Non-Overlapping Multi-camera Detection and Tracking of Vehicles in Tunnel Surveillance
6
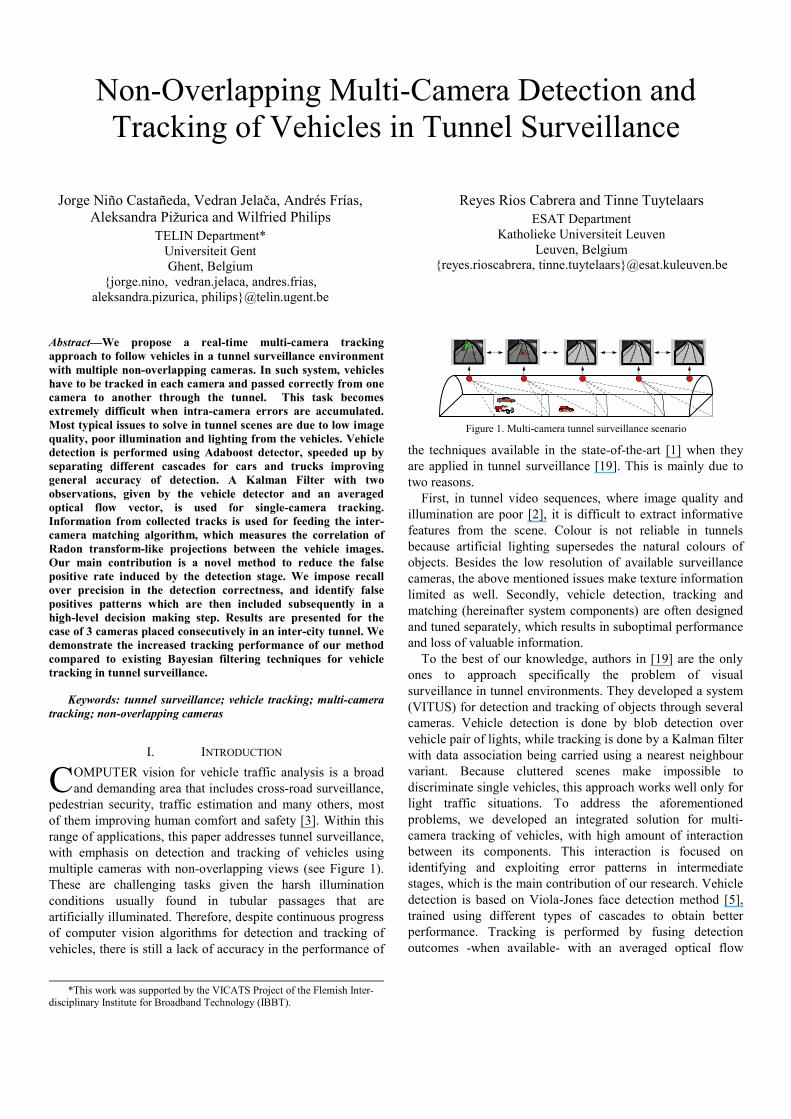
Non-Overlapping Multi-Camera Detection and Tracking of Vehicles in Tunnel Surveillance Jorge Niño Castañeda, Vedran Jelača, Andrés Frías, Aleksandra Pižurica and Wilfried Philips TELIN Department* Universiteit Gent Ghent, Belgium {jorge.nino, vedran.jelaca, andres.frias, aleksandra.pizurica, philips}@telin.ugent.be Reyes Rios Cabrera and Tinne Tuytelaars ESAT Department Katholieke Universiteit Leuven Leuven, Belgium {reyes.rioscabrera, tinne.tuytelaars}@esat.kuleuven.be Abstract—We propose a real-time multi-camera tracking approach to follow vehicles in a tunnel surveillance environment with multiple non-overlapping cameras. In such system, vehicles have to be tracked in each camera and passed correctly from one camera to another through the tunnel. This task becomes extremely difficult when intra-camera errors are accumulated. Most typical issues to solve in tunnel scenes are due to low image quality, poor illumination and lighting from the vehicles. Vehicle detection is performed using Adaboost detector, speeded up by separating different cascades for cars and trucks improving general accuracy of detection. A Kalman Filter with two observations, given by the vehicle detector and an averaged optical flow vector, is used for single-camera tracking. Information from collected tracks is used for feeding the inter- camera matching algorithm, which measures the correlation of Radon transform-like projections between the vehicle images. Our main contribution is a novel method to reduce the false positive rate induced by the detection stage. We impose recall over precision in the detection correctness, and identify false positives patterns which are then included subsequently in a high-level decision making step. Results are presented for the case of 3 cameras placed consecutively in an inter-city tunnel. We demonstrate the increased tracking performance of our method compared to existing Bayesian filtering techniques for vehicle tracking in tunnel surveillance. Keywords: tunnel surveillance; vehicle tracking; multi-camera tracking; non-overlapping cameras I. INTRODUCTION OMPUTER vision for vehicle traffic analysis is a broad and demanding area that includes cross-road surveillance, pedestrian security, traffic estimation and many others, most of them improving human comfort and safety [3]. Within this range of applications, this paper addresses tunnel surveillance, with emphasis on detection and tracking of vehicles using multiple cameras with non-overlapping views (see Figure 1). These are challenging tasks given the harsh illumination conditions usually found in tubular passages that are artificially illuminated. Therefore, despite continuous progress of computer vision algorithms for detection and tracking of vehicles, there is still a lack of accuracy in the performance of the techniques available in the state-of-the-art [1] when they are applied in tunnel surveillance [19]. This is mainly due to two reasons. First, in tunnel video sequences, where image quality and illumination are poor [2], it is difficult to extract informative features from the scene. Colour is not reliable in tunnels because artificial lighting supersedes the natural colours of objects. Besides the low resolution of available surveillance cameras, the above mentioned issues make texture information limited as well. Secondly, vehicle detection, tracking and matching (hereinafter system components) are often designed and tuned separately, which results in suboptimal performance and loss of valuable information. To the best of our knowledge, authors in [19] are the only ones to approach specifically the problem of visual surveillance in tunnel environments. They developed a system (VITUS) for detection and tracking of objects through several cameras. Vehicle detection is done by blob detection over vehicle pair of lights, while tracking is done by a Kalman filter with data association being carried using a nearest neighbour variant. Because cluttered scenes make impossible to discriminate single vehicles, this approach works well only for light traffic situations. To address the aforementioned problems, we developed an integrated solution for multi- camera tracking of vehicles, with high amount of interaction between its components. This interaction is focused on identifying and exploiting error patterns in intermediate stages, which is the main contribution of our research. Vehicle detection is based on Viola-Jones face detection method [5], trained using different types of cascades to obtain better performance. Tracking is performed by fusing detection outcomes -when available- with an averaged optical flow C *This work was supported by the VICATS Project of the Flemish Inter- disciplinary Institute for Broadband Technology (IBBT). Figure 1. Multi-camera tunnel surveillance scenario
-
Upload
independent -
Category
Documents
-
view
3 -
download
0
Transcript of Non-Overlapping Multi-camera Detection and Tracking of Vehicles in Tunnel Surveillance
Non-Overlapping Multi-Camera Detection and Tracking of Vehicles in Tunnel Surveillance
Jorge Niño Castañeda, Vedran Jelača, Andrés Frías, Aleksandra Pižurica and Wilfried Philips
TELIN Department* Universiteit Gent Ghent, Belgium
{jorge.nino, vedran.jelaca, andres.frias, aleksandra.pizurica, philips}@telin.ugent.be
Reyes Rios Cabrera and Tinne Tuytelaars ESAT Department
Katholieke Universiteit Leuven Leuven, Belgium
{reyes.rioscabrera, tinne.tuytelaars}@esat.kuleuven.be
Abstract—We propose a real-time multi-camera tracking approach to follow vehicles in a tunnel surveillance environment with multiple non-overlapping cameras. In such system, vehicles have to be tracked in each camera and passed correctly from one camera to another through the tunnel. This task becomes extremely difficult when intra-camera errors are accumulated. Most typical issues to solve in tunnel scenes are due to low image quality, poor illumination and lighting from the vehicles. Vehicle detection is performed using Adaboost detector, speeded up by separating different cascades for cars and trucks improving general accuracy of detection. A Kalman Filter with two observations, given by the vehicle detector and an averaged optical flow vector, is used for single-camera tracking. Information from collected tracks is used for feeding the inter-camera matching algorithm, which measures the correlation of Radon transform-like projections between the vehicle images. Our main contribution is a novel method to reduce the false positive rate induced by the detection stage. We impose recall over precision in the detection correctness, and identify false positives patterns which are then included subsequently in a high-level decision making step. Results are presented for the case of 3 cameras placed consecutively in an inter-city tunnel. We demonstrate the increased tracking performance of our method compared to existing Bayesian filtering techniques for vehicle tracking in tunnel surveillance.
Keywords: tunnel surveillance; vehicle tracking; multi-camera tracking; non-overlapping cameras
I. INTRODUCTION OMPUTER vision for vehicle traffic analysis is a broad and demanding area that includes cross-road surveillance,
pedestrian security, traffic estimation and many others, most of them improving human comfort and safety [3]. Within this range of applications, this paper addresses tunnel surveillance, with emphasis on detection and tracking of vehicles using multiple cameras with non-overlapping views (see Figure 1). These are challenging tasks given the harsh illumination conditions usually found in tubular passages that are artificially illuminated. Therefore, despite continuous progress of computer vision algorithms for detection and tracking of vehicles, there is still a lack of accuracy in the performance of
the techniques available in the state-of-the-art [1] when they are applied in tunnel surveillance [19]. This is mainly due to two reasons.
First, in tunnel video sequences, where image quality and illumination are poor [2], it is difficult to extract informative features from the scene. Colour is not reliable in tunnels because artificial lighting supersedes the natural colours of objects. Besides the low resolution of available surveillance cameras, the above mentioned issues make texture information limited as well. Secondly, vehicle detection, tracking and matching (hereinafter system components) are often designed and tuned separately, which results in suboptimal performance and loss of valuable information.
To the best of our knowledge, authors in [19] are the only ones to approach specifically the problem of visual surveillance in tunnel environments. They developed a system (VITUS) for detection and tracking of objects through several cameras. Vehicle detection is done by blob detection over vehicle pair of lights, while tracking is done by a Kalman filter with data association being carried using a nearest neighbour variant. Because cluttered scenes make impossible to discriminate single vehicles, this approach works well only for light traffic situations. To address the aforementioned problems, we developed an integrated solution for multi-camera tracking of vehicles, with high amount of interaction between its components. This interaction is focused on identifying and exploiting error patterns in intermediate stages, which is the main contribution of our research. Vehicle detection is based on Viola-Jones face detection method [5], trained using different types of cascades to obtain better performance. Tracking is performed by fusing detection outcomes -when available- with an averaged optical flow
C
*This work was supported by the VICATS Project of the Flemish Inter- disciplinary Institute for Broadband Technology (IBBT).
Figure 1. Multi-camera tunnel surveillance scenario

vector of Shi-Tomasi [11] features in a Kalman filtering estimation framework. For matching of vehicles between cameras, we use projection profiles of vehicle images [4] that are shown to be suitable for recognizing vehicles in low resolution images when online execution is required.
Our main contribution to visual object tracking is a novel method to reduce the false positive rate induced by the detection stage. Detector sensitivity is set to the highest possible value, and its false positive error patterns are subsequently included in a high-level decision making step. This results in a superior tracking recall while maximising precision.
The paper is organized as follows. Section II presents an overview of the integrated system. In Sections III, IV and V we present our vehicle detection, intra-camera tracking and inter-camera matching strategies in detail. Experimental evaluation and discussion of results are given in Section VI, and conclusions in Section VII.
II. OVERVIEW OF THE PROPOSED SYSTEM In our system, vehicle detection and tracking routines are
implemented for each camera, and a central server processes the inter-camera vehicle matching. In every new frame, a vehicle detector searches for vehicles in the scene, as explained in Section III. We have identified error patterns in this stage, which are included in the subsequent tracking routine. A vehicle is represented by a bounding box with an associated state vector
[ ]TX x y x y w h= (1) where x and y are centre-bottom image coordinates of the bounding box, and w and h are its width and height respectively. A bounding box encompasses point features which are searched in subsequent frames using optical flow. Vehicle representation is completed by obtaining its signature, which is later used for inter-camera matching. The state vector is updated during the tracking stage, which is further explained in Section IV. For each object being tracked, its state and signatures are stored in local memory and signature consistency is evaluated for a number of N frames. Thereafter, only useful information is kept and sent to the central server. In this way, the single-camera tracking step collects the information for discarding false detections and supplies the inter-camera matching algorithm with the correct detection
results. The matching algorithm constantly updates the position of the vehicles in the tunnel by comparing existing signatures retrieved from other cameras with the ones from new accepted detections. At this stage, in order to reduce the search space of vehicle candidates to be matched, a higher level of spatio-temporal consistency of tracks is evaluated for the sake of speed performance, as explained in Section V. Figure 2 shows the system overview.
III. VEHICLE DETECTION
A. Description For vehicle detection we use an implementation of Viola-
Jones detector [5]. While considering all possible locations (bounding boxes) of an object of interest, only very few of them will contain an instance of such object in an image. Using a single strong classifier with multiple features, the whole detector has to be evaluated for every possible bounding box to decide whether the image contains an object or not. Because this routine becomes an exhaustive task, a cascade of Adaboost strong classifiers is built in order to accelerate the detection process. Every location in the image is evaluated by an array of a few classifiers. We tune each of these arrays to reject 50% of background and to keep most of the positive samples (99.9% of the vehicles). Most background samples are evaluated to be background at early stages in the cascade and only the real objects should go through all stages. We also use the proposed integral images scheme described in [5] and four basic Haar-like features, which allows fast computation independent from the scale or location.
The boosted cascade approach is based given by:
11 ( )
( )0 otherwise
Tt tt
w h xh x
α θ=
⎧ ⎫= ≥⎪ ⎪= ⎨ ⎬⎪ ⎪⎩ ⎭
∑ (2)
where h(x) represents a strong classifier, α is the assigned weight in the Adaboost algorithm, T is the number of features and w is the answer of the strong classifier.
If w<0, (with θ=0), the object inside the window is classified as background, otherwise, it is classified as vehicle. However, for the cascade scheme, θ is tuned so that it lets subwindows classified as background to be accepted as vehicle hypothesis for further evaluation on next stages, letting almost all positives to pass to next stages. We found in our experiments that using the local output accuracy gi of each of the S stages i, and adding it to a final cascade output accuracy G (Equation (3)), results in a better detection performance.
The final detections of cascade are considered only if G is larger than a predefined threshold TG.
1
Sii
G g=
=∑ (3) This variable adds value to the final score, based on “as
very good stage classification” or “lightly good classification”. Using this strategy, we obtained better detections than using the standard procedure where only last stage accuracy is considered. To select the best final detection,
Figure 2. Proposed Multi-Camera Tracking system

a minimum overlapping of 2 sub windows (25% overlapping) and G was used as score while applying Non-Maximal Suppression.
The variance of an image patch containing cars or trucks lies normally between 15 and 60 whereas most background tunnel sub-windows are below 15. We use this information to accelerate detection by dropping sub-windows with very low/high variance.
B. Training/Testing
To train the cascade, we used 3 annotated videos and additionally tunnel images downloaded from the Internet. They were split into training and testing sets. The positive samples were mirrored horizontally to double the training set. All training data was variance normalized. During testing, the variance normalization is performed online using the squared integral image.
We compared two different approaches: - Bulk Cascade with cars, trucks, vans and
motorcycles together vs background - Separate cascades, merging cars/motorcycles and
trucks/vans vs background. We found that for this problem and database, separating
cascades merging cars/motorcycles and trucks/vans, (which will be called only ‘car’ and ‘truck’ from here on), was the best approach to solve this problem. It took less processing time, since with the bulk cascade the aspect ratio has to be changed more. Moreover, in accuracy, separate cascades outperformed the bulk cascade.
The size of the training images was 50x50 pixels for cars, and 50x64 for trucks. The number of weak classifiers using bulk cascade was 914 (cars and trucks together) and for the combined of separate cascades was 1254 (890+364). To define a correct detection, we use 50% overlap as criterion, as in the Pascal VOC Challenge [6], which computes the overlap score as
( ) ( )T GT T GTroi roi roi roi∩ ∪ (4) with roiT the detection and roiGT the ground truth.
To generate the precision/recall plot (Figure 3), a sliding
window was run on several annotated frames using the same parameters for both methods.
IV. TRACKING ALGORITHM We propose a multi-cue approach where information from
Vehicle Detection and Optical Flow is fused in a Kalman Filter framework, as illustrated in Figure 5. We assume a second order kinematic model for the vehicle motion. We also include a high-level routine that includes identified error patterns in detection to boost the tracking performance while eliminating false positives. Details are presented in the following sub-sections.
A. Lucas Kanade Optical Flow
The Lucas-Kanade approach [8] to the calculation of optical flow minimizes the sum of squared intensity differences between two consecutive windows. An underlying assumption is that given the small inter-frame motion, the current window can be approximated by a translation of the past one. It is also assumed that the image intensities in the translated window can be written as those in the original window plus a residue term that depends almost linearly on the translation vector. As a result of these approximations, it is possible to write a 2×2 linear system where the displacement vector between the two windows is the unknown variable. Iterating the basic solution of the algorithm in a Newton-Raphson fashion reduces the errors introduced by the approximations.
Given two consecutive frames I and J in a sequence, let us consider an image point u = [ux uy]T in image I. The goal of the feature tracking is to find the location v = u + d = [ux+dx uy+dx] in image J, such that I(u) = J(v). The vector d is known as the optical flow at [x y]T, which is defined as being the vector that minimizes the residual function:
2( ) ( , ) ( , ) ( , )
y yx x
x x y y
u wu w
x y x yx u w y u w
d d I x y J x d y dε ε++
= − = −
⎡ ⎤= = − + +⎣ ⎦∑ ∑d (5)
where wx and wy are the two integers that define the integration window. To solve the aperture problem [12] we use the pyramidal implementation of the Lucas-Kanade feature tracker described in [9]. Shi-Tomasi method [11] is used for features initialization.
B. Position and size calculation from optical flow
The method explained above calculates the visual motion over one patch of wx × wy pixels or visual feature. When tracking a rigid object in two consecutive frames, its local optical flow (visual motion vectors within its rectangular region, i.e. bounding box) is expected to be approximately uniform, and therefore its spatial distribution of features is expected to be similar between frames.
We exploit this property by assuming the motion vectors distribution to be unimodal and with a narrow variance. We
0 0.1 0.2 0.3 0.4 0.5 0.6 0.7 0.8 0.9 10
0.1
0.2
0.3
0.4
0.5
0.6
0.7
0.8
0.9
1
recall
prec
isio
n
Detector: Precision/Recall at 50% overlap
Bulk: LastStageAccuracy AP= 0.4036
Bulk: G Accuracy AP= 0.5172Separate: LastStageAccuracy AP= 0.6624
Separate: G Accuracy AP= 0.7565
Figure 3 Precision-recall graphic of the detector
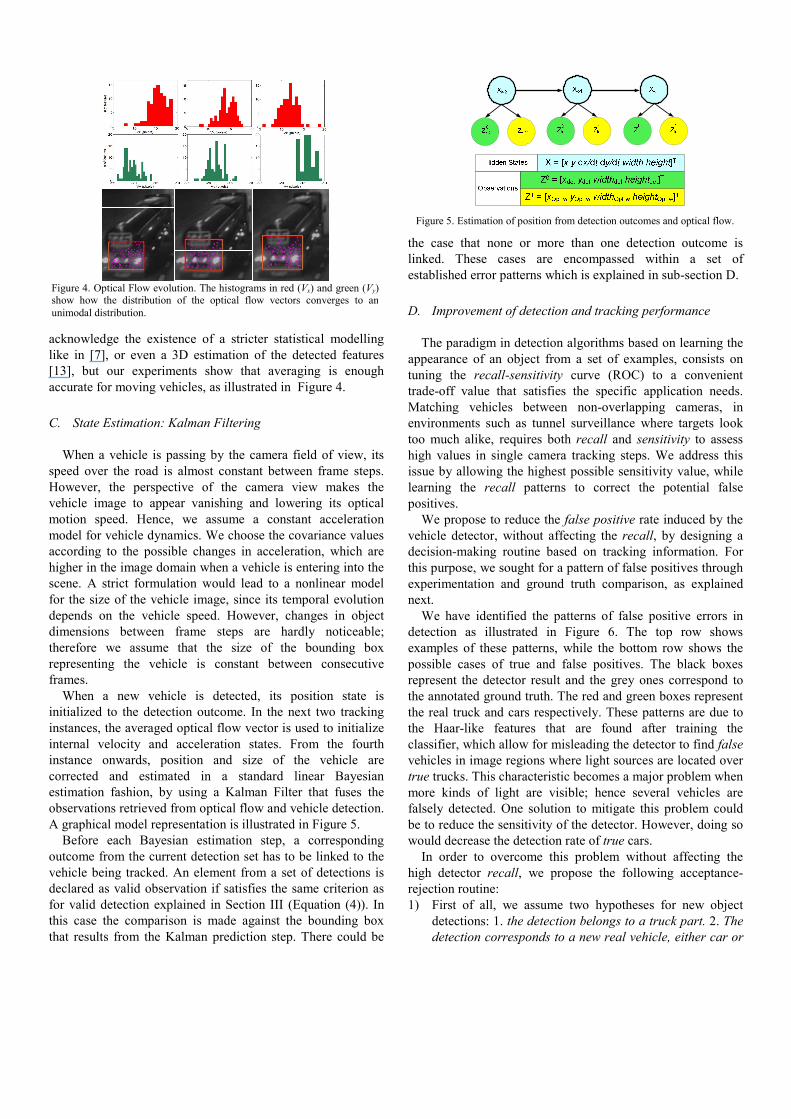
Figure 4. Optical Flow evolution. The histograms in red (Vx) and green (Vy) show how the distribution of the optical flow vectors converges to an unimodal distribution.
acknowledge the existence of a stricter statistical modelling like in [7], or even a 3D estimation of the detected features [13], but our experiments show that averaging is enough accurate for moving vehicles, as illustrated in Figure 4.
C. State Estimation: Kalman Filtering
When a vehicle is passing by the camera field of view, its speed over the road is almost constant between frame steps. However, the perspective of the camera view makes the vehicle image to appear vanishing and lowering its optical motion speed. Hence, we assume a constant acceleration model for vehicle dynamics. We choose the covariance values according to the possible changes in acceleration, which are higher in the image domain when a vehicle is entering into the scene. A strict formulation would lead to a nonlinear model for the size of the vehicle image, since its temporal evolution depends on the vehicle speed. However, changes in object dimensions between frame steps are hardly noticeable; therefore we assume that the size of the bounding box representing the vehicle is constant between consecutive frames.
When a new vehicle is detected, its position state is initialized to the detection outcome. In the next two tracking instances, the averaged optical flow vector is used to initialize internal velocity and acceleration states. From the fourth instance onwards, position and size of the vehicle are corrected and estimated in a standard linear Bayesian estimation fashion, by using a Kalman Filter that fuses the observations retrieved from optical flow and vehicle detection. A graphical model representation is illustrated in Figure 5.
Before each Bayesian estimation step, a corresponding outcome from the current detection set has to be linked to the vehicle being tracked. An element from a set of detections is declared as valid observation if satisfies the same criterion as for valid detection explained in Section III (Equation (4)). In this case the comparison is made against the bounding box that results from the Kalman prediction step. There could be
the case that none or more than one detection outcome is linked. These cases are encompassed within a set of established error patterns which is explained in sub-section D.
D. Improvement of detection and tracking performance
The paradigm in detection algorithms based on learning the appearance of an object from a set of examples, consists on tuning the recall-sensitivity curve (ROC) to a convenient trade-off value that satisfies the specific application needs. Matching vehicles between non-overlapping cameras, in environments such as tunnel surveillance where targets look too much alike, requires both recall and sensitivity to assess high values in single camera tracking steps. We address this issue by allowing the highest possible sensitivity value, while learning the recall patterns to correct the potential false positives.
We propose to reduce the false positive rate induced by the vehicle detector, without affecting the recall, by designing a decision-making routine based on tracking information. For this purpose, we sought for a pattern of false positives through experimentation and ground truth comparison, as explained next.
We have identified the patterns of false positive errors in detection as illustrated in Figure 6. The top row shows examples of these patterns, while the bottom row shows the possible cases of true and false positives. The black boxes represent the detector result and the grey ones correspond to the annotated ground truth. The red and green boxes represent the real truck and cars respectively. These patterns are due to the Haar-like features that are found after training the classifier, which allow for misleading the detector to find false vehicles in image regions where light sources are located over true trucks. This characteristic becomes a major problem when more kinds of light are visible; hence several vehicles are falsely detected. One solution to mitigate this problem could be to reduce the sensitivity of the detector. However, doing so would decrease the detection rate of true cars.
In order to overcome this problem without affecting the high detector recall, we propose the following acceptance-rejection routine: 1) First of all, we assume two hypotheses for new object
detections: 1. the detection belongs to a truck part. 2. The detection corresponds to a new real vehicle, either car or
Figure 5. Estimation of position from detection outcomes and optical flow.

truck. The second one is taken initially. 2) During subsequent frames, the detected object is tracked
as explained in sub-section C. When comparing a new detection with an existing object, the overlap score is used to evaluate correspondence. After comparing the whole set of new detections, the one with the highest overlap score is taken for decision-making. If the distance between the coordinates (xdet, ydet) and (xOpFw, yOpFw) is lower than a given threshold DOMax, the tracking routine continues normally.
3) If this is not the case, a new target is initialized and declared as a part of a truck together with the existing object, and hypothesis 2 is included. The two resulting bounding boxes are tracked as normal targets, but their encompassing area is taken temporary as the real object, as illustrated in Figure 7.
4) The reliability of the hypotheses is measured during tracking by assigning a score according to the number of observations fitting their corresponding bounding boxes.
5) Once object tracks from potential vehicles are completed, the hypothesis with the highest score is taken as true.
We use a ground truth database of cars and trucks obtained from manual segmentation of 156 vehicles for performance evaluation. We compare our proposed improved tracking strategy explained in this subsection, to the tracking performance of the standard detection/tracking algorithm described in the first part of this section, and a third tracking routine where association of observations is based on the closest neighbour metric. The comparison is made with the aim to evaluate the impact of the false positives during detection stage, and to quantify how the proposed tracking algorithm can mitigate it. Results are presented in Section VI.
V. MATCHING VEHICLES BETWEEN CAMERAS Matching of vehicles in traffic scenarios is typically done
by comparing their appearances and using their kinematics together with inter-camera distances to reduce the number of
possible matches [14][15][16]. We follow the same approach. However, matching of vehicle appearances in tunnels is challenging, mainly because of poor artificial illumination.
Additional limitations are imposed by low resolution of vehicle images and request for real-time performance. Therefore, typically used features for object recognition, like colour [14][16], local features (e.g. SIFT [18]), edges [10] or image eigenvectors [17] have limited success in tunnel applications. Colour is not reliable; calculation of invariant local features is computationally demanding and their amount in low resolution images is insufficient; edges are not strong; image eigenvectors are calculated in the offline training stage so they are not invariant to online changes. Hence, we use an appearance descriptor proposed in [4], based on signatures that are horizontal and vertical Radon transform like projection profiles of vehicle images, as illustrated in Figure 8. It has been shown in [4] that such signatures are suitable for matching of vehicles in tunnel environments.
The vertical and horizontal signatures are the arithmetic means of image pixel intensities in each image row and column, respectively. They are compared using 1-D correlation. To deal with scale differences and misalignments, signatures are normalized to the same length before matching and correlated by shifting them along each other to find the best alignment. Differences in perspective view are noticeable when a vehicle changes lane between cameras. However, signatures are sufficiently robust to the possible span of camera-view angle, since the rear of the vehicles is always visible and contains most of the signature information. A more detailed explanation of the signatures matching method can be found in [4].
After calculation of similarities between appearances, the final matching results are obtained by assignment optimization as in [4], with an assumption that each vehicle has one and only one correct match and using the constraints given by an inter-camera travel time and lane position of each vehicle.
VI. EXPERIMENTS AND RESULTS A set of grey-scale annotated videos of size 576x768,
corresponding to three spatially consecutive non-overlapping-view cameras, were used for the experiments. The traffic flow is composed of around 160 vehicles (mostly cars and trucks
Figure 8. Vehicle images from two different cameras along a tunnel pipewith the corresponding horizontal and vertical signatures .
Figure 6. Pattern of false vehicle detections found (first row) and hypothesesassumed to address them (second row).
Figure 7. Example of successful tracking of a truck in one camera, with correction of false positives. LightBlue dotted: tracked parts, Green: tracked vehicle.

and some few motorcycles) passing by during seven minutes (see Figure 9).
In order to evaluate the impact of our tracking method on the overall system performance, inter-camera tracking and multi-camera matching were evaluated for three scenarios: Pflugfelde: tracking by detection method using the nearest neighbour metric and a Kalman Filter, as described in [19].; SinglePart: detection and tracking strategies that we propose in this article, excluding interaction and error correction; Proposed: our proposed tracking methodology.
As it is shown in Table 1, when detection and tracking are running with the proposed implementation, around 95% of vehicles are detected and tracked properly per camera. The false positive rate is improved significantly in both intra and inter-camera tracking, compared to the Pflugfelde tracker.
When evaluating the performance of multi-camera tracking, it was found that 88% of the vehicles were successfully detected and tracked from the first to the third camera, when using our proposed method (vehicles that were lost in at least one camera are not considered as successfully tracked). Despite the fact that this performance is still low for a real life application, the impact of the error pattern inclusion is noticeable, with a 11% of improvement compared to the Pflugfelde tracker.
To better understand the results, it is important to notice in Table 1 that for intra-camera tracking, false positives include multiple tracks of the same vehicle, and tracks of objects that are not vehicles.
VII. CONCLUSIONS AND FUTURE WORK A general framework for tunnel video surveillance using
non-overlapped-view cameras has been presented. A real-time smart integration of state-of-the-art techniques for the components involved has been presented.
We have shown that when including error patterns from dependent tasks in computer vision methods, their overall performance is improved. This new paradigm seeks for patterns of algorithm errors within a specific application context. For the case of tunnel surveillance, four patterns were found which are illustrated in Figure 6. This methodology can however be extended to other surveillance scenarios and different kind of targets.
REFERENCES [1] Kastrinaki, V., Zervakis, M., Kalaitzakis, K., “A survey of video
processing techniques for traffic applications”. Image and Vision Computing vol. 21, no. 4, pp. 359-381, April 2003.
[2] Yilmaz, A., Javed, O., & Shah, M. (n.d.). Object Tracking: A Survey. ACM Computing Surveys, vol. 38 no. 4 p13.
[3] Gandhi, T., & Trivedi, M. “Pedestrian protection systems: Issues, survey, and challenges”. Intelligent Transportation Systems, vol. 8, no. 3, pp 413-430, Sept. 2007
[4] Jelaca, V., Niño, J., Frias, A., Pizurica, A., and Philips, W. “Real-Time Vehicle Matching for Multi-Camera Tunnel Surveillance”, in Proceedings of the SPIE 2011, Volume 7871, San Francisco, 2011.
[5] P. Viola, M. Jones, “Rapid Object Detection Using a Boosted Cascade of Simple Features”, in Proc. IEEE Int. Conf. Computer Vision and Pattern Recognition, Kauai, 2001, pp. 511-518.
[6] Everingham, M. and Van Gool, L. and Williams, C. K. I. and Winn, J. and Zisserman, A., The PASCAL Visual Object Classes Challenge 2010
[7] Zhang, W., Fang, X., & Yang, X., “Moving vehicles segmentation based on Bayesian framework for Gaussian motion model”, Pattern Recognition Letters, vol. 27, no. 9, pp. 956-967, July 2006.
[8] Lucas, B., & Kanade, T., “An iterative image registration technique with an application to stereo vision”, in Proc. Of Int. Joint Conf. on Artificial Intelligence, Vol. 2, San Francisco, 1981, pp. 674-679.
[9] Bouguet, J.Y., “Pyramidal implementation of the lucas kanade feature tracker: Description of the algorithm”, Intel Corporation Microprocessor Research Labs”, Technical Report, 2000.
[10] Shan, Y., Sawhney, H., & Kumar, R., “Vehicle Identification between Non-Overlapping Cameras without Direct Feature Matching”, in Proc. Tenth IEEE Int. Conf. on Computer Vision, Vol. 1, Beijing, 2005,pp. 378-385.
[11] J. Shi and C. Tomasi, “Good Features to Track,” Proc. IEEE Conf. Computer Vision and Pattern Recognition, Seattle, 1994, pp. 593-600.
[12] Shinsuke Shimojo, Gerald H. Silverman, Ken Nakayama. “Occlusion and the solution to the aperture problem for motion”, Vision Research, Volume 29, Issue 5, Pages 619-626, 1989.
[13] Kanhere, Neeraj K., and Stanley T. Birchfield. “Real-Time Incremental Segmentation and Tracking of Vehicles at Low Camera Angles Using Stable Features” IEEE Transactions on Intelligent Transportation Systems, vol. 9, no. 1, pp. 148-160, March 2008.
[14] Huang, T. and Russell, S. “Object identification in a Bayesian context”, Proc. of Int. Joint Conferences on Artificial Intelligence, Nagoya, 1997, pp. 1276-1283.
[15] Javed, O. and Shafique K. and Shah, M. “Appearance modelling for tracking in multiple non-overlapping cameras,” in Proc. Int. Conf. on Computer Vision and Pattern Recognition, vol. 2, San Diego, 2005, pp. 26-33.
[16] Choe, T. and Lee M. and Hearing, N. “Traffic analysis with low frame rate camera networks”, in Proc. First IEEE Workshop on Camera Networks, San Francisco, 2010, pp. 9-16.
[17] Bischof, H. and Wildenauer, H. and Leonardis, A. “Illumination insensitive recognition using eigenspaces” Computer Vision and Image Understanding, vol. 95, no. 1, pp. 86-104, July 2004.
[18] Lowe, D. “Distinctive image features from scale-invariant keypoints,” International Journal of Computer Vision, vol. 60, No. 2, pp. 91-110, November 2004.
[19] Pflugfelder, R., Bischof, H., Dominguez, G.F., Nolle, M., Schwabach, H. "Influence of camera properties on image analysis in visual tunnel surveillance", in Proc. of Intelligent Transportation Systems, Vienna, 2005. pp. 868- 873.
Figure 9. Multi-Camera Tracking system screenshot
Cam1 Cam2 Cam3 MCam Method TR FP TR FP TR FP MR FP
Proposed 97% 4.5% 95% 4.5% 94% 4.6% 88% 7%SinglePart 95% 10% 93% 9 % 93% 8.2% 80% 12%Pflugfelde 93% 12% 91% 10% 92% 9.5% 77% 14%
Table 1. Multi-Camera Tracking Performance