Noise induced hearing loss in a steel rolling mill company in ...
67
NOISE INDUCED HEARING LOSS IN A STEEL ROLLING MILL COMPANY IN NAIROBI, KENYA DR. MANDEEP CHAUHAN H58/72059/08 M.MED ENT-H&N SURGERY RESIDENT UNIVERSITY OF NAIROBI A study submitted in part fulfilment of the requirements for the degree of Master of Medicine in Ear, Nose and Throat- Head and Neck Surgery, at the University Of Nairobi.
-
Upload
khangminh22 -
Category
Documents
-
view
1 -
download
0
Transcript of Noise induced hearing loss in a steel rolling mill company in ...

NOISE INDUCED HEARING LOSS IN A STEEL
ROLLING MILL COMPANY IN NAIROBI, KENYA
DR. MANDEEP CHAUHAN
H58/72059/08
M.MED ENT-H&N SURGERY RESIDENT
UNIVERSITY OF NAIROBI
A study submitted in part fulfilment of the requirements for the degree of Master of Medicine in
Ear, Nose and Throat- Head and Neck Surgery, at the University Of Nairobi.

DECLARATION
This dissertation is my original work and has not been presented for the award of a degree in any
other university.
Dr Mandeep Kaur Chauhan
Resident -Department of ENT H&N Surgery
University Of Nairobi
H58/72059/08
Signed----------------------------------------------Date---------------------------------

CERTIFICATE OF APPROVAL
This study has been submitted to the KNH and UON Research and Ethics Committee for
approval through the permission of the following supervisors:
Prof I.M Macharia, M.B.Ch.B, M.Med (ENT) NBI
Professor (ENT), Department Of Surgery,
University of Nairobi
Signature …………………………… Date………………..
Serah Ndegwa
Higher Dip ENT (NBI), MSC Audiology (UK)
Lecturer
University of Nairobi
Signature …………………………… Date………………..
Dr.Mary Omutsani, MBChB,M.Med(ENT)NBI
Consultant ENT Surgeon,
Kenyatta National Hospital
Signature …………………………… Date………………..

I
DEDICATION
I dedicate this study to my loving parents, Mr. Avtar Singh Chauhan and Mrs. Gurcharan Kaur
Chauhan for their love and patience.
Thank you mum and dad for believing in me

II
ACKNOWLEDGEMENT
I wish to express my sincere gratitude to:
My supervisors: Prof. I.M Macharia, Dr. M. Omutsani and Serah Ndegwa for their valuable
guidance and support in this study.
My dear siblings: Dr. Gurdeep Chauhan,Dr. Virinderpal Chauhan ,Dr Amandeep Chauhan for
their encouragement.
Mr. Francis Njiru and Mr. Nyachieo Dhillon for data analysis.
Mr.Pathak, Dr. M. Nyandusi , Prof.Mike Randhawa, Lindsay Fahnestock, and Eng H.S Gill for
their opinions and advice.

III
TABLE OF CONTENTS
ABBREVIATIONS .................................................................................................................................................................. i
ABSTRACT ............................................................................................................................................................................... 1
2. BACKGROUND ................................................................................................................................................................. 4
2.1. History of Noise Induced Hearing Loss ............................................................................................................ 4
2.2. Definitions of Sound and Noise ............................................................................................................................ 4
2.3. Definition of Noise Induced Hearing Loss ....................................................................................................... 5
2.4. Hearing level ................................................................................................................................................................ 5
2.5. Noise measurement and exposure ....................................................................................................................... 5
3. PATHOPHYSIOLOGY OF NOISE INDUCED HEARING LOSS ............................................................. 6
3.1. Normal Physiology .................................................................................................................................................... 6
3.2. Mechanisms of damage ........................................................................................................................................... 8
3.3. Sound Intensity and Hearing .............................................................................................................................. 10
3.4 Impulse Noise .............................................................................................................................................................. 11
4. Combined Effects of Oto-traumatic Agents .......................................................................................................... 11
5. Clinical Features ............................................................................................................................................................... 12
5.1Establishment of the presence of NIHL ............................................................................................................ 13
6. Diagnosis of NIHL............................................................................................................................................................ 13
7. Types and Grading of Hearing loss .......................................................................................................................... 15
8. The Damage Risk Criteria ............................................................................................................................................ 16
9. Prevention of NIHL ......................................................................................................................................................... 17
10. LITERATURE REVIEW .......................................................................................................................................... 17
12. JUSTIFICATION OF THE STUDY ..................................................................................................................... 22
13. RESEARCH QUESTION .......................................................................................................................................... 22
14. AIMS AND OBJECTIVES ........................................................................................................................................ 22
14.1Broad Objective ........................................................................................................................................................ 22
14.2Specific Objectives ................................................................................................................................................... 22
15. MATERIALS AND METHODS ............................................................................................................................. 23
15.1. Study Design ............................................................................................................................................................ 23
15.2. Setting ......................................................................................................................................................................... 23
15.3. Study Population ................................................................................................................................................... 23

IV
15.4. Inclusion criteria .................................................................................................................................................... 24
15.5. Exclusion criteria ................................................................................................................................................... 24
15.6 Sample size calculation ......................................................................................................................................... 25
15.7 Methodology ............................................................................................................................................................. 26
15.7.1. Recruitment of subjects .............................................................................................................................. 26
15.7.2. Noise Mapping: .............................................................................................................................................. 26
15.7.3. Data collection ................................................................................................................................................ 26
15.7.4. Clinical examination, ................................................................................................................................... 26
15.7v. Audiometric measurements ....................................................................................................................... 27
16. Quality control ................................................................................................................................................................ 28
17. Data management and Statistical analysis .......................................................................................................... 28
18. Data presentation ........................................................................................................................................................... 28
20. Implementation Timetable ......................................................................................................................................... 29
21. BUDGET ........................................................................................................................................................................... 30
22. RESULTS .......................................................................................................................................................................... 31
23. DISCUSSION .................................................................................................................................................................. 43
24. CONCLUSION ............................................................................................................................................................... 47
26. LIMITATIONS .............................................................................................................................................................. 48
REFERENCES ..................................................................................................................................................................... 49
APPENDIX 1: GENERAL PATIENT INFORMATION AND CONSENT FORM ................................ 54
APPENDIX 2: QUESTIONNAIRE............................................................................................................................... 56
APPENDIX 3: EAR EXAMINATION ........................................................................................................................ 59

i
ABBREVIATIONS
dB Decibel.
dB (A) Decibel with A weighted.
HL Hearing Loss.
HPDs Hearing Protective Devices.
Hz Hertz.
IHCs Inner Hair Cells.
KHz Kilohertz.
NIHL Noise Induced Hearing Loss.
NIOSH National Institute for Occupational Safety and Health.
OHCs Outer Hair Cells.
ONIHL Occupational Noise Induced Hearing Loss.
OSHA Occupational Safety and Health Act.
OAEs Otoacoustic Emissions.
PTS Permanent Threshold Shift.
SPL Sound Pressure Level.
TTS Temporary Threshold Shift.
TWA Time Weighted Average.
WHO World Health Organization.

1
ABSTRACT
Background: Occupational noise induced hearing loss (ONIHL) is a significant economic and
health concern in the developing world but the prevalence among factory workers in Kenya is
not well known. The iron and steel industry employees are exposed to excessive occupational
noise as compared to other industries, hence vulnerable to permanent deafness. ONIHL is a
preventable condition with effective occupational noise control strategies.
Objective: To determine the prevalence and risk of developing ONIHL in a group of production
versus administrative non- production workers in relation to intensity and duration of noise
exposure.
Study Site and Population: This study was conducted in a busy steel rolling mill based in the
industrial area of Nairobi Kenya. 114 workers were randomly recruited and distributed equally
between the two groups. All participants were male, 93.9% were below 50 years old, and 62.8%
had at least secondary education.
Study Design and Methodology: This was a cross-sectional comparative study. Each
participant had a structured questionnaire followed by tuning fork tests and a baseline
audiogram. Noise mapping was done at various units
Data Analysis: Chi-squared tests for categorical variables and analysis of variance tests
(ANOVA) for continuous variables were performed. Independent predictors of NIHL were
determined using backward stepwise logistic regression. A p-value of less than 5% (p= <0.05)
was considered statistically significant.

2
Results: A total of 39(34.2%) workers were found to have NIHL. From these, 17(81.0%)
worked in the mill machine, 11(45.8%) were from the furnace, 5(41.7%) operated in the
workshop and 6(10.5%) worked in the non-production administration unit.
The total duration of being employed as a factory worker was a statistically significant factor
(p<0.0305) associated with NIHL. Factory workers who had served for 10-19 years were mainly
from the administration group 19 (33.3%) as compared to 6(28.6%) in mill machine, 5(20.8%) in
furnace, and 3(25.0%) in the workshop.
Exposure to high noise intensity was a significant factor (p < 0.0001) associated with NIHL. Mill
machine workers had the highest risk of developing NIHL due to operating in the highest noise
levels of 98.0 dB(A). The relative risk of developing NIHL for production unit workers was
33.1(95% CI 7.7-141.63).
In this study, using HPDs was not a significant factor (p = 0.088) in prevention of NIHL. Only
15(13.2%) workers had a pre-employment audiogram done in this factory
With the multivariate analysis, the factors associated with NIHL were duration of employment
(OR 3.8, 95% CI: 1.17, 12.53; p=0.001), working in the production unit (OR 33.10 95% CI:
7.74, 141.63; p<0.001) and age (OR 3.03, 95% CI: 1.48, 6.17; p=0.03).
Conclusion: This study demonstrates that hearing loss is common among steel mill workers
within this region. These findings qualify for implementation of an effective hearing
conservation and rehabilitation policy that will protect and improve the quality of life of these
mill workers.

3
1. INTRODUCTION
Noise is one of the most widespread pollutants in workstations. About six hundred million
workers are exposed daily to unsafe occupational noise levels in the world (1). Excessive
exposure to high intensity noise levels for a long duration of time results in irreversible hearing
loss (2).
Globally, ONIHL accounts for 7 to 21% of permanent hearing loss with an estimated negative
economic impact of 0.2-2% on the world‘s Gross Domestic Product (3).The World Health
Organization (WHO) rates ONIHL among the top ten work related problems worldwide and top
three causes of hearing impairment in Africa (4). In Kenya, the prevalence of NIHL ranges from
22%-32.5% (5, 6).
Steel is a useful raw material, which is vital to various upcoming industries within Kenya. The
iron and steel industry is considered a ‗heavy industry‘ (7) that forms a huge entity in Kenya and
noise exposure for factory workers is an inseparable part of these industries. Several workers
labour in these settings, forming a foundation to implement hearing conservation programs that
will reduce the local burden within this country.
NIHL is preventable but it cannot be reversed. It persists even after the noise exposure is
terminated as permanent damage has already occurred (2).
The purpose of this study was to identify the prevalence of NIHL and the associated risk factors
among the workers of a Steel Rolling Mill in Nairobi, Kenya.

4
2. BACKGROUND
2.1. HISTORY OF NOISE INDUCED HEARING LOSS
Alberti et al (2) stated NIHL as a major occupational aural disorder after the discovery of
gunpowder. In 1886, Thomas Barr (9) described the ‘boilermaker’s deafness’ related to
shipbuilding. Haberman (10) demonstrated the histological features of NIHL in the organ of
Corti within the inner ear in 1890. Afterwards, Fowler (11) described the characteristic noise-
induced 4 kHz notch on an audiogram and in due course in 1939 and Bunch (12) explained the
audiometric findings of NIHL. The technical advances of the Second World War fetched noisier
machinery resulting to NIHL becoming more of a global problem.
2.2. DEFINITIONS OF SOUND AND NOISE
Sound is the propagation of pressure waves radiating from a vibrating source through an elastic
medium (13). The waves are characterized by the amplitude of sound pressure changes
(intensity), frequency (pitch), and the velocity of propagation (2). A simple type of sound wave
is called a pure tone of one frequency. The source of such a sound is a sinusoidal pressure cycle
defined in terms of a single frequency and pressure amplitude at a given time (13). The number
of times such a cycle occurs in a given time is called frequency, which is measured in hertz (Hz
= 1/sec).
Noise is characterized as any unwarranted disturbance within a useful frequency band (2).
According to the time variation of the sound pressure level, noise is classified as continuous,
intermittent, repetitive, discrete , and separated single impulses, with continuous being the most
harmful(13). The effects of noise depend on intensity, spectrum, cumulative lifetime exposure,
pattern, and individual susceptibility (2).

5
2.3. DEFINITION OF NOISE INDUCED HEARING LOSS
The WHO defines NIHL as bilateral sensorineural loss with a 0.5 KHz threshold of less than 50
dBHL (13). An individual with NIHL has had a noise exposure history of 100 dB (or 83 dB A)
for a 50-year lifetime with at least a 15 dB difference between high and low frequency threshold
averages (14).
2.4. HEARING LEVEL
Human ears can normally detect sounds within a frequency range of 20 Hz to 20 kHz, but are far
more sensitive to sounds between 1 kHz and 4 kHz (14). Individuals can distinguish between
tones with changes in frequencies between 0.3 % at 3 kHz and 3% at 100 Hz.
According to the International Standard Organization (15), normal ranges of audiometric
frequencies are from 0.125 kHz to 8 kHz for both males and females between 18 to 70 years of
age. The human speech range lies within the 250 Hz to 4000 Hz range.
2.5. NOISE MEASUREMENT AND EXPOSURE
Noise exposure is the total sound energy reaching the inner ear (2). Total sound energy is a
combination of sound intensity and duration. It is measured with a sound pressure meter in
decibel (dB) units. A decibel is a tenth of a Bel that measures changes in air pressures. The
logarithmic nature allows for representation of a large range of ratios and description of
perceptual levels.
Sound intensity is also represented on a logarithmic scale of decibel SPL (Sound Pressure
Level). On this scale, 0 dB SPL is a sound wave power of 10-16
watts/cm2, the weakest sound
detectable by the human ear. Normal speech is at about 60 dB SPL, while painful damage to the
ear occurs at about 140 dB SPL (13Filter A (dB-A) is used to weight SPLs in accordance with
the frequency response characteristics of the human auditory system for pure tones. It
approximates the ear‘s response for a sound level below 55 dB with lower frequencies being
filtered (16). The A-weighting is internationally used to assess occupational noise that will be
employed in this study.
As per Chai et al, the usual noise levels in steel rolling mills vary from 81 to 100 dB (A) (17).

6
3. PATHOPHYSIOLOGY OF NOISE INDUCED HEARING LOSS
3.1. NORMAL PHYSIOLOGY
The ear is made up of the outer, middle, and inner ear, consisting of the auditory and vestibular
pathway (Fig 1).Acoustic stimuli are transferred from the free field to the inner ear by the
external and the middle ear.
Figure1. The major components of the right ear
(Courtesy of: http://www.lyrichearing.com)
The external acoustic meatus and the middle ear transmit acoustic energy from air to the cochlea.
The external acoustic meatus is approximately 25mm long with a resonant frequency of around
3,200 Hz, which helps determine the acoustic energy delivered to the cochlea(2).
The meatal resonance redistributes the sound pressure as it passes from the entrance of the
external acoustic meatus to the tympanic membrane (2).

7
Amplification of sound pressure can be as great as 20 dB in the mid-frequency range depending
on the direction and frequency of the sound source as illustrated in Figure 2A (8). Acoustic
energy in the mid-frequency range is amplified when industrial noise travels through the external
acoustic meatus, creating a band pass noise centred at 3200 Hz at the tympanic membrane
(Figures 2B and 2C).
Figure 2:A. Resonance characteristics of a typical adult external auditory meatus. B. Spectrum of a
typical industrial noise. C. Transformation of the industrial noise as measured at the tympanic
membrane.
From: Hearing loss by Donald Henderson (8)
In steel mills, the external acoustic meatus creates a band pass noise, centred at 3 kHz since the
noise is broadband (8). Hence, the 4 kHz notch is the result of the half-octave shift of the
fundamental external meatus resonance (Fig. 2C).

8
There is a 40dB transmission loss when air-bone sound is transmitted to the fluid filled cochlea.
This is compensated by the middle ear that serves as an impedance matching transformer,
behaving like a low pass filter with an approximate cut-off of 1,200 Hz. The poor audiometric
performance at high frequencies is explained by the attenuation at high frequencies (above 4
kHz) (8).
The noise threshold of at the cochlea ranges from 80-85dbA for the frequencies ranging from
500-4000Hz. The stapedial reflex prevents high noise levels from reaching the cochlea; hence
protects against early hearing loss.
3.2. MECHANISMS OF DAMAGE
The inner ear consists of the cochlear, the semi-circular canals, and the vestibule. It contains the
saccule and utricle, which are balance and equilibrium-related structures (2) as shown in Figure
3.When sound is conducted to the inner ear through the movement of the stapes footplate, it
initiates a travelling wave that moves from the oval window to a point of maximum vibration
along the basilar membrane. The relative displacements of the basilar membrane and of the
tectorial membrane generate shearing motions of the outer hair cells (OHC), inner hair cells
(IHC), and sterocilia (18).
Figure 3: Schematic arrangement of the Organ of Corti.
(From: Research on the Organ of Corti of hearing in mammals. (Corti A 1851).

9
OHC mechanically assist in the vibration of the Organ of Corti that augments the sensitivity and
the frequency tuning of the inner ear. Damage of OHCs is perpetually greater than IHCs
following a traumatic noise exposure. They are more vulnerable to damage, since they
experience a direct sharing force at their stereocilia, whereas the IHC stereocilia are stimulated
by viscous drag. The OHCs have most of their long axis ‗unprotected‘ from mechanical stress,
whereas the IHCs are ‗supported‘ on all surfaces with supporting cells. OHCs are also closer to
the point of the maximal basilar membrane travelling wave displacement than are IHCs (2).
OHCs are subject to damage from excessive shearing between the tectorial membrane and the
cuticular plate via the ciliary connections.
If OHCs are damaged, a greater stimulation is required to initiate a neural impulse. This raises
the threshold sensitivity of the IHCs, which is perceived as hearing loss. High levels of
stimulation release an excess of neurotransmitter (glutamate) in IHCs leading to damage to
associated nerve rootlets, which may be permanent (2). A person‘s hearing can be reduced 40 to
50 dB with OHC damage. The ability to understand speech in a noisy background is also
compromised due to degraded tuning of the basilar membrane. (19).
NIHL not only implicates the sensory cells, but also supporting cells, nerve fibres, and vascular
supply. Secondary to very high levels of continuous sound, the hair cells in the Organ of Corti
may be impaired directly by noise, or indirectly by vascular lesions (2). These vascular lesions
may be the result of separations of Reissner‘s membrane at its attachment to the lateral wall. This
leads to a reduction in the number of capillaries and occlusion of vessels. The hair cells are
anoxic and thus secondarily damaged (20). The extent of the effects of noise on cochlear blood
flow is influenced by the length and intensity of the noise exposure.
Following severe exposures that lead to losses of IHCs, with a concomitant loss of inner pillar
cells, there is a retrograde degeneration of VIII nerve fibres reflected in losses of spiral ganglion
cells and morphologic changes in the ascending neural pathways (2).
High noise levels increase the level of metabolism, which increases the demand for ATP and
consequently generation of superoxide. This free radical presence leads to further damage of
proteins, mitochondria, DNA, and eventually leads to cell death (2).

10
The damage is worse after several days of a noise exposure insult. This is because of apoptotic
cell death that continues for days after the exposure. This may be initiated by a Src–protein
tyrosine kinase (PTK) signalling cascade that is activated in OHC following noise exposure (2).
High noise levels result in basal cell damage (21). This is attributed to the fact that high
frequency stimuli cause maximal disturbance near the oval window involving greater travelling
waves and acoustic load at the base. When the frequency is lowered, the peak of basilar
membrane motion systematically shifts apically. There is also a possible basal locus for shock
from abnormal impulse energy conducted to the cochlea (21).
3.3. SOUND INTENSITY AND HEARING
The type and amount of direct hair cell damage depends on sound intensity. When the ear is
stimulated by sounds of 70 dB SPL or less, adaptation occurs. Above a certain minimum of
frequency and intensity, the OHCs show signs of auditory fatigue through drooping of the stereo
cilia and micro vascular changes (14).
Puel (22) described that, glutamate over secretion at the synapses between hair cells and the
auditory nerve fibres leads to synaptic overload, swelling of synaptic terminals, and damage to
both to the primary auditory nerve fibres and hair cells.
This relates to Temporary Threshold Shift (TTS), in which the hearing threshold elevates
during the first 8-12 hours of a noise exposure and recovers within 16 hours (23). TTS may last
for several days or weeks if the noise exposure is sufficiently intense.
The level of a TTS is correlated to the causative noise's intensity, frequency, content, and pattern
of exposure. The TTS produced by intermittent noise exposure is considerably less than the shift
produced by continuous exposure to the same total amount of noise as stated by Glorig (24).
This can be attributed to auditory fatigue.
Mills et al. (25) established that no TTS occurs until 74 dB at 4 kHz. Thereafter, a 4 kHz sound
produces an asymptotic threshold shift of 1.7 dB for each decibel increase in sound level. Hence,
the critical level is 74 dB at 4.0 kHz, 78 dB at 2.0 kHz, and 82 dB SPL at 1.0 and 0.5 kHz
respectively.
11
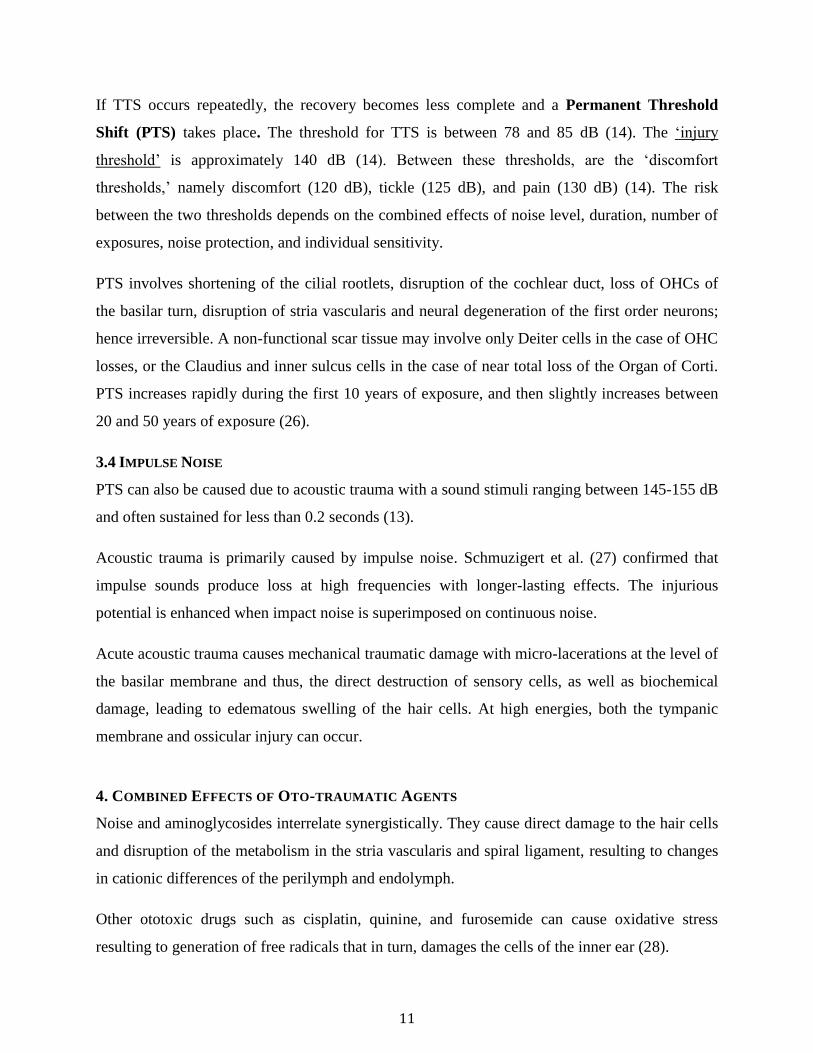
If TTS occurs repeatedly, the recovery becomes less complete and a Permanent Threshold
Shift (PTS) takes place. The threshold for TTS is between 78 and 85 dB (14). The ‗injury
threshold‘ is approximately 140 dB (14). Between these thresholds, are the ‗discomfort
thresholds,‘ namely discomfort (120 dB), tickle (125 dB), and pain (130 dB) (14). The risk
between the two thresholds depends on the combined effects of noise level, duration, number of
exposures, noise protection, and individual sensitivity.
PTS involves shortening of the cilial rootlets, disruption of the cochlear duct, loss of OHCs of
the basilar turn, disruption of stria vascularis and neural degeneration of the first order neurons;
hence irreversible. A non-functional scar tissue may involve only Deiter cells in the case of OHC
losses, or the Claudius and inner sulcus cells in the case of near total loss of the Organ of Corti.
PTS increases rapidly during the first 10 years of exposure, and then slightly increases between
20 and 50 years of exposure (26).
3.4 IMPULSE NOISE
PTS can also be caused due to acoustic trauma with a sound stimuli ranging between 145-155 dB
and often sustained for less than 0.2 seconds (13).
Acoustic trauma is primarily caused by impulse noise. Schmuzigert et al. (27) confirmed that
impulse sounds produce loss at high frequencies with longer-lasting effects. The injurious
potential is enhanced when impact noise is superimposed on continuous noise.
Acute acoustic trauma causes mechanical traumatic damage with micro-lacerations at the level of
the basilar membrane and thus, the direct destruction of sensory cells, as well as biochemical
damage, leading to edematous swelling of the hair cells. At high energies, both the tympanic
membrane and ossicular injury can occur.
4. COMBINED EFFECTS OF OTO-TRAUMATIC AGENTS
Noise and aminoglycosides interrelate synergistically. They cause direct damage to the hair cells
and disruption of the metabolism in the stria vascularis and spiral ligament, resulting to changes
in cationic differences of the perilymph and endolymph.
Other ototoxic drugs such as cisplatin, quinine, and furosemide can cause oxidative stress
resulting to generation of free radicals that in turn, damages the cells of the inner ear (28).

12
Noise exposure prior to receiving an ototoxic drug does not appear to affect the potential for
ototoxicity. However, excessive noise pollution along with ototoxic drugs can cause a greater
ototoxic effect (25). Ototoxic damage usually progresses from high to low frequencies.
Dobie (29) showed that the effects of presbycusis added linearly to the effects of occupational
noise exposure. In sensory and mechanical types of presbycusis there is reduced auditory
sensitivity at higher frequencies. By the age of 50-59, hearing loss at 16 kHz is greater than 60
dB (30). In this study, subjects over 55 years of age will be excluded in order to correct for age-
related hearing loss.
A large number of other factors can affect hearing. These include middle ear disease, previous
head injury, chemicals and bacterial infections, as well as over 40 genetic and metabolic
syndromes (30).
5. CLINICAL FEATURES
The first symptom of NIHL is trouble understanding speech in high levels of ambient
background noise (2). As NIHL progresses, there is difficulty hearing consonants such as s,f,t,z
(high pitched sounds). They are also unable to hear octaves such as high pitched sounds even in
quiet conversational situations. Hence, sounds heard are distorted and voices may not be
understood. As NIHL progresses, individuals have abnormal growth in loudness, known as
recruitment. This results in a reduced dynamic range to a discomfort level.
More than 50% of individuals with NIHL report intermittent or continuous bilateral tonal tinnitus
(31). Recent studies confirmed that when associated with NIHL, tinnitus is almost invariably of
high pitch, with a tonal or narrow frequency-band timbre. Tinnitus appears early after an impulse
noise and is usually temporary. With continuous long-term noise exposure, it appears after years,
but remains permanent. The incidence and severity of tinnitus rises with increased hearing loss
(2).

13
5.1ESTABLISHMENT OF THE PRESENCE OF NIHL
Dobie listed the criteria for the diagnosis of Occupational NIHL (32):
It is always a sensorineural hearing loss.
It is almost always bilateral.
High-frequency losses rarely exceed 75 dBA; low-frequency losses rarely exceed 40
dBA.
In stable exposure conditions, losses at 3, 4, 6 KHz with recovery at 8 kHz reaching a
maximum level in 10-15 years.
Hearing loss does not progress after noise exposure is discontinued.
As hearing loss progresses, the rate of hearing loss decreases.
6. DIAGNOSIS OF NIHL
A physical examination by otoscopy will evaluate the presence of cerumen impaction or
evidence of middle ear disease. This will exclude other causes of hearing loss.
Tuning fork tests (Weber and Rinne) performed with a 512-Hz tuning fork will classify the loss
into conductive or sensorineural. If there is sensorineural loss, the Rinne test will demonstrate air
conduction better than bone conduction and the Weber test will lateralize away from that ear.
NIHL is identified with a calibrated audiometer in a sound attenuated room. The first sign is a
‗notching‘ of the audiogram at 3000, 4000, or 6000 Hz, with recovery at 8000 Hertz (33). The
greatest loss usually occurs at around 4 kHz which forms an acoustic notch (10) or a boilers
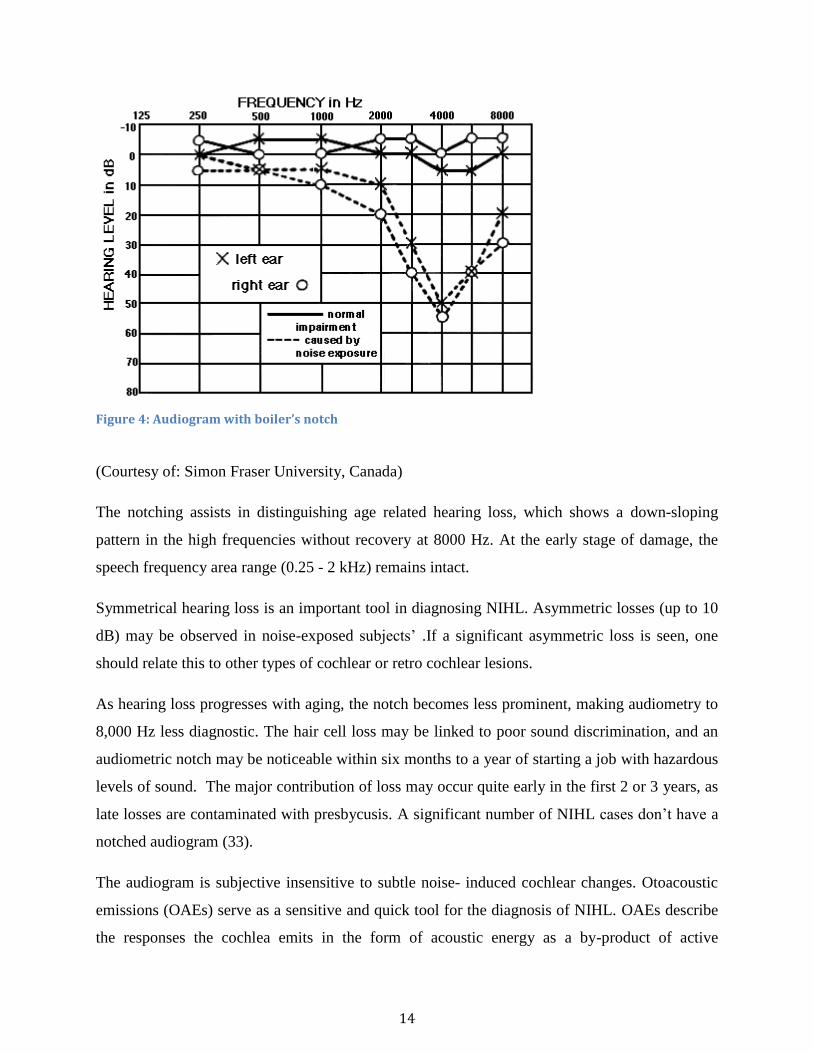
notch (Figure 4).
14
Figure 4: Audiogram with boiler’s notch
(Courtesy of: Simon Fraser University, Canada)
The notching assists in distinguishing age related hearing loss, which shows a down-sloping
pattern in the high frequencies without recovery at 8000 Hz. At the early stage of damage, the
speech frequency area range (0.25 - 2 kHz) remains intact.
Symmetrical hearing loss is an important tool in diagnosing NIHL. Asymmetric losses (up to 10
dB) may be observed in noise-exposed subjects‘ .If a significant asymmetric loss is seen, one
should relate this to other types of cochlear or retro cochlear lesions.
As hearing loss progresses with aging, the notch becomes less prominent, making audiometry to
8,000 Hz less diagnostic. The hair cell loss may be linked to poor sound discrimination, and an
audiometric notch may be noticeable within six months to a year of starting a job with hazardous
levels of sound. The major contribution of loss may occur quite early in the first 2 or 3 years, as
late losses are contaminated with presbycusis. A significant number of NIHL cases don‘t have a
notched audiogram (33).
The audiogram is subjective insensitive to subtle noise induced cochlear changes. Otoacoustic
emissions (OAEs) serve as a sensitive and quick tool for the diagnosis of NIHL. OAEs describe
the responses the cochlea emits in the form of acoustic energy as a by-product of active

15
processing by the OHCs. Attias et al. (34) showed increased sensitivity and specificity of OAE in
the detection of early NIHL, whereby the distortion product OAEs reflect is a bilateral and
almost symmetric loss in the high frequency tones. This study utilized the pure-tone audiometer
due to lack of availability of this tool.
7. TYPES AND GRADING OF HEARING LOSS
The types of hearing loss include conductive, sensorineural, and mixed hearing loss. The degree
of hearing loss is described as the extent to which a person's threshold exceeds normal hearing
(0-25 dB hearing level [HL]) and can significantly impact communication abilities and quality of
life.
Table 1: WHO classification of hearing loss(14).
The audiometric ISO values are averages of values at 500, 1000, 2000, 4000Hz.
Grade of
Impairment
Audiometric ISO value
Performance
0 (No
impairment)
25 dBHL or less (better
ear)
No or very slight hearing problems. Able to
hear whispers.
1 (Slight
impairment)
26-40 dBHL (better ear) Able to hear and repeat words spoken in a
normal voice at 1 meter.
2 (Moderate
impairment)
41-60 dBHL (better ear) Able to hear and repeat words using a raised
voice at 1 meter.
3 (Severe
impairment)
61-80 dBHL (better ear) Able to hear some words when shouted into
better ear.
4 (Profound
impairment
including
deafness)
81 dBHL or greater
(better ear)
Unable to hear and understand even a shouted
voice.

16
8. THE DAMAGE RISK CRITERIA
The Occupational Safety and Health Act (OSHA) in the United States of America (35) delineate
the maximum exposure time for unprotected ears as 85 Db (A) over a time-averaged, eight hour
workday, five days a week for a minimum of five years.
The National Institute for Occupational Safety and Health (NIOSH) (36) predicts that one out of
every four factory workers exposed to noise levels of 90dBA or more during lifetime will
develop NIHL.
An average of 15% of the population are at risk of significant hearing loss after 10 years of 90
dBA exposure, 8 hours a day, 5 days a week. Seven per cent of the population is at risk for 10
years of 85dBA for a similar time-frame (36).
The Factories and Other Places of Work (37) law states that permissible levels in Kenyan
production units should not exceed 90dBA for 8 hours of exposure. In non- production offices,
the recommended noise levels are 50 Db (A) during the day and 45 Db (A) at night.
The damage risk criteria equates actual noise measurements at work over a period of years, in
which several jobs have been held into a single risk figure for legal purposes (Table 2).
Sound Level dB(A) Maximum Exposure Time(hours)
90 8
92 6
95 4
97 3
100 2
102 1.5
110 0.5
115 15 minutes
Table 2: Permissible Noise Exposure by OSHA (29 CFR 1910.95) (35).

17
Hearing protective devices (HPDs) should be provided to reduce the sound levels stated in Table
2 if administrative or engineering controls fail to reduce to safe sound levels.
9. PREVENTION OF NIHL
Besides avoiding excessive noise, wearing HPDs such as ear-plugs and earmuffs constitute an
important preventive measure. The effectiveness of HPDs in prevention of NIHL is greatly
dependent upon the correct use, wear, and compliance of the equipment. NIOSH recommends
de-rating noise reduction by 75% for ear muffs, 50% for custom and foam earplugs (36). Further
prevention methods include regular breaks, regularly serviced machinery and periodic
audiometric testing.
10. LITERATURE REVIEW
A number of organizations together with the National Institutes of Health and the Centre for
Disease Control and Prevention identify NIHL as a strategic target area for their efforts (38). In
Africa, prevalence rates of 27.4-34% have been reported, indicating the magnitude of the
problem (5, 39).
In 2004, Gitau et al. (5) conducted a study to determine prevalence of NIHL among textile
industry workers in Eldoret, Kenya. He observed that 60% of workers in the weaving department
had NIHL with an overall prevalence rate of 32.5%. Sound intensity level in the textile industry
ranged from 33dB to 101dB with a mean daily exposure time of 7.67 hours. This was tallied with
the local levels presented by Wambugu (40) in 1992. Noise levels in steel mills ranges from 81
to 100 dB (A), which may result in worse hearing loss as compared to the textile industry (17). In
addition, 39.6% workers above 35 years of age in Gitau‘s study had a threshold shift towards
hearing loss.
The Operation Eardrop- Kenya (6) implemented the Jua Kali Hearing Conservation Programme,
where they surveyed 1200 Jua Kali workers and established 22% with hearing loss in Kisumu,
which was analogous to a pilot study done in Nairobi that had 20% prevalence. This provides a
strong bearing for this study since the Jua Kali workers (informal industry) frequently operate
metal wares that may have similar noise levels. Furthermore, the noise survey showed 75% of
the workers were exposed to noise levels exceeding 85 dBA on a daily basis.

18
However, the sheds were open, indicating interference from background noise that may impact
on the accuracy of the actual noise levels. This study measured noise levels in a close setting. It
was shown that majority of the workers had no knowledge of preventive measures against
precarious noise levels, including HPDs.
A recent study by Anino et al. in 2010 (41) showed that occupational hearing loss in 246 aircraft
crew members was much lower, unlike the textile and Jua Kali workers (informal industry) in
Kenya. The prevalence of NIHL was 15.3%, with ground crew at 14.8% and air crew 16.1% at
the Jomo Kenyatta International Airport in Nairobi. This can be attributed to compliances of
HPDs. Respondents ranged from 22 to 62 years of age with a mean duration of exposure of 10.7
years. The ground crew had significantly worse mean hearing threshold levels at 3, 4, and 6 kHz,
than the air crew with 50% working at the noisiest section of the airside ramp. Male workers
were mainly affected with a male to female ratio of 4:3, whereas those aged 50 years and above
had a 13.7 times higher relative risk than those aged 20 to 29 years. Exposure of more than 10
years was significant (p < 0.01) for hearing loss at 4 kHz. Hence, Anino recommended periodic
audiometric assessment of workers targeting mainly the older vulnerable group. Conversely,
background noise estimates were not recorded which would be necessary to determine subtle
associations and trends.
Steel production room employees have been found to have a higher risk of NIHL compared to
administrative employees despite working in the same factory as shown by Harmadji et al (42).
He carried out a case control study with controls from the administration block at noise intensity
levels of 60.4 dB and cases from the steel production room at 102 dB. A significant difference in
the incidence of NIHL between the two groups was established, where 21 workers (84 %) of the
case group developed NIHL, compared to one worker (4 %) of the control group in an Eastern
Java steel company. There was also a difference in correlation between NIHL and working
period (p < 0.05). This was also established by Chang et al. (43) with one hundred times more
risk for NIHL among the in-field workers compared to the administration group in a liquefied
petroleum gas cylinder infusion factory in Taipei City. Our study aimed to determine the
difference in NIHL between production room and administrative staff in a steel mill.

19
The high risk of the exposed group is also confirmed in various case control studies by Ahmed et
al. (44) and Shakhatreh et al. (45). Ahmed et al (44) in Saudi Arabia showed 38% of exposed
subjects had NIHL, which was an 8-fold higher rate than that found for non-exposed subjects.
Likewise, Shakhatreh et al. (45) presented 30% of NIHL in the exposed group from a textile
company in Jordan and 8% in non-exposed group from that community. The exposed group was
four times more likely to develop hearing loss. This study will aim to describe the risk of hearing
loss between the two different groups.
The duration of exposure affects the prevalence of hearing impairment as observed by Narlawar
et al. (46) in workers of the Nagpur iron and steel industry in India. He saw a direct association,
which was found to be statistically significant (p < 0.001). This has also been defined by Anino
et al. (41), and Guerra et al. (47). Guerra‘s mean length of exposure to noise in the metallurgical
company was 9.9 years. He showed that the length of exposure to occupational noise of 0 to 5
years had a prevalence of 8.3%, 6 to 10 years was 14.3%, and 20 years and over was 38.7%,
respectively. He reported, however, that it may be over or underestimated due to a variety of
interests, such as the obtaining of some legal assistance.
On the other hand, Ologe (48) in Nigeria carried out a cross-sectional comparative study in a
steel rolling mill. His sample size was 159 from various sections in the mill. He showed that
noise level ranged from 49-93 dBA. He noted that the average hearing threshold at 4 kHz for the
groups increased with an increasing noise exposure level; so also was the pure-tone average.
A meta-analysis by Boger et al. (49) evaluated the noise spectrum influence on NIHL prevalence
in workers as a cross-sectional historical cohort, carried out in steel mills, timber mills, and
marble shops, with noise levels above 85dB. 53.8% of the workers from the metallurgical plants
had an audiometric notch, followed by those from the timber mills, with 48.1%, and marble mills
with 40.4%. In the metallurgical plants, the 8,000 Hz frequency band was the one that represents
the highest noise level (85.4dB); hence, it is the most noxious to workers.
As to noise induced hearing losses (49.0%), they noticed that the frequency bearing the largest
notches was at 6,000 Hz. Poor hearing levels of 23.4% in the left ear, compared to 13.8% in the
right ear were also demonstrated.

20
Simon (50) described steel manufacturing as one of the industries with the highest levels of
noise. Industrial noise pollution produces loud noise, which tends to last much longer. 52 to 60%
of all industrial workers get exposed to noise level of 85 dB or more for 8 hours a day (50).
In 1992, Kilburn et al. (51) carried out a study on ironworkers, where he found that 25% of the
study subjects had hearing loss at the 500 Hz frequency, while 60% had hearing loss at 8000 Hz,
with the rest at 4000Hz. This study also linked hearing loss in ironworkers to increased balance
dysfunction; an obvious concern for a worker population commonly performing work at elevated
locations.
Minja et al. (52) carried out a study regarding NIHL among industrial workers in Dar-es-alaam,
where 140 cases and 52 controls were recruited. 28 cases and 8 controls had NIHL. 81.1% of the
cases and 85% of the employees knew that noise causes hearing loss, and all workers/employees
from both study areas knew that noise induced hearing loss could be prevented by some form of
ear protection. Masaka (39) established the knowledge of NIHL at a Zimbabwean mine to be
85%. Conversely, compliance with the use of HPDs was found to be low, with optimum usage
only being achieved during the last 4 days of the 14-day observation period.

21
Table3: Summary of similar studies showing Occupational Noise Induced Hearing Loss
Author NIHL Prevalence Noise levels
(dBA)
Special Remarks
Gitau et al.
(2004)
Eldoret,Kenya
32.5% 33-101 39.6% workers above 35 years of age had
a threshold shift towards hearing loss.
OED (2009)
Kenya
22% Kisumu
20% Nairobi
75% exposed to 85
dBA
Use of HPDs not explored.
Anino et al.
(2010)
Nairobi,Kenya
15.3%
14.8% with ground
crew
16.1% with air crew
More than 90 dBA Duration of more than a ten year exposure
was significant (p < 0.01) for 4 KHz of
hearing loss.
Ologe et al.
(2004)
Nigeria
28.2% mild –moderate
HL in better ear
56.8% mild to
moderate in worse ear.
49- 93 Pre-employment audiogram strongly
recommended.
Masaka (2009)
Zimbabwe
27.4% 81.2-125 Knowledge of HPDs = 85%
Shakhatreh et al.
(1999)
Jordan
30% exposed
8% non -exposed
46-95 Exposed group was 4 times more likely to
develop HL when compared to the non-
exposed group.
Chang et al.
(2009)
Taiwan
56.8% 55.4-98.3 None adopted noise-proof devices
regularly at work.
100 times more risk for NIHL was found
among these in-field workers compared to
administration workers.
Guerra et al.
(2005)
Brazil
15.9% 83-102 Workers over 50 years of age had 11.45
times higher risk of getting NIHL.

22
12. JUSTIFICATION OF THE STUDY
As Kenya achieves its industrialization goals, many factories are likely to sprout up. This will
subject the employees of these factories to the risk of NIHL due to exposure to excessive noise.
ONIHL is therefore, likely to become a common health problem that will need to be addressed
by the Kenyan health sector.
Although NIHL has been well recognized for a century within the steel rolling mills, it is weakly
supported by epidemiological evidence in Kenya. This study will overcome the scarcity by
providing an accurate quantification of the prevalence of NIHL. This data will assist in assessing
the risk and burden of disease and enhance various Health Conservation and Rehabilitation
programs to improve the quality of life of factory workers in Kenya.
13. RESEARCH QUESTION
What is the prevalence of noise induced hearing loss among workers in a steel rolling mill in
Nairobi, Kenya and what are the likely associated risk factors?
14. AIMS AND OBJECTIVES
14.1BROAD OBJECTIVE
To identify the prevalence and risk factors associated with NIHL in a steel mill.
14.2SPECIFIC OBJECTIVES
1. To establish the prevalence of NIHL among steel mill workers.
2. To compare the prevalence of NIHL between production unit and non-production unit
workers.
3. To determine the possible risk factors for NIHL in Steel mill workers.

23
15. MATERIALS AND METHODS
15.1. STUDY DESIGN
A comparative cross-sectional study based in a steel rolling mill company
15.2. SETTING
A major steel rolling mill factory in Nairobi, Kenya, that manufactures twisted bars for
construction.
15.3. STUDY POPULATION
All steel rolling mill workers with a minimum of five years of continuous service, formed the
study population.

24
15.4. INCLUSION CRITERIA
Mill workers who had been working at the factory for a minimum of 5 continuous years.
Mill workers who signed an informed consent.
15.5. EXCLUSION CRITERIA
Those who worked for less than 5 years in the current mill.
Workers 55 years of age and older whose hearing loss may be complicated by
presbycusis.
Workers with significant concurrent noise exposure.
Workers who had been using ototoxic medication.
Workers with conductive hearing loss.
Workers with a history of previous middle ear infection.
Workers with history of previous ear surgery or head injury.
Workers with systemic disease affecting their hearing.

25
15.6 SAMPLE SIZE CALCULATION
The determination of sample size in studies comparing two proportions was calculated using the
formula (53)
Where:
Probability of "Hearing Loss" in "Factory Workers" group p1 30%30.3
Probability of "Hearing Loss" in "Office Workers" group p2 0.8%0%
p1 - p2 =d 0.22
Odds Ratio OR 4.93
Proportion of participants expected in production unit workers 50% 50.0%
Proportion of participants expected in non-production workers 50% 50.0%
Ratio of (production workers: non-production workers) sizes r 1.00
P corrected p-bar 0.190
Power 1-β 80%
z-β 0.84
Confidence level 1-α 95% 95%
z-α 1.96
Number of subjects required for ‗production workers‘ (n1) 49
Number of subjects required for ‗non-production workers‘ (n2) 49
Continuity correction for n1' n1 57
Continuity correction for n2' n2 57
Sample Size 114
Figures were rearranged to achieve 80% power of the study, with prior reference from Gitau et
al. (5).

26
15.7 METHODOLOGY
15.7.1. RECRUITMENT OF SUBJECTS
Participants were selected from their appointment list in both the production and non-production
sections, using a simple sequential sampling. A brief history was taken to screen for workers
who satisfied the inclusion criteria. 57 participants from each section were then recruited,
approached, and briefed about the study and enrolled upon consent (Appendix 1).
15.7.2. NOISE MAPPING:
Noise was measured with the Cirrus: 263 Type1 Noise Meter with 1:1 Octave Filter on a dBA
scale that was calibrated.
For the administration unit, readings were taken at the entrance, in the middle, and at the end of
the administration unit for an average of eight hours between eight am and five pm for five days.
For the production unit, noise was measured in the furnace, the mill machine, and the different
sectors, respectively. Three readings were taken at the entrance, middle, and the end of each of
these units. These were recorded when sound levels were noted to be steady for 15 seconds.
Electroacoustic calibration of the noise meter was performed each time before data collection.
15.7.3. DATA COLLECTION
A face-to-face interview with each of the workers was conducted. A standardized, anonymous
questionnaire (Appendix 3) was used to obtain their socio-demographic data (age, gender,
education), employment (in this factory and as an overall factory worker), and medical history
(tinnitus and vertigo) including use of any HPDs.
15.7.4. CLINICAL EXAMINATION,
A physical exam was done with an emphasis on ear examination. Preliminary otoscopic exam
with a Welch Allyn MOD 95001otoscope was done to rule out any aural condition. Any foreign
bodies or wax was removed before conducting audiological tests. Any pathology noted was
referred to Kenyatta National Hospital clinic 34
Weber and Rhinnes tuning fork tests were performed with an ADC Aluminium Alloy Tuning
Fork, 512 Hz Model: 500512 to identify whether the loss was conductive or sensorineural.

27
15.7V. AUDIOMETRIC MEASUREMENTS
All participants had pure-tone audiometric tests with an interacoustic AS216 diagnostic
audiometer Model: MD04503 complying with ISO 8253.Daily calibration was conducted before
subjects were tested, by setting the audiometer to scale 0. Both air and bone conduction
audiometry was done to determine the type of hearing loss. Pure-tone averages were calculated
for frequencies 0.5-6.0 kHz, and hearing loss was graded according to the WHO (14).
The audiometric measurements were conducted in a quiet office (30dB (A) in the company by an
audiologist. The measurements were done before the workers entered the work area. Thus the
workers had been away from noise for more than 16 hours. This helped us to show the
distinction between PTS and TTS.
The participant was relaxed and the procedure was explained. Ear phones were placed and each
ear was being tested separately.
After placing the ear phones, the participant was then asked to press the button once he/she heard
a tone. The process was started with the better ear based on the subject‘s report. If hearing was
reported to be the same in both ears; we began with the right ear. A sound stimulus was
presented to the ear of the listener at an intensity of 60dB at frequency of 1000Hz. If it was not
heard, it was increased in steps of 20 dB until the response was obtained. Once the subject
responded, a threshold search began by decreasing intensity by 10 dB if he/she heard the tone, or
increased by 5 dB if the tone was not heard. A threshold was considered to be the lowest level at
which the subject perceived the tone approximately 50% of the time.
This process was repeated for 2000, 3000, 4000, 6000, 8000, 500 and 250 Hz. The same was
done for the other ear. Bone conduction was measured by a vibrator, placed on the mastoid.
Masking was indicated where the difference between the left and right air conduction thresholds
were 40 dB or more. These findings were then plotted on a standard form for both ears
(Appendix 4).

28
16. QUALITY CONTROL
The questionnaire was pretested on 10 conveniently sampled workers (5 each from their
respective units). Special attention was paid to the sensitivity and acceptability of the questions,
as well as ambiguity. This ensured that questions were set in a logical manner, were appropriate
and obtained useful answers. All 10 workers included in the pilot study were excluded from the
study to avoid bias.
Daily calibration was conducted before subjects were tested to avoid errors. The principal
investigator carried out the questionnaire, took noise measurements, and physical examination.
Audiometric tests were done by a qualified audiologist in both groups to eliminate observer bias.
17. DATA MANAGEMENT AND STATISTICAL ANALYSIS
Data was entered into a database and stored in a password protected database in Microsoft access
version 2010. The principal investigator checked for correctness once the data entry was
complete. Data was then exported to SPSS version 20 for analysis with the help of a statistician.
The prevalence of NIHL was estimated by computing the number of persons with NIHL among
people who had been exposed to industrial noise. Continuous variables were summarized using
measures of central tendency and dispersion, whereas categorical variables were summarized
using frequencies and percentages. To compare differences between respondents working in the
production unit with those working in the non-production units, chi-squared tests for categorical
variables and analysis of variance tests (ANOVA) for continuous variables were performed.
Independent predictors of NIHL were determined using a backward stepwise logistic regression.
For this study, a p-value of less than 5% (p-value of < 0.05) was considered statistically
significant.
18. DATA PRESENTATION
Results are presented in the form of charts, tables, text, and graphs.

29
9. ETHICAL CONSIDERATION
The study was approved by the Kenyatta National Hospital /University Of Nairobi Ethics and
Research Committee ethical and research committee (Approval number P405/09/2011).
Permission to perform the study was obtained from the owners of the steel mill.
Participants were given information about the study before taking consent and being inducted
into the study. They had the full authority to decline and participation. (Appendix1- tool for
taking consent)
Participants did not incur any extra cost for participating in the study. Costs incurred were borne
by the principal investigator.
Patient information was held confidential to ensure privacy.
Participants reserved the right to withdraw from the study at any time without any penalty.
The subjects were not given any monetary inducement to participate in the study.
The results were to be published in periodical, electronic and print media where applicable. Both
the mill owner and factory workers were to be offered benefits from the study.
20. IMPLEMENTATION TIMETABLE
Proposal Writing December 2010-September 2011
Ethics Review Committee July- August 2014
Data Collection September –October 2014
Data Analysis November-December 2014
Presentation of Results May 2015

30
21. BUDGET
ENTITY COST(Shillings)
Stationary 30,000
Otoscope 5,000
Tuning fork 2,500
Syringe set 4,300
Noise meter1500x15[Hire] 15,000
PTA(30X3000)[Hire] 90,000
Transport 18,000
Biostatistician 30,000
Contingencies 15,000
TOTAL 209,800

31
22. RESULTS
The pie chart below shows the distribution of workers in the various sections of the factory.
Figure 5: Pie chart showing distribution of selected workers
All participants were male aged between 24 to 54 years of age with a mean age of 35 years.
Subjects more than 55 years were excluded to correct for presbycusis.60 (52.6%) workers fell
into the 30-39 age brackets with 35 (61.4%) from the non- production unit and 25(43.9%) from
the production unit. 7(6.1%) individuals were above 50 years, with 4(7.0%) from the
administration unit as shown in Figure 6.
Of all the workers, 58(51.3%) had a secondary education level with 35 (30.7%) from the non-
production unit and 23(20.1%) from the production unit.13 (11.4%) workers had a tertiary
education from the non- production unit. This is shown in Figure 7 below:

32
Figure 6: Bar Chart showing distribution of age among mill workers
Figure 7: Bar Chart showing education level among mill workers

33
The difference in age and education between the two groups is statistically significant (p <0.05)
as shown in tables 4 and 5 below:
Table 4,5: Bivariate analysis of age and education between two groups
VARIANT
NIHL
No Yes
n % n % Chi
square
P value
Age group
20-29 years 24 80.0% 6 20.0% 8.966 0.030
30-39 years 40 67.8% 19 32.2%
40-49 years 7 41.2% 10 58.8%
50-59 years 3 42.9% 4 57.1%
Education
None 3 75.0% 1 25.0% 12.045 0.007
Primary 18 48.6% 19 51.4%
Secondary 40 69.0% 18 31.0%
Tertiary 13 100.0% 0 0.0%
VARIANT Unit
Non-production Production
n % n % Chi square P value
Age group
20-29 years 11 19.3% 19 33.3% 4.472 0.215
30-39 years 35 61.4% 25 43.9%
40-49 years 7 12.3% 10 17.5%
50-59 years 4 7.0% 3 5.3%
Education
None 0 0.0% 4 7.1% 30.003 <0.0001
Primary 9 15.8% 29 51.8%
Secondary 35 61.4% 23 41.1%
Tertiary 13 22.8% 0 0.0%

34
Noise Intensity
Noise levels were highest in the mill machine, 98.0 dB (A) followed by workshop 96.0 dB (A),
furnace 93.1dB (A), and lastly administration 60.0 dB (A). This is shown in the stacked pyramid
chart below
Figure 8: Pyramid chart showing noise levels in various units
At least 43(37.7%) workers reported high noise levels at their worksite with 11 (9.6%) stating
the noise to be very high. 73(64%) of all workers described the noise to be continuous at their
work units, from which 45(39.4%) belonged to the production unit. A number of 32(28%)
defined it as intermittent, irregular in nature. This is shown in table 6 below:

35
Table 6: Bivariate analysis of age and education between two groups
Duration of Exposure
Duration of working years was presented as the duration in the current mill and the total time as
a factory worker respectively.
All employees worked for 6 days a week, with various exposure hours and breaks. The
administration unit workers were exposed to a total of 42 hours a week. This was similar to the
workshop workers, however, they were subjected to higher noise levels of 96 dB (A).
The furnace staff had the most exposed hours of 66 hours per week as compared to mill machine
workers who did 54 hours per week. All workers were given an hour of lunch break except mill
machine workers who had 2 hours as shown in Table 7 below. From this table, it is clear that the
furnace and mill machine production workers were exposed for longer hours as compared to the
workshop and administration units respectively.
Noise Description
Unit
Non-production Production
n % n % Chi square P value
How would you describe the
type of noise that you are
exposed to in your work
environment
Continuous (Nonstop) 28 49.1% 45 78.9% 11.237 0.004
Intermittent (irregular or
broken) 22 38.6% 10 17.5%
Impact (Banging) 7 12.3% 2 3.5%
How would you describe the
noise levels at your work site
Negligible 23 40.4% 2 3.5% 40.763 <0.0001
Low 23 40.4% 12 21.1%
High 10 17.5% 33 57.9%
Very high 1 1.8% 10 17.5%

36
Table 7: Number of hours exposed per week in each unit
Task Noise Level
dB(A)
Hours
worked/day
Break
hours/day
Hours
worked/week
Break
hours/week
Total hours
exposed/week
Administration 60.0 8 1 48 6 42
Furnace 93.1 12 1 72 6 66
Mill machine 98.0 11 2 66 12 54
Workshop 96.0 8 1 48 6 42
The odds of getting NIHL among workers in production is 33 times (95%C.I. 7.4 – 141.6) than
the odds of getting NIHL among works in the administration department.
The relative risk of having NIHL in various production units compared to non- production unit is
shown below in Table 8.
Production Unit Relative Risk
Mill Machine 7.7
Furnace 4.36
Workshop 3.97
Table 8: Relative Risk of having NIHL in various production units as compared to non-production unit.
In the current mill, workers who had served for 0-9 years were mainly from the non-production
unit as 41(71.9%). From the production unit, 20(83.3%) furnace workers, 19(90.5%) mill
machine workers and 8(66.7%) workshop workers had worked for 0-9 years as seen in the Table
9 below.
The total time worked in a factory setting for the 10-19 year range had 19 (33.3%) administration
workers, 6 (28.6%) mill machine workers, 5 (20.8%) furnace workers and 3 (25.0%) workshop
workers. This showed that the administration unit workers were the longest serving factory
employees in both settings as compared to the production unit workers.

37
The working duration in different groups was significant (p = 0.003).
Task Duration of years
worked
Total time worked in a
Factory Setting
Total time worked in current
Factory
Number of
workers
% Number of
workers
%
Administration 0-9 years 33 57.9% 41 71.9%
10-19 years 19 33.3% 14 24.6%
20-29 years 3 5.3% 1 1.8%
30 years and
above
2 3.5% 1 1.8%
Furnace 0-9 years 17 70.8% 20 83.3%
10-19 years 5 20.8% 4 16.7%
20-29 years 2 8.3% 0 0.0%
30 years and
above
0 0.0% 0 0.0%
Mill machine 0-9 years 14 66.7% 19 90.5%
10-19 years 6 28.6% 2 9.5%
20-29 years 0 0.0% 0 0.0%
30 years and
above
1 4.8% 0 0.0%
Workshop 0-9 years 8 66.7% 8 66.7%
10-19 years 3 25.0% 3 25.0%
20-29 years 1 8.3% 1 8.3%
30 years and
above
0 0.0% 0 0.0%
Table 9: Duration of noise exposure in various tasks
The multivariate analysis showed that working previously in an excessive noisy environment
was significant, with an odds ratio of 3.8, and a 95% CI of 1.17-12.5 as shown in Table 10
below.

38
Coefficient Standard
Error of
coefficient
P value Odds Ratio 95% C.I. for OR
Lower Upper
Previous work in excessive
noise environment 1.344 0.604 0.026 3.835 1.173 12.539
Table 10: Previous noise exposure and hearing loss.
Hearing Loss
As per the WHO classification, 48(42.1%) mill workers had a sensorineural hearing loss, from
which 10(8.8%) had a mild impairment, 29(25.4%) had a moderate loss and 9(7.9%) had severe
hearing loss as shown in the pie chart below.
Figure 9: Pie chart showing distribution of hearing loss among mill workers

39
Of all the workers, 39 (34.2%) were found to have developed NIHL as per the Dobie criteria
(25). These were 33(84.69%) from the production unit and 6 (10.5%) were from the
administration unit. 17(81.0%) of the production workers with NIHL worked in the mill
machine, 11(45.8%) were from the furnace, 5(41.7%) operated in the workshop. This is shown in
Figure 10 below.
Figure 10: Bar chart presenting Prevalence of NIHL among steel mill workers
There was a significant difference between the two groups in the incidence of NIHL with p <
0.0001.
The boilers notch was present at 3 and 4 KHz with the 4 KHz notch highest in 17 (81.0%) of mill
machine workers as shown in Table 11.The 3 KHz notch was noted in four furnace workers who
had been factory workers for a minimum of 15 years, as well as one administration worker. This
particular mill supervisor had been a factory worker for 27 years, having worked for 6 years in
the current mill.

40
Table 11: Distribution of Notch at 3 and 4 KHz
Task NOTCH (KHz)
3 4
n % n %
Administration 1 1.80% 5 8.80%
Furnace 4 16.70% 7 29.20%
Mill machine 0 0.00% 17 81.00%
Workshop 0 0.00% 5 41.70%
Total 5 4.40% 34 29.80%
It was noted that 19(16.7%) of the workers had tinnitus. From these, 7(29.2%) were furnace
workers and 6(10.5%) were administration workers as shown in the Figure 11 below.
Figure 11: Chart showing number of workers who presented with Tinnitus

41
Use of Protection Devices
A total of 28 individuals (24.6%) reported daily use of HPDs at their units as shown in Table 12.
Use protective equipment for ears
n %
Administration 5 8.80%
Furnace 9 37.50%
Mill machine 10 47.60%
Workshop 4 33.30%
Total 28 24.60%
Task
Table 12: Table showing use of HPDs in various units
The HPDs used included formable earplugs at 58.3%, earmuffs at 33.3%, and pre-moulded
earplugs at 8.3% as shown in the Table 13 below.
The rest of the 34 production workers who did not use HPDs gave various reasons including
issues such as no education (4 workshop workers) and discomfort (7 furnace workers).
Table 13: Use of hearing protective devices and various types.
Task Pre-molded earplugs Formable earplugs Earmuffs
n % n % n % n
Administration 0 0.0% 1 50.0% 1 50.0% 1
Furnace 0 0.0% 3 37.5% 5 62.5% 3
Mill machine 2 20.0% 2 20.0% 6 60.0% 2
Workshop 0 0.0% 2 50.0% 2 50.0% 2
Total 2 8.3% 8 33.3% 14 58.3% 8

42
A total of 71.95% of the workers reported that they had not been given HPDs as shown in Table
14
Table 14: Reasons for not using HPDs
Only 15 individuals (13.3%) had a pre-employment audiogram. From these, 10 (17.9%)
belonged to the production unit and only 5 (8.8%) were from the non-production unit. None of
the workers presented these audiograms to the examiner to assess hearing loss.
From the multivariate linear analysis, the associated factors of NIHL were age (Adjusted OR
3.03, 95% CI: 1.48, 6.18; p=0.002), previous work in an excessive noise environment (Adjusted
OR 3.8, 95% CI: 1.17, 12.53; p=0.026), and working in the production unit (Adjusted OR 33.10
95% CI: 7.74, 141.63; p=0.0).
Table 15: A Multivariate Analysis showing significant factors associated with NIHL and their Adjusted
Odds ratios.
TASK REASON
Not Educated
on use
Feels hot not aware of
HPDs
Worried will
not hear
danger signs
Not provided
n % n % n % n % n %
Administration 2 3.5% 0 0.0% 1 1.8% 3 5.3% 51 89.5%
Furnace 1 4.2% 1 4.2% 0 0.0% 7 29.2% 15 62.5%
Mill machine 5 23.8% 1 4.8% 0 0.0% 5 23.8% 9 42.9%
Workshop 4 33.3% 0 0.0% 0 0.0% 1 8.3% 7 58.3%
Total 12 10.5% 2 1.8% 1 0.9% 16 14.0% 82 71.9%
Coefficient Standard Error of
coefficient P value Adjusted OR
95% C.I. for OR
Lower Upper
Age 1.109 0.363 0.002 3.033 1.489 6.178
History of ear problems 1.912 0.662 0.004 6.766 1.849 24.756
Previous work in excessive noise
environment 1.344 0.604 0.026 3.835 1.173 12.539
Production unit 3.500 0.742 .000 33.109 7.740 141.634

43
23. DISCUSSION
NIHL is associated with exposure to excessive noise (39, 44, 45, and 48). In Kenya, limited data
has been presented from the iron and steel industries, which has been reported to be one of the
factories with high noise levels (50). Our study selected one of the busiest steel rolling mills at
the heart of industrial area in Nairobi, Kenya. It comprised of 300 workers with 60 in the non-
production unit (administration unit) and 240 in the production unit. The mill was operational
from 7am to 7pm, 6 days a week with four main operational units namely the administration
block, workshop, furnace and the mill machine.
This study confirmed that excessive noise is a crucial occupational health hazard in the selected
steel rolling mill. The major risk factors for ONIHL were the duration of employment and the
intensity of noise exposure. This relationship is similar to that observed in previous studies in
Zimbabwe, Nigeria, Taiwan and Jordan (39, 48, 43 and 45).
The steel industry has been known to be one of the industries with very high sound intensity
levels (50).Individuals exposed to excessive high intensity sound levels will develop a hearing
threshold shift, which may be either be TTS or PTS (23, 29) subject to duration of exposure. In
this steel mill the sound levels ranged from 60 dB A to 98 dB A. The highest sound exposure
levels in the mill machine sector had already exceeded the permissible noise levels as stated by
OSHA (35) and the Kenyan 2005 Factories and Other Places of Work law (37).
Similar studies done in steel mills in Nigeria (48) and Indonesia (42) showed noise intensity
levels of 49 to 93dBA and 60.4 to102 dBA respectively. Noise intensity levels at administration
unit of our study industry are higher than the Rivatex textile industry, Eldoret, Kenya (5) and the
steel rolling mill in Nigeria (48) but similar to the steel factory in East of Java, Indonesia (42).
Noise intensity levels at the production unit of our study are lower than the steel mill in
Indonesia (48) China (17) and Tanzania (52) respectively. This perhaps can be due to newer
machines with frequent service and maintenance in this mill as reported by the mill owner.

44
In this study 39 (34.2%) workers had developed NIHL as per the Dobie criteria (32). The
prevalence was high compared to similar Kenyan studies by Anino et al. (15.3%) (41), OED Jua
Kali workers (22%) (6), Gitau et al (32.5%) (5) and a metallurgical company in Rio de Janeiro,
Brazil (15.9%) (46).
This high prevalence may have been attributed to lack of a standard hearing conservation
program other than the use of HPDs. However, it was much lower than those reported among
industry workers in Malaysia (83%)(54) ,sawmill workers in Kota Bharu, Kelantan (80%) (55),
and nickel workers in Zimbabwe (37%) (39).
The boilers notch has been recognised as a clinical sign of continuous exposure to noise. Barry
(56) defined ONIHL as beginning at 4 KHz and then shifting towards other frequencies. All 39
workers with NIHL were found to have a notch on their audiogram with the rate highest at
frequency of 4 KHz, similarly noted by Ologe et al (48) and Anino et al (41). The 3 KHz notch
was seen in 4 furnace workers who had been factory workers for a minimum of 15 years, and
one mill supervisor who had been a factory worker for 27 years. The shift can be explained by
the lengthy period of noise exposure. Similar 3 KHz notch (24%) as well as 6 KHz notch (34%)
was seen among ground crew members in the study by Anino et al (41).
In this steel mill, we found that being a production unit worker had an increased risk of 5.5 times
compared to that of a non-production worker in developing NIHL thence indicating a significant
difference between the two groups (p< 0.0001) .The production unit workers had a prevalence of
28.94% compared to non-production unit workers with 5.26%. Similarly, Shakrateh et al. (45)
who did a comparative cross-sectional study in 1999, showed 30% in exposed and 8% in non-
exposed, with a 4 times the risk. Ahmed et al. (44) in Saudi Arabia showed an 8-fold risk while
Chang et al. (43) defined a 100 times risk between the two groups.
The 6 non production workers found with NIHL working in safe sound levels in areas normally
thought to be free from noise. This maybe because those affected by NIHL are usually rotated to
the noise free areas to prevent further exposure. It appears that a number of administration
workers may have been subsequently promoted from production units as well as some carry out
supervision of production of workers in the production environment. This may explain the
hearing loss despite working in safer noise zones of 60 dBA.

45
All production unit workers surpassed their maximum exposure time in regards to their sound
levels as per OSHA (29 CFR 1910.95) (35) as seen in Table 1. This confirms that exposure to
high intensity of sound over a period of time predisposes to hearing loss. They were already
candidates for hearing conservation programs stated by both OSHA (35) and the Factories and
Other Places of Work law (37).
Only 15(13.2%) of all the workers reported having gone through a pre-employment hearing
assessment. Due to lack of a pre-employment audiogram, the hearing loss was difficult to
attribute to the current job or previous work as also reported by Ologe et al (48) and Anino et al
(41).
As per U.G Olero et al (57), hearing thresholds for workers increase with both age and duration
of employment. There was a positive and linear relationship between duration of noise exposure
and hearing loss (p = 0.003). In our study all subjects had a minimum of 5 years employment
duration. Cumulative length of exposure to occupational noise of above 30 years had the highest
prevalence of 66.7% This relationship was also observed in the study by Shakrateh (45) that
showed staff who worked over 25 years had 40% hearing loss as compared to those who worked
5-14 years suffering from a total hearing loss of 30%.Guerra (47) showed noise exposure of 20
years and above had a prevalence of 38.7%. However, Anino (41) reported that 12.1% of NIHL
in crew members who had been working for more than 20 years compared to 21.4% for 0-4 years
of employment.
This study shows there is possibly an additive effect of noise and age on hearing loss as stated by
Dobie (29) as 58.8% of the workers above 40 years developed hearing loss. This relationship is
similar to the study done by Rachiotis et al. (58) who found that workers over 40 years of age
had 5.3 odds of developing NIHL compared to their younger counterparts. Guerra et al. (47) also
found that subjects between the ages 30 and 39 years had 1.3 odds, those between the ages of 40
and 49 years had 6.0 odds and workers over 50 years of age had 21.3 odds of developing NIHL.
Gitau et al. (5) noted that 39.6% workers above 35 years of age had a threshold shift towards
hearing loss, whereas Anino et al. (41) reported a 13.7 times relative risk of developing NIHL
who were aged between 20 to 29 years. In this study, all 7 individuals above 50 years of age
were present in the safer administration zone throughout this study.

46
Workers with an upper level of education were perhaps protected from excessive noise levels as
a result of deployment to administration unit seen in our study.
NIOSH (36) recommends a de-rating of 50-70% for earplugs and 25% for earmuffs. There was
no significant difference in mean hearing threshold level between those who used HPDs and
those who were not (p = 0.088) .This can be attributed to the workers noncompliance due to
ignorance and incorrect use.
There are various reasons why workers exposed to loud sound refuse to wear protective devices.
In our study, the 24.6% who used HPDs, 14.0% were worried they would not hear danger signals,
0.5% reported no education on how to utilize these devices and 1.8% felt hot while wearing the
devices. Some administration workers, who were supervisors, periodically visited the production
units to monitor the staff.In spite of a basic knowledge of HPDs, both Masaka(39) and Minja et
al (52) still showed hearing loss among workers similar to the finding in our study.
A total of 19(16.7%) of all workers developed tinnitus which was lower compared to studies
done by Barrs et al (58%) and Mrena et al( 67.7%) (59, 60).These higher values can be attributed
to a longer period of exposure of 21.8 years and 24.8 respectively.

47
24. CONCLUSION
It is noted that exposure to loud noise is an occupational hazard in steel mills causing NIHL
among workers. The duration and intensity of noise exposure were the major risk factors in
developing ONIHL and preventive strategies such as HPDs were available but only a few
workers used them optimally. Poor compliance of HPDS can lead to higher prevalence of NIHL
in the future.
The actual NIHL level could be higher than observed in this study due to the ―healthy worker
effect‖. Workers who may have been suffering from severe hearing loss might have actually left
the factory, leaving healthier workers behind, therefore producing an underestimation of the
magnitude of the problem.
The findings of this study qualify for implementation of an effective hearing conservation and
rehabilitation policy that will protect and improve the quality of life of these factory workers.
25. RECOMMENDATIONS
Provision of a pre-employment audiogram along with subsequent annual hearing assessments
are highly recommended as per the Factories and Other Places of Work law (34).This will
assist in recognizing and monitoring the worsening trend of ONIHL as well as enable
compensation.
Create more awareness of both the disease and prevention through government policies
Encourage hearing conservation activities -persistent education and training is essential in
high noise exposure sites of more than 85 dB (A) such as our production unit.
Machines should be regularly maintained, inspected, and calibrated to noise emission
prevention and control. The mill supervisors are encouraged to regularly purchase newer,
quieter equipment.
More periodic shift rotations and regular breaks among the different production units.
Regular and correct use of HPDs is encouraged. Poor use of HPDs calls for a detailed KAP
study in the future.
A future study on effect of age on hearing loss in a factory setting

48
26. LIMITATIONS
Previous employment history did not define the exact noise levels and duration of hours
exposed during their work.
Some supervisors were noted to shift from their units towards the production units as they
monitor their staff. The noise levels and duration of exposure may not be exact.

49
REFERENCES
1. Rabinowitz Peter M, Rees Thomas S: Occupational hearing loss. In Text book of Clinical
Occupational and Environmental Medicine Volume 20.2. 2nd edition. Edited by: Rosen stock
Linda. ELSEVIER Inc. China; 2005:426.
2. Ballenger, JJ, Snow J.B. Ballenger‘s Otorhinolaryngology Head and Neck Surgery. In Alberti
P, editor. Occupational Hearing Loss. B C Decker Inc.2003 16th
ed:pp.357-370.
3. Nelson DI, Nelson RY, Concha-Barrientos M, Fingeruhut M. the global burden of
occupational noise induced hearing loss. Am J Ind Med. 2005; 48:446–58.
4. Report on the WHO Workshop on Prevention of Deafness and Hearing Impairment in Africa,
Nairobi, Kenya. 1995; 10: 24-27.
5. Gitau M. J, Mwikali M.J, Battk. W and Njau Zachary .Noise induced hearing loss among
textile industry workers in Eldoret, Kenya. Faculty of Health Sciences, Moi. University. 1998
July.pp1-17.
6. RBA/OED Jua Kali Hearing Conservation Programme at Kamkunji Nairobi. RBA
News.2009 June ;8(4):1-6.
7. Nelson DI, Schwela D. Foreword. In: Goelzer B, Hanson CH, Sehrndt GA eds. Occupational
exposure to noise evaluation, prevention and control. Atlantic: Federal Institute for
Occupational Safety and Health; 2001: 19-20.
8. Le Prell, C.G. Henderson, D. Fay, R.R. Popper.Noise-Induced Hearing Loss Scientific
Advances, Springer Handbook of Auditory Research, 2012,Vol. 40 pp 3-4.
9. Barr T. Transactions of the Philosophical Society of Glasgow 1886; 17:223–39.Ballenger,
J.J. Editor. Diseases of the nose, throat, ear, head, and neck, 13th Ed.
10. Habermann J. Uber die Schwerhortighkelt des Kesselschmiede. Arch Ohrenhelik 1890; 30:1–
25Wilson D, Xibin S, Read P, Walsh P, Esterman A. Hearing loss - an underestimated public
health problem. Aust J Public Health 1992 Sept; 16(3):282-6.
11. Fowler EP. Limited lesions of the basilar membrane. Arch Otolaryngol 1928; 8:151.
12. Bunch CC. Traumatic deafness. In: Fowler EP, editor. Nelson‘s loose leaf medicine of the
ear. New York: Thomas Nelson; 1939: 349–67.

50
13. Egwin Warnier, Leena Yliniemi and Pasi Joensuu.University of Oulu, Control Engineering
Laboratory. University of Oulu. Control Engineering Laboratory. Report A No 22,
September 2003.
14. Prevention of Noise-Induced Hearing Loss report of an informal consultation held at the
World Health Organization, Geneva on 28-30 October 1997Alberti PW. Occupational
Hearing Loss. In: Ballenger JJ, ed. Diseases of the Nose, Throat, Ear, Head and Neck:
Occupational Hearing Loss. Philadelphia: Lea and Febiger, 1991: 1053.
15. International Organization for Standardization. Acoustics —Threshold of Hearing by Air
Conduction as a Function of Age and Sex for OtologicaUy Normal Persons. Geneva,
Switzerland: International Organization for Standardization. ISO 1984:7029.
16. IEEE Standard 100 Dictionary of IEEE Standards terms.7th edition. The institute of
Electrical and Electronics Engineering; 2000.Decibel; p.288.
17. Chai DL, Lu JQ, Zeng L, Su YG, Lei Z, Zhao YM. Measurement of personal noise exposure
in a cold rolling mill. ChinaJ Prev Med (chin).2006; 40: 93-96.
18. Ahmad, M.; Bohne, B.A.; Harding, G.W. An in vivo tracer study of noise-induced damage to
the reticular lamina. Hearing Research, Volume 175, Number unknown, January 2003, pp.
82-100(19)
19. Salvi R. The physiology of noise induced hearing loss. In: Chasin M (ed.). The Consumer
Handbook on Hearing Loss and Noise. Arizona: Auricle Ink Publishers; 2009.
20. Shaddock LC, Wright CG, Hamernik RP: A morphometric study of microvascular pathology
following experimental rupture of Reissner‘s membrane. Hear Res.1985; 20:119-129.
21. Fausti SA, Erickson DA, Frey RH, Rappaport BZ, Schechter MA. The effects of noise upon
human hearing sensitivity from 8000 to 20 000 Hz. J Acoust Soc Am. 1981; 69(5):1343-47.
22. Puel, J-L. et al, ―Protective effect of glutamate antagonist kynurenate on noise-induced
hearing loss‖, in ―Advances in Noise Research: Biological Effects of Noise‖, Prasher,
D. and Luxon, L., Eds., Whurr London: 1998;26.
23. Handrock M, Zeisberg J. The influence of the efferent system on adaptation, temporary and
permanent threshold shift. European Archives of Otorhinolaryngology; 243(2):191-195.
24. Glorig A, Summerfieald A, Ward W.D. Observations On Temporary Auditory Threshold
Shift Resulting From Noise-Exposure. Acta Oto-Laryngologica Jan 1959, Vol. 50, No. 1-2,
Pages 76-77: 76-77.

51
25. Mills JH. Effects of noise on auditory sensitivity, psychophysical tuning curves and
suppression. In:Hamernik RP, Henderson D, Salvi R, editors. New perspectives on noise-
induced hearing loss. New York: Raven Press; 1982. p. 249–63.
26. Moussavi-Najarkola, S. A.; Khavanin, A.;Mirzaei, R.; Salehnia, M.; Muhammadnejad, A.and
Akbari, M.. "Temporary and Permanent Level Shifts in Distortion Product Otoacoustic
Emissions following Noise Exposure in an Animal Model", International Journal
ofOccupational & Environmental Medicine, 2012.
27. Schmuzigert N, Fostiropoulos K, Probst R. Long-term assessment of auditory changes
resulting from a single noise exposure associated with non-occupational activities. Int J
Audiol 2006; 45: 46–54.
28. Boettcher FA, Henderson D, Gratton MA, Danielson RW, Byrne CD. Synergistic interactions
of noise and other ototraumatic agents. Ear Hear. 1987 Aug; 8(4):192-212.
29. Dobie RA. The relative contributions of occupational noise and aging in individual loss of
hearing. Ear Hear 1992; 13:19–27.
30. Stelmachowicz PG,Beauchine KA,Kalberer A,Jesteadt W,Normative thresholds in the 8-
20Khz range as a function of age. J Acoust Soc Am 1989; 86:1384-91.
31. Phoon WH, Lee HS, Chia SE. Tinnitus in noise-exposed workers. Occup Med (Lond) 1993;
43(1):35–8.
32. Dobie RA.A method for allocation of hearing handicap. Otolaryngol Head and Neck
Surg.1990 Nov; 103(5):733-9.
33. McBride DI, Williams S. Audiometric notch as a sign of noise induced hearing loss. Occup
Environ Med. 2001; 58: 46-51.
34. Attias J, Horovitz G,El-Hatib N,Nageris B. Detection and clinical diagnosis of noise-induced
hearing loss by otoacoustic emissions.Noise and Health 2001;3(12):19-31.
35. Occupational Safety and Health Administration (OSHA).United States Department of
Labor.[Internet] .Available from http://www.osha.gov.
36. National Institute for Occupational Safety and Health (NIOSH) (1996) National Occupational
Research Agenda. US Department of Health and Human Services, Public Health Service,
Centre for Disease Control and Prevention, Washington, DC.

52
37. Energy Regulatory Commission. The Factories and Other Places of Work (Noise Prevention
and Control) Rules, (Legal Notice No.24).[Internet] 2005.[cited 10th March 2005].Available
from http://www.erc.go.ke/erc/regulatory_instruments/?ContentID=19.
38. Centres for Disease Control and Prevention. Noise and Hearing Loss Prevention.[Internet]
2009 [cited 2009
June30].Availablefrom:http://www.cdc.gov/niosh/topics/noise/abouthlp/nihlattitude.html
39. Masaka Edmore.The prevelance of noise induced hearing loss at a nickel mine in Zimbabwe.
Faculty of Health Sciences, University of the Witwatersrand.2009 Jan:p 1-85.
40. Wambugu AW. Case of noise induced deafness in industry, Kenya. African newsletter on
occupational health. 1992; 2:1.
41. Anino J.O, Afullo A, Occupational Noise Induced Hearing Loss Among Workers at Jomo
Kenyatta International Airport, Nairobi: East African Medical Journal 2010 Feb; 87:49-57.
42. Harmadji S, Kabullah H. Noise Induced Hearing Loss in steel factory workers. Folia Medica
Indonesiana 2004; 40:171.
43. Chang SJ, Chang CK. Prevalence and risk factors of noise-induced hearing loss among
liquefied petroleum gas cylinder infusion workers in Taiwan. Industrial Health 2009 Dec;
47(6):603-10.
44. Ahmed H.O, Dennis J.H, Badran O, Ismail M,Ballal S.G, Ashoor A,Jerwood D.
Occupational Noise Exposure and Hearing Loss of Workers in Two Plants in Eastern Saudi
Arabia. Ann. occup. Hyg 2001; 45(5):371-380.
45. Shakhatreh F.M, Khader J, Abdul-Baqi, Moh‘d M. Turk. Hearing loss in a textile factory
Saudi Medical Journal 2000; 21 (1):58-60.59.Narlawar U.W,Surjuse B.G,Thakre
S.S.Hypertension and Hearing Impairement in Workers of Iron and Steel Industry.Indian J
Physiol Pharmacol 2006;50(1):60-66.
46. Narlawar U.W,Bhooshan G,Surjuse,Thakre S.Hypertension and hearing impairement in
workers of iron and steel industry.Indian J Physiol Pharmacol 2006;50(1):60-66.
47. Guerra M.R, Lourenço P.M.C, Teixeira M.T.B, Alves M.J.M. Prevalence of noise-induced
hearingloss in metallurgical company. Revista de Saúde Pública 2005; 39(2).
48. Ologe F.E, Akande T.M,Olajide T.G. Occupational noise exposure and sensorineural hearing
loss among workers of a steel rolling mill. Eur Arch Otorhinolaryngol 2006; 263: 618–621.

53
49. Boger ME, Barbosa-Branco A, Ottoni AC. The noise spectrum influence on Noise-Induced
Hearing Loss prevalence in workers. Braz J Otorhinolaryngol 2009; 75(3):328-34.
50. Simon PV. Iron and steel health and safety problems and patterns. International Labour
Office 1992; 3: 73.
51. K H Kilburn, R H Warshaw, B Hanscom Are hearing loss and balance dysfunction linked in
construction iron workers? Ind Med 1992; 49:138-141.
52. Minja B.M, Moshi N.H, RIWA P. Noise induced hearing loss among industrial workers in
Dar es salaam. East African Medical Journal 2003; 80(6):238-42.
53. Jaykaran Charan,Tamoghna Biswas. How to Calculate Sample Size for Different Study
Designs in Medical Research?Indian J Psychol Med. 2013 Apr-Jun; 35(2): 121–126.
54. Maisarah, S. and H. Said, The Noise Exposed Factory Workers: The Prevalence of Sensori-
Neural Hearing Loss and Their Use of Personal Hearing Protection Devices Med J Malaysia
1993 48(3): 280-285.
55. Fadzli MN. Knowledge, Attitude and Practice, and Effect of Occupational Noise Exposure
on Hearing Among Sawmill Workers in Kota Bharu, Kelantan in Department of Community
Medicine 2005, USM.
56. Barry, SL, David, HW. Noise and hearing impairment. Occupational health USA 2000; 1(3):
321-338.
57. Olero UG. Ijaduola GTA. Sowho E. Hearing Threshold in an Auto Assembley
Plant:perspects for Hearing Conservation in a Nigerian Factory. Int.Arch. Environ. Health, 1990.
62:199-202.
58. Rachiotis, G., C. Alexopoulos, and S. Drivas, Occupational Exposure to Noise, and Hearing
Function among Electro Production Workers Auris Nasus Larynx International Journal of ORL
and HNS, 2006. 33: 381-385
59. Barrs, D.M. et al., valuation including evoked potential audiometry. Otolaryngology Head
and Neck Surgery, 1994. 110(2): p. 177-184.
60. Mrena, R., et al., Occupational noise-induced hearing loss reports and tinnitus in Finland.
Acta Oto-Laryngologica, 2007. 127(7): p. 729-735.

54
APPENDIX 1: GENERAL PATIENT INFORMATION AND CONSENT FORM
A greeting, my name is Dr. Mandeep Chauhan, I would like to seek your consent to participate in
a study aimed at undertaking the nature of your work on your hearing. I would like to know the
effect of noise on your hearing.
I will ask questions on complains you have. I will examine the ear. I will do hearing tests on you.
Syringing will be done if necessary
What I propose to do is part of what is done in the course of usual examinations and
investigations. No investigation will be administered to you other than that which is required to
reach the diagnosis. All information will be kept confidential. The study does not reveal
individual identity
You are free to drop out of the study at any time you wish so.
The information we get may not be of immediate benefit to you but it will help us in the long run
in understanding the relation.
Like all scientific information we will share our findings with the other people undertaking
similar studies. Therefore we will publish our findings in scientific journals or present them in
scientific meetings.
Consent Form
Study number…………………
I hereby consent to participate in the study to determine hearing loss at our steel rolling mill.
__________________________
Name of Patient
______________
Date
__________________________
Signature
__________________________
Name of Researcher
______________
Date
__________________________
Signature

55
FOMU YA MAELEZO KWA MGONJWA NA MAKUBALIANO YA KUSHIRIKI
KATIKA UTAFITI.
Maelezo kwa mgonjwa
Jambo,mimi ni Dr. Mandeep Chauhan naomba ruhusa yako kushiriki katika utafiti
unaochunguza matatizo yanayojitokezea katika sehemu ya sikoi kutokana na kelele.
Tutakuuliza masuali kuhusu matatizo yako.Tutakupima.Tutafanya uchunguzi ya kusikia kwako .
Utafiti huu hautakuathiri kwa hali yoyote;Vipimo utakavyofanyiwa ni vile vile kama
atakavyofanyiwa mgonjwa yeyote mwenya shida kama yako.
Hautafanyiwa vipimo zaidi ya vile vinavyohitajika katika kujua matatizo yako.Matokeo yote
yatakuwa ni siri.Utafiti huu hautatooa kielelezo cha mgonjwa. Kama hukuridhishwa na sehemu
au utafiti wote huu, uko na hiari ya kukataa.
Matokeo ya utafiti huu inawezekana usikusaidie wewe binafsi lakini yatatumika katika kusaidia
wagonjwa wengine.Matokeo ya utafiti huu yatatumika kutoa taarifa kwa madaktari wanaofanya
utafiti kama huu,hivyo huenda yatachapishwa katika majarida ya kisayansi.Matokeo haya
hayatatumiwa kukuathari.Siri zako hazitafichuliwa.
Kama umeridhika na maelezo yetu juu ya utafiti huu,tafadhali weka sahihi/kibali chako hapo cini
kwenye fomu;
Utafiti namabari…………………………
Nimekubali kushiriki katika utafiti unaochunguza matatizo yanayojitokezea katika sehemu ya
sikio kutokana na kelele kwa kampuni ua kutengeneza chuma.
__________________________
Jina la Mgonjwa
______________
Tarehe
__________________________
Sahihi
__________________________
Jina la Mgonjwa
______________
Tarehe
__________________________
Sahihi

56
APPENDIX 2: QUESTIONNAIRE
No……………………………….. Date………………………………
Time………………………………….
SECTION A
PERSONAL DETAILS
Initials…………Age………Sex: M………F……… Education…………………………..
SECTION B
OTOLOGICAL HISTORY
1. Have you ever had an audiogram done? Yes No
If yes, when was it done? ……………………………
2. Do you experience any ear problems? Yes No
If yes, is it
a) Pain If Yes, RE LE Both
b) Difficulty hearing spoken communication in one-to-one conversation?
c) Difficulty understanding spoken communication in the presence of surrounding noise.
d) Ringing in ears… Yes No
e) Other…………………………………………………………………………
3. Have you been treated for any ear infection recently? Yes No
If yes, with pus No pus Duration
4. Have you ever had surgery on your ears? Yes No
If Yes, which surgery…………………………

57
SECTION C
PREVIOUS NOISE EXPOSURE HISTORY
5. Besides this current job, have you ever worked in any environment with excessive noise level
Yes No
If Yes, duration…………………………
SECTION D
WORK ENVIRONMENT
6. Task…………………………………… Work Site………………Noise Level …………….
7. Length of service in this task (years) Number of working hours per day
Number of working days per week
8. How would you describe the type of noise that you are exposed to in your work environment?
a) Continuous (nonstop)
b) Intermittent (irregular or broken)
c) Impact (banging)
9. How would you describe the noise levels at your work site?
Negligible Low High Very High
10. Do you take any breaks in between working hours? Yes No
If Yes, for how long?
11. Do you do any other task with excessive noise after work? Yes No
If Yes, specify……………………………

58
SECTION E
USE OF HEARING PROTECTIVE EQUIPMENT
12. Do you use any protective equipment for ears? Yes No
If yes, duration………….
State equipment.
Premolded earplugs Formable earplugs Earmuffs

59
APPENDIX 3: EAR EXAMINATION
Otoscopy Normal Wax Other
Wax removal Yes No Other
Right Ear Rhinnes +ve Rhinnes –ve
Left Ear` Rhinnes +ve Rhinnes –ve Weber
AUDIOGRAM
No……………………………….. Date………………………………
COMMENTS: