No-till technology: benefits to farmers and the environment? Theoretical analysis and application to...
29
No-till technology: benefits to farmers and the environment? Theoretical analysis and application to Finnish agriculture Jussi Lankoski Agrifood Research Finland, Helsinki, Finland (and OECD, Paris, France; years 2005 – 2006) Markku Ollikainen University of Helsinki, Helsinki, Finland Pekka Uusitalo Agrifood Research Finland, Helsinki, Finland Received March 2004; final version received February 2006 Summary We assess theoretically and empirically the private profitability and social desirability of conventional tillage and no-till when crop yields, production costs and nutrient and herbicide runoff damages are taken into account. Based on Finnish experimental data, no-till provides higher social and private profit than conventional tillage for barley but not for oats and wheat, for which the production cost advantage of no-till does not compensate for lower yields in the private optimum. As regards social returns, no- till provides slightly better overall environmental performance but, given the existing valuation of nutrient and herbicide runoff damage, this is not enough to give no-till an advantage in oats and wheat cultivation. Thus, the key factors determining the private and social profitability of no-till and conventional tillage are yields and production costs rather than environmental performance. Keywords: agri-environmental policy, buffer strips, herbicide runoff, nutrient runoff, tillage JEL classification: Q16, Q18 1. Introduction Conservation tillage refers to cultivation practices that decrease disruption of the soil’s structure, composition and natural biodiversity, thereby decreasing erosion and degradation and also contamination (Anonymous, 2001). Among conservation tillage methods, no-till refers to a tillage system, such as direct dril- ling, that leaves the soil undisturbed from harvest to planting, as the only soil # Oxford University Press and Foundation for the European Review of Agricultural Economics 2006; all rights reserved. For permissions, please email [email protected] European Review of Agricultural Economics Vol 33 (2) (2006) pp. 193–221 doi:10.1093/erae/jbl003 by guest on February 9, 2016 http://erae.oxfordjournals.org/ Downloaded from
-
Upload
independent -
Category
Documents
-
view
1 -
download
0
Transcript of No-till technology: benefits to farmers and the environment? Theoretical analysis and application to...

No-till technology: benefits to farmers andthe environment? Theoretical analysis andapplication to Finnish agriculture
Jussi Lankoski
Agrifood Research Finland, Helsinki, Finland (and OECD, Paris, France;
years 2005–2006)
Markku Ollikainen
University of Helsinki, Helsinki, Finland
Pekka Uusitalo
Agrifood Research Finland, Helsinki, Finland
Received March 2004; final version received February 2006
Summary
We assess theoretically and empirically the private profitability and social desirabilityof conventional tillage and no-till when crop yields, production costs and nutrient andherbicide runoff damages are taken into account. Based on Finnish experimental data,no-till provides higher social and private profit than conventional tillage for barley butnot for oats and wheat, for which the production cost advantage of no-till does notcompensate for lower yields in the private optimum. As regards social returns, no-till provides slightly better overall environmental performance but, given the existingvaluation of nutrient and herbicide runoff damage, this is not enough to give no-till anadvantage in oats and wheat cultivation. Thus, the key factors determining the privateand social profitability of no-till and conventional tillage are yields and productioncosts rather than environmental performance.
Keywords: agri-environmental policy, buffer strips, herbicide runoff, nutrient runoff,tillage
JEL classification: Q16, Q18
1. Introduction
Conservation tillage refers to cultivation practices that decrease disruption of thesoil’s structure, composition and natural biodiversity, thereby decreasingerosion and degradation and also contamination (Anonymous, 2001). Amongconservation tillage methods, no-till refers to a tillage system, such as direct dril-ling, that leaves the soil undisturbed from harvest to planting, as the only soil
# Oxford University Press and Foundation for the European Review of Agricultural Economics 2006; all rightsreserved. For permissions, please email [email protected]
European Review of Agricultural Economics Vol 33 (2) (2006) pp. 193–221doi:10.1093/erae/jbl003
by guest on February 9, 2016http://erae.oxfordjournals.org/
Dow
nloaded from
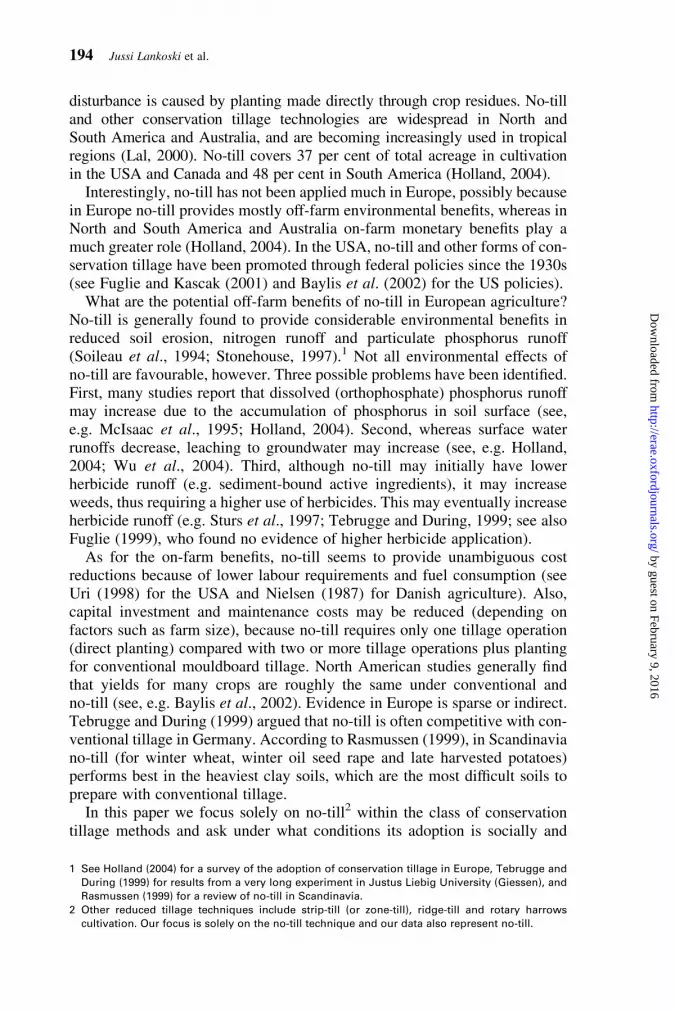
disturbance is caused by planting made directly through crop residues. No-tilland other conservation tillage technologies are widespread in North andSouth America and Australia, and are becoming increasingly used in tropicalregions (Lal, 2000). No-till covers 37 per cent of total acreage in cultivationin the USA and Canada and 48 per cent in South America (Holland, 2004).Interestingly, no-till has not been applied much in Europe, possibly because
in Europe no-till provides mostly off-farm environmental benefits, whereas inNorth and South America and Australia on-farm monetary benefits play amuch greater role (Holland, 2004). In the USA, no-till and other forms of con-servation tillage have been promoted through federal policies since the 1930s(see Fuglie and Kascak (2001) and Baylis et al. (2002) for the US policies).What are the potential off-farm benefits of no-till in European agriculture?
No-till is generally found to provide considerable environmental benefits inreduced soil erosion, nitrogen runoff and particulate phosphorus runoff(Soileau et al., 1994; Stonehouse, 1997).1 Not all environmental effects ofno-till are favourable, however. Three possible problems have been identified.First, many studies report that dissolved (orthophosphate) phosphorus runoffmay increase due to the accumulation of phosphorus in soil surface (see,e.g. McIsaac et al., 1995; Holland, 2004). Second, whereas surface waterrunoffs decrease, leaching to groundwater may increase (see, e.g. Holland,2004; Wu et al., 2004). Third, although no-till may initially have lowerherbicide runoff (e.g. sediment-bound active ingredients), it may increaseweeds, thus requiring a higher use of herbicides. This may eventually increaseherbicide runoff (e.g. Sturs et al., 1997; Tebrugge and During, 1999; see alsoFuglie (1999), who found no evidence of higher herbicide application).As for the on-farm benefits, no-till seems to provide unambiguous cost
reductions because of lower labour requirements and fuel consumption (seeUri (1998) for the USA and Nielsen (1987) for Danish agriculture). Also,capital investment and maintenance costs may be reduced (depending onfactors such as farm size), because no-till requires only one tillage operation(direct planting) compared with two or more tillage operations plus plantingfor conventional mouldboard tillage. North American studies generally findthat yields for many crops are roughly the same under conventional andno-till (see, e.g. Baylis et al., 2002). Evidence in Europe is sparse or indirect.Tebrugge and During (1999) argued that no-till is often competitive with con-ventional tillage in Germany. According to Rasmussen (1999), in Scandinaviano-till (for winter wheat, winter oil seed rape and late harvested potatoes)performs best in the heaviest clay soils, which are the most difficult soils toprepare with conventional tillage.In this paper we focus solely on no-till2 within the class of conservation
tillage methods and ask under what conditions its adoption is socially and
1 See Holland (2004) for a survey of the adoption of conservation tillage in Europe, Tebrugge and
During (1999) for results from a very long experiment in Justus Liebig University (Giessen), and
Rasmussen (1999) for a review of no-till in Scandinavia.
2 Other reduced tillage techniques include strip-till (or zone-till), ridge-till and rotary harrows
cultivation. Our focus is solely on the no-till technique and our data also represent no-till.
194 Jussi Lankoski et al.
by guest on February 9, 2016http://erae.oxfordjournals.org/
Dow
nloaded from

privately optimal when yields, production costs and runoff damages intosurface water are explicitly taken into account.3 We extend the conventionalcrop production model to cover basic features of no-till technology. Fromthis theoretical framework, we develop a parametric model and calibrate itto Finnish agriculture. This model exhibits the same features of mixedeffects on nutrient runoff, increased use of herbicides, and lower productioncosts as reported above.4 It allows us to quantify and assess more closelythe mixed effects of no-till on runoff and to estimate the range where no-tillcan provide the same returns as conventional tillage.Our paper relates to the existing literature as follows. Many US studies
focus on farmers’ incentives to adopt no-till or other conservation tillagemethods subject to prevailing policies (Rahm and Hufman, 1984; Klemme,1985; Soule et al., 2000; Kurkalova et al., 2001, 2003; Zhao et al., 2003).These studies typically take the environmental benefits for granted withoutanalysing them explicitly. Closest to our approach are Aase and Schafer(1996), Wu and Babcock (1998) and Wu et al. (2004), which, however, arebased on US institutional, environmental and economic conditions. Moreover,they do not explicitly analyse the potential trade-offs in terms of dissolvedphosphorus and herbicide runoff. Unfortunately, there are no integrated eco-nomic studies in Europe focusing systematically on the economic and environ-mental conditions of adoption of no-till technology. A notable exception isFykse et al. (2004), which focuses on the trade-off between soil erosion andweed control under alternative tillage methods, including no-till.The rest of the paper is organised as follows. Section 2 describes the frame-
work for analysing no-till and conventional technologies, and analyses thesocially optimal choice between them. Section 3 develops a parametricmodel and calibrates it to Finnish agricultural and environmental conditions.Section 4 provides our empirical results. Concluding, Section 5 ends the paper.
2. Social choice between conventional and no-tilltechnology
Before examining the socially optimal conditions for the adoption of no-tilltechnology, we first describe the properties of both technologies in terms ofproduction and the nutrient and herbicide runoff resulting from input use. Wethen conduct the analysis for homogeneous cultivated land of (any) quality q.
2.1. No-till and conventional technology
We consider a parcel of cultivated land, of homogeneous quality. Becauseit is cultivated differently under conventional and no-till technology, both
3 Besides benefits in water quality, no-till reduces CO2 emissions from agriculture (see Lal et al.,
1999; Smith, 2003) but we omit this aspect from our analysis because of lack of data.
4 This is in line with observations that no-till does not suit all types of land, and also with the fact
that farmers are not necessarily able or willing to adopt no-till on all their land, and thus apply
both no-till and conventional tillage (see, e.g. CTIC, 2002).
No-till technology: benefits to farmers and the environment? 195
by guest on February 9, 2016http://erae.oxfordjournals.org/
Dow
nloaded from

production process and environmental effects will differ between thetechnologies.
2.1.1. Production
The conventional technology includes mouldboard ploughing and seedbedtillage before drilling, whereas in no-till technology the direct drilling equip-ment inserts the fertiliser input and the seed directly through residues of theprevious crop. Reflecting the difference in technologies, the pattern of cropgrowth will differ as well. Conventional technology gives higher growth atthe beginning of the growing season, but no-till technology catches up dueto faster growth later in the season. In the absence of weeds, the productionof crop under technology i in a parcel of quality q in a general form is
yi ¼ f iðli; qÞ; i ¼ 1; 2 ð1Þ
where f i indicates yields under both technologies and li is fertiliser input withfl
i . 0, flli , 0.5 In what follows, the subscript 1 refers to the conventional tech-
nology and subscript 2 to no-till technology.6
Weeds cause damage by decreasing yields but this damage can be reducedby herbicides. Let weed population size be Hi and herbicide application xi.According to Lichtenberg and Zilberman (1986), the damage-abatementfunction of weeds depends on the weed population and its control:Fi(Hi, xi), defined on the interval [0, 1] with Fx
i . 0 and Fxxi , 0. In the pre-
sence of weeds, the actual yield, y, can be expressed as a product of maximumyield and damage-abatement function,
yi ¼ f iðli; qÞFiðHi; xiÞ: ð2Þ
In (2), the amount of weeds, Hi, is a technology-dependent variable. Wespecifically assume that H1 � H2, i.e. that no-till entails weeds at least asmuch as, or more than conventional technology.7 This assumption impliesthat, ceteris paribus, Fx
2�Fx
1, i.e. the marginal productivity of herbicideuse is higher under no-till technology.
2.1.2. Profit from production
Let p denote the crop price, c the price of fertiliser and a the price of herbicide.Labour costs, wh, and fuel costs, wff, can be directly linked to the working
5 To avoid unnecessary notation, we drop the subscript i from the derivatives of production and
runoff and weed damage functions in what follows.
6 It is sometimes argued that no-till may adversely affect the quality of crops produced. For
instance, Finnish studies suggest that no-till may slightly increase the moisture content at harvest
(one percentage difference from other tillage methods), but successful weed control (e.g. Elymus
repens) will mitigate this effect.
7 Both technologies apply post-emergence weed control during the growing season. In addition,
no-till requires the use of pre-emergence control for Elymus repens and other perennial weeds.
Usually Glyphosate is applied at the beginning of the growing season about 1 week before direct
drilling.
196 Jussi Lankoski et al.
by guest on February 9, 2016http://erae.oxfordjournals.org/
Dow
nloaded from
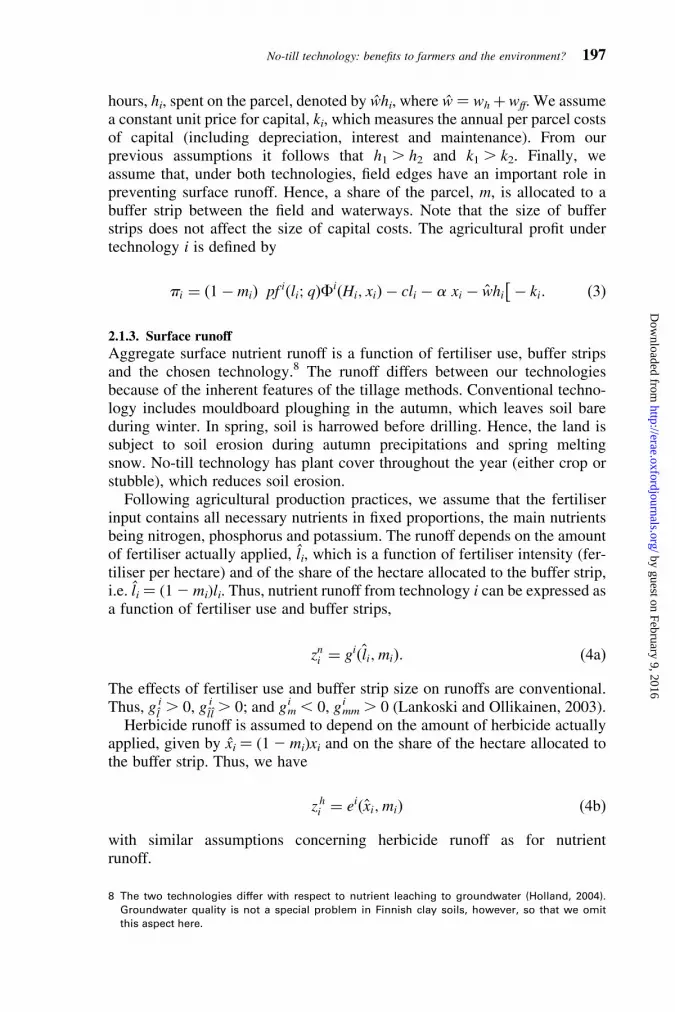
hours, hi, spent on the parcel, denoted by whi, where w ¼ wh þ wff. We assumea constant unit price for capital, ki, which measures the annual per parcel costsof capital (including depreciation, interest and maintenance). From ourprevious assumptions it follows that h1 . h2 and k1 . k2. Finally, weassume that, under both technologies, field edges have an important role inpreventing surface runoff. Hence, a share of the parcel, m, is allocated to abuffer strip between the field and waterways. Note that the size of bufferstrips does not affect the size of capital costs. The agricultural profit undertechnology i is defined by
pi ¼ ð1� miÞ pf iðli; qÞFiðHi; xiÞ � cli � a xi � whi
� �� ki: ð3Þ
2.1.3. Surface runoff
Aggregate surface nutrient runoff is a function of fertiliser use, buffer stripsand the chosen technology.8 The runoff differs between our technologiesbecause of the inherent features of the tillage methods. Conventional techno-logy includes mouldboard ploughing in the autumn, which leaves soil bareduring winter. In spring, soil is harrowed before drilling. Hence, the land issubject to soil erosion during autumn precipitations and spring meltingsnow. No-till technology has plant cover throughout the year (either crop orstubble), which reduces soil erosion.Following agricultural production practices, we assume that the fertiliser
input contains all necessary nutrients in fixed proportions, the main nutrientsbeing nitrogen, phosphorus and potassium. The runoff depends on the amountof fertiliser actually applied, li, which is a function of fertiliser intensity (fer-tiliser per hectare) and of the share of the hectare allocated to the buffer strip,i.e. li ¼ (12 mi)li. Thus, nutrient runoff from technology i can be expressed asa function of fertiliser use and buffer strips,
zni ¼ giðli;miÞ: ð4aÞ
The effects of fertiliser use and buffer strip size on runoffs are conventional.Thus, g
l
i . 0, gll
i . 0; and gim , 0, gi
mm . 0 (Lankoski and Ollikainen, 2003).Herbicide runoff is assumed to depend on the amount of herbicide actually
applied, given by xi ¼ (12 mi)xi and on the share of the hectare allocated tothe buffer strip. Thus, we have
z hi ¼ eiðxi;miÞ ð4bÞ
with similar assumptions concerning herbicide runoff as for nutrientrunoff.
8 The two technologies differ with respect to nutrient leaching to groundwater (Holland, 2004).
Groundwater quality is not a special problem in Finnish clay soils, however, so that we omit
this aspect here.
No-till technology: benefits to farmers and the environment? 197
by guest on February 9, 2016http://erae.oxfordjournals.org/
Dow
nloaded from
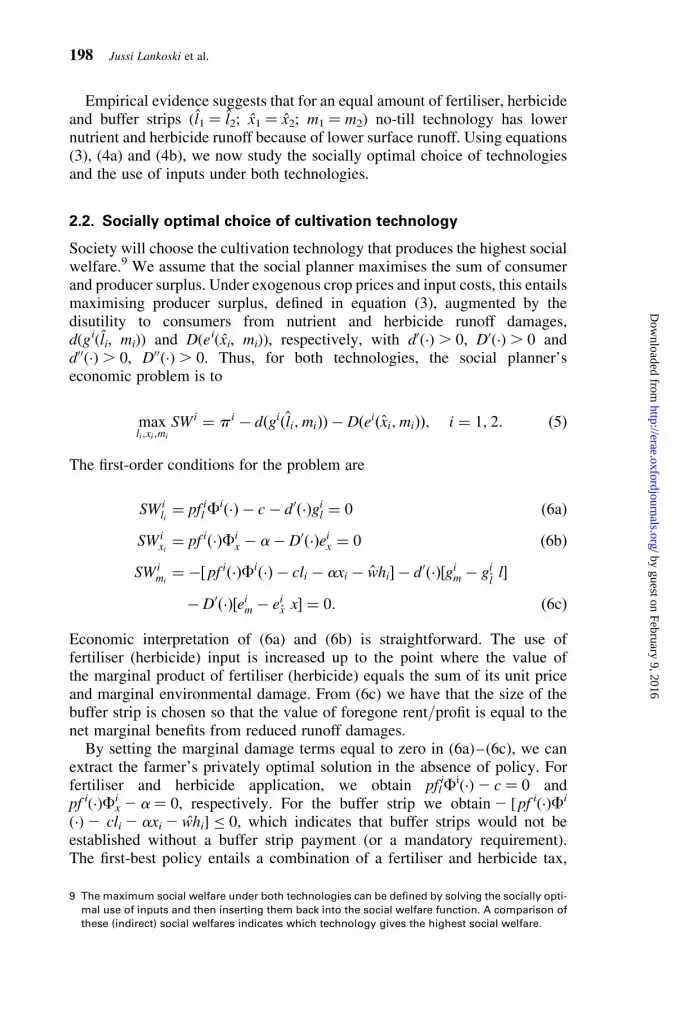
Empirical evidence suggests that for an equal amount of fertiliser, herbicideand buffer strips (l1 ¼ l2; x1 ¼ x2; m1 ¼ m2) no-till technology has lowernutrient and herbicide runoff because of lower surface runoff. Using equations(3), (4a) and (4b), we now study the socially optimal choice of technologiesand the use of inputs under both technologies.
2.2. Socially optimal choice of cultivation technology
Society will choose the cultivation technology that produces the highest socialwelfare.9 We assume that the social planner maximises the sum of consumerand producer surplus. Under exogenous crop prices and input costs, this entailsmaximising producer surplus, defined in equation (3), augmented by thedisutility to consumers from nutrient and herbicide runoff damages,d(gi(li, mi)) and D(ei(xi, mi)), respectively, with d0(.) . 0, D0(.). 0 andd00(.). 0, D00(.). 0. Thus, for both technologies, the social planner’seconomic problem is to
maxli;xi;mi
SWi ¼ p i � dðgiðli;miÞÞ � Dðeiðxi;miÞÞ; i ¼ 1; 2: ð5Þ
The first-order conditions for the problem are
SWili¼ pf i
l Fið�Þ � c � d0ð�Þgi
l ¼ 0 ð6aÞ
SWixi¼ pf ið�ÞFi
x � a� D0ð�Þeix ¼ 0 ð6bÞ
SWimi
¼ �½ pf ið�ÞFið�Þ � cli � axi � whi� � d0ð�Þ½gi
m � gi
ll�
� D0ð�Þ½eim � ei
x x� ¼ 0: ð6cÞ
Economic interpretation of (6a) and (6b) is straightforward. The use offertiliser (herbicide) input is increased up to the point where the value ofthe marginal product of fertiliser (herbicide) equals the sum of its unit priceand marginal environmental damage. From (6c) we have that the size of thebuffer strip is chosen so that the value of foregone rent/profit is equal to thenet marginal benefits from reduced runoff damages.By setting the marginal damage terms equal to zero in (6a)–(6c), we can
extract the farmer’s privately optimal solution in the absence of policy. Forfertiliser and herbicide application, we obtain pfl
iFi(.)2 c ¼ 0 andpf i(.)Fx
i 2 a ¼ 0, respectively. For the buffer strip we obtain2 [pf i(.)Fi
(.)2 cli 2 axi 2 whi] � 0, which indicates that buffer strips would not beestablished without a buffer strip payment (or a mandatory requirement).The first-best policy entails a combination of a fertiliser and herbicide tax,
9 The maximum social welfare under both technologies can be defined by solving the socially opti-
mal use of inputs and then inserting them back into the social welfare function. A comparison of
these (indirect) social welfares indicates which technology gives the highest social welfare.
198 Jussi Lankoski et al.
by guest on February 9, 2016http://erae.oxfordjournals.org/
Dow
nloaded from
set at the level of respective marginal damages, and a buffer strip payment, setat the level of marginal benefits from runoff reduction.We ask next how input intensities relate to each other under no-till and
conventional technologies. Let the superscript star (zero) refer to the socially(privately) optimal choice of l, x and m. Then we can provide the answer in thefollowing Lemma.
Lemma. If fl2F2(.) � fl
1F1(.), then (a) at the social optimum it holds alwaysthat l�2 . l�1 and m�
2 , m�1, but x�2 . x�1 holds only over a some range of herbi-
cide runoff; (b) at the private optimum it holds always that l20� l1
0 and x20� x1
0.If fl
2F2(.) , fl1F1(.), then (a) at the social optimum the relationships between
input uses remain ambiguous, (b) at the private optimum l20 , l1
0 and x20� x1
0.
Proof. Follows directly from the first-order conditions.
Inserting the socially optimal values of inputs, l�i, x�i, m�i, into the respective social
welfare functions allows us to compare the social welfare outcomes, yielding
Proposition. If no-till technology has higher yields than conventional technol-ogy then (a) its adoption is socially optimal provided that the herbicide runoffdamages under both technologies are ‘close enough’, (b) its adoption isalways privately optimal. If conventional technology has higher yields thanno till, then the socially and private optimal outcome is indeterminate.
Proof. See Appendix 1.
From the Proposition, if yields under no-till are as high as under conventionaltechnology no-till is privately adopted. In fact, yields can be even lower,because no-till implies cost reductions relative to conventional cultivation.The condition for the social adoption contains the vague requirement of herbi-cide runoffs being ‘close enough’. As we discuss in detail in Section 4, no-tillentails the same post-emergent treatment as conventional technology and inaddition one extra pre-emergence control at the beginning of the growingseason. Given that many herbicides degrade fast, the additional runoffdamage of this early pre-emergent treatment may be rather small.
3. Data and parametric model
In this section we develop a parametric model, based on Finnish data, toexamine social and private profitability of conventional and no-till technology.We focus on wheat, barley and oats production on clay soils, which is thetypical soil type in South and South-Western Finland.
3.1. Costs, production and profit
We define conventional tillage as mouldboard plough tillage and no-till as directdrilling. Mouldboard plough tillage includes primary tillage (ploughing),
No-till technology: benefits to farmers and the environment? 199
by guest on February 9, 2016http://erae.oxfordjournals.org/
Dow
nloaded from
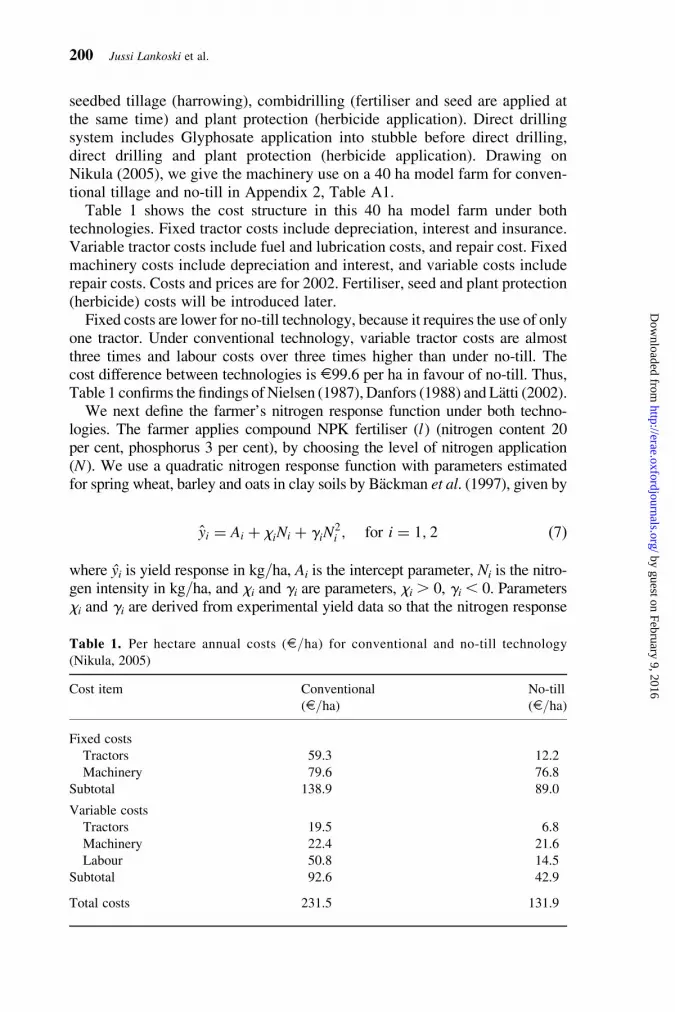
seedbed tillage (harrowing), combidrilling (fertiliser and seed are applied atthe same time) and plant protection (herbicide application). Direct drillingsystem includes Glyphosate application into stubble before direct drilling,direct drilling and plant protection (herbicide application). Drawing onNikula (2005), we give the machinery use on a 40 ha model farm for conven-tional tillage and no-till in Appendix 2, Table A1.Table 1 shows the cost structure in this 40 ha model farm under both
technologies. Fixed tractor costs include depreciation, interest and insurance.Variable tractor costs include fuel and lubrication costs, and repair cost. Fixedmachinery costs include depreciation and interest, and variable costs includerepair costs. Costs and prices are for 2002. Fertiliser, seed and plant protection(herbicide) costs will be introduced later.Fixed costs are lower for no-till technology, because it requires the use of only
one tractor. Under conventional technology, variable tractor costs are almostthree times and labour costs over three times higher than under no-till. Thecost difference between technologies is E99.6 per ha in favour of no-till. Thus,Table 1 confirms the findings of Nielsen (1987), Danfors (1988) and Latti (2002).We next define the farmer’s nitrogen response function under both techno-
logies. The farmer applies compound NPK fertiliser (l) (nitrogen content 20per cent, phosphorus 3 per cent), by choosing the level of nitrogen application(N). We use a quadratic nitrogen response function with parameters estimatedfor spring wheat, barley and oats in clay soils by Backman et al. (1997), given by
yi ¼ Ai þ xiNi þ giN2i ; for i ¼ 1; 2 ð7Þ
where yi is yield response in kg/ha, Ai is the intercept parameter, Ni is the nitro-gen intensity in kg/ha, and xi and gi are parameters, xi . 0, gi , 0. Parametersxi and gi are derived from experimental yield data so that the nitrogen response
Table 1. Per hectare annual costs (E/ha) for conventional and no-till technology
(Nikula, 2005)
Cost item Conventional
(E/ha)No-till
(E/ha)
Fixed costs
Tractors 59.3 12.2
Machinery 79.6 76.8
Subtotal 138.9 89.0
Variable costs
Tractors 19.5 6.8
Machinery 22.4 21.6
Labour 50.8 14.5
Subtotal 92.6 42.9
Total costs 231.5 131.9
200 Jussi Lankoski et al.
by guest on February 9, 2016http://erae.oxfordjournals.org/
Dow
nloaded from

function for both technologies reflects the experimental yields for different cropsreported in Table 2. These yields are from the same experimental trials for bothtechnologies, which were conducted on clay soils (clay content 30–60 per cent)(Alakukku, 2003; Salo, 2003). Table 2 shows the average yields for wheat, barleyand oats in clay soils for conventional and no-till technology.As Table 2 reveals, only in the case of barley are the average yield levels
close to each other. Moreover, in the two other cases, the yield differencebetween the two technologies is large. One possible explanation for this isthat the reported no-till yields involve some yield penalty because of the tran-sitional period of no-till technology. To be more precise, Salo (2003) andAlakukku (2003) note that failures in the timing of direct drilling and in choos-ing the proper drilling depth mainly explain the low yield level of no-till wheatin these field experiments. In one experimental year, the direct drilling ofwheat was done too early in the spring, so that the surface layer of the claysoil was not dry enough to break into aggregates during drilling. Because ofthe resulting lack of proper soil cover for the seed and the weak soil–seedcontact, the sprouting rate of the seed was only 43 per cent. In another experi-mental year, excessively deep direct drilling hampered no-till wheat sproutingand the sprouting rate was only 28 per cent. In the case of no-till oats, failure inthe timing of direct drilling mainly affected yield losses.A transitional period of several years is usually needed for the soil conditions
and structure (e.g. abundance of macropores and earthworms) to change toreflect no-till technology. Thus, Table 2 may give an over-pessimistic view ofno-till yields. Hence, given that the maximum yields for no-till are clearlyabove the average yields, one could expect that the average yields could increaseafter the transitional period. This would also be more in line with Latti (2002),according to whom farmers reported higher yields than our averages.10
Table 2. Yields (kg/ha) for wheat, barley and oats on clay soil under conventional and
no-till cultivation from experimental data (Alakukku, 2003; Salo, 2003)
Crop Conventional No-till
Average Max. Min. Average Max. Min.
Wheat 4,655 5,387 3,276 2,960 4,111 1,799
Barley 4,191 5,750 3,108 3,946 5,526 3,191
Oats 5,122 6,154 4,400 4,196 4,840 2,796
There are four replicates per observation in this data. The number of observations for conventional wheat is 36,for barley 48, and for oats 16. The number of observations for no-till wheat is 28, for barley 36, and for oats 16.In Table 2, max. and min. are averages from these replicates.
10 Some Finnish and international research suggests that the difference is, in practice, quite small.
For instance, Holma (2000) reports winter wheat (our case is spring wheat) experimental results
for no-till, which are equal to or even higher than yields under conventional technology. We
recall also that, in the same vein, Baylis et al. (2002) found that the estimated yields for
corn–soybean rotations were roughly the same under conventional and no-till over different
regions in the USA.
No-till technology: benefits to farmers and the environment? 201
by guest on February 9, 2016http://erae.oxfordjournals.org/
Dow
nloaded from
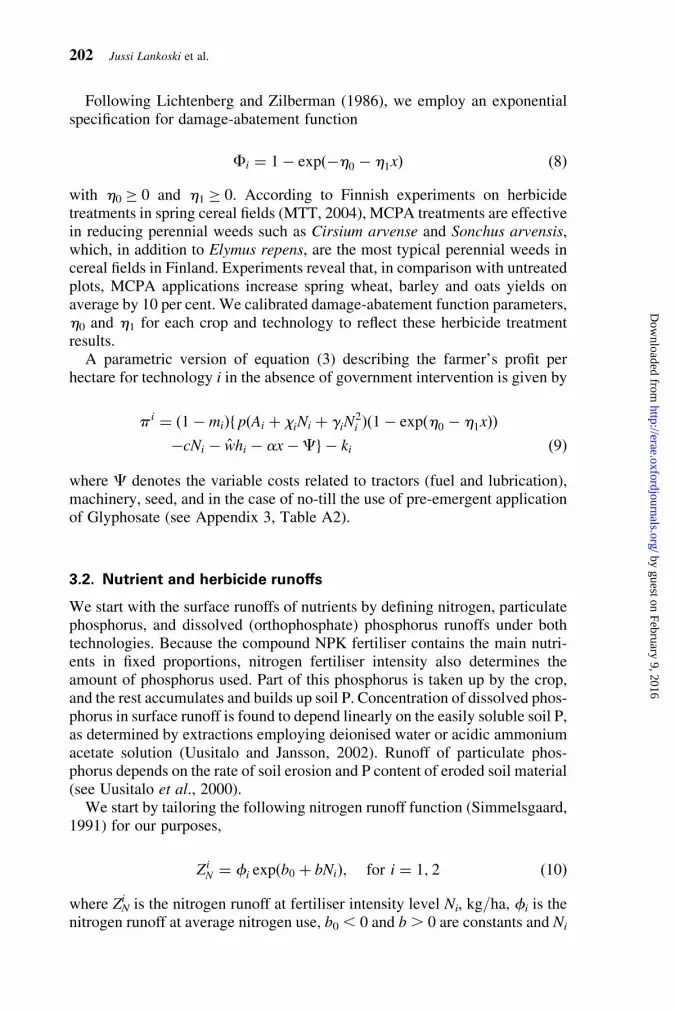
Following Lichtenberg and Zilberman (1986), we employ an exponentialspecification for damage-abatement function
Fi ¼ 1� expð�h0 � h1xÞ ð8Þ
with h0 � 0 and h1 � 0. According to Finnish experiments on herbicidetreatments in spring cereal fields (MTT, 2004), MCPA treatments are effectivein reducing perennial weeds such as Cirsium arvense and Sonchus arvensis,which, in addition to Elymus repens, are the most typical perennial weeds incereal fields in Finland. Experiments reveal that, in comparison with untreatedplots, MCPA applications increase spring wheat, barley and oats yields onaverage by 10 per cent. We calibrated damage-abatement function parameters,h0 and h1 for each crop and technology to reflect these herbicide treatmentresults.A parametric version of equation (3) describing the farmer’s profit per
hectare for technology i in the absence of government intervention is given by
p i ¼ ð1� miÞf pðAi þ xiNi þ giN2i Þð1� expðh0 � h1xÞÞ
�cNi � whi � ax �Cg � ki ð9Þ
where C denotes the variable costs related to tractors (fuel and lubrication),machinery, seed, and in the case of no-till the use of pre-emergent applicationof Glyphosate (see Appendix 3, Table A2).
3.2. Nutrient and herbicide runoffs
We start with the surface runoffs of nutrients by defining nitrogen, particulatephosphorus, and dissolved (orthophosphate) phosphorus runoffs under bothtechnologies. Because the compound NPK fertiliser contains the main nutri-ents in fixed proportions, nitrogen fertiliser intensity also determines theamount of phosphorus used. Part of this phosphorus is taken up by the crop,and the rest accumulates and builds up soil P. Concentration of dissolved phos-phorus in surface runoff is found to depend linearly on the easily soluble soil P,as determined by extractions employing deionised water or acidic ammoniumacetate solution (Uusitalo and Jansson, 2002). Runoff of particulate phos-phorus depends on the rate of soil erosion and P content of eroded soil material(see Uusitalo et al., 2000).We start by tailoring the following nitrogen runoff function (Simmelsgaard,
1991) for our purposes,
ZiN ¼ fi expðb0 þ bNiÞ; for i ¼ 1; 2 ð10Þ
where ZNi is the nitrogen runoff at fertiliser intensity level Ni, kg/ha, fi is the
nitrogen runoff at average nitrogen use, b0 , 0 and b . 0 are constants and Ni
202 Jussi Lankoski et al.
by guest on February 9, 2016http://erae.oxfordjournals.org/
Dow
nloaded from

is the nitrogen fertilisation in relation to the normal fertiliser intensity for thecrop, 0.5 � N � 1.5. We incorporate the reductive effect of the buffer strip onthe runoff ZN
i via two channels, via nitrogen uptake by buffer strips and viareduction of the actually applied fertiliser, as follows:
ZiN ¼ ½1� m0:2
i �fi e�0:7½1�0:01ð1�miÞNi�: ð11Þ
The first right-hand side brace term of (11) describes nitrogen uptake by bufferstrips. It is calibrated to reflect Finnish experimental studies on grass bufferstrips (Uusi-Kamppa and Ylaranta, 1992, 1996; Uusi-Kamppa and Kilpinen,2000). The second right-hand side term represents nitrogen runoffs generatedby a nitrogen application rate of Ni per hectare when buffer strips take up ashare of land mi. Parameter fi reflects technology differences and calibratesequation (11) to both technologies by describing their nitrogen runoffsgenerated by a nitrogen application rate of 100 kg per hectare in theabsence of buffers strips. Based on Puustinen (2004) and Puustinen et al.(2005), fi ¼ 15 kg N/ha for conventional technology and fi ¼ 8 kg N/hafor no-till technology.For phosphorus we explicitly describe both dissolved and particulate
runoffs. Drawing on Finnish experiments (Saarela et al., 1995) it is assumedthat 1 kg increase in soil phosphorus reserve increases the soil P status (i.e.ammonium acetate-extractable P) by 0.01 mg/l soil. Uusitalo and Jansson(2002) estimated the following equation between soil P and concentrationof dissolved phosphorus in runoff:
water soluble P in runoff (mg/l) ¼ 0:021� AAAc P � 0:015
where AAAc refers to ammonium acetate buffer and P to soil phosphorus(Vuorinen and Makitie, 1955). Surface runoff of potentially bioavailableparticulate phosphorus is approximated from the rate of soil loss and theconcentration of potentially bioavailable phosphorus in eroded soil materialas follows (Uusitalo, 2004):11
potentially bioavailable particulate phosphorus PP ðmg/kg eroded soilÞ
¼ 250 ln½AAAc P � 150�:
Drawing on Finnish experimental studies on grass buffer strips (Uusi-Kamppa and Kilpinen, 2000) the potentially bioavailable particulate (PP)and dissolved reactive phosphorus (DRP) uptake by buffer strips is calibratedas follows: (12 m0.3)PP and (12 m1.3)DRP. Thus, the parametric description
11 This estimation is based on 32 samples from 18 experimental sites in different parts of Finland.
Average soil P status of samples is 16 and the median is 11.
No-till technology: benefits to farmers and the environment? 203
by guest on February 9, 2016http://erae.oxfordjournals.org/
Dow
nloaded from

of surface phosphorus runoffs is given by
ZiDRP ¼ ð1� m1:3
i Þsi½Cið0:021ðuþ 0:01� 0:15ð1� miÞNiÞ � 0:015�=100
ð12aÞ
ZiPP ¼ ð1� m0:3
i ÞDi½zif250 lnðuþ 0:01� 0:15ð1� miÞNiÞ � 150g� � 10�6
ð12bÞ
where Ci is runoff volume (mm), u is AAAc_P (common to both technologies)and z is erosion kg/ha, and 0.15(12 mi)Ni is the amount of phosphorus applied.As in the case of nitrogen, the technology-based difference in the runoffs ofdissolved and the potentially bioavailable particulate phosphorus is capturedby parameters si and Di, respectively. As for the AAAc_P, following Puustinenet al. (2005) we set u ¼ 18.6. For runoffs, erosion and technology differences weuse experimental results from South-Western Finland by Puustinen (2004) andPuustinen et al. (2005), which examined surface runoffs of erosion, particulatephosphorus, dissolved phosphorus, and total nitrogen under conventional andno-till technology presented in Table 3.12
The experimental data presented in Table 3 are quite revealing. No-till tech-nology reduces erosion and particulate phosphorus by 70 per cent and nitrogenby 43 per cent relative to conventional technology. However, it increases therunoffs of dissolved phosphorus more than three-fold.13
Next we focus on the herbicide runoffs. Glyphosate is applied to stubble beforedirect drilling under no-till as a (fixed) pre-emergence control for Elymus repens.The standard application rate is 1,500 g/ha and it costsE19.0 per hectare.MCPAapplication (kg/ha) is a post-emergent weed control variable, and is thus acontinuous choice variable under both technologies. Both herbicides aredegradable. Therefore, we assume that Glyphosate is applied on stubble on 1May, which is 1 week before direct drilling. MCPA is applied on 15 June.Herbicides decay according to equation Bie
kt, where Bi denotes the amount ofherbicide applied, t is the number of days after application and the coefficient ofdegradation, k, is defined as k ¼ ln 2/DT50. We obtain the following degra-dation equations for Glyphosate (GLY) and for MCPA:
GLY ¼ 1500� e�0:014145t and MCPA ¼ xi � e�0:0693t: ð13Þ
Equations (13) define the amount of herbicides in the soil at each point of time.They imply that the half-life for Glyphosate is 49 days in the uppermost 20 cmof the soil surface, and 10 days for MCPA.For Glyphosate, the adsorption coefficient, k, indicates how the herbicide is
divided between liquid and solid phases, because it defines the ratio of liquid
12 This experimental field, cultivated with winter cereals, is located in Aurajoki. The soil has a clay
content of 45–60 per cent. The average slope of the field is 8 per cent, runoffs being mainly sur-
face runoffs. Data have been collected since 1990.
13 Table 3 differs from other related studies in one respect. The ratio of runoffs under no-till and
conventional technology is unity, whereas other studies show considerably lower runoffs for
no-till. Whether this feature is typical or not remains to be ascertained by future studies.
204 Jussi Lankoski et al.
by guest on February 9, 2016http://erae.oxfordjournals.org/
Dow
nloaded from

and solid phases. Thus, letting a denote the share of Glyphosate in soilparticles and (12 a) in soil water, an estimated value (k) of the adsorptioncoefficient can be used to define the actual shares of Glyphosate (GLY)from k ¼ aGLY/(12 a)GLY. From Finnish experiments, Autio et al.(2004) estimated an adsorption coefficient of 58 for Glyphosate.14
Using degradation of Glyphosate and its adsorption coefficient, we obtainthe following liquid and solid runoffs for Glyphosate under no-till technology:
ZiGLYl
¼ ð1� m1:3i Þ Cið0:02� GLYlÞ=100½ � for i ¼ 2 ð14aÞ
ZiGLYs
¼ ð1� m0:3i Þ ziðGLYsÞ � 10�6
� �for i ¼ 2 ð14bÞ
where Ci is runoff volume (mm), zi is erosion kg/ha, GLYl is the concen-tration of glyphosate in soil water (mg/l) and GLYs is the adsorption ofglyphosate in soil particles (g/ha), which is converted into eroded soil(mg/kg) and then multiplied by erosion (kg/ha).MCPA runoffs behave differently and are modelled using equation (15),
adapted from Kreuger and Tornqvist (1998):
logZiMCPA ¼ ð1� m0:3
i Þ½1:1þ ð1:1� logMCPAðkg=haÞ
þ 0:00004� Koc � 0:005� DT50�; i ¼ 1; 2 ð15Þ
where Koc is the soil sorption coefficient (normalised to soil organic carboncontent) which is 125 in our case, DT50 is the soil half-life, 10 days forMCPA. Equation (15) is calibrated to reflect the MCPA runoff experimentson steep clay soils (Laitinen et al., 1996).
3.3. Social welfare function
The final step in developing our parametric model is to define the socialwelfare function, whose arguments are profit (already defined in (9)) and
Table 3. Surface runoffs of erosion, particulate phosphorus, dissolved phosphorus and
total nitrogen under conventional and no-till technology (Puustinen, 2004; Puustinen
et al., 2005)
Technology Runoff
(mm)
Erosion
(kg/ha)Particulate
phosphorus
(kg/ha)
Dissolved
phosphorus
(kg/ha)
Total
nitrogen
(kg/ha)
Conventional 234 2,100 3.71 0.58 15.7
No-till 233 620 1.13 2.02 9.00
14 For example, at t ¼ 30 the amount of Glyphosate in soil is 981.3 g/ha. Using the above equation
we obtain a ¼ 0.983051, giving an amount 964.6 g sorbed to soil particles and 16.6 g as the
concentration in soil water (mg/l).
No-till technology: benefits to farmers and the environment? 205
by guest on February 9, 2016http://erae.oxfordjournals.org/
Dow
nloaded from

damages from nutrient and herbicide runoff. We next define the socialdamages from the runoff, starting with the nutrient runoff.To express the social valuation of nutrient runoff damages, we follow a
strategy suggested by Kiirikki et al. (2003) in the context of the Gulf ofFinland. As in that study, we transform total P into N equivalents in thedamage function by multiplying total P by the Redfield ratio 7.2. The Redfieldratio describes the optimum N/P ratio for the growth of phytoplankton,relevant for algal growth in coastal waters. Moreover, we assume that themarginal damage from nitrogen equivalents is constant, so that the damagefunction is given by
dðZiÞ ¼ RnðNi þ 7:2PiÞ ð16aÞ
where Ni is defined in equation (11), Pi is the sum of equations (12a) and (12b)and Rn is the constant social marginal damage. Drawing on Aakkula (1999)and Yrjola and Kola (2004), Finnish consumers experience a damage valueof E35 from average per hectare agricultural nutrient runoff (13 kg/ha Nand 2 kg/ha P).For the herbicide runoff we also postulate constant marginal damage, so that
the damage function is given by
DðZiÞ ¼ RhZhi ; for i ¼ 1; 2 ð16bÞ
where Z1h consists of MCPA runoff only and Z2
h consists of the sum of MCPAand GLY runoff. As for the value of Rh, herbicide runoff differs from nutrientrunoff because of the toxic nature of herbicides. Thus, one can expect that thesocial value of herbicide runoff damage is higher than that of nutrient runoffdamage. Siikamaki (1997) suggested an average WTP E189.3 per kg ofactive ingredients in the case of the total abandonment of herbicide use inFinnish agriculture, and we use this estimate.Combining equations (9)–(16b) allows us to express our social welfare
function for both cultivation technologies in the following simple form:
SWi ¼ pi � dðZni Þ � DðZh
i Þ; i ¼ 1; 2: ð17Þ
4. Comparison of no-till and conventional technologies:empirical findings
This section presents our empirical results. We start with private and socialprofitability, and then continue to policy instruments and sensitivity analysis.
4.1. Private profitability of no-till and conventional technologies
Table 4 presents the privately optimal nitrogen and herbicide application andthe resulting production and profits under both technologies.
206 Jussi Lankoski et al.
by guest on February 9, 2016http://erae.oxfordjournals.org/
Dow
nloaded from
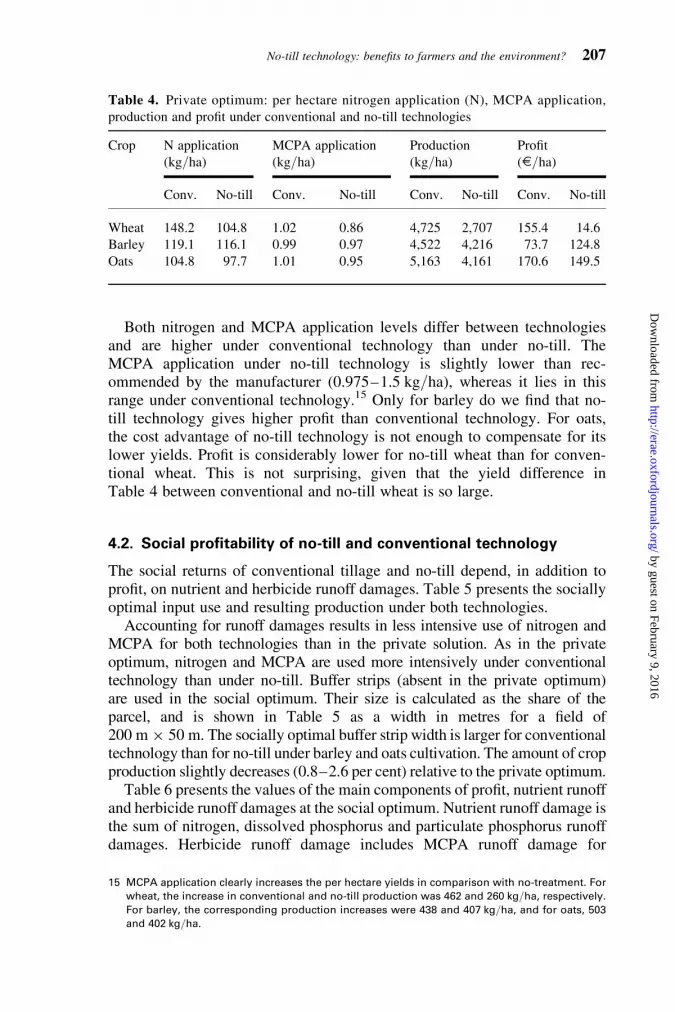
Both nitrogen and MCPA application levels differ between technologiesand are higher under conventional technology than under no-till. TheMCPA application under no-till technology is slightly lower than rec-ommended by the manufacturer (0.975–1.5 kg/ha), whereas it lies in thisrange under conventional technology.15 Only for barley do we find that no-till technology gives higher profit than conventional technology. For oats,the cost advantage of no-till technology is not enough to compensate for itslower yields. Profit is considerably lower for no-till wheat than for conven-tional wheat. This is not surprising, given that the yield difference inTable 4 between conventional and no-till wheat is so large.
4.2. Social profitability of no-till and conventional technology
The social returns of conventional tillage and no-till depend, in addition toprofit, on nutrient and herbicide runoff damages. Table 5 presents the sociallyoptimal input use and resulting production under both technologies.Accounting for runoff damages results in less intensive use of nitrogen and
MCPA for both technologies than in the private solution. As in the privateoptimum, nitrogen and MCPA are used more intensively under conventionaltechnology than under no-till. Buffer strips (absent in the private optimum)are used in the social optimum. Their size is calculated as the share of theparcel, and is shown in Table 5 as a width in metres for a field of200 m � 50 m. The socially optimal buffer strip width is larger for conventionaltechnology than for no-till under barley and oats cultivation. The amount of cropproduction slightly decreases (0.8–2.6 per cent) relative to the private optimum.Table 6 presents the values of the main components of profit, nutrient runoff
and herbicide runoff damages at the social optimum. Nutrient runoff damage isthe sum of nitrogen, dissolved phosphorus and particulate phosphorus runoffdamages. Herbicide runoff damage includes MCPA runoff damage for
Table 4. Private optimum: per hectare nitrogen application (N), MCPA application,
production and profit under conventional and no-till technologies
Crop N application
(kg/ha)MCPA application
(kg/ha)Production
(kg/ha)Profit
(E/ha)
Conv. No-till Conv. No-till Conv. No-till Conv. No-till
Wheat 148.2 104.8 1.02 0.86 4,725 2,707 155.4 14.6
Barley 119.1 116.1 0.99 0.97 4,522 4,216 73.7 124.8
Oats 104.8 97.7 1.01 0.95 5,163 4,161 170.6 149.5
15 MCPA application clearly increases the per hectare yields in comparison with no-treatment. For
wheat, the increase in conventional and no-till production was 462 and 260 kg/ha, respectively.
For barley, the corresponding production increases were 438 and 407 kg/ha, and for oats, 503
and 402 kg/ha.
No-till technology: benefits to farmers and the environment? 207
by guest on February 9, 2016http://erae.oxfordjournals.org/
Dow
nloaded from

conventional technology and the sum of MCPA, liquid and solid Glyphosaterunoff damages for no-till.The decrease in profit at the social optimum relative to the private optimum is
in the range 0.8–12.3 per cent, depending on the crop and technology. Nutrientrunoff damage is higher under conventional technology than under no-till for allcrops. In monetary terms, herbicide runoff damage plays a very small role. Thisreflects peculiarities of Finnish agriculture, where the use of herbicides is small.In line with previous discussion, herbicide runoff damage is clearly higher forno-till because, in addition to MCPA runoff damage, it also includes damagefrom liquid and solid glyphosate runoff. Again we find that adoption of no-tilltechnology is optimal only for barley cultivation. Thus, accounting for nutrientand herbicide runoff damages does not change the ranking of technologies com-pared with the private optimum. The presence of runoff damage, however,nearly closes the gap between conventional and no-till technology in the caseof oats. Social returns for no-till wheat are negative, reflecting the above-men-tioned yield failures in no-till wheat experiments.
4.3. Does no-till imply lower overall nutrient runoffs?
The above empirical findings indicate that no-till decreases particulate phos-phorus runoff but this reduction may be offset by increased dissolved
Table 5. Social optimum: per hectare nitrogen application (N), MCPA application, buffer
strips (share and meters) and production under no-till and conventional technologies
Crop N application
(kg/ha)MCPA application
(kg/ha)Buffer strips, share
(m)
Production
(kg/ha)
Conv. No-till Conv. No-till Conv. No-till Conv. No-till
Wheat 145.2 102.2 0.97 0.81 0.0149 (3.0) 0.0165 (3.3) 4,624 2,638
Barley 117.2 114.8 0.94 0.91 0.0208 (4.2) 0.0063 (1.3) 4,404 4,171
Oats 103.5 96.8 0.96 0.89 0.0117 (2.3) 0.0049 (1.0) 5,086 4,127
Table 6. Social optimum: profit from production, nutrient runoff damage, herbicide runoff
damage and social welfare under no-till and conventional technologies
Crop Profit
(E/ha)Nutrient runoff
damage (E/ha)Herbicide runoff
damage (E/ha)Social welfare
(E/ha)
Conv. No-till Conv. No-till Conv. No-till Conv. No-till
Wheat 150.1 12.8 35.2 24.4 1.07 1.61 114.6 213.2
Barley 69.1 123.4 31.8 26.2 0.99 1.84 36.4 95.4
Oats 166.9 148.3 33.2 25.8 1.08 1.84 132.7 120.7
208 Jussi Lankoski et al.
by guest on February 9, 2016http://erae.oxfordjournals.org/
Dow
nloaded from
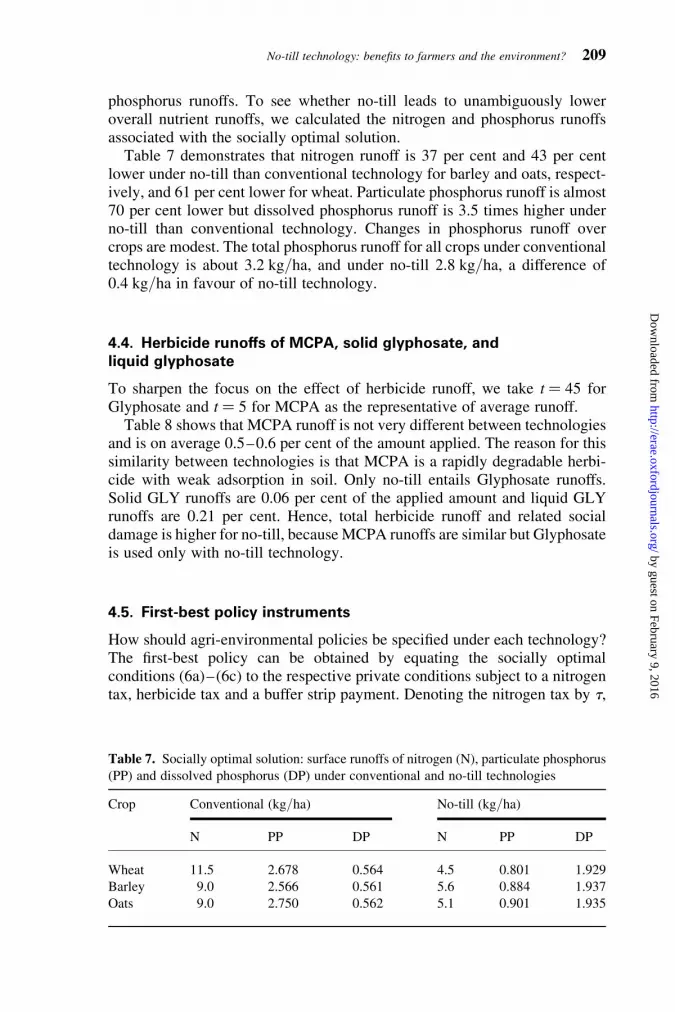
phosphorus runoffs. To see whether no-till leads to unambiguously loweroverall nutrient runoffs, we calculated the nitrogen and phosphorus runoffsassociated with the socially optimal solution.Table 7 demonstrates that nitrogen runoff is 37 per cent and 43 per cent
lower under no-till than conventional technology for barley and oats, respect-ively, and 61 per cent lower for wheat. Particulate phosphorus runoff is almost70 per cent lower but dissolved phosphorus runoff is 3.5 times higher underno-till than conventional technology. Changes in phosphorus runoff overcrops are modest. The total phosphorus runoff for all crops under conventionaltechnology is about 3.2 kg/ha, and under no-till 2.8 kg/ha, a difference of0.4 kg/ha in favour of no-till technology.
4.4. Herbicide runoffs of MCPA, solid glyphosate, and
liquid glyphosate
To sharpen the focus on the effect of herbicide runoff, we take t ¼ 45 forGlyphosate and t ¼ 5 for MCPA as the representative of average runoff.Table 8 shows that MCPA runoff is not very different between technologies
and is on average 0.5–0.6 per cent of the amount applied. The reason for thissimilarity between technologies is that MCPA is a rapidly degradable herbi-cide with weak adsorption in soil. Only no-till entails Glyphosate runoffs.Solid GLY runoffs are 0.06 per cent of the applied amount and liquid GLYrunoffs are 0.21 per cent. Hence, total herbicide runoff and related socialdamage is higher for no-till, because MCPA runoffs are similar but Glyphosateis used only with no-till technology.
4.5. First-best policy instruments
How should agri-environmental policies be specified under each technology?The first-best policy can be obtained by equating the socially optimalconditions (6a)–(6c) to the respective private conditions subject to a nitrogentax, herbicide tax and a buffer strip payment. Denoting the nitrogen tax by t,
Table 7. Socially optimal solution: surface runoffs of nitrogen (N), particulate phosphorus
(PP) and dissolved phosphorus (DP) under conventional and no-till technologies
Crop Conventional (kg/ha) No-till (kg/ha)
N PP DP N PP DP
Wheat 11.5 2.678 0.564 4.5 0.801 1.929
Barley 9.0 2.566 0.561 5.6 0.884 1.937
Oats 9.0 2.750 0.562 5.1 0.901 1.935
No-till technology: benefits to farmers and the environment? 209
by guest on February 9, 2016http://erae.oxfordjournals.org/
Dow
nloaded from

MCPA tax by j, and a concave buffer strip payment by l, we express privateprofit as
pi ¼ ð1� miÞfpðAi þ xiNi þ giN2i Þð1� expðh0 � h1xÞÞ � cð1þ tÞNi
� whi � að1þ jÞx �Cg � ki þ ðl� l miÞmi; i ¼ 1; 2: ð20Þ
Following a standard procedure, we equate the private optimality conditions inthe presence of policy instruments with the socially optimal conditions andsolve the simultaneous equation system for instruments to obtain the followingresults shown in Table 9. The first-best nitrogen and herbicide taxes differbetween technologies and crops. Despite the range of 1.6 percentage pointsunder conventional cultivation, uniform nitrogen and herbicide taxes couldperform quite well within each technology. The fact that the nitrogen tax islower and the herbicide tax slightly higher under no-till is in line with thetheoretical analysis. The optimal buffer strip payment differs markedlybetween technologies, and between crops within each technology, as theopportunity costs of establishing buffers vary significantly. Thus, in terms ofthe optimal buffer strip payment, differentiation between technologies andeven between crops within each technology may well be warranted.
Table 8. Socially optimal solution: surface runoffs of MCPA, solid glyphosate and liquid
glyphosate under conventional and no-till technologies
Crop Conventional (g/ha) No-till (g/ha)
MCPA MCPA Solid GLY Liquid GLY
Wheat 5.64 4.59 0.78 3.11
Barley 5.21 5.74 0.86 3.13
Oats 5.71 5.71 0.88 3.13
Table 9. Levels of the first-best policy instruments (the nitrogen and MCPA taxes are
reported in percentages of price and the buffer payment in euros)
Crop Conventional No-till
Nitrogen MCPA Buffer Nitrogen MCPA Buffer
tax (%) tax (%) payment (E) tax (%) tax (%) payment (E)
Wheat 7.2 19.3 289.7 2.9 19.1 102.6
Barley 5.6 18.6 212.7 3.6 20.9 210.5
Oats 5.6 19.8 308.8 3.3 21.3 236.0
210 Jussi Lankoski et al.
by guest on February 9, 2016http://erae.oxfordjournals.org/
Dow
nloaded from

4.6. Sensitivity analysis
We performed sensitivity analysis for the key economic and environmentalvariables. We start with the economic factors (critical yield loss, prices andcosts) and then examine how variability in environmental conditions wouldaffect our results. We represent environmental heterogeneity by the variationin the propensity to runoff that results from different field slopes.
4.6.1. Critical yield loss for no-till under private and social optimum
First, we ask how much lower yields could be under no-till whilst still provid-ing private or social profit that are equal to those of conventional technology.This critical yield loss defines the point where the adoption of no-till becomesprivately or socially optimal.Table 10 shows that the critical yield loss is roughly the same for both
solutions. No-till can yield, on average, 900 kg/ha less than conventionaltechnology and still be a viable solution. The yield losses given in Table 4for no-till are 306 kg/ha for barley and 2,018 kg/ha for wheat. Thus, forthese crops, the results are robust. By contrast, the yield difference for oats(1002 kg/ha) is closer to the critical yield loss.Using the values in Table 10 and crop prices, we calculate the value of the
critical yield loss at private optimum to be E131/ha for wheat, E84/ha forbarley and E89/ha for oats.
4.6.2. The effects of crop prices and nitrogen and herbicide costs
To see how crop prices and nitrogen and herbicide (both MCPA andGlyphosate) costs affect the private profitability, we increased their value by10 per cent (see Table 11).
Table 10. Critical yield loss at the private and social optima
Solution Wheat (kg/ha) Barley (kg/ha) Oats (kg/ha)
Private optimum –971 –778 –808
Social optimum –1,040 –779 –901
Table 11. Sensitivity analysis: profit under a 10 per cent increase in crop prices, nitrogen
prices and herbicide prices
þ10% crop price:
profit (E/ha)þ10% nitrogen price:
profit (E/ha)þ10% herbicide price:
profit (E/ha)
Conv. No-till Conv. No-till Conv. No-till
Wheat 219.4 51.6 138.6 3.1 154.8 12.2
Barley 122.7 170.5 60.2 111.7 73.1 122.3
Oats 227.5 195.5 158.7 138.5 170.0 147.1
No-till technology: benefits to farmers and the environment? 211
by guest on February 9, 2016http://erae.oxfordjournals.org/
Dow
nloaded from

The profitability ranking of the technologies remains unchanged for a 10 percent increase in exogenous crop, nitrogen and herbicide prices. However, incomparison with the base case (Table 4), an increase in the crop and herbicideprice favours conventional technology, whereas a nitrogen price increasefavours no-till.
4.6.3. The effect of environmental heterogeneity
Sensitivity analysis of the role of environmental heterogeneity was conductedby assuming a different field slope, which leads to different nutrient and her-bicide runoffs.16 The effect of the slope is obtained from the ICECREAMmodel, which simulates runoff, soil loss, and nitrogen and phosphorusrunoff, and from the GLEAMS model, which simulates pesticide runoff (Lai-tinen et al., 1996). Our base case represents an experimental field with a steepslope (8 per cent). The sensitivity analysis, therefore, examines the case of afield with a slope of less than 3 per cent.Table 12 shows that the socially optimal nitrogen application increases
slightly (relative to Table 5), reflecting the smaller propensity to runofffrom a flatter field. The most important change takes place in the sociallyoptimal buffer strip width, which is on average only 30 per cent of thewidth reported in Table 5.Table 13 presents the values of the main components of the social welfare,
assuming a less steep slope. In comparison with Table 6, nutrient runoffdamage is clearly lower for both technologies, but especially so for the con-ventional technology. Hence, it seems that a less steep slope is more favour-able for conventional technology. However, the effect of the flatter slope onsocial returns is not enough to alter the social welfare ranking of thetechnologies.Finally, Tables 14 and 15 show the nutrient and herbicide runoff for conven-
tional and no-till technologies for a field parcel with a slope of less than 3 percent. Relative to the corresponding Tables 7 and 8, nitrogen runoff decreases
Table 12. Sensitivity analysis: field slope under 3 per cent; social optimum: per hectare
nitrogen application (N), MCPA application, buffer strips (share and meters) and
production under no-till and conventional technologies
Crop N application
(kg/ha)MCPA application
(kg/ha)Buffer strips, share
(m)
Production
(kg/ha)
Conv. No-till Conv. No-till Conv. No-till Conv. No-till
Wheat 146.4 103.2 0.97 0.81 0.0045 (0.9) 0.0053 (1.1) 4,685 2,677
Barley 118.0 115.3 0.94 0.91 0.0061 (1.2) 0.0022 (0.4) 4,479 4,195
Oats 104.0 97.2 0.96 0.89 0.0034 (0.7) 0.0017 (0.3) 5,134 4,145
16 The effect of the slope on the amount of runoff is significant for erosion and soil sediment-bound
nutrients and herbicides (particulate phosphorus and solid Glyphosate), and smaller for nutri-
ents and herbicides in dissolved form (dissolved phosphorus, nitrogen, and liquid Glyphosate).
212 Jussi Lankoski et al.
by guest on February 9, 2016http://erae.oxfordjournals.org/
Dow
nloaded from
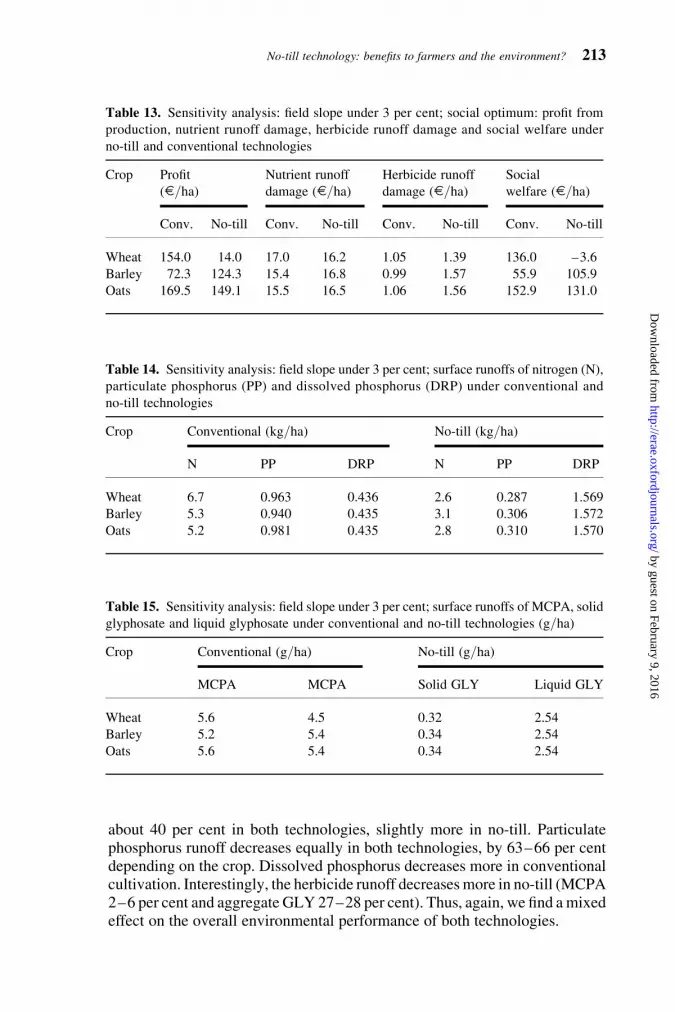
about 40 per cent in both technologies, slightly more in no-till. Particulatephosphorus runoff decreases equally in both technologies, by 63–66 per centdepending on the crop. Dissolved phosphorus decreases more in conventionalcultivation. Interestingly, the herbicide runoff decreasesmore in no-till (MCPA2–6 per cent and aggregate GLY 27–28 per cent). Thus, again, we find amixedeffect on the overall environmental performance of both technologies.
Table 13. Sensitivity analysis: field slope under 3 per cent; social optimum: profit from
production, nutrient runoff damage, herbicide runoff damage and social welfare under
no-till and conventional technologies
Crop Profit
(E/ha)Nutrient runoff
damage (E/ha)Herbicide runoff
damage (E/ha)Social
welfare (E/ha)
Conv. No-till Conv. No-till Conv. No-till Conv. No-till
Wheat 154.0 14.0 17.0 16.2 1.05 1.39 136.0 –3.6
Barley 72.3 124.3 15.4 16.8 0.99 1.57 55.9 105.9
Oats 169.5 149.1 15.5 16.5 1.06 1.56 152.9 131.0
Table 14. Sensitivity analysis: field slope under 3 per cent; surface runoffs of nitrogen (N),
particulate phosphorus (PP) and dissolved phosphorus (DRP) under conventional and
no-till technologies
Crop Conventional (kg/ha) No-till (kg/ha)
N PP DRP N PP DRP
Wheat 6.7 0.963 0.436 2.6 0.287 1.569
Barley 5.3 0.940 0.435 3.1 0.306 1.572
Oats 5.2 0.981 0.435 2.8 0.310 1.570
Table 15. Sensitivity analysis: field slope under 3 per cent; surface runoffs of MCPA, solid
glyphosate and liquid glyphosate under conventional and no-till technologies (g/ha)
Crop Conventional (g/ha) No-till (g/ha)
MCPA MCPA Solid GLY Liquid GLY
Wheat 5.6 4.5 0.32 2.54
Barley 5.2 5.4 0.34 2.54
Oats 5.6 5.4 0.34 2.54
No-till technology: benefits to farmers and the environment? 213
by guest on February 9, 2016http://erae.oxfordjournals.org/
Dow
nloaded from

5. Conclusions and policy implications
We developed a theoretical framework and a parametric model to assess theprivate profitability and social desirability of conventional tillage and no-tilltechnology. Our analysis integrates crop yields, production costs, and nutrientand herbicide runoff damages resulting from fertiliser and herbicide appli-cations. The empirical model was calibrated with Finnish data. We foundthat no-till provides higher social returns and private profit than conventionaltillage only for barley, but not for oats or wheat. For oats the production costadvantage of no-till is not enough to compensate for the lower yields no-tillprovides in the private optimum. Moreover, the slightly better environmentalperformance of no-till for oats at the social optimum is not enough to make itsocially preferable. This holds more strongly for wheat. Thus, the key factorsdetermining the private and social profitability of no-till and conventionaltillage are yields and production costs, rather than environmental performance.Our model predicts that in order for no-till to be adopted, average yield lossescompared with conventional technology should not exceed 900 kg/ha.Comparison of the environmental performance of the two technologies is
revealing. No-till seems to provide only slightly better overall performancethan conventional tillage. No-till reduces nitrogen and particulate phosphorusrunoffs considerably. However, and in line with previous studies, dissolvedphosphorus runoff increases markedly, making the amount of total phosphorusrunoff almost the same as in conventional cultivation. Total herbicide runoff isslightly higher for no-till because of the need to use pre-emergence Glyphosatetreatment to control perennial weeds, which are more abundant under no-tillthan conventional tillage. Hence, the adoption of no-till entails trade-offsconcerning the types of environmental effects. The importance of thesetrade-offs depends on society’s valuation of herbicide and runoff damages.Using estimates of these values for Finland, the role of herbicide damagesat the social optimum is very small. Moreover, nutrient damage valuation isnot enough to make the slight environmental performance advantage ofno-till a decisive factor in the technology choice.Sensitivity analysis with respect to exogenous factors, input and output prices,
and environmental heterogeneity (measured by field gradient) reveals that theranking of technologies is rather robust. Interestingly, however, we found thatthe steeper the field is, the more attractive no-till becomes. This suggests thatno-till may provide local solutions for watersheds that are surrounded by verysteep fields, or where water quality impairment is mainly due to nitrogen orsoil sediment-bound pollutants such as particulate phosphorus.Overall, given the short-term experimental data used, no-till does not
provide a general win–win possibility for agri-environmental policy inFinnish agriculture. However, its adoption may be optimal for some crops(barley) and for some environmentally sensitive areas. Further field experi-ments are needed to investigate whether the no-till yields can be increased,which would strengthen the case for its adoption. Following de Koeijeret al. (1999), we stress that the adoption of any new cultivation technology
214 Jussi Lankoski et al.
by guest on February 9, 2016http://erae.oxfordjournals.org/
Dow
nloaded from
entails many dynamic agronomic and biological changes that are not includedin conventional economic models. In the case of no-till, there are many suchchanges, including improved soil structure and stability, enhanced drainageand water-holding capacity, and richer soil biota improving nutrient recycling.Thus, including these important environmental and agronomic aspects may
make no-till more socially desirable. One additional example is the potentialof no-till to promote net carbon sequestration in croplands as an importantmeans for reducing greenhouse gas emissions. Also, one would like toknow how no-till relates to species diversity (birds, weeds, herbivores andsoil micro-organisms), and what the implications for biodiversity are of poten-tial increase in herbicide use.
Acknowledgements
The opinions expressed in this paper should not be ascribed to the OECD or its member
governments.
This paper is a part of the project ‘Multifunctional Agriculture and Policies’, funded by the
Ministry of Agriculture and Forestry. This funding is gratefully acknowledged. Ollikainen
thanks Academy of Finland for the grant No. 204476 for the position of Senior Researcher for
the academic year 2003–2004. We are grateful for Laura Alakukku, Markku Puustinen, Katri
Siimes and Risto Uusitalo, who kindly advised us on many details concerning nutrient and
herbicide runoff under no-till. We thank Hannu J. Mikkola and Antti Nikula for data and
helpful comments, and Stefan Backman and Eirik Romstad for insightful advice. The comments
by the Editor and three anonymous referees are gratefully acknowledged.
References
Aakkula, J. J. (1999). Economic value of pro-environmental farming—a critical and
decision-making oriented application of the contingent valuation method. Publication
92, Agricultural Economics Research Institute (MTTL). Helsinki: MTTL.
Aase, J. and Schaefer, G. (1996). Economics of tillage practices and spring wheat and
barley crop sequence in the Northern Great Plains. Journal of Soil and Water Conserva-
tion 51: 167–170.
Alakukku, L. (2003). Zero tillage of spring cereals on two clay soils in humid climate.
In: The Conference Proceedings of International Soil Tillage Research Organisation
16th Triennial Conference ‘Soil Management for Sustainability’, 13–18 July 2003,
The University of Queensland, Brisbane, Australia (CD-rom).
Anonymous (2001). Conservation agriculture in Europe. http://www.ecaf.org. Accessed13 March 2006.
Autio, S., Siimes, K., Laitinen, P., Ramo, S., Oinonen, S. and Eronen, L. (2004). Adsorption
of sugar beet herbicides to Finnish soils. Chemosphere 55: 215–226.
Backman, S. T., Vermeulen, S. and Taavitsainen, V.-M. (1997). Long-term fertilizer field
trials: comparison of three mathematical response models. Agricultural and Food
Science in Finland 6: 151–160.
Baylis, K., Feather, P., Padgitt, M. and Sandretto, C. (2002). Water-based recreational
benefits of conservation programs: the case of conservation tillage on U.S. cropland.
Review of Agricultural Economics 24: 384–393.
No-till technology: benefits to farmers and the environment? 215
by guest on February 9, 2016http://erae.oxfordjournals.org/
Dow
nloaded from

CTIC (2002). Economic benefits with environmental protection—no-till and conservation
buffers in the Midwest. West Lafayette, IN: Conservation Technology Information
Center.
Danfors, B. (1988). Bransleforbrukning och avverkning vid olika system for jordbearbet-
ning och sadd. Olika satt att spara motorbransle och oka kapaciteten. Meddelande nr
420, Jordbrukstekniska Institutet. Uppsala: Jordbrukstekniska Institutet.
Fuglie, K. (1999). Conservation tillage and pesticide use in the Cornbelt. Journal of
Agricultural and Applied Economics 31: 133–147.
Fuglie, K. and Kascak, C. (2001). Adoption and diffusion of natural-resource-conserving
agricultural technology. Review of Agricultural Economics 23: 386–403.
Fykse, H., Torresen, K. and Romstad, E. (2004). Production systems and plant protection
requirements in cereals: a model analysis of long-term effects. Acta Agriculturae
Scandinavica, Section B: Soil and Plant Science 54: 149–160.
Holland, J. (2004). The environmental consequences of adopting conservation tillage in
Europe: reviewing the evidence. Agriculture, Ecosystems and Environment 103: 1–25.
Holma, E. (2000). Suorakylvo harkittava joka lohkolla erikseen—tutkija ja viljelija
yhteistyossa. Koneviesti 3/2000, 6–7. In English: Use of no-till is parcel specific
decision–the cooperation between the farmer and the researcher.
Kiirikki, M., Rantanen, P., Varjopuro, R., Leppanen, A., Hiltunen, M., Pitkanen, H.,
Ekholm, P., Moukhametsina, E., Inkala, A., Kuosa, H. and Sarkkula, J. (2003). Cost
effective water protection in the Gulf of Finland: focus on St. Petersburg. The
Finnish Environment No. 632, Finnish Environment Research Institute. Helsinki:
Finnish Environment Research Institute.
Klemme, R. (1985). A stochastic dominance comparison of reduced tillage systems in corn
and soybean production under risk. American Journal of Agricultural Economics 67:
550–557.
Koeijer, T., Wossink, G., van Ittersum, M., Struik, P. and Renkema, J. (1999). A conceptual
model for analysing input–output coefficients in arable farming systems: from diagnosis
towards design. Agricultural Systems 61: 33–44.
Kreuger, J. and Tornqvist, L. (1998). Multiple regression analysis of pesticide occurrence in
streamflow related to pesticide properties and quantities applied. Chemosphere 37:
189–207.
Kurkalova, L., Kling, C. and Zhao, J. (2001). The subsidy for adopting conservation
tillage: estimation from observed behavior. Working Paper 01-WP 286, Center for
Agricultural and Rural Development, Iowa State University. Ames, IA: Iowa State
University.
Kurkalova, L., Kling, C. and Zhao, J. (2003). Multiple benefits of carbon-friendly
agricultural practices: empirical assessment of conservation tillage. Working Paper
03-WP 341, Center for Agricultural and Rural Development, Iowa State University.
Ames, IA: Iowa State University.
Laitinen, P., Raisio, R. and Siimes, K. (1996). Torjunta-ainepaastot maataloudessa.
Maatalouden tutkimuskeskuksen julkaisuja. Sarja A. In English: Pesticide runoffs in
agriculture.
Lal, R., Follett, R., Kimble, J. and Cole, C. (1999). Managing U.S. cropland to sequester
carbon in soil. Journal of Soil and Water Conservation 54: 374–381.
216 Jussi Lankoski et al.
by guest on February 9, 2016http://erae.oxfordjournals.org/
Dow
nloaded from
Lankoski, J. and Ollikainen, M. (2003). Agri-environmental externalities: a frame-
work for designing targeted policies. European Review of Agricultural Economics 30:
51–75.
Latti, M. (2002). Suorakylvoa kaytannossa—kayttajien kokemuksia. Tyotehoseuran
maataloustiedote 8/2002. In English: No-till in practice–farmers’ experiences.
Lichtenberg, E. and Zilberman, D. (1986). The econometrics of damage control: why
specification matters. American Journal of Agricultural Economics 68: 261–273.
McIsaac, G., Michell, J. and Hirschi, M. (1995). Dissolved phosphorus concentration in
runoff from simulated rainfall on corn and soybean tillage systems. Journal of Soil
and Water Conservation 50: 383–387.
MTT (2004). Herbicides and plant growth regulators. Trial report. Jokioinen: MTT
Agrifood Research Finland.
Nielsen, V. (1987). Energiforbrug og arbejdsbehov ved direkte saning og traditional
jordbehandling. Beretning nr. 37, Statens jordbrukstekniske forsog.
Nikula, A. (2005). Kylvomenetelmien kustannusvertailu tilamallien avulla. Koneviesti:
(2) 2005. In English: Using farm models to estimate the costs of alternative tillage
methods.
Puustinen, M. (2004). Surface runoffs of nitrogen, particulate phosphorus and dissolved
phosphorus under alternative tillage methods. Unpublished manuscript.
Puustinen, M., Koskiaho, J. and Peltonen, K. (2005). Influence of cultivation methods on
suspended solids and phosphorus concentrations in surface runoff on clayey sloped
fields in boreal climate. Agriculture, Ecosystems and Environment 105: 565–579.
Rahm, M. and Huffman, W. (1984). The adoption of reduced tillage: the role of human
capital and other variables. American Journal of Agricultural Economics 66: 405–413.
Rasmussen, K. (1999). Impact of ploughless soil tillage on yield and soil quality: a
Scandinavian review. Soil and Tillage Research 53: 3–14.
Saarela, I., Jarvi, A., Hakkola, H. and Rinne, K. (1995). Fosforilannoituksen porraskokeet
1977–1994. Vuosittain annetun fosforimaaran vaikutus maan viljavuuteen ja peltokas-
vien satoon monivuotisissa kenttakokeissa. In English: Phosphorus fertilizer trials,
1977–1994: effects of the rate of annual phosphorus application on soil fertility and
yields of field crops in long-term field experiments). Maatalouden tutkimuskeskus,
Tiedote 16/95.
Salo, Y. (2003). Direct drilling of cereals. Proceedings of Nordic Association of Agricul-
tural Scientists 22nd Congress, July 1–4, 2003, Turku, Finland.
Siikamaki, J. (1997). Torjunta-aineiden kayton vahentamisen arvo? Contingent valuation—
tutkimus kuluttajien maksuhalukkuudesta. In English: The economic value of decreased
use of pesticides? A contingent valuation study on willingness to pay. Helsinki: Agri-
cultural Economics Research Institute, 217.
Simmelsgaard, S. (1991). Estimation of nitrogen leakage functions—nitrogen leakage as a
function of nitrogen applications for different crops on sand and clay soils. In: S. Rude
(ed.), Nitrogen fertilizers in Danish agriculture—present and future application and
leaching. Report 62, Institute of Agricultural Economics. Copenhagen: Institute of Agri-
cultural Economics, 135–150 (in Danish).
Smith, P. (2003). Carbon sequestration in croplands: the potential in Europe and the global
context. European Journal of Agronomy 20(3): 229–236.
No-till technology: benefits to farmers and the environment? 217
by guest on February 9, 2016http://erae.oxfordjournals.org/
Dow
nloaded from

Soileau, J. M., Touchton, J. T., Hajek, B. F. and Baglio, J. V. (1994). Sediment, nitrogen,
and phosphorus runoff with conventional- and conservation tillage cotton in a small
watershed. Journal of Soil and Water Conservation 48: 449–457.
Soule, M., Tegene, A. and Wiebe, K. (2000). Land tenure and the adoption of conservation
practices. American Journal of Agricultural Economics 82: 993–1005.
Stonehouse, D. P. (1997). Socio-economics of alternative tillage systems. Soil and Tillage
Research 43: 109–130.
Sturs, A., Carter, M. and Johnston, H. (1997). A review of plant disease, pathogen inter-
actions and microbial antagonism under conservation tillage in temperate humid
agriculture. Soil and Tillage Research 41: 169–189.
Tebrugge, F. and During, F.-A. (1999). Reducing tillage intensity—a review of results from
a long-term study in Germany. Soil and Tillage Research 53: 15–28.
Uri, N. (1998). Conservation tillage and the use of energy and other inputs in US agricul-
ture. Energy Economics 20: 389–410.
Uusi-Kamppa, J and Kilpinen, M. (2000). Suojakaistat ravinnekuormituksen vahentajana.
Maatalouden tutkimuskeskuksen julkaisuja, Sarja A 83. In English: The effectiveness of
buffer strips in reducing nutrient runoffs.
Uusi-Kamppa, J. and Ylaranta, T. (1992). Reduction of sediment, phosphorus and nitrogen
transport on vegetated buffer strips. Agricultural Science in Finland 1: 569–575.
Uusi-Kamppa, J. and Ylaranta, T. (1996). Effect of buffer strip on controlling erosion and
nutrient losses in Southern Finland. In: G. Mulamoottil, B.G. Warner and E.A. McBean
(eds), Wetlands: Environmental Gradients, Boundaries and Buffers. Boca Raton, FL:
CRC Press/Lewis, 221–235.
Uusitalo, R. (2004). Potential bioavailability of particular phosphorus in runoff from arable
clayey soils. Agrifood Research Reports 53, Doctoral Dissertation, MTT Agrifood
Research Finland. Jokioinen: MTT Agrifood Research Finland.
Uusitalo, R. and Jansson, H. (2002). Dissolved reactive phosphorus in runoff assessed by soil
extraction with an acetate buffer. Agricultural and Food Science in Finland 11: 343–353.
Uusitalo, R., Yli-Halla, M. and Turtola, E. (2000). Suspended soil as a source of potentially
bioavailable phosphorus in surface runoff waters from clay soils. Water Resources 34:
2477–2482.
Vuorinen, J. and Makitie, O. (1955). The method of soil testing in use in Finland. Agro-
geological Publications 63: 1–44.
Wu, J., Adams, R., Kling, C. and Tanaka, K. (2004). From microlevel decisions to land-
scape changes: an assessment of agricultural conservation policies. American Journal
of Agricultural Economics 86: 26–41.
Wu, J. and Babcock, B. (1998). The choice of tillage, rotation and soil testing practices:
economic and environmental implications. American Journal of Agricultural Econ-
omics 80: 494–511.
Yrjola, T. and Kola, J. (2004). Consumer preferences regarding multifunctional agriculture.
International Food and Agribusiness Management Review 7(1): 78–91.
Zhao, J., Kling, C. and Kurkalova, L. (2003). Alternative green payment policies under
heterogeneity when multiple benefits matter. Working Paper 03-WP 341, Center for
Agricultural and Rural Development, Iowa State University. Ames, IA: Iowa State
University.
218 Jussi Lankoski et al.
by guest on February 9, 2016http://erae.oxfordjournals.org/
Dow
nloaded from

Appendix 1: Proof of proposition
(a) Social optimum
Express first the difference in social welfare as
SW2 � SW1 ¼ ðr�2 � r�1Þ þ w½�ð1� m�2Þh2 þ ð1� m�
1Þh1�
þ ð�d2 þ d1Þ þ ð�D2 � D1Þ
where
r�i ¼ ð1� m�i Þ pf iðl�i ; qÞFi
ðHi; x�i Þ � cl�i � ax�i � whi
� �
� ki; with i ¼ 1; 2:
ð�d2 þ d1Þ ¼ �d2ðg2ðl�2;m�2ÞÞ þ d1ðg1ðl�1;m�
1ÞÞ . 0
and
ð�D2 þ D1Þ ¼ �D2ðe2ðx�2;m�2ÞÞ þ D1ðe1ðx�1;m�
1ÞÞ , ð�Þ 0:
Assume first that fl2F2
� fl1F1, then all other terms are positive except the last
one, which can be positive or negative. If this term is small enough relative toothers, no-till is adopted. But if fl
2F2 , fl1F1, then the first, third and fifth
terms can be either positive or negative, making social returns of either con-ventional or no-till higher.
(b) Private optimum
Define the difference in private profit as p22 p1 ¼ (u22 u1)þ (2k2 þk1)þ w�(2h2þ h1), where ui ¼ pf(li
0, q)Fi(Hi, xi0)2 c�li
02 a�xi0, i ¼ 1,
2. If fl2F2
� fl1F1, then the difference in profit is positive, as all terms are
unambiguously positive. If, however, fl2F2 , fl
1F1, then the difference(u2–u1) becomes negative and offsets the last two positive terms, makingthe outcome ambiguous.
Appendix 2: Cost structure of conventional and no-till
The cost structure of conventional and no-till technology is from Nikula(2005). Fixed tractor costs include depreciation, interest and insurance.Fixed machinery costs include depreciation and interest. Depreciation timefor tractors is 10 years and for machinery 12 years, interest rate is 4 percent and repair cost is 3 per cent. By assumption, under conventional tillagethe annual use of tractors is 300 hours for a 70 kW tractor and 200 hoursfor 55 kW tractor. Under no-till annual tractor use is 400 hours for a 70 kWtractor.
No-till technology: benefits to farmers and the environment? 219
by guest on February 9, 2016http://erae.oxfordjournals.org/
Dow
nloaded from

Appendix 3: Parameter values in the numericalapplication
Table A1. Fixed costs of tractors and machinery (depreciation, interest, insurance and
maintenance cost), total annual ownership costs, E/year (Nikula, 2005)
Machinery Conventional
(E/year)No-till
(E/year)
Tractor
70 kW 3,726 3,726
55 kW 2,644
Mouldboard plough, 3 � 1600 1,102
Harrows, 6.5 m and 4.5 m 327þ 1,107 ¼ 1,434
Grain drill, 2.5 m 1,171
Direct planter, 3.0 m 3,569
Plant protection sprayer, 700 l per 12 m 370 370
Table A2. Parameter values in the numerical application
Parameter Symbol Value
Price of crop pi E/kgWheat 0.135
Barley 0.108
Oats 0.110
Price of nitrogen fertiliser c E1.15/kgPrice of MCPA a E6.25/kgGlyphosate cost for no-till E18.9/haSeed cost E/ha
Wheat 74.0
Barley 40.0
Oats 39.0
Labour input h/haConventional 4.58
No-till 1.31
Fuel cost wff E0.34/lConventional E19.45/haNo-till E6.84/ha
Labour cost whh E11.1/hConventional E50.8/haNo-till E14.5/ha
Damage-abatement function parameters h0 –2.3
Wheat h1 –3.50
Barley –3.28
Oats –3.40
(continued on next page )
220 Jussi Lankoski et al.
by guest on February 9, 2016http://erae.oxfordjournals.org/
Dow
nloaded from

Corresponding author: Markku Ollikainen, Department of Economics and Management,P.O. Box 27, FIN-00014, University of Helsinki, Helsinki, Finland. Phone: þ3589 19158065. Fax: þ358 9 19158096. E-mail: [email protected]
Table A2 (continued)
Parameter Symbol Value
Nitrogen response function
Wheat A 1,274
Barley 1,010
Oats 1,414
Wheat (conventional; no-till) g –0.100; –0.050
Barley (conventional; no-till) –0.159; –0.147
Oats (conventional; no-till) –0.243; –0.182
Wheat (conventional; no-till) xi 38.19; 19.04
Barley (conventional; no-till) 48.57; 44.83
Oats (conventional; no-till) 61.40; 46.07
All prices and costs are from the year 2002. The price of nitrogen is calculated on the basis of a compound NPKfertiliser.
No-till technology: benefits to farmers and the environment? 221
by guest on February 9, 2016http://erae.oxfordjournals.org/
Dow
nloaded from