NNPC Monthly Financial and Operations Report April 2020
41
April 2020 Monthly Report Financial and Operations Report NNPC
-
Upload
khangminh22 -
Category
Documents
-
view
3 -
download
0
Transcript of NNPC Monthly Financial and Operations Report April 2020

April 2020
Monthly Report
Financial and Operations
Report
NNPC
2 NNPC | Monthly Financial and Operations Report April 2020 www.nnpcgroup.com | www.facebook.com/NNPCgroup | www.twitter.com/NNPCgroup
Disclaimer
This publication presents information on the Nigerian oil and gas
industry. Its content reflects individual as well as general analysis and
trend of activities that characterized the industry within the country.
Although NNPC endeavors to ensure accuracy of information in this
unaudited report, it cannot guarantee 100% accuracy, nor can it be held
liable for errors that may be contained therein. Users are to note that use
of any information herein is purely at their own discretion.

3 NNPC | Monthly Financial and Operations Report April 2020 www.nnpcgroup.com | www.facebook.com/NNPCgroup | www.twitter.com/NNPCgroup
Outline
1.0 Introduction
2.0 National Crude Oil & Natural Gas Production, Lifting and Utilization
3.0 Refinery Operations
4.0 Petroleum Product Supply & Distribution
5.0 Budget Performance Report
6.0 Federation Crude Oil & Gas Revenue
7.0 Key Determinants For Change
8.0 Glossary
4 NNPC | Monthly Financial and Operations Report April 2020 www.nnpcgroup.com | www.facebook.com/NNPCgroup | www.twitter.com/NNPCgroup
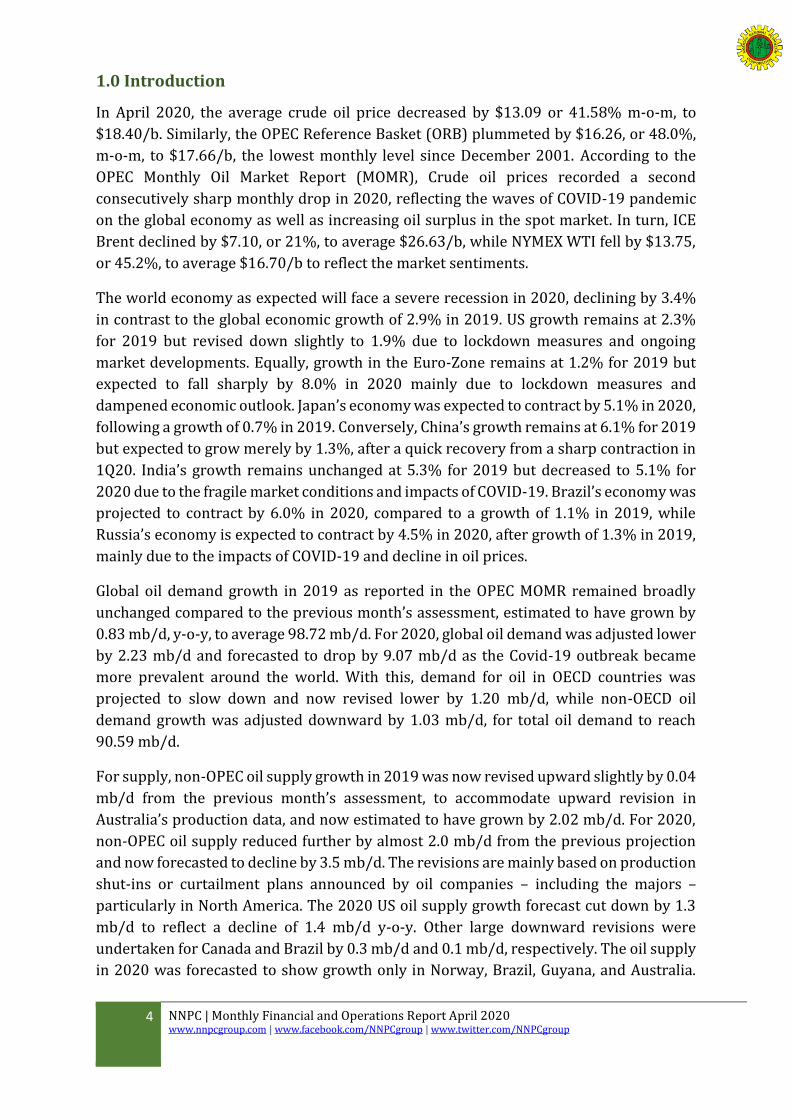
1.0 Introduction
In April 2020, the average crude oil price decreased by $13.09 or 41.58% m-o-m, to
$18.40/b. Similarly, the OPEC Reference Basket (ORB) plummeted by $16.26, or 48.0%,
m-o-m, to $17.66/b, the lowest monthly level since December 2001. According to the
OPEC Monthly Oil Market Report (MOMR), Crude oil prices recorded a second
consecutively sharp monthly drop in 2020, reflecting the waves of COVID-19 pandemic
on the global economy as well as increasing oil surplus in the spot market. In turn, ICE
Brent declined by $7.10, or 21%, to average $26.63/b, while NYMEX WTI fell by $13.75,
or 45.2%, to average $16.70/b to reflect the market sentiments.
The world economy as expected will face a severe recession in 2020, declining by 3.4%
in contrast to the global economic growth of 2.9% in 2019. US growth remains at 2.3%
for 2019 but revised down slightly to 1.9% due to lockdown measures and ongoing
market developments. Equally, growth in the Euro-Zone remains at 1.2% for 2019 but
expected to fall sharply by 8.0% in 2020 mainly due to lockdown measures and
dampened economic outlook. Japan’s economy was expected to contract by 5.1% in 2020,
following a growth of 0.7% in 2019. Conversely, China’s growth remains at 6.1% for 2019
but expected to grow merely by 1.3%, after a quick recovery from a sharp contraction in
1Q20. India’s growth remains unchanged at 5.3% for 2019 but decreased to 5.1% for
2020 due to the fragile market conditions and impacts of COVID-19. Brazil’s economy was
projected to contract by 6.0% in 2020, compared to a growth of 1.1% in 2019, while
Russia’s economy is expected to contract by 4.5% in 2020, after growth of 1.3% in 2019,
mainly due to the impacts of COVID-19 and decline in oil prices.
Global oil demand growth in 2019 as reported in the OPEC MOMR remained broadly
unchanged compared to the previous month’s assessment, estimated to have grown by
0.83 mb/d, y-o-y, to average 98.72 mb/d. For 2020, global oil demand was adjusted lower
by 2.23 mb/d and forecasted to drop by 9.07 mb/d as the Covid-19 outbreak became
more prevalent around the world. With this, demand for oil in OECD countries was
projected to slow down and now revised lower by 1.20 mb/d, while non-OECD oil
demand growth was adjusted downward by 1.03 mb/d, for total oil demand to reach
90.59 mb/d.
For supply, non-OPEC oil supply growth in 2019 was now revised upward slightly by 0.04
mb/d from the previous month’s assessment, to accommodate upward revision in
Australia’s production data, and now estimated to have grown by 2.02 mb/d. For 2020,
non-OPEC oil supply reduced further by almost 2.0 mb/d from the previous projection
and now forecasted to decline by 3.5 mb/d. The revisions are mainly based on production
shut-ins or curtailment plans announced by oil companies – including the majors –
particularly in North America. The 2020 US oil supply growth forecast cut down by 1.3
mb/d to reflect a decline of 1.4 mb/d y-o-y. Other large downward revisions were
undertaken for Canada and Brazil by 0.3 mb/d and 0.1 mb/d, respectively. The oil supply
in 2020 was forecasted to show growth only in Norway, Brazil, Guyana, and Australia.

5 NNPC | Monthly Financial and Operations Report April 2020 www.nnpcgroup.com | www.facebook.com/NNPCgroup | www.twitter.com/NNPCgroup
Overall, OPEC crude oil production in April surged by 1.80 mb/d m-o-m to an average
30.41 mb/d, according to secondary sources.
As reported by the National Bureau of Statistics, Nigeria’s Gross Domestic Product (GDP)
grew by 1.87% (y-o-y) in real terms, in the first quarter of 2020. However, in nominal
terms, the performance recorded in Q1 2020 represents a drop of –0.23% points
compared to Q1 2019 and –0.68% points compared to Q4 2019, reflecting the earliest
effects of COVID-19 disruption, particularly on the non-oil economy. Quarter on quarter,
real GDP growth was –14.27% compared to 5.59% recorded in the preceding quarter.
The oil sector recorded a real growth rate of 5.06% (y-o-y) in Q1 2020 indicating an
increase of 6.51% points relative to the rate recorded in the corresponding quarter of
2019. Yet growth decreased by –1.30% points when compared to Q4 2019 which was
6.36%. Quarter-on-quarter, the oil sector recorded a growth rate of 11.30% in Q1 2020.
Overall, the Oil sector contributed 9.50% to aggregate real GDP in Q1 2020, up from
figures recorded in the corresponding period of 2019 and the preceding quarter, as the
share of the non-oil economy declined.
In March 2020, total crude oil production in Nigeria increased by 3.17 mb or 5.28% at
63.19 mb with daily average of 2.04 mb/d. Production was disrupted by shutdown of the
TFP at Forcados for repairs while Bonny NCTL was shut down due to leaks on ROW near
Boro / Awoba axis. Production was also interrupted at Bonga, Egina, Brass, Erha, Usan,
Amenam, Ogo Ocha and Ima terminals due to lube oil loss, pump issues, loss of power,
riser protector replacement, pipeline repairs and flare management.
National Gas production in April 2020 further increased by 3.73% at 226.51BCF
compared to output in March 2020; translating to an average daily production of
7,786.17mmscfd. Likewise, the daily average natural gas supply to gas power plants
increased by 19.14% to 788mmscfd, equivalent to power generation of 2,873MW.
To ensure continuous increased PMS supply and effective distribution across the country,
a total of 0.94bn litres of PMS translating to 31.37mn liters/day were supplied for the
month; in the downstream sector. The Corporation has continued to diligently monitor
the daily stock of Premium Motor Spirit (PMS) to achieve smooth distribution of
petroleum products and zero fuel queue across the Nation.
This month, a total of 65 pipeline points were vandalized representing about 2.4times
increase from the 19 points recorded in March 2020. ATC-Mosimi accounted for 55%
while Mosimi-Ore recorded 22% and other locations make up for the remaining 23%.
NNPC in collaboration with the local communities and other stakeholders continuously
strive to reduce and eventually eliminate this menace.
This 57th edition of the Report in April 2020 indicates an increased trading deficit of
₦30.81Billion compared to the ₦9.53Billion deficit posted in March 2020. The current
hike of over 200% is attributed to the 29% increased deficit for NPDC due to ongoing
Coronavirus-related impact of reduced exports; coupled with the upsurge in CHQ deficit
6 NNPC | Monthly Financial and Operations Report April 2020 www.nnpcgroup.com | www.facebook.com/NNPCgroup | www.twitter.com/NNPCgroup
arising from terminal benefits made to retired staff. In addition, PPMC, NGMC and Duke
Oil Incorporated posted reduced surpluses arising from the COVID-19 effect of reduced
demand, fluctuating prices and marketers’ unwillingness to lift products thus affecting
revenue. The net result is an increased deficit to the Group.
This report highlights NNPC’s activities for the period of April 2019 to April 2020. In line
with the Corporation’s commitment to becoming more accountable, responsive and
transparent and a FACTI based Organization; the Corporation has continued to sustain
effective communication with stakeholders through this report via publications on its
website and in national dailies. NNPC in return demands continued support from
Nigerians especially in areas of security to achieve zero vandalism of the Nation’s oil &
gas infrastructure.
Activity update
NNPC to Tackle Oil Revenue Shortfall with Production Cost Cuts
NNPC Considers Adopting NLNG Model for Refineries
NNPC Corporate Planning Division Receives ISO Certification in Quality
Management System
Kerosene: FG to Deepen Use of LPG as Substitute
COVID-19: Petroleum Industry’s N21bn Support to be Delivered in Kind

7 NNPC | Monthly Financial and Operations Report April 2020 www.nnpcgroup.com | www.facebook.com/NNPCgroup | www.twitter.com/NNPCgroup
2 National Crude Oil & Natural Gas Production, Lifting and Utilization
2.1 National Crude Oil & Condensate Production
In March 2020, a total of 63.19million barrels of crude oil & condensate were produced
representing an average daily production of 2.04million barrels. This translates to a
decrease of 1.51% in the average daily production compared to February 2020 average
daily performance. Of the March 2020 Production, Joint Ventures (JVs) and Production
Sharing Contracts (PSC) contributed about 34.66% and 40.20% respectively. While AF,
NPDC and Independents accounted for 10.71%, 7.27% and 7.16% respectively. The
tables and charts below provide details of the National Crude Oil Production for the
period March 2019 to March 2020.
Table 2.1.1: Fiscalised National Crude Oil & Condensate Production
JVs PSC AF NPDCIndependent /
Marginal FieldsTotal
Average Daily Production
Barrels Barrels Barrels Barrels Barrels Barrels Barrels
Mar-19 19,064,366 27,013,024 7,724,090 3,894,652 4,968,891 62,665,023 2,021,452
Apr-19 17,520,185 26,579,582 6,731,332 5,676,252 3,518,225 60,025,576 2,000,853
May-19 17,567,593 27,188,983 6,464,447 4,875,061 3,752,830 59,848,914 1,930,610
Jun-19 19,020,901 26,938,093 7,529,665 5,665,192 4,372,525 63,526,377 2,117,546
Jul-19 20,989,993 28,019,860 6,552,738 5,548,452 4,472,661 65,583,704 2,115,603
Aug-19 20,641,210 27,377,512 6,292,482 6,312,535 3,988,244 64,611,984 2,084,258
Sep-19 18,474,136 27,427,606 5,258,304 4,350,850 6,387,716 61,898,612 2,063,287
Oct-19 21,266,847 26,519,528 6,761,513 5,878,606 2,947,843 63,374,338 2,044,333
Nov-19 18,402,011 24,970,450 6,387,164 4,638,276 3,851,588 58,249,489 1,941,650
Dec-19 20,501,440 25,507,750 6,420,300 5,509,484 2,863,809 60,802,783 1,961,380
Jan-20 21,407,353 26,943,371 6,388,285 6,827,648 2,693,737 64,260,394 2,072,916
Feb-20 19,563,126 24,994,553 6,445,960 4,512,437 4,504,573 60,020,649 2,069,678
Mar-20 21,901,436 25,404,808 6,765,485 4,594,710 4,523,944 63,190,383 2,038,399
PTD 256,320,596 344,885,121 85,721,765 68,284,157 52,846,586 808,058,225 2,035,411
Month
Notes: March 2020 Crude Oil figure includes Pure Condensate of 7,856,305 barrels & Spiked Condensate of 2,609,792 barrels.
Crude oil Production is reported 1 month in arrears. Jan – Dec 2019 updated to reconciled figures with DPR and IOCs.
NPDC’s Crude production is based on NPDC’s wholly owned assets and percentage holding in JV assets.
NPDC 60 Series production is included in JVs & MCA production, the volume included in March 2020 is 1,901,820 bbls.
For more details on production by company, streams and well-head productions (Non-Fiscalised) click on these links:
Company streams and well-head respectively.

8 NNPC | Monthly Financial and Operations Report April 2020 www.nnpcgroup.com | www.facebook.com/NNPCgroup | www.twitter.com/NNPCgroup
Chart 2.1.1: Crude Oil & Condensate Production: March ’19 – March ‘20
Chart 2.1.2: Average Daily Crude Oil & Condensate Production & Percentage distribution
Table 2.1.2: NPDC Monthly Crude Oil & Condensate Production
Field/Company YTD Budget
(bbls)Mar-19 Apr-19 May-19 Jun-19 Jul-19 Aug-19 Sep-19 Oct-19 Nov-19 Dec-19 Jan-20 Feb-20 Mar-20 PTD
NPDC Owned Direct Operated Assets Barrels Barrels Barrels Barrels Barrels Barrels Barrels Barrels Barrels Barrels Barrels Barrels Barrels Barrels
Abura OML 65 2,264,163 195,904 198,851 35,716 1,242,635 91,927 146,551 204,821 173,298 16,695 124,951 170,607 50,544 37,210 2,689,708
Oredo OML 111 2,502,500 192,692 201,231 248,611 228,718 246,473 263,086 263,005 130,630 157,251 229,249 243,710 192,512 164,176 2,761,345
Oziengbe OML 111 678,337 0 0 279,221 0 0 0 0 0 0 0 7,500 5,999 292,721
Okono_Okpoho OML 119 15,574,163 547,344 534,892 544,066 0 511,745 504,810 482,736 495,160 489,457 412,063 461,063 429,716 445,380 5,858,433
Brass OML 60-63 - 0 1,251,210 1,114,874 384,729 1,326,340 2,035,458 0 1,729,923 865,463 1,094,445 0 1,090,182 1,126,367 12,018,991
SUB-TOTAL 21,019,163 935,940 2,186,184 1,943,267 2,135,303 2,176,485 2,949,905 950,562 2,529,010 1,528,867 1,860,708 875,379 1,770,455 1,779,132 23,621,197
NPDC JV Direct Operated Assets
Block
Ogini_Isoko/FHN OML 26 1,457,500 74,836 138,030 84,842 131,464 139,689 156,707 140,256 151,953 180,866 178,377 285,518 112,213 120,673 1,895,424
NPDC/Uzere OML 28 614,997 0 0 0 0 0 0 0 0 0 0 0 0 2,485 2,485
Opuama/Elcrest OML 40 751,663 234,203 393,530 358,076 323,996 285,836 309,953 273,574 334,096 218,437 456,739 470,930 364,347 480,798 4,504,513
Batan_Odidi/Neconde OML 42 2,731,663 806,658 704,977 626,280 869,746 861,196 604,618 754,558 635,546 547,834 511,220 1,361,182 726,967 770,823 9,781,604
Afiesere_Kokori/Shoreline OML 30 6,737,500 904,518 1,118,615 947,255 1,077,375 1,110,506 1,234,239 1,206,716 1,219,297 1,151,412 1,328,908 1,765,692 618,874 678,057 14,361,463
Utorogu_Ughelli/NDW OML 34 3,125,837 273,517 310,569 204,540 294,203 202,021 168,980 278,817 244,254 143,220 256,656 342,414 167,897 199,062 3,086,151
SUB-TOTAL 15,419,160 2,293,732 2,665,722 2,220,992 2,696,784 2,599,248 2,474,497 2,653,920 2,585,146 2,241,769 2,731,898 4,225,736 1,990,298 2,251,897 33,631,640 0.4925 11,097,183 OBEN_Amukpe_Sapele/SEPLAT
OBEN_Amukpe_Sapele/SEPLAT OML 4,38&41 28,242,500 664,980 824,347 710,801 833,105 772,720 888,133 746,367 764,450 867,640 916,878 1,726,533 751,684 563,681 11,031,320
SUB-TOTAL 28,242,500 664,980 824,347 710,801 833,105 772,720 888,133 746,367 764,450 867,640 916,878 1,726,533 751,684 563,681 11,031,320
GRAND TOTAL 64,680,823 3,894,652 5,676,252 4,875,061 5,665,192 5,548,452 6,312,535 4,350,850 5,878,606 4,638,276 5,509,484 6,827,648 4,512,437 4,594,710 68,284,157
NPDC JV Non-Operated Assets
Average Daily Production 141,844 125,634 189,208 157,260 188,840 178,982 203,630 145,028 189,632 154,609 177,725 220,247 155,601 148,216 172,000
19.1 17.5 17.6 19.0 21.0 20.6 18.5 21.3 18.4 20.5 21.4 19.6 21.9
27.0 26.6 27.2 26.928.0 27.4 27.4
26.525.0
25.5 26.925.0
25.4
7.76.7 6.5 7.5
6.6 6.35.3
6.86.4
6.46.4
6.46.8
62.67 60.03 59.85 63.53 65.58 64.61 61.90 63.37 58.2560.80 64.26 60.02 63.19
0
10
20
30
40
50
60
70
Mar-19 Apr-19 May-19 Jun-19 Jul-19 Aug-19 Sep-19 Oct-19 Nov-19 Dec-19 Jan-20 Feb-20 Mar-20
Total Monthly Crude Oil & Condensate Production (Million Barrels)
JVs PSC AF NPDC Independent / Marginal Fields
2.02 2.00 1.932.12 2.12 2.08 2.06 2.04
1.94 1.962.07 2.07 2.04
0.0
0.5
1.0
1.5
2.0
2.5
Average Daily Crude Oil & Condensate Production (Million Barrels/Day)
31.7%
42.7%
10.6%
8%6%
PTD Percentage Distribution of Crude Oil Production by Commercial Arrangements
JVs
PSC
AF
NPDC
Independent /Marginal Fields

9 NNPC | Monthly Financial and Operations Report April 2020 www.nnpcgroup.com | www.facebook.com/NNPCgroup | www.twitter.com/NNPCgroup
The NPDC March 2019 to March 2020 cumulative production from all fields totaled
68,035,870 barrels of crude oil translating to an average daily production of 172,000
barrels per day. Comparing PTD NPDC performance to National Production, the
Company’s production share is 8.45%. NPDC is projected to ramp-up production level to
250,000bp/d in the near future. PTD from NPDC wholly operated assets amounted to
23,621,197 barrels (or 34.59% of the total NPDC production) with Okono Okpoho (OML
119) alone producing 24.80% of the NPDC wholly owned operated assets and 8.58% of
the total NPDC production. Also, on the NPDC operated JV assets, in which NPDC owns
55% controlling interest, crude oil production amounted to 33,631,640 barrels (or
49.25% of the NPDC total production). On the non-operated assets, production level
stood at 11,031,320 barrels or 16.16% of the Company’s production.
Chart 2.1.3 NPDC Monthly Crude Oil & Condensate Production
Chart 2.1.4 NPDC Monthly Average Daily Crude Production by Field
936
2,186 1,943 2,135 2,1762,950
951
2,529
1,529 1,861
875
1,770 1,779
2,294
2,666
2,2212,697 2,599
2,474
2,654
2,585
2,242
2,7324,226
1,990 2,252
665
824
711
833 773
888
746
764
868
917
1,727
752 5643,895
5,676
4,875
5,665 5,548
6,313
4,351
5,879
4,638
5,509
6,828
4,512 4,595
0
1,000
2,000
3,000
4,000
5,000
6,000
7,000
8,000
Mar-19 Apr-19 May-19 Jun-19 Jul-19 Aug-19 Sep-19 Oct-19 Nov-19 Dec-19 Jan-20 Feb-20 Mar-20
NPDC Crude Monthly Production (Thousand Barrels)
NPDC Owned Direct Operated Assets NPDC JV Direct Operated Assets
126
189
157
189179
204
145
190
155
178
220
156148
0
50
100
150
200
250
NPDC Average Daily Crude Oil Production(Thousand Barrels/Day)
293
1,895
2,761
2,690
4,505
3,086
5,858
9,765
9,926
11,031
0 4,000 8,000 12,000
Oziengbe
Ogini_Isoko/FHN
Oredo
Abura
Opuama/Elcrest
Utorogu_Ughelli/NDW
Okono_Okpoho
Afiesere_Kokori/Shoreline
Batan_Odidi/Neconde
OBEN_Amukpe_Sapele/S…
NPDC PTD Ranking by Field (Thousand Barrels)

10 NNPC | Monthly Financial and Operations Report April 2020 www.nnpcgroup.com | www.facebook.com/NNPCgroup | www.twitter.com/NNPCgroup
2.2. National Gas Production
A total of 226.51 Billion Cubic Feet (BCF) of natural gas was produced in the month of
April 2020 translating to an average daily production of 7,786.17 Million Standard Cubic
Feet per Day (mmscfd). For the period April 2019 to April 2020, a total of 3,082.91 BCF
of gas was produced representing an average daily production of 7,857.18 mmscfd during
the period. Period-to-date Production from Joint Ventures (JVs), Production Sharing
Contracts (PSCs) and NPDC contributed about 69.57%, 21.46% and 8.97% respectively
to the total national gas production. The tables and charts overleaf provide details of the
national gas production for the period April 2019 to April 2020.
Table 2.2.1: National Gas Production by Regime
Total Monthly Production Daily Average Production
JV PSC NPDC TOTAL
BCF BCF BCF BCF
Apr-19 173.34 56.29 25.44 255.08
May-19 146.79 52.10 24.84 223.73
Jun-19 148.41 51.42 24.16 223.98
Jul-19 177.84 53.64 21.87 253.35
Aug-19 175.72 52.95 19.05 247.72
Sep-19 160.09 53.66 21.38 235.12
Oct-19 165.35 51.85 19.07 236.27
Nov-19 162.69 46.60 19.36 228.65
Dec-19 167.34 50.28 21.68 239.29
Jan-20 176.09 54.82 22.19 253.09
Feb-20 170.84 50.94 19.96 241.74
Mar-20 156.52 45.38 16.47 218.37
Apr-20 163.73 41.65 21.14 226.51
Total 2,144.73 661.56 276.62 3,082.91
PERIOD
JV PSC NPDC TOTALmmscfd mmscfd mmscfd mmscfd
Apr-19 5,778.09 1,876.31 848.14 8,502.54
May-19 4,893.09 1,736.49 801.38 7,430.96
Jun-19 4,946.80 1,713.90 805.39 7,466.09
Jul-19 5,736.81 1,730.32 705.58 8,172.70
Aug-19 5,668.22 1,708.10 614.63 7,990.95
Sep-19 5,336.22 1,788.60 712.60 7,837.42
Oct-19 5,334.00 1,673.00 615.00 7,622.00
Nov-19 5,423.06 1,553.27 645.35 7,621.68
Dec-19 5,397.90 1,621.80 699.29 7,718.99
Jan-20 5,680.18 1,768.26 715.79 8,164.23
Feb-20 5,890.92 1,756.60 688.40 8,335.92
Mar-20 5,397.33 1,564.98 531.34 7,493.65
Apr-20 5,645.78 1,436.08 704.31 7,786.17
Average 5,471.42 1,686.75 699.01 7,857.18
PERIOD
Chart 2.2.1: Average Daily National Gas Production for the period
5,7784,893 4,947
5,737 5,668 5,336 5,334 5,423 5,398 5,680 5,891 5,397 5,646
1,876
1,736 1,714
1,730 1,7081,789 1,673 1,553 1,622
1,768 1,7571,565 1,436
848
801 805
706 615 713 615 645 699716 688
531 704
8,503
7,431 7,466
8,173 7,991 7,837 7,622 7,622 7,7198,164 8,336
7,494 7,786
0.00
1,000.00
2,000.00
3,000.00
4,000.00
5,000.00
6,000.00
7,000.00
8,000.00
9,000.00
10,000.00
Apr-19 May-19 Jun-19 Jul-19 Aug-19 Sep-19 Oct-19 Nov-19 Dec-19 Jan-20 Feb-20 Mar-20 Apr-20
Average Daily National Gas Production (mmscfd)
JV PSC NPDC

11 NNPC | Monthly Financial and Operations Report April 2020 www.nnpcgroup.com | www.facebook.com/NNPCgroup | www.twitter.com/NNPCgroup
Chart 2.2.2: Monthly National Gas Production & Percentage Distribution
2.3 Crude Oil & Condensate Lifting & utilization
In March 2020, a total volume of 62.25 million barrels of crude oil and condensate was
lifted by all parties. Out of this volume, 20.79 million barrels was lifted by NNPC on behalf
of the Federation. This comprises 14.90 million barrels lifted on the account of NNPC
(Domestic and Federation Export) while 5.89 million barrels were superintended for
FIRS and none for DPR.
Table 2.3.1: Crude Oil & Condensate Lifting and utilization
NNPC
Barrels Barrels Barrels Barrels Barrels Barrels Barrels Barrels BarrelsMar-19 2,847,027 1,635,562 5,085,876 5,783,416 10,869,292 15,351,881 39,473,600 3,844,913 58,670,394Apr-19 5,776,491 411,977 6,259,548 9,487,883 15,747,431 21,935,899 38,448,458 3,170,082 63,554,439May-19 3,221,008 899,160 3,471,348 8,069,842 11,541,190 15,661,358 40,858,616 2,031,249 58,551,223Jun-19 2,645,264 2,121,765 3,743,417 10,955,223 14,698,640 19,465,669 42,407,067 2,040,752 63,913,488Jul-19 5,027,810 1,032,618 2,403,119 7,932,679 10,335,798 16,396,226 43,102,152 1,497,280 60,995,658Aug-19 2,820,098 1,101,850 4,419,247 11,557,171 15,976,418 19,898,366 44,305,889 2,380,704 66,584,959Sep-19 6,027,754 800,077 6,197,366 10,665,632 16,862,998 23,690,829 40,747,618 1,005,552 65,443,999Oct-19 5,726,139 800,000 6,131,393 9,560,513 15,691,906 22,218,045 41,797,923 669,000 64,684,968Nov-19 2,918,727 271,100 2,161,697 8,621,658 10,783,355 13,973,182 40,058,189 3,826,181 57,857,552Dec-19 4,128,158 241,353 4,891,148 9,033,535 13,924,683 18,294,194 38,300,717 2,719,717 59,314,628Jan-20 4,799,535 1,177,342 4,382,017 11,732,866 16,114,883 22,091,760 37,786,815 1,309,781 61,188,356Feb-20 5,282,779 0 3,154,891 9,557,710 12,712,601 17,995,380 41,164,285 1,117,319 60,276,984Mar-20 5,282,214 612,018 5,407,419 9,489,602 14,897,021 20,791,253 38,818,610 2,637,070 62,246,933
TOTAL 56,503,004 11,104,822 57,708,486 122,447,730 180,156,216 247,764,042 527,269,939 28,249,600 803,283,581
NIGERIAN GOVERNMENT
FIRS (PSC)AF GRAND TOTAL
DPR (PSC)SUB-TOTAL
GOVERNMENT LIFTING
FEDERATION EXPORT
SUB-TOTAL (NNPC)
IOCs & INDEPENDENTS
(INC. NPDC)DOMESTIC LIFTING MONTH
Notes: Crude oil lifting is reported one month in arrears
For more details on crude oil lifting under each AF lifting arrangement and MCA performance analysis
follow the link
255
224 224
253 248235 236
229239
253242
218227
0
50
100
150
200
250
300
Total Monthly Natural Gas Production (BCF)
69.6%
21.5%
9.0%
Percentage Distribution of Upstream Gas Production-
April '19 - April '20 Average
JV
PSC
NPDC
12 NNPC | Monthly Financial and Operations Report April 2020 www.nnpcgroup.com | www.facebook.com/NNPCgroup | www.twitter.com/NNPCgroup
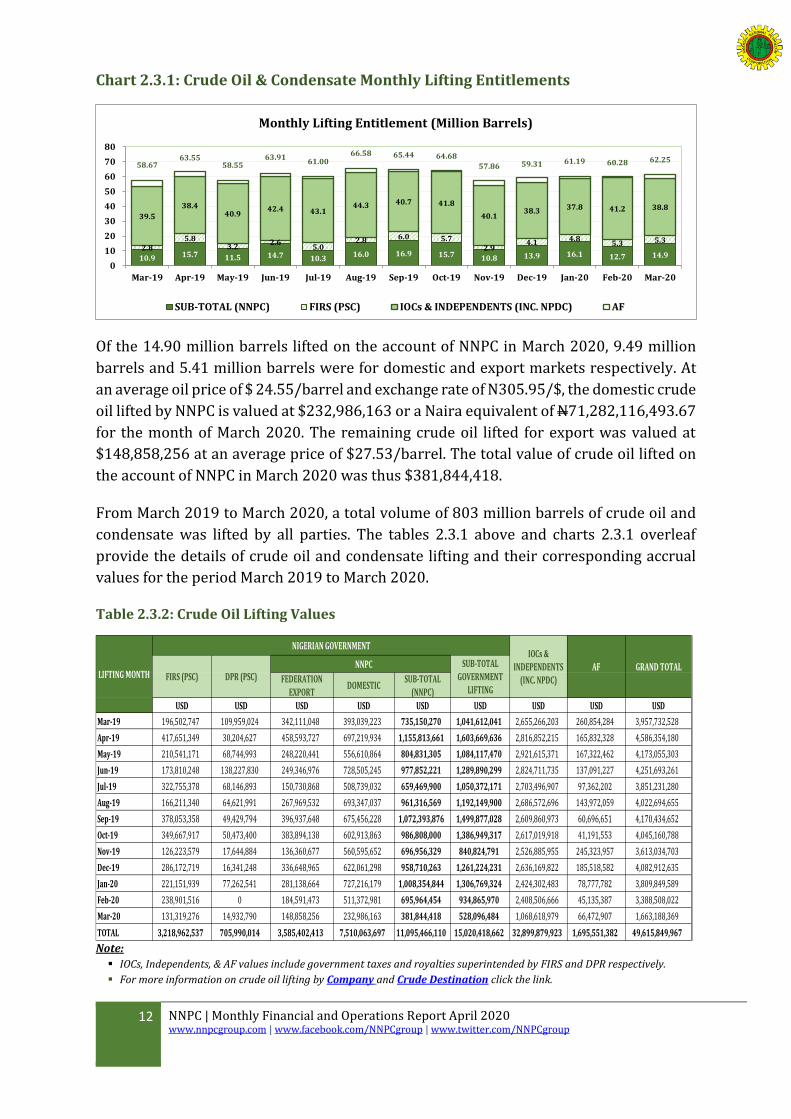
Chart 2.3.1: Crude Oil & Condensate Monthly Lifting Entitlements
Of the 14.90 million barrels lifted on the account of NNPC in March 2020, 9.49 million
barrels and 5.41 million barrels were for domestic and export markets respectively. At
an average oil price of $ 24.55/barrel and exchange rate of N305.95/$, the domestic crude
oil lifted by NNPC is valued at $232,986,163 or a Naira equivalent of N71,282,116,493.67
for the month of March 2020. The remaining crude oil lifted for export was valued at
$148,858,256 at an average price of $27.53/barrel. The total value of crude oil lifted on
the account of NNPC in March 2020 was thus $381,844,418.
From March 2019 to March 2020, a total volume of 803 million barrels of crude oil and
condensate was lifted by all parties. The tables 2.3.1 above and charts 2.3.1 overleaf
provide the details of crude oil and condensate lifting and their corresponding accrual
values for the period March 2019 to March 2020.
Table 2.3.2: Crude Oil Lifting Values
NNPC
USD USD USD USD USD USD USD USD USD
Mar-19 196,502,747 109,959,024 342,111,048 393,039,223 735,150,270 1,041,612,041 2,655,266,203 260,854,284 3,957,732,528
Apr-19 417,651,349 30,204,627 458,593,727 697,219,934 1,155,813,661 1,603,669,636 2,816,852,215 165,832,328 4,586,354,180
May-19 210,541,171 68,744,993 248,220,441 556,610,864 804,831,305 1,084,117,470 2,921,615,371 167,322,462 4,173,055,303
Jun-19 173,810,248 138,227,830 249,346,976 728,505,245 977,852,221 1,289,890,299 2,824,711,735 137,091,227 4,251,693,261
Jul-19 322,755,378 68,146,893 150,730,868 508,739,032 659,469,900 1,050,372,171 2,703,496,907 97,362,202 3,851,231,280
Aug-19 166,211,340 64,621,991 267,969,532 693,347,037 961,316,569 1,192,149,900 2,686,572,696 143,972,059 4,022,694,655
Sep-19 378,053,358 49,429,794 396,937,648 675,456,228 1,072,393,876 1,499,877,028 2,609,860,973 60,696,651 4,170,434,652
Oct-19 349,667,917 50,473,400 383,894,138 602,913,863 986,808,000 1,386,949,317 2,617,019,918 41,191,553 4,045,160,788
Nov-19 126,223,579 17,644,884 136,360,677 560,595,652 696,956,329 840,824,791 2,526,885,955 245,323,957 3,613,034,703
Dec-19 286,172,719 16,341,248 336,648,965 622,061,298 958,710,263 1,261,224,231 2,636,169,822 185,518,582 4,082,912,635
Jan-20 221,151,939 77,262,541 281,138,664 727,216,179 1,008,354,844 1,306,769,324 2,424,302,483 78,777,782 3,809,849,589
Feb-20 238,901,516 0 184,591,473 511,372,981 695,964,454 934,865,970 2,408,506,666 45,135,387 3,388,508,022
Mar-20 131,319,276 14,932,790 148,858,256 232,986,163 381,844,418 528,096,484 1,068,618,979 66,472,907 1,663,188,369
TOTAL 3,218,962,537 705,990,014 3,585,402,413 7,510,063,697 11,095,466,110 15,020,418,662 32,899,879,923 1,695,551,382 49,615,849,967
IOCs & INDEPENDENTS
(INC. NPDC)LIFTING MONTH
NIGERIAN GOVERNMENT
SUB-TOTAL (NNPC)
DOMESTIC
SUB-TOTAL GOVERNMENT
LIFTINGFEDERATION
EXPORT
AF GRAND TOTALFIRS (PSC) DPR (PSC)
Note:
IOCs, Independents, & AF values include government taxes and royalties superintended by FIRS and DPR respectively.
For more information on crude oil lifting by Company and Crude Destination click the link.
10.9 15.7 11.5 14.7 10.316.0 16.9 15.7 10.8 13.9 16.1 12.7 14.9
2.85.8
3.22.6
5.02.8 6.0 5.7
2.94.1 4.8
5.3 5.3
39.5
38.440.9
42.4 43.144.3 40.7 41.8
40.138.3 37.8 41.2 38.8
58.6763.55
58.5563.91
61.0066.58 65.44 64.68
57.86 59.31 61.19 60.28 62.25
0
10
20
30
40
50
60
70
80
Mar-19 Apr-19 May-19 Jun-19 Jul-19 Aug-19 Sep-19 Oct-19 Nov-19 Dec-19 Jan-20 Feb-20 Mar-20
Monthly Lifting Entitlement (Million Barrels)
SUB-TOTAL (NNPC) FIRS (PSC) IOCs & INDEPENDENTS (INC. NPDC) AF

13 NNPC | Monthly Financial and Operations Report April 2020 www.nnpcgroup.com | www.facebook.com/NNPCgroup | www.twitter.com/NNPCgroup
Chart 2.3.2: Government Crude Oil Lifting and utilization on Account of NNPC
2.4 Utilization of Crude Oil for Domestic Product Supply
In March 2020, NNPC lifted 9,489,602 barrels of crude oil from the daily allocation for
domestic utilization translating to an average volume of 306,116 barrels of oil per day in
terms of performance. In order to meet domestic product supply requirement for the
month of March 2020, the entire 9,489,602 barrels were processed under the Direct-
Sales-Direct Purchase (DSDP) scheme while no deliveries to the domestic refineries for
processing. Tables and charts below provide details of NNPC’s Utilization of Crude Oil for
Domestic Product Supply for the period, March 2019 to March 2020.
Table 2.4.1: Domestic Crude Purchased By NNPC from Federation
Volume Ave. Price Sales Value Sales Value Average Lifting
Barrels $/bbl USD NGN Barrels Per Day
Mar-19 5,783,416.00 67.96 393,039,222.71 120,211,046,266.77 186,561.81
Apr-19 9,487,883.00 73.49 697,219,933.82 213,314,438,751.62 316,262.77
May-19 8,069,842.00 68.97 556,610,864.34 170,295,093,943.29 260,317.48
Jun-19 10,955,223.00 66.50 728,505,244.79 222,886,179,643.20 365,174.10
Jul-19 7,932,679.00 64.13 508,739,031.81 155,623,269,830.37 255,892.87
Aug-19 11,557,171.00 59.99 693,347,036.95 212,060,191,251.77 372,811.97
Sep-19 10,665,632.00 63.33 675,456,227.68 206,689,605,668.55 355,521.07
Oct-19 9,560,513.00 63.06 602,913,862.53 184,491,641,934.48 308,403.65
Nov-19 8,621,658.00 65.02 560,595,651.62 171,542,269,396.33 287,388.60
Dec-19 9,033,535.00 68.86 622,061,297.78 190,350,757,121.60 291,404.35
Jan-20 11,732,866.00 61.98 727,216,179.36 222,528,150,883.85 378,479.55
Feb-20 9,557,710.00 53.50 511,372,981.00 184,094,273,158.92 329,576.21
Mar-20 9,489,602.00 24.55 232,986,162.75 71,282,116,493.67 306,116.19
Total/Ave 122,447,730.00 61.33 7,510,063,697.13 2,325,369,034,344.42 308,432.57
Period
5.8
9.58.1
11.0
7.9
11.6 10.79.6 8.6 9.0
11.79.6 9.5
5.1
6.3
3.5
3.7
2.4
4.4 6.26.1
2.2
4.9
4.4
3.25.410.87
15.75
11.54
14.70
10.34
15.98 16.86 15.69
10.78
13.92
16.11
12.71
14.90
0
2
4
6
8
10
12
14
16
18
Mar-19 Apr-19 May-19 Jun-19 Jul-19 Aug-19 Sep-19 Oct-19 Nov-19 Dec-19 Jan-20 Feb-20 Mar-20
Government Crude Oil Lifting & Utilization (Million Barrels)
DOMESTIC FEDERATION EXPORT

14 NNPC | Monthly Financial and Operations Report April 2020 www.nnpcgroup.com | www.facebook.com/NNPCgroup | www.twitter.com/NNPCgroup
Table 2.4.2: Breakdown of NNPC Utilization of Crude oil for Domestic Product Supply
Qty ('000 Bbls) Value in US$'Mn Naira'Mn Qty ('000 Bbls) Value in US$'Mn Naira'Mn Qty ('000 Bbls) Value in US$'Mn Naira'Mn
Mar-19 996.90 68.86 21,059.62 7,681.44 521.45 159,484.19 8,678.35 590.30 180,543.82
Apr-19 0.00 0.00 0.00 14,284.19 1,042.99 319,101.57 14,284.19 1,042.99 319,101.57
May-19 430.09 29.38 8,990.33 11,162.00 757.33 231,706.60 11,592.09 786.72 240,696.93
Jun-19 0.00 0.00 0.00 13,829.17 918.06 280,879.16 13,829.17 918.06 280,879.16
Jul-19 0.00 0.00 0.00 12,728.27 814.21 249,147.16 12,728.27 814.21 249,147.16
Aug-19 0.00 0.00 0.00 15,374.46 917.94 280,751.62 15,374.46 917.94 280,751.62
Sep-19 0.00 0.00 0.00 14,490.43 917.05 280,616.06 14,490.43 917.05 280,616.06
Oct-19 0.00 0.00 0.00 15,286.65 952.58 291,490.02 15,286.65 952.58 291,490.02
Nov-19 0.00 0.00 0.00 12,490.35 807.61 247,127.50 12,490.35 807.61 247,127.50
Dec-19 0.00 0.00 0.00 14,817.73 1,020.92 312,401.23 14,817.73 1,020.92 312,401.23
Jan-20 0.00 0.00 0.00 17,598.01 1,086.68 332,469.60 17,598.01 1,086.68 332,469.60
Feb-20 0.00 0.00 0.00 14,376.47 781.23 239,015.82 14,376.47 781.23 239,015.82
Mar-20 0.00 0.00 0.00 13,824.96 340.66 104,223.91 13,824.96 340.66 104,223.91
PTD 1,426.99 98.24 30,049.95 177,944.13 10,878.68 3,328,414.45 179,371.12 10,976.92 3,358,464.40
Month
TOTAL DELIVERIES TO REFINERIES DIRECT SALES DIRECT PURCHASE - JV/PSC (Domestic)+FIRS-PPT+EXTENDED
Notes:
DSDP has been adjusted to include daily crude allocation from Federation (Domestic), FIRS-PPT Crude & Extended DSDP. This is reported retrospectively from July 2018.
Chart 2.4.1: NNPC Crude Oil Utilization for Domestic Product Supply
Chart 2.4.2: Percentage Distribution for March 2020 Domestic Crude Utilization
7.7
14.3
11.213.8 12.7
15.4
14.5
15.3
12.514.8
17.6
14.3 13.81.00
-
0.43
--
--
-
-
-
-
- -
8.7
14.3
11.6
13.812.7
15.414.5
15.3
12.5
14.813.8
-
2.00
4.00
6.00
8.00
10.00
12.00
14.00
16.00
18.00
20.00
Mar-19 Apr-19 May-19 Jun-19 Jul-19 Aug-19 Sep-19 Oct-19 Nov-19 Dec-19 Jan-20 Feb-20 Mar-20
NNPC Crude Oil Utilisation For Domestic Product Supply (Million Barrels)
DSDP REFINERY DIRECT EXPORT
14.3
17.6
100.0%
March 2020 Crude Oil Utilization For Domestic Product Consumption
REFINERY
DSDP
DIRECTEXPORT
0.0%
1.4%
98.6%
0.0%
PTD Crude Oil Utilization For Domestic Product Consumption
REFINERY
DSDP
DIRECTEXPORT

15 NNPC | Monthly Financial and Operations Report April 2020 www.nnpcgroup.com | www.facebook.com/NNPCgroup | www.twitter.com/NNPCgroup
2.5 Natural Gas Off take, Commercialization & Utilization
Out of the 226.51 BCF of gas supplied in April 2020, a total of 136.44 BCF of gas was
commercialized consisting of 36.99 BCF and 99.45 BCF for the domestic and export
market respectively as shown in Table 2.5.1 below. This translates to a total supply of
1,233.01 mmscfd of gas to the domestic market and 3,425.98 mmscfd of gas supplied to
the export market for the month as shown in Table 2.5.2 on page 16.
This implies that 59.86% of the average daily gas produced was commercialized while
the balance of 40.14% was re-injected, used as upstream fuel gas or flared. Gas flare rate
was 7.93% for the month under review i.e. 617.32 mmscfd compared with average Gas
flare rate of 8.30 % i.e. 652.48 mmscfd for the period April 2019 to April 2020.
Table 2.5.1: Total Gas Commercialization and utilization
Domestic Gas To
Power
Domestic Gas to
Industry
Total Domestic Gas
SupplyWAPG EGTL NGL/ LPG NLNG Total Export Gas
BCF BCF BCF BCF BCF BCF BCF BCF BCF BCF BCF BCF BCF
Apr-19 20.38 14.52 34.89 1.90 7.59 3.47 97.99 110.96 68.84 12.28 24.82 105.94 251.79
May-19 21.32 14.93 36.25 2.11 7.13 3.72 75.08 88.04 65.05 12.02 19.84 96.92 221.21
Jun-19 21.03 14.66 35.69 2.43 7.41 3.72 78.17 91.73 64.16 12.34 18.12 94.62 222.04
Jul-19 20.44 14.02 34.45 2.70 5.11 4.03 99.64 111.47 69.89 13.11 20.47 103.47 249.39
Aug-19 20.50 15.77 36.27 3.47 2.90 2.77 105.81 114.95 65.72 12.37 21.66 99.75 250.98
Sep-19 17.84 14.41 32.25 2.43 0.53 2.35 98.07 103.38 67.94 11.61 19.94 99.49 235.12
Oct-19 17.15 14.22 31.37 2.57 0.00 2.13 98.90 103.60 70.34 13.00 17.52 100.86 235.82
Nov-19 19.34 15.96 35.29 1.98 1.35 2.48 95.93 101.73 60.83 11.89 18.97 91.70 228.72
Dec-19 18.48 16.29 34.78 2.87 5.44 2.00 103.24 113.54 59.58 11.94 18.54 90.05 238.37
Jan-20 19.83 16.37 36.20 2.54 6.48 3.08 102.86 114.96 68.64 12.65 19.95 101.24 252.39
Feb-20 20.27 15.56 35.83 1.50 8.10 3.31 97.79 110.71 63.97 11.65 18.27 93.89 240.42
Mar-20 19.17 14.28 33.45 2.05 7.59 3.29 74.35 87.28 64.97 11.61 19.71 96.28 217.01
Apr-20 23.63 13.36 36.99 2.83 5.70 3.60 87.31 99.45 60.69 11.99 17.90 90.58 227.01
Total 259.37 194.34 453.71 31.38 65.32 39.96 1,215.13 1,351.79 850.62 158.44 255.72 1,264.78 3,070.28
Grand TotalPeriod
Non-Commercialized Gas
Re-Injection Fuel Gas FlareTotal Non-
Commerialized Gas
Domestic Gas Export Gas
Gas Commercialisation
Note: For more details on Gas Lifting follow this link
Total gas supply for the period April 2019 to April 2020 stood at 3,070.28 BCF out of
which 453.71 BCF and 1,351.79 BCF were commercialized for the domestic and export
market respectively. Gas re–injected, Fuel gas and Gas flared stood at 1,264.78 BCF. The
table 2.5.1 and chart 2.5.1 provides more details of the gas utilization and
commercialization for the period April 2019 to April 2020.
16 NNPC | Monthly Financial and Operations Report April 2020 www.nnpcgroup.com | www.facebook.com/NNPCgroup | www.twitter.com/NNPCgroup
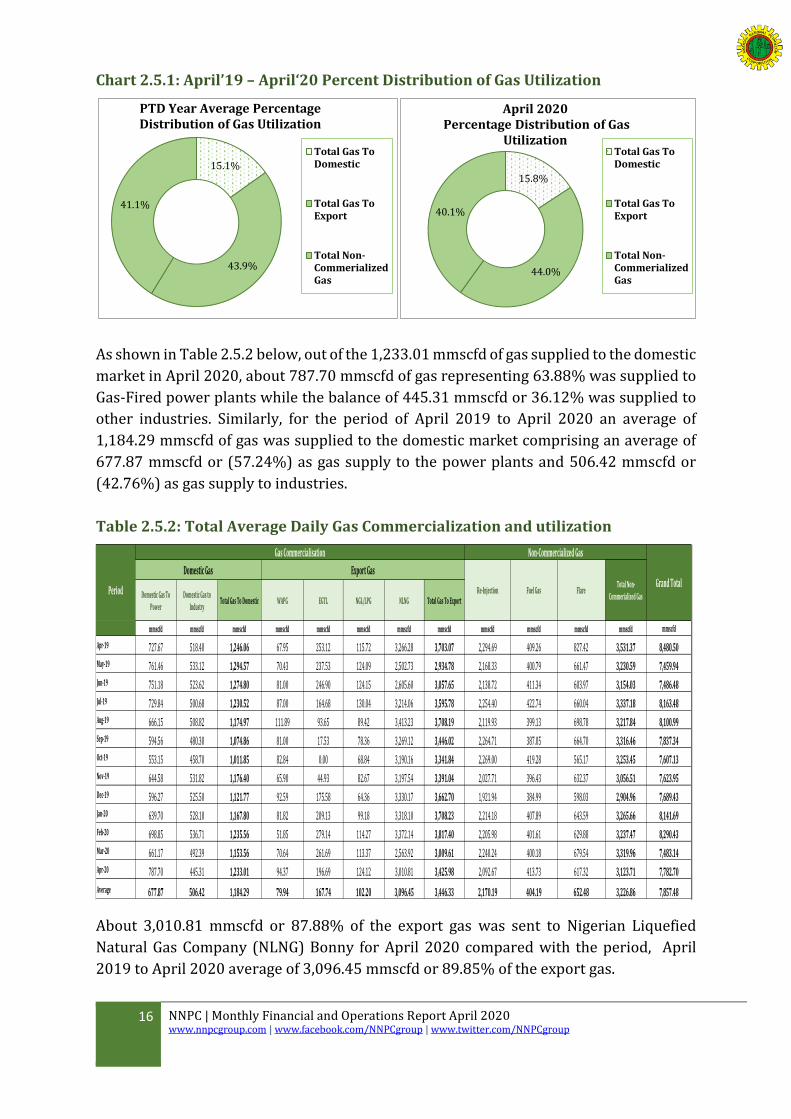
Chart 2.5.1: April’19 – April‘20 Percent Distribution of Gas Utilization
As shown in Table 2.5.2 below, out of the 1,233.01 mmscfd of gas supplied to the domestic
market in April 2020, about 787.70 mmscfd of gas representing 63.88% was supplied to
Gas-Fired power plants while the balance of 445.31 mmscfd or 36.12% was supplied to
other industries. Similarly, for the period of April 2019 to April 2020 an average of
1,184.29 mmscfd of gas was supplied to the domestic market comprising an average of
677.87 mmscfd or (57.24%) as gas supply to the power plants and 506.42 mmscfd or
(42.76%) as gas supply to industries.
Table 2.5.2: Total Average Daily Gas Commercialization and utilization
Domestic Gas To
Power
Domestic Gas to
IndustryTotal Gas To Domestic WAPG EGTL NGL/LPG NLNG Total Gas To Export
mmscfd mmscfd mmscfd mmscfd mmscfd mmscfd mmscfd mmscfd mmscfd mmscfd mmscfd mmscfd mmscfd
Apr-19 727.67 518.40 1,246.06 67.95 253.12 115.72 3,266.28 3,703.07 2,294.69 409.26 827.42 3,531.37 8,480.50
May-19 761.46 533.12 1,294.57 70.43 237.53 124.09 2,502.73 2,934.78 2,168.33 400.79 661.47 3,230.59 7,459.94
Jun-19 751.18 523.62 1,274.80 81.00 246.90 124.15 2,605.60 3,057.65 2,138.72 411.34 603.97 3,154.03 7,486.48
Jul-19 729.84 500.68 1,230.52 87.00 164.68 130.04 3,214.06 3,595.78 2,254.40 422.74 660.04 3,337.18 8,163.48
Aug-19 666.15 508.82 1,174.97 111.89 93.65 89.42 3,413.23 3,708.19 2,119.93 399.13 698.78 3,217.84 8,100.99
Sep-19 594.56 480.30 1,074.86 81.00 17.53 78.36 3,269.12 3,446.02 2,264.71 387.05 664.70 3,316.46 7,837.34
Oct-19 553.15 458.70 1,011.85 82.84 0.00 68.84 3,190.16 3,341.84 2,269.00 419.28 565.17 3,253.45 7,607.13
Nov-19 644.58 531.82 1,176.40 65.90 44.93 82.67 3,197.54 3,391.04 2,027.71 396.43 632.37 3,056.51 7,623.95
Dec-19 596.27 525.50 1,121.77 92.59 175.58 64.36 3,330.17 3,662.70 1,921.94 384.99 598.03 2,904.96 7,689.43
Jan-20 639.70 528.10 1,167.80 81.82 209.13 99.18 3,318.10 3,708.23 2,214.18 407.89 643.59 3,265.66 8,141.69
Feb-20 698.85 536.71 1,235.56 51.85 279.14 114.27 3,372.14 3,817.40 2,205.98 401.61 629.88 3,237.47 8,290.43
Mar-20 661.17 492.39 1,153.56 70.64 261.69 113.37 2,563.92 3,009.61 2,240.24 400.18 679.54 3,319.96 7,483.14
Apr-20 787.70 445.31 1,233.01 94.37 196.69 124.12 3,010.81 3,425.98 2,092.67 413.73 617.32 3,123.71 7,782.70
Average 677.87 506.42 1,184.29 79.94 167.74 102.20 3,096.45 3,446.33 2,170.19 404.19 652.48 3,226.86 7,857.48
Total Non-
Commerialized Gas
Gas Commercialisation
Export GasDomestic GasGrand Total
Non-Commercialized Gas
Re-Injection Fuel Gas FlarePeriod
About 3,010.81 mmscfd or 87.88% of the export gas was sent to Nigerian Liquefied
Natural Gas Company (NLNG) Bonny for April 2020 compared with the period, April
2019 to April 2020 average of 3,096.45 mmscfd or 89.85% of the export gas.
15.1%
43.9%
41.1%
PTD Year Average Percentage Distribution of Gas Utilization
Total Gas ToDomestic
Total Gas ToExport
Total Non-CommerializedGas
15.8%
44.0%
40.1%
April 2020Percentage Distribution of Gas
Utilization Total Gas ToDomestic
Total Gas ToExport
Total Non-CommerializedGas
17 NNPC | Monthly Financial and Operations Report April 2020 www.nnpcgroup.com | www.facebook.com/NNPCgroup | www.twitter.com/NNPCgroup
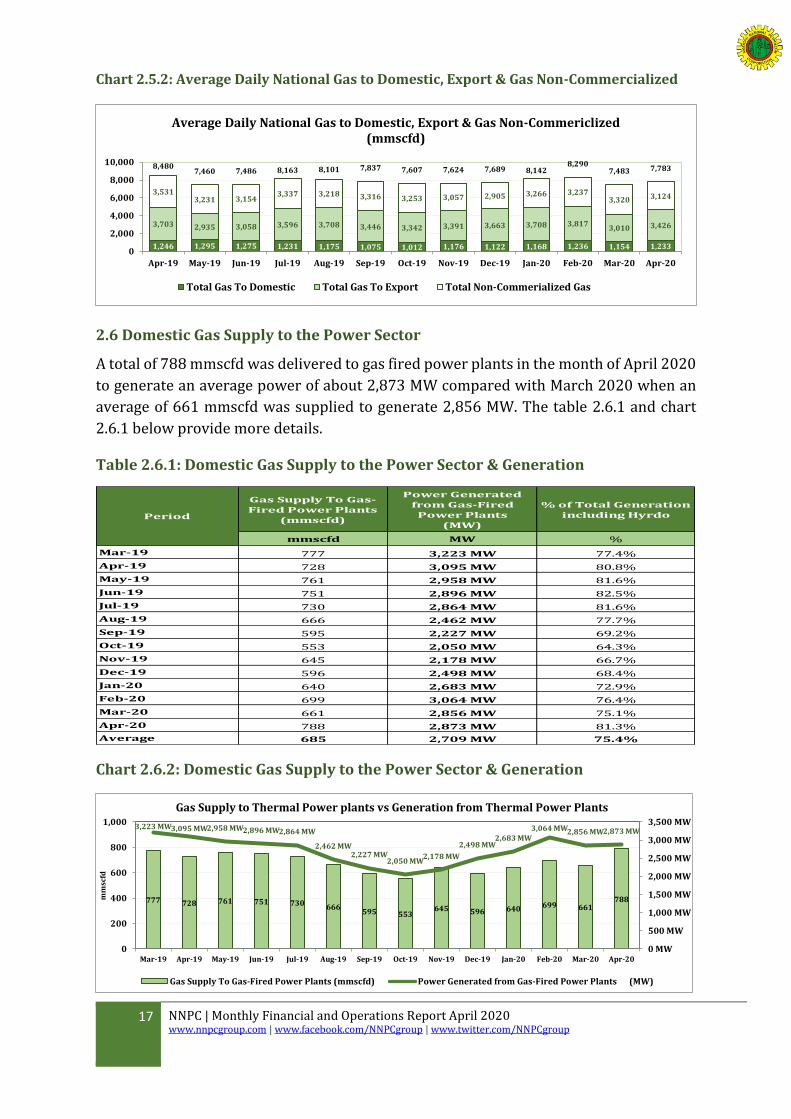
Chart 2.5.2: Average Daily National Gas to Domestic, Export & Gas Non-Commercialized
2.6 Domestic Gas Supply to the Power Sector
A total of 788 mmscfd was delivered to gas fired power plants in the month of April 2020
to generate an average power of about 2,873 MW compared with March 2020 when an
average of 661 mmscfd was supplied to generate 2,856 MW. The table 2.6.1 and chart
2.6.1 below provide more details.
Table 2.6.1: Domestic Gas Supply to the Power Sector & Generation
Gas Supply To Gas-Fired Power Plants
(mmscfd)
Power Generated from Gas-Fired Power Plants
(MW)
% of Total Generation including Hyrdo
mmscfd MW %
Mar-19 777 3,223 MW 77.4%
Apr-19 728 3,095 MW 80.8%
May-19 761 2,958 MW 81.6%
Jun-19 751 2,896 MW 82.5%
Jul-19 730 2,864 MW 81.6%
Aug-19 666 2,462 MW 77.7%
Sep-19 595 2,227 MW 69.2%
Oct-19 553 2,050 MW 64.3%
Nov-19 645 2,178 MW 66.7%
Dec-19 596 2,498 MW 68.4%
Jan-20 640 2,683 MW 72.9%
Feb-20 699 3,064 MW 76.4%
Mar-20 661 2,856 MW 75.1%
Apr-20 788 2,873 MW 81.3%
Average 685 2,709 MW 75.4%
Period
Chart 2.6.2: Domestic Gas Supply to the Power Sector & Generation
1,246 1,295 1,275 1,231 1,175 1,075 1,012 1,176 1,122 1,168 1,236 1,154 1,233
3,703 2,935 3,058 3,596 3,708 3,446 3,342 3,391 3,663 3,708 3,8173,010 3,426
3,5313,231 3,154
3,337 3,218 3,316 3,253 3,057 2,905 3,266 3,2373,320 3,124
8,4807,460 7,486 8,163 8,101 7,837 7,607 7,624 7,689 8,142
8,2907,483 7,783
0
2,000
4,000
6,000
8,000
10,000
Apr-19 May-19 Jun-19 Jul-19 Aug-19 Sep-19 Oct-19 Nov-19 Dec-19 Jan-20 Feb-20 Mar-20 Apr-20
Average Daily National Gas to Domestic, Export & Gas Non-Commericlized (mmscfd)
Total Gas To Domestic Total Gas To Export Total Non-Commerialized Gas
777 728 761 751 730666
595 553645 596 640 699 661
788
3,223 MW3,095 MW2,958 MW2,896 MW2,864 MW
2,462 MW2,227 MW
2,050 MW2,178 MW
2,498 MW2,683 MW
3,064 MW2,856 MW2,873 MW
0 MW
500 MW
1,000 MW
1,500 MW
2,000 MW
2,500 MW
3,000 MW
3,500 MW
0
200
400
600
800
1,000
Mar-19 Apr-19 May-19 Jun-19 Jul-19 Aug-19 Sep-19 Oct-19 Nov-19 Dec-19 Jan-20 Feb-20 Mar-20 Apr-20
mm
scfd
Gas Supply to Thermal Power plants vs Generation from Thermal Power Plants
Gas Supply To Gas-Fired Power Plants (mmscfd) Power Generated from Gas-Fired Power Plants (MW)
18 NNPC | Monthly Financial and Operations Report April 2020 www.nnpcgroup.com | www.facebook.com/NNPCgroup | www.twitter.com/NNPCgroup
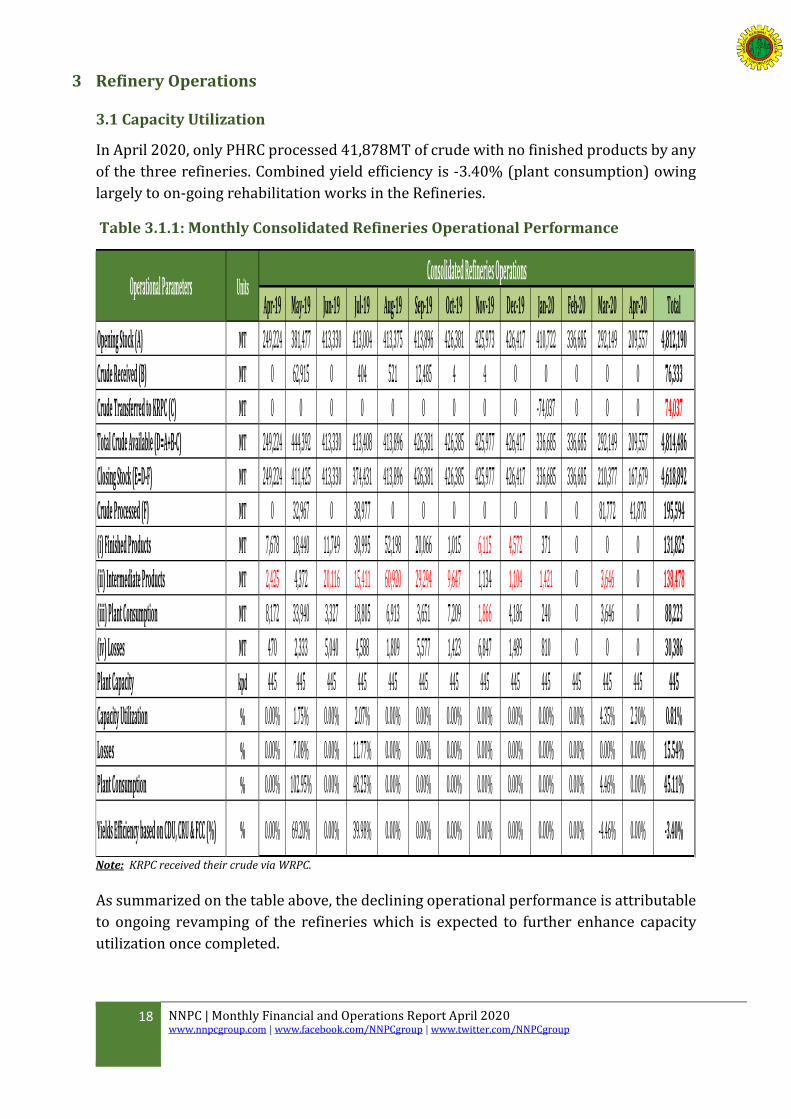
3 Refinery Operations
3.1 Capacity Utilization
In April 2020, only PHRC processed 41,878MT of crude with no finished products by any
of the three refineries. Combined yield efficiency is -3.40% (plant consumption) owing
largely to on-going rehabilitation works in the Refineries.
Table 3.1.1: Monthly Consolidated Refineries Operational Performance
Apr-19 May-19 Jun-19 Jul-19 Aug-19 Sep-19 Oct-19 Nov-19 Dec-19 Jan-20 Feb-20 Mar-20 Apr-20 Total
Opening Stock (A) MT 249,224 381,477 413,330 413,004 413,375 413,896 426,381 425,973 426,417 410,722 336,685 292,149 209,557 4,812,190
Crude Received (B) MT 0 62,915 0 404 521 12,485 4 4 0 0 0 0 0 76,333
Crude Transferred to KRPC (C) MT 0 0 0 0 0 0 0 0 0 -74,037 0 0 0 74,037
Total Crude Available (D=A+B-C) MT 249,224 444,392 413,330 413,408 413,896 426,381 426,385 425,977 426,417 336,685 336,685 292,149 209,557 4,814,486
Closing Stock (E=D-F) MT 249,224 411,425 413,330 374,431 413,896 426,381 426,385 425,977 426,417 336,685 336,685 210,377 167,679 4,618,892
Crude Processed (F) MT 0 32,967 0 38,977 0 0 0 0 0 0 0 81,772 41,878 195,594
(i) Finished Products MT 7,678 18,440 11,749 30,995 52,198 20,066 1,015 6,115 4,572 371 0 0 0 131,825
(ii) Intermediate Products MT 2,425 4,372 20,116 15,411 60,920 29,294 9,647 1,134 1,104 1,421 0 3,646 0 138,478
(iii) Plant Consumption MT 8,172 33,940 3,327 18,805 6,913 3,651 7,209 1,866 4,186 240 0 3,646 0 88,223
(iv) Losses MT 470 2,333 5,040 4,588 1,809 5,577 1,423 6,847 1,489 810 0 0 0 30,386
Plant Capacity kpd 445 445 445 445 445 445 445 445 445 445 445 445 445 445
Capacity Utilization % 0.00% 1.75% 0.00% 2.07% 0.00% 0.00% 0.00% 0.00% 0.00% 0.00% 0.00% 4.35% 2.30% 0.81%
Losses % 0.00% 7.08% 0.00% 11.77% 0.00% 0.00% 0.00% 0.00% 0.00% 0.00% 0.00% 0.00% 0.00% 15.54%
Plant Consumption % 0.00% 102.95% 0.00% 48.25% 0.00% 0.00% 0.00% 0.00% 0.00% 0.00% 0.00% 4.46% 0.00% 45.11%
Yields Efficiency based on CDU, CRU & FCC (%) % 0.00% 69.20% 0.00% 39.98% 0.00% 0.00% 0.00% 0.00% 0.00% 0.00% 0.00% -4.46% 0.00% -3.40%
Operational Parameters UnitsConsolidated Refineries Operations
Note: KRPC received their crude via WRPC.
As summarized on the table above, the declining operational performance is attributable
to ongoing revamping of the refineries which is expected to further enhance capacity
utilization once completed.

19 NNPC | Monthly Financial and Operations Report April 2020 www.nnpcgroup.com | www.facebook.com/NNPCgroup | www.twitter.com/NNPCgroup
Chart 3.1.1: Monthly Refineries Consolidated Capacity Utilization
Table 3.1.2: Refineries Monthly Operations
Apr-19 May-19 Jun-19 Jul-19 Aug-19 Sep-19 Oct-19 Nov-19 Dec-19 Jan-20 Feb-20 Mar-20 Apr-20 Total
Opening Stock (A) MT 170,891 170,891 200,839 200,839 201,243 201,243 213,728 213,732 214,196 199,200 125,163 70,774 70,774 2,253,513
Crude Received (B) MT 0 62,915 0 404 0 12,485 4 4 0 0 0 0 0 75,812
Crude Transferred to KRPC (C) MT 0 0 0 0 0 0 0 0 0 -74,037 0 0 0 74,037
Total Crude Available (D=A+B-C) MT 170,891 233,806 200,839 201,243 201,243 213,728 213,732 213,736 214,196 125,163 125,163 70,774 70,774 2,255,288
Closing Stock (E=D-F) MT 170,891 200,839 200,839 201,243 201,243 213,728 213,732 213,736 214,196 125,163 125,163 70,774 70,774 2,222,321
Crude Processed (F) MT 0 32,967 0 0 0 0 0 0 0 0 0 0 0 32,967
(i) Finished Products MT 2,487 21,347 10,420 17,537 10,424 511 559 3,052 2,593 1,603 0 0 0 56,037
(ii) Intermediate Products MT 5,176 4,771 18,463 22,152 10,759 511 559 0 1,489 1,603 0 0 0 52,735
(iii) Plant Consumption MT 2,689 31,541 5,064 2,851 335 0 0 3,052 4,081 0 0 0 0 49,613
(iv) Losses MT 0 1,426 2,979 1,764 0 0 0 0 0 0 0 0 0 6,169
Plant Capacity kpd 125 125 125 125 125 125 125 125 125 125 125 125 125 125
Capacity Utilization % 0.00% 6.24% 0.00% 0.00% 0.00% 0.00% 0.00% 0.00% 0.00% 0.00% 0.00% 0.00% 0.00% 0.49%
Losses % 0.00% 4.33% 0.00% 0.00% 0.00% 0.00% 0.00% 0.00% 0.00% 0.00% 0.00% 0.00% 0.00% 18.71%
Plant Consumption % 0.00% 95.67% 0.00% 0.00% 0.00% 0.00% 0.00% 0.00% 0.00% 0.00% 0.00% 0.00% 0.00% 150.49%
Yields Efficiency based on CDU, CRU & FCC (%) % 0.00% 79.22% 0.00% 0.00% 0.00% 0.00% 0.00% 0.00% 0.00% 0.00% 0.00% 0.00% 0.00% 10.02%
Operational Parameters Units
Opening Stock (A) MT 146,148 132,253 134,158 133,832 133,799 134,320 134,320 133,908 133,888 133,189 133,189 143,042 60,450 1,686,496
Crude Received (B) MT 0 0 0 0 521 0 0 0 0 0 0 0 0 521
Total Crude Available (C=A+B) MT 146,148 132,253 134,158 133,832 134,320 134,320 134,320 133,908 133,888 133,189 133,189 143,042 60,450 1,687,017
Closing Stock (D=C-E) MT 132,253 132,253 134,158 133,832 134,320 134,320 134,320 133,908 133,888 133,189 133,189 61,270 18,572 1,549,472
Crude Processed (E) MT 13,895 0 0 0 0 0 0 0 0 0 0 81,772 41,878 137,545
(i) Finished Products MT 5,191 2,907 1,329 717 41,774 19,555 456 3,063 1,979 1,974 0 0 0 61,613
(ii) Intermediate Products MT 2,751 399 5,630 3,131 44,583 25,189 1,879 1,134 385 3,024 0 0 0 79,565
(iii) Plant Consumption MT 5,483 2,399 2,766 1,024 1,000 57 0 0 105 240 0 0 0 13,074
(iv) Losses MT 470 907 1,535 2,824 1,809 5,577 1,423 1,929 1,489 810 0 0 0 18,773
Plant Capacity kpd 210 210 210 210 210 210 210 210 210 210 210 210 210 210
Capacity Utilization % 0.00% 0.00% 0.00% 0.00% 0.00% 0.00% 0.00% 0.00% 0.00% 0.00% 0.00% 9.21% 4.87% 1.21%
Losses % 0.00% 0.00% 0.00% 0.00% 0.00% 0.00% 0.00% 0.00% 0.00% 0.00% 0.00% 0.00% 0.00% 13.65%
Plant Consumption % 0.00% 0.00% 0.00% 0.00% 0.00% 0.00% 0.00% 0.00% 0.00% 0.00% 0.00% 0.00% 0.00% 9.51%
Yields Efficiency based on CDU, CRU & FCC (%) % 0.00% 0.00% 0.00% 0.00% 0.00% 0.00% 0.00% 0.00% 0.00% 0.00% 0.00% 0.00% 0.00% -13.05%
Operational Parameters Units
Opening Stock (A) MT 78,333 78,333 78,333 78,333 78,333 78,333 78,333 78,333 78,333 78,333 78,333 78,333 78,333 1,018,329
Crude Received (B) MT 0 0 0 0 0 0 0 0 0 0 0 0 0 0
Total Crude Available (C=A+B) MT 78,333 78,333 78,333 78,333 78,333 78,333 78,333 78,333 78,333 78,333 78,333 78,333 78,333 1,018,329
Closing Stock (D=C-E) MT 78,333 78,333 78,333 39,356 78,333 78,333 78,333 78,333 78,333 78,333 78,333 78,333 78,333 979,352
Crude Processed (E) MT 0 0 0 38,977 0 0 0 0 0 0 0 0 0 38,977
(i) Finished Products MT 0 0 0 14,175 0 0 0 0 0 0 0 0 0 14,175
(ii) Intermediate Products MT 0 0 3,977 9,872 5,578 3,594 7,209 0 0 0 0 3,646 0 6,178
(iii) Plant Consumption MT 0 0 4,503 14,930 5,578 3,594 7,209 4,918 0 0 0 3,646 0 25,536
(iv) Losses MT 0 0 526 0 0 0 0 4,918 0 0 0 0 0 5,444
Plant Capacity kpd 110 110 110 110 110 110 110 110 110 110 110 110 110 110
Capacity Utilization % 0.00% 0.00% 0.00% 8.38% 0.00% 0.00% 0.00% 0.00% 0.00% 0.00% 0.00% 0.00% 0.00% 0.66%
Losses % 0.00% 0.00% 0.00% 0.00% 0.00% 0.00% 0.00% 0.00% 0.00% 0.00% 0.00% 0.00% 0.00% 13.97%
Plant Consumption % 0.00% 0.00% 0.00% 38.30% 0.00% 0.00% 0.00% 0.00% 0.00% 0.00% 0.00% 0.00% 0.00% 65.52%
Yields Efficiency based on CDU, CRU & FCC (%) % 0.00% 0.00% 0.00% 61.70% 0.00% 0.00% 0.00% 0.00% 0.00% 0.00% 0.00% 0.00% 0.00% 20.52%
Operational Parameters Units
PHRC
KRPC
WRPC
Note: For more details on breakdown for Refineries Crude grade received, follow this link.
0.00%
1.75%
0.00%
2.07%
0.00% 0.00% 0.00% 0.00% 0.00% 0.00% 0.00%
4.35%
2.30%
0%
1%
1%
2%
2%
3%
3%
4%
4%
5%
5%
Apr-19 May-19 Jun-19 Jul-19 Aug-19 Sep-19 Oct-19 Nov-19 Dec-19 Jan-20 Feb-20 Mar-20 Apr-20
Refineries Consolidated Capacity Utilization

20 NNPC | Monthly Financial and Operations Report April 2020 www.nnpcgroup.com | www.facebook.com/NNPCgroup | www.twitter.com/NNPCgroup
Chart 3.1.2: Refineries Capacity Utilization
3.2 Refineries Economics for the Period April 2020
The Corporation has been adopting a Merchant Plant Refineries Business Model since
January 2017. The model takes cognizance of the Products Worth and Crude Costs. The
combined value of output by the three refineries (at Import Parity Price) for the month
of April 2020 amounted to approximately ₦0.78billion. No associated crude plus freight
cost for the three refineries since there was no production but operational expenses
amounted to ₦10.47billion. This resulted to an operating deficit of ₦9.69billion by the
Refineries as shown in Table 3.2 beneath.
Table 3.2: Refinery Financial Performance April 2019 - April 2020 Apr-19 May-19 Jun-19 Jul-19 Aug-19 Sep-19 Oct-19 Nov-19 Dec-19 Jan-20 Feb-20 Mar-20 Apr-20
NGN Million NGN Million NGN Million NGN Million NGN Million NGN Million NGN Million NGN Million NGN Million NGN Million NGN Million NGN Million NGN Million
Revenue 31.93 4,627.57 151.44 70.13 41.76 40.39 45.22 38.51 38.66 35.77 39.21 1.37 36.24
Crude + Frieght (COGS) 0.00 (5,304.41) 0.00 0.00 0.00 0.00 0.00 0.00 0.00 0.00 0.00 0.00 0.00
Opex (3,709.72) (3,933.78) (4,222.07) (3,644.61) (3,357.25) (3,160.52) (3,140.91) (3,140.91) (5,180.42) (3,152.69) (2,869.98) (2,725.29) (2,705.77)
Operating Surplus/Deficit(3,677.79) (4,610.63) (4,070.63) (3,574.48) (3,315.49) (3,120.13) (3,095.69) (3,102.40) (5,141.76) (3,116.92) (2,830.77) (2,723.92) (2,669.52)
Revenue 555.21 567.45 1,848.83 720.29 507.53 930.74 2.23 1.34 2.20 2,834.68 721.79 569.86 720.28
Crude + Frieght (COGS) 0.00 0.00 (6,336.18) 0.00 0.00 0.00 0.00 0.00 0.00 0.00 0.00 0.00 0.00
Opex (4,893.61) (4,878.66) (5,068.19) (5,103.95) (6,420.95) (4,598.06) (5,242.68) (5,048.26) (4,620.70) (4,931.12) (4,831.10) (4,867.73) (4,838.68)
Operating Surplus/Deficit(4,338.40) (4,311.21) (9,555.54) (4,383.66) (5,913.42) (3,667.32) (5,240.45) (5,046.92) (4,618.50) (2,096.44) (4,109.31) (4,297.87) (4,118.40)
Revenue 4.76 45.82 12.00 34.72 6.36 62.84 3.77 2.40 55.11 9.51 5.96 2.14 24.17
Crude + Frieght (COGS) 0.00 0.00 0.00 0.00 0.00 0.00 0.00 0.00 0.00 0.00 0.00 0.00 0.00
Opex (3,428.43) (4,753.26) (3,806.30) (5,912.62) (3,986.53) (3,476.91) (3,384.19) (4,370.17) (3,752.43) (4,397.64) (2,429.69) (3,284.94) (2,923.86)
Operating Surplus/Deficit(3,423.67) (4,707.44) (3,794.30) (5,877.90) (3,980.17) (286.86) (3,380.42) (4,367.77) (3,697.32) (4,388.13) (2,423.73) (3,282.80) (2,899.69)
Revenue 591.90 5,240.84 2,012.27 825.14 555.65 1,033.97 51.22 42.25 95.97 2,879.96 766.96 573.37 780.69
Crude + Frieght (COGS) 0.00 (5,304.41) (6,336.18) 0.00 0.00 0.00 0.00 0.00 0.00 0.00 0.00 0.00 0.00
Opex (12,031.76) (13,565.70) (13,096.56) (14,661.18) (13,764.73) (11,235.49) (11,767.78) (12,559.34) (13,553.56) (12,481.45) (10,130.77) (10,877.96) (10,468.31)
Operating Surplus/Deficit(11,439.86) (13,629.28) (17,420.47) (13,836.04) (13,209.08) (7,074.31) (11,716.56) (12,517.09) (13,457.59) (9,601.49) (9,363.81) (10,304.59) (9,687.61)
Description
KRPC
WRPC
PHRC
Consolidated
Note: For PHRC, The overstated losses for June -236.49 and July -2890.72 have been added to the current deficit of -3434.07 to arrive at the adjusted
balance of -286.86 in September 2019.
0.0
% 6.2
%
0.0
%
0.0
%
0.0
%
0.0
%
0.0
%
0.0
%
0.0
%
0.0
%
0.0
%
0.0
%
0.0
%
0.0
%
0.0
%
0.0
%
0.0
%
0.0
%
0.0
%
0.0
%
0.0
%
0.0
%
0.0
%
9.2
%
4.9
%
0.0
%
0.0
%
0.0
% 8.4
%
0.0
%
0.0
%
0.0
%
0.0
%
0.0
%
0.0
%
0.0
%
0.0
%
0.0
%
0%
10%
20%
30%
40%
50%
60%
Apr-19 May-19 Jun-19 Jul-19 Aug-19 Sep-19 Oct-19 Nov-19 Dec-19 Jan-20 Feb-20 Mar-20 Apr-20
Refineries Capacity Utilization
WRPC PHRC KRPC

21 NNPC | Monthly Financial and Operations Report April 2020 www.nnpcgroup.com | www.facebook.com/NNPCgroup | www.twitter.com/NNPCgroup
4 Petroleum Product Supply & Distribution
4.1 Petroleum Product Supply from Direct sales Direct Purchase (DSDP)
In April 2020, 1,812.81 million litres of PMS were supplied into the country through the
DSDP arrangement as against the 2,250.56 million litres of PMS supplied in the month of
March 2020. The table and chart below provide more details of the total petroleum
products supply from DSDP.
Table 4.1.1: Monthly Imported Petroleum Products via DSDP in litres
Month DSDP (Domestic) Extended DSDP/NFSF Total DSDP
PMS PMS PMS AGO DPK
Litres Litres Litres Litres Litres
Apr-19 2,436,497,208.14 154,517,419.64 2,591,014,627.78 - -
May-19 2,098,547,949.47 0.00 2,098,547,949.47 - -
Jun-19 1,687,689,202.03 544,893,026.37 2,232,582,228.41 - -
Jul-19 1,221,285,513.13 238,027,042.72 1,459,312,555.85 38,761,200.00 -
Aug-19 1,441,693,147.46 198,789,390.77 1,640,482,538.23 113,378,702.98 -
Sep-19 1,601,487,407.47 325,323,613.59 1,926,811,021.06 - -
Oct-19 1,198,434,182.52 425,522,978.04 1,623,957,160.55 111,860,420.95 -
Nov-19 1,293,661,505.17 499,446,697.29 1,793,108,202.46 - -
Dec-19 1,245,207,523.63 392,640,519.53 1,637,848,043.15 95,014,557.83 -
Jan-20 1,466,760,725.98 494,650,034.16 1,961,410,760.15 - -
Feb-20 1,246,797,445.41 149,749,888.39 1,396,547,333.80 115,242,192.48 -
Mar-20 1,604,968,013.20 645,591,751.06 2,250,559,764.25 - -
Apr-20 1,407,669,756.77 405,138,450.45 1,812,808,207.22 - -
TOTAL 19,950,699,580.38 4,474,290,812.00 24,424,990,392.38 474,257,074.24 0.00
DSDP (Domestic)
Notes: Under recovery for DSDP (Domestic) is charged to the Federation account. Under recovery for Flush Volumes and Extended DSDP is charged to the National Fuel Support Fund (NFSF).
Chart 4.1.1: Petroleum Products Supply from DSDP (Million Litres)
2,591
2,099 2,233
1,4591,640
1,9271,624
1,793 1,6381,961
1,397
2,251
1,813
0
0
95
2,591
2,0992,233
1,498
1,7541,927
1,736 1,793 1,733
1,961
1,512
2,251
1,813
0
500
1,000
1,500
2,000
2,500
3,000
Apr-19 May-19 Jun-19 Jul-19 Aug-19 Sep-19 Oct-19 Nov-19 Dec-19 Jan-20 Feb-20 Mar-20 Apr-20
Petroleum Products from Direct Sales Direct Purchase (Million Litres)
PMS AGO

22 NNPC | Monthly Financial and Operations Report April 2020 www.nnpcgroup.com | www.facebook.com/NNPCgroup | www.twitter.com/NNPCgroup
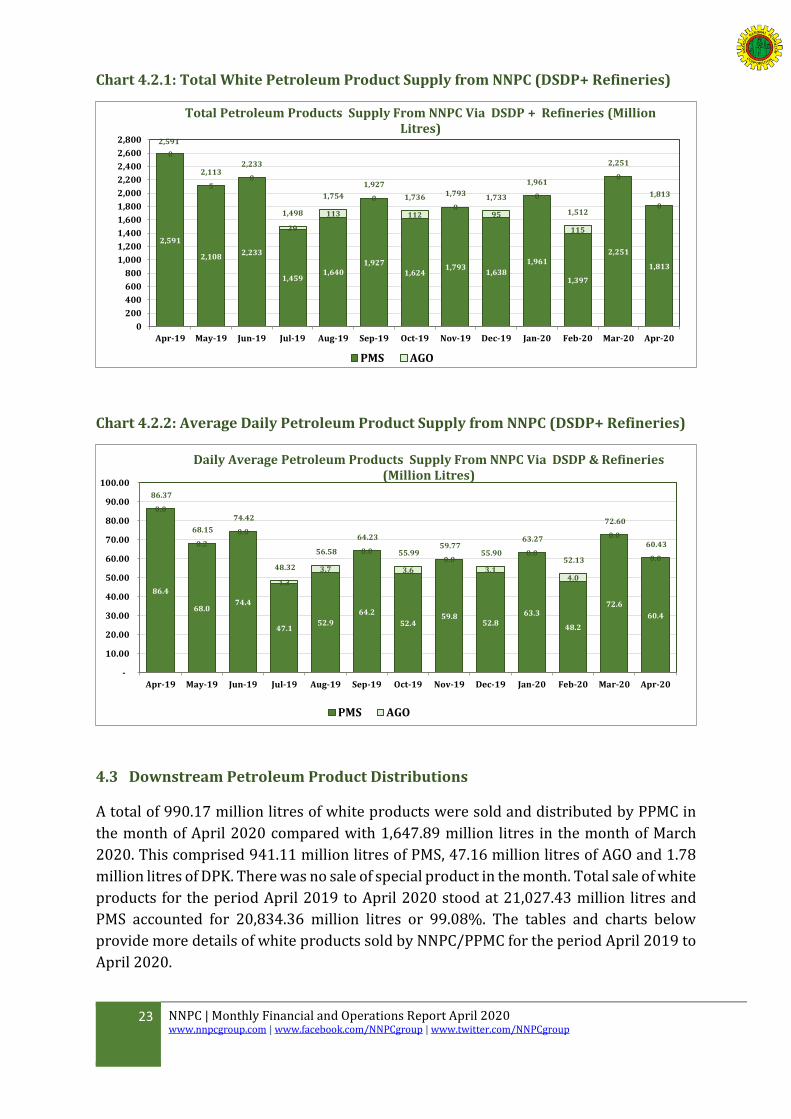
4.2 Petroleum Products Supply from Domestic Refineries
Table 4.2.1 shows comparison of white petroleum products produced by the domestic
refineries. No white product (PMS & DPK) was produced in April 2020 and apparently
for the past ten consecutive months. The lack of production is due to ongoing
rehabilitation works at the refineries.
Table 4.2.1: Monthly Refined White Petroleum Products from Local Refineries
PMS DPK Total (PMS+DPK)
Litres Litres Litres
Apr-19 0 0 0
May-19 9,101,176 4,990,044 14,091,220
Jun-19 0 0 0
Jul-19 0 0 0
Aug-19 0 0 0
Sep-19 0 0 0
Oct-19 0 0 0
Nov-19 0 0 0
Dec-19 0 0 0
Jan-20 0 0 0
Feb-20 0 0 0
Mar-20 0 0 0
Apr-20 0 0 0
Total 9,101,176 4,990,044 14,091,220
Period
Table 4.2.2: Total White Petroleum Product Supply from NNPC (DSDP + Refineries)
PMS AGO Total PMS AGO Total
Litres Litres Litres Litres/Day Litres/Day Litres/Day
Apr-19 2,591,014,627.78 - 2,591,014,627.78 86,367,154.26 - 86,367,154.26
May-19 2,107,649,125.47 4,990,044.00 2,112,639,169.47 67,988,681.47 160,969.16 68,149,650.63
Jun-19 2,232,582,228.41 - 2,232,582,228.41 74,419,407.61 - 74,419,407.61
Jul-19 1,459,312,555.85 38,761,200.00 1,498,073,755.85 47,074,598.58 1,250,361.29 48,324,959.87
Aug-19 1,640,482,538.23 113,378,702.98 1,753,861,241.21 52,918,791.56 3,657,377.52 56,576,169.07
Sep-19 1,926,811,021.06 - 1,926,811,021.06 64,227,034.04 - 64,227,034.04
Oct-19 1,623,957,160.55 111,860,420.95 1,735,817,581.51 52,385,714.86 3,608,400.68 55,994,115.53
Nov-19 1,793,108,202.46 - 1,793,108,202.46 59,770,273.42 - 59,770,273.42
Dec-19 1,637,848,043.15 95,014,557.83 1,732,862,600.98 52,833,807.84 3,064,985.74 55,898,793.58
Jan-20 1,961,410,760.15 - 1,961,410,760.15 63,271,314.84 - 63,271,314.84
Feb-20 1,396,547,333.80 115,242,192.48 1,511,789,526.28 48,156,804.61 3,973,868.71 52,130,673.32
Mar-20 2,250,559,764.25 - 2,250,559,764.25 72,598,702.07 - 72,598,702.07
Apr-20 1,812,808,207.22 - 1,812,808,207.22 60,426,940.24 - 60,426,940.24
Total/Average 24,434,091,568.38 479,247,118.24 24,913,338,686.62 802,439,225.39 15,715,963.09 818,155,188.48
Total Product Supply (OPA, DSDP+Refineries)
Period
Average Daily Supply
23 NNPC | Monthly Financial and Operations Report April 2020 www.nnpcgroup.com | www.facebook.com/NNPCgroup | www.twitter.com/NNPCgroup
Chart 4.2.1: Total White Petroleum Product Supply from NNPC (DSDP+ Refineries)
Chart 4.2.2: Average Daily Petroleum Product Supply from NNPC (DSDP+ Refineries)
4.3 Downstream Petroleum Product Distributions
A total of 990.17 million litres of white products were sold and distributed by PPMC in
the month of April 2020 compared with 1,647.89 million litres in the month of March
2020. This comprised 941.11 million litres of PMS, 47.16 million litres of AGO and 1.78
million litres of DPK. There was no sale of special product in the month. Total sale of white
products for the period April 2019 to April 2020 stood at 21,027.43 million litres and
PMS accounted for 20,834.36 million litres or 99.08%. The tables and charts below
provide more details of white products sold by NNPC/PPMC for the period April 2019 to
April 2020.
2,591
2,1082,233
1,4591,640
1,927
1,6241,793
1,638
1,961
1,397
2,251
1,813
0
50
39
113
0
1120
95
0
115
0
0
2,591
2,1132,233
1,498
1,754
1,927
1,736 1,7931,733
1,961
1,512
2,251
1,813
0
200
400
600
800
1,000
1,200
1,400
1,600
1,800
2,000
2,200
2,400
2,600
2,800
Apr-19 May-19 Jun-19 Jul-19 Aug-19 Sep-19 Oct-19 Nov-19 Dec-19 Jan-20 Feb-20 Mar-20 Apr-20
Total Petroleum Products Supply From NNPC Via DSDP + Refineries (Million Litres)
PMS AGO
86.4
68.074.4
47.152.9
64.2
52.459.8
52.863.3
48.2
72.6
60.4
0.0
0.2
0.0
1.3
3.7
0.0
3.6
0.0
3.1
0.0
4.0
0.0
0.0
86.37
68.15
74.42
48.32
56.58
64.23
55.99 59.77
55.90
63.27
52.13
72.60
60.43
-
10.00
20.00
30.00
40.00
50.00
60.00
70.00
80.00
90.00
100.00
Apr-19 May-19 Jun-19 Jul-19 Aug-19 Sep-19 Oct-19 Nov-19 Dec-19 Jan-20 Feb-20 Mar-20 Apr-20
Daily Average Petroleum Products Supply From NNPC Via DSDP & Refineries (Million Litres)
PMS AGO

24 NNPC | Monthly Financial and Operations Report April 2020 www.nnpcgroup.com | www.facebook.com/NNPCgroup | www.twitter.com/NNPCgroup
Table 4.3.1: Downstream Petroleum Product Sales by PPMC
PMS AGO DPK Total White Products LPFO Other Special
Products Total Special
Products
Litres Litres Litres Litres Litres Litres Litres
Apr-19 2,080,538,397 12,440,922 19,322,583 2,112,301,902 1,254,000 0 1,254,000
May-19 2,061,148,901 26,154,932 19,511,492 2,106,815,325 9,628,756 0 9,628,756
Jun-19 1,759,615,504 8,661,566 9,293,903 1,777,570,973 30,987,463 0 30,987,463
Jul-19 1,727,960,801 16,313,314 33,000 1,744,307,115 4,818,000 0 4,818,000
Aug-19 1,916,624,803 299,404 0 1,916,924,207 0 0 0
Sep-19 1,013,064,625 1,250,832 3,375,055 1,017,690,512 0 0 0
Oct-19 1,156,217,879 262,648 15,000 1,156,495,527 33,000 0 33,000
Nov-19 839,698,013 1,062,016 301,860 841,061,889 759,000 0 759,000
Dec-19 2,761,609,174 13,124,103 45,000 2,774,778,277 3,366,000 0 3,366,000
Jan-20 1,199,015,926 9,439,315 0 1,208,455,241 99,000 0 99,000
Feb-20 1,731,883,775 1,085,101 0 1,732,968,876 99,000 0 99,000
Mar-20 1,645,760,304 589,003 1,541,088 1,647,890,395 0 0 0
Apr-20 941,224,458 47,163,101 1,782,081 990,169,640 0 0 0
Total 20,834,362,559 137,846,257 55,221,062 21,027,429,878 51,044,219 0 51,044,219
Period
Chart 4.3.1: Monthly White Product sales by PPMC
2,081 2,0611,760 1,728
1,917
1,0131,156
840
2,762
1,199
1,732 1,646
941
19 20
9 0
0
30
0
0
0
02
2
12 26
9 16
0
10
1
13
9
11
47
2,112.30 2,106.82
1,777.57 1,744.31
1,916.92
1,017.691,156.50
841.06
2,774.78
1,208.46
1,732.971,647.89
990.17
0
500
1,000
1,500
2,000
2,500
3,000
Apr-19 May-19 Jun-19 Jul-19 Aug-19 Sep-19 Oct-19 Nov-19 Dec-19 Jan-20 Feb-20 Mar-20 Apr-20
Total Montly PPMC Product Distribution Sales Volume (Million Litres)
PMS DPK AGO

25 NNPC | Monthly Financial and Operations Report April 2020 www.nnpcgroup.com | www.facebook.com/NNPCgroup | www.twitter.com/NNPCgroup
Table 4.3.2: Average Daily Petroleum Product Sales by PPMC
PMS AGO DPK Total White Products LPFO Other Special
Products Total Special
Products
Litres/Day Litres/Day Litres/Day Litres/Day Litres/Day Litres/Day Litres/Day
Apr-19 69,351,280 414,697 644,086 70,410,063 41,800 0 41,800
May-19 66,488,674 843,707 629,403 67,961,785 310,605 0 310,605
Jun-19 58,653,850 288,719 309,797 59,252,366 1,032,915 0 1,032,915
Jul-19 55,740,671 526,236 1,065 56,267,971 155,419 0 155,419
Aug-19 61,826,607 9,658 0 61,836,265 0 0 0
Sep-19 33,768,821 41,694 112,502 33,923,017 0 0 0
Oct-19 37,297,351 8,473 484 37,306,307 1,065 0 1,065
Nov-19 27,989,934 35,401 10,062 28,035,396 25,300 0 25,300
Dec-19 89,084,167 423,358 1,452 89,508,977 108,581 0 108,581
Jan-20 38,677,933 304,494 0 38,982,427 3,194 0 3,194
Feb-20 59,720,130 37,417 0 59,757,547 3,414 0 3,414
Mar-20 53,089,042 19,000 49,713 53,157,755 0 0 0
Apr-20 31,374,149 1,572,103 59,403 33,005,655 0 0 0
Average 52,612,027 348,097 139,447 53,099,570 128,900 0 128,900
Period
Chart 4.3.2: Average Daily White Products Distribution by PPMC
A total sum of ₦107.61 billion was made on the sale of white products by PPMC in the
month of April 2020 compared to ₦192.37 billion sales in March, 2020. Total revenues
generated from the sales of white products for the period April 2019 to April 2020 stood
at ₦2,562.63 billion, where PMS contributed about 98.68% of the total sales with a value
of ₦2,528.91 billion. The table and chart below provide details accordingly.
69 6659 56
62
34 3728
89
39
6053
31
11
00
0
00
0
0
0
0
0
0
01
01
0
00
0
0
0
0
0
2
70.4167.96
59.2556.27
61.84
33.9237.31
28.04
89.51
38.98
59.76
53.16
33.01
0
10
20
30
40
50
60
70
80
90
100
Apr-19 May-19 Jun-19 Jul-19 Aug-19 Sep-19 Oct-19 Nov-19 Dec-19 Jan-20 Feb-20 Mar-20 Apr-20
Average Daily PPMC Product Distribution Sales Volume (Million Litres)
PMS DPK AGO

26 NNPC | Monthly Financial and Operations Report April 2020 www.nnpcgroup.com | www.facebook.com/NNPCgroup | www.twitter.com/NNPCgroup
Table 4.3.3: Revenue from Sales of White Product
PMS AGO DPK Total White Products
Revenue LPFO
Other Special Products
Total Special
Products Revenue
Naira Naira Naira Naira Naira Naira Naira
Apr-19 255,332,011,840 2,363,775,180 3,663,329,322 261,359,116,342 155,257,740 0 155,257,740
May-19 252,350,443,561 4,978,662,080 3,695,374,480 261,024,480,121 1,156,037,500 0 1,156,037,500
Jun-19 213,577,710,940 1,635,008,458 1,719,372,055 216,932,091,453 3,802,266,112 0 3,802,266,112
Jul-19 211,647,332,775 3,050,589,718 6,105,000 214,704,027,493 596,516,580 0 596,516,580
Aug-19 233,367,696,696 55,988,548 0 233,423,685,244 0 0 0
Sep-19 124,311,940,808 233,905,584 624,385,175 125,170,231,567 0 0 0
Oct-19 143,349,124,961 49,115,176 2,775,000 143,401,015,137 4,085,730 0 4,085,730
Nov-19 105,366,620,662 198,596,992 55,844,100 105,621,061,754 93,971,790 0 93,971,790
Dec-19 335,216,500,573 2,401,710,849 8,325,000 337,626,536,422 416,744,460 0 416,744,460
Jan-20 149,969,916,088 1,821,598,795 0 151,791,514,883 12,554,190 0 12,554,190
Feb-20 211,413,420,844 209,424,493 0 211,622,845,337 12,554,190 0 12,554,190
Mar-20 191,980,429,849 104,842,534 285,101,280 192,370,373,663 0 0 0
Apr-20 101,024,462,011 6,302,229,729 285,132,960 107,611,824,700 0 0 0
Total 2,528,907,611,610 23,405,448,136 10,345,744,372 2,562,658,804,118 6,249,988,292 0 6,249,988,292
Period
Note: The PPMC Sales includes PEF & PPPRA collections.
Chart 4.3.3: Monthly Sales Revenue from Petroleum Product Distribution
255 252214 212
233
124143
105
335
150
211192
101
4 4
2 00
10
0
0
0
00
0
2 5
2 30
00
0
2
2
00
6
261.36 261.02
216.93 214.70233.42
125.17143.40
105.62
337.63
151.79
211.62192.37
107.61
0
50
100
150
200
250
300
350
400
Apr-19 May-19 Jun-19 Jul-19 Aug-19 Sep-19 Oct-19 Nov-19 Dec-19 Jan-20 Feb-20 Mar-20 Apr-20
Sales Revenue From PPMC Product Distribution (Billion Naira)
PMS DPK AGO
27 NNPC | Monthly Financial and Operations Report April 2020 www.nnpcgroup.com | www.facebook.com/NNPCgroup | www.twitter.com/NNPCgroup
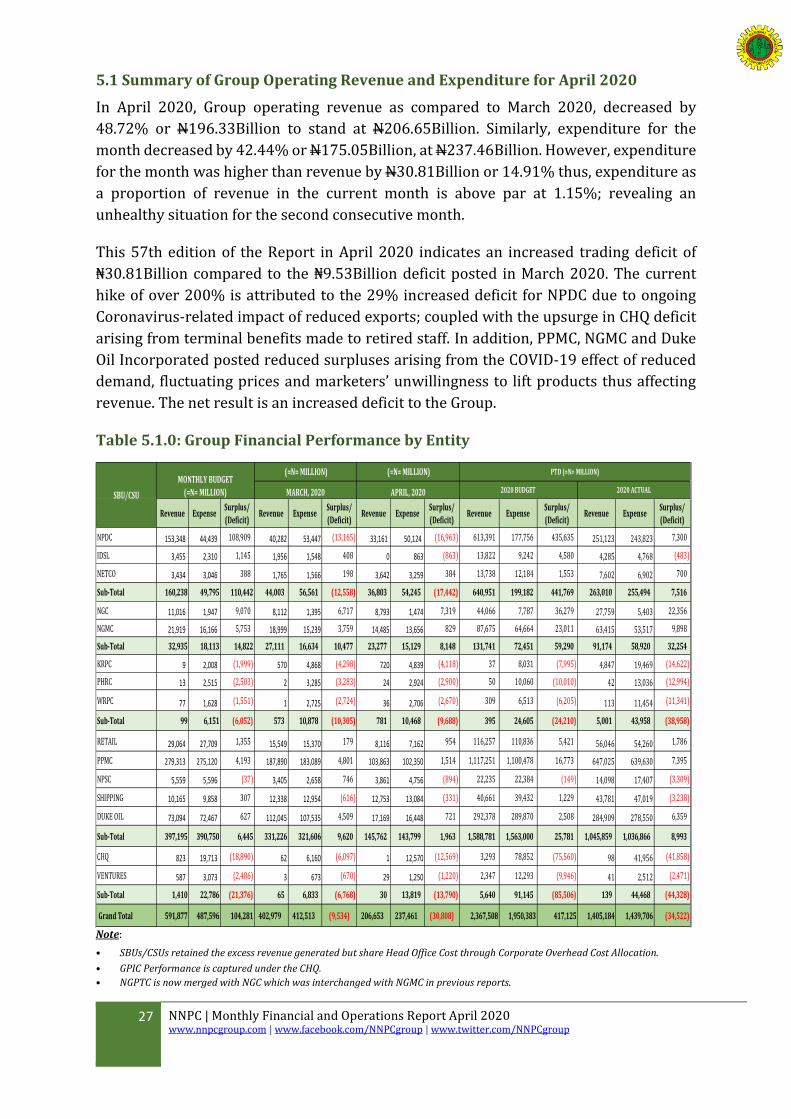
5.1 Summary of Group Operating Revenue and Expenditure for April 2020
In April 2020, Group operating revenue as compared to March 2020, decreased by
48.72% or N196.33Billion to stand at N206.65Billion. Similarly, expenditure for the
month decreased by 42.44% or N175.05Billion, at N237.46Billion. However, expenditure
for the month was higher than revenue by N30.81Billion or 14.91% thus, expenditure as
a proportion of revenue in the current month is above par at 1.15%; revealing an
unhealthy situation for the second consecutive month.
This 57th edition of the Report in April 2020 indicates an increased trading deficit of
₦30.81Billion compared to the ₦9.53Billion deficit posted in March 2020. The current
hike of over 200% is attributed to the 29% increased deficit for NPDC due to ongoing
Coronavirus-related impact of reduced exports; coupled with the upsurge in CHQ deficit
arising from terminal benefits made to retired staff. In addition, PPMC, NGMC and Duke
Oil Incorporated posted reduced surpluses arising from the COVID-19 effect of reduced
demand, fluctuating prices and marketers’ unwillingness to lift products thus affecting
revenue. The net result is an increased deficit to the Group.
Table 5.1.0: Group Financial Performance by Entity
Revenue ExpenseSurplus/
(Deficit)Revenue Expense
Surplus/
(Deficit)Revenue Expense
Surplus/
(Deficit)Revenue Expense
Surplus/
(Deficit)Revenue Expense
Surplus/
(Deficit)
NPDC 153,348 44,439 108,909 40,282 53,447 (13,165) 33,161 50,124 (16,963) 613,391 177,756 435,635 251,123 243,823 7,300
IDSL 3,455 2,310 1,145 1,956 1,548 408 0 863 (863) 13,822 9,242 4,580 4,285 4,768 (483)
NETCO 3,434 3,046 388 1,765 1,566 198 3,642 3,259 384 13,738 12,184 1,553 7,602 6,902 700
Sub-Total 160,238 49,795 110,442 44,003 56,561 (12,558) 36,803 54,245 (17,442) 640,951 199,182 441,769 263,010 255,494 7,516
NGC 11,016 1,947 9,070 8,112 1,395 6,717 8,793 1,474 7,319 44,066 7,787 36,279 27,759 5,403 22,356
NGMC 21,919 16,166 5,753 18,999 15,239 3,759 14,485 13,656 829 87,675 64,664 23,011 63,415 53,517 9,898
Sub-Total 32,935 18,113 14,822 27,111 16,634 10,477 23,277 15,129 8,148 131,741 72,451 59,290 91,174 58,920 32,254
KRPC 9 2,008 (1,999) 570 4,868 (4,298) 720 4,839 (4,118) 37 8,031 (7,995) 4,847 19,469 (14,622)
PHRC 13 2,515 (2,503) 2 3,285 (3,283) 24 2,924 (2,900) 50 10,060 (10,010) 42 13,036 (12,994)
WRPC 77 1,628 (1,551) 1 2,725 (2,724) 36 2,706 (2,670) 309 6,513 (6,205) 113 11,454 (11,341)
Sub-Total 99 6,151 (6,052) 573 10,878 (10,305) 781 10,468 (9,688) 395 24,605 (24,210) 5,001 43,958 (38,958)
RETAIL 29,064 27,709 1,355 15,549 15,370 179 8,116 7,162 954 116,257 110,836 5,421 56,046 54,260 1,786
PPMC 279,313 275,120 4,193 187,890 183,089 4,801 103,863 102,350 1,514 1,117,251 1,100,478 16,773 647,025 639,630 7,395
NPSC 5,559 5,596 (37) 3,405 2,658 746 3,861 4,756 (894) 22,235 22,384 (149) 14,098 17,407 (3,309)
SHIPPING 10,165 9,858 307 12,338 12,954 (616) 12,753 13,084 (331) 40,661 39,432 1,229 43,781 47,019 (3,238)
DUKE OIL 73,094 72,467 627 112,045 107,535 4,509 17,169 16,448 721 292,378 289,870 2,508 284,909 278,550 6,359
Sub-Total 397,195 390,750 6,445 331,226 321,606 9,620 145,762 143,799 1,963 1,588,781 1,563,000 25,781 1,045,859 1,036,866 8,993
CHQ 823 19,713 (18,890) 62 6,160 (6,097) 1 12,570 (12,569) 3,293 78,852 (75,560) 98 41,956 (41,858)
VENTURES 587 3,073 (2,486) 3 673 (670) 29 1,250 (1,220) 2,347 12,293 (9,946) 41 2,512 (2,471)
Sub-Total 1,410 22,786 (21,376) 65 6,833 (6,768) 30 13,819 (13,790) 5,640 91,145 (85,506) 139 44,468 (44,328)
Grand Total 591,877 487,596 104,281 402,979 412,513 (9,534) 206,653 237,461 (30,808) 2,367,508 1,950,383 417,125 1,405,184 1,439,706 (34,522)
2020 ACTUALAPRIL, 2020SBU/CSU
MONTHLY BUDGET
(=N= MILLION)
PTD (=N= MILLION) (=N= MILLION)
2020 BUDGET
(=N= MILLION)
MARCH, 2020
Note:
• SBUs/CSUs retained the excess revenue generated but share Head Office Cost through Corporate Overhead Cost Allocation.
• GPIC Performance is captured under the CHQ.
• NGPTC is now merged with NGC which was interchanged with NGMC in previous reports.

28 NNPC | Monthly Financial and Operations Report April 2020 www.nnpcgroup.com | www.facebook.com/NNPCgroup | www.twitter.com/NNPCgroup
Chart 5.1.1: Group Operating Revenue: April 2019 – April 2020
Chart 5.1.2: Group Operating Expenditure: April 2019 – April 2020
80.48109.47 89.17
61.3283.43 81.90
125.9386.04 91.87 86.51 91.17
40.28 33.16
6
76
219 9
8
77
3 8
8 9
13.96
14.2014.54
18.13 17.57 18.08
16.35
14.8416.89
15.7614.17
19.00 14.48
0.59
5.242.01
0.83 0.56 1.03
0.05
0.040.10
2.88 0.77
0.57 0.78
21.07
17.3213.63
14.20 12.21 11.82
14.92
14.9318.60
18.55 13.83
15.558.12
256.67
257.43
217.41210.96
229.34
162.55
139.61
102.33
335.26
147.51
207.76
187.89
103.86
0
1
0 0
0 0
0
0
1
0
0 0
0
531.23
578.35
518.18
502.49
540.59 539.81
391.80
330.80
695.18
378.01
417.54
402.98
206.65
0
100
200
300
400
500
600
700
800
Apr-19 May-19 Jun-19 Jul-19 Aug-19 Sep-19 Oct-19 Nov-19 Dec-19 Jan-20 Feb-20 Mar-20 Apr-20
NNPC Group Revenue: April 2019 - April 2020 (Billion Naira)
NPDC IDSL NETCO NGC NGMC REFINERIES RETAIL PPMC NPSC SHIPPING DUKE OIL CHQ/VENTURES
55.5189.90
64.38 45.55 57.89 71.90 94.4551.97 70.33 65.35 74.90 53.45 50.12
2
2 3
2 3 3
3
3 7 0 2
1.5664 3.2585811.24
11.2511.22
14.66 14.8914.55
15.28
13.7214.00
11.6213.00
15.24 13.6612.03
18.8719.43
14.66 13.76 8.1111.77
12.5613.55
12.4810.13
10.88 10.4720.82
17.1213.52
14.01 12.22 11.8314.85
15.0918.97
18.06 13.6615.37 7.16
253.44
255
217 210
229 160
139
101
334
147
207 183
102
525.62
572.02
514.26498.23
535.40 531.22
378.57
326.85
689.90
376.14
413.59412.51
237.46
0
100
200
300
400
500
600
700
800
Apr-19 May-19 Jun-19 Jul-19 Aug-19 Sep-19 Oct-19 Nov-19 Dec-19 Jan-20 Feb-20 Mar-20 Apr-20
NNPC Group Expenditure: April 2019 - April 2020 (Billion Naira)
NPDC IDSL NETCO NGC NGMC REFINERIES RETAIL PPMC NPSC SHIPPING DUKE OIL CHQ/VENTURES
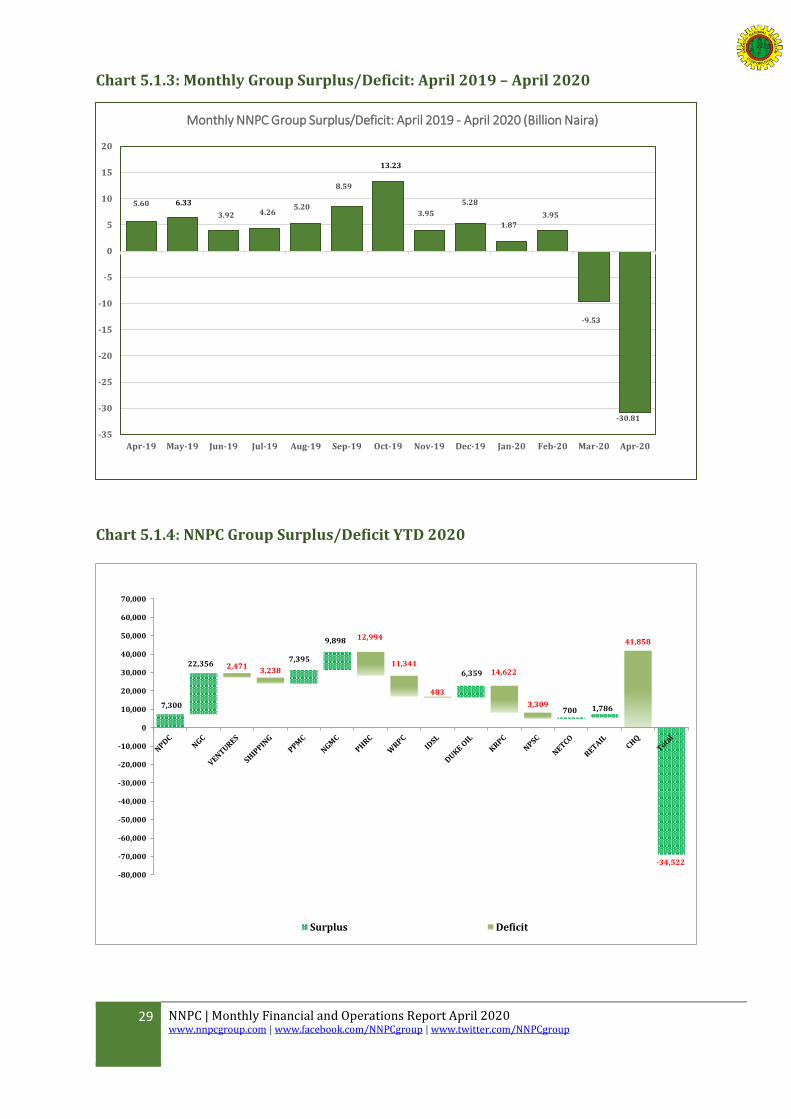
29 NNPC | Monthly Financial and Operations Report April 2020 www.nnpcgroup.com | www.facebook.com/NNPCgroup | www.twitter.com/NNPCgroup
Chart 5.1.3: Monthly Group Surplus/Deficit: April 2019 – April 2020
Chart 5.1.4: NNPC Group Surplus/Deficit YTD 2020
8.59
5.204.26
5.60
13.23
3.92
6.33
3.95
5.28
1.873.95
-9.53
-30.81
-35
-30
-25
-20
-15
-10
-5
0
5
10
15
20
Apr-19 May-19 Jun-19 Jul-19 Aug-19 Sep-19 Oct-19 Nov-19 Dec-19 Jan-20 Feb-20 Mar-20 Apr-20
Monthly NNPC Group Surplus/Deficit: April 2019 - April 2020 (Billion Naira)
2,4713,238
12,994
11,34114,622
3,309
41,858
7,300
22,3567,395
9,898
483
6,359
700 1,786
-34,522
-80,000
-70,000
-60,000
-50,000
-40,000
-30,000
-20,000
-10,000
0
10,000
20,000
30,000
40,000
50,000
60,000
70,000
Surplus Deficit

30 NNPC | Monthly Financial and Operations Report April 2020 www.nnpcgroup.com | www.facebook.com/NNPCgroup | www.twitter.com/NNPCgroup
6 Federation Crude Oil & Gas Revenue
Federation Crude Oil and Gas lifting are broadly classified into Equity Export and
Domestic. Both categories are lifted and marketed by NNPC and the proceeds remitted
into the Federation Account.
Equity Export receipts, after adjusting for Joint Venture (JV) Cash Calls, are paid directly
into Federation Account domiciled in the Central Bank of Nigeria (CBN). Domestic Crude
Oil of 445,000bpd is allocated for refining to meet domestic products supply. Payments
are effected to Federation Account by NNPC after adjusting crude & product losses and
pipeline repairs & management cost incurred during the period.
6.1 Flow of Oil Revenue into Federation Account.
NNPC also lifts Crude Oil and Gas other than Equity and Domestic Crude Oil on behalf of
DPR and FIRS proceeds of which are remitted into Federation Account.
The Third-Party finance lifting are Crude Oil and Gas lifting from fields that are financed
using alternative finance/loan facility which require the servicing of debt obligations
before remitting the balance into the Federation Account as Price Balance as shown
below:
Oil Field Terminals
Equity Crude Export
3rd Party Finance Liftings
Other Liftings
Domestic Crude (445kbpd)
CBN/NNPC JP Morgan USD Crude
Oil Accounts
Debt Service
Payment to CBN/NNPC
JVCC Account
CBN/DPR JP Morgan USD Crude
Oil Account
CBN/FIRS JP Morgan USD
Crude Oil Account
Local Refining
Direct Export
Adjustment for Subsidy,
Losses & Pipeline Mgt.
Costs
Royalty to DPR
PPT/CIT to FIRS
Federation Account
CBN/NNPC Naira Crude Oil Account
Price Balance
IOC Partners & PSC Contractor Liftings
Direct Sales Direct Purchase

31 NNPC | Monthly Financial and Operations Report April 2020 www.nnpcgroup.com | www.facebook.com/NNPCgroup | www.twitter.com/NNPCgroup
6.2 Accounting for Federation Crude Oil & Gas
The summary of Oil & Gas Sales and inflow into Federation Account can be depicted as
follows:
6.3 Dollar Payments to Federation Account
A total export sale of $195.82 million was recorded in April 2020; decreasing by 23.57%
compared to last month. Crude oil export sales contributed $148.86 million (76.02%) of
the dollar transactions compared with $184.59 million contribution in the previous
month; while the export Gas sales amounted to $46.96 million in the month. The April
2019 to April 2020 Crude Oil and Gas transactions indicated that Crude Oil & Gas worth
$4.76 Billion was exported. See Table 6.3.1 & Chart 6.3.1 overleaf for details.
Market Trial
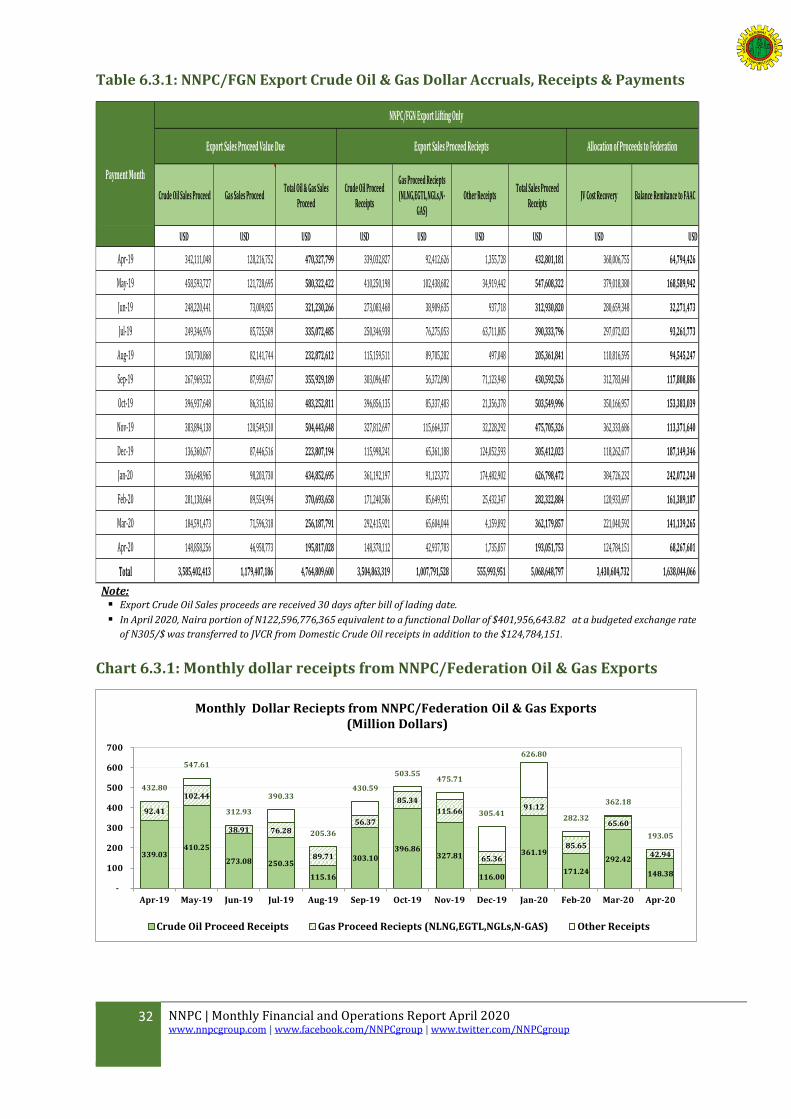
32 NNPC | Monthly Financial and Operations Report April 2020 www.nnpcgroup.com | www.facebook.com/NNPCgroup | www.twitter.com/NNPCgroup
Table 6.3.1: NNPC/FGN Export Crude Oil & Gas Dollar Accruals, Receipts & Payments
Crude Oil Sales Proceed Gas Sales Proceed Total Oil & Gas Sales
ProceedCrude Oil Proceed
Receipts
Gas Proceed Reciepts
(NLNG,EGTL,NGLs,N-
GAS)
Other ReceiptsTotal Sales Proceed
ReceiptsJV Cost Recovery Balance Remitance to FAAC
USD USD USD USD USD USD USD USD USD
Apr-19 342,111,048 128,216,752 470,327,799 339,032,827 92,412,626 1,355,728 432,801,181 368,006,755 64,794,426
May-19 458,593,727 121,728,695 580,322,422 410,250,198 102,438,682 34,919,442 547,608,322 379,018,380 168,589,942
Jun-19 248,220,441 73,009,825 321,230,266 273,083,468 38,909,635 937,718 312,930,820 280,659,348 32,271,473
Jul-19 249,346,976 85,725,509 335,072,485 250,346,938 76,275,053 63,711,805 390,333,796 297,072,023 93,261,773
Aug-19 150,730,868 82,141,744 232,872,612 115,159,511 89,705,282 497,048 205,361,841 110,816,595 94,545,247
Sep-19 267,969,532 87,959,657 355,929,189 303,096,487 56,372,090 71,123,948 430,592,526 312,783,640 117,808,886
Oct-19 396,937,648 86,315,163 483,252,811 396,856,135 85,337,483 21,356,378 503,549,996 350,166,957 153,383,039
Nov-19 383,894,138 120,549,510 504,443,648 327,812,697 115,664,337 32,228,292 475,705,326 362,333,686 113,371,640
Dec-19 136,360,677 87,446,516 223,807,194 115,998,241 65,361,188 124,052,593 305,412,023 118,262,677 187,149,346
Jan-20 336,648,965 98,203,730 434,852,695 361,192,197 91,123,372 174,482,902 626,798,472 384,726,232 242,072,240
Feb-20 281,138,664 89,554,994 370,693,658 171,240,586 85,649,951 25,432,347 282,322,884 120,933,697 161,389,187
Mar-20 184,591,473 71,596,318 256,187,791 292,415,921 65,604,044 4,159,892 362,179,857 221,040,592 141,139,265
Apr-20 148,858,256 46,958,773 195,817,028 148,378,112 42,937,783 1,735,857 193,051,753 124,784,151 68,267,601
Total 3,585,402,413 1,179,407,186 4,764,809,600 3,504,863,319 1,007,791,528 555,993,951 5,068,648,797 3,430,604,732 1,638,044,066
NNPC/FGN Export Lifting Only
Allocation of Proceeds to FederationExport Sales Proceed Reciepts
Payment Month
Export Sales Proceed Value Due
Note: Export Crude Oil Sales proceeds are received 30 days after bill of lading date.
In April 2020, Naira portion of N122,596,776,365 equivalent to a functional Dollar of $401,956,643.82 at a budgeted exchange rate
of N305/$ was transferred to JVCR from Domestic Crude Oil receipts in addition to the $124,784,151.
Chart 6.3.1: Monthly dollar receipts from NNPC/Federation Oil & Gas Exports
339.03410.25
273.08 250.35
115.16
303.10396.86
327.81
116.00
361.19
171.24
292.42
148.38
92.41
102.44
38.91 76.28
89.71
56.37
85.34
115.66
65.36
91.12
85.65
65.60
42.94
432.80
547.61
312.93
390.33
205.36
430.59
503.55475.71
305.41
626.80
282.32
362.18
193.05
-
100
200
300
400
500
600
700
Apr-19 May-19 Jun-19 Jul-19 Aug-19 Sep-19 Oct-19 Nov-19 Dec-19 Jan-20 Feb-20 Mar-20 Apr-20
Monthly Dollar Reciepts from NNPC/Federation Oil & Gas Exports(Million Dollars)
Crude Oil Proceed Receipts Gas Proceed Reciepts (NLNG,EGTL,NGLs,N-GAS) Other Receipts
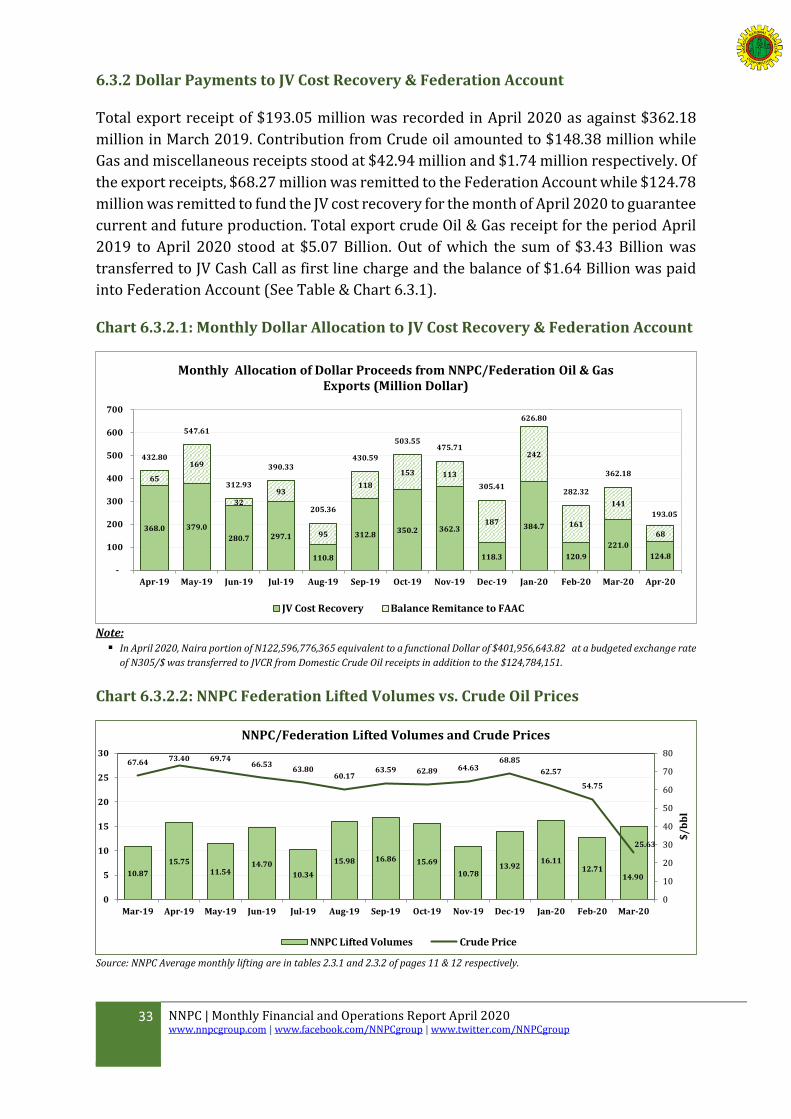
33 NNPC | Monthly Financial and Operations Report April 2020 www.nnpcgroup.com | www.facebook.com/NNPCgroup | www.twitter.com/NNPCgroup
6.3.2 Dollar Payments to JV Cost Recovery & Federation Account
Total export receipt of $193.05 million was recorded in April 2020 as against $362.18
million in March 2019. Contribution from Crude oil amounted to $148.38 million while
Gas and miscellaneous receipts stood at $42.94 million and $1.74 million respectively. Of
the export receipts, $68.27 million was remitted to the Federation Account while $124.78
million was remitted to fund the JV cost recovery for the month of April 2020 to guarantee
current and future production. Total export crude Oil & Gas receipt for the period April
2019 to April 2020 stood at $5.07 Billion. Out of which the sum of $3.43 Billion was
transferred to JV Cash Call as first line charge and the balance of $1.64 Billion was paid
into Federation Account (See Table & Chart 6.3.1).
Chart 6.3.2.1: Monthly Dollar Allocation to JV Cost Recovery & Federation Account
Note:
In April 2020, Naira portion of N122,596,776,365 equivalent to a functional Dollar of $401,956,643.82 at a budgeted exchange rate
of N305/$ was transferred to JVCR from Domestic Crude Oil receipts in addition to the $124,784,151.
Chart 6.3.2.2: NNPC Federation Lifted Volumes vs. Crude Oil Prices
Source: NNPC Average monthly lifting are in tables 2.3.1 and 2.3.2 of pages 11 & 12 respectively.
368.0 379.0
280.7 297.1
110.8
312.8350.2 362.3
118.3
384.7
120.9
221.0
124.8
65
169
32
93
95
118
153 113
187
242
161
141
68
432.80
547.61
312.93
390.33
205.36
430.59
503.55475.71
305.41
626.80
282.32
362.18
193.05
-
100
200
300
400
500
600
700
Apr-19 May-19 Jun-19 Jul-19 Aug-19 Sep-19 Oct-19 Nov-19 Dec-19 Jan-20 Feb-20 Mar-20 Apr-20
Monthly Allocation of Dollar Proceeds from NNPC/Federation Oil & Gas Exports (Million Dollar)
JV Cost Recovery Balance Remitance to FAAC
10.87
15.75
11.5414.70
10.34
15.98 16.86 15.69
10.7813.92
16.1112.71
14.90
67.64 73.40 69.7466.53
63.8060.17
63.59 62.89 64.6368.85
62.57
54.75
25.63
0
10
20
30
40
50
60
70
80
0
5
10
15
20
25
30
Mar-19 Apr-19 May-19 Jun-19 Jul-19 Aug-19 Sep-19 Oct-19 Nov-19 Dec-19 Jan-20 Feb-20 Mar-20
$/
bb
l
Mil
lio
ns
Ba
rre
ls
NNPC/Federation Lifted Volumes and Crude Prices
NNPC Lifted Volumes Crude Price
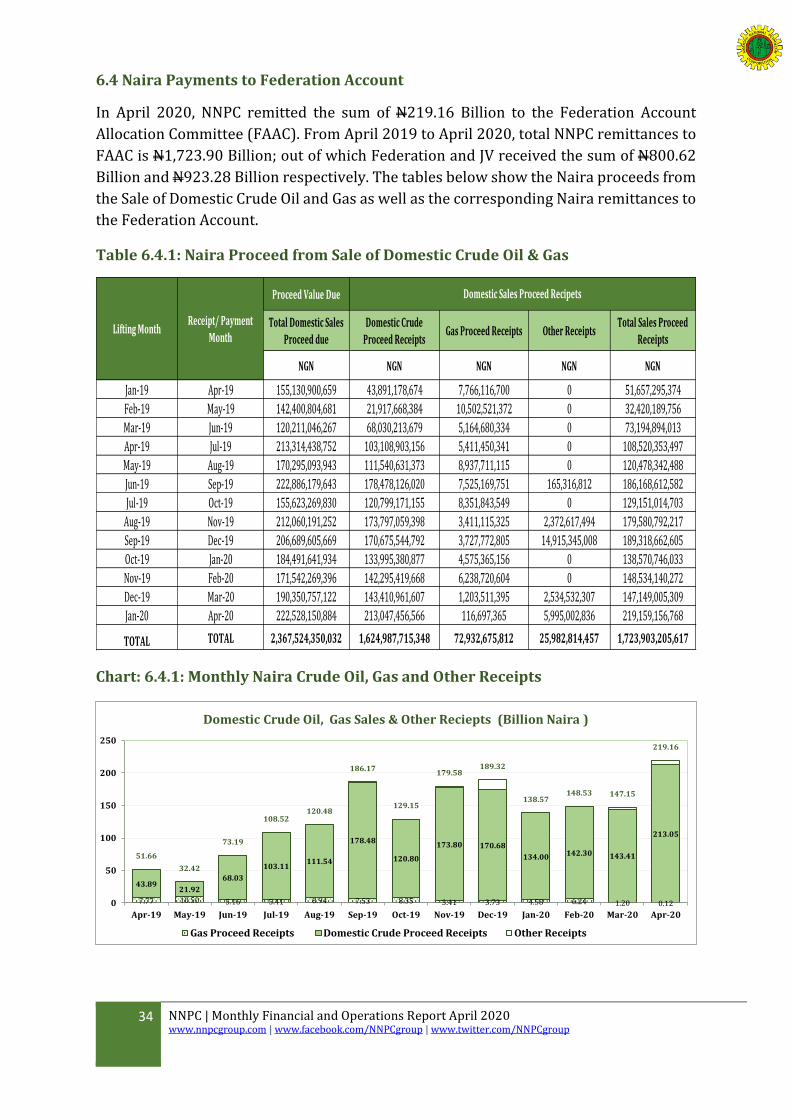
34 NNPC | Monthly Financial and Operations Report April 2020 www.nnpcgroup.com | www.facebook.com/NNPCgroup | www.twitter.com/NNPCgroup
6.4 Naira Payments to Federation Account
In April 2020, NNPC remitted the sum of N219.16 Billion to the Federation Account
Allocation Committee (FAAC). From April 2019 to April 2020, total NNPC remittances to
FAAC is N1,723.90 Billion; out of which Federation and JV received the sum of N800.62
Billion and N923.28 Billion respectively. The tables below show the Naira proceeds from
the Sale of Domestic Crude Oil and Gas as well as the corresponding Naira remittances to
the Federation Account.
Table 6.4.1: Naira Proceed from Sale of Domestic Crude Oil & Gas
Proceed Value Due
Total Domestic Sales
Proceed due
Domestic Crude
Proceed ReceiptsGas Proceed Receipts Other Receipts
Total Sales Proceed
Receipts
NGN NGN NGN NGN NGN
Jan-19 Apr-19 155,130,900,659 43,891,178,674 7,766,116,700 0 51,657,295,374
Feb-19 May-19 142,400,804,681 21,917,668,384 10,502,521,372 0 32,420,189,756
Mar-19 Jun-19 120,211,046,267 68,030,213,679 5,164,680,334 0 73,194,894,013
Apr-19 Jul-19 213,314,438,752 103,108,903,156 5,411,450,341 0 108,520,353,497
May-19 Aug-19 170,295,093,943 111,540,631,373 8,937,711,115 0 120,478,342,488
Jun-19 Sep-19 222,886,179,643 178,478,126,020 7,525,169,751 165,316,812 186,168,612,582
Jul-19 Oct-19 155,623,269,830 120,799,171,155 8,351,843,549 0 129,151,014,703
Aug-19 Nov-19 212,060,191,252 173,797,059,398 3,411,115,325 2,372,617,494 179,580,792,217
Sep-19 Dec-19 206,689,605,669 170,675,544,792 3,727,772,805 14,915,345,008 189,318,662,605
Oct-19 Jan-20 184,491,641,934 133,995,380,877 4,575,365,156 0 138,570,746,033
Nov-19 Feb-20 171,542,269,396 142,295,419,668 6,238,720,604 0 148,534,140,272
Dec-19 Mar-20 190,350,757,122 143,410,961,607 1,203,511,395 2,534,532,307 147,149,005,309
Jan-20 Apr-20 222,528,150,884 213,047,456,566 116,697,365 5,995,002,836 219,159,156,768
TOTAL TOTAL 2,367,524,350,032 1,624,987,715,348 72,932,675,812 25,982,814,457 1,723,903,205,617
Receipt/ Payment
MonthLifting Month
Domestic Sales Proceed Recipets
Chart: 6.4.1: Monthly Naira Crude Oil, Gas and Other Receipts
7.77 10.50 5.16 5.41 8.94 7.53 8.35 3.41 3.73 4.58 6.24 1.20 0.12
43.8921.92
68.03
103.11111.54
178.48
120.80
173.80 170.68
134.00 142.30 143.41
213.05
51.66
32.42
73.19
108.52120.48
186.17
129.15
179.58189.32
138.57148.53 147.15
219.16
0
50
100
150
200
250
Apr-19 May-19 Jun-19 Jul-19 Aug-19 Sep-19 Oct-19 Nov-19 Dec-19 Jan-20 Feb-20 Mar-20 Apr-20
Domestic Crude Oil, Gas Sales & Other Reciepts (Billion Naira )
Gas Proceed Receipts Domestic Crude Proceed Receipts Other Receipts
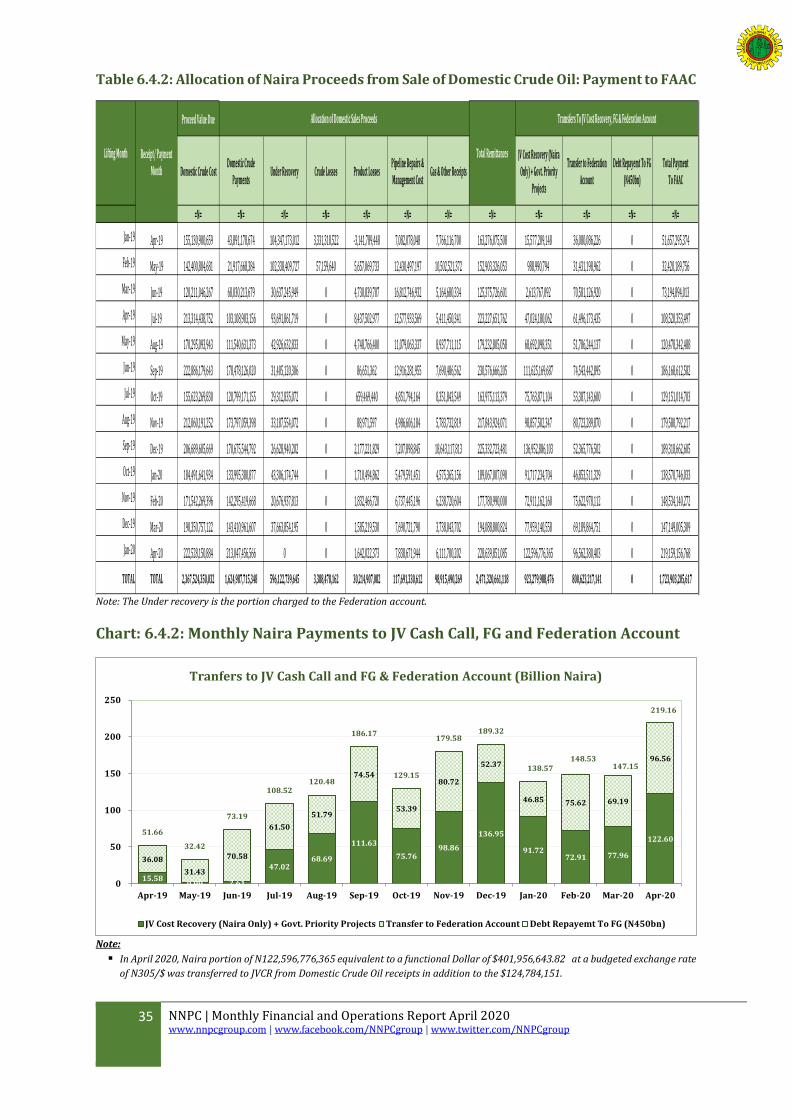
35 NNPC | Monthly Financial and Operations Report April 2020 www.nnpcgroup.com | www.facebook.com/NNPCgroup | www.twitter.com/NNPCgroup
Table 6.4.2: Allocation of Naira Proceeds from Sale of Domestic Crude Oil: Payment to FAAC
Proceed Value Due
Domestic Crude CostDomestic Crude
PaymentsUnder Recovery Crude Losses Product Losses
Pipeline Repairs &
Management CostGas & Other Receipts
JV Cost Recovery (Naira
Only) + Govt. Priority
Projects
Transfer to Federation
Account
Debt Repayemt To FG
(N450bn)
Total Payment
To FAAC
=N= =N= =N= =N= =N= =N= =N= =N= =N= =N= =N= =N=
Jan-19 Apr-19 155,130,900,659 43,891,178,674 104,347,173,012 3,331,318,522 -3,141,789,448 7,082,078,048 7,766,116,700 163,276,075,508 15,577,209,148 36,080,086,226 0 51,657,295,374
Feb-19 May-19 142,400,804,681 21,917,668,384 102,338,409,727 57,159,640 5,657,069,733 12,430,497,197 10,502,521,372 152,903,326,053 988,990,794 31,431,198,962 0 32,420,189,756
Mar-19 Jun-19 120,211,046,267 68,030,213,679 30,637,245,949 0 4,730,839,707 16,812,746,932 5,164,680,334 125,375,726,601 2,613,767,092 70,581,126,920 0 73,194,894,013
Apr-19 Jul-19 213,314,438,752 103,108,903,156 93,691,861,719 0 8,437,502,977 12,577,933,569 5,411,450,341 223,227,651,762 47,024,180,062 61,496,173,435 0 108,520,353,497
May-19 Aug-19 170,295,093,943 111,540,631,373 42,926,632,833 0 4,748,766,400 11,079,063,337 8,937,711,115 179,232,805,058 68,692,098,351 51,786,244,137 0 120,478,342,488
Jun-19 Sep-19 222,886,179,643 178,478,126,020 31,405,120,306 0 86,651,362 12,916,281,955 7,690,486,562 230,576,666,205 111,625,169,687 74,543,442,895 0 186,168,612,582
Jul-19 Oct-19 155,623,269,830 120,799,171,155 29,312,835,072 0 659,469,440 4,851,794,164 8,351,843,549 163,975,113,379 75,763,871,104 53,387,143,600 0 129,151,014,703
Aug-19 Nov-19 212,060,191,252 173,797,059,398 33,187,554,072 0 88,971,597 4,986,606,184 5,783,732,819 217,843,924,071 98,857,502,347 80,723,289,870 0 179,580,792,217
Sep-19 Dec-19 206,689,605,669 170,675,544,792 26,628,940,202 0 2,177,221,829 7,207,898,845 18,643,117,813 225,332,723,481 136,952,886,103 52,365,776,502 0 189,318,662,605
Oct-19 Jan-20 184,491,641,934 133,995,380,877 43,306,174,744 0 1,710,494,862 5,479,591,451 4,575,365,156 189,067,007,090 91,717,234,704 46,853,511,329 0 138,570,746,033
Nov-19 Feb-20 171,542,269,396 142,295,419,668 20,676,937,813 0 1,832,466,720 6,737,445,196 6,238,720,604 177,780,990,000 72,911,162,160 75,622,978,112 0 148,534,140,272
Dec-19 Mar-20 190,350,757,122 143,410,961,607 37,663,854,195 0 1,585,219,530 7,690,721,790 3,738,043,702 194,088,800,824 77,959,140,558 69,189,864,751 0 147,149,005,309
Jan-20 Apr-20 222,528,150,884 213,047,456,566 0 0 1,642,022,373 7,838,671,944 6,111,700,202 228,639,851,085 122,596,776,365 96,562,380,403 0 219,159,156,768
TOTAL TOTAL 2,367,524,350,032 1,624,987,715,348 596,122,739,645 3,388,478,162 30,214,907,082 117,691,330,612 98,915,490,269 2,471,320,661,118 923,279,988,476 800,623,217,141 0 1,723,903,205,617
Receipt/ Payment
Month
Lifting Month
Tramsfers To JV Cost Recovery, FG & Federation Account
Total Remittances
Allocation of Domestic Sales Proceeds
Note: The Under recovery is the portion charged to the Federation account.
Chart: 6.4.2: Monthly Naira Payments to JV Cash Call, FG and Federation Account
Note:
In April 2020, Naira portion of N122,596,776,365 equivalent to a functional Dollar of $401,956,643.82 at a budgeted exchange rate
of N305/$ was transferred to JVCR from Domestic Crude Oil receipts in addition to the $124,784,151.
15.580.99 2.61
47.0268.69
111.63
75.7698.86
136.95
91.7272.91 77.96
122.60
36.08
31.43
70.58
61.50
51.79
74.54
53.39
80.72
52.37
46.85 75.62 69.19
96.56
51.66
32.42
73.19
108.52120.48
186.17
129.15
179.58189.32
138.57148.53
147.15
219.16
0
50
100
150
200
250
Apr-19 May-19 Jun-19 Jul-19 Aug-19 Sep-19 Oct-19 Nov-19 Dec-19 Jan-20 Feb-20 Mar-20 Apr-20
Tranfers to JV Cash Call and FG & Federation Account (Billion Naira)
JV Cost Recovery (Naira Only) + Govt. Priority Projects Transfer to Federation Account Debt Repayemt To FG (N450bn)
36 NNPC | Monthly Financial and Operations Report April 2020 www.nnpcgroup.com | www.facebook.com/NNPCgroup | www.twitter.com/NNPCgroup
7.0 Key Determinants for Change
7.1 Key events and activities during the period
NNPC to Tackle Oil Revenue Shortfall with Production Cost Cuts
As a way of tackling the dip in oil revenue owing to the global glut in supply and
consequent crash in the price of crude oil resulting from the COVID-19 pandemic, the
Nigerian National Petroleum Corporation (NNPC) is looking at introducing cost-cutting
measures aimed at reducing the overall cost of producing crude oil in the country. This
was disclosed by the Group Managing Director (GMD) of the corporation at a Round-
Table organised by the Central Bank of Nigeria to brainstorm on ways to shore up
revenues in the face of the drastic fall in price of crude oil which is the country’s main
earner.
On some of the specific steps to be taken to drive down production cost, Mallam Kyari
stated: “We will cut down our cost by slowing down or pushing forward projects that do
not support current realities. We will also cut down certain services that are not required
today. All these can ultimately help us balance our books in such a way that we are still
able to operate and meet our obligations to our shareholders who are all the citizens of
Nigeria”.
NNPC Considers Adopting NLNG Model for Refineries
In a bid to ensure sustainability in the operations of the nation’s refineries post-
rehabilitation, the Nigerian National Petroleum Corporation (NNPC) is considering
adopting the NLNG model for their operations. In an interview on Arise TV Breakfast
Programme, The Morning Show, NNPC Group Managing Director, Mallam Kyari, stated
that upon completion of the ongoing rehabilitation exercise, the Corporation would
engage the services of a company which would manage the plants on an Operations and
Maintenance (O&M) basis in the interim. On the plans to sustainably run the refineries,
the GMD declared the involvement of private companies that would invest their monies
upon prescription to adopt the NLNG model which will be a joint ownership between
NNPC and private sector companies. Consequently, decision-making will not rest with the
NNPC alone.
NNPC Corporate Planning Division Receives ISO Certification in Quality
Management System
The Nigerian National Petroleum Corporation (NNPC) has received ISO certification in
Quality Management System covering the processes and services of its Corporate
Planning and Strategy Division. The ISO 90001:2015 Certificate was presented to the
Group Managing Director, Mallam Mele Kyari, in his office at the NNPC Towers, Abuja by
the Group General Manager, Corporate Planning and Strategy, Mrs. Orisemeyiwa Eyesan.
At the event, Mallam Kyari said the skill pool in the Corporation’s workforce is second to
37 NNPC | Monthly Financial and Operations Report April 2020 www.nnpcgroup.com | www.facebook.com/NNPCgroup | www.twitter.com/NNPCgroup
none in the nation’s public service sector. He said NNPC would leverage on the ISO
90001:2015 certification to ensure that all its Strategic Business Units and entities
acquire necessary certifications to enhance their operations, noting that his leadership
was committed to the agenda of Performance Excellence.
Kerosene: FG to Deepen Use of LPG as Substitute
Federal Government policy aimed at encouraging widespread adoption of Liquefied
Petroleum Gas (LPG) as domestic cooking fuel in place of kerosene among Nigerian
households is in the offing. This was disclosed by the Group Managing Director of the
Nigerian National Petroleum Corporation (NNPC), Mallam Mele Kyari. Speaking on the
Channels TV breakfast show, Sunrise Daily, on the high cost of kerosene and what the
government was doing to keep it within the reach of the average Nigerian, the GMD
explained that the focus was rather on how to migrate all those who were still using
kerosene for domestic cooking to the use of LPG which is popularly known as cooking
gas. According to him, apart from the LPG being a cheaper fuel than kerosene, it is also
safer and more environmental friendly. He explained that there was not much that could
be done to bring down the price of kerosene as its price was usually directly affected by
the price of aviation fuel since they are used interchangeably as substitutes.
COVID-19: Petroleum Industry’s N21bn Support to be Delivered in Kind
The N21bn support pledged by the Nigerian National Petroleum Corporation (NNPC) and
its partners in the oil and gas industry for the fight against the Coronavirus (COVID-19)
pandemic in the country will be delivered in kind in the form of medical consumables,
equipment and facilities. This clarification was made by the Group Managing Director of
NNPC, Mallam Mele Kyari, in a series of interviews on television breakfast show where
he stated that no part of the support would be given in cash. Reason being the peculiar
governance system of the NNPC partners which made it difficult for them to make cash
donations. But they will be able to use their respective Corporate Social Responsibility
(CSR) and procurement systems to ensure that the equipment and projects are on
ground.
The NNPC boss further mentioned that the support would come in the form of medical
consumable and in-patient support equipment like hospital beds, ventilators and min-
oxygen plants. The support would also be in the form of 250-bed capacity temporary
isolation centres and permanent health infrastructures that would outlast the COVID-19
pandemic. Furthermore, Mallam Kyari clarified that the N21bn petroleum industry
support was in addition to the regular CSR initiatives of each of the partner companies.
7.2 Key challenges
The following are some key setbacks that affected production in the month:
38 NNPC | Monthly Financial and Operations Report April 2020 www.nnpcgroup.com | www.facebook.com/NNPCgroup | www.twitter.com/NNPCgroup
i. FORCADOS TERMINAL
Batan flow station came down due to trip alarm on the ABB HV switchgera
which led to generator shutting down with10kbd shut-in in 6 days. Opuama
and Otumara flowstations were also shut down on 01/11/19 for 13 days
due to leaks and suspected illegal connection on the TEP with loss of 50kbd.
ii. BONGA TERMINAL
Production shut-down for 3 days due to power loss initiated by a smoke
detection alarm activation which led to ESD. Total loss was 51,000 bpd.
iii. OGU OCHA TERMINAL
Odidi flow station was shut down for 5 days to commission the VIOSS with
shut-in of 20kbd while Jones Creek flow station shutdown over 4 days for
debottlenecking and statutory inspection of pressure vessels and release
valves. 17kbd shut-in.
iv. ERHA TERMINAL
Production shut-in due to emergency for 6 days with aggregate loss of
320,470barrels.
v. BONNY TERMINAL
NCTL shutdown due to leaks on Botokiri axis from 31/10/19 - 11/11/19
(12 days) with shut-in of 120kpd. NCTL was also shut down for 8 days due
to second leak along Cawthorne channel 2 Axis with production cut of
approximately 110kbd. Cumulative loss of production within the period
was 2,320,000 barrels.
vi. AMENAM TERMINAL
OML 102: Well closed due to unavailability of MP/HP compressor B
(Shortfall of 8,393bbls). MP/HP compressor A TRIP on VSD high
temperature due to unavailabilty of OFP 2 HVAC (Shortfall of 10,021bbls).
Equally on OML 102: Field shut down following ESD OFP1 / OFP2 due to
LSHH on HP flare knockout drum with shortfall of 22,396 bbls).
vii. EGINA TERMINAL
This was shut-in 8 times in course of the month due to low /loss of electrical
power from switchgear faults. Cumulative loss was 54,407 barrels.
viii. AKPO TERMINAL
Production dropped due to confirmed gas detection. Also plant trip due to
false gas detection caused by dust cloud from sand blasting as well as
unavailability of gas compressor. Cumulative loss is 84,654 barrels.
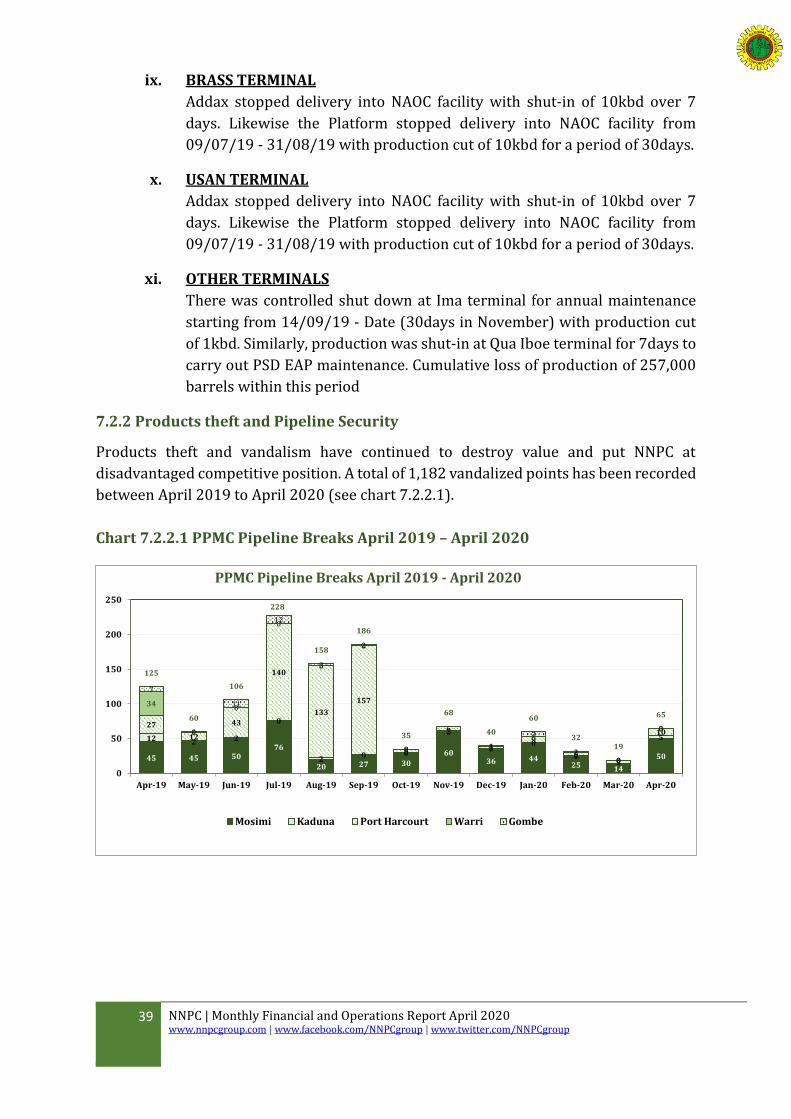
39 NNPC | Monthly Financial and Operations Report April 2020 www.nnpcgroup.com | www.facebook.com/NNPCgroup | www.twitter.com/NNPCgroup
ix. BRASS TERMINAL
Addax stopped delivery into NAOC facility with shut-in of 10kbd over 7
days. Likewise the Platform stopped delivery into NAOC facility from
09/07/19 - 31/08/19 with production cut of 10kbd for a period of 30days.
x. USAN TERMINAL
Addax stopped delivery into NAOC facility with shut-in of 10kbd over 7
days. Likewise the Platform stopped delivery into NAOC facility from
09/07/19 - 31/08/19 with production cut of 10kbd for a period of 30days.
xi. OTHER TERMINALS
There was controlled shut down at Ima terminal for annual maintenance
starting from 14/09/19 - Date (30days in November) with production cut
of 1kbd. Similarly, production was shut-in at Qua Iboe terminal for 7days to
carry out PSD EAP maintenance. Cumulative loss of production of 257,000
barrels within this period
7.2.2 Products theft and Pipeline Security
Products theft and vandalism have continued to destroy value and put NNPC at
disadvantaged competitive position. A total of 1,182 vandalized points has been recorded
between April 2019 to April 2020 (see chart 7.2.2.1).
Chart 7.2.2.1 PPMC Pipeline Breaks April 2019 – April 2020
45 45 5076
20 27 30
6036 44
25 14
50
12 2 2
0
20 0
0
00
05
5
27
12
43
140
133
157
5
2
39
50
10
34
1
0
0
0
0
0
0
00
00
0
7
0
11
12
3
2
0
6
1
7
20
0
125
60
106
228
158
186
35
68
40
60
3219
65
0
50
100
150
200
250
Apr-19 May-19 Jun-19 Jul-19 Aug-19 Sep-19 Oct-19 Nov-19 Dec-19 Jan-20 Feb-20 Mar-20 Apr-20
PPMC Pipeline Breaks April 2019 - April 2020
Mosimi Kaduna Port Harcourt Warri Gombe

40 NNPC | Monthly Financial and Operations Report April 2020 www.nnpcgroup.com | www.facebook.com/NNPCgroup | www.twitter.com/NNPCgroup
8 Glossary and Definition of Terms
AF Alternative Funding (Financing)
AGO Automotive Gas Oil
B/L Bill of Lading
BBLS Barrels
CA Carry Agreement
CBN Central Bank of Nigeria
DPK Dual Purpose Kerosene
DPR Department of Petroleum Resources
DSDP Direct Sales Direct Purchase
EGTL Escravos Gas to Liquid
FCCU Fluid Catalytic Cracking Unit
FX Foreign Exchange
FAAC Federation Account Allocation Committee
FACTI Focused, Accountable, Competitive & Transparent with Integrity
FGN Federal Government of Nigeria
FIRS Federal Inland Revenue Service
IOCs International Oil Companies
JV(s) Joint Ventures
JVCC Joint Venture Cash Call
LPG Liquefied Petroleum Gas
MCA Modified Carry Agreement
MMBTU Million British Thermal Unit
M-O-M Month-on-Month
MT Metric Tons
NGL Natural Gas Liquid
NLNG Nigerian Liquefied Natural Gas
NNPC Nigerian National Petroleum Corporation
NPDC Nigerian Petroleum Development Company
OECD Organization for Economic Co-operation and Development
OPA Offshore Processing Agreement
PMS Premium Motor Spirit
PPMC Pipelines and Products Marketing Company
PPPRA Petroleum Products Pricing Regulatory Agency
PPT Petroleum Profit Tax
PSC Production Sharing Contract
PTD Period to Date
QIT Qua Iboe Terminal
QTY Quantity
RDP Reserve Development Project
SC Service Contract
SOF Satellite Oil Field Project
TM Trial Marketing
TMP Trial Marketing Period WTI West Texas Intermediate Y-O-Y Year-on-Year YTD Year-to-Date
41 NNPC | Monthly Financial and Operations Report April 2020 www.nnpcgroup.com | www.facebook.com/NNPCgroup | www.twitter.com/NNPCgroup
Explanatory Notes
Federation Equity Crude Oil & Gas Export Sales
Export sales proceeds are receivable 30 days after B/L date.
About 61% of the NGL sales are dedicated for servicing the NGL II Project debt’s
obligations. The balance is transferred into the Federation Account as price
balance.
NLNG feedstock: Gas supplied by NNPC/JV partners to NLNG.
Domestic Crude Oil Costs
445,000 barrels/day of crude oil is allocated to NNPC for the purpose of supplying
refined products for domestic consumption.
NNPC purchases its allocated crude oil from the Federation at the prevailing
International market price per barrel and payment is due 90 days after the B/L
date.
NNPC obligations are paid in Naira based on CBN determined exchange rate in the
month of lifting.
Remittances To FAAC
Domestic Gas: Revenues received from NNPC Joint Ventures for Gas sales in
Domestic market e.g. - Gas sales to Indorama, IPPs, and NGC etc.
Miscellaneous Income consists of the following:
(a) Assets disposal income
(b) Ullage fees
(c) Osubi air strip
(d) JP Morgan Bank Account interest
(e) Price balance from Third Party financing e.g. RDP, SOF, NGLII
(f) Revenue from Afam-Power
(g) Insurance Claims settlement etc.
FIRS PPT And DPR Royalty Remittances
Receipts from PPT and Royalty crude lifting are paid directly into FIRS/CBN JP
Morgan Accounts and DPR/CBN JP Morgan Accounts respectively without involvement of NNPC in the collection process.