Shared Research Monthly Wrap - April 2014 - IR Street
77
1 / 77 Shared Research Monthly Wrap - April 2014 This PDF document is an updated note on the company. A comprehensive version of the report on the company, including this latest update, is available on our website at http://www.sharedresearch.jp and various professional platforms. Our sponsored research reports provide an in-depth and informative view of the companies we cover, and contain the latest available information updated in a timely manner. Shared Research Inc. has produced this report to provide monthly updates on its coverage to investors. We at Shared Research Inc. make every effort to provide an accurate, objective, and neutral analysis. In order to highlight any biases, we clearly attribute our data and findings. We will always present opinions from company management as such. Our views are ours where stated. We appreciate your suggestions and feedback. Write to us at [email protected] or find us on Bloomberg Copyright (C) 2013 Shared Research Inc. All Rights Reserved. TABLE OF CONTENTS Monthly musings......................................................................................................................... 3 Market view from Sendagi ........................................................................................................... 3 New Coverage ............................................................................................................................ 7 ArtSpark Holdings Inc. (3663)..................................................................................................... 7 Gulliver International Co., Ltd. (7599) ........................................................................................ 13 Happinet Corporation (7552) .................................................................................................... 19 J Trust Co Ltd (8508) ............................................................................................................... 25 Star Mica (3230)...................................................................................................................... 31 March 2014 Client Updates ........................................................................................................ 37 3-D Matrix, Ltd. (7777) ............................................................................................................ 37 Ai Holdings Corp. (3076) .......................................................................................................... 38 Apamanshop Holdings Co., Ltd. (8889) ...................................................................................... 39 Bell-Park Co., Ltd. (9441) ......................................................................................................... 40 Chiome Bioscience Inc. (4583).................................................................................................. 42 Chiyoda Co., Ltd. (8185) .......................................................................................................... 43 DIC Corporation (4631) ............................................................................................................ 43 Digital Garage Inc. (4819) ........................................................................................................ 44 Don Quijote Co., Ltd. (7532) ..................................................................................................... 45 Emergency Assistance Japan Co., Ltd. (6063) ............................................................................. 46 en–japan Inc. (4849) ............................................................................................................... 47 Fields Corp. (2767) .................................................................................................................. 48 FreeBit Co., Ltd. (3843) ............................................................................................................ 49 GCA Savvian Corp. (2174) ........................................................................................................ 50 Infomart Corp. (2492) .............................................................................................................. 51 Intelligent Wave Inc. (4847) ................................................................................................... 52 Ito En, Ltd. (2593) ................................................................................................................ 53 JIN Co., Ltd. (3046) ................................................................................................................. 54 Kenedix, Inc. (4321) ................................................................................................................ 55 Mac-House Co., Ltd. (7603) ...................................................................................................... 56 Medinet Co., Ltd. (2370) .......................................................................................................... 57 mobcast inc. (3664) ................................................................................................................. 58 NAIGAI TRANS LINE LTD. (9384) .............................................................................................. 59 NanoCarrier Co. (4571) .......................................................................................................... 60 Nippon Parking Development (2353) ......................................................................................... 61 NS TOOL Co., Ltd. (6157) ......................................................................................................... 62 Paris Miki Holdings Inc. (7455) ................................................................................................. 62 Pigeon Corp. (7956) ............................................................................................................... 63 Resorttrust, Inc. (4681)............................................................................................................ 64 Round One Corp. (4680) .......................................................................................................... 65 Sanix Incorporated (4651) ........................................................................................................ 66 Sanrio Co., Ltd. (8136) ............................................................................................................. 67 Ship Healthcare Holdings Inc. (3360) ....................................................................................... 68
-
Upload
khangminh22 -
Category
Documents
-
view
1 -
download
0
Transcript of Shared Research Monthly Wrap - April 2014 - IR Street

1 / 77
Shared Research Monthly Wrap - April 2014
This PDF document is an updated note on the company. A comprehensive version of the report on the company, including this latest update, is
available on our website at http://www.sharedresearch.jp and various professional platforms. Our sponsored research reports provide an in-depth
and informative view of the companies we cover, and contain the latest available information updated in a timely manner.
Shared Research Inc. has produced this report to provide monthly updates on its coverage to investors. We at Shared Research Inc. make every
effort to provide an accurate, objective, and neutral analysis.
In order to highlight any biases, we clearly attribute our data and findings. We will always present opinions from company management as such.
Our views are ours where stated.
We appreciate your suggestions and feedback. Write to us at [email protected] or find us on Bloomberg
Copyright (C) 2013 Shared Research Inc. All Rights Reserved.
TABLE OF CONTENTS
Monthly musings......................................................................................................................... 3 Market view from Sendagi ........................................................................................................... 3 New Coverage ............................................................................................................................ 7 ArtSpark Holdings Inc. (3663) ..................................................................................................... 7 Gulliver International Co., Ltd. (7599) ........................................................................................ 13 Happinet Corporation (7552) .................................................................................................... 19 J Trust Co Ltd (8508) ............................................................................................................... 25 Star Mica (3230) ...................................................................................................................... 31
March 2014 Client Updates ........................................................................................................ 37 3-D Matrix, Ltd. (7777) ............................................................................................................ 37 Ai Holdings Corp. (3076) .......................................................................................................... 38 Apamanshop Holdings Co., Ltd. (8889) ...................................................................................... 39 Bell-Park Co., Ltd. (9441) ......................................................................................................... 40 Chiome Bioscience Inc. (4583) .................................................................................................. 42 Chiyoda Co., Ltd. (8185) .......................................................................................................... 43 DIC Corporation (4631) ............................................................................................................ 43 Digital Garage Inc. (4819) ........................................................................................................ 44 Don Quijote Co., Ltd. (7532) ..................................................................................................... 45 Emergency Assistance Japan Co., Ltd. (6063) ............................................................................. 46 en–japan Inc. (4849) ............................................................................................................... 47 Fields Corp. (2767) .................................................................................................................. 48 FreeBit Co., Ltd. (3843) ............................................................................................................ 49 GCA Savvian Corp. (2174) ........................................................................................................ 50 Infomart Corp. (2492) .............................................................................................................. 51 Intelligent Wave Inc. (4847) ................................................................................................... 52 Ito En, Ltd. (2593) ................................................................................................................ 53 JIN Co., Ltd. (3046) ................................................................................................................. 54 Kenedix, Inc. (4321) ................................................................................................................ 55 Mac-House Co., Ltd. (7603) ...................................................................................................... 56 Medinet Co., Ltd. (2370) .......................................................................................................... 57 mobcast inc. (3664) ................................................................................................................. 58 NAIGAI TRANS LINE LTD. (9384) .............................................................................................. 59 NanoCarrier Co. (4571) .......................................................................................................... 60 Nippon Parking Development (2353) ......................................................................................... 61 NS TOOL Co., Ltd. (6157) ......................................................................................................... 62 Paris Miki Holdings Inc. (7455) ................................................................................................. 62 Pigeon Corp. (7956) ............................................................................................................... 63 Resorttrust, Inc. (4681) ............................................................................................................ 64 Round One Corp. (4680) .......................................................................................................... 65 Sanix Incorporated (4651) ........................................................................................................ 66 Sanrio Co., Ltd. (8136) ............................................................................................................. 67 Ship Healthcare Holdings Inc. (3360) ....................................................................................... 68

2 / 77
MONTHLY WRAP – April 2014
Copyright (C) Shared Research Inc. All Rights Reserved.
SMS Co., Ltd. (2175) ................................................................................................................ 69 Takashimaya Co., Ltd. (8233).................................................................................................... 70 Takihyo Co., Ltd. (9982) ........................................................................................................... 71 Tamagawa Holdings Co., Ltd. (6838) ......................................................................................... 72 Verite Co., Ltd. (9904) .............................................................................................................. 73 WirelessGate Inc (9419) ........................................................................................................... 74 Yellow Hat Ltd (9882) .............................................................................................................. 74 Yumeshin Holdings Co., Ltd. (2362) ........................................................................................... 75 ZAPPALLAS, INC. (3770) .......................................................................................................... 76
To receive this monthly wrap on a regular basis, please contact us at

3 / 77
MONTHLY WRAP – April 2014
Copyright (C) Shared Research Inc. All Rights Reserved.
Monthly musings
Market view from Sendagi
さすが花ちるにみれんはなかりけり
When cherry blossoms scatter… no regrets.
Hanami season is over. Every year, when sakura trees start blossoming in early April, millions of
Japanese perform the same ritual: snap countless pictures of sakura cherry blossoms on cameras and
smartphones; then form groups, secure a tiny patch of ground underneath or near a cherry tree, buy
beer and snacks and get festive, without paying much attention to the abovementioned blossoms. Both
activities reportedly represent traditional Japanese sensibilities—getting touchy-feely about the
ephemeral nature of things while observing fragile cherry blossoms fall down, without regrets or
clinging to the past.
This year the Japanese stock market has joined the cherry blossoms, reminding weary investors that its
nature can be just as ephemeral. The correction is underway. So far, we are firmly in the trading box,
set by last spring’s breakout. Interesting opportunities should emerge from a trading perspective over the
next few weeks. Do we test resistance of the 1,050 level (Topix), also testing the nerves of market
participants, or consolidate for a rally? I repeat that my personal view is a rally, most likely set off by
government policy announcement or its anticipation.
At the same time, I remind myself that currency movements and the “dog that wags the tails”—the US
stocks that indirectly drive the Japanese market—will be key to sustaining the trend. In that sense, the
extended nature of the US bull market—where a bull phase tended to last for roughly five years in
the past few cycles—is a worry. However, in the end markets are driven by economic fundamentals—as
the Oracle of Omaha loves reminding us. US fundamentals appear strong, fueled by cheap energy and
the spirit of capitalism. My confident bet is that Japanese fundamentals will continue to strengthen,
although it is critically important that they strengthen enough.
The Japanese government must hope that its people do not look back, or hold back, now that they’re
paying the brand-new 8% consumption tax from April 1st. The first necessary step toward stabilizing
Japanese public finances has been made. Wage inflation also seems to have started, at least in such
industries as retailing and construction. These are all good things.
I probably represent the domestic consensus when I say that I expect additional quantitative
easing, despite the BOJ’s recent statements to the contrary, and policy announcements in the
coming months. The critically important task has now shifted toward hitting real and nominal GDP
growth targets, the difference being a healthy inflation rate. Japan needs to raise its consumption tax
again next year. This means continued short-term pressures on consumer demand. Higher wages will
offset that but also mean cost pressures for businesses. Overcoming the challenges and definitively
escaping the gravity pull of deflation is not easy.
In the last few installments of the Market View, I’ve discussed productivity growth issues. Specifically for
Japan, my conclusions were:
a) In the 1990-2000s, Japan made a choice to keep the excess labor capacity after the burst of its
economic bubble to maintain social harmony and a uniform standard of living. The country and its
economy paid for this with lower productivity, innovation, and growth;
b) Structural adjustments in the Japanese economy, from baby boomers exiting the workforce, to the
inflationary policies of the BOJ, to new drivers such as the birth of Japan as a worldwide tourist
destination—will mean that productivity should rise incrementally and contribute to economic
growth for at least several years.

4 / 77
MONTHLY WRAP – April 2014
Copyright (C) Shared Research Inc. All Rights Reserved.
However, Japan, like any mature economy, must innovate to grow. It actually must innovate
more than others, enough to offset inevitable and steep decline in population as the country resists
allowing more immigration. After substantial research on the topic of innovation and growth for
developed economies, my conclusion is that the only reliable driver of innovation is economic
freedom. I’ve therefore come full circle in my discussion of the Japanese economy and its issues. I
conclude that to ensure a bright future for its people, Japan needs to foster free enterprise through
deregulation (targeting the labor market and protected sectors) and lower taxes for businesses and
entrepreneurs.
Last time I finished the discussion with this chart, showing the sources of economic growth in several
economies post serious economic crises.
I thought it might be interesting to look at one country in this chart that is known as exceptionally
welfare-oriented but also as an effective and prosperous economy—Finland (I chose it over Sweden for
sentimental reasons).
Located north of my tiny home country of Estonia, Finland has only a slightly smaller territory (338,424 sq.
km) than Japan (377,944 sq. km) but is extremely sparsely populated (only 5.4mn inhabitants compared to
Japan’s 127.6mn and neighboring Sweden’s 9.5mn).
One thing that immediately strikes any observer is that the Finnish economy—like many other economies
in post-war Europe—was heavily regulated until the late 1980s. The government was everywhere—setting
prices for goods, taxing, and licensing. The deep recession of the early 90s, exacerbated by the substantial
dependence of Finnish exports on the Soviet Union—which promptly collapsed in 1991, highlighted the
need for both decisive macroeconomic policy and deregulation.
Deregulation in Finland began as early as 1985, with the establishment of a competition and price
committee which started with setting the guidelines for removing price regulation. In 1989, the country
began a program of administrative reform. At the time Finland had about 1,700 types of administrative
permits, including a large number of business licenses. The country made a wholesale move to a
notification system, as opposed to licensing. That happened, for instance in the real estate business in
1993. The country then liberalized foreign ownership of Finnish companies and joined the EU in 1995,
opening its markets and removing protectionist barriers. The mobile telecommunication network was
opened to competition as early as 1990. Energy sector deregulation followed in 1995.
Discussing the current state of affairs of the Finnish economy is beyond the scope of this essay. Finland

5 / 77
MONTHLY WRAP – April 2014
Copyright (C) Shared Research Inc. All Rights Reserved.
was extremely successful in remaking it from a sleepy overregulated lumber supplier for the Soviet Union
into the dynamic ICT-driven economy that it is now. The country still has its fair share of issues,
highlighting the fact that reforms and deregulation should be a continuous process. However, the Finnish
lesson shows that deregulation works, even for countries with deeply seated problems and structural
disadvantages (for Finland—dependence on the Soviet Union, relative remoteness, and scarce population).
Here in Japan, regulatory reform is also increasingly accepted as good and necessary. The problem
however, starts when anybody tries to actually implement the reform. We at Shared Research had an
opportunity to partially document one farcical example of the deregulation struggle in our upcoming report
on Kenko.com, an online purveyor of health-related merchandise. The seemingly simple issue of
permission to sell drugs online has been stymied by powerful interest groups. Other issues riding high on
the government’s regulatory reform agenda are labor regulatory reform, deregulation of childcare services,
and reform in the energy industry (e.g., separation of the generation and transmission of electricity). On
most of these issues, despite the obvious urgency and apparent simplicity of solutions for at least some of
them, the progress has been slow.
However, slow progress is better than no progress. It appears highly likely that thanks to the stable political
situation (no general elections till 2016), the Abe government will push through more reforms than Japan
has seen in decades. This is precisely what makes me optimistic about the economic performance of this
country over the next 3-7 years. However, whatever happens beyond the current cycle, the secular trend is
more important. My big concern is that the reform in Japan, despite accelerating, may not be enough to
unleash true innovation.
Innovation should not be understood simply as technological innovation or a breakthrough scientific
discovery. Innovation means adding value through new approaches and products, in any field. This view of
innovation demonstrates that the only way for the government to truly support innovation is to create a
more level playing field, and let entrepreneurs dream and realize their dreams—be it making money or
helping the world.
A report by the Asian Studies Center of The Heritage Foundation discusses issues impacting innovation in
Japan and spells out conditions for effective government involvement: let innovation happen everywhere
and not just in the advanced technology field, don’t pre-select desired outcomes, and allow competition to
be the biggest driver of innovation. I couldn’t agree more. Unfortunately, in Japan the government tends to
increase its intervention when it gets excited about something and this is what we observe today with
many initiatives born out of Abenomics.
So the key question may not be “can Japan innovate?” but “can Japan let innovate?” We should start
seeing some answers soon.
Have a nice day,
Oleg Zuravljov
P.S. Here is my usual chart for you.

6 / 77
MONTHLY WRAP – April 2014
Copyright (C) Shared Research Inc. All Rights Reserved.
TOPIX100 PortfolioStart Date Current Date
TPX100 -5.17 2013/10/11 2014/4/14 BIG OW 2.0
Portfolio -5.41 OW 1.5
TPX100 Points MW 1.0
2013/10/11 797.18 UW 0.5
2014/4/14 748.89 BIG UW 0
Ticker NameWeight
Rel. To TPX100
Total Return
(%)Wgt (%) Ticker Name
Weight
Rel. To TPX100
Total Return
(%)Wgt (%)
7203 Toyota Motor Corp UW -15.60 4.1 6273 SMC Corp/Japan MW 7.49 0.7
8306 Mitsubishi UFJ FG BIG OW -14.47 9.2 2503 Kirin Holdings OW -0.44 1.0
8316 Sumitomo Mitsui FG OW -14.83 5.2 5411 JFE Holdings BIG OW -25.74 1.3
9984 Softbank Corp UW -5.98 1.7 7974 Nintendo MW -2.42 0.6
7267 Honda Motor UW -11.15 1.7 9735 Secom OW -4.73 0.9
8411 Mizuho Financial Group OW -2.68 3.8 9531 Tokyo Gas UW -5.60 0.3
9432 NTT UW -0.81 1.1 1605 Inpex Corp OW 20.48 0.9
2914 Japan Tobacco MW -8.48 2.1 2502 Asahi Group Holdings MW 1.24 0.6
8802 Mitsubishi Estate OW -19.21 2.8 8002 Marubeni Corp MW -10.24 0.6
4502 Takeda Pharmaceutical MW -3.53 1.8 4568 Daiichi Sankyo UW -2.12 0.3
7751 Canon MW 2.33 1.7 7741 Hoya Corp OW 25.58 0.8
6954 FANUC Corp MW 6.78 1.7 1925 Daiwa House Industry MW -6.69 0.5
8801 Mitsui Fudosan MW -12.16 1.5 4578 Otsuka Holdings MW 6.21 0.5
9020 East Japan Railway MW -13.14 1.5 5020 JX Holdings OW 4.61 0.8
8058 Mitsubishi Corp BIG OW -7.67 3.0 8630 NKSJ Holdings UW 1.91 0.3
8604 Nomura Holdings MW -20.18 1.5 5802 Sumitomo Electric MW -2.31 0.5
3382 Seven & I Holdings MW 2.09 1.5 9503 Kansai Electric Power UW -31.16 0.3
5401 NSSMC MW -21.73 1.5 4901 FUJIFILM Holdings Corp BIG OW 14.84 1.0
6501 Hitachi MW 14.93 1.4 4661 Oriental Land/Japan MW -6.21 0.5
9433 KDDI Corp BIG UW -0.63 0.0 4523 Eisai UW 0.47 0.3
9437 NTT DOCOMO OW -0.30 1.8 3402 Toray Industries MW 6.74 0.5
7201 Nissan Motor UW -9.71 0.6 7269 Suzuki Motor Corp UW 15.18 0.2
8031 Mitsui & BIG OW 2.96 2.3 8267 Aeon UW -15.30 0.2
6758 Sony Corp UW -2.55 0.6 6988 Nitto Denko Corp UW -16.03 0.2
8766 Tokio Marine Holdings MW -4.80 1.2 8308 Resona Holdings MW -3.57 0.5
6902 Denso Corp UW -2.17 0.6 6594 Nidec Corp MW 36.43 0.5
6301 Komatsu MW -9.93 1.1 3407 Asahi Kasei Corp BIG UW -4.94 0.0
5108 Bridgestone Corp MW -0.62 1.1 8035 Tokyo Electron MW 11.14 0.4
4503 Astellas Pharma BIG UW 8.78 0.0 1878 Daito Trust Construction UW -0.65 0.2
4063 Shin-Etsu Chemical OW 0.42 1.6 1928 Sekisui House UW -4.58 0.2
8830 Sumitomo Realty UW -16.14 0.6 9502 Chubu Electric Power OW -19.99 0.6
9022 Central Japan Railway MW -12.34 1.1 1963 JGC Corp UW -8.67 0.2
6752 Panasonic Corp MW 13.53 1.1 9202 ANA Holdings MW 2.30 0.4
6503 Mitsubishi Electric Corp OW 4.07 1.5 9532 Osaka Gas MW -8.46 0.4
7011 Mitsubishi Heavy Industries MW -5.33 1.0 8795 T&D Holdings OW -1.67 0.6
8309 Sumitomo Mitsui Trust HD OW -14.93 1.4 9064 Yamato Holdings MW -3.51 0.4
8591 ORIX Corp OW -16.45 1.4 7202 Isuzu Motors MW -7.19 0.4
8001 ITOCHU Corp MW -2.82 0.9 2802 Ajinomoto UW 13.34 0.2
6861 Keyence Corp OW 9.68 1.3 6702 Fujitsu UW 53.21 0.2
8601 Daiwa Securities Group OW -10.19 1.2 9021 West Japan Railway MW -5.36 0.4
6502 Toshiba Corp BIG OW -2.15 1.6 5713 Sumitomo Metal Mining UW 5.03 0.2
6971 Kyocera Corp UW -11.12 0.4 8113 Unicharm Corp UW -7.45 0.2
4452 Kao Corp BIG UW 18.02 0.0 7731 Nikon Corp OW -11.13 0.5
6981 Murata Manufacturing OW 19.66 1.1 8332 Bank of Yokohama/The MW -10.10 0.3
6326 Kubota Corp BIG UW -10.16 0.0 7752 Ricoh UW 3.32 0.2
8053 Sumitomo Corp BIG OW -2.00 1.5 4911 Shiseido BIG UW 1.01 0.0
9983 Fast Retailing BIG UW -1.55 0.0 7912 Dai Nippon Printing OW -11.06 0.5
8725 MS&AD Insurance Group HD MW -10.75 0.7 5201 Asahi Glass MW -4.58 0.3
6367 Daikin Industries MW 6.38 0.7 4188 Mitsubishi Chemical HD MW -8.11 0.3
8750 Dai-ichi Life Insurance MW 1.27 0.7 9831 Yamada Denki MW 43.20 0.1
(The views above are random musings and not a recommendation to buy, sell, or look for a finance job.)
Return Comparison (%) Weight Rel. To TPX100
7 / 77
MONTHLY WRAP – April 2014
Copyright (C) Shared Research Inc. All Rights Reserved.
New Coverage
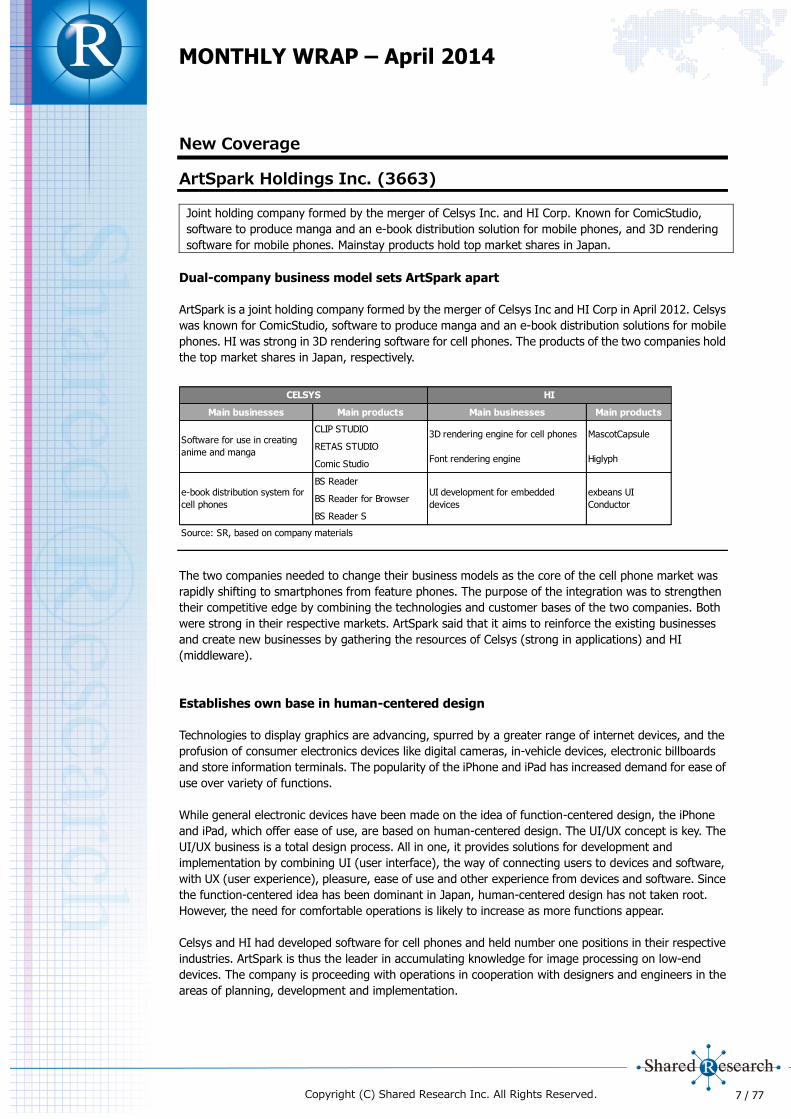
ArtSpark Holdings Inc. (3663)
Joint holding company formed by the merger of Celsys Inc. and HI Corp. Known for ComicStudio,
software to produce manga and an e-book distribution solution for mobile phones, and 3D rendering
software for mobile phones. Mainstay products hold top market shares in Japan.
Dual-company business model sets ArtSpark apart
ArtSpark is a joint holding company formed by the merger of Celsys Inc and HI Corp in April 2012. Celsys
was known for ComicStudio, software to produce manga and an e-book distribution solutions for mobile
phones. HI was strong in 3D rendering software for cell phones. The products of the two companies hold
the top market shares in Japan, respectively.
The two companies needed to change their business models as the core of the cell phone market was
rapidly shifting to smartphones from feature phones. The purpose of the integration was to strengthen
their competitive edge by combining the technologies and customer bases of the two companies. Both
were strong in their respective markets. ArtSpark said that it aims to reinforce the existing businesses
and create new businesses by gathering the resources of Celsys (strong in applications) and HI
(middleware).
Establishes own base in human-centered design
Technologies to display graphics are advancing, spurred by a greater range of internet devices, and the
profusion of consumer electronics devices like digital cameras, in-vehicle devices, electronic billboards
and store information terminals. The popularity of the iPhone and iPad has increased demand for ease of
use over variety of functions.
While general electronic devices have been made on the idea of function-centered design, the iPhone
and iPad, which offer ease of use, are based on human-centered design. The UI/UX concept is key. The
UI/UX business is a total design process. All in one, it provides solutions for development and
implementation by combining UI (user interface), the way of connecting users to devices and software,
with UX (user experience), pleasure, ease of use and other experience from devices and software. Since
the function-centered idea has been dominant in Japan, human-centered design has not taken root.
However, the need for comfortable operations is likely to increase as more functions appear.
Celsys and HI had developed software for cell phones and held number one positions in their respective
industries. ArtSpark is thus the leader in accumulating knowledge for image processing on low-end
devices. The company is proceeding with operations in cooperation with designers and engineers in the
areas of planning, development and implementation.
Main businesses Main products Main businesses Main products
CLIP STUDIO
RETAS STUDIO
Comic Studio
BS Reader
BS Reader for Browser
BS Reader S
Source: SR, based on company materials
CELSYS HI
Software for use in creating
anime and manga
e-book distribution system for
cell phones
UI development for embedded
devices
exbeans UI
Conductor
MascotCapsule
Higlyph
3D rendering engine for cell phones
Font rendering engine

8 / 77
MONTHLY WRAP – April 2014
Copyright (C) Shared Research Inc. All Rights Reserved.
Compatibility of design and operability is vital in UI development. The designers and engineers exchange
ideas to create better products. Engineers theoretically examine visual elements proposed by designers.
The company said that few design offices in Japan employ 20-30 designers. Plus few companies have
both designers and engineers for cooperative projects. The company has more than 100 employees,
including 20 designers, to develop collaborative software products. The company plans to capitalize on
its advantages through acquisitions and business alliances.
Segments
The company’s business segments: Content Solution, Creator Support, UI/UX and Applications. They
follow the segments of Celsys and HI, pre-merger. Celsys handles Content Solution and Creator Support.
HI handles UI/UX and Applications. In FY12/13, Content Solutions accounted for 35% of overall sales,
Creator Support 17%, UI/UX 40%, and Applications 8%. UI/UX was the top sales contributor; Content
Solution contributed most to profits.
Content Solution
FY12/13: 35% of sales
BS Reader for browser
ArtSpark Holdings Group development team
(people) Engineers Designers
HI 70 20
CELSYS 60 -
Clouds 15 2
Total 145 22
Source: Company materialsSource: SR, based on interviews with the company
Figures are adjusted for intragroup transactions. Note: correct as of December 2013.
HI and CELSYS are subsidiaries of the company. Clouds is an
equity-method affliate.
35%
17%
40%
8%
Sales breakdown
Content
solutionCreator support
UI/UX business
Applications
FY12/12 FY13/12 FY13/12 FY12/12 FY13/12 FY13/12 FY12/12 FY13/12 FY13/12
(JPYmn) 4Q 4Q FY 4Q 4Q FY 4Q 4Q FY
Segment
Content Solution 355 345 1283 -8 47 119 - - 9.3%
Creator Support 131 183 637 -112 4 -94 - 2.2% -
UI/UX 247 365 1489 -68 -62 -188 - - -
Applications 178 48 299 -58 7 28 - 13.6% 9.3%
Subtotal 911 942 3709 -246 -4 -135 - - -
Adjustments -4 -20 -23 1 16 66 - - -
Total 907 921 3685 -245 12 -69 - 1.3% -
Composition (Exc. Adjustments)
Content Solution 39% 37% 35% - - - - - -
Creator Support 14% 19% 17% - - - - - -
UI/UX 27% 39% 40% - - - - - -
Applications 20% 5% 8% - - - - - -
Source: Company data, SR
Sales Operating Profit OPM

9 / 77
MONTHLY WRAP – April 2014
Copyright (C) Shared Research Inc. All Rights Reserved.
As the product allows users to browse e-books on web browsers, users do not need to download viewer
applications to look around content at e-book store sites. A variety of content can be distributed: comics, novels
and photo books.
The content solution business provides software and knowledge of services based on research and
development of graphic technologies as solutions. The core product is the BS Reader series of e-book
viewers, developed by Celsys. The company has not unveiled a detailed sales breakdown, though it said
that the BS Reader series accounted for 70-80% of sales and almost all the segment’s profit. The
segment also develops and sells (or leases out) BS BookStudio, authoring software for processing manga
and other publications for mobile devices, and develops and provides ComicDC, a data server for content
distribution.
BS Reader
As the necessary software for browsing e-books, the company provides the product, or grants a license, to
content providers, which distribute content to feature phone and smartphone users, and telecom carriers, and
receives certain royalty rates depending on sales of content by using the viewer.
Its BS Reader holds a viewer share of more than 90% for cell phones. Though competitors have joined
the viewer market for smartphones, its BS Reader for smartphones is compatible with that for feature
phones. Despite the rapid spread of smartphones, nearly half of cell phone users do not use smartphones.
For content holders, ArtSpark’s BS Reader is seen to be more attractive than other competitors’ products
as it can provide one-stop solutions both for cellphones and smartphones.
The company changed part of its segment classification in FY12/13. Content Solution was previously
called e-Book Support. The company restructured its graphics operations for corporate clients in the
creator support business, in a bid to strengthen comprehensive content-related solutions. It transferred
revenue from royalties and revenue from custom operations to e-Book Support, changing the name to
Content Solution.
Source: Company materials
Creator Support
FY12/13: 17% of sales
CLIP STUDIO PAINT (PRO, EX)
Illustration and manga production software with various uses, such as monochrome and color drawings

10 / 77
MONTHLY WRAP – April 2014
Copyright (C) Shared Research Inc. All Rights Reserved.
for printing on commercial magazines and manga for websites and digital devices. In addition to
drawing and painting features for color illustrations, it has features that cover all production processes
of manga including rough sketches, frame cuts, inking, background, effect, lettering and management
of multiple pages. It is the world’s first dedicated manga production software. (Compatible with both
Windows and Mac.)
The creator support business is a specialized business-to-consumer business for creators. Main products:
CLIP STUDIO PAINT, an illustration and manga production software; Illust Studio for illustrations;
ComicStudio series for manga production; and Retasstudio to support production of animations. Celsys, a
subsidiary, is in charge of planning, development, and support of all the software.
The company sells these software products through personal computer distributors and retailers. It also
operates CLIP, a website providing total support for creators of illustrations, manga, animations and
novels. It receives fees from users. In the Japanese market, its software products related to manga and
animations are de-facto standards among professionals and more than 90% of television animations use
its products.
In FY12/13, the company changed the segment classification for the creator support business,
transferring royalties from corporate clients and revenue from custom development to the content
solution business.
Source: Company materials
UI/UX (formerly Middleware)
FY12/13: 40% of sales
exbeans® UI Conductor
A UI authoring tool (middleware) that allows users to launch their creations in runtime, thereby experiencing
the designer’s concept as he or she imagined it. The controls are intuitive, allowing users to drag and drop all
elements of UI creation—including design, user interaction, animations, and screen transitions. Users can also
easily create UIs across multiple devices and languages, and change designs and mechanisms as they see fit.
Thus, this comprehensive line of UI authoring software provides users with a number of features that simplify
the development process.
The UI/UX business provides UI solutions for digital consumer electronics devices, licensing
graphics-related products and receiving custom development orders.

11 / 77
MONTHLY WRAP – April 2014
Copyright (C) Shared Research Inc. All Rights Reserved.
The company’s strength in the business is in a string of products that are supported by provision of UI
design by designers and endorsed by de-facto standard 3D graphics technologies. Core products were
developed by HI, an ArtSpark subsidiary, including:
exbeans UI Conductor (provides a UI development environment for embedded devices).
Higlyph (a scalable font rendering engine with an emphasis on design; provides high speeds and
beautiful rendering even on embedded devices).
W10 Browser (a browser application for embedded devices compatible with HTML5).
UI solutions-related products are adopted for in-vehicle devices, digital cameras and karaoke equipment.
W10 Browser is used for browsers compatible with multimedia broadcast. The company has developed
UI for the SLR cameras of Olympus Imaging Corp, all-in-one printers of Brother Industries (TSE1: 6448)
and Clarion Co Ltd (TSE1: 6796) touch panel audio-display screens for Suzuki Motor Corp (TSE1: 7269)
K-cars. The company receives revenue from licensing those graphics-related products as UI solutions. It
also receives revenue from the development, maintenance and support of custom UI design, software
development and implementation. In addition, the core of this business has shifted from middleware
products for mobile devices to UI solutions. The company changed the name of the business accordingly
in FY12/13, from middleware to UI/UX.
K-car: A Japanese car category—literally “light car”. Engine displacement limited to 660cc. The number plates
of private cars have a yellow base (black base for commercial vehicles).
Source: Company materials
Applications
FY12/13: 8% of sales
The Applications business develops products using graphics-related technologies cultivated in the UI/UX
business. The company receives fees from content providers and telecom carriers to develop game and
services. The service component also receives royalties and management fees. However, profitability has
been low from contract-based operations and the company does not promote this segment of the
business. As a result it plans to scale back in this area. The main revenue sources are from ongoing
projects and service operations.

12 / 77
MONTHLY WRAP – April 2014
Copyright (C) Shared Research Inc. All Rights Reserved.
Source: Company materials
Manufacturing and sales
View the full report.
HI (JPYmn) FY03/09 FY03/10 FY03/11 FY03/12 FY12/12
Manufacturing Middleware* 720 721 704 893 561
(Production expenditure) Applications 550 713 632 485 408
Total 1,270 1,434 1,336 1,379 969
Sales Middleware* 1,517 1,509 1,429 1,359 789
Applications 400 750 781 504 357
Total 1,918 2,259 2,210 1,863 1,146
CELSYS (JPYmn) FY03/09 FY03/10 FY03/11 FY03/12 FY12/12
Manufacturing e-book support* 667 874 949 1,052 630
(Production expenditure) Creator support 295 609 1,089 1,208 1,179
Content creation 487 299 - - -
Total 1,449 1,782 2,039 2,260 1,809
Purchasing e-book support* 148 180 193 188 94
(Cost of purchases) Creator support 91 100 80 88 261
Content creation 0 0 0 0 0
Total 239 279 273 276 354
Sales e-book support* 1,505 1,942 2,200 2,091 987
Creator support 382 450 521 611 500
Content creation 559 304 0 0 0
Total 2,446 2,696 2,721 2,702 1,487
Source: SR, based on company materials
Note, FY12/12 figures are for ArtSpark Holdings (irregular period of nine months).
Sales figures are adjusted for intragroup transactions.
*Former segment names have been used. In FY12/13 the company changed the name of the middleware business to the UI/UX business, and the name of the e-
book support business to the content support business.

13 / 77
MONTHLY WRAP – April 2014
Copyright (C) Shared Research Inc. All Rights Reserved.
Gulliver International Co., Ltd. (7599)
Core business in buying and wholesaling used vehicles. Japan’s largest buyer of used vehicles and the
first to introduce nationwide unified purchase prices. Pioneer in use of computers to showcase and sell
used vehicles.
The company’s core business is buying and wholesaling used vehicles. The introduction of unified
purchasing prices nationwide was the key to the company’s growth. Used vehicle prices vary widely, and
the market value for used vehicles was difficult to assess. Gulliver was the first to introduce nationwide
unified purchase prices. This straightforward rule and use of a franchise model during its founding
worked. The company is Japan’s largest buyer of used vehicles.
In FY02/13, the company spent around JPY100bn purchasing about 140,000 vehicles at its directly
operated stores. The company then sells vehicles via three channels.
Wholesale (nearly 70% of sales in FY02/13), selling purchased vehicles at auction.
Retail (30% of the total), selling retail through the screen-based Dolphinet system.
Display sales (showroom-based retail), from FY02/14.
To guard against sudden declines in value and to limit inventory risk, Gulliver restricts retail (Dolphinet
and showroom) sales to a two-week period after purchasing a vehicle. If the vehicle remains unsold after
two weeks, it is sold via auction.
Wholesale auctions account for around 70% of consolidated sales. Dolphinet retail operations,
meanwhile, account for about 50% of consolidated gross profit (FY02/13, SR estimates). Gross profit per
vehicle is around JPY100,000-150,000 at auction, and JPY300,000-400,000 for retail.
Source: SR diagram, based on interviews with the company
BuyingSelling(retail)
Selling(wholesale)
Two weeks
Selling via Dolphinet
Display salesTo used car auctions
Consumers
sell used carsBuying used
cars
Consumers
purchase
used cars

14 / 77
MONTHLY WRAP – April 2014
Copyright (C) Shared Research Inc. All Rights Reserved.
Purchasing
In FY02/13, Gulliver’s vehicle COGS was around JPY100bn, for approximately 197,000 vehicles
purchased. Directly managed stores bought 144,000 vehicles (73% of total) and franchises bought
53,000 (27%). Average purchase price: around JPY700,000.
The used-vehicle purchase price that Gulliver offers is based on nationwide auction transactions, and the
price is the same nationwide. Before the company began operations in 1990, there were two ways a
vehicle owner could sell a vehicle. They had the choice of trade-in when buying a new vehicle from a
new-vehicle dealer, or selling directly to a used-vehicle dealer. There was not a clear boundary between
the discounts on the new vehicle and the trade-in price the new-vehicle dealer offered. Prices offered by
used-vehicle dealers were unclear, with wide discrepancies among individual dealers. Spotting an
opportunity, Gulliver created a database based on auction results and made purchase prices transparent.
Since it pays the same purchase price nationwide, its used-vehicle prices are uniform across the country.
Gulliver sets its standard purchase prices by using the prices paid at the bestselling auction houses in the
country and deducting a gross margin (JPY100,000-150,000). Gulliver provides feedback on the
purchase price to each of its shops, and thus pays the same price for each model nationwide. The
company only holds inventory for two weeks, limiting its exposure to inventory risk. Thus, it is able to
offer higher purchase prices than used-vehicle dealers with showrooms.
Gulliver’s purchasing flows
Gulliver’s used-vehicle purchasing process has been optimized for easy inspection, assessment and
decision-making. The only aspect it leaves up to individual stores is vehicle inspection, which is based on
companywide standards set by corporate headquarters. HQ determines valuations based on the results
of inspections, and decides on when and where to send vehicles for auction.
Buyers make appointments via the internet or Gulliver’s call centers. In some cases a sales person visits
customers’ homes. In others, the customer visits the store. We note that 60% of purchases are from the
customer visiting the store, and 40% relates to home visits. In regions that do not have a regional office,
a representative from one of the directly operated stores will personally visit the customer.
FY02/13
Purchases
(directly
managed
stores)
Purchases
(franchises)
Auctions
(wholesale
business)
Dolphinet
(retail business)
Others
(franchise
revenue,
peripheral
sales etc)
Units 144,402 53,000 11,245 45,269 -
Average purchase price ~JPY700,000 - - - -
Average sale price - - JPY900,000* JPY1.1mn -
Gross profit per unit - - JPY100,000-150,000 JPY300,000-400,000 -
% of sales - - 70%* 30%* ~2%
% of gross profit - - ~35% ~50% ~15%
Source: SR based on company data
Note, % of sales and % of gross profit figures are SR estimates.
*Just under.
FY02/13 Cars purchased Average purchase price
Directly managed stores 144,402
Franchise stores 53,000
Source: Company materials, SR
Note, Average purchase price figures are SR estimates.
~JPY700,000

15 / 77
MONTHLY WRAP – April 2014
Copyright (C) Shared Research Inc. All Rights Reserved.
At each store the vehicle’s condition is first assessed. This takes about 20 minutes. The results are noted
on an assessment sheet, with data sent to HQ. HQ then takes about 10-15 minutes to price the vehicle
based on its condition and corresponding auction value, and sends the data back to the store. In over a
third of cases, this results in a transaction.
The purchasing store network comprises 294 directly managed stores (including 50 regional offices) and
118 member stores. Around 60 companies run the member stores and some of the larger companies
control up to four or five stores. Since FY02/01, when its brand recognition increased, Gulliver has been
shrinking the member network and opening more directly managed stores, which contribute more to
profits. Also, because Gulliver put a hold on new store openings starting in FY02/10 as part of efforts to
improve its financial standing, and store numbers overall have been shrinking. From FY02/14, as the
company was beefing up its retail (showroom) business, it restarted its store openings, focusing on new
showroom formats.
Sales through Dolphinet (directly managed stores)
In FY02/13 SR estimates that this segment accounted for sales of nearly JPY50bn (slightly under 30% of
the total), and around JPY16bn in gross profit (about 50% of the total).
Information on all vehicles purchased by directly managed stores and franchises is uploaded to Gulliver’s
used-vehicle information system, Dolphinet. Through this system, Gulliver sells around 45,000 vehicles
to customers (28% of the company’s volume). Retail margins are about two to three times wholesaling
margins.
Some customers selling their vehicle at a Gulliver store would buy a different vehicle on the spot, using
the in-store Dolphinet terminal to search the available inventory. Dolphinet displays an array of detailed
information, including pictures, specifications and repair history. Selling vehicles on-screen without the
customer being able to see the actual vehicle was thought impossible. But thanks to its trusted brand and
an advanced pricing system based on real-time auction data, Gulliver was able to overcome this
challenge and become a successful pioneer of selling cars sight unseen.
The sale of vehicles through Dolphinet—utilizing pictures without the need for stores or display
areas—has kept store opening costs in check. As flagged, Gulliver limits the time to sell vehicles it has
purchased to two weeks, and sells them to consumers through Dolphinet directly to consumers. By
limiting the holding period to two weeks, Gulliver cuts inventory risk.
10-15 minutes
Sending data Receiving data
Headquarters
Customer
visits the
store
Inspect the
car's
condition
Complete
assessment
sheet
Decide on
price
Display the
valueNegotiation Contract
Source: SR based on company materials

16 / 77
MONTHLY WRAP – April 2014
Copyright (C) Shared Research Inc. All Rights Reserved.
Auction sales (wholesale)
Sales at auctions in FY02/13 reached nearly JPY100bn, 70% of the total, with gross profit of about
JPY11bn, or 35% of the total (SR estimate). Gulliver sold 111,000 vehicles at auction (72% of sales
volume).
Vehicles not sold within two weeks of listing on Dolphinet are put to auctions operated by major car
auction companies. When purchasing vehicles, Gulliver pays customers an amount equal to the best
auction price minus its gross margin. Auction and transport fees are accounted for as an incidental
portion of CoGS.
Companies such as USS (TSE1: 4732), TAA (Toyota Auto Auctions), JAA (Japan Automobile Auctions) and
CAA (Chubu Auto Auctions) operate the auction centers. Market shares in 2012: USS 31.5%; TAA 9.7%,
and JAA 8.6%. In FY02/13, USS sold JPY62.3bn of Gulliver’s stock—43.5% of Gulliver’s sales.
USS is a pioneer in the used-vehicle auction field, starting in 1980 as Aichi Automobile General Services.
It had the top market share in the industry in FY2012. USS has 17 auction sites nationwide, which hold
weekly auctions, and had 45,000 employees in FY03/13. Among USS’ subsidiaries are R&W, which
operates a specialty vehicle purchasing chain, Rabbit, one of Gulliver’s competitors.
Retail (display sales)
The company has been conducting display sales since FY02/13. Until recently, the main sales channel for
Gulliver was Dolphinet, in which the customer did not personally see the physical vehicle. From FY02/13
onward, the company started selling vehicles through display sales at directly run stores, as part of its
retail sales push. By end FY02/18, the company plans to have 400 stores using display sales for retail
customers.
For display vehicles as well, the company will auction those not sold within two weeks. In line with
increased retail sales, ancillary income (maintenance, insurance etc) should also rise. SR estimates that
these brought in around JPY1bn in FY02/13.
New stores are categorized into one of several types. WOW! TOWN stores divide vehicles into different
segments such as outdoor, leisure, family, and active. LIBERALA specializes in high-end imported vehicles
such as Porsche and Ferrari. Minikuru provides an environment catering to women, with soothing colors
and a café atmosphere. Gulliver Outlet showcases less-than-perfect vehicles, such as those with scrapes
or dents, or cars with unpopular colors for low prices and no warranty.
Average retail price varies with store format, with a rough breakdown below. Retail margins are about
two to three times wholesale margins.
LIBERALA (red): High-end imported vehicles. Estimated average price: JPY7mn.
LIBERALA (black): Imported vehicles. Estimated average price: JPY2.5mn.
WOW! TOWN: Large showroom. Estimated average price: JPY1.7mn.
SNAP HOUSE: Minivan specialist. Estimated average price: JPY1.5mn.
Gulliver: Flagship store brand. Estimated average price: JPY1.2mn.
Minikuru: Light vehicles. Estimated average price: JPY900,000.
Gulliver Outlet: Low cost vehicles. Estimated average price: JPY800,000.
According to the company, when opening new retail showrooms it tries to depict lifestyles associated
with the particular type of vehicle, showing customers how these vehicles might fit into their daily lives.
WOW Town! does not use designations such as minivan, light vehicle, compact vehicle etc, but family,

17 / 77
MONTHLY WRAP – April 2014
Copyright (C) Shared Research Inc. All Rights Reserved.
fashion, eco & eco, active and driving pleasure, in line with the buyer’s lifestyle. The company has divided
the display space into zones with five scenes. Also, to attract more women, Gulliver has installed cafes
and children’s play rooms in its stores. At first most of the customers visiting the stores were replacing
used vehicles. But the company said that now it is seeing increasing numbers of customers replacing
vehicles they had bought new.
Gulliver plans to open 100 shops yearly through FY02/18, or a total of 400. The company said it costs
JPY60-80mn to build a shop (prior to FY02/14); the land is leased, and Gulliver handles construction
work. The average shop covers 1,000 sq m and payback is around two years.
From FY02/10 through FY02/13, Gulliver restrained the number of (used-vehicle purchasing) store
openings, so it has well over one hundred assistant store managers who have store manager
qualifications (company’s own standards). As these assistant managers are store manager candidates, it
has two years’ worth of reserve store managers for the store rollout program.
Revenue from member stores
In addition to retail and wholesale sales, Gulliver receives revenue from member stores. SR estimates
that in FY02/13, member stores contributed around JPY2.5bn to sales (2% of the total), with gross profit
of just under JPY2.5bn (about 10% of the total). At end FY02/13, Gulliver had 118 member stores.
New member stores pay JPY8mn to join, with royalties fixed at JPY900,000 per month. In FY02/13,
royalty income was JPY1.2bn, around half of Gulliver’s revenue from member stores. When member
stores (118 stores) or used-vehicle dealer members (20,000-30,000 stores) use Dolphinet to sell used
vehicles to consumers (2,000 vehicles in FY02/13) they pay an auction commission to Gulliver. The
commission is JPY24,500 for member stores and JPY34,500 for other used-vehicle dealers. If a directly
owned store sells a vehicle held by a member store, the member store pays a commission of JPY22,500
as a contract fee.
In line with company policy, franchisees auction off vehicles that are not sold within two weeks. Gulliver
bundles the franchisees’ stock with its own when putting vehicles to auction, for reasons of efficiency.
The franchisees pay JPY7,000 in auction fees to the auctioneers and another JPY7,000/vehicle to Gulliver
as an auction agency commission. Gulliver also receives contract renewal fees. The first renewal is for
five years and costs JPY3mn; subsequent renewals are JPY3mn for three years.
If directly run stores buy vehicles through franchisees, they add a margin of JPY200,000-250,000—as
usual when selling to consumers. The franchisees pay a contract closing fee of JPY22,500 to Gulliver.
Revenue Amount FY02/13 Details
New franchise fees JPY8mnWhen stores become part of the
franchise
Renewal fees JPY3mn -When stores renew their
franchise contracts
Royalty fees JPY900,000/month A fixed monthly amount
Dolphinet commission
(completed deals)JPY22,500/unit ~4,000 units
When directly managed stores
purchase a car via a franchise
store
Dolphinet commission
(successful bids)JPY24,500, JPY34,500/unit ~9,000 units When franchise stores sell a car
Auction agency
commissionJPY7,000/unit 28,000 units
When unsold cars are taken to
auction en masse
Source: Company materials, SR

18 / 77
MONTHLY WRAP – April 2014
Copyright (C) Shared Research Inc. All Rights Reserved.
Overseas expansion
In November 2004, the company established Gulliver USA. In 2007 and 2008 it planned to open in
emerging markets such as China and India. Its subsidiary G-Trading was exporting construction
equipment to Russia. However, the company withdrew from all overseas markets except for the US in
2009 amid the global financial crisis to concentrate management resources on the domestic business.
In 2014, Gulliver was again intent on expanding overseas. The company said one necessary condition for
a used-vehicle market to develop was a certain number of new vehicles. It said that Thailand, with more
than 1mn new vehicle sales a year, was an attractive market. It planned to start overseas expansion with
Thailand from FY02/15 onwards. Gulliver said that the Thai used-vehicle market was already around
2.1mn vehicles per year.
Gulliver’s first step was to set up a joint venture (49% Gulliver owned) with the Viriyah Group, the leading
property and casualty insurance company in Thailand, to start a franchise business. The joint venture will
receive a franchise membership fee of JPY8mn, and monthly royalties of JPY900,000, the same as the
domestic franchise operations, with 30% going to Gulliver as licensing fees. The company said that
used-vehicle supply in Thailand is small, so prices tend not to fall too much. Thus, rather than an
auction-dependent business model, the joint venture would take on a degree of inventory risk (a few
months) by lengthening its holding period, and develop the retail business.
Gulliver aimed to have 800 stores overseas as well as in Japan by FY02/18. In addition to 300 in Thailand,
it planned to have shops in other ASEAN countries, such as Indonesia, Malaysia and Myanmar.
On March 28, 2014, the company announced a revision to its FY02/14 earnings and dividends
forecasts.
FY02/14 full-year earnings forecast
Sales: JPY169.3bn (Previous forecast: JPY145bn)
Operating profit: JPY7.1bn (JPY5.8bn)
Recurring profit: JPY7.2bn (JPY5.8bn)
Net income: JPY4.4bn (JPY3.3bn)
The number of vehicles sold across all store types was approximately 50,000 units, in line with the
company’s initial expectations. Sales were especially brisk at newly opened stores for different retail
channels, such as outlet stores (low cost vehicles) and LIBERALA stores (luxury vehicles). Vehicles
purchased by the company across all store types were higher than initial estimates, a result of increased
customer traffic from higher sales. In light of these facts, Gulliver has made an upward revision to its
full-year earnings forecast.
The year-end dividends forecast for FY02/14 has been revised upward by JPY3 per share to JPY8 per
share. In line with this change, the total full-year dividend forecast was revised to JPY13 per share.
View the full report.

19 / 77
MONTHLY WRAP – April 2014
Copyright (C) Shared Research Inc. All Rights Reserved.
Happinet Corporation (7552)
Leading intermediary distributor for toys, DVDs, CDs and video games, with a 60% market share in
capsule toys and card games. Manages inventories and handles orders/shipments.
Leading intermediary distributor for toys, DVDs, CDs and video games. The company buys
goods from makers and distributes to retailers, managing inventories and handling orders/shipments.
Segment breakdown: toys (42.2% FY03/13 sales), visual and music (25.4%), video-game (20.8%), and
amusement (11.6%).
Distribution channels are specialty stores, including consumer electronics and camera stores (34.2%
FY03/13 sales), general merchandise stores (20.9%), convenience stores (12.9%), E-commerce
(10.9%), large-format suburban specialty stores (9.8%), and others (11.3%).
Consolidated Sales and OP by Segment FY03/09 FY03/10 FY03/11 FY03/12 FY03/13 FY03/14
(million yen) Act. Act. Act. Act. Act. Est.
Sale Toy 61,813 65,654 69,104 77,313 74,660 75,000
YoY -1.7% 6.2% 5.3% 11.9% -3.4% 0.5%
Composition 37.1% 33.8% 36.2% 39.0% 42.2% 36.6%
Visual and Music 36,570 67,838 57,759 55,719 44,810 41,000
YoY -5.1% 85.5% -14.9% -3.5% -19.6% -8.5%
Composition 21.9% 34.9% 30.3% 28.1% 25.4% 20.0%
Video Game 50,474 44,372 46,447 42,704 36,839 68,000
YoY -7.4% -12.1% 4.7% -8.1% -13.7% 84.6%
Composition 30.3% 22.8% 24.3% 21.6% 20.8% 33.2%
Amusement 17,919 16,381 17,579 22,282 20,447 21,000
YoY 38.3% -8.6% 7.3% 26.8% -8.2% 2.7%
Composition 10.7% 8.4% 9.2% 11.3% 11.6% 10.2%
Total 166,778 194,246 190,891 198,021 176,757 205,000
YoY -1.3% 16.5% -1.7% 3.7% -10.7% 16.0%
OP Toy 996 1,865 2,321 3,009 2,055 2,100
YoY -24.6% 87.2% 24.4% 29.6% -31.7% 2.2%
Composition 29.1% 50.4% 55.8% 48.6% 47.7% 44.7%
Visual and Music 1,330 253 -656 448 309 600
YoY 3494.6% -81.0% -359.3% - -31.0% 94.2%
Composition 38.9% 6.9% -15.8% 7.2% 7.2% 12.8%
Video Game 1,221 1,035 1,156 936 678 800
YoY -7.6% -15.2% 11.7% -19.0% -27.6% 18.0%
Composition 35.7% 28.0% 27.8% 15.1% 15.7% 17.0%
Amusement -127 544 1,340 1,801 1,265 1,200
YoY - - 146.3% 34.4% -29.8% -5.1%
Composition -3.7% 14.7% 32.2% 29.1% 29.4% 25.5%
Total 3,420 3,699 4,162 6,196 4,309 4,700
Adjustments -1,283 -1,371 -1,307 -1,341 -1,335 -1,300
Consolidated Operating Profit 2,137 2,327 2,855 4,855 2,973 3,400
YoY 47.3% 8.9% 22.7% 70.0% -38.8% 14.4%
Source: Company data, SR Inc. Research
Figures may differ from company materials due to differences in rounding methods.

20 / 77
MONTHLY WRAP – April 2014
Copyright (C) Shared Research Inc. All Rights Reserved.
Happinet is the largest intermediary distributor of toys, DVDs and CDs in the industry, with a 60% market
share in capsule toys and card games.
Toys business (42.2% FY03/13 consolidated sales; 47.7% operating profit)
Happinet is Japan’s largest intermediary distributor of toys, with a 30% market share. It
handles 80% of toy distribution in Japan for Bandai (a Namco Bandai Holdings [TSE1: 7832] subsidiary).
In this segment, Happinet enjoys a gross profit margin buying goods from toy makers and selling them to
retailers. The company liquidates unsold inventories each month. Gross profit margin moves up or down
by 1% given fluctuating inventory write-offs.
The company buys goods from big toy makers like Bandai and Tomy and sells them to toy retailers such
as Toys"R"Us-Japan Ltd (unlisted), large consumer electronics stores and retail chains, and major online
retailers.
Japan’s toy market centers on fads, rather than long-selling, staple products. Goods featuring
characters from TV animation series tend to have a one-year sales cycle with products refreshed when a
new series begins. Popularity drops and sales falter for products whose TV programs have finished.
Also, toy manufacturers often make use of overseas factories, particularly in China. It takes about three
months from when toys are manufactured till they are ready to be sold by retailers, due to strict
Sales by Channel FY03/09 FY03/10 FY03/11 FY03/12 FY03/13
(million yen) Act. Act. Act. Act. Act.
Sales Specialty Stores 55,200 63,900 65,300 62,500 60,400
YoY 8.4% 15.8% 2.2% -4.3% -3.4%
Composition 33.1% 33.0% 34.3% 31.6% 34.2%
General Merchandise Stores 27,000 35,600 36,700 40,300 36,900
YoY -9.4% 31.9% 3.1% 9.8% -8.4%
Composition 16.2% 18.4% 19.3% 20.4% 20.9%
Convenience Stores 14,100 21,500 21,300 26,300 22,800
YoY 11.9% 52.5% -0.9% 23.5% -13.3%
Composition 8.5% 11.1% 11.2% 13.3% 12.9%
E-Commerce 28,800 22,200 24,100 25,000 19,200
YoY -17.7% -22.9% 8.6% 3.7% -23.2%
Composition 17.3% 11.4% 12.7% 12.6% 10.9%
Large-format Suburban Specialty Stores 9,000 19,300 18,500 19,300 17,200
YoY -33.3% 114.4% -4.1% 4.3% -10.9%
Composition 5.4% 10.0% 9.7% 9.7% 9.7%
Wholesalers 17,000 21,500 15,400 15,200 11,500
YoY 14.1% 26.5% -28.4% -1.3% -24.3%
Composition 10.2% 11.1% 8.1% 7.7% 6.5%
Others 15,300 9,900 9,200 9,100 8,500
YoY 27.5% -35.3% -7.1% -1.1% -6.6%
Composition 9.2% 5.1% 4.8% 4.6% 4.8%
Total 166,700 193,900 190,500 198,000 176,700
YoY -1.3% 16.5% -1.7% 3.7% -10.7%
Source: Company data, SR Inc. Research
Figures may differ from company materials due to differences in rounding methods.
* Others include Department Stores

21 / 77
MONTHLY WRAP – April 2014
Copyright (C) Shared Research Inc. All Rights Reserved.
procedures for managing and checking quality—after all, these are products that will be used by children.
Intermediary distributors like Happinet lie between manufacturers and retailers, and add value by
absorbing inventory risk. By trading with intermediary distributors, retailers need only take inventory
risks for the goods on their store shelves.
Toy distribution:
Happinet and toymakers agree on order quantities three months prior to the release of new products.
On product launch, toymakers deliver toys to the company, which in turn delivers them to retailers that
shoulder inventory risk.
The company holds inventories worth roughly two weeks of sales and partially distributes them in
response to additional orders from retailers. Here, the company bears the inventory risk.
Happinet typically sells out most of its inventories at end December and recognizes losses on inventories
by disposing of inventories or making inventory write-downs at end March the following year. For toys,
annual inventory disposal is 1-2% of annual sales.
SR understands that the company’s rise to prominence as the largest intermediary distributor of toys
began in the 1990s with the relaxation of the Large Scale Retail Store Law. Happinet responded to
changes in the business environment. Distributors began to need advanced information and logistics
systems in order to keep up with the growing size of retailers. Also, the growth in Bandai’s toy sales was
another contributing factor in Happinet’s growth.
SR understands that Bandai—a group company and one of Happinet’s main toy suppliers—specializes in
making products and accessories that feature characters from popular TV animated cartoons. Bandai has
leveraged these character goods to increase its domestic toy sales.
Bandai’s character goods portfolio
Leading toy characters with the highest sales rankings at Bandai are those from the Super Sentai, Kamen
Rider, and Precure series. Toei or Toei Animation makes these series; TV Asahi broadcasts them on Sundays.
Program sponsor Bandai merchandises related toys. This system has a long history. The Super Sentai series,
the longest-running of the trio, started with Himitsu Sentai Gorenger in 1975. Its 37th series, Zyuden Sentai
Kyoryuger, aired in 2013. In the 30-minute Super Sentai program, a team of three to five people use special
items to become superheroes wearing helmets and color-coded jumpsuits, and fight bad guys or monsters. In
each episode the enemy, once defeated, is reborn as a giant monster and the heroes ride a giant robot to
destroy it. Each year a TV series starts in February and a movie version is launched in August. With new
characters and items added during the year, Bandai merchandises all the transforming items, weapons and
robots. All super hero toys are ready for Christmas when sales peak.
Visual and music business (25.4% FY03/13 consolidated sales; 7.2% operating
profit)
This segment comprises the visual wholesale section (58.0% of sales in visual and music business), the
visual manufacturing section (12.5%), and the music section (29.5%).
Visual wholesale section
Happinet makes a gross profit margin from buying DVDs from visual content manufacturers and selling
them to retailers. The company said that intermediary distributors, like itself, do not need to hold
substantial inventories compared with toymakers since retailer orders are made and delivered in a week.

22 / 77
MONTHLY WRAP – April 2014
Copyright (C) Shared Research Inc. All Rights Reserved.
As wholesalers do not shoulder much inventory risk, the gross profit margin is slimmer than in toy
wholesaling.
The company buys products from all major content makers, but it has been Nikkatsu Corp’s (unlisted)
sole distributor since 2009 and Bandai Visual Co Ltd’s (a Namco Bandai subsidiary) sole distributor since
2010. The company distributes products to major online retailers and consumer electronics chains.
Visual manufacturing section
Happinet invests in movie production partnerships, thus obtaining videogram rights, or obtains existing
videogram rights and then makes and sells DVD products. Income hinges on the amount and ratio of
investment in partnerships, box-office proceeds, DVD sales volumes, and videogram royalties.
Videogram is a Japanese legal term, used to refer to visual media (movies and TV programs) on a certain
format (eg, VHS, DVD) and its packaging. Videogram rights here refer to the rights to manufacture, release,
and sell this media.
The movie industry and movie production partnerships handle production, distribution, exhibition, and
secondary use (renting/selling movie content to consumers). Video content makers obtain videogram
rights to movies by investing in production partnerships or by purchasing the rights from their holders.
Rights to receive box-office proceeds are distributed in proportion to the amount invested in the
production partnership. Box-office profits are defined as proceeds—ie, number of viewers multiplied by
ticket prices—less expenses (cinema operators and distributors, production, and advertising). According
to the company, it is difficult to predict the profitability of investing in production partnerships, because
production costs, investment stake, and box-office proceeds differ from movie to movie. Also, as part of
the conditions for investing in a production partnership, the company obtains videogram rights to the
movie, and will therefore sell it as a DVD.
Another way to obtain videogram rights is from copyright holders, such as production partnerships. This
can be done either by paying for the rights, or by paying a minimum guarantee (MG). According to the
company, videogram royalties differ widely by movie, so it is difficult to calculate an average profitability
for videogram rights.
Music wholesale section
In the music section, Happinet takes its gross profit margin from buying products from music content
makers and selling them to retailers. As in its visual wholesale section, the company does not shoulder
much inventory risk. Therefore, gross profit margins are tighter than in the toy wholesaling business.
The company buys goods from big music software makers and distributes them to online shops and
consumer electronics chains.
Japan’s resale price maintenance system (recommended retail price)—as established by Japanese
copyright law—means the creators of music media are able to force retailers to observe a certain retail
price. Thus the distribution of music media differs from that of visual media. Although in both cases
companies are effectively purchasing stock, for music media a limit is set for a proportion of the sales
that may be returned, and the seller sometimes ends up taking these returns back.
The proportion of sales that may be returned differs between the manufacturer and the distributor, and
between the distributor and the retailer. Therefore, the distributor must accept some inventory risk in
cases where there is more leeway for the retailer to return stock to the distributor, than for the distributor
to return it to the manufacturer.
Music CDs: resale price maintenance

23 / 77
MONTHLY WRAP – April 2014
Copyright (C) Shared Research Inc. All Rights Reserved.
A maker or supplier of music imposes selling prices on wholesalers and retailers who abide by this. The
resale maintenance system of music software (such as CDs) is approved as an exception to the
Antimonopoly Act which normally prohibits such conduct as unfair trading practices.
Video game business (20.8% FY03/13 consolidated sales; 15.7% operating profit)
Happinet makes a margin by buying video game consoles and game software from makers and
distributing it to shops. This business has the lowest gross profit margin of all the company’s businesses,
which stems from the company bearing little inventory risk due to short order placement/delivery times.
Happinet buys products from Nintendo Co Ltd (TSE1: 7974), Sony Computer Entertainment Inc (a
subsidiary of Sony [TSE1: 6758]), and Microsoft Corp. It is the only wholesaler handling all consumer
game consoles available in Japan.
Nintendo products account for over half of sales, with Sony products next at over 30%. The company
distributes products to major online retailers and consumer electronics chains. SR estimates the
company’s share of Nintendo’s game-related sales at around 25%. The company is virtually the sole
distributor of Sony Computer Entertainment games and toys, and has exclusive distribution agreements
in Japan with Microsoft.
Happinet creates and sells original game software and operates social network game sites but profit
impact is small (December 2013).
The company entered video gaming in 1994 and expanded sales by acquiring distributors. There is a
possibility that there will be an increase in M&A between companies in this industry, as the market in
games sold at bricks and mortar stores is expected to shrink—perhaps providing an opportunity for the
company to increase its market share.
Amusement business (11.6% FY03/13 total consolidated sales; 29.4% operating
profit)
The company’s amusement business includes toy vending machine operations and card game
operations.
Toy vending machine section
The company sells toys in capsules from vending machines at major retail and electronics stores, and
shopping malls. It purchases vending machines and capsule toys from Bandai. This business is close to
retail, and therefore has the highest gross profit margin of all the company’s businesses.
Capsule toys retail at between JPY100 and JPY500. The vending machines work thus: a capsule toy
comes out when the customer inserts money, in coins, and turns the crank in the middle of the machine.
The toys themselves are varied, ranging from scale models of animation characters and animal figures, to
mobile phone accessories. There is an element of entertainment in the fact that, although the vending
machines are themed, the customer does not know the exact contents of the capsule he or she will
receive.
As of December 2013, the company had machines at 4,800 locations nationwide.
In November 2007, Happinet acquired the two leading operators of toy vending machines in the industry,
Sunlink Co Ltd and The Apple Corporation. Then, after merging the amusement businesses of these
companies with its own in October 2008, the company established Happinet Vending Service

24 / 77
MONTHLY WRAP – April 2014
Copyright (C) Shared Research Inc. All Rights Reserved.
Corporation—a consolidated subsidiary that then continued running this business.
According to Happinet, the three companies—Happinet, Sunlink, and The Apple Corporation—together
had vending machines at around 8,600 locations nationwide in 2007, but nearly half of these locations
were unprofitable. When operating toy vending machines, staff members still need to visit machine sites
to monitor sales, refill capsules, and collect takings. The company must therefore allocate labor
according to the number of machines at sites and the frequency of visits. There were many unprofitable
areas where sales did not cover fixed costs.
After integration, Happinet scrapped and streamlined unprofitable sites and business offices, reducing
the number of sites to 4,800 from 8,600. The amusement arm reported an operating profit in FY03/10.
Digital card game section
The company operates card game machines based on popular animation characters, in major retail and
electronics stores. As in the toy vending machine section, gross profits are high for the digital card game
section because it is close to retail.
To play on a digital card game machine, a customer inserts JPY100 and the machine ejects an IC card, on
which an animation character is shown and electronic data (offensive and defensive abilities, and a
special move, in the case of a battle game) is printed in transparent ink. The game unfolds on an LCD,
affected by input from a panel that reads the data on the cards. The cards themselves are also collectors’
items. The company buys and leases digital card game machines from Bandai, which also supplies the
cards.
As of December 2013, the company operated card games based on Dragon Ball, Kamen Rider, Mobile
Suit Gundam, and Aikatsu!.
On March 11, 2014, the company announced the merger of Toys Union Co., Ltd. and Mori Games Co.,
Ltd., both wholly-owned subsidiaries of the company.
Toys Union is a wholesaler of video game products. According to the company, it trades a much greater
amount of Nintendo Co., Ltd. video game consoles and software products since acquiring Toys Union as
a subsidiary in July 2013. The company aims to further strengthen its relationship with Nintendo by
merging Toys Union and Mori Games, which are both involved in wholesaling videogames. It also hopes
that streamlining its organization in this way will lead to earnings growth.
The company plans to merge the two companies on July 1, 2014. Toys Union will be the absorbing firm.
View the full report.

25 / 77
MONTHLY WRAP – April 2014
Copyright (C) Shared Research Inc. All Rights Reserved.
J Trust Co Ltd (8508)
Active in financial, real estate, amusement, and international segments. Financial is the overwhelming
revenue and profits contributor, consisting mostly of credit card and other consumer finance. Provides
savings bank services in Korea, a long-term growth driver.
Financial: lion’s share of earnings. J Trust has several segments—financial, real estate, amusement,
and international. However, financial is the overwhelming revenue and profits contributor. International,
the company provides savings bank services in Korea, a long-term growth driver.
Operating revenue/OP by segment FY03/09 FY03/10 FY03/11 FY03/12 FY03/13
(JPYmn) Cons. Cons. Cons. Cons. Cons.
Operating revenue 4,946 16,541 16,908 24,508 55,683
YoY 54.5% 234.4% 2.2% 44.9% 127.2%
Financial 3,772 14,634 13,326 19,605 33,186
YoY 32.8% 288.0% -8.9% 47.1% 69.3%
% of Total 76.3% 88.5% 78.8% 80.0% 59.6%
Real Estate 1,173 1,557 3,166 2,645 4,285
YoY 224.9% 32.7% 103.3% -16.5% 62.0%
% of Total 23.7% 9.4% 18.7% 10.8% 7.7%
Amusement - - - - 13,484
YoY - - - - -
% of Total - - - - 24.2%
International - - - 1,916 2,793
YoY - - - - 45.8%
% of Total - - - 7.8% 5.0%
Operating profit 328 4,292 4,466 6,050 12,647
YoY 326.0% 1208.5% 4.1% 35.5% 109.0%
Financial -159 3,888 4,017 5,571 12,293
YoY - - 3.3% 38.7% 120.7%
% of Total - 90.6% 89.9% 92.1% 97.2%
Real estate 488 340 407 131 270
YoY - -30.3% 19.7% -67.8% 106.1%
% of Total - 7.9% 9.1% 2.2% 2.1%
Amusement - - - - 250
YoY - - - - -
% of Total - - - - 2.0%
International - - - 303 -336
YoY - - - - -
% of Total - - - 5.0% -
Source: Company data, SR

26 / 77
MONTHLY WRAP – April 2014
Copyright (C) Shared Research Inc. All Rights Reserved.
Financial (59.6% of operating revenue, 97.2% of operating profit in
FY03/13)
Segment operating revenue (FY03/13 %)
Credit card and consumer credit services: 30.2
Consumer loan services: 15.0
Servicer operations: 7.2
Credit guarantee services: 5.3
Business loan services: 1.0
Drivers: credit card, and consumer credit services and credit guarantee services.
Credit card and consumer credit services
(30.2% of financial business operating revenue in FY03/13)
KC Card (bought August 2011) provides credit card services, handling more than 620,000 credit
cardholders (December 2013). Setting its offering aside from the pack is a generous point rewards
(mileage points) program, resulting in about 40% of issued cards being used at least once a month. In
Japan, given the credit card glut, a credit card is doing well if more than half of all holders use it at least
once a year. KC Card earns money from commissions on installment payments and interest income on
cash advances. Cardholders pay annualized interest rates of 13.08-18.00% on installment payments.
Cash advances, available up to JPY500,000, command an annualized 18% interest rate. KC Card also
issues KC Money Cards exclusively for cash advances up to JPY3mn (4.6-18.0% interest rate).
Balance sheet treatment: advances paid on cardholder installment payments and the balance of cash
advances are booked as installment advances paid (current assets) and as long-term operating loans
Balance by product FY03/09 FY03/10 FY03/11 FY03/12 FY03/13
(JPYmn) Cons. Cons. Cons. Cons. Cons.
Commercial notes (current assets) 990 1,497 1,900 2,119 1,656
YoY -12.2% 51.2% 26.9% 11.5% -21.8%
Operating loans (current assets) 28,236 18,039 11,725 27,713 18,227
YoY 317.6% -36.1% -35.0% 136.4% -34.2%
Advances paid-installment (current assets) 6,343 3,825 1,443 65,024 48,133
YoY - -39.7% -62.3% 4406.2% -26.0%
Purchased receivables (current assets) 1,313 5,407 4,008 2,310 2,529
YoY - 311.8% -25.9% -42.4% 9.5%
LT operating loans receivable (investments and other assets) 1,858 2,776 2,286 8,487 4,686
YoY 1573.9% 49.4% -17.7% 271.3% -44.8%
Credit guarantee balance (off-balance sheet) 2,455 7,536 9,699 22,072 33,194
YoY -37.2% 207.0% 28.7% 127.6% 50.4%
Source: Company data, SR
Financial business operating revenue breakdown FY03/09 FY03/10 FY03/11 FY03/12 FY03/13
(JPYmn) Cons. Cons. Cons. Cons. Cons.
Interest on loans, discount revenue (for consumers) 96 4,277 2,801 3,479 4,964
Other financial revenue 1,293 6,068 5,823 3,358 6,868
Collection on purchased receivables 1,556 2,106 2,669 2,740 2,403
Commissions on installment payments - 1,222 616 9,236 10,016
Guarantee commissions received 131 340 513 801 1,751
Gain on bad debt recovered - - - 536 6,634
Source: Company data, SR

27 / 77
MONTHLY WRAP – April 2014
Copyright (C) Shared Research Inc. All Rights Reserved.
receivable (fixed assets) if the loans have been delinquent for one year, or those that are likely to take at
least one year to collect. P&L: revenues are commissions on installment payments. Commissions on
installment payments are noted as credit card revenue, and interest income on cash advances is
recorded as financing revenue.
Balance of installment advances paid—declining. This was mainly owing to lower cashing volumes
amid stable balance of shopping installment payments. The company sees no growth in cashing-only
cards, given loan ceiling regulations and in turn migration of balances to large banks and related service
providers (who have more marketing clout). Thus J Trust intends to focus more on the credit guarantee
services subsegment. In its credit card services J Trust aims to increase cardholder numbers and loan
balance thereby boosting revenues. To expand its cardholder base the company: 1) jointly runs Rental!
Adores, a DVD/CD rental chain, with Adores; and 2) operates eMoMoT.com, a membership online
shopping site. Longer term J Trust wants synergistic alliances with companies sporting a big customer
base. Acquisitions are possible.
Credit guarantee services
(5.3% of financial business operating revenue in FY03/13)
Group companies Nihon Hoshou, KC Card, and Credia provide credit guarantees on
consumer loans to banks and cooperative-type financial institutions. It had seven partner banks as of
February 2014.
The credit guarantee business is to guarantee consumer loans and property-backed loans by banks and
other lenders. The business does not tie up assets and thus does not impact the balance sheet. The P&L
entry is guarantee commissions received.
Court ruling. In January 2006 Japan’s Supreme Court ruled that the interest rate gap between the
Investment Act and the Interest Rate Restriction Act was not valid. The upshot: consumer lenders are
forced to lend money at lower rates while implementing more stringent borrower screening. In June
2010 the Money Lending Business Act was revised. The revised law restricts loans up to one third of the
annual income of borrowers, paring opportunities for consumer loan businesses to lend. So Japan is
Balance of advances paid-installment FY03/09 FY03/10 FY03/11 FY03/12 FY03/13
(JPYmn) Cons. Cons. Cons. Cons. Cons.
Advances paid-installment 6,343 3,825 1,443 65,024 48,133
Long-term operating loans receivable 2 44 31 7,115 3,205
Total (balance of advances paid-installment) 6,345 3,870 1,475 72,139 51,338
Source: Company data
Installment payment paying for commission FY03/09 FY03/10 FY03/11 FY03/12 FY03/13
(JPYmn) Cons. Cons. Cons. Cons. Cons.
Credit card revenue - - - 2,028 2,853
Financing revenue - - - 6,926 6,937
Installment payment paying for commission - 1,222 616 281 224
Total (installment payment paying for commission) - 1,222 616 9,236 10,016
Source: Company data
Credit guarantee balance, guarantee commission received FY03/09 FY03/10 FY03/11 FY03/12 FY03/13
(JPYmn) Cons. Cons. Cons. Cons. Cons.
Unsecured 8 4,743 4,594 9,614 16,458
Secured 2,446 2,792 5,104 12,457 16,735
Total credit guarantee balance 2,455 7,536 9,699 22,072 33,194
Guarantee commission received 131 340 513 801 1,751
Source: Company data

28 / 77
MONTHLY WRAP – April 2014
Copyright (C) Shared Research Inc. All Rights Reserved.
unlikely to see many more people taking out consumer loans or going for higher balances. Banks though
are exempt from the lending ceiling restrictions and that increased their presence and influence in the
market. Yet banks lack screening and loan recovery expertise when it comes to higher-risk unsecured
consumer loans, so are turning to consumer financial firms to guarantee loans. In the guarantor business,
the guarantor firm will be the one that repays the bank in the event that a borrower becomes unable to
make loan payments.
J Trust has expanded its credit guarantee balance through unique services, targeting small
regional banks. It sends credit guarantee specialists to these banks. This arrangement is win-win for J
Trust and partner banks, providing J Trust with solid revenues and letting banks access specialist
knowledge.
Customers of J Trust (eg, Nihon Hoshou and KC Card) are introduced to a partner bank. Credit
guarantee specialists from J Trust also help the bank to collect debt and extend additional/new loans.
A consumer loan customer introduced to a partner bank becomes a consumer loan customer of the
bank. Rates on unsecured loans are about 15% and 8% for secured loans. The change of lenders
from a consumer financial firm to a bank can make the borrower feel more comfortable.
The partner bank and the company split the interest income: on unsecured loans the bank receives
about one-third of interest income and the company receives two-thirds; on secured loans the bank
and the company receive half the interest income each. Since the company is providing its unique
expertise to the partner bank, the company receives a higher share of interest income than is typical
for other companies.
Banks lack consumer loan receivables collection skill and have little incentive to collect,
especially when the receivables are subject to a credit guarantee (no risk of loss). Under J Trust’s credit
guarantee scheme, dispatched debt collection specialists sharply reduce loan losses. J Trust’s credit loss
rate hovers at 1% vis-à-vis 4% at other credit guarantee firms. J Trust intends to partner with more
banks and build up its credit guarantee balance by using the customer base of KC Card and Takefuji Corp
(defunct). J Trust aims to grow its credit guarantee balance further by having dispatched specialists take
an active stance toward the extension of additional loans or finding new customers.
Consumer loan services
(15.0% of financial business operating revenue in FY03/13)
J Trust makes unsecured loans at 15-18% interest rate. Group companies Nihon Hoshou, Credia,
and Saikyo Card (removed from the group in January 2014) handle these services. Loans extended are
booked on the balance sheet as accounts receivable, operating loans, or long-term operating loans
receivable. Interest income is recorded on the P&L as interest on loans.
The balance of consumer loans is trending south driven by customer introductions to partner banks in
the credit guarantee services subsegment.
Bad debt recovery services
(20.0% of financial business operating revenue in FY03/13)
J Trust uses its expertise to accelerate bad debt recovery. According to J Trust the purchased
Sum of loans receivable, interest on loans FY03/09 FY03/10 FY03/11 FY03/12 FY03/13
(JPYmn) Cons. Cons. Cons. Cons. Cons.
Accounts receivable-operating loans 25,663 16,256 9,504 20,903 12,025
Long-term loans receivable 1,772 2,672 2,224 1,322 1,405
Total (sum of loans receivable) 27,435 18,928 11,728 22,226 13,431
Interest on loans 96 4,277 2,801 3,479 4,964
Source: Company data

29 / 77
MONTHLY WRAP – April 2014
Copyright (C) Shared Research Inc. All Rights Reserved.
receivables it assumed from Takefuji (defunct) included performing receivables along with bad debt
already written off the balance sheet. Written-off bad debt has no book value, so recovery implies
zero-cost profits. Through use of its proprietary expertise, the company is making progress in recoveries.
Revenues from bad debt recovery are booked on the P&L as gain on bad debt recovered. In FY03/13 the
gain hit JPY6.6bn.
Other financing revenues
(20.7% of financial business operating revenue in FY03/13)
In factoring services, the difference between the recovered amount for loan receivables and the cost of
purchasing loan receivables is booked as other financing revenue—this mainly applies to loan receivables
inherited from Takefuji. In FY03/13, other financing revenues were JPY6.9bn.
Costs in the financial business
J Trust does not disclose gross operating profits by segment. However, estimating from P&L data, it
seems that the main operating cost in the financial business is interest on borrowings. Main selling and
general expenses: provisions for bad debts, provisions for losses on interest repayments, provisions for
losses on credit guarantees, personnel costs, and other overheads.
Provisions for losses on interest repayments: Business accounting in Japan requires that repayment of interest that
has been overpaid on loans with so-called “gray zone” interest rates that were in excess of maximums set forth in the
Interest Rate Restriction Act must be provided for in the accounts of loan lenders. The provision for loss on interest
repayments is calculated as follows. First, the estimated provision for loss on interest repayments at the end of the current
period is calculated. Next, the loss on interest repayments for the current year is deducted from the provision balance at the
end of the previous year. If there is a shortfall after allocating the current year’s losses, provisions must be topped up, and
recorded as SG&A expenses.
Provisions for credit guarantee losses: provisions for credit guarantees from periods prior to the current one where there
is a high likelihood of losses.
Provisions of allowance for bad debts rose due to the consolidation of KC Card in FY03/12. In FY03/13,
provisions fell as falls in the relevant balance and loan loss ratio saw the inflow of new provisions decline.
Provisions for losses on interest repayments are on a downward trend. The number of claims is falling,
and J Trust has made progress on reaching voluntary settlements with creditors.
Provision for loss on guarantees in FY03/13 included not only loss provision related to credit guarantee
services, but also provision of allowance for contingent liabilities. The allowance was reversed in FY03/14
because the liabilities were fully repaid.
Personnel and sundry expenses are on an uptrend due to the bigger scale of the business and employee
numbers following M&A activity.
International business
(5.0% operating revenue, JPY336mn operating loss (FY03/13)
Long-term focus: expanding savings bank services. J Trust’s international business has two
subsegments: savings bank services and consumer loan services.
Provisions for allowances FY03/09 FY03/10 FY03/11 FY03/12 FY03/13
(JPYmn) Cons. Cons. Cons. Cons. Cons.
Provisions for allowance for doubtful accounts 1,075 2,041 0 2,019 71
Provisions for losses on interest repayment 296 2,457 2,535 1,460 1,195
Provisions for bad debts 0 66 0 87 1,484
Source: Company data, SR Inc.

30 / 77
MONTHLY WRAP – April 2014
Copyright (C) Shared Research Inc. All Rights Reserved.
Savings bank services (Korea)
Chinae Savings Bank is very profitable. In October 2012 J Trust set up Chinae Savings Bank in
Korea, and began offering consumer loan services there integrating its expertise in credit screening and
receivables management. Neoline Credit joined J Trust group in 2011 having previously launched a
Korean consumer financial business in 2009. Neoline Credit had been tracking steady growth. As such J
Trust, via Neoline Credit, already had knowledge of Korea’s consumer loan market before it established
Chinae Savings Bank. Korea’s consumer financial arena can be more profitable than Japan’s. Korea allows
higher loan rates (up to 39% at present, and scheduled to be up to 34.9% in April 2014), has no
overcharged interest problem, and levies a lower corporate tax rate. Chinae Savings Bank lends to
consumers at about a 29% interest rate. Per J Trust, Korea’s credit loss rates at around 10-15% are
higher than Japan’s. Yet Chinae Savings Bank is highly profitable.
Loans by the banking business hit JPY48.2bn at end FY03/13. Loans extended here are
recorded on the balance sheet as loans by the banking business. Interest income is booked on the P&L as
operating revenue from banking operations. The company has continued increasing its receivables
balance in Korea. In October 2012 J Trust took over about JPY20bn of consumer credit loan receivables
from Mirae Savings Bank. In January 2013 the company bought JPY29.9bn of consumer loan receivables
from Solomon Savings Bank. In June 2013 J Trust bought JPY15.3bn of consumer loan receivables from
HK Savings Bank. At end Q2 FY03/14 the banking business’ loan balance was JPY51.7bn.
Bail-out fund: moral hazard. In 1H FY03/14 the Korean government launched the People’s Happiness
Fund to help heavily indebted people, to fulfill an election promise by President Park Guen-hye. By June
2013 J Trust had sold applicable loans receivable worth about JPY2.6bn to the fund. Acceptance of
applications for the bailout program was terminated in December 2013.
People’s Happiness Fund: a Korean government program to address household debt. The target group
is those with less than KRW100mn (approximately JPY9mn) debt in arrears for more than six months at end
February 2013. The debt is written down by up to 50% and debtors need to repay the balance to the fund
by installment. Lenders need to sell applicable debt to the fund for about 8% of its value (some 92%
impairment). The initial application period was from April 2013 to October 2013 but this was extended to
end December 2013.
According to J Trust, other Japanese corporations entered the market by investing in existing mutual
savings banks. They thus felt the impact of existing bad debts directly. However Chinae Savings Bank
purchased only the good assets and liabilities (deposits) of bankrupt financial institutions, so there is
limited bad debt impact. In January 2014, the company resolved that KC Card will underwrite a capital
increase in Chinae Savings Bank—in order to improve the bank’s BIS capital ratio—but will limit the
amount to around JPY5.0bn.
View the full report.

31 / 77
MONTHLY WRAP – April 2014
Copyright (C) Shared Research Inc. All Rights Reserved.
Star Mica (3230)
Purchaser and reseller of pre-owned condominiums. Buys pre-owned individual condominium units
that are being rented, renovates these apartments when the tenants move out, and sells them for a
profit.
Star Mica’s primary business is to buy pre-owned condominiums, and earn rental income and profits from
sales. This business comprised 91.6% of the company’s overall sales and 84.3% of its operating profit for
FY11/13.
The company’s growth strategy focuses on an expansion of its existing operations and the development
of new businesses. The company plans to expand its pre-owned condominium business and increase the
number of such properties by borrowing money until its capital-to-asset ratio reaches 25%. The
company will at the same time expand its property rental and brokerage services involving pre-owned
condominiums.
Operations
The company’s main pre-owned condominium business is fairly unique for a large listed real estate
company: it buys pre-owned individual condominium units that are being rented, renovates these
apartments when the tenants move out, and sells them for a profit.
In Japan, purchasers of pre-owned condominiums with tenants are limited because these properties
cannot be sold immediately after purchase and because according to local convention the buyer cannot
inspect the inside. As a result, such condominiums tend to be cheaper than vacant pre-owned properties.
Star Mica acquires such individual tenant-occupied condominiums that are being rented. The company
first earns rental income and then makes a profit from the fact that there are always price differences
between properties that are being rented and those that are vacant.
Instead of acquiring entire buildings, the company buys individual pre-owned condominiums to spread
the risk (accidents, natural disasters, price fluctuations, and the tenant’s length of stay). This approach
allows the company to own a variety of apartments in different locations. The age of the condominiums
also varies. The downside of this method is that acquiring a single condominium property can be
inefficient and cumbersome. However, there is little competition to acquire such properties, allowing the
company to buy them cheaply.
The company quickly assesses the value of properties and makes swift purchase decisions. The company
also has the ability to raise funds and enjoys a track record of successful transactions. As a result, the
company is in a strong position to gather information on pre-owned condominiums that have been put
up for sale. Another factor that sets the company apart is the ability to assess the value of a large number
of properties and execute many transactions. Star Mica also has access to loans that are not tied to any
specific properties, allowing the company to quickly sign a purchase agreement without making a
separate loan application each time a property is found.
Main business segments
The company’s business segments comprise Pre-Owned Condominium, Investment, and Advisory
services. Sales composition for FY11/13: Pre-Owned Condominium, 91.6%; Investment, 5.6%; advisory,
2.7%. Operating composition for FY11/13: Pre-Owned Condominium, 84.3%, Investment, 2.2%,
Advisory, 13.5%. Hence the Pre-Owned Condominium business is the company’s main business.

32 / 77
MONTHLY WRAP – April 2014
Copyright (C) Shared Research Inc. All Rights Reserved.
Pre-Owned Condominium (91.6% contribution to FY11/13 sales, 84.3%
contribution to operating profit)
The company makes profits from price differences between pre-owned apartments with tenants and
those that are vacant. The company purchases pre-owned family-size apartments with tenants and earns
rental income until the tenant leaves. Then, it renovates the apartments and sells them for a profit.
The process:
The company buys a pre-owned apartment with a tenant through a real estate broker;
The company takes over the leasing agreement and earns rental income until the tenant moves out;
After the tenant leaves, the company renovates the apartment and sells it through a broker.
The exact cost varies according to the property in question, but in a typical case a pre-owned, family-size
condominium located in or around Tokyo costs Star Mica about JPY20mn on average. The company earns
about JPY120,000 per month in rent until the tenant leaves. Then, the company spends about JPY3.5mn
to renovate the apartments and sells them for about JPY28mn.
The company’s renovation of pre-owned condominiums includes new wallpaper, wooden flooring, doors,
bath units, sinks, and restrooms.
The company buys single condominium units with the following features:
Pre-owned, family-size apartments currently being rented, in and around Tokyo of at least 50m2 in size;
Between 10 and 30 years old;
Sales and OP by Segment FY11/09 FY11/10 FY11/11 FY11/12 FY11/13
(JPYmn) Act. Act. Act. Act. Est.
Sales 13,310 12,403 12,719 12,858 13,544
YoY -5.5% -6.8% 2.5% 1.1% 5.3%
Pre-owned Condominium 12,273 11,440 11,834 11,775 12,411
YoY 1.1% -6.8% 3.4% -0.5% 5.4%
Composition 92.2% 92.2% 93.0% 91.6% 91.6%
Investment 852 759 585 774 763
YoY -45.8% -10.9% -23.0% 32.4% -1.5%
Composition 6.4% 6.1% 4.6% 6.0% 5.6%
Advisory Services 184 204 301 308 370
YoY -50.8% 10.5% 47.6% 2.6% 19.9%
Composition 1.4% 1.6% 2.4% 2.4% 2.7%
Operating Profit 1,377 1,610 1,858 1,542 1,804
YoY -16.8% 16.9% 15.4% -17.0% 17.0%
Pre-owned Condominium 1,622 1,697 1,807 1,585 1,846
YoY -9.8% 4.6% 6.5% -12.3% 16.4%
Composition 100.6% 91.8% 85.4% 85.8% 84.3%
Investment -92 21 78 31 48
YoY - - 264.0% -60.5% 55.8%
Composition - 1.2% 3.7% 1.7% 2.2%
Advisory Services 83 131 230 231 295
YoY -59.0% 58.2% 75.7% 0.7% 27.5%
Composition 5.1% 7.1% 10.9% 12.5% 13.5%
Source: Company data, SR research
Figures may differ from company materials due to differences in rounding methods
Operating profit composition percentages are calculated using the sum of segment operating profit before eliminations.

33 / 77
MONTHLY WRAP – April 2014
Copyright (C) Shared Research Inc. All Rights Reserved.
Cost price around JPY20mn.
As of November 2013, the company was acquiring about 500 such apartments on an annual basis and
holding more than 1,000 units at any given time. According to the company, the average size of these
family apartments is 64.2m2, the average age is 21.8 years, and the average cost price is JPY18.8mn
(end FY11/13). When purchasing an apartment, the company considers how easy it will be to sell on, and
is particularly conscious of liquidity and convenience.
As of November 2013, about 70% of the company’s properties are in the Tokyo Metropolis. However, only
14.9% of them are located in the major five wards (Shibuya, Shinjuku, Chuo, Chiyoda, and Minato).
Those located in other wards of Tokyo comprise 36.9% of the total. Those in Kanagawa Prefecture
comprise 19.9%, followed by Chiba Prefecture at 7.6% and Saitama Prefecture at 2.8%. About 70% of
the properties were built after 1988 and the rest were built between 1980 and 1988.
Pre-owned condominiums by area and age
Source: Company materials
Price differences between pre-owned apartments that are being rented and those that are vacant allow
the company to make a profit after selling the properties. According to the company, apartments that are
being rented are cheaper for the following reasons:
Limited liquidity: Such apartments are purchased for investment purposes and not for residential
purposes. Thus, the pool of buyers is limited.
Uncertain time horizon: These apartments, once purchased, cannot be sold until the tenant moves
out. There is a possibility that the tenant will stay for a long time.
Uncertain cost: The inside of the apartments cannot be seen since there is a sitting tenant. Thus, it is
difficult to estimate the amount of renovation expenses that would be incurred after the tenants leave.
As a result, apartments that are being rented are usually sold between 20-30% cheaper than vacant
properties.
Liquidity and uncertainty vary widely between properties when purchasing pre-owned condominiums
with tenants. Thus, the value and profitability of small portfolios of properties is heavily affected by the
individual characteristics of each property. However, the company owns over 1,000 properties, and is
therefore able to reduce investment risk through the benefit of diversification.

34 / 77
MONTHLY WRAP – April 2014
Copyright (C) Shared Research Inc. All Rights Reserved.
The prices of some properties—such as studio apartments for investors, new family condominiums, and
expensive properties in desirable urban locations—fluctuate widely depending on conditions in the real
estate market. However, price fluctuations are small for pre-owned family-size condominiums. The
reason for this, according to the company, is that there is always a certain level of demand for
apartments catering to families, and therefore prices will not fall by any great amount. If property prices
were to fall, demand for properties would rise among those who live in rental houses—since the
difference between what they currently pay in rent and their potential loan payments would become
smaller. Therefore pre-owned condominium prices will not fall below the level where monthly loan
payments would far undercut rent costs.
During FY11/13, the company’s average pre-owned 70.8m2 condominium was sold for JPY30.8mn. The
monthly rent for a similar apartment would be JPY152,000. Since the monthly housing loan payment (35
year amortizing mortgage with an interest rate of 1%) for this condominium would be JPY85,000 as of
November 2013, the buyer would spend less money on monthly mortgage repayments.
Differentiation
According to the company, it quickly assesses the value of properties and makes swift purchase decisions.
It also has the ability to raise funds and a track record of successful transactions. As a result, the
company is in a strong position to gather information on pre-owned apartments that have been put up
for sale.
When assessing the value of properties, the company uses its own database that has detailed
information on the apartments that it acquired or considered acquiring in the past. According to the
company, it uses a sales comparison approach (a method to determine the value of a property based on
the transaction prices and list prices of neighboring properties) to provide appropriate and swift price
assessments.
It is important to make swift purchase decisions. Real estate brokers are reluctant to disclose property
information to other brokers because they want to maximize their earnings by receiving commissions
from both the seller and the buyer. However, when a broker signs a contract with a property owner and
agrees to find a buyer for the property, the broker is required by the Building Lots and Buildings
Transactions Business Act to disclose information on the property. This information is disclosed through
the Real Estate Information Network System, which is accessible to other brokers. These brokers then
may come forward with their own buy offers, depriving the first broker of a chance to earn commissions
from the buyer of its own. SR understands that the broker would be able to avoid sharing the information
if a buyer is found before the five-day period ends. Then, the broker would be able to earn commissions
from both the seller and the buyer. That means a buyer who can make a quick purchase decision is an
important customer for brokers. Such a buyer would receive property information before anyone else
does.
Brokers are also eager to introduce properties to Star Mica because of its ability to raise funds. That is
why the company receives property information more quickly than other potential buyers.
Barriers to entry
SR believes that new market entrants will face difficulty competing with Star Mica, which makes
diversified investments based on statistical analysis and its own history of transactions. The company has
the financial resources to acquire a large number of pre-owned apartments. It also has knowledge on
apartment renovation and expertise in handling a variety of tasks associated with this business.
As it is unknown when tenants will leave, it is impossible to tell when revenue from the sale of an
individual pre-owned condominium that is being rented will come in. Further, there is no way to tell
whether or not there are flaws with the property before purchase, because purchasers cannot see inside
the property (given that someone lives there). Thus new market entrants—those with no track record of
purchasing pre-owned condominiums that are being rented—are unlikely to purchase these types of

35 / 77
MONTHLY WRAP – April 2014
Copyright (C) Shared Research Inc. All Rights Reserved.
properties thanks to uncertainty over their liquidity and the condition of the interior. Also, buyers with
small portfolios are exposed to the pros and cons of individual properties. Star Mica purchases a large
number of pre-owned apartments to spread this risk. Some individual properties could be problematic.
However, profits from these properties tend to converge at a statistical mean. When taken as a whole,
these apartments generate a certain level of income for the company. As a result, the buying and selling
of pre-owned condominiums that are being rented can be a viable business.
The company was seeking to improve the value of its pre-owned condominiums through renovation as of
November 2013. The company created Shiawase Renove Kenkyujo, a product planning organization
made up mostly of female employees. The goal is to create condominiums with plenty of storage and
elbow room, and pursue comfort from the standpoint of women.
Star Mica is also trying new initiatives. For example, the company is working with Mikihouse Child &
Family Research and Marketing Institute, a subsidiary of Miki House (privately held), to create a room
layout and develop equipment for parents with small children.
Pre-owned condominium business (rental)
Contribution to sales for FY11/13: 13.7%; contribution to gross profit: 42.0%
After purchasing a property, the company takes over the existing leasing agreement with the tenant, who
continues to live in the apartment and pays the rent.
According to Star Mica, the average tenant stays for about two and a half years after the company makes
a purchase. SR estimates that the company owned about 1,400 condominium units as of end-FY11/13.
The company’s rental income can be calculated by multiplying the average rent payment by the number
of condominium units it owns. Thus, the number of pre-owned condominiums held (for sale) determines
this segment’s sales and profits. The company has been increasing the number of properties it holds. The
number rose by 51.6% during a five-year period from FY11/09 until FY11/13 (8.6% average annual
increase).
Expenses in this segment include property maintenance fees, payments for reserve funds for building
repairs, taxes on fixed assets, and rental administration fees. The company farms out some of the
administration work to a subsidiary, Fan Investment Co Ltd. According to an estimate by SR, the nominal
yield of the company’s properties is about 8%, with a gross profit margin of 70%.
Pre-owned condominium business (sale)
Contribution to sales for FY11/13: 77.9%; contribution to gross profit: 44.3%
The company’s revenue from this business can be calculated by multiplying the sale price per unit by the
number of apartments sold. The average tenant continues to stay for 2.5 years, meaning that the
company sells between 30% and 40% of the apartments it owns each year. (SR estimates that the
average length of stay in the company’s pre-owned condominiums was 3.8 years during FY11/13 and
that the company sold about a quarter of its properties during that year.) The company sells a certain
number of its condominiums on a regular basis, and therefore the number of condominiums held for sale
determines the company’s sales and profits.
The sale price is influenced by price movements in the pre-owned condominium market but, as
previously mentioned, the impact of these movements is minimal. Primary expenses include the initial
purchase price, brokerage commissions, taxes, and renovation expenses. Gross profit margin for this
business is between 10% and 15%.

36 / 77
MONTHLY WRAP – April 2014
Copyright (C) Shared Research Inc. All Rights Reserved.
The pre-owned condominium business is handled at the parent level. The segment’s SG&A expenses are
almost identical to those of the parent company. Most of the SG&A expenses for these operations are
fixed costs, such as personnel and office expenses.
On March 31, 2014, the company announced earnings results for Q1 FY11/14.
As for the company’s progress toward its FY11/14 target, Q1 sales were somewhat short of forecast.
However, the company stated that profits exceeded the target. The company does not rush to sell
properties in part because prices of pre-owned condominiums may rise in the near future. The company
now sells properties at high prices. Thus, SR believes that a failure of Q1 sales to meet the target is not
a major concern for the company.
View the full report.
Pre-Owned Condominium (Sales): Sales, Gross Profit, and Nominal Yield (million yen)
FY11/09 FY11/10 FY11/11 FY11/12 FY11/13
Act. Act. Act. Act. Act.
Sales (JPYmn) 10,746 10,025 10,184 10,065 10,550
YoY 1.7% -6.7% 1.6% -1.2% 4.8%
Gross Profit (JPYmn) 1,163 1,443 1,518 1,334 1,434
YoY -6.7% 24.1% 5.2% -12.1% 7.5%
Gross Profit Margin 10.8% 14.4% 14.9% 13.3% 13.6%
Average sale price (JPY '000) - - 26,107 27,302 30,770
Properties sold - - 390 369 343
Real estate for sale (JPYmn) 17,797 21,256 24,191 23,986 26,978
Average cost price (JPY '000) 19,159 20,986 20,860 20,127 18,826
Total properties 929 1,013 1,160 1,192 1,433
Properties sold/average total properties - - 0.36 0.31 0.26
Average years held - - 2.8 3.2 3.8
Source: Company data, SR Research
Note: Total properties, average rent, and nominal yield are estimates by SR and may differ from actual figures. Formulas
used for calculating estimates are as below. In addition to these formulas, the average vacancy rate is estimated at 12.5%
based on SR's interviews with Star Mica management.
Total properties=real estate for sale÷average cost price
Average rent=sales÷total properties averaged between beginning and end of term÷vacancy rate
Nominal yield=sales÷real estate for sale averaged between beginning and end of term÷vacancy rate
Quarterly Performance
(JPYmn) Q1 Q2 Q3 Q4 Q1 Q2 Q3 Q4 Q1 Q2 Q3 Q4 % of FY Est. 1H Est.
Sales 3,172 3,369 3,208 3,110 2,602 3,565 4,006 3,371 3,118 - - - 43.6% 7,159
YoY 10.7% 0.5% -3.9% -1.8% -18.0% 5.8% 24.9% 8.4% 19.8% - - - 16.1%
GP 696 765 706 603 671 908 908 753 870 - - -
YoY -9.0% -9.0% -0.3% -15.5% -3.7% 18.6% 28.5% 24.9% 29.7% - - -
GPM 22.0% 22.7% 22.0% 19.4% 25.8% 25.5% 22.7% 22.3% 27.9% - - -
SG&A 288 306 289 346 304 391 310 430 304 - - -
YoY 11.4% 7.6% -4.0% 6.0% 5.5% 27.9% 7.3% 24.3% 0.0% - - -
SG&A / Sales 9.1% 9.1% 9.0% 11.1% 11.7% 11.0% 7.7% 12.8% 9.7% - - -
OP 408 460 417 257 367 516 598 323 566 - - - 56.9% 996
YoY -19.4% -17.5% 2.4% -33.7% -10.1% 12.4% 43.2% 25.8% 54.5% - - - 12.8%
OPM 12.9% 13.6% 13.0% 8.3% 14.1% 14.5% 14.9% 9.6% 18.2% - - - 13.9%
RP 263 323 282 121 230 372 449 179 415 - - - 59.9% 693
YoY -30.4% -22.6% 2.5% -51.0% -12.5% 15.2% 59.6% 47.4% 80.4% - - - 15.1%
RPM 8.3% 9.6% 8.8% 3.9% 8.9% 10.4% 11.2% 5.3% 13.3% - - - 9.7%
NI 149 171 166 52 136 208 292 109 253 - - - 60.7% 417
YoY -32.9% -25.3% 2.9% -59.3% -8.7% 21.6% 75.3% 107.9% 86.2% - - - 21.2%
NPM 4.7% 5.1% 5.2% 1.7% 5.2% 5.8% 7.3% 3.2% 8.1% - - - 5.8%
Figures may differ from company materials due to differences in rounding methods
Source: Company data
FY11/13 FY11/14FY11/12 FY11/14

37 / 77
MONTHLY WRAP – April 2014
Copyright (C) Shared Research Inc. All Rights Reserved.
March 2014 Client Updates
3-D Matrix, Ltd. (7777)
Medical technology company. Exclusively licensed from MIT, core technology is based on unique
characteristics of self-assembling peptides.
On March 14, 2014, the company announced earnings results for Q3 FY04/14 and revised its FY04/14
full-year earnings forecast and medium-term business plan.
At the beginning of FY04/14, 3DM forecasted that it would receive domestic approval for manufacture
and sales of its absorbent topical hemostatic agent, and planned for revenue from milestone payments
and product sales. Concerning TDM-621 in the US market, the company had planned to establish a
business partnership with a firm in the US by the end of April 2014, and receive a one-time payment for
licensing rights.
However, although the company worked to move forward with the PMDA approval process, as of March
2014, the agent is still under review. As such, approval is expected to be beyond April 2014. In light of
this, revenue from milestone payments and sales are now planned to be booked in FY04/15.
In addition to the US, sales licensing negotiations in the EU are behind schedule. 3DM is currently in talks
with a number of different companies, but any agreements will not be reached in time to be booked in
FY04/14. As a result, the company is now aiming to establish agreements during FY04/15, and record
one-time licensing payments in FY04/15.
Revised FY04/14 full-year earnings forecast
Sales: JPY106mn (Previous forecast: JPY4.2bn)
Operating loss: JPY1.5bn (Operating profit of JPY1.7bn)
Recurring loss: JPY1.5bn (Recurring profit of JPY1.6bn)
Net loss: JPY1.5bn (Net income of JPY1.5bn)
Loss per share: JPY75.57 (Earnings per share of JPY78.76)
Revision to the medium-term business plan
In light of the revision to the FY04/14 full-year earnings forecast, 3DM has revised the timing of when it
plans to receive revenue from milestone payments and sales that were originally planned to be booked in
FY04/14.
View the full report
Quarterly Performance
(JPYmn) Q1 Q2 Q3 Q4 Q1 Q2 Q3 Q4 % of FY FY Est.
Operating Revenue 0 0 0 32 48 1 7 - 53.3% 106
YoY - - - -95.5% - - - - -
R&D Expenses 92 91 90 123 146 136 145 -
YoY 130.1% 93.8% 101.2% 2.9% 59.7% 50.0% 61.6% -
SG&A 134 136 165 201 222 221 232 -
YoY -10.6% 30.1% 46.4% 52.3% 65.9% 62.6% 40.7% -
OP -226 -227 -254 -292 -321 -356 -372 - - -1,464
YoY - - - - - - - - -
OPM - - - - - - - - -
RP -232 -226 -238 -281 -341 -361 -357 - - -1,475
YoY - - - - - - - - -
RPM - - - - - - - - -
NI -232 -226 -239 -281 -341 -361 -357 - - -1,476
YoY - - - - - - - - -
NPM - - - - - - - - -
Figures may differ from company materials due to differences in rounding methods.
Source: Company data, SR Inc. Research
FY04/14 FY04/14FY04/13
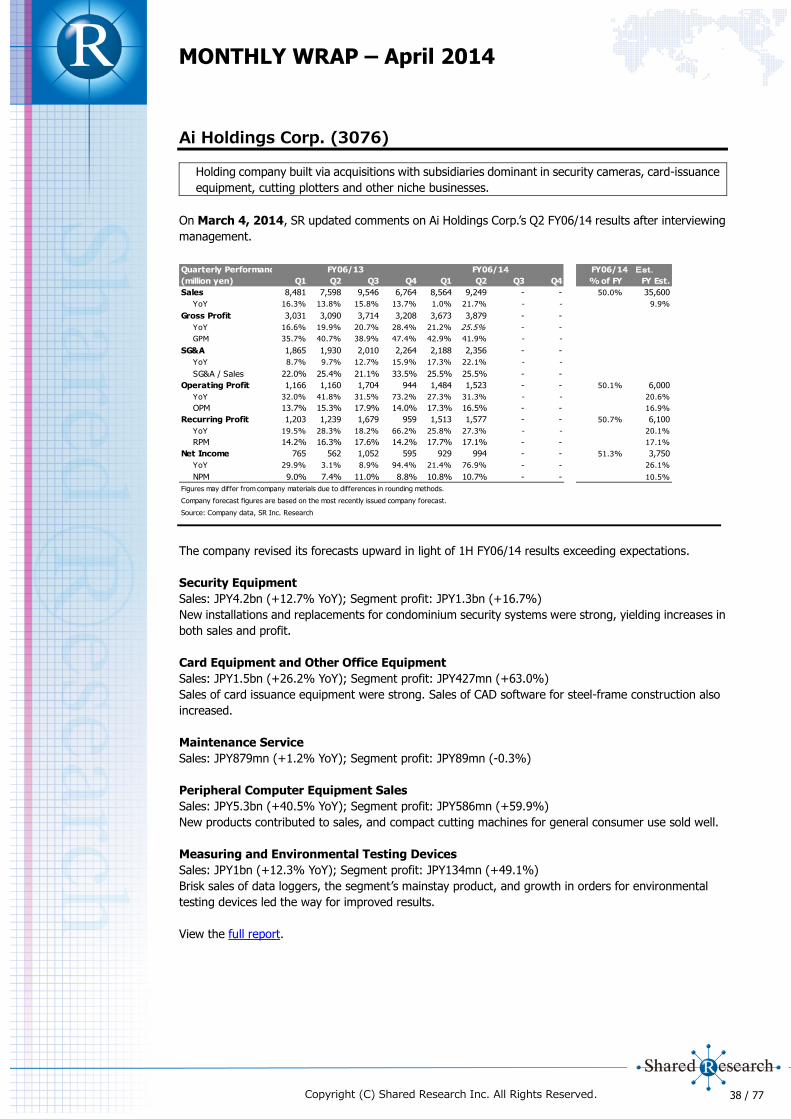
38 / 77
MONTHLY WRAP – April 2014
Copyright (C) Shared Research Inc. All Rights Reserved.
Ai Holdings Corp. (3076)
Holding company built via acquisitions with subsidiaries dominant in security cameras, card-issuance
equipment, cutting plotters and other niche businesses.
On March 4, 2014, SR updated comments on Ai Holdings Corp.’s Q2 FY06/14 results after interviewing
management.
The company revised its forecasts upward in light of 1H FY06/14 results exceeding expectations.
Security Equipment
Sales: JPY4.2bn (+12.7% YoY); Segment profit: JPY1.3bn (+16.7%)
New installations and replacements for condominium security systems were strong, yielding increases in
both sales and profit.
Card Equipment and Other Office Equipment
Sales: JPY1.5bn (+26.2% YoY); Segment profit: JPY427mn (+63.0%)
Sales of card issuance equipment were strong. Sales of CAD software for steel-frame construction also
increased.
Maintenance Service
Sales: JPY879mn (+1.2% YoY); Segment profit: JPY89mn (-0.3%)
Peripheral Computer Equipment Sales
Sales: JPY5.3bn (+40.5% YoY); Segment profit: JPY586mn (+59.9%)
New products contributed to sales, and compact cutting machines for general consumer use sold well.
Measuring and Environmental Testing Devices
Sales: JPY1bn (+12.3% YoY); Segment profit: JPY134mn (+49.1%)
Brisk sales of data loggers, the segment’s mainstay product, and growth in orders for environmental
testing devices led the way for improved results.
View the full report.
Quarterly Performance
(million yen) Q1 Q2 Q3 Q4 Q1 Q2 Q3 Q4 % of FY FY Est.
Sales 8,481 7,598 9,546 6,764 8,564 9,249 - - 50.0% 35,600
YoY 16.3% 13.8% 15.8% 13.7% 1.0% 21.7% - - 9.9%
Gross Profit 3,031 3,090 3,714 3,208 3,673 3,879 - -
YoY 16.6% 19.9% 20.7% 28.4% 21.2% 25.5% - -
GPM 35.7% 40.7% 38.9% 47.4% 42.9% 41.9% - -
SG&A 1,865 1,930 2,010 2,264 2,188 2,356 - -
YoY 8.7% 9.7% 12.7% 15.9% 17.3% 22.1% - -
SG&A / Sales 22.0% 25.4% 21.1% 33.5% 25.5% 25.5% - -
Operating Profit 1,166 1,160 1,704 944 1,484 1,523 - - 50.1% 6,000
YoY 32.0% 41.8% 31.5% 73.2% 27.3% 31.3% - - 20.6%
OPM 13.7% 15.3% 17.9% 14.0% 17.3% 16.5% - - 16.9%
Recurring Profit 1,203 1,239 1,679 959 1,513 1,577 - - 50.7% 6,100
YoY 19.5% 28.3% 18.2% 66.2% 25.8% 27.3% - - 20.1%
RPM 14.2% 16.3% 17.6% 14.2% 17.7% 17.1% - - 17.1%
Net Income 765 562 1,052 595 929 994 - - 51.3% 3,750
YoY 29.9% 3.1% 8.9% 94.4% 21.4% 76.9% - - 26.1%
NPM 9.0% 7.4% 11.0% 8.8% 10.8% 10.7% - - 10.5%
Figures may differ from company materials due to differences in rounding methods.
Company forecast figures are based on the most recently issued company forecast.
Source: Company data, SR Inc. Research
FY06/14 Est.FY06/13 FY06/14

39 / 77
MONTHLY WRAP – April 2014
Copyright (C) Shared Research Inc. All Rights Reserved.
Apamanshop Holdings Co., Ltd. (8889)
Japan’s leading rental property broker, offering comprehensive services through its proprietary real
estate information network.
On March 14, 2014, SR updated comments on Apamanshop Holdings Q1 FY09/14 earnings results
after interviewing management.
According to the company, comparable store results at directly managed agencies (ie, excluding newly
opened stores) are growing healthily, with an 11% increase in sales and a 42% increase in operating
profit.
Sales were strong in the Related Services business, which Apamanshop has been strengthening as its
third main earnings source. These services include acting as a sales agent for services such as internet
connections, insurance, and furniture movers, and products such as room deodorizers and fire
extinguishers.
View the full report
Quarterly Performance
(million yen) Q1 Q2 Q3 Q4 Q1 Q2 Q3 Q4 % of FY FY Est.
Sales 9,000 9,734 9,105 8,803 8,872 - - - 24.0% 37,000
YoY -7.2% -5.3% -3.9% -4.0% -1.4% - - - -4.2%
GP 2,192 2,583 2,573 2,566 2,199 - - -
YoY -10.3% -3.5% 3.4% 5.8% 0.3% - - -GPM 24.4% 26.5% 28.3% 29.1% 24.8% - - -
SG&A 1,915 1,807 1,963 1,918 1,911 - - -
YoY -3.2% -4.1% -3.8% 5.7% -0.2% - - -SG&A / Sales 21.3% 18.6% 21.6% 21.8% 21.5% - - -
OP 276 777 610 647 288 - - - 12.0% 2,400
YoY -40.6% -1.9% 36.2% 5.9% 4.3% - - - 3.6%
OPM 3.1% 8.0% 6.7% 7.3% 3.2% - - - 6.5%
RP -32 677 458 305 126 - - - 7.4% 1,700
YoY - 13.4% 133.7% -4.4% - - - - 25.6%
RPM - 7.0% 5.0% 3.5% 1.4% - - - 4.6%
NI -425 1,878 75 685 929 - - - 46.5% 2,000
YoY - 1576.8% -58.3% -32.7% - - - - 2050.5%
NPM - 19.3% 0.8% 7.8% 10.5% - - - 5.4%
Figures may differ from company materials due to differences in rounding methods.
Source: Company data processed by SR Inc.
FY09/14 FY09/14FY09/13

40 / 77
MONTHLY WRAP – April 2014
Copyright (C) Shared Research Inc. All Rights Reserved.
Bell-Park Co., Ltd. (9441)
Independent mobile phone distributor focusing on SoftBank Mobile shops. Differentiation through
efficient stores and personnel investments. Growth through acquisitions
On March 28, 2014, SR Inc. updated comments on Bell-Park’s FY12/13 results after interviewing
management.
In September 2013, NTT Docomo (TSE1: 9437) began sales of the iPhone. Now, all three Japanese
major wireless carriers offer the iPhone. Being a relatively universal device which is largely independent
of the network it operates on, popularity of the iPhone is making differentiation for devices, services, and
networks among the carriers difficult. The company believes that distributors will play increasingly
important roles in aiding consumers in the purchasing process.
In contrast, carriers are altering commissions paid to distributors. Income from carriers is now tied very
strongly to performance and customer satisfaction. Carriers are seeking to filter out poor performers, and
the company stated that distributors that are unable to meet these demands are already starting to show
signs of trouble.
For the full-year, replacement sales were the main area of growth. Sales volume was 934,233 units
(+5.3% YoY): 493,068 units in new handset sales (-1.5%) and 441,165 units in replacement sales
(+14.2%).
On March 26, 2014, the company announced a share buyback.
On March 27, 2014, at 8:45AM, the company will conduct a share buyback on the Tokyo Stock Exchange
via the Tokyo Stock Exchange Trading NeTwork (ToSTNeT-3) system at the closing price for March 26,
2014, of JPY2,430 per share.
Quarterly Performance
(Million Yen) Q1 Q2 Q3 Q4 Q1 Q2 Q3 Q4 % of FY FY Est.
Sales 19,599 15,466 15,599 23,806 22,553 18,992 18,854 23,828 97.7% 86,200
YoY 19.3% -3.4% 1.6% 4.5% 15.1% 22.8% 20.9% 0.1% 15.8%
GP 3,890 3,292 3,065 3,647 4,520 3,840 3,847 4,287
YoY 33.2% 21.6% 5.7% 1.6% 16.2% 16.7% 25.5% 17.6%
GPM 19.8% 21.3% 19.6% 15.3% 20.0% 20.2% 20.4% 18.0%
SG&A 2,852 2,629 2,523 2,767 3,311 3,040 3,305 3,598
YoY 30.3% 19.8% 8.7% 8.0% 16.1% 15.7% 31.0% 30.0%
SG&A / Sales 14.6% 17.0% 16.2% 11.6% 14.7% 16.0% 17.5% 15.1%
OP 1,038 663 542 879 1,209 800 542 689 101.2% 3,200
YoY 41.9% 29.4% -6.2% -14.4% 16.5% 20.7% -0.1% -21.7% 2.5%
OPM 5.3% 4.3% 3.5% 3.7% 5.4% 4.2% 2.9% 2.9% 3.7%
RP 1,085 632 520 964 1,285 846 531 764 103.5% 3,310
YoY 49.3% 28.7% -2.3% -6.5% 18.5% 33.8% 2.0% -20.7% 3.4%
RPM 5.5% 4.1% 3.3% 4.0% 5.7% 4.5% 2.8% 3.2% 3.8%
NP 611 358 289 526 709 476 283 411 102.7% 1,830
YoY 64.2% 30.9% -1.2% -4.7% 16.1% 32.8% -1.9% -21.8% 2.6%
NPM 3.1% 2.3% 1.9% 2.2% 3.1% 2.5% 1.5% 1.7% 2.1%
Source: Company data, SR Inc. Research
Figures may differ from company materials due to differences in rounding methods.
Company forecasts are the most recent figures.
FY12/13FY12/12 FY12/13

41 / 77
MONTHLY WRAP – April 2014
Copyright (C) Shared Research Inc. All Rights Reserved.
On March 6, 2014, the company announced February monthly sales estimate.
View the full report.
Monthly Sales Jan Feb Mar Apr May Jun Jul Aug Sep Oct Nov Dec Total
2014
New 37,521 37,493 75,014
YoY -15.8% -4.2%
ex-low ARPU handsets 28,160 27,090 55,250
(YoY) 24.8% 36.3%
Replacement 34,016 31,927 65,943
YoY -8.9% 23.4%
Total 71,537 69,420 140,957
YoY -12.6% 6.8%
2013
New 44,561 39,123 80,207 42,188 44,188 29,921 31,772 33,596 34,022 37,766 39,479 36,245 493,068
YoY 15.8% 2.9% 20.1% 0.3% 4.4% -0.9% -10.9% 7.4% -11.4% -18.9% -19.9% -12.3%
ex-low ARPU handsets 22,566 19,882 40,417 23,187 24,066 19,059 21,191 24,508 22,890 22,919 25,087 25,944 291,716
(YoY) -23.0% -32.5% -22.2% -27.5% -23.4% -5.7% -12.7% 18.4% -4.4% -7.4% 5.8% 18.1%
Replacement 37,325 25,865 46,305 33,039 40,335 26,499 29,059 30,075 36,832 46,110 49,021 40,700 441,165
YoY 9.0% 9.5% 64.8% 37.4% 63.5% 31.9% 8.4% 25.3% 11.6% -12.5% -16.1% 10.6%
Total 81,886 64,988 126,512 75,227 84,523 56,420 60,831 63,671 70,854 83,876 88,500 76,945 934,233
YoY 12.6% 5.4% 33.4% 13.7% 26.2% 12.2% -2.6% 15.2% -0.8% -15.5% -17.8% -1.5%
Source: Company data, SR Inc. Research
Figures may differ from company materials due to differences in rounding methods.
Low ARPU handsets: Mimamori Mobile handsets, PhotoVision digital photo frames, and USIM

42 / 77
MONTHLY WRAP – April 2014
Copyright (C) Shared Research Inc. All Rights Reserved.
Chiome Bioscience Inc. (4583)
Independent private sector corporation involved in biotech drug discovery, having its roots in the
independent administrative institution Riken. Holding joint ownership and exclusive commercialization
rights for ADLib® system, a cutting edge platform technology, Chiome pursues the discovery of
“made-to-order drugs.”
On March 31, 2014, Chiome Bioscience Inc. revised its earnings forecast for FY03/14.
Earnings forecast revision for FY03/14
Sales: JPY435mn (Previous forecast: JPY740mn)
Operating loss: JPY687mn (Previous forecast: JPY522mn)
Recurring loss: JPY689mn (Previous forecast: JPY596mn)
Net loss: JPY739bn (Previous forecast: JPY599mn)
Loss per share: JPY77.38 (Previous forecast: JPY63.37)
Reason for the revision:
Sales may have missed forecast for FY03/14 because the planned licensing of Anti-Semaphorin 3A
antibody in the Lead Antibody Licensing segment was delayed.
Chiome in February 2013 submitted a patent application for Anti-Semaphorin 3A based on data that
demonstrated its effectiveness against sepsis during experiments on animals. According to the company,
subsequent studies have identified a clinically significant biomarker associated with Anti-Semaphorin 3A.
Furthermore, Anti-Semaphorin 3A was also effective in blocking the infiltration of cancer cells and in
eliminating their drug resistance. In February 2014, the company filed a Patent Cooperation Treaty (PCT)
application based on these data. The company stated that these developments have increased the
likelihood of the licensing of Anti-Semaphorin 3A.
The performance of the Drug Discovery Alliances segment and the Core Technology Licensing segment
were probably in line with forecast.
Operating profit, recurring profit, and net income may also have fallen short due to the sales forecast
revision outlined above.
On March 18, 2014, the company announced that it had succeeded in development of its Fully Human
ADLib® system.
According to the company, after creation and testing of a diversified library using superior cell lines that
were created by crossing over human antibody genes with light and heavy antibody genes of the gene
regions in avian B lymphoma-derived DT40 cells, it had succeeded in creating a practical application of its
Fully Human ADLib® system.
On March 14, 2014, the company announced a stock split.
On the record date of March 31, 2014, and the effective date of April 1, 2014, the company will execute
a two-for-one stock split. With this, the number of shares outstanding will increase from 10,087,000 to
20,174,000.
On March 10, 2014, SR updated comments on the company’s Q3 FY03/14 earnings results after
interviewing management.
View the full report.
43 / 77
MONTHLY WRAP – April 2014
Copyright (C) Shared Research Inc. All Rights Reserved.
Chiyoda Co., Ltd. (8185)
Retailer specializing in low-price shoes.
Chiyoda Co., Ltd. announced monthly sales data for February 2014 on March 3, 2014 and for March
2014 on April 1, 2014.
On March 19, 2014, the company announced a revision to its FY02/14 year-end dividend.
In light of its earnings results, financial standing, and striving to meet its goal of returning 50% of profits
to shareholders to maximize shareholder returns, the company announced that it will provide a JPY10
per share special year-end dividend for FY02/14. This, combined with the standard dividend of JPY30 per
share, will amount to a total year-end dividend of JPY40 per share. Combined with the mid-term dividend
of JPY30 per share, the total full-year dividend will be JPY70 per share (versus the previous forecast of
JPY60 per share).
View the full report.
DIC Corporation (4631)
DIC has four business segments: printing inks, fine chemicals, polymers, and application materials.
On March 20, 2014, DIC Corporation announced that its wholly-owned subsidiary, Sun Chemical
Corporation, will construct a new plant in Turkey to produce liquid ink for packaging.
Sun Chemical, based in the US, will increase its production capacity to target growth markets in Europe,
the Middle East, and Africa. It is also seeking further expansion of its presence in Turkey, where it already
has a significant share of the market. The new plant will begin construction in Q2 FY12/14, and is
scheduled to begin operations in Q3 FY12/15.
In the DIC105 medium term management plan, which began in FY12/13, liquid ink for packaging is a
core product in the company’s mainstay printing ink business. DIC Corporation will continue to
implement measures tailored to each region’s unique needs.
View the full report.
Comparable Store Sales Mar Apr May Jun Jul Aug Sep Oct Nov Dec Jan Feb
FY02/11 -6.5% -6.1% -7.5% -4.4% -4.6% -8.5% -7.4% 2.2% -5.4% -3.2% -0.1% 3.1%
FY02/12 -17.3% 4.1% 2.4% 1.9% 5.4% 1.0% 1.5% -0.5% 6.3% 3.0% -0.4% 1.4%
FY02/13 15.7% 2.2% -4.6% -0.6% -3.8% -3.5% -0.2% -8.9% 1.5% -2.8% -1.7% -6.9%
FY02/14 2.8% -11.4% -2.1% 1.3% -8.4% 0.2% -3.2% -3.9% -2.2% -3.4% -8.5% 17.0%
FY02/15 14.7%
Source: Company data processed by SR Inc.
Figures may differ from company materials due to differences in rounding methods.
All Store Sales Mar Apr May Jun Jul Aug Sep Oct Nov Dec Jan Feb
FY02/11 -2.2% -2.6% -4.2% -1.2% -1.6% -5.8% -5.7% 3.3% -4.8% -2.7% 0.4% 4.0%
FY02/12 -18.5% 2.1% 1.2% 0.5% 3.9% -0.1% 0.5% -1.3% 4.9% 1.5% -1.8% 0.0%
FY02/13 14.3% 0.8% -6.1% -1.7% -4.9% -4.7% -1.2% -9.4% 2.0% -2.5% -1.5% -6.6%
FY02/14 3.6% -8.3% -0.5% 3.3% -6.7% 1.8% -1.7% -2.6% -1.2% -2.5% -7.6% 17.7%
FY02/15 15.5%
Source: Company data processed by SR Inc.
Figures may differ from company materials due to differences in rounding methods.

44 / 77
MONTHLY WRAP – April 2014
Copyright (C) Shared Research Inc. All Rights Reserved.
Digital Garage Inc. (4819)
An online payment and marketing-support firm with a business incubation unit focused on early stage
e-commerce investments. Also has a stake in Twitter.
On March 27, 2014, Digital Garage Inc. announced development of Streamication O2O, a new type of
promotional service that is adapted to the mental and physical states of smartphone users.
The company has developed Streamication O2O, a new promotional service which fulfills the needs of
users, client companies, and storefronts through a smartphone app that is popular with certain user
segments. As a first project, the service will work together with “Luna Luna Lite,” a popular smartphone
app released by MTI Ltd. (JASDAQ: 9438). With cooperation from cocokara fine Inc. (TSE1: 3098), one
of the top drug store chains in Japan, the promotion will be held at cocokara fine’s 1,300 stores
nationwide.
Streamication O2O first stores various information about the smartphone app users such as their
attributes, mental, and physical states. Based on this information, it accurately matches users with
cosmetics, healthcare, and other daily necessities produced by client firms. After matching, users are
then provided with product information or discount coupons.
View the full report.

45 / 77
MONTHLY WRAP – April 2014
Copyright (C) Shared Research Inc. All Rights Reserved.
Don Quijote Co., Ltd. (7532)
Innovative and iconoclastic general discount retailer with a nationwide presence.
On March 10, 2014, Don Quijote announced sales figures for February.
Comparable store sales fell by 2.3% YoY in February 2014. Customer count fell 2.4% YoY as heavy snow
meant more people stayed indoors. However, foods and household goods picked up once the weather
settled down, and exhibited YoY growth by the end of the month. Electric appliances and watches and
fashion merchandise, however, had little chance to recover before the month was over.
View the full report.
Jul Aug Sep Oct Nov Dec Jan Feb Mar Apr May Jun
Total Stores
Sales 5.2% 8.2% 4.3% 5.1% 4.9% 5.4% 5.2% 3.5%
# of Stores 200 201 200 203 208 211 212 212
Comparable Stores
Sales -0.5% 1.8% -0.6% 0.0% 0.0% -0.9% -1.3% -2.3%
# of Customers 0.0% 1.1% -2.5% -0.4% -0.1% -0.5% -0.5% -2.4%
Avg. Spend per Customer -0.5% 0.6% 2.0% 0.4% 0.1% -0.5% -0.8% 0.1%
# of Comparable Stores 184 185 185 186 187 189 192 191
0.9% 3.7% -2.4% -0.6% 0.5% -4.1% -0.4% -5.0%
5.7% 10.0% 4.1% 8.2% 6.2% 8.0% 5.9% 5.4%
6.6% 9.6% 3.3% 5.1% 6.8% 9.4% 8.6% 9.9%
5.4% 9.1% 1.8% 4.4% 4.4% 4.2% 3.9% 0.0%
8.6% 6.8% 0.4% 4.9% 5.5% 6.9% 7.0% 2.7%
-13.3% -12.0% 103.4% 7.9% -5.7% 8.3% 5.1% -7.2%
(Fiscal Year Ending) 2002 2003 2004 2005 2006 2007 2008 2009 2010 2011 2012 2013
Total Stores
Sales 22.2% 37.6% 20.3% 19.8% 11.8% 7.2% 6.5% 5.9% 6.1% 5.9% 6.2% 7.1%
# of Stores 53 70 93 107 122 135 148 150 162 169 185 200
Comparable Stores
Sales -1.4% -1.8% -2.4% 2.0% 2.9% 0.4% -3.3% 0.5% -1.5% 3.4% 0.5% -0.1%
# of Customers 1.2% 0.5% -2.8% 0.3% -0.4% -0.7% -2.2% 4.5% 3.8% 3.1% -0.8% -0.5%
Avg. Spend per Customer -2.5% -2.3% 0.4% 1.7% 3.3% 1.1% -1.2% -3.8% -5.1% 0.3% 1.3% 0.4%
# of Comparable Stores 31 48 70 89 104 117 123 144 149 158 164 179
18.5% 29.4% 17.1% 17.0% 12.2% 4.0% -2.7% -4.8% -3.6% 5.1% -2.2% -0.5%
22.6% 37.4% 15.1% 15.5% 12.9% 10.4% 8.2% 9.8% 9.1% 7.9% 6.7% 7.9%
27.7% 42.0% 25.6% 23.1% 9.2% 5.1% 10.9% 20.8% 14.4% 4.5% 7.3% 8.9%
28.0% 48.1% 25.6% 23.4% 14.0% 7.0% 6.3% 0.0% 1.7% 4.3% 11.9% 11.2%
10.6% 24.8% 18.6% 14.1% 7.2% 13.3% 5.5% 4.1% 5.5% 8.2% 2.0% 8.3%
8.9% 28.1% 6.0% 19.4% -7.8% -1.3% 0.1% 10.4% 21.7% 29.7% 10.9% -22.6%
Source: Company data, SR Inc. Research
Figures may differ from company materials due to differences in rounding methods.
Other Products
Foods
Watches & Fashion Merchandise
Sporting & Leisure Goods
Other Products
(YoY)
Electric Appliances
Household Goods
Foods
Watches & Fashion Merchandise
Sporting & Leisure Goods
Household Goods
(YoY)
Electric Appliances
46 / 77
MONTHLY WRAP – April 2014
Copyright (C) Shared Research Inc. All Rights Reserved.
Emergency Assistance Japan Co., Ltd. (6063)
Japan’s sole independent provider of global medical assistance services. Expanding businesses related
to medical tourism.
On March 17, 2014, SR Inc. updated comments on FY12/13 earnings results by Emergency Assistance
Japan Co., Ltd. (EAJ) after interviewing management.
A steady increase in providing medical assistance services led to sales that were up 4.8% YoY to JPY2bn,
but operating profit fell 75.8% YoY to JPY35mn because of investments for future growth, increased
costs at overseas offices, and accounting costs incurred from a weaker yen. However, it should be noted
that in comparison to forecasts released by the company on July 16, 2013, operating profit was JPY5mn
higher, recurring profit was JPY3mn higher, and net income was JPY2mn higher.
View the full report.
Quarterly Performance
(Million Yen) Q1 Q2 Q3 Q4 Q1 Q2 Q3 Q4 % of FY FY Est.
Sales 554 435 448 456 548 447 473 515 99.2% 2,000
YoY - - - - -1.0% 2.7% 5.7% 12.9% 5.7%
GP 138 109 122 137 114 88 106 127
YoY - - - - -17.6% -18.6% -13.0% -7.8%
GPM 24.9% 24.9% 27.2% 30.1% 20.7% 19.8% 22.4% 24.6%
SG&A 84 102 93 78 93 96 106 104
YoY - - - - 10.0% -6.0% 13.3% 33.3%
SG&A / Sales 15.2% 23.5% 20.8% 17.2% 16.9% 21.5% 22.3% 20.3%
OP 54 6 29 59 21 -8 0 22 119.2% 30
YoY - - - - -61.1% - -98.7% -62.4% 12.0%
OPM 9.7% 1.5% 6.4% 12.9% 3.8% - 0.1% 4.3% 1.5%
RP 53 -11 25 62 18 -13 -1 21 115.4% 22
YoY - - - - -65.8% - - -65.3% 20.3%
RPM 9.6% - 5.6% 13.5% 3.3% - - 4.2% 1.1%
NI 32 -6 15 35 12 -9 1 11 118.8% 12
YoY - - - - -63.6% - -93.7% -67.9% 26.0%
NPM 5.7% - 3.4% 7.6% 2.1% - 0.2% 2.2% 0.6%
Figures may differ from company materials due to differences in rounding methods
Source: Company data, SR Inc.
FY12/13FY12/12 FY12/13

47 / 77
MONTHLY WRAP – April 2014
Copyright (C) Shared Research Inc. All Rights Reserved.
en–japan Inc. (4849)
Pioneer of online recruitment information websites, with a particular focus on mid-career and
experienced worker hiring. Now looking to expand into Asia and bilingual staff recruiting.
On March 4, 2014, SR updated comments on en-japan Inc.’s Q3 FY03/14 earnings results after
interviewing management.
Cumulative Q3 sales were JPY1.8bn higher (+18.0%) YoY. Contributing to this increase were: en world
Japan K.K. (EWJ), +JPY312mn (+13.6%); [en] Career Change Info, +JPY722mn; and overseas
subsidiaries, +JPY531mn. EWJ felt the positive effects of increased hiring activity by global companies,
[en] Career Change Info saw robust sales of job advertising space from increased hiring activity by client
companies, and overseas subsidiaries were included in the scope of consolidation beginning in FY03/14
(beginning in Q3, income from the Navigos Group in Vietnam was also consolidated).
View the full report.
Quarterly Performance
(million yen) Q1 Q2 Q3 Q4 Q1 Q2 Q3 Q4 % of FY Est. FY Est.
Sales 3,297 3,138 3,801 3,327 3,652 3,835 4,595 - 74.1% 16,300
YoY - - - - 10.7% 22.2% 20.9% 20.2%
GP 2,824 2,687 3,300 2,820 3,219 3,401 4,096 -
YoY - - - - 14.0% 26.5% 24.1%
GPM 85.7% 85.6% 86.8% 84.8% 88.2% 88.7% 89.1% -
SG&A 2,101 2,129 2,265 2,353 2,506 2,497 2,918 -
YoY - - - - 19.3% 17.3% 28.8%
SG&A / Sales 63.7% 67.8% 59.6% 70.7% 68.6% 65.1% 63.5% -
OP 724 558 1,034 467 713 903 1,177 - 87.3% 3,200
YoY - - - - -1.4% 61.8% 13.8% 15.0%
OPM 21.9% 17.8% 27.2% 14.0% 19.5% 23.6% 25.6% - 19.6%
RP 782 576 1,045 437 902 925 1,274 - 94.5% 3,280
YoY - - - - 15.3% 60.6% 21.9% 15.5%
RPM 23.7% 18.4% 27.5% 13.1% 24.7% 24.1% 27.7% - 20.1%
NI 468 338 653 86 1,771 546 772 - 114.8% 2,690
YoY - - - - 278.6% 61.4% 18.1% 74.0%
NPM 14.2% 10.8% 17.2% 2.6% 48.5% 14.2% 16.8% - 16.5%
Figures may differ from company materials due to differences in rounding methods.
Source: Company data, SR Inc. Research
FY03/14FY03/13 FY03/14

48 / 77
MONTHLY WRAP – April 2014
Copyright (C) Shared Research Inc. All Rights Reserved.
Fields Corp. (2767)
Pachinko and pachislot planning, development and sales specialist firm. Largest independent
distributor in Japan.
On March 18, 2014, Fields Corporation announced a revision to its FY03/14 earnings forecast.
Revised FY03/14 earnings forecast:
Sales: JPY114bn (previous forecast: JPY120bn)
Operating profit: JPY9.6bn (JPY12.5bn)
Recurring profit: JPY10.3bn (JPY12.5bn)
Net income: JPY5.2bn (JPY6.3bn)
The pachislot business held steady from efforts by the company to strengthen and enhance its product
lineup. However, the company modified the release date of a new machine to FY03/15, and this required
a revision to its FY03/14 earnings forecast. In interactive media, Fields moved to concentrate its efforts
on select social game titles in order to increase intellectual property value and maximize revenue. As a
result, the company stated that number of titles released in FY03/14 decreased.
On March 3, 2014, SR updated comments on the company’s Q3 FY03/14 results after interviewing
management.
In cumulative Q3, sales accounted for 45.2%, and operating profit stood at 16.3% of the company’s
full-year FY03/14 estimates. In Q4 FY03/14, the company is scheduled to release two pachinko machines
and four pachislot machines (see below), which will be close to the same number of releases conducted
in the first nine months of FY03/14 combined. SR believes that this will cause significant changes in the
company’s results.
View the full report.
Quarterly Performance
(JPYmn) Q1 Q2 Q3 Q4 Q1 Q2 Q3 Q4 % of FY FY Est.
Sales 21,145 7,973 18,627 60,396 5,748 30,637 17,819 47.5% 114,000
YoY 19.9% -49.3% 91.9% 22.9% -72.8% 284.3% -4.3% 5.4%
GP 5,566 3,258 6,239 18,216 2,027 11,621 5,709
YoY 9.7% -52.8% 43.7% 21.4% -63.6% 256.7% -8.5%
GPM 26.3% 40.9% 33.5% 30.2% 35.3% 37.9% 32.0%
SG&A 5,282 5,402 5,535 6,745 5,856 5,615 5,849
YoY -0.4% 5.9% -6.2% 3.8% 10.9% 3.9% 5.7%
SG&A / Sales 25.0% 67.8% 29.7% 11.2% 101.9% 18.3% 32.8%
OP 283 -2,142 703 11,470 -3,829 6,005 -140 21.2% 9,600
YoY - - - 34.9% - - - -6.9%
OPM 1.3% - 3.8% 19.0% - 19.6% - 8.4%
RP 574 -2,312 763 11,243 -3,759 5,903 -78 20.1% 10,300
YoY - - - 31.4% - - - 0.3%
RPM 2.7% - 4.1% 18.6% - 19.3% - 9.0%
NI 342 -1,322 303 5,397 -2,290 3,724 -207 23.6% 5,200
YoY - - - 11.1% - - - 10.2%
NPM 1.6% - 1.6% 8.9% - 12.2% - 4.6%
Source: Company data, SR Inc.; figures may differ from company materials due to differences in rounding methods
FY03/14FY03/13 FY03/14

49 / 77
MONTHLY WRAP – April 2014
Copyright (C) Shared Research Inc. All Rights Reserved.
FreeBit Co., Ltd. (3843)
FreeBit provides Internet-based infrastructure services that it terms Smart Infrastructure services.
On March 20, 2014, SR updated comments on FreeBit Co., Ltd.’s Q3 FY04/14 results after interviewing
management.
For FY04/14, the company adopted a strategy with emphasis on mobile services. In line with the launch
of freebit mobile, the company is accelerating its shift to mobile. The company is also focusing on
expanding freebit mobile to encompass B2C services under the freebit mobile brand.
View the full report.
Quarterly Performance
(Million Yen) Q1 Q2 Q3 Q4 Q1 Q2 Q3 Q4 % of FY FY Est.
Sales 5,274 5,153 5,030 5,203 5,252 5,143 4,987 - 76.9% 20,000
YoY 5.5% 0.9% -6.2% -6.0% -0.4% -0.2% -0.9% -
GP 1,781 1,884 1,840 2,001 1,950 1,982 2,012 -
YoY 6.4% 19.2% 7.5% 2.7% 9.5% 5.2% 9.3% -
GPM 33.8% 36.6% 36.6% 38.5% 37.1% 38.5% 40.3% -
SG&A 1,628 1,670 1,632 1,640 1,643 1,673 1,720 -
YoY 6.5% 13.1% 9.3% 3.3% 0.9% 0.2% 5.4% -
SG&A / Sales 30.9% 32.4% 32.4% 31.5% 31.3% 32.5% 34.5% -
Operating Profit 152 214 208 361 306 309 293 - 75.7% 1,200
YoY 4.7% 107.8% -5.0% -0.6% 100.7% 44.4% 40.9% -
OPM 2.9% 4.2% 4.1% 6.9% 5.8% 6.0% 5.9% -
Recurring Profit 113 133 45 189 276 260 300 - 83.6% 1,000
YoY -40.5% -15.3% -80.3% -47.9% 144.1% 95.5% 566.7% -
RPM 2.1% 2.6% 0.9% 3.6% 5.3% 5.1% 6.0% -
Net Income -33 -125 -40 12 -64 114 117 - 167.0% 100
YoY - - - -94.3% - - - -
NPM - - - 0.2% - 2.2% 2.3% -
Figures may differ from company materials due to differences in rounding methods.
Source: Company data, SR Inc.
FY04/14FY04/14FY04/13

50 / 77
MONTHLY WRAP – April 2014
Copyright (C) Shared Research Inc. All Rights Reserved.
GCA Savvian Corp. (2174)
An independent M&A advisory firm, pushing “repeat-client model” and other unique initiatives toward
winning more cross-border deals.
On March 25, 2014, GCA Savvian announced the forecasted effects of voluntary adoption of the
International Financial Reporting Standards (IFRS).
In addition to Japanese Generally Accepted Accounting Principles (JGAAP), the company is planning to
disclose its earnings under IFRS beginning in Q1 FY12/14. JGAAP allows for consolidation of investment
business limited partnerships (funds) operated by the company’s Mezzanine Corp. subsidiary, but these
are outside the scope of consolidation under IFRS. GCA Savvian India Investment Advisors Private
Limited and GCA Savvian China Co., Ltd. are two subsidiaries that are not considered significant and thus
excluded from consolidation under JGAAP, but these are within the scope of consolidation under IFRS.
The method used for calculating depreciation will be changed to the straight-line method, the useful lives
of assets will be adjusted, and a reserve for paid vacations will be recorded, but these amounts will not
have any material effect on the company’s financial standing.
Comparison between FY12/13 IFRS (unaudited) results and JGAAP results:
Sales: JPY9.6bn (JGAAP: JPY22.4bn)
Operating profit: JPY1.7bn (JPY4.2bn)
Net income: JPY1.1bn (JPY1.1bn)
Comparison between FY12/13 IFRS (unaudited) results and voluntarily disclosed fund-unconsolidated
(JGAAP) results:
Sales: JPY9.6bn (JGAAP: JPY9.6bn)
Operating profit: JPY1.7bn (JPY1.7bn)
Net income: JPY1.1bn (JPY1.1bn)
View the full report.
51 / 77
MONTHLY WRAP – April 2014
Copyright (C) Shared Research Inc. All Rights Reserved.
Infomart Corp. (2492)
B2B e-commerce platform operator looking to become industry standard for the food sector. Branching
out overseas and into other industry sectors with its online B2B platforms.
On March 3, 2014, SR Inc. updated comments on Infomart’s full-year FY12/13 earnings results after
interviewing management.
Sales were largely in line with the company’s forecast (JPY4.4bn). However, operating profit exceeded
the company’s forecast (JPY997mn) by 9.8%. This was mainly attributable to the later release of the
next-generation B2B Platform (September instead of May), which meant amortization was put back, and
lower expenses due to such factors as the sales promotion budget not being fully used.
View the full report.
Quarterly Performance
(million yen) Q1 Q2 Q3 Q4 Q1 Q2 Q3 Q4 % of FY FY Est.
Sales 876 918 966 1,024 1,006 1,060 1,110 1,163 98.9% 4,388
YoY 12.3% 13.4% 14.2% 15.3% 14.9% 15.5% 14.9% 13.6% 15.9%
GP 558 593 631 696 679 718 742 710 101.2% 2,816
YoY 8.9% 11.5% 8.2% 12.7% 21.6% 21.0% 17.7% 2.1% 13.6%
GPM 63.8% 64.6% 65.3% 67.9% 67.5% 67.7% 66.9% 61.1% 64.2%
SG&A 401 419 429 414 432 434 442 447 96.5% 1,818
YoY 5.2% 7.6% 2.4% 2.1% 7.6% 3.5% 3.1% 7.9% 9.3%
SG&A / Sales 45.8% 45.6% 44.4% 40.4% 42.9% 40.9% 39.8% 38.4% 41.4%
OP 157 174 202 282 247 284 300 263 109.8% 997
YoY 19.9% 22.4% 22.9% 33.0% 57.3% 62.9% 48.5% -6.5% 22.3%
OPM 17.9% 19.0% 20.9% 27.5% 24.6% 26.8% 27.1% 22.6% 22.7%
RP 159 169 198 289 253 286 297 270 112.0% 988
YoY 20.6% 21.2% 21.7% 36.9% 58.8% 69.1% 50.0% -6.4% 21.2%
RPM 18.2% 18.4% 20.5% 28.2% 25.2% 27.0% 26.8% 23.2% 22.5%
NI 92 88 47 270 155 167 177 133 106.2% 594
YoY 26.0% 12.3% -49.8% 132.0% 69.0% 88.5% 278.2% -50.8% 19.6%
NPM 10.5% 9.6% 4.8% 26.3% 15.4% 15.7% 15.9% 11.4% 13.5%
Source: Company data, SR Inc. Research. Figures may differ from company materials due to differences in rounding methods.
FY12/12 FY12/13FY12/13
52 / 77
MONTHLY WRAP – April 2014
Copyright (C) Shared Research Inc. All Rights Reserved.
Intelligent Wave Inc. (4847)
Software company strong in credit card processing software. Information security a next growth
driver? Significant relationship with DNP
On March 7, 2014, SR updated comments on Intelligent Wave’s Q2 FY06/14 after interviewing
management.
In the credit card industry (the company’s main business area) there was an increase in capex projects,
both for the likes of system renewals and hardware replacements, and also for new offerings, such as
prepaid cards and mobile payment terminals. The company seized upon this opportunity to conduct sales
activities, resulting in an increase in sales.
View the full report.
Quarterly Performance
(JPYmn) Q1 Q2 Q3 Q4 Q1 Q2 Q3 Q4 % of FY FY Est.
Sales 911 1,766 1,812 1,382 1,279 1,776 - - - -
YoY -16.8% 23.1% 35.5% 0.4% 40.4% 0.6% - -
GP -314 62 353 372 28 465 - -
YoY - -84.4% -3.1% 10.7% - 647.4% - -
GPM -34.4% 3.5% 19.5% 26.9% 2.2% 26.2% - -
SG&A 300 283 268 301 298 297 - -
YoY -10.2% -9.1% -9.0% -0.9% -0.5% 4.9% - -
SG&A / Sales 32.9% 16.0% 14.8% 21.8% 23.3% 16.7% - -
OP -613 -221 85 72 -270 167 - - - -
YoY - - 21.7% 119.2% - - - -
OPM -67.3% -12.5% 4.7% 5.2% -21.1% 9.4% - -
RP -617 -215 89 155 -268 180 - - - -
YoY - - 28.9% 197.5% - - - -
RPM -67.7% -12.2% 4.9% 11.2% -21.0% 10.1% - -
NI -385 -450 94 392 -246 174 - - - -
YoY - - 75.9% 827.0% - - - -
NPM -42.3% -25.5% 5.2% 28.4% -19.2% 9.8% - -
Cumulative Q1 Q2 Q3 Q4 Q1 Q2 Q3 Q4 % of FY FY Est.
Sales 911 2,677 4,488 5,871 1,279 3,055 - - 50.9% 6,000
YoY -16.8% 5.8% 16.1% 12.0% 40.4% 14.1% - - 2.2%
GP -314 -252 101 473 28 492 - -
GPM - - 5.6% 34.3% 2.2% 27.7% - -
SG&A 300 583 851 1,151 298 595 - -
YoY -10.2% -9.6% -9.4% -7.4% -0.5% 2.1% - -
OP -613 -834 -750 -678 -270 -103 - - -25.8% 400
YoY 956.7% -2952.3% -856.7% -614.5% -55.9% -87.7% - - -159.0%
OPM - - - - - - - - 6.7%
RP -617 -831 -742 -587 -268 -88 - - -22.0% 400
YoY 996.5% -2579.4% -825.4% -479.7% -56.5% -89.4% - - -168.1%
NI -385 -835 -741 -349 -246 -72 - - -28.8% 250
YoY 895.2% -577.1% -424.9% -229.1% -36.2% -91.4% - - -171.6%
Source: Company data, SR Research. Figures may differ from company materials due to differences in rounding methods.
Company forecasts are based on the most recent figures.
FY06/14FY06/13 FY06/14
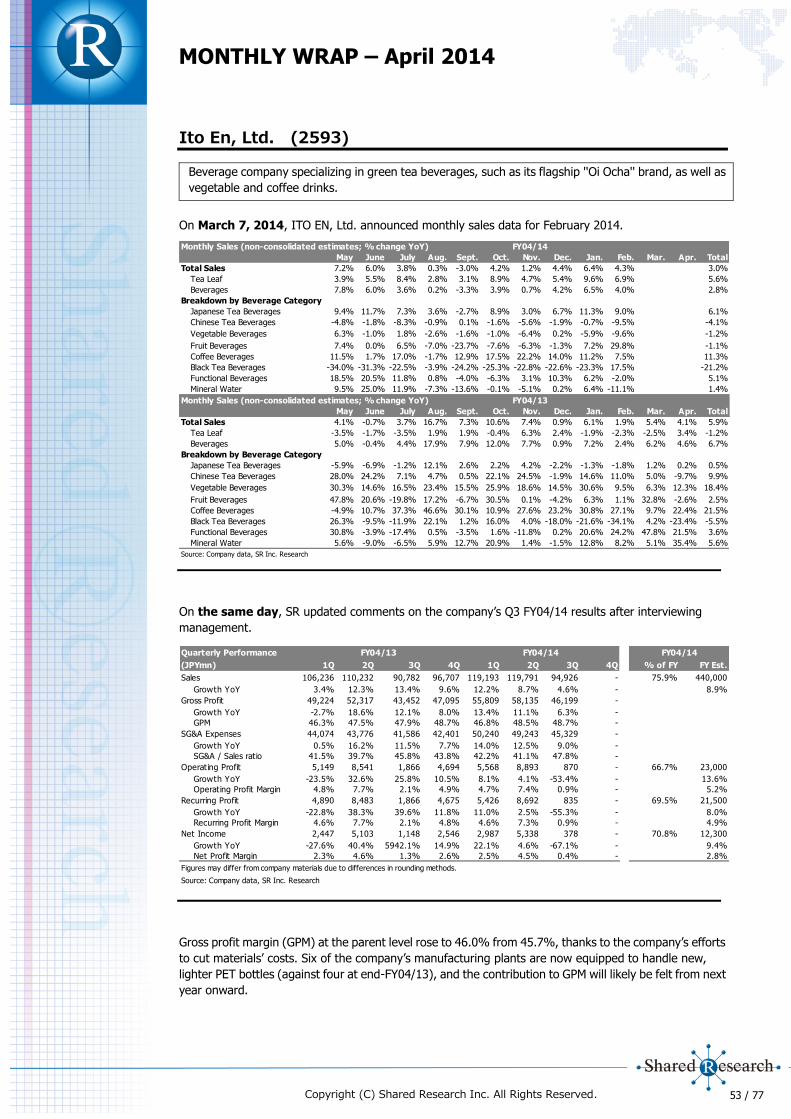
53 / 77
MONTHLY WRAP – April 2014
Copyright (C) Shared Research Inc. All Rights Reserved.
Ito En, Ltd. (2593)
Beverage company specializing in green tea beverages, such as its flagship ''Oi Ocha'' brand, as well as
vegetable and coffee drinks.
On March 7, 2014, ITO EN, Ltd. announced monthly sales data for February 2014.
On the same day, SR updated comments on the company’s Q3 FY04/14 results after interviewing
management.
Gross profit margin (GPM) at the parent level rose to 46.0% from 45.7%, thanks to the company’s efforts
to cut materials’ costs. Six of the company’s manufacturing plants are now equipped to handle new,
lighter PET bottles (against four at end-FY04/13), and the contribution to GPM will likely be felt from next
year onward.
Monthly Sales (non-consolidated estimates; % change YoY) FY04/14
May June July Aug. Sept. Oct. Nov. Dec. Jan. Feb. Mar. Apr. Total
Total Sales 7.2% 6.0% 3.8% 0.3% -3.0% 4.2% 1.2% 4.4% 6.4% 4.3% 3.0%
Tea Leaf 3.9% 5.5% 8.4% 2.8% 3.1% 8.9% 4.7% 5.4% 9.6% 6.9% 5.6%
Beverages 7.8% 6.0% 3.6% 0.2% -3.3% 3.9% 0.7% 4.2% 6.5% 4.0% 2.8%
Breakdown by Beverage Category
Japanese Tea Beverages 9.4% 11.7% 7.3% 3.6% -2.7% 8.9% 3.0% 6.7% 11.3% 9.0% 6.1%
Chinese Tea Beverages -4.8% -1.8% -8.3% -0.9% 0.1% -1.6% -5.6% -1.9% -0.7% -9.5% -4.1%
Vegetable Beverages 6.3% -1.0% 1.8% -2.6% -1.6% -1.0% -6.4% 0.2% -5.9% -9.6% -1.2%
Fruit Beverages 7.4% 0.0% 6.5% -7.0% -23.7% -7.6% -6.3% -1.3% 7.2% 29.8% -1.1%
Coffee Beverages 11.5% 1.7% 17.0% -1.7% 12.9% 17.5% 22.2% 14.0% 11.2% 7.5% 11.3%
Black Tea Beverages -34.0% -31.3% -22.5% -3.9% -24.2% -25.3% -22.8% -22.6% -23.3% 17.5% -21.2%
Functional Beverages 18.5% 20.5% 11.8% 0.8% -4.0% -6.3% 3.1% 10.3% 6.2% -2.0% 5.1%
Mineral Water 9.5% 25.0% 11.9% -7.3% -13.6% -0.1% -5.1% 0.2% 6.4% -11.1% 1.4%
Monthly Sales (non-consolidated estimates; % change YoY) FY04/13
May June July Aug. Sept. Oct. Nov. Dec. Jan. Feb. Mar. Apr. Total
Total Sales 4.1% -0.7% 3.7% 16.7% 7.3% 10.6% 7.4% 0.9% 6.1% 1.9% 5.4% 4.1% 5.9%
Tea Leaf -3.5% -1.7% -3.5% 1.9% 1.9% -0.4% 6.3% 2.4% -1.9% -2.3% -2.5% 3.4% -1.2%
Beverages 5.0% -0.4% 4.4% 17.9% 7.9% 12.0% 7.7% 0.9% 7.2% 2.4% 6.2% 4.6% 6.7%
Breakdown by Beverage Category
Japanese Tea Beverages -5.9% -6.9% -1.2% 12.1% 2.6% 2.2% 4.2% -2.2% -1.3% -1.8% 1.2% 0.2% 0.5%
Chinese Tea Beverages 28.0% 24.2% 7.1% 4.7% 0.5% 22.1% 24.5% -1.9% 14.6% 11.0% 5.0% -9.7% 9.9%
Vegetable Beverages 30.3% 14.6% 16.5% 23.4% 15.5% 25.9% 18.6% 14.5% 30.6% 9.5% 6.3% 12.3% 18.4%
Fruit Beverages 47.8% 20.6% -19.8% 17.2% -6.7% 30.5% 0.1% -4.2% 6.3% 1.1% 32.8% -2.6% 2.5%
Coffee Beverages -4.9% 10.7% 37.3% 46.6% 30.1% 10.9% 27.6% 23.2% 30.8% 27.1% 9.7% 22.4% 21.5%
Black Tea Beverages 26.3% -9.5% -11.9% 22.1% 1.2% 16.0% 4.0% -18.0% -21.6% -34.1% 4.2% -23.4% -5.5%
Functional Beverages 30.8% -3.9% -17.4% 0.5% -3.5% 1.6% -11.8% 0.2% 20.6% 24.2% 47.8% 21.5% 3.6%
Mineral Water 5.6% -9.0% -6.5% 5.9% 12.7% 20.9% 1.4% -1.5% 12.8% 8.2% 5.1% 35.4% 5.6%
Source: Company data, SR Inc. Research
Quarterly Performance
(JPYmn) 1Q 2Q 3Q 4Q 1Q 2Q 3Q 4Q % of FY FY Est.
Sales 106,236 110,232 90,782 96,707 119,193 119,791 94,926 - 75.9% 440,000
Growth YoY 3.4% 12.3% 13.4% 9.6% 12.2% 8.7% 4.6% - 8.9%
Gross Profit 49,224 52,317 43,452 47,095 55,809 58,135 46,199 -
Growth YoY -2.7% 18.6% 12.1% 8.0% 13.4% 11.1% 6.3% -
GPM 46.3% 47.5% 47.9% 48.7% 46.8% 48.5% 48.7% -
SG&A Expenses 44,074 43,776 41,586 42,401 50,240 49,243 45,329 -
Growth YoY 0.5% 16.2% 11.5% 7.7% 14.0% 12.5% 9.0% -
SG&A / Sales ratio 41.5% 39.7% 45.8% 43.8% 42.2% 41.1% 47.8% -
Operating Profit 5,149 8,541 1,866 4,694 5,568 8,893 870 - 66.7% 23,000
Growth YoY -23.5% 32.6% 25.8% 10.5% 8.1% 4.1% -53.4% - 13.6%
Operating Profit Margin 4.8% 7.7% 2.1% 4.9% 4.7% 7.4% 0.9% - 5.2%
Recurring Profit 4,890 8,483 1,866 4,675 5,426 8,692 835 - 69.5% 21,500
Growth YoY -22.8% 38.3% 39.6% 11.8% 11.0% 2.5% -55.3% - 8.0%
Recurring Profit Margin 4.6% 7.7% 2.1% 4.8% 4.6% 7.3% 0.9% - 4.9%
Net Income 2,447 5,103 1,148 2,546 2,987 5,338 378 - 70.8% 12,300
Growth YoY -27.6% 40.4% 5942.1% 14.9% 22.1% 4.6% -67.1% - 9.4%
Net Profit Margin 2.3% 4.6% 1.3% 2.6% 2.5% 4.5% 0.4% - 2.8%
Figures may differ from company materials due to differences in rounding methods.
Source: Company data, SR Inc. Research
FY04/14 FY04/14FY04/13

54 / 77
MONTHLY WRAP – April 2014
Copyright (C) Shared Research Inc. All Rights Reserved.
Parent-level operating profit was JPY10.8bn (-14.5% YoY) due to heavy competition, which resulted in
higher SG&A expenses. However, contributions from Tully’s Coffee Japan and other subsidiaries acted as
a counterbalance, and net income was down only slightly, at -1.4% YoY. Results thus far appear to
indicate that fulfilling its full-year targets will be no easy task, but the company maintains that it is still
aiming to achieve its net income forecast and a dividend payout ratio of 40%.
View the full report.
JIN Co., Ltd. (3046)
Mall-based eyewear retailer, aggressive growth strategy using private-label retailing model.
On March 5, 2014, JIN released monthly sales data for February 2014.
View the full report.
Comparable Stores Sales Growth (YoY)
Sep Oct Nov Dec Jan Feb Mar Apr May Jun Jul Aug
2008 2.4% -1.0% -5.8% 4.0% -6.6% -8.8% 0.1% -8.8% -10.7% -7.8% -5.6% -7.5%
2009 -20.6% -11.1% -1.5% -13.2% 3.8% -8.3% -7.8% -5.1% 6.0% 2.9% 9.9% 15.9%
2010 33.5% 51.1% 36.1% 40.7% 41.1% 42.5% 35.3% 50.4% 36.1% 29.6% 20.2% 21.2%
2011 9.4% 30.3% 8.4% 15.1% 3.1% 5.7% 1.2% 12.7% 3.3% 5.9% 12.9% 14.7%
2012 31.1% 7.9% 5.9% 3.0% 9.3% 28.1% 33.1% 14.9% 23.2% 70.4% 56.2% 41.7%
2013 54.8% 17.8% 68.3% 69.8% 50.3% 51.9% 41.3% 23.8% 33.7% 6.1% -3.5% 13.3%
2014 -18.6% -8.1% -24.5% -26.3% -22.2% -25.1%
Source: Company data, SR Inc. Research

55 / 77
MONTHLY WRAP – April 2014
Copyright (C) Shared Research Inc. All Rights Reserved.
Kenedix, Inc. (4321)
Japan’s largest, independent real estate fund manager. After rightsizing its balance sheet, now aiming
to grow assets under management.
On March 27, 2014, Kenedix Inc. announced the transfer of a subsidiary.
Previously, the company chose to make a silent partnership investment of JPY1.1bn in KRF43, a
special-purpose company (SPC). Kenedix Office Investment Corporation (KDO), which is managed by
Kenedix subsidiary Kenedix Real Estate Fund Management, Inc., resolved to make an additional silent
partnership investment of JPY1.1bn on March 27, 2014. Due to these two investments, Kenedix and KDO
will have a combined equity interest of 55% in KRF43, which will make the SPC a consolidated subsidiary
of the company.
On March 18, 2014, the company announced that Kenedix Private Investment Corporation (KPI) will
start operations and that Kenedix will purchase KPI investment units. Please click here to go to the text of
the release.
Operations will start on March 28 at KPI, which is the first private real estate investment trust (REIT)
established by Kenedix. Furthermore, to provide support to KPI, Kenedix will purchase KPI investment
units by making an investment of about JPY5.5bn (acquiring an interest of approximately 35%).
On the same day, the company announced a sale of fixed assets. Please click here to go to the text of
the release.
The company has decided to sell the TKS Musashikosugi Building, which is owned by consolidated
subsidiary Godo Kaisha KRF41, to Kenedix Office Investment Corporation (KDO).
As a result of a change in the sub-leasing agreement in line with this transaction, total expenses of
approximately JPY400mn are expected to be recorded. Kenedix also expects to record an extraordinary
profit of around JPY 2.7bn from the sale in FY12/014.
On the same day, the company announced a sale of fixed assets and the emergence of revenue from
asset management-related business. Please click here to go to the text of the release. Kenedix expects to record an extraordinary loss due to a decision on March 18, 2014 to sell fixed assets.
In addition, in association with a decision to sell real estate owned by a fund that receives asset
management services from Kenedix, revenue from asset management-related business is also expected.
Kenedix expects to record an extraordinary loss of approximately JPY300mn in line with the sale in
FY12/14.
Kenedix expects to record revenue from asset management-related business in association with the sale
of an office building owned by a special-purpose company (SPC) that receives asset management
services from Kenedix. In FY12/14, the company expects to record operating revenue of around
JPY400mn on a consolidated basis.
On March 12, 2014, the company announced a change to a subsidiary along with the acquisition of
fixed assets.
The company announced that it will make a new silent partnership investment in Godo Kaisha KRF50 (an
SPC), thereby making KRF50 a consolidated subsidiary. Furthermore, via KRF50 the company will acquire
a 65% quasi joint ownership stake in trust beneficiary rights backed by KDX Toyosu Grandsquare.
Kenedix Private Investment Corp. (KPI) will acquire the remaining 35% quasi joint ownership stake in the
trust beneficiary rights.
View the full report.

56 / 77
MONTHLY WRAP – April 2014
Copyright (C) Shared Research Inc. All Rights Reserved.
Mac-House Co., Ltd. (7603)
Low-cost specialty retailer of everyday casual wear with nationwide appeal.
Mac House Co., Ltd. announced monthly sales data for February on March 3, 2014 and for March on
April 1, 2014.
View the full report.
Comparable Store Sales Mar Apr May Jun Jul Aug Sep Oct Nov Dec Jan Feb
FY02/09 3.3% -13.7% -7.0% -11.9% -6.1% -6.7% -1.0% -8.8% 1.5% -12.0% -9.2% -14.9%
FY02/10 -18.2% -11.0% -9.6% -18.6% -11.4% -13.2% -17.6% -16.8% -26.2% -11.8% -11.7% -10.9%
FY02/11 -17.5% -15.3% -11.9% -8.3% -10.1% -12.1% -17.3% -0.9% -8.0% -13.7% -6.3% 1.5%
FY02/12 -18.1% 7.4% -6.7% 1.9% -1.4% -1.6% 7.5% -0.9% 1.2% 7.5% -2.1% -0.9%
FY02/13 23.2% 3.8% -1.3% -2.2% -4.0% 1.8% -7.3% -9.3% 8.4% -3.2% -5.8% -5.3%
FY02/14 5.8% -11.4% -2.8% 2.9% -8.9% -4.1% -6.2% -14.3% -9.0% -8.5% 1.8% 10.5%
FY02/15 -4.5%
Source: Company data processed by SR Inc.
Figures may differ from company materials due to differences in rounding methods.
All Store Sales Mar Apr May Jun Jul Aug Sep Oct Nov Dec Jan Feb
FY02/09 10.9% -8.4% -2.0% -5.4% -0.1% -0.1% 5.5% -3.4% 7.9% -6.4% -2.6% -8.4%
FY02/10 -15.4% -7.6% -5.0% -16.4% -9.7% -11.6% -16.2% -15.2% -25.9% -12.6% -11.9% -11.9%
FY02/11 -18.8% -17.3% -14.6% -10.7% -12.2% -14.2% -19.2% -5.1% -12.0% -17.5% -10.9% -3.1%
FY02/12 -21.4% 1.4% -11.3% -2.5% -5.9% -5.7% 3.1% -4.8% -3.1% 3.6% -6.1% -5.5%
FY02/13 17.0% -1.4% -6.2% -7.0% -8.8% -3.2% -11.7% -12.6% 4.9% -5.3% -7.9% -6.9%
FY02/14 4.9% -11.8% -2.5% 2.9% -8.8% -3.9% -6.0% -14.2% -9.1% -8.2% 0.9% 9.2%
FY02/15 -3.3%
Source: Company data processed by SR Inc.
Figures may differ from company materials due to differences in rounding methods.

57 / 77
MONTHLY WRAP – April 2014
Copyright (C) Shared Research Inc. All Rights Reserved.
Medinet Co., Ltd. (2370)
Biotech company that enables medical institutions to provide immuno-cell therapy
On March 11, 2014, MEDINET Co., Ltd. announced a strategic partnership with TC BioPharm Ltd. (UK),
for the development and sale of an immuno-cell medicinal product in Europe.
The company agreed a strategic partnership with TC BioPharm on February 21, 2014. The aim of the
partnership is to develop and sell a new immuno-cell medicinal product for cancer patients in the UK and
Europe.
The company has agreed to provide financing to TC BioPharm along with licenses for the use of
MEDINET’s innovative technology in this area. TC BioPharm will be able to take advantage of this
technology and the company’s joint research with the University of Tokyo as it begins clinical trials for the
use of immuno-cell therapy to treat cancer. It is hoped that the company will thus obtain approval to
develop and commercialize this type of therapy in the UK and Europe.
MEDINET contributed funds together with Scottish investors to establish TC BioPharm, for the purpose of
developing a type of immuno-cell therapy that uses autologous cells. It has already received subsidies
from the Scottish government, the Scottish Enterprise High Growth Start-Up Unit, and Glasgow City
Council, for the development and commercialization of immuno-cell therapy that it is now embarking on.
(The funding from the Scottish government comes in the form of Regional Selective Assistance Grant
Funding.)
The company believes that this strategic partnership with TC BioPharm will accelerate the process of
obtaining UK and European approval to manufacture and sell immuno-cell medicinal products that use its
technology.
On March 10, 2014, the company announced that it will begin joint clinical studies of the combination
therapy of adoptive immunotherapy with chemoradiotherapy for pancreatic cancer, together with Gunma
University and Seta Clinic Group.
The company’s partners in these investigator led clinical trials will be Gunma University—a national
university—and KOSHIKAI, a Non-Profit Medical Corporation of the Seta Clinic Group. Together they will
trial the use of adoptive immunotherapy as a means of preventing the recurrence or metastasis of
pancreatic cancer after chemoradiotherapy.
On March 5, 2014, the company announced a recording of extraordinary profit from a gain on sales of
investment securities.
The company sold a portion of its investment security holdings, and will record an extraordinary profit in
Q2 FY09/14 of JPY440mn as a gain on sales of investment securities.
View the full report.

58 / 77
MONTHLY WRAP – April 2014
Copyright (C) Shared Research Inc. All Rights Reserved.
mobcast inc. (3664)
Sports game developer and provider for mobile social platforms.
On March 12, 2014, mobcast inc. announced the issue of Series 20, 21, and 22 share warrants via
third-party allotment. The company has also entered into a commitment agreement.
The details of this funding arrangement are as follows:
Allocation date: April 2, 2014
In the event that all warrants are exercised, the total amount of funding raised will be JPY2.9bn, and
up to 1,500,000 new shares will be delivered. Control of the company will be diluted by 10.8%.
The company will use this funding to create new features for mobcast, its mobile platform; to release
blockbuster titles overseas; and to develop major new releases. The company aims thereby to
increase revenues and strengthen its financial base, as well as take a larger share of the increasingly
competitive mobile social games market.
View the full report.

59 / 77
MONTHLY WRAP – April 2014
Copyright (C) Shared Research Inc. All Rights Reserved.
NAIGAI TRANS LINE LTD. (9384)
Non-vessel operating common carrier (NVOCC) providing international ocean freight transport
services.
On March 6, 2014, SR updated comments on Naigai Trans Line Ltd. (NTL) full-year FY12/13 earnings
results after interviewing management.
Domestic sales in mainstay less-than-container-load (LCL) exports at the parent company were JPY4.6bn
(-2.4% YoY), but there were definite signs of recovery in Q4 (October-December) compared to the slump
that this business saw in 1H. Sales were up 10.9% in October, up 10.1% in November and up 6.7% in
December, with overall Q4 sales turning up.
However, full-container-load (FCL) export sales at the parent company—which the company has been
focusing its management policies on— were JPY1.7bn (+11.6% YoY) in FY12/13. In Q4, FCL sales
increased sharply YoY, up 65.6% in October, 69.5% in November and 73.2% in December. Import sales
at the parent level were up 14.3%. Overall, full-year domestic sales were up to JPY11.8bn (+20.7%),
due to the factors listed above and an increase in sales across the group—such as new business by Flying
Fish Co., Ltd. (from July 2013), and the contribution to full-year earnings of UCI Airfreight Japan, Inc.,
which the company acquired the previous year.
However, domestic operating profit dropped slightly to JPY630mn (-1.2% YoY), due to the amortization
of goodwill and business start-up costs related to the acquisition of Flying Fish. The company said that
sales of Flying Fish have been growing smoothly and the subsidiary turned into the black before the
amortization of goodwill. Thanks to Flying Fish’s contribution, the ratio of import services rose to 27%
from 22% in the previous year.
View the full report.
Quarterly Performance
(million yen) Q1 Q2 Q3 Q4 Q1 Q2 Q3 Q4 % of FY FY Est.
Sales 2,982 3,503 3,377 3,544 3,465 4,034 4,494 4,803 101.8% 16,500
YoY 2.5% 6.3% 6.7% 11.8% 16.2% 15.1% 33.1% 35.5%
GP 952 1,090 1,006 1,066 1,014 1,215 1,270 1,344
YoY 2.0% 4.8% 1.1% 5.3% 6.4% 11.5% 26.2% 26.0%
GPM 31.9% 31.1% 29.8% 30.1% 29.3% 30.1% 28.3% 28.0%
SG&A 733 826 815 833 837 921 960 961
YoY 4.8% 12.6% 10.5% 13.6% 14.2% 11.5% 17.9% 15.4%
SG&A / Sales 24.6% 23.6% 24.1% 23.5% 24.1% 22.8% 21.4% 20.0%
OP 220 263 192 233 176 293 311 361 103.9% 1,100
YoY -6.8% -13.7% -25.5% -16.7% -19.5% 11.5% 62.4% 162.4%
OPM 7.4% 7.5% 5.7% 6.6% 5.1% 7.3% 6.9% 7.5%
RP 248 273 198 256 201 308 330 364 104.7% 1,150
YoY 3.5% 5.0% -23.3% -11.0% -18.7% 13.0% 66.6% 42.3%
RPM 8.3% 7.8% 5.9% 7.2% 5.8% 7.6% 7.3% 7.6%
NI 148 166 109 36 117 191 202 220 100.0% 730
YoY 15.7% 3.1% -23.8% -73.4% -20.8% 14.8% 86.1% 503.3%
NPM 5.0% 4.7% 3.2% 1.0% 3.4% 4.7% 4.5% 4.6%
Figures may differ from company materials due to differences in rounding methods.
Source: Company data, SR Inc. Research
FY12/13FY12/12 FY12/13

60 / 77
MONTHLY WRAP – April 2014
Copyright (C) Shared Research Inc. All Rights Reserved.
NanoCarrier Co. (4571)
Biotech pharmaceutical company. Developer of new therapeutic drugs using micellar nanoparticle
technology for drug targeting and delivery.
On March 18, 2014, NanoCarrier Co., Ltd. announced that it was granted a substance patent in the US
for Antibody/Drug-conjugated Micelles (ADCM).
Antibody/Drug-conjugated Micelles (ADCM) are a combination of sensors that can target cancer cells and
diseased parts of the body and securely deliver large quantities of drugs to these locations. The company
has already secured substance patents for this technology in Japan, Europe, Canada, Australia, and
China. According to the company, the acquisition of a US patent means that it now holds intellectual
property rights to the technology in the US, and ADCM is therefore the company’s global intellectual
property.
On the same day, SR updated comments on the company’s Q3 FY03/14 results after interviewing
management.
In cumulative Q3, sales were JPY444mn (+121.1% YoY), attributable to milestone and clinical trial
medication payment from license and co-development agreements with Orient Eurpharma Co., Ltd. (OEP)
and Kowa Co., Ltd. (Kowa), as well as cosmetic material supply and lump-sum payment from a
collaborative development agreement with Albion Co., Ltd. Mainly due to a rise in R&D costs, operating loss
was JPY785mn (JPY361mn loss a year earlier), recurring loss was JPY633mn (JPY355mn loss a year
earlier), and net loss was JPY633mn (JPY356mn loss a year earlier).
On March10, 2014, the company announced progress of development of its product pipelines.
The company used to disclose qualitative information on the state of progress of developing its product
pipelines using micelle nanoparticle technology when it announced its quarterly earnings results. However,
as the number of pipelines should expand in the future, NanoCarrier decided to disclose progress of
development of pipelines in a more understandable manner.
View the full report.
Quarterly Performance
(million yen) Q1 Q2 Q3 Q4 Q1 Q2 Q3 Q4 % of FY FY Est.
Sales 10 90 102 173 150 176 119 - 95.4% 466
YoY 120.1% -56.5% 6064.4% 28.3% 1430.2% 96.4% 16.7% - 24.7%
GP -30 40 62 28 98 125 53 -
YoY - -79.1% - -65.6% - 209.9% -14.9% -
GPM - 45.2% 61.4% 16.1% 65.2% 71.4% 44.8% -
SG&A 149 128 157 194 375 349 336 -
YoY 0.9% -13.5% 21.7% 49.0% 151.8% 172.2% 114.6% -
SG&A / Sales 1520.7% 143.3% 154.1% 112.1% 250.2% 198.7% 283.5% -
OP -179 -88 -94 -166 -277 -224 -283 - - -1,174
YoY - - - - - - - - -
OPM - - - - - - - - -
RP -179 -87 -88 -77 -190 -246 -197 - - -1,176
YoY - - - - - - - - -
RPM - - - - - - - - -
NI -180 -88 -88 -128 -191 -246 -197 - - -1,198
YoY - - - - - - - - -
NPM - - - - - - - - -
Figures may differ from company materials due to differences in rounding methods
Source: Company data
FY03/14FY03/13 FY03/14

61 / 77
MONTHLY WRAP – April 2014
Copyright (C) Shared Research Inc. All Rights Reserved.
Nippon Parking Development (2353)
Operator of legally mandated parking lots in office buildings. High ROE based on its unique business
model.
On March 12, 2014, SR updated comments on Nippon Parking Development Co Ltd’s (NPD) Q2 FY07/14
earnings results after interviewing management.
Operating income was higher as a result of an increase in both the number and size of parking lots in the
domestic parking lot business. Improvements in profitability of the overseas parking lot business as well as
a jump in visitors in the ski resort business were also contributing factors. Recurring profit was bolstered by
sales of investment securities and receipt of dividends.
View the full report.
Quarterly Performance
(million yen) Q1 Q2 Q3 Q4 Q1 Q2 Q3 Q4 % of FY FY Est.
Sales 2,296 3,929 4,217 2,995 3,064 4,401 - - 49.8% 15,000
Growth YoY 8.2% 35.3% 29.5% 29.7% 33.4% 12.0% - - 11.6%
Gross Profit 807 1,820 2,026 1,105 1,238 2,188 - -
Growth YoY 4.8% 36.8% 28.7% 28.7% 53.3% 20.2% - -
Gross Profit Margin 35.2% 46.3% 48.0% 36.9% 40.4% 49.7% - -
SG&A 610 1,099 1,093 935 926 1,295 - -
Growth YoY 9.4% 42.1% 46.5% 47.3% 51.8% 17.9% - -
SG&A / Sales 26.6% 28.0% 25.9% 31.2% 30.2% 29.4% - -
Operating Profit 197 722 932 170 312 892 - - 50.2% 2,400
Growth YoY -7.1% 29.4% 12.6% -24.0% 58.1% 23.6% - - 18.7%
Operating Profit Margin 8.6% 18.4% 22.1% 5.7% 10.2% 20.3% - - 16.0%
Recurring Profit 214 819 982 220 354 989 - - 54.8% 2,450
Growth YoY 6.0% 44.1% 7.7% -1.6% 65.2% 20.8% - - 9.6%
Recurring Profit Margin 9.3% 20.8% 23.3% 7.4% 11.6% 22.5% - - 16.3%
Net Income 115 539 646 79 199 670 - - 58.0% 1,500
Growth YoY 21.6% 69.1% - -32.6% 73.5% 24.5% - - 8.8%
Net Income Margin 5.0% 13.7% 15.3% 2.6% 6.5% 15.2% - - 10.0%
Figures may differ from company materials due to differences in rounding methods.
Company forecasts are most recently announced figures
Source: Company data, SR Inc. Research
FY07/14FY07/13 FY07/14

62 / 77
MONTHLY WRAP – April 2014
Copyright (C) Shared Research Inc. All Rights Reserved.
NS TOOL Co., Ltd. (6157)
Leading Japanese maker of carbide miniature end mills with sound financials, aiming for growth by
keeping with the miniaturization trend of end products.
On March 11, 2014, NS Tool announced a revision to its dividend forecast for FY03/14 (to
commemorate the company’s 60th year).
The company plans to increase its year-end dividend from its previous forecast of JPY40 to JPY60. The
increase of JPY20 is a special anniversary dividend to mark the fact that on December 1 2014 it will have
been 60 years since the company was founded.
View the full report.
Paris Miki Holdings Inc. (7455)
Eyeglass retailer focusing on depth of product offering and selling across the price spectrum. Largest
store network in Japan. Strong financial position.
Paris Miki Holdings announced sales figures for February 2014 On March 3 and for March on April 1,
2014.
View the full report.
-20%
-15%
-10%
-5%
0%
5%
10%
15%
20%
25%
Apr May Jun Jul Aug Sep Oct Nov Dec Jan Feb Mar
Comparable Store Sales
FY03/13 FY03/14
Source: Company data, SR Inc. Research

63 / 77
MONTHLY WRAP – April 2014
Copyright (C) Shared Research Inc. All Rights Reserved.
Pigeon Corp. (7956)
Manufacturer of baby bottles, nipples, and other baby goods, seeking a greater global presence.
On March 20, 2014, SR updated comments on Pigeon Corp.’s FY01/14 earnings based on an interview
with the company.
On March 7 2014, SR updated comments on the company’s FY01/14 earnings based on the company’s
results briefing.
On March 3, 2014, the company also announced its fifth mid-term management plan and an upward
revision to its dividend for FY01/14.
The company raised its year-end dividend from the forecasted JPY37 to JPY55 per share. With this
upward revision, the annual dividend is JPY88 per share (forecasted: JPY70). (Note, on August 1, 2013,
the company carried out a 2-for-1 stock split. The interim dividend is calculated based on post-split
levels.)
The company has also established its fifth mid-term management plan, which will begin in FY01/15 (and
run until FY01/17). The plan calls for the following results in FY01/17:
Sales: JPY100.0bn (versus sales of JPY77.4bn in FY01/14);
Gross profit: JPY44.2bn (versus JPY34.4bn);
Operating profit: JPY15.0bn (versus JPY10.3bn);
Recurring profit: JPY15.0bn (versus JPY11.0bn);
Net income: JPY9.0bn (versus JPY6.9bn);
ROE: at least 21.0% (versus 19.7%);
ROIC: at least 15.0% (versus 14.2%).
View the full report.
Quarterly Performance
(million yen) Q1 Q2 Q3 Q4 Q1 Q2 Q3 Q4 % of FY FY Est.
Sales 14,346 16,862 16,778 17,090 16,896 19,726 20,919 19,925 100.3% 77,200
YoY 10.0% 9.6% 10.7% 9.9% 17.8% 17.0% 24.7% 16.6%
GP 6,096 7,150 7,292 7,206 7,364 8,822 9,466 8,821
YoY 15.7% 13.6% 15.6% 11.5% 20.8% 23.4% 29.8% 22.4%
GPM 42.5% 42.4% 43.5% 42.2% 43.6% 44.7% 45.3% 44.3%
SG&A 4,691 5,331 5,092 5,561 5,438 5,912 5,876 6,872
YoY 2.5% 9.1% 5.1% 12.0% 15.9% 10.9% 15.4% 23.6%
SG&A / Sales 32.7% 31.6% 30.3% 32.5% 32.2% 30.0% 28.1% 34.5%
OP 1,408 1,817 2,205 1,656 1,913 2,901 3,607 1,944 101.6% 10,200
YoY 105.4% 29.6% 50.5% 11.1% 35.9% 59.6% 63.6% 17.4%
OPM 9.8% 10.8% 13.1% 9.7% 11.3% 14.7% 17.2% 9.8%
RP 1,608 1,659 2,249 1,874 2,188 2,974 3,729 2,111 102.8% 10,700
YoY 119.0% 24.6% 65.2% 25.8% 36.1% 79.3% 65.8% 12.6%
RPM 11.2% 9.8% 13.4% 11.0% 12.9% 15.1% 17.8% 10.6%
NI 1,051 860 1,538 1,125 1,328 1,793 2,517 1,347 107.5% 6,500
YoY 211.3% -1.9% 75.7% 2.9% 26.4% 108.5% 63.7% 19.8%
NPM 7.3% 5.1% 9.2% 6.6% 7.9% 9.1% 12.0% 6.8%
Source: Company data, SR research.
Figures may differ from company materials due to differences in rounding methods.
FY01/14FY01/13 FY01/14

64 / 77
MONTHLY WRAP – April 2014
Copyright (C) Shared Research Inc. All Rights Reserved.
Resorttrust, Inc. (4681)
The pioneer and leader in Japan’s membership-based resort industry.
On March 4, 2014, SR updated comments on Resorttrust, Inc.’s Q3 FY03/14 earnings results after
interviewing management.
As of the end of Q3, the company had achieved 77.4% of its full-year sales target and 99.5% of its
operating profit target. It had outperformed its full-year net income target by 2.0% (102.0% of its
full-year target). In light of these figures, the company’s upward revisions to its forecasts still appear
conservative, even allowing for JPY700mn in maintenance costs and JPY400mn in impairment losses in
Q4.
Revenue in FY03/15 will be hampered by the fact that profit from real estate sales of facilities under
construction will not be recorded until the facilities open for business. However, the company is
nevertheless aiming for an increase in earnings in FY03/15, given that FY03/14 saw it record JPY700mn
in facility maintenance costs, and JPY500mn in costs relating to opening June Hotel Trusty Kanazawa and
the renewal and reopening of Resorpia Hakone.
View the full report.
Quarterly Performance
(million yen) Q1 Q2 Q3 Q4 Q1 Q2 Q3 Q4 % of FY FY Est.
Sales 25,052 27,608 27,886 24,765 27,342 30,401 30,787 - 77.4% 114,400
YoY 10.4% 4.6% 10.2% -2.8% 9.1% 10.1% 10.4% -
GP 20,501 22,532 22,724 19,559 22,369 25,059 25,024 -
YoY 11.5% 4.6% 9.9% -2.5% 9.1% 11.2% 10.1% -
GPM 81.8% 81.6% 81.5% 79.0% 81.8% 82.4% 81.3% -
SG&A 17,949 18,089 18,372 18,851 19,330 19,729 19,066 -
YoY 6.4% 1.3% 5.0% 1.5% 7.7% 9.1% 3.8% -
SG&A / Sales 71.6% 65.5% 65.9% 76.1% 70.7% 64.9% 61.9% -
OP 2,552 4,443 4,351 708 3,039 5,330 5,957 - 99.5% 14,400
YoY 66.7% 20.6% 36.6% -52.5% 19.1% 20.0% 36.9% -
OPM 10.2% 16.1% 15.6% 2.9% 11.1% 17.5% 19.3% -
RP 2,589 4,641 4,575 1,171 4,188 5,366 6,159 - 99.4% 15,800
YoY 32.5% 20.6% 32.2% 543.4% 61.8% 15.6% 34.6% -
RPM 10.3% 16.8% 16.4% 4.7% 15.3% 17.7% 20.0% -
NI 1,385 2,947 2,838 -43 1,623 3,289 3,754 - 102.0% 8,500
YoY 7.9% 28.7% 37.5% - 17.2% 11.6% 32.3% -
NPM 5.5% 10.7% 10.2% - 5.9% 10.8% 12.2% -
Figures may differ from company materials due to differences in rounding methods
Source: Company Data, SR Inc. Research
FY03/13 FY03/14FY03/14

65 / 77
MONTHLY WRAP – April 2014
Copyright (C) Shared Research Inc. All Rights Reserved.
Round One Corp. (4680)
Nationwide operator of amusement complex centers with bowling at their core.
On March 7, 2014, Round One released monthly sales data for February 2014.
View the full report.
FY03/14 Apr May Jun Jul Aug Sep Oct Nov Dec Jan Feb Mar
Total Sales (Million Yen) 6,625 7,015 6,291 6,168 8,597 6,611 5,586 5,522 7,284 8,596 6,146
Bowling 2,306 2,420 2,122 1,922 2,713 2,110 1,795 1,727 2,237 2,708 1,965
Game 2,598 2,763 2,571 2,719 3,502 2,756 2,379 2,380 3,145 3,621 2,580
Karaoke 630 667 627 639 838 631 538 537 816 824 601
SPO-CHA 862 918 738 668 1,278 881 668 684 880 1,205 802
Other 227 245 231 219 264 231 203 192 204 235 197
Total Sales YoY -2.2% -7.1% 0.2% -6.7% -1.9% -5.5% -8.5% -3.1% 2.9% 0.6% -4.0%
Bowling -4.9% -7.3% -3.9% -12.3% -7.2% -12.1% -10.9% -7.2% -7.7% -13.2% -14.5%
Game -4.7% -11.4% 0.5% -2.7% 1.7% -2.0% -8.6% -2.9% 9.9% 9.2% 2.5%
Karaoke 3.2% 2.5% 3.2% -5.2% 1.8% -8.0% -9.0% -2.3% 2.0% 3.2% 0.3%
SPO-CHA 10.7% 0.4% 10.2% -6.7% -1.4% 3.7% -0.3% 8.9% 16.9% 15.5% 5.9%
Other -3.5% -4.7% -2.4% -7.5% -4.2% -7.5% -8.2% -8.2% -13.2% -11.9% -15.3%
Comparable Store Sales YoY -7.1% -8.9% -2.0% -8.8% -3.7% -7.7% -10.7% -5.5% 1.8% 0.6% -4.0%
Bowling -8.6% -8.9% -5.7% -14.1% -8.6% -14.2% -13.2% -9.5% -9.0% -13.2% -14.5%
Game -10.0% -13.9% -2.5% -5.4% -0.9% -4.8% -11.3% -5.9% 8.6% 9.2% 2.5%
Karaoke -1.7% 0.4% 1.0% -7.2% -0.1% -10.3% -11.3% -4.9% 0.4% 3.2% 0.3%
SPO-CHA -3.9% 0.4% 10.2% -6.7% -1.4% 3.7% -0.3% 8.9% 16.9% 15.5% 5.9%
Other -7.4% -7.0% -4.6% -9.9% -6.5% -10.1% -10.9% -10.3% -13.6% -11.9% -15.3%
FY03/13 Apr May Jun Jul Aug Sep Oct Nov Dec Jan Feb Mar
Total Sales (Million Yen) 6,777 7,555 6,281 6,615 8,764 6,997 6,102 5,700 7,075 8,543 6,405 8,363
Bowling 2,425 2,612 2,208 2,193 2,923 2,400 2,016 1,861 2,424 3,118 2,298 3,134
Game 2,725 3,119 2,557 2,794 3,443 2,811 2,601 2,451 2,860 3,315 2,516 2,915
Karaoke 611 651 608 673 823 686 592 550 800 798 600 771
SPO-CHA 779 914 670 716 1,297 849 671 628 753 1,043 757 1,277
Other 235 257 236 237 276 250 221 209 235 267 232 263
Total Sales YoY -7.0% -10.1% -2.0% -7.7% -4.1% -4.4% -8.2% -5.7% -4.6% 2.7% -0.3% -1.1%
Bowling -10.6% -15.6% -5.0% -11.5% -9.2% -8.2% -13.8% -11.4% -3.1% -1.5% -5.8% -6.0%
Game -7.5% -7.6% -4.3% -9.2% -6.2% -8.1% -8.0% -4.4% -11.6% 6.3% -1.0% -4.0%
Karaoke -6.2% -9.0% 3.4% -2.5% 1.7% 3.7% -2.6% -2.7% 4.9% 5.4% 6.1% 2.0%
SPO-CHA 7.4% -2.5% 15.6% 9.5% 13.8% 17.7% 7.1% 6.2% 11.8% 4.0% 17.1% 16.1%
Other -5.3% -8.5% -2.6% -9.7% -6.8% -5.3% -9.3% -6.7% -2.9% -1.9% -0.4% 17.5%
Comparable Store Sales YoY -9.1% -15.1% -7.4% -12.7% -9.2% -8.4% -11.6% -9.2% -9.4% -2.7% -6.4% -6.9%
Bowling -11.7% -18.5% -8.4% -14.8% -12.3% -10.6% -15.6% -13.4% -6.4% -5.1% -10.0% -9.9%
Game -10.4% -13.5% -9.9% -14.6% -12.2% -12.1% -11.4% -7.9% -16.5% -0.3% -7.7% -10.6%
Karaoke -7.8% -12.7% -0.9% -6.7% -2.6% 0.1% -5.6% -5.6% 0.5% 0.3% 0.2% -3.5%
SPO-CHA 4.2% -12.7% 0.6% -2.9% 4.5% 6.2% -3.6% -4.1% 1.1% -3.8% 5.6% 6.4%
Other -6.2% -10.6% -4.9% -12.0% -9.8% -8.4% -11.0% -8.5% -6.5% -6.6% -5.1% 11.8%
Source: Company data, SR Inc. Research
Figures may differ from company materials due to differences in rounding methods.
Monthly Sales Trends

66 / 77
MONTHLY WRAP – April 2014
Copyright (C) Shared Research Inc. All Rights Reserved.
Sanix Incorporated (4651)
Commercial solar power generation and environmental resources development (i.e., power
generation and waste recycling)
On March 10, 2014, Sanix Incorporated announced monthly sales data for February 2014.
On March 6, 2014, the company announced the construction of a new factory for manufacturing
machinery associated with photovoltaic (PV) power generation systems.
Sanix provides comprehensive service for commercial PV systems, including design, sales, installation,
and maintenance. Although the company has strong business fundamentals, keeping up with increasing
demand has been a challenge. To cope with this, and to reduce costs, the company will construct new
facilities for manufacturing machinery associated with PV power generation systems. The new factory
will strengthen and expand production capabilities.
Factory summary
Product to be manufactured: Power conditioners for PV systems
Investment amount: JPY845mn (JPY170mn for the acquisition of real estate and buildings)
Operations begin: August 2014 (tentative)
View the full report.
FY03/14 Consolidated Monthly Sales
Apr. May Jun Jul Aug Sep Oct Nov Dec Jan Feb Mar Total
Total Sales 5,521 5,091 5,141 5,274 5,349 5,316 6,184 6,631 7,025 7,810 8,460 67,802
YoY 107.9% 68.6% 71.7% 63.8% 92.8% 57.8% 124.8% 134.8% 92.9% 77.8% 58.2%
Sales by Category
Commercial Photovoltaic (PV) Solution - 2,401 2,450 2,604 2,634 2,380 3,620 3,949 5,391 5,562 6,109 37,100
YoY - - - - - - - - 633.6% 161.8% 125.7%
Home Sanitation (HS) 3,842 1,091 1,059 1,079 971 917 824 797 723 688 727 12,718
YoY 179.0% -26.1% -25.4% -28.2% -21.2% -39.9% -27.4% -27.7% -35.6% -5.7% -31.1%
Establishment Sanitation (ES) 398 311 491 408 411 619 431 437 445 328 501 4,780
YoY 70.1% 31.8% 93.8% 64.6% 88.1% 135.3% 125.8% 57..3% 26.8% -7.0% 30.6%
Environmental Resources Development 1,281 1,288 1,407 1,183 1,333 1,344 1,309 1,448 1,446 1,232 1,123 14,394
YoY 22.7% 8.8% 2.7% -8.2% 13.1% -0.2% 14.3% 32.7% 0.9% 3.8% -6.7%
Source: Company data, SR Inc. Research
Figures in the category breakdown are preliminarly and their sums may differ from finalized monthly sales figures.

67 / 77
MONTHLY WRAP – April 2014
Copyright (C) Shared Research Inc. All Rights Reserved.
Sanrio Co., Ltd. (8136)
Character management company. Owns Hello Kitty. Growing worldwide licensing business.
On March 6, 2014, SR updated comments on Sanrio Co Ltd’s Q3 FY03/14 after interviewing
management.
The company maintained its full-year forecasts. The cumulative Q3 sales and operating profit were
74.4% and 75.7% of full-year estimates, respectively.
For the period, the Overseas business had sales of JPY32.9bn (+15.0% YoY) and operating profit of
JPY16.0bn (+18.3%). The Domestic business posted sales of JPY37.1bn (-0.8% YoY) and operating
profit of JPY700mn (-46.9%).
The Domestic Licensing business saw sales of JPY7.0bn (-5.9% YoY) and operating profit of JPY4.8bn
(-7.7%). Sales in the Domestic Product Sales sub-segment were JPY15.6bn (-1.0%), and operating profit
was JPY1.4bn (+0.1%). Theme Parks business sales were JPY4.9bn (+3.2%), and operating loss was
JPY200mn (JPY200mn loss a year earlier). Concerning Domestic Licensing, the company states that
effects of a large-scale collaborative project implemented in the previous year led to reduced sales, and
unfavorable weather conditions held back growth in sales of outerwear and toys. General and
administrative expenses associated with the Domestic business were JPY5.9bn (JPY5.6bn a year earlier).
View the full report.
Quarterly Performance
(JPYmn) Q1 Q2 Q3 Q4 Q1 Q2 Q3 Q4 % of FY FY Est.
Sales 16,875 17,220 21,435 18,703 17,242 17,674 22,373 - 74.4% 77,000
YoY 3.2% -4.1% -3.6% 1.6% 2.2% 2.6% 4.4% -
GP 11,205 11,723 13,670 12,856 11,957 12,930 15,021 -
YoY 4.4% -0.7% -1.2% 9.5% 6.7% 10.3% 9.9% -
GPM 66.4% 68.1% 63.8% 68.7% 69.3% 73.2% 67.1% -
SG&A 7,097 7,335 7,286 7,537 7,278 7,851 8,058 -
YoY 4.9% -1.8% -7.2% 5.9% 2.6% 7.0% 10.6% -
SG&A / Sales 42.1% 42.6% 34.0% 40.3% 42.2% 44.4% 36.0% -
OP 4,108 4,388 6,384 5,318 4,678 5,079 6,964 - 75.7% 22,100
YoY 3.5% 1.2% 6.8% 15.0% 13.9% 15.7% 9.1% -
OPM 24.3% 25.5% 29.8% 28.4% 27.1% 28.7% 31.1% -
RP 4,296 4,643 5,749 4,958 4,133 4,915 6,593 - 74.1% 21,100
YoY 11.1% 14.1% -6.1% 15.0% -3.8% 5.9% 14.7% -
RPM 25.5% 27.0% 26.8% 26.5% 24.0% 27.8% 29.5% -
NI 2,913 2,678 3,663 3,282 2,635 3,214 4,295 - 75.1% 13,500
YoY 1.7% -0.7% -36.6% 7.9% -9.5% 20.0% 17.3% -
NPM 17.3% 15.6% 17.1% 17.5% 15.3% 18.2% 19.2% -
*Reversal of allowance for sales returns is subtracted from gross profit; figures may differ from company materials due to differences in rounding methods
Source: Company data, SR Inc.
FY03/14FY03/13 FY03/14
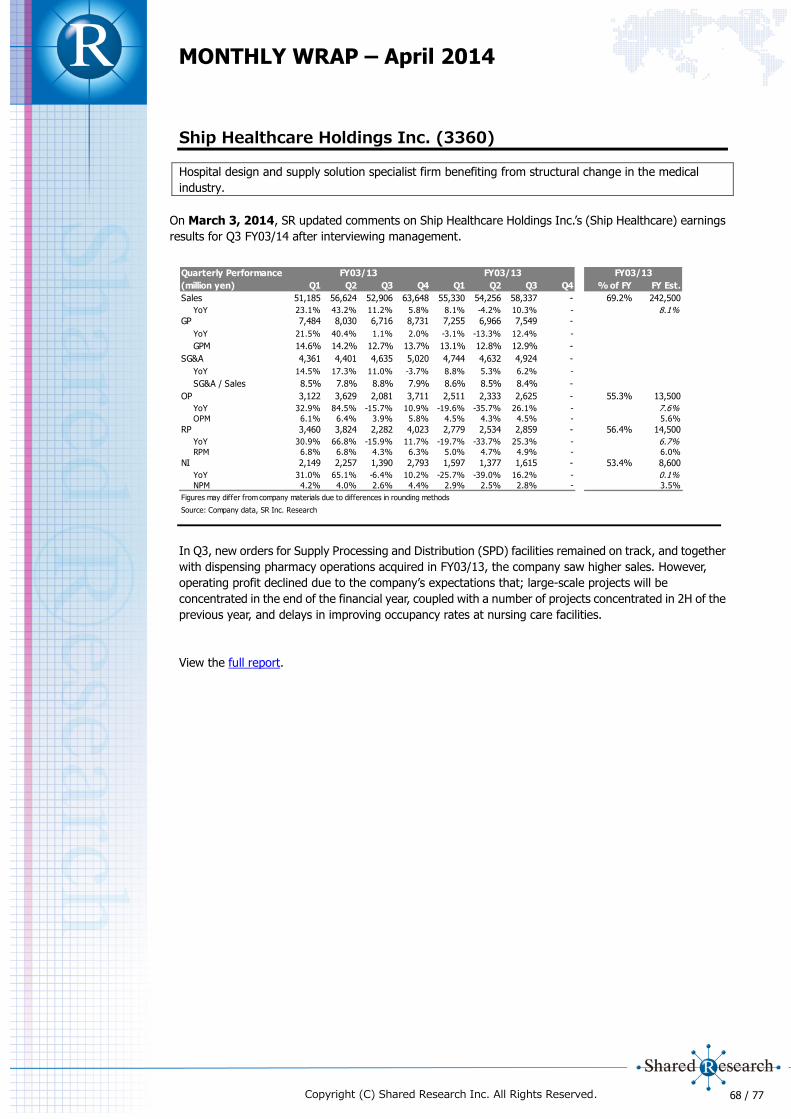
68 / 77
MONTHLY WRAP – April 2014
Copyright (C) Shared Research Inc. All Rights Reserved.
Ship Healthcare Holdings Inc. (3360)
Hospital design and supply solution specialist firm benefiting from structural change in the medical
industry.
On March 3, 2014, SR updated comments on Ship Healthcare Holdings Inc.’s (Ship Healthcare) earnings
results for Q3 FY03/14 after interviewing management.
In Q3, new orders for Supply Processing and Distribution (SPD) facilities remained on track, and together
with dispensing pharmacy operations acquired in FY03/13, the company saw higher sales. However,
operating profit declined due to the company’s expectations that; large-scale projects will be
concentrated in the end of the financial year, coupled with a number of projects concentrated in 2H of the
previous year, and delays in improving occupancy rates at nursing care facilities.
View the full report.
Quarterly Performance
(million yen) Q1 Q2 Q3 Q4 Q1 Q2 Q3 Q4 % of FY FY Est.
Sales 51,185 56,624 52,906 63,648 55,330 54,256 58,337 - 69.2% 242,500
YoY 23.1% 43.2% 11.2% 5.8% 8.1% -4.2% 10.3% - 8.1%
GP 7,484 8,030 6,716 8,731 7,255 6,966 7,549 -
YoY 21.5% 40.4% 1.1% 2.0% -3.1% -13.3% 12.4% -
GPM 14.6% 14.2% 12.7% 13.7% 13.1% 12.8% 12.9% -
SG&A 4,361 4,401 4,635 5,020 4,744 4,632 4,924 -
YoY 14.5% 17.3% 11.0% -3.7% 8.8% 5.3% 6.2% -
SG&A / Sales 8.5% 7.8% 8.8% 7.9% 8.6% 8.5% 8.4% -
OP 3,122 3,629 2,081 3,711 2,511 2,333 2,625 - 55.3% 13,500
YoY 32.9% 84.5% -15.7% 10.9% -19.6% -35.7% 26.1% - 7.6%OPM 6.1% 6.4% 3.9% 5.8% 4.5% 4.3% 4.5% - 5.6%
RP 3,460 3,824 2,282 4,023 2,779 2,534 2,859 - 56.4% 14,500
YoY 30.9% 66.8% -15.9% 11.7% -19.7% -33.7% 25.3% - 6.7%RPM 6.8% 6.8% 4.3% 6.3% 5.0% 4.7% 4.9% - 6.0%
NI 2,149 2,257 1,390 2,793 1,597 1,377 1,615 - 53.4% 8,600
YoY 31.0% 65.1% -6.4% 10.2% -25.7% -39.0% 16.2% - 0.1%NPM 4.2% 4.0% 2.6% 4.4% 2.9% 2.5% 2.8% - 3.5%
Figures may differ from company materials due to differences in rounding methods
Source: Company data, SR Inc. Research
FY03/13FY03/13 FY03/13

69 / 77
MONTHLY WRAP – April 2014
Copyright (C) Shared Research Inc. All Rights Reserved.
SMS Co., Ltd. (2175)
SMS provides recruitment services and managing professional community websites.
On March 17, 2014, SR Inc. updated comments on SMS Co., Ltd. Q3 FY03/14 earnings results after
interviewing management.
Nursing Care segment
Earnings were favorable for the daily use nursing care business, where SMS offers business portal
services (Kaipoke Biz) for small and medium-size nursing care providers. The main reason was an
increase in the number of member companies using the company’s software for nursing care insurance
billing.
Earnings rose in the non-daily nursing care business, where the company offers Care personnel bank
recruitment services for care managers, and its PT/OT Personnel Bank recruitment services for physical
therapists, occupational therapists, and speech therapists, due mainly to expansion of the sales force and
a higher productivity, ie, a higher number of contracts signed per consultant, than in any cumulative Q3
to date.
Medical Care segment
In the daily use medical care segment, earnings for the Pure Nurse catalog-sales service for nurses
showed little year-on-year change.
In the non-daily medical care business, earnings for the nursing recruitment service—Nurse personnel
bank—showed steady growth attributable to an increase in sales personnel and increased orders for new
products.
View the full report.
Quarterly Performance
(million yen) Q1 Q2 Q3 Q4 Q1 Q2 Q3 Q4 % of FY Est. FY Est.
Sales 3,237 2,204 1,962 2,779 3,823 2,598 2,300 - 69.9% 12,475
YoY 17.1% 17.2% 23.2% 13.1% 18.1% 17.9% 17.2% - 22.5%
GP 3,056 2,077 1,824 2,524 3,634 2,417 2,071 -
YoY 12.4% 14.4% 21.6% 13.4% 18.9% 16.4% 13.5% -
GPM 94.4% 94.2% 93.0% 90.8% 95.0% 93.1% 90.1% -
SG&A 2,019 2,035 1,982 1,875 2,300 2,412 2,318 -
YoY 24.4% 19.7% 14.1% 11.6% 14.0% 18.6% 16.9% -
SG&A / Sales 62.4% 92.3% 101.1% 67.5% 60.2% 92.9% 100.8% -
OP 1,038 42 -158 648 1,333 5 -246 - 75.2% 1,780
YoY -5.4% -63.2% - 18.8% 28.5% -88.9% - - 13.3%
OPM 32.1% 1.9% - 23.3% 34.9% 0.2% - - 14.3%
RP 1,141 109 -77 818 1,552 94 -189 - 72.7% 2,263
YoY -2.4% -23.6% - 20.8% 36.0% -12.9% - - 13.7%
RPM 35.2% 4.9% - 29.4% 40.6% 3.6% - - 18.1%
NI 734 64 -55 484 1,022 59 -149 - 79.0% 1,369
YoY 2.7% -29.5% - 27.1% 39.2% -6.7% - - 11.6%
NPM 22.7% 2.9% - 17.4% 26.7% 2.3% - - 11.0%
Figures may differ from company materials due to differences in rounding methods
Source: Company data, SR
FY03/14 FY03/14FY03/13

70 / 77
MONTHLY WRAP – April 2014
Copyright (C) Shared Research Inc. All Rights Reserved.
Takashimaya Co., Ltd. (8233)
Major Japanese department store operator aiming for further growth driven by greater presence in the
shopping center sector and in Asia
Takashimaya released monthly store sales data for February on March 3, 2014, and for March on April
1, 2014,
View the full report.
All Store Sales Mar Apr May Jun Jul Aug Sep Oct Nov Dec Jan Feb
FY02/12
Takashimaya (Parent) -15.6% -1.9% -3.5% 0.8% 0.1% -1.1% -1.6% -0.1% -1.7% 0.9% -1.8% 0.7%
Domestic Department
Stores (18 Stores)-16.8% -0.9% -2.8% 0.6% 0.8% -1.2% -1.9% 0.3% -1.4% 0.3% -1.8% -1.0%
Corporate Business 14.7% -22.0% -22.3% 3.5% -19.2% 3.1% -4.9% -11.8% -11.5% 14.4% -0.9% 16.8%
Cross-Media Business 2.7% -0.3% 5.3% 6.7% 1.0% -13.6% 1.8% 1.5% -6.6% 6.7% -5.3% -0.3%
FY02/13
Takashimaya (Parent) 16.5% 2.8% -0.2% -0.9% -1.9% 0.6% 1.9% -1.0% 2.4% -2.7% -2.2% -0.3%
Domestic Department
Stores (18 Stores)16.9% 1.9% -0.7% -0.5% -3.0% -0.6% 1.1% -1.6% 1.6% -2.6% -2.9% 0.3%
Corporate Business 0.1% 23.6% 9.0% -2.5% 31.5% 20.0% 26.1% 10.3% 21.8% -7.8% 5.2% -5.6%
Cross-Media Business 13.4% -10.3% -3.8% -11.7% -1.4% 22.3% 0.9% 3.6% 7.1% -0.8% 13.8% -6.1%
FY02/14
Takashimaya (Parent) 2.9% -1.3% 2.5% 8.9% -3.6% 0.4% 1.9% -2.6% 2.2% 1.8% 4.1% 3.7%
Domestic Department
Stores (18 Stores)4.9% -0.5% 1.0% 7.8% -4.0% 0.3% 2.6% -2.3% 3.0% 1.8% 4.1% 3.9%
Corporate Business 29.1% -11.5% 20.7% 38.8% 6.0% -3.0% 3.7% -4.2% -5.9% 11.7% 7.5% 3.0%
Cross-Media Business -1.8% 4.5% 11.3% 0.6% 3.9% 13.2% -18.3% -5.3% -11.2% -7.0% -0.7% -5.8%
FY02/15
Takashimaya (Parent) 32.7%
Domestic Department
Stores (18 Stores)32.1%
Corporate Business
Cross-Media Business
Source: Company data processed by SR Inc.
Figures may differ from company materials due to differences in rounding methods.

71 / 77
MONTHLY WRAP – April 2014
Copyright (C) Shared Research Inc. All Rights Reserved.
Takihyo Co., Ltd. (9982)
Textiles and apparel trading house with over 260 years of history.
On March 31, 2014, Takihyo Co., Ltd. announced earnings results for FY02/14.
Sales were JPY79.4bn (+6.5% YoY). The company grew sales of mainstay women’s apparel to large
specialty stores and catalogue-shopping companies, particularly driven by bottom items. Exports of
fabric to the United States and Europe were also robust. The company launched new brand BERARDI
from Spring/Summer 2013, with 30 shops opened at major department stores nationwide.
View the full report.
Quarterly Performance
(million yen) Q1 Q2 Q3 Q4 Q1 Q2 Q3 Q4 % of FY FY Est.
Sales 18,796 16,392 21,752 17,607 19,635 17,666 23,701 18,368 99.2% 80,000
YoY 15.4% 6.2% 6.2% 2.9% 4.5% 7.8% 9.0% 4.3%
GP 4,698 3,652 5,041 3,397 4,111 3,519 4,914 3,464
YoY 31.8% 17.4% 3.7% -2.6% -12.5% -3.6% -2.5% 2.0%
GPM 25.0% 22.3% 23.2% 19.3% 20.9% 19.9% 20.7% 18.9%
SG&A 3,650 3,317 3,515 3,573 3,736 3,408 3,550 3,399
YoY 13.2% 6.4% 8.0% 7.3% 2.4% 2.7% 1.0% -4.9%
SG&A / Sales 19.4% 20.2% 16.2% 20.3% 19.0% 19.3% 15.0% 18.5%
OP 1,045 342 1,505 -148 373 115 1,347 86 109.8% 1,750
YoY 203.9% - -5.2% - -64.3% -66.4% -10.5% -
OPM 5.6% 2.1% 6.9% - 1.9% 0.7% 5.7% 0.5%
RP 1,070 351 1,519 -65 453 105 1,367 85 105.8% 1,900
YoY 192.0% - -4.3% - -57.7% - -10.0% -
RPM 5.7% 2.1% 7.0% - 2.3% 0.6% 5.8% 0.5%
NI 589 158 907 -210 271 79 854 -52 96.0% 1,200
YoY - - -3.1% - -54.0% -50.0% -5.8% -
NPM 3.1% 1.0% 4.2% - 1.4% 0.4% 3.6% -
Source: Company data, SR Inc. Research; figures may differ from company materials due to differences in rounding methods.
FY02/14FY02/13 FY02/14
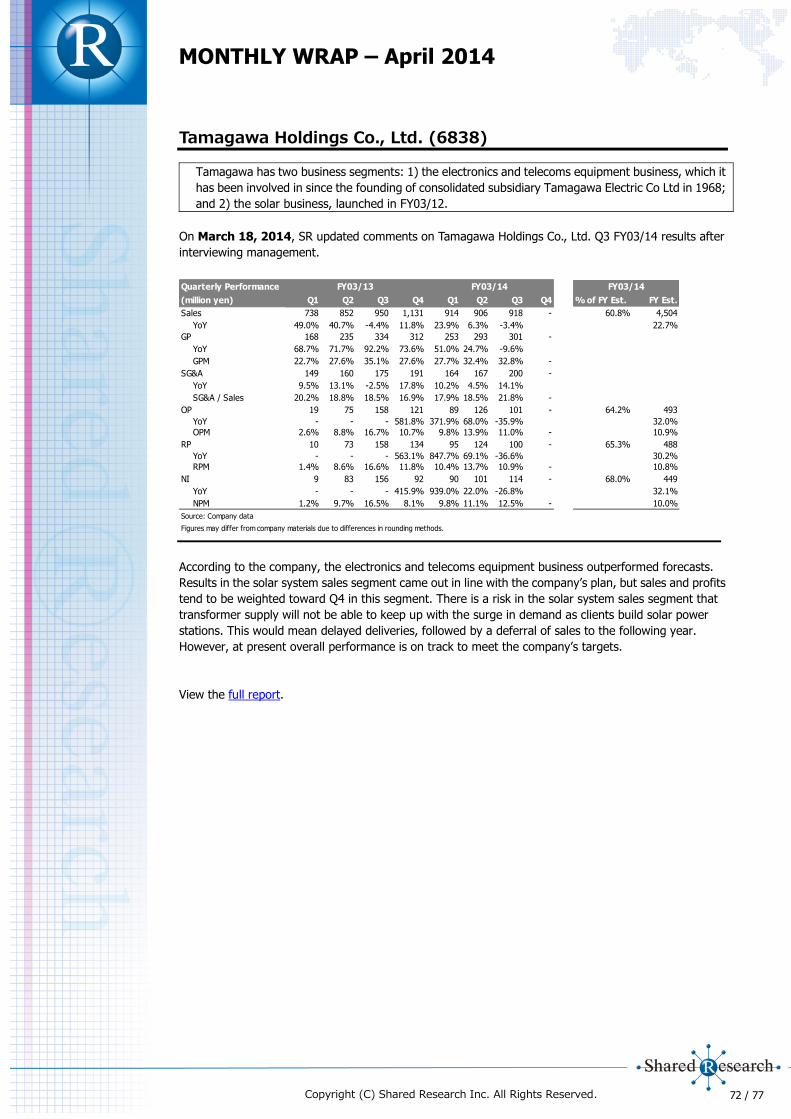
72 / 77
MONTHLY WRAP – April 2014
Copyright (C) Shared Research Inc. All Rights Reserved.
Tamagawa Holdings Co., Ltd. (6838)
Tamagawa has two business segments: 1) the electronics and telecoms equipment business, which it
has been involved in since the founding of consolidated subsidiary Tamagawa Electric Co Ltd in 1968;
and 2) the solar business, launched in FY03/12.
On March 18, 2014, SR updated comments on Tamagawa Holdings Co., Ltd. Q3 FY03/14 results after
interviewing management.
According to the company, the electronics and telecoms equipment business outperformed forecasts.
Results in the solar system sales segment came out in line with the company’s plan, but sales and profits
tend to be weighted toward Q4 in this segment. There is a risk in the solar system sales segment that
transformer supply will not be able to keep up with the surge in demand as clients build solar power
stations. This would mean delayed deliveries, followed by a deferral of sales to the following year.
However, at present overall performance is on track to meet the company’s targets.
View the full report.
Quarterly Performance
(million yen) Q1 Q2 Q3 Q4 Q1 Q2 Q3 Q4 % of FY Est. FY Est.
Sales 738 852 950 1,131 914 906 918 - 60.8% 4,504
YoY 49.0% 40.7% -4.4% 11.8% 23.9% 6.3% -3.4% 22.7%
GP 168 235 334 312 253 293 301 -
YoY 68.7% 71.7% 92.2% 73.6% 51.0% 24.7% -9.6%
GPM 22.7% 27.6% 35.1% 27.6% 27.7% 32.4% 32.8% -
SG&A 149 160 175 191 164 167 200 -
YoY 9.5% 13.1% -2.5% 17.8% 10.2% 4.5% 14.1%
SG&A / Sales 20.2% 18.8% 18.5% 16.9% 17.9% 18.5% 21.8% -
OP 19 75 158 121 89 126 101 - 64.2% 493
YoY - - - 581.8% 371.9% 68.0% -35.9% 32.0%
OPM 2.6% 8.8% 16.7% 10.7% 9.8% 13.9% 11.0% - 10.9%
RP 10 73 158 134 95 124 100 - 65.3% 488
YoY - - - 563.1% 847.7% 69.1% -36.6% 30.2%
RPM 1.4% 8.6% 16.6% 11.8% 10.4% 13.7% 10.9% - 10.8%
NI 9 83 156 92 90 101 114 - 68.0% 449
YoY - - - 415.9% 939.0% 22.0% -26.8% 32.1%
NPM 1.2% 9.7% 16.5% 8.1% 9.8% 11.1% 12.5% - 10.0%
Source: Company data
Figures may differ from company materials due to differences in rounding methods.
FY03/14FY03/13 FY03/14

73 / 77
MONTHLY WRAP – April 2014
Copyright (C) Shared Research Inc. All Rights Reserved.
Verite Co., Ltd. (9904)
Jewelry retailer acquired by Indian jewelry conglomerate specializing in diamond rings.
On March 7, 2014, Verite announced February 2014 sales figures.
On March 3, 2014, SR updated comments on the company’s Q3 FY03/14 earnings results after
interviewing management.
In FY03/15, the company plans to continue focusing on new sales channels (wholesaling to catalog
retailers and so forth) and sales at exhibitions. It appears that exhibitions are patronized by many
wealthy customers, and therefore the effect of the consumption tax hike will be smaller than on store
sales. The company intends to continue holding exhibitions catering to wealthy customers in the future.
The company will lift sales per customer by inviting the 90,000 members of its CRM database to
exhibitions that center on expensive products.
View the full report.
Monthly Sales (YoY)
FY03/14 Apr. May Jun. Jul. Aug. Sep. Oct. Nov. Dec. Jan. Feb. Mar. 1H FY
All Stores
Sales 8.5% -8.7% -7.4% -0.8% -9.8% -1.9% -7.0% 4.2% 2.3% 8.4% -10.8% -3.8% -2.2%
Customer Count 17.4% 2.5% -9.5% -7.2% -14.2% -11.6% -9.4% -8.9% -12.6% -14.6% -30.0% -4.3% -9.3%
Sales Per Customer -7.6% -11.0% 2.4% 6.9% 5.1% 11.0% 2.6% 14.4% 17.0% 26.9% 27.4% 0.5% 7.9%
Stores 87 84 83 83 83 82 82 84 84 82 81 82 81
Comparable Stores
Sales 7.7% -9.0% 6.7% 0.5% -4.0% 2.4% -0.2% 12.2% 11.8% 18.7% -4.1% 0.4% 3.9%
Customer Count 18.6% 1.8% -1.6% -0.6% -8.0% -4.6% -0.1% -3.5% -3.6% -7.6% -23.9% 0.6% -3.2%
Sales Per Customer -9.2% -10.7% 8.5% 1.2% 4.4% 7.3% -0.1% 16.3% 16.0% 28.4% 26.0% -0.2% 7.4%
Stores 81 78 78 77 77 76 77 78 79 79 76 76 76
FY03/13 Apr. May Jun. Jul. Aug. Sep. Oct. Nov. Dec. Jan. Feb. Mar. 1H FY
All Stores
Sales 7.4% 8.6% -12.1% -7.3% 4.0% 1.1% -2.0% -12.7% -10.9% -3.9% 0.7% -7.1% -0.5% -3.7%
Customer Count -4.1% -6.9% 2.6% -8.7% -0.1% -5.5% -12.4% -7.4% -6.8% 3.4% 3.2% 5.5% -3.9% -3.1%
Sales Per Customer 12.0% 16.6% -14.3% 1.5% 4.1% 7.0% 11.8% -5.7% -4.3% -7.0% -2.4% -12.0% 3.5% -0.6%
Stores 100 100 101 101 101 102 103 104 104 102 99 97 97 97
Comparable Stores
Sales 6.4% 9.8% -11.3% -4.2% 1.3% -1.5% -2.2% -6.1% -9.1% -4.2% 2.3% -2.8% -0.4% -2.4%
Customer Count -2.9% -3.7% 1.0% -8.6% -2.4% -8.2% -14.8% -5.3% -5.2% 3.1% 6.1% 9.5% -4.3% -2.7%
Sales Per Customer 9.6% 14.0% -12.2% 4.8% 3.8% 7.3% 14.8% -0.8% -4.1% -7.1% -3.6% -11.3% 4.0% 0.3%
Stores 81 81 82 84 85 90 92 96 96 95 90 90 90 90
FY03/12 Apr. May Jun. Jul. Aug. Sep. Oct. Nov. Dec. Jan. Feb. Mar. 1H FY
All Stores
Sales -14.7% -19.7% 0.6% -12.2% 0.8% -10.4% -3.2% -6.2% 1.9% 3.9% 24.5% 39.3% -11.1% -1.0%
Customer Count -3.8% -0.6% -1.2% -4.8% -8.9% -14.5% -5.6% -4.0% -5.3% -3.8% 2.2% 6.6% -5.9% 3.9%
Sales Per Customer -11.7% -19.2% 1.8% -7.8% 10.7% 4.8% 2.5% -2.2% 7.6% 8.0% 21.8% 30.7% -5.5% 3.0%
Stores 90 89 89 91 90 92 94 98 99 99 98 100 92 100
Comparable Stores
Sales -11.5% -15.9% -1.3% -7.4% 7.9% -6.7% 2.4% -8.2% 2.2% 2.9% 18.9% 46.6% -7.7% 1.3%
Customer Count -4.2% 0.4% 1.1% 0.7% -5.3% -10.4% 2.0% 0.1% -2.3% -4.1% 4.1% 15.0% -3.0% -0.5%
Sales Per Customer -18.1% -16.2% -2.4% -8.1% 13.9% 4.1% 0.4% -8.3% 4.6% 7.3% 14.2% 27.5% -4.8% 1.8%
Stores 82 80 80 80 77 77 79 79 79 79 78 80 77 80
Source: Company data, SR Inc. Research
Figures may differ from company materials due to differences in rounding methods.
Quarterly Performance
(million yen) Q1 Q2 Q3 Q4 Q1 Q2 Q3 Q4 % of FY FY Est.
Sales 2,217 2,392 2,589 3,367 2,251 2,296 2,505 - 82.0% 8,600
YoY - - - - 1.5% -4.0% -3.2% -
GP 1,162 1,257 1,783 1,521 1,127 1,200 1,280 -
YoY - - - - -25.9% -4.5% -28.2% -
GPM 52.4% 52.6% 68.9% 45.2% 50.1% 52.3% 51.1% -
SG&A 1,371 1,333 1,368 1,446 1,169 1,148 1,140 -
YoY - - - - -19.2% -13.9% -16.7% -
SG&A / Sales 61.8% 55.7% 52.8% 42.9% 51.9% 50.0% 45.5% -
OP -209 -75 414 79 -42 52 140 - 38.5% 390
YoY - - - - - -169.3% -66.2% -
OPM - - 16.0% 2.3% - 2.3% 5.6% -
RP -238 -105 378 39 -66 -1 81 - 5.8% 240
YoY - - - - - -99.0% -78.6% -
RPM - - 14.6% 1.2% - - 3.2% -
NI -254 -202 354 215 -58 -16 69 - - 130
YoY - - - - - -92.1% -80.5% -
NPM - - 13.7% 6.4% - - 2.8% -
Figures may differ from company materials due to differences in rounding methods
Source: Company data
FY03/14 FY03/14FY03/13

74 / 77
MONTHLY WRAP – April 2014
Copyright (C) Shared Research Inc. All Rights Reserved.
WirelessGate Inc (9419)
Japan's first mobile virtual network operator (MVNO) and aggregator.
On March 26, 2014, WirelessGate Inc. announced an absorption-type merger with a consolidated
subsidiary.
The company has resolved to conduct an absorption-type merger with Wireless Technology Labo, a
wholly-owned consolidated subsidiary, with an effective date of July 1, 2014. By combining the
technology departments of both companies, particularly research and development of wireless
transmission services and network system operations conducted by Wireless Technology Labo, the
company seeks to strengthen its technological expertise.
The merger is between the parent company and a wholly-owned consolidated subsidiary and will not
have any effect on the company’s consolidated earnings results.
On March 12, 2014, SR updated the company’s report.
View the full report.
Yellow Hat Ltd (9882)
Nationwide auto parts distributor. Restructured store network to clear the path for renewed growth.
Financial condition improving.
On March 24, 2012, Yellow Hat raised its FY03/14 year-end DPS forecast by JPY4 for a total of JPY22.
With this upward revision, annual DPS will be JPY40.
View the full report.

75 / 77
MONTHLY WRAP – April 2014
Copyright (C) Shared Research Inc. All Rights Reserved.
Yumeshin Holdings Co., Ltd. (2362)
Staffing company focused on the construction industry. Expanding into other areas to secure
long-term growth
On March 7, 2014, Yumeshin Holdings released monthly sales and hiring data for February 2014.
View the full report.
Monthly Sales Oct Nov Dec Jan Feb Mar Apr May Jun Jul Aug Sep Total
FY09/14
Sales (Million Yen) 821 890 908 933 983 4,535
(YoY) 33.6% 43.5% 40.8% 40.4% 42.2%
Hired Numbers of Construction Staffing
Est. 100 100 115 115 115 115 180 180 180 170 115 115 1,600
Act. 97 104 74 151 145 571
(Difference) -3 4 -41 36 30 26
Source: Company data, SR Inc. Research
Figures may differ from company materials due to differences in rounding methods.
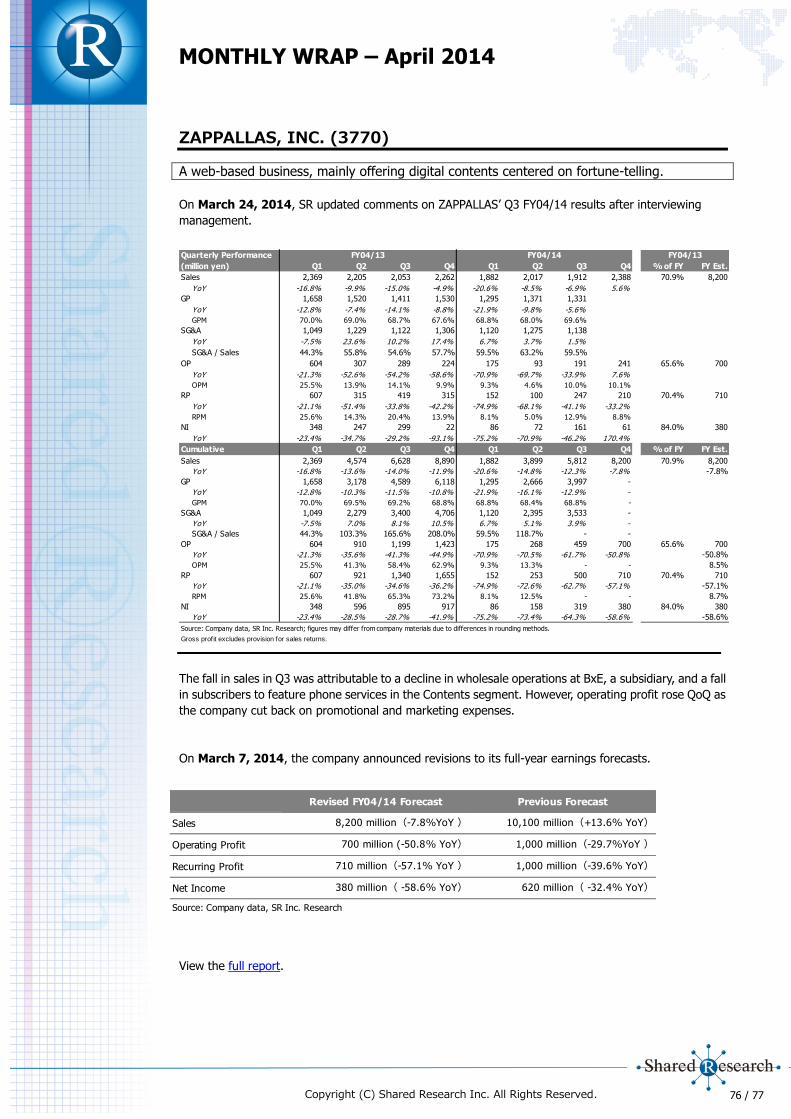
76 / 77
MONTHLY WRAP – April 2014
Copyright (C) Shared Research Inc. All Rights Reserved.
ZAPPALLAS, INC. (3770)
A web-based business, mainly offering digital contents centered on fortune-telling.
On March 24, 2014, SR updated comments on ZAPPALLAS’ Q3 FY04/14 results after interviewing
management.
The fall in sales in Q3 was attributable to a decline in wholesale operations at BxE, a subsidiary, and a fall
in subscribers to feature phone services in the Contents segment. However, operating profit rose QoQ as
the company cut back on promotional and marketing expenses.
On March 7, 2014, the company announced revisions to its full-year earnings forecasts.
View the full report.
Quarterly Performance
(million yen) Q1 Q2 Q3 Q4 Q1 Q2 Q3 Q4 % of FY FY Est.
Sales 2,369 2,205 2,053 2,262 1,882 2,017 1,912 2,388 70.9% 8,200
YoY -16.8% -9.9% -15.0% -4.9% -20.6% -8.5% -6.9% 5.6%
GP 1,658 1,520 1,411 1,530 1,295 1,371 1,331
YoY -12.8% -7.4% -14.1% -8.8% -21.9% -9.8% -5.6%
GPM 70.0% 69.0% 68.7% 67.6% 68.8% 68.0% 69.6%
SG&A 1,049 1,229 1,122 1,306 1,120 1,275 1,138
YoY -7.5% 23.6% 10.2% 17.4% 6.7% 3.7% 1.5%
SG&A / Sales 44.3% 55.8% 54.6% 57.7% 59.5% 63.2% 59.5%
OP 604 307 289 224 175 93 191 241 65.6% 700
YoY -21.3% -52.6% -54.2% -58.6% -70.9% -69.7% -33.9% 7.6%
OPM 25.5% 13.9% 14.1% 9.9% 9.3% 4.6% 10.0% 10.1%
RP 607 315 419 315 152 100 247 210 70.4% 710
YoY -21.1% -51.4% -33.8% -42.2% -74.9% -68.1% -41.1% -33.2%
RPM 25.6% 14.3% 20.4% 13.9% 8.1% 5.0% 12.9% 8.8%
NI 348 247 299 22 86 72 161 61 84.0% 380
YoY -23.4% -34.7% -29.2% -93.1% -75.2% -70.9% -46.2% 170.4%
Cumulative Q1 Q2 Q3 Q4 Q1 Q2 Q3 Q4 % of FY FY Est.
Sales 2,369 4,574 6,628 8,890 1,882 3,899 5,812 8,200 70.9% 8,200
YoY -16.8% -13.6% -14.0% -11.9% -20.6% -14.8% -12.3% -7.8% -7.8%
GP 1,658 3,178 4,589 6,118 1,295 2,666 3,997 -
YoY -12.8% -10.3% -11.5% -10.8% -21.9% -16.1% -12.9% -
GPM 70.0% 69.5% 69.2% 68.8% 68.8% 68.4% 68.8% -
SG&A 1,049 2,279 3,400 4,706 1,120 2,395 3,533 -
YoY -7.5% 7.0% 8.1% 10.5% 6.7% 5.1% 3.9% -
SG&A / Sales 44.3% 103.3% 165.6% 208.0% 59.5% 118.7% - -
OP 604 910 1,199 1,423 175 268 459 700 65.6% 700
YoY -21.3% -35.6% -41.3% -44.9% -70.9% -70.5% -61.7% -50.8% -50.8%
OPM 25.5% 41.3% 58.4% 62.9% 9.3% 13.3% - - 8.5%
RP 607 921 1,340 1,655 152 253 500 710 70.4% 710
YoY -21.1% -35.0% -34.6% -36.2% -74.9% -72.6% -62.7% -57.1% -57.1%
RPM 25.6% 41.8% 65.3% 73.2% 8.1% 12.5% - - 8.7%
NI 348 596 895 917 86 158 319 380 84.0% 380
YoY -23.4% -28.5% -28.7% -41.9% -75.2% -73.4% -64.3% -58.6% -58.6%
Source: Company data, SR Inc. Research; figures may differ from company materials due to differences in rounding methods.
Gross profit excludes provision for sales returns.
FY04/13FY04/13 FY04/14
Revised FY04/14 Forecast Previous Forecast
Sales 8,200 million(-7.8%YoY ) 10,100 million(+13.6% YoY)
Operating Profit 700 million (-50.8% YoY) 1,000 million(-29.7%YoY )
Recurring Profit 710 million(-57.1% YoY ) 1,000 million(-39.6% YoY)
Net Income 380 million( -58.6% YoY) 620 million( -32.4% YoY)
Source: Company data, SR Inc. Research

77 / 77
MONTHLY WRAP – April 2014
Copyright (C) Shared Research Inc. All Rights Reserved.
About Shared Research Inc.
We offer corporate clients comprehensive report coverage, a service that allows them to better inform investors and
other stakeholders by presenting continuously updated third party view of the business fundamentals, independent of
investment biases. Shared Research can be found on the web at http://www.sharedresearch.jp.
Disclaimer
This document is provided for informational purposes only. No investment opinion or advice is provided, intended, or
solicited. Shared Research, Inc. offers no warranty, either expressed or implied, regarding the veracity of data or
interpretations of data included in this report. Shared Research, Inc. shall not be held responsible for any damage
caused by the use of this report.
The copyright of this report and the rights regarding the creation and exploitation of the derivative work of this and
other Shared Research Reports belong to Shared Research, Inc. This report may be reproduced or modified for
personal use; distribution, transfer, or other uses of this report are strictly prohibited and a violation of the copyright of
this report. SR Inc. officers and employees may currently, or in the future, have a position in securities of the
companies mentioned in this report, which may affect this report’s objectivity
Japanese Financial Instruments and Exchange Law (FIEL) Disclaimer
The full versions of company reports have been prepared by Shared Research Inc. (“SR”) under contract with the
companies described in this report (“the Companies”). Opinions and views presented are SR’s where so stated. Such
opinions and views attributed to the Companies are interpretations made by SR. SR represents that if this report is
deemed to include an opinion by SR that could influence investment decisions in the Companies, such opinion may be
in exchange for consideration or promise of consideration from the Companies to SR.
Current Client Coverage of Shared Research Inc.:
Accretive Co., Ltd. Fields Corp. Onward Holdings Co., Inc.
AEON DELIGHT Co. FreeBit Co., Ltd. Panasonic Information Systems Co.
Ai Holdings Corp. Gamecard-Joyco Holdings, Inc. Paris Miki Holdings Inc.
Anritsu Corporation GCA Savvian Corporation Pigeon Corp.
Apamanshop Holdings Co., Ltd. Grandy House Corp. Resorttrust, Inc.
ArtSpark Holdings Inc. Gulliver International Co., Ltd. Round One Corp.
Axell Corporation Happinet Corporation Sanix Incorporated
BALS Corporation Harmonic Drive Systems Inc. Sanrio Co., Ltd.
Bell-Park Co., Ltd. Infomart Corp. SATO Holdings Corp.
Benefit One Inc. Intelligent Wave Inc. SBS Holdings, Inc.
Canon Marketing Japan Inc. ITO EN, Ltd. Ship Healthcare Holdings Inc.
Chiome Bioscience Inc. J Trust Co., Ltd SMS Co., Ltd.
Chiyoda Co., Ltd. Japan Best Rescue Co., Ltd. Star Mica Co., Ltd.
Comsys Holdings Corporation JIN Co., Ltd. Takashimaya Co., Ltd.
Creek & River Co., Ltd. Kenedix, Inc. Takihyo Co., Ltd.
Daiseki Corp. Lasertec Corp. Tamagawa Holdings Co., Ltd
DIC Corporation MAC-HOUSE Co. 3-D Matrix, Ltd.
Digital Garage Inc. Medinet Co., Ltd. TOKAI Holdings Corp.
Don Quijote Co., Ltd. MIRAIT Holdings Corp. Verite Co., Ltd.
Dream Incubator Inc. mobcast inc. WirelessGate, Inc.
Elecom Co. NAIGAI TRANS LINE LTD. Yellow Hat Ltd.
EMERGENCY ASSISTANCE JAPAN Co. NanoCarrier Ltd. Yumeshin Holdings
en-Japan Inc. Nippon Parking Development Co., Ltd. ZAPPALLAS, INC.
FerroTec Corp. NS Tool Co.
A ttention: If y ou would like to see firms y ou inv est in on this list, ask them to become our client, or sponsor a report y ourself.
Contact Details
http://www.sharedresearch.jp
Email: [email protected]
3-31-12 Sendagi ,
Bunkyo-ku Tokyo, Japan
Phone: +81 (0)3 5834-8787