Nitrogen Behaviour and Nitrous Oxide Emission in the Tidal Seine River Estuary (France) as...
22
Nitrogen behaviour and nitrous oxide emission in the tidal Seine River estuary (France) as influenced by human activities in the upstream watershed JOSETTE GARNIER 1, *, AURE ´ LIE CE ´ BRON 1 , GAE ¨ LLE TALLEC 1,2 , GILLES BILLEN 1 , MATHIEU SEBILO 1,3 and ANUN MARTINEZ 1 1 UMR Sisyphe 7619, Fonctionnement des Hydrosyste `mes, Universite´ P. & M. Curie-CNRS, Boite 105, Tour 56, Etage 4, 4 place Jussieu, 75005 Paris, France; 2 SIAAP / DRD, 82, Av. Kle´ber, 92700 Colombes, France; 3 UMR 7618, Biomco, Universite ´ P. & M. Curie – INRA – CNRS, Boite 120, Tour 56, Etage 4, 4 place Jussieu, 75005 Paris, France; *Author for correspondence (e-mail: josette. [email protected]) Received 22 March 2005; accepted in revised form 5 July 2005 Key words: Domestic impact, Nitrogen budget, N 2 O emission, Seine tidal estuary Abstract. The Seine River estuary (France) is the receptacle of a drainage basin characterised by high population density, heavy industrial activity and intensive agriculture. Whereas nitrate con- centrations are high due to diffuse sources in the upstream drainage basin, ammonium mainly originates from the effluents of the Ache`res wastewater treatment plant (WWTP) downstream from Paris and its suburbs (6.5 million equivalent-inhabitants). Ammonium is mostly nitrified in the tidal freshwater estuary and nitrification causes a strong summer oxygen deficit. Average longitudinal summer profiles of oxygen and nitrogen concentrations for two periods, between 1993–1997 and 1998–2003 in dry hydrological conditions (excluding the wet years 2000 and 2001) clearly reflect the changes due to the improved treatment of wastewater from Paris and its suburbs. On the basis of daily water flux data and twice monthly nitrogen measurements at the boundaries of the upstream freshwater estuarine section (108 km), we calculated nitrification and denitrification fluxes, whose annual averages were 43 and 71 · 10 3 kg N d 1 respectively from 1993 to 2003, with summer values (July–September) representing 73 and 57% of the annual fluxes, respectively. The degree of deni- trification in the upper estuary appears to be closely related to the nitrification, itself more loosely related to the amount of reduced nitrogen (Kjeldahl) brought by the treated effluents from the Ache`res WWTP. We estimated the total N 2 O emissions to about 40 kg N d 1 (25–60 kg N d 1 ) in the same sector. Introduction The ecological functioning of the Seine estuary is greatly affected by the input of a large amount of ammonium from treated effluents from Paris and its suburbs discharged 200 km upstream, which causes a strong summer oxygen deficit due to nitrification (Garnier et al. 2001). The treatment of the Paris effluents has been considerably improved in the last 10 years. Whereas the Ache` res wastewater treatment plant treated 8.5 million inhabitant-equivalents by the activated sludge process at the beginning of the 1990s, it now treats only 6.5 million inhabitant-equivalents, as the remainder is processed by Biogeochemistry (2006) 77: 305–326 ȑ Springer 2006 DOI 10.1007/s10533-005-0544-4
-
Upload
independent -
Category
Documents
-
view
3 -
download
0
Transcript of Nitrogen Behaviour and Nitrous Oxide Emission in the Tidal Seine River Estuary (France) as...
Nitrogen behaviour and nitrous oxide emission in
the tidal Seine River estuary (France) as influenced
by human activities in the upstream watershed
JOSETTE GARNIER1,*, AURELIE CEBRON1, GAELLE TALLEC1,2,GILLES BILLEN1, MATHIEU SEBILO1,3 and ANUN MARTINEZ1
1UMR Sisyphe 7619, Fonctionnement des Hydrosystemes, Universite P. & M. Curie-CNRS, Boite
105, Tour 56, Etage 4, 4 place Jussieu, 75005 Paris, France; 2SIAAP / DRD, 82, Av. Kleber, 92700
Colombes, France; 3UMR 7618, Biomco, Universite P. & M. Curie – INRA – CNRS, Boite 120, Tour
56, Etage 4, 4 place Jussieu, 75005 Paris, France; *Author for correspondence (e-mail: josette.
Received 22 March 2005; accepted in revised form 5 July 2005
Key words: Domestic impact, Nitrogen budget, N2O emission, Seine tidal estuary
Abstract. The Seine River estuary (France) is the receptacle of a drainage basin characterised by
high population density, heavy industrial activity and intensive agriculture. Whereas nitrate con-
centrations are high due to diffuse sources in the upstream drainage basin, ammonium mainly
originates from the effluents of the Acheres wastewater treatment plant (WWTP) downstream from
Paris and its suburbs (6.5 million equivalent-inhabitants). Ammonium is mostly nitrified in the tidal
freshwater estuary and nitrification causes a strong summer oxygen deficit. Average longitudinal
summer profiles of oxygen and nitrogen concentrations for two periods, between 1993–1997 and
1998–2003 in dry hydrological conditions (excluding the wet years 2000 and 2001) clearly reflect the
changes due to the improved treatment of wastewater from Paris and its suburbs. On the basis of
daily water flux data and twice monthly nitrogen measurements at the boundaries of the upstream
freshwater estuarine section (108 km), we calculated nitrification and denitrification fluxes, whose
annual averages were 43 and 71 · 103 kg N d�1 respectively from 1993 to 2003, with summer values
(July–September) representing 73 and 57% of the annual fluxes, respectively. The degree of deni-
trification in the upper estuary appears to be closely related to the nitrification, itself more loosely
related to the amount of reduced nitrogen (Kjeldahl) brought by the treated effluents from the
Acheres WWTP. We estimated the total N2O emissions to about 40 kg N d�1 (25–60 kg N d�1) in
the same sector.
Introduction
The ecological functioning of the Seine estuary is greatly affected by the inputof a large amount of ammonium from treated effluents from Paris and itssuburbs discharged 200 km upstream, which causes a strong summer oxygendeficit due to nitrification (Garnier et al. 2001). The treatment of the Pariseffluents has been considerably improved in the last 10 years. Whereas theAcheres wastewater treatment plant treated 8.5 million inhabitant-equivalentsby the activated sludge process at the beginning of the 1990s, it now treatsonly 6.5 million inhabitant-equivalents, as the remainder is processed by
Biogeochemistry (2006) 77: 305–326 � Springer 2006
DOI 10.1007/s10533-005-0544-4

tertiary treatment in Valenton, Noisy and a newly constructed WWTP atColombes. The implementation of a tertiary treatment, involving completenitrification and partial denitrification at the Acheres WWTP is programmedfor 2007.
Both process of denitrification (as well as, to a lesser extent, dissimilatorynitrate reduction, Conrad 1996; Kelso et al. 1997) and nitrification, particu-larly nitrifier denitrification (i.e. autotrophic denitrification), at low ambientoxygen tension (Jorgensen et al. 1984; Poth and Focht 1985; De Wilde and deBie 2000; Wrage et al. 2001; Dong et al. 2002; Punshon and Moore 2004), areknown to cause emission of nitrous oxide (N2O) as an intermediate product(Miller et al. 1993). The general concern for N2O emissions arises from the factthat atmospheric N2O significantly contributes to global warming. In addition,N2O is stable in the troposphere and it can therefore reach the stratospherewhere the NOx by-products of its photochemical decomposition contribute tothe destruction of the ozone layer (Crutzen and Ehhalt 1977; Bange 2000).Since 1970, N2O has increased at a rate of 0.2–0.3% yr�1, reaching the presentlevel of about 313 ppb (Rasmussen and Khalil 1986; Houghton et al. 1996;Garcia-Ruiz et al. 1998; Bange, 2000). The global rate of N2O emission hasincreased dramatically in the last decade by about 2.8–4.3 Tg N yr�1 (Nevisonet al. 1995), with most of the anthropogenic N2O production being attributedto agricultural activities (Bouwman et al. 1993; Bouwman 1996). Nitrogentransformations in the soil are considered to be responsible for 65% of theincreasing levels of N2O in the atmosphere (Bouwman et al. 1993; Bouwman1996; Bouwman et al. 2002; IPCC 2000), but estuaries may account for 60% oftotal marine N2O emissions (Bange et al. 1996). Whereas N2O emission fromrivers and coastal zones has been generally assumed to be related to N loadingat the global scale (Bouwman 1996; Bouwman et al. 2002; Seitzinger andKroeze 1998), field and laboratory experiments have shown the complexity ofthe kinetic control exerted on this process by variables such as oxygen, nitriteand pH (Goreau et al. 1980; Anderson and Levine 1986; de Bie et al. 2002;Bonin et al. 2002; Cebron et al. 2006). Therefore, more studies are needed for abetter understanding of the factors controlling the N2O production, thatappears to vary in time and to be dependent on specific conditions and cases(Mengis et al. 1996; De Bie et al. 2002).
Nitrification in the Seine river and estuary has been studied since thebeginning of the 1990s (Chesterikoff et al. 1992; Brion et al. 2000; Garnieret al. 2001; Cebron et al. 2003). Recently, we have characterized and quantifiedthe populations of nitrifying bacteria using molecular methods (Cebron et al.2003, 2004), and showed that ammonium oxidizing bacteria were alsoresponsible for the conversion of NH4
+ into N2O (Cebron et al. 2006).Although water column denitrification is probably of limited importance in theSeine fluvial and upper tidal estuarine sectors because oxic conditions arealways maintained, benthic denitrification can have a role both in the nitrogenbalance of the Seine river and estuary, and in the emission of N2O, as shownfor other estuaries (Robinson et al., 1998).
306
In this paper, we established the budget of nitrification and denitrification inthe Seine estuary over a long time series (1993–2003) characterized by signifi-cant improvement of the parisian wastewater treatment, in order to (i) quantifynitrogen transformations and (ii) analyse the factors controlling in situ N2Oemission.
Material and methods
Site studied
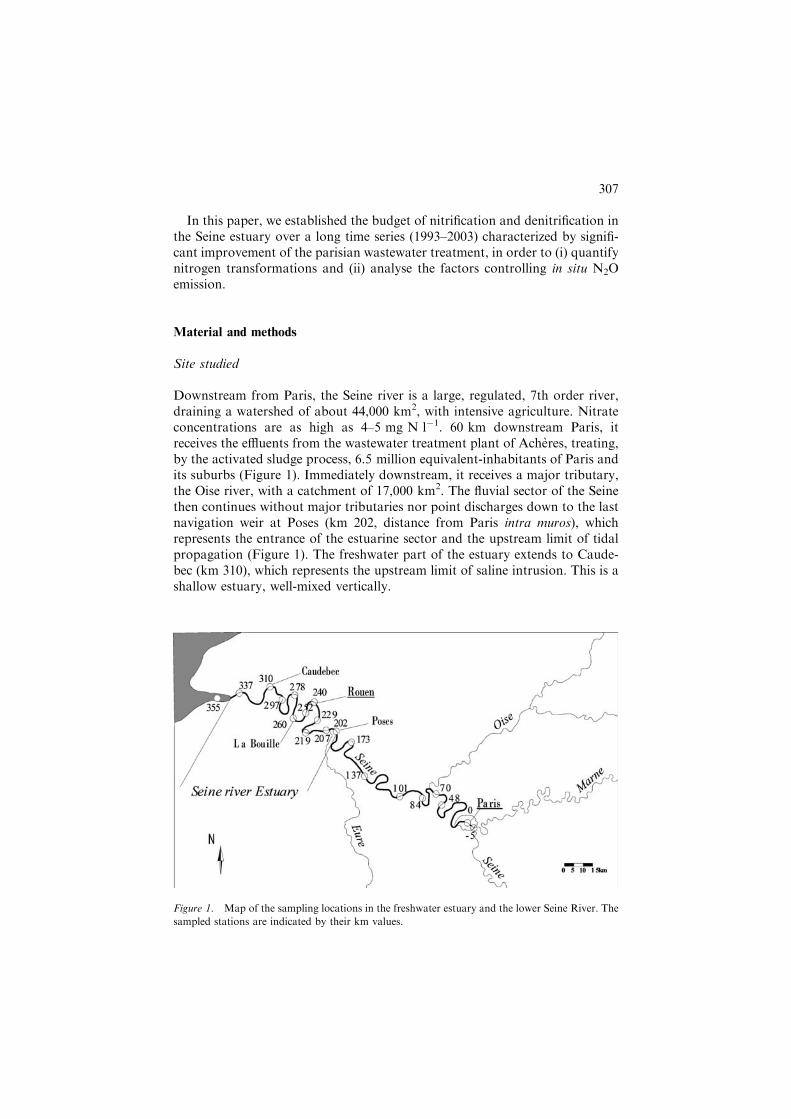
Downstream from Paris, the Seine river is a large, regulated, 7th order river,draining a watershed of about 44,000 km2, with intensive agriculture. Nitrateconcentrations are as high as 4–5 mg N l�1. 60 km downstream Paris, itreceives the effluents from the wastewater treatment plant of Acheres, treating,by the activated sludge process, 6.5 million equivalent-inhabitants of Paris andits suburbs (Figure 1). Immediately downstream, it receives a major tributary,the Oise river, with a catchment of 17,000 km2. The fluvial sector of the Seinethen continues without major tributaries nor point discharges down to the lastnavigation weir at Poses (km 202, distance from Paris intra muros), whichrepresents the entrance of the estuarine sector and the upstream limit of tidalpropagation (Figure 1). The freshwater part of the estuary extends to Caude-bec (km 310), which represents the upstream limit of saline intrusion. This is ashallow estuary, well-mixed vertically.
Figure 1. Map of the sampling locations in the freshwater estuary and the lower Seine River. The
sampled stations are indicated by their km values.
307
Sampling strategy
Two different dataset have been gathered and discussed in this paper, (i) one ata twice monthly frequency at the inlet and outlet of the tidal estuary, (ii)another at 2–3 occasions during summer, for 17 stations covering the wholeprofile from Paris to Honfleur along the fluvial and estuarine sectors of theSeine. Except for N2O, analysed only from 1997 on, all other variables weremeasured according to the same protocols over a 11-year-period from 1993 to2003.
Seasonal sampling. Sampling was carried out at twice-monthly intervals, atthe upstream and downstream limits of the tidal freshwater part of the estuary(Poses and Caudebec, respectively), (Figure 1). Besides classical water-qualityvariables (O2, PO4
�, Si, etc.), the various forms of nitrogen were analysed(NO3
�, NO2�, NH4
+, total organic nitrogen by Kjeldahl N, i.e. dissolved +particulate). The data used here are those from 1993 to 2003, during the periodwhen a comprehensive scientific programme was launched by the RegionHaute Normandie (Seine-Aval programme). Nitrous oxide (N2O) was alsodetermined seasonally at Poses and Caudebec in 1998 and 1999.
Longitudinal summer profiles were obtained at 17 stations from Paris toHonfleur at 2 or 3 occasions during summer (May , July and September). On dayi, sampleswere collected at 7 stations fromSaintMaurice to Poses, on day i+1 at8 stations from Poses to Caudebec, and on day i+2 at 2 stations in the salineestuary. In the river and the upstream part of the estuary (km 0–250), sampleswere collected from bridges with a bucket, while, for the downstream part of theestuary, samples were collected from a ship, 1 m below the surface, with a peri-staltic pump. Samples for dissolvedN2O analysis were immediately collected in apenicillin flask, poisoned with HgCl2 (2%) and stoppered with a rubber septumexcluding any headspace gas. For the othermeasurements and analysis, thewaterwas kept in 10-l containers and brought to the laboratory within 2–4 h aftersampling: activity measurements (see below) were initiated immediately, waterwas filtered and samples were deep frozen until chemical analysis.
Chemical measurements
Inorganic nitrogen. Ammoniumwas measured on filtered water (GF/F 0.7 lm ofporosity) with the indophenol blue method according to Slavyck and McIsaac(1972). Nitrate was also measured on filtered water, after a cadmium reductioninto nitrite, and nitrite was measured with the sulphanilamide methodaccording to Jones (1984). Nitrite was measured prior to cadmium reduction.
Total organic nitrogen was determined according to the Kjeldahl method(Rodier 1984) by difference betweenKjeldahl N and ammonium concentrations.
Nitrous oxide in water samples was determined with a gas chromatograph(Perichrom ST 200) equipped with an electron capture detector, after degassingan aliquot (20 ml) of the water sample.
308
Nitrifying activity was determined by the H14CO3 incorporation method inthe presence of specific nitrification inhibitors, as described by Brion and Billen(1998) and Cebron et al. (2003). About 125 ml of a water sample is incubatedin the dark for 20–24 h with the radiotracer (0.5 lCi ml�1) with and withoutinhibitors (N-serve or Nitrapyrin i.e 2-chloro-6-trichloromethyl pyridine,5 mg l�1 and chlorate, 10 mmol l�1). Five replicate subsamples of 10–20 mlwere filtered on 0.2-lm polycarbonate membrane filters. Radioactivity incor-poration was counted by liquid scintillation. The carbon incorporation rate bythe nitrifying bacteria was calculated by difference between non-inhibited andinhibited samples. As the incubations were carried out in optimum conditions(oxygen: 6 mg l�1; ammonium saturation: 2 mM; pH: 7–8; temperature:20 �C), the values represent potential nitrifying activities. We used the yieldfactor of 0.11 molC molN�1, as determined by Brion and Billen (1998), forcalculating ammonium oxidation from carbon incorporation. Potential nitri-fying activity values in the estuarine sector (downstream from km 202) weremultiplied by a factor of · 2.5 in order to take into account the sampling biaslinked to the propensity of nitrifying bacteria to be attached on particles, asdiscussed in details by Brion et al. (2000).
Flux calculations
The measurements of the nitrogen forms at twice-monthly intervals and ofdaily water fluxes allowed the calculation of the N fluxes at the boundaries ofthe freshwater estuary (Poses-Caudebec) using the procedure described byVerhoff et al. (1980) and recommended by Walling and Webb (1985), andcommonly used for the Seine (Meybeck et al. 1998; Nemery et al. 2005).
Flux ¼ RðCiQiÞ:Qm=RQi;
where Ci, instantaneous concentrations; Qi, corresponding instantaneous waterflux; Qm, mean water flux for the period considered (annual or summer).
These calculations assume that advection fluxes dominate the transfer. It iscertainly so at the upstream limit of the sector, materialized by the weir ofPoses. At the downstream limit, dispersion could play a role in the transfer.However, the choice of the station Caudebec, as a boundary is based onthe fact that the longitudinal concentration gradients are minimal there (seeFigure 3), owing to the fact that nitrification is completed several km upstream,and that sea water intrusion does not reach this point. Consequently, disper-sion terms can be neglected.
The N2O emission flux (kg N m�2 d�1) across the water–air interface wasestimated using the classical gas transfer velocity approach (Frankignoulleet al., 1998; Raymond and Cole, 2001; Abril and Borges, 2004), in which theflux is calculated as the product of a gas transfer velocity (k, in m h�1) by theexcess of dissolved gas concentration over the equilibrium concentration withthe atmosphere (C � Csat). At given temperature and turbulence conditions,
309
the gas transfer velocity, k, is the same for any non reactive gaseous species,except for minor differences in their diffusivities. Previous analysis of theoxygen budget on the Seine estuary (Garnier et al. 2001) allowed to estimatethe gas transfer velocity in the Seine estuary in the range from 0.04 to0.06 m h�1, in agreement with the estimates made by Thibodeaux et al.(1994) for the fluvial part of the Seine River (0.02–0.07 m h�1). These valuesare in good agreement with the mean annual transfer velocity of 0.067 m h�1
estimated by Law et al. (1992) for the Tamar estuary, and with the range of0.03–0.07 m h�1 proposed by Raymond and Cole (2001). The equilibriumconcentration of N2O was calculated on the basis of the relation with tem-perature and salinity established by Weiss and Price (1980), using the meanN2O concentration in the atmosphere of 0.310 ppm by volume (Steffen et al.2004).
Results
Changing conditions in the Seine river and estuary
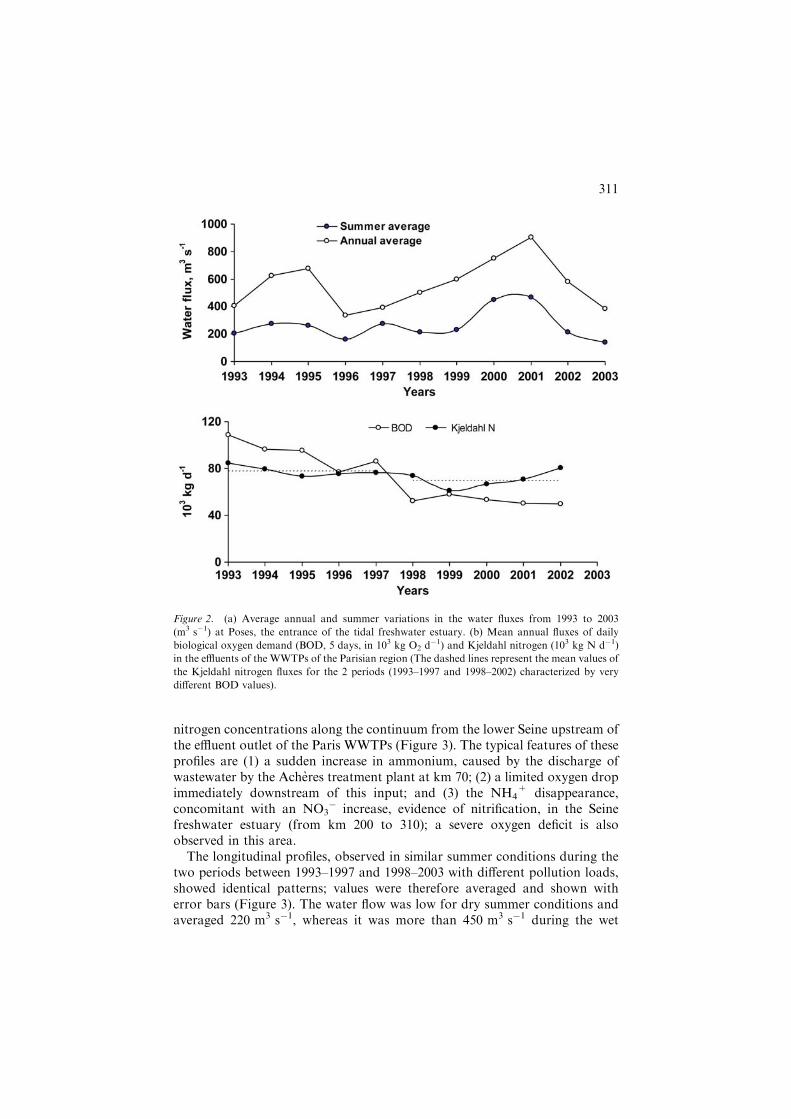
The ten-year-period of study was characterized by changing conditions ofwater fluxes and effluent inputs, major factors controlling the spatial distri-bution and intensity of the biological processes in the lower Seine River(Chesterikoff et al. 1992; Servais and Garnier 1993; Garnier et al. 1995),(Figure 2a, b). The annual and summer average of discharges measured atPoses, shows that the years 1996 and 2003 were particularly dry, whereas theyears 2000 and 2001 were wet (Figure 2a); these differences in the dischargeaffect the residence time of the water bodies and the spatial distribution of theprocesses.
Regarding the treated effluent fluxes of the Paris and suburbs wastewatertreatment plants, a significant improvement during the period of study, from1998 onwards can be observed (Figure 2b). This is evidenced both by thereduced nitrogen load (Kjeldahl) (reduction by 10% on average), which con-trols nitrification, and by the organic carbon load (BOD) (reduction by 40% onaverage), which controls denitrification (Figure 2b). The Acheres wastewatertreatment plant (one of the largest in Europe) represents more than 80% of thepollution by Paris of the lower Seine River. The recent changes are only part ofa long-term plan of improvements in the Paris wastewater treatment (Billenet al. 2001).
Longitudinal summer profiles of oxygen and nitrogen in the estuary andthe lower Seine River
To obtain a better understanding of the ecological functioning of the fresh-water estuary, we have analysed the longitudinal pattern of oxygen and
310
nitrogen concentrations along the continuum from the lower Seine upstream ofthe effluent outlet of the Paris WWTPs (Figure 3). The typical features of theseprofiles are (1) a sudden increase in ammonium, caused by the discharge ofwastewater by the Acheres treatment plant at km 70; (2) a limited oxygen dropimmediately downstream of this input; and (3) the NH4
+ disappearance,concomitant with an NO3
� increase, evidence of nitrification, in the Seinefreshwater estuary (from km 200 to 310); a severe oxygen deficit is alsoobserved in this area.
The longitudinal profiles, observed in similar summer conditions during thetwo periods between 1993–1997 and 1998–2003 with different pollution loads,showed identical patterns; values were therefore averaged and shown witherror bars (Figure 3). The water flow was low for dry summer conditions andaveraged 220 m3 s�1, whereas it was more than 450 m3 s�1 during the wet
Figure 2. (a) Average annual and summer variations in the water fluxes from 1993 to 2003
(m3 s�1) at Poses, the entrance of the tidal freshwater estuary. (b) Mean annual fluxes of daily
biological oxygen demand (BOD, 5 days, in 103 kg O2 d�1) and Kjeldahl nitrogen (103 kg N d�1)
in the effluents of the WWTPs of the Parisian region (The dashed lines represent the mean values of
the Kjeldahl nitrogen fluxes for the 2 periods (1993–1997 and 1998–2002) characterized by very
different BOD values).
311
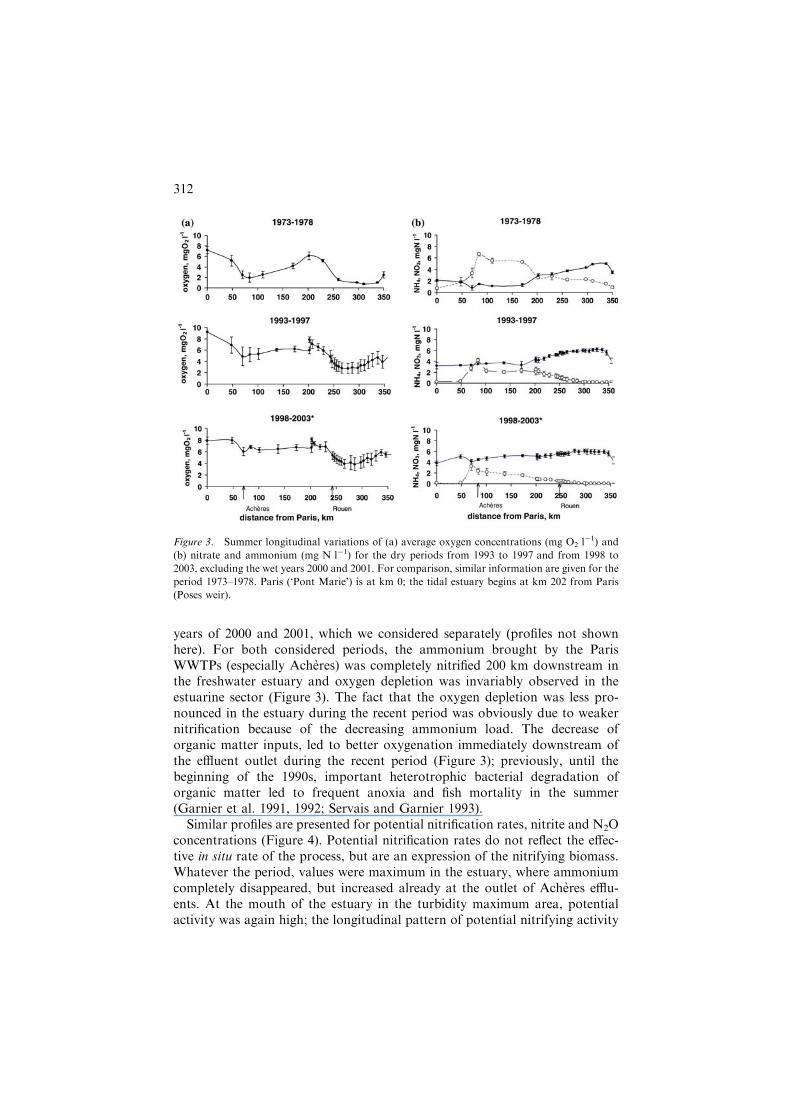
years of 2000 and 2001, which we considered separately (profiles not shownhere). For both considered periods, the ammonium brought by the ParisWWTPs (especially Acheres) was completely nitrified 200 km downstream inthe freshwater estuary and oxygen depletion was invariably observed in theestuarine sector (Figure 3). The fact that the oxygen depletion was less pro-nounced in the estuary during the recent period was obviously due to weakernitrification because of the decreasing ammonium load. The decrease oforganic matter inputs, led to better oxygenation immediately downstream ofthe effluent outlet during the recent period (Figure 3); previously, until thebeginning of the 1990s, important heterotrophic bacterial degradation oforganic matter led to frequent anoxia and fish mortality in the summer(Garnier et al. 1991, 1992; Servais and Garnier 1993).
Similar profiles are presented for potential nitrification rates, nitrite and N2Oconcentrations (Figure 4). Potential nitrification rates do not reflect the effec-tive in situ rate of the process, but are an expression of the nitrifying biomass.Whatever the period, values were maximum in the estuary, where ammoniumcompletely disappeared, but increased already at the outlet of Acheres efflu-ents. At the mouth of the estuary in the turbidity maximum area, potentialactivity was again high; the longitudinal pattern of potential nitrifying activity
Figure 3. Summer longitudinal variations of (a) average oxygen concentrations (mg O2 l�1) and
(b) nitrate and ammonium (mg N l�1) for the dry periods from 1993 to 1997 and from 1998 to
2003, excluding the wet years 2000 and 2001. For comparison, similar information are given for the
period 1973–1978. Paris (‘Pont Marie’) is at km 0; the tidal estuary begins at km 202 from Paris
(Poses weir).
312
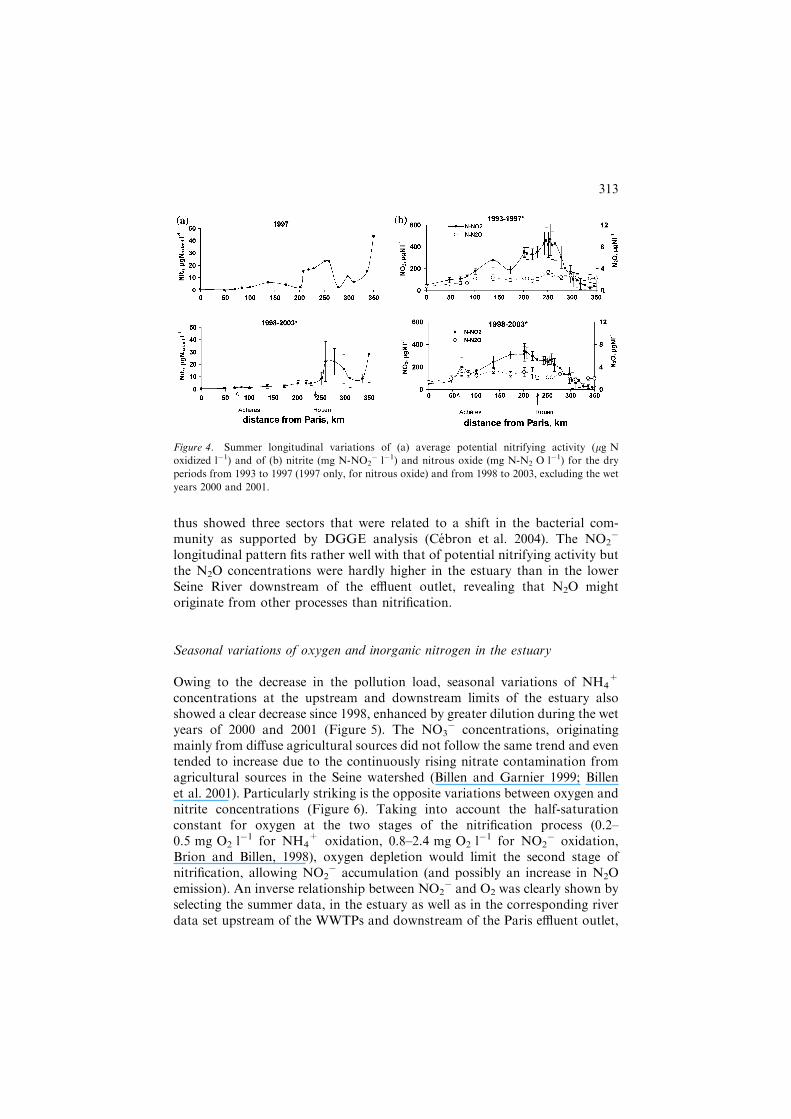
thus showed three sectors that were related to a shift in the bacterial com-munity as supported by DGGE analysis (Cebron et al. 2004). The NO2
�
longitudinal pattern fits rather well with that of potential nitrifying activity butthe N2O concentrations were hardly higher in the estuary than in the lowerSeine River downstream of the effluent outlet, revealing that N2O mightoriginate from other processes than nitrification.
Seasonal variations of oxygen and inorganic nitrogen in the estuary
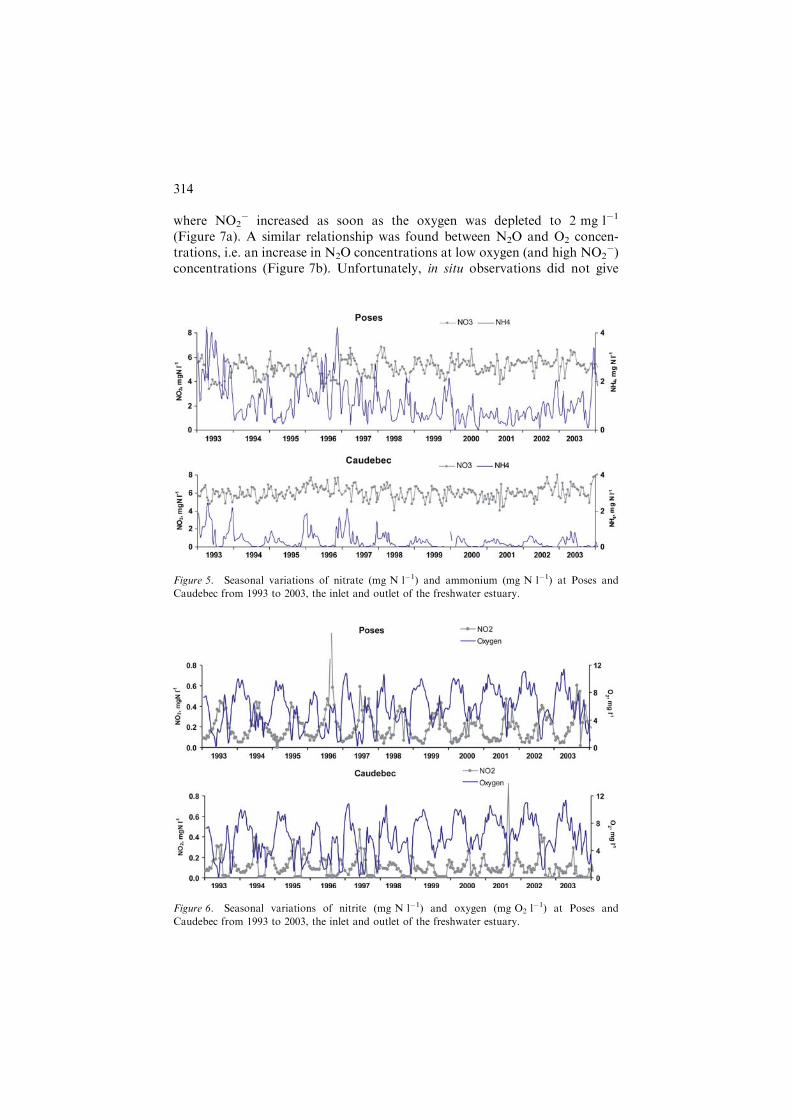
Owing to the decrease in the pollution load, seasonal variations of NH4+
concentrations at the upstream and downstream limits of the estuary alsoshowed a clear decrease since 1998, enhanced by greater dilution during the wetyears of 2000 and 2001 (Figure 5). The NO3
� concentrations, originatingmainly from diffuse agricultural sources did not follow the same trend and eventended to increase due to the continuously rising nitrate contamination fromagricultural sources in the Seine watershed (Billen and Garnier 1999; Billenet al. 2001). Particularly striking is the opposite variations between oxygen andnitrite concentrations (Figure 6). Taking into account the half-saturationconstant for oxygen at the two stages of the nitrification process (0.2–0.5 mg O2 l
�1 for NH4+ oxidation, 0.8–2.4 mg O2 l
�1 for NO2� oxidation,
Brion and Billen, 1998), oxygen depletion would limit the second stage ofnitrification, allowing NO2
� accumulation (and possibly an increase in N2Oemission). An inverse relationship between NO2
� and O2 was clearly shown byselecting the summer data, in the estuary as well as in the corresponding riverdata set upstream of the WWTPs and downstream of the Paris effluent outlet,
Figure 4. Summer longitudinal variations of (a) average potential nitrifying activity (lg N
oxidized l�1) and of (b) nitrite (mg N-NO2� l�1) and nitrous oxide (mg N-N2 O l�1) for the dry
periods from 1993 to 1997 (1997 only, for nitrous oxide) and from 1998 to 2003, excluding the wet
years 2000 and 2001.
313
where NO2� increased as soon as the oxygen was depleted to 2 mg l�1
(Figure 7a). A similar relationship was found between N2O and O2 concen-trations, i.e. an increase in N2O concentrations at low oxygen (and high NO2
�)concentrations (Figure 7b). Unfortunately, in situ observations did not give
Figure 5. Seasonal variations of nitrate (mg N l�1) and ammonium (mg N l�1) at Poses and
Caudebec from 1993 to 2003, the inlet and outlet of the freshwater estuary.
Figure 6. Seasonal variations of nitrite (mg N l�1) and oxygen (mg O2 l�1) at Poses and
Caudebec from 1993 to 2003, the inlet and outlet of the freshwater estuary.
314
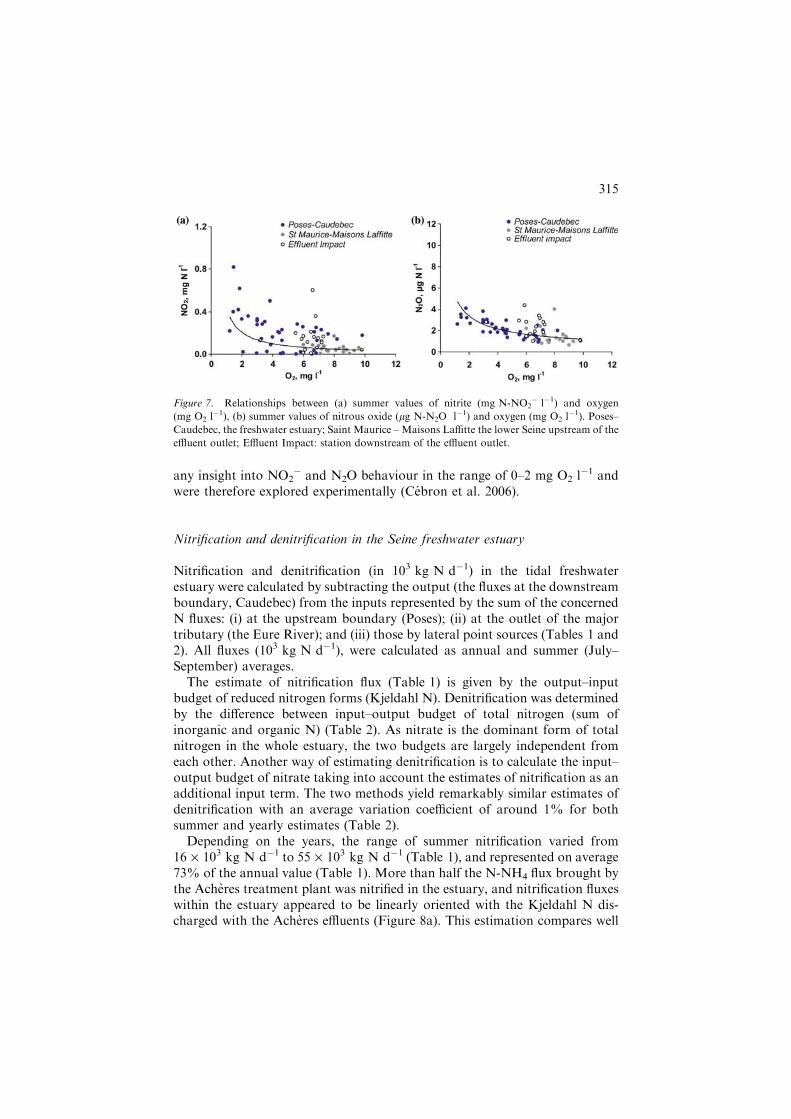
any insight into NO2� and N2O behaviour in the range of 0–2 mg O2 l
�1 andwere therefore explored experimentally (Cebron et al. 2006).
Nitrification and denitrification in the Seine freshwater estuary
Nitrification and denitrification (in 103 kg N d�1) in the tidal freshwaterestuary were calculated by subtracting the output (the fluxes at the downstreamboundary, Caudebec) from the inputs represented by the sum of the concernedN fluxes: (i) at the upstream boundary (Poses); (ii) at the outlet of the majortributary (the Eure River); and (iii) those by lateral point sources (Tables 1 and2). All fluxes (103 kg N d�1), were calculated as annual and summer (July–September) averages.
The estimate of nitrification flux (Table 1) is given by the output–inputbudget of reduced nitrogen forms (Kjeldahl N). Denitrification was determinedby the difference between input–output budget of total nitrogen (sum ofinorganic and organic N) (Table 2). As nitrate is the dominant form of totalnitrogen in the whole estuary, the two budgets are largely independent fromeach other. Another way of estimating denitrification is to calculate the input–output budget of nitrate taking into account the estimates of nitrification as anadditional input term. The two methods yield remarkably similar estimates ofdenitrification with an average variation coefficient of around 1% for bothsummer and yearly estimates (Table 2).
Depending on the years, the range of summer nitrification varied from16 · 103 kg N d�1 to 55 · 103 kg N d�1 (Table 1), and represented on average73% of the annual value (Table 1). More than half the N-NH4 flux brought bythe Acheres treatment plant was nitrified in the estuary, and nitrification fluxeswithin the estuary appeared to be linearly oriented with the Kjeldahl N dis-charged with the Acheres effluents (Figure 8a). This estimation compares well
Figure 7. Relationships between (a) summer values of nitrite (mg N-NO2� l�1) and oxygen
(mg O2 l�1), (b) summer values of nitrous oxide (lg N-N2O l�1) and oxygen (mg O2 l
�1). Poses–
Caudebec, the freshwater estuary; Saint Maurice – Maisons Laffitte the lower Seine upstream of the
effluent outlet; Effluent Impact: station downstream of the effluent outlet.
315
Table
2.
Budget
ofdenitrification(103kgN
d�1)in
thefreshwaterSeineEstuary,from
1993to
2003,averaged
annualvalues
(year)
andsummer
values
(Sum).
103kgN
d�1
1993
1994
1995
1996
1997
1998
1999
2000
2001
2002
2003
Year
Sum
Year
Sum
Year
Sum
Year
Sum
Year
Sum
Year
Sum
Year
Sum
Year
Sum
Year
Sum
Year
Sum
Year
Sum
Poses
285
136
384
169
424
161
234
110
277
162
344
153
364
139
486
259
488
273
332
135
233
76
Eure
R.
18
12
27
21
26
21
17
12
19
15
23
17
24
15
29
20
29
20
23
15
19
13
Lat.inputs
36
36
36
36
22
22
22
22
20
20
20
20
20
20
20
20
20
20
20
20
20
20
Totalinputs
340
184
448
226
472
204
273
144
316
198
387
190
408
175
535
299
537
314
375
171
272
109
Output
(Caudebec)
282
153
396
165
361
163
194
110
215
159
346
155
334
128
411
248
462
265
340
142
243
82
Denitrification
�58�31�52�61�111�41�79�34�101�39�41�35�74�47�124�51�75�49�35�29�29�27
Denitrification-nit�60�32�69�66�111�41�79�33�101�38�40�36�75�48�124�51�77�50�36�30�29�29
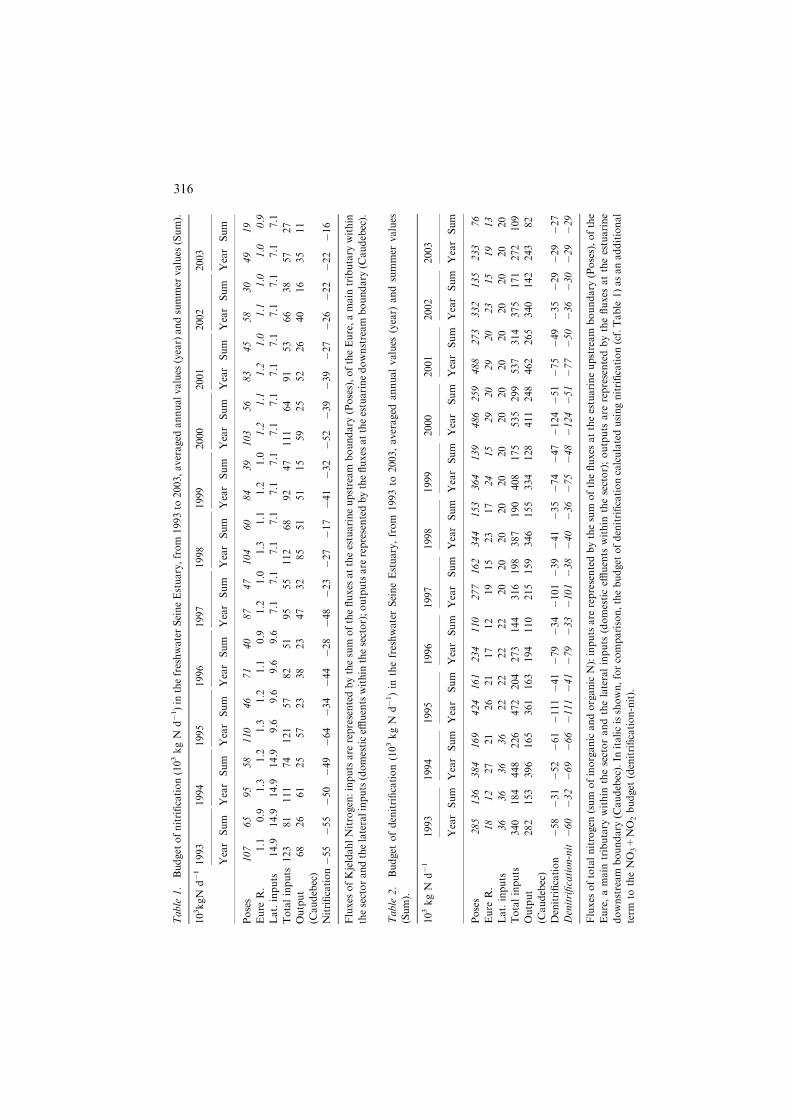
Fluxes
oftotalnitrogen
(sum
ofinorganicandorganicN):inputsare
representedbythesum
ofthefluxes
attheestuarineupstream
boundary
(Poses),ofthe
Eure,amain
tributary
within
thesectorandthelateralinputs
(domesticeffl
uents
within
thesector);outputs
are
representedbythefluxes
attheestuarine
downstream
boundary
(Caudebec).In
italicisshown,forcomparison,thebudget
ofdenitrificationcalculatedusingnitrification(cf.Table
1)asanadditional
term
totheNO
3+
NO
2budget
(denitrification-nit).
Table
1.
Budget
ofnitrification(103kgN
d�1)in
thefreshwaterSeineEstuary,from
1993to
2003,averaged
annualvalues
(year)andsummer
values
(Sum).
103kgN
d�11993
1994
1995
1996
1997
1998
1999
2000
2001
2002
2003
Year
Sum
Year
Sum
Year
Sum
Year
Sum
Year
Sum
Year
Sum
Year
Sum
Year
Sum
Year
Sum
Year
Sum
Year
Sum
Poses
107
65
95
58
110
46
71
40
87
47
104
60
84
39
103
56
83
45
58
30
49
19
Eure
R.
1.1
0.9
1.3
1.2
1.3
1.2
1.1
0.9
1.2
1.0
1.3
1.1
1.2
1.0
1.2
1.1
1.2
1.0
1.1
1.0
1.0
0.9
Lat.inputs
14.9
14.9
14.9
14.9
9.6
9.6
9.6
9.6
7.1
7.1
7.1
7.1
7.1
7.1
7.1
7.1
7.1
7.1
7.1
7.1
7.1
7.1
Totalinputs
123
81
111
74
121
57
82
51
95
55
112
68
92
47
111
64
91
53
66
38
57
27
Output
68
26
61
25
57
23
38
23
47
32
85
51
51
15
59
25
52
26
40
16
35
11
(Caudebec)
Nitrification�55�55�50�49�64�34�44�28�48�23�27�17�41�32�52�39�39�27�26�22�22�16
Fluxes
ofKjeldahlNitrogen:inputsare
representedbythesum
ofthefluxes
attheestuarineupstream
boundary
(Poses),oftheEure,amain
tributary
within
thesectorandthelateralinputs(domesticeffl
uentswithin
thesector);outputsare
representedbythefluxes
attheestuarinedownstream
boundary
(Caudebec).
316
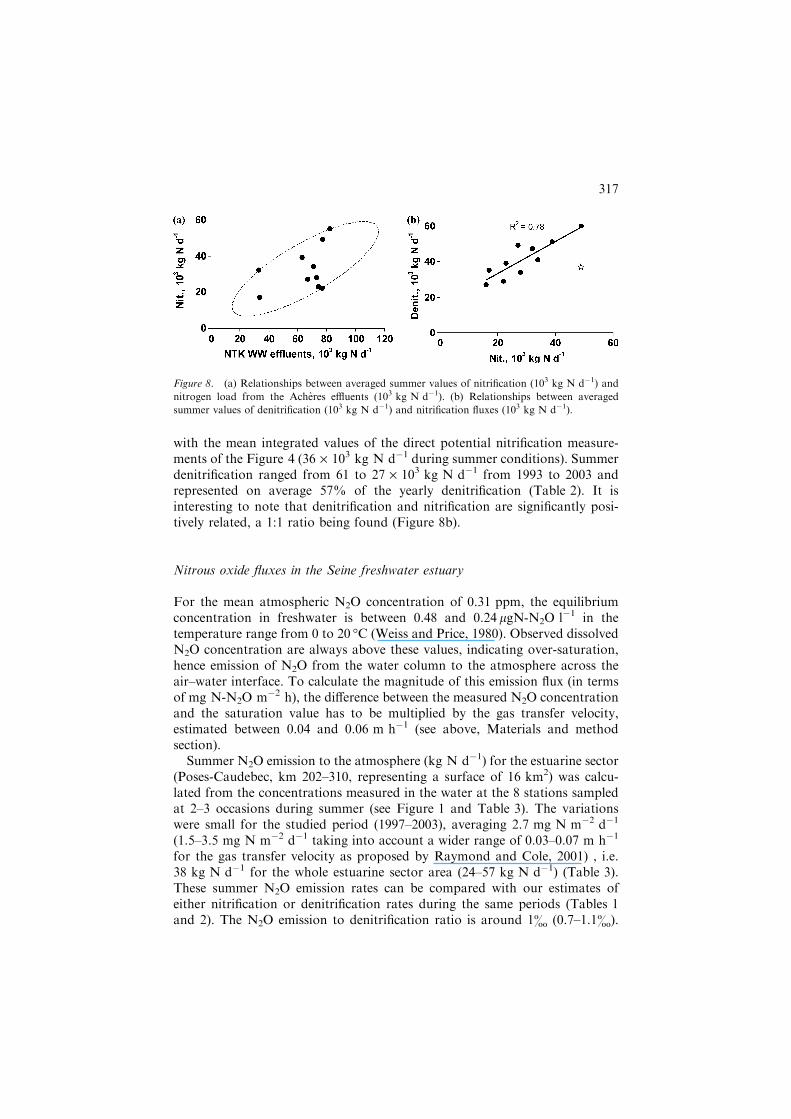
with the mean integrated values of the direct potential nitrification measure-ments of the Figure 4 (36 · 103 kg N d�1 during summer conditions). Summerdenitrification ranged from 61 to 27 · 103 kg N d�1 from 1993 to 2003 andrepresented on average 57% of the yearly denitrification (Table 2). It isinteresting to note that denitrification and nitrification are significantly posi-tively related, a 1:1 ratio being found (Figure 8b).
Nitrous oxide fluxes in the Seine freshwater estuary
For the mean atmospheric N2O concentration of 0.31 ppm, the equilibriumconcentration in freshwater is between 0.48 and 0.24 lgN-N2O l�1 in thetemperature range from 0 to 20 �C (Weiss and Price, 1980). Observed dissolvedN2O concentration are always above these values, indicating over-saturation,hence emission of N2O from the water column to the atmosphere across theair–water interface. To calculate the magnitude of this emission flux (in termsof mg N-N2O m�2 h), the difference between the measured N2O concentrationand the saturation value has to be multiplied by the gas transfer velocity,estimated between 0.04 and 0.06 m h�1 (see above, Materials and methodsection).
Summer N2O emission to the atmosphere (kg N d�1) for the estuarine sector(Poses-Caudebec, km 202–310, representing a surface of 16 km2) was calcu-lated from the concentrations measured in the water at the 8 stations sampledat 2–3 occasions during summer (see Figure 1 and Table 3). The variationswere small for the studied period (1997–2003), averaging 2.7 mg N m�2 d�1
(1.5–3.5 mg N m�2 d�1 taking into account a wider range of 0.03–0.07 m h�1
for the gas transfer velocity as proposed by Raymond and Cole, 2001) , i.e.38 kg N d�1 for the whole estuarine sector area (24–57 kg N d�1) (Table 3).These summer N2O emission rates can be compared with our estimates ofeither nitrification or denitrification rates during the same periods (Tables 1and 2). The N2O emission to denitrification ratio is around 1& (0.7–1.1&).
Figure 8. (a) Relationships between averaged summer values of nitrification (103 kg N d�1) and
nitrogen load from the Acheres effluents (103 kg N d�1). (b) Relationships between averaged
summer values of denitrification (103 kg N d�1) and nitrification fluxes (103 kg N d�1).
317
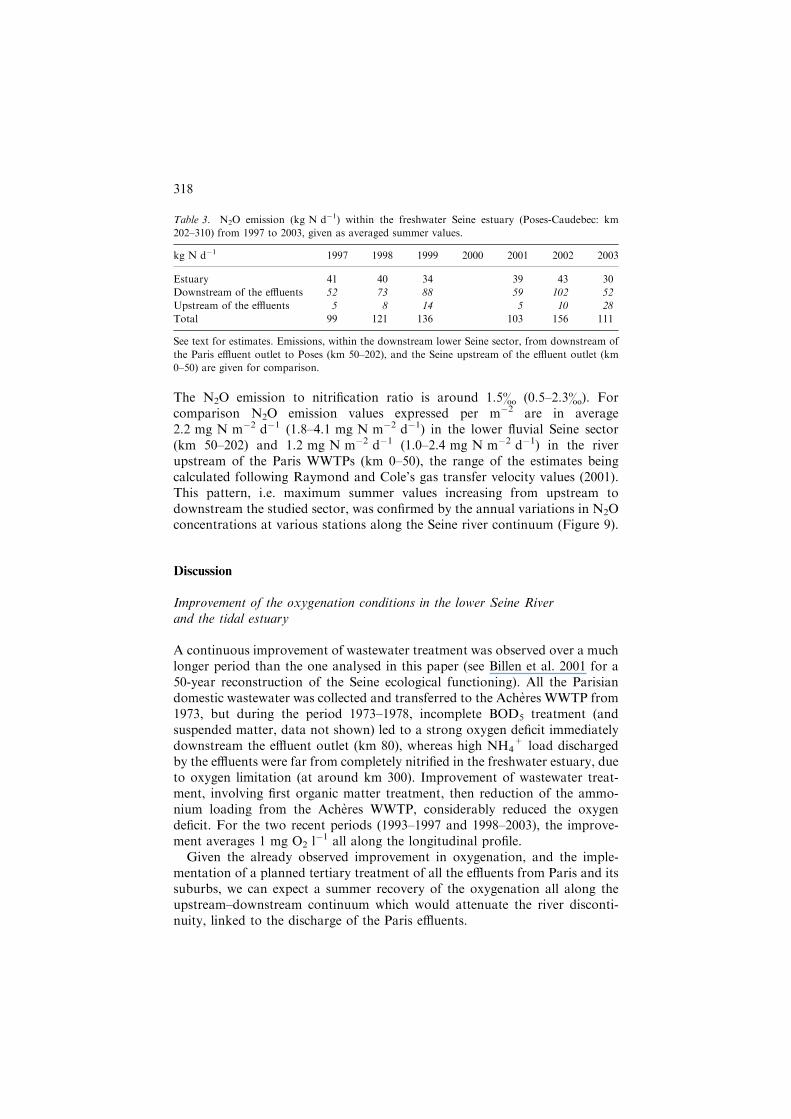
The N2O emission to nitrification ratio is around 1.5& (0.5–2.3&). Forcomparison N2O emission values expressed per m�2 are in average2.2 mg N m�2 d�1 (1.8–4.1 mg N m�2 d�1) in the lower fluvial Seine sector(km 50–202) and 1.2 mg N m�2 d�1 (1.0–2.4 mg N m�2 d�1) in the riverupstream of the Paris WWTPs (km 0–50), the range of the estimates beingcalculated following Raymond and Cole’s gas transfer velocity values (2001).This pattern, i.e. maximum summer values increasing from upstream todownstream the studied sector, was confirmed by the annual variations in N2Oconcentrations at various stations along the Seine river continuum (Figure 9).
Discussion
Improvement of the oxygenation conditions in the lower Seine Riverand the tidal estuary
A continuous improvement of wastewater treatment was observed over a muchlonger period than the one analysed in this paper (see Billen et al. 2001 for a50-year reconstruction of the Seine ecological functioning). All the Parisiandomestic wastewater was collected and transferred to the Acheres WWTP from1973, but during the period 1973–1978, incomplete BOD5 treatment (andsuspended matter, data not shown) led to a strong oxygen deficit immediatelydownstream the effluent outlet (km 80), whereas high NH4
+ load dischargedby the effluents were far from completely nitrified in the freshwater estuary, dueto oxygen limitation (at around km 300). Improvement of wastewater treat-ment, involving first organic matter treatment, then reduction of the ammo-nium loading from the Acheres WWTP, considerably reduced the oxygendeficit. For the two recent periods (1993–1997 and 1998–2003), the improve-ment averages 1 mg O2 l
�1 all along the longitudinal profile.Given the already observed improvement in oxygenation, and the imple-
mentation of a planned tertiary treatment of all the effluents from Paris and itssuburbs, we can expect a summer recovery of the oxygenation all along theupstream–downstream continuum which would attenuate the river disconti-nuity, linked to the discharge of the Paris effluents.
Table 3. N2O emission (kg N d�1) within the freshwater Seine estuary (Poses-Caudebec: km
202–310) from 1997 to 2003, given as averaged summer values.
kg N d�1 1997 1998 1999 2000 2001 2002 2003
Estuary 41 40 34 39 43 30
Downstream of the effluents 52 73 88 59 102 52
Upstream of the effluents 5 8 14 5 10 28
Total 99 121 136 103 156 111
See text for estimates. Emissions, within the downstream lower Seine sector, from downstream of
the Paris effluent outlet to Poses (km 50–202), and the Seine upstream of the effluent outlet (km
0–50) are given for comparison.
318
Budget of nitrification, denitrification and nitrous oxide emission in the tidalestuary
Whereas the results of chemical analyses show a variation of less than 5% onnutrient values, estimates of the water flux vary within about 5–15%.Regarding the lateral input (treated domestic effluents) along the sector, arange of 10–15% also seems reasonable. Overall, the budget of nitrification and
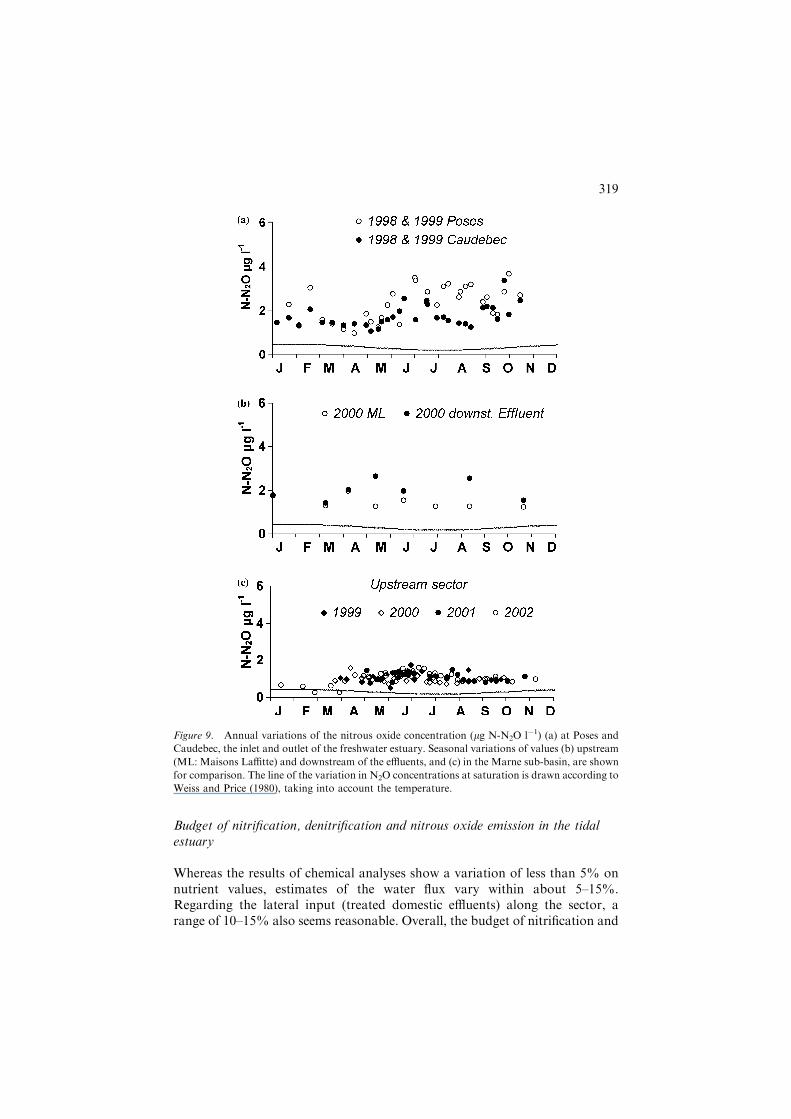
Figure 9. Annual variations of the nitrous oxide concentration (lg N-N2O l�1) (a) at Poses and
Caudebec, the inlet and outlet of the freshwater estuary. Seasonal variations of values (b) upstream
(ML: Maisons Laffitte) and downstream of the effluents, and (c) in the Marne sub-basin, are shown
for comparison. The line of the variation in N2O concentrations at saturation is drawn according to
Weiss and Price (1980), taking into account the temperature.
319
denitrification are given with a maximum variation of 30%. For the nitrousoxide emission, the range of gas transfer velocity values leads to a variation of50%. Year-to-year changes should be interpreted with this limitation in mind.
The budget calculations carried out in the freshwater tidal estuarine sectorshowed that nitrification and denitrification fluxes are of the same order ofmagnitude (Tables 1 and 2). Nitrification occurred mainly during the threesummer months, whereas the period of denitrification was longer. Althoughprevious work using natural isotopic composition of nitrate tended to showthat no significant denitrification occurred in the water column in this sector(Sebilo 2003; Sebilo et al, in press), the budget calculations presented in thisstudy reveal the occurrence of significant denitrification. This apparent con-tradiction can be easily explained if most of the denitrification revealed by ourbudget occurred in the benthic phase. Indeed, benthic denitrification, as it iscontrolled by the nonfractionating process of nitrate diffusion into the anoxicsediment layers, does not cause any significant change in the natural isotopiccomposition of nitrate (Sebilo et al. 2003). Some direct measurements of thebenthic nitrate flux through the water sediment interface allowed Chesterikoffet al. (1992) to estimate a benthic denitrification of at least 3 · 103 kg N d�1 inthe riverine sector downstream of the Acheres WWTP outlet.
The positive relationship between the summer level of nitrification anddenitrification throughout the 11 years, and the similarity of the absolutevalues of the corresponding nitrogen fluxes (Tables 1 and 2) should not lead tothe conclusion that nitrate produced by nitrification was reduced by denitrifi-cation. The relationship should rather be interpreted as the double effect of theimprovement of wastewater treatment which simultaneously leaded to bettersummer conditions of oxygenation and lower organic matter contamination,thus reducing denitrification, while, in parallel, the reduction in ammoniumloading results in decreasing nitrification.
N2O emission fluxes in the freshwater estuary (Table 3) amounted to lessthan 0.1% of both denitrification and nitrification fluxes, in agreement with therange of percentage obtained in laboratory experiments (Kester et al. 1997;Cebron et al. 2006), although our estimates refer to net field ratio, which mayinclude the effect of N2O consumption processes.
Mechanisms and control factors of N2O emission
N2O can be produced by nitrification (nitrifier denitrification) in a narrowrange of low oxygenation, provided that NO2
� is available (Ritchie andNicholas 1972; Goreau et al. 1980; Jorgensen et al. 1984; Bock et al. 1995;Cebron et al. 2006). N2O is also known as a by-product of denitrification ordissimilatory nitrate reduction (Conrad 1996; Kelso et al. 1997). Whichmechanism (nitrification and/or denitrification) is responsible for the N2Oproduction observed in the lower Seine River and estuary, is a question thatrequires further investigations.
320

The present study however reveals a high N2O production in the lower Seineriver and estuary impacted by ammonium effluents. In the Scheldt estuary,where the ammonium contamination is still higher than in the Seine, De Bieet al. (2002) observed an inverse relationship between N2O and oxygen, similarto the one we found in the Seine estuary (Figure 7). However, N2O concen-trations in the Seine estuary were much lower than those in the Scheldt(3 against 8 lg N l�1 respectively at maximum), just as the ammonium con-centration that differed in a rather similar ratio (2 against 4 mg N l�1
respectively at maximum). This result supports the assumption by Seitzingerand Kroeze (1998), of a direct connection between the input of DIN (DissolvedInorganic Nitrogen) to rivers and the output of N2O gas. These results alsosupport the findings by McMahon and Dennehy (1999) on the South PlatteRiver (Colorado) that systems enriched in N by wastewater effluents are animportant anthropogenic source of N2O to the atmosphere. The lower SeineRiver and estuary, with a concentration above 4 mg N-NO3
� l�1 (300 lM) anda N2O emission amounting 0.6 g N m�2 yr�1 (0.4–1.0 g N m�2 yr�1), havevalues in the higher range of those reported for 7 rivers and estuaries (Cole andCaraco 2001). These emissions to the atmosphere are of the same order ofmagnitude as the highest N2O emissions reported for eutrophic lake water(Mengis et al. 1996).
Both nitrite and nitrous oxide concentrations in the water clearly depend onthe oxygenation level, values increasing with decreasing oxygen concentration(see Figure 7). N2O concentrations apparently increase less than those ofNO2
�, probably due to its escape to the atmosphere when the water issupersaturated. However, a scatter of data points demonstrated the complexityof the factors controlling NO2
� and N2O in the water. Because concentrationsin the treated effluents were low (0–1 lg l�1 N-N2O), the N2O present in theriver was necessarily produced in situ. A fraction of the N2O production mightbe due to denitrification occurring below the sediment–water interface, or evenat microsites in suspended aggregates or fluid mud (Bonin and Raymond 1990;Bianchi et al. 1994; Middelburg et al. 1995; Abril et al. 2000; Bonin et al.2002).
It is a priori surprising to find higher NO2� and N2O concentrations at
Poses, the upstream limit of the estuary, than at the downstream limit atCaudebec in similar oxygenation conditions. This may have several explana-tions. The first one would be ammonium limitation at Caudebec where moreintermediate products are consumed than produced whereas at Poses condi-tions for nitrification were nonlimiting. This would argue in favour of nitrifi-cation as the predominant mechanism of N2O emission in the tidal freshwaterestuary. Another hypothesis would be a greater accumulation of biodegradableorganic matter at Poses, which is the limit between the river and the upstreamestuary, where the algal development is generally highest in the summer(Garnier et al. 2001); heterotrophic respiration of organic matter would depletethe oxygen in the bottom sediment layer; in this case, denitrification would beat the origin of the high NO2
� and N2O concentrations.
321
Although nitrification appears to be the dominant process at the origin ofthe N2O emissions within the tidal freshwater estuary, denitrification at theanoxic water–sediment interface would be the major source of the N2O emis-sions in the river immediately downstream of the effluent outlet. The resultinglongitudinal pattern of N2O concentrations in the lower Seine and the fresh-water estuary is therefore a composite one, but the two processes may interferewith each other.
The significance of estuarine N2O emission
Like many estuarine systems receiving high anthropogenic nutrient inputs, theconditions in the lower Seine River and estuary are ideal both for denitrifica-tion at the sediment–water interface and for nitrification in the water column,and consequently likely to contribute significantly to the N2O emissions to theatmosphere (Bange et al. 1996; De Wilde and De Bie 2000).
According to our estimates, the N2O emission in the upper Seine estuaryamounted to about 40 kg N d�1 (Table 3). By adding the contributions of thefluvial riverine sectors, upstream and downstream of the Paris effluent dis-charge, a total emission of 120 kg N-N2O d�1 (90–200 kg N-N2O d�1) wasobtained for the investigated fluvial-estuarine continuum. If we extrapolate theobserved emission rates, namely 1.2–2.2 mg N-N2O m�2 d�1 in average, to thewhole surface of the Seine drainage network (310 · 106 m2, Guerrini et al.1998) a daily emission rate of 370–680 kg N-N2O is obtained for the wholeriver system. Direct measurements of N2O concentrations in small rivers andstreams justify this extrapolation: N2O concentrations remains as high in thehead waters as the ones reported for the sector immediately upstream from theParisian WWTPs (unpublished, see Figure 9). This would indicate that about20–30% of total N2O emissions by the whole hydrographic network occur inits fluvial-estuarine part. The currently available dataset does not, however,allow to estimate the possible role of the processes occurring in the mostupstream sectors of the drainage network, including riparian wetlands.
Global climate scenarios consider that the major part of anthropogenic N2Oemissions is related to agricultural activities and represents, on average 1.25%(range 0.25–2.25%) of the total nitrogen content of applied organic and min-eral fertilizers (IPCC, 2000). Of this, one third is assumed to occur as directemission from agricultural soil, one third is linked to animal waste manage-ment, and one third is due to indirect N2O emissions through ammonium andnitrate losses (IPCC, 2000). Our data on the Seine can be compared to thesegeneral numbers.
The nitrogen fertilizers used in the Seine watershed (75,000 km2) amount to770 · 106 kg N yr�1, mostly (75%) of inorganic fertilizers, as animal farmingin the Seine basin is restricted to the peripheral areas. Direct measurementsof N2O emission from representative cultivated soil, fertilized at a rateof 200 kg N ha�1 yr�1, have revealed mean annual emission rates of
322
0.4–0.8 kg N-N2O ha�1 yr�1 (data cited by Khalil, 2003; Khalil et al., 2004).This would represent the direct emission from agricultural soils themselves,and falls within the range of 0.2–0.4% of the used fertilizer. One canthen propose the range of 1500–3000 · 103 kg N-N2O yr�1 (0.2–0.4% of770 · 106 kg N yr�1) for the total direct emission of N2O from agriculturalsoils in the Seine watershed. The emission from animal waste managementshould be much lower because the agriculture in the Seine watershed specializesmostly in cereal and industrial crops. The above estimate of the ‘indirect’emission from the river network represents an annual flux of 135–250 kgN-N2O yr�1, i.e. about 10% of the direct emission from agricultural soils.
Although speculative, these estimations of N2O production caused byeffluents or originating from agriculture are of major interest for managersresponsible for the implementation of European Water Directive, the stakes forimproving wastewater treatment competing those for changes in agriculturalpractices.
Acknowledgments
This work was undertaken in the framework of the programmes Seine-Aval,funded by the Region Haute-Normandie and the Agence de l’Eau Seine-Normandie (AESN), and the PIREN-Seine funded by the CNRS and severalinstitutions involved in the water management of the Seine River, includingAESN and the Syndicat Interdepartemental pour l’Assainissement de l’Ag-glomeration Parisienne (SIAAP). We are grateful to Dr. L.A. Romana,director of the programme Seine-Aval for his helpful questions and suggestionsduring the study and to the Service de la Navigation de la Seine (SNS), forroutine measurements complementary to those we gathered during the study.Mr Andre Ficht (from the SNS) is particularly acknowledged for his help in thefield. We thank Dr. Jack Middelburg for his useful comments and questionsthat helped to improve the earlier versions of this paper. Two other anonymousreviewers are also acknowledged.
References
Abril G., Riou S.A., Etcheber H., Frankignoulle M., De Witt R. and Middelburg J.J. 2000.
Transient, tidal time-scale, nitrogen transformations in an estuarine turbidity maximum-fluid
mud system (The Gironde, South West France). Estuar. Coast. Schelf. Sci. 50: 703–715.
Abril G. and Borges A.V. 2004. Carbon dioxide and methane emissions from estuaries. In:
Tremblay A., Varfalvy L., Roehm C. and Garneau M. (eds), Greenhouse Gas Emissions: Fluxes
and Processes, Hydroelectric Reservoirs and Natural Environments. Environmental Science
Series. Springer, Berlin, Heidelberg, New York, pp. 187–207.
Anderson I.C. and Levine J.S. 1986. Relative rates of nitric oxide and nitrous oxide production by
nitrifiers, denitrifiers and nitrate respirers. Appl. Environ. Microb. 51: 938–945.
Bange W.H., Rapsomanikis S. and Andreae M.O. 1996. Nitrous oxide in coastal waters. Global
Biogeochem. Cycles 10: 197–207.
323
Bange W.H. 2000. It’s not a gas. Nature 408: 301–302.
Bianchi M., Bonin P. and Feliatra 1994. Bacterial nitrification and denitrification rates in the
Rhone River Plume (Northwestern Mediterranean Sea). Mar. Ecol. Prog. Ser. 103: 197–202.
Billen G. and Garnier J. 1999. Nitrogen transfers through the Seine drainage network: a budget
based on the application of the Riverstrahler model. Hydrobiologia 410: 139–150.
Billen G., Garnier J., Ficht A. and Cun C. 2001. Modelling the response of water quality in the
Seine Estuary to human activity in its watershed over the last 50 years. Estuaries 24(6): 977–993.
Bock E., Schmidt I., Stuven R. and Zart D. 1995. Nitrogen loss caused by denitrifying Nitroso-
monas cells using ammonium or hydrogen as electron donors and nitrite as electron acceptor.
Arch. Microbiol. 163: 16–20.
Bonin P. and Raymond N. 1990. Effect of oxygen on denitrification in marine sediment.
Hydrobiologia 207: 115–122.
Bonin P., Tamburini C. and Michotey V. 2002. Determination of bacterial processes which are
sources of nitrous oxide production in marine samples. Water Res. 36: 722–732.
Bouwman A.F. 1996. Direct emission of nitrous oxide from agricultural soils. Nutr. Cycling
Agroecosyst. 46: 53–70.
Bouwman A.F., Fung I., Matthews E. and John J. 1993. Global analysis of the potential for N2O
production in natural soils. Global Biogeochem. Cycles 7: 557–597.
Bouwman A.F., Boumans J.M. and Batjes N.H. 2002. Emissions of N2O and NO from fertilised
fields: summary of available measurement data. Global Biogeochem. Cycles 16(4): 6/1–6/12.
Brion N. and Billen G. 1998. Une reevaluation de la methode d’incorporation de 14HCO3- pour
mesurer la nitrification autotrophe et son application pour estimer des biomasses de bacteries
nitrifiantes. Rev. Sci. Eau 11: 283–302.
Brion N., Billen G., Guezennec L. and Ficht A. 2000. Distribution of nitrifying activity in the Seine
river (France) from Paris to the estuary. Estuaries 23: 669–682.
Cebron A., Berthe T. and Garnier J. 2003. Nitrification and nitrifying bacteria in the lower Seine
River and estuary. Appl. Environ. Microb. 69: 7091–7100.
Cebron A., Coci M., Garnier J. and Laanbroek H.J. 2004. DGGE analysis of the ammonia
oxidizing bacterial Community structure in the lower Seine River: impact of the Paris wastewater
effluents. Appl. Environ. Microb. 70: 6726–6737.
Cebron A., Garnier J. and Billen G. 2006. Nitrous oxide production and nitrification kinetics by
natural bacterial communities (the lower Seine River, France). Aquat. Microb. Ecol. (in press).
Chesterikoff A., Garban B., Billen G. and Poulin M. 1992. Inorganic nitrogen dynamics in the
River Seine downstream from Paris. Biogeochemistry 17: 147–164.
Cole J.J. and Caraco N.F. 2001. Emissions of nitrous oxide (N2O) from tidal, freshwater river, the
Hudson River, New York. Environ. Sci. Technol. 35: 991–995.
Conrad R. 1996. Soil microorganisms as controllers of atmospheric trace gases (H2, CO, CH4,
OCS, N2O and NO). Microbiol. Rev. 60: 609–640.
Crutzen P.J. and Ehhalt D.H. 1977. Effects of nitrogen fertilizers and combustion on the strato-
spheric ozone layer. Ambio 6: 112–117.
De Bie M.J.M., Middelburg J.J., Starink M. and Laanbroek H.J. 2002. Factors controlling nitrous
oxide at the microbial community and estuarine scale. Mar. Ecol. Prog. Ser. 240: 1–9.
De Wilde H.P.J. and De Bie M.J.M. 2000. Nitrous oxide in the Scheldt estuary: production by
nitrification and emission to the atmosphere. Mar. Chem. 69: 203–216.
Dong L.F., Nedwell D.B., Underwood G.J.C., Thornton D.C.O. and Rusmana I. 2002. Nitrous
oxide formation in the Colne estuary, England: the central role of nitrite. Appl. Environ.
Microbiol. 40: 526–532.
Frankignoulle M., Abril G., Borges A.V., Bourge I., Canon C., Delille B., Libert E. and Theate
J.M. 1998. Carbon dioxide emission from European estuaries. Science 282: 434–436.
Garcia-Ruiz R., Pattinson S.N. and Whitton B.A. 1998. Kinetic parameters of denitrification in a
river continuum. Appl. Environ. Microb. 64: 2533–2538.
Garnier J., Servais P. and Billen G. 1991. Bacterioplankton in the Seine River: impact of the
parisian urban effluents. Can. J. Microbiol. 38: 56–64.
324
Garnier J., Billen G. and Servais S. 1992. Physiological characteristics and ecological role of small
and large sized bacteria in a polluted river (Seine river, France). Archiv. Hydrobiol. Ergebn.
Limnol. 37: 83–94.
Garnier J., Billen G. and Coste M. 1995. Seasonal succession of diatoms and Chlorophyceae in
the drainage network of the river Seine: observations and modelling. Limnol. Oceanogr. 40:
750–765.
Garnier J., Servais P., Billen G., Akopian M. and Brion N. 2001. The oxygen budget in the Seine
estuary: balance between photosynthesis and degradation of organic matter. Estuaries 24(6):
964–977.
Goreau T.J., Kaplan W.A., Wofsy S.C., McElroy M.B., Valois F.W. and Watson S.W. 1980.
Production of nitrite and N2O by nitrifying bacteria at reduced concentrations of oxygen. Appl.
Environ. Microbiol. 40: 526–532.
Guerrini M.-C., Mouchel J.-M., Meybeck M., Penven M.J., Hubert G. and Muxard T. 1998. Le
bassin de la Seine: la confrontation du rural et de l’urbain. Chapitre 1. In: Meybeck M., De
Marsily G. and Fustec F. (eds.), La Seine en son bassin. Fonctionnement ecologique d’un
systeme fluvial anthropise. Elsevier, Paris, pp. 29–75.
Houghton J.T., Meira Filho L.G., Callander B.A., Harris N., Kattenberg A. and Maskell K. (Eds.)
1996. Climate Change 1995. The Science of Published for Intergovernmental Panel on Climate
Change. Cambridge Univ. Press, pp. 1–572.
Intergovernmental Panel on Climate Change (IPCC) 2000. Special Report on Emissions Scenarios.
Cambridge Univ. Press, pp. 599.
Jones M.N. 1984. Nitrate reduction by shaking with cadmium, alternative to cadmium columns.
Water Res. 18: 643–646.
Jorgensen K.S., Jensen H.B. and Sorensen J. 1984. Nitrous oxide production from nitrification and
denitrification in marine sediment at low oxygen concentration. Can. J. Microbiol. 30: 1073–
1078.
Kelso B.H.L., Smith R.V., Laughtlin R.J. and Lennox D. 1997. Dissimilatory nitrate reduction in
anaerobic sediments leading to nitrite accumulation. Appl. Environ. Microb. 63: 4679–4685.
Kester R.A., De Boer W. and Laanbroek H.J. 1997. Production of NO and N2O by pure cultures
of nitrifying and denitrifying bacteria during changes in aeration. Appl. Environ. Microbiol. 63:
3872–3877.
Khalil K. 2003. Emissions de N2O par nitrification et denitrification a l’echelle de la motte de sol:
effet de la structure du sol, de l’aeration et des activites microbiennes. Ph-D Univ. Pierre & Marie
Curie, 223 pp.
Khalil K., Mary B. and Renault P. 2004. Nitrous oxide production by nitrification and denitrifi-
cation in soil aggregates as affected by O2 concentration. Soil Biol. Biochem. 36: 687–699.
Law C.S., Rees A.P. and Owens N.J.P. 1992. Nitrous oxide: estuarine sources and atmospheric
flux. Estuar. Coast. Shelf Sci. 35: 301–314.
Mengis M., Gachter R. and Wehrli B. 1996. Nitrous oxide emissions to the atmosphere from
artificially oxygenated lake. Limnol. Oceanogr. 41: 548–553.
Meybeck M., Mouchel J.-M., Idlafkih Z., Andreassian V. and Thibert S. 1998. Transfert d’eau, de
matiere dissoute et particulaire dans le reseau fluvial. Chapitre 8. In: Meybeck M., De Marsily G.
and Fustec F. (eds.), La Seine en son bassin. La Seine en son bassin. Fonctionnement ecologique
d’un systeme fluvial anthropise, Paris, pp. 345–387.
Middelburg J.J., Klaver G., Nieuwenhuize J., Markusse R.M., Vlug T. and der Nat F.J.W.A. 1995.
Nitrous oxide emissions from estuarine interdidal sediment. Hydrobiologia 311: 43–55.
Miller L.G., Coutlakis M.D., Oremland R.S. and Ward B.B. 1993. Selective inhibition of
ammonium oxidation and nitrification-linked N2O formation by methyl fluoride and dimethyl
ether. Appl. Environ. Microb. 59: 2457–2464.
McMahon P.B. and Dennehy K.F. 1999. N2O emissions from a nitrogen-enriched river. Environ.
Sci. Technol. 32: 21–25.
Nemery J., Garnier J. and Morel C. 2005. Phosphorus budget in the Marne watershed (France):
urban vs. diffuse sources, dissolved vs. particulate forms. Biogeochemistry 72(1): 35–66.
325
Nevison C.D., Weiss R.F. and Erickson D.J. 1995. Global oceanic emissions of nitrous oxide.
J. Geophys. Res. 100: 809–820.
Poth M. and Focht D.D. 1985. N-15 kinetic analysis of N2O production by Nitrosomonas europaea
– an examination of nitrifier denitrification. Appl. Environ. Microbiol. 49: 1134–1141.
Punshon S. and Moore R.M. 2004. Nitrous oxide production and consumption in a eutrophic
coastal embayment. Mar. Chem. 91: 37–51.
Rasmussen R.A. and Khalil M.A.J. 1986. Atmospheric trace gases: trends and distribution over the
last decade. Science 232: 1623–1624.
Raymond P.A. and Cole J.J. 2001. Gas exchange in rivers and estuaries: choosing a gas transfer
velocity. Estuaries 24: 312–317.
Ritchie G.A. and Nicholas D.J. 1972. Identification of the sources of nitrous oxide produced by
oxidative and reductive processes in Nitrosomonas europaea. Biochem J. 126: 1181–1191.
Robinson A.D., Nedwell D.B., Harrison R.M. and Ogilvie B.G. 1998. Hypernutrified estuaries as a
sources of N2O emission to the atmosphere: the estuary of the River Colne, Essex, UK. Mar.
Ecol. Prog. Ser. 164: 59–71.
Rodier J. (ed.) 1984. L¢analyse de l¢eau. 7eme edition. Dunod, Paris, pp. 1365.
Sebilo M. 2003. Utilisation du tracage isotopique naturel pour caracteriser et quantifier les
processus de nitrification et denitrification a l’echelle du reseau hydrographique de la Seine.
These Doct. Univ, Paris 6, pp. 124.
Sebilo M., Billen G., Grably M. and Mariotti A. 2003. Isotopic composition of nitrate-nitrogen as a
marker of riparian and benthic denitrification at the scale of the whole Seine River system.
Biogeochemistry 63: 35–51.
Sebilo M., Billen G., Mayer B., Billiou D., Grably M., Garnier J. and Mariotti A. Assessing
nitrification and denitrification in the Seine River and estuary using chemical and isotopic
techniques. Ecosystems (in press).
Seitzinger S.P. and Kroeze C. 1998. Global distribution of nitrous oxide production and N inputs
in freshwater and coastal ecosystems. Global Biochem. Cycles 12: 93–113.
Servais P. and Garnier J. 1993. Contribution of heterotrophic bacterial production to the carbon
budget of the River Seine (France). Microb. Ecol. 25: 19–33.
Slavyck G. and McIsaac J.J. 1972. Comparison of two automated ammonium methods in a region
of coastal upwelling. Deep Sea Res. 19: 1–4.
Steffen W., Sanderson A., Tyson P.D., Jager J., Matson P.A., Moore B., Oldfield F., Richardson
K., Schnellnhuber H.J., Turner B.L. and Wasson R.J. 2004. Global Change and the Earth
System. A Planet under Pressure IGBP Series. Springer, Berlin, 336 pp.
Thibodeaux L., Poulin M. and Even S. 1994. A model for enhanced aeration of streams by motor
vessels with application to the river Seine. J. Hazard. Mater. 37: 459–473.
Verhof F.H., Yacksich S.M. and Melfi D.A. 1980. River nutrient and chemical transport estimates.
J. Environ. Eng. Div. ASCE 10: 591–608.
Walling D.E. and Webb W. 1985. Estimating the discharge of contaminants to coastal waters by
rivers: some cautionary comments. Mar. Pollut. Bull. 16: 488–492.
Weiss R.F. and Price B.A. 1980. Nitrous oxide solubility in water and seawater. Mar. Chem. 8:
347–359.
Wrage N., Velthof G.L., BeusichemM.L.V. and Oenema O. 2001. Role of nitrifier denitrification in
the production of nitrous oxide. Soil Biol. Biochem. 33: 1723–1732.
326