New Module 20 Louisa Lorenz1, 2; Grace WK Ho3
27
1 Translation and Psychometric Evaluation of the Chinese Adjustment Disorder – New Module 20 Louisa Lorenz 1, 2 ; Grace W.K. Ho 3 ; Athena C.Y. Chan 3 ; Daniel T. Bressington 3 ; Wai Tong Chien 4 ; Mark Shevlin 5 ; Philip Hyland 6 ; Andreas Maercker 7 ; Thanos Karatzias 8,9 1 Department of Psychology, University of Zurich, Zurich, Switzerland 2 Klinik im Hasel, Stationaere Therapie, Gontenschwil, Switzerland 3 School of Nursing, The Hong Kong Polytechnic University, Hong Kong SAR 4 The Nethersole School of Nursing, The Chinese University of Hong Kong, Hong Kong SAR 5 School of Psychology, Ulster University, Derry, Northern Ireland 6 Department of Psychology, Maynooth University, Kildare, Ireland 7 Department of Psychology, University of Zurich, Zurich, Switzerland 8 Edinburgh Napier University, School of Health & Social Care, United Kingdom 9 NHS Lothian, Rivers Centre for Traumatic Stress, United Kingdom Corresponding Author: Grace W.K. Ho, PhD, RN PQ426, The Hong Kong Polytechnic University, Hung Hom, Hong Kong +852 3400 3918 | [email protected]
-
Upload
khangminh22 -
Category
Documents
-
view
0 -
download
0
Transcript of New Module 20 Louisa Lorenz1, 2; Grace WK Ho3
1
Translation and Psychometric Evaluation of the Chinese Adjustment Disorder – New
Module 20
Louisa Lorenz1, 2; Grace W.K. Ho3; Athena C.Y. Chan3; Daniel T. Bressington3 ;
Wai Tong Chien4; Mark Shevlin5; Philip Hyland6; Andreas Maercker7; Thanos Karatzias8,9
1Department of Psychology, University of Zurich, Zurich, Switzerland
2Klinik im Hasel, Stationaere Therapie, Gontenschwil, Switzerland 3School of Nursing, The Hong Kong Polytechnic University, Hong Kong SAR
4The Nethersole School of Nursing, The Chinese University of Hong Kong, Hong Kong SAR 5School of Psychology, Ulster University, Derry, Northern Ireland
6Department of Psychology, Maynooth University, Kildare, Ireland 7Department of Psychology, University of Zurich, Zurich, Switzerland
8Edinburgh Napier University, School of Health & Social Care, United Kingdom 9NHS Lothian, Rivers Centre for Traumatic Stress, United Kingdom
Corresponding Author:
Grace W.K. Ho, PhD, RN
PQ426, The Hong Kong Polytechnic University, Hung Hom, Hong Kong
+852 3400 3918 | [email protected]
2
Translation and Psychometric Evaluation of the Chinese Adjustment Disorder – New
Module 20
Abstract
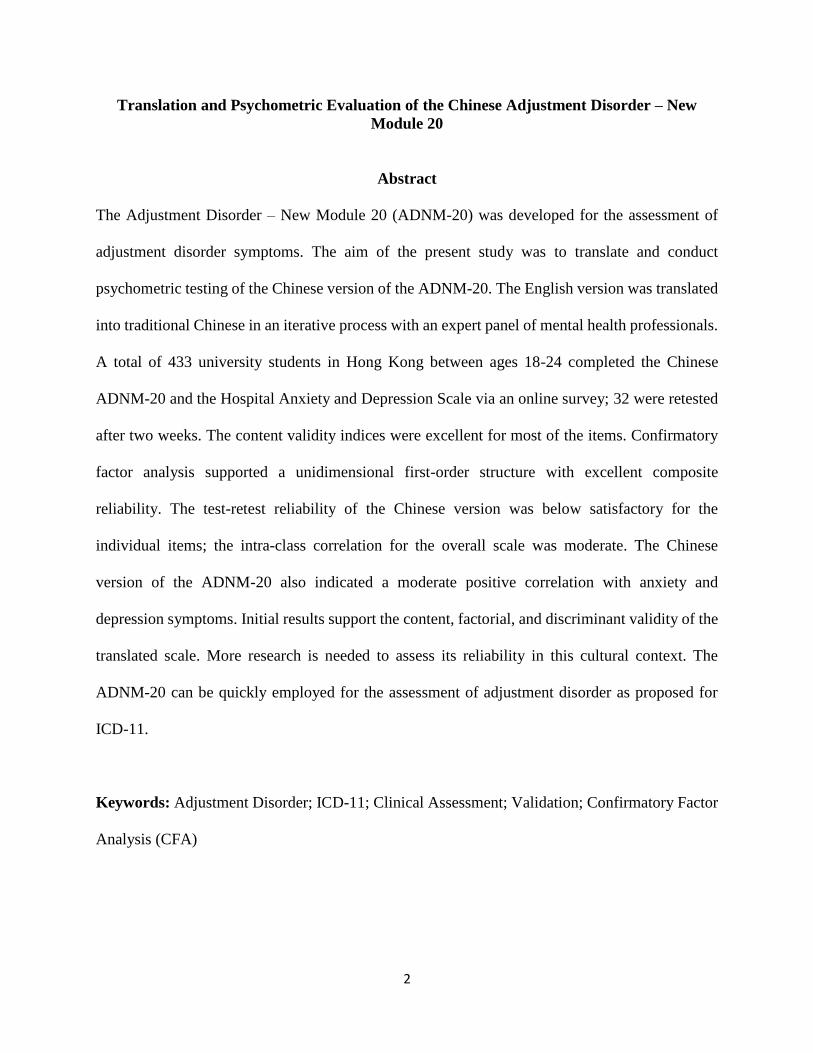
The Adjustment Disorder – New Module 20 (ADNM-20) was developed for the assessment of
adjustment disorder symptoms. The aim of the present study was to translate and conduct
psychometric testing of the Chinese version of the ADNM-20. The English version was translated
into traditional Chinese in an iterative process with an expert panel of mental health professionals.
A total of 433 university students in Hong Kong between ages 18-24 completed the Chinese
ADNM-20 and the Hospital Anxiety and Depression Scale via an online survey; 32 were retested
after two weeks. The content validity indices were excellent for most of the items. Confirmatory
factor analysis supported a unidimensional first-order structure with excellent composite
reliability. The test-retest reliability of the Chinese version was below satisfactory for the
individual items; the intra-class correlation for the overall scale was moderate. The Chinese
version of the ADNM-20 also indicated a moderate positive correlation with anxiety and
depression symptoms. Initial results support the content, factorial, and discriminant validity of the
translated scale. More research is needed to assess its reliability in this cultural context. The
ADNM-20 can be quickly employed for the assessment of adjustment disorder as proposed for
ICD-11.
Keywords: Adjustment Disorder; ICD-11; Clinical Assessment; Validation; Confirmatory Factor
Analysis (CFA)
3
Background
Adjustment disorder (AjD) is defined as the development of emotional and behavioural
symptoms in response to a critical life event (World Health Organization, 1992). A major issue
with the current definition of AjD is that the International Classification of Diseases (ICD), 10th
revision (World Health Organization, 1992), and the Diagnostic and Statistical Manual, 5th
revision (DSM-5; American Psychiatric Association, 2013) do not define clear symptom criteria
for the diagnosis of AjD (Strain & Diefenbacher, 2008). Instead, the diagnosis is made if symptoms
of depressive, anxiety, neurotic, stress-related, somatoform, and/or conduct disorders are present
but do not meet the full threshold of an individual diagnosis (World Health Organization, 1992).
This loose symptom definition led to inadequate assessment methods for AjD (Casey, Dowrick, &
Wilkinson, 2001). Until recently, there were no instruments specifically designed for the
assessment of AjD as a sub-threshold diagnosis (Casey et al., 2001).
During the revision of the ICD and DSM, a new concept of AjD that included a positive
symptom formulation was proposed (A. Maercker, Einsle, & Köllner, 2007). In the course of this
revision, a new self-report questionnaire was developed: the Adjustment Disorder – New Module
(ADNM; A. Maercker et al., 2007). The ADNM contains two parts: the first part consists of a list
of 19 possible critical life events, on which individuals indicate their exposure over the past year;
the second part is a list of possible AjD symptoms in response to the most stressful event. In its
original version, the symptom list contained 29 items (ADNM-29; Einsle, Köllner, Dannemann,
& Maercker, 2010) but with further revision of the scale, the questionnaire was reduced to 20 items
(ADNM-20; Glaesmer, Romppel, Brähler, Hinz, & Maercker, 2015). Both versions measure six
symptoms areas: (1) preoccupation with the stressor (PRE), (2) failure to adapt (FTA), (3)
4
avoidance, (4) depression, (5) anxiety, and (6) impulsivity. The ADNM-20 also includes one item
that measures functional impairment.
A 6-factor structure was supported in prior psychometric testing of the ADNM-29 (Einsle
et al., 2010) and ADNM-20 (Glaesmer et al., 2015). However, due to high first-order factor
correlations, a unidimensional structure was proposed for the ADNM-20 (Glaesmer et al., 2015;
Lorenz, Hyland, Perkonigg, & Maercker, 2018). As ICD-11 only focuses on the core symptoms
(Andreas Maercker et al., 2013), Zelviene, Kazlauskas, Eimontas, and Maercker (2017) proposed
a 2-core factor model for the items reflecting PRE and FTA. During the initial validations, the
ADNM-20 showed sufficiently good reliabilities, with Cronbach’s alphas ranging from α=.81-.94
(L. Lorenz, R. Bachem, & A. Maercker, 2016). Furthermore, Einsle et al. (2010) reported the test-
retest reliability of the ADNM-29 of rtt=.61-.84 over a 6-week interval. Previous studies on the
ADNM-29 also found moderate associations with the Hospital Anxiety and Depression Scale
(Einsle et al., 2010), the Montgomery-Asberg Depression Scale (Bachem, Perkonigg, Stein, &
Maercker, 2017), and the Anxiety Rating Scale (Bachem et al., 2017) as indicators of discriminant
validity.
Although much research has been devoted to understanding and assessing AjD in the past
two decades, most were conducted in Western settings and little attention has been given to
examining AjD in Asian populations. In fact, among the relatively small number of investigations
on AjD in Asian samples, most have primarily focused on Asian Americans rather than native East
Asian groups (Chun & Hsu, 2012). Nonetheless, it is clear that culture can be a strong determinant
for how individuals adjust and respond to stressors. For example, prior studies have reported that
the cultural stigma attached to certain stressors (e.g. divorce and domestic violence) in Chinese
populations may lead to more complicated responses to these stressors, such as suppression of true
5
feelings and fear of social exclusion, which may further lead to denial of maladaptive responses or
preclude overall positive adjustment in the face of those specific stressors (Anderson & Mayes,
2010; Chan, Lam, & Shae, 2011; Chun & Hsu, 2012). Importantly, most studies that examined
maladjustment in Chinese populations were based on measures of other nonspecific psychological
distress (e.g. general depressive or anxiety symptoms, or psychosocial dysfunction) (Gau, Chong,
Chen, & Cheng, 2005; Shek, Chan, & Wong, 2012; Tu, Hsu, Chi, Lin, & Yen, 2014), and no
known instrument specifically designed to assess AjD has been validated for use in Chinese
samples.
The aim of the present study was to develop a Chinese version of the ADNM-20 and to test
its psychometric properties in a convenience sample of Chinese university students. We evaluated
four characteristics of the questionnaire: (1) the content validity of the Chinese translation, (2) the
factor structure of the items, (3) the composite and the test-retest reliability, and (4) the association
of the ADNM-20 with depression and anxiety as discriminant validity of the questionnaire.
Materials and Methods
Phase 1: Chinese Translation and Content Validation
Translation of the ADNM-20 was conducted similar to the steps described by Beaton,
Bombardier, Guillemin, and Ferraz (Beaton, Bombardier, Guillemin, & Ferraz, 2000). The
ADNM-20 was translated from English to traditional Chinese by a bilingual technical writer, and
back-translated by a bilingual study team member. Three other study team members who are
experienced in mental health research independently reviewed the initial forward and backward
translations. Two additional iterations of the translations were generated before a consensus was
reached for the initial draft.
6
The initial translation of the AjD symptom items was assessed for content validity in terms
of their relevance to the theme and their appropriateness to the Chinese culture (Polit & Beck,
2006; Polit, Beck, & Owen, 2007). An expert panel of two mental health researchers, two clinical
psychologists, and two social workers who were not part of the study team rated the relevance and
appropriateness of each translated question on a 4-point Likert scale, ranging from 4 (‘highly
relevant/appropriate’), 3 (‘quite relevant/appropriate’), 2 (‘somewhat relevant/appropriate’), to
1 (‘not relevant/appropriate’). After content validation, the Chinese ADNM-20, including items
on current life stressors and AjD symptoms, was pilot tested with eight young adults recruited
from a university setting, and all eight participants provided positive comments on the clarity,
understandability, and ease of answering the questions. The final translated version of the scale
was deployed for a larger psychometric evaluation.
Phase 2: Psychometric Evaluation
Participants and settings
Young adults aged 18 to 24, who were enrolled in an undergraduate degree program in
Hong Kong, and who were able to read traditional Chinese were eligible to participate in this study.
They were recruited via convenience sampling from two major universities and their affiliated
community colleges in Hong Kong. Flyer with study information were posted on message boards
and distributed around college campuses. Participants entered the study website to answer the
survey questions anonymously. They were asked to supply their contact information if they agreed
to be contacted again for a study follow-up. Among N=433 participants who completed the
Chinese version of the ADNM-20 online, n=32 completed the retest. This retest sample size is
sufficient to detect intra-class correlation of 0.50 or above at 90% power and alpha of 0.05 for 2
observations per subject (Bujang & Baharum, 2017). For the full sample, the mean age of the
7
participants was M=20.16 (SD=1.67). Over half of the participants were female (58.9%) and
approximately half were enrolled in an associate degree program (50.3%). For the retest, the mean
age was M=20.81 (SD=1.70); twenty-four were female (75.8%) and thirteen were associate degree
students (39.4%).
This study was approved by the ethics committee of the Hong Kong Polytechnic
University. MySurvey v1.1 (The Hong Kong Polytechnic University, 2016) was used to collect
data online. The study information included that informed consent was implied by survey
completion, and data was immediately stored in a secure backend database. To complete the
ADNM-20, participants indicated their exposure to a list of 19 life stressors and were asked to
answer the AjD symptom items based on the most straining event(s). Participants also completed
measures of their depression and anxiety. At survey completion, participants may provide their
contact information if they agree to participate in a follow-up survey and/or for a chance to be
entered into a lucky draw to win an electronic tablet. At approximately two weeks after initial
survey, participants who agreed to be contacted again were approached to complete the Chinese
ADNM-20 again.
Measures
The Adjustment Disorder – New Module 20 (Einsle et al., 2010) consists of two parts. First,
participants were asked to indicate exposure to stressful critical life events in the past year that
have burdened them in the past six months from a list of 19 potential stressors. Second, participants
responded to 19 AjD symptom indicators plus 1 item that reflects functional impairment. The
response format is a 4-point Likert scale ranging from 1 (‘never’) to 4 (‘often’); sum scores are
used for either all items or on subscale level.
8
The Hospital Anxiety and Depression Scale (HADS; Zigmond & Snaith, 1983) was used to
measure anxiety and depression for the assessment of convergent and discriminant validity. The
HADS consists of 14 items that are answered on a 4-point Likert scale ranging from 0 to 3 with
response options varying by item. The depression and anxiety subscales include 7 items each, with
higher sum scores reflecting higher levels of symptomatology. The Chinese version of the HADS
was previously validated in Hong Kong samples with regard to factor structure, internal
consistency, retest reliability, and convergent/discriminant validity (Li et al., 2016; Wang, Chair,
Thompson, & Twinn, 2009).
Statistical analysis
Content validity indices were calculated for relevance and appropriateness both by item
and for the overall questionnaire. Item-level analysis was conducted using item content validity
index (I-CVI), which is the proportion of experts who rated the item with a score of 3 or 4 (out of
4) (Polit & Beck, 2006). A modified kappa statistic (k*) was computed to correct for the chance
agreement among experts that might artificially inflate the I-CVI ratings (Polit et al., 2007).
Content validity index for the overall scale (S-CVI) was computed using two methods: (1)
universal agreement (S-CVIUA), which is the proportion of items that received a score of 3 or 4 by
all experts, and (2) an average I-CVI of all scale items (S-CVIAve) (Polit & Beck, 2006). For a
panel of six raters, I-CVI, S-CVIUA, and S-CVIAve are considered good when coefficient exceeds
0.78, 0.80, and 0.90, respectively (Lynn, 1986; Polit & Beck, 2006); k* >0.74 is considered
excellent (Polit et al., 2007).
The factor structure of the ADNM-20 symptom items was investigated using confirmatory
factor analysis. In total, four models that were recently proposed in the literature were tested in the
present study. Three models tested the structure of all 19 symptom indicators, while one model
9
only used the 8 items that are designed to measure PRE, FTA, and functional impairment.
Following the example of Lorenz et al. (2018), a bifactor model with one general factor explaining
covariation across all items (Reise, 2012) would have been tested, if the best fitting first-order
solution was multidimensional. The first model was a single factor solution in which all 19
symptom indicators load on an AjD factor (1-factor model) as proposed by Glaesmer et al. (2015).
The 5-factor model included five correlated general factors reflecting PRE (4 items), FTA (3
items), avoidance (4 items), affective reaction (5 items), and impulsivity (3 items) (Lorenz et al.,
2018). The 6-factor model represented the basic six-factor solution as proposed by Einsle et al.
(2010) and reflected PRE, FTA, avoidance, depression (3 items), anxiety (2 items), and
impulsivity. The model testing the reduced item range, the 2-core-factor model (Zelviene et al.,
2017), contained two factors reflecting PRE and FTA with 4 items each (the item measuring
functional impairment loaded on FTA). All models were tested using Mplus, Version 8.1 (L. K.
Muthén & Muthén, 2017) using the robust weighted least squares, mean- and variance-adjusted
(WLSMV) estimator (Karl G. Jöreskog, 1994; B. O. Muthén, 1997). We followed standard
recommendations for assessing model fit (Jackson, Gillaspy Jr, & Purc-Stephenson, 2009):
Acceptable model fit was defined as a non-significant chi-square, a comparative fit index (CFI)
and Tucker-Lewis Index (TLI) greater than .95. For the Root-Mean Square Error of Approximation
(RMSEA) values less than .05 represent ‘close’ fit and up to .08 indicated ‘reasonable’ errors of
approximation (Karl G Jöreskog & Sörbom, 1993). The same cut-off values were used for the
Standardised Root Mean Square Residual (SRMR) (Karl G Jöreskog & Sörbom, 1981). The fit of
the CFA models was compared using the DIFFTEST procedure in Mplus. The adequacy of models
was also assessed by inspection and interpretation of the parameter estimates: improper solutions
10
or out-of-bounds estimates were considered to be indicative of misspecified models (Chen, Bollen,
Paxton, Curran, & Kirby, 2001).
We computed the composite reliability for the resulting models using the Composite
Reliability Calculator (Colwell, 2016). Test-rest reliability over 2 weeks was assessed by
percentage agreement (PA), with PA≥70% considered satisfactory (Kazdin, 1977). Systematic
disagreement between paired ordinal item scores was further analysed using the rank-invariant
method developed by Svensson (Svensson, 2012). This method estimates the relative position
(RP), i.e. the degree of which the distribution of scores from one assessment is systematically
shifted to a higher or lower score in another assessment, and relative concentration (RC), i.e. the
degree of which the distribution of scores from one assessment is more or less concentrated
towards the central scale categories (Svensson, 2012). Possible values of RP and RC range from -
1 to 1; a higher absolute value of RP implies a greater systematic difference between assessments,
and a higher absolute value of RC implies the score of an assessment is systematically more
concentrated than another assessment. The individual variability was assessed by relative rank
variance (RV), which is defined by the sum squares of rank differences when the ranks are tied to
the pairs of observations (Svensson, 2012); RV<0.1 is generally regarded as negligible. We further
examined test-retest reliability using two-way mixed effects model intra-class correlation
coefficients (ICC; DeVon et al., 2007; Koo & Li, 2016). These analyses were conducted using
STATA IC14.
Lastly, we assessed concurrent and discriminant validity for the best fitting solution for all
19 symptom indicators plus only for the core symptoms. We computed the unique and partial
correlations between each latent variable and the two manifest criterion variables, i.e. depression
and anxiety.
11
Results
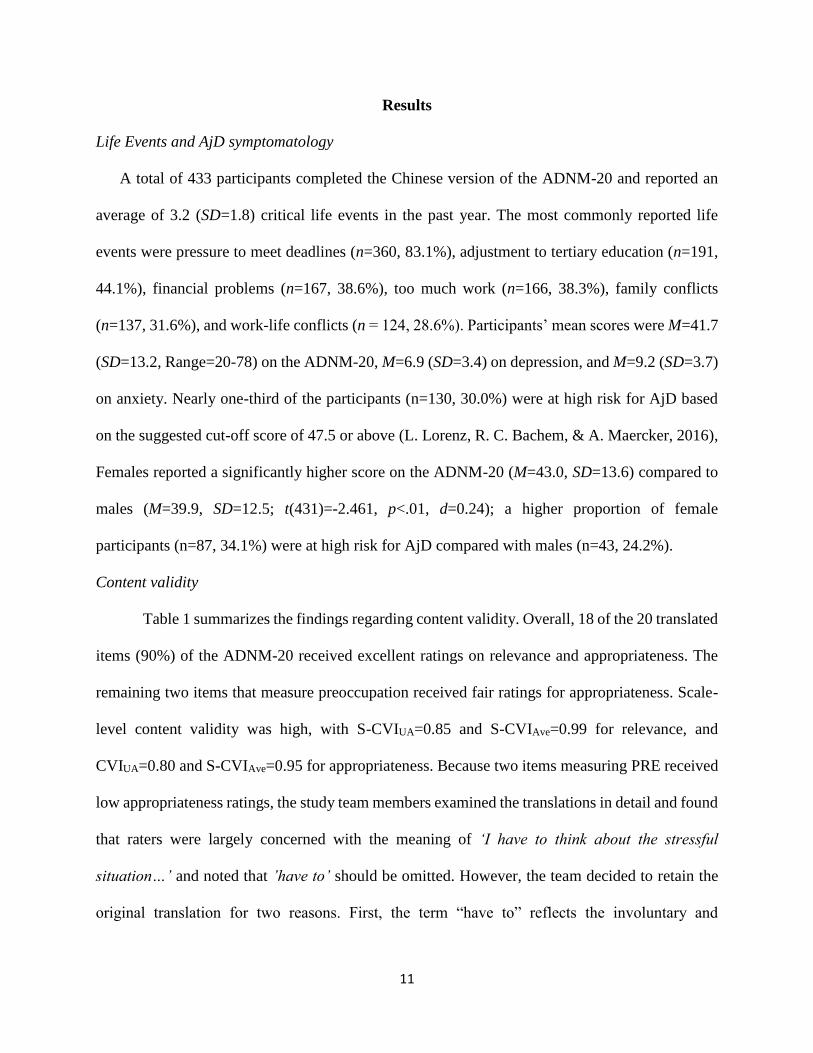
Life Events and AjD symptomatology
A total of 433 participants completed the Chinese version of the ADNM-20 and reported an
average of 3.2 (SD=1.8) critical life events in the past year. The most commonly reported life
events were pressure to meet deadlines (n=360, 83.1%), adjustment to tertiary education (n=191,
44.1%), financial problems (n=167, 38.6%), too much work (n=166, 38.3%), family conflicts
(n=137, 31.6%), and work-life conflicts (n = 124, 28.6%). Participants’ mean scores were M=41.7
(SD=13.2, Range=20-78) on the ADNM-20, M=6.9 (SD=3.4) on depression, and M=9.2 (SD=3.7)
on anxiety. Nearly one-third of the participants (n=130, 30.0%) were at high risk for AjD based
on the suggested cut-off score of 47.5 or above (L. Lorenz, R. C. Bachem, & A. Maercker, 2016),
Females reported a significantly higher score on the ADNM-20 (M=43.0, SD=13.6) compared to
males (M=39.9, SD=12.5; t(431)=-2.461, p<.01, d=0.24); a higher proportion of female
participants (n=87, 34.1%) were at high risk for AjD compared with males (n=43, 24.2%).
Content validity
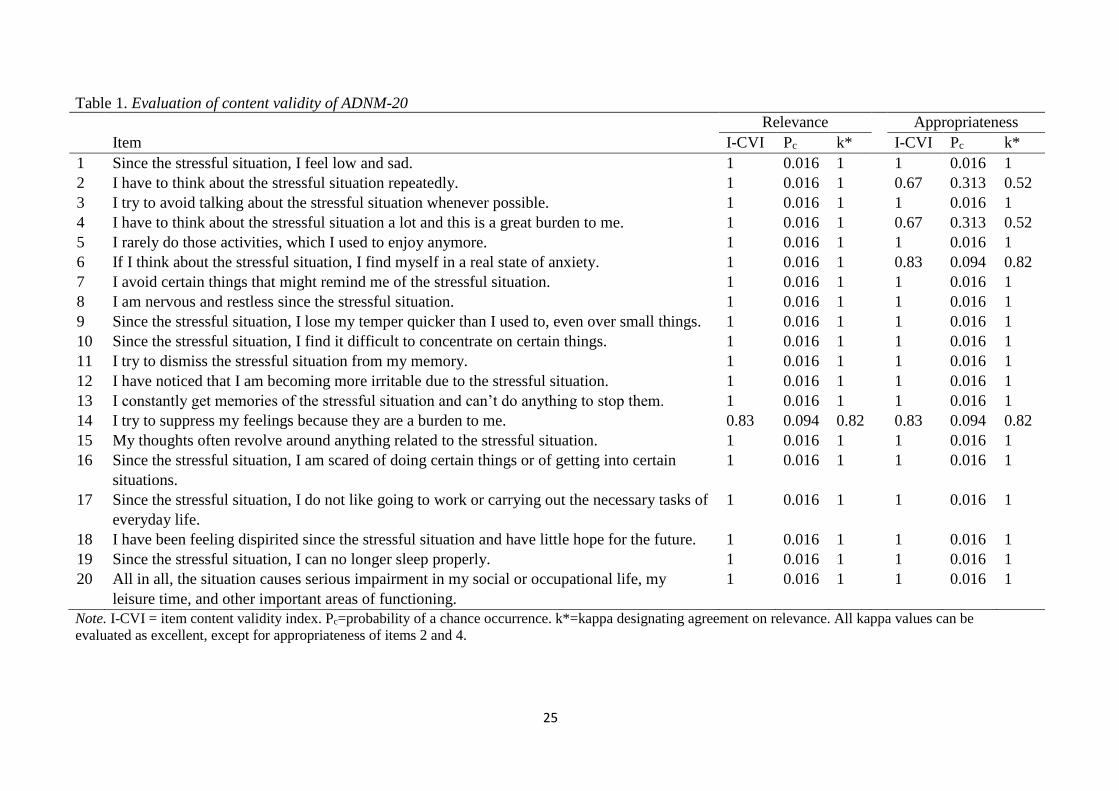
Table 1 summarizes the findings regarding content validity. Overall, 18 of the 20 translated
items (90%) of the ADNM-20 received excellent ratings on relevance and appropriateness. The
remaining two items that measure preoccupation received fair ratings for appropriateness. Scale-
level content validity was high, with S-CVIUA=0.85 and S-CVIAve=0.99 for relevance, and
CVIUA=0.80 and S-CVIAve=0.95 for appropriateness. Because two items measuring PRE received
low appropriateness ratings, the study team members examined the translations in detail and found
that raters were largely concerned with the meaning of ‘I have to think about the stressful
situation…’ and noted that ’have to’ should be omitted. However, the team decided to retain the
original translation for two reasons. First, the term “have to” reflects the involuntary and
12
uncontrollable nature of preoccupation and, second, the term was retained to ensure translational
equivalence between the English and Chinese versions.
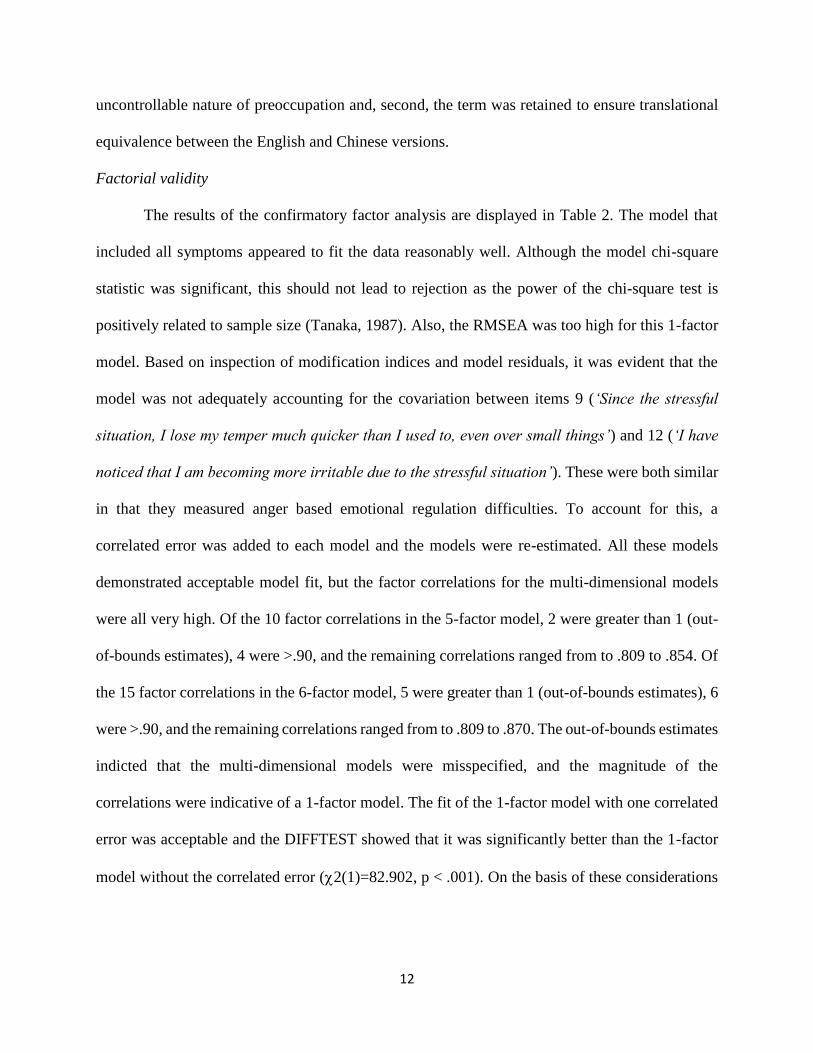
Factorial validity
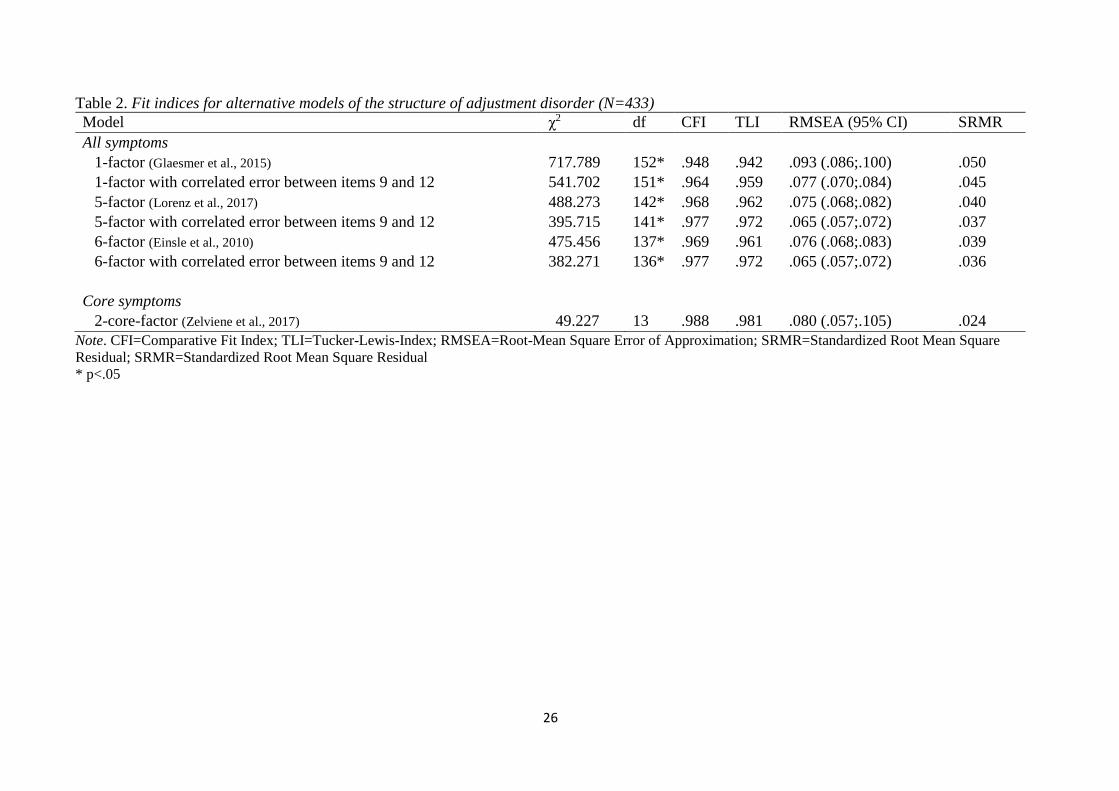
The results of the confirmatory factor analysis are displayed in Table 2. The model that
included all symptoms appeared to fit the data reasonably well. Although the model chi-square
statistic was significant, this should not lead to rejection as the power of the chi-square test is
positively related to sample size (Tanaka, 1987). Also, the RMSEA was too high for this 1-factor
model. Based on inspection of modification indices and model residuals, it was evident that the
model was not adequately accounting for the covariation between items 9 (‘Since the stressful
situation, I lose my temper much quicker than I used to, even over small things’) and 12 (‘I have
noticed that I am becoming more irritable due to the stressful situation’). These were both similar
in that they measured anger based emotional regulation difficulties. To account for this, a
correlated error was added to each model and the models were re-estimated. All these models
demonstrated acceptable model fit, but the factor correlations for the multi-dimensional models
were all very high. Of the 10 factor correlations in the 5-factor model, 2 were greater than 1 (out-
of-bounds estimates), 4 were >.90, and the remaining correlations ranged from to .809 to .854. Of
the 15 factor correlations in the 6-factor model, 5 were greater than 1 (out-of-bounds estimates), 6
were >.90, and the remaining correlations ranged from to .809 to .870. The out-of-bounds estimates
indicted that the multi-dimensional models were misspecified, and the magnitude of the
correlations were indicative of a 1-factor model. The fit of the 1-factor model with one correlated
error was acceptable and the DIFFTEST showed that it was significantly better than the 1-factor
model without the correlated error (2(1)=82.902, p < .001). On the basis of these considerations
13
the 1-factor model was considered the best model1 . An exploratory factor analysis was also
conducted using WLSMV estimation and the eigenvalues for the sample correlation matrix
indicated only 2 factors with an eigenvalue > 1 (factor 1 =10.470, factor 2 =1.258) and the loadings
for all items on first factor were all higher than the loadings on the second factor based on the
Geomin rotated solution. This provided more evidence for the unidimensional structure of the
scale.
With regard to the core symptoms, the 2-core-factor model exhibited acceptable model fit
across the majority of indices. All items showed positive and statistical significant factor loadings
on their respective factors. The PRE and FTA factor correlated at r=.92.
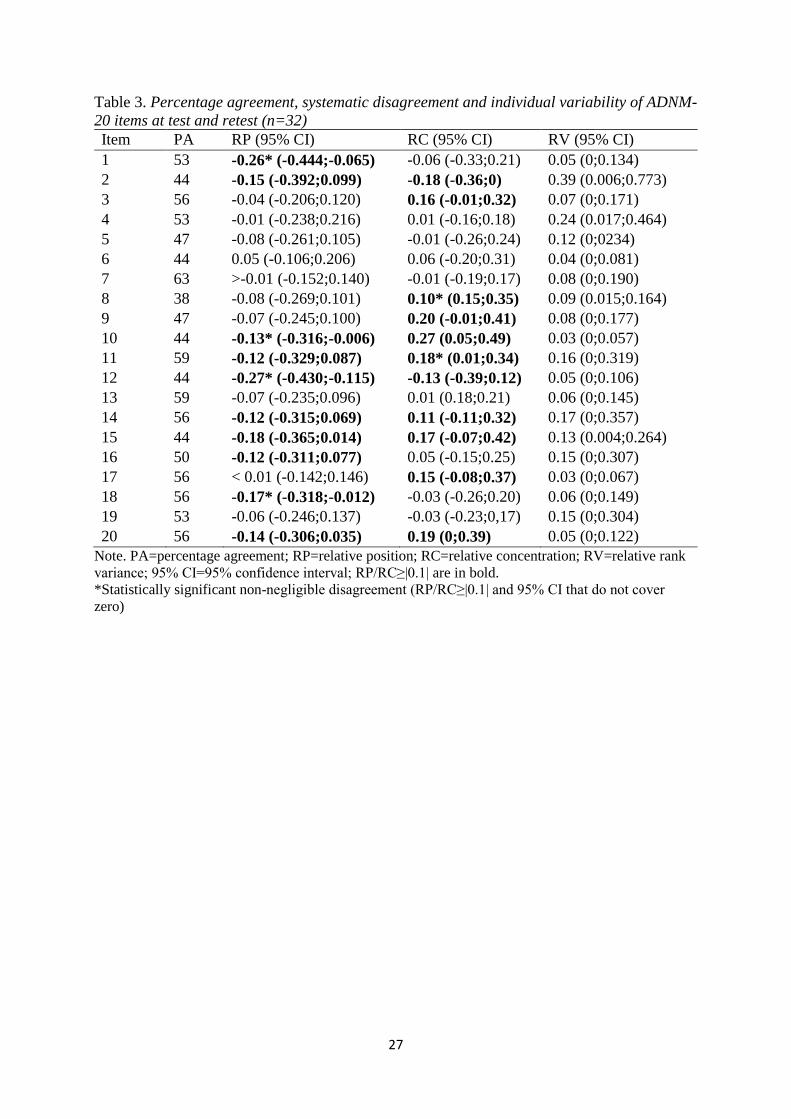
Reliability
The composite reliability of the 1-factor model was excellent with CR=.96. For the 2-core-
factor model, composite reliability was high with CR=.88 for PRE and CR=.75 for FTA. Table 3
summarizes the findings regarding test-retest reliability. The time between assessments ranged
from 14 to 31 days (M=22.2, SD=6.2). Overall, PA was below satisfactory (<70%) for all items.
Of the 20 items, six had a small but significant systematic disagreement between responses at
initial test and retest. The ICC for the overall scale was moderate (ICC=0.74 [0.54;0.87]).
Discriminant validity
The AjD factor in the 1-factor model correlated positively and moderately with depression
(r=.54) and anxiety (r=.68). For the 2-core-factor model, PRE showed a weak to moderate positive
association with depression (r=.49) and a moderate positive association with anxiety (r=.66). FTA
was moderately positive associated with both depression (r=.61) and anxiety (r=.67).
14
Discussion
The purpose of this study was to provide a psychometric evaluation of the first Chinese
version of the Adjustment Disorder – New Module 20. Overall, results provide preliminary
indications that the translated ADNM-20 is valid, relevant, and acceptable among young adults in
the Chinese culture. The Chinese translation was created in an iterative process and the content
validity of the items was overall satisfactory. Two items reflecting PRE were criticized because of
a strict wording with more rigid implications (‘have to’), however, they were retained in the
questionnaire. In the further analysis, item 2 evidenced systematic disagreement between test and
retest. As PRE is one of the core symptoms proposed for the diagnostic criteria in ICD-11 (Andreas
Maercker et al., 2013), it might be beneficial to further work on the specific item formulation to
make the questions more acceptable in the Chinese culture.
Confirmatory factor analysis supported a unidimensional first-order model for all 19 symptom
indicators. Since the six-factor model was proposed in the initial validation of the ADNM (Einsle
et al., 2010), several studies have provided evidence for a unidimensional conceptualization of
AjD (Einsle et al., 2010; Lorenz et al., 2018). Our results suggest that the symptoms of
maladjustment to life stressors may also be reflected as a single entity in the Chinese culture.
However, ICD-11 defines PRE and FTA as separate entities (World Health Organisation, 2018)
and, similar to an earlier study (Zelviene et al., 2017), the 2-core factor model showed good fit
with the data and performed well with exogenous variables in the present analysis. Thus, further
work is required to decrease the number of items that describe the core symptoms of the condition.
The specific distinction between PRE and FTA symptoms should be investigated in future studies.
A related issue concerns the contribution of item 20, which is supposed to measure impairment
in functioning. In previous validations, this item loaded on the FTA subscale because interference
15
of the symptoms with everyday functioning is part of the FTA definition (Andreas Maercker et al.,
2013). However, impairment in social, occupational, and other important areas of functioning is
considered as an additional diagnostic requirement for AjD (World Health Organisation, 2018),
which provides a sound rationale to detach item 20 from the FTA subscale (Lorenz et al., 2018).
Therefore, future revisions of the questionnaire should address the issue of measurement conflation
between FTA symptoms that interfere with everyday function and impairment in functioning as
diagnostic criterion.
Recent studies have also investigated the shortening of the ADNM-20 and two brief measures,
the ADNM-8 and the ADNM-4, were developed (Ben-Ezra, Mahat-Shamir, Lorenz, Lavenda, &
Maercker, 2018; Lavenda et al., 2019; Zelviene et al., 2017). The reasoning for the development
of an abbreviated form was to focus on the proposed ICD-11 core symptoms as well as the
evidence for a unidimensional structure in previous studies (Einsle et al., 2010; Lorenz et al.,
2018). Both abbreviations, the ADNM-8 and the ADNM-4, evidenced satisfactory construct
validity, convergent and discriminant validity, and good accordance with the long version (Ben-
Ezra et al., 2018; Lavenda et al., 2019; Zelviene et al., 2017). This study used the longer version
with 20 items to account for cultural differences in the phenomenology of adjustment difficulties.
Since there was again evidence for unidimensionality of the measure in the current study, future
research should focus on the development and testing of an abbreviated ADNM measure for the
Chinese culture.
The test-retest reliability of the Chinese version of the ADNM-20 in this study was not
acceptable. There was a low agreement between the test and retest scores and statistically
significant disagreement in half of the items. One reason for the weak results could lie in the design
of the study. AjD is a condition, in which symptoms are fluctuating and diminishing over time.
16
This could account for the low agreement between test and retest conducted approximately two
weeks apart. Moreover, the first assessment was during the academic year while the second
assessment was during the summer break which could have accounted for lower stress levels at
retest. Hence, present results should be interpreted with caution and future validation should
account for these issues to provide a more robust picture of retest reliability. Lastly, the analysis
regarding discriminant validity of AjD revealed that AjD was moderately associated with anxiety
and depression. This is in line with earlier findings on the association between the ADNM-20 and
the HADS in the initial validation of the ADNM-29 (Einsle et al., 2010) and could be another
indicator of the applicability of the construct to the Chinese culture.
There are also several limitations to the present study. The generalizability of the results to
the Chinese society is limited by the nature of the sample. University students from Hong Kong
do not necessarily reflect the general Chinese population, thus replication with representative
samples of Chinese adults across the socioeconomic and age spectrum is needed. The validation
of a single assessment instrument of AjD does not allow final conclusions about the nature of the
construct in a specific population. Research on AjD is still sparse and further studies should
investigate the nature of AjD by using different means of assessment and in more representative
samples.
Conclusions
Adjustment disorders are highly prevalent in primary care settings. However, there are only
limited standardized assessments for adjustment disorder available. The Adjustment Disorder –
New Module 20 can facilitate the assessment of psychopathology as a result of critical life events.
It is a self-report questionnaire that can be quickly employed and it can be evaluated according to
the current ICD-11 guidelines for adjustment disorder. This can enable a quick assessment of the
17
most relevant symptoms after life stress. The present study provides a significant contribution to
the research of AjD as this was the first study to validate a structured assessment of AjD symptoms
to the Chinese culture. The new conceptualization of AjD as stress-response syndrome was
applicable among University students from Hong Kong and the Chinese version of ADNM-20
showed satisfactory properties regarding its content, factorial, and discriminant validity. More
research is needed to assess its reliability in this cultural context. The translation and validation of
a structured assessment for AjD can facilitate further research into cultural differences of stress-
related psychopathology.
Declarations
Acknowledgements: Not applicable.
Competing interests: The authors declare that they have no competing interests.
Funding details: This study was funded by the Start Up-Fund of The Hong Kong Polytechnic
University [1-ZE7A]
Availability of data and material: The datasets used and/or analyzed during the current study are
available from Grace W.K. Ho on reasonable request.
Biographical note: Louisa Lorenz is at the Department of Psychology, Division of
Psychopathology and Clinical Intervention at University of Zurich. Her interest is in
understanding and assessing adjustment and related disorders. Grace W.K. Ho is an Assistant
Professor at the School of Nursing of The Hong Kong Polytechnic University. She is interested
in understanding childhood adversities, resilience, and their impact on health and development.
Athena C.Y. Chan is a Research Assistant at the School of Nursing of The Hong Kong
Polytechnic University. She is interested in understanding the intergenerational transmission of
parenting behaviors and their impact on children’s psychosocial development. Daniel T.
Bressington is an Assistant Professor at the School of Nursing of The Hong Kong Polytechnic
18
University. He is interested in mental health promotion and health profiles of patients with
severe mental illnesses. Wai Tong Chien is a Professor and Vice Director of Research at The
Nethersole School of Nursing at The Chinese University of Hong Kong. He is interested in
designing and testing interventions for community-resided people with mental health problems
and their families. Mark Shevlin is a Professor of psychology at Ulster University. His research
interests are in the areas of trauma, psychosis, and posttraumatic stress disorder. Philip Hyland
is a Senior Lecturer at the Department of Psychology at Maynooth University. His primary
research area is traumatic stress studies. Andreas Maercker is Professor and Head of Division
for the Department of Psychology – Psychopathology and Clinical Intervention at University of
Zurich. His expertise are in the areas of PTSD, stress-respond syndromes, lifespan
developmental psychopathology, treatment, and e-mental health. Thanos Karatzias is Professor
of Mental Health at Edinburgh Napier University and a Clinical & Health Psychologist at the
Rivers Centre for Traumatic Stress. His research focuses on the effects and treatment of
psychological trauma on physical and mental health in vulnerable populations.
19
References
American Psychiatric Association. (2013). Diagnostic and statistical manual of mental disorders
(DSM-5®): American Psychiatric Pub.
Anderson, E. R., & Mayes, L. C. (2010). Race/ethnicity and internalizing disorders in youth: A
review. Clinical Psychology Review, 30(3), 338-348.
doi:https://doi.org/10.1016/j.cpr.2009.12.008
Bachem, R., Perkonigg, A., Stein, D. J., & Maercker, A. (2017). Measuring the ICD-11
adjustment disorder concept: Validity and sensitivity to change of the Adjustment Disorder –
New Module questionnaire in a clinical intervention study. International Journal of Methods
in Psychiatric Research, 26(4), e1545. doi:10.1002/mpr.1545
Beaton, D. E., Bombardier, C., Guillemin, F., & Ferraz, M. B. (2000). Guidelines for the process
of cross-cultural adaptation of self-report measures. Spine, 25(24), 3186-3191.
Ben-Ezra, M., Mahat-Shamir, M., Lorenz, L., Lavenda, O., & Maercker, A. (2018). Screening of
adjustment disorder: Scale based on the ICD-11 and the Adjustment Disorder New Module.
Journal of Psychiatric Research, 103, 91-96.
doi:https://doi.org/10.1016/j.jpsychires.2018.05.011
Bujang, M. A., & Baharum, N. (2017). A simplified guide to determination of sample size
requirements for estimating the value of intraclass correlation coefficient: a review. Archives
of Orofacial Science, 12(1).
Casey, P., Dowrick, C., & Wilkinson, G. (2001). Adjustment disorders: Fault line in the
psychiatric glossary. British Journal of Psychiatry, 179(6), 479-481.
doi:10.1192/bjp.179.6.479
20
Chan, Y.-c., Lam, G. L. T., & Shae, W.-C. (2011). Children's views on child abuse and neglect:
Findings from an exploratory study with Chinese children in Hong Kong. Child Abuse &
Neglect, 35(3), 162-172. doi:https://doi.org/10.1016/j.chiabu.2010.12.001
Chen, F., Bollen, K. A., Paxton, P., Curran, P. J., & Kirby, J. B. (2001). Improper Solutions in
Structural Equation Models: Causes, Consequences, and Strategies. Sociological Methods &
Research, 29(4), 468-508. doi:10.1177/0049124101029004003
Chun, K. M., & Hsu, J. (2012). Adjustment disorders in Asians. Handbook of Adult
Psychopathology in Asians: Theory, Diagnosis, and Treatment. Oxford University Press,
New York, NY, 328-356.
Colwell, S. R. (2016). The composite reliability calculator. Technical Report.
doi:10.13140/RG.2.1.4298.088
DeVon, H. A., Block, M. E., Moyle‐Wright, P., Ernst, D. M., Hayden, S. J., Lazzara, D. J., . . .
Kostas‐Polston, E. (2007). A psychometric toolbox for testing validity and reliability.
Journal of Nursing scholarship, 39(2), 155-164.
Einsle, F., Köllner, V., Dannemann, S., & Maercker, A. (2010). Development and validation of a
self-report for the assessment of adjustment disorders. Psychology, Health & Medicine,
15(5), 584-595. doi:10.1080/13548506.2010.487107
Gau, S. S. F., Chong, M. Y., Chen, T. H. H., & Cheng, A. T. A. (2005). A 3-Year Panel Study of
Mental Disorders Among Adolescents in Taiwan. American Journal of Psychiatry, 162(7),
1344-1350. doi:10.1176/appi.ajp.162.7.1344
Glaesmer, H., Romppel, M., Brähler, E., Hinz, A., & Maercker, A. (2015). Adjustment disorder
as proposed for ICD-11: Dimensionality and symptom differentiation. Psychiatry Research,
229(3), 940-948. doi:https://doi.org/10.1016/j.psychres.2015.07.010
21
Jackson, D. L., Gillaspy Jr, J. A., & Purc-Stephenson, R. (2009). Reporting practices in
confirmatory factor analysis: An overview and some recommendations. Psychological
methods, 14(1), 6-23. doi:http://dx.doi.org/10.1037/a0014694
Jöreskog, K. G. (1994). On the estimation of polychoric correlations and their asymptotic
covariance matrix. Psychometrika, 59(3), 381-389. doi:10.1007/BF02296131
Jöreskog, K. G., & Sörbom, D. (1981). LISREL VI: Analysis of linear structural relationships by
maximum likelihood, instrumental variables, and least squares methods: Scientific Software.
Jöreskog, K. G., & Sörbom, D. (1993). LISREL 8: Structural equation modeling with the
SIMPLIS command language: Scientific Software International.
Kazdin, A. E. (1977). Artifact, bias, and complexity of assessment: The ABCs of reliability.
Journal of Applied Behavior Analysis, 10(1), 141-150.
Koo, T. K., & Li, M. Y. (2016). A Guideline of Selecting and Reporting Intraclass Correlation
Coefficients for Reliability Research. Journal of chiropractic medicine, 15(2), 155-163.
doi:https://doi.org/10.1016/j.jcm.2016.02.012
Lavenda, O., Mahat-Shamir, M., Lorenz, L., Hamama-Raz, Y., Greenblatt-Kimron, L., Pitcho-
Prelorentzos, S., . . . Ben-Ezra, M. (2019). Revalidation of Adjustment Disorder-New
Module-4 screening of adjustment disorder in a non-clinical sample: Psychometric
reevaluation and correlates with other ICD-11 mental disorders. Psych J, 8(3), 378-385.
doi:10.1002/pchj.286
Li, Q., Lin, Y., Hu, C., Xu, Y., Zhou, H., Yang, L., & Xu, Y. (2016). The Chinese version of
hospital anxiety and depression scale: Psychometric properties in Chinese cancer patients and
their family caregivers. European Journal of Oncology Nursing, 25, 16-23.
doi:https://doi.org/10.1016/j.ejon.2016.09.004
22
Lorenz, L., Bachem, R., & Maercker, A. (2016). The adjustment disorder–new module 20 as a
screening instrument: cluster analysis and cut-off values. The International Journal of
Occupational and Environmental Medicine, 7(4 ), 215-220. doi:doi:
10.15171/ijoem.2016.775
Lorenz, L., Bachem, R. C., & Maercker, A. (2016). The Adjustment Disorder--New Module 20
as a Screening Instrument: Cluster Analysis and Cut-off Values. Int J Occup Environ Med,
7(4), 215-220.
Lorenz, L., Hyland, P., Perkonigg, A., & Maercker, A. (2018). Is adjustment disorder
unidimensional or multidimensional? Implications for ICD-11. International Journal of
Methods in Psychiatric Research, 27(1), e1591. doi:10.1002/mpr.1591
Lynn, M. R. (1986). Determination and quantification of content validity. Nursing research,
35(6), 382-385. doi:10.1097/00006199-198611000-00017
Maercker, A., Brewin, C. R., Bryant, R. A., Cloitre, M., van Ommeren, M., Jones, L. M., . . .
Reed, G. M. (2013). Diagnosis and classification of disorders specifically associated with
stress: proposals for ICD-11. World Psychiatry, 12(3), 198-206. doi:10.1002/wps.20057
Maercker, A., Einsle, F., & Köllner, V. (2007). Adjustment Disorders as Stress Response
Syndromes: A New Diagnostic Concept and Its Exploration in a Medical Sample.
Psychopathology, 40(3), 135-146. doi:10.1159/000099290
Muthén, B. O. (1997). Robust inference using weighted least squares and quadratic estimating
equations in latent variable modeling with categorical and continuous outcomes.
Psychometrika.
Muthén, L. K., & Muthén, B. O. (2017). Mplus User’s Guide (Eighth Edition ed.). Los Angeles,
CA.
23
Polit, D. F., & Beck, C. T. (2006). The content validity index: are you sure you know what's
being reported? Critique and recommendations. Research in nursing & health, 29(5), 489-
497.
Polit, D. F., Beck, C. T., & Owen, S. V. (2007). Is the CVI an acceptable indicator of content
validity? Appraisal and recommendations. Research in nursing & health, 30(4), 459-467.
Reise, S. P. (2012). The Rediscovery of Bifactor Measurement Models. Multivariate Behavioral
Research, 47(5), 667-696. doi:10.1080/00273171.2012.715555
Shek, D. T. L., Chan, E. M. L., & Wong, R. H. Y. (2012). Associations between Pathological
Gambling and Psychiatric Comorbidity among Help-Seeking Populations in Hong Kong. The
Scientific World Journal, 2012, 15. doi:10.1100/2012/571434
Strain, J. J., & Diefenbacher, A. (2008). The adjustment disorders: the conundrums of the
diagnoses. Comprehensive Psychiatry, 49(2), 121-130.
doi:https://doi.org/10.1016/j.comppsych.2007.10.002
Svensson, E. (2012). Different ranking approaches defining association and agreement measures
of paired ordinal data. Statistics in Medicine, 31(26), 3104-3117.
Tanaka, J. S. (1987). "How Big Is Big Enough?": Sample Size and Goodness of Fit in Structural
Equation Models with Latent Variables. Child Development, 58(1), 134-146.
doi:10.2307/1130296
The Hong Kong Polytechnic University. (2016). mySurvey (Version 1.1) [Software]. Retrieved
from https://www.polyu.edu.hk/mysurvey/
Tu, C.-H., Hsu, M.-C., Chi, S.-C., Lin, H.-Y., & Yen, Y.-C. (2014). Routine depression
screening and diagnosing strategy for cancer inpatients. Psycho-Oncology, 23(9), 1057-1067.
doi:10.1002/pon.3547
24
Wang, W., Chair, S. Y., Thompson, D. R., & Twinn, S. F. (2009). A psychometric evaluation of
the Chinese version of the Hospital Anxiety and Depression Scale in patients with coronary
heart disease. Journal of clinical nursing, 18(13), 1908-1915.
World Health Organisation. (2018). International Statistical Classification of Diseases and
Related Health Problems, 11th revision (ICD-11). Retrieved from
https://icd.who.int/browse11/l-m/en
World Health Organization. (1992). The ICD-10 classification of mental and behavioural
disorders: clinical descriptions and diagnostic guidelines: Geneva: World Health
Organization.
Zelviene, P., Kazlauskas, E., Eimontas, J., & Maercker, A. (2017). Adjustment disorder:
Empirical study of a new diagnostic concept for ICD-11 in the general population in
Lithuania. European Psychiatry, 40, 20-25. doi:https://doi.org/10.1016/j.eurpsy.2016.06.009
Zigmond, A. S., & Snaith, R. P. (1983). The hospital anxiety and depression scale. Acta
Psychiatrica Scandinavica, 67(6), 361-370.
25
Table 1. Evaluation of content validity of ADNM-20
Relevance Appropriateness
Item I-CVI Pc k* I-CVI Pc k*
1 Since the stressful situation, I feel low and sad. 1 0.016 1 1 0.016 1
2 I have to think about the stressful situation repeatedly. 1 0.016 1 0.67 0.313 0.52
3 I try to avoid talking about the stressful situation whenever possible. 1 0.016 1 1 0.016 1
4 I have to think about the stressful situation a lot and this is a great burden to me. 1 0.016 1 0.67 0.313 0.52
5 I rarely do those activities, which I used to enjoy anymore. 1 0.016 1 1 0.016 1
6 If I think about the stressful situation, I find myself in a real state of anxiety. 1 0.016 1 0.83 0.094 0.82
7 I avoid certain things that might remind me of the stressful situation. 1 0.016 1 1 0.016 1
8 I am nervous and restless since the stressful situation. 1 0.016 1 1 0.016 1
9 Since the stressful situation, I lose my temper quicker than I used to, even over small things. 1 0.016 1 1 0.016 1
10 Since the stressful situation, I find it difficult to concentrate on certain things. 1 0.016 1 1 0.016 1
11 I try to dismiss the stressful situation from my memory. 1 0.016 1 1 0.016 1
12 I have noticed that I am becoming more irritable due to the stressful situation. 1 0.016 1 1 0.016 1
13 I constantly get memories of the stressful situation and can’t do anything to stop them. 1 0.016 1 1 0.016 1
14 I try to suppress my feelings because they are a burden to me. 0.83 0.094 0.82 0.83 0.094 0.82
15 My thoughts often revolve around anything related to the stressful situation. 1 0.016 1 1 0.016 1
16 Since the stressful situation, I am scared of doing certain things or of getting into certain
situations.
1 0.016 1 1 0.016 1
17 Since the stressful situation, I do not like going to work or carrying out the necessary tasks of
everyday life.
1 0.016 1 1 0.016 1
18 I have been feeling dispirited since the stressful situation and have little hope for the future. 1 0.016 1 1 0.016 1
19 Since the stressful situation, I can no longer sleep properly. 1 0.016 1 1 0.016 1
20 All in all, the situation causes serious impairment in my social or occupational life, my
leisure time, and other important areas of functioning.
1 0.016 1 1 0.016 1
Note. I-CVI = item content validity index. Pc=probability of a chance occurrence. k*=kappa designating agreement on relevance. All kappa values can be
evaluated as excellent, except for appropriateness of items 2 and 4.
26
Table 2. Fit indices for alternative models of the structure of adjustment disorder (N=433)
Model χ2 df CFI TLI RMSEA (95% CI) SRMR
All symptoms
1-factor (Glaesmer et al., 2015) 717.789 152* .948 .942 .093 (.086;.100) .050
1-factor with correlated error between items 9 and 12 541.702 151* .964 .959 .077 (.070;.084) .045
5-factor (Lorenz et al., 2017) 488.273 142* .968 .962 .075 (.068;.082) .040
5-factor with correlated error between items 9 and 12 395.715 141* .977 .972 .065 (.057;.072) .037
6-factor (Einsle et al., 2010) 475.456 137* .969 .961 .076 (.068;.083) .039
6-factor with correlated error between items 9 and 12 382.271 136* .977 .972 .065 (.057;.072) .036
Core symptoms
2-core-factor (Zelviene et al., 2017) 49.227 13 .988 .981 .080 (.057;.105) .024
Note. CFI=Comparative Fit Index; TLI=Tucker-Lewis-Index; RMSEA=Root-Mean Square Error of Approximation; SRMR=Standardized Root Mean Square
Residual; SRMR=Standardized Root Mean Square Residual
* p<.05
27
Table 3. Percentage agreement, systematic disagreement and individual variability of ADNM-
20 items at test and retest (n=32)
Item PA RP (95% CI) RC (95% CI) RV (95% CI)
1 53 -0.26* (-0.444;-0.065) -0.06 (-0.33;0.21) 0.05 (0;0.134)
2 44 -0.15 (-0.392;0.099) -0.18 (-0.36;0) 0.39 (0.006;0.773)
3 56 -0.04 (-0.206;0.120) 0.16 (-0.01;0.32) 0.07 (0;0.171)
4 53 -0.01 (-0.238;0.216) 0.01 (-0.16;0.18) 0.24 (0.017;0.464)
5 47 -0.08 (-0.261;0.105) -0.01 (-0.26;0.24) 0.12 (0;0234)
6 44 0.05 (-0.106;0.206) 0.06 (-0.20;0.31) 0.04 (0;0.081)
7 63 >-0.01 (-0.152;0.140) -0.01 (-0.19;0.17) 0.08 (0;0.190)
8 38 -0.08 (-0.269;0.101) 0.10* (0.15;0.35) 0.09 (0.015;0.164)
9 47 -0.07 (-0.245;0.100) 0.20 (-0.01;0.41) 0.08 (0;0.177)
10 44 -0.13* (-0.316;-0.006) 0.27 (0.05;0.49) 0.03 (0;0.057)
11 59 -0.12 (-0.329;0.087) 0.18* (0.01;0.34) 0.16 (0;0.319)
12 44 -0.27* (-0.430;-0.115) -0.13 (-0.39;0.12) 0.05 (0;0.106)
13 59 -0.07 (-0.235;0.096) 0.01 (0.18;0.21) 0.06 (0;0.145)
14 56 -0.12 (-0.315;0.069) 0.11 (-0.11;0.32) 0.17 (0;0.357)
15 44 -0.18 (-0.365;0.014) 0.17 (-0.07;0.42) 0.13 (0.004;0.264)
16 50 -0.12 (-0.311;0.077) 0.05 (-0.15;0.25) 0.15 (0;0.307)
17 56 < 0.01 (-0.142;0.146) 0.15 (-0.08;0.37) 0.03 (0;0.067)
18 56 -0.17* (-0.318;-0.012) -0.03 (-0.26;0.20) 0.06 (0;0.149)
19 53 -0.06 (-0.246;0.137) -0.03 (-0.23;0,17) 0.15 (0;0.304)
20 56 -0.14 (-0.306;0.035) 0.19 (0;0.39) 0.05 (0;0.122)
Note. PA=percentage agreement; RP=relative position; RC=relative concentration; RV=relative rank
variance; 95% CI=95% confidence interval; RP/RC≥|0.1| are in bold.
*Statistically significant non-negligible disagreement (RP/RC≥|0.1| and 95% CI that do not cover
zero)