New insights into signaling mechanisms controlling the ...
193
New insights into signaling mechanisms controlling the function and fate of hepatic stellate cells Dissertation This dissertation is submitted for the degree of the Doctor of Philosophy to the Faculty of Mathematics and Natural Sciences at the Heinrich‐Heine‐University Düsseldorf Presented by Saeideh Nakhaeirad from Mashhad, Iran Düsseldorf, November 2015
-
Upload
khangminh22 -
Category
Documents
-
view
1 -
download
0
Transcript of New insights into signaling mechanisms controlling the ...

New insights into signaling mechanisms controlling
the function and fate of hepatic stellate cells
Dissertation
This dissertation is submitted
for the degree of the Doctor of Philosophy
to the Faculty of Mathematics and Natural Sciences
at the Heinrich‐Heine‐University Düsseldorf
Presented by
Saeideh Nakhaeirad
from Mashhad, Iran
Düsseldorf, November 2015

Neue Erkenntnisse über die Signalmechanismen in
der Kontrolle der Funktion und des Schicksals
hepatischer Sternzellen
Inaugural‐Dissertation
zur Erlangung des Doktorgrades
der Mathematisch‐Naturwissenschaftlichen Fakultät
der Heinrich‐Heine‐Universität Düsseldorf
vorgelegt von
Saeideh Nakhaeirad
aus Mashhad, Iran
Düsseldorf, November 2015

Aus dem Institut für Biochemie und Molekularbiologie II
der Heinrich‐Heine‐Universität Düsseldorf
Gedruckt mit der Genehmigung der
Mathematisch‐Naturwissenschaftlichen Fakultät der
Heinrich‐Heine‐Universität Düsseldorf
Referent: Prof. Dr. Reza Ahmadian
Korreferent: Prof. Dr. Vlada Urlacher
Tag der mündlichen Prüfung: 25 May 2016

Table of contents
Summary ........................................................................................................................................ I Zusammenfassung ......................................................................................................................... II Table of Figures ............................................................................................................................ III Abbreviation ................................................................................................................................. IV Chapter I ........................................................................................................................................ 1 General introduction ................................................................................................................. 1 Anatomical units and resident cells of the liver .................................................................... 2 Microanatomy of the liver ................................................................................................. 2
Hallmarks and roles of hepatic stellate cells ......................................................................... 3 Quiescent HSC (qHSC) in the normal liver ......................................................................... 3 Activated HSC (aHSC) after liver injury .............................................................................. 6
Postulated signaling mechanisms in hepatic stellate cells .................................................... 7 RAS superfamily at a glance .............................................................................................. 8 RAS family GTPases ......................................................................................................... 10 Effectors and signaling of RAS proteins ........................................................................... 13 RHO family GTPases ........................................................................................................ 19 Signaling cross‐talk between RHO and RAS GTPases ...................................................... 20
Aims and objectives ................................................................................................................. 23 Chapter II ..................................................................................................................................... 24 The function of embryonic stem cell‐expressed RAS (ERAS), a unique RAS family member, correlates with its additional motifs and its structural properties ......................................... 24
Chapter III .................................................................................................................................... 38 Embryonic stem cell‐expressed ERAS controls quiescence of hepatic stellate cells............... 38
Chapter IV .................................................................................................................................... 39 Classical RHO proteins: biochemistry of molecular switch function and regulation .............. 58
Chapter V ..................................................................................................................................... 73 Functional cross‐talk between RAS and RAS pathways: a RAS‐specific GTPase activating protein (p120RASGAP) competitively inhibits the RHOGAP activity of deleted in liver cancer (DLC) tumor suppressor by masking the catalytic arginine finger ....................... 73
Chapter VI .................................................................................................................................... 85 IQGAP1 interaction with RHO family proteins revisited: kinetic and equilibrium evidence for two distinct binding sites ........................................................................................................ 85
Chapter VII ................................................................................................................................. 117 Juvenile myelomonocytic leukemia displays mutations in components of the RAS pathway and the PRC2 network ........................................................................................................... 117
Chapter VIII ................................................................................................................................ 142 General discussion ................................................................................................................. 142 Biochemical characteristic of embryonic stem cell‐expressed RAS (ERAS) .......................... 144 Signaling network and proposed function of endogenous ERAS in HSC ............................... 146 Functional cross‐talk between RAS and RHO pathways ....................................................... 150 p120GAP links RAS and RHO pathways via p190GAP and DLC1 ....................................... 151 Scaffolding protein IQGAP modulates RHO and RAS signaling ......................................... 152 The coordination of RAS (NRAS) and RHO (RAC2) mutations in tumor progression ........ 154
Concluding remarks ............................................................................................................... 155 References ................................................................................................................................. 157 Acknowledgments ..................................................................................................................... 178 Curriculum Vitae ........................................................................................................................ 180 Eidesstattliche Erklärung zur Dissertation ................................................................................ 183

I
Summary Hepatic stellate cells (HSCs) are non‐parenchymal liver resident cells in the space of Dissé,
which are central to metabolism and storage of retinoids in the body and are involved in liver
development, immunoregulation, homeostasis, regeneration, and fibrosis. In healthy liver,
HSCs are in a state referred as quiescent. After liver injury, HSCs develop into activated HSCs,
which are then able to proliferate, migrate, contract, and differentiate to other liver cell types
and, in this way, contribute to liver regeneration. However, during sustained liver injury HSCs
promote liver fibrosis via excessive extracellular matrix production. The key signaling
networks, which maintain quiescent of HSCs or orchestrate their plasticity toward liver
regeneration or fibrosis need further investigation. The RAS family is central in a network
controlling intracellular signaling pathways, which adopt the cellular responses upon
integration of external stimuli from the neighboring cells and the microenvironment. The
functions and activity of RAS dependent signaling pathways in the fate of HSCs are poorly
understood. This doctoral thesis provides new insights into the expression pattern, isoform
specificity, activity and networking of RAS family members and their signaling components in
both quiescent and activated HSCs. The obtained data revealed a differential expression
pattern for RAS isoforms, where embryonic stem cell‐expressed RAS (ERAS) is specifically
expressed in quiescent HSCs and becomes drastically down‐regulated after HSC activation. In
contrast to ERAS, other members of the RAS family, e.g., MRAS, RRAS, RALA, and RAP2A were
rather up‐regulated upon HSC activation. Comprehensive biochemical studies identified ERAS
as a unique member of the RAS family with remarkable sequence deviations, additional motifs,
and an extended N‐terminal region. The latter appears to be important for the signaling
activity of ERAS. Most remarkably, ERAS revealed a different mode of effector interaction as
compared to classical HRAS signaling, thereby, correlating with deviations in the effector‐
binding site of ERAS. Hence, ERAS signals maintain the HSC quiescent by the inhibition of both
proliferation and apoptosis via various pathways, such as JAK‐STAT3, AKT‐mTORC1‐FOXO1,
mTORC2‐AKT, and RASSF5‐HIPPO. In contrast, activated HSCs exhibited YAP‐CTGF/NOTCH2
and RAS‐RAF‐MEK‐ERK activity, which are involved in HSC proliferation and development.

II
Zusammenfassung
Hepatische Sternzellen (HSCs) sind nicht‐parenchymale, im Dissé'schen Raum der Leber
ansässige Zellen, welche für den Metabolismus und die Speicherung von Retinoiden im Körper
von zentraler Bedeutung sind. HSCs sind wesentlich an der Entwicklung, Immunregulation,
Homöostase, Regeneration, sowie an der Fibrose der Leber beteiligt. In gesundem
Lebergewebe befinden die HSCs sich in einem ruhenden Zustand. Nach einer Leberschädigung
werden sie zu aktivierten HSCs (aHSCs) umprogrammiert und gewinnen dadurch die Fähigkeit
zur Proliferation, Migration, Kontraktion, sowie Differenzierung in andere hepatische
Zelltypen. Somit tragen HSCs wesentlich zur Regeneration der Leber bei. Bei einer anhaltenden
Leberschädigung begünstigen HSCs jedoch durch eine übermäßige Produktion an
extrazellulärer Matrix die Entstehung einer Fibrose. Die zugrundeligenden
(patho)biochemischen Signalkaskaden, welche für die Aufrechterhaltung ruhender HSCs und
deren Aktivierung im Rahmen regenerativer und fibrotischer Prozesse in der Leber
ausschlaggebend sind, waren zu Beginn dieser Arbeit weitestgehend unklar. Die RAS‐
Proteinfamilie spielt eine zentrale Rolle für die Kontrolle intrazellulärer Signalwege, welche
zelluläre Reaktionen entsprechend äußerer Reize benachbarter Zellen und der
Mikroumgebung vermitteln. Die Analysen der Funktionen und die Aktivität RAS‐abhängiger
Signalwege in ruhenden vs. aktivierten HSCs war das Hauptziel dieser Doktorarbeit, die neue
Einblicke in die Expressionsänderung, Isoform‐Spezifizät, Aktivität und die Signalnetzwerke von
Mitgliedern der RAS Proteinfamilie und deren Komponente, sowohl in qHSCs, als auch in
aHSCs, charakterisiert. Hierbei konnte gezeigt werden dass die bisher nur wenig
charakterisierte RAS Isoform ERAS (embryonic stem cell‐expressed RAS) spezifisch in qHSCs
exprimiert wird und nach deren Aktivierung im Gegensatz zu allen anderen RAS‐Isoformen
drastisch runterreguliert wird. MRAS, RRAS, RALA und RAP2A wurden dagegen nach HSC‐
Aktivierung hochreguliert. In umfangreichen biochemischen Analysen wurde ERAS als
einzigartiges Mitglied der RAS Familie identifiziert, gekennzeichnet durch deutliche
Sequenzunterschiede, zusätzliche Motive, sowie einen verlängerten N‐Terminus. Letzterer
scheint eine Rolle in der ERAS vermittelten Signaltransduktion einzunehmen.
Interessanterweise zeigen ERAS und HRAS eine größtenteils nicht überlappende Interaktion
mit Effektoren. Dieser Unterschied korreliert mit Abweichungen in den
Effektorbindungsstellen von ERAS. ERAS‐Signale erhalten demzufolge die Quieszenz ruhender
HSC durch die Inhibition von sowohl Proliferation als auch Apoptose via verschiedener
Signalwege, wie JAK‐STAT3, AKT‐mTORC1‐FOXO1, mTORC2‐AKT, und RASSF5‐HIPPO. Im
Gegensatz dazu zeigen die aktivierten HSCs YAP‐CTGF/NOTCH2‐ und RAS‐RAF‐MEK‐ERK‐
Aktivität, die an der Proliferation und Entwicklung von HSCs beteiligt sind.

III
Table of Figures
Figure 1. Microanatomy of the liver and liver resident cells ........................................................ 4
Figure 2. Schematic view of the RAS‐GTP/GDP cycle and downstream signaling pathways of
RAS proteins .................................................................................................................................. 8
Figure 3. RAS superfamily, family members and subgroups ......................................................... 9
Figure 4. Overall sequence comparison of ERAS protein with classical RAS proteins.. .............. 10
Figure 5. Schematic view of signaling pathway of the mammalian target of rapamycin (mTOR)
complexes.. .................................................................................................................................. 18
Figure 6. Predicted structure of full‐length ERAS and exhibits of the three‐dimensional places
of studied ERAS mutants ........................................................................................................... 144
Figure 7. Schematic view of the proposed model of HSC signaling networking and gene
expressional changes ................................................................................................................ 149
Figure 8. p120 interacts through SH3 domain with DLC1 and regulates RAS and RHO signaling..
................................................................................................................................................... 151

IV
Abbreviation
aa amino acid aHSC activated HSC ARP2/3 actin related protein 2/3 BMP‐2 bone morphogenetic protein‐2 CXCR4 chemokine (C‐X‐C motif) receptor 4 DEPTOR DEP domain‐containing mTOR‐interacting protein DLC1 deleted in liver cancer 1 ECM extracellular matrix ERAS embryonic stem cell‐expressed RAS ERK extracellular regulated kinase FTase farnesyltransferase FGF fibroblast growth factor FOXO1 forkhead transcription factor 1 GAP GTPase‐activating protein GDP guanosine diphosphate GEF guanine nucleotide exchange factor GFAP glial fibrillary acidic protein GGTase I geranylgeranyltransferase type I GSK3β glycogen synthase kinase 3 beta GTP guanosine triphosphate GTPases guanosine triphosphatase HA hyaluronan HCC hepatocellular carcinoma HGF hepatocyte growth factor HRAS harvey rat sarcoma HSC hepatic stellate cell HVR hypervariable region IGF insulin‐like growth factor IQGAP IQ motif‐containing GTPase‐activating protein IRSp53 insulin receptor substrate p53 JMML juvenile myelomonocytic leukemia KRAS kirsten rat sarcoma mDia mammalian diaphanous MEK MAP/ERK kinase MLST8 mammalian lethal with SEC13 protein 8 MMP matrix‐metalloproteinase MRAS muscle rat sarcoma MSC mesenchymal stem cell mSIN1 mammalian stress‐activated MAP kinase‐interacting protein 1 MST mammalian sterile 20‐like kinase mTORC mammalian target of rapamycin NF1 neurofibromatosis type 1 NRAS neuroblastoma rat sarcoma NORE1 novel RAS effector 1 OCT4 octamer‐binding transcription factor 4

V
PAK p21‐activated kinase PDGF platelet‐derived growth factor PDK1 3‐phosphoinositide‐dependent protein kinase 1 PH pleckstrin homology PHx partial hepatectomy PIP3 phosphoinositide 3,4,5‐trisphosphate PI3K phosphoinositide 3‐kinase PKR protein kinase C‐related kinase PLC phospholipase C PP1 protein phosphatase 1 PPARγ peroxisome proliferator‐activated receptor γ PRAS40 40 kDa pro‐rich Akt substrate PROTOR protein observed with RICTOR PTM post‐translational modification qHSC quiescent HSC RA RAS association RAC RAS‐related C3 botulinum toxin substrate RAF rapidly accelerated fibrosarcoma RAL RAS like RALBP1 RALA binding protein 1 RALGDS guanine nucleotide dissociation stimulator RAP2A RAS related protein 2A RAPTOR regulatory‐associated protein of mTOR RAS rat sarcoma RAS D RAS, dexamethasone‐induced RASSF RAS‐association domain family RBD RAS binding domain RGL RALGDS like RHO RAS homolog RICTOR rapamycin‐insensitive companion of mTOR RLIP76 76 KDa RAL‐interacting protein RHEB RAS homolog enriched in brain ROCK RHO‐associated coiled‐coil kinase RRAS related RAS SAM sterile α motif SARAH salvador‐RASSF‐HIPPO SATB1 AT‐rich binding protein 1 SDFα stromal cell‐derived factor α SH2 src homology 2 SH3 src homology 3 SMA smooth muscle actin SREBP sterol regulatory element‐binding protein SPRY1 sprouty homolog 1 SRA1 specifically RAC1‐associated protein‐1 START steroidogenic acute regulatory related lipid transfer STAT3 signal transducer and activator of transcription 3 TGFβ transforming growth factor beta
VI
TIMP tissue inhibitors of metalloproteinase TSC tuberous sclerosis ULK1 Unc‐51 like autophagy activating kinase 1 WASP wiskott–aldrich syndrome protein WAVE WASP‐family verprolin‐homologous protein WNT wingless‐type MMTV YAP yes‐associated protein ZONAB ZO‐1 associated nucleic acid‐binding protein
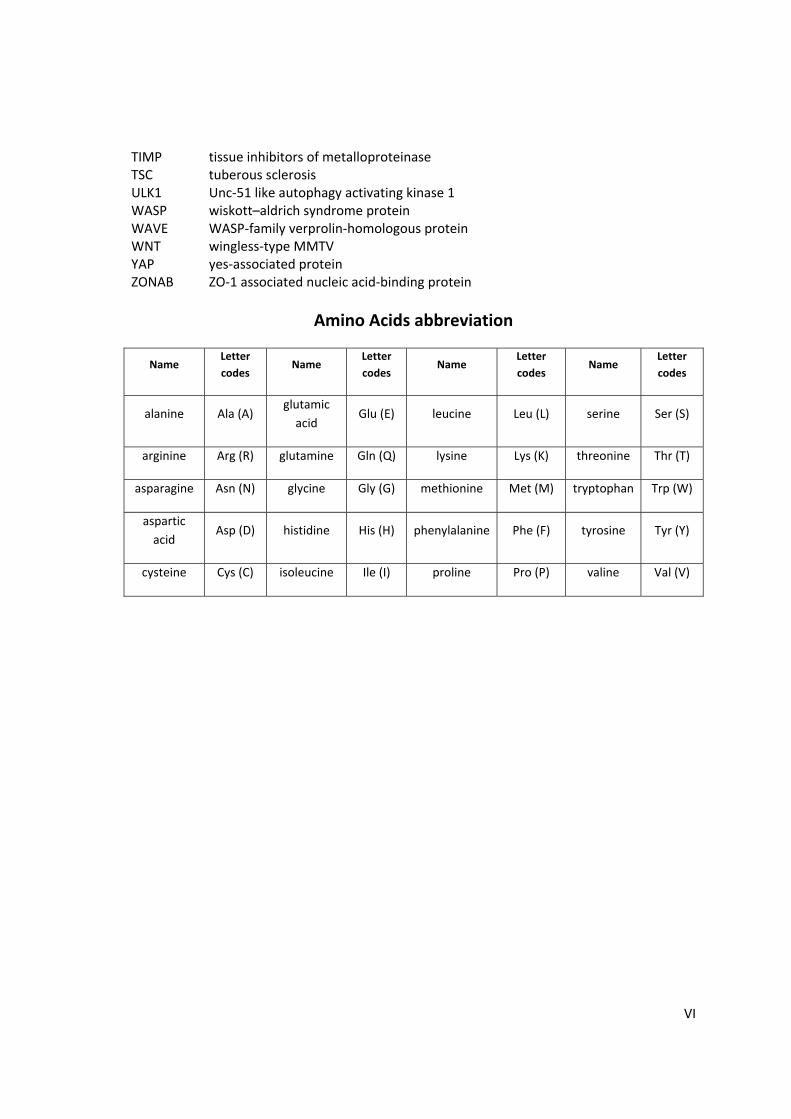
Amino Acids abbreviation
Name Letter
codes Name
Letter
codes Name
Letter
codes Name
Letter
codes
alanine Ala (A) glutamic
acid Glu (E) leucine Leu (L) serine Ser (S)
arginine Arg (R) glutamine Gln (Q) lysine Lys (K) threonine Thr (T)
asparagine Asn (N) glycine Gly (G) methionine Met (M) tryptophan Trp (W)
aspartic
acid Asp (D) histidine His (H) phenylalanine Phe (F) tyrosine Tyr (Y)
cysteine Cys (C) isoleucine Ile (I) proline Pro (P) valine Val (V)

1
Chapter I
General introduction

2
Chapter I
Anatomical units and resident cells of the liver
Liver is located in the upper‐right quadrant of the abdominal cavity below the diaphragm.
It acts as a unique organ in the body with wide range of physiological functions and plays a
central role in the metabolic homeostasis, glycogen storage, bile secretion, detoxification,
serum protein production, e.g., albumin and acute‐phase proteins (Lefkowitch, 2011). The liver
represents a largest organ in the body and weights around 1200‐1500 g in adults and its size
and weight is correlated with age and gender (Chouker et al., 2004). Liver receives the blood
from two sources: First, the portal vein carries nutrient rich and oxygen poor blood 70% (40%
oxygen) from spleen, pancreas and intestine. Second, hepatic artery supplies 30% oxygen rich
(60% oxygen) and nutrient poor blood from the celiac trunk (Burt and Day, 2003).
Microanatomy of the liver
Functional units
Based on anatomical aspects on pig dissections, Kiernan in 1833 described anatomically
units of the liver as hexagonal structures named classic lobules (Fig. 1A) (Kiernan, 1833). Each
lobule, periphery recognizes with around six portal triads containing terminal branches of
portal vein, hepatic artery and bile duct (Fig. 1A). At the central of liver lobules placed the
center vein that collects the blood from the whole lobule and drains to hepatic vein. In
addition, Rappaport introduced alternative functional liver units, liver acinus, which are
important for liver physiology and pathology. It lies between two classical lobules in diamond
shape and involves two portal triads and two central veins in periphery (Fig. 1A). At the level of
acinus, hepatocytes are grouped into three zones based on their distance from oxygen‐rich
portal triads and are numbered to direction of blood flow from 1 to 3 (Fig. 1A) (Rappaport et
al., 1954).
Microscopy structure of liver lobules composed of four major parts; I) Parenchyma, a line
of organized hepatocytes; II) Connective tissues, i.e. vessels, ducts and nerve system. III)
Hepatic capillaries which are known as sinusoids, located between planes of parenchymal cells
and lined with endothelial cells, where the supplied blood from peripheral branches of hepatic
artery and portal vein are combined and drained towards central vein. IV) Space of Dissé
(perisinusoidal space), a narrow area between basal surface of hepatocytes and endothelial
cells (Fig. 1B) (Lachman and Pawlina, 2010).
Liver specific resident cells and their functions
Hepatocytes comprise 80 % of liver cell population and are the most prominent cells of
the liver according to their functions. Hepatocytes are structurally and functionally
heterogenic cells depending on their position. The major functions of periportal hepatocytes
(zone 1, Fig. 1A) consisting: gluconeogenesis, β‐Oxidation of fatty acids, amino acid catabolism,
bile secretion and, cholesterol, glycogen and urea synthesis. Whereas periventricular
hepatocytes are involved on glycolysis, lipogenesis, ammonia removal, detoxifications,

3
Chapter I
ketogenesis, glycogen and bile acid synthesis (Häussinger et al., 1985; Lamers et al., 1989;
Gumucio, 1989; Jungermann, 1988). Hepatocytes are polarized cells; the basal surface faces
the sinusoidal space that covered with microvilli and apical surface form the canaliculus (Fig.
1B) (Gissen and Arias, 2015).
Cholangiocytes are epithelial cells, which line the bile duct. Bile flows from the canaliculi
into the bile ducts (named bile ductules) and cholangiocytes modify and secret bile derived
(Fig. 1B, green arrow) (Kanno et al., 2000).
Kupffer cells are liver resident macrophages that are associated with endothelial cells in
the lumen side of sinusoid. They contribute for removal of bacteria, viruses, parasites, dead
cells and tumor cells from the liver. Moreover, they are an important source of cytokines
secretion (Dixon et al., 2013).
Endothelial cells are elongated fenestrae cells, line sinusoidal space. They act as sieve and
allow transport of macromolecules between blood sinusoids and plasma within Dissé space
with the size of up to 0.2 μm through their pores. In addition, they possess high capacity for
receptor‐mediated endocytosis. Together, with these two features, they provide the
hepatocytes their substrates and via selective endocytosis protect hepatocytes from several
harmful components (Smedsrod et al., 1990; Braet et al., 2009).
Hepatic stellate cells (HSCs; also called Ito cells, lipocytes, fat storing cells, or
perisinusoidal cells) contribute to 5‐8% of total liver‐resident cells and are located between the
basolateral surface of hepatocytes and sinusoidal endothelial cells in the space of Dissé in the
liver (Fig. 1B) (Kordes and Häussinger, 2013a).
The focus of present study is to provide a better understanding about the function and
regulation of HSCs within the liver and after liver injury, therefore in following parts HSCs will
be viewed in more detail.
Hallmarks and roles of hepatic stellate cells
Quiescent HSC (qHSC) in the normal liver
Characteristics
HSCs reside in the Disse space of liver in close proximity to other liver cells, i. e.,
hepatocytes, sinusoidal endothelial cells and Kupffer cells (Fig. 1B). In a healthy liver, stellate
cells remain in quiescent state and are characterized by high content of vitamin A storage
(mainly retinyl palmitate) as cytoplasmic lipid vesicles and expression of neural and
mesodermal markers, i.e., glial fibrillary acidic protein (GFAP) and desmin (Wake, 1971; Yokoi
et al., 1984; Gard et al., 1985) (see Fig . 1B and C). Under excitation by UV light, lipid‐
containing vesicles reflect the blue‐green light due to their autofluorescence property (Blaner
et al., 2009; Sauvant et al., 2011).

4
Chapter I
Figure 1. Microanatomy of the liver and liver resident cells. (A) Illustration of liver three lobules and acinus, zone 1 to 3. (B) Schematic view of sinusoidal space, liver resident cells, Dissé space, canal of Hering and blood vessels [adopted from (Kordes and Häussinger, 2013a)]. (C) Quiescent HSC. (D) Activated HSC in regeneration. (E) Activated HSC in fibrosis.

5
Chapter I
Functions
Development and organogenesis—HSCs originate from the mesodermal cells of septum
transversum (Asahina et al., 2011) and during embryogenesis, they contribute to liver
development and organogenesis through: I) Progenitor proliferation, HSCs have profound
impact on proliferation of hepatoblasts (epithelial progenitors of hepatocytes and
cholangiocytes) by releasing the mitogen factors such as fibroblast growth factor 10 (FGF10)
(Berg et al., 2007), hepatocyte growth factor (HGF) (Schirmacher et al., 1992; Delgado et al.,
2009) and WNT (Matsumoto et al., 2008). II) Cell fate decision and differentiation, HSCs
through extracellular matrix (ECM) protein production and NOTCH signaling control the
hepatoblasts differentiation towards, either hepatocytes or cholangiocytes, respectively (Nagai
et al., 2002; Sawitza et al., 2009; Yanai et al., 2008; Zong et al., 2009). III) Chemotaxis and
homing, HSCs by providing the stromal cell‐derived factor α (SDF1α or CXCL12) chemokine,
recruit hematopoietic stem cells and endothelial cells that express its receptor CXCR4 into the
fetal liver (Wright et al., 2002; Kubota et al., 2007). IV) Hematopoiesis, recently it is
demonstrated that HSCs similar to bone marrow mesenchymal stem cells (MSCs), have a
positive influence on hematopoiesis by supporting hematopoietic stem cells and are
introduced as liver‐resident MSCs (Castilho‐Fernandes et al., 2011; Kordes et al., 2013; Kordes
et al., 2014).
In normal liver—qHSCs are viewed for their contribution in two main processes; I)
Retinoid storage and mobilization in the liver (Wake, 1971). The majority of the retinoids in the
body are stored in the lipid droplets of the qHSCs. Retinoids (retinyl ester, retinol, retinal and
retinoic acid), are engaged in large spectrum of the physiological processes, e.g. development,
organogenesis, differentiation, vision, reproduction and immunity (Duester, 2008; Blaner et
al., 2009; Clagett‐Dame and Knutson, 2011; Zhou et al., 2012; Markgraf et al., 2014). The
active metabolite of retinol is retinoic acid and through binding to the nuclear receptors
modulates the expression of variety of the genes, including the genes which are controlling the
cell growth, differentiation and cellular metabolism (Di Masi et al., 2015; Zhang et al., 2015). II)
Maintenance and homeostasis of stem cell niche in the liver. Stem cell microenvironment or
niche provides the soluble factors and cell‐cell contacts, which are critical factors for stem cells
maintenance and self‐renewal. qHSCs reside in the Dissé space that represents the stem cell
niche within the liver. HSCs are the main source of HGF secretion that is essential for
hepatocytes homeostasis (Ramadori et al., 1992; Schirmacher et al., 1992). Moreover, they are
involved in signaling pathways such as WNT and NOTCH, which required for maintenance of
stem cell niche (Kordes et al., 2008a; Sawitza et al., 2009; Kordes and Häussinger, 2013a). The
most exciting prospects of HSCs are that in addition to their supportive roles in stem cell niche,
they also possess characteristics of stem cells, like the expression of OCT4 and CD133 genes,
and react as a multipotent cells with potency to differentiate into other cell lineages, such as

6
Chapter I
hepatocytes, endothelial cells, adipocytes and osteocytes (Kordes et al., 2007; Kordes et al.,
2013; Kordes et al., 2014; Sawitza et al., 2015).
Activated HSC (aHSC) after liver injury Transition to myofibroblast‐like cells—Following chronic liver injury, apoptotic/necrotic
hepatocytes release factors which activate HSCs and trigger their transdifferentiation into
contractile, proliferative and migrating cells, so‐called activated HSCs. During activation, aHSCs
release their vitamin A, up‐regulate various genes, including α‐smooth muscle actin (α‐SMA)
and collagen type I, and down‐regulate GFAP (Figs. 1D and E). In addition to in vivo activation
of HSCs during the chronic liver injury, by culturing the freshly isolated HSCs on the plastic
dishes, they undergo spontaneous activation and provide an in vitro model to study the
activated HSCs which are from different aspects very close to the in vivo models (De Minicis et
al., 2007; Mannaerts et al., 2015).
Physiologically, HSCs represent well‐known extracellular matrix (ECM) producing cells.
ECM production is important for maintenance of the tissue structure and function (Jones et al.,
1993; Wang et al., 2004). In acute liver infection, HSCs protect hepatocytes against toxin
products of ectopic pathogens by releasing type I collagen and contributing to scar tissue
formation (Friedman, 2008; Bourbonnais et al., 2012). However, apart from the protective
function of scar tissue, in chronic liver injuries, dysregulation of fibrosis can occur and
excessive scar formation interferes with normal liver function. In some pathophysiological
conditions, last long activation of HSCs causes the accumulation of ECM in the liver and initiate
the liver diseases like, fibrosis, cirrhosis and hepatocellular carcinoma (HCC) (Dechene et al.,
2010; Pellicoro et al., 2014).
Matrix remodeling and controlling ECM composition—Matrix remodeling occurs via a
balance between matrix‐metalloproteinases (MMPs or matrixins) and their inhibitors, tissue
inhibitors of metalloproteinases (TIMPs) and this process is important for normal function of
organs. MMPs hydrolyze the ECM components and are regulated at transcriptional levels and
locally via their specific inhibitors, TIMPs. They are zinc‐calcium dependent proteinases (Werb,
1997; Parks, 1999; Sternlicht and Werb, 2001) and based on their substrate categorized in five
groups; I) Collagenases, MMP‐1, MMP‐8, MMP‐13, and MMP‐18 that cleave collagens I, II, and III. II) Gelatinases, MMP‐2 and MMP‐9. III) Stromelysins, MMP‐3, ‐10 and ‐11. IV) Matrilysins,
MMP‐7 and MMP‐26. V) Membrane‐type, MMP‐14, ‐15, ‐16, ‐17, ‐24, ‐25 (Visse, 2003).
Activated HSCs play profound roles in matrix remodeling by up‐regulation and secretion of
MMP‐2 (Arthur et al., 1992), MMP‐9 (Han et al., 2007), MMP‐13 (Schaefer et al., 2003) and
stromelysin (Vyas et al., 1995; Benyon and Arthur, 2001; Friedman, 2008) (Fig. 1E).
Liver regeneration after partial hematectomy—Liver is a unique solid organ in the body
with high capacity of regeneration. After surgical removal of two/thirds of the liver (termed
partial hepatectomy or PHx), the remaining parts of the liver grow and enlarge until the liver
mass reach to its normal size, this phenomenon is called liver regeneration (Taub, 2004;
Michalopoulos, 2010). This is mainly proposed as a result of hepatocytes reentry to the cell
cycle (from G0 to G1) and their proliferation (Miyaoka et al., 2012). Notably, there are growing

7
Chapter I
numbers of evidences indicating the pivotal contribution of other liver cell types especially
HSCs in supporting hepatocytes upon liver regeneration, by providing the high levels of growth
factors (HGF), cytokines, chemokines, NOTCH signaling activity and modulation the ECM
composition (Geffers et al., 2007; Roskams, 2008; Sawitza et al., 2009; Friedman, 2008; Yin et
al., 2013b).
Stem cell‐mediated liver regeneration—Under some pathological conditions, when the
hepatocytes proliferation compromised, liver regeneration mediated through the progenitor
cells activation, proliferation and differentiation. The liver progenitor/stem cells emerge when
the hepatocytes proliferation is impaired and there are two candidate cell lineages, which are
introduced as liver stem cells; I) Oval cells in the rodents appear around the canal of Hering
(Fig. 1B). These cells exhibit the immature oval‐shaped cells with bipotent capacity to
differentiate into hepatocytes and cholangiocytes (Miyajima et al., 2014). II) HSCs are the
second candidate for liver stem cells and Dissé space serves as a stem cell niche by providing
the soluble factors and appropriates microenvironment for cell‐cell communication (Sawitza et
al., 2009; Kordes and Häussinger, 2013a; Kordes et al., 2014). Similar to oval cells, they are
multipotent cells and emit the stem cells properties (Yang et al., 2008). Noteworthy, recent
study demonstrated the transdifferentiation of transplanted HSCs into the progenitor cell
population of the host animal during liver regeneration and their contribution to the
hepatocytes and bile duct formation (Kordes et al., 2014) (Fig. 1D).
In the previous part, we had a short introduction about HSCs and a view of their
functions, in both quiescent and activated states. The most exciting aspects of HSCs are their
bilateral roles during physiological and pathophysiological situations as positive or negative
players. Therefore, there is a pivotal need to further understand the molecular mechanisms
that govern the fate and contribution of HSCs in different cellular circumstances. In the next
section, we will get more detailed information about the candidate pathways that may be the
driven force on HSC fate decisions.
Postulated signaling mechanisms in hepatic stellate cells
To date, several studies reported the candidate pathways that regulate the plasticity of
HSCs during different circumstances including liver development, hemostasis, repair and
fibrosis; such as RAS‐MAPK, PI3K‐AKT, JAK‐STAT3, HIPPO‐YAP, NOTCH, WNT, Hedgehog, and
importance of growth factors, like platelet‐derived growth factor (PDGF), transforming growth
factor beta (TGFβ) and insulin‐like growth factor (IGF) (Reimann et al., 1997; Carloni et al.,
2002; Kordes et al., 2008a; Lakner, 2010; Xie et al., 2013; de Souza et al., 2015; Mannaerts et
al., 2015). Among these pathways, RAS signaling is one of the earliest, which was identified to
plays a role in HSC activation (Parola et al., 1998). However, how the cross‐talking between
different RAS dependent signaling pathways modulates the HSC fate decisions, remains to be
manifested. In this section, we will have an introduction to RAS superfamily of monomeric
GTPases; the cellular outcomes, subgrouping, sequence highlights, lipid modification, and
regulation. Then, we will take the signaling networks of two major families of RAS and RHO
into consideration.

8
Chapter I
RAS superfamily at a glance Cellular functions—Small GTPases of the RAS superfamily normally act as molecular
switches within the cell, cycling between a GTP‐bound (active) and a GDP‐bound (inactive)
states (Fig. 2) (Wittinghofer and Vetter, 2011). According to the sequence and function
similarly, they fall into seven major subfamilies: RAS, RHO, RAB, RAN, RAD, RAG and ARF
(Fig. 3). In 1979, the RAS protein, prototype of RAS superfamily, was first described as a
phospho‐protein (p) 21 kDa and later RAS term was used as a prototype of a superfamily (Fig.
3) (Shih et al., 1979). These molecules trigger intracellular responses by sensing the
extracellular signals through their interacting receptors or intermediate proteins and passing
the signal to downstream targets (Fig. 2). Therefore, they play a key role in various cellular
processes, including gene expression, metabolism, cell cycle progression, proliferation,
survival, differentiation, vesicular transport, cytoskeleton organization, migration, cell motility,
endocytosis, contraction and nuclear transport (Coleman et al., 2004; Wennerberg, 2005;
Sorkin and von Zastrow, 2009; Amin et al., 2013). In pathological situations, the somatic or
germline mutations in genes related to members of the RAS superfamily or their regulators are
commonly associated with cancer progression or developmental disorders (Ahmadian et al.,
2002; Gremer et al., 2011; Karnoub and Weinberg, 2008; Pylayeva‐Gupta et al., 2011; Tidyman
and Rauen, 2009; Flex et al., 2014; Cirstea et al., 2013).
Figure 2. Schematic view of the RAS‐GDP/GTP cycle and downstream signaling pathways of RAS proteins. As it is written at the top left, RAS proteins are cycling between GDP/GTP bound forms by the actions of two main regulatory proteins, GEF, and GAP. They can only exert their cellular functions when they are anchored to the membrane via posttranslational lipid modifications (see text for more information). Effector proteins downstream of RAS‐GTP are depicted with green letters and the cellular targets of effectors in black. Through the interaction with these effectors and switching on the downstream pathways, RAS proteins emit their cellular functions, bottom in gray. DAG, diacylglycerol; ERK, extracellular regulated kinase; GAP, GTPase‐activating protein; GEF, guanine nucleotide exchange factor; MEK, MAP/ERK kinase; MST, mammalian sterile 20‐like kinase; PDK1, 3‐phosphoinositide‐dependent protein kinase; PI3K, phosphoinositide 3‐kinase; PIP3, phosphoinositide 3,4,5‐trisphosphate;

9
Chapter I
PKC, protein kinase C; PLC, phospholipase C; RALBP1, RALA binding protein 1; RALGDS, guanine nucleotide dissociation stimulator; RAS, rat sarcoma; RASSF5, Ras‐association domain family.
Sequence highlights of RAS superfamily—RAS proteins share a highly conserved GTP‐
binding (G) domain with five essential motifs, termed G1‐G5 (Fig. 4) (Bourne et al., 1990;
Bourne et al., 1991). G1 or P‐loop (10GxxxxGKS/T17; HRAS numbering) binds the beta and
gamma phosphates of GTP (Saraste et al., 1990). Substitution of glycine 12 to any other amino
acids (except for proline) is most frequently found in human cancers. These mutations render
RAS protein GAP‐insensitive and consequently hyperactive (Bos, 1989; Tidyman and Rauen,
2009). G2 and G3, also are referred as switch I and switch II, respectively, are dynamic regions
that sense the nucleotide state and provide the regulator and effector binding sites (Vetter,
2001; Herrmann, 2003). G4 and G5 are important for determining the guanine base‐binding
specificity of G domain (Schmidt et al., 1996; Wittinghofer and Vetter, 2011) (Fig. 4).
Figure 3. RAS superfamily, family members and subgroups [adopted from (Kennedy et al., 2005)]. RAS superfamily consist of seven family (first row), RAS, RAB, RAN, ARF, RAG, RAD and RHO. Each family is subdivided in different subgroups, here we only depicted RAS and RHO dependent subgroups; RAS subgroups, p21 RAS, ERAS, RHEB, RAP, RRAS and RAL. RHO subgroups, RHO, RAC, CDC42, RHOH, RND and RHOD. Two last rows highlight the members of each RAS subgroups in the same colors as used for the subgoups (see the text for further information).
Lipid modifications and membrane targeting— Association of RAS proteins with cellular
membranes are mediated through posttranslational (PTM) modification in their very C‐
terminal end, termed hypervariable region (HVR) (Figs. 2 and 4). The plasma membrane
localization of RAS proteins is essential for their functionality where they physically can
interact with their regulators and effector proteins (Willumsen et al., 1984; Ahearn et al.,
2011; Schmick et al., 2014). They undergo two lipid modifications; I) Prenylation, the RAS and
RHO family members, mainly terminated with CAAX sequence (C is cysteine, A is any aliphatic
amino acid, and X is any amino acid) (Seabra et al., 1991) (Fig. 4). CAAX motif serves as
10
Chapter I
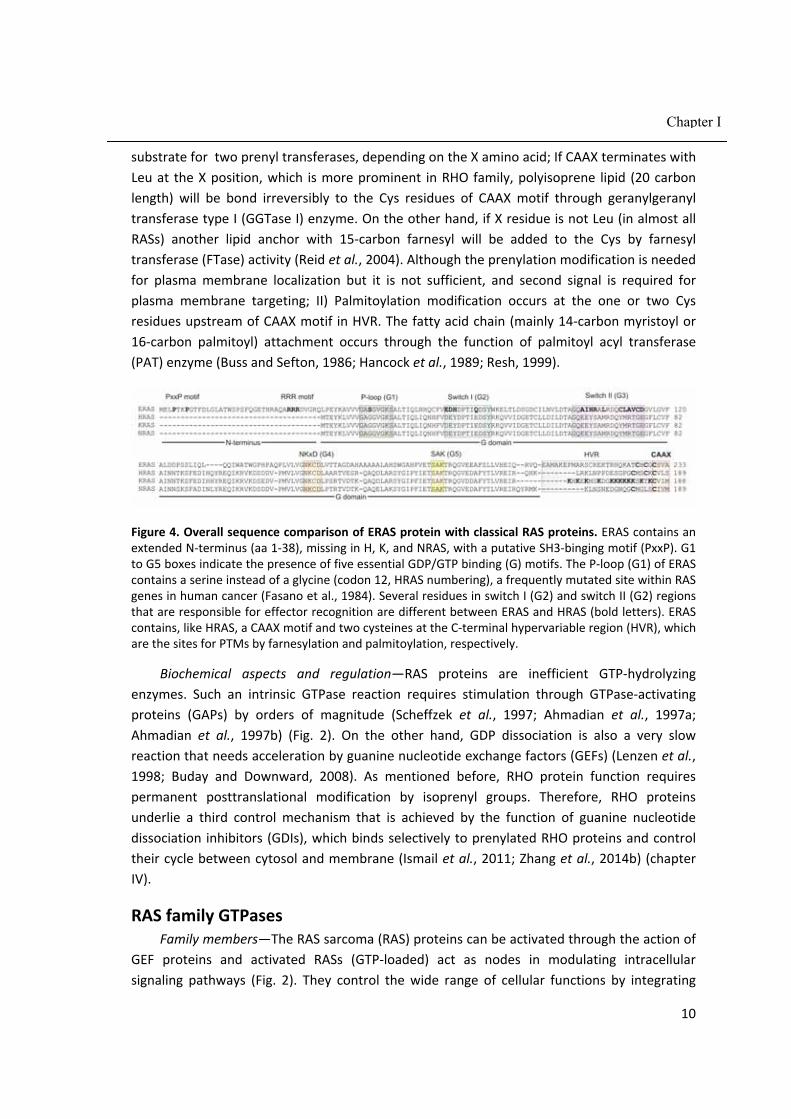
substrate for two prenyl transferases, depending on the X amino acid; If CAAX terminates with
Leu at the X position, which is more prominent in RHO family, polyisoprene lipid (20 carbon
length) will be bond irreversibly to the Cys residues of CAAX motif through geranylgeranyl
transferase type I (GGTase I) enzyme. On the other hand, if X residue is not Leu (in almost all
RASs) another lipid anchor with 15‐carbon farnesyl will be added to the Cys by farnesyl
transferase (FTase) activity (Reid et al., 2004). Although the prenylation modification is needed
for plasma membrane localization but it is not sufficient, and second signal is required for
plasma membrane targeting; II) Palmitoylation modification occurs at the one or two Cys
residues upstream of CAAX motif in HVR. The fatty acid chain (mainly 14‐carbon myristoyl or
16‐carbon palmitoyl) attachment occurs through the function of palmitoyl acyl transferase
(PAT) enzyme (Buss and Sefton, 1986; Hancock et al., 1989; Resh, 1999).
Figure 4. Overall sequence comparison of ERAS protein with classical RAS proteins. ERAS contains an extended N‐terminus (aa 1‐38), missing in H, K, and NRAS, with a putative SH3‐binging motif (PxxP). G1 to G5 boxes indicate the presence of five essential GDP/GTP binding (G) motifs. The P‐loop (G1) of ERAS contains a serine instead of a glycine (codon 12, HRAS numbering), a frequently mutated site within RAS genes in human cancer (Fasano et al., 1984). Several residues in switch I (G2) and switch II (G2) regions that are responsible for effector recognition are different between ERAS and HRAS (bold letters). ERAS contains, like HRAS, a CAAX motif and two cysteines at the C‐terminal hypervariable region (HVR), which are the sites for PTMs by farnesylation and palmitoylation, respectively.
Biochemical aspects and regulation—RAS proteins are inefficient GTP‐hydrolyzing
enzymes. Such an intrinsic GTPase reaction requires stimulation through GTPase‐activating
proteins (GAPs) by orders of magnitude (Scheffzek et al., 1997; Ahmadian et al., 1997a;
Ahmadian et al., 1997b) (Fig. 2). On the other hand, GDP dissociation is also a very slow
reaction that needs acceleration by guanine nucleotide exchange factors (GEFs) (Lenzen et al.,
1998; Buday and Downward, 2008). As mentioned before, RHO protein function requires
permanent posttranslational modification by isoprenyl groups. Therefore, RHO proteins
underlie a third control mechanism that is achieved by the function of guanine nucleotide
dissociation inhibitors (GDIs), which binds selectively to prenylated RHO proteins and control
their cycle between cytosol and membrane (Ismail et al., 2011; Zhang et al., 2014b) (chapter
IV).
RAS family GTPases Family members—The RAS sarcoma (RAS) proteins can be activated through the action of
GEF proteins and activated RASs (GTP‐loaded) act as nodes in modulating intracellular
signaling pathways (Fig. 2). They control the wide range of cellular functions by integrating

11
Chapter I
with distinct downstream effector proteins. Rojas and colleagues, reported 39 members of
human RAS family (http://www.cbbio.es/GTPases/), including HRAS, KRAS, NRAS, RAP1A/B,
RAP2A/B/C, RALA/B, RRAS subgroup (RRAS, TC21 and MRAS), RHEB, DiRAS (RIG), RASD
(AGS1/DEXRAS), RASL10, ERAS, NKiRAS, and RIT (Rojas and Valencia, 2014) (Fig. 3).
Functions—Best investigated RAS proteins are HRAS, NRAS and KRAS4B, share
overlapping functions, including cell proliferation, differentiation and apoptosis (Castellano
and Santos, 2011; Ichise et al., 2010; Omerovic et al., 2007; Potenza et al., 2005). However,
different RAS isoforms exhibit a particular pattern of expression, different regulators and
specific microdomains or subcellular localization, indicating their functional specificity as well
as redundant roles (Leon et al., 1987; Johnson et al., 1997; Potenza et al., 2005; Omerovic et
al., 2007; Nakamura et al., 2008; Ichise et al., 2010; Castellano and Santos, 2011; Lau and
Haigis, 2009). The individual roles of other members of the RAS family, such as RRAS, TC21,
MRAS, RAP2A, RASD, or the embryonic stem cell‐expressed RAS (ERAS) have not been fully
described. In this part, we will have a brief description of these RAS family members, ERAS,
RRAS, MRAS and RAP2A.
ERAS novel members of RAS family
ERAS expression ranging from embryonic stem cells to tumors—The ERAS expression has
been reported to date in embryonic stem cells and some tumor cell lines but not in the normal
cells of the body. For the first time, Yamanaka and colleagues introduced ERAS in 2003 as a
novel member of RAS family, specifically expressed in undifferentiated mouse embryonic stem
cells to be critical for maintenance of growth and tumor‐like properties in these cells
(Takahashi et al., 2003). Later, the ERAS expression was detected in different types of
colorectal carcinoma cells (HCT116, DLD1, LS174T and HT29), pancreatic carcinomas (RWP‐1
and MIAPaCa‐2), breast carcinoma (AMB‐231) (Yasuda et al., 2007) and gastric cancer (e.g.,
GCIY, NUGC‐4 and MKN‐45) cell lines (Kubota et al., 2010). Kaizaki and colleagues reported the
ERAS expression in 45% of gastric cancer tissues and found coloration between ERAS‐negative
patients recognized with poorer diagnosis (Kaizaki et al., 2009). In addition, ERAS expression
was also found in various neuroblastoma cell lines that has been suggested to promote
transforming activity and resistance to chemotherapy (Aoyama et al., 2010).
Hallmarks of ERAS. ERAS harbors, despite a conserved G domain with all essential motifs
for a high‐affinity binding of GTP, significant amino acid deviation as compared to other RAS
proteins (Fig. 4); I) Its phosphate binding loop containing a serine (S50) instead of a glycine
that is critical for the GTP hydrolysis reaction (Scheffzek et al., 1997) and responsible for ERAS
makes it GAP insensitivity (Nakhaei‐Rad et al., 2015). Substitution of G12 for any other amino
acids in RAS isoforms is frequently associated with tumor formation (Tidyman and Rauen,
2009; Bos, 1989); II) ERAS contains different amino acids in the effector binding sites in
comparison to other members of the RAS family; III) ERAS has a unique extended, evolutionally
conserved N‐terminus (Nakhaei‐Rad et al., 2015) (chapter II).
12
Chapter I
Sequence deviations in effector binding regions of ERAS—HRAS, NRAS and KRAS4B share
an identical effector binding regions suggesting that they may share the same downstream
effectors. In contrast, ERAS revealed significant differences in the effector binding regions. This
implicates that it may utilize other effectors as compared to known HRAS effectors and may
consequently have different cellular functions. However, the downstream effectors selective
for ERAS are not fully identified yet. A known HRAS effector is phosphoinositide 3‐kinase (PI3K)
that has also been reported to be activated by ERAS (Fig. 2) (Takahashi et al., 2003; Takahashi
et al., 2005; Yu et al., 2014) (chapter II and III).
N‐terminal extension—ERAS is distinguished from the classical RAS isoforms due to its
unique extended N‐terminus. This may provide a putative interaction site for a new group of
proteins, which may determine its subcellular localization. For instance, it contains a PxxP
motif that may serve as a putative binding motif for interaction with SH3‐containing proteins
(Fig. 4) (Nakhaei‐Rad et al., 2015) (chapter II).
RRAS subfamily of RAS proteins
RRAS shares particular cellular functions with other RASs, such as cell proliferation and
transformation (Shang et al., 2011; Yu and Feig, 2002; Flex et al., 2014). However, RRAS has
been implicated in specific biological processes, i.e., integrin‐dependent cell adhesion, cell
spreading, migration and membrane ruffling (Kinbara et al., 2003; Ada‐Nguema et al., 2006;
Goldfinger, 2006; Holly et al., 2005). In comparison with HRAS, RRAS can interact with a set of
HRAS effectors like, PI3Kα/γ, CRAF, RASSF5 and PLCε (Marte et al., 1997; Rey et al., 1994;
Vavvas et al., 1998; Ada‐Nguema et al., 2006), however, it has its own specific effector, RLIP76
(RALBP1) that has mediated cell‐adhesion dependent RAC activation (Goldfinger, 2006).
Interestingly, in endothelial cells the RRAS‐RIN2‐RAB5 axis stimulates endocytosis of β1 integrin
in a RAC1‐dependent manner (Sandri et al., 2012). Moreover, sequence analysis revealed
similar to ERAS, RRAS harbors extended N‐terminus (26 amino acid length), which modulates
RRAS specific functions but revealed no impact in cellular localization (Holly et al., 2005).
Therefore, RRAS carries out its specific function in the cells through its unique N‐terminus and
individual effector protein.
Muscle RAS oncogene homolog (MRAS) is a RRAS‐related protein that involved in different
cellular processes such as cell growth and differentiation (Kimmelman et al., 1997; Watanabe‐
Takano et al., 2010). Bone morphogenetic protein‐2 (BMP‐2) treatment on skeletal muscle
myoblasts during their transdifferentiation towards osteoblasts, results in an increased
expression of MRAS at mRNA and protein levels as well as its activation (Watanabe‐Takano et
al., 2010). Among the different members of RAS family, only MRAS can interact with SHOC2 in
ternary complex with protein phosphatase 1 (PP1), which dephosphorylates autoinhibited
CRAF and activate the CRAF‐MEK‐ERK axis (Rodriguez‐Viciana et al., 2006). Similar to RRAS,
MRAS can stimulate the cell migration when it is overexpressed (Young et al., 2013).

13
Chapter I
RAP subfamily of RAS proteins
In mammalian RAP subfamily is composed of five isoforms, RAP1 (A, B) and RAP2 (A, B
and C) with 60% sequence homology. The switch I/II regions, where interact with effector
proteins, have amino acid deviations between isoform RAP1 and RAP2 which specify their
signaling towards different pathways (Gloerich and Bos, 2011). They are involved in different
cellular processes and play pivotal roles in cell motility, endothelial barrier functions, polarity
and cell adhesion (Torti and Lapetina, 1994; Paganini et al., 2006; Frische and Zwartkruis,
2010; Pannekoek et al., 2013). RAP2A, is reported to be involved in the polarity of intestine
cells. Apical localization of PDZ‐GEF activates RAP2A and GTP‐bound RAP2A interacts with its
effector, TNIK, and switchs on the TNIK‐MST4‐Ezrin axis that consequently results in actin
remodeling (Gloerich et al., 2012). Recently, it has been shown RAP2A as a novel target gene
of p53 and as a regulator of cancer cell migration (Wu et al., 2015). Moreover, expression of
RAP2A in cancer cells results in secretion of two matrix metalloproteinases (MMP2 and 9) and
AKT phosphorylation at Ser473 that promotes tumor invasion (Wu et al., 2015).
Effectors and signaling of RAS proteins The RAS effectors carry either RAS biding (RBD) or RAS association (RA) domain and they
are interacting with GTP‐bound forms of RAS proteins in switch I and switch II regions. Through
the interaction with effector proteins, RAS proteins are able to exert their biological functions,
and depending on which target effectors get activated the cellular outcomes various (Fig. 2)
(Wittinghofer and Vetter, 2011; Karnoub and Weinberg, 2008). Herein, we will have an
overview about a set of well‐annotated RAS effectors and their signaling cascades; RAF kinase,
RALGDS, PLCε, RASSFs and PI3K.
Mitogen –activated protein kinase signaling
RAF kinase (MAPKKK)—RAF family members are serine/threonine protein kinase with
three RAF isoforms in mammalian, CRAF (RAF1), ARAF and BRAF. All carry an N‐terminal RBD
and C‐terminal serine/threonine kinase domain. It is proposed that binding of RAS‐GTP to N‐
terminal RBD of RAF kinase, relieves the auto‐inhibitory effects of their N‐terminus and brings
the RAF on the plasma membrane, however, still the underling mechanism that RAS can
activate RAF is not fully investigated (Lavoie and Therrien, 2015). Three RAF isoforms act as an
RAS effector, are direct activator of MEK1/2 and consequently ERK1/2. However, BRAF was
introduced as the best activator of MEK1/2 and its mutations are association with several
human cancers (Karasarides et al., 2004; Cantwell‐Dorris et al., 2011; Barras, 2015). On the
other hand, ARAF mutation is not reported in cancer and it is proposed that ARAF is not
strongly activated via RAS (Rodriguez‐Viciana et al., 2004; Matallanas et al., 2011). RAF‐
MEK1/2‐ERK1/2 axis contributes in different cellular processes such as cell proliferation,
differentiation and apoptosis (Leicht et al., 2007). Knockout studies have revealed all RAF
isoforms are required for normal embryogenesis (Pritchard et al., 1996; Wojnowski et al.,
1997; Wojnowski et al., 1998).

14
Chapter I
MAP/ERK kinase (MAPKK)—MEK1 and MEK2 are serine/threonine/tyrosine kinases that
phosphorylate position T202/Y204 ERK1 and T185/Y187 ERK2. RAF kinases phosphorylate
S218/S222 and S222/S226 MEK1/MEK2, respectively (Hayes and Der, 2014). Beside, RAF
kinase, two other serine/threonine kinases, COT (Tp12) and MOS also serve as upstream
activators of MEKs (Hagemann et al., 1999; Johannessen et al., 2010).
ERK kinase (MAPK)—ERK1/2 are the end kinases downstream of cascade flow which are
triggered from RAS‐GTP bound and are substrate of MEK1/2. There are growing number of
evidences, indicating the distinct biological functions of ERK1 and ERK2 (Yoon and Seger, 2006;
Shin et al., 2010; Shin et al., 2015; Woodson and Kedes, 2012; Krens et al., 2008). Unlike, RAF
kinase and MEK which have a highly imitated number of substrates, collectively, ERK1/2
possess around 200 cytoplasmic or nuclear targets (Yoon and Seger, 2006).
RAL guanine nucleotide dissociation stimulator
RAS proteins interact with a wide range of proteins, and beside activation of their specific
signaling cascades, are able to regulate the parallel pathways as well. A cross‐talking between
RAS family members can occur by proteins which carry both RBD/RA domain and GEF catalytic
domain (CDC25 homology domain), therefore first as RAS effector bind to RAS and then serve
as GEF to activated another RAS family members (Quilliam et al., 2002; Ferro and Trabalzini,
2010). For instance, RALGDS family consists of RALGDS, RGL (RALGDS like), RGL2 (RIF) and
RGL3, they harbor RA domain that interact with GTP‐bound RAS (e.g., HRAS, KRAS, RAP1,
RRAS, MRAS and RIT) and after activation serve as a GEF to activate RAL subfamily of small‐
GTPases (Spaargaren and Bischoff, 1994; Wolthuis et al., 1996; Peterson et al., 1996; Shao and
Andres, 2000; Nakhaei‐Rad et al., 2015). It is reported that RAS interaction with RALGDS does
not influence its GEF activity and translocates it close to membrane where can bind to its
substrate, RAL (Wolthuis et al., 1997; Matsubara et al., 1999). Activated RAL (GTP‐loaded)
emits its cellular functions through interaction with its specific effectors; RALA binding protein
1 (RALBP1/RLIP76), ZO‐1 associated nucleic acid‐binding protein (ZONAB), exocyst complex
subunits (SEC5/EXO84) and phospholipase D1 (Bodemann and White, 2014). For instance,
RALBP1 plays roles in cellular processes like, mitochondrial fission, clatherin‐mediated
endocytosis, and cell cycle progression (Jullien‐Flores et al., 2000; Kashatus et al., 2011; Tazat
et al., 2013).
Phospholipase C enzymes
PLC enzymes, are composed of six families, PLCβ ,γ , ,,and (Katan, 2005). These enzymes hydrolyze the phosphatidylinositol 4,5‐bisphosphate (PIP2) and generate two second
messengers that stimulate different intracellular responses: inositol 1,4,5‐trisphosphate (IP3)
and diacylglycerol (DAG) (Bunney and Katan, 2011). Among PLC families, PLC is unique in regulation and function because of its prominent sequence fingerprints; I) N‐terminal CDC25
domain, which serves as a GEF for RAP1 (Bunney and Katan, 2006); II) Two C‐terminal RA
domains (RA1/RA2) that only RA2 interacts with small‐GTPase of RAS family. Therefore, PLC

15
Chapter I
acts as both effector and regulator of RAS family, similar to RALGDS (Kelley et al., 2004;
Bunney et al., 2006); III) It has an insertion of 65 aa within Y part of its catalytic domain, where
RHO proteins can bind and regulate PLC activity (Wing et al., 2003).
RAS‐association domain family
RAS‐association domain family (RASSF) proteins compose ten members: RASSF1A/B, 2, 3,
4, 5A/B/C (NORE1), 6A/B, 7, 8, 9 and 10 which share RA domain, however, two additional
domains, are not universal; 1C1 domain (RASSF1 and 5A/B) and SARAH domain (Salvador‐
RASSF‐HIPPO) (RASSF1‐6). Two well‐characterized isoforms of RASSF1/5A proteins are
recognized as unique RAS effectors which in contrast to other RAS effectors, are tumor
suppressor and emerge an pro‐apoptotic effects and their loss of function mutations are
associated with tumors (Vavvas et al., 1998; van der Weyden and Adams, 2007). MST
(Drosophila orthologues of HIPPO) is a STE‐20 family protein kinase, which interacts, and forms
a heterodimer with RASSF1/5A and WW45 (salvador) through their SARAH domain (Scheel and
Hofmann, 2003). This complex phosphorylates and activates LATS1/2, which in turn promotes
phosphorylation and sequestration and proteasomal degradation of YAP in cytoplasm (Ramos
and Camargo, 2012a; Oka et al., 2008; Zhao et al., 2007; Pfeifer et al., 2010; Hwang et al.,
2014; Rawat and Chernoff, 2015). YAP is a transcription co‐activator that promotes
transcription of the genes, like CTGF and NOTCH2, which are involved in cell development and
differentiation (Camargo et al., 2007; Avruch et al., 2010; Lu et al., 2010; Yimlamai et al.,
2014). It has been shown that HIPPO‐YAP pathway plays distinct roles in differentiated
parenchymal cells and liver progenitor cells, respectively. Where MST1/2 activity plays a role in
maintenance of differentiated state of parenchymal cells and YAP activity dedifferentiates the
cells and induces cell proliferation (Yimlamai et al., 2014). A switch between activities of two
RAS effectors with opposite functions, CRAF and RASSF, which stimulate cell proliferation and
apoptosis, can determine the biological outcomes of RAS signaling in different circumstances
(Romano et al., 2014).
Phosphatidylinositol 3‐kinase signaling
PI3K isoforms—PI3Ks are the intracellular lipid kinases that phosphorylate
phosphatidylinositol and phosphoinositides. Based on sequence homology and lipid substrates
they fall into three groups: class I, II and III. Upstream regulators of PI3K, mainly consist,
receptor tyrosine kinases, RAS proteins and G protein‐coupled receptors (Vanhaesebroeck et
al., 2010). In mammalian, class I PI3K contains four isoforms that are heterodimer proteins
compose of two subunits: catalytic and regulatory subunit. According to the regulatory
subunit, class I PI3K further subdivided in two subgroups; class IA p110α, p110β and p110δ
accompany with p85‐like regulatory subunit (p85α/β, p50α and p55α/γ). Class IB has single
member p110γ and makes a heterodimer with p101 and p84 regulatory subunits
(Vanhaesebroeck et al., 2010; Vadas et al., 2011; Jean and Kiger, 2014). p110α and β are
1 putative diacylglycerol binding site

16
Chapter I
reported to be ubiquitously expressed but the presence of p110γ and δ is restricted to specific
cell types or tissues, mainly hematopoietic cells (Vanhaesebroeck et al., 2005; Kok et al., 2009;
Fritsch et al., 2013; Fritsch and Downward, 2013). Class I PI3K phosphorylates 3‐hydroxyle of
the phosphoinositide (4,5) bisphosphate (PIP2) and generates the second messenger of
phosphoinositide (3,4,5) trisphosphate (PIP3) that recruits the wide range of protein effectors
through their pleckstrin homology (PH) domain to the membrane. Target proteins, could be
kinases (e.g. AKT and PDK1), adaptor proteins, GEFs or GAPs that regulate different cellular
processes (Vanhaesebroeck et al., 2001).
AKT serine/threonine kinase—AKT or protein kinase B (PKB) belongs to AGC subfamily of
protein kinases. AKT is one of the key proteins downstream of PI3K‐PIP3 and involves in wide
range of the cellular processes, such as cell proliferation, metabolism, growth, autophagy
inhibition, and survival (Pearce et al., 2010; Hers et al., 2011). AKT functions depend on its
phosphorylation at two critical positions, T308 and S473 (Andjelkovic et al., 1997). Upon
extracellular stimuli and the tyrosine receptor activation, class I PI3K generates the PIP3 that
engages both PDK1 and AKT through PH domain to the plasma membrane. PDK1
phosphorylates the AKT at position T308 (here after p‐AKT308) that is located on the catalytic
domain of AKT (Alessi et al., 1997). This phosphorylation triggers the inhibitory
phosphorylation of tuberous sclerosis 1/2 (TSC1/2) that is a well‐known GAP for RHEB protein
of RAS family. Phosphorylation of TSC1/2 suppresses its inhibitory effect on mammalian target
of rapamycin (mTOR) complex 1 (Fig. 5) (Inoki et al., 2002; Inoki et al., 2003). Second key
phosphorylation site positions on the hydrophobic motifs of AKT S473 (here after p‐AKT473)
and occurs through the second mTOR complex (mTORC2) (see below for further information).
Organization of mammalian target of rapamycin (mTOR) complex 1 and 2—mTOR kinase
is the catalytic domain of two multiprotein complexes; mTORC1 and mTORC2 (Zoncu et al.,
2010). These complexes are discriminated mainly based on the specific accessory proteins, in
the case of mTORC1 it is called regulatory‐associated protein of mTOR (RAPTOR) (Hara et al.,
2002) and for mTORC2 it is called rapamycin‐insensitive companion of mTOR (RICTOR)
(Sarbassov et al., 2004) (Fig 5). In addition, they harbor unique regulatory subunits, 40 kDa
Pro‐rich AKT substrate (PRAS40; mTORC1), mammalian stress‐activated MAP kinase‐
interacting protein 1 (mSIN1/MAPKAP1; mTORC2) and protein observed with RICTOR
(PROTOR; mTORC2) (Sancak et al., 2007; Pearce et al., 2007; Frias et al., 2006; Yang et al.,
2006). However, mTORC complexes share some negative and positive regulatory proteins, DEP
domain‐containing mTOR‐interacting protein (DEPTOR) and mammalian lethal with SEC13
protein 8 (mLST8), respectively (Peterson et al., 2009; Loewith et al., 2002).
Upstream regulators and substrates of the mTOR complexes—Signal integration towards
mTORC1 occurs through TSC1/2 and at the lysosome level via RAG GTPases (Huang and
Manning, 2008; Sancak et al., 2008). TSC1/2 is regulated negatively by AKT (phosphorylated at
position T308) and ERK1/2 (Alessi et al., 1997; Ma et al., 2005), whereas GSK3β, Hypoxia and
AMPK are the positive regulators (Castilho et al., 2009; Inoki et al., 2006; DeYoung et al.,
2008). AKT activity (p‐T308) results in inhibitory phosphorylation of TSC1/2 which is the RHEB‐

17
Chapter I
GAP (Tee et al., 2003) (Fig. 5). In physiological conditions, RHEB and RAG GTPases reside on the
lysosome/endosome surface. Upon the growth factor stimuli, RHEB switches to active form
(GTP‐loaded) and interacts with mTORC1 which activates catalytic function of mTOR and its
substrate interactions through RAPTOR (Inoki et al., 2003; Avruch et al., 2009; Zoncu et al.,
2010). One essential requirement of RHEB‐mTORC1 interaction is the endomembrane
translocation of the mTORC1. Amino acid stimulation of RAG GTPases results in
endomembrane localization of mTORC1 (Sancak et al., 2008). Therefore, both growth factors
and amino acids inputs are needed for mTORC1 activity (Zoncu et al., 2010). mTORC1
phosphorylates wide range of substrates and regulates the ribosome biogenesis, mRNA
translation, lipid synthesis and autophagy (Fig. 5) (Kim and Chen, 2004; Porstmann et al., 2008;
Yu et al., 2010; Iadevaia et al., 2012; Gentilella et al., 2015). S6 kinase 1 (S6K1) is the most
prominent kinase downstream of mTORC1 and phosphorylates mTOR itself at position S2448,
ribosomal protein S6, eukaryotic elongation factor 2 kinase (eEF2) kinase and eIF4B (Hara et
al., 1997; Wang et al., 2001; Ma et al., 2008; Ma and Blenis, 2009). The upstream regulators of
the mTORC2 are poorly understood and growth factor signaling and its association with
ribosome are indicated to control mTORC2 signaling activity (Zinzalla et al., 2011). Recently, a
possible cross‐talk between mTORC1 and mTORC2 is reported that S6K phosphorylates a
regulatory subunit of mTORC2 is called mSIN1 at two positions which is critical for the integrity
and substrate recruitment (e.g. AKT) of the mTORC2 (Fig. 5) (Liu et al., 2013b; Xie and Proud,
2013; Liu et al., 2014b). Furthermore, upon stimulation mTORC1 exerts a negative feedback
regulatory through phosphorylation of the insulin receptor substrate‐1 (IRS‐1) and adaptor
protein Grb10 which suppress the growth factor induced signaling (Um et al., 2004; Hsu et al.,
2011). mTORC2 phosphorylates AGC kinases, AKT (p‐AKT473), serum and
glucocorticoid‐regulated kinase (SGK) and protein kinase C (PKC) (Sarbassov, 2005; Garcia‐
Martinez and Alessi, 2008; Ikenoue et al., 2008; Su and Jacinto, 2011). AKT phosphorylation at
the hydrophobic motifs (S473) results in full activation of AKT for special substrates, such as
FOXO1 and 3. Inhibitory phosphorylation of FOXO1/3 by AKT sequestrates it in the cytoplasm
and impairs its translocation to the nucleus where it binds to gene promoters and induces
apoptosis, therefore favorites the cell survival (Wang et al., 2014). Collectively, mTORC2
regulates cell cycle progression, survival, anabolism and actin cytoskeleton organization
(Jacinto et al., 2004).

18
Chapter I
Figure 5. Schematic view of signaling pathway of the mammalian target of rapamycin (mTOR)
complexes. Complexes composition, stimulation, regulation, substrates and cellular outcomes are
illustrated. DEPTOR, DEP domain‐containing mTOR‐interacting protein; ERK, extracellular regulated
kinase; Fbw7, F‐box and WD repeat domain containing 7; FIP200, FAK family kinase‐interacting protein
of 200 kDa; 4E‐BP1, eukaryotic translation initiation factor 4E binding protein 1; FOXO1, forkhead
transcription factor; IRS1, insulin receptor substrate 1; GAP, GTPase activating protein; GSK3β, glycogen
synthase kinase 3 beta; MEK, MAP/ERK kinase; mLST8, mammalian lethal with SEC13 protein 8; mSIN1,
mammalian stress‐activated MAP kinase‐interacting protein 1; mTORC, mammalian target of rapamycin;
NICD1, Notch intracellular domain; PDK1, 3‐phosphoinositide‐dependent protein kinase; PI3K,
phosphoinositide 3‐kinase; PKC, protein kinase C; PPARγ, peroxisome proliferator‐activated receptor γ;
PRAS40, 40 kDa Pro‐rich AKT substrate; PROTOR, protein observed with RICTOR; RAPTOR, regulatory‐
associated protein of mTOR; RAS, rat sarcoma; RHEB, RAS homologue enriched in brain; RICTOR,
mTORC2 rapamycin‐insensitive companion of mTOR; SGK, serum and glucocorticoid‐regulated kinase;
SREBP, sterol regulatory element‐binding proteins; TSC, tuberous sclerosis; ULK, Unc‐51 like autophagy
activating kinase 1.
In the previous section, we had an overall view about the members, functions, target
proteins and signaling activities of the RAS family of the small GTPases. In following section,
we will consider second largest family of small GTPases is named RHO (RAS homologous) and
the cross‐talking between RAS and RHO proteins to orchestrate different cellular responses.

19
Chapter I
RHO family GTPases RHO Family members, functions and regulation— RHO family GTPases have key functions
in cytoskeletal organization, migration, adhesion, survival and cell cycle progression (Heasman
and Ridley, 2008b). To date, 20 members of the RHO family have been reported, which further
are subdivided into six subfamilies based on their sequence homology: I) RHO (RHOA, RHOB,
RHOC); II) RAC (RAC1, RAC1b, RAC2, RAC3, RHOG); III) CDC42 (CDC42, G25K, TC10, TCL,
RHOU/Wrch1, RHOV/Chp); IV) RHOD (RHOD, Rif); V) RND (RND1, RND, RND3); VI) RHOH/TTF
(Fig. 3). The GDP/GTP exchange and the GTP hydrolysis of typical RHO proteins (Jaiswal et al.,
2013b), are regulated by RHOGEF and RHOGAP proteins, respectively. However, in comparison
with RAS family, RHO proteins underlie a third control mechanism, which is achieved by the
function of guanine nucleotide dissociation inhibitors (GDIs) and bind selectively to prenylated
RHO proteins and control their cycle between cytosol and membrane (see chapter IV).
Activation of RHO proteins results in their association with effector molecules that
subsequently activate a wide variety of downstream signaling cascades (Bishop and Hall 2000;
Burridge and Wennerberg 2004).
RHO subfamily
In mammalian, there are three RHO isoforms, RHOA, RHOB and RHOC with well‐known
function in stress fiber formation (Wheeler and Ridley, 2004). RHOA plays roles in cell
migration, cytokinesis and cell cycle progression (Vega and Ridley, 2008). On the other hand,
RHOB introduced as a tumor suppressor, which its down‐regulation was reported in a set of
tumors (Huang and Prendergast, 2006). RHOB regulates the trafficking of the cellular receptors
that limits the growth factors signaling (Huang et al., 2007), and by internalization of E‐
cadherin, and integrin, modulates the cell‐cell adhesion and migration speed (Wheeler and
Ridley, 2007; Vega et al., 2015). RHOC isoform was reported to promote tumor metastasis and
invasion (Pille et al., 2005). Similar to other GTPases, RHO subfamily emerges its cellular
functions by binding to a set of scaffolding: Rhotekin, Rhophilin, mammalian diaphanous
(mDia) and PLC or kinase effector proteins: RHO‐associated coiled‐coil kinases I/II (ROCKI/II),
protein kinase C‐related kinase (PKR) and Citron (Reid et al., 1996; Thumkeo et al., 2013; Amin
et al., 2013).
CDC42 GTPase
CDC42 functions implicate in cellular control of cytoskeleton dynamic, cellular polarity,
migration, adhesion, intracellular trafficking and proliferation (Aznar and Lacal, 2001; Cerione,
2004). CDC42 is famous for its contribution in formation of cell protrusions is called filopodia.
Filopodia is the finger‐shape structure that consists of parallel bundles of actin filaments and
acts as antenna to sense the cellular microenvironment and plays important roles in cell
migration and neuronal outgrowth (Gupton and Gertler, 2007; Mattila and Lappalainen, 2008).
Activated CDC42 targets a set of effectors: p21‐activated kinase (PAK), insulin receptor
substrate p53 (IRSp53), mammalian diaphanous (mDia), Wiskott‐Aldrich syndrome protein
(WASP) (Hemsath et al., 2005) and IQ motif‐containing GTPase‐activating protein (IQGAP)

20
Chapter I
(Cerione, 2004; Sinha and Yang, 2008). CDC42 interaction with WASP and IRSp53 activates the
actin related protein 2/3 (ARP2/3) that mediates the filopodia formation (Hufner et al., 2002;
Lim et al., 2008). mDia was known as a third effector of CDC42 which contributes in filopodia
formation (Peng et al., 2003). Upon CDC42 binding to PAK1 and LIM kinase (LIMK)
phosphorylation, LIMK phosphorylates and inhibits actin depolymerization through cofilin
(Edwards et al., 1999).
RAC subfamily
Based on the sequence homology, RAC subgroup of RHO GTPases consists of five
members: RAC1, RAC1b, RAC2, RAC3, RHOG. RAC proteins involve on lamellipodium formation
and membrane rufflling, which are required for the maintenance of cell morphology and
migration (Kurokawa et al., 2004). RAC isoforms exhibit the individual pattern of gene
expression and they have non‐overlapping functions (Didsbury et al., 1989; Shirsat et al., 1990;
Bolis et al., 2003). RAC1b is alternative splice variant of RAC1 with 19 amino acid insertion near
the switch II region that renders RAC1b in active GTP‐bound form with impaired GTP
hydrolysis (Fiegen et al., 2004). RAC shares some effectors with CDC42 like, mDia2 and PAK,
however has its specific effectors, such as WASP‐family verprolin‐homologous protein (WAVE),
specifically RAC1‐associated protein‐1 (SRA1) and p67PHOX (Kobayashi et al., 1998; Koronakis
et al., 2011; Diebold et al., 2004). Upon RAC1 activation and binding to WAVE, mDia and PAK,
actin polymerization and turn over will be regulated by RAC1 and results in lamellipodia
formation (Jaffe and Hall, 2005; Takenawa and Suetsugu, 2007).
Signaling cross‐talk between RHO and RAS GTPases GTPase‐activating proteins (GAPs) link the RAS and RHO signaling—The GAP proteins
were identified to interconnect the RAS and RHO signaling, which is known to be required for
cell transformation by oncogenic RAS and, cell cycle progression and proliferation by RHO
proteins (Khosravi‐Far et al., 1998; Coleman et al., 2004). Emerging evidence suggests that the
GAPs, in particular p120RASGAP and the RHO‐specific p190ARHOGAP, p200RHOGAP and
deleted in liver cancer 1 (DLC1), act as a linker to coordinate the RAS and RHO signaling
pathways (Shang et al., 2007; Yang et al., 2009; Asnaghi et al., 2010). Frequent loss of DLC1
gene expression was first described in liver (Yuan et al., 1998). DLC1RHOGAP function is
required for the maintenance of cell morphology and the coordination of cell migration (Kim et
al., 2008). p120 contains multiple domains with different functions (Pamonsinlapatham et al.,
2009). While the C‐terminus of p120 with the catalytic GAP activity is responsible for RAS
inactivation (Ahmadian et al., 1997a), its N‐terminal Src homology 2 and 3 (SH2 and SH3)
domains have been suggested to possess effector function (Chan and Chen, 2012). p120
functionally modulates RHO signaling by directly binding to two RHO‐specific GAPs, p190 and
DLC1 (Yang et al., 2009; Asnaghi et al., 2010). The association of p120 with the tyrosine
phosphorylated p190 via its SH2 domain promotes RHO inactivation (Hu and Settleman, 1997;
Herbrand and Ahmadian, 2006). Thus, p120 positively regulates the RHOGAP function of p190.
Another mechanism, which connects the RAS and RHO pathways and regulates the actin

21
Chapter I
cytoskeleton, is dependent on p120 SH3 domain function and controls RHO activation (Leblanc
et al., 1998). This mechanism was later revealed to involve DLC1 but not p190. The p120 SH3
domain (called p120SH3) binds to the RHOGAP domain of DLC1 (called DLC1GAP) and inhibits
the DLC1‐dependent RHO inactivation (Yang et al., 2009). Therefore, p120 acts as a negative
regulator not only for RAS but also for the GAP activity of DLC1 (chapter V).
Scaffolding proteins cross‐link the RAS/RHO signaling components—Scaffolding proteins
are multidomain proteins, which are able to interact with plethora of substrates and control
the spatial and temporal assembling of signaling partners. Thereby, through the tethering
mechanism, they organize the discrete components of signaling pathways in place and time,
(e.g., activators, enzymes and effectors) to increase their interaction efficiency (Scott and
Pawson, 2009; Good et al., 2011). IQGAP proteins emerge diverse cellular functions such as
cell migration, adhesion, cytoskeletal dynamic and cytokinesis (Noritake et al., 2005; White et
al., 2012). By acting as scaffold proteins, IQGAPs organize the signaling partner into close
proximity to enable their interaction/activation and in some cases act as a bridge to connect
distinct signaling pathways (Brown and Sacks, 2006). IQGAP family composes of three
isoforms, IQGAP1, 2 and 3, which are differentially expressed in distinct tissues. In addition to
share a set of binding partners, each isoform possesses its specific binding partners and
therefore contributes to different cellular processes (Weissbach et al., 1994; Brill et al., 1996;
Wang et al., 2007). For instance, IQGAP1 was recognized as an oncogene where IQGAP2 is a
tumor suppressor (White et al., 2009b; White et al., 2010b). IQGAP1 can interact with
different signaling components of MAPK pathway, RTKs, KRAS, BRAF/CRAF, MEK1/2 and
ERK1/2, and directs the information flow from the EGF to ERK1/2 phosphorylation (Roy et al.,
2004; Roy et al., 2005; Ren et al., 2007). In addition to scaffold the RAS signaling components,
IQGAP1 was identified to interact with RHO family GTPase, RAC1 and CDC42, and promotes
the cell migration (Mataraza et al., 2003a). Upon hyaluronan (HA) stimulation of CD44
receptor, IQGAP1 anchors the CDC42 and ERK2 to CD44 and F‐actin that results in
phosphorylation of ERK2. Therefore, it bridges the MAPK pathways to cytoskeleton
organization machinery (Bourguignon et al., 2005) (chapter VI).
Disease models indicate the coordination of RAS and RHO mutations in tumor
progression—As we discussed earlier there are different levels of RAS and RHO cross‐talking:
at the levels of GAP or scaffolding proteins. However, there are emerging lanes of evidences
that indicate the coexistence of RAS and RHO mutations in tumors. Mano and colleagues,
reported that the oncogenic mutation of RAC1N92I beside the NRASQ61K mutation drives the
growth of human sarcoma cell line, HT1080 (Kawazu et al., 2013). Juvenile myelomonocytic
leukemia (JMML) is a rare and early childhood severe myeloproliferative neoplasm that is
resulted from infiltration of overproduced myelomonocytic cells to organs, such as liver,
spleen and intestine. Pathological studies revealed that the JMML is initiated by germline or
somatic RAS‐activating mutations (Chang et al., 2014). JMML is considered a unique example
of RAS‐driven oncogenesis since it is thought to be initiated by mutations, usually described as
mutually exclusive, in RAS genes (NRAS, KRAS) or RAS‐pathway regulators (PTPN11, NF1 or

22
Chapter I
CBL) (Niemeyer, 2014). Genetic profiling of the JMML patient with NRAS mutation depicted
the second mutation which belongs to RHO GTPase (RAC2) (Caye et al., 2015). However, the
mechanisms that RAC2 mutation coordinates with NRAS transformation need further
investigation (chapter VII).

23
Aims and objectives
Hepatic stellate cells (HSCs) play pivotal roles in liver development, immunoregulation,
homeostasis, regeneration, and pathology. In addition, they emit a remarkable plasticity in
their phenotype, expression profile and function. HSCs are able to develop to cells that
contribute in liver regeneration or in pathological situations promote scar formation and liver
fibrosis (see Figs. 1C, D and E). However, little is known about the intracellular signaling
networks, which orchestrate HSCs plasticity and their bilateral functions as positive and
negative regulators of liver damage responses. Therefore, it is noteworthy to reconsider the impact of different signaling pathways on HSC fate decision and obtained information will lead
future studies to find pharmacological drugs that target HSC activation and shift them to
participate in liver regeneration. In this study, we set out to cover the activities and functions
of RAS dependent signaling pathways in both quiescent HSC (qHSC) and activated HSC (aHSC)
and generate a new model that will help to a better understanding of signaling networks of
HSC (Fig. 8). This will provide hope for the patients with liver problems to restore their liver
regeneration responses.
At the first, we tried to get an overview about which RAS isoforms are mostly influenced by
the HSC activation processes. Therefore, by the aim of isoform specific qPCR primers, we
sought for the expressional changes of different RAS family members and their signaling
compartments during the HSC activation. We found a novel member of RAS family, ERAS,
specifically expressed in qHSC not aHSC where other RAS isoforms did not show significant
changes or get up‐regulated. The molecular properties, regulation and function of this new
RAS member is poorly understood. Therefore, we comprehensively investigated biochemical
and structural characteristics of exogenous ERAS to get an overview of the physiological
functions of ERAS (see chapter II).
Second, we aimed to detect and analyze ERAS protein in HSC. Therefore, we generated an
anti‐rat ERAS antibody that specifically recognized ERAS not other RAS proteins. With this
study, we reported for the first time, the endogenous expression of ERAS in non‐malignant and
normal cells of the body. Therefore, it was noteworthy to reinvestigate our obtained data from
overexpressed ERAS in endogenous system and find out the signaling networking of ERAS in
qHSC as well as monitor signaling activity of RAS proteins in aHSC (chapter III).
Activated HSCs are enabling to contract and migrate as a consequent of RHO signaling
activity. We extended and shared our knowledge about molecular properties and regulation of
RHO GTPases as a book chapter (chapter IV). Next, we aimed to find a possible cross‐talk
between RHO and RAS GTPases in two distinct levels; I) GTPase activation proteins of p120,
p190 and DLC1 (deleted in liver cancer1) (chapter V). II) Scaffolding proteins such as IQGAP
isoforms (chapter VI). Through conducting these studies to cell based analysis in HSCs, we
revealed interesting aspect of scaffolding and cross‐linking between RAS and RHO proteins. At
the end, we tried to find a link between RHO and RAS mutations in disease progression with
the aid of whole genomic sequencing of the juvenile myelomonocytic leukemia (JMML)
patients (chapter VII).

24
Chapter II
The function of embryonic stem cell‐expressed RAS (ERAS), a unique RAS family member, correlates with its additional motifs and its structural properties
Published in: The journal of biological chemistry
Impact factor:
Own Proportion to this work:
4.56 (2014)
85%
Site direct mutagenesis
Cloning
Transfection
Confocal microscopy
Pull‐down assay
Immunoblotting
Preparing of the manuscript
Graphical Abstract

25
Chapter II

26
Chapter II

27
Chapter II

28
Chapter II

29
Chapter II

30
Chapter II

31
Chapter II

32
Chapter II
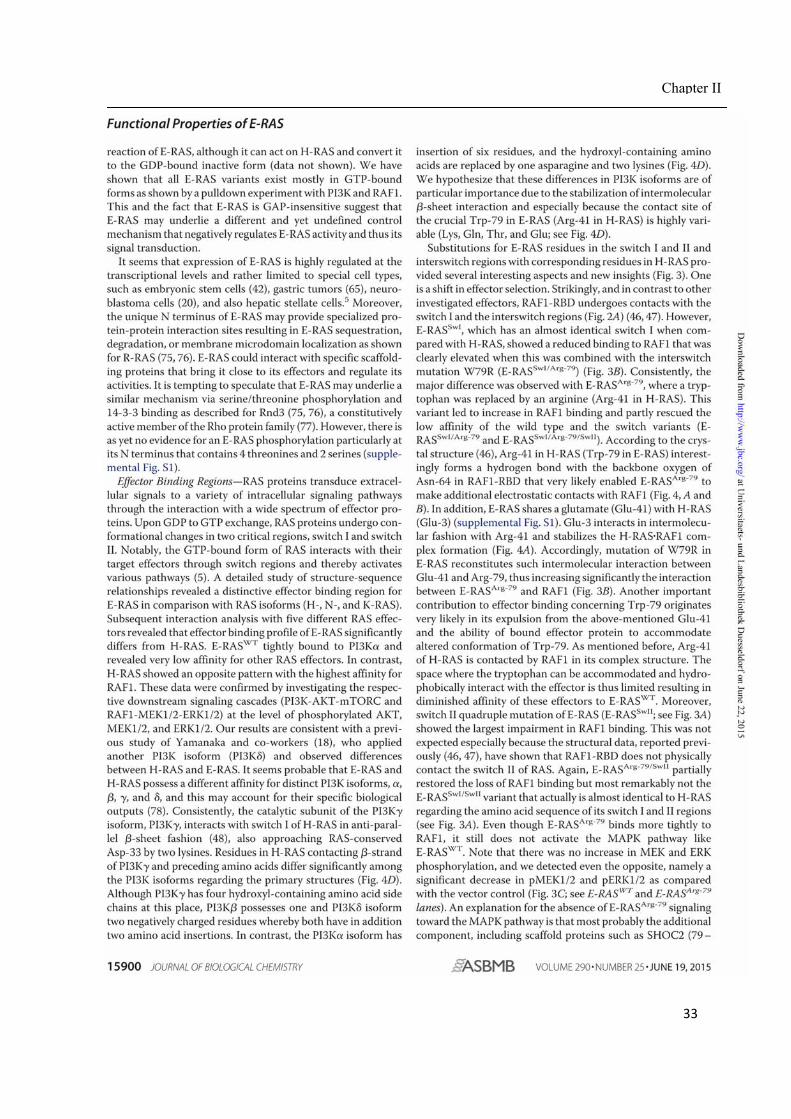
33
Chapter II
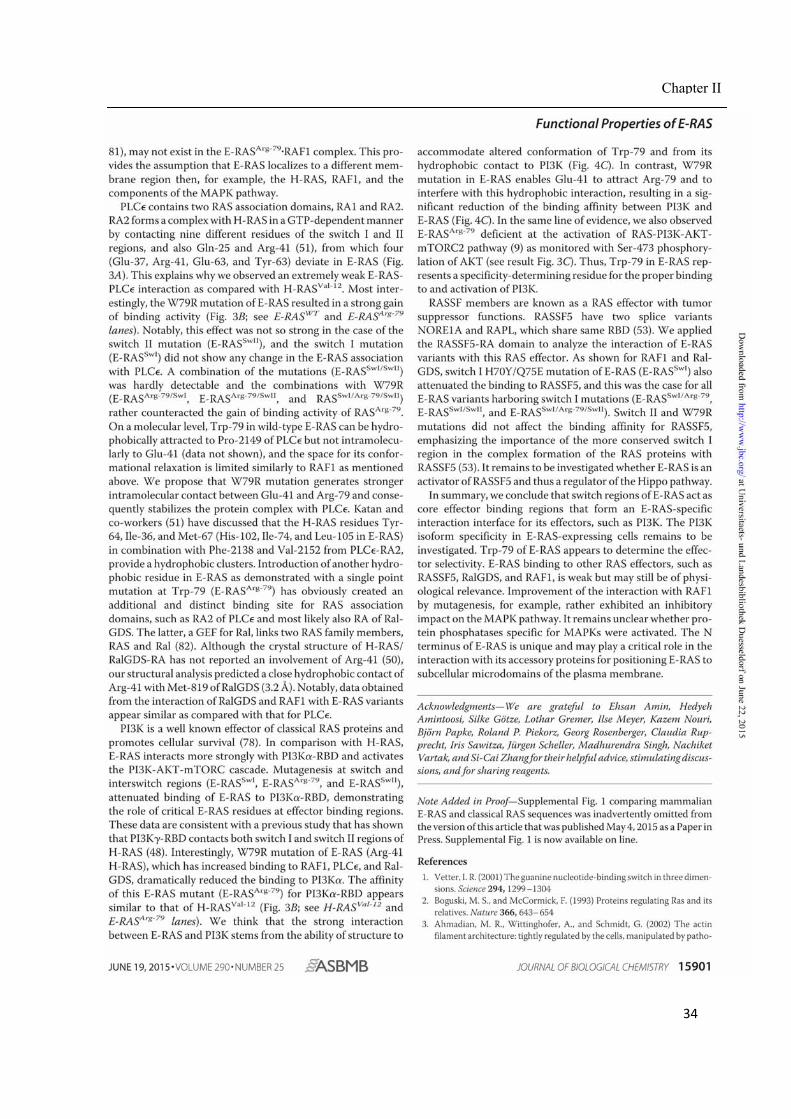
34
Chapter II

35
Chapter II

36
Chapter II

37
Chapter II

38
Chapter III
Embryonic stem cell‐expressed ERAS controls quiescence of hepatic stellate cells
Published in: The journal of biological chemistry Impact factor:
Own Proportion to this work:
4.56 (2014)
85%
Site direct mutagenesis
Cloning
Transfection
RNA isolation
Real‐time PCR
Confocal microscopy
Pull‐down assay
Immunoprecipitation
Immunoblotting
Preparing of the manuscript
Graphical Abstract

39
Chapter III

40
Chapter III

41
Chapter III

42
Chapter III

43
Chapter III

44
Chapter III

45
Chapter III

46
Chapter III

47
Chapter III
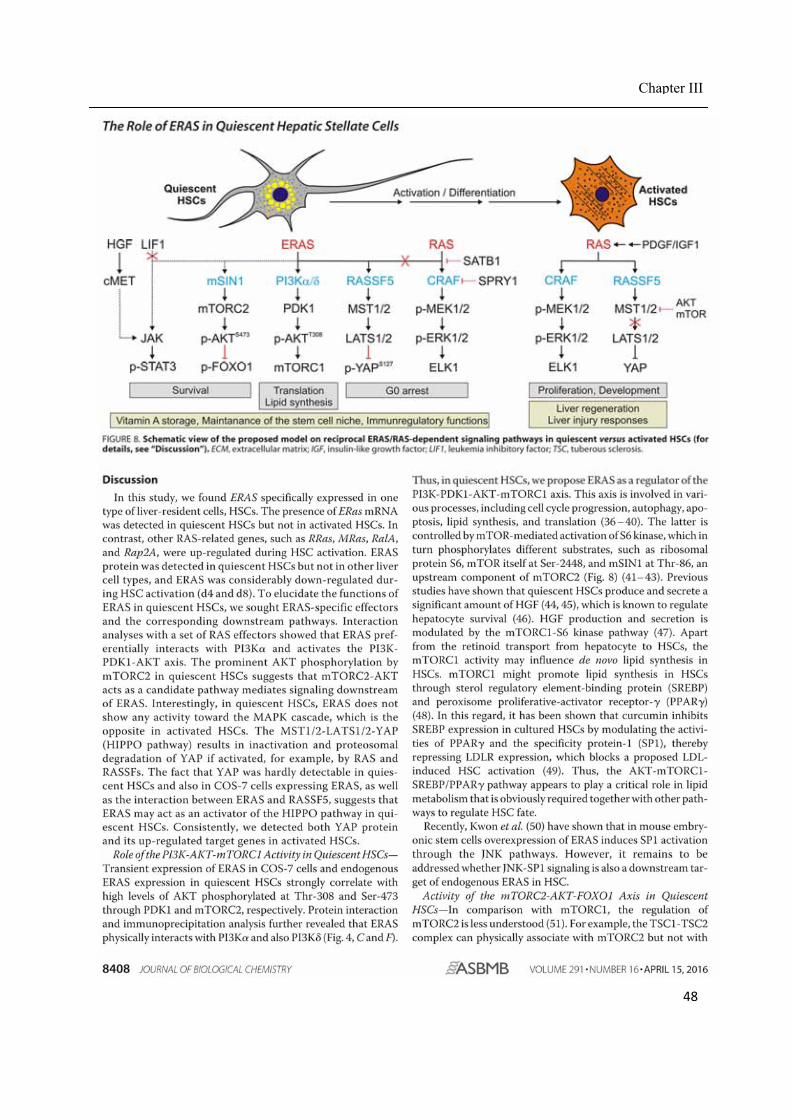
48
Chapter III

49
Chapter III

50
Chapter III

51
Chapter III

52
Chapter III

53
Chapter III

54
Chapter III

55
Chapter III

56
Chapter III

57
Chapter III

58
Chapter IV
Classical RHO proteins: biochemistry of molecular switch function and regulation
Published in: Springer Vienna
Impact factor:
Own Proportion to this work:
Book chapter (not available)
10%
Writing the manuscript
Graphical Abstract
59
Chapter IV

60
Chapter IV

61
Chapter IV

62
Chapter IV

63
Chapter IV
64
Chapter IV

65
Chapter IV

66
Chapter IV

67
Chapter IV
68
Chapter IV

69
Chapter IV

70
Chapter IV

71
Chapter IV

72
Chapter IV
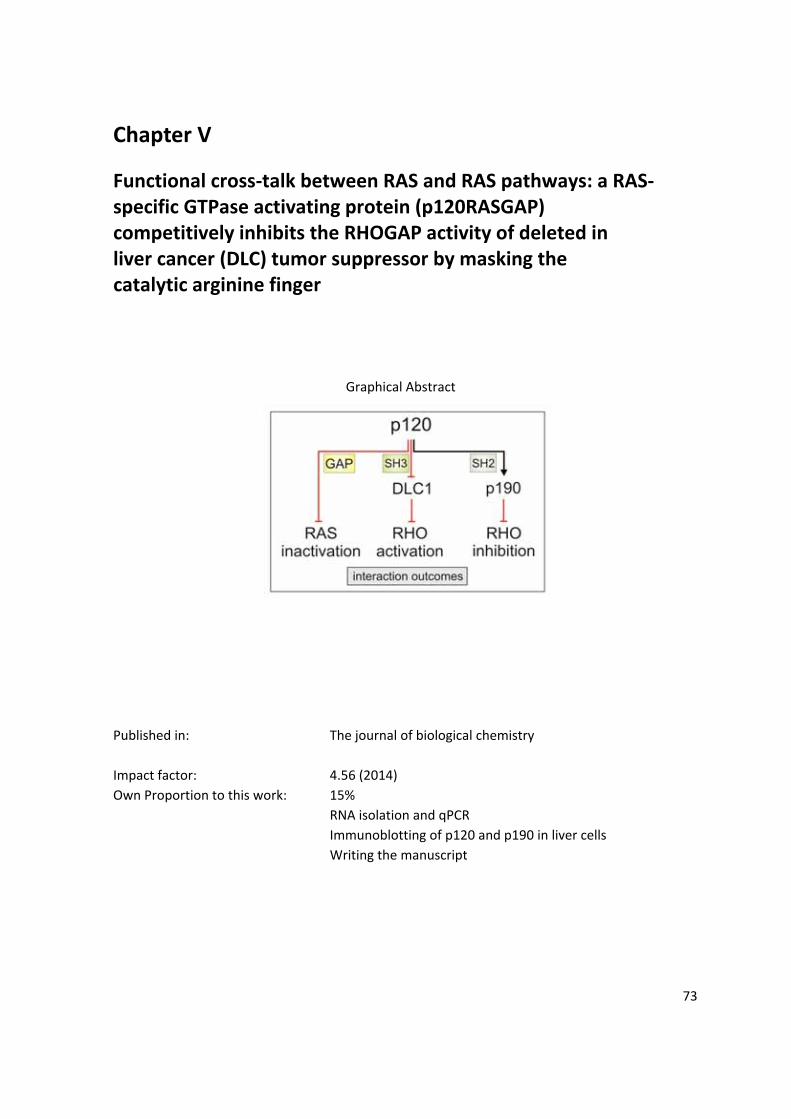
73
Chapter V
Functional cross‐talk between RAS and RAS pathways: a RAS‐specific GTPase activating protein (p120RASGAP) competitively inhibits the RHOGAP activity of deleted in liver cancer (DLC) tumor suppressor by masking the catalytic arginine finger
Published in: The journal of biological chemistry
Impact factor:
Own Proportion to this work:
4.56 (2014)
15%
RNA isolation and qPCR
Immunoblotting of p120 and p190 in liver cells
Writing the manuscript
Graphical Abstract

74
Chapter V

75
Chapter V

76
Chapter V

77
Chapter V

78
Chapter V

79
Chapter V

80
Chapter V

81
Chapter V

82
Chapter V

83
Chapter V

84
Chapter V
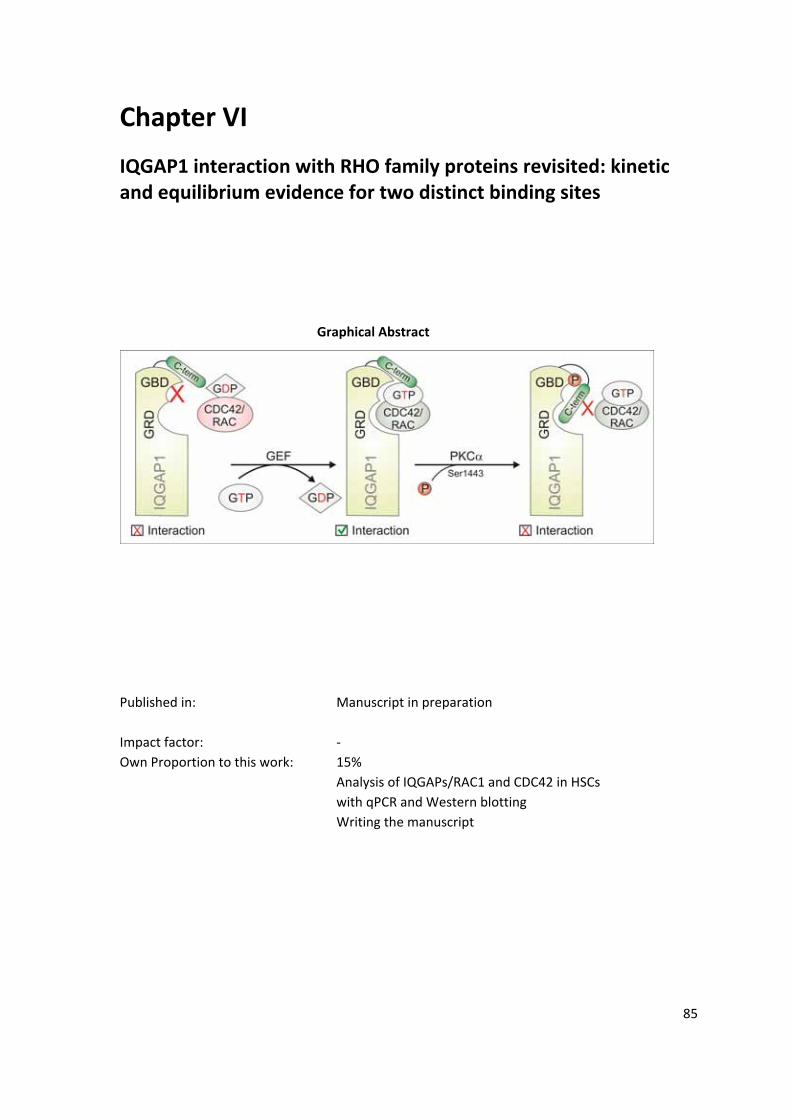
85
Chapter VI
IQGAP1 interaction with RHO family proteins revisited: kinetic and equilibrium evidence for two distinct binding sites
Published in: Manuscript in preparation
Impact factor:
Own Proportion to this work:
‐
15%
Analysis of IQGAPs/RAC1 and CDC42 in HSCs
with qPCR and Western blotting
Writing the manuscript
Graphical Abstract

86
Chapter VI
IQGAP1 interaction with RHO family proteins revisited:
kinetic and equilibrium evidence for two distinct binding sites*
Kazem Nouri1, Eyad K. Fansa1§, Ehsan Amin1, Saeideh Nakhaei‐Rad1, Radovan Dvorsky1, Lothar
Gremer2, David J. Timson3, Lutz Schmitt4, Dieter Häussinger5, and Mohammad R. Ahmadian1@
1Institute of Biochemistry and Molecular Biology II, Medical faculty of the Heinrich‐Heine University, 40225 Düsseldorf, Germany
2Institute of Physical Biology, Heinrich‐Heine University, Düsseldorf, Germany
3School of Pharmacy and Biomolecular Sciences, University of Brighton, Huxley Building, Lewes Road, Brighton BN2 4GJ, United Kingdom
4Institute of Biochemistry, Heinrich‐Heine University, Düsseldorf, Germany
5Clinic of Gastroenterology, Hepatology and Infectious Diseases, Medical Faculty of the Heinrich‐Heine University, Düsseldorf, Germany
*Running title: New IQGAP binding mode for the RAC‐/CDC42‐like proteins
§Current Address: Structural Biology Group, Max Planck Institute, Dortmund, Germany
@To whom correspondence should be addressed: Prof. Dr. Mohammad Reza Ahmadian, Institut für
Biochemie und Molekularbiologie II, Medizinische Fakultät der Heinrich‐Heine‐Universität, Universitätsstr.
1, Gebäude 22.03, 40255 Düsseldorf, Germany, Tel.: #49‐211‐811 2384, #Fax: 49‐211‐811 2726, e‐mail:
reza.ahmadian@uni‐duesseldorf.de
Abbreviations: aa, amino acids; A (ala), alanine ; CBB, coomassie brilliant blue; CDC42, cell
division control protein 42 homolog; CHD, calponine homology domain; D (asp), aspartic acid; E
(glu), glutamic acid; FL, full‐length; GAP, GTPase‐activating protein; GBD, GTPase‐binding
domain; GDP, guanosine diphosphate; GEF, guanine‐nucleotide‐exchange factor; GRD, GAP‐
related domain; GTP, guanosine triphosphate; GTPases, guanosine triphosphatases; H (his),
histidine; HCC, hepatocellular carcinoma; HSC, hepatic stellate cell; IQ, protein sequences
containing Iso/Leu and Gln residues; IQGAPs, IQ‐domain GTPase‐ activating proteins; kDa, kilo
dalton; PAK, p21‐activated kinase; PKC, protein kinase C; RAC, RAS‐related C3 botulinum toxin
substrate; RHO, RAS homolog; S (ser), serine; W (trp), tryptophan; WASP, wiskott–aldrich‐
syndrome protein; WT, wild type; WW, tryptophan‐containing protein domain

87
Chapter VI
ABSTRACT The scaffolding IQ motif‐containing GTPase activating protein 1 (IQGAP1) plays a central role
in the physical assembly of relevant signaling networks that are responsible for various cellular
processes, including cell adhesion, polarity and transmigration. Amongst various proteins, RAC1
and CDC42, have been also proposed to interact with the GAP‐related domain (GRD) of IQGAP1,
however, the exact nature of this interaction process has remained obscure. Here, we
demonstrate that (i) IQGAP1 associates with six different RAC‐ and CDC42‐related proteins but
not with other members of the RHO family, including the RHO‐and RND‐proteins, and (ii) unlike
published models, IQGAP1 interaction with RAC‐ and CDC42‐related proteins underlies a two‐
step binding mechanism, first a low‐affinity, largely nucleotide‐independent binding of GRD
outside the switch regions, and second a high‐affinity, GTP‐dependent binding of the RHO
GTPase binding domain (GBD) to the switch region. These data were confirmed by
phosphomimetic mutations of S1443 in GBD, which resulted in complete abolishment of the
IQGAP1 interaction with RAC1 and CDC42, clearly indicating that S1443 phosphorylation by
protein kinase C is critical for these interactions. Taken together, these results provide the field
with new insights into interaction characteristics of IQGAP1 and highlight the complementary
importance of kinetic and equilibrium analyses. Therefore, herein, we challenge the paradigm
that the ability of IQGAP1 to interact with RAC/CDC42 proteins is based on a two‐step binding
process which is a prerequisite for IQGAP1 activation and a critical mechanism in temporal
regulation and integration of IQGAP1‐mediated cellular responses.
Key words: CDC42, GBD, GRD, stopped‐flow, fluorescence, polarization, anisotropy, interaction,
IQGAPs, RAC1, RHOA, RHO family

88
Chapter VI
INTRODUCTION
The RHO family proteins are known to play an important role in diverse cellular processes and
progression of different diseases, such as cardiovascular diseases, developmental and
neurological disorders, tumor invasion and metastasis as well as regulating liver regeneration
(Yuan et al., 2009; Fukata et al., 2003; Hall, 2012). RHO proteins share two common functional
characteristics, membrane anchorage and an on/off switch cycle (Dvorsky and Ahmadian, 2004).
Subcellular localization of RHO proteins to different cellular membranes is known to be critical
for their biological activity. This is achieved by a hyper variable region (HVR) (Lam and Hordijk,
2013) and a lipid anchor in their C‐terminal tail at a distinct cysteine residue in the CAAX motif (C
is cysteine, A is any aliphatic amino acid, and X is any amino acid) (Wennerberg and Der, 2004).
RHO protein function is dependent on the guanine nucleotide‐binding (G) domain that contains
the principle binding center for GDP and GTP and presents depending on its nucleotide‐bound
state various contact sites for regulators and effectors (Dvorsky and Ahmadian, 2004). Thus,
membrane‐associated RHO proteins act, with some exceptions (Jaiswal et al., 2013b), as
molecular switches by cycling between an inactive GDP‐bound state and an active GTP‐bound
state. This cycle underlies two critical intrinsic functions, the GDP‐GTP exchange and GTP
hydrolysis (Jaiswal et al., 2013b) and is controlled at least three classes of regulatory proteins
(Dvorsky and Ahmadian, 2004): (i) Guanine nucleotide exchange factors (GEFs) catalyze the
exchange of GDP to GTP and activate the RHO protein (Jaiswal et al., 2013a; Rossman et al.,
2005); ii) GTPase activating proteins (GAPs) stimulate the GTP hydrolysis and convey the RHO
protein in its inactive conformation (Tcherkezian and Lamarche‐Vane, 2007; Jaiswal et al., 2014);
(iii) Guanine nucleotide dissociation inhibitors (GDIs) bind to prenylated RHO proteins and
extract them from the membranes into the cytoplasm (DerMardirossian and Bokoch, 2005;
Garcia‐Mata et al., 2011; Tnimov et al., 2012; Zhang et al., 2014a). The formation of the active
GTP‐bound state of RHO proteins is accompanied by a conformational change in two regions,
known as switch I and II (Dvorsky and Ahmadian, 2004), which provide a platform for the
selective interaction with structurally and functionally diverse effectors, e.g. p21‐activated kinase
1 (PAK1) (Lei et al., 2000), p67phox a member of the NSDPH oxidase (Lapouge et al., 2000),
semephorin receptor Plexin B1 (Fansa et al., 2013; Hota and Buck, 2012) as well as the IQ motif‐
containing GTPase activating proteins (IQGAPs) (Watanabe et al., 2015; Hedman et al., 2015).
In mammals, three isoforms of IQGAPs are expressed: IQGAP1, IQGAP2 and IQGAP3. These
homologues have similar domain compositions but different subcellular localization, tissue
expression and functions (White et al., 2009a; Watanabe et al., 2015). This class of proteins
activates a wide variety of downstream signaling cascades (Bishop and Hall, 2000; White et al.,
2012; White et al., 2009a; Abel et al., 2015), thereby regulating many important physiological
and pathophysiological processes in eukaryotic cells (Heasman and Ridley, 2008a; Watanabe et
al., 2015; Smith et al., 2015b). Among IQGAP isoforms, IQGAP1 is ubiquitously expressed and is
the most investigated member of IQGAP family, and our understanding mainly relies on the
evidences from IQGAP1. IQGAP1 is involved in wide spectrum of cellular processes, such as
adhesion, cell polarity and directional migration (White et al., 2012) and also cancer progression
(White et al., 2009a; Johnson et al., 2009) via binding to RHO protein. The domain organization
of IQGAP1 is highly conserved in IQGAP family consisting of an N‐terminal calponin homology
domain (CHD), a coiled‐coil repeat region (CC), a tryptophan‐containing proline‐rich motif‐

89
Chapter VI
binding region (WW), four isoleucine/glutamine‐containing motifs (IQ), a RASGAP‐related
domain (GRD), an originally called RASGAP C‐terminal domain (RGTC) (White et al., 2012), which
we called a GTPase‐binding domain (GBD) in this study, and a C‐terminal domain (C).
IQGAP2 and IQGAP3 are also able to bind RHO proteins (McCallum et al., 1996; Brill et al.,
1996; Wang et al., 2007; Nojima et al., 2008). IQGAP2 has 62% sequence identity to IQGAP1 and
is expressed predominantly in the liver, but can be detected in stomach, prostate, thyroid, testis,
kidney, platelets and salivary glands (Watanabe et al., 2015; Brill et al., 1996; Wang et al., 2007;
Schmidt et al., 2003; Cupit et al., 2004). IQGAP3 is enriched in brain, testis, lung, small intestine,
and colon (Mateer et al., 2003; Wang et al., 2007; Brandt and Grosse, 2007; Smith et al., 2015a;
Schmidt et al., 2003; Nojima et al., 2008). Recent differential gene expression analysis revealed a
reciprocal expression of IQGAPs in Hepatocellular carcinoma (HCC) and subsequently opposing
functions (White et al., 2010a). Given that IQGAP proteins share a domain structure and have
sequence homology, such a paradoxical phenomenon may be due to their protein binding
partners, subcellular localization and diverse tissue expression.
Furthermore, in hepatic stellate cells (HSCs) has been shown that Iqgap1 deficiency promotes
myofibroblast activation, tumor implantation, and metastatic growth in mice via upregulation of
paracrine signaling molecules (Liu et al., 2013a). In spite of having RASGAP homology domain,
none of these three isoforms have GTPase‐activating protein (GAP) activity. GAPs increase the
intrinsic activity of RHO proteins and inactivate them. By contrast, IQGAP proteins exhibit an
inhibitory effect on the intrinsic GTPase activity of the RHO family members CDC42 and RAC1,
thereby stabilize them in their active GTP‐bound form (Hart et al., 1996; Ho et al., 1999; Brill et
al., 1996). Apart from RAC1 and CDC42, a multitude of IQGAP interacting partners have been
reported to date (White et al., 2012; Malarkannan et al., 2012; Liu et al., 2014a; Pathmanathan
et al., 2011; Abel et al., 2015; Smith et al., 2015b; Watanabe et al., 2015). From IQGAP family,
IQGAP1 has been implicated as a drug target although the molecular mechanism of the IQGAP1
functions is unclear. A prerequisite to achieve these functions is the dissection of its distinct
domains and the analysis of their interactions with desired protein partners.
Work from several laboratories has shown that the C‐terminal half of IQGAP1 (amino acids
863‐1657), encompassing GRD (amino acids 1025‐1238) and RGTC (called GBD in this study;
amino acids 1451‐1583), binds physically to active, GTP‐bound forms of CDC42 and RAC1
(McCallum et al., 1996; Zhang et al., 1998; Elliott et al., 2012; Owen et al., 2008). IQGAP1 GRD,
which is structurally a homologous but functionally an inactive RASGAP (Kurella et al., 2009), also
undergoes interaction with RAC1 and CDC42, although with a lower affinity than the larger
protein fragment, containing GRD and RGCT (Owen et al., 2008; Kurella et al., 2009). These
works together with homology modeling, based on the RHOGAP in complex with RHOA (Rittinger
et al., 1997) and CDC42 (Nassar et al., 1998), and RASGAP in complex with HRAS (Scheffzek et al.,
1997), provided a structural model of IQGAP1 GRD that contacts the switch regions of the GTP‐
bound CDC42 (Mataraza et al., 2003b; Owen et al., 2008; Kurella et al., 2009). In contrast,
another study has shown phosphomimetic variants of IQGAP1 at position S1441 and S1443 were
significantly impaired in interacting with active CDC42 (Elliott et al., 2012). This strongly indicates
that regions downstream of GRD, may also be critical in the interaction with RAC1 and CDC42. In
an attempt to resolve this controversy, we set out to investigate comprehensively the structure‐
function relationship of IQGAP1 interaction with the RHO proteins. Detailed characterization of

90
Chapter VI
the IQGAP1 interaction with the RHO family members, using time‐resolved fluorescence
spectroscopy, provided unprecedented insights into the structure, function, and mechanistic
properties of IQGAP1, especially regarding its interaction with RAC‐ and CDC42‐like proteins.
Obtained data showed that GRD‐C associated with the RAC‐ and CDC42‐like proteins (RAC1,
RAC2, RAC3, RHOG, CDC42, and TC10), but not with RHOA, RHOB, RHOC, RHOD, TCL, RND and
RIF. Furthermore, GRD1 and GRD2 do not associate with RAC1 under this experimental
condition. We next investigated the effect of the last 99 amino acids of IQGAP1 on RAC1 and
CDC42 binding and our results clearly suggest that the very C‐terminal region of IQGAP1 may
negatively regulate GBD‐RAC1/CDC42 interaction. Moreover, we found that point mutations of
the PKCα phosphorylation sites (S1441 and S1443) differently affect GRD‐GBD association with
RAC1/CDC42‐mantGppNHp. Additionally, equilibrium measurement using fluorescence
polarization experiments showed that IQGAP1GRD2 also interacts with RAC1 and CDC42 but with
a much lower affinity and in a largely nucleotide‐independent manner as compared with
IQGAP1GRD‐C. Results described here clearly suggest that IQGAP1 binds RAC1‐ and CDC42‐like
proteins at least at two sites by utilizing the GBD domain rather than the GRD domain to contact
the switch regions.
MATERIALS AND METHODS
Constructs. Different variants of pGEX vectors (pGEX2T, pGEX4T‐1, pGEX3) encoding an N‐
terminal glutathione S‐transferase (GST) fusion protein were used for the overexpression of
various human IQGAP1 (Acc. no. P46940) variants (aa 863‐1345, 962‐1345, and 863‐1657, 877‐
1558, 877‐1558 S1443E and S1443A), human Plexin‐B1 (Acc. no. O43157) (aa 1724‐1903), human
p67phox (Acc. no. P19878) (aa 1‐203), human PAK1 (Acc. No. Q13153) (aa 57‐141), murine TIAM1
DH‐PH (Acc. no. Q60610) (aa 1033–1404), human TrioN DH‐PH (Acc. no. O75962) (aa 1226–
1535), and human RHOGDIα (Acc. no. P52565) as well as human RHO‐related genes, i.e. RAC1
(Acc. no. P63000) (aa 1‐179), RAC2 (Acc. no. P15153) (aa 1‐192), RAC3 (Acc. no. P60763) (aa 1‐
192), RHOG (Acc. no. P84095) (aa 1‐178), RHOA (Acc. no. P61586) (aa 1‐181), RHOB (Acc. no.
P62745) (aa 1‐181), RHOC (Acc. no. P08134) (aa 1‐181), CDC42 (Acc. no. P60953) (aa 1‐178),
TC10 (Acc. no. P17081) (aa 2‐193), TCL (Acc. no. Q9H4E5) (aa 2 – 197), RND1 (Acc. no. Q92730)
(aa 1‐232), RND2 (Acc. no. P52198) (aa 26‐184), RND3 (Acc. no. P61587) (aa, 1‐244), RIF (Acc. no.
Q9HBH0) (aa 1‐195), and mouse RHOD (Acc. no. P97348) (aa 2‐193). pET46 EkLIC vector (Merck,
Nottingham, United Kingdom) was used for the overexpression of IGQAP1 877‐1558 S1441E,
S1143D, S1441A/S1443A, and S1441E/S1443D mutants as a his tag protein. The Kazusa cDNA
clone KIAA0051 (Suyama et al., 1999) was used as a template for making mutants.
Proteins. All proteins were purified according to the protocols described (Fiegen et al., 2002;
Hemsath and Ahmadian, 2005; Jaiswal et al., 2013b). Nucleotide‐free RHO proteins were
prepared using alkaline phosphatase (Roche) and phosphodiesterase (Sigma Aldrich) at 4°C as
described (Jaiswal et al., 2012). Fuorescent methylanthraniloyl (mant) was used to generate
mantGDP and mantGppNHp bound RHO proteins, where GppNHp is non hydrolayzable analog of
GTP. Quality and concentrations of labeled proteins were determined as described (Jaiswal et al.,
2012).

91
Chapter VI
Fluorescence measurements. Kinetics measurements were monitored by stopped‐flow
apparatus (Hi‐Tech Scientific SF‐61 with a mercury xenon light source and TgK Scientific Kinetic
Studio software), and performed as described (Hemsath and Ahmadian, 2005). The observed
rate constants were fitted single exponentially using the GraFit program (Erithacus software).
Fluorescence polarization. Experiments were performed in a Fluoromax 4 fluorimeter in
polarization mode as described (Nouri et al., 2015). The dissociation constant (Kd) were
calculated by fitting the concentration dependent binding curve using a quadratic ligand binding
equation.
Cell isolation and culture. Livers from male Wistar rats (local animal facility of the Heinrich Heine
University) were enzymatically digested with collagenase H (Roche, Germany) and protease E
(Merck, Germany). Primary hepatic stellate cell (HSC) isolation was followed by density gradient
centrifugation. HSCs were feeded with Dulbecco's Modified Eagle Medium (DMEM)
supplemented with 15% fetal calf serum and 50 units of penicillin/streptomycin (Gibco® Life
Technologies).
Reverse transcriptase polymerase chain reaction. To isolated RNA, cells were lysed by QIAzol
lysis reagent (QIAGEN, Germany) and proceed with RNeasy plus kit (Qiagen, Germany). To
eliminate any possible genomic DNA contaminations, isolated RNAs were subjected to DNase
with the DNA‐free™ DNA Removal Kit (Ambion, Life Technologies, Germany). Transcrption of the
RNA to first strand complementary DNA (cDNA) was followed by using the ImProm‐II™ reverse
transcription system (Promega, Germany). Quantitative polymerase chain reaction (qPCR) was
performed using the SYBR Green reagent (Life Technologies, Germany). Primers are listed in
Table S1. 2‐∆Ct method was used to calculate the mRNA levels according to relative endogenous
levels of the HPRT1.
Immunoblotting. Cell membranes and nuclei were disturbed with lysis buffer (50 mM Tris‐HCl
pH 7.5, 100 mM NaCl, 2 mM MgCl2, 1% Igepal CA‐630, 10% glycerol, 20 mM beta‐
glycerolphosphate, 1 mM Ortho‐Na3VO4, 1 EDTA‐free inhibitor tablet). To normalize the amount
of the total proteins, the Bradford assay applied to measure the protein concentration (Bio‐Rad).
Primary antibodies to mouse γ‐tubulin (# T5326) Sigma‐Aldrich; mouse RAC1 (05‐389) millipore;
rabbit CDC42 (2462) cell signaling; mouse IQGAP1 (ab56529) and rabbit IQGAP2 (ab181127)
abcam were diluted in 5% non‐fat milk (Merck, Germany)/TBST (Tris‐buffered saline, 0.05%
Tween 20), and incubated overnight in 4˚C. After washing steps, membranes were incubated
with horseradish peroxidase‐coupled secondary antibodies for 1 h and signals were visualized by
the ECL detection system (GE Healthcare) and images were collected using the ChemoCam
Imager ECL (INTAS science imaging, Germany).
RESULTS
IQGAP1GRD‐C selectively associates with various RAC‐ and CDC42‐like proteins
Kinetics of IQGAP1GRD‐C (IQGAP1863‐1657; Fig. 1) association with different RHO proteins was
monitored using stopped‐flow fluorescence spectroscopic methods established previously
(Hemsath et al., 2005). MantGppNHp (Fig. 2A) is a fluorescent, non‐hydrolysable GTP analog and
stopped‐flow fluorescence is a direct way to monitor the association between two proteins in

92
Chapter VI
real‐time (Jaiswal et al., 2012). Rapid mixing of GRD‐C with active, mantGppNHp bound RAC1
and CDC42 resulted in change in fluorescence (Figs. 2B and 2F green trace), which represents the
RAC1/CDC42‐IQGAP1 association reaction. Under the same conditions, most remarkably, we did
not observe any fluorescence change when mixing RAC1/CDC42‐mantGppNHp with GRD itself
(IQGAP1962‐1345) (Figs. 2B and 2F red trace). This was unexpected because GRD has been generally
accepted as the RAC1‐ and CDC42‐binding domain of IQGAP1 to date (Owen et al., 2008; Kurella
et al., 2009; Elliott et al., 2012; Hart et al., 1996; Ho et al., 1999; Kuroda et al., 1998; Mataraza et
al., 2003b). Under the same conditions we measured kinetics for other members of the RHO
family and evaluated the data by single exponential fitting to obtain the respective observed rate
constants (kobs). Data presented in figure 2B‐G show that GRD‐C associated with various RAC‐
and CDC42‐like proteins (RAC1, RAC2, RAC3, RHOG, CDC42 and TC10), but not with RHOA, RHOB,
RHOC, RHOD, TCL and RIF. Mixing of mantGppNHp‐bound form of the latters did not result in a
fluorescence change (Fig. 2H). Due to instability, fluorescently labeled RND proteins could not be
prepared. Therefore, their association with GRD‐C was measured indirectly by premixing excess
amounts of GTP‐bound RND proteins with GRD‐C before measuring its association with RAC1‐
mantGppNHp. RND1, RND2 and RND3 did not interfere with the RAC1‐IQGAP1 interaction (Fig.
2I), indicating that IQGAP1 does also not associate with RND proteins under these conditions,
while Figure 2J shows association competition of mantGppNHp∙RAC1 with IQGAP1GRD‐C in the
presence of excess amount of CDC42, or vice versa.
RAC2 showed highest affinity for IQGAP1GRD‐C
In some studies was previously shown that the binding affinity of CDC42 for IQGAP1 was
considerably higher than that of RAC1 for IQGAP1 (see Table 1) (Zhang et al., 1998; McCallum et
al., 1996; Zhang et al., 1997). Later Owen et al. reported that, IQGAP1 has similar affinities for
both RAC1 and CDC42 (see Table 1) (Owen et al., 2008). Here individual kinetic parameters were
determined for the interaction of IQGAP1GRD‐C with RAC‐ and CDC42‐like proteins under
conditions described previously (Hemsath and Ahmadian, 2005). An incremental increase in
fluorescence was observed when increasing the concentrations of GRD‐C were rapidly mixed
with RAC1‐mantGppNHp (Fig. 3A). Increase in fluorescence was also observed for other RAC‐ and
CDC42‐like proteins except for CDC42 that the mode of interaction was different and we
observed decrease in fluorescence (Fig. S3). Association kinetics was then performed for all
other RAC‐ and CDC42‐like proteins. kobs values obtained by a single exponential fitting were
evaluated in a linear fashion as a function of the GRD‐C concentration (Fig. 3B), which yielded
the respective association rate constants (kon). The dissociation of GRD‐C from its complex with
RAC1‐mantGppNHp was measured in a displacement experiment when excess amounts of RAC1‐
GppNHp were rapidly mixed with the complex. This led expectedly to fast decrease (for CDC42;
increase) in fluorescence (Figs. S2 and S4), which was also observed for other RAC‐ and CDC42‐
like proteins (data not shown). Exponential fitting of the curves yielded the dissociation rate
constants (koff). The dissociation constants (Kd) (Fig. 3D, Green bars), which is the binding affinity
and defined as the strength of IQGAP‐RHO protein interactions was ultimately calculated from
the ratio of the koff values (Fig. 3D, Orange bars) divided by the kon values (Fig. 3D, Blue bars).
Accordingly, RAC2 turned out to possess the highest affinity for GRD‐C that was between 16‐ and
75‐fold higher than that of the other RHO proteins (Fig. 4D, Green bars). All individual data are
summarized in Table 1.

93
Chapter VI
GBD but not GRD appears to be critical for the IQGAP1 interaction with RAC1 and CDC42
To further prove the critical role of the more C‐terminal domains of IQGAP1 beyond GRD we
generated various deletion and point mutations of IQGAP1 (Fig. 1). Figures 4A, S1, and S3 clearly
show that GRD1 and GRD2 do not associate with RAC1 and CDC42 under this experimental
condition. We next measured the effect of the last 99 amino acids of IQGAP1 on RAC1 and
CDC42 binding and found that GRD‐GBD (IQGAP1877‐1558), which lacks this region associated 3‐
fold faster with RAC1 as compared to GRD‐C. Moreover, we found that point mutations of the
PKCα phosphorylation sites (S1441 and S1443; Fig. 1) differently affect GRD‐GBD association with
RAC1‐mantGppNHp. In contrast to GRD‐GBD SE (Ser1441 substituted by Glu), GRD‐GBD SD
(Ser1443 substituted by Asp), and the double mutations GRD‐GBD SE/SD (phosphomimetic
substitutions) and GRD‐GBD SA/SA (neutral substitutions to Ala) completely abolished GRD‐GBD
association with RAC1 and CDC42 (Fig. 4A).
As it is shown in Figures 4B and 4C, association kinetics were performed for the interaction of
GRD‐C, GRD‐GBD, and GRD‐GBDSE with RAC1 and CDC42. kobs values gained by a single
exponential fitting were evaluated in a linear fashion as a function of the GRD‐C, GRD‐GBD, and
GRD‐GBDSE concentrations, which yielded the respective association rate constants (kon). The kon
for all three variants was almost similar and the same pattern was observed for RAC1 and CDC42
(Figs. 4B and 4C). The dissociation of all three proteins from their complex with RAC1‐/CDC42‐
mantGppNHp was measured in a displacement experiment in the presence of excess amounts of
RAC1‐ and CDC42‐GppNHp mixed with the complex (Figs. S2 and S4). Exponential fitting of the
curves yielded the dissociation rate constants (koff) (Figs. 4B and 4C). The binding affinity (Kd) as
the strength of IQGAP1‐RAC1/CDC42 interactions was calculated from the ratio of the koff values
divided by the kon values. Our results showed 2 folds lower Kd of GRD‐GBDSE compared to GRD‐
GBD in the case of RAC1, and Kd for CDC42 was not significantly changed (Figs. 4B and C, Green
bars).
IQGAP1 possesses at least two RAC/CDC42‐binding domains
To further shed light on the potent interaction of GRD‐C versus GRD alone we used a different
method, fluorescence polarization, that measures the binding affinity of two proteins and
provide an equilibrium dissociation constant (Kd) of their interaction. As shown in figures 5A‐5C,
both IQGAP1 variants, GRD‐C and GRD do in fact interact with mantGppNHp‐bound RAC1 and
CDC42 but as expected not with RHOA using fluorescence polarization (equilibrium mode).
Evaluated Kd values obtained from the measurements showed that GRD‐C is a high affinity binder
as compared to GRD with 10‐15‐fold lower affinity for mantGppNHp‐bound RAC1 and CDC42
(Fig. 5C; Table 1). This was not observed using Stopped‐flow fluorescence, measuring the kinetics
of the association in real‐time, as is shown in figures 2 and 4A. Furthermore, for GRD‐GBD and
GRD‐GBDSE with mantGppNHp‐bound RAC1 comparable affinity to GRD‐C was observed but GRD‐
GBDSD showed 5‐8 folds lower affinity (Figs. 5E and 5F; Table 1). The explanation for our
observations regarding binding of RAC1 to GRD is simple; in direct mode only a change in
fluorescence can be observed when the associating protein (IQGAP1) binds to close vicinity of
the fluorophore (mant group of the bound GppNHp) on the surface of RAC1 and CDC42 (Fig. 2).
This surface covers the switch regions that changes their conformation upon a GDP/GTP
exchange (Dvorsky and Ahmadian, 2004). This is of fundamental importance because binding

94
Chapter VI
effectors (such as IQGAP1) to the switch regions determines the specificity of the signal
transduction (Dvorsky and Ahmadian, 2004; Hemsath et al., 2005). To prove this idea we
repeated the measurements by using inactive RHO proteins bound to mantGDP. Both GRD‐C and
GRD were able to interact with CDC42‐mantGDP although with very low affinities (Fig. 5G‐H).
This strongly suggests that IQGAP1 consists of two distinct binding domains, with GBD binding to
the switch regions and with GRD that binds to other regions of CDC42 beyond the switch regions
in a largely nucleotide‐independent manner.
Differential expression analysis of IQGAPs in hepatic stellate cells
Each IQGAP isoform possess its specific binding partners and therefore contribute to different
cellular processes. For instance, IQGAP1 is known as an oncogene where IQGAP2 is a tumor
suppressor (White et al., 2009a; White et al., 2010a). IQGAP2 is shown to express predominantly
in liver. We asked the questions, is there any isoform preference for IQGAPs in the specific liver
cell types called hepatic stellate cells and how they could scaffold the RHO proteins in these
cells? Hepatic stellate cells (HSCs) reside in the Disse space of the liver and during chronic liver
injuries become activated and contribute in either liver repair or fibrosis (Kordes and Häussinger,
2013b; Yin et al., 2013a). It is reported that the IQGAP1 play a role in HSC activation by binging to
TGF‐β receptor II and suppress HSC activation (Liu et al., 2013a). To investigate the biological
function of IQGAP isoforms and their responsive target proteins (RAC and CDC42), freshly
isolated HSCs were cultivated for 8 days that induce spontaneous activation of these cells.
Quantitative RNA analysis revealed that IQGAP1 and 3 were upregulated during the activation
process of HSCs where the IQGAP2 was downregulated. RAC2 exhibits the drastic increased in
HSC d8, however, other RAC isoforms (RAC1 and 3) did not altered. To further investigate the
correlation between the IQGAP1 regulation of RAC1 and CDC42 mechanisms in HSCs, the protein
levels of IQGAP1, 2, RAC1, and CDC42 were detected. Consistent with qPCR data, obtained data
showed IQGAP1 increase at proteins levels, where IQGAP2 is downregulated. The RAC1 and
CDC42 exist at higher levels in activated HSCs (Fig. 6).
DISCUSSION
The interaction with the active, GTP‐bound form of RAC1 and CDC42 identified IQGAP1 as a
putative downstream effector (Mataraza et al., 2003b; Hart et al., 1996; Kuroda et al., 1999;
Izumi et al., 2004; Watanabe et al., 2004; Kholmanskikh et al., 2006; Brown et al., 2007; Sakurai‐
Yageta et al., 2008; McCallum et al., 1996; Zhang et al., 1998; Owen et al., 2008; Elliott et al.,
2012; Kurella et al., 2009; Noritake et al., 2005). Subsequent studies have shown that the
interaction between IQGAP1 and the RHO proteins has significance on variety of biological
functions. Accumulating evidence supports diverse roles for IQGAP‐RHO protein interaction in
vertebrates. However, the nature of such a protein‐protein recognition process has remained
obscure. While modulation of the cytoskeletal architecture was initially thought to be the
primary function of the interaction of IQGAP1 with RHO proteins, it is now clear that they have
some critical physiological roles beyond the cytoskeleton. CDC42 promotes the interaction of
PTPl with IQGAP1 to stimulate actin remodeling and, eventually, neurite outgrowth (Li et al.,
2005), and also complex of active CDC42, Lis1, and CLIP‐170 with IQGAP1 seems to be crucial for

95
Chapter VI
cerebellar neuronal motility (Kholmanskikh et al., 2006). Another example is in the pancreatic β‐
cells. Analysis of the insulin secretory pathway has shown that IQGAP1 scaffolds CDC42, RAB27A,
and coronin‐3 and this complex controls endocytosis of insulin secretory membranes (Kimura et
al., 2013).
Of the RHO family proteins, RAC1, RHOA, and CDC42 have been most extensively studied and
characterized (Etienne‐Manneville and Hall, 2002). In this study, a comprehensive interaction
study of RHO proteins and C‐terminal domain of IQGAP1863‐1657 (here called GRD‐C) was
conducted. Kinetics of GRD‐C association with different RHO proteins was monitored using
stopped‐flow fluorescence spectroscopic methods (Fig. 2). The results clearly indicate that
IQGAP1 binds among RHO proteins selectively to RAC‐ and CDC42‐like proteins in the active form
and that GRD‐C most obviously recognizes and binds to the switch regions but however not, as
previously proposed by several groups (Mataraza et al., 2003b; Owen et al., 2008; Kurella et al.,
2009), the GRD alone. In contrast to our data, Casteel et al. have shown that GRD‐C interacts
with the active, G14V variant of RHOA and RHOC but not with that of RHOB, which were
overexpressed in, and immunoprecipitated from human embryonic kidney 293T cell lysates
(Casteel et al., 2012). In addition, recent immunoprecipitation studies have shown that IQGAP1
binds to both RHOA and p190A‐RHOGAP to inactivate RHOA, and to modulate contractility of
airway smooth muscle cells (Bhattacharya et al., 2014). Wu et al. have also found RHOC and
IQGAP1 in immunoprecipitates. This study has shown that an isoform‐specific interaction of RHO
proteins with IQGAP1 regulates cancer cell proliferation, and has been proposed that IQGAP1 is a
downstream effector of RHOC in the regulation of gastric cancer cell migration (Wu et al., 2012;
Clark et al., 2000). In contrast, our study showed no physical interaction between GRD‐C and the
RHO isoforms, including RHOA or RHOC, under cell‐free conditions using purified proteins. In this
context, we think that observed interactions of GRD‐C with RHOA and RHOC most likely are
indirect, mediated by other proteins co‐immunoprecipitated from cells expressing tagged RHO
protein. We also exclude an interaction with other regions of RHOA outside switch regions
evident from our fluorescence polarization data (Figs. 5A‐5C).
Another striking observation was an increase in fluorescence upon association of GRD‐C with
RAC1, RAC2, RAC3, RHOG, and TC10 but a decrease in fluorescence with CDC42 (Figs. 2, S1 and
S3). In contrast, we have monitored in an earlier study a fluorescence decrease for the
association of the CDC42/RAC‐interacting binding (CRIB) motif of the Wiskott‐Aldrich syndrome
protein (WASP) with the CDC42, RAC1 and TC10, respectively (Hemsath et al., 2005). This
observation indicates that (i) the binding mode of CDC42 interaction with IQGAP1 is different
from that of TC10 and the RAC‐like proteins, and (ii) the binding mode of IQGAP1 interaction
with these RHO proteins differs from that of WASP. Owen et al. have studied GRD‐C interaction
with a large panel of RAC1 and CDC42 variants and have suggested, despite their 71% identity,
RAC1 and CDC42 appear to have only partially overlapping binding sites on IQGAP1, and each
uses different determinants to achieve high affinity binding (Owen et al., 2008). However, our
competition experiment has shown in figure 2J clearly indicated that GRD‐C competitively
associates with an overlapping binding region of RAC1 and CDC42.
The determination of individual kinetics parameters for the interaction of GRD‐C with RAC‐
and CDC42‐like proteins indicates that GRD‐C may utilize a homologous set of associating
residues of various CDC42‐/RAC‐like proteins, in spite of differences in the reaction rates (Fig.

96
Chapter VI
3D; Table 1). The fact that six members of the RHO family and probably also WRCH1 and
Chp/WRCH2 (not analyzed in this study), associate with IQGAP1 raises the question of how an
interaction specificity is achieved in cells. RHOG is due to its high sequence similarity with the
RAC proteins classified as a RAC‐related protein, although it shares with RAC1 overlapping signal
transduction pathways (Prieto‐Sanchez and Bustelo, 2003). TC10 and RHOG interaction with
IQGAP1 and IQGAP2, respectively, has been previously reported (Wennerberg et al., 2002;
Neudauer et al., 1998). RHOG has been reported that do not bind to effectors such as PAK1,
PAK5, PAK6, PAR6, IRSp53, WASP, or POSH, but on the other hand it binds in an activated GTP
bound form to the RAC/CDC42‐specific effectors MLK3, PLD1, and IQGAP2 which in turn,
stimulates some downstream signaling targets of activated RAC1 and CDC42 such as JNK and Akt
(Wennerberg et al., 2002). Although the consequence of TC10‐IQGAP1 interaction is not defined,
it seems to play a role in exocytosis and cell polarity. EXO70, a component of the exocyst
complex, has been shown to bind to the N‐terminal IQGAP1, most likely to the WW motif (Prieto‐
Sanchez and Bustelo, 2003) but probably not to the IQ region because Exo70 was not found as
binding partner of this region (Hedman et al., 2015). In mammals, RALA, a member of the RAS
family, and TC10 have been shown to bind the exocyst (Inoue et al., 2003). TC10‐EXO70
interaction is implicated in the tethering of GLUT4 vesicles to the plasma membrane in response
to insulin (Inoue et al., 2003; Inoue et al., 2006; Chiang et al., 2006), and in promoting neurite
outgrowth (Pommereit and Wouters, 2007; Dupraz et al., 2009; Fujita et al., 2013). IQGAP
proteins has been shown to be involved in both processes (Ory and Gasman, 2011; Wang et al.,
2007; Hedman et al., 2015). Data presented in this study, revealed that TC10 has the fastest
dissociation rate from GRD‐C (Fig. 3D), suggesting that the IQGAP‐TC10 complex requires
stabilization by additional binding proteins, for example EXO70. Investigating the protein
interaction network of the IQGAPs, modulating their function in space and time, remains an
open and very interesting issue for future studies.
The highest affinity of RAC2 for GRD‐C can most likely be attributed to distinct amino acid
sequence deviations. The high affinity of RAC2 for IQGAP1 cannot be explained by comparing
potential residues that may undergo direct interacting contacts in spite of high amino acid
sequence identity of RAC isoforms. An aspect to be considered is the overall dynamics of the
protein parts originated from few different amino acids all over the molecule. The lower
flexibility of the switch I region of RAC2 in comparison to RAC1 and RAC3 may explain the
functional differences of these proteins as it has been previously proposed to contribute to a
higher TIAM1 activity on RAC2 compared to RAC1 and RAC3 (Haeusler et al., 2003).
Previous studies by other groups have shown that shorter IQGAP1 fragments, encompassing
the GRD domain, are responsible for the RAC1 and CDC42 interactions. For the first time, Zhang
and coworkers have shown that activated form of CDC42 is able to bound IQGAP1 GRD‐C (aa
864‐1657) (Zhang et al., 1997). One year later the same group reported that not only CDC42 but
also RAC1, although with lower affinity, could interact to GRD‐C (Zhang et al., 1998). Afterwards,
Nomanbhoy and Cerione, have shown that GRD‐C interacts tightly to CDC42‐mantGTP using
fluorescence assay (Nomanbhoy and Cerione, 1999). Owen et al. have also reported that a GRD
protein (aa 950‐1407) was able to tightly bind CDC42(Q61L) with a Kd value of 140 nM but failed
to bind RAC1(Q61L) using scintillation proximity assay (Owen et al., 2008). In this study, GRD‐C
(aa 864‐1657) has shown a much higher affinity for the Q61L mutant of not only CDC42 but also

97
Chapter VI
RAC1, and yet the GRD was proposed to be the binding domain of IQGAP1 that associates with
the switch regions of CDC42. Correspondingly, Kurella et al. have reported that GRD2 (aa 62‐
1345) binds CDC42 in a GTP‐dependent manner with an affinity of 1300 nM using isothermal
titration calorimetry (Kurella et al., 2009). These biochemical data (summarized in Table 1) along
with homology modeling, based on the RAS‐RASGAP structure (Scheffzek et al., 1997), provided
up to date a structural model of IQGAP1 GRD contacting the switch regions of the CDC42 which
is generally accepted (Kurella et al., 2009; Owen et al., 2008; Elliott et al., 2012; Hart et al., 1996;
Ho et al., 1999; Kuroda et al., 1998; Mataraza et al., 2003b). Contrary to the existing model, we
observed a low‐affinity, largely nucleotide‐independent binding of GRD that associates with RAC‐
and CDC42‐like proteins outside the switch regions. This was evidenced by kinetic measurements
of GRD‐GBD and GRD‐C association, but not GDR, with RAC1 and CDC42 proteins (Figs. 2 and 4;
no changes in fluorescence were observed with GRD). Conducted equilibrium measurements
using fluorescence polarization not only substantiated the essential role of IQGAP1 GBD in a GTP‐
dependent interaction with RAC1 and CDC42 in support with our kinetic analysis but also
provided striking insights into the main feature of IQGAP1 GRD. Our quantitative analysis under
equilibrium conditions clearly revealed that GRD indeed undergoes a low‐affinity, largely
nucleotide‐independent interaction with CDC42 and also RAC1 but in contrast to GBD its binding
site resides outside the critical switch regions (Fig. 5). The significance of GBD (previously called
RGTC) as a GTP‐dependent interacting domain for RAC‐ and CDC42‐like proteins was proved
using single point mutants of GRD‐GBD (e.g. Ser1443 substituted by Asp and Ala but not Ser1441
to Glu and Ala, two PKCα phosphorylation sites), which led to the abolishment of a GTP‐
dependent interaction of GRD‐GBD while nucleotide‐independent association through the GRD
was unchanged. Grohmanova and coworkers previuosly have shown via GST pull down
experiments and using MCF10A cell lysate, that in the presence of phosphatase inhibitor there is
a significat reduction in the interaction between IQGAP1 and CDC42‐GTP bound in contrast to
CDC42 nucleotide depleted which bound to phosphorylated IQGAP1 much stronger
(Grohmanova et al., 2004). In addition, our data have clearly demonstrated that the region
upstream of GRD2 (aa 863‐961) is dispensable for the RAC1 and CDC42 interaction. Another
interesting issue was the inhibitory effect of the very C‐terminal 99 amino acids (C domain) on
the GBD determined through a 3‐fold faster association of GRD‐GBD (lacking the C domain) with
RAC1 and CDC42 as compared to GRD‐C. This is consistent with observations regarding the
interaction of GRD and GBD‐C domains with each other, favoring GTP‐dependent binding to
CDC42 (Grohmanova et al., 2004; Le Clainche et al., 2007).
Upon HSCs activation, quiescent HSCs develop into the cells that are able to contract and
migrate. It is reported that IQGAP1 plays a role in HSC activation by binding to TGF‐β receptor II
and suppress HSC activation (Liu et al., 2013a). These observations raised the questions, which
IQGAP isoforms are present in HSCs and is there any evidence that IQGAPs actively scaffolds RHO
proteins in HSCs? To address these questions, first we investigated the expression pattern of
IQGAP1, 2, 3, RAC1, 2, 3, and CDC42 in quiescent vs. activated HSCs. Our quantitative RNA
analysis revealed that IQGAP1 and 3 isoforms get upregulated during the activation process of
HSCs while IQGAP2 is down‐regulated. At protein levels, we were able to detect IQGAP2 isoform
only in quiescent HSCs while IQGAP1 was presented in both states of HSCs, and became
upregulated during HSC activation. These results are in consistent with what Schmidt and

98
Chapter VI
colleagues, have reported regarding the reciprocal expression of IQGAP1 and 2 in human
hepatocellular carcinomas, where IQGAP1 increased and IQGAP2 decreased (White et al.,
2010b). In quiescent HSCs, we speculate that IQGAP2 exerts its specific functions by scaffolding
the distinct signaling components in different protein complexes than IQGAP1. Canonical Wnt
signaling is very dynamic in quiescent HSCs and it is shown in other cells that IQGAP2 can interact
with Dishevelled/β‐catenin, therefore in qHSCs IQGAP2 may modulate Wnt‐β‐catenin signaling
and stimulate GFAP synthesis and cell‐cycle arrest (Kordes et al., 2008b; Schmidt et al., 2008).
Another possibility would be, IQGAP2 competes with other scaffolding proteins to recruits RHO
proteins and may interfere with RHO‐dependent cell migration. The functions and specific
binding partners of IQGAP2 in qHSCs remain to be investigated. aHSCs display the elevated levels
of PDGF signaling and focal adhesion kinase (FAK), acts downstream of PDGF (Carloni et al.,
2000). PDGF induces the IQGAP1‐dependent complex formation of focal adhesion proteins
(paxillin and vinculin) and PDGF receptor β (Kohno et al., 2013). IQGAP1 also binds to FAK
(Cheung et al., 2013), therefore, PDGF‐IQGAP1 may regulate the focal adhesion assembly in
aHSCs that is important for cell motility and migration.
Elevated levels of the RAC1 and CDC42 correlate with high amount of IQGAP1 in activated
HSCs; we detected higher levels of RAC1, RAC2 and CDC42 in aHSCs than qHSCs. On the other
hand, our biochemical studies demonstrated that RAC1 and CDC42 interact in GTP‐bound forms
with IQGPA1. Therefore, we suggest that IQGAP1 scaffolds RAC1 and CDC42 to regulate cell‐
adhesion and migration in these cells. However, the role of IQGAP1 in aHSCs needs to be
investigated.
Taken together, our kinetic and equilibrium measurements clearly challenge the paradigm
that the ability of IQGAP1 to interact with RAC/CDC42 proteins is mainly attributed to its GRD.
On the contrary, we propose that the C‐terminal half of IQGAP1 utilize at least three functionally
distinct units, including GRD, GBD and C, to achieve the interaction with RAC1‐ and CDC42‐like
proteins. Keeping this in mind, the switch regions of the RHO family proteins have been
previously proposed as the first binding site for the downstream effectors and if this first contact
is achieved then additional contacts outside the switch regions will be required to guarantee
effector activation (Dvorsky and Ahmadian, 2004). Remarkably, IQGAP1 seems to employ a
different strategy to interact with RAC1 and CDC42 proteins as schematically illustrated in Figure
7: (i) GRD undergoes a low‐affinity, GDP‐/GTP‐independent complex with RAC1 and CDC42
proteins outside their switch regions in a way that is independent of the upstream signals,
providing it is structurally accessible and available for interactions; (ii) GBD only binds to the
RAC1 and CDC42 proteins if they are active and exist in the GTP‐bound forms; (iii) the C‐terminal
region of IQGAP1 may potentiate the IQGAP1 interaction with RAC1 and CDC42 proteins by
probably extending the resident time of the respective proteins complexes. Such a sequential
association with the RAC1 and CDC42 proteins most likely leads to activation of IQGAP1, can be
envisaged as conformational changes allowing further IQGAP1 interaction with its downstream
targets depending on both the cell types and the upstream signals. We further propose that this
is a conserved control mechanism also for IQGAP2 and probably also IQGAP3 due to high
sequence homology.
CONFLICT OF INTEREST

99
Chapter VI
The authors declare no conflict of interest.
ACKNOWLEDGEMENTS This work was supported in part by the German Research Foundation (Deutsche
Forschungsgemeinschaft or DFG) through both the Collaborative Research Center 974 (SFB 974)
“Communication and Systems Relevance during Liver Injury and Regeneration” and the
International Research Training Group 1902 (IRTG 1902) “Intra‐ and interorgan communication
of the cardiovascular system”, and by the International Graduate School of Protein Science and
Technology (iGRASP), and the Research committee of the Medical Faculty of the Heinrich‐Heine
University Düsseldorf (Grant Number 9772617).

100
Chapter VI
REFERENCES 1. Yuan H, Zhang H, Wu X, Zhang Z, Du D, et al. (2009) Hepatocyte‐specific deletion of Cdc42 results in
delayed liver regeneration after partial hepatectomy in mice. Hepatology 49: 240‐249. 2. Fukata M, Nakagawa M, Kaibuchi K (2003) Roles of Rho‐family GTPases in cell polarisation and
directional migration. Curr Opin Cell Biol 15: 590‐597. 3. Hall A (2012) Rho family GTPases. Biochem Soc Trans 40: 1378‐1382. 4. Dvorsky R, Ahmadian MR (2004) Always look on the bright site of Rho: structural implications for a
conserved intermolecular interface. EMBO Rep 5: 1130‐1136. 5. Lam BD, Hordijk PL (2013) The Rac1 hypervariable region in targeting and signaling: a tail of many
stories. Small GTPases 4: 78‐89. 6. Wennerberg K, Der CJ (2004) Rho‐family GTPases: it's not only Rac and Rho (and I like it). J Cell Sci 117:
1301‐1312. 7. Jaiswal M, Fansa EK, Dvorsky R, Ahmadian MR (2013) New insight into the molecular switch mechanism
of human Rho family proteins: shifting a paradigm. Biol Chem 394: 89‐95. 8. Jaiswal M, Dvorsky R, Ahmadian MR (2013) Deciphering the molecular and functional basis of Dbl family
proteins: a novel systematic approach toward classification of selective activation of the Rho family proteins. J Biol Chem 288: 4486‐4500.
9. Rossman KL, Der CJ, Sondek J (2005) GEF means go: turning on RHO GTPases with guanine nucleotide‐exchange factors. Nature reviews Molecular cell biology 6: 167‐180.
10. Tcherkezian J, Lamarche‐Vane N (2007) Current knowledge of the large RhoGAP family of proteins. Biology of the Cell 99: 67‐86.
11. Jaiswal M, Dvorsky R, Amin E, Risse SL, Fansa EK, et al. (2014) Functional cross‐talk between ras and rho pathways: a Ras‐specific GTPase‐activating protein (p120RasGAP) competitively inhibits the RhoGAP activity of deleted in liver cancer (DLC) tumor suppressor by masking the catalytic arginine finger. J Biol Chem 289: 6839‐6849.
12. DerMardirossian C, Bokoch GM (2005) GDIs: central regulatory molecules in Rho GTPase activation. Trends Cell Biol 15: 356‐363.
13. Garcia‐Mata R, Boulter E, Burridge K (2011) The 'invisible hand': regulation of RHO GTPases by RHOGDIs. Nature reviews Molecular cell biology 12: 493‐504.
14. Tnimov Z, Guo Z, Gambin Y, Nguyen UT, Wu YW, et al. (2012) Quantitative analysis of prenylated RhoA interaction with its chaperone, RhoGDI. J Biol Chem 287: 26549‐26562.
15. Zhang SC, Gremer L, Heise H, Janning P, Shymanets A, et al. (2014) Liposome Reconstitution and Modulation of Recombinant Prenylated Human Rac1 by GEFs, GDI1 and Pak1. PLoS ONE 9: e102425.
16. Lei M, Lu W, Meng W, Parrini MC, Eck MJ, et al. (2000) Structure of PAK1 in an autoinhibited conformation reveals a multistage activation switch. Cell 102: 387‐397.
17. Lapouge K, Smith SJ, Walker PA, Gamblin SJ, Smerdon SJ, et al. (2000) Structure of the TPR domain of p67phox in complex with Rac.GTP. Mol Cell 6: 899‐907.
18. Fansa EK, Dvorsky R, Zhang SC, Fiegen D, Ahmadian MR (2013) Interaction characteristics of Plexin‐B1 with Rho family proteins. Biochem Biophys Res Commun 434: 785‐790.
19. Hota PK, Buck M (2012) Plexin structures are coming: opportunities for multilevel investigations of semaphorin guidance receptors, their cell signaling mechanisms, and functions. Cell Mol Life Sci 69: 3765‐3805.
20. Watanabe T, Wang S, Kaibuchi K (2015) IQGAPs as Key Regulators of Actin‐cytoskeleton Dynamics. Cell Struct Funct 40: 69‐77.
21. Hedman AC, Smith JM, Sacks DB (2015) The biology of IQGAP proteins: beyond the cytoskeleton. EMBO reports 16: 427‐446.
22. White CD, Brown MD, Sacks DB (2009) IQGAPs in cancer: a family of scaffold proteins underlying tumorigenesis. FEBS Lett 583: 1817‐1824.
23. Bishop AL, Hall A (2000) Rho GTPases and their effector proteins. Biochem J 348 Pt 2: 241‐255. 24. White CD, Erdemir HH, Sacks DB (2012) IQGAP1 and its binding proteins control diverse biological
functions. Cell Signal 24: 826‐834. 25. Abel AM, Schuldt KM, Rajasekaran K, Hwang D, Riese MJ, et al. (2015) IQGAP1: insights into the
function of a molecular puppeteer. Mol Immunol 65: 336‐349.

101
Chapter VI
26. Heasman SJ, Ridley AJ (2008) Mammalian Rho GTPases: new insights into their functions from in vivo studies. Nature reviews Molecular cell biology 9: 690‐701.
27. Smith JM, Hedman AC, Sacks DB (2015) IQGAPs choreograph cellular signaling from the membrane to the nucleus. Trends Cell Biol 25: 171‐184.
28. Johnson M, Sharma M, Henderson BR (2009) IQGAP1 regulation and roles in cancer. Cell Signal 21: 1471‐1478.
29. McCallum SJ, Wu WJ, Cerione RA (1996) Identification of a putative effector for Cdc42Hs with high sequence similarity to the RasGAP‐related protein IQGAP1 and a Cdc42Hs binding partner with similarity to IQGAP2. J Biol Chem 271: 21732‐21737.
30. Brill S, Li S, Lyman CW, Church DM, Wasmuth JJ, et al. (1996) The Ras GTPase‐activating‐protein‐related human protein IQGAP2 harbors a potential actin binding domain and interacts with calmodulin and Rho family GTPases. Mol Cell Biol 16: 4869‐4878.
31. Wang S, Watanabe T, Noritake J, Fukata M, Yoshimura T, et al. (2007) IQGAP3, a novel effector of Rac1 and Cdc42, regulates neurite outgrowth. J Cell Sci 120: 567‐577.
32. Nojima H, Adachi M, Matsui T, Okawa K, Tsukita S (2008) IQGAP3 regulates cell proliferation through the Ras/ERK signalling cascade. Nat Cell Biol 10: 971‐978.
33. Schmidt VA, Scudder L, Devoe CE, Bernards A, Cupit LD, et al. (2003) IQGAP2 functions as a GTP‐dependent effector protein in thrombin‐induced platelet cytoskeletal reorganization. Blood 101: 3021‐3028.
34. Cupit LD, Schmidt VA, Miller F, Bahou WF (2004) Distinct PAR/IQGAP expression patterns during murine development: implications for thrombin‐associated cytoskeletal reorganization. Mamm Genome 15: 618‐629.
35. Mateer SC, Wang N, Bloom GS (2003) IQGAPs: integrators of the cytoskeleton, cell adhesion machinery, and signaling networks. Cell Motil Cytoskeleton 55: 147‐155.
36. Brandt DT, Grosse R (2007) Get to grips: steering local actin dynamics with IQGAPs. EMBO Rep 8: 1019‐1023.
37. Smith JM, Hedman AC, Sacks DB (2015) IQGAPs choreograph cellular signaling from the membrane to the nucleus. Trends Cell Biol.
38. White CD, Khurana H, Gnatenko DV, Li Z, Odze RD, et al. (2010) IQGAP1 and IQGAP2 are reciprocally altered in hepatocellular carcinoma. BMC Gastroenterol 10: 125.
39. Liu C, Billadeau DD, Abdelhakim H, Leof E, Kaibuchi K, et al. (2013) IQGAP1 suppresses TbetaRII‐mediated myofibroblastic activation and metastatic growth in liver. J Clin Invest 123: 1138‐1156.
40. Hart MJ, Callow MG, Souza B, Polakis P (1996) IQGAP1, a calmodulin‐binding protein with a rasGAP‐related domain, is a potential effector for cdc42Hs. Embo J 15: 2997‐3005.
41. Ho YD, Joyal JL, Li Z, Sacks DB (1999) IQGAP1 integrates Ca2+/calmodulin and Cdc42 signaling. J Biol Chem 274: 464‐470.
42. Malarkannan S, Awasthi A, Rajasekaran K, Kumar P, Schuldt KM, et al. (2012) IQGAP1: a regulator of intracellular spacetime relativity. J Immunol 188: 2057‐2063.
43. Liu J, Guidry JJ, Worthylake DK (2014) Conserved sequence repeats of IQGAP1 mediate binding to Ezrin. J Proteome Res 13: 1156‐1166.
44. Pathmanathan S, Hamilton E, Atcheson E, Timson DJ (2011) The interaction of IQGAPs with calmodulin‐like proteins. Biochem Soc Trans 39: 694‐699.
45. Zhang B, Chernoff J, Zheng Y (1998) Interaction of Rac1 with GTPase‐activating proteins and putative effectors. A comparison with Cdc42 and RhoA. J Biol Chem 273: 8776‐8782.
46. Elliott SF, Allen G, Timson DJ (2012) Biochemical analysis of the interactions of IQGAP1 C‐terminal domain with CDC42. World J Biol Chem 3: 53‐60.
47. Owen D, Campbell LJ, Littlefield K, Evetts KA, Li Z, et al. (2008) The IQGAP1‐Rac1 and IQGAP1‐Cdc42 interactions: interfaces differ between the complexes. J Biol Chem 283: 1692‐1704.
48. Kurella VB, Richard JM, Parke CL, Lecour LF, Jr., Bellamy HD, et al. (2009) Crystal structure of the GTPase‐activating protein‐related domain from IQGAP1. J Biol Chem 284: 14857‐14865.
49. Rittinger K, Walker PA, Eccleston JF, Nurmahomed K, Owen D, et al. (1997) Crystal structure of a small G protein in complex with the GTPase‐activating protein rhoGAP. Nature 388: 693‐697.
50. Nassar N, Hoffman GR, Manor D, Clardy JC, Cerione RA (1998) Structures of Cdc42 bound to the active and catalytically compromised forms of Cdc42GAP. Nat Struct Biol 5: 1047‐1052.

102
Chapter VI
51. Scheffzek K, Ahmadian MR, Kabsch W, Wiesmuller L, Lautwein A, et al. (1997) The Ras‐RasGAP complex: structural basis for GTPase activation and its loss in oncogenic Ras mutants. Science 277: 333‐338.
52. Mataraza JM, Briggs MW, Li Z, Frank R, Sacks DB (2003) Identification and characterization of the Cdc42‐binding site of IQGAP1. Biochem Biophys Res Commun 305: 315‐321.
53. Suyama M, Nagase T, Ohara O (1999) HUGE: a database for human large proteins identified by Kazusa cDNA sequencing project. Nucleic Acids Res 27: 338‐339.
54. Fiegen D, Blumenstein L, Stege P, Vetter IR, Ahmadian MR (2002) Crystal structure of Rnd3/RhoE: functional implications. FEBS letters 525: 100‐104.
55. Hemsath L, Ahmadian MR (2005) Fluorescence approaches for monitoring interactions of Rho GTPases with nucleotides, regulators, and effectors. Methods 37: 173‐182.
56. Jaiswal M, Dubey BN, Koessmeier KT, Gremer L, Ahmadian MR (2012) Biochemical assays to characterize Rho GTPases. Methods in molecular biology 827: 37‐58.
57. Nouri K, J. MM, Milroy LG, Hain A, Dvorsky R, et al. (2015) Biophysical Characterization of Nucleophosmin Interactions with Human Immunodeficiency Virus Rev and Herpes Simplex Virus US11. PLoS ONE.
58. Hemsath L, Dvorsky R, Fiegen D, Carlier MF, Ahmadian MR (2005) An electrostatic steering mechanism of Cdc42 recognition by Wiskott‐Aldrich syndrome proteins. Mol Cell 20: 313‐324.
59. Kuroda S, Fukata M, Nakagawa M, Fujii K, Nakamura T, et al. (1998) Role of IQGAP1, a target of the small GTPases Cdc42 and Rac1, in regulation of E‐cadherin‐ mediated cell‐cell adhesion. Science 281: 832‐835.
60. Zhang B, Wang ZX, Zheng Y (1997) Characterization of the interactions between the small GTPase Cdc42 and its GTPase‐activating proteins and putative effectors. Comparison of kinetic properties of Cdc42 binding to the Cdc42‐interactive domains. J Biol Chem 272: 21999‐22007.
61. Kordes C, Häussinger D (2013) Hepatic stem cell niches. Journal of Clinical Investigation 123: 1874‐1880.
62. Yin C, Evason KJ, Asahina K, Stainier DYR (2013) Hepatic stellate cells in liver development, regeneration, and cancer. Journal of Clinical Investigation 123: 1902‐1910.
63. Kuroda S, Fukata M, Nakagawa M, Kaibuchi K (1999) Cdc42, Rac1, and their effector IQGAP1 as molecular switches for cadherin‐mediated cell‐cell adhesion. Biochem Biophys Res Commun 262: 1‐6.
64. Izumi G, Sakisaka T, Baba T, Tanaka S, Morimoto K, et al. (2004) Endocytosis of E‐cadherin regulated by Rac and Cdc42 small G proteins through IQGAP1 and actin filaments. J Cell Biol 166: 237‐248.
65. Watanabe T, Wang S, Noritake J, Sato K, Fukata M, et al. (2004) Interaction with IQGAP1 links APC to Rac1, Cdc42, and actin filaments during cell polarization and migration. Dev Cell 7: 871‐883.
66. Kholmanskikh SS, Koeller HB, Wynshaw‐Boris A, Gomez T, Letourneau PC, et al. (2006) Calcium‐dependent interaction of Lis1 with IQGAP1 and Cdc42 promotes neuronal motility. Nat Neurosci 9: 50‐57.
67. Brown MD, Bry L, Li Z, Sacks DB (2007) IQGAP1 regulates Salmonella invasion through interactions with actin, Rac1, and Cdc42. J Biol Chem 282: 30265‐30272.
68. Sakurai‐Yageta M, Recchi C, Le Dez G, Sibarita JB, Daviet L, et al. (2008) The interaction of IQGAP1 with the exocyst complex is required for tumor cell invasion downstream of Cdc42 and RhoA. J Cell Biol 181: 985‐998.
69. Noritake J, Watanabe T, Sato K, Wang S, Kaibuchi K (2005) IQGAP1: a key regulator of adhesion and migration. J Cell Sci 118: 2085‐2092.
70. Li Z, McNulty DE, Marler KJ, Lim L, Hall C, et al. (2005) IQGAP1 promotes neurite outgrowth in a phosphorylation‐dependent manner. J Biol Chem 280: 13871‐13878.
71. Kimura T, Yamaoka M, Taniguchi S, Okamoto M, Takei M, et al. (2013) Activated Cdc42‐bound IQGAP1 determines the cellular endocytic site. Mol Cell Biol 33: 4834‐4843.
72. Etienne‐Manneville S, Hall A (2002) Rho GTPases in cell biology. Nature 420: 629‐635. 73. Casteel DE, Turner S, Schwappacher R, Rangaswami H, Su‐Yuo J, et al. (2012) Rho isoform‐specific
interaction with IQGAP1 promotes breast cancer cell proliferation and migration. The Journal of biological chemistry 287: 38367‐38378.
74. Bhattacharya M, Sundaram A, Kudo M, Farmer J, Ganesan P, et al. (2014) IQGAP1‐dependent scaffold suppresses RhoA and inhibits airway smooth muscle contraction. J Clin Invest 124: 4895‐4898.

103
Chapter VI
75. Wu Y, Tao Y, Chen Y, Xu W (2012) RhoC regulates the proliferation of gastric cancer cells through interaction with IQGAP1. PLoS ONE 7: 7.
76. Clark EA, Golub TR, Lander ES, Hynes RO (2000) Genomic analysis of metastasis reveals an essential role for RhoC. Nature 406: 532‐535.
77. Prieto‐Sanchez RM, Bustelo XR (2003) Structural basis for the signaling specificity of RhoG and Rac1 GTPases. J Biol Chem 278: 37916‐37925.
78. Wennerberg K, Ellerbroek SM, Liu RY, Karnoub AE, Burridge K, et al. (2002) RhoG signals in parallel with Rac1 and Cdc42. J Biol Chem 277: 47810‐47817.
79. Neudauer CL, Joberty G, Tatsis N, Macara IG (1998) Distinct cellular effects and interactions of the Rho‐family GTPase TC10. Curr Biol 8: 1151‐1160.
80. Inoue M, Chang L, Hwang J, Chiang SH, Saltiel AR (2003) The exocyst complex is required for targeting of Glut4 to the plasma membrane by insulin. Nature 422: 629‐633.
81. Inoue M, Chiang SH, Chang L, Chen XW, Saltiel AR (2006) Compartmentalization of the exocyst complex in lipid rafts controls Glut4 vesicle tethering. Mol Biol Cell 17: 2303‐2311.
82. Chiang SH, Chang L, Saltiel AR (2006) TC10 and insulin‐stimulated glucose transport. Methods Enzymol 406: 701‐714.
83. Pommereit D, Wouters FS (2007) An NGF‐induced Exo70‐TC10 complex locally antagonises Cdc42‐mediated activation of N‐WASP to modulate neurite outgrowth. J Cell Sci 120: 2694‐2705.
84. Dupraz S, Grassi D, Bernis ME, Sosa L, Bisbal M, et al. (2009) The TC10‐Exo70 complex is essential for membrane expansion and axonal specification in developing neurons. J Neurosci 29: 13292‐13301.
85. Fujita A, Koinuma S, Yasuda S, Nagai H, Kamiguchi H, et al. (2013) GTP hydrolysis of TC10 promotes neurite outgrowth through exocytic fusion of Rab11‐ and L1‐containing vesicles by releasing exocyst component Exo70. PLoS ONE 8.
86. Ory S, Gasman S (2011) Rho GTPases and exocytosis: what are the molecular links? Semin Cell Dev Biol 22: 27‐32.
87. Haeusler LC, Blumenstein L, Stege P, Dvorsky R, Ahmadian MR (2003) Comparative functional analysis of the Rac GTPases. FEBS letters 555: 556‐560.
88. Nomanbhoy T, Cerione RA (1999) Fluorescence assays of Cdc42 interactions with target/effector proteins. Biochemistry 38: 15878‐15884.
89. Grohmanova K, Schlaepfer D, Hess D, Gutierrez P, Beck M, et al. (2004) Phosphorylation of IQGAP1 modulates its binding to Cdc42, revealing a new type of rho‐GTPase regulator. J Biol Chem 279: 48495‐48504.
90. Le Clainche C, Schlaepfer D, Ferrari A, Klingauf M, Grohmanova K, et al. (2007) IQGAP1 stimulates actin assembly through the N‐WASP‐Arp2/3 pathway. J Biol Chem 282: 426‐435.
91. White CD, Khurana H, Gnatenko DV, Li Z, Odze RD, et al. (2010) IQGAP1 and IQGAP2 are Reciprocally Altered in Hepatocellular Carcinoma. BMC Gastroenterology 10: 125.
92. Kordes C, Sawitza I, Häussinger D (2008) Canonical Wnt signaling maintains the quiescent stage of hepatic stellate cells. Biochemical and Biophysical Research Communications 367: 116‐123.
93. Schmidt VA, Chiariello CS, Capilla E, Miller F, Bahou WF (2008) Development of hepatocellular carcinoma in Iqgap2‐deficient mice is IQGAP1 dependent. Mol Cell Biol 28: 1489‐1502.
94. Carloni V, Pinzani M, Giusti S, Romanelli RG, Parola M, et al. (2000) Tyrosine phosphorylation of focal adhesion kinase by PDGF is dependent on ras in human hepatic stellate cells. Hepatology 31: 131‐140.
95. Kohno T, Urao N, Ashino T, Sudhahar V, Inomata H, et al. (2013) IQGAP1 links PDGF receptor‐beta signal to focal adhesions involved in vascular smooth muscle cell migration: role in neointimal formation after vascular injury. Am J Physiol Cell Physiol 305: C591‐600.
96. Cheung KL, Lee JH, Shu L, Kim JH, Sacks DB, et al. (2013) The Ras GTPase‐activating‐like protein IQGAP1 mediates Nrf2 protein activation via the mitogen‐activated protein kinase/extracellular signal‐regulated kinase (ERK) kinase (MEK)‐ERK pathway. J Biol Chem 288: 22378‐22386.

104
Chapter VI
The RHO family proteins are known to play an important role in diverse cellular processes and
Table 1. Data summary for the interaction of RHO proteins with IQGAP variants
Proteinsa Kd (nM)b1 Methodc Reference
IQGAP1863‐1345/RAC1‐mantGppNHp no binding FM this studyIQGAP1863‐1345/CDC42‐mantGppNHp no binding FM this studyIQGAP1962‐1345/RAC1‐mantGppNHp no binding FM this studyIQGAP1962‐1345/CDC42‐mantGppNHp no binding FM this studyIQGAP1863‐1657/RAC1‐mantGppNHp 1,420 FM this studyIQGAP1863‐1657/CDC42‐mantGppNHp 2,000 FM this studyIQGAP1863‐1657/RAC2‐mantGppNHp 27 FM this studyIQGAP1863‐1657/RAC3‐mantGppNHp 450 FM this studyIQGAP1863‐1657/RHOG‐mantGppNHp 490 FM this studyIQGAP1863‐1657/TC10‐mantGppNHp 1,530 FM this studyIQGAP1877‐1558/RAC1‐mantGppNHp 4,110 FM this studyIQGAP1877‐1558/CDC42‐mantGppNHp 4,200 FM this studyIQGAP1877‐1558(S1441E)/RAC1‐mantGppNHp 9,960 FM this studyIQGAP1877‐1558(S1441E)/CDC42‐mantGppNHp 6,060 FM this studyIQGAP1877‐1558(S1443D)/RAC1‐mantGppNHp no binding FM this studyIQGAP1877‐1558(S1443D)/CDC42‐mantGppNHp no binding FM this studyIQGAP1877‐1558(SS/AA)/RAC1‐mantGppNHp no binding FM this studyIQGAP1877‐1558(SS/AA)/CDC42‐mantGppNHp no binding FM this studyIQGAP1877‐1558(SS/ED)/RAC1‐mantGppNHp no binding FM this studyIQGAP1877‐1558(SS/ED)/CDC42‐mantGppNHp no binding FM this studyIQGAP1877‐1558/CDC42‐GTP 1,300 SPR (Elliott et al.,
2012) IQGAP1877‐1558(S1441E)/CDC42‐GTP 220,000 SPR (Elliott et al.,
2012)
Proteinsa eKd (nM)b2 Methodc Reference
IQGAP962‐1345/RAC1‐mantGppNHp 8,145 FP this studyIQGAP962‐1345/CDC42‐mantGDP 184,700 FP this studyIQGAP863‐1657/RAC1‐mantGppNHp 5,530 FP this studyIQGAP863‐1657/CDC42‐mantGDP 95,100 FP this studyIQGAP962‐1345/CDC42‐mantGppNHp 30,200 FP this studyIQGAP863‐1657/CDC42‐mantGppNHp 3,400 FP this studyIQGAP962‐1345/RHOA‐mantGppNHp no binding FP this studyIQGAP863‐1657/RHOA‐mantGppNHp no binding FP this studyIQGAP1877‐1558/RAC1‐mantGppNHp 4,570 FP this studyIQGAP1877‐1558(S1441E)/RAC1‐mantGppNHp 6,680 FP this studyIQGAP1877‐1558(S1443D)/RAC1‐mantGppNHp 288,300 FP this studyIQGAP1864‐1657/CDC42‐mantdGTP 28 FA (Nomanbhoy and
Cerione, 1999) IQGAP1864‐1657/RAC1Q61L‐[3H]GTP 18 SPA (Owen et al.,
2008) IQGAP1950‐1407/RAC1Q61L‐[3H]GTP no binding SPA (Owen et al.,
2008) IQGAP1864‐1657/CDC42Q61L‐[3H]GTP 24 SPA (Owen et al.,
2008) IQGAP1950‐1407/CDC42Q61L‐[3H]GTP 140 SPA (Owen et al.,
2008) IQGAP1962‐1345/CDC42‐GTP 1,300 ITC (Kurella et al.,
2009) IQGAP1962‐1345/CDC42‐GDP no binding ITC (Kurella et al.,

105
Chapter VI
2009)
Proteinsa Ki (nM)b3 Methodc Reference
IQGAP1864‐1657/CDC42‐GTP 82 PRA (Zhang et al., 1997)
IQGAP1864‐1657/CDC42‐GTP 390 PRA (Zhang et al., 1998)
IQGAP1864‐1657/RAC1‐GTP 2,130 PRA (Zhang et al., 1998)
aIQGAP1 proteins; bthe binding affinity of the IQGAP proteins for various RHO proteins has been analyze in different ways: b1under kinetic condition that provides the individual association and dissociation rate constant (kon and koff) and determines the dissociation constants (Kd) or
b2under equilibrium conditions by determining the equilibrium dissociation constants (eKd) or
b3 under competitive reaction conditions, for example inhibition the intrinsic GTP‐hydrolysis reaction the RHO proteins that determines the equilibrium inhibition constant (Ki);
c FM, fluorescence measurement by stopped flow, FA, fluorescence assay; FP, fluorescence polarization; ITC, isothermal titration calorimetry; PRA, Phosphate‐release assay; SPA, scintillation proximity assay; SPR, surface plasmon resonance.
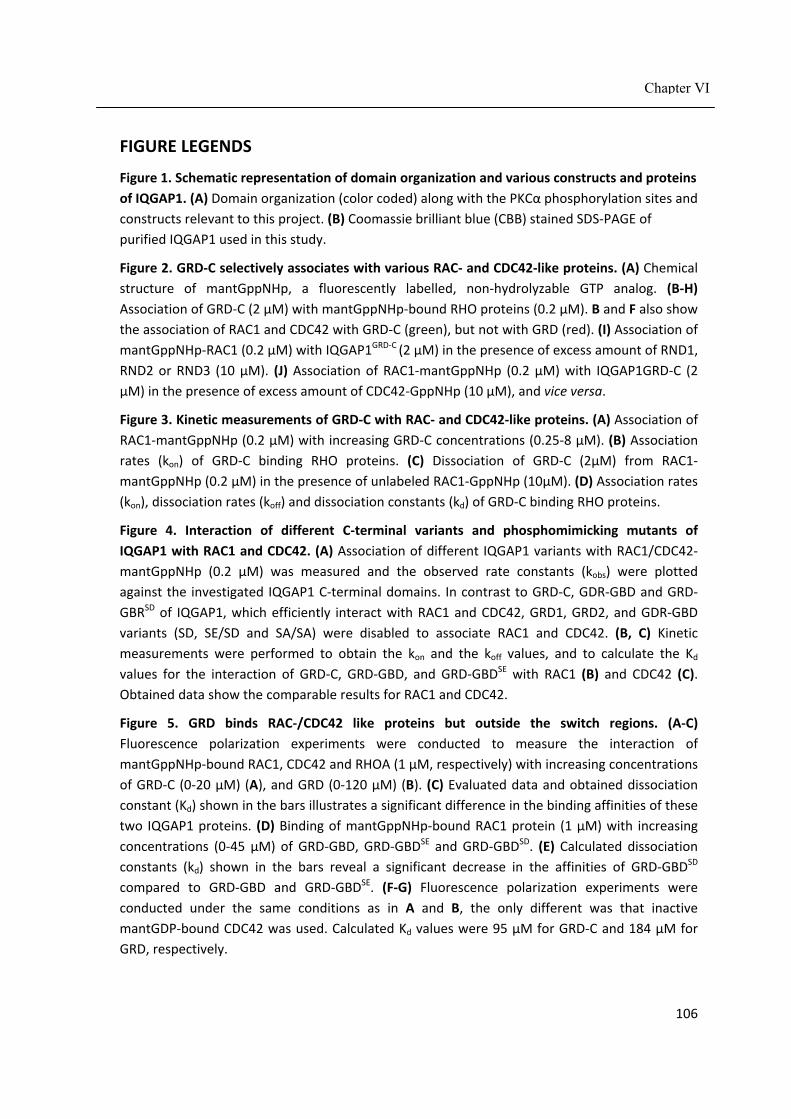
106
Chapter VI
FIGURE LEGENDS
Figure 1. Schematic representation of domain organization and various constructs and proteins
of IQGAP1. (A) Domain organization (color coded) along with the PKCα phosphorylation sites and
constructs relevant to this project. (B) Coomassie brilliant blue (CBB) stained SDS‐PAGE of
purified IQGAP1 used in this study.
Figure 2. GRD‐C selectively associates with various RAC‐ and CDC42‐like proteins. (A) Chemical
structure of mantGppNHp, a fluorescently labelled, non‐hydrolyzable GTP analog. (B‐H)
Association of GRD‐C (2 μM) with mantGppNHp‐bound RHO proteins (0.2 μM). B and F also show
the association of RAC1 and CDC42 with GRD‐C (green), but not with GRD (red). (I) Association of
mantGppNHp‐RAC1 (0.2 μM) with IQGAP1GRD‐C (2 μM) in the presence of excess amount of RND1,
RND2 or RND3 (10 μM). (J) Association of RAC1‐mantGppNHp (0.2 μM) with IQGAP1GRD‐C (2
μM) in the presence of excess amount of CDC42‐GppNHp (10 μM), and vice versa.
Figure 3. Kinetic measurements of GRD‐C with RAC‐ and CDC42‐like proteins. (A) Association of
RAC1‐mantGppNHp (0.2 μM) with increasing GRD‐C concentrations (0.25‐8 μM). (B) Association
rates (kon) of GRD‐C binding RHO proteins. (C) Dissociation of GRD‐C (2μM) from RAC1‐
mantGppNHp (0.2 μM) in the presence of unlabeled RAC1‐GppNHp (10μM). (D) Association rates
(kon), dissociation rates (koff) and dissociation constants (kd) of GRD‐C binding RHO proteins.
Figure 4. Interaction of different C‐terminal variants and phosphomimicking mutants of
IQGAP1 with RAC1 and CDC42. (A) Association of different IQGAP1 variants with RAC1/CDC42‐
mantGppNHp (0.2 μM) was measured and the observed rate constants (kobs) were plotted
against the investigated IQGAP1 C‐terminal domains. In contrast to GRD‐C, GDR‐GBD and GRD‐
GBRSD of IQGAP1, which efficiently interact with RAC1 and CDC42, GRD1, GRD2, and GDR‐GBD
variants (SD, SE/SD and SA/SA) were disabled to associate RAC1 and CDC42. (B, C) Kinetic
measurements were performed to obtain the kon and the koff values, and to calculate the Kd
values for the interaction of GRD‐C, GRD‐GBD, and GRD‐GBDSE with RAC1 (B) and CDC42 (C).
Obtained data show the comparable results for RAC1 and CDC42.
Figure 5. GRD binds RAC‐/CDC42 like proteins but outside the switch regions. (A‐C)
Fluorescence polarization experiments were conducted to measure the interaction of
mantGppNHp‐bound RAC1, CDC42 and RHOA (1 µM, respectively) with increasing concentrations
of GRD‐C (0‐20 µM) (A), and GRD (0‐120 µM) (B). (C) Evaluated data and obtained dissociation
constant (Kd) shown in the bars illustrates a significant difference in the binding affinities of these
two IQGAP1 proteins. (D) Binding of mantGppNHp‐bound RAC1 protein (1 μM) with increasing
concentrations (0‐45 μM) of GRD‐GBD, GRD‐GBDSE and GRD‐GBDSD. (E) Calculated dissociation
constants (kd) shown in the bars reveal a significant decrease in the affinities of GRD‐GBDSD
compared to GRD‐GBD and GRD‐GBDSE. (F‐G) Fluorescence polarization experiments were
conducted under the same conditions as in A and B, the only different was that inactive
mantGDP‐bound CDC42 was used. Calculated Kd values were 95 µM for GRD‐C and 184 µM for
GRD, respectively.

107
Chapter VI
Figure 6. Reciprocal expression of IQGAP isoforms and RHO proteins in hepatic stellate cells.
(A) qPCR analysis of IQGAP1, 2, 3, RAC1, 2, 3, and CDC42 in freshly isolated (quiescent, d0) and
activated HSCs (day 8) revealed that IQGAP1, 3 and RAC2 preferentially expressed in aHSCs
where IQGAP2 is downregulated. (B) Western blot analysis of RAC1, CDC42, IQGAP1 and 2 were
performed at different time points after HSC isolation (d0, d1, d4 and d8). On contrary to IQGAP2
which was expressed more in qHSCs and lesser in aHSCs, IQGAP1, RAC1, and CDC42 had higher
levels of expression in aHSCs. γ‐tubulin was applied as a inernal contral for western bloting.
Figure 7. A proposed multi‐stage mechanistic model of IQGAP interaction with IQGAP1. Low‐
affinity, GDP‐/GTP‐independent interaction of GRD with RAC1 and CDC42 proteins outside their
switch regions occurs in a way that is independent of the upstream signals, providing it is
structurally accessible and available for interactions. GBD only binds to the RAC1 and CDC42
proteins after GEFs catalyze the exchange of GDP to GTP, and they exist in an active GTP‐bound
forms. The C‐terminal domain of IQGAP1 may potentiate the IQGAP1 interaction with RAC1 and
CDC42 proteins by probably extending the resident time of the respective proteins complexes.

108
Chapter VI
Nouri et al., Figure 1
Nouri et al., Figure 2

109
Chapter VI
Nouri et al., Figure 3
Nouri et al., Figure 4
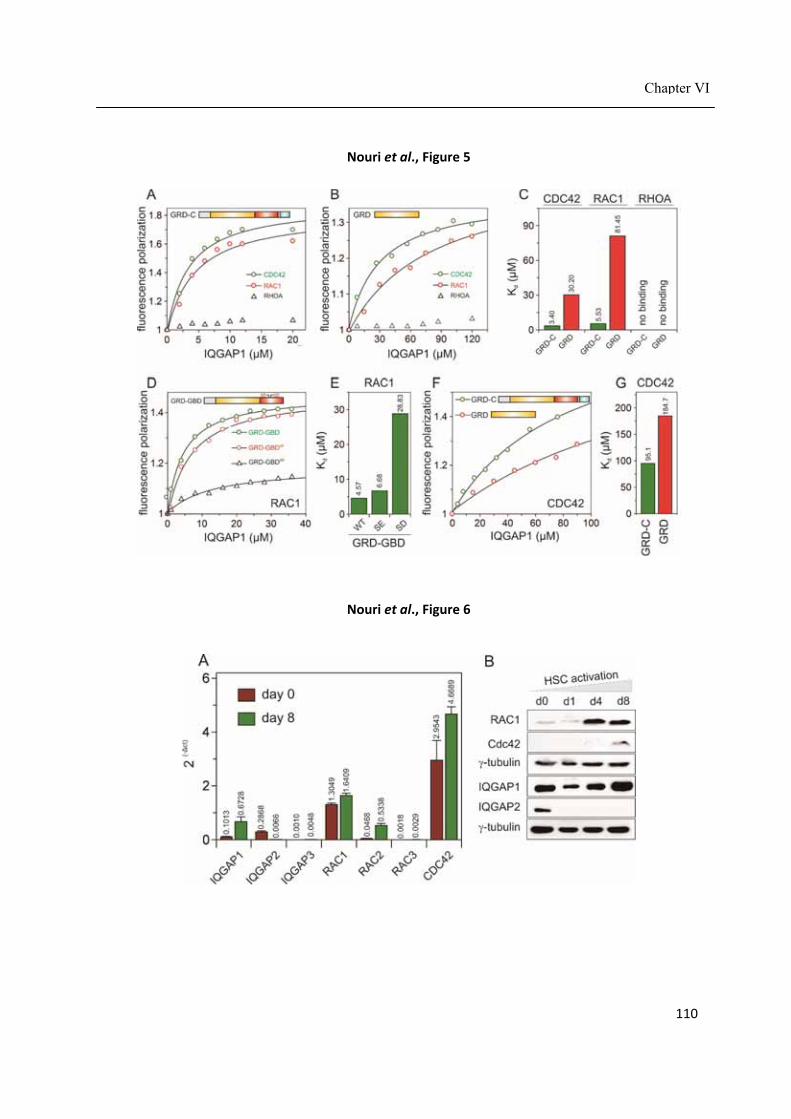
110
Chapter VI
Nouri et al., Figure 5
Nouri et al., Figure 6

111
Chapter VI
Nouri et al., Figure 7

112
Chapter VI
SUPPORTING INFORMATION
IQGAP1 interaction with RHO family proteins revisited:
kinetic and equilibrium evidence for two distinct binding sites*
Kazem Nouri1, Eyad K. Fansa1§, Ehsan Amin1, Saeideh Nakhaei‐Rad1, Radovan Dvorsky1, Lothar
Gremer2, David J. Timson3, Lutz Schmitt4, Dieter Häussinger5, and Mohammad R. Ahmadian1@
1Institute of Biochemistry and Molecular Biology II, Medical faculty of the Heinrich‐Heine University, 40225
Düsseldorf, Germany
2Institute of Physical Biology, Heinrich‐Heine University, Düsseldorf, Germany
3School of Pharmacy and Biomolecular Sciences, University of Brighton, Huxley Building, Lewes Road,
Brighton BN2 4GJ, United Kingdom
4Institute of Biochemistry, Heinrich‐Heine University, Düsseldorf, Germany
5Clinic of Gastroenterology, Hepatology and Infectious Diseases, Medical Faculty of the Heinrich‐Heine
University, Düsseldorf, Germany
Table S1: Primer sequences were obtained from Primer Bank
(http://pga.mgh.harvard.edu/primerbank) with small modifications match with rat sequences.
Target Primer Source
IQGAP1 FW: 5’‐GAGAAGACCGTTTTGGAGCTAAT ‐‘3
RV: 5’‐GGGTGAGGCTATGCTCAGG ‐‘3 NM_001 1 08489.1
IQGAP2 FW: 5’‐GCTGTCAAAACTTCAGCAGAC‐‘3
RV: 5’‐ AGGTTGTCTACACAGGTCTTGA‐‘3 XM_008760685.1
IQGAP3 FW: 5’‐AACTTCTGGCTTTCTGCGGTA ‐‘3
RV: 5’‐AATGCAGTAGATCACCCGAGG‐‘3 NM_001 1 91 709.1
RAC1 FW: 5’‐ ACGGAGCCGTTGGTAAAACC‐‘3
RV: 5’‐ AGACGGTGGGGATGTACTCTC‐‘3 NM_1 34366.1
RAC2 FW: 5’‐ GACAGTAAACCTGTGAACCTGG‐‘3
RV: 5’‐ CTGACTAGCGAGAAGCAGATG‐‘3 XM_006242028.1
RAC3 FW: 5’‐ TATCCCCACAGTTTTCGACAAC‐‘3
RV: 5’‐GAGAGTGGCCGAAGCCTAT ‐‘3 XM_006247966.1
CDC42 FW: 5’‐GAAAATGTGAAAGAAAAGTGGGTG‐‘3
RV: 5’‐TCTGGAGTAATAGGCTTCTGTTTG‐‘3 XM_006239270.1
HPRT1 FW: 5’‐AAG TGT TGG ATA CAG GCC AGA‐‘3
RV: 5’‐GGC TTT GTA CTT GGC TTT TCC‐‘3 self‐designed

113
Chapter VI
Nouri et al. Figure S1
Figure S1. IQGAP1GBD is crucial for the interaction with RAC1. Association of RAC1 mantGppNHp
labeled (0.2 μM) and various IQGAP1 variants (2 μM) were measured. In contrast to GRD‐C, GDR‐
GBD, and GRD‐GBDSE variants of IQGAP1, GRD1, GRD2, and GDR‐GBD variants (SD, SE/SD, and
SA/SA) failed to associate with RAC1. Calculated kobs values for associating IQGAP1 fragments
with RAC1 are shown in parenthesis.

114
Chapter VI
Nouri et al. Figure S2
Figure S2. Kinetic measurements of GRD‐C, GRD‐GBD, and GRD‐GBDSE association with RAC1.
Association of mantGppNHp‐RAC1 (0.2 μM) with increasing concentrations (2‐12 μM) of IQGAP1,
association rates (kon), and dissociation of IQGAP1 (2μM) from RAC1‐mantGppNHp (0.2 μM) in
the presence of unlabeled RAC1‐GppNHp (10μM) are shown for (A‐C) GRD‐C, (D‐F) GRD‐GBD,
and (G‐I) GRD‐GBDSE, respectively. Quantitative data are presented in figure 4B

115
Chapter VI
Nouri et al. Figure S3
Figure S3. IQGAP1GBD is essential for the CDC42 interaction. Association of different IQGAP1
variants (2 μM) with CDC42‐mantGppNHp (0.2 μM) was measured under the same conditions as
in S1. CDC42 associates with GRD‐C, GDR‐GBD, and GRD‐GBRSE, but not with GRD1, GRD2, and
GDR‐GBD variants (SD, SE/SD and SA/SA). kobs values are presented in parenthesis in front of
each associating fragment.

116
Chapter VI
Nouri et al. Figure S4
Figure S4. Kinetic measurements of GRD‐C, GRD‐GBD, and GRD‐GBDSE association with CDC42.
Kinetic measurements were performed under the same conditions as in S2. Association of
mantGppNHp‐CDC42 (0.2 μM) with increasing concentrations (2‐12 μM) of IQGAP1 proteins,
association rates (kon), and dissociation of IQGAP1 (2μM) from CDC42‐mantGppNHp (0.2 μM) in
the presence of unlabeled CDC42‐GppNHp (10μM) are shown for GRD‐C (A‐C), GRD‐GBD (D‐F),
and GRD‐GBDSE (G‐I), respectively. Corresponding quantitative data are presented in figure 4C.

117
Chapter VII
Juvenile myelomonocytic leukemia displays mutations in components of the RAS pathway and the PRC2 network
Published in: Nature Genetics
Impact factor: Own Proportion to this work:
29.35 (2014) 20% Site direct mutagenesis Cloning Transfection Analysis of interaction between RAC2 mutants and RAC effector with pull-down assay Monitoring the signaling activity of RAC2 mutants towards AKT/mTORC and MAP kinase pathways with immunoblotting Writing the manuscript
Graphical Abstract

118
Chapter VII

119
Chapter VII

120
Chapter VII

121
Chapter VII
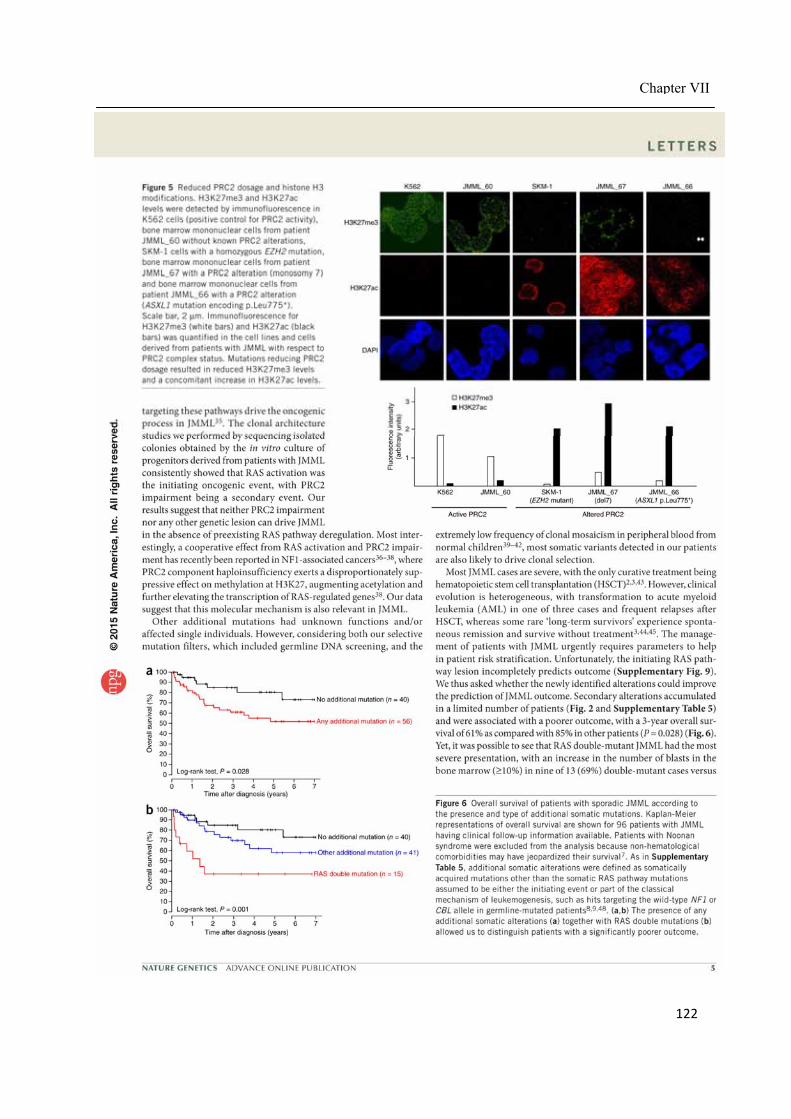
122
Chapter VII

123
Chapter VII

124
Chapter VII

125
Chapter VII
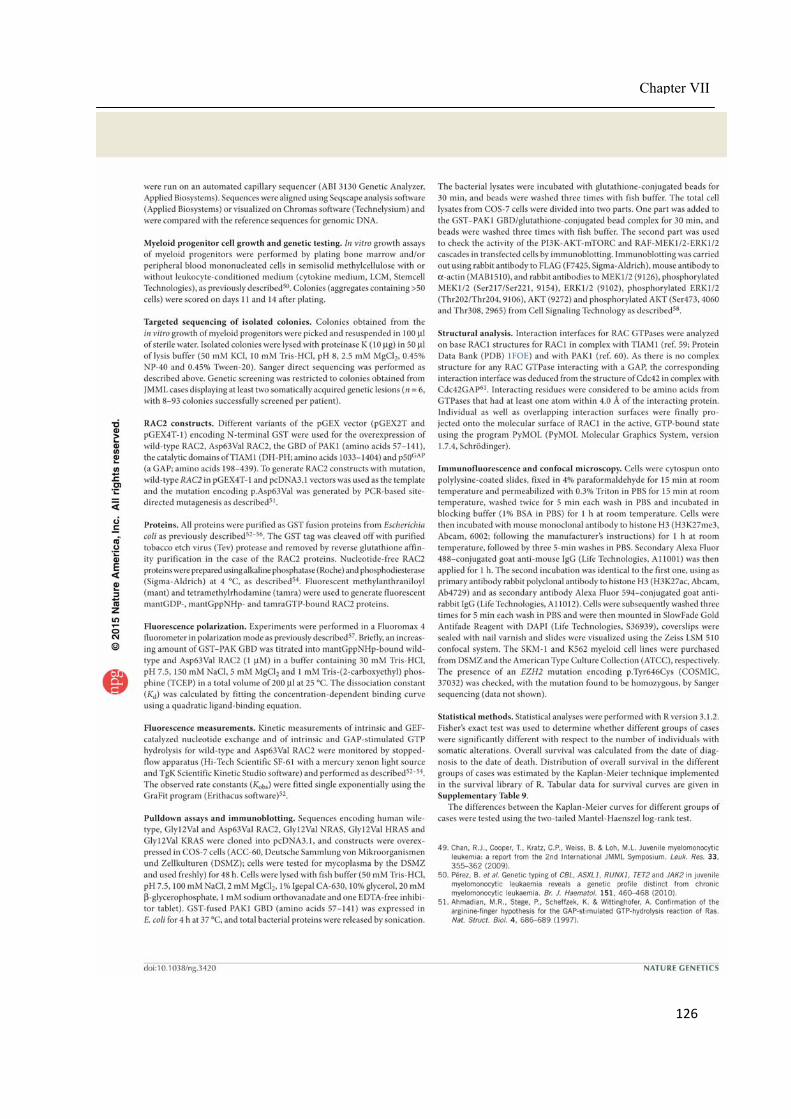
126
Chapter VII

127
Chapter VII

128
Chapter VII
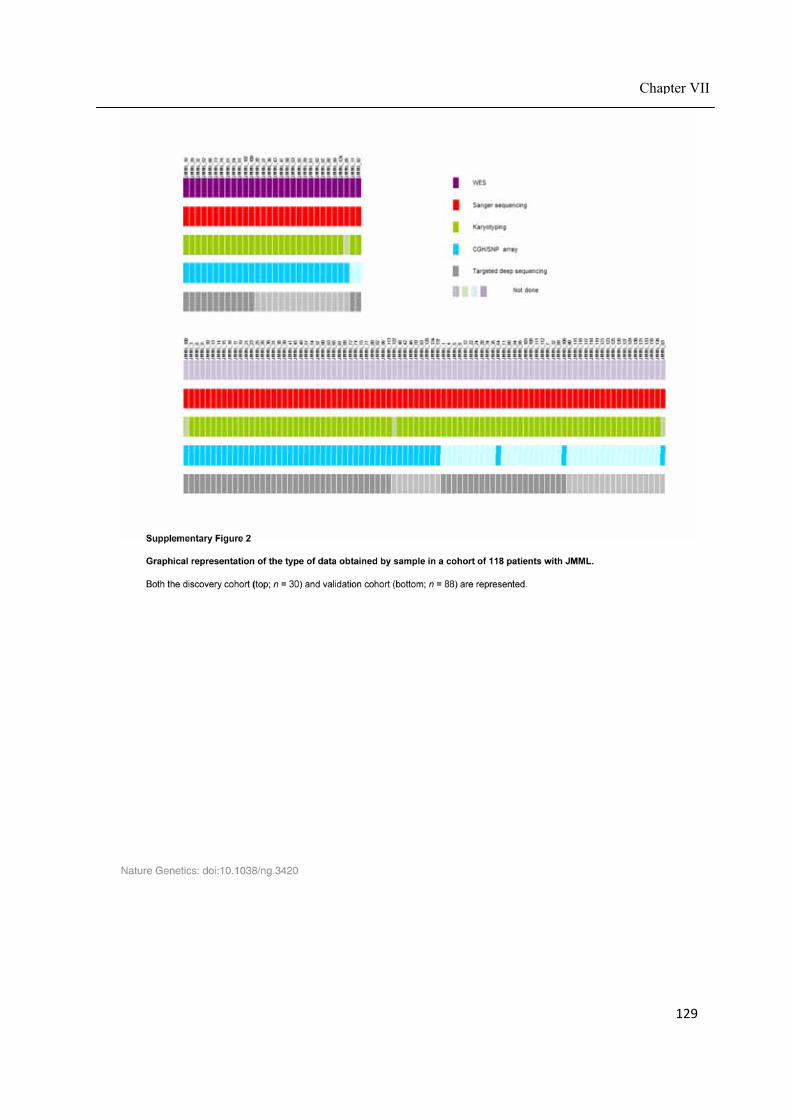
129
Chapter VII

130
Chapter VII

131
Chapter VII

132
Chapter VII

133
Chapter VII

134
Chapter VII

135
Chapter VII
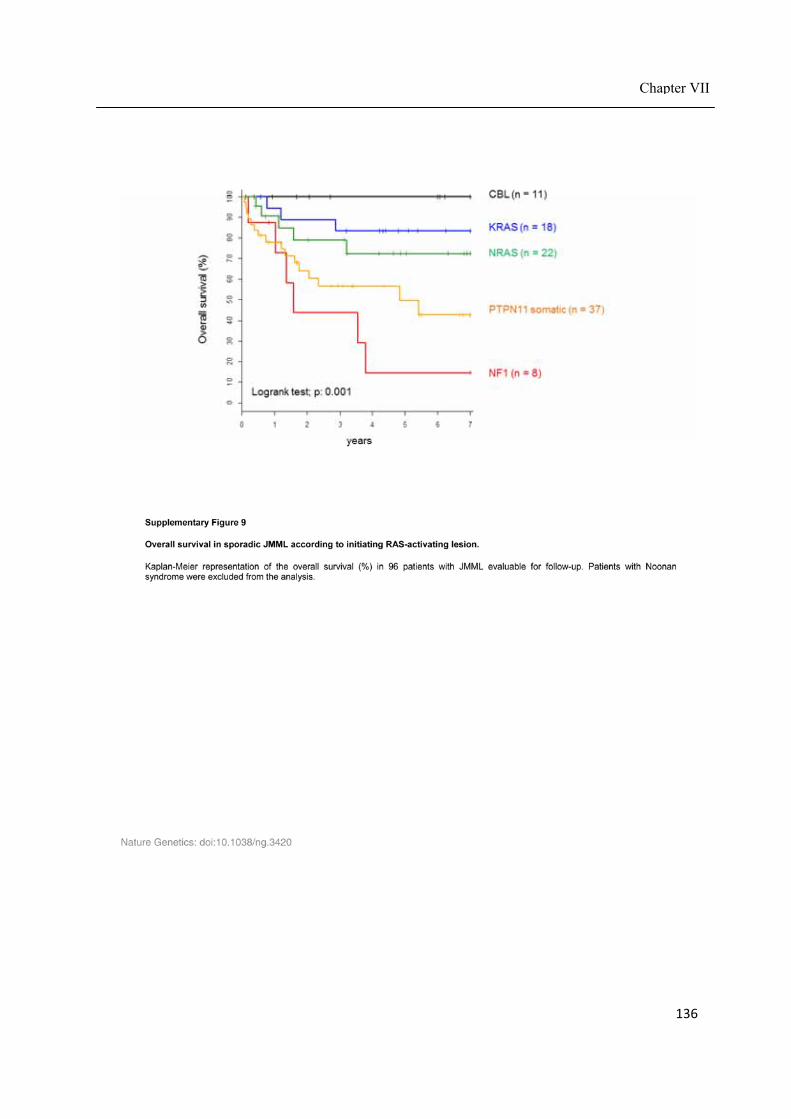
136
Chapter VII

137
Chapter VII

138
Chapter VII

139
Chapter VII

140
Chapter VII

141
Chapter VII

142
RHO
Chapter VIII
General discussion
RAS

143
Chapter VIII
General discussion
Hepatic stellate cells (HSCs) are central to metabolism and storage of retinoids in the body
and are involved in liver development, immunoregulation, homeostasis, regeneration and
fibrosis (Winau et al., 2008; Blaner et al., 2009; Yin et al., 2013; Kordes et al., 2014). In healthy
liver HSCs are in a state referred as quiescent (G0). Quiescent HSCs (qHSCs) are multipotent cells
that after activation could differentiate to other liver cell types (Kordes et al., 2007; Kordes et al.,
2008; Sawitza et al., 2009b; Kordes et al., 2013; Sawitza et al., 2015). Throughout activation,
HSCs alter their quiescent characteristics and adopt into the cells, which are recognized as
proliferative, multipotent, contractile and migratory cells (Kordes et al., 2014; Bitencourt et al.,
2014; Dong et al., 2015) (chapter I, hallmarks and roles of hepatic stellate cells). In some
pathophysiological conditions, sustained activation of HSC causes the accumulation of
extracellular matrix (ECM) in the liver and initiates the liver diseases, such as fibrosis, cirrhosis
and hepatocellular carcinoma (HCC) (Yin et al., 2013b). The molecular mechanisms that maintain
the quiescent of HSC and trigger HSC activation and differentiation are poorly understood and
needs further investigation. Therefore, it is noteworthy to search for key signaling pathways that
govern HSCs fate decision and modulate them in a way that activated HSC (aHSC) contributes
into liver regenerative not fibrosis. RAS molecular switches are nodes of intracellular signaling
pathways. RAS superfamily is composed of different families (RAS, RHO, RAN, RAD, RAG, RAB and
ARF) with specific mode of regulation, expression, effector proteins and subcellular localization,
which through the activation of individual signaling pathways exert their cellular functions. RAS
and RHO family GTPases are well‐recognized for their involvement in the wide spectrum of
cellular responses, such as cell growth, proliferation, survival, differentiation, adhesion,
contraction, motility and migration (Karnoub and Weinberg, 2008; Heasman and Ridley, 2008b).
These families are subdivided farther to the different subgroups and isoforms with individual
functions (chapter I, RAS/RHO family GTPases sections). The focus of this study was to consider
the RAS GTPases activity, networking, cross‐talking and biological functions in modulating the
HSC activation processes and fate cell decisions.
This doctoral thesis provided new insights into the expression pattern, isoform specificity,
activity and networking of RAS family members and their signaling components in both quiescent
(here after, d0) and activated (d8) HSCs. Obtained data revealed differential expression pattern
for RAS isoforms, where embryonic stem cell‐expressed RAS (ERAS) specifically expressed in
quiescent HSCs and drastically down‐regulated after activation. ERAS was identified in 2003 as a
new member of the RAS family, which is specifically expressed in undifferentiated mouse
embryonic stem cells (Takahashi et al., 2003). In addition to stem cells, ERAS has been detected
in the several adult cynomolgus tissues (Tanaka et al., 2009), and in gastric cancer and
neuroblastoma cell lines (Aoyama et al., 2010; Kubota et al., 2010). Still the individual roles of
ERAS have not been fully described. This raised the question, what would be the function of
ERAS in quiescent and non‐proliferative cells? To address this question, first we investigated the
biochemical and molecular features of ERAS with generating different ERAS mutants and
analyzed the cellular outcomes in overexpressed system (chapter II). Second, we monitored the
signaling networking of the endogenous ERAS/RAS in quiescent HSC vs. activated HSC (chapter

144
Chapter VIII
III). Third, we aimed to investigate the cross‐talking between the RAS‐RHO signaling in both in
vitro and disease progression (chapter V‐VII).
Biochemical characteristic of embryonic stem cell‐expressed RAS (ERAS)
Comprehensive sequence and structural analysis between ERAS and other Ras isoforms,
revealed ERAS harbors additional motifs, regions and sequence deviations (in critical locations of
G1, G2 and G3, see figure 6) which are not present in classical members of RAS family (HRAS,
NRAS and KRAS). Therefore, we generated different ERAS variants with mutations and deletion
of these motifs and region and investigated their impact on ERAS specific function and
localization. These ERAS variants included ERASΔN, ERASS7, ERasA31/A32/A33, ERASS226/S228, ERASSwI,
ERASSwII, ERASSwI/SwII, ERASR79, ERASSwI/R79, ERASR79/SwII and ERASSwI/R79/SwII. We depicted the place of
these mutations in the predicted structure of ERAS with colors in the figure 6. Here we will
discuss the new findings about each of this sequence fingerprints (chapter II) (Nakhaei‐Rad et al.,
2015).
Figure 6. Predicted structure of full‐length ERAS and exhibits of the three‐dimensional places of studied ERAS mutants. In contrast to the G domain as well as N‐ and C‐terminus of ERAS appear as disordered/unstructured regions. P7 and RRR motifs are shown in purple, W79 in deep purple, mutations in switch I in yellow, mutations in switch II in brown, C226/C228 at the very C‐terminus in cyan. HVR, hypervariable region; SWI, switch I; SWII, switch II.
N‐terminal extension of ERAS—We proposed that N‐terminal extension of ERAS might
modulate its localization through interaction with potential adaptor/scaffold proteins via
putative PxxP and RRR motifs. With our co‐localization studies we did not observed significant
differences in localization of the N‐terminus mutants of ERAS (ERASΔN, ERASS7 and ERasA31/A32/A33).
However, considering our results we cannot exclude the role of ERAS N‐terminus as a putative
protein interaction site, since ERAS is not expressed endogenously in the MDCK II cells (used for
confocal studies) and therefore its binding partner may not be available in this cell line. To
confirm our hypothesis we need to study ERAS localization in the cells that endogenously express

145
Chapter VIII
ERAS such as hepatic stellate cells (chapter III). However, our cell‐based studies revealed that the
N‐terminal extension of ERAS is critical for PI3K‐AKT‐mTORC activation and N‐terminal truncated
ERAS variants (ERAS∆N and ERAS∆N/S226/S228) remarkably had a lower signaling activity. One
explanation maybe the role of the unique N‐terminus in lateral segregation of ERAS across the
membrane that consequently specifies association with and activation of its effectors in a
manner reminiscent to microdomain localization of HRAS that regulates its interaction with
effector proteins of CRAF and PI3K (Jaumot et al., 2002). In addition, ERAS was found in
membrane ruffles (data not shown) maybe induced by RAC1, which can be activated by the
ERAS‐PI3K‐PIP3‐RACGEF axis (Innocenti et al., 2003; Inabe et al., 2002; Dillon et al., 2014). Such a
scenario has been reported for the RRAS N‐terminal 26 amino acid extension, which has been
proposed to positively regulation RAC activation and cell spreading (Holly et al., 2005). Similar to
ERAS, RRAS N‐terminus modulates its specific functions but revealed no impact in cellular
localization (Holly et al., 2005).
Palmitoylation modification and ERAS trafficking—RAS proteins are compartmentalized by PTMs
at their C‐terminus, with the CAAX motif as the farnesylation site and additional upstream
cysteine residues as the palmitoylation site(s) in the case of H, and NRAS (Ahearn et al., 2011;
Apolloni et al., 2000; Rocks et al., 2005; Schmick et al., 2014). We found substitution of two
cysteine residues C226/C228 in HVR of ERAS with serines clearly impaired the plasma membrane
localization of protein. In addition, our confocal microscopy data revealed that in contrast to
plasma membrane localization of ERASWT, palmitoylation‐deficient ERASS226/S228 is mainly
localized, with clear pattern, in cytoplasm and also in endomembrane. These data, support
proposed reports demonstrating that HRAS and NRAS cycle between Golgi and the plasma
membrane via reversible and dynamic palmitoylation‐depalmitoylation reactions (Matallanas et
al., 2006; Rocks et al., 2005; Goodwin et al., 2005).
Effector binding regions—A detailed study of structure–sequence relationships revealed a
distinctive effector binding regions for ERAS in comparison with RAS isoforms (H, N, and KRAS).
Subsequent interaction analysis with five different RAS effectors revealed that effector binding
profile of ERAS significantly differs from HRAS. ERAS tightly bounds to PI3Kα and revealed very
low affinity for other RAS effectors. In contrast, HRAS showed an opposite pattern with highest
affinity for CRAF. These data were confirmed by investigating the respective downstream
signaling cascades (PI3K‐AKT‐mTORC and CRAF‐MEK1/2‐ERK1/2) at the level of phosphorylated
AKT, MEK1/2 and ERK1/2.
ERAS‐CRAF interaction—Substitutions for corresponding residues in HRAS of deviating
residues in switch I, II and interswitch regions of ERAS for corresponding residues in HRAS
provided several interesting and new insights. One is a large shift in effector binding affinity of
ERAS gain of CRAF binding. The major difference was observed with ERASR79, where a tryptophan
was replaced by an arginine (R41 in HRAS). This variant led to a significant increase of CRAF
binding and partly rescued the low affinity of the switch variants (ERASSwI/R79 and ERASSwI/R79/SwII).
According to the crystal structure (Nassar et al., 1996), R41 (W79 in ERAS) forms hydrogen bonds
with Q66 and N64 of CRAF‐RBD, which enables ERASR79 to make additional electrostatic contacts
with CRAF and to bind tighter.

146
Chapter VIII
ERAS‐PI3K interaction —In comparison with HRAS, ERAS interacts much strongly with PI3Kα‐
RBD and activates PI3K‐AKT‐mTORC cascade. Mutagenesis at switch and interswitch regions
(ERASSwI, ERASR79 and ERASSwII), attenuated binding of ERAS to PI3Kα‐RBD, demonstrating the role
of critical ERAS residues at effector binding regions. These data are consistent with previous
study that has shown PI3Kγ‐RBD contacts both switch I and switch II regions of HRAS (Pacold et
al., 2000). Interestingly, W79R mutation of ERAS (R41 HRAS), which has increased binding to
CRAF, PLCɛ, and RALGDS, dramatically reduced the binding to PI3Kα. The affinity of this ERAS
mutant (ERASR79) for PI3Kα‐RBD appears similar to that of HRASV12. In the same line of evidence,
we observed ERASR79 also was deficient at activation of RAS‐PI3K‐AKT‐mTORC2 pathway as
monitored with S473 phosphorylation of AKT. Thus, W79 in ERAS, represents a specificity‐
determining residue for the proper binding to and activation of PI3K.
ERAS‐RASSF5 interaction—RASSF members are known as a RAS effector with tumor
suppressor functions. RASSF5, have two splice variants NORE1A and RAPL, which share same
RBD (Stieglitz et al., 2008). We applied RASSF5‐RBD domain to analyze the interaction of ERAS
variants with this RAS effector. Switch I H70Y/Q75E mutation of ERAS (ERASSwI) attenuated the
binding to RASSF5 and this was the case for all ERAS variant harboring switch I mutations
(ERASSwI/R79, ERASSwI/SwII, and ERASSwI/R79/SwII). Switch II and W79R mutations did not affect the
binding affinity for RASSF5, emphasizing the importance of the more conserved switch I region in
the complex formation of the RAS proteins with RASSF5 (Stieglitz et al., 2008). It remains to be
investigated whether ERAS is an activator of RASSF5 and thus a regulator of HIPPO pathway.
With the aim of this study, we shed light on the sequence fingerprint and cellular targets of
ERAS and intruded ERAS as a unique member of RAS family with its own mode of regulation and
function. N‐terminal of ERAS is important for its cellular functions and probably not for its
localization. We found that switch regions of ERAS act as core effector binding regions that form
an ERAS specific interaction interface for its effectors such as PI3Kα. ERAS binding to other RAS
effectors, such as RASSF5, RALGDS and CRAF, is weak but may still be of physiologically
relevance. W79 of ERAS appears to determine the effector selectivity.
However, this study raised several questions. What is the function of endogenous ERAS in
normal cells of the body? Which isoform of PI3K is the main target of ERAS? Which signaling
pathways are downstream of endogenous ERAS? We identified that one of the liver cell types, is
called hepatic stellate cells, which endogenously express ERAS. To address these questions, we,
therefore, investigated the ERAS regulation, downstream pathways and functions in hepatic
stellate cells (chapter III).
Signaling network and proposed function of endogenous ERAS in HSC
In this study, we found embryonic stem cell‐expressed RAS (ERAS) expressed in hepatic
stellate cells (HSCs). The presence of ERAS mRNA was detected in quiescent HSCs but not in
activated HSCs where other RAS‐related genes, such as RRAS, MRAS, RALA and RAP2A, were
upregulated during HSC activation. This observation raised the questions, what would be the
function of ERAS in quiescent (G0) cells and why do we need a reciprocal expression of these RAS
isoforms in quiescent vs. activated HSC? To address these questions, first we investigated the

147
Chapter VIII
presence of ERAS protein with our monoclonal antibody against rat ERAS in different liver cells
and checked the activity and isoform specificity of RAS and their signaling components in
quiescent and activated HSC (chapter III).
Obtained data, revealed ERAS protein in quiescent HSC but not in other liver cell types, and
ERAS was considerably reduced during HSC activation (d4 and d8). To elucidate the ERAS
functions in quiescent HSCs, we sought for ERAS specific effectors and the corresponding
downstream pathways.
Role of the ERAS‐PI3K‐AKT‐mTORC1 activity in quiescent HSCs—Endogenous ERAS
expression in quiescent HSCs strongly correlates with high levels of AKT phosphorylated at T308
and S473 through PDK1 and mTORC2, respectively. Protein interaction and immunoprecipitation
analysis further revealed that ERAS physically interacts with PI3Kα/. Thus, we propose ERAS as a regulator of the PI3K‐PDK1‐AKT‐mTORC1 axis in quiescent HSCs. This axis controls various
processes including cell cycle progress, autophagy, apoptosis, lipid synthesis and translation (Kim
and Spiegelman, 1996; Kim et al., 1998; Wang et al., 2012; Tzivion et al., 2011; Prasad et al.,
2015). The latter is controlled by mTOR mediated activation of S6 kinase, which in turn
phosphorylates different substrates, such as ribosomal protein S6, mTOR itself at S2448 and
mSIN1 at T86, which is an upstream component of mTORC2 (Fig. 5) (Chiang and Abraham, 2005;
Liu et al., 2014b; Ma et al., 2008). Previous studies have shown that quiescent HSCs produce and
secrete a significant amount of HGF (Schirmacher et al., 1992; Maher, 1993), which is modulated
by the mTORC1‐S6 kinase pathway (Tomiya et al., 2007) and is known to regulate hepatocyte
survival (Wang et al., 2002).
Activity of the mTORC2‐AKT‐FOXO1 axis in quiescent HSCs. In comparison with mTORC1, the
regulation of mTORC2 is less understood (Oh and Jacinto, 2011). Our findings indicate that ERAS
may act as an activator of the mTORC2 pathway. Retrovirally expressed ERAS has been shown to
promote phosphorylation of both AKT (S473) and FOXO1 (S256) in induced pluripotent stem cells
(iPSCs) generated from mouse embryonic fibroblasts (Yu et al., 2014). Thus, ERAS‐AKT‐FOXO1
signaling has been suggested to be important for somatic cell reprogramming. We detected high
levels of p‐AKTS473 and p‐FOXO1S256 in quiescent HSCs endogenously expressing ERAS.
Phosphorylated FOXO1 is sequestrated in the cytoplasm and cannot translocate to the nucleus
where it binds to gene promoters and induces apoptosis (Fig. 7) (Wang et al., 2014).
Interestingly, a possible link between ERAS and mTORC2 may be mSIN1, which appears to be an
upstream component and modulator of mTORC2 activity (Huang and Fingar, 2014). It has been
reported that mSIN1 contains a RAS‐binding domain with some homology to that of CRAF
(Schroder et al., 2007). Taken together, ERAS‐mTORC2‐AKT‐FOXO1 axis may insure the survival
of HSCs in the space of Disse by interfering with the programed cell death (Fig. 7B).
Role of the HGF‐JAK‐STAT3 axis in quiescent HSCs—Ectopic expression of ERAS stimulates
phosphorylation of STAT3 likely downstream of leukemia inhibitory factor (LIF) (Yu et al., 2014).
ERAS may compensate for lack of LIF in support of iPSC generation (Yu et al., 2014). Moreover,
the LIF‐STAT3 axis is essential for keeping mouse stem cells undifferentiated in cultures and
regulates self‐renewal and pluripotency of embryonic stem cells (Stuhlmann‐Laeisz et al., 2006).

148
Chapter VIII
Consistently, we detected high levels of p‐STAT3 and p‐FOXO1 in quiescent HSCs, which may
control survival, self‐renewal, and multipotency of quiescent HSCs. In addition, stimulation of the
HGF receptor (c‐MET) that is expressed in HSCs results in JAK activation and phosphorylation of
STAT3 (Boccaccio et al., 1998; Friedman, 2008). However, the presence and activity of LIF‐STAT3
axis in HSCs needs further investigations.
Quiescent HSCs display a locked RAS‐MAPK signaling pathway—In quiescent HSCs only basal
levels of activated (phosphorylated) MEK and ERK could be observed although all components of
the RAS‐RAF‐MEK‐ERK axis were expressed. There are several explanations for the strongly
reduced activity of RAS‐MAPK signaling in quiescent HSCs (Fig. 7B); I) Absence of external stimuli,
such as PDGF1 and TGFβ1 in healthy liver. These growth factors are strong activators of the
MAPK pathway in activated HSCs (Reimann et al., 1997; Carloni et al., 2002); II) Presence of an
intracellular inhibitor, like special AT‐rich binding protein 1 (SATB1), which is specifically
expressed in quiescent HSCs and down‐regulated during HSC activation (He et al., 2015).
Interestingly, SATB1 has been shown to be a strong inhibitor of RAS‐MAPK pathway that may
lock this signaling in quiescent HSCs (He et al., 2015); III) MicroRNAs (miRNAs), especially miRNA‐
21, may play a role in the reciprocal regulation of the RAS‐MAPK pathway in quiescent vs.
activated HSCs. Upregulated miRNA‐21 in activated HSCs results in MAPK activation, which is
based on depletion of sprouty homolog 1 (SPRY1), a target gene of miRNA‐21 (Coll et al., 2015)
and negative regulator of the RAS‐MAPK pathway (Mason et al., 2006).
Up‐regulation of individual RAS isoforms in activated HSCs—Comprehensive mRNA analysis
of various RAS family members revealed that RRAS, MRAS, RALA and RAP2A were upregulated
during HSC activation. These genes may also play a role in the coordination of the cellular
processes, required for activation and differentiation of HSCs, such as polarity, motility, adhesion
and migration. Interestingly, RRAS has been implicated in integrin‐dependent cell adhesion
(Kinbara et al., 2003). Of note, in endothelial cells the RRAS‐RIN2‐RAB5 axis stimulates
endocytosis of β1 integrin in a RAC1‐dependent manner (Sandri et al., 2012). On the other hand,
the muscle RAS oncogene homolog (MRAS), a RRAS‐related protein, is upregulated during HSC
activation. Among the different members of RAS family, only MRAS can interact with SHOC2 in
ternary complex with protein phosphatase 1 (PP1), which dephosphorylates autoinhibited CRAF
and activates the CRAF‐MEK‐ERK axis (Rodriguez‐Viciana et al., 2006). These findings and data
obtained in this study suggest that MRAS may be responsible for high level of p‐MEK and p‐ERK
in activated HSCs due to the RAF kinase activation. RAP proteins, including RAP2A, are involved
in different cellular processes and play pivotal roles in cell motility and cell adhesion (Torti and
Lapetina, 1994; Paganini et al., 2006). Recently, it has been shown RAP2A is a novel target gene
of p53 and a regulator of cancer cell migration (Wu et al., 2015). Moreover, expression of RAP2A
in cancer cells results in secretion of two matrix metalloproteinases (MMP2 and 9) and AKT
phosphorylation at Ser473, which promotes tumor invasion (Wu et al., 2015). Notably, p53 is
unregulated in activated HSCs (Saile et al., 2001). Thus, we speculate the binding of p53 to
RAP2A promoter may results in transcription of RAP2A in activated HSCs and stimulates
secretion of MMPs, which remodels the extracellular matrix and facilitate the migration of HSCs
in the space or Dissé.
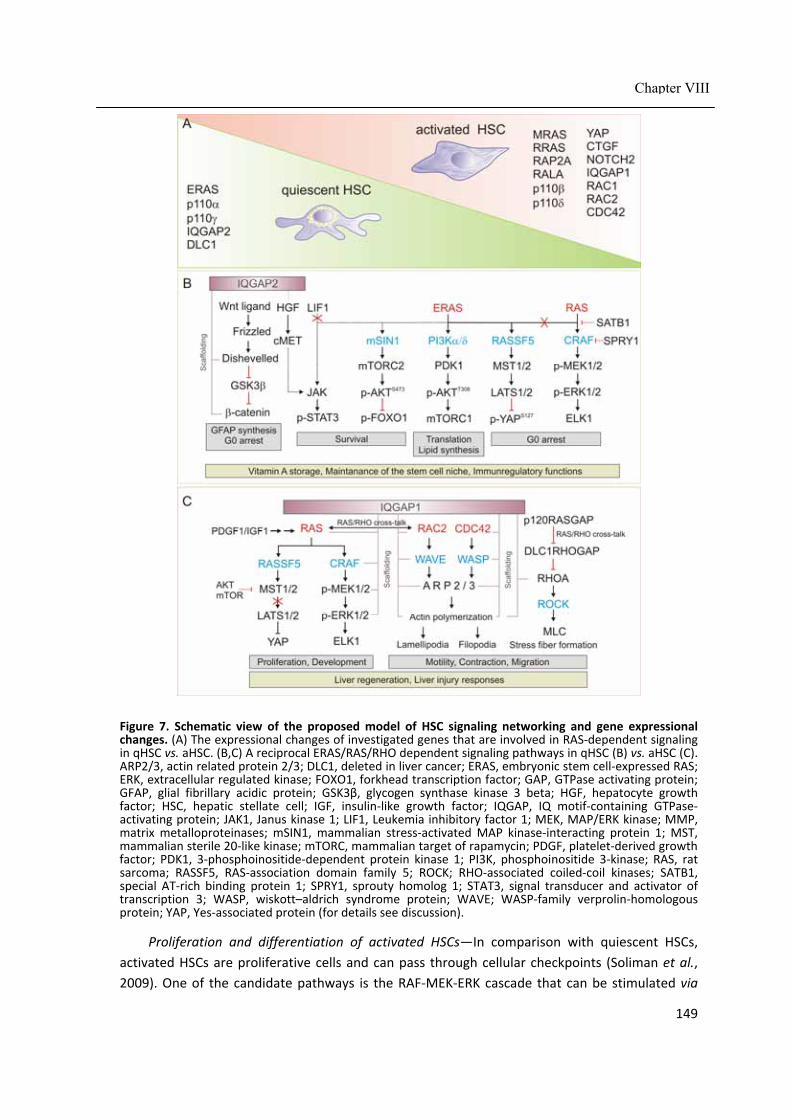
149
Chapter VIII
Figure 7. Schematic view of the proposed model of HSC signaling networking and gene expressional changes. (A) The expressional changes of investigated genes that are involved in RAS‐dependent signaling in qHSC vs. aHSC. (B,C) A reciprocal ERAS/RAS/RHO dependent signaling pathways in qHSC (B) vs. aHSC (C). ARP2/3, actin related protein 2/3; DLC1, deleted in liver cancer; ERAS, embryonic stem cell‐expressed RAS; ERK, extracellular regulated kinase; FOXO1, forkhead transcription factor; GAP, GTPase activating protein; GFAP, glial fibrillary acidic protein; GSK3β, glycogen synthase kinase 3 beta; HGF, hepatocyte growth factor; HSC, hepatic stellate cell; IGF, insulin‐like growth factor; IQGAP, IQ motif‐containing GTPase‐activating protein; JAK1, Janus kinase 1; LIF1, Leukemia inhibitory factor 1; MEK, MAP/ERK kinase; MMP, matrix metalloproteinases; mSIN1, mammalian stress‐activated MAP kinase‐interacting protein 1; MST, mammalian sterile 20‐like kinase; mTORC, mammalian target of rapamycin; PDGF, platelet‐derived growth factor; PDK1, 3‐phosphoinositide‐dependent protein kinase 1; PI3K, phosphoinositide 3‐kinase; RAS, rat sarcoma; RASSF5, RAS‐association domain family 5; ROCK; RHO‐associated coiled‐coil kinases; SATB1, special AT‐rich binding protein 1; SPRY1, sprouty homolog 1; STAT3, signal transducer and activator of transcription 3; WASP, wiskott–aldrich syndrome protein; WAVE; WASP‐family verprolin‐homologous protein; YAP, Yes‐associated protein (for details see discussion).
Proliferation and differentiation of activated HSCs—In comparison with quiescent HSCs,
activated HSCs are proliferative cells and can pass through cellular checkpoints (Soliman et al.,
2009). One of the candidate pathways is the RAF‐MEK‐ERK cascade that can be stimulated via

150
Chapter VIII
different growth factors. Consist with previous studies, we detected high levels of p‐MEK and p‐
ERK in culture‐activated HSCs (Reimann et al., 1997; Gu et al., 2013). Three scenarios may explain
the elevated RAF‐MEK‐ERK activity in activated HSCs: I) As discussed above, MRAS in the complex
with SHOC2 and PP1 is able to activate the CRAF‐MEK‐ERK pathway (Wu et al., 2015). p‐ERK
translocates to the nucleus and phosphorylates different transcriptional factors, including Ets1
and c‐Myc thereby eliciting cell cycle progression and proliferation. The cytoplasmic p‐ERK
alternatively phosphorylates Mnk1 and p90RSK and thereby promotes protein synthesis and cell
growth (Fukunaga and Hunter, 1997; Pereira et al., 2013) II) PDGF and IGF1 are the most potent
mitogens for activated HSCs and induce activation of MAPK pathways (Reimann et al., 1997;
Iwamoto et al., 2000). III) The expression of SATB1, a cellular inhibitor of the RAS‐RAF‐MEK‐ERK
pathway, significantly declines during HSC activation (He et al., 2015).
YAP controls cell cycle arrest vs. proliferation of HSCs—We observed a moderate interaction
between ERAS and RAS‐association domain (RA) of RASSF5A. Previously, we showed that switch I
of ERAS is important for ERAS‐RASSF5 interaction and mutation in this region impairs ERAS
binding to RASSF5 (Nakhaei‐Rad et al., 2015). RASSF5‐MST1/2‐LATS1/2 activity promotes
phosphorylation, and therefore sequestration and proteasomal degradation of YAP in cytoplasm
(Ramos and Camargo, 2012b; Rawat and Chernoff, 2015). YAP is a transcriptional co‐activator
that promotes transcription of CTGF and NOTCH2, which are involved in cell development and
differentiation (Camargo et al., 2007; Avruch et al., 2010; Lu et al., 2010; Yimlamai et al., 2014).
Recently, van Grunsven and colleagues reported that transcriptional co‐activator of YAP controls
in vitro and in vivo activation of HSCs (Mannaerts et al., 2015). Consistent with this study we
observed hardly any YAP protein in quiescent HSCs in comparison to activated HSCs. Thus, our
data suggest that YAP degradation through RASSF5‐MST1/2‐LATS1/2 may be triggered by binding
and recruitment of RASSF5 to the plasma membrane via ERAS‐GTP. High levels of YAP
transcriptional activity in activated HSCs, may be due to the inhibitory activities of AKT and mTOR
on MST1/2 (Chiang and Martinez‐Agosto, 2012) and may thus cause opposite effects of the pro‐
apoptotic RAS‐RASSF5‐MST1/2‐LATS1/2 pathway (Fig. 7C), leading to increased cell survival,
proliferation and development of activated HSCs (Mannaerts et al., 2015).
Overexpression and endogenous studies of ERAS (chapter II and III), demonstrate that ERAS
preferentially interact with PI3Kα/ and RASS5A, is able to signal through the PI3K‐PDK1‐AKT‐mTORC and RASSF5‐MST1/2‐LATS1/2 axis. Therefore, this study adds ERAS signaling to the
remarkable features of quiescent HSCs and the cellular outcome of these signaling pathways
would maintain quiescent state of HSCs by the inhibition of proliferation (HIPPO pathways, G0
arrest) and apoptosis (PI3K‐PDK1 and mTORC2) (see Fig. 7B). On the other hand, activated HSCs
exhibit YAP‐CTGF/NOTCH2 and RAS‐RAF‐MEK‐ERK activity, which are involved in HSC
proliferation and development (Fig. 7C). This information helps us to get one‐step closer to the
RAS dependent signaling pathways, which maintain quiescent and modulate activation of HSCs.
Functional cross‐talk between RAS and RHO pathways
One of the important features of activated HSC is their ability to contract and migrate,
which should be controlled by RHO family GTPases (chapter IV). There are growing numbers of
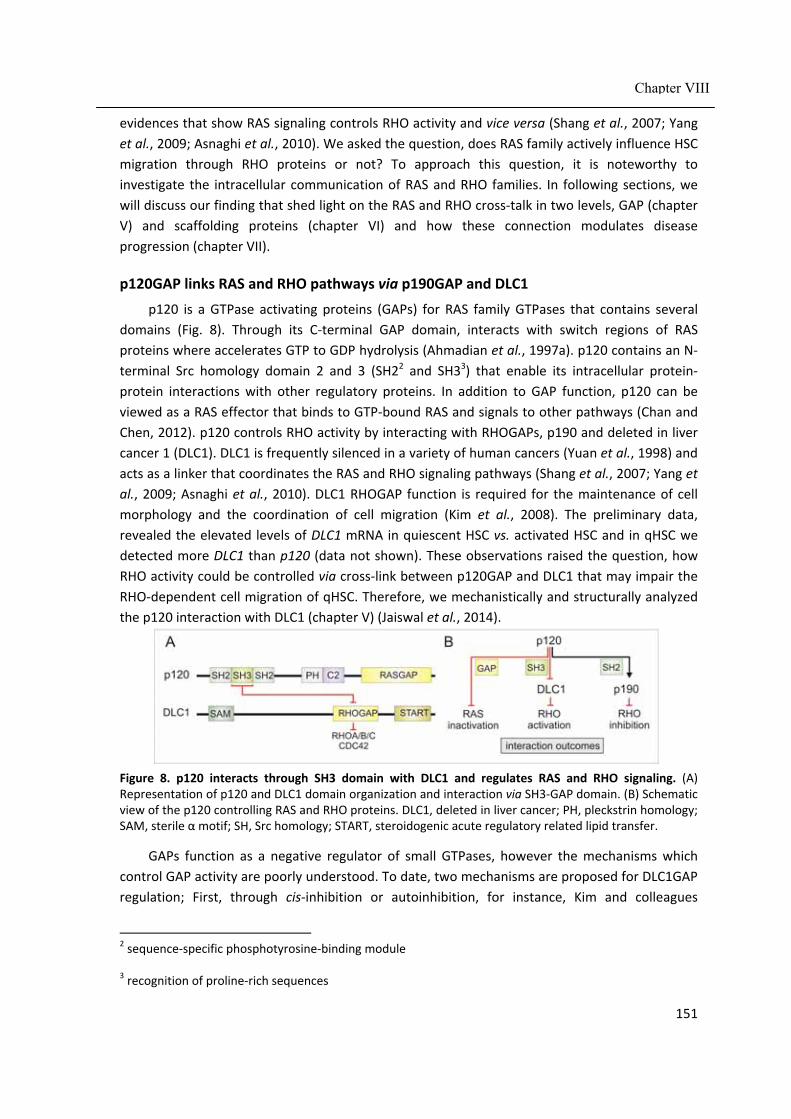
151
Chapter VIII
evidences that show RAS signaling controls RHO activity and vice versa (Shang et al., 2007; Yang
et al., 2009; Asnaghi et al., 2010). We asked the question, does RAS family actively influence HSC
migration through RHO proteins or not? To approach this question, it is noteworthy to
investigate the intracellular communication of RAS and RHO families. In following sections, we
will discuss our finding that shed light on the RAS and RHO cross‐talk in two levels, GAP (chapter
V) and scaffolding proteins (chapter VI) and how these connection modulates disease
progression (chapter VII).
p120GAP links RAS and RHO pathways via p190GAP and DLC1
p120 is a GTPase activating proteins (GAPs) for RAS family GTPases that contains several
domains (Fig. 8). Through its C‐terminal GAP domain, interacts with switch regions of RAS
proteins where accelerates GTP to GDP hydrolysis (Ahmadian et al., 1997a). p120 contains an N‐
terminal Src homology domain 2 and 3 (SH22 and SH33) that enable its intracellular protein‐
protein interactions with other regulatory proteins. In addition to GAP function, p120 can be
viewed as a RAS effector that binds to GTP‐bound RAS and signals to other pathways (Chan and
Chen, 2012). p120 controls RHO activity by interacting with RHOGAPs, p190 and deleted in liver
cancer 1 (DLC1). DLC1 is frequently silenced in a variety of human cancers (Yuan et al., 1998) and
acts as a linker that coordinates the RAS and RHO signaling pathways (Shang et al., 2007; Yang et
al., 2009; Asnaghi et al., 2010). DLC1 RHOGAP function is required for the maintenance of cell
morphology and the coordination of cell migration (Kim et al., 2008). The preliminary data,
revealed the elevated levels of DLC1 mRNA in quiescent HSC vs. activated HSC and in qHSC we
detected more DLC1 than p120 (data not shown). These observations raised the question, how
RHO activity could be controlled via cross‐link between p120GAP and DLC1 that may impair the
RHO‐dependent cell migration of qHSC. Therefore, we mechanistically and structurally analyzed
the p120 interaction with DLC1 (chapter V) (Jaiswal et al., 2014).
Figure 8. p120 interacts through SH3 domain with DLC1 and regulates RAS and RHO signaling. (A) Representation of p120 and DLC1 domain organization and interaction via SH3‐GAP domain. (B) Schematic view of the p120 controlling RAS and RHO proteins. DLC1, deleted in liver cancer; PH, pleckstrin homology; SAM, sterile α motif; SH, Src homology; START, steroidogenic acute regulatory related lipid transfer.
GAPs function as a negative regulator of small GTPases, however the mechanisms which
control GAP activity are poorly understood. To date, two mechanisms are proposed for DLC1GAP
regulation; First, through cis‐inhibition or autoinhibition, for instance, Kim and colleagues
2 sequence‐specific phosphotyrosine‐binding module
3 recognition of proline‐rich sequences

152
Chapter VIII
reported SAM domain of DLC1 acts as an autoinhibitor of this GAP (Kim et al., 2008); Second,
trans‐inhibition of DLC1 through a RASGAP protein, p120 (Yang et al., 2009).
p120 binds through SH3 domain to DLC1 and inhibits DLC1 in PxxP independent manner—
Our in silico analysis revealed that the GAP domain of DLC1 does not possess a proline‐rich
region. Therefore, unlike classical PxxP motif‐recognizing SH3 domains, the interaction mode of
the p120 SH3 domain is atypical, utilizes different amino acids to bind, and masks the catalytic
arginine finger of the GAP domain of DLC1. The Ser/Thr kinases Aurora A and Aurora B are other
examples in addition to DLC1 for negative modulation of biological processes by p120 (Gigoux et
al., 2002). The SH3 domain of p120 binds to the catalytic domain of Aurora kinases that inhibits
their kinase activity. These interactions also do not involve a proline‐rich consensus sequence.
Two accessible hydrophobic regions of p120 SH3 have been suggested to function as binding
sites for protein interaction (Yang et al., 1994).
Collectively, SH3 domain of p120 inhibits specifically DLC1GAP activity where p120 activated
p190, through its SH2 domain (Fig. 8A and B). Our qPCR analysis showed that quiescent HSC
harbors elevated levels of DLC1 that were more than p120 and p190 levels. The overexpression
of DLC isoforms has been shown to lead to inactivation of RHOA and to the reduction of actin
stress‐fiber formation (Leung et al., 2005; Kawai et al., 2007). On the other hand, RHOA controls
the contraction and migration of activated HSC (Li et al., 2012; Sohail et al., 2009). Therefore, we
speculated that a high level of DLC1 might inhibit the stress‐fiber formation in quiescent HSC,
where down‐regulation of DLC1 in activated HSC results in increased RHOA activity and HSC
contraction (Fig. 7C).
Scaffolding protein IQGAP modulates RHO and RAS signaling
Upon HSCs activation, quiescent HSCs develop into the cells that are able to contract and
migrate. As we discussed earlier, our signaling analysis revealed the high levels of RAS‐
dependent signaling activity in activated HSCs (chapter III). Besides GAP proteins, scaffold
proteins can cross‐link RAS to RHO signaling. It is shown that IQGAPs scaffold different
components of RAS‐MAPK pathways as well as RHO GTPases, such as CDC42 and RAC proteins
(Mataraza et al., 2003a; Roy et al., 2004; Roy et al., 2005; Ren et al., 2007); therefore, they may
connect RAS signaling to RHO proteins and modulate the cell‐adhesion and migration. Moreover,
it is reported that the IQGAP1 plays a role in HSC activation by binging to TGF‐β receptor II and
suppresses HSC activation (Liu et al., 2013a). These observations raised the questions; are there
any evidences that IQGAPs actively scaffolds RHO proteins in HSCs? Which IQGAP isoforms are
present in HSCs? Which regions of IQGAP determine the interaction specificity for RHO proteins?
To address these questions, first, we generated varies IQGAP1 constructs and with the aim of
biochemical studies of IQGAP1 interaction with different RHO family members, we identified the
C‐terminal region of IQGAP1863‐1657 (here after called GRD‐C) is responsible for high affinity of
IQGAP1 to interact with GTP‐loaded RAC and CDC42 proteins but not RHO subgroup. Second, we
investigated the expression pattern of IQGAP1/2/3, RAC1/2/3 and CDC42 in quiescent vs.
activated HSC.

153
Chapter VIII
GBD domain (1345‐1563) of IQGAP1 tightly binds to RAC and CDC42 in GTP‐dependent
fashion—In this study, a comprehensive interaction study of RHO GTPases and C‐terminal
domain of IQGAP1863‐1657 (here called GRD‐C) was conducted. Kinetics of GRD‐C association with
fourteen different RHO proteins was monitored using stopped‐flow fluorescence spectroscopic
methods. The results clearly indicate that IQGAP1 binds among RHO proteins selectively to RAC‐
and CDC42‐like proteins only in the active form and that GRD‐C containing IQGAP11346‐1657 most
probably recognizes and binds to the switch regions but however not, as previously proposed by
several groups (Mataraza et al., 2003b; Owen et al., 2008; Kurella et al., 2009), the GRD‐
containing IQGAP962‐1345.
Reciprocal expression of IQGAP isoforms during activation of the hepatic stellate cells—
IQGAP family composes of three isoforms, IQGAP1, 2 and 3, which are differentially expressed in
distinct tissues. In addition to share a set of binding partners, each isoforms possess its specific
binding partners and therefore contribute to different cellular processes (Weissbach et al., 1994;
Brill et al., 1996; Wang et al., 2007). For instance, IQGAP1 is recognized as an oncogene where
IQGAP2 is a tumor suppressor (White et al., 2009b; White et al., 2010b). IQGAP2 is shown to be
expressed predominantly in liver. We asked the question, is there any isoform preference for
IQGAPs during HSC activation? Our quantitative RNA analysis revealed that IQGAP1 and 3
isoforms, get upregulated during the activation process of HSC where the IQGAP2 down‐
regulated. At protein levels, we were able to detect IQGAP2 isoform only in quiescent HSC where
IQGAP1 presented in both states of HSC and became up‐regulated during HSC activation.
Consistently, Schmidt and colleagues, reported the reciprocal expression of IQGAP1 and 2 in
human hepatocellular carcinomas where IQGAP1 increased and IQGAP2 decreased (White et al.,
2010b). Domain organization of IQGAP1 and 2 are similar, and both are reported to interact with
GTP‐loaded CDC42 and RAC1 (Smith et al., 2015c). In quiescent HSC, we speculate that IQGAP2
exerts its specific functions by scaffolding the distinct signaling components in different protein
complexes than IQGAP1. Canonical Wnt signaling is very dynamic in quiescent HSC and it is
shown in other cells, IQGAP2 can interact with Dishevelled/β‐catenin, therefore in qHSC IQGAP2
may modulate Wnt‐β‐catenin signaling and stimulate GFAP synthesis and cell‐cycle arrest
(Kordes et al., 2008a; Schmidt et al., 2008). Another possibility would be, IQGAP2 competes with
other scaffolding proteins to recruits RHO proteins and may interfere with RHO dependent‐cell
migration (Fig. 7B). The functions and specific binding partners of IQGAP2 in qHSC remain to be
investigated. aHSCs display the elevated levels of PDGF signaling and focal adhesion kinase (FAK)
acts downstream of PDGF (Carloni et al., 2000). PDGF induces the IQGAP1‐dependent complex
formation of focal adhesion proteins (paxillin and vinculin) and PDGF receptor β (Kohno et al.,
2013). IQGAP1 also binds to FAK (Cheung et al., 2013), therefore, PDGF‐IQGAP1 may regulate the
focal adhesion assembly in aHSCs that is important for cell motility and migration.
Elevated levels of the RAC and CDC42 correlate with high amount of IQGAP1 in activated
HSC—We detected higher levels of RAC1, RAC2 and CDC42 in aHSCs than qHSC. On the other
hand, our biochemical studies demonstrated that RAC1 and CDC42 interact in GTP‐bound forms
with IQGAP1‐GBD. Therefore, we suggest that IQGAP1 scaffolds RAC1/2 and CDC42 to regulate
cell‐adhesion and migration in these cells. However, the role of IQGAP1 in aHSC needs to be
investigated.

154
Chapter VIII
IQGAP1 exhibits the highest affinity for RAC2 isoform—qPCR data reveals in hepatic stellate
cells, RAC2 drastically increased in activated state. In addition, the interaction of IQGAP1GRD‐C
with RAC‐ and CDC42‐like proteins revealed the fastest association with RAC2, which is 2‐9 fold
higher than others. The highest affinity of RAC2 for GRD‐C can most likely be attributed to
distinct amino acid sequence deviations. The high affinity of RAC2 for IQGAP1 cannot be
explained by comparing potential residues that may undergo direct interacting contacts in spite
of high amino acid sequence identity. Another aspect to be considered is the overall dynamics of
the G domain, which has been previously proposed to contribute to a higher affinity, in the case
of RAC2 compared to RAC1 and RAC3 (Haeusler et al., 2003). Due to the highest affinity of
IQGAP1 for RAC2 and up‐regulation of RAC2/IQGAP1 in activated HSCs, we suggest that IQGAP1
might associate RAC2 with its specific protein complex to accelerate their interaction (Fig. 7C).
Cross‐link between RAS‐MAPK and RHO pathways—In addition to scaffold the RHO signaling
components (RAC and CDC42), IQGAP1 identified to interact with different signaling components
of RAS‐MAPK pathway, RTKs, KRAS, BRAF/CRAF, MEK1/2 and ERK1/2, and directs the
information flow from the EGF to ERK1/2 phosphorylation (Roy et al., 2004; Roy et al., 2005; Ren
et al., 2007) (Fig. 7C). It is reported upon hyaluronan (HA) stimulation of CD44 receptor, IQGAP1
anchors the CDC42 and ERK2 to CD44 and F‐actin that results in phosphorylation of ERK2.
Moreover, at the level of focal adhesions, it is reported that RAS proteins mediate the Tyrosine
phosphorylation of FAK via PDGF receptor in activated HSC (Carloni et al., 2000) that most
probably this complex can form through the IQGAP1. Therefore, IQGAP1 may bridge the MAPK
pathways to cytoskeleton organization machinery in hepatic stellate cells. On the other hand,
our genetic screening of JMML patients revealed a correlation between RAC2 and NRAS double
mutants in one patient which RAC2 mutation drives the PI3K‐AKT‐mTORC pathway in parallel to
NRAS mutation (chapter VII) (see below).
The coordination of RAS (NRAS) and RHO (RAC2) mutations in tumor
progression
In pathological conditions, the aberrant activation of RAS proteins due to the somatic or
germline mutations in the critical residues of RAS proteins (G12, G13 or Q61; HRAS numbering)
or their regulators are very common in a wide spectrum of human cancers and genetic disorders
(Ratner and Miller, 2015). Juvenile myelomonocytic leukemia (JMML) is a rare and severe
myelodysplastic and myeloproliferative neoplasm of early childhood is initiated by germline or
somatic RAS‐activating mutations (Chang et al., 2014). JMML is considered a unique example of
RAS‐driven oncogenesis since it is thought to be initiated by mutations, usually described as
mutually exclusive, in RAS genes (NRAS, KRAS) or RAS‐pathway regulators (PTPN11, NF1 or CBL).
JMML can be sporadic or develop in patients displaying syndromic diseases with constitutional
RAS overactivation such as Noonan syndrome (NS), type 1‐neurofibromatosis (NF1) and CBL
syndrome, caused by heterozygous germline mutations in PTPN11, NF1 and CBL, respectively
(Niemeyer, 2014). In this study, multiple concomitant genetic hits targeting the RAS‐pathway
were identified in 13/78 cases (17%), disproving the concept of exclusive RAS mutations and
defining novel activated JMML pathways involving PI3K and the mTORC2 complex through RAC2
mutation (chapter VII) (Caye et al., 2015).

155
Chapter VIII
JMML pathways involving PI3K and the mTORC2 complex through RAC2 mutation— Multiple
concomitant genetic hits targeting the RAS pathway in JMML patients, identified mutations in
RAS genes. Two NRAS‐JMML patients had mutations in RRAS, an inducer of RAS/MAPK activation
(Flex et al., 2014) and upstream regulator of RAC in hematopoietic stem cells (Shang et al., 2011),
and another had a mutation in the RHO GTPase RAC2 V63. The coexistence of RAC and RAS/MAPK
mutations in some tumors and cooperation between oncogenic NRAS and RAC has been
previously demonstrated (Kawazu et al., 2013). Investigations into the functional and structural
properties of RAC2V63, which predominantly occurs in its active, GTP‐loaded state as compared to
wild‐type RAC2 and the constitutive variant RAC2V12, have revealed a drastic gain‐of‐function
effect. Interestingly, an analysis of signaling downstream to RAS has shown that RAC2V63
activates the PI3K‐PDK1‐AKT and the mTORC2 pathways but has no significant effect on the RAF‐
MEK‐ERK pathway. This is consistent with several lines of evidence indicating a strong impact of
the PI3K‐PDK‐AKT pathway on JMML (Emanuel, 2014), and activating the catalytic p110γ subunit
of PI3K has recently been shown to promote the effects of Shp2 on GM‐CSF hypersensitivity
(Goodwin et al., 2014).
This study sheds light on the intercommunication of RAC2‐GTP with NRAS‐GTP to induce the
mTORC2 and PI3K pathways and provides evidence for in vivo RHO and RAS cross‐talk in disease
model. On the other hand, we detected high levels of RAC2 in aHSC that may also signal towards
the PI3K‐mTORC2 and MAPK therefore promotes cell survival, proliferation, which needs further
investigations (Fig. 7C).
Concluding remarks
Collectively, with aim of this doctoral thesis, we shed light on the RAS‐dependent
intracellular signaling pathways that drive the fate decisions of HSC and maintain the quiescence
of HSC or induce HSC activation, proliferation, contraction and migration (Fig. 7). We identified
ERAS, p110α, p110, IQGAP2 and DLC1 expressed mainly in qHSCs, and MRAS, RRAS, RAP2A,
RALA, p110β, p110, YAP, CTGF, NOTCH2, IQGAP1, RAC1, RAC2 and CDC42 in aHSCs (Fig. 7A). Obtained data suggested elevated ERAS‐dependent signaling pathway activity via PI3K‐AKT‐
mTORC1, mSIN1‐mTORC2‐AKT‐FOXO1, LIF‐STAT3, and HIPPO signaling in qHSCs (Fig. 7B).
However, we detected high levels of RAS‐MAPK and YAP‐NOTCH2/CTGF in aHSCs. Moreover, our
cell‐based studies were combined with biochemical and mechanistic studies of highlighted
molecules in qHSC and aHSC that provided detailed information about the mode of regulation
and networking of these molecules. Biochemical analysis demonstrated that effector selection of
ERAS significantly differs from HRAS (chapter II). ERAS specificity and consequently cellular
outcomes depend on its unique switch and interswitch regions and W79 of ERAS appears to
determine the effector selectivity. Expressional analysis reveals a different expression pattern of
RAS and RAS‐signaling components in qHSCs vs. aHSCs. Among the RHO regulators, we observed
more DLC1RHOGAP in qHSC than aHSC, which were higher than p120RASGAP in both state. On
the other hand, our mechanistic and structural studies of DLC1RHOGAP and p120RASGAP
revealed interesting aspects of RHO regulations via a well‐known RAS regulator (chapter V). We
found p120RASGAP competitively and selectively inhibits DLC1 by targeting its catalytic arginine
finger that is mediated through p120 SH3 and DLC1 RHOGAP domain interaction (Fig. 8A).

156
Chapter VIII
Therefore, herein, we emphasize the functional inter‐relationships of GAPs that mediate a cross‐
talk between the RAS and RHO pathways. Beside GAPs, scaffolding proteins, such as IQGAPs, link
RAS to RHO signaling. We observed reciprocal expression of IQGAP isoforms and RHO proteins in
hepatic stellate cells; IQGAP1/3, RAC2 and CDC42 are upregulated during the activation process
of HSCs while IQGAP2 is down‐regulated. Amongst different RHO proteins, our kinetic and
equilibrium measurements implicated that IQGAP1 selectively interacts in a GTP‐dependent
manner with RAC and CDC42 (chapter VI). We showed that these interactions are mediated
through the C‐terminal half of IQGAP1 composing three functionally distinct units, including GRD,
GBD and C‐terminus. GBD only binds to the RAC1 and CDC42 proteins if they are active and exist
in the GTP‐bound forms, where GRD undergoes a low‐affinity, GDP‐/GTP‐independent complex
with these proteins. Consistent with our data on GAP and IQGAP proteins, which may link signal
transduction of RAS to RHO, we found a functional cross‐talk between RHO and RAS mutations in
disease progression with the aid of whole genomic sequencing of the juvenile myelomonocytic
leukemia (JMML) patients (chapter VII). Genetic profiling and whole‐exome sequencing of a large
JMML cohort, showed for the first time that concomitant mutations in JMML target a small
number of interacting networks, with a striking enrichment in components of the RAS and PRC2
networks. This study sheds light on the inter‐communication of RAC2 with NRAS to activate the
mTORC2 and PI3K pathways. Consistent with data from JMML patient, high levels of RAC2 in
aHSC may also signal towards the PI3K‐mTORC2 and MAPK, therefore, promotes cell survival,
proliferation (Fig. 7C). Collectively, with the aim of cell biological and biochemical studies, we
suggest a possible ERAS/RAS signaling networks in qHSC vs. aHSC and propose a model that links
RAS and RHO signaling in order to regulate cellular processes, such as cell migration (Fig. 7).
Therefore, this study adds additional clues to the remarkable signaling features of qHSC and how
the cellular outcome of these signaling pathways would maintain quiescent state of qHSC by the
inhibition of proliferation (HIPPO pathways, G0 arrest) and apoptosis (PI3K‐PDK1 and mTORC2)
(see Fig. 7B). Where, in aHSC the activity of YAP‐CTGF/NOTCH2, RAS‐RAF‐MEK‐ERK, RAC2, CDC42
and RHOA may contribute to the HSC proliferation, development and migration (Fig. 7C).

157
References
Abel, A. M., Schuldt, K. M., Rajasekaran, K., Hwang, D., Riese, M. J., Rao, S., Thakar, M. S. &Malarkannan, S. (2015). IQGAP1: insights into the function of a molecular puppeteer. Mol Immunol 65(2): 336‐349.
Ada‐Nguema, A. S., Xenias, H., Hofman, J. M., Wiggins, C. H., Sheetz, M. P. &Keely, P. J. (2006). The small GTPase R‐Ras regulates organization of actin and drives membrane protrusions through the activity of PLCepsilon. J Cell Sci 119(Pt 7): 1307‐1319.
Ahearn, I. M., Haigis, K., Bar‐Sagi, D. &Philips, M. R. (2011). Regulating the regulator: post‐translational modification of RAS. Nat Rev Mol Cell Biol 13(1): 39‐51.
Ahmadian, M. R., Hoffmann, U., Goody, R. S. &Wittinghofer, A. (1997a). Individual rate constants for the interaction of Ras proteins with GTPase‐activating proteins determined by fluorescence spectroscopy. Biochemistry 36(15): 4535‐4541.
Ahmadian, M. R., Stege, P., Scheffzek, K. &Wittinghofer, A. (1997b). Confirmation of the arginine‐finger hypothesis for the GAP‐stimulated GTP‐hydrolysis reaction of Ras. Nat Struct Biol 4(9): 686‐689.
Ahmadian, M. R., Wittinghofer, A. &Schmidt, G. (2002). The actin filament architecture: tightly regulated by the cells, manipulated by pathogens. International Titisee Conference on the actin cytoskeleton: from signalling to bacterial pathogenesis. EMBO Rep 3(3): 214‐218.
Alessi, D. R., James, S. R., Downes, C. P., Holmes, A. B., Gaffney, P. R., Reese, C. B. &Cohen, P. (1997). Characterization of a 3‐phosphoinositide‐dependent protein kinase which phosphorylates and activates protein kinase Balpha. Curr Biol 7(4): 261‐269.
Amin, E., Dubey, B. N., Zhang, S. C., Gremer, L., Dvorsky, R., Moll, J. M., Taha, M. S., Nagel‐Steger, L., Piekorz, R. P., Somlyo, A. V. &Ahmadian, M. R. (2013). Rho‐kinase: regulation, (dys)function, and inhibition. Biol Chem 394(11): 1399‐1410.
Andjelkovic, M., Alessi, D. R., Meier, R., Fernandez, A., Lamb, N. J., Frech, M., Cron, P., Cohen, P., Lucocq, J. M. &Hemmings, B. A. (1997). Role of translocation in the activation and function of protein kinase B. J Biol Chem 272(50): 31515‐31524.
Aoyama, M., Kataoka, H., Kubota, E., Tada, T. &Asai, K. (2010). Resistance to chemotherapeutic agents and promotion of transforming activity mediated by embryonic stem cell‐expressed Ras (ERas) signal in neuroblastoma cells. Int J Oncol 37(4): 1011‐1016.
Apolloni, A., Prior, I. A., Lindsay, M., Parton, R. G. &Hancock, J. F. (2000). H‐ras but not K‐ras traffics to the plasma membrane through the exocytic pathway. Mol Cell Biol 20(7): 2475‐2487.
Arthur, M. J., Stanley, A., Iredale, J. P., Rafferty, J. A., Hembry, R. M. &Friedman, S. L. (1992). Secretion of 72 kDa type IV collagenase/gelatinase by cultured human lipocytes. Analysis of gene expression, protein synthesis and proteinase activity. Biochem J 287 ( Pt 3): 701‐707.
Asahina, K., Zhou, B., Pu, W. T. &Tsukamoto, H. (2011). Septum transversum‐derived mesothelium gives rise to hepatic stellate cells and perivascular mesenchymal cells in developing mouse liver. Hepatology 53(3): 983‐995.
Asnaghi, L., Vass, W. C., Quadri, R., Day, P. M., Qian, X., Braverman, R., Papageorge, A. G. &Lowy, D. R. (2010). E‐cadherin negatively regulates neoplastic growth in non‐small cell lung cancer: role of Rho GTPases. Oncogene 29(19): 2760‐2771.
Avruch, J., Long, X., Lin, Y., Ortiz‐Vega, S., Rapley, J., Papageorgiou, A., Oshiro, N. &Kikkawa, U. (2009). Activation of mTORC1 in two steps: Rheb‐GTP activation of catalytic function and increased binding of substrates to raptor1. Biochem Soc Trans 37(1): 223‐226.
Avruch, J., Zhou, D., Fitamant, J. &Bardeesy, N. (2010). Mst1/2 signalling to Yap: gatekeeper for liver size and tumour development. Br J Cancer 104(1): 24‐32.
Aznar, S. &Lacal, J. C. (2001). Rho signals to cell growth and apoptosis. Cancer Lett 165(1): 1‐10. Barras, D. (2015). BRAF Mutation in Colorectal Cancer: An Update. Biomark Cancer 7(Suppl 1): 9‐12. Benyon, R. C. &Arthur, M. J. (2001). Extracellular matrix degradation and the role of hepatic stellate cells.
Semin Liver Dis 21(3): 373‐384. Berg, T., Rountree, C. B., Lee, L., Estrada, J., Sala, F. G., Choe, A., Veltmaat, J. M., De Langhe, S., Lee, R.,
Tsukamoto, H., Crooks, G. M., Bellusci, S. &Wang, K. S. (2007). Fibroblast growth factor 10 is critical for liver growth during embryogenesis and controls hepatoblast survival via beta‐catenin activation. Hepatology 46(4): 1187‐1197.

158
Bhattacharya, M., Sundaram, A., Kudo, M., Farmer, J., Ganesan, P., Khalifeh‐Soltani, A., Arjomandi, M., Atabai, K., Huang, X. &Sheppard, D. (2014). IQGAP1‐dependent scaffold suppresses RhoA and inhibits airway smooth muscle contraction. J Clin Invest 124(11): 4895‐4898.
Bishop, A. L. &Hall, A. (2000). Rho GTPases and their effector proteins. Biochem J 348 Pt 2: 241‐255. Blaner, W. S., O'Byrne, S. M., Wongsiriroj, N., Kluwe, J., D'Ambrosio, D. M., Jiang, H., Schwabe, R. F.,
Hillman, E. M. C., Piantedosi, R. &Libien, J. (2009). Hepatic stellate cell lipid droplets: A specialized lipid droplet for retinoid storage. Biochim Biophys Acta 1791(6): 467‐473.
Boccaccio, C., Ando, M., Tamagnone, L., Bardelli, A., Michieli, P., Battistini, C. &Comoglio, P. M. (1998). Induction of epithelial tubules by growth factor HGF depends on the STAT pathway. Nature 391(6664): 285‐288.
Bodemann, B. O. &White, M. A. (2014).The Coordinated Biology and Signaling Partners of Ral G‐Proteins. In Ras Superfamily Small G Proteins: Biology and Mechanisms 1, 257‐279 (Ed A. Wittinghofer). Springer Vienna.
Bolis, A., Corbetta, S., Cioce, A. &de Curtis, I. (2003). Differential distribution of Rac1 and Rac3 GTPases in the developing mouse brain: implications for a role of Rac3 in Purkinje cell differentiation. Eur J Neurosci 18(9): 2417‐2424.
Bos, J. L. (1989). ras oncogenes in human cancer: a review. Cancer Res 49(17): 4682‐4689. Bourbonnais, E., Raymond, V. A., Ethier, C., Nguyen, B. N., El‐Leil, M. S., Meloche, S. &Bilodeau, M. (2012).
Liver fibrosis protects mice from acute hepatocellular injury. Gastroenterology 142(1): 130‐139 e134.
Bourguignon, L. Y., Gilad, E., Rothman, K. &Peyrollier, K. (2005). Hyaluronan‐CD44 interaction with IQGAP1 promotes Cdc42 and ERK signaling, leading to actin binding, Elk‐1/estrogen receptor transcriptional activation, and ovarian cancer progression. J Biol Chem 280(12): 11961‐11972.
Bourne, H. R., Sanders, D. A. &McCormick, F. (1990). The GTPase superfamily: a conserved switch for diverse cell functions. Nature 348(6297): 125‐132.
Bourne, H. R., Sanders, D. A. &McCormick, F. (1991). The GTPase superfamily: conserved structure and molecular mechanism. Nature 349(6305): 117‐127.
Braet, F., Riches, J., Geerts, W., Jahn, K. A., Wisse, E. &Frederik, P. (2009). Three‐dimensional organization of fenestrae labyrinths in liver sinusoidal endothelial cells. Liver Int 29(4): 603‐613.
Brandt, D. T. &Grosse, R. (2007). Get to grips: steering local actin dynamics with IQGAPs. EMBO Rep 8(11): 1019‐1023.
Brill, S., Li, S., Lyman, C. W., Church, D. M., Wasmuth, J. J., Weissbach, L., Bernards, A. &Snijders, A. J. (1996). The Ras GTPase‐activating‐protein‐related human protein IQGAP2 harbors a potential actin binding domain and interacts with calmodulin and Rho family GTPases. Mol Cell Biol 16(9): 4869‐4878.
Brown, M. D., Bry, L., Li, Z. &Sacks, D. B. (2007). IQGAP1 regulates Salmonella invasion through interactions with actin, Rac1, and Cdc42. J Biol Chem 282(41): 30265‐30272.
Brown, M. D. &Sacks, D. B. (2006). IQGAP1 in cellular signaling: bridging the GAP. Trends Cell Biol 16(5): 242‐249.
Buday, L. &Downward, J. (2008). Many faces of Ras activation. Biochim Biophys Acta 1786(2): 178‐187. Bunney, T. &Katan, M. (2006). Phospholipase C epsilon: linking second messengers and small GTPases.
Trends Cell Biol 16(12): 640‐648. Bunney, T. D., Harris, R., Gandarillas, N. L., Josephs, M. B., Roe, S. M., Sorli, S. C., Paterson, H. F., Rodrigues‐
Lima, F., Esposito, D., Ponting, C. P., Gierschik, P., Pearl, L. H., Driscoll, P. C. &Katan, M. (2006). Structural and Mechanistic Insights into Ras Association Domains of Phospholipase C Epsilon. Mol Cell 21(4): 495‐507.
Bunney, T. D. &Katan, M. (2011). PLC regulation: emerging pictures for molecular mechanisms. Trends Biochem Sci 36(2): 88‐96.
Burt, A. D. &Day, C. P. (2003).Pathophysiology of the liver. In Pathology of the Liver, 67–105 (Ed R. MacSween). New York: Churchill Livingstone.
Buss, J. E. &Sefton, B. M. (1986). Direct identification of palmitic acid as the lipid attached to p21ras. Mol Cell Biol 6(1): 116‐122.
Camargo, F. D., Gokhale, S., Johnnidis, J. B., Fu, D., Bell, G. W., Jaenisch, R. &Brummelkamp, T. R. (2007). YAP1 Increases Organ Size and Expands Undifferentiated Progenitor Cells. Curr Biol 17(23): 2054‐2060.

159
Cantwell‐Dorris, E. R., O'Leary, J. J. &Sheils, O. M. (2011). BRAFV600E: Implications for Carcinogenesis and Molecular Therapy. Mol Cancer Ther 10(3): 385‐394.
Carloni, V., Defranco, R. M., Caligiuri, A., Gentilini, A., Sciammetta, S. C., Baldi, E., Lottini, B., Gentilini, P. &Pinzani, M. (2002). Cell adhesion regulates platelet‐derived growth factor‐induced MAP kinase and PI‐3 kinase activation in stellate cells. Hepatology 36(3): 582‐591.
Carloni, V., Pinzani, M., Giusti, S., Romanelli, R. G., Parola, M., Bellomo, G., Failli, P., Hamilton, A. D., Sebti, S. M., Laffi, G. &Gentilini, P. (2000). Tyrosine phosphorylation of focal adhesion kinase by PDGF is dependent on ras in human hepatic stellate cells. Hepatology 31(1): 131‐140.
Casteel, D. E., Turner, S., Schwappacher, R., Rangaswami, H., Su‐Yuo, J., Zhuang, S., Boss, G. R. &Pilz, R. B. (2012). Rho isoform‐specific interaction with IQGAP1 promotes breast cancer cell proliferation and migration. J Biol Chem 287(45): 38367‐38378.
Castellano, E. &Santos, E. (2011). Functional Specificity of Ras Isoforms: So Similar but So Different. Genes Cancer 2(3): 216‐231.
Castilho‐Fernandes, A., de Almeida, D. C., Fontes, A. M., Melo, F. U., Picanco‐Castro, V., Freitas, M. C., Orellana, M. D., Palma, P. V., Hackett, P. B., Friedman, S. L. &Covas, D. T. (2011). Human hepatic stellate cell line (LX‐2) exhibits characteristics of bone marrow‐derived mesenchymal stem cells. Exp Mol Pathol 91(3): 664‐672.
Castilho, R. M., Squarize, C. H., Chodosh, L. A., Williams, B. O. &Gutkind, J. S. (2009). mTOR mediates Wnt‐induced epidermal stem cell exhaustion and aging. Cell Stem Cell 5(3): 279‐289.
Caye, A., Strullu, M., Guidez, F., Cassinat, B., Gazal, S., Fenneteau, O., Lainey, E., Nouri, K., Nakhaei‐Rad, S., Dvorsky, R., Lachenaud, J., Pereira, S., Vivent, J., Verger, E., Vidaud, D., Galambrun, C., Picard, C., Petit, A., Contet, A., Poirée, M., Sirvent, N., Méchinaud, F., Adjaoud, D., Paillard, C., Nelken, B., Reguerre, Y., Bertrand, Y., Häussinger, D., Dalle, J.‐H., Ahmadian, M. R., Baruchel, A., Chomienne, C. &Cavé, H. (2015). Juvenile myelomonocytic leukemia displays mutations in components of the RAS pathway and the PRC2 network. Nat Genet.
Cerione, R. A. (2004). Cdc42: new roads to travel. Trends Cell Biol 14(3): 127‐132. Chan, P. C. &Chen, H. C. (2012). p120RasGAP‐mediated activation of c‐Src is critical for oncogenic Ras to
induce tumor invasion. Cancer Res 72(9): 2405‐2415. Chang, T. Y., Dvorak, C. C. &Loh, M. L. (2014). Bedside to bench in juvenile myelomonocytic leukemia:
insights into leukemogenesis from a rare pediatric leukemia. Blood 124(16): 2487‐2497. Cheung, K. L., Lee, J. H., Shu, L., Kim, J. H., Sacks, D. B. &Kong, A. N. (2013). The Ras GTPase‐activating‐like
protein IQGAP1 mediates Nrf2 protein activation via the mitogen‐activated protein kinase/extracellular signal‐regulated kinase (ERK) kinase (MEK)‐ERK pathway. Journal of Biological Chemistry 288(31): 22378‐22386.
Chiang, G. G. &Abraham, R. T. (2005). Phosphorylation of Mammalian Target of Rapamycin (mTOR) at Ser‐2448 Is Mediated by p70S6 Kinase. Journal of Biological Chemistry 280(27): 25485‐25490.
Chiang, J. &Martinez‐Agosto, J. A. (2012). Effects of mTOR Inhibitors on Components of the Salvador‐Warts‐Hippo Pathway. Cells 1(4): 886‐904.
Chiang, S. H., Chang, L. &Saltiel, A. R. (2006). TC10 and insulin‐stimulated glucose transport. Methods Enzymol 406: 701‐714.
Chouker, A., Martignoni, A., Dugas, M., Eisenmenger, W., Schauer, R., Kaufmann, I., Schelling, G., Lohe, F., Jauch, K. W., Peter, K. &Thiel, M. (2004). Estimation of liver size for liver transplantation: the impact of age and gender. Liver Transpl 10(5): 678‐685.
Cirstea, I. C., Gremer, L., Dvorsky, R., Zhang, S. C., Piekorz, R. P., Zenker, M. &Ahmadian, M. R. (2013). Diverging gain‐of‐function mechanisms of two novel KRAS mutations associated with Noonan and cardio‐facio‐cutaneous syndromes. Hum Mol Genet 22(2): 262‐270.
Clagett‐Dame, M. &Knutson, D. (2011). Vitamin A in Reproduction and Development. Nutrients 3(12): 385‐428.
Clark, E. A., Golub, T. R., Lander, E. S. &Hynes, R. O. (2000). Genomic analysis of metastasis reveals an essential role for RhoC. Nature 406(6795): 532‐535.
Coleman, M. L., Marshall, C. J. &Olson, M. F. (2004). RAS and RHO GTPases in G1‐phase cell‐cycle regulation. Nat Rev Mol Cell Biol 5(5): 355‐366.
Coll, M., El Taghdouini, A., Perea, L., Mannaerts, I., Vila‐Casadesus, M., Blaya, D., Rodrigo‐Torres, D., Affo, S., Morales‐Ibanez, O., Graupera, I., Lozano, J. J., Najimi, M., Sokal, E., Lambrecht, J., Gines, P., van Grunsven, L. A. &Sancho‐Bru, P. (2015). Integrative miRNA and Gene Expression Profiling Analysis of Human Quiescent Hepatic Stellate Cells. Sci Rep 5: 11549.

160
Cupit, L. D., Schmidt, V. A., Miller, F. &Bahou, W. F. (2004). Distinct PAR/IQGAP expression patterns during murine development: implications for thrombin‐associated cytoskeletal reorganization. Mamm Genome 15(8): 618‐629.
De Minicis, S., Seki, E., Uchinami, H., Kluwe, J., Zhang, Y., Brenner, D. A. &Schwabe, R. F. (2007). Gene Expression Profiles During Hepatic Stellate Cell Activation in Culture and In Vivo. Gastroenterology 132(5): 1937‐1946.
de Souza, I. C. C., Meira Martins, L. A., de Vasconcelos, M., de Oliveira, C. M., Barbé‐Tuana, F., Andrade, C. B., Pettenuzzo, L. F., Borojevic, R., Margis, R., Guaragna, R. &Guma, F. C. R. (2015). Resveratrol Regulates the Quiescence‐Like Induction of Activated Stellate Cells by Modulating the PPARγ/SIRT1 Ratio. J Cell Biochem: n/a‐n/a.
Dechene, A., Sowa, J. P., Gieseler, R. K., Jochum, C., Bechmann, L. P., El Fouly, A., Schlattjan, M., Saner, F., Baba, H. A., Paul, A., Dries, V., Odenthal, M., Gerken, G., Friedman, S. L. &Canbay, A. (2010). Acute liver failure is associated with elevated liver stiffness and hepatic stellate cell activation. Hepatology 52(3): 1008‐1016.
Delgado, J. P., Vanneaux, V., Branger, J., Touboul, T., Sentilhes, L., Mainot, S., Lainas, P., Leclerc, P., Uzan, G., Mahieu‐Caputo, D. &Weber, A. (2009). The role of HGF on invasive properties and repopulation potential of human fetal hepatic progenitor cells. Exp Cell Res 315(19): 3396‐3405.
DerMardirossian, C. &Bokoch, G. M. (2005). GDIs: central regulatory molecules in Rho GTPase activation. Trends Cell Biol 15(7): 356‐363.
DeYoung, M. P., Horak, P., Sofer, A., Sgroi, D. &Ellisen, L. W. (2008). Hypoxia regulates TSC1/2‐mTOR signaling and tumor suppression through REDD1‐mediated 14‐3‐3 shuttling. Genes Dev 22(2): 239‐251.
Di Masi, A., Leboffe, L., De Marinis, E., Pagano, F., Cicconi, L., Rochette‐Egly, C., Lo‐Coco, F., Ascenzi, P. &Nervi, C. (2015). Retinoic acid receptors: from molecular mechanisms to cancer therapy. Mol Aspects Med 41: 1‐115.
Didsbury, J., Weber, R. F., Bokoch, G. M., Evans, T. &Snyderman, R. (1989). rac, a novel ras‐related family of proteins that are botulinum toxin substrates. J Biol Chem 264(28): 16378‐16382.
Diebold, B. A., Fowler, B., Lu, J., Dinauer, M. C. &Bokoch, G. M. (2004). Antagonistic cross‐talk between Rac and Cdc42 GTPases regulates generation of reactive oxygen species. J Biol Chem 279(27): 28136‐28142.
Dillon, L. M., Bean, J. R., Yang, W., Shee, K., Symonds, L. K., Balko, J. M., McDonald, W. H., Liu, S., Gonzalez‐Angulo, A. M., Mills, G. B., Arteaga, C. L. &Miller, T. W. (2014). P‐REX1 creates a positive feedback loop to activate growth factor receptor, PI3K/AKT and MEK/ERK signaling in breast cancer. Oncogene 6(10): 328.
Dixon, L. J., Barnes, M., Tang, H., Pritchard, M. T. &Nagy, L. E. (2013). Kupffer cells in the liver. Compr Physiol 3(2): 785‐797.
Duester, G. (2008). Retinoic Acid Synthesis and Signaling during Early Organogenesis. Cell 134(6): 921‐931. Dupraz, S., Grassi, D., Bernis, M. E., Sosa, L., Bisbal, M., Gastaldi, L., Jausoro, I., Caceres, A., Pfenninger, K.
H. &Quiroga, S. (2009). The TC10‐Exo70 complex is essential for membrane expansion and axonal specification in developing neurons. J Neurosci 29(42): 13292‐13301.
Dvorsky, R. &Ahmadian, M. R. (2004). Always look on the bright site of Rho: structural implications for a conserved intermolecular interface. EMBO Rep 5(12): 1130‐1136.
Edwards, D. C., Sanders, L. C., Bokoch, G. M. &Gill, G. N. (1999). Activation of LIM‐kinase by Pak1 couples Rac/Cdc42 GTPase signalling to actin cytoskeletal dynamics. Nat Cell Biol 1(5): 253‐259.
Elliott, S. F., Allen, G. &Timson, D. J. (2012). Biochemical analysis of the interactions of IQGAP1 C‐terminal domain with CDC42. World J Biol Chem 3(3): 53‐60.
Emanuel, P. D. (2014). Hallway gossip between Ras and PI3K pathways. Blood 123(18): 2751‐2753. Etienne‐Manneville, S. &Hall, A. (2002). Rho GTPases in cell biology. Nature 420(6916): 629‐635. Fansa, E. K., Dvorsky, R., Zhang, S. C., Fiegen, D. &Ahmadian, M. R. (2013). Interaction characteristics of
Plexin‐B1 with Rho family proteins. Biochem Biophys Res Commun 434(4): 785‐790. Fasano, O., Aldrich, T., Tamanoi, F., Taparowsky, E., Furth, M. &Wigler, M. (1984). Analysis of the
transforming potential of the human H‐ras gene by random mutagenesis. Proc Natl Acad Sci U S A 81(13): 4008‐4012.
Ferro, E. &Trabalzini, L. (2010). RalGDS family members couple Ras to Ral signalling and that's not all. Cell Signal 22(12): 1804‐1810.

161
Fiegen, D., Blumenstein, L., Stege, P., Vetter, I. R. &Ahmadian, M. R. (2002). Crystal structure of Rnd3/RhoE: functional implications. FEBS Lett 525(1‐3): 100‐104.
Fiegen, D., Haeusler, L. C., Blumenstein, L., Herbrand, U., Dvorsky, R., Vetter, I. R. &Ahmadian, M. R. (2004). Alternative splicing of Rac1 generates Rac1b, a self‐activating GTPase. J Biol Chem 279(6): 4743‐4749.
Flex, E., Jaiswal, M., Pantaleoni, F., Martinelli, S., Strullu, M., Fansa, E. K., Caye, A., De Luca, A., Lepri, F., Dvorsky, R., Pannone, L., Paolacci, S., Zhang, S. C., Fodale, V., Bocchinfuso, G., Rossi, C., Burkitt‐Wright, E. M., Farrotti, A., Stellacci, E., Cecchetti, S., Ferese, R., Bottero, L., Castro, S., Fenneteau, O., Brethon, B., Sanchez, M., Roberts, A. E., Yntema, H. G., Van Der Burgt, I., Cianci, P., Bondeson, M. L., Cristina Digilio, M., Zampino, G., Kerr, B., Aoki, Y., Loh, M. L., Palleschi, A., Di Schiavi, E., Care, A., Selicorni, A., Dallapiccola, B., Cirstea, I. C., Stella, L., Zenker, M., Gelb, B. D., Cave, H., Ahmadian, M. R. &Tartaglia, M. (2014). Activating mutations in RRAS underlie a phenotype within the RASopathy spectrum and contribute to leukaemogenesis. Hum Mol Genet 23(16): 4315‐4327.
Frias, M. A., Thoreen, C. C., Jaffe, J. D., Schroder, W., Sculley, T., Carr, S. A. &Sabatini, D. M. (2006). mSin1 is necessary for Akt/PKB phosphorylation, and its isoforms define three distinct mTORC2s. Curr Biol 16(18): 1865‐1870.
Friedman, S. L. (2008). Hepatic stellate cells: protean, multifunctional, and enigmatic cells of the liver. Physiol Rev 88(1): 125‐172.
Frische, E. W. &Zwartkruis, F. J. (2010). Rap1, a mercenary among the Ras‐like GTPases. Dev Biol 340(1): 1‐9.
Fritsch, R., de Krijger, I., Fritsch, K., George, R., Reason, B., Kumar, Madhu S., Diefenbacher, M., Stamp, G. &Downward, J. (2013). RAS and RHO Families of GTPases Directly Regulate Distinct Phosphoinositide 3‐Kinase Isoforms. Cell 153(5): 1050‐1063.
Fritsch, R. &Downward, J. (2013). SnapShot: Class I PI3K Isoform Signaling. Cell 154(4): 940‐940.e941. Fujita, A., Koinuma, S., Yasuda, S., Nagai, H., Kamiguchi, H., Wada, N. &Nakamura, T. (2013). GTP hydrolysis
of TC10 promotes neurite outgrowth through exocytic fusion of Rab11‐ and L1‐containing vesicles by releasing exocyst component Exo70. PLoS ONE 8(11).
Fukata, M., Nakagawa, M. &Kaibuchi, K. (2003). Roles of Rho‐family GTPases in cell polarisation and directional migration. Curr Opin Cell Biol 15(5): 590‐597.
Fukunaga, R. &Hunter, T. (1997). MNK1, a new MAP kinase‐activated protein kinase, isolated by a novel expression screening method for identifying protein kinase substrates. EMBO J 16(8): 1921‐1933.
Garcia‐Martinez, J. M. &Alessi, D. R. (2008). mTOR complex 2 (mTORC2) controls hydrophobic motif phosphorylation and activation of serum‐ and glucocorticoid‐induced protein kinase 1 (SGK1). Biochem J 416(3): 375‐385.
Garcia‐Mata, R., Boulter, E. &Burridge, K. (2011). The 'invisible hand': regulation of RHO GTPases by RHOGDIs. Nat Rev Mol Cell Biol 12(8): 493‐504.
Gard, A. L., White, F. P. &Dutton, G. R. (1985). Extra‐neural glial fibrillary acidic protein (GFAP) immunoreactivity in perisinusoidal stellate cells of rat liver. J Neuroimmunol 8(4‐6): 359‐375.
Geffers, I., Serth, K., Chapman, G., Jaekel, R., Schuster‐Gossler, K., Cordes, R., Sparrow, D. B., Kremmer, E., Dunwoodie, S. L., Klein, T. &Gossler, A. (2007). Divergent functions and distinct localization of the Notch ligands DLL1 and DLL3 in vivo. J Cell Biol 178(3): 465‐476.
Gentilella, A., Kozma, S. C. &Thomas, G. (2015). A liaison between mTOR signaling, ribosome biogenesis and cancer. Biochim Biophys Acta 1849(7): 812‐820.
Gigoux, V., L'Hoste, S., Raynaud, F., Camonis, J. &Garbay, C. (2002). Identification of Aurora kinases as RasGAP Src homology 3 domain‐binding proteins. J Biol Chem 277(26): 23742‐23746.
Gissen, P. &Arias, I. M. (2015). Structural and functional hepatocyte polarity and liver disease. J Hepatol 63(4): 1023‐1037.
Gloerich, M. &Bos, J. L. (2011). Regulating Rap small G‐proteins in time and space. Trends Cell Biol 21(10): 615‐623.
Gloerich, M., ten Klooster, J. P., Vliem, M. J., Koorman, T., Zwartkruis, F. J., Clevers, H. &Bos, J. L. (2012). Rap2A links intestinal cell polarity to brush border formation. Nat Cell Biol 14(8): 793‐801.
Goldfinger, L. E. (2006). RLIP76 (RalBP1) is an R‐Ras effector that mediates adhesion‐dependent Rac activation and cell migration. J Cell Biol 174(6): 877‐888.
Good, M. C., Zalatan, J. G. &Lim, W. A. (2011). Scaffold proteins: hubs for controlling the flow of cellular information. Science 332(6030): 680‐686.

162
Goodwin, C. B., Li, X. J., Mali, R. S., Chan, G., Kang, M., Liu, Z., Vanhaesebroeck, B., Neel, B. G., Loh, M. L., Lannutti, B. J., Kapur, R. &Chan, R. J. (2014). PI3K p110delta uniquely promotes gain‐of‐function Shp2‐induced GM‐CSF hypersensitivity in a model of JMML. Blood 123(18): 2838‐2842.
Goodwin, J. S., Drake, K. R., Rogers, C., Wright, L., Lippincott‐Schwartz, J., Philips, M. R. &Kenworthy, A. K. (2005). Depalmitoylated Ras traffics to and from the Golgi complex via a nonvesicular pathway. J Cell Biol 170(2): 261‐272.
Gremer, L., Merbitz‐Zahradnik, T., Dvorsky, R., Cirstea, I. C., Kratz, C. P., Zenker, M., Wittinghofer, A. &Ahmadian, M. R. (2011). Germline KRAS mutations cause aberrant biochemical and physical properties leading to developmental disorders. Hum Mutat 32(1): 33‐43.
Grohmanova, K., Schlaepfer, D., Hess, D., Gutierrez, P., Beck, M. &Kroschewski, R. (2004). Phosphorylation of IQGAP1 modulates its binding to Cdc42, revealing a new type of rho‐GTPase regulator. J Biol Chem 279(47): 48495‐48504.
Gu, X., Wang, Y., Xiang, J., Chen, Z., Wang, L., Lu, L. &Qian, S. (2013). Interferon‐γ Triggers Hepatic Stellate Cell‐Mediated Immune Regulation through MEK/ERK Signaling Pathway. Clinical and Developmental Immunology 2013: 1‐6.
Gumucio, J. J. (1989). Hepatocyte heterogeneity: the coming of age from the description of a biological curiosity to a partial understanding of its physiological meaning and regulation. Hepatology 9(1): 154‐160.
Gupton, S. L. &Gertler, F. B. (2007). Filopodia: the fingers that do the walking. Sci STKE 2007(400): re5. Haeusler, L. C., Blumenstein, L., Stege, P., Dvorsky, R. &Ahmadian, M. R. (2003). Comparative functional
analysis of the Rac GTPases. FEBS letters 555(3): 556‐560. Hagemann, D., Troppmair, J. &Rapp, U. R. (1999). Cot protooncoprotein activates the dual specificity
kinases MEK‐1 and SEK‐1 and induces differentiation of PC12 cells. Oncogene 18(7): 1391‐1400. Hall, A. (2012). Rho family GTPases. Biochem Soc Trans 40(6): 1378‐1382. Han, Y. P., Yan, C., Zhou, L., Qin, L. &Tsukamoto, H. (2007). A matrix metalloproteinase‐9 activation
cascade by hepatic stellate cells in trans‐differentiation in the three‐dimensional extracellular matrix. J Biol Chem 282(17): 12928‐12939.
Hancock, J. F., Magee, A. I., Childs, J. E. &Marshall, C. J. (1989). All ras proteins are polyisoprenylated but only some are palmitoylated. Cell 57(7): 1167‐1177.
Hara, K., Maruki, Y., Long, X., Yoshino, K., Oshiro, N., Hidayat, S., Tokunaga, C., Avruch, J. &Yonezawa, K. (2002). Raptor, a binding partner of target of rapamycin (TOR), mediates TOR action. Cell 110(2): 177‐189.
Hara, K., Yonezawa, K., Kozlowski, M. T., Sugimoto, T., Andrabi, K., Weng, Q. P., Kasuga, M., Nishimoto, I. &Avruch, J. (1997). Regulation of eIF‐4E BP1 phosphorylation by mTOR. J Biol Chem 272(42): 26457‐26463.
Hart, M. J., Callow, M. G., Souza, B. &Polakis, P. (1996). IQGAP1, a calmodulin‐binding protein with a rasGAP‐related domain, is a potential effector for cdc42Hs. Embo J 15(12): 2997‐3005.
Häussinger, D., Sies, H. &Gerok, W. (1985). Functional hepatocyte heterogeneity in ammonia metabolism. The intercellular glutamine cycle. J Hepatol 1(1): 3‐14.
Hayes, T. K. &Der, C. J. (2014).Targeting the Raf‐MEK‐ERK Mitogen‐Activated Protein Kinase Cascade for the Treatment of RAS Mutant Cancers. In Ras Superfamily Small G Proteins: Biology and Mechanisms 1, 135‐156 (Ed A. Wittinghofer). Springer Vienna.
He, J., Gong, J., Ding, Q., Tan, Q., Han, P., Liu, J., Zhou, Z., Tu, W., Xia, Y., Yan, W. &Tian, D. (2015). Suppressive effect of SATB1 on hepatic stellate cell activation and liver fibrosis in rats. FEBS Letters 589(12): 1359‐1368.
Heasman, S. J. &Ridley, A. J. (2008a). Mammalian Rho GTPases: new insights into their functions from in vivo studies. Nat Rev Mol Cell Biol 9(9): 690‐701.
Heasman, S. J. &Ridley, A. J. (2008b). Mammalian Rho GTPases: new insights into their functions from in vivo studies. Nat Rev Mol Cell Biol 9(9): 690‐701.
Hedman, A. C., Smith, J. M. &Sacks, D. B. (2015). The biology of IQGAP proteins: beyond the cytoskeleton. EMBO reports 16(4): 427‐446.
Hemsath, L. &Ahmadian, M. R. (2005). Fluorescence approaches for monitoring interactions of Rho GTPases with nucleotides, regulators, and effectors. Methods 37(2): 173‐182.
Hemsath, L., Dvorsky, R., Fiegen, D., Carlier, M. F. &Ahmadian, M. R. (2005). An electrostatic steering mechanism of Cdc42 recognition by Wiskott‐Aldrich syndrome proteins. Mol Cell 20(2): 313‐324.

163
Herbrand, U. &Ahmadian, M. R. (2006). p190‐RhoGAP as an integral component of the Tiam1/Rac1‐induced downregulation of Rho. Biol Chem 387(3).
Herrmann, C. (2003). Ras‐effector interactions: after one decade. Curr Opin Struct Biol 13(1): 122‐129. Hers, I., Vincent, E. E. &Tavaré, J. M. (2011). Akt signalling in health and disease. Cell Signal 23(10): 1515‐
1527. Ho, Y. D., Joyal, J. L., Li, Z. &Sacks, D. B. (1999). IQGAP1 integrates Ca2+/calmodulin and Cdc42 signaling. J
Biol Chem 274(1): 464‐470. Holly, S. P., Larson, M. K. &Parise, L. V. (2005). The unique N‐terminus of R‐ras is required for Rac
activation and precise regulation of cell migration. Mol Biol Cell 16(5): 2458‐2469. Hota, P. K. &Buck, M. (2012). Plexin structures are coming: opportunities for multilevel investigations of
semaphorin guidance receptors, their cell signaling mechanisms, and functions. Cell Mol Life Sci 69(22): 3765‐3805.
Hsu, P. P., Kang, S. A., Rameseder, J., Zhang, Y., Ottina, K. A., Lim, D., Peterson, T. R., Choi, Y., Gray, N. S., Yaffe, M. B., Marto, J. A. &Sabatini, D. M. (2011). The mTOR‐regulated phosphoproteome reveals a mechanism of mTORC1‐mediated inhibition of growth factor signaling. Science 332(6035): 1317‐1322.
Hu, K. Q. &Settleman, J. (1997). Tandem SH2 binding sites mediate the RasGAP‐RhoGAP interaction: a conformational mechanism for SH3 domain regulation. EMBO J 16(3): 473‐483.
Huang, J. &Manning, B. D. (2008). The TSC1‐TSC2 complex: a molecular switchboard controlling cell growth. Biochem J 412(2): 179‐190.
Huang, K. &Fingar, D. C. (2014). Growing knowledge of the mTOR signaling network. Semin Cell Dev Biol 36: 79‐90.
Huang, M., Duhadaway, J. B., Prendergast, G. C. &Laury‐Kleintop, L. D. (2007). RhoB regulates PDGFR‐beta trafficking and signaling in vascular smooth muscle cells. Arterioscler Thromb Vasc Biol 27(12): 2597‐2605.
Huang, M. &Prendergast, G. C. (2006). RhoB in cancer suppression. Histol Histopathol 21(2): 213‐218. Hufner, K., Schell, B., Aepfelbacher, M. &Linder, S. (2002). The acidic regions of WASp and N‐WASP can
synergize with CDC42Hs and Rac1 to induce filopodia and lamellipodia. FEBS Lett 514(2‐3): 168‐174.
Hwang, E., Cheong, H.‐K., Mushtaq, A. U., Kim, H.‐Y., Yeo, K. J., Kim, E., Lee, W. C., Hwang, K. Y., Cheong, C. &Jeon, Y. H. (2014). Structural basis of the heterodimerization of the MST and RASSF SARAH domains in the Hippo signalling pathway. Acta Crystallogr D Biol Crystallogr 70(7): 1944‐1953.
Iadevaia, V., Huo, Y., Zhang, Z., Foster, L. J. &Proud, C. G. (2012). Roles of the mammalian target of rapamycin, mTOR, in controlling ribosome biogenesis and protein synthesis. Biochem Soc Trans 40(1): 168‐172.
Ichise, T., Yoshida, N. &Ichise, H. (2010). H‐, N‐ and Kras cooperatively regulate lymphatic vessel growth by modulating VEGFR3 expression in lymphatic endothelial cells in mice. Development 137(6): 1003‐1013.
Ikenoue, T., Inoki, K., Yang, Q., Zhou, X. &Guan, K. L. (2008). Essential function of TORC2 in PKC and Akt turn motif phosphorylation, maturation and signalling. EMBO J 27(14): 1919‐1931.
Inabe, K., Ishiai, M., Scharenberg, A. M., Freshney, N., Downward, J. &Kurosaki, T. (2002). Vav3 modulates B cell receptor responses by regulating phosphoinositide 3‐kinase activation. J Exp Med 195(2): 189‐200.
Innocenti, M., Frittoli, E., Ponzanelli, I., Falck, J. R., Brachmann, S. M., Di Fiore, P. P. &Scita, G. (2003). Phosphoinositide 3‐kinase activates Rac by entering in a complex with Eps8, Abi1, and Sos‐1. J Cell Biol 160(1): 17‐23.
Inoki, K., Li, Y., Xu, T. &Guan, K. L. (2003). Rheb GTPase is a direct target of TSC2 GAP activity and regulates mTOR signaling. Genes Dev 17(15): 1829‐1834.
Inoki, K., Li, Y., Zhu, T., Wu, J. &Guan, K. L. (2002). TSC2 is phosphorylated and inhibited by Akt and suppresses mTOR signalling. Nat Cell Biol 4(9): 648‐657.
Inoki, K., Ouyang, H., Zhu, T., Lindvall, C., Wang, Y., Zhang, X., Yang, Q., Bennett, C., Harada, Y., Stankunas, K., Wang, C. Y., He, X., MacDougald, O. A., You, M., Williams, B. O. &Guan, K. L. (2006). TSC2 integrates Wnt and energy signals via a coordinated phosphorylation by AMPK and GSK3 to regulate cell growth. Cell 126(5): 955‐968.
Inoue, M., Chang, L., Hwang, J., Chiang, S. H. &Saltiel, A. R. (2003). The exocyst complex is required for targeting of Glut4 to the plasma membrane by insulin. Nature 422(6932): 629‐633.
164
Inoue, M., Chiang, S. H., Chang, L., Chen, X. W. &Saltiel, A. R. (2006). Compartmentalization of the exocyst complex in lipid rafts controls Glut4 vesicle tethering. Mol Biol Cell 17(5): 2303‐2311.
Ismail, S. A., Chen, Y. X., Rusinova, A., Chandra, A., Bierbaum, M., Gremer, L., Triola, G., Waldmann, H., Bastiaens, P. I. &Wittinghofer, A. (2011). Arl2‐GTP and Arl3‐GTP regulate a GDI‐like transport system for farnesylated cargo. Nat Chem Biol 7(12): 942‐949.
Iwamoto, H., Nakamuta, M., Tada, S., Sugimoto, R., Enjoji, M. &Nawata, H. (2000). Platelet‐derived growth factor receptor tyrosine kinase inhibitor AG1295 attenuates rat hepatic stellate cell growth. J Lab Clin Med 135(5): 406‐412.
Izumi, G., Sakisaka, T., Baba, T., Tanaka, S., Morimoto, K. &Takai, Y. (2004). Endocytosis of E‐cadherin regulated by Rac and Cdc42 small G proteins through IQGAP1 and actin filaments. J Cell Biol 166(2): 237‐248.
Jacinto, E., Loewith, R., Schmidt, A., Lin, S., Ruegg, M. A., Hall, A. &Hall, M. N. (2004). Mammalian TOR complex 2 controls the actin cytoskeleton and is rapamycin insensitive. Nat Cell Biol 6(11): 1122‐1128.
Jaffe, A. B. &Hall, A. (2005). Rho GTPases: biochemistry and biology. Annu Rev Cell Dev Biol 21: 247‐269. Jaiswal, M., Dubey, B. N., Koessmeier, K. T., Gremer, L. &Ahmadian, M. R. (2012). Biochemical assays to
characterize Rho GTPases. Methods Mol Biol 827: 37‐58. Jaiswal, M., Dvorsky, R. &Ahmadian, M. R. (2013a). Deciphering the molecular and functional basis of Dbl
family proteins: a novel systematic approach toward classification of selective activation of the Rho family proteins. J Biol Chem 288(6): 4486‐4500.
Jaiswal, M., Dvorsky, R., Amin, E., Risse, S. L., Fansa, E. K., Zhang, S. C., Taha, M. S., Gauhar, A. R., Nakhaei‐Rad, S., Kordes, C., Koessmeier, K. T., Cirstea, I. C., Olayioye, M. A., Haussinger, D. &Ahmadian, M. R. (2014). Functional cross‐talk between ras and rho pathways: a Ras‐specific GTPase‐activating protein (p120RasGAP) competitively inhibits the RhoGAP activity of deleted in liver cancer (DLC) tumor suppressor by masking the catalytic arginine finger. J Biol Chem 289(10): 6839‐6849.
Jaiswal, M., Fansa, E. K., Dvorsky, R. &Ahmadian, M. R. (2013b). New insight into the molecular switch mechanism of human Rho family proteins: shifting a paradigm. Biol Chem 394(1): 89‐95.
Jaumot, M., Yan, J., Clyde‐Smith, J., Sluimer, J. &Hancock, J. F. (2002). The linker domain of the Ha‐Ras hypervariable region regulates interactions with exchange factors, Raf‐1 and phosphoinositide 3‐kinase. J Biol Chem 277(1): 272‐278.
Jean, S. &Kiger, A. A. (2014). Classes of phosphoinositide 3‐kinases at a glance. J Cell Sci 127(Pt 5): 923‐928. Johannessen, C. M., Boehm, J. S., Kim, S. Y., Thomas, S. R., Wardwell, L., Johnson, L. A., Emery, C. M.,
Stransky, N., Cogdill, A. P., Barretina, J., Caponigro, G., Hieronymus, H., Murray, R. R., Salehi‐Ashtiani, K., Hill, D. E., Vidal, M., Zhao, J. J., Yang, X., Alkan, O., Kim, S., Harris, J. L., Wilson, C. J., Myer, V. E., Finan, P. M., Root, D. E., Roberts, T. M., Golub, T., Flaherty, K. T., Dummer, R., Weber, B. L., Sellers, W. R., Schlegel, R., Wargo, J. A., Hahn, W. C. &Garraway, L. A. (2010). COT drives resistance to RAF inhibition through MAP kinase pathway reactivation. Nature 468(7326): 968‐972.
Johnson, L., Greenbaum, D., Cichowski, K., Mercer, K., Murphy, E., Schmitt, E., Bronson, R. T., Umanoff, H., Edelmann, W., Kucherlapati, R. &Jacks, T. (1997). K‐ras is an essential gene in the mouse with partial functional overlap with N‐ras. Genes Dev 11(19): 2468‐2481.
Johnson, M., Sharma, M. &Henderson, B. R. (2009). IQGAP1 regulation and roles in cancer. Cell Signal 21(10): 1471‐1478.
Jones, P. L., Schmidhauser, C. &Bissell, M. J. (1993). Regulation of gene expression and cell function by extracellular matrix. Crit Rev Eukaryot Gene Expr 3(2): 137‐154.
Jullien‐Flores, V., Mahe, Y., Mirey, G., Leprince, C., Meunier‐Bisceuil, B., Sorkin, A. &Camonis, J. H. (2000). RLIP76, an effector of the GTPase Ral, interacts with the AP2 complex: involvement of the Ral pathway in receptor endocytosis. J Cell Sci 113 ( Pt 16): 2837‐2844.
Jungermann, K. (1988). Metabolic zonation of liver parenchyma. Semin Liver Dis 8(4): 329‐341. Kaizaki, R., Yashiro, M., Shinto, O., Yasuda, K., Matsuzaki, T., Sawada, T. &Hirakawa, K. (2009). Expression
of ERas oncogene in gastric carcinoma. Anticancer Res 29(6): 2189‐2193. Kanno, N., LeSage, G., Glaser, S., Alvaro, D. &Alpini, G. (2000). Functional heterogeneity of the intrahepatic
biliary epithelium. Hepatology 31(3): 555‐561. Karasarides, M., Chiloeches, A., Hayward, R., Niculescu‐Duvaz, D., Scanlon, I., Friedlos, F., Ogilvie, L.,
Hedley, D., Martin, J., Marshall, C. J., Springer, C. J. &Marais, R. (2004). B‐RAF is a therapeutic target in melanoma. Oncogene 23(37): 6292‐6298.

165
Karnoub, A. E. &Weinberg, R. A. (2008). Ras oncogenes: split personalities. Nat Rev Mol Cell Biol 9(7): 517‐531.
Kashatus, D. F., Lim, K. H., Brady, D. C., Pershing, N. L., Cox, A. D. &Counter, C. M. (2011). RALA and RALBP1 regulate mitochondrial fission at mitosis. Nat Cell Biol 13(9): 1108‐1115.
Katan, M. (2005). New insights into the families of PLC enzymes: looking back and going forward. Biochem J 391(Pt 3): e7‐9.
Kawai, K., Kiyota, M., Seike, J., Deki, Y. &Yagisawa, H. (2007). START‐GAP3/DLC3 is a GAP for RhoA and Cdc42 and is localized in focal adhesions regulating cell morphology. Biochem Biophys Res Commun 364(4): 783‐789.
Kawazu, M., Ueno, T., Kontani, K., Ogita, Y., Ando, M., Fukumura, K., Yamato, A., Soda, M., Takeuchi, K., Miki, Y., Yamaguchi, H., Yasuda, T., Naoe, T., Yamashita, Y., Katada, T., Choi, Y. L. &Mano, H. (2013). Transforming mutations of RAC guanosine triphosphatases in human cancers. Proc Natl Acad Sci U S A 110(8): 3029‐3034.
Kelley, G. G., Reks, S. E. &Smrcka, A. V. (2004). Hormonal regulation of phospholipase Cepsilon through distinct and overlapping pathways involving G12 and Ras family G‐proteins. Biochem J 378(Pt 1): 129‐139.
Kennedy, M. B., Beale, H. C., Carlisle, H. J. &Washburn, L. R. (2005). Integration of biochemical signalling in spines. Nat Rev Neurosci 6(6): 423‐434.
Kholmanskikh, S. S., Koeller, H. B., Wynshaw‐Boris, A., Gomez, T., Letourneau, P. C. &Ross, M. E. (2006). Calcium‐dependent interaction of Lis1 with IQGAP1 and Cdc42 promotes neuronal motility. Nat Neurosci 9(1): 50‐57.
Khosravi‐Far, R., Campbell, S., Rossman, K. L. &Der, C. J. (1998). Increasing complexity of Ras signal transduction: involvement of Rho family proteins. Adv Cancer Res 72: 57‐107.
Kiernan, F. (1833). The anatomy and physiology of the liver Phil. Trans. R. Soc. Lond. 123: 711 – 770. Kim, J. B. &Spiegelman, B. M. (1996). ADD1/SREBP1 promotes adipocyte differentiation and gene
expression linked to fatty acid metabolism. Genes Dev 10(9): 1096‐1107. Kim, J. B., Wright, H. M., Wright, M. &Spiegelman, B. M. (1998). ADD1/SREBP1 activates PPARgamma
through the production of endogenous ligand. Proc Natl Acad Sci U S A 95(8): 4333‐4337. Kim, J. E. &Chen, J. (2004). regulation of peroxisome proliferator‐activated receptor‐gamma activity by
mammalian target of rapamycin and amino acids in adipogenesis. Diabetes 53(11): 2748‐2756. Kim, T. Y., Healy, K. D., Der, C. J., Sciaky, N., Bang, Y. J. &Juliano, R. L. (2008). Effects of structure of Rho
GTPase‐activating protein DLC‐1 on cell morphology and migration. J Biol Chem 283(47): 32762‐32770.
Kimmelman, A., Tolkacheva, T., Lorenzi, M. V., Osada, M. &Chan, A. M. (1997). Identification and characterization of R‐ras3: a novel member of the RAS gene family with a non‐ubiquitous pattern of tissue distribution. Oncogene 15(22): 2675‐2685.
Kimura, T., Yamaoka, M., Taniguchi, S., Okamoto, M., Takei, M., Ando, T., Iwamatsu, A., Watanabe, T., Kaibuchi, K., Ishizaki, T. &Niki, I. (2013). Activated Cdc42‐bound IQGAP1 determines the cellular endocytic site. Mol Cell Biol 33(24): 4834‐4843.
Kinbara, K., Goldfinger, L. E., Hansen, M., Chou, F. L. &Ginsberg, M. H. (2003). Ras GTPases: integrins' friends or foes? Nat Rev Mol Cell Biol 4(10): 767‐776.
Kobayashi, K., Kuroda, S., Fukata, M., Nakamura, T., Nagase, T., Nomura, N., Matsuura, Y., Yoshida‐Kubomura, N., Iwamatsu, A. &Kaibuchi, K. (1998). p140Sra‐1 (specifically Rac1‐associated protein) is a novel specific target for Rac1 small GTPase. J Biol Chem 273(1): 291‐295.
Kohno, T., Urao, N., Ashino, T., Sudhahar, V., Inomata, H., Yamaoka‐Tojo, M., McKinney, R. D., Fukai, T. &Ushio‐Fukai, M. (2013). IQGAP1 links PDGF receptor‐beta signal to focal adhesions involved in vascular smooth muscle cell migration: role in neointimal formation after vascular injury. Am J Physiol Cell Physiol 305(6): C591‐600.
Kok, K., Geering, B. &Vanhaesebroeck, B. (2009). Regulation of phosphoinositide 3‐kinase expression in health and disease. Trends Biochem Sci 34(3): 115‐127.
Kordes, C. &Häussinger, D. (2013a). Hepatic stem cell niches. J Clin Invest 123(5): 1874‐1880. Kordes, C. &Häussinger, D. (2013b). Hepatic stem cell niches. Journal of Clinical Investigation 123(5): 1874‐
1880. Kordes, C., Sawitza, I., Götze, S. &Häussinger, D. (2013). Hepatic Stellate Cells Support Hematopoiesis and
are Liver‐Resident Mesenchymal Stem Cells. Cell Physiol Biochem 31(2‐3): 290‐304.

166
Kordes, C., Sawitza, I., Götze, S., Herebian, D. &Häussinger, D. (2014). Hepatic stellate cells contribute to progenitor cells and liver regeneration. J Clin Invest 124(12): 5503‐5515.
Kordes, C., Sawitza, I. &Häussinger, D. (2008a). Canonical Wnt signaling maintains the quiescent stage of hepatic stellate cells. Biochem Biophys Res Commun 367(1): 116‐123.
Kordes, C., Sawitza, I. &Häussinger, D. (2008b). Canonical Wnt signaling maintains the quiescent stage of hepatic stellate cells. Biochemical and Biophysical Research Communications 367(1): 116‐123.
Kordes, C., Sawitza, I., Müller‐Marbach, A., Ale‐Agha, N., Keitel, V., Klonowski‐Stumpe, H. &Häussinger, D. (2007). CD133+ hepatic stellate cells are progenitor cells. Biochem Biophys Res Commun 352(2): 410‐417.
Koronakis, V., Hume, P. J., Humphreys, D., Liu, T., Horning, O., Jensen, O. N. &McGhie, E. J. (2011). WAVE regulatory complex activation by cooperating GTPases Arf and Rac1. Proc Natl Acad Sci U S A 108(35): 14449‐14454.
Krens, S. F., Corredor‐Adamez, M., He, S., Snaar‐Jagalska, B. E. &Spaink, H. P. (2008). ERK1 and ERK2 MAPK are key regulators of distinct gene sets in zebrafish embryogenesis. BMC Genomics 9: 196.
Kubota, E., Kataoka, H., Aoyama, M., Mizoshita, T., Mori, Y., Shimura, T., Tanaka, M., Sasaki, M., Takahashi, S., Asai, K. &Joh, T. (2010). Role of ES cell‐expressed Ras (ERas) in tumorigenicity of gastric cancer. Am J Pathol 177(2): 955‐963.
Kubota, H., Yao, H. L. &Reid, L. M. (2007). Identification and characterization of vitamin A‐storing cells in fetal liver: implications for functional importance of hepatic stellate cells in liver development and hematopoiesis. Stem Cells 25(9): 2339‐2349.
Kurella, V. B., Richard, J. M., Parke, C. L., Lecour, L. F., Jr., Bellamy, H. D. &Worthylake, D. K. (2009). Crystal structure of the GTPase‐activating protein‐related domain from IQGAP1. J Biol Chem 284(22): 14857‐14865.
Kuroda, S., Fukata, M., Nakagawa, M., Fujii, K., Nakamura, T., Ookubo, T., Izawa, I., Nagase, T., Nomura, N., Tani, H., Shoji, I., Matsuura, Y., Yonehara, S. &Kaibuchi, K. (1998). Role of IQGAP1, a target of the small GTPases Cdc42 and Rac1, in regulation of E‐cadherin‐ mediated cell‐cell adhesion. Science 281(5378): 832‐835.
Kuroda, S., Fukata, M., Nakagawa, M. &Kaibuchi, K. (1999). Cdc42, Rac1, and their effector IQGAP1 as molecular switches for cadherin‐mediated cell‐cell adhesion. Biochem Biophys Res Commun 262(1): 1‐6.
Kurokawa, K., Itoh, R. E., Yoshizaki, H., Nakamura, Y. O. &Matsuda, M. (2004). Coactivation of Rac1 and Cdc42 at lamellipodia and membrane ruffles induced by epidermal growth factor. Mol Biol Cell 15(3): 1003‐1010.
Lachman, N. &Pawlina, W. (2010).The Liver and Biliary Apparatus: Basic Structural Anatomy and Variations. In Practical Gastroenterology and Hepatology: Liver and Biliary Disease, 3‐16 (Eds N. J. Talley, K. D. Lindor and H. E. Vargas). Oxford: Wiley‐Blackwell.
Lakner, A. M. (2010). Daily genetic profiling indicates JAK/STAT signaling promotes early hepatic stellate cell transdifferentiation. World J Gastroenterol 16(40): 5047.
Lam, B. D. &Hordijk, P. L. (2013). The Rac1 hypervariable region in targeting and signaling: a tail of many stories. Small GTPases 4(2): 78‐89.
Lamers, W. H., Hilberts, A., Furt, E., Smith, J., Jonges, G. N., van Noorden, C. J., Janzen, J. W., Charles, R. &Moorman, A. F. (1989). Hepatic enzymic zonation: a reevaluation of the concept of the liver acinus. Hepatology 10(1): 72‐76.
Lapouge, K., Smith, S. J., Walker, P. A., Gamblin, S. J., Smerdon, S. J. &Rittinger, K. (2000). Structure of the TPR domain of p67phox in complex with Rac.GTP. Mol Cell 6(4): 899‐907.
Lau, K. S. &Haigis, K. M. (2009). Non‐redundancy within the RAS oncogene family: insights into mutational disparities in cancer. Mol Cells 28(4): 315‐320.
Lavoie, H. &Therrien, M. (2015). Regulation of RAF protein kinases in ERK signalling. Nat Rev Mol Cell Biol 16(5): 281‐298.
Le Clainche, C., Schlaepfer, D., Ferrari, A., Klingauf, M., Grohmanova, K., Veligodskiy, A., Didry, D., Le, D., Egile, C., Carlier, M. F. &Kroschewski, R. (2007). IQGAP1 stimulates actin assembly through the N‐WASP‐Arp2/3 pathway. J Biol Chem 282(1): 426‐435.
Leblanc, V., Tocque, B. &Delumeau, I. (1998). Ras‐GAP controls Rho‐mediated cytoskeletal reorganization through its SH3 domain. Mol Cell Biol 18(9): 5567‐5578.
Lefkowitch, J. H. (2011).Anatomy and Function. In Sherlock’s Diseases of the Liver and Biliary System, 1‐19 (Eds J. S. Dooley, A. S. F. Lok, A. K. Burroughs and E. J. Heathcote). Wiley‐Blackwell.

167
Lei, M., Lu, W., Meng, W., Parrini, M. C., Eck, M. J., Mayer, B. J. &Harrison, S. C. (2000). Structure of PAK1 in an autoinhibited conformation reveals a multistage activation switch. Cell 102(3): 387‐397.
Leicht, D. T., Balan, V., Kaplun, A., Singh‐Gupta, V., Kaplun, L., Dobson, M. &Tzivion, G. (2007). Raf kinases: function, regulation and role in human cancer. Biochim Biophys Acta 1773(8): 1196‐1212.
Lenzen, C., Cool, R. H., Prinz, H., Kuhlmann, J. &Wittinghofer, A. (1998). Kinetic analysis by fluorescence of the interaction between Ras and the catalytic domain of the guanine nucleotide exchange factor Cdc25Mm. Biochemistry 37(20): 7420‐7430.
Leon, J., Guerrero, I. &Pellicer, A. (1987). Differential expression of the ras gene family in mice. Mol Cell Biol 7(4): 1535‐1540.
Leung, T. H., Ching, Y. P., Yam, J. W., Wong, C. M., Yau, T. O., Jin, D. Y. &Ng, I. O. (2005). Deleted in liver cancer 2 (DLC2) suppresses cell transformation by means of inhibition of RhoA activity. Proc Natl Acad Sci U S A 102(42): 15207‐15212.
Li, L., Wang, J. Y., Yang, C. Q. &Jiang, W. (2012). Effect of RhoA on transforming growth factor beta1‐induced rat hepatic stellate cell migration. Liver Int 32(7): 1093‐1102.
Li, Z., McNulty, D. E., Marler, K. J., Lim, L., Hall, C., Annan, R. S. &Sacks, D. B. (2005). IQGAP1 promotes neurite outgrowth in a phosphorylation‐dependent manner. J Biol Chem 280(14): 13871‐13878.
Lim, K. B., Bu, W., Goh, W. I., Koh, E., Ong, S. H., Pawson, T., Sudhaharan, T. &Ahmed, S. (2008). The Cdc42 effector IRSp53 generates filopodia by coupling membrane protrusion with actin dynamics. J Biol Chem 283(29): 20454‐20472.
Liu, C., Billadeau, D. D., Abdelhakim, H., Leof, E., Kaibuchi, K., Bernabeu, C., Bloom, G. S., Yang, L., Boardman, L., Shah, V. H. &Kang, N. (2013a). IQGAP1 suppresses TbetaRII‐mediated myofibroblastic activation and metastatic growth in liver. J Clin Invest 123(3): 1138‐1156.
Liu, J., Guidry, J. J. &Worthylake, D. K. (2014a). Conserved sequence repeats of IQGAP1 mediate binding to Ezrin. J Proteome Res 13(2): 1156‐1166.
Liu, P., Gan, W., Inuzuka, H., Lazorchak, A. S., Gao, D., Arojo, O., Liu, D., Wan, L., Zhai, B., Yu, Y., Yuan, M., Kim, B. M., Shaik, S., Menon, S., Gygi, S. P., Lee, T. H., Asara, J. M., Manning, B. D., Blenis, J., Su, B. &Wei, W. (2013b). Sin1 phosphorylation impairs mTORC2 complex integrity and inhibits downstream Akt signalling to suppress tumorigenesis. Nat Cell Biol 15(11): 1340‐1350.
Liu, P., Guo, J., Gan, W. &Wei, W. (2014b). Dual phosphorylation of Sin1 at T86 and T398 negatively regulates mTORC2 complex integrity and activity. Protein Cell 5(3): 171‐177.
Loewith, R., Jacinto, E., Wullschleger, S., Lorberg, A., Crespo, J. L., Bonenfant, D., Oppliger, W., Jenoe, P. &Hall, M. N. (2002). Two TOR complexes, only one of which is rapamycin sensitive, have distinct roles in cell growth control. Mol Cell 10(3): 457‐468.
Lu, L., Li, Y., Kim, S. M., Bossuyt, W., Liu, P., Qiu, Q., Wang, Y., Halder, G., Finegold, M. J., Lee, J. S. &Johnson, R. L. (2010). Hippo signaling is a potent in vivo growth and tumor suppressor pathway in the mammalian liver. Proc Natl Acad Sci U S A 107(4): 1437‐1442.
Ma, L., Chen, Z., Erdjument‐Bromage, H., Tempst, P. &Pandolfi, P. P. (2005). Phosphorylation and functional inactivation of TSC2 by Erk implications for tuberous sclerosis and cancer pathogenesis. Cell 121(2): 179‐193.
Ma, X. M. &Blenis, J. (2009). Molecular mechanisms of mTOR‐mediated translational control. Nat Rev Mol Cell Biol 10(5): 307‐318.
Ma, X. M., Yoon, S. O., Richardson, C. J., Julich, K. &Blenis, J. (2008). SKAR links pre‐mRNA splicing to mTOR/S6K1‐mediated enhanced translation efficiency of spliced mRNAs. Cell 133(2): 303‐313.
Maher, J. J. (1993). Cell‐specific expression of hepatocyte growth factor in liver. Upregulation in sinusoidal endothelial cells after carbon tetrachloride. Journal of Clinical Investigation 91(5): 2244‐2252.
Malarkannan, S., Awasthi, A., Rajasekaran, K., Kumar, P., Schuldt, K. M., Bartoszek, A., Manoharan, N., Goldner, N. K., Umhoefer, C. M. &Thakar, M. S. (2012). IQGAP1: a regulator of intracellular spacetime relativity. J Immunol 188(5): 2057‐2063.
Mannaerts, I., Leite, S. B., Verhulst, S., Claerhout, S., Eysackers, N., Thoen, L. F. R., Hoorens, A., Reynaert, H., Halder, G. &van Grunsven, L. A. (2015). The Hippo pathway effector YAP controls mouse hepatic stellate cell activation. J Hepatol 63(3): 679‐688.
Markgraf, Daniel F., Klemm, Robin W., Junker, M., Hannibal‐Bach, Hans K., Ejsing, Christer S. &Rapoport, Tom A. (2014). An ER Protein Functionally Couples Neutral Lipid Metabolism on Lipid Droplets to Membrane Lipid Synthesis in the ER. Cell Rep 6(1): 44‐55.
168
Marte, B. M., Rodriguez‐Viciana, P., Wennstrom, S., Warne, P. H. &Downward, J. (1997). R‐Ras can activate the phosphoinositide 3‐kinase but not the MAP kinase arm of the Ras effector pathways. Curr Biol 7(1): 63‐70.
Mason, J. M., Morrison, D. J., Basson, M. A. &Licht, J. D. (2006). Sprouty proteins: multifaceted negative‐feedback regulators of receptor tyrosine kinase signaling. Trends Cell Biol 16(1): 45‐54.
Matallanas, D., Birtwistle, M., Romano, D., Zebisch, A., Rauch, J., von Kriegsheim, A. &Kolch, W. (2011). Raf family kinases: old dogs have learned new tricks. Genes Cancer 2(3): 232‐260.
Matallanas, D., Sanz‐Moreno, V., Arozarena, I., Calvo, F., Agudo‐Ibanez, L., Santos, E., Berciano, M. T. &Crespo, P. (2006). Distinct utilization of effectors and biological outcomes resulting from site‐specific Ras activation: Ras functions in lipid rafts and Golgi complex are dispensable for proliferation and transformation. Mol Cell Biol 26(1): 100‐116.
Mataraza, J. M., Briggs, M. W., Li, Z., Entwistle, A., Ridley, A. J. &Sacks, D. B. (2003a). IQGAP1 promotes cell motility and invasion. J Biol Chem 278(42): 41237‐41245.
Mataraza, J. M., Briggs, M. W., Li, Z., Frank, R. &Sacks, D. B. (2003b). Identification and characterization of the Cdc42‐binding site of IQGAP1. Biochem Biophys Res Commun 305(2): 315‐321.
Mateer, S. C., Wang, N. &Bloom, G. S. (2003). IQGAPs: integrators of the cytoskeleton, cell adhesion machinery, and signaling networks. Cell Motil Cytoskeleton 55(3): 147‐155.
Matsubara, K., Kishida, S., Matsuura, Y., Kitayama, H., Noda, M. &Kikuchi, A. (1999). Plasma membrane recruitment of RalGDS is critical for Ras‐dependent Ral activation. Oncogene 18(6): 1303‐1312.
Matsumoto, K., Miki, R., Nakayama, M., Tatsumi, N. &Yokouchi, Y. (2008). Wnt9a secreted from the walls of hepatic sinusoids is essential for morphogenesis, proliferation, and glycogen accumulation of chick hepatic epithelium. Dev Biol 319(2): 234‐247.
Mattila, P. K. &Lappalainen, P. (2008). Filopodia: molecular architecture and cellular functions. Nat Rev Mol Cell Biol 9(6): 446‐454.
McCallum, S. J., Wu, W. J. &Cerione, R. A. (1996). Identification of a putative effector for Cdc42Hs with high sequence similarity to the RasGAP‐related protein IQGAP1 and a Cdc42Hs binding partner with similarity to IQGAP2. J Biol Chem 271(36): 21732‐21737.
Michalopoulos, G. K. (2010). Liver Regeneration after Partial Hepatectomy: Critical Analysis of Mechanistic Dilemmas. Am J Pathol 176(1): 2‐13.
Miyajima, A., Tanaka, M. &Itoh, T. (2014). Stem/Progenitor Cells in Liver Development, Homeostasis, Regeneration, and Reprogramming. Cell Stem Cell 14(5): 561‐574.
Miyaoka, Y., Ebato, K., Kato, H., Arakawa, S., Shimizu, S. &Miyajima, A. (2012). Hypertrophy and unconventional cell division of hepatocytes underlie liver regeneration. Curr Biol 22(13): 1166‐1175.
Nagai, H., Terada, K., Watanabe, G., Ueno, Y., Aiba, N., Shibuya, T., Kawagoe, M., Kameda, T., Sato, M., Senoo, H. &Sugiyama, T. (2002). Differentiation of liver epithelial (stem‐like) cells into hepatocytes induced by coculture with hepatic stellate cells. Biochem Biophys Res Commun 293(5): 1420‐1425.
Nakamura, K., Ichise, H., Nakao, K., Hatta, T., Otani, H., Sakagami, H., Kondo, H. &Katsuki, M. (2008). Partial functional overlap of the three ras genes in mouse embryonic development. Oncogene 27(21): 2961‐2968.
Nakhaei‐Rad, S., Nakhaeizadeh, H., Kordes, C., Cirstea, I. C., Schmick, M., Dvorsky, R., Bastiaens, P. I., Haussinger, D. &Ahmadian, M. R. (2015). The function of embryonic stem cell‐expressed Ras (E‐Ras), a unique Ras family member, correlates with its additional motifs and its structural properties. J Biol Chem.
Nassar, N., Hoffman, G. R., Manor, D., Clardy, J. C. &Cerione, R. A. (1998). Structures of Cdc42 bound to the active and catalytically compromised forms of Cdc42GAP. Nat Struct Biol 5(12): 1047‐1052.
Nassar, N., Horn, G., Herrmann, C., Block, C., Janknecht, R. &Wittinghofer, A. (1996). Ras/Rap effector specificity determined by charge reversal. Nat Struct Biol 3(8): 723‐729.
Neudauer, C. L., Joberty, G., Tatsis, N. &Macara, I. G. (1998). Distinct cellular effects and interactions of the Rho‐family GTPase TC10. Curr Biol 8(21): 1151‐1160.
Niemeyer, C. M. (2014). RAS diseases in children. Haematologica 99(11): 1653‐1662. Nojima, H., Adachi, M., Matsui, T., Okawa, K. &Tsukita, S. (2008). IQGAP3 regulates cell proliferation
through the Ras/ERK signalling cascade. Nat Cell Biol 10(8): 971‐978. Nomanbhoy, T. &Cerione, R. A. (1999). Fluorescence assays of Cdc42 interactions with target/effector
proteins. Biochemistry 38(48): 15878‐15884.

169
Noritake, J., Watanabe, T., Sato, K., Wang, S. &Kaibuchi, K. (2005). IQGAP1: a key regulator of adhesion and migration. J Cell Sci 118(Pt 10): 2085‐2092.
Nouri, K., J., M. M., Milroy LG, Hain, A., Dvorsky, R., Amin, E., Lenders, M., Nagel‐Steger, L., Howe, S., Smits, S. H. J., Hengel, H., Schmitt, L., Münk, C., Brunsveld, L. &Ahmadian, M. R. (2015). Biophysical Characterization of Nucleophosmin Interactions with Human Immunodeficiency Virus Rev and Herpes Simplex Virus US11. PLoS ONE.
Oh, W. J. &Jacinto, E. (2011). mTOR complex 2 signaling and functions. Cell Cycle 10(14): 2305‐2316. Oka, T., Mazack, V. &Sudol, M. (2008). Mst2 and Lats kinases regulate apoptotic function of Yes kinase‐
associated protein (YAP). J Biol Chem 283(41): 27534‐27546. Omerovic, J., Laude, A. J. &Prior, I. A. (2007). Ras proteins: paradigms for compartmentalised and isoform‐
specific signalling. Cell Mol Life Sci 64(19‐20): 2575‐2589. Ory, S. &Gasman, S. (2011). Rho GTPases and exocytosis: what are the molecular links? Semin Cell Dev Biol
22(1): 27‐32. Owen, D., Campbell, L. J., Littlefield, K., Evetts, K. A., Li, Z., Sacks, D. B., Lowe, P. N. &Mott, H. R. (2008). The
IQGAP1‐Rac1 and IQGAP1‐Cdc42 interactions: interfaces differ between the complexes. J Biol Chem 283(3): 1692‐1704.
Pacold, M. E., Suire, S., Perisic, O., Lara‐Gonzalez, S., Davis, C. T., Walker, E. H., Hawkins, P. T., Stephens, L., Eccleston, J. F. &Williams, R. L. (2000). Crystal structure and functional analysis of Ras binding to its effector phosphoinositide 3‐kinase gamma. Cell 103(6): 931‐943.
Paganini, S., Guidetti, G. F., Catricala, S., Trionfini, P., Panelli, S., Balduini, C. &Torti, M. (2006). Identification and biochemical characterization of Rap2C, a new member of the Rap family of small GTP‐binding proteins. Biochimie 88(3‐4): 285‐295.
Pamonsinlapatham, P., Hadj‐Slimane, R., Lepelletier, Y., Allain, B., Toccafondi, M., Garbay, C. &Raynaud, F. (2009). p120‐Ras GTPase activating protein (RasGAP): a multi‐interacting protein in downstream signaling. Biochimie 91(3): 320‐328.
Pannekoek, W. J., Linnemann, J. R., Brouwer, P. M., Bos, J. L. &Rehmann, H. (2013). Rap1 and Rap2 antagonistically control endothelial barrier resistance. PLoS One 8(2): e57903.
Parks, W. C. (1999).Matrix metalloproteinases in repair. In Wound Repair and Regeneration, Vol. 7, 423–432.
Parola, M., Robino, G., Marra, F., Pinzani, M., Bellomo, G., Leonarduzzi, G., Chiarugi, P., Camandola, S., Poli, G., Waeg, G., Gentilini, P. &Dianzani, M. U. (1998). HNE interacts directly with JNK isoforms in human hepatic stellate cells. J Clin Invest 102(11): 1942‐1950.
Pathmanathan, S., Hamilton, E., Atcheson, E. &Timson, D. J. (2011). The interaction of IQGAPs with calmodulin‐like proteins. Biochem Soc Trans 39(2): 694‐699.
Pearce, L. R., Huang, X., Boudeau, J., Pawlowski, R., Wullschleger, S., Deak, M., Ibrahim, A. F., Gourlay, R., Magnuson, M. A. &Alessi, D. R. (2007). Identification of Protor as a novel Rictor‐binding component of mTOR complex‐2. Biochem J 405(3): 513‐522.
Pearce, L. R., Komander, D. &Alessi, D. R. (2010). The nuts and bolts of AGC protein kinases. Nat Rev Mol Cell Biol 11(1): 9‐22.
Pellicoro, A., Ramachandran, P., Iredale, J. P. &Fallowfield, J. A. (2014). Liver fibrosis and repair: immune regulation of wound healing in a solid organ. Nat Rev Immunol 14(3): 181‐194.
Peng, J., Wallar, B. J., Flanders, A., Swiatek, P. J. &Alberts, A. S. (2003). Disruption of the Diaphanous‐related formin Drf1 gene encoding mDia1 reveals a role for Drf3 as an effector for Cdc42. Curr Biol 13(7): 534‐545.
Pereira, A., Zhang, B., Malcolm, P. &Sundram, S. (2013). Clozapine regulation of p90RSK and c‐Fos signaling via the ErbB1‐ERK pathway is distinct from olanzapine and haloperidol in mouse cortex and striatum. Prog Neuropsychopharmacol Biol Psychiatry 40: 353‐363.
Peterson, S. N., Trabalzini, L., Brtva, T. R., Fischer, T., Altschuler, D. L., Martelli, P., Lapetina, E. G., Der, C. J. &White, G. C., 2nd (1996). Identification of a novel RalGDS‐related protein as a candidate effector for Ras and Rap1. J Biol Chem 271(47): 29903‐29908.
Peterson, T. R., Laplante, M., Thoreen, C. C., Sancak, Y., Kang, S. A., Kuehl, W. M., Gray, N. S. &Sabatini, D. M. (2009). DEPTOR is an mTOR inhibitor frequently overexpressed in multiple myeloma cells and required for their survival. Cell 137(5): 873‐886.
Pfeifer, G. P., Dammann, R. &Tommasi, S. (2010). RASSF proteins. Curr Biol 20(8): R344‐R345.

170
Pille, J. Y., Denoyelle, C., Varet, J., Bertrand, J. R., Soria, J., Opolon, P., Lu, H., Pritchard, L. L., Vannier, J. P., Malvy, C., Soria, C. &Li, H. (2005). Anti‐RhoA and anti‐RhoC siRNAs inhibit the proliferation and invasiveness of MDA‐MB‐231 breast cancer cells in vitro and in vivo. Mol Ther 11(2): 267‐274.
Pommereit, D. &Wouters, F. S. (2007). An NGF‐induced Exo70‐TC10 complex locally antagonises Cdc42‐mediated activation of N‐WASP to modulate neurite outgrowth. J Cell Sci 120(Pt 15): 2694‐2705.
Porstmann, T., Santos, C. R., Griffiths, B., Cully, M., Wu, M., Leevers, S., Griffiths, J. R., Chung, Y. L. &Schulze, A. (2008). SREBP activity is regulated by mTORC1 and contributes to Akt‐dependent cell growth. Cell Metab 8(3): 224‐236.
Potenza, N., Vecchione, C., Notte, A., De Rienzo, A., Rosica, A., Bauer, L., Affuso, A., De Felice, M., Russo, T., Poulet, R., Cifelli, G., De Vita, G., Lembo, G. &Di Lauro, R. (2005). Replacement of K‐Ras with H‐Ras supports normal embryonic development despite inducing cardiovascular pathology in adult mice. EMBO Reports 6(5): 432‐437.
Prasad, S. B., Yadav, S. S., Das, M., Modi, A., Kumari, S., Pandey, L. K., Singh, S., Pradhan, S. &Narayan, G. (2015). PI3K/AKT pathway‐mediated regulation of p27(Kip1) is associated with cell cycle arrest and apoptosis in cervical cancer. Cell Oncol (Dordr) 38(3): 215‐225.
Prieto‐Sanchez, R. M. &Bustelo, X. R. (2003). Structural basis for the signaling specificity of RhoG and Rac1 GTPases. J Biol Chem 278(39): 37916‐37925.
Pritchard, C. A., Bolin, L., Slattery, R., Murray, R. &McMahon, M. (1996). Post‐natal lethality and neurological and gastrointestinal defects in mice with targeted disruption of the A‐Raf protein kinase gene. Curr Biol 6(5): 614‐617.
Pylayeva‐Gupta, Y., Grabocka, E. &Bar‐Sagi, D. (2011). RAS oncogenes: weaving a tumorigenic web. Nat Rev Cancer 11(11): 761‐774.
Quilliam, L. A., Rebhun, J. F. &Castro, A. F. (2002). A growing family of guanine nucleotide exchange factors is responsible for activation of Ras‐family GTPases. Prog Nucleic Acid Res Mol Biol 71: 391‐444.
Ramadori, G., Neubauer, K., Odenthal, M., Nakamura, T., Knittel, T., Schwogler, S. &Meyer zum Buschenfelde, K. H. (1992). The gene of hepatocyte growth factor is expressed in fat‐storing cells of rat liver and is downregulated during cell growth and by transforming growth factor‐beta. Biochem Biophys Res Commun 183(2): 739‐742.
Ramos, A. &Camargo, F. D. (2012a). The Hippo signaling pathway and stem cell biology. Trends Cell Biol 22(7): 339‐346.
Ramos, A. &Camargo, F. D. (2012b). The Hippo signaling pathway and stem cell biology. Trends in Cell Biology 22(7): 339‐346.
Rappaport, A. M., Borowy, Z. J., Lougheed, W. M. &Lotto, W. N. (1954). Subdivision of hexagonal liver lobules into a structural and functional unit; role in hepatic physiology and pathology. Anat Rec 119(1): 11‐33.
Ratner, N. &Miller, S. J. (2015). A RASopathy gene commonly mutated in cancer: the neurofibromatosis type 1 tumour suppressor. Nature Reviews Cancer 15(5): 290‐301.
Rawat, S. J. &Chernoff, J. (2015). Regulation of mammalian Ste20 (Mst) kinases. Trends Biochem Sci 40(3): 149‐156.
Reid, T., Furuyashiki, T., Ishizaki, T., Watanabe, G., Watanabe, N., Fujisawa, K., Morii, N., Madaule, P. &Narumiya, S. (1996). Rhotekin, a new putative target for Rho bearing homology to a serine/threonine kinase, PKN, and rhophilin in the rho‐binding domain. J Biol Chem 271(23): 13556‐13560.
Reid, T. S., Terry, K. L., Casey, P. J. &Beese, L. S. (2004). Crystallographic analysis of CaaX prenyltransferases complexed with substrates defines rules of protein substrate selectivity. J Mol Biol 343(2): 417‐433.
Reimann, T., Hempel, U., Krautwald, S., Axmann, A., Scheibe, R., Seidel, D. &Wenzel, K. W. (1997). Transforming growth factor‐beta1 induces activation of Ras, Raf‐1, MEK and MAPK in rat hepatic stellate cells. FEBS Lett 403(1): 57‐60.
Ren, J. G., Li, Z. &Sacks, D. B. (2007). IQGAP1 modulates activation of B‐Raf. Proc Natl Acad Sci U S A 104(25): 10465‐10469.
Resh, M. D. (1999). Fatty acylation of proteins: new insights into membrane targeting of myristoylated and palmitoylated proteins. Biochim Biophys Acta 1451(1): 1‐16.
Rey, I., Taylor‐Harris, P., van Erp, H. &Hall, A. (1994). R‐ras interacts with rasGAP, neurofibromin and c‐raf but does not regulate cell growth or differentiation. Oncogene 9(3): 685‐692.

171
Rittinger, K., Walker, P. A., Eccleston, J. F., Nurmahomed, K., Owen, D., Laue, E., Gamblin, S. J. &Smerdon, S. J. (1997). Crystal structure of a small G protein in complex with the GTPase‐activating protein rhoGAP. Nature 388(6643): 693‐697.
Rocks, O., Peyker, A., Kahms, M., Verveer, P. J., Koerner, C., Lumbierres, M., Kuhlmann, J., Waldmann, H., Wittinghofer, A. &Bastiaens, P. I. (2005). An acylation cycle regulates localization and activity of palmitoylated Ras isoforms. Science 307(5716): 1746‐1752.
Rodriguez‐Viciana, P., Oses‐Prieto, J., Burlingame, A., Fried, M. &McCormick, F. (2006). A phosphatase holoenzyme comprised of Shoc2/Sur8 and the catalytic subunit of PP1 functions as an M‐Ras effector to modulate Raf activity. Mol Cell 22(2): 217‐230.
Rodriguez‐Viciana, P., Sabatier, C. &McCormick, F. (2004). Signaling specificity by Ras family GTPases is determined by the full spectrum of effectors they regulate. Mol Cell Biol 24(11): 4943‐4954.
Rojas, A. M. &Valencia, A. (2014).Evolution of the Ras Superfamily of GTPases. In Ras Superfamily Small G Proteins: Biology and Mechanisms 1, 3‐23 (Ed A. Wittinghofer). Springer Vienna.
Romano, D., Nguyen, L. K., Matallanas, D., Halasz, M., Doherty, C., Kholodenko, B. N. &Kolch, W. (2014). Protein interaction switches coordinate Raf‐1 and MST2/Hippo signalling. Nat Cell Biol 16(7): 673‐684.
Roskams, T. (2008). Relationships among stellate cell activation, progenitor cells, and hepatic regeneration. Clin Liver Dis 12(4): 853‐860, ix.
Rossman, K. L., Der, C. J. &Sondek, J. (2005). GEF means go: turning on RHO GTPases with guanine nucleotide‐exchange factors. Nat Rev Mol Cell Biol 6(2): 167‐180.
Roy, M., Li, Z. &Sacks, D. B. (2004). IQGAP1 binds ERK2 and modulates its activity. J Biol Chem 279(17): 17329‐17337.
Roy, M., Li, Z. &Sacks, D. B. (2005). IQGAP1 is a scaffold for mitogen‐activated protein kinase signaling. Mol Cell Biol 25(18): 7940‐7952.
Saile, B., Matthes, N., El Armouche, H., Neubauer, K. &Ramadori, G. (2001). The bcl, NFkappaB and p53/p21WAF1 systems are involved in spontaneous apoptosis and in the anti‐apoptotic effect of TGF‐beta or TNF‐alpha on activated hepatic stellate cells. Eur J Cell Biol 80(8): 554‐561.
Sakurai‐Yageta, M., Recchi, C., Le Dez, G., Sibarita, J. B., Daviet, L., Camonis, J., D'Souza‐Schorey, C. &Chavrier, P. (2008). The interaction of IQGAP1 with the exocyst complex is required for tumor cell invasion downstream of Cdc42 and RhoA. J Cell Biol 181(6): 985‐998.
Sancak, Y., Peterson, T. R., Shaul, Y. D., Lindquist, R. A., Thoreen, C. C., Bar‐Peled, L. &Sabatini, D. M. (2008). The Rag GTPases bind raptor and mediate amino acid signaling to mTORC1. Science 320(5882): 1496‐1501.
Sancak, Y., Thoreen, C. C., Peterson, T. R., Lindquist, R. A., Kang, S. A., Spooner, E., Carr, S. A. &Sabatini, D. M. (2007). PRAS40 is an insulin‐regulated inhibitor of the mTORC1 protein kinase. Mol Cell 25(6): 903‐915.
Sandri, C., Caccavari, F., Valdembri, D., Camillo, C., Veltel, S., Santambrogio, M., Lanzetti, L., Bussolino, F., Ivaska, J. &Serini, G. (2012). The R‐Ras/RIN2/Rab5 complex controls endothelial cell adhesion and morphogenesis via active integrin endocytosis and Rac signaling. Cell Res 22(10): 1479‐1501.
Saraste, M., Sibbald, P. R. &Wittinghofer, A. (1990). The P‐loop‐‐a common motif in ATP‐ and GTP‐binding proteins. Trends Biochem Sci 15(11): 430‐434.
Sarbassov, D. D. (2005). Phosphorylation and Regulation of Akt/PKB by the Rictor‐mTOR Complex. Science 307(5712): 1098‐1101.
Sarbassov, D. D., Ali, S. M., Kim, D. H., Guertin, D. A., Latek, R. R., Erdjument‐Bromage, H., Tempst, P. &Sabatini, D. M. (2004). Rictor, a novel binding partner of mTOR, defines a rapamycin‐insensitive and raptor‐independent pathway that regulates the cytoskeleton. Curr Biol 14(14): 1296‐1302.
Sauvant, P., Cansell, M. &Atgié, C. (2011). Vitamin A and lipid metabolism: relationship between hepatic stellate cells (HSCs) and adipocytes. J Physiol Biochem 67(3): 487‐496.
Sawitza, I., Kordes, C., Gotze, S., Herebian, D. &Haussinger, D. (2015). Bile acids induce hepatic differentiation of mesenchymal stem cells. Sci Rep 5: 13320.
Sawitza, I., Kordes, C., Reister, S. &Haussinger, D. (2009). The niche of stellate cells within rat liver. Hepatology 50(5): 1617‐1624.
Schaefer, B., Rivas‐Estilla, A. M., Meraz‐Cruz, N., Reyes‐Romero, M. A., Hernández‐Nazara, Z. H., Domínguez‐Rosales, J.‐A., Schuppan, D., Greenwel, P. &Rojkind, M. (2003). Reciprocal Modulation of Matrix Metalloproteinase‐13 and Type I Collagen Genes in Rat Hepatic Stellate Cells. Am J Pathol 162(6): 1771‐1780.

172
Scheel, H. &Hofmann, K. (2003). A novel interaction motif, SARAH, connects three classes of tumor suppressor. Curr Biol 13(23): R899‐900.
Scheffzek, K., Ahmadian, M. R., Kabsch, W., Wiesmuller, L., Lautwein, A., Schmitz, F. &Wittinghofer, A. (1997). The Ras‐RasGAP complex: structural basis for GTPase activation and its loss in oncogenic Ras mutants. Science 277(5324): 333‐338.
Schirmacher, P., Geerts, A., Pietrangelo, A., Dienes, H. P. &Rogler, C. E. (1992). Hepatocyte growth factor/hepatopoietin A is expressed in fat‐storing cells from rat liver but not myofibroblast‐like cells derived from fat‐storing cells. Hepatology 15(1): 5‐11.
Schmick, M., Vartak, N., Papke, B., Kovacevic, M., Truxius, Dina C., Rossmannek, L. &Bastiaens, Philippe I. H. (2014). KRas Localizes to the Plasma Membrane by Spatial Cycles of Solubilization, Trapping and Vesicular Transport. Cell 157(2): 459‐471.
Schmidt, G., Lenzen, C., Simon, I., Deuter, R., Cool, R. H., Goody, R. S. &Wittinghofer, A. (1996). Biochemical and biological consequences of changing the specificity of p21ras from guanosine to xanthosine nucleotides. Oncogene 12(1): 87‐96.
Schmidt, V. A., Chiariello, C. S., Capilla, E., Miller, F. &Bahou, W. F. (2008). Development of hepatocellular carcinoma in Iqgap2‐deficient mice is IQGAP1 dependent. Mol Cell Biol 28(5): 1489‐1502.
Schmidt, V. A., Scudder, L., Devoe, C. E., Bernards, A., Cupit, L. D. &Bahou, W. F. (2003). IQGAP2 functions as a GTP‐dependent effector protein in thrombin‐induced platelet cytoskeletal reorganization. Blood 101(8): 3021‐3028.
Schroder, W. A., Buck, M., Cloonan, N., Hancock, J. F., Suhrbier, A., Sculley, T. &Bushell, G. (2007). Human Sin1 contains Ras‐binding and pleckstrin homology domains and suppresses Ras signalling. Cell Signal 19(6): 1279‐1289.
Scott, J. D. &Pawson, T. (2009). Cell signaling in space and time: where proteins come together and when they're apart. Science 326(5957): 1220‐1224.
Seabra, M. C., Reiss, Y., Casey, P. J., Brown, M. S. &Goldstein, J. L. (1991). Protein farnesyltransferase and geranylgeranyltransferase share a common alpha subunit. Cell 65(3): 429‐434.
Shang, X., Cancelas, J. A., Li, L., Guo, F., Liu, W., Johnson, J. F., Ficker, A., Daria, D., Geiger, H., Ratner, N. &Zheng, Y. (2011). R‐Ras and Rac GTPase cross‐talk regulates hematopoietic progenitor cell migration, homing, and mobilization. J Biol Chem 286(27): 24068‐24078.
Shang, X., Moon, S. Y. &Zheng, Y. (2007). p200 RhoGAP promotes cell proliferation by mediating cross‐talk between Ras and Rho signaling pathways. J Biol Chem 282(12): 8801‐8811.
Shao, H. &Andres, D. A. (2000). A novel RalGEF‐like protein, RGL3, as a candidate effector for rit and Ras. J Biol Chem 275(35): 26914‐26924.
Shih, T. Y., Weeks, M. O., Young, H. A. &Scholnick, E. M. (1979). Identification of a sarcoma virus‐coded phosphoprotein in nonproducer cells transformed by Kirsten or Harvey murine sarcoma virus. Virology 96(1): 64‐79.
Shin, S., Buel, G. R., Wolgamott, L., Plas, D. R., Asara, J. M., Blenis, J. &Yoon, S. O. (2015). ERK2 Mediates Metabolic Stress Response to Regulate Cell Fate. Mol Cell 59(3): 382‐398.
Shin, S., Dimitri, C. A., Yoon, S. O., Dowdle, W. &Blenis, J. (2010). ERK2 but not ERK1 induces epithelial‐to‐mesenchymal transformation via DEF motif‐dependent signaling events. Mol Cell 38(1): 114‐127.
Shirsat, N. V., Pignolo, R. J., Kreider, B. L. &Rovera, G. (1990). A member of the ras gene superfamily is expressed specifically in T, B and myeloid hemopoietic cells. Oncogene 5(5): 769‐772.
Sinha, S. &Yang, W. (2008). Cellular signaling for activation of Rho GTPase Cdc42. Cell Signal 20(11): 1927‐1934.
Smedsrod, B., Pertoft, H., Gustafson, S. &Laurent, T. C. (1990). Scavenger functions of the liver endothelial cell. Biochem J 266(2): 313‐327.
Smith, J. M., Hedman, A. C. &Sacks, D. B. (2015a). IQGAPs choreograph cellular signaling from the membrane to the nucleus. Trends Cell Biol.
Smith, J. M., Hedman, A. C. &Sacks, D. B. (2015b). IQGAPs choreograph cellular signaling from the membrane to the nucleus. Trends Cell Biol 25(3): 171‐184.
Smith, J. M., Hedman, A. C. &Sacks, D. B. (2015c). IQGAPs choreograph cellular signaling from the membrane to the nucleus. Trends Cell Biol 25(3): 171‐184.
Sohail, M. A., Hashmi, A. Z., Hakim, W., Watanabe, A., Zipprich, A., Groszmann, R. J., Dranoff, J. A., Torok, N. J. &Mehal, W. Z. (2009). Adenosine induces loss of actin stress fibers and inhibits contraction in hepatic stellate cells via Rho inhibition. Hepatology 49(1): 185‐194.

173
Soliman, E. M., Rodrigues, M. A., Gomes, D. A., Sheung, N., Yu, J., Amaya, M. J., Nathanson, M. H. &Dranoff, J. A. (2009). Intracellular calcium signals regulate growth of hepatic stellate cells via specific effects on cell cycle progression. Cell Calcium 45(3): 284‐292.
Sorkin, A. &von Zastrow, M. (2009). Endocytosis and signalling: intertwining molecular networks. Nat Rev Mol Cell Biol 10(9): 609‐622.
Spaargaren, M. &Bischoff, J. R. (1994). Identification of the guanine nucleotide dissociation stimulator for Ral as a putative effector molecule of R‐ras, H‐ras, K‐ras, and Rap. Proc Natl Acad Sci U S A 91(26): 12609‐12613.
Sternlicht, M. D. &Werb, Z. (2001). How matrix metalloproteinases regulate cell behavior. Annu Rev Cell Dev Biol 17: 463‐516.
Stieglitz, B., Bee, C., Schwarz, D., Yildiz, O., Moshnikova, A., Khokhlatchev, A. &Herrmann, C. (2008). Novel type of Ras effector interaction established between tumour suppressor NORE1A and Ras switch II. EMBO J 27(14): 1995‐2005.
Stuhlmann‐Laeisz, C., Lang, S., Chalaris, A., Krzysztof, P., Enge, S., Eichler, J., Klingmuller, U., Samuel, M., Ernst, M., Rose‐John, S. &Scheller, J. (2006). Forced dimerization of gp130 leads to constitutive STAT3 activation, cytokine‐independent growth, and blockade of differentiation of embryonic stem cells. Mol Biol Cell 17(7): 2986‐2995.
Su, B. &Jacinto, E. (2011). Mammalian TOR signaling to the AGC kinases. Crit Rev Biochem Mol Biol 46(6): 527‐547.
Suyama, M., Nagase, T. &Ohara, O. (1999). HUGE: a database for human large proteins identified by Kazusa cDNA sequencing project. Nucleic Acids Res 27(1): 338‐339.
Takahashi, K., Mitsui, K. &Yamanaka, S. (2003). Role of ERas in promoting tumour‐like properties in mouse embryonic stem cells. Nature 423(6939): 541‐545.
Takahashi, K., Nakagawa, M., Young, S. G. &Yamanaka, S. (2005). Differential Membrane Localization of ERas and Rheb, Two Ras‐related Proteins Involved in the Phosphatidylinositol 3‐Kinase/mTOR Pathway. J Biol Chem 280(38): 32768‐32774.
Takenawa, T. &Suetsugu, S. (2007). The WASP‐WAVE protein network: connecting the membrane to the cytoskeleton. Nat Rev Mol Cell Biol 8(1): 37‐48.
Tanaka, Y., Ikeda, T., Kishi, Y., Masuda, S., Shibata, H., Takeuchi, K., Komura, M., Iwanaka, T., Muramatsu, S., Kondo, Y., Takahashi, K., Yamanaka, S. &Hanazono, Y. (2009). ERas is expressed in primate embryonic stem cells but not related to tumorigenesis. Cell Transplant 18(4): 381‐389.
Taub, R. (2004). Liver regeneration: from myth to mechanism. Nat Rev Mol Cell Biol 5(10): 836‐847. Tazat, K., Harsat, M., Goldshmid‐Shagal, A., Ehrlich, M. &Henis, Y. I. (2013). Dual effects of Ral‐activated
pathways on p27 localization and TGF‐beta signaling. Mol Biol Cell 24(11): 1812‐1824. Tcherkezian, J. &Lamarche‐Vane, N. (2007). Current knowledge of the large RhoGAP family of proteins.
Biology of the Cell 99(2): 67‐86. Tee, A. R., Manning, B. D., Roux, P. P., Cantley, L. C. &Blenis, J. (2003). Tuberous sclerosis complex gene
products, Tuberin and Hamartin, control mTOR signaling by acting as a GTPase‐activating protein complex toward Rheb. Curr Biol 13(15): 1259‐1268.
Thumkeo, D., Watanabe, S. &Narumiya, S. (2013). Physiological roles of Rho and Rho effectors in mammals. Eur J Cell Biol 92(10‐11): 303‐315.
Tidyman, W. E. &Rauen, K. A. (2009). The RASopathies: developmental syndromes of Ras/MAPK pathway dysregulation. Curr Opin Genet Dev 19(3): 230‐236.
Tnimov, Z., Guo, Z., Gambin, Y., Nguyen, U. T., Wu, Y. W., Abankwa, D., Stigter, A., Collins, B. M., Waldmann, H., Goody, R. S. &Alexandrov, K. (2012). Quantitative analysis of prenylated RhoA interaction with its chaperone, RhoGDI. J Biol Chem 287(32): 26549‐26562.
Tomiya, T., Nishikawa, T., Inoue, Y., Ohtomo, N., Ikeda, H., Tejima, K., Watanabe, N., Tanoue, Y., Omata, M. &Fujiwara, K. (2007). Leucine stimulates HGF production by hepatic stellate cells through mTOR pathway. Biochem Biophys Res Commun 358(1): 176‐180.
Torti, M. &Lapetina, E. G. (1994). Structure and function of rap proteins in human platelets. Thromb Haemost 71(5): 533‐543.
Tzivion, G., Dobson, M. &Ramakrishnan, G. (2011). FoxO transcription factors; Regulation by AKT and 14‐3‐3 proteins. Biochim Biophys Acta 1813(11): 1938‐1945.
Um, S. H., Frigerio, F., Watanabe, M., Picard, F., Joaquin, M., Sticker, M., Fumagalli, S., Allegrini, P. R., Kozma, S. C., Auwerx, J. &Thomas, G. (2004). Absence of S6K1 protects against age‐ and diet‐induced obesity while enhancing insulin sensitivity. Nature 431(7005): 200‐205.

174
Vadas, O., Burke, J. E., Zhang, X., Berndt, A. &Williams, R. L. (2011). Structural basis for activation and inhibition of class I phosphoinositide 3‐kinases. Sci Signal 4(195): re2.
van der Weyden, L. &Adams, D. J. (2007). The Ras‐association domain family (RASSF) members and their role in human tumourigenesis. Biochim Biophys Acta 1776(1): 58‐85.
Vanhaesebroeck, B., Ali, K., Bilancio, A., Geering, B. &Foukas, L. C. (2005). Signalling by PI3K isoforms: insights from gene‐targeted mice. Trends Biochem Sci 30(4): 194‐204.
Vanhaesebroeck, B., Leevers, S. J., Ahmadi, K., Timms, J., Katso, R., Driscoll, P. C., Woscholski, R., Parker, P. J. &Waterfield, M. D. (2001). Synthesis and function of 3‐phosphorylated inositol lipids. Annu Rev Biochem 70: 535‐602.
Vanhaesebroeck, B., Vogt, P. K. &Rommel, C. (2010). PI3K: from the bench to the clinic and back. Curr Top Microbiol Immunol 347: 1‐19.
Vavvas, D., Li, X., Avruch, J. &Zhang, X. F. (1998). Identification of Nore1 as a Potential Ras Effector. J Biol Chem 273(10): 5439‐5442.
Vega, F. M. &Ridley, A. J. (2008). Rho GTPases in cancer cell biology. FEBS Lett 582(14): 2093‐2101. Vega, F. M., Thomas, M., Reymond, N. &Ridley, A. J. (2015). The Rho GTPase RhoB regulates cadherin
expression and epithelial cell‐cell interaction. Cell Commun Signal 13(1). Vetter, I. R. (2001). The Guanine Nucleotide‐Binding Switch in Three Dimensions. Science 294(5545): 1299‐
1304. Visse, R. (2003). Matrix Metalloproteinases and Tissue Inhibitors of Metalloproteinases: Structure,
Function, and Biochemistry. Circ Res 92(8): 827‐839. Vyas, S. K., Leyland, H., Gentry, J. &Arthur, M. J. (1995). Rat hepatic lipocytes synthesize and secrete
transin (stromelysin) in early primary culture. Gastroenterology 109(3): 889‐898. Wake, K. (1971). "Sternzellen" in the liver: perisinusoidal cells with special reference to storage of vitamin
A. Am J Anat 132(4): 429‐462. Wang, D. R., Sato, M., Sato, T., Kojima, N., Higashi, N. &Senoo, H. (2004). Regulation of matrix metallo‐
proteinase expression by extracellular matrix components in cultured hepatic stellate cells. Comp Hepatol 3 Suppl 1: S20.
Wang, R. C., Wei, Y., An, Z., Zou, Z., Xiao, G., Bhagat, G., White, M., Reichelt, J. &Levine, B. (2012). Akt‐mediated regulation of autophagy and tumorigenesis through Beclin 1 phosphorylation. Science 338(6109): 956‐959.
Wang, S., Watanabe, T., Noritake, J., Fukata, M., Yoshimura, T., Itoh, N., Harada, T., Nakagawa, M., Matsuura, Y., Arimura, N. &Kaibuchi, K. (2007). IQGAP3, a novel effector of Rac1 and Cdc42, regulates neurite outgrowth. J Cell Sci 120(Pt 4): 567‐577.
Wang, X., DeFrances, M. C., Dai, Y., Pediaditakis, P., Johnson, C., Bell, A., Michalopoulos, G. K. &Zarnegar, R. (2002). A mechanism of cell survival: sequestration of Fas by the HGF receptor Met. Mol Cell 9(2): 411‐421.
Wang, X., Li, W., Williams, M., Terada, N., Alessi, D. R. &Proud, C. G. (2001). Regulation of elongation factor 2 kinase by p90(RSK1) and p70 S6 kinase. EMBO J 20(16): 4370‐4379.
Wang, Y., Zhou, Y. &Graves, D. T. (2014). FOXO transcription factors: their clinical significance and regulation. Biomed Res Int 2014: 925350.
Watanabe‐Takano, H., Takano, K., Keduka, E. &Endo, T. (2010). M‐Ras is activated by bone morphogenetic protein‐2 and participates in osteoblastic determination, differentiation, and transdifferentiation. Exp Cell Res 316(3): 477‐490.
Watanabe, T., Wang, S. &Kaibuchi, K. (2015). IQGAPs as Key Regulators of Actin‐cytoskeleton Dynamics. Cell Struct Funct 40(2): 69‐77.
Watanabe, T., Wang, S., Noritake, J., Sato, K., Fukata, M., Takefuji, M., Nakagawa, M., Izumi, N., Akiyama, T. &Kaibuchi, K. (2004). Interaction with IQGAP1 links APC to Rac1, Cdc42, and actin filaments during cell polarization and migration. Dev Cell 7(6): 871‐883.
Weissbach, L., Settleman, J., Kalady, M. F., Snijders, A. J., Murthy, A. E., Yan, Y. X. &Bernards, A. (1994). Identification of a human rasGAP‐related protein containing calmodulin‐binding motifs. J Biol Chem 269(32): 20517‐20521.
Wennerberg, K. (2005). The Ras superfamily at a glance. J Cell Sci 118(5): 843‐846. Wennerberg, K. &Der, C. J. (2004). Rho‐family GTPases: it's not only Rac and Rho (and I like it). J Cell Sci
117(Pt 8): 1301‐1312. Wennerberg, K., Ellerbroek, S. M., Liu, R. Y., Karnoub, A. E., Burridge, K. &Der, C. J. (2002). RhoG signals in
parallel with Rac1 and Cdc42. J Biol Chem 277(49): 47810‐47817.

175
Werb, Z. (1997). ECM and cell surface proteolysis: regulating cellular ecology. Cell 91(4): 439‐442. Wheeler, A. P. &Ridley, A. J. (2004). Why three Rho proteins? RhoA, RhoB, RhoC, and cell motility. Exp Cell
Res 301(1): 43‐49. Wheeler, A. P. &Ridley, A. J. (2007). RhoB affects macrophage adhesion, integrin expression and migration.
Exp Cell Res 313(16): 3505‐3516. White, C. D., Brown, M. D. &Sacks, D. B. (2009a). IQGAPs in cancer: a family of scaffold proteins underlying
tumorigenesis. FEBS Lett 583(12): 1817‐1824. White, C. D., Brown, M. D. &Sacks, D. B. (2009b). IQGAPs in cancer: A family of scaffold proteins underlying
tumorigenesis. FEBS Lett 583(12): 1817‐1824. White, C. D., Erdemir, H. H. &Sacks, D. B. (2012). IQGAP1 and its binding proteins control diverse biological
functions. Cell Signal 24(4): 826‐834. White, C. D., Khurana, H., Gnatenko, D. V., Li, Z., Odze, R. D., Sacks, D. B. &Schmidt, V. A. (2010a). IQGAP1
and IQGAP2 are reciprocally altered in hepatocellular carcinoma. BMC Gastroenterol 10: 125. White, C. D., Khurana, H., Gnatenko, D. V., Li, Z., Odze, R. D., Sacks, D. B. &Schmidt, V. A. (2010b). IQGAP1
and IQGAP2 are Reciprocally Altered in Hepatocellular Carcinoma. BMC Gastroenterology 10(1): 125.
Willumsen, B. M., Christensen, A., Hubbert, N. L., Papageorge, A. G. &Lowy, D. R. (1984). The p21 ras C‐terminus is required for transformation and membrane association. Nature 310(5978): 583‐586.
Wing, M. R., Snyder, J. T., Sondek, J. &Harden, T. K. (2003). Direct activation of phospholipase C‐epsilon by Rho. J Biol Chem 278(42): 41253‐41258.
Wittinghofer, A. &Vetter, I. R. (2011). Structure‐Function Relationships of the G Domain, a Canonical Switch Motif. Annual Review of Biochemistry 80(1): 943‐971.
Wojnowski, L., Stancato, L. F., Zimmer, A. M., Hahn, H., Beck, T. W., Larner, A. C., Rapp, U. R. &Zimmer, A. (1998). Craf‐1 protein kinase is essential for mouse development. Mech Dev 76(1‐2): 141‐149.
Wojnowski, L., Zimmer, A. M., Beck, T. W., Hahn, H., Bernal, R., Rapp, U. R. &Zimmer, A. (1997). Endothelial apoptosis in Braf‐deficient mice. Nat Genet 16(3): 293‐297.
Wolthuis, R. M., Bauer, B., van 't Veer, L. J., de Vries‐Smits, A. M., Cool, R. H., Spaargaren, M., Wittinghofer, A., Burgering, B. M. &Bos, J. L. (1996). RalGDS‐like factor (Rlf) is a novel Ras and Rap 1A‐associating protein. Oncogene 13(2): 353‐362.
Wolthuis, R. M., de Ruiter, N. D., Cool, R. H. &Bos, J. L. (1997). Stimulation of gene induction and cell growth by the Ras effector Rlf. EMBO J 16(22): 6748‐6761.
Woodson, E. N. &Kedes, D. H. (2012). Distinct roles for extracellular signal‐regulated kinase 1 (ERK1) and ERK2 in the structure and production of a primate gammaherpesvirus. J Virol 86(18): 9721‐9736.
Wright, D. E., Bowman, E. P., Wagers, A. J., Butcher, E. C. &Weissman, I. L. (2002). Hematopoietic stem cells are uniquely selective in their migratory response to chemokines. J Exp Med 195(9): 1145‐1154.
Wu, J.‐X., Zhang, D.‐G., Zheng, J.‐N. &Pei, D.‐S. (2015). Rap2a is a novel target gene of p53 and regulates cancer cell migration and invasion. Cell Signal 27(6): 1198‐1207.
Wu, Y., Tao, Y., Chen, Y. &Xu, W. (2012). RhoC regulates the proliferation of gastric cancer cells through interaction with IQGAP1. PLoS ONE 7(11): 7.
Xie, G., Karaca, G., Swiderska‐Syn, M., Michelotti, G. A., Krüger, L., Chen, Y., Premont, R. T., Choi, S. S. &Diehl, A. M. (2013). Cross‐talk between Notch and Hedgehog regulates hepatic stellate cell fate in mice. Hepatology 58(5): 1801‐1813.
Xie, J. &Proud, C. G. (2013). Crosstalk between mTOR complexes. Nat Cell Biol 15(11): 1263‐1265. Yanai, M., Tatsumi, N., Hasunuma, N., Katsu, K., Endo, F. &Yokouchi, Y. (2008). FGF signaling segregates
biliary cell‐lineage from chick hepatoblasts cooperatively with BMP4 and ECM components in vitro. Dev Dyn 237(5): 1268‐1283.
Yang, L., Jung, Y., Omenetti, A., Witek, R. P., Choi, S., Vandongen, H. M., Huang, J., Alpini, G. D. &Diehl, A. M. (2008). Fate‐mapping evidence that hepatic stellate cells are epithelial progenitors in adult mouse livers. Stem Cells 26(8): 2104‐2113.
Yang, Q., Inoki, K., Ikenoue, T. &Guan, K. L. (2006). Identification of Sin1 as an essential TORC2 component required for complex formation and kinase activity. Genes Dev 20(20): 2820‐2832.
Yang, X. Y., Guan, M., Vigil, D., Der, C. J., Lowy, D. R. &Popescu, N. C. (2009). p120Ras‐GAP binds the DLC1 Rho‐GAP tumor suppressor protein and inhibits its RhoA GTPase and growth‐suppressing activities. Oncogene 28(11): 1401‐1409.

176
Yang, Y. S., Garbay, C., Duchesne, M., Cornille, F., Jullian, N., Fromage, N., Tocque, B. &Roques, B. P. (1994). Solution structure of GAP SH3 domain by 1H NMR and spatial arrangement of essential Ras signaling‐involved sequence. EMBO J 13(6): 1270‐1279.
Yasuda, K., Yashiro, M., Sawada, T., Ohira, M. &Hirakawa, K. (2007). ERas oncogene expression and epigenetic regulation by histone acetylation in human cancer cells. Anticancer Res 27(6B): 4071‐4075.
Yimlamai, D., Christodoulou, C., Galli, Giorgio G., Yanger, K., Pepe‐Mooney, B., Gurung, B., Shrestha, K., Cahan, P., Stanger, Ben Z. &Camargo, Fernando D. (2014). Hippo Pathway Activity Influences Liver Cell Fate. Cell 157(6): 1324‐1338.
Yin, C., Evason, K. J., Asahina, K. &Stainier, D. Y. R. (2013a). Hepatic stellate cells in liver development, regeneration, and cancer. Journal of Clinical Investigation 123(5): 1902‐1910.
Yin, C., Evason, K. J., Asahina, K. &Stainier, D. Y. R. (2013b). Hepatic stellate cells in liver development, regeneration, and cancer. J Clin Invest 123(5): 1902‐1910.
Yokoi, Y., Namihisa, T., Kuroda, H., Komatsu, I., Miyazaki, A., Watanabe, S. &Usui, K. (1984). Immunocytochemical detection of desmin in fat‐storing cells (Ito cells). Hepatology 4(4): 709‐714.
Yoon, S. &Seger, R. (2006). The extracellular signal‐regulated kinase: multiple substrates regulate diverse cellular functions. Growth Factors 24(1): 21‐44.
Young, Lucy C., Hartig, N., Muñoz‐Alegre, M., Oses‐Prieto, Juan A., Durdu, S., Bender, S., Vijayakumar, V., Vietri Rudan, M., Gewinner, C., Henderson, S., Jathoul, Amit P., Ghatrora, R., Lythgoe, Mark F., Burlingame, Alma L. &Rodriguez‐Viciana, P. (2013). An MRAS, SHOC2, and SCRIB Complex Coordinates ERK Pathway Activation with Polarity and Tumorigenic Growth. Mol Cell 52(5): 679‐692.
Yu, L., McPhee, C. K., Zheng, L., Mardones, G. A., Rong, Y., Peng, J., Mi, N., Zhao, Y., Liu, Z., Wan, F., Hailey, D. W., Oorschot, V., Klumperman, J., Baehrecke, E. H. &Lenardo, M. J. (2010). Termination of autophagy and reformation of lysosomes regulated by mTOR. Nature 465(7300): 942‐946.
Yu, Y. &Feig, L. A. (2002). Involvement of R‐Ras and Ral GTPases in estrogen‐independent proliferation of breast cancer cells. Oncogene 21(49): 7557‐7568.
Yu, Y., Liang, D., Tian, Q., Chen, X., Jiang, B., Chou, B.‐K., Hu, P., Cheng, L., Gao, P., Li, J. &Wang, G. (2014). Stimulation of Somatic Cell Reprogramming by ERas‐Akt‐FoxO1 Signaling Axis. Stem Cells 32(2): 349‐363.
Yuan, B. Z., Miller, M. J., Keck, C. L., Zimonjic, D. B., Thorgeirsson, S. S. &Popescu, N. C. (1998). Cloning, characterization, and chromosomal localization of a gene frequently deleted in human liver cancer (DLC‐1) homologous to rat RhoGAP. Cancer Res 58(10): 2196‐2199.
Yuan, H., Zhang, H., Wu, X., Zhang, Z., Du, D., Zhou, W., Zhou, S., Brakebusch, C. &Chen, Z. (2009). Hepatocyte‐specific deletion of Cdc42 results in delayed liver regeneration after partial hepatectomy in mice. Hepatology 49(1): 240‐249.
Zhang, B., Chernoff, J. &Zheng, Y. (1998). Interaction of Rac1 with GTPase‐activating proteins and putative effectors. A comparison with Cdc42 and RhoA. J Biol Chem 273(15): 8776‐8782.
Zhang, B., Wang, Z. X. &Zheng, Y. (1997). Characterization of the interactions between the small GTPase Cdc42 and its GTPase‐activating proteins and putative effectors. Comparison of kinetic properties of Cdc42 binding to the Cdc42‐interactive domains. J Biol Chem 272(35): 21999‐22007.
Zhang, R., Wang, Y., Li, R. &Chen, G. (2015). Transcriptional Factors Mediating Retinoic Acid Signals in the Control of Energy Metabolism. Int J Mol Sci 16(6): 14210‐14244.
Zhang, S. C., Gremer, L., Heise, H., Janning, P., Shymanets, A., Cirstea, I. C., Krause, E., Nurnberg, B. &Ahmadian, M. R. (2014a). Liposome Reconstitution and Modulation of Recombinant Prenylated Human Rac1 by GEFs, GDI1 and Pak1. PLoS ONE 9(7): e102425.
Zhang, S. C., Nouri, K., Amin, E., Taha, M. S., Nakhaeizadeh, H., Nakhaei‐Rad, S., Dvorsky, R. &Ahmadian, M. R. (2014b).Classical Rho Proteins: Biochemistry of Molecular Switch Function and Regulation. In Ras Superfamily Small G Proteins: Biology and Mechanisms 1, 327‐340 (Ed A. Wittinghofer). Springer Vienna.
Zhao, B., Wei, X., Li, W., Udan, R. S., Yang, Q., Kim, J., Xie, J., Ikenoue, T., Yu, J., Li, L., Zheng, P., Ye, K., Chinnaiyan, A., Halder, G., Lai, Z. C. &Guan, K. L. (2007). Inactivation of YAP oncoprotein by the Hippo pathway is involved in cell contact inhibition and tissue growth control. Genes Dev 21(21): 2747‐2761.
Zhou, T.‐B., Drummen, G. &Qin, Y.‐H. (2012). The Controversial Role of Retinoic Acid in Fibrotic Diseases: Analysis of Involved Signaling Pathways. Int J Mol Sci 14(1): 226‐243.

177
Zinzalla, V., Stracka, D., Oppliger, W. &Hall, Michael N. (2011). Activation of mTORC2 by Association with the Ribosome. Cell 144(5): 757‐768.
Zoncu, R., Efeyan, A. &Sabatini, D. M. (2010). mTOR: from growth signal integration to cancer, diabetes and ageing. Nat Rev Mol Cell Biol 12(1): 21‐35.
Zong, Y., Panikkar, A., Xu, J., Antoniou, A., Raynaud, P., Lemaigre, F. &Stanger, B. Z. (2009). Notch signaling controls liver development by regulating biliary differentiation. Development 136(10): 1727‐1739.

178
Acknowledgments
First, I would like to express my deepest thanks to Prof. Dr. Reza Ahmadian who accepted
me to join his scientific group and for continuous supports of my Ph.D. study, patience,
motivation, and immense knowledge. Especially, I would like to thanks you for allowing me to
grow as a research scientist and opening new windows to my scientific life. These years provided
me an opportunity to beside Cell biology, in some extends, I entered to Biochemistry and
specifically Cell signaling fields, which allowed me to have a better understanding of Cell biology
as well. In addition, I would like to emphasize my thanks also for your positives critics after my
presentations and for the time you spent on them that let me to work in my weak points and
promoted my presentations.
I would like to express my special appreciation and thanks to Prof. Dr. Vlader Urlacher who
his guidance helped me in all the time of Ph.D. research. You were always patient and welcome
to answer my questions and helps me to extent my knowledge.
My sincere thanks also go to Prof. Dr. Dieter Häussinger, Dr. Claus Kordes, Dr. Silke Götze,
Dr. Iris Sawitza and Dr. Boris Görg, for sharing their knowledge and experiences in this study. I
express my special thanks to Ms. Claudia Rupprecht for helping me with isolation of the primary
liver cells.
I take this opportunity to express my sincere gratitude to all of my colleagues and
coordinators in Integrated Graduate School SFB 974 (iGK). Being a part of iGK was a wonderful
opportunity for me to expand my knowledge in distinct aspects of the liver regeneration and
good start to learn about how different projects with variety of scientific backgrounds could be
interconnected in one research program (SFB974). This provided me a unique chance to attend
weekly Ph.D. seminars, skill workshops, lectures and international conferences that all together
helped me to grow as a scientist in this excellent program. I would like to express my sincere
thanks to coordinate of iGK, Sandra Berger, Eva‐Maria Grimm‐Guenter, Inga Nissen and Ute
Albrecht.
My sincere thanks goes to the German Research Foundation (Deutsche
Forschungsgemeinschaft or DFG) through the Collaborative Research Center 974 (SFB 974)
“Communication and System Relevance during Liver Injury and Regeneration” for generous
sponsoring of this thesis and without their support this study was not possible.
I would like to extend my thanks to Prof. Dr. Jürgen Scheller and Dr. Roland P. Piekorz for
their motivating discussions and guiding me in the right direction during my Ph.D. study. I had a
chance that beside my official supervisors I benefited from your knowledge, experiences and
insightful comments.
I also appreciate Dr. Radovan Dvorsky for his generous help, patience and guiding me for
structural analysis and sharing his idea and knowledge. Working with you, gave me a chance to
start imagination about the protein structures and you encouraged me for being brave in this
field.

179
I would like to express my thanks to all members of institute of biochemistry and molecular
biology II, you were all beside me during my Ph.D. time and we had memorable times together. I
thank my fellow labmates Dr. Si‐Cai Zhang, Dr. Madhurendra Singh, Ehsan Amin, Kazem Nouri,
Hossein Nakheizadeh, Dr. Mohammad Saleh Taha, Niloufar Monhasery, Alexander Lang, Manuel
Franke, Dr. Doreen Floss and Dr. Jens Moll, for the stimulating discussions, supports, sharing the
knowledge and for all the fun we have had in the my Ph.D. years. My special thanks goes to my
friends from the institute, Simone Hambuechen, Inga Rebecca Heinen, Jana Kremer, Bach‐Ngan
Nguyen, Nirina Sivakumar and Timo Faustmann, I am very happy to know all of you, being with
you provided me an opportunity to be more familiar with German culture and you encouraged
me for learning language. In particular, I am grateful to Petra Opree, Fereshteh Kamrani, Ilse
Meyer, Nadine Horstick, Hakima Ezzahoini, and Zeynep Tokyürek.
Last but not the least; I would like to thank my lovely and unique family: with words, I
cannot express my deep thanks to you! My dear parents, I am devoted to both of you. By loving
me, you taught me how to like other peoples. You spent your best time of your lives for training
me and with putting yourself in front of the life problems, I never felt the hard times in my life.
You were my motivators from elementary school up to now (my Ph.D.) and always encouraged
me. Thank you for allowing me to study abroad although being far from me was very difficult for
you and you never complained about this situation because my success and my future career
were more important for you. I cannot say how grateful I am from my brothers (Mohammad and
Mojtaba) and my only sister (Tayebe) for supporting me spiritually throughout my studying times
and my life in general. I would like to express my special thanks to Hedyeh Amintoosi (my bother
wife), who helped me to correct grammar mistakes in my dissertation.

180
Curriculum Vitae
Personal data
Date of Birth: 30th March 1986
Place of Birth: Mashhad, Iran
Nationality: Iranian (Persian)
Academic education
Oct 2008‐ Sep 2011: Master studies in Cell and Molecular Biology
Ferdowsi University of Mashhad, Iran
Degree: Master of Science in Cell and Molecular Biology
Oct 2004 – Sep 2008 Bachelor studies in Animal Biology
Ferdowsi University of Mashhad, Iran
Degree: Bachelor of Science in Animal Biology
School education
Oct 1992 – Oct 2004: Elementary, Junior and Senior high school in Mashhad, Iran
Degree: Diploma of Natural Science
Work experience
Since May 2012: Ph.D. student with Prof. Dr. Mohammad Reza Ahmadian
Institute of Biochemistry and Molecular Biology II
Heinrich Heine University, Düsseldorf, Germany
Oct 2011‐Mar 2012: collaboration and managements of the technical workshops
Institute of Biotechnology
Ferdowsi University of Mashhad, Iran
Poster presentation:
Jan 2016 22‐23th, 32nd GASL Annual Meeting, Expression, epigenetical regulation and signaling
network of embryonic stem cell‐expressed RAS in hepatic stellate cells, Düsseldorf, Germany.
Sep 24‐26th 2014, First international meeting “Building the cells”, Insights into the molecular
mechanism of hepatic stellate cells activation, Paris, France.
Nov 15‐16th 2013, International conference of SFB 974 "Liver Damage and Regeneration", The
properties and functions of embryonic stem cell‐expressed Ras (ERAS) with respect to liver
regeneration, Düsseldorf, Germany.
Apr 27‐29th 2011, Iranian congress on “Biology and Application of Stem cells”, Improve the
efficiency and safety of induced pluripotent stem cells technology, Ferdowsi University of
Mashhad, Iran.
Awards and scholarships
Inlands patent (Iran) “the small molecules kit for the dedifferentiation induction”, 2014, No.
83648.
Prizes for the first grade student on M.Sc. between Cell and molecular biology students on the
faculty of Science, for three years 2008‐2011, Ferdowsi University of Mashhad, Iran.

181
Prizes for the first grade student on B.Sc. between Biology students on the faculty of Science, for
three years 2005, 2006 and 2007, Ferdowsi University of Mashhad, Iran.
Jan 2001 School prize in general science exam between the high schools of the city (Mashhad)
University scholarship for doing M.Sc., Ferdowsi University of Mashhad.
University scholarship for B.Sc., Ferdowsi University of Mashhad, based on entrance
examination.
Training, commitments and workshops
Dec 2012‐Jan 2016: Member of the graduate school iGRAD
May 2012‐Jan 2016: Member of the integrated graduate school iGK974 of the SFB974
iGRAD Workshops, Heinrich Heine University: - Good scientific practice for doctoral researchers
- Optimizing writing strategies for publishing in English
- Get into teaching for doctoracl researchers
- Leadership skills for scientists
- Scientific image processing and analysis
Stem cell biology and differentiation workshop ‘induced pluripotent stem cells cultivation and
cardio‐myocyte differentiation’ (Klinik für Herz‐ und Thoraxchirurgie, Universität Magdeburg,
Germany in 2016, 5 days).
Data analysis with GraphPad Prism workshop (Heinrich‐Heine‐Universität Düsseldorf, Germany,
2016 2 days).
Gene Trapping/Knock‐out workshop (Institut für Medizinische Mikrobiologie und
Krankenhaushygiene Heinrich‐Heine‐Universität Düsseldorf, Germany, 2014 2 days).
List of publications Nakhaei‐Rad, S., Bahrami, A. R., Mirahmadi, M. &Matin, M. M. (2012). New windows to enhance
direct reprogramming of somatic cells towards induced pluripotent stem cells. Biochem Cell Biol 90(2): 115‐123.
Zhang, S. C., Nouri, K., Amin, E., Taha, M. S., Nakhaeizadeh, H., Nakhaei‐Rad, S., Dvorsky, R. &Ahmadian, M. R. (2014). Classical Rho Proteins: Biochemistry of Molecular Switch Function and Regulation. In Ras Superfamily Small G Proteins: Biology and Mechanisms 1, 327‐340 (Ed A. Wittinghofer). Springer Vienna.
Jaiswal, M., Dvorsky, R., Amin, E., Risse, S. L., Fansa, E. K., Zhang, S. C., Taha, M. S., Gauhar, A. R., Nakhaei‐Rad, S., Kordes, C., Koessmeier, K. T., Cirstea, I. C., Olayioye, M. A., Haussinger, D. &Ahmadian, M. R. (2014). Functional cross‐talk between ras and rho pathways: a Ras‐specific GTPase‐activating protein (p120RasGAP) competitively inhibits the RhoGAP activity of deleted in liver cancer (DLC) tumor suppressor by masking the catalytic arginine finger. J Biol Chem 289(10): 6839‐6849.
Nakhaei‐Rad, S., Nakhaeizadeh, H., Kordes, C., Cirstea, I. C., Schmick, M., Dvorsky, R., Bastiaens, P. I., Haussinger, D. &Ahmadian, M. R. (2015). The Function of Embryonic Stem Cell‐expressed RAS (ERAS), a Unique RAS Family Member, Correlates with Its Additional Motifs and Its Structural Properties. J Biol Chem 290(25): 15892‐15903.
Caye, A., Strullu, M., Guidez, F., Cassinat, B., Gazal, S., Fenneteau, O., Lainey, E., Nouri, K., Nakhaei‐Rad, S., Dvorsky, R., Lachenaud, J., Pereira, S., Vivent, J., Verger, E., Vidaud, D., Galambrun, C., Picard, C., Petit, A., Contet, A., Poirée, M., Sirvent, N., Méchinaud, F., Adjaoud, D., Paillard, C., Nelken, B., Reguerre, Y., Bertrand, Y., Häussinger, D., Dalle, J.‐H., Ahmadian, M. R., Baruchel, A., Chomienne, C. &Cavé, H. (2015). Juvenile myelomonocytic

182
leukemia displays mutations in components of the RAS pathway and the PRC2 network. Nat Genet 47(11): 1334‐1340.
Nakhaei‐Rad, S., Nakhaeizadeh, H., Götze, S., Kordes, C., Sawitza, I., Franke, M., Scheller, J., Piekorz, R. P., Häussinger, D. & Ahmadian, M. R. (2016). Embryonic stem cell‐expressed ERAS controls the quiescence of hepatic stellate cells. J Biol Chem 291(16):8399‐413.
Mirahmadi, M*., Nakhaei‐Rad, S*., Matin, M. M., Shahriari, M., Saeinasab, M., Mahmoudi, Z., Haghighi‐Talab, A., Mahdavi‐Shahri, N., & Bahrami, A. R. (2016). Dedifferentiation effects of rabbit regenerating tissue on partially differentiated cells. CELL REPROGRAM. DOI: 10.1089/cell.2016.0008.

183
Eidesstattliche Erklärung zur Dissertation
Hiermit versichere ich, dass die vorliegende Dissertation von mir selbstständig und ohne
unzulässige fremde Hilfe unter Beachtung der Grundsätze zur Sicherung guter wissenschaftlicher
Praxis an der Heinrich‐Heine‐Universität Düsseldorf verfasst worden ist. Die Dissertation wurde
in der vorgelegten oder in ähnlicher Form noch bei keiner anderen Institution eingereicht. Ich
habe bisher keine erfolglosen Promotionsversuche unternommen.
Düsseldorf, den
Saeideh Nakhaeirad