DEFICIT IRRIGATION OF SUNFLOWER UNDER MEDITERRANEAN ENVIRONMENTAL CONDITIONS
Upload
khangminh22Category
view
1download
0
1
EXPORT-IMPORT BANK OF INDIA
OCCASIONAL PAPER NO. 171
INDIAN ElEcTRONIc GOODs INDusTRy: NEuTRAlIzING TRADE DEFIcIT wITh chINA
© Export-Import Bank of IndiaMarch 2015
EXIM Bank’s Occasional Paper Series is an attempt to disseminate the findings of research studies carried out in the Bank. The results of research studies can interest exporters, policy makers, industrialists, export promotion agencies as well as researchers. However, views expressed do not necessarily reflect those of the Bank. While reasonable care has been taken to ensure authenticity of information and data, EXIM Bank accepts no responsibility for authenticity, accuracy or completeness of such items.

2

3
cONTENTs
Page No.
List of Tables 5
List of Exhibits 7
List of Boxes 9
Executive Summary 11
1. Global Scenario of Electronics Industry 32
2. Scenario of Electronics Industry in India 63
3. Scenario of Electronics Industry in China 82
4. Neutralizing India’s Trade Deficit 98
5. Identification of Areas for Cooperation 118
6. Review of Security Related Issues: Policies in China and India 136
7. Strategy and Road Map 140
Annexures
Annexure I: Categorization of HS codes in the Electronics Sector 157
Annexure II: Products in Which Investment from China could be 168
Attracted
Annexure III: Product Categories for Enhancing Exports from India 173 to China
Annexure IV: Policy Developments in India and China Relevent Electronics Industry 175
Project Team :Mr. S. Prahalathan, Chief General Manager, Research and Analysis GroupMr. Ashish Kumar, Assistant General Manager, Research and Analysis GroupMs. Jahanwi, Manager, Research and Analysis Group

4

5
Table No. Title Page No.
1. Main Product Groups where JVs can be Formed 192. Top Exporters & Importers of Electronic Products in 2012 48 (Value in US$ bn)3. Category-wise Top Exporters and Importers of Final Electronic 51 Products (Value in US$ mn)4. Top Countries in Terms of ‘Exports of Value Added’ in Electrical 57 and Optical Instruments, 20095. Top Countries in Terms of ‘Imports of Value Added’ in Electrical 59 and Optical Instruments, 20096. Category-wise Trade of India in Electronic Products 70 (Value in US$ mn)7. Top Destinations for Export of Electronics from India 72 (Value in US$ mn; 2013-14)8. Top Sources for Import of Electronics from India 73 (Value in US$ mn; 2013-14)9. Balance of India’s trade with China in Final Electronic 74 Categories (Value in US$ mn) 10. HHI Index for Categories of Electronics Industry 7711. Major Source Countries for FDI into Indian Electronics Industry 7912. Destination States for FDI into Indian Electronics Industry 7913. China’s Production of Select Electronic Goods 8714. Category-wise Trade of China in Electronic Products 89 (Value in US$ mn)15. Top Destinations for Export of Electronics from China 91 (Value in US$ mn; 2012)16. Top Sources for Import of Electronics by China 92 (Value in US$ mn; 2012)17. Top Countries Investing in China’s Electronics Industry 94 (Jan 2003-March 2014)
lIsT OF TABlEs

6
Table No. Title Page No.
18. Top Ten Companies Investing in China’s Electronics Industry 96 (Jan 2003-Mar 2014)19. Top Destinations for China’s FDI Projects in Electronics Industry 97 (Jan 2003 - March 2014)20. Import of Phones, Fax Machines and Routers by India 102 (Value in US$ mn)21. Import of Computer and Storage Devices by India 104 (Value in US$ mn)22. Import of Television and Monitors by India (Value in US$ mn) 10523. Import of Analytical Instruments by India (Value in US$ mn) 10724. Import of Cameras and Projectors by India (Value in US$ mn) 10825. Import of Medical Devices by India (Value in US$ mn) 11026. Top Ten Electronic Products Exported by India to the World and 112 Imported by China from India, 2012 (Value in US$ mn) 27. Top Ten Electronics Products Exported by China to the World 115 and Imported by India from China (2012)28. Share of Specialized Products in Each Category 11929. Main Product Groups Where JVs can be Formed 12330. Top Exporting Countries for Computer & Information Services 12531. China Enterprise Application Market (Value in US$ mn) 12532. Trade Barriers Affecting China’s Trade in Electronics 12833. List of Electronic Products in which India has Preferential 131 Access in MERCOSUR34. List of Electronic Products which are in Sensitive List of 133 ASEAN for China but not for India35. Electronic Products where China has Preferential Access in 134 Pakistan36. NDRC and MOFCOM Approval and Filing Requirements 13737. Top Performing Nations in Logistics Performance Index 14938. Ranking of Countries Based on Gross Expenditure on R&D 15239. Good Practices in Areas Where India Performed Relatively 155 Poor in Doing Business Index40. List of Electronic Products for which Import is Banned under 189 Used Category41. Category-wise Electronic Products Requiring CCC Mark 190

7
Exhibit No. Title Page No.
1. Electronic Segments Where Investment from China could be 16 Attracted (Total: 61 products)2. Product Categories for Enhancing Exports from India to China 173. Global Value Added in Electronics: A Segmented Trend (US$ bn) 334. Major Producers of Electronics in 2007 and 2012 345. Category-wise Major Producers of Electronics 356. Production of Electronics in USA (Value in US$ bn) 377. Segment-wise Share in Total Electronics Production of USA 388. Production of Electronics in Japan (Value in US$ bn) 409. Segment-wise Share in Total Electronics Production of Japan 4110. Production of Electronics in European Union (Value in US$ bn) 4211. Segment-wise Share in Total Electronics Production of EU 4312. Global Value Chain in Electronics 4513. Global Trade in Electronics (Value in US$ bn) 4714. Category-wise Top Exporters of Electronics 4915. Category-wise Top Importers of Electronics 5016. Trade Balance in Value Added vs Gross Trade Balance for Countries 60 in Electrical and Optical Instruments (2009; Value in US$ mn) 17. Share of Electronics Segments in Countries’ Exports and Imports (2009) 6218. Segments of Indian Electronics and IT Hardware Sector 6319. Timeline of Developments in the Indian Electronics Industry 6420. Segment-wise Electronics Production (FY09-FY13, Value in Rs. Crore) 6521. Share of Segments in Total Electronics Production of India 6622. Export Intensity of Sales in Electronics Industry (%) 6723. Indigenous Raw Materials Consumed by the Industry as % of 68 Total Raw Materials Consumed24. Export and Import Trend of India’s Electronics Goods 69 (Value in US$ bn)
lIsT OF EXhIBITs

8
Exhibit No. Title Page No.
25. Top Trading Partners for India in Electronics 7126. China’s Share in India’s Trade Deficit of Electronic Goods (2013-14) 7427. Cumulative TBT Notifications under the ITA HS Lines 7628. FDI in India’s Electronics Industry (US$ mn) 7829. Export and Import Trend of China’s Electronics Goods 88 (Value in US$ bn)30. Top Trading Partners for China in Electronics 9031. Foreign Direct Investment in China’s Electronics Industry 9432. Major FDI Motives Cited by Companies Investing in China’s 95 Electronics Industry (January ’03 - March ’14)33. FDI Outflows from China in Electronics Industry 9634. Major FDI Motives Cited by Companies Investing in Indian 98 Electronics Projects (January ‘03 - March ‘14)35. Share of Segments in India’s Imports of Final Electronic Goods 10036. Major FDI Motives Cited by Companies Investing in Indian 101 Communication Equipments Industry (January 2003 - March 2014)37. Major FDI Motives Cited by Companies Investing in Indian Computer 103 and Peripheral Equipments Industry (January 2003 - March 2014)38. Average Hourly Wages Across Countries (in US$ per hour) 10339. Major FDI Motives Cited by Companies Investing in Indian Medical 109 Devices Segment (January 2003 - March 2014)40. Criteria for Identification of Electronic Sub-Sectors for Attracting 120 FDI from China to India41. Electronic Segments Where Investment from China could be Attracted 120 (Total: 61 Products)42. Product Categories for Enhancing Exports from India to China 12143. China’s Trade in Computer and Information Services (Value in US$ mn) 12444. Map of the Finnish Mobile Cluster 14345. General Government Expenditure on Health as Percentage of 144 Total Expenditure on Health in India (%)46. Components of Operating Expenses of Computers, Peripherals and 148 Storage Devices Industry47. Distribution of Labor Force based on Educational Attainment (2010) 15048. Skill Requirements for the Industry by 2022 151

9
lIsT OF BOXEs
Box No. Titles Page No.
1. Development of China’s Electronics Industry over the 83 Plan Periods

10

11
EXEcuTIVE suMMARy
The electronic industry is one of the most diversified and dynamic sectors, evolving at a rapid pace with continuous innovations. There is high modularity in the electronics industry, as a result of which an electronic production cycle can be segregated into many different parts which can be finally assembled. Therefore, production can be distributed over different geographies, making the role of global supply chains pivotal for the industry.
For the purpose of analyzing trade, the electronics industry can be classified under three broad heads, viz. electronic components, sub-assembly products and final electronic goods. Final electronics goods can be further classified on the basis of their end-use into 14 sub-categories, viz. phones, fax machines and routers, computer and storage devices, television and monitors, analytical instruments, cameras and projectors, medical devices, sound projection devices, sound and video recording devices, radios and alarm clocks,
radio and TV transmission, radar and radio navigation equipment, office equipment, clocks and watches, and other electronic products.
GlOBAl scENARIO
Globally, USA remains the largest producer of electronics in terms of value added, accounting for a share of 29.2 percent of the world production in 2012, up from 27.0 percent in 2007. China consolidated its position as the second largest producer with its share nearly doubling from 15.3 percent in 2005 to 26.7 percent in 2012. On the contrary, share of Japan almost halved – from 14.1 percent to 8.6 percent during the same period. The major players remained more or less the same, save for the entry of Brazil into the list, displacing France among the top ten.
Global exports of electronic goods were valued at US$ 2149 billion in 2012, registering a y-o-y decline of 0.5 percent, after recording two years of positive growth. Global

12
exports are more than twice the global value added in the production of electronics goods. This may seem inflated essentially on account of the industry being characterized by a large presence of established global value chains, implying that the component and sub-assemblies are moving either vertically or horizontally in the value chain1. Exports of both final electronic goods and electronic components declined marginally, but that of subassembly products recorded a moderate increase of 0.9 percent in 2012. However, over the period 2008 to 2012 the industry’s trade performance was relatively better, with exports registering a CAGR of 2.7 percent.
Trade data in value added terms is significantly different than gross trade data. In the category of electrical and optical instruments, countries like the Netherlands and Mexico had gross trade surplus in 2009, but had deficit in value added terms. Moreover, countries like China, Japan, Republic of Korea, Germany, and Singapore had substantially lower trade balance in value added terms, as compared
to the gross trade balance. Other countries like USA, Canada, Australia, France and United Kingdom had lower trade deficit in value added terms than in gross terms. The VAX ratio (ratio of value added exports to gross exports) for Philippines and Thailand was greater than one, indicative of the fact that electronics industry is extensively used in other export-oriented sectors.
India’s trade deficit was much narrower in value added terms, amounting to merely 22.1 percent of the gross trade deficit. On the contrary, China’s trade surplus in value added terms was 47.6 percent of its gross trade surplus. The VAX ratio for electronics exports from India was 0.79 i.e., India’s exports in value added terms was 79.2 percent of its gross exports. India’s valued added imports of electronics were also significantly lower than its gross imports (amounting to 43 percent of the gross imports).
scENARIO IN INDIA
Although there has been significant increase in production of electronics,
1Thus for instance, consider that country A exports US$ 10 million of goods to B, to which value of US$ 10 million is additionally added by country B before finally exporting it to country C at a value of US$ 20 million. Although total exports by conventional measures amount to US$ 30 million in this example (US$ 10 million by Country A and US$ 20 million by Country B), the actual value added production is only US$ 20 million. Moreover, exports in value added terms will have two components – direct and indirect exports . Indirect exports are essential in accounting as conventional trade statistics do not present a true picture of trade relations. For example, in the above case, conventional trade statistics will not show any trade relation between A and C, even though A benefits extensively on account of demand from C.

13
there remains large unmet demand which is currently being met by imports. Majority of the electronic production in India is intended for the domestic market. Export intensity of sales in electronics industry has grown in 2000s. However, there has been a marked decline in the export intensity in post-2008-09 period.
The growth in India’s exports and imports of electronic goods had peaked in 2010-11, but has witnessed moderation since then. The moderation has been starker in the case of exports, where y-o-y growth moderated from 52.1 percent in 2010-11 to 7.4 percent in 2011-12 before recording successive years of negative growths of (-) 7.8 percent and (-) 8.0 percent in 2012-13 and 2013-14, respectively. In absolute terms, exports of electronics declined from US$ 8.2 bn in 2010-11 to US$ 7.5 bn in 2013-14. As far as imports of electronics are concerned, during 2013-14, they were valued at US$ 30.97 billion, registering a y-o-y decline of (-) 1.5 percent.
India is a net importer of electronic goods and had a huge trade deficit of US$ 23.5 billion in 2013-14, primarily on account of huge imports from China whose share in India’s total trade deficit in electronic products
stood at 66.7 percent in 2013-14. China’s share in India’s trade deficit of electronic goods is largest in the category of final electronic goods. In 2013-14, China accounted for 73 percent of India’s trade deficit of final electronic goods. In the segments of subassembly products and electronic component as well, the share was as high as 58 percent and 55 percent, respectively.
scENARIO IN chINA
China’s performance in the electronics industry has been nothing short of phenomenal. The development of electronic capabilities in the country has to a large extent been possible due to the articulation and successful achievement of goals in its five year plans, which are the planning mechanism adopted in the country.
Import-substituting and export-driven foreign direct investment played an important role in China’s electronics industry. While the former was largely a result of the sheer potential of China’s market, the latter was ensured through regulations such as setting of export ratios for FDI (Zhongxiu Zhao et al, 2007)2. The mandatory export ratio was usually 70 percent for export-oriented FDI.
2Zhongxiu Zhao et al (2007), China’s Industrial Policy in Relation to Electronics Manufacturing.

14
According to G Long (2005), China’s FDI policies regarding exports can be categorized into: compulsory, neutral and voluntary. Compulsory policies required that “FDI shall be able to keep a balance of exchanges, or make sure the proportion of their domestically made products in the total number of products reach a certain benchmark, or a certain percentage of their products must be exported.” Interested foreign investors had to meet this condition before receiving approval for investing in the country. However, after China’s membership in the WTO, most of the compulsory requirements were eliminated in order to satisfy the TRIMs agreement. Neutral policies were aimed at creating favourable scenario for exports to compete internationally. Tariff and VAT exemptions were provided on imports of input for re-exports. Voluntary policies of the government included incentives like 50 percent cut in corporate income tax for enterprises with 70 percent of export products3.
China is a net exporter of electronic goods with exports in 2012 amount-ing to US$ 598.4 bn and imports amounting to US$ 416.3 bn. Although, exports and imports of electronic
goods from China have been rising since 2009, growth rates have moderated from 2009 onwards.
FDI outflows from China in the electronics industry during the first half of 2000s was low, but has increased substantially in the recent past. In 2012, capital investments made by Chinese companies in overseas electronics industry were US$ 2563 million. This came down to a lower, yet sizeable, level of US$ 1928.8 million in 2013.
NEuTRAlIzING ThE TRADE DEFIcIT
India has substantial trade deficit with China in the electronics segment. However, Chinese products are not necessarily more competitive than those supplied by Indian players. Empirical findings in a recent study by RIS have found India’s imports from China to be uncompetitive in the Vinerian sense, i.e. on the basis of comparative cost advantage. Nearly 16.2 percent of the total imports from China in 2012 in the Machinery and Mechanical Appliances segment have been found to be uncompetitive in the study4.
Substantial complementarities have been found in the trade baskets of
3Guoqiang Long (2005), China’s Policies on FDI: Review and Evaulation.4Mohanty, S.K. (2014), India-China Bilateral Trade Relationship, Research and Information System for Developing Countries.

15
India and China. Basket of imports by China from India, and of the exports of India to world is similar to a large extent, indicative of strong signals of complementarities. Many products which rank high among products exported by China to the world also feature among the basket of major products imported by India from China. Especially in the subassembly products category, the top three products exported by China to the world are also the top three products imported by India from China.
The purpose of analysing trade complementarities is twofold- identifying areas where China’s imports are substantial, indicative of the demand for those products, and suggesting strategies for developing domestic capabilities in those areas, and identifying areas where there is scope for attracting FDI from China on account of substantial demand by India.
IDENTIFIcATION OF ElEcTRONIc PRODucTs FOR cOOPERATION wITh chINA
Identification of Electronic Sub-Sectors for Attracting FDI from china to India
At the six digit HS code level, three major points have been considered
while identifying the products where India can attract investment from China:
• China’s outward investment in electronics sector has been increasing. As per data from FDI Markets, outward FDI (capital investment) from China in electronics industry increased from US$ 575 mn in 2008 to US$ 2563 mn in 2012 before moderating to US$ 1928.8 mn in 2013. Outward investment from China in the electronics industry accounted for 13.8 percent and 8.5 percent of the total outward investments from the country in 2012 and 2013, respectively. Quite a few of these investments were horizontal and were envisaged with the objective of serving the local Chinese market (import platform investment)5. Hence, an analysis of Chinese electronic imports becomes important.
• However, when it comes to investments into India in the electronics goods sector by Chinese firms, Chinese firms have cited market seeking investment as a major reason for investment. This implies that India’s import demand would be a key parameter for the identification process.
5Alon, Molodtsova & Zhang (2012), Macroeconomic Prospects for China’s outward FDI.

16
• From the above two, a case can be made for identifying products where trade structures of India and China are complementary. If India’s exports are complementary to China’s imports, import platform investment can be attracted. If China’s exports are complementary to India’s imports, market seeking investment can be attracted.
The intersection of the three sets – a) where India and China have complementary trade pattern (i.e. where Trade Specialization index (TSI)6 for the product is at variance for India and China – positive for one and negative for the other, and vice versa); b) where India has significant imports (minimum threshold level of US$ 10 million) and; c) where China’s imports are above a threshold level
Exhibit 1: Electronic Segments Where Investment from China could be Attracted (Total: 61 products)
Source: UNCOMTRADE, EXIM Bank Analysis
6Trade specialization index (TSI) is used to measure the degree of net exportation by a coun-try in a particular commodity. It basically compares the net flow of goods with the total flow of goods, thereby removing any bias due to re-export activities, if any. It thus helps in identifica-tion of real producers of a commodity and not merely traders. The range of TSI is +1 to -1, where +1 indicates complete specialization and -1 indicates no specialization. Algebraically, it can be written as-
TSI = X-M
X+M

17
(at least US$ 50 million) is derived as the required set of electronic products where FDI could be attracted from China by India. Based on the above methodology, sixty one such products have been identified, accounting for 19.8 percent of China’s total electronics imports, and 69.7 percent of India’s total electronics imports in 2012. Most of these products are in the final electronic goods segment. Within the final goods segment, computer and storage devices is the most important sub-category where investment can be attracted (Exhibit 1).
Identification of Electronic Product Categories for Enhancing Exports from India to China
India can also strive towards enhancing its export capabilities in
the identified electronic goods. These would include products where:
• China is not a real producer currently, and has got significant import demand (>US$ 50 million). Whether China is a real producer can be identified from the TSI index. China will not be a real producer in all those goods where TSI is negative.
• India has got a certain minimum amount of exports (>US$ 10 million), indicative of some production capabilities available in the country.
Twenty two such products have been identified, largely from the segments of medical devices and components. These products in total account
Exhibit 2: Product Categories for Enhancing Exports from India to China
Source: UNCOMTRADE, EXIM Bank Analysis

18
for 50.4 percent of total imports by China. These products accounted for 15.9 percent of India’s total electronics exports and 17.3 percent of India’s total electronics imports in 2012 (Exhibit 2).
Identification of Sub-Segments for Establishing Joint Ventures between India and china in the Electronic Sector of India
While looking for a potential JV partner, companies look into various aspects like financial security, resource and management capabilities, production performance, reputation, etc. Hence, JVs can be attracted successfully only in those areas where Indian companies already have a critical mass and experience. For the purpose of identifying such areas, an analysis of Indian companies which have achieved operating success, and thus are attractive JV partners can be undertaken.
This study takes net profit as a proxy for operating success of a company. List of companies engaged in electronic production was obtained from the CMIE’s Prowess database. Taking 2011-12 as the reference period, those companies have been selected where the profit after tax was positive7. The list of major products produced by these firms, and hence
suitable far establishing joint ventures is given in Table 1.
Identification of Sub-Segments for the Development of Software Industry to Meet the Requirements of Chinese Market
ERP and SCM are important segments in China’s enterprise application market. In the ERP segment, Indian software companies need to provide more customized products and should also try to provide on-site delivery which is an important consideration for the Chinese customers. Indian players will also have to familiarize with the Chinese business culture and language as it is another important factor to tap the Chinese ERP demand. Moreover, the business process-related functions of ERP system (like SCM) are more in demand in the Chinese market. So emphasis on this particular segment should be the highest.
Other Areas for Attracting Investment from China
Benefits from Regional Trade Agreements: List of electronic products can be identified where India has access to preferential duties, while China doesn’t. These areas would be attractive for Chinese firms to invest
7The companies for which 2012-13 data was available were few. Hence, 2011-12 data has been considered for the present analysis.

19
Table 1: Main Product Groups where JVs can be Formed
Medical equipments Line printers
Analytical instruments Control valves
Printed circuit boards LED lamps
Uninterrupted power supplies Other diodes & transitors
Control instrumentation & industrial electronics
Diodes & transistors
Therapy equipments Level controllers
Microwave passive components Industrial fans, blowers, etc.
Weighing system, load cell Other automation electronics equipment
Filters Crystals
Electro cardio graphics Electronic lighters
Defence communication equipments Computer systems
Strategic electronics equipments Solar modules
Connectors Instrument cooling fans
Surgical equipments Industrial ultrasonic equipment
Piezo electric elements Semiconductor devices
Other testing & measuring instruments Integrated circuits
Thermal analysis equipments Computer peripherals
Soft ferrites Electronic components
VHF radio systems Reed switches
Solar appliances Switch mode power supply systems
Transmission equipments Process controllers
Electronics Integrated circuits, nec
Process control equipments Ph analysis equipments and ph meters
Electronic buzzers Television receivers, colour
Electrolytic capacitors Telephone components
Temperature controllers Computer terminals
Antennae for radios & TVs Communication & broadcasting equipments
Rotary switches Television receivers
Control panels
Source: CMIE Prowess, EXIM Bank Analysis

20
in order to access wider market. India has concluded agreements with some countries/regions where China has not been able to gain preferential access. These agreements are crucial from the point of view of attracting market-seeking investment from China. Even in countries where both India and China have FTA, some areas can be identified where the FTA partner countries have put electronic items under sensitive list for China, but not for India.
A Preferential Trade Agreement was signed between India and MERCOSUR in 2005 wherein the latter provided concession in 452 products. Of these 452 products, 30 are electronic products. Maximum preference is allowed by MERCOSUR in the medical electronics products category wherein four product categories benefit from 100 percent margin of preference. These are lithotripters operating by shock waves (HS code: 90189031), computerized microwave apparatus for intra-urethra (HS code: 90189093), endoscopes (HS code: 90189094), and clamps and clips, applicators and extractors there (HS code: 90189095).
Both India and China have entered into trade agreement with ASEAN. However, some of the products which are in the sensitive list of ASEAN countries for China are under the
Normal Track-1 and Normal Track-2 list for India. Twenty three such products have been identified at the six digit level.
SAFTA is a free trade agreement between the countries of Bangladesh, Bhutan, India, Maldives, Nepal, Pakistan and Sri Lanka. Out of these countries, China has FTA only with Pakistan. However, even in Pakistan, China has margin of preference in only 21 products at HS 6-digit level. Investment in India will give Chinese companies access to the markets of SAARC countries. Although the market size of individual countries within SAARC might be small, collectively it is an attractive export destination.
Benefits from Investment in Areas where Chinese Firms Face Trade Barriers: India can also attract investment in those sectors where China faces anti-dumping duties, countervailing duties and safeguards from other countries and hence would like to circumvent these trade barriers. The scope of barriers is fairly large and includes wide array of non-tariff barriers as well. For the purpose of our analysis we have taken three significant trade barriers- anti-dumping duties, countervailing duties, and safeguards. Twenty seven products in six different countries/regions (including European Union)

21
have been identified where China faces these trade barriers. However, import by some of the countries placing import-restrictions on electronic products is low, thereby limiting the prospects of investment in those commodities.
Products featuring under monitors and projectors, not incorporating television reception apparatus; reception apparatus for television, whether or not incorporating radio-broadcast receivers or sound or video recording or reproducing apparatus (HS code: 8528, Category: Television & Monitors) has witnessed significant import-restricting actions from across the globe. Under this category, imports from China have been banned by countries such as Argentina, EU, Turkey and USA. All these countries are also significant importers of the product, with total imports from these four countries under this HS code amounting to US$ 13,754.13 million in 2012. Hence, investments in this area can be attracted.
Within the sound and video recording devices segment, magnetic media for the recording of sound/of other phenomena, but excluding products of Chapters 37, other than cards incorporating a magnetic stripe (HS code: 852329) and optical media for the recording of sound/of other phenomena, but excluding products
of Chapters 37 (HS code: 852340) are important categories where China faces anti-dumping and countervailing duties from European Union. Total imports under these two HS codes by European Union were US$ 1,381.44 million in 2012. China also faces barriers from Argentina and European Union in the category of microwave ovens (HS code: 851650).
Within the electronic components segment, China faces maximum trade barrier on account of these measures in the category of other permanent magnets and articles intended to become permanent magnets after magnetisation (HS code: 850519). Both Brazil and USA have placed import-restricting duties on China in this category. Total import for this product by both the countries amounted to US$ 48.18 million in 2012.
sTRATEGIEs FOR DEVElOPING DOMEsTIc cAPABIlITIEs
Developing the Electronic Components Category: Electronic components are the building blocks of a successful electronics industry. Its growth has been frail in India. Like India, Brazil also has seen a surge in the electronic components import. An influential effort was taken by the Brazilian government in the form of Integrated Circuits Brazil

22
(CI Brasil) program, from which cue can be taken by India. Established in 2007, this program has established training centers in ICT clusters and many semiconductor designers have graduated under this program. Such training help develop domestic technical pool. It is not that India is aloof from such kind of initiatives. KarMic Training Centre, in India, is a rural VLSI training institute which offers specialized semiconductor design training to graduate engineers to prepare them for absorption into the design sector. Interestingly, it was a private initiative wherein students were absorbed into the company upon graduation.
Tax Related Incentives for Semiconductor Industry: Tax related incentives also go a long way in developing the electronics industry. Brazil started the Program for the Development of the Semiconductor and Display Industry (PADIS) which provides incentive for manufacture of semiconductor electronic devices, crystal and plasma displays and on-board chip systems. PADIS allows for several incentives, including zero percent corporate income tax for development and design, testing and packaging, and diffusion (physical/chemical) processes. Countries like Japan, China and Taiwan also
provide tax subsidy for manufacturing in the electronics and semiconductor manufacturing category, which is not provided in the Indian case. Japan provided subsidies and tax benefit under two laws- Machinery Industry Law (1956) and Electronics Industry Law (1957). Subsidies for R&D and loans, along with tax incentives were provided under these laws for firms that developed or used advanced production technologies. In this direction, India recently provided for reimbursement of central taxes and duties in select high-tech units like fabs under the M-SIPS scheme. More such incentives along with simplification of tax structure are required.
Venture Capital (VC) Investment: In India, VC investment has more than doubled from US$ 600 million to US$ 1.4 billion between 2006 and 2012, principally driven by regulatory changes, including the elimination of tax on capital gains and the relaxation of rules preventing foreign investment. However, bulk of the VC investment has been in the consumer services sector8. Although VC firms might seem skeptical about their involvements in the electronics sector and might see these investments as high risk, low yield and unstable
8Global Venture Capital Insights and Trends 2014, Ernst and Young

23
returns, the government backing can help build trust in the sector. In Europe, the government supports VC in several ways. In Germany, the High-Tech Gründerfonds invests directly in emerging businesses which fund technology start-ups. The European Investment Fund, which is funded by member states of European Union, also plays a key role through investment in VC growth funds.
Setting Up of Clusters for Mobile Telecom: State of cluster develop-ment is considered as strength in the Indian case, among all other ways to promote innovation linkages9. It is essential to promote the concept of cluster development for mobile telecom in India, as the country has substantial prowess in the model of cluster development.
Finland’s “wireless valley” is an example of mobile telecom cluster which was a major component of “Mona” – a Finnish mobile services development program. The cluster comprised several related players, with terminal manufacturers (producing mobile phones) and network manufacturers (producing equipment needed for mobile networks) being a part of the core
industries. A cluster for mobile telecom on similar lines could be set up in India.
Development of Industrial Clusters for Medical Devices: Similarly, development of industrial clusters specifically for the medical devices industry would provide an impetus to the sector. In this regard, Gujarat Government has taken some initiatives. The State Government intends to develop a specialized pharmaceutical machinery cluster in the State. More such Central and the State Government initiatives would help improve Indian capabilities in the segment.
Guidance for Product Development in Medical Devices: US-FDA and European Medicines Agency give guidance to their national industry about product development. In a case study by Szymon Jarosławski and Gayatri Saberwal (2013), lack of guidance and dialogue regarding product specifications has come out as a major challenge for product innovations. The firms found it essential to engage with foreign regulatory agencies for their guidance, distinguishing their innovative products from other substandard ones, and also to access global
9Global Innovation Report 201310Szymon Jarosławski and Gayatri Saberwal (2013), Case studies of innovative medical device companies from India: barriers and enablers to development.

24
markets10. Such guidance needs to be provided by national regulatory agencies.
Greater and More Transparent Procurement of Innovative Medical Devices: Share of general government expenditure on health as percentage of total expenditure on health in India has risen steadily over the years and is expected to continue to rise. Given this trend, promotion of innovative technologies through government procurement is going to gain significance.
Szymon Jarosławski and Gayatri Saberwal (2013) suggested greater government procurement of innovative devices in the Indian case to encourage product innovations. The process of such procurement should also be made more transparent through the use of evidence-based decision making11. Evidence based pratice is the use of the best available incidence together with a clinician’s expertise and a patient’s value and preference in making health decision.Agencies in many European and Asian countries (like, Japan, Singapore and Malaysia) appraise technologies and advise on their financing from public sources.
Separate Regulatory Environment for Medical Devices: Under the
Drugs and Cosmetics Act, many medical devices have been currently notified as drugs. The difference between drugs and devices is stark. While drugs are based on chemistry and pharmacology, devices are based on engineering. While drug is regulated by licensing system, device is regulated by notified bodies in most countries. While in the case of a drug, the issue may be that of dosage, in the case of device, it may be of the size, especially in implantable devices. Moreover, the latter would be more risky than a drug, especially in later-phase trials. Industry and regulatory authorities have for long felt that provisions related to drugs can’t be applicable entirely for medical devices. Currently, not all medical devices have been classified as drugs. Those which are not considered as “drugs” only require import or manufacturing license and no quality check system exists for them. Hence, the Drugs and Cosmetics (Amendment) Bill, 2013 is an attempt towards specifying provisions specific to medical devices. For example, conditions have been specified under which medical devices shall be deemed to be misbranded, adulterated, and spurious. The Bill needs speedy implementation.
Stronger Linkages between Academia and Industry: In promot-ing partnerships between industry
11Ibid.

25
and academia, India can take inspiration from the Innovation law and Good law of Brazil. These laws allowed automatic use of fiscal benefits for investment in R&D, without any need for a formal request.
Innovation Law has been enacted to strengthen the university-industry research relationship, promoting the shared use of science and technology infrastructure by research institutions and firms, allowing direct government grants for innovation in firms, and stimulating the mobility of researchers within the S&T system. The Law permitted the creation of the Economic Subsidy Program, created in 2006 and coordinated by FINEP, which provides resources for R&D activities undertaken by industrial firms. Under this umbrella programme, four sub-programmes provide grants viz.: a) nationally competitive grants to firms of any size to develop new products and processes; b) grants to firms to hire researchers holding masters or PhD degrees; c) state-level competitive grants for innovation to small firms, to be implemented through partnerships of business federation, micro and small enterprises agency, etc.; and d) locally competitive milestone-based small grants to start-ups.
Good Law has been enacted in Brazil for authorizing the automatic use of fiscal benefits for companies
that invest in R&D. The significant incentives under this Law include: deductions from income tax and social contributions on net profits from expenses on R&D (between 60 percent and 100 percent); reductions in the tax on industrial products for purchasing machines and equipment for R&D (50 percent); economic subsidies for scholarships of researchers in companies; and exemption from the Contribution for Intervention in the Economic Domain (CIDE) carried to payments of patent deposits. The Law also included provisions for funding firms which hire employees with Masters Degrees and Ph.Ds.
Creation of a Fund for Promotion of Innovation in Analytical Instrument Category: A Fund can be created to support the premier science and technology related educational and research institutes in the country for the development of scientific instruments. Since, the amount of funding can be quite large in case of some scientific instruments, programs of joint funding requirements can be established with like-minded countries. Joint funding in analytical instruments can strengthen the scientific and technological capabilities of countries, leading to discovery and development of new knowledge, product, process or services, or improvement in existing ones.

26
Motivation can be taken from the PRODEX program, which was a joint funding of European Union. It began in 1986 with the objective of providing funds “for the industrial development of scientific instruments or experiments, proposed by Institutes or Universities in the Participating States that have been selected by European Space Agency (ESA) for one of its programs in the various fields of space research (science, microgravity, earth observation, etc).”
Creation of a Fund for Computer Hardware Component Production: In 2012-13, imported raw materials accounted for 78.73 percent of the total raw materials consumed by the computer hardware industry, as per the sample of companies taken from CMIE Prowess database. The ratio was higher in comparison to the ratio in other sub-categories of communication equipment and other electronics. Around 46.13 percent of operating expenses incurred by this industry category has been on account of raw materials, stores and spares, which is indicative of immense potential which exists for electronic component producers.
According to Prathap (2013), value added in the electronics industry of
India is merely 5-10 percent, with electronic giants like Samsung, Dell and Hewlett Packard importing nearly 90 percent of their electronic components12. There is a need to increase the value added production of electronics in India. Boosting production of electronic components and subassembly products gains greater significance in this context as substantial value addition happens at the components and subassembly stage of an electronics manufacturing process, contrary to other manufacturing activities. Many of the processes at these initial stages are capital and skill intensive. Hence, for lowering the import intensity in this category and increasing the domestic value added production, promotion of production of computer hardware components is crucial.
Inspiration can be taken from Electronics Industry Development Fund (EIDF) which was set up in China in 1986. It was first set up to support R&D and production of four key electronic products: integrated circuits, computers, software and program-controlled switching devices. Producers who were eligible to apply for support from the Fund had to meet the criteria of state-owned status and high local content of their products.
12Surendra Pratap (2013), Workers in the Supply Chain of Electronics Industry in India: The Case of Samsung.

27
The Fund later enlarged its support to include all major electronic products, components, and to include non-state owned firms13.
sTRATEGIEs FOR ATTRAcTING FDI FROM chINA
Development of Infrastructural Facilities: Infrastructure is an important element for attracting investments. This is especially important in the case of electronics industry because of large presence of global value chains which require swift movement of goods across nations. However, the current state of infrastructure and logistic services in India is grossly inadequate. According to the World Bank’s Logistics Performance Index, India is ranked 45th in 2012 which reflects the relatively poor state of infrastructure and logistics. Holding other factors constant, Kumar (2001) had shown that infrastructure availability contributes to the FDI attractiveness of a country, and also that export orientation of production of investing firms is significantly related to the infrastructure of the country14. Countries like Singapore and Hong Kong which rank highest on the logistics performance index have attracted large investments in their
electronics industries and established an important presence in the global value chain for electronics. Hence, infrastructure development will have a crucial role to play in attracting FDI in the industry.
Human Resource Development: Electronics companies require workforce with diverse knowledge and skills, and as the industry moves on a path with greater technological innovations, the worker profile needs greater education and training. In light of this, education standards in India become a major constraint, with only 9.8 percent of the labor force having tertiary education in 2010. As per a Report by NSDC on Human Resource and Skill Requirements in the Electronics and IT Hardware Industry, the incremental requirement in India for level-2 and level-3, which require technical knowledge and long drawn preparations in the industry will be the highest at 25-27 percent, and 49-50 percent, respectively, in 2022. In order to attract investment into this industry, workforce need to be trained as per the industry requirements.
One major problem which has emerged out of the studies concerning the education sector has been the
13Zhongxiu Zhao et al. / 33 - 51, Vol. 15, N0. 3, 200714Nagesh Kumar (2001), Infrastructure Availability, Foreign Direct Investment Inflows and Their Export-orientation: A Cross-Country Exploration.

28
presence of significant regulatory impediments like limitations on entry by foreign universities, and collaboration of Indian university with foreign players. These regulatory hurdles need to be addressed, especially since the role of private players in higher education has been growing at a rapid pace.
Favorable Duty Structure for Final Electronics Exports: The duty structure should be such that it should favor the production of final electronics goods over electronic components and subassembly products, and also to support the domestic production over imports. China had established an export processing policy wherein raw materials such as parts and components and other intermediate imported goods did not have any duty imposed, as long as they are used to produce export goods. However, in the Indian case, there exists no such enabling environment.
While there is no import duty on finished products, the Government has put tariff barriers on electronic components required to manufacture telecom hardware (Chattopadhyay, 2013)15. For example, while most
of the six final electronics products in the category of phones, fax machines, and routers do not face basic custom duty (average effective rate of duty: 18.1 percent), electronic integrated circuits: Other (Hs code: 85423900) faces basic customs duty of 7.5 percent (effective rate of duty: 21.6 percent). Simplifying the tax structure and aligning the taxes in favor of domestic manufacturing is essential. Preferential laws for usage of domestic products can also help incentivize investments.
Creating Greater Market for Analytical Instruments through R&D Promotion: India ranks fairly low in gross expenditure on R&D (ranked 44th) and only 33.9 percent of it is financed by business enterprises. China on the other hand has 71.7 percent of its R&D by business enterprises. R&D promotion will serve the dual purpose of creating robust innovation base in India and also of creating a greater market for analytical instruments in India.
Israel which ranks topmost in GERD had come up with novel ways to encourage R&D in the economy. India has already taken many steps to
15Utpal Chattopadhyay (2013), Making India a Telecom Manufacturing Hub: Emerging Issues and Challenges.

29
promote R&D in the country, but need to focus more on incentivizing the business enterprises and promoting collaborations among institutions.
In Israel, Life Sciences Fund was created to bring about growth in the biotechnology industry. The government had selected a private healthcare investment firm, Orbimed Partners Israel in an open tender to become the Fund’s general partner and its manager. The Fund was structured as a standard venture capital fund and capital commitments in a limited way was made by the Israeli Government as a minority partner. Another initiative by the Israeli Government was setting up of Tnufa which is a national pre-seed fund. It assists individual inventors and nascent start-up companies during the earliest stages of their projects. This includes evaluation of the technological and commercial potential of a project, filing for a patent, building a prototype, drafting a business plan and initial business development.
Apart from these, BIRD - Bi-national Industrial R&D Foundation for joint R&D between American and Israeli companies has also been set up. Under this, one Israeli and one
American company can jointly apply for BIRD support as long as they have combined capability and infrastructure to define, develop, manufacture, market, sell and support an innovative product based on industrial R&D. The BIRD Foundation offers conditional grants for joint development of projects on a risk-sharing basis. The Foundation funds up to 50 percent of each company’s R&D expenses associated with the joint project. Repayments are due only if commercial revenues are generated as a direct result of the project. Israel has also set up other bi-national funds like SIIRD (Singapore), CIIRDF (Canada), KORIL-RDF (Korea) and US-Israel Science & Technology Commission and Foundation.
Enlarging the Technical Pool Required for Medical Devices: The number of colleges offering biomedical engineering/ bio-engineering courses in India is not much. Biomedical engineering is an interdisciplinary subject in which engineering and technology is applied to medicine, surgery and healthcare of humans and other higher forms of life. It mainly involves bio-instrumentation, biomaterials, imaging, and biomedical devices. Such programs need to be promoted

30
in more number of institutions, so that the skill set required for manufacture of medical electronics is enhanced.
suM uP
In the context of India’s electronics industry, perhaps the quote “China is a threat, China is a customer, and China is an opportunity”16, suits perfectly well. China is a threat considering the burgeoning trade deficit in the electronic goods sector. India’s rising trade deficit with China makes it imperative to think on the lines of improving production facilities in the electronics category and also get access to latest technologies for production. China is a customer for it is a large economy with an enormous appetite. It has a large and growing demand for medical devices. China is an opportunity as FDI outflows from the country has been growing in the electronics industry. Foreign Direct Investment from China can propel electronics production in India and aid the ailing industry.
Several steps have been taken towards the improvement of electronics industry in recent times by the Government of India, including the seminal National Electronics Policy
2012, which envisages achieving a turnover of about US$ 400 billion by 2020. These policies should move in tandem with exploring opportunities presented by the electronics market in China, and attracting Chinese investors.
Going forward, rapid urbanization, rising personal disposable income, adoption of high-end technology devices, high technology obsole-scence and product innovation, competitive pricing of products, easy financing schemes, expansion of organized retail and distribution networks, and several government initiatives are going to be major drivers for the growth of the electronics industry in India. On the back of these, there exists huge opportunity for the domestic manufacturers.
Select strategies for development of domestic capabilities and encouragement of FDI like establishment of training centres for electronic components production; promoting venture capital investment; development of dedicated clusters on the lines of Finnish mobile telecom cluster; guidance for product development, and strengthening
16The World is Flat, Thomas Friedman.

31
of regulatory environment in the category of medical devices; development of stronger linkages between academia and industry; incentivizing innovative products through Government procurement as in the case of several countries
like Japan, Singapore, European countries and Malaysia; engagement in international co-operations on R&D and electronics production; and streamlining tax structure, can help create an enabling environment for the domestic manufacturing

32
1. GlOBAl scENARIO OF ElEcTRONIcs INDusTRy
The discovery of transistor effect was a watershed development in the history of electronics industry. From then on, electronics has entered every sphere, right from medicine to warfare. Currently, it is one of the most diversified and dynamic sectors, evolving at a rapid pace with continuous innovations. Most electronics manufacturing is extremely automated and the quality standards in the global circuit are demanding.
Electronics industry played a crucial role in the export-oriented industrialization of the East Asian countries. American, European and Japanese firms identified other firms in East Asia as suppliers, transferred skills and technologies to them, invested in them and finally bought them. This process of developing a supply base, tuned to serving advanced economy firms, has been referred to as “supplier-oriented industrial upgrading”17. These countries served as a low cost base for the advanced countries.
Although the success of electronics industry in China and East Asia has been phenomenal, countries like USA, Western Europe and Japan are still significantly important players at the international level. Several factors make these countries conducive for the development of the electronics industry. These countries rank high in terms of number of patent applications filed by residents at the national patent office (per billion PPP$ GDP), which can be used as a proxy for innovation. They also rank above in high-tech output (as percent of total manufactured output)18. Moreover, many important firms in the electronics industry landscape are from these countries and have significant market power.
GlOBAl VAluE ADDED PRODuc-TION
The global production (in terms of value added19) of electronics was estimated to have reached US$ 958 bn in 2012, up from
17Sturgeon, Timothy and Richard Lester. (2004), “The New Global Supply-base: New Challenges for Local Suppliers in East Asia.”18Global Innovation Index Report 2013.19Value added is the amount contributed by a country, firm, or other entity to the value of a good or service and excludes purchases of domestic and imported materials and inputs.

33
US$ 734 bn in 2005, thereby recording a CAGR of 3.9 percent during the period. Four electronic segments have been categorized by the National Science Foundation, USA namely, Testing, Measuring and Control Instrument; Communications; Semiconductors; and Computers and Office Machinery. Of these, the latter three segments are characterized by complex global value chains. Global production had declined in two years between 2005 and 2012 (Exhibit 3). The decline in 2009 can largely be attributed to the crisis of 2008-09, with production declining across all the four segments. Global production had dipped slightly in 2012 on account of decline in production of computers and office machinery, and semiconductors.
The growth in the global electronics industry has been led by the robust performance of Testing, Measuring and Control Instruments, which recorded a CAGR of 7.1 percent during 2005-2012 to touch US$ 340 bn, making it the largest contributor to the electronics industry among the aforementioned four segments in 2012. Performance of semiconductors was also relatively healthy with global value added increasing from US$ 246 bn to US$ 326 bn, registering a CAGR of 4.1 percent during this period.
Semiconductor production in 2012 had declined for all the top ten producers, other than China. Value added production of semiconductors in China surged by 14.8 percent in 2012, as compared to the previous year. In
Exhibit 3: Global Value Added in Electronics: A Segmented Trend (US$ bn)
Source: Derived from National Science Foundation, EXIM Bank Analysis

34
the same year, production of testing, measuring and control instrument had witnessed a major year-on-year (y-o-y) decline of 7 percent in the EU which is an important producer of these electronic products.
The USA remains the largest producer of electronics in terms of value added, accounting for a share of 29.2 percent of the world production in 2012, up from 27.0 percent in 2007. China consolidated its position as the second largest producer with its share nearly doubling from 15.3 percent in 2005 to 26.7 percent in 2012. On the contrary, share of Japan almost halved – from 14.1 percent to 8.6 percent during the same period. The major players remained more or less the same, save for the entry of Brazil
as one of the leading producers of electronics, displacing France among the top ten (Exhibit 4).
An interesting point to note is that the shares of all the top ten producers except the USA, China and Switzer-land declined in terms of value added during this period. Significant decline in share of Japan can be attributed to the country’s economic stagnation, financial difficulties of its domestic firms, and off-shoring of electronics production to low cost locations like China. India’s share over the same period increased marginally from 0.34 percent to 0.46 percent.
China was the largest producer of electronics in terms of value addition under three of the four segments identified by the National
Exhibit 4: Major Producers of Electronics in 2007 and 2012

35
Science Foundation, the USA. The country accounted for 33 percent of communications production, 46 percent of computer and office machinery production and 34 percent of semiconductors production at the global level. In the category of testing, measuring and control instruments, the United States was the largest producer, accounting
for 43 percent of the global value added in production in 2012 (Exhibit 5). These results reflect the fact that China is a dominant player in those segments of electronics production where global value chains are well established. In segments like testing, measuring, and control instruments, global integration is relatively low. Production in this segment is largely located in developed countries.
Exhibit 5: Category-wise Major Producers of Electronics

36
MAJOR PlAyERs IN ThE GlOBAl ElEcTRONIcs lANDscAPE
The United States, China, Japan and the European Union countries are important players in the global electronics industry. It is worthwhile to analyse the performance of electronics industry in these countries in recent years. The electronics industry of China holds special significance for the Indian industry from the point of view of trade and investment, and solicits an in-depth analysis. This has been undertaken in the later sections.
scenario in the united states
Notwithstanding its leadership in market size, the USA, which is an important producer of electronic products, has still not been able to achieve the pre-crisis level of electronics production in value terms. There has been significant moderations in y-o-y growth rates of value of computer and electronic production in the country during 2011 and 2012, after witnessing a fair growth in 2010 (although relatively higher growth rates in 2010 could be attributed partly to the base effect). The total value of electronic production in USA amounted to US$ 284.8 bn in 2012, recording a marginal y-o-y growth of 0.7 percent (Exhibit 6).
Electronic instrument was the largest category of electronics production in the USA and had recovered fairly well (after a major decline in production witnessed in 2009) to amount to US$ 128.1 bn in 201120. Production of computer and peripheral equipment, on the other hand, declined continuously over the four year period between 2008 and 2011, with the value of production in 2011 reducing to US$ 19.2 bn – one-third of the value in 2008. Production of semiconductor and other electronic components, which was the second largest category of electronics production, grew at a robust pace after 2009 to reach US$ 105.3 bn in 2011 (Exhibit 6).
Share of electronic instruments, and semiconductors and other electronic components – the two largest categories of electronics production in the USA, has expanded over the period 2008-2011. While the share of the former increased by 6 percentage points (from 37 percent to 43 percent), the share of the latter increased by 7 percentage points (from 29 percent to 36 percent). Share of computer and peripheral equipment on the other hand has contracted significantly from 17 percent to merely 6 percent of the total production, on the back of falling production under this segment (Exhibit 7).
20Disaggregated segment-wise data for production is available only till 2011

37
Exhibit 6: Production of Electronics in USA (Value in US$ bn)
According to the ‘US Industrial Outlook’ by Manufacturers Alliance for Productivity and Innovation (MAPI), production of computer and electronics products bounced back in 2013 with y-o-y growth in the industry being 4.4 percent. Such strong growth rates in 2013 have been attributed to declining prices and the quality
adjustment for processing speed. MAPI further expects the growth rates to be 6.8 percent and 7.2 percent in 2014 and 2015, respectively. Production of medical equipment is expected to improve on the back of aging population and the Affordable Care Act21. Aerospace production is also expected to improve and thus
21Affordable Care Act has brought about reforms in health insurance, thereby expanding coverage, holding insurance companies accountable and lowering health care costs. Expansion of coverage is expected to create more demand for medical products.

38
Exhi
bit 7
: Seg
men
t-wis
e Sh
are
in T
otal
Ele
ctro
nics
Pro
duct
ion
of U
SA
Sou
rce:
U.S
. Bur
eau
of L
abou
r Sta
tistic
s, E
XIM
Ban
k A
naly
sis

39
provide impetus to the electronics industry.
Scenario in Japan
Japan currently accounts for 15 percent of the total global electronics and IT markets22. It was also the seventh largest exporter in 2012. Japan had invested in the electronics industries of other Asian countries, largely to benefit from their cost advantage. However, in the year 2013, the share of asian countries like China, Thailand, Vietnam, Taiwan, Singapore and Malaysia in total FDI projects from Japan declined. On the other hand, an increase in share was witnessed by the countries like the United States, Germany and the UK. In 2013, the United States received the highest number of FDI projects from Japan, accounting for 16.82 percent of total FDI projects originating from Japan. India has also received substantial FDI into this industry from Japan, primarily in the consumer electronics segment.
The value of production of electronics in Japan amounted to an estimated US$ 114.2 bn in 2013, a significant fall from US$ 185.3 bn in 2008. Depreciation in the exchange rate
of Japanese yen vis-a-vis US dollar in 2013 benefitted the electronics industry. While the average exchange rate (bid rate) for 1 JPY (Vs. USD) in 2011 and 2012 was 0.01255 and 0.01254, respectively, it depreciated to 0.01026 in 201323. This was on account of a combination of fiscal policy, monetary policy and growth strategies, popularly referred to as Abenomics. However, the industry had to put up with falling prices, slump in the domestic demand and intensified competition in digital equipment. Consequently, fall in domestic production of electronics was substantial in 2013 (25 percent y-o-y decline), with production declining across all the segments (Exhibit 8).
Semiconductors and electronic components continued to remain the largest category of electronics production in 2013, with their share in total electronics production rising during 2008-2013 by 2 percentage points (from 23 percent to 25 percent) and 4 percentage points (from 17 percent to 21 percent), respectively. Share of display devices have also gone up during this period from 12 percent to 14 percent. On the
22Japan Electronics and Information Technology Industries Association23Bid rate is the ceiling, while ask rate is the floor in case of foreign exchange. Average yearly data sourced from OANDA.

40
other hand, shares of audio video (AV) equipment, communications equipment, and computer and information terminals have gone down during this period (Exhibit 9).
Scenario in the European Union
In 2012, the total production of computer, electronic and optical products in the European Union (EU-27) stood at US$ 224.4 billion.
Production witnessed a drastic decline in the period 2008-2012. The CAGR for production during this period was -6.7 percent, with maximum decline recorded in the categories of computers and peripheral equipment (-13.3 percent) and communication equipment (-11.8 percent). After the precipitous decline of 20.4 percent in the production in 2009, the electronics industry in the EU witnessed positive growth rates in production for the
Exhibit 8: Production of Electronics in Japan (Value in US$ bn)

41
Exhi
bit 9
: Seg
men
t-wis
e Sh
are
in T
otal
Ele
ctro
nics
Pro
duct
ion
of J
apan
Sou
rce:
Jap
an E
lect
roni
cs a
nd In
form
atio
n Te
chno
logy
Indu
strie
s A
ssoc
iatio
n, E
XIM
Ban
k A
naly
sis

42
Exhibit 10: Production of Electronics in European Union (Value in US$ bn)
next two years. However, production again declined by (-) 9.0 percent in 2012, as compared to the previous year. All categories of electronics production other than computers and peripheral equipment (which grew by 7.3 percent) witnessed y-o-y declines in 2012 (Exhibit 10).
Instruments and appliances for measuring, testing and navigation was the largest category of electronic
production in the European Union, accounting for 31 percent of the total electronics production in 2012, up from 24 percent in 2008. Share of many other major segments declined over this period. Communications equipment remained the second largest category of electronics production in 2012, but its share in the total production declined by 4 percentage points during 2008-2012 (Exhibit 11).

43
Exhi
bit 1
1: S
egm
ent-w
ise
Shar
e in
Tot
al E
lect
roni
cs P
rodu
ctio
n of
EU
Sou
rce:
Eur
osta
t, E
XIM
Ban
k A
naly
sis

44
Some of the important producers of electronics in the EU are Germany, the Netherlands, France, the United Kingdom and Czech Republic. Central and Eastern Europe countries like Hungary, Poland and Czech Republic have also emerged as the low cost producers and exporters of electronics. In the EU, Germany has the largest electronics industry, as well as the largest electronics market. Automotive electronics is the largest segment of the German electronics industry, with the segment accounting for 39.6 percent of the total semiconductor revenue in the country.
There is significant R&D investment in Germany and 40 percent of electronics and microtechnology products in the country are less than three years old24. Germany’s government is also committed towards the growth of the industry. It had launched the ‘High-Tech Strategy 2020’ in 2010 which aims to establish the country as a lead provider of science and technolgy (S&T) based solutions in the fields of climate, health, mobility, security and communication. Out of the eight key technologies defined under this Strategy, three are related to the electronics industry. These are microsystems technology, optics and micro and nanotechnology.
ElEcTRONIcs GlOBAl VAluE chAIN
There is high modularity in the electronics industry, as a result of which an electronic production cycle can be segregated into many different parts which can be finally assembled. Therefore, production can be distributed over different geographies.
According to Fredrick and Gereffi (2013), the electronics global value chain comprises raw materials and inputs to electronic components, electronic components, subassemblies, final product assembly for a variety of end market segments, and the ultimate buyers of final products (Exhibit 12). The value chain also includes several activities that add value to final products outside the manufacturing process related to research, product and process development, design, marketing and after-sales services. Some of these activities, like product development, circuitry and semiconductor design, and software integration are most profitable activities in the chain, but they are also least likely to be performed in offshore locations, and are largely controlled by original equipment manufacturers or leading component suppliers.
24Germany Trade & Invest

45
Exhibit 12: Global Value Chain in Electronics
For the purpose of analyzing trade, electronics industry can be classified under three broad heads, viz. electronic components, subassembly products and final goods. Electronic components are basic electronic elements with two or more connecting leads or metallic pads intended to be connected together, usually by
soldering to a printed circuit board, to create an electronic (integrated) circuit. Subassembly product can be defined as a unit assembled to be incorporated with other units into a final electronic product. Some of these goods are product specific like parts of telephone sets, telephones for cellular networks or for other data

46
(HS: 851770), while some are found in several electronics products (like displays and assembled PCBs). Final electronics products are those which are used directly by the end-user. Final electronics goods can be further classified on the basis of their end-use into 14 sub-categories, viz. phones, fax machines and routers; computer and storage devices; television and monitors; analytical instruments; cameras and projectors; medical devices; sound projection; sound and video recording devices; radios and alarm clocks; radio and TV transmission; radar and radio navigation equipment; office equipment; clocks and watches; and other electronic products (Annexure 1).
INTERNATIONAl TRADE
Global exports of electronic goods were valued at US$ 2149 billion in 2012, registering a y-o-y decline of 0.5 percent, after recording two continuous years of positive growth. Global exports are more than twice the global value added in the production of electronics goods. This may seem inflated essentially on account of the industry being characterized by a large presence of established global value chains, implying that the component and subassembly products are
moving either vertically or horizontally in the value chain. While vertical movement is for further value addition at the next stage of production, horizontal movement refers to re-exports, especially from countries like Hong Kong and Singapore which are core distribution and logistics hubs in Asian production and trade networks. Exports of both final electronic goods and electronic components declined marginally, but that of subassembly products recorded a slight increase of 0.9 percent in 2012. However, over the period 2008 to 2012, the industry’s trade performance fared relatively better with exports registering a CAGR of 2.7 percent (Exhibit 13).
China was the largest exporter and importer of electronic products in the world, accounting for 27.8 percent of the global electronic exports and 17.6 percent of the global electronic imports in 2012. The top five countries – China, Hong Kong, USA, Singapore and Germany, accounted for 59.6 percent of total electronic exports while the top ten accounted for 80.3 percent of total electronics exports in 2012. Except for Malaysia, all the countries which feature on the list of top ten exporters are also among the top ten importers of electronic products (Table 2). This peculiarity can be ascribed to the high presence

47
Exhibit 13: Global Trade in Electronics (Value in US$ bn)
of global value chains in this industry. This characteristic of electronic production also leads to enormous “double counting” of exports25.
In 2012, China was the largest exporter in all the three categories of electronics exports, viz. electronic components, subassembly products and final goods. In 2008, it was the largest exporter in the latter two categories. In the electronic components category, Singapore
was the topmost exporter in 2008, but its share declined thereafter, resulting in it being relegated to the third place in 2012. On the other hand, China’s exports of electronic components have recorded a CAGR of 14.6 percent during the period 2008-2012, thereby making it the biggest exporter in 2012. Integrated circuit (IC) production in China was considered a weak link, but several government incentives have provided a boost to IC production in the recent
25According to World Investment Report 2013, about 28% or US $ 5 trillion of the US $ 19 trillion in global gross exports in 2010 was double counted on account of global value chains.

48
years. Hence, electronic component production as well as exports from the country have grown significantly. Republic of Korea has also enlarged its share in the global electronic component exports from 6 percent in 2008 to 9 percent in 2012 (Exhibit 14).
China’s position as the largest importer of electronics is largely due to its overwhelming share in the global imports of components and subassembly products. China’s share in global electronic components imports amounted to 32 percent in 2012, while its share in global
subassembly products imports amounted to 18 percent during the same year. Its share in global imports in both these segments has expanded over the period 2008-2012. In the final electronic goods category, USA was the largest importer accounting for 23 percent share in global imports of these products in 2012. China’s share has grown in final electronic products from 5 percent in 2008 (rank 4) to 7 percent in 2012 (rank 2) (Exhibit 15).
Of the 14 categories of final electronic products, China was the topmost exporter in 11 categories. In the remainig 3 categories, viz., medical
Top Exporters Value share% Top Importers Value share%
China 598.4 27.8% China 416.3 17.6%
Hong Kong 234.3 10.9% USA 357.8 15.1%
USA 198.3 9.2% Hong Kong 250.6 10.6%
Singapore 132.9 6.2% Germany 117.1 4.9%
Germany 116.8 5.4% Japan 106.5 4.5%
Rep. of Korea 112.9 5.3% Singapore 100.5 4.2%
Japan 112.0 5.2% Mexico 76.8 3.2%
Mexico 76.1 3.5% Netherlands 71.2 3.0%
Malaysia 74.1 3.4% Rep. of Korea 68.2 2.9%
Netherlands 70.1 3.3% United Kingdom 62.6 2.6%
world 2149.2 100.0% world 2371.6 100.0%
Source: UNCOMTRADE, EXIM Bank Analysis
Table 2: Top Exporters & Importers of Electronic Products in 2012 (Value in US$ bn)

49
Exhibit 14Category-wise Top Exporters of Electronics
2008 2012
Source: UNCOMTRADE, EXIM Bank Analysis

50
Exhibit 15Category-wise Top Importers of Electronics
2008 2012
Source: UNCOMTRADE, EXIM Bank Analysis

51
devices, radio and TV transmission and analytical instruments, USA was the topmost exporter, accounting for 23.0 percent, 33.2 percent and 15.2 percent of global exports, respectively. USA was the topmost importer in 11 of these final electronics goods
categories (Table 3). This, perhaps is an outcome of the fact that the final assembling of the electronic products typically occurs in a relatively lower cost economy. This aspect of the global electronics production has been elucidated in the next section.
Category Top Exporters Exports share % Top Importers Imports share %
Analytical Instru-ments
world 87098.0 100.0% world 89079.6 100.0%
USA 13255.4 15.2% USA 14283.0 16.0 %
Germany 12065.1 13.9% China 12494.3 14.0%
China 11707.9 13.4% Germany 5742.8 6.4%
Japan 8566.7 9.8% Japan 4761.9 5.3%
United Kingdom 4049.9 4.6% Rep. of Korea 4257.7 4.8%
Rep. of Korea 3794.7 4.4% United Kingdom 4015.0 4.5%
Mexico 3522.3 4.0% Thailand 3265.2 3.7%
Hong Kong 3143.0 3.6% Canada 3203.7 3.6%
France 3116.7 3.6% Mexico 2997.4 3.4%
Malaysia 2976.2 3.4% Hong Kong 2953.6 3.3%
cameras & Projectors
world 48401.9 100.0% world 54776.4 100.0%
China 15042.9 31.1% China 9994.2 18.2%
Japan 9756.9 20.2% USA 9107.6 16.6%
Netherlands 3989.4 8.2% Hong Kong 5135.4 9.4%
Hong Kong 3769.5 7.8% Netherlands 3443.5 6.3%
Germany 2437.8 5.0% Germany 3408.7 6.2%
Thailand 2309.1 4.8% Japan 2285.8 4.2%
USA 2265.4 4.7% United Kingdom 1771.5 3.2%
Singapore 1141.8 2.4% Russian Federation 1683.5 3.1%
United Kingdom 772.0 1.6% Singapore 1445.1 2.6%
Rep. of Korea 760.6 1.6% France 1406.3 2.6%
Table 3: Category-wise Top Exporters and Importers of Final Electronic Products (Value in US$ mn)

52
Clocks & watches
world 2978.0 100.0% world 2767.3 100.0%
China 1527.8 51.3% Hong Kong 771.0 27.9%
Hong Kong 717.4 24.1% USA 461.4 16.7%
Germany 129.4 4.3% Japan 292.5 10.6%
France 85.8 2.9% Germany 200.0 7.2%
USA 79.6 2.7% France 114.4 4.1%
Switzerland 73.8 2.5% United Kingdom 101.0 3.6%
Netherlands 69.0 2.3% Spain 58.0 2.1%
Japan 49.1 1.6% Italy 57.8 2.1%
Singapore 43.7 1.5% China 53.6 1.9%
Belgium 34.3 1.2% Canada 52.6 1.9%
Computer & storage Devices
world 340939.7 100.0% world 345989.8 100.0%
China 163436.8 47.9% USA 85716.2 24.8%
USA 27784.8 8.1% China 34885.6 10.1%
Hong Kong 18716.9 5.5% Hong Kong 22526.9 6.5%
Mexico 18438.7 5.4% Germany 18705.6 5.4%
Netherlands 15543.6 4.6% Netherlands 17531.6 5.1%
Thailand 13711.6 4.0% Japan 16997.1 4.9%
Germany 11281.1 3.3% United Kingdom 14308.8 4.1%
Czech Rep. 10283.8 3.0% France 9954.0 2.9%
Malaysia 9733.7 2.9% Canada 9213.3 2.7%
Singapore 9411.7 2.8% Mexico 8338.8 2.4%
Medical Devices
world 93578.9 100.0% world 92680.6 100.0%
USA 21500.2 23.0% USA 18009.9 19.4%
Germany 15191.1 16.2% Germany 7085.4 7.6%
Netherlands 7171.2 7.7% China 6682.6 7.2%
Japan 4867.5 5.2% Japan 5442.3 5.9%
France 4668.6 5.0% Netherlands 5158.3 5.6%
China 4215.1 4.5% France 4853.6 5.2%
Switzerland 3499.8 3.7% Russian Federation 3872.1 4.2%
Singapore 3185.1 3.4% United Kingdom 3448.6 3.7%
Belgium 3112.6 3.3% Belgium 3140.2 3.4%
United Kingdom 3058.2 3.3% Italy 2512.3 2.7%

53
Office equipment
world 3147.0 100.0% world 3727.7 100.0%
China 1310.7 41.6% USA 701.6 18.8%
USA 358.6 11.4% Hong Kong 303.5 8.1%
Singapore 285.1 9.1% Germany 221.4 5.9%
Hong Kong 237.9 7.6% United Kingdom 203.4 5.5%
Germany 195.3 6.2% Singapore 184.3 4.9%
Malaysia 127.1 4.0% France 158.8 4.3%
Rep. of Korea 96.6 3.1% Canada 130.5 3.5%
Hungary 85.4 2.7% Japan 120.5 3.2%
United Kingdom 72.0 2.3% Australia 114.9 3.1%
Netherlands 44.3 1.4% Italy 111.1 3.0%
Others Electron-ics
world 17681.9 100.0% world 19613.6 100.0%
China 4552.0 25.7% USA 3333.6 17.0%
USA 1475.6 8.3% Germany 1667.4 8.5%
Rep. of Korea 1424.7 8.1% Malaysia 1481.7 7.6%
Philippines 1321.5 7.5% Rep. of Korea 1234.4 6.3%
Germany 1282.3 7.3% Turkey 1074.9 5.5%
Hong Kong 849.9 4.8% United Kingdom 787.9 4.0%
United Kingdom 784.6 4.4% Japan 767.2 3.9%
Malaysia 619.3 3.5% France 764.2 3.9%
Thailand 584.4 3.3% Hong Kong 694.9 3.5%
Netherlands 430.4 2.4% Thailand 589.2 3.0%
Phones, Fax Machines & Routers
world 284802.8 100.0% world 326666.3 100.0%
China 113591.0 39.9% USA 75539.7 23.1%
Hong Kong 26621.6 9.3% Hong Kong 30591.6 9.4%
USA 24739.8 8.7% Japan 21720.0 6.6%
Rep. of Korea 13749.2 4.8% Germany 15682.8 4.8%
Netherlands 11690.4 4.1% United Kingdom 14808.5 4.5%
Mexico 11064.4 3.9% Netherlands 13303.6 4.1%
Viet Nam 10815.8 3.8% France 9775.7 3.0%
Germany 10026.7 3.5% Mexico 9597.3 2.9%
Singapore 7753.4 2.7% Singapore 8956.1 2.7%
Hungary 6556.9 2.3% Canada 8232.1 2.5%

54
Radar & Radio Navigation Equipment
world 16215.8 100.0% world 17794.3 100.0%
China 2279.8 14.1% USA 4518.0 25.4%
Germany 2099.3 12.9% Germany 2438.8 13.7%
Japan 2055.7 12.7% Japan 1369.8 7.7%
USA 1989.5 12.3% United Kingdom 821.9 4.6%
Netherlands 812.6 5.0% Canada 761.5 4.3%
Mexico 720.5 4.4% China 744.4 4.2%
France 713.4 4.4% France 634.6 3.6%
United Kingdom 649.2 4.0% Singapore 532.4 3.0%
Hong Kong 507.9 3.1% Hong Kong 480.8 2.7%
Russian Federa-tion 454.8 2.8% Netherlands 474.5 2.7%
Radio & TV Transmis-sion
world 6166.7 100.0% world 8392.1 100.0%
USA 2048.0 33.2% USA 4192.1 50.0%
Canada 775.3 12.6% Canada 617.1 7.4%
United Kingdom 583.9 9.5% United Kingdom 402.9 4.8%
Malaysia 358.7 5.8% Australia 254.3 3.0%
Singapore 308.0 5.0% Mexico 205.8 2.5%
Hong Kong 260.2 4.2% Singapore 205.1 2.4%
Italy 207.9 3.4% Hong Kong 179.0 2.1%
Mexico 188.7 3.1% France 146.5 1.7%
France 161.1 2.6% Netherlands 144.3 1.7%
Germany 131.4 2.1% Saudi Arabia 116.8 1.4%
Radios & Alarm Clocks
world 16411.0 100.0% world 17811.8 100.0%
China 4781.6 29.1% USA 5249.6 29.5%
USA 1456.8 8.9% Germany 1410.2 7.9%
Malaysia 1429.4 8.7% Japan 1096.4 6.2%
Mexico 1129.5 6.9% Canada 1082.2 6.1%
Thailand 1091.5 6.7% Hong Kong 755.5 4.2%
Hong Kong 1009.2 6.1% United Kingdom 711.8 4.0%
Portugal 995.4 6.1% Belgium 664.2 3.7%
Germany 701.2 4.3% Russian Federation 546.3 3.1%
Czech Rep. 647.3 3.9% Mexico 522.6 2.9%
Belgium 478.0 2.9% France 487.7 2.7%

55
Sound & Video Recording Devices
world 42658.4 100.0% world 48079.9 100.0%
China 12998.8 30.5% Hong Kong 6320.8 13.1%
Hong Kong 4482.6 10.5% USA 6110.7 12.7%
Singapore 3787.0 8.9% China 4420.2 9.2%
USA 2616.5 6.1% Japan 2945.1 6.1%
Japan 2097.1 4.9% Germany 2487.8 5.2%
Malaysia 2088.2 4.9% Netherlands 2145.1 4.5%
Netherlands 1924.3 4.5% United Kingdom 1949.6 4.1%
Germany 1820.9 4.3% France 1669.2 3.5%
United Kingdom 1291.2 3.0% Thailand 1614.7 3.4%
Rep. of Korea 1188.3 2.8% India 1608.6 3.3%
Sound Projection
world 27164.8 100.0% world 27796.5 100.0%
China 11832.3 43.6% USA 5093.5 18.3%
Hong Kong 3319.0 12.2% Hong Kong 3165.6 11.4%
USA 2117.1 7.8% China 3083.1 11.1%
Mexico 1434.2 5.3% Germany 1803.0 6.5%
Germany 1388.1 5.1% Japan 1428.9 5.1%
Viet Nam 764.1 2.8% Mexico 1075.8 3.9%
Belgium 643.3 2.4% United Kingdom 966.4 3.5%
Malaysia 600.9 2.2% Canada 928.8 3.3%
United Kingdom 491.4 1.8% Rep. of Korea 789.5 2.8%
Netherlands 450.8 1.7% France 745.4 2.7%
Television & Monitors
world 93185.7 100.0% world 91970.8 100.0%
China 25435.1 27.3% USA 29375.5 31.9%
Mexico 17762.4 19.1% Germany 6960.8 7.6%
Slovakia 6552.9 7.0% United Kingdom 4206.2 4.6%
Poland 4882.0 5.2% Netherlands 3346.7 3.6%
USA 4556.5 4.9% Japan 3336.8 3.6%
Malaysia 3943.8 4.2% France 3268.0 3.6%
Hungary 3828.0 4.1% Canada 2939.3 3.2%
Rep. of Korea 3012.9 3.2% Mexico 2846.8 3.1%
Netherlands 2565.5 2.8% Italy 2182.7 2.4%
Czech Rep. 2549.7 2.7% Australia 1866.3 2.0%
Source: UNCOMTRADE, EXIM Bank Analysis

56
GlOBAl TRADE IN VAluE ADDED
As was indicated earlier, global data on trade, in sectors where prodcution value chains are spread across geographies, are largely overestimations. Problem of double counting in case of trade data has been attempted to be addressed by WTO through the Trade in Value Added Initiative (TiVA). This problem of double counting can be explained in terms of an example. Consider that country A exports US$ 10 million of goods to country B, which adds an additional value of US$ 10 million before finally exporting it to country C at a value of US$ 20 million. Although total global trade by conventional measures amount to US$ 30 million in this example, the actual value added is only US$ 20 million. Moreover, conventional trade statistics will also not show any trade relation between countries A and C, even though country A benefits extensively on account of demand from country C.
According to WTO, TiVA helps as it “measures flows related to the value that is added (labor compensation, taxes and profits) by a country in the production of any good or service that is exported.” In order to analyse trade in value added for the purpose of current analysis, the category of
‘Electrical and Optical Instrument’ has been considered. This includes office, accounting and computing machinery, electrical machinery and apparatus nec, radio, television and communication equipment, and medical, precision and optical instruments. This category broadly corresponds to the whole of electrical and electronics industry. In the absence of data at a more granular level, the analysis has been restricted to this level. The data released in May 2013 provides an estimate of trade in value added in 2009.
As per this data, the exports of value added in the electrical and optical instruments category in 2009 amounted to US$ 694.6 billion, with China being the topmost country with a share of 17.2 percent, followed by the United States (15.9 percent), Japan (9.4 percent), Germany (7.5 percent) and Korea (5.2 percent). India ranked 17th in terms of this measure, accounting for 1.2 percent of the global exports of value added in the electrical and optical instruments category. Many countries like Hong Kong, Singapore, Malaysia and Mexico do not feature in the top ten exporters list once the value added aspect of exports is taken into account, indicating relatively lesser production in value added terms in these countries than is reflected in actual trade data

57
Rank Exporting CountryExports of Value Added* (US$ mn)
share %
1 China 119731.6 17.2%
2 United States 110492.2 15.9%
3 Japan 65248.0 9.4%
4 Germany 52139.7 7.5%
5 Korea 36390.5 5.2%
6 Chinese Taipei 35534.2 5.1%
7 United Kingdom 21324.2 3.1%
8 Thailand 18660.6 2.7%
9 Italy 17097.0 2.5%
10 Switzerland 16860.9 2.4%
17 India 8537.1 1.2%
world 694553.7 100.0%
Table 4: Top Countries in Terms of ‘Exports of Value Added’ in Electrical and Optical Instruments, 2009
*Export of value added refers to Value-Added embodied in Foreign Final Domestic Demand. This shows how industries export value both through direct final exports and via indirect exports of intermediates through other countries to foreign final consumers (households, charities, government, and as investment). They reflect how industries (upstream in a value-chain) are connected to consumers in other countries, even where no direct trade relationship exists. The indicator illustrates therefore the full upstream impact of final demand in foreign markets to domestic output.
Source: OECD-WTO Trade in Value Added (TiVA) - May 2013, EXIM Bank Analysis

58
(Table 4). Interestingly, in the case of China, major destinations for exports in value added terms are also significantly different from those in gross exports terms, with fewer Asian economies featuring in the top ten list in the former case.
In terms of imports of value added in the electrical and optical instruments, the United States was the leading country, accounting for 19.5 percent of the total value added in 2009, followed by China (7.6 percent), Germany (6.0 percent), Japan (5.7 percent) and the United Kingdom (4.6 percent). As in the case of exports of value added, even in this list, some countries like Singapore, Mexico and Republic of Korea are absent which feature prominently in the top ten gross importers list. Moreover, unlike the top gross importers list, countries like Australia, Canada, France and Italy feature in the list of top importers in value added term (Table 5). India was the 14th largest importer accounting for 1.8 percent of total world imports of value added in the electrical and optical instruments category. Top source countries for imports of value added by China is somewhat similar to the gross import source countries. Here as well, many Asian countries
feature in the top import source list. Only aberration is Vietnam, which was the 9th largest import source in gross terms, but holds a place significantly lower in value added terms.
Trade balance in value added also varies significantly from the gross trade balance of countries in the electrical and optical instruments. To compare estimates of value-added trade with conventional estimates of gross trade, it is also useful to construct an indicator known as the VAX ratio (ratio of value-added exports to gross exports). The VAX ratio for a sector can be less than one if intermediate inputs from other sectors, or from imports, contribute more to the value of the sector’s exports than it contributes to the exports of other sectors. Conversely, the VAX ratio for a sector can be greater than one if the sector contributes more as an intermediate input to the value of exports of other sectors than those sectors contribute to the value of its own exports26.
In the category of electrical and optical instruments, countries like the Netherlands and Mexico had gross trade surplus in 2009, but had deficit in value added terms. Moreover,
26 Gerard Kelly and Gianni La Cava, Value-added Trade and the Australian Economy, Reserve Bank of Australia

59
countries like China, Japan, Republic of Korea, Germany, Singapore had substantially lower trade balance in value added terms, as compared to the gross trade balance. Other countries like the USA, Canada, Australia, France and the United Kingdom had lower trade deficit in value added terms than in gross terms (Exhibit 16). The VAX ratio for the Philippines and Thailand was greater than one, indicative of the fact that the electronics industry in these
countries is extensively used in other export-oriented sectors.
India’s trade deficit was much narrower in value added terms, amounting to merely 22.1 percent of the gross trade deficit. On the contrary, China’s trade surplus in value added terms was 47.6 percent of its gross trade surplus. The VAX ratio for electronics exports from India was 0.79 i.e., India’s exports in value added terms was 79.2 percent of its gross exports. India’s value
Table 5: Top Countries in Terms of ‘Imports of Value Added’ in Electrical and Optical Instrument, 2009
Rank Importing CountryImports of Value
Added* (US$ mn)share %
1 United States 135190.7 19.5%
2 China 52825.9 7.6%
3 Germany 41969.4 6.0%
4 Japan 39463.1 5.7%
5 United Kingdom 31734.0 4.6%
6 France 30591.2 4.4%
7 Canada 28566.4 4.1%
8 Mexico 23745.4 3.4%
9 Italy 21623.3 3.1%
10 Australia 17017.8 2.5%
14 India 12633.2 1.8%
world 694179.9 100.0%
*Import of value added refers to Foreign Value-Added embodied in Final Domestic Demand. This shows for a final good or service (purchased by households, government, non-profit institutions serving households, or as investment) where foreign value-added originates. It shows how industries abroad (upstream in a value-chain) are connected to consumers at home, even where no direct trade relationship exists.Source: OECD-WTO Trade in Value Added (TiVA) - May 2013, EXIM Bank Analysis

60
added imports of electronics was also significantly lower than its gross imports (amounting to 43 percent of the gross imports).
Since there is high presence of global value chain in the electronic industry owing to high modularity in the industry, it would be interesting to look at the stage of product which the top trading countries are producing. Ideally, a high share of subassembly products imports and component products imports, and a high share of final electronics exports, places the country higher in the value chain, and vise versa. Thus, intuitively, one can expect developed countries like the US, the EU countries and Japan to exhibit such a pattern and the
vice versa case would hold for the economies of the East Asian region.
Countries in the East Asian region like Singapore, Republic of Korea and Malaysia largely export electronic components. They also export relatively lower, yet significant amount of final electronic products. Interestingly, the East Asian countries also have a high share of electronic components in its imports.
On the other hand, quite expectedly, developed economies like the USA, Germany and the Netherlands have major share of final electronics in their exports, while their import basket have a large share of subassembly products. Mexico has the highest
Exhibit 16: Trade Balance in Value Added vs Gross Trade Balance for Countries in Electrical and Optical Instruments (2009; Value in US$ mn)

61
share of final electronics export of 76 percent, among the top ten exporting economies. On the import side, 70 percent of its imports comprises components and subassembly products.
Japan has a significantly high share of subassembly products imports, accounting for 59 percent of its total electronic imports. Although final electronics exports account for only 30 percent of the share of Japan’s total electronics export, the country is the fifth largest exporter of final electronics products, as against an overall rank of seventh in the total electronics exports (Exhibit 17). Hence, the high share of electronic components in Japan’s total exports should not obscure the picture of its overall standing in the global value chain.
The reason for the East Asian region having both high share in export and import of electronic components
has been provided by Gangnes and Assche (2010). Countries of Hong Kong, Singapore, Republic of Korea and Taiwan source relatively unsophisticated components from lower wage Asian economies and produce more sophisticated components. Higher component export in the case of Japan is also largely due to the production and export of sophisticated components. These sophisticated components are then supplied to China and other low wage Asian economies for final assembly27.
A similar argument can be applied to the Mexican case. It imports electronic subassembly products and components, and provides assembling services at low cost, thereby having a high share of final electronics goods in its exports. This also explains the earlier observation that while gross trade balance for the country in 2009 was high, in value added terms there was a trade deficit.
27Byron Gangnes and Ari Van Assche, 2010. “Global Production Networks in Electronics and Intra-Asian Trade.”

62
Exhibit 17: Share of Electronics Segments in Countries’ Exports and Imports (2009)
Source: UNCOMTRADE, EXIM Bank Analysis

63
2. scENARIO OF ElEcTRONIcs INDusTRy IN INDIA
The Indian Electronics and IT Hardware sector has 6 key segments, namely Consumer Electronics, Industrial Electronics, IT Hardware, Telecommunication Equipment, Electronic Components, and Strategic Electronics. The commencement of Indian electronics industry could be traced back to the sixties, when the Government took initiatives in the manufacturing of space and defence electronic products. This was followed by developments in consumer
electronics, mainly the manufacturing of transistor radios, black and white TVs, calculators and other audio products; later in 1980s, manufacture of colour televisions also started.
The 1980s, witnessed the golden period of the electronics sector when several noteworthy developments occurred including the advent of computers and telecom products and digital exchanges. However, the success of 1980s couldn’t be carried
Exhibit 18: Segments of Indian Electronics and IT Hardware Sector
Source: Indian Brand Equity Foundation

64
forward to the next decade. Following the software boom, since the middle of 1990s, India’s focus shifted to software related electronic products. Further, the steep fall in import tariffs in the country rendered the hardware sector open to international competition. This was aggravated by the elimination of custom duties in 1997 when India became signatory to the International Technology Agreement (ITA).
DEMAND-suPPly scENARIO
Demand for communication and broadcast equipment in India has been robust and the country has emerged as one of the fastest growing telecom markets in the world. The number of telecom connections in the country has increased from 429.72
million in 2008-09 to 898.02 million in 2012-1328. Consumption of computers has also grown in the Indian market and the household segment’s share in total consumption has grown remarkably. Within the business segment, growth in consumption of computer has been led by telecom, banking and financial sectors, education and households segments. Demand for consumer electronics is also growing as a result of rising disposable incomes, growing electrification of rural areas and relatively easier access to credit. Industrial electronics is also increasingly being used in industries like steel, textiles, cement, power, chemical and refineries.
From the supply perspective, India’s total production of electronics has recorded a CAGR of 14.4 percent
Exhibit 19: Timeline of Developments in the Indian Electronics Industry
Source: EXIM Bank Analysis
28Telecom Regulatory Authority of India

65
during the period 1995-96 to 2012-13. India’s total production of electronics recorded double digit y-o-y growths over the period 2008-09 to 2012-13, with growth in 2012-13 being a significant 23.9 percent (Exhibit 20). Overall, the value of production of Indian electronic industry amounted to Rs. 1,77,500 crore (approx. US$ 32 bn) in 2012-13. Production of electronic components has witnessed the largest increase over the period FY09 to FY13, registering a CAGR of 21.8 percent. However, the CAGR of production for this segment over the
longer period of FY96 to FY13 was merely 12.6 percent, which was lower than the average CAGR of production for the electronic industry as a whole.
Propelled by the vibrant demand from the telecommunications sector, production of communication and broadcast equipment recorded a CAGR of 19.9 percent during FY09 to FY13. Retaining its position as the largest category of electronics production in India, the share of communication and broadcast equipment has grown from 27 percent
Exhibit 20: Segment-wise Electronics Production (FY09-FY13, Value in Rs. Crore)

66
in FY09 to 31 percent in FY13. On the other hand, the shares of strategic electronics, consumer electronics and industrial electronics in India’s total electronics production receded during this period. Consumer electronics, which is the second largest category of electronics production in India, witnessed the maximum decline in share over the period under consideration (Exhibit 21).
Although there has been significant increase in the production of electronics, there remains large unmet demand which is currently being met by imports. Hence, production of electronics needs to increase at a considerable pace if this demand-supply gap is to be bridged.
EXTERNAl TRANsAcTIONs
Majority of the electronics production in India is intended for the domestic market. Export intensity of sales in electronics industry has grown in 2000s. However, there has been a marked decline in the export intensity in the post-2008-09 period. Export intensity of computer, peripherals and storage devices has been the highest among all other categories and had reached the level of 50.6 percent in 2005-06. However, since then, there was a consistent decline in the export intensity till 2010-11. Encouragingly, export intensity in 2011-12 bounced back and further improved in 2012-13 to 46.61 percent. The category of other electronic products had
Exhibit 21: Share of Segments in Total Electronics Production of India
Source: Ministry of Statistics and Programme Implementation, Department of Electronics and Information Technology, EXIM Bank Analysis

67
generally witnessed an increasing trend in export intensity during the period 2002-03 to 2008-09, peaking at 24.3 percent in 2008-09, but declining thereafter. As against the previous two categories, export intensity of consumer electronics and communication equipment has remained significantly low, at 3.1 percent and 2.3 percent, respectively in 2012-13 (Exhibit 22).
A particularly alarming trend has been observed in the indigenous raw materials consumed by the electronics industry. While indigenous sourcing has been the highest in the category of consumer electronics (65.34 percent in 2012-13), the share of indigenous raw materials in total raw materials consumed has fallen
over the years. It has also fallen sharply for the computers, peripherals and storage devices segment, where the indigenous raw material intensity in 2012-13 stood at 21.27 percent, down from the peak value of 49.16 percent in 2009-10 (Exhibit 23). Communication equipment category has also witnessed a precipitous decline with indigenous raw material intensity declining from a high of 84.58 percent in 2008-09 to 22.02 percent in 2012-13. This category has shown the maximum variance in indigenous raw material usage intensity during the period 2000-01 to 2011-12, of 182.6 (and so has the category of computers, peripherals and storage devices with a variance of 118.2). On the other hand, variance is low
Exhibit 22: Export Intensity of Sales in Electronics Industry (%)
Source: CMIE Prowess, EXIM Bank Analysis

68
for other electronics and consumer electronics category, where the trend has been more or less stable. This low sourcing from indigenous suppliers coincides with the relatively lower production growth (CAGR) of electronic components industry during the period FY96 to FY13. This builds a case for increased focus on the electronic components category.
TRADE
The growth in India’s exports and imports of electronic goods had peaked in 2010-11, but has witnessed moderation since then. The moderation has been starker in the case of exports, where y-o-y growth moderated from 52.1 percent
in 2010-11 to 7.4 percent in 2011-12 before recording successive years of negative growths of (-) 7 .8 percent and (-) 8.0 percent in 2012-13 and 2013-14, respectively. In absolute terms, exports of electronics declined from US$ 8.2 bn in 2010-11 to US$ 7.5 bn in 2013-14. As far as imports of electronics are concerned, during 2013-14, they were valued at US$ 30.97 billion, registering a y-o-y decline of (-) 1.5 percent (Exhibit 24).
India is a net importer of electronic goods and had a huge trade deficit of US$ 23.5 billion in 2013-14, primarily on account of huge imports from China whose share in India’s total trade deficit in electronic products stood at 66.7 percent in 2013-14.
Exhibit 23: Indigenous Raw Materials Consumed by the Industry as % of Total Raw Materials Consumed
Source: CMIE Prowess, EXIM Bank Analysis

69
Exports of subassembly products have shown the maximum vibrancy, recording a CAGR of 15.5 percent during the period FY09-FY14. Both final electronic goods and electronic components witnessed marginal declines in CAGR of (-) 0.7 percent each, during this period. Imports of electronic components, on the other hand have risen significantly during the six year period 2008-09 to 2013-14 recording a CAGR of 5.2 percent. Growth in imports of two of the three segments, viz. components and final goods, has significantly outpaced the growth in exports (Table 6).
Phones, fax machines and routers accounted for 62.2 percent of the total exports of final electronic goods from India in 2013-14. Sub-segments of final electronics goods where exports have witnessed robust double digit growths include: cameras and projectors, clocks and watches, radar and radio navigation equipment, radios and alarm clocks, and sound projection. In all these sub-segments and additionally in analytical instruments, growth in exports has surpassed growth in imports, although the value of import dwarfs the value of exports for most of these sub-segments.
Exhibit 24: Export and Import Trend of India’s Electronics Goods (Value in US$ bn)
Source: DGCI&S, EXIM Bank Analysis

70
Source: DGC&IS, EXIM Bank Analysis
Table 6: Category-wise Trade of India in Electronic Products (Value in US$ mn)
CategoryImports by India Exports from India
2008-09 2013-14 cAGR % 2008-09 2013-14 cAGR
%
Component 4689.1 6055.2 5.2% 1978.9 1910.5 -0.7%
Subassemblies 5597.1 6759.2 3.8% 861.2 1770.1 15.5%
Final Goods 13559.8 18160.2 6.0% 3962.8 3820.2 -0.7%
Analytical Instruments 810.4 927.9 2.7% 139.8 177.5 4.9%
Cameras and projectors 258.5 606.5 18.6% 2.8 55.3 81.5%
Clocks & Watches 4.8 2.3 -13.5% 2.1 5.6 22.1%
Computer and storage devices 2253.1 4372.7 14.2% 236.2 244.4 0.7%
Medical 607.2 798.3 5.6% 270.7 336.5 4.5%
Office equipment 15.5 43.8 23.1% 3.7 1.1 -21.6%
Others 107.4 146.2 6.4% 9.8 13.0 5.8%
Phones, Fax Machines, & Routers 6699.8 8272.4 4.3% 2519.1 2377.2 -1.2%
Radar & Radio Navigation Equipment 67.4 53.8 -4.4% 5.6 22.1 31.5%
Radio & TV Transmission 659.8 44.5 -41.7% 140.2 28.2 -27.5%
Radios & Alarm Clocks 121.5 167.3 6.6% 4.4 8.4 14.1%
Sound & Video Recording Devices 669.5 783.3 3.2% 340.0 197.5 -10.3%
Sound projection 270.0 441.8 10.4% 35.1 90.7 20.9%
Television & Monitors 1015.1 1499.4 8.1% 253.4 262.7 0.7%

71
The USA was the largest export destination for India’s electronic exports, accounting for 14 percent of the total exports in 2013-14, while China was, by far, the largest import source, with a share of 52 percent in India’s total electronic imports. China’s share in India’s electronics imports has grown stupendously from 39 percent in FY09 to 52 percent in FY14. On the other hand, share of
Singapore, the USA and South Korea in electronics imports of India has declined over this period (Exhibit 25).
The UAE has emerged as the second largest export destination for India, with its share in India’s total exports rising by 5 percentage points, from 7 percent in 2008-09 to 12 percent in 2013-14. China was also among the top ten export destinations in
Exhibit 25: Top Trading Partners for India in Electronics
Source: DGCI&S, Exim Bank Analysis

72
2013-14, with a share of 5 percent in total electronics exports of India. The country did not feature among the top ten export destinations in 2008-09 and its share has increased considerably over the period FY09 to FY14. On the other hand, share of Germany and Singapore in electronics exports of India witnessed significant declines over the period under consideration.
In the final electronic goods category, India exported significantly to the Middle East and African countries. The UAE was the largest export destination in this segment, accounting for 20 percent of India’s total exports in 2013-14, followed by the USA (13 percent), Singapore (5 percent), South Africa (4 percent) and Russia (3 percent). The Netherlands
was the largest export destination for India in the subassembly products category, accounting for 15 percent of total exports in 2013-14, followed by the USA (15 percent), China (9 percent), Israel (6 percent) and the UAE (5 percent). In the components category, the USA was the largest export destination accounting for 15 percent of total exports from India, followed by Germany (10 percent), the UK (8 percent), France (5 percent) and the Netherlands (5 percent) (Table 7).
India has significant exports to the USA and the European Union in the electronic components category. China is among the top ten export destinations in the categories of subassembly products and components (Table 7).
Final Goods Value share %
Subassem-bly products Value share
% component Value share %
world 3820.2 100% world 1770.1 100% world 1910.5 100%
UAE 746.3 20% Netherlands 271.5 15% USA 292.2 15%
USA 493.9 13% USA 261.0 15% Germany 200.3 10%
Singapore 190.3 5% China 164.4 9% UK 144.8 8%
S. Africa 140.0 4% Israel 98.8 6% France 100.2 5%
Russia 123.8 3% UAE 94.6 5% Netherlands 98.9 5%
Hong Kong 110.7 3% Singapore 69.1 4% China 85.1 4%
Nigeria 107.7 3% Indonesia 64.4 4% UAE 81.8 4%
Argentina 95.1 2% Germany 58.1 3% Hong Kong 61.3 3%
Egypt 93.6 2% Malaysia 44.6 3% Singapore 54.2 3%
Saudi Arabia 92.4 2% Hong Kong 37.5 2% Saudi Arabia 32.1 2%
Table 7: Top Destinations for Export of Electronics from India (Value in US$ mn; 2013-14)
Source: DGCI&S, EXIM Bank Analysis

73
In terms of imports, China was, by far, the largest import source for all the three categories of electronic goods imports by India, with its share in India’s imports as high as 58 percent, 45 percent and 39 percent in the final electronic goods, subassembly products and component categories, respectively (Table 8).
China accounts for 66.7 percent of India’s trade deficit with the world in electronic goods. China’s share in India’s trade deficit of electronic goods is largest in the category of final electronic goods. In 2013-14, China accounted for 73 percent of India’s trade deficit of final electronic goods. In the segments of subassembly products and components as
well, the share was as high as 58 percent and 55 percent, respectively (Exhibit 26).
Within final electronics category, India had negative trade balance with China in all sub-categories. Maximum trade deficits were in the categories of computer and storage devices, and phones, fax machines and routers. In 2008-09, India had trade surplus with China in the final electronic categories of analytical instruments, clocks and watches, medical devices, radar and radio navigation equipment, radio and TV transmission, and sound and video recording devices. However, by 2013-14, trade balance with China in all these categories turned negative (Table 9).
Final Goods Value share
%Subassem-
bly products Value share %
compo-nent Value share
%
world 18160.2 100% world 6759.2 100% world 6055.2 100%
China 10581.0 58% China 3039.4 45% China 2373.9 39%
USA 1021.9 6% Repulic of Korea 876.2 13% Singapore 478.1 8%
Viet Nam 1015.6 6% Malaysia 460.1 7% Germany 418.8 7%
Singapore 873.1 5% USA 365.8 5% Repulic of Korea 372.2 6%
Malaysia 870.0 5% Germany 265.0 4% Japan 320.6 5%
Thailand 451.4 2% Viet Nam 228.9 3% Taiwan 297.2 5%
Repulic of Korea 432.8 2% Singapore 162.7 2% Malaysia 257.1 4%
Hong Kong 418.4 2% Japan 162.4 2% USA 239.7 4%
Taiwan 371.1 2% Taiwan 108.9 2% France 149.1 2%
Germany 341.2 2% Finland 95.8 1% Hong Kong 115.1 2%
Table 8: Top Sources for Import of Electronics from India (Value in US$ mn; 2013-14)
Source: DGCI&S, EXIM Bank Analysis

74
Exhibit 26: China’s Share in India’s Trade Deficit of Electronic Goods (2013-14)
Category 2008-09 2012-13
Analytical Instruments 63.80 -92.41Cameras and projectors -113.5 -310.46Clocks & Watches 0.08 -1.34Computer and storage devices -642.41 -2751.86Medical devices 223.42 -76.01Office equipment -9.28 -27.43Others -37.00 -73.12Phones, Fax Machines, & Routers -1502.31 -5703.35Radar & Radio Navigation Equipment 3.54 -3.95Radio & TV Transmission 13.07 -4.04Radios & Alarm Clocks -83.67 -47.12Sound & Video Recording Devices 125.37 -378.82Sound projection -99.30 -289.94Television & Monitors -304.50 -729.01
Table 9: Balance of India’s Trade with China in Final Electronic Categories (Value in US$ mn)
Source: DGCI&S, EXIM Bank Analysis

75
ANAlysING ThE IMPAcT OF ITA-I
According to the Ministry of Commerce, Government of India, the Information Technology Agreement (ITA) is a plurilateral agreement within the WTO, which “aims to expand world trade in information technology products considering the key role this trade plays in development of information based industries, and the dynamic expansion of the world economy, while recognizing the goal of raising the standards of living and expanding the production of, and trade in goods.” Under the ITA, participants are required to completely eliminate duties on IT products covered by the Agreement. India joined the ITA on 25th March 1997 and had bound 217 lines in all (including expositions), of which 95 lines were to be reduced to zero by 2000, 4 lines in 2000, 2 lines in 2004 and 116 lines in 2005, making 2000 and 2005 watershed years for the industry.
An analysis of the export intensity of Indian firms (Exhibit 22) reveals that immediately after the first phase in 2000, a marked increase was witnessed in the export intensity during the period 2001-02. This coincided with sales of Indian electronics goods firms declining in 2001-02, which implies a significant displacement of domestic market for domestic producers and greater
dependence on exports revenues. However, eventually sales as a whole increased along with a continued increase in export intensity. So, while the immediate impact as seen by the domestic sales of these companies was certainly negative, the industry later thrived on account of high export intensity.
This analysis however doesn’t go for the large mass of unlisted and MSME companies who are engaged in electronics production, especially the lower end production of electronic components. Sourcing by large listed companies from indigenous firms, many of which are MSMEs, has never been able to reach the 1999-2000 level of 63.7 percent, post the removal of duties. Production of electronic components has also not been able to grow at the pace of other categories due to lack of forward linkages for MSMEs on account of easy availability of imports. Access to markets of other countries has also not sufficiently increased as tariff barriers have now been replaced by non-tariff barriers. Technical barriers to trade (TBT) have been increasingly used by the WTO members, annulling the impact of reduction in tariffs (Exhibit 27). Nearly 82 percent of these TBT notifications have been issued by the ITA signatories, suggesting that there has been increased protectionism by

76
way of domestic regulations, thereby creating market access barriers29.
As a result of the ITA, it has been noted that only a few firms dominate the industry, and the level of competition has been declining in the industry. There are huge barriers that exist for new entrants into the manufacturing space with the level of competition having significantly declined. This is reflected in the rise in Herfindahl-Hirschman Index (HHI) index, which is a measure of the size of firms in relation to the industry and an indicator of the amount of competition among them. Thus, for instance, in the case of “computers and its peripherals of all types”, HHI increased from 0.1 in 1999-2000 to 0.24 in 2010-11. Similarly, private automatic branch exchange, audio equipment and television receiver categories also witnessed increase in concentration.
Some other categories like capacitor and medical equipment witnessed marginal increase in concentration. On the other hand, transmission equipment and telephone instruments category have gradually become less concentrated over time (Table 10).
FOREIGN DIREcT INVEsTMENT
In India, 100 percent FDI is permitted in the electronics hardware manufacturing sector under the automatic route. A large number of empirical studies on the role of FDI in host countries suggest that FDI is an important source of capital, complements domestic private investment, is usually associated with new job opportunities and enhancement of technology transfer, and boosts overall economic growth in host countries30.
Exhibit 27: Cumulative TBT notifications under the ITA HS lines
29Murali Kallummal (2012), Process of Trade Liberalization under the Information Technology Agreement (ITA): The Indian Experience.30Abdur Chowdhury and George Mavrotas (2005), FDI and Growth: A Causal Relationship.

77
cat
egor
ies
1999
-00
2000
-01
2001
-02
2002
-03
2003
-04
2004
-05
2005
-06
2006
-07
2007
-08
2008
-09
2009
-10
2010
-11
Com
pute
rs a
nd It
s P
erip
hera
l of a
ll Ty
pes
0.10
0.08
0.08
0.09
0.12
0.15
0.16
0.18
0.19
0.22
0.17
0.24
Tran
smis
sion
E
quip
men
t0.
100.
050.
050.
020.
010.
000.
000.
000.
010.
080.
060.
06
Priv
ate
Aut
omat
ic
Bra
nch
Exc
hang
e0.
210.
240.
280.
280.
370.
400.
450.
430.
440.
350.
330.
37
Tele
phon
e in
stru
men
ts0.
070.
080.
070.
060.
210.
200.
150.
310.
090.
020.
010.
01
Tele
visi
on P
ictu
re
Tube
s0.
180.
180.
20.
250.
230.
260.
220.
220.
210.
270.
260.
18
Med
ical
Equ
ipm
ents
0.01
0.01
0.01
0.01
0.04
0.03
0.03
0.02
0.02
0.01
0.01
0.02
Pro
cess
Con
trol
Equ
ipm
ent
0.10
0.09
0.08
0.06
0.07
0.07
0.09
0.08
0.08
0.08
0.09
0.10
Cap
acito
r0.
020.
020.
030.
030.
030.
030.
030.
030.
060.
020.
050.
05P
rinte
d C
ircui
t B
oard
s0.
050.
060.
050.
060.
050.
050.
060.
060.
070.
010.
030.
02
Aud
io E
quip
men
t0.
340.
340.
340.
390.
430.
450.
630.
680.
680.
710.
770.
81Te
levi
sion
Rec
eive
rs
(incl
. TV
Spa
res
&
Kits
)0.
110.
110.
100.
100.
090.
070.
170.
180.
210.
180.
210.
17
Tabl
e 10
: HH
I Ind
ex fo
r Cat
egor
ies
of E
lect
roni
cs In
dust
ry
Sou
rce:
CM
IE

78
For the purpose of the following analysis, data from Financial Times’ FDI Markets has been used. The definition of electronics in FDI Markets database is wider than the one defined by the Department of Industrial Policy and Promotion (DIPP), which excludes categories like computer hardware, scientific instruments, etc31. According to FDI Markets database, FDI in the electronics industry of India peaked in 2006 to US$ 11.77 billion32 after which it showed a fluctuating trend. But since 2010, it has witnessed a constant declining trend. In 2013,
the industry received FDI worth only US$ 1.6 billion (Exhibit 28). This data may not match with the DIPP data on FDI inflows into India. The primary reason would be that many such investments are routed through tax haven economies e.g. Mauritius.
United States had the largest number of FDI projects in the country, accounting for 35 percent of total FDI projects during the period January 2003-March 2014, followed by Japan (12 percent), Germany (7 percent), UK (5 percent) and South Korea
Exhibit 28: FDI in India’s Electronics Industry (US$ mn)
31Electronics data from FDI markets includes capital expenditure in the sub-sectors of: all other electrical equipment & components, Audio & video equipment, Communication & en-ergy wires & cables, Communications equipment, Computer & peripheral equipment, Elec-trical equipment, Electromedical and Electrotherapeutic Apparatus, Household appliances, Magnetic & optical media, Measuring & control instruments, Medical equipment & supplies, Navigational instruments, Other (Consumer Electronics), Power transmission equipment, Semiconductor machinery, Semiconductors & other electronic components, Ventilation, heat-ing, air conditioning, and commercial refrigeration equipment manufacturing32In terms of capital expenditure

79
Source Country No. of Projects share %
United States 378 35%
Japan 128 12%
Germany 73 7%
UK 57 5%
South Korea 55 5%
Taiwan 45 4%
Switzerland 43 4%
Finland 42 4%
China 39 4%
France 32 3%Total 1070 100%
Table 11: Major Source Countries for FDI into Indian Electronics Industry
Source: FDI Markets, EXIM Bank Analysis
Destination state No. of Projects share %
Karnataka 236 22%
Maharashtra 181 17%
Tamil Nadu 128 12%
Delhi 86 8%
Andhra Pradesh 66 6%
Haryana 46 4%
Uttar Pradesh 34 3%
Gujarat 32 3%
West Bengal 18 2%
Uttarakhand 12 1%
Total 1070 100%
Table 12: Destination States for FDI into Indian Electronics Industry
Source: FDI Markets, EXIM Bank Analysis

80
(5 percent). China accounted for 4 percent of total FDI projects (Table 11). Within India, Karnataka was the state which got the maximum number of FDI projects, accounting for 22 percent of the total, followed by Maharashtra (17 percent), Tamil Nadu (12 percent) and Delhi (8 percent). While capital expenditure in Karnataka and Maharashtra has started to decline in the recent years, Andhra Pradesh has emerged as a major hub for foreign capital in the electronics sector (Table 12).
NATIONAl ElEcTRONIcs POlIcy 2012
The National Electronics Policy, 2012, was formed with the vision to “create a globally competitive electronics design and manufacturing industry to meet the country’s needs and serve the international market”. The major initiatives under this Policy, considered to be a key government initiative for the electronic goods sector, include:
• Modified SIPS (M-SIPS): Under this scheme, subsidy is provided for investment in all verticals of the Electronic System Design and Manufacturing (ESDM) sector. Capital expenditure subsidy of 25 percent is available in non-SEZ and 20 percent within SEZ for 10 years. CVD/excise duty on
capital equipment is reimbursed for non-SEZ units. Central taxes and duties are reimbursed for 10 years in select high-tech units.
• Electronics Manufacturing Clusters (EMC): Under this, assistance for brownfield and greenfield EMCs are available. Assistance for the former is to a maximum extent of 75 percent of project cost subject to ceiling of Rs. 50 crore, while in the case of the latter, assistance is 50 percent of the project cost, with a ceiling of Rs. 50 crore for the first 100 acres.
• Preferential market access: This provides for preference to notified domestically manufactured electronic goods for government procurement and also for procurement of Managed Service Providers which have security implications.
• Semiconductor Wafer Fab: Government has approved two semiconductor wafer fabrication units. Various incentives are provided under this including various forms of viability gap funding.
• Electronic Development Fund: A fund is proposed to be setup, which comprises “daughter funds” of varying size which in turn will

81
provide risk capital to company developing new technology in specified areas. These are intended to promote innovation, R&D, product commercialization, etc. in ESDM, nano-electronics and IT sector. The corpus of a daughter fund may be determined by market requirements and the capacity of its fund manager.
• Mandating safety standards: Fifteen electronic products were notified under safety standards on October 3, 2012. BIS accredited labs are supposed to test the goods.
• Human Resource Development: To develop requisite human resource for the electronics industry, Electronics and Telecom Sector Skill Council has been set up. Special Manpower Development Programme-Phase III has been started in the area of very large scale integration design and related software.
lOOKING AhEAD
In the context of India’s electronics industry, perhaps the quote “China is a threat, China is a customer, and China is an opportunity”33, suits perfectly well. China is a threat considering
the burgeoning trade deficit in the electronic goods sector. India’s rising trade deficit with China makes it imperative to think on the lines of improving production facilities in the electronics category and also getting access to latest technologies for production. China is a customer as it is a large economy with an enormous appetite. It has a large and growing demand for medical devices. China is an opportunity as FDI outflows from the country has been growing in the electronics industry. Foreign Direct Investment from China can propel electronics production in India and aid the ailing industry. Through FDI production capabilities in categories of computer and storage devices, phones, fax machines and routers, and television and monitors need to be developed, as these are the largest categories of trade deficit with respect to China. FDI also needs to be attracted in the electronic components category where India received only 1.5 percent of the total FDI outflows from China during Jan 2003 – Mar 2014. To boost the production capabilities in the electronics category, electronic components category needs to be developed as share of indigenous raw materials has substantially declined in the electronics industry. Absence of local fab has made reliance on imports crucial.
33The World is Flat, Thomas Friedman

82
3. SCENARIO OF ELECTRONICS INDUSTRY IN CHINA
China’s performance in the electronics industry has been nothing short of phenomenal. The development of electronic capabilities in the country has, to a large extent, been possible due to the articulation and successful achievement of goals in its Five Year Plans, which are the planning mechanism adopted in the country. The first two Plan periods had seen significant amount of the erstwhile Soviet assistance in China’s electronics foray. The first two Plans were also largely focused on the electronics industry from the point of view of the country’s national defence. Later Five Year Plans have seen a constant changing of the structure of the industry into a more sophisticated one and geared towards developing scientific acumen in the field. Many national projects like Golden Projects, 909 semiconductor manufacturing projects, air traffic control system project, etc have been instrumental in driving the electronics
industry towards higher growth path. China’s success in achieving the goals of its five year plans is reflected in the country becoming the largest producer in the world in many electronic categories and also achieving a net exporter status by the Eighth Five Year Plan.
FDI has played an important role in jumpstarting China’s ICT production and exports. In 1990s, preferential treatments were offered in China, which enabled transnational capital to integrate China’s expanding manufacturing capacities into transnational production networks. Many FDI-driven export oriented manufacturing clusters emerged in China, making it the leading ICT manufacturing powerhouse in the world. A qualitative breakthrough came about in the Eleventh Five Year Plan, with domestic firms outperforming the foreign-invested firms on many scales (Hong, 2001)34.
34Yu Hong (2008), Class formation in high-tech information and communications as an aspect of China’s reintegration into transnational capitalism.

83
Box 1: Development of China’s Electronics Industry over the Plan Periods
FIRST FYP (1953-1957)v Dual objectives of modernisation and strengthening of radio and communication aspect
of national defence, and setting up of automatic telephone switchboard factories for civilian networks.
v Erstwhile Soviet Union provided assistance in nine electronics projects.v Establishment of scientific research and development institutions.
SECOND FYP (1958-1965)v Goals related to three defence oriented areas: Development and construction of
electronic equipment for a ballistic missile capability; supporting atomic energy and aviation development; and establishing of factories for electronic measuring instruments and specialized atomic energy and aviation development.
THIRD & FOURTH FYP (1966-1975)v Cultural Revolution deflected economic development.
FIFTH & SIXTH FYP (1976-1985)v End of Cultural Revolution.v Production structures were revised and military factories began producing both military
and civilian products.v Ministry of Electronics Industry was established.v Lead group focussed on electronics industry was formed within the State Council.
SEVENTH FYP (1986-1990)v Production levels accelerated. Exports started to become important. Total exports for
electronics products during this plan period were US$ 10.5 billion.v For the first time, projects to tackle key science and technology problems were
included.v There were five large projects in electronics during this period: very large scale
integration technology, computer systems, computer software, communication technology and electronic materials.
v Development of significant number of indigenous devices and systems.EIGHTH FYP (1991-1995)
v Value of electronic imports surpassed the value of electronics exports in this period, for the first time. While exports amounted to US$ 16.5 billion, imports were slightly lower at US$ 16.1 billion in 1995.
v China became the largest producer of products like colour televisions, radios, audio cassette recorders and some other electronic components. Mass production of goods like large digital switchers began locally.
v Structure also witnessed increased sophistication with the presence of large electronic companies.
v Enhancement of scientific research and technology development programs resulted in significant progress with some mainframe and microcomputers beginning to achieve international technology levels.

84
v Three Golden Projects were launched35.v Government allocated US$ 110 million to support 17 major electronic projects launched
to tackle key problems in science and technology. These projects involved participation of 8000 scientists and technicians.
NINTH FYP (1996-2000)v Goal was to place China among top five electronics producing nations of the world.v Worked to restructure the electronics industry into a more complex, multi-tiered modern
supply chain, with large companies playing the leading role.v Emphasis in this period was on integrated circuits, electronic device and components,
computers and software, and telecommunication and information technology. v Golden Projects were still underway.
TENTH FYP (2001-2005)v Telecom industry created a network close to accepted international standards. Scale
of fixed telephone and cellular network became second largest in the world.v China became the top manufacturer of program controlled switchboards, cellular
phones, display devices and monitors.v Ministry of Information Industry placed fostering China’s IT manufacturing and software
industry, and promoting dissemination of national economic and scientific information on top priority.
v By 2005, China had 3 to 7 million fibre optic broadband users and similar number of digital subscriber line users. Mobile phone subscribers reached 390 million in November 2005. Cable TV broadband users reached 120 million in 2005.
ELEVENTH FYP (2006-2010)v Proclaimed to “strengthen the nation by electronics and telecommunication”.v For the first time, growth of domestic firms outpaced that of foreign invested counterparts
in terms of profit, value added, investment, export and R&D input. v Policy priority to quality rather than quantity of FDI. Focus was more on inducing large
MNCs to transfer their technology and high value added processing facilities and R&D capacities to China.
v China became the world’s largest export processing centre of consumer electronic products. It also made backward linkages to manufacture more intermediate goods.
Source: Pecht, M. (2006), China’s Electronics Industry, EXIM Bank Analysis
35Golden Projects were implemented to modernize China’s IT infrastructure and support local industries. These include Golden Bridge Project for nationwide public economic information processing network, Golden Card Project for electronic monetary and modern payment system, Golden Customs Project for foreign trade information source network, Golden Taxation Project for electronic taxation system, Golden Enterprises Project for industrial production and circulation information network, Golden Intellec-tual Project for education and research network, Golden Agriculture Project for agricultural management and services network, and the Golden Policy Project for national economic micro-policymaking support system. The first three were launched in the Eighth FYP period.

85
DEMAND-SUPPLY SCENARIO
From the demand perspective, growing urbanization in China has propelled the demand for electronics in the country. Government programs like “Home Appliance to the Countryside” and “Home Appliance Replacement” program have increased consumption of consumer electronics. “Home Appliances to the Countryside” program provided a 13 percent subsidy to rural consumers on purchase of home appliances. The “Household Appliance Replacement” program also offered subsidies for new purchases. However, several of such subsidies ended in May 2013.
Going forward, rising disposable incomes and shorter replacement cycles is expected to continue to drive the growth in the consumption of consumer electronics in China. Industrial electronics has also witnessed significant growth in demand, largely from the segments of medical electronics and factory automation. China was the second largest spender and influencer on the design of industrial electronics chips in 2013, after the United States36.
From the supply perspective, during the period 2008-2012, China’s
production in most categories of electronic goods has grown, in some cases quite exceptionally. Microcomputer equipment category witnessed the maximum CAGR of 26.9 percent during the period 2008-2012. All consumer electronics products witnessed positive CAGR during the five year period. Products witnessing a decline in production over the period included program-controlled switchboards, telephone sets, fax machines, display and cameras (Table 13).
Integrated Circuit (IC) production was considered the weakest link in China’s electronics production. It remained so in spite of heavy investment from the government to set up IC foundries through the 908 and 909 projects37. IC production is capital and technology intensive and domestic producers in China are mostly medium sized or small enterprises with limited funds and technology. According to China Semiconductor Industry Association, China has also faced challenges in boosting this sector on account of outdated equipment. Steps have been taken since 2000, which have reaped benefits for this segment.
‘Policies for Encouraging the Development of Software and IC
36IHS Technology37908 and 909 projects led to the formation of Huajing Electronic Group and Huahong Electronic Group, both of which are among the top IC manufacturers in China.

86
industry’ was enacted in 2000 which provided wide range of measures to support the IC industry. This included subsidized loans, direct investment by the government, tax reduction and development funds. Significant increase in output and sales was witnessed in the 2000-2005 period as a result of these preferential policies. Although, tax reduction provided under this was finally withdrawn in 2005 on account of claims by the US government of the policy being against WTO rules, other incentives remained effective. More recently, the Circular on ‘Certain Policies for Further Encouragement to the Development of Software Industry and Integrated Circuit Industry’, released in 2011, further encourages to develop production of IC. Under this, companies get preferential tax treatment and for companies that invest more than RMB 8 billion, or manufacture ICs with line-width less than 0.25 mu, more favourable tax concessions are granted. As a result, the production of IC has continued to witness a consistent increase.
TRADE
China is a net exporter of electronic goods with exports in 2012 amounting to US$ 598.4 bn and imports amounting to US$ 416.3 bn. Although, exports
and imports of electronic goods from China have been rising since 2009, growth rates have moderated in 2011 and 2012 (Exhibit 29).
In terms of segmentation, China’s exports of components have increased substantially over the five year period 2008-2012 (CAGR: 14.6 percent). As far as imports are concerned, final products have witnessed the maximum increase during the five year period 2008-2012, of 10.8 percent. CAGR of import of final electronic goods and subassembly products during the period 2008-2012 outpaced the CAGR of export in these categories (Table 14). In terms of values, final goods were the largest category of electronic exports from China in 2012 (US$ 372.7 billion), while components were the largest category of electronic imports by the country (US$ 261.9 billion).
Although imports of final electronic goods by China has recorded a robust CAGR of 10.8 percent during 2008-2012, many sub-categories within the segment of final electronics goods witnessed negative CAGRs. Import of cameras and projectors and medical devices by China has witnessed significant growth during this period (Table 14).

87
Item
2008
2009
2010
2011
2012
CA
GR
%
Hom
e R
efrig
erat
ors
(10
000
sets
)47
56.9
5930
.572
95.7
8699
.284
27.0
15.4
Air
Con
ditio
ners
(1
0 00
0 se
ts)
8230
.980
78.3
1088
7.5
1391
2.5
1328
1.1
12.7
Hom
e W
ashi
ng M
achi
nes
(10
000
sets
)42
31.2
4973
.662
47.7
6715
.967
91.1
12.6
Vacu
um C
lean
ers
(10
000
sets
)63
67.5
6534
.776
69.4
8400
.581
45.1
6.3
Pro
gram
-con
trolle
d S
witc
hboa
rds
(10
000
lines
)45
8441
52.5
3138
.030
34.0
2829
.1-1
1.4
Tele
phon
e S
ets
(10
000
units
)16
688
1453
7.7
1676
9.7
1401
7.9
1277
3.8
-6.5
Fax
Mac
hine
s (1
0 00
0 un
its)
769.
9168
3.5
181.
126
8.1
263.
6-2
3.5
Mob
ile T
elep
hone
s (1
0 00
0 se
ts)
5596
468
193.
499
827.
411
3257
.711
8154
.620
.5
Mic
ro C
ompu
ter E
quip
men
t (1
0 00
0 un
its)
1366
718
215.
124
584.
532
036.
935
411.
026
.9
Not
eboo
k P
Cs
(10
000
units
)10
859
1500
9.5
1858
4.1
2389
7.4
2528
9.4
23.5
Dis
play
(1
0 00
0 un
its)
1336
513
123.
513
927.
012
680.
512
713.
3-1
.2
Inte
grat
ed C
ircui
ts
(100
mill
ion
units
)41
7.14
414.
465
2.5
719.
582
3.3
18.5
Col
our T
elev
isio
n S
ets
(10
000
sets
)90
33.1
9898
.811
830.
012
231.
312
823.
59.
2
Hi-F
i Ste
reo
Com
pone
nt P
laye
rs
(10
000
sets
)72
97.2
9879
.011
613.
815
491.
813
145.
615
.9
Cam
eras
(1
0 00
0 se
ts)
8900
8457
.893
27.7
8241
.388
01.7
-0.3
Xer
ox &
Hec
togr
aph
Prin
ting
Equ
ip.
(10
000
sets
)51
7.7
421.
053
4.8
655.
168
7.3
7.3
Tabl
e 13
: Chi
na’s
Pro
duct
ion
of S
elec
t Ele
ctro
nic
Goo
ds
Sou
rce:
Nat
iona
l Bur
eau
of S
tatis
tics
of C
hina
, EX
IM B
ank
Ana
lysi
s

88
Even though imports of cameras and projectors by China have grown significantly, faster than the exports of these products, the country still remains a net exporter of these products. On the other hand, in the medical devices category, China is a net importer. Local companies in China largely manufacture low-end medical devices while mid and high-end devices are imported into the country. China’s aging population, growing urbanization and emergence of lifestyle related diseases is expected to drive the demand for medical devices in the country. China is also a net importer of analytical instruments, and radio and TV
transmission equipments. Focus on scientific research and development has led to large imports of analytical instruments.
Japan was the largest import source for China in 2008 with a share of 14 percent in China’s total imports, but its share declined to 10 percent in 2012. Republic of Korea emerged as the topmost import source for China with its share in the country’s total imports rising from 13 percent in 2008 to 16 percent in 2012. Hong Kong remained the largest export destination in 2012, with its share in China’s total exports expanding from 24 percent in 2008 to 29 percent in 2012 (Exhibit 29).
Exhibit 29: Export and Import Trend of China’s Electronics Goods (Value in US$ bn)

89
CategoryImports by China Exports from China
2008 2012 CAGR % 2008 2012 CAGR
%
Electronic Component 180512.5 261921.4 9.8% 74090.1 127805.0 14.6%
Subassembly Products 51351.0 74031.5 9.6% 81004.7 97842.9 4.8%
Final Electronic Goods 53274.5 80371.5 10.8% 274447.9 372749.5 8.0%
Analytical Instruments 7502.4 12494.3 13.6% 7013.1 11707.9 13.7%
Cameras and projectors 3214.9 9994.2 32.8% 13011.0 15042.9 3.7%
Clocks & Watches 66.7 53.6 -5.3% 753.5 1527.8 19.3%
Computer and storage devices 22847.3 34885.6 11.2% 105652.4 163436.8 11.5%
Medical devices 3074.7 6682.6 21.4% 2617.0 4215.1 12.7%
Office equipment 182.0 91.1 -15.9% 1348.6 1310.7 -0.7%
Others 859.3 473.9 -13.8% 12093.3 4552.0 -21.7%
Phones, Fax Machines, & Routers 5315.9 6667.5 5.8% 65310.5 113591.0 14.8%
Radar & Radio Navigation Equipment 585.4 744.4 6.2% 2104.3 2279.8 2.0%
Radio & TV Transmission 82.3 42.6 -15.2% 29.6 37.7 6.2%
Radios & Alarm Clocks 254.5 216.8 -3.9% 4450.3 4781.6 1.8%
Sound & Video Recording Devices 5870.2 4420.2 -6.8% 19612.4 12998.8 -9.8%
Sound projection 1863.0 3083.1 13.4% 7411.5 11832.3 12.4%
Television & Monitors 1556.0 521.5 -23.9% 33040.2 25435.1 -6.3%
Table 14: Category-wise Trade of China in Electronic Products (Value in US$ mn)
Source: UNCOMTRADE, EXIM Bank Analysis

90
Exhibit 30: Top Trading Partners for China in Electronics
Source: UNCOMTRADE, EXIM Bank Analysis
In the final electronic goods category, the USA was the largest export destination in 2012, accounting for 27 percent of China’s total exports of final electronics goods. In the category of subassembly products and electronic component, Hong Kong was, by far, the largest export destination with shares of 38 percent and 46 percent, respectively. India was among the top ten export destinations in all
the categories (Table 15). As far as imports are concerned, Thailand was the largest import source for China in the category of final electronic goods, accounting for 11 percent of China’s total imports of these products in 2012. In the categories of subassembly products and electronic component, Republic of Korea was the largest import source with shares of 18 percent in each of the two categories (Table 16).

91
Fina
l Goo
dsVa
lue
Shar
e %
Suba
ssem
bly
prod
ucts
Valu
eSh
are
%C
ompo
nent
Valu
eSh
are
%W
orld
3727
49.5
100%
Wor
ld97
842.
910
0%W
orld
1278
05.0
100%
US
A99
304.
927
%H
ong
Kon
g37
106.
338
%H
ong
Kon
g59
256.
246
%
Hon
g K
ong
7565
2.6
20%
US
A10
732.
711
%U
SA
8117
.26%
The
Net
herla
nds
2422
4.9
6%R
ep. o
f Kor
ea93
47.1
10%
Rep
. of K
orea
7072
.66%
Japa
n24
146.
36%
Japa
n62
88.1
6%Ja
pan
6510
.55%
Rep
. of K
orea
1451
1.0
4%M
exic
o26
00.5
3%S
inga
pore
5114
.04%
Ger
man
y14
040.
74%
Bra
zil
2480
.53%
The
Net
her-
land
s50
68.6
4%
UK
8822
.22%
Thai
land
2347
.12%
Ger
man
y42
82.4
3%
Indi
a65
60.1
2%In
dia
2083
.92%
Mal
aysi
a30
02.2
2%
Sin
gapo
re60
93.3
2%H
unga
ry19
20.9
2%In
dia
1642
.21%
Aus
tralia
5977
.22%
Viet
Nam
1751
.02%
Viet
Nam
1321
.11%
Tabl
e 15
: Top
Des
tinat
ions
for E
xpor
t of E
lect
roni
cs fr
om C
hina
(Val
ue in
US$
mn;
201
2)
Sou
rce:
UN
CO
MTR
AD
E, E
XIM
Ban
k A
naly
sis

92
Fina
l Goo
dsVa
lue
Shar
e %
Suba
ssem
bly
prod
ucts
Valu
eSh
are
%C
ompo
nent
Valu
eSh
are
%
Wor
ld80
371.
510
0%W
orld
7403
1.5
100%
Wor
ld26
1921
.410
0%
Thai
land
8865
.611
%R
ep. o
f Kor
ea13
334.
618
%R
ep. o
f Kor
ea47
678.
818
%
Japa
n71
92.6
9%Ja
pan
6492
.99%
Mal
aysi
a30
741.
812
%
US
A66
02.8
8%Th
aila
nd28
77.1
4%Ja
pan
2852
6.9
11%
Rep
. of K
orea
5548
.87%
Phi
lippi
nes
2755
.04%
US
A88
12.1
3%
Mal
aysi
a47
43.4
6%U
SA
2003
.03%
Phi
lippi
nes
7260
.33%
Ger
man
y46
68.4
6%G
erm
any
1737
.82%
Sin
gapo
re63
67.6
2%
Phi
lippi
nes
4276
.45%
Mal
aysi
a13
01.8
2%C
osta
Ric
a51
29.1
2%
Viet
Nam
2292
.93%
Sin
gapo
re10
05.6
1%G
erm
any
4198
.62%
Sin
gapo
re22
20.8
3%Vi
et N
am87
6.4
1%Th
aila
nd39
14.5
1%
UK
778.
11%
Hon
g K
ong
821.
71%
Viet
Nam
3383
.71%
Tabl
e 16
: Top
Sou
rces
for I
mpo
rt o
f Ele
ctro
nics
by
Chi
na (V
alue
in U
S$ m
n; 2
012)
Sou
rce:
UN
CO
MTR
AD
E, E
XIM
Ban
k A
naly
sis

93
FOREIGN DIRECT INVESTMENT
Inward FDI
Import-substituting and export-driven foreign direct investment played an important role in China’s electronics industry. While the former was largely a result of the sheer potential of China’s market, the latter was ensured through regulations such as setting of export ratios for FDI (Zhongxiu Zhao et al, 2007)38. The mandatory export ratio was usually 70 percent for export-oriented FDI.
According to G Long (2005), China’s FDI policies with regard to exports can be categorized into: compulsory, neutral and voluntary. Compulsory policies required that “FDI shall be able to keep a balance of exchanges, or make sure the proportion of their domestically made products in the total number of products reach a certain benchmark, or a certain percentage of their products must be exported.” Interested foreign investors had to meet this condition before receiving approval for investing in the country. However, after China’s membership in the WTO, most of the compulsory requirements were eliminated in order to satisfy the TRIMs agreement. Neutral policies were aimed at creating
favourable scenario for exports to compete internationally. Tariff and VAT exemptions were provided on input imports for re-exports. Voluntary policies of the government included incentives like 50 percent cut in corporate income tax for enterprises with 70 percent of export products39.
In 2012, FDI in China’s electronics industry had reduced significantly to US$ 3179.1 million, the lowest level achieved since 2003 (Exhibit 32). According to Global Investment Trends Monitor, UNCTAD, FDI flows to China as a whole witnessed a strong downward pressure in 2012 on account of rising production costs and weakening export markets. Although, capital investments surged to US$ 4,434.4 million in 2013, it still remained lower than the pre-2012 period (Exhibit 31).
The United States was the largest source country for capital investments in China in terms of number of projects during January 2003 to March 2014, accounting for 33 percent of all FDI projects in the electronics industry of the country, followed by Japan (18 percent), Taiwan (12 percent), Germany (6 percent) and the UK (4 percent) (Table 17). Domestic market growth potential and proximity to
38Zhongxiu Zhao et. al. (2007), China’s Industrial Policy in Relation to Electronics Manufacturing.39Guoqiang Long (2005), China’s Policies on FDI: Review and Evaulation.

94
markets or customers have been cited as the major motives for investment by companies investing in China’s electronics industry, indicative of market seeking investment motive. Citing of domestic market growth potential has been especially higher than the average in the case of projects by the US-based investing
companies. Lower costs have also been cited as a major motive in 14.2 percent of FDI projects, largely by investing companies of the United States and Japan (Exhibit 32). However, China’s labour cost has been increasing and the relevance of this criterion is limited under the present scenario.
Exhibit 31: Foreign Direct Investment in China’s Electronics Industry
Source country No. of projects Share %The United States 717 33%Japan 389 18%Taiwan 269 12%Germany 133 6%The UK 94 4%South Korea 89 4%Switzerland 63 3%France 52 2%Sweden 42 2%Hong Kong 40 2%Total 2,202 100%
Source: FDI Markets, EXIM Bank Analysis
Table 17: Top Countries Investing in China’s Electronics Industry (Jan 2003-March 2014)

95
Hon Hai Precision Industry, a Taiwan based company is the top investing company in China’s electronics industry, with 40 of its 83 global projects in China. The latest project by the company in China was in October 2013 in the electronics component category. The top ten investing companies account for 10.4 percent of all FDI projects in China’s electronics industry during Jan 2003 – Mar 2014 period (Table 18).
Outward FDI
FDI outflows from China in the electronics industry during the first half of 2000s was low, but has increased substantially in the recent past. In 2012, capital investments
made by Chinese companies in the overseas electronics industry were US$ 2563 million. This came down to a lower, yet sizeable level of US$ 1928.8 million in 2013 (Exhibit 33). China’s outward FDI flows with reference to electronics industry have largely been in the Asia Pacific region, which accounted for 42.7 percent of the country’s capital investments in overseas electronic industries during Jan 2003 - Mar 2014.
India was the largest recipient of capital investments in the electronics industry from China, accounting for 15.0 percent of total value of outward FDI projects from China in the electronics industry during January
Exhibit 32: Major FDI Motives Cited by Companies Investing in China’s ElectronicsIndustry (January ‘03 - March ‘14)
Other Motives
* Percentages add up to more than 100% as one company can cite multiple motives for the same project

96
Company Name Source country
No of projects
Global projects
% of global projects
Hon Hai Precision Industry Taiwan 40 83 48.1
Siemens Germany 30 400 7.5
Samsung South Korea 27 340 7.9
Intel United States 26 164 15.8
Panasonic (Matsushita) Japan 21 165 12.7
General Electric (GE) United States 20 481 4.1
Hitachi Japan 18 203 8.8
Hewlett-Packard (HP) United States 17 304 5.5
Nokia Finland 16 179 8.9
Royal Philips Electronics Netherlands 15 131 11.4
Table 18: Top Ten Companies Investing in China’s Electronics Industry (Jan 2003-Mar 2014)
Source: FDI Markets, Exim Bank Analysis
Exhibit 33: FDI Outflows from China in Electronics Industry

97
2003 to March 2014, followed by Bulgaria (8.4 percent), Malaysia (7.1 percent), Singapore (6.7 percent) and Turkey (6.0 percent) (Table 19).
Market seeking investments were the topmost motives cited by Chinese companies while investing in the electronics industry overseas. Regulations or business climate, infrastructure and logistics, and investment promotion authority or government support also appeared as important motives for FDI projects, indicative of the importance of government’s role in the destination countries. Regulation or business climate was a prominent motive for
Chinese companies investing in the electronics industry in Singapore.
Foreign Direct Investment can be of two types - horizontal or vertical. While in the horizontal FDI, a foreign firm produces the same type of commodity as produced by it at home; in vertical FDI, production process is fragmented and intermediate products produced in the country go for further processing at a different location. Alon et al. (2012) in a recent article have supported the theory that China’s investment abroad is largely horizontal in nature and designed to serve the Chinese local market (import platform investment)40.
Destination Country Capital Investment*(US$ mn)
Share %
India 2,294.9 15.0%Bulgaria 1,286.4 8.4%Malaysia 1,079.8 7.1%Singapore 1,015.8 6.7%Turkey 908.9 6.0%United States 805.5 5.3%UK 531.5 3.5%Romania 531.0 3.5%Australia 427.6 2.8%Japan 394.5 2.6%Total 15,271.1 100.0%
Table 19: Top Destinations for China’s FDI Projects in Electronics Industry (Jan 2003-March 2014)
*This data may not match with the DIPP data on FDI inflows into India. The primary reason would be that many such investments are routed through tax haven economies e.g. Mauritius.Source: FDI Markets, EXIM Bank Analysis
40Alon et al (2012), Macroeconomic Prospects for China’s Outward FDI.

98
4. NEUTRALIZING INDIA’S TRADE DEFICIT
ATTRACTING MARKET SEEKING INVESTMENT
Dunning (1993) prov ides four different motivations for outward FDI from a country: a) market seeking investment for accessing new markets, b) resource seeking investment for specific resources found in the foreign territories, c) strategic asset seeking investment for expanding the set of firm’s proprietary resources, and d) efficiency seeking investment with a view to reduce cost. During January
2003 and March 2014, 62.1 percent of all companies citing reasons for investment in Indian electronics sector cited domestic market growth potential as a motive, making market seeking as the major reason for investment in the electronics category. Proximity to markets or customers was also cited as a reason by 17.9 percent of investors, strengthening the argument of market seeking investment in India. Apart from this, resource seeking investment is a major determinant, with 24.1 percent of companies stating skilled workforce
Exhibit 34: Major FDI Motives Cited by Companies Investing in Indian ElectronicsProjects (January ‘03 - March ‘14)
* Percentages add up to more than 100% as one company can cite multiple motives for the same project.

99
availability as a motive. Efficiency seeking investment also emerges as a motive, as 7.9 percent of investors also cited lower costs as a determinant (Exhibit 34).
Since market seeking investment emerges as a major motive for FDI inflows in the electronics category of India, it will be useful to analyze the import pattern and find areas where India can look forward to attract FDI from the world. Since nearly 63 percent of India’s trade deficit is in the final electronic goods category, the present analysis is restricted to only final electronics goods import. Product categories at HS- 6 digit level have been identified where imports are significant (greater than US$ 10 million) and have been witnessing strong growth rates (greater than 5 percent). FDI in these segments can be attracted.
Communication Equipment
Phones, fax machines and routers is the largest sub-category of import in India, accounting for 46 percent of total final electronics goods import by India in 2013-14 (Exhibit 35). During January 2003 to March 2014, communications equipment sub-sector accounted for 20 percent of all FDI
projects in the electronics industry of India. Market seeking investment was largely responsible for the inflows as 72.1 percent of companies attributed domestic market growth potential as a major reason, as against 62.1 percent of industry-wide companies (Exhibit 36 and 34). Project volume had peaked in 2006 with 38 FDI projects coming into this segment, with total capital expenditure of US$ 1,415.1 million in the year. Significant inflows in this segment can be attributed to the telecom sector in India which has grown by leaps and bounds. The consumer base has increased considerably over the years. Telecom connections (wire-line and wireless) increased from 429.72 min 2008-09 to 898.02 mn in 2012-1341. There still lies immense potential for the communication electronics in India, as there is scope for telecom penetration in the rural areas. Increasing electrification will lead to spread of telecom in the rural areas. The significance of growing telecom sector in India has been acknowledged worldwide and massive FDI has flown into the category, making it one of the top FDI recipients in India42. On account of positive outlook for growth in telecommunications, further investment in the category can be attracted.
41Telecom Regulatory Authority of India42DIPP

100
Exhi
bit 3
5: S
hare
of S
egm
ents
in In
dia’
s Im
port
s of
Fin
al E
lect
roni
c G
oods
Sou
rce:
DG
CI&
S, E
XIM
Ban
k A
naly
sis

101
Although phones, fax machines and routers are the largest category of import by India, its share has declined from 49 percent in 2008-09 to 46 percent in 2013-14 in the total final electronics goods imports by India (Exhibit 35). Imports witnessed a CAGR of 4.3 percent during the period 2008-09 to 2013-14. Threshold CAGR and imports assumed for the purpose of current analysis has been witnessed only in the category of telephones for cellular networks mobile telephones or for other wireless (HS code: 851712) (Table 20).
Computer and Peripheral Equipment
Computers and storage devices sub-category’s share has increased from 17 percent in 2008-09 to 24 percent in 2013-14 in the total final electronics products imports (Exhibit 35). It is also the second largest category of imports under the final electronics category by India. The USA and Japan are major source countries for FDI inflows into this category, accounting for 36 percent and 22 percent of FDI projects in the period Jan 2003- March
Exhibit 36: Major FDI Motives Cited by Companies Investing in IndianCommunication Equipments Industry (January 2003 - March 2014)
Source: FDI Markets, EXIM Bank Analysis
* Percentages add up to more than 100% as one company can cite multiple motives for the same project

102
2014, respectively. Although market seeking is cited as a major investment motive in this category as well (57.7 percent), FDI in this area seems to be also driven significantly by efficiency seeking motives. In comparison to the industry wide average, motive of domestic market growth potential has been stated by fewer players in this sub-category. Efficiency seeking motives are more pronounced in this category as 19.2 percent of companies have attributed lower costs as a motive, as compared to the industry-wide average of 7.9 percent (Exhibit 37). Cost of production in China has risen significantly from 2006 onwards and the gap between the cost of production in China and India has widened (Exhibit 38). Hence, there is
scope for attracting investments on account of efficiency seeking motives from China.
India’s imports of computer and storage devices witnessed a significant upsurge with imports witnessing a CAGR of 14.2 percent during 2008-09 and 2013-14. Portable digital computers <10kg (HS code: 847130) was the largest item of import within this category from India, and was also the one to have recorded the highest CAGR of 27.4 percent during the five year period. Three products at HS-6 digit level have been identified where investment can be attracted on account of market seeking motives (Table 21).
HS Code Description 2008-09 2013-14 CAGR %
851711 Line telephone sets with cordless handsets 39.1 40.5 0.7
851712 Telephones for cellular networks mobile telephones or for other wireless 3718.8 5926.6 9.8
851718 Telephone sets excluding line telephone sets with cordless handsets 35.6 39.9 2.3
851761 Base stations of apparatus for the transmis-sion or reception of voice 471.2 52.3 -35.6
851762 Machines for the reception, conversion and transmission or regeneration 1642.6 1445.7 -2.5
851769 Apparatus for the transmission or reception of voice, images or other data 792.6 767.4 -0.6
Total 6699.8 8272.4 4.3Note: Categories in bold are those where market seeking investment can be attracted (Value of Imports greater than US$ 10 million and CAGR greater than 5%)
Table 20: Import of Phones, Fax Machines and Routers by India (Value in US$ mn)
Source: DGCI&S, EXIM Bank Analysis

103
Exhibit 37: Major FDI Motives Cited by Companies Investing in Indian Computer and Peripheral Equipments Industry (January 2003 - March 2014)
Exhibit 38: Average Hourly Wages Across Countries (in US$ per hour)
Source: Accenture
* Percentages add up to more than 100% as one company can cite multiple motives for the same project

104
Television and Monitors
India also imports large value of products in the television and monitors category. The share of this category in India’s final electronics imports remained the same at 8 percent in both 2008-09 and 2013-14 (Exhibit 35). With 146 million television households in 2011, India was the third largest television market after the the U.S. and China43. The subscriber base for the television industry has been growing rapidly with growing per capita income and increasing television
penetration. As on 30th June 2013, reported registered DTH subscribers of 6 private service providers amounted to 58.89 million, a robust 21.5 percent y-o-y increase44. Television penetration is expected to increase further over the years. Digitization of cable television is likely to improve profitability of players in the category. These factors are expected to further boost the demand in this category.
Import of television and monitors registered a healthy CAGR of 8.1 percent during the period 2008-09
HS Codes Description 2008-09 2013-14 CAGR %
847130 Portable digital computers <10kg 686.51 2301.98 27.4
847141 Non-portable digital edp machines with processor & i/o 78.75 67.15 -3.1
847149 Digital data processing systems, nes 87.31 62.57 -6.4
847150 Digital processing units not sold as complete systems 414.62 775.67 13.3
847160 Computer input/outputs, with/with-out storage 108.31 164.43 8.7
847170 Computer data storage units 733.03 858.01 3.2
847180 Units of automatic data processing equipment nes 71.29 79.44 2.2
847190 Automatic data processing equipment nes 73.31 63.49 -2.8
Total 2253.13 4372.74 14.2Note: Categories in bold are those where market seeking investment can be attracted (Value of Imports greater than US$ 10 million and CAGR greater than 5%)
Table 21: Import of Computer and Storage Devices by India (Value in US$ mn)
Source: DGCI&S, EXIM Bank Analysis
43IBEF44TRAI

105
to 2013-14, with maximum CAGR being witnessed in monitors, not incorporating television reception apparatus (HS code: 852859) of 25.4 percent. Reception apparatus for television, color (HS code: 852872) was the largest category of import by India under this category and also witnessed robust growth over the period under consideration. Four products at HS-6 digit level have been identified where investment can be attracted on account of market seeking motives (Table 22).
Analytical Instruments
Share of analytical instruments in India’s total final electronics imports declined from 6 percent in 2008-09 to 5 percent in 2013-14 (Exhibit 35). Imports registered a CAGR of 2.7 percent during the same period. Government and academia are important buyers in this category. Government provides ample incentives for import of such instruments. Research institutions and public funded research institutions in
HS Codes Description 2008-09 2013-14 CAGR
%
852841Cathode-ray tube monitors of a kind solely or principally used in an automatic data-processing machine of heading 8471
31.49 3.06 -37.3
852849 Cathode-ray tube monitors, not incorporat-ing television reception apparatus 9.24 4.58 -13.1
852851 Monitors of a kind solely or principally used in an automatic data-processing system 444.13 395.19 -2.3
852859 Monitors, not incorporating television reception apparatus excluding with 18.62 57.68 25.4
852871 Reception apparatus for television, whether or not incorporating radio 244.79 464.04 13.6
852872Reception apparatus for television, colour, whether or not incorporating radio
252.55 542.31 16.5
852873 Reception apparatus for television, black and white or other monochrome 14.27 32.58 18.0
Total 1015.09 1499.44 8.1Note: Categories in bold are those where market seeking investment can be attracted (Value of Imports greater than US$ 10 million and CAGR greater than 5%)
Table 22: Import of Television and Monitors by India (Value in US$ mn)
Source: DGCI&S, EXIM Bank Analysis

106
India get concessional basic customs duty rate at 5 percent and full exemption from additional customs duty on import of scientific and technical equipment, apparatus and equipments. They also get exemption from excise duty on purchase of such goods. R&D project undertaken by any company having an in-house R&D unit recognized by the Department of Scientific and Industrial Research, Government of India, are provided with an exemption from basic and additional customs duty for import of equipments and instruments.
Microscopes other than optical microscopes and diffraction apparatus (HS code: 901210) includes products like electron microscope which is widely used in areas like biology and life sciences. For this product, India has considerable import appetite and its imports have witnessed a fairly decent CAGR of 5.4 percent during the period under consideration. Import demand for instruments & apparatus, specially designed for telecommunications n.e.s (HS: 903040) stood at US$ 103.07 million in 2013-14, recording a healthy CAGR of 18.0 percent. This is also an important segment where investment can be attracted. Eight products having significant and growing demand have been identified (Table 23).
Camera and Projector
Camera and projector industry in India has witnessed stupendous CAGR of 18.6 percent over the period 2008-09 to 2013-14. Share of cameras and projectors imports in total final electronics import from India has also increased from 2 percent in 2008-09 to 3 percent in 2013-14 (Exhibit 35). All categories within this industry witnessed high CAGRs over the period, and are prospective areas where investment can be attracted. Projectors, of a kind solely or principally used in an automatic data processing system of heading 8471 (HS code: 852861) witnessed the maximum CAGR of 69.0 percent in this period (Table 24).
Medical Devices
India is the fourth largest medical device market in Asia with more than 700 medical device makers, and currently ranks among the world’s top 20 medical device makers45. The domestic industry in India is still at a nascent stage and the country is largely import dependent. Market seeking investment motive has been cited as a major reason for companies investing in the Indian medical
45 Indian Semiconductor Association

107
HS Codes Description 2008-
092013-
14CAGR
%
854310 Electrical particle accelerators for electrons, protons, etc. excluding i 2.99 3.99 5.9
854320 Signal generators 17.16 23.16 6.2
854330 Machines & apparatus for electroplating, electrolysis or electropho-resis 59.09 33.75 -10.6
854370 Electrical machines and apparatus, having individual functions, nes 352.33 326.62 -1.5
901210 Microscopes other than optical microscopes and diffraction apparatus 29.82 38.87 5.4
901420 Instruments & appl for aeronautical/space navigation (other than compasses) 2.51 9.11 29.4
901480 Navigational instruments and appliances nes 1.07 0.67 -8.9
901580 Surveying, hydrographic, oceanographic, meteorologic/geophysical instruments nes 92.05 98.99 1.5
901600 Balances of a sensitivity of 5 cg or better with or without weights 5.21 4.45 -3.1
901720 Drawing, marking-out or mathematical calculating instruments, nes 0.7 0.23 -20.0
902519 Thermometers, not combined with other instruments, nes 1.04 3.77 29.4
903010 Instruments & apparatus for measuring or detecting ionising radiations 5.17 15.71 24.9
903020 Cathode-ray oscilloscopes and cathoderay oscillographs 15.2 19.34 4.9
903031 Multimeters 3.57 5.7 9.8
903032 Multimeters with recording device 0.65 1.24 13.8
903033 Instruments and apparatus for measuring or checking voltage, current 23.21 41.65 12.4
903039 Instruments and Apparatus, for measuring or checking voltage, cur-rent, etc without a record dev 14.81 10.31 -7.0
903040 Instruments & apparatus, specially designed for telecommunica-tions nes 45.04 103.07 18.0
903082 Instruments for checking semiconductor wafers 3.99 4.82 3.9
903084 Instruments and appliances for measuring or checking electrical quanti 6.84 3.6 -12.0
903089 Instruments & apparatus for measuring or checking electrical quantities nes 49.7 77.99 9.4
903210 Thermostats 11.33 21.7 13.9
903220 Manostats 4.29 4.56 1.2
903281 Hydraulic or pneumatic automatic regulating or controlling instruments & app 3.9 18.85 37.0
903289 Automatic regulating or controlling instruments and apparatus, nes 58.69 55.77 -1.0
Total 810.36 927.92 2.7
Note: Categories in bold are those where market seeking investment can be attracted (Value of Imports greater than US$ 10 million and CAGR greater than 5%)
Table 23: Import of Analytical Instruments by India (Value in US$ mn)
Source: DGCI&S, EXIM Bank Analysis

108
devices category, with 73.3 percent of companies citing it as a motive for investment. A reasonable percentage (6.7 percent) of companies also cited universities or researchers as a reason for investment (Exhibit 39). The United States, Germany and the UK were major investors in this category over the period January 2003 to March 2014. China had only one project out of 83 FDI projects recorded over this period in the Indian medical device category, that too not within the last five years.
Import of medical devices by India witnessed a CAGR of 5.6 percent over the period 2008-09 to 2013-14. Parts & accessories for apparatus based on the use of X-rays or other radiations (HS: 902290) was the most
important segment within this category where investment can be attracted. India imported US$ 146.1 mn worth of these products in 2013-14, and their imports have registered a CAGR of 6.6 percent. Other than this, seven other products have also been identified (Table 25).
IDENTIFYING TRADE COMPLE-MENTARITIES BETWEEN INDIA AND CHINA
India has substantial trade deficit with China in the electronics segment. However, Chinese products are not necessarily more competitive than those supplied by Indian players. Empirical findings in a recent study by RIS have found India’s imports from China to be uncompetitive in the
HS Codes Description 2008-09 2013-14 CAGR
%
852580 Television cameras, digital cameras and video camera recorders 209.17 511.99 19.6
852861Projectors of a kind solely or principally used in an automatic data-processing system
2.4 33.1 69.0
852869 Projectors, not incorporating television reception apparatus 46.93 61.4 5.5
Total 258.5 606.49 18.6Note: Categories in bold are those where market seeking investment can be attracted (Value of Imports greater than US$ 10 million in 2013-14 and CAGR greater than 5%)
Table 24: Import of Cameras and Projectors by India (Value in US$ mn)
Source: DGCI&S, EXIM Bank Analysis

109
Exhibit 39: Major FDI Motives Cited by Companies Investing in Indian Medical Devices Segment (January 2003 - March 2014)
Vinerian sense, i.e. on the basis of comparative cost advantage. Nearly 16.2 percent of the total imports from China in 2012 in the Machinery and Mechanical Appliances segment have been found to be uncompetitive in the study46.
The purpose of analysing trade complementarities in the current section is twofold – identifying areas where China’s imports are substantial, indicative of the demand for those products and suggesting strategies for developing domestic capabilities in those areas, and secondly, identifying areas where there is scope for
attracting FDI from China on account of substantial demand by India, reflected in the ever increasing imports of those products.
Complementarities of India’s Exports to China’s Imports
China’s import basket of final electronics products from India is preponderated by the medical devices sub-category, with four out of the top ten products being from this category. However, medical devices sub-category doesn’t feature as starkly among the final electronics exports from India to the world (Table 26). Building more capacity in this
46 Mohanty, S.K. (2014), India-China Bilateral Trade Relationship, Research and Information System for Developing Countries.
* Percentages add up to more than 100% as one company can cite multiple motives for the same project

110
HS Codes Description 2008-09 2013-14 CAGR
%
901811 Electro-cardiographs 5.4 3.57 -7.9
901812 Ultrasonic scanning apparatus 74.17 93.88 4.8
901813 Magnetic resonance imaging apparatus 69.06 88.1 5.0
901814 Scintigraphic apparatus 3.98 0.76 -28.2
901819 Electro-diagnostic apparatus, nes 127.04 107.24 -3.3
901820 Ultra-violet or infra-red ray apparatus 0.91 0.36 -16.9
901890 Instruments and appliances used in medical or veterinary sciences, nes 2.49 9.95 31.9
902140 Hearing aids, excluding parts and accesso-ries 18.79 49.24 21.2
902150 Pacemakers for stimulating heart muscles, ex-cluding parts & accessories 22.62 22.86 0.2
902212 Computed tomography apparatus 54.71 83.46 8.8
902213 X-rays apparatus, dental use, nes 1.34 2.51 13.4
902214 X-rays apparatus, medical/surgical/veterinary use nes 35.25 70.33 14.8
902219 Apparatus based on the use of X-rays for other uses 29.69 38.37 5.3
902221 Apparatus basd on the use of alpha beta/gamma radiations, for medical use 10.27 18.79 12.8
902229 Apparatus basd on the use of alpha beta/gamma radiations, for other uses 11.67 24.87 16.3
902230 X-ray tubes 33.87 37.87 2.3
902290 Parts & accessories for apparatus based on the use of X-rays or other radiations 105.98 146.1 6.6
Total 607.24 798.26 5.6Note: Categories in bold are those where market seeking investment can be attracted (Value of Imports greater than US$ 10 million and CAGR greater than 5%)
Table 25: Import of Medical Devices by India (Value in US$ mn)
Source: DGCI&S, EXIM Bank Analysis

111
sub-category and augmenting current exports can help establish even stronger complementarities in bilateral trade.
The development of healthcare and medical resources category in China is far behind the level of economic development achieved by the country47.
Medical devices import into the country witnessed a CAGR of 21.4 percent during 2008-2012, largely as a result of imports of higher-end products. China’s latest Five Year Plan (2011-15) has allocated US$ 41 billion to the development of new hospitals and upgrading of country’s grassroots health services system, which is expected to generate more demand for products in this sub-category. India can reduce its trade deficit in the electronics category by tapping this opportunity.
Apart from this, phones, fax machines and routers is also a major category, with three out of the top ten products imported by China from India coming from this category. Phones, fax machines, and routers are also a major export commodity for India to the world. Even in the subassemblies segment, parts of telephone sets,
telephones for cellular networks or for other data (HS: 851770) is the largest category of subassembly products’ exports from India to the world, and the largest category of subassembly products’ imports by China from India (Table 26). Greater complementarities can be established in the phones, fax machines and routers segment by further increment in the production and exports of these products.
In the subassemblies and components category, signals of complementarities are strong as the basket of imports of China from India and of exports of India to the world are similar to a large extent. In the components category, eight products feature both in the list of top ten electronic components imported by China from India and the list of top ten electronic components exported by India to the world. In subassembly products as well, complementarity is evident as nine products feature in both the lists (Table 26).
Photosensitive semiconductor devices, photovoltaic cells and light emitting devices (Hs code 854140) are an important export item for India, and although China does source a part of its import under this category from India, the amount is miniscule as compared to the country’s total import from the
47Medtech Switzerland

112
rest of the world. China is aggressively pushing towards a green economy and has planned to set up 10GW of solar power in the period 2013-15 which assures further incentive to provide a boost to the category. India’s own domestic requirements for such goods are expected to increase as a result of increasing focus of the government on the renewable energy category.
Complementarity of Chinese Exports to Indian Imports
Several products which rank high among products exported by China to the world also feature among the basket of major products imported by India from China. Especially in the subassembly category, the top three products exported by China
HS Code
HS Description Value HS Code
HS Description Value
Components Products Imported by China from India
Component Products Exported by India to World
853890Parts for use with the apparatus of heading no. 85.35,85.36 or 85.37,nes
18.6 850440 Static converters, nes 390.8
850440 Static converters, nes 17.1 853890Parts for use with the apparatus of heading no. 85.35,85.36 or 85.37,nes
308.6
853400 Printed circuits 5.7 853810
Boards, panels, etc for goods of heading no. 85.37,not equipped with their apparatus
164.1
853810Boards, panels, etc for goods of heading no. 85.37,not equipped with their apparatus
4.4 850490Parts of electrical transform-ers, static converters and inductors
155.1
850490Parts of electrical transformers, static converters and inductors
3.9 853400 Printed circuits 130.2
854231
Electronic integrated circuits as processors and controllers, whether or not combined with memories
3.4 854140Photosensitive semiconduc-tor device, photovoltaic cells & light emit diodes
111.8
853210Fixed capacitors designed for use in 50/60 Hz circuits (power capacitors)
2.4 850421Liquid dielectric transform-ers having a power handling capacity </= 650 KVA
109.1
854140Photosensitive semiconductor device, photovoltaic cells & light emit diodes
2.1 853225Electrical capacitors, fixed, dielectric of paper or plas-tics, nes
48.5
Table 26: Top Ten Electronic Products Exported by India to the World and Imported by China from India, 2012 (Value in US$ mn)

113
850421Liquid dielectric transformers having a power handling capac-ity </= 650 KVA
1.9 850422
Liquid dielectric transformer having a power handling cap >650 KVA but </= 10,000KVA
46.4
853225Electrical capacitors, fixed, di-electric of paper or plastics, nes
1.7 853649Electrical relays for a volt-age exceeding 60 V but not exceeding 1,000 volts
43.7
Subassembly Products Imported by China from India
Subassembly Products Exported by India to World
851770Parts of telephone sets, tele-phones for cellular networks or for other data
77.1 851770Parts of telephone sets, telephones for cellular net-works or for other data
590.3
847340Parts and accessories of other office machines, nes
25.4 903300
Parts & access nes for machines, appliances, instruments or apparatus of Chapter 90
220.6
847330Parts & accessories of automat-ic data processing machines & units thereof
23.4 853710Boards, panels, including numerical control panels, for a voltage <=1000 V
179.5
852990Parts suitable for use solely/principally with the apparatus of headings 85.25 to 85.28
11.3 847330Parts & accessories of automatic data processing machines & units thereof
164.1
850110Electric motors of an output not exceeding 37.5 W
8.7 847340Parts and accessories of other office machines, nes
126.9
853710Boards, panels, includg numeri-cal control panels, for a voltage <=1000 V
3.5 850110Electric motors of an output not exceeding 37.5 W
114.8
903300Parts & access nes for ma-chines, appliances, instruments or apparatus of Chapter 90
2.1 852990
Parts suitable for use solely/principally with the ap-paratus of headings 85.25 to 85.28
111.3
854390Parts of electrical machines & apparatus having individual functions, nes
0.8 853720Boards, panels, including numerical control panels, for a voltage > 1,000 V
94.1
901590Parts and accessories for use with the apparatus of heading No 90.15
0.7 854390Parts of electrical machines & apparatus having individu-al functions, nes
84.8
851890
Parts of microphones, loudspeakers, headphones, earphones & electric sound amplifier
0.3 901590Parts and accessories for use with the apparatus of heading No 90.15
35.5

114
Final Products Imported by China from India Final Products Exported by India to World
902214X-rays apparatus, medical/sur-gical/veterinary use nes
30.8 851712Telephones for cellular networks mobile telephones or for other wireless
2849.6
902230 X-ray tubes 18.7 852380
Gramophone records and other media for the record-ing of sound or of other phenomena, whether or not recorded
351.6
852380
Gramophone records and other media for the recording of sound or of other phenomena, whether or not recorded
5.4 852340
Optical media for the recording of sound or of other phenomena excluding products of chapter 37
194.3
847170 Computer data storage units 5.0 852871Reception apparatus for television, whether or not incorporating radio
164.0
901890Instruments and appliances used in medical or veterinary sciences, nes
4.8 852352Cards incorporating one or more electronic integrated circuits smart cards
162.9
851769Apparatus for the transmission or reception of voice, images or other data
4.2 851769Apparatus for the transmis-sion or reception of voice, images or other data
160.1
901812 Ultrasonic scanning apparatus 3.3 901890Instruments and appliances used in medical or veteri-nary sciences, nes
142.4
847141Non-portable digital edp ma-chines with processor & i/o
2.7 847150Digital processing units not sold as complete systems
127.1
851711Line telephone sets with cord-less handsets
2.3 902214X-rays apparatus, medical/surgical/veterinary use nes
107.9
851762Machines for the reception, conversion and transmission or regeneration
2.0 851762Machines for the reception, conversion and transmis-sion or regeneration
95.9
Source: UNCOMTRADE, EXIM Bank Analysis
to the world are also the top three products imported by India from China (Table 27).
Among India’s final electronics imports from China, majority of the products
come within the ambit of computers & storage devices; phones, fax machines & routers; and television and monitors. This import basket mirrors the development of telecom and information technology in India. These

115
categories of final electronics imports also constitute a significant portion of China’s final electronic goods exports to the world.
Since it is evident that there exist strong complementarities between
the trade baskets of India and China in the electronics industry, there is scope for attracting horizontal FDI, as well as development of domestic capabilities in products which have high import demand in China, and thereby neutralizing the trade deficit.
Table 27: Top Ten Electronics Products Exported by China to the World and Imported by India from China (2012)
Final Products Exported by China to World Final Products Imported by India from China
HS code HS Description Value
(US$ mn)HS
Code HS Description Value (US$ mn)
847130 Portable digital computers <10kg 113784.3 851712
Telephones for cellular networks mobile telephones or for other wireless
3181.6
851712
Telephones for cellular networks mobile telephones or for other wireless
81453.7 847130 Portable digital computers <10kg 1678.5
851762
Machines for the reception, conversion and transmission or regeneration
26543.6 851762
Machines for the reception, conversion and transmission or regeneration
486.1
847170 Computer data storage units 18638.9 852851
Monitors of a kind solely or principally used in an automatic data-processing system
391.2
852580Television cameras, digital cameras and video camera recorders
12737.6 847170 Computer data storage units 359.1
852872Reception apparatus for television, color, whether or not incorporating
12108.6 852580Television cameras, digital cameras and video camera recorders
315.1
847150Digital processing units not sold as complete systems
11471.3 851769
Apparatus for the transmission or reception of voice, images or other data
290.1
854370Electrical machines and apparatus, having individual functions, nes
7596.1 852871Reception apparatus for television, whether or not incorporating radio
268.2

116
852190Video recording or reproducing apparatus nes
6362.7 847150Digital processing units not sold as complete systems
246.0
847160 Computer input/outputs, with/without storage 5962.1 852380
Gramophone records and other media for the recording of sound or of other phenomena, whether or not recorded
180.7
Subassembly Products Exported by China to World
Subassembly Products Imported by India from China
851770Parts of telephone sets, telephones for cellular networks or for other data
39594.3 851770Parts of telephone sets, telephones for cellular networks or for other data
1815.4
847330Parts & accessories of automatic data processing machines & units thereof
29622.4 847330Parts & accessories of automatic data processing machines & units thereof
764.8
852990
Parts suitable for use solely/principally with the apparatus of headings 85.25 to 85.28
10398.3 852990
Parts suitable for use solely/principally with the apparatus of headings 85.25 to 85.28
435.7
853710Boards, panels, including numerical control panels, for a voltage <=1000 V
3853.1 854390
Parts of electrical machines & apparatus having individual functions, nes
109.1
852290Parts and accessories of apparatus of heading nos 85.19 to 85.21, nes
2699.8 850680 Primary cells & primary batteries nes 91.3
850110Electric motors of an output not exceeding 37.5 W
2657.8 850110Electric motors of an output not exceeding 37.5 W
70.4
901390Parts and accessories of optical appliances and instruments, nes
1949.5 852910Aerials & aerial reflectors of all kinds; parts suitable for use therewith
55.3
852910Aerials &aerial reflectors of all kinds; parts suitable for use therewith
1475.9 903300
Parts & access nes for machines, appliances, instruments or apparatus of Chapter 90
44.0
851890
Parts of microphones, loudspeakers, headphones, earphones & electric sound amplifiers
972.3 853710Boards, panels, including numerical control panels, for a voltage <=1000 V
42.2
853720Boards, panels, including numerical control panels, for a voltage > 1,000 V
843.4 852290Parts and accessories of apparatus of heading Nos 85.19 to 85.21, nes
34.7

117
Component Products Exported by China to World
Component Products Imported by India from China
854231
Electronic integrated circuits as processors and controllers, whether or not combined with memories
27056.5 854140
Photosensitive semiconductor device, photovoltaic cells & light emit diodes
341.7
854140
Photosensitive semiconductor device, photovoltaic cells & light emit diodes
17483.2 850440 Static converters, nes 281.1
850440 Static converters, nes 15550.6 853400 Printed circuits 228.3
854232 Electronic integrated circuits as memories 14374.6 854231
Electronic integrated circuits as processors and controllers, whether or not combined with memories
178.5
853400 Printed circuits 13739.3 854239Electronic integrated circuits excluding such as processors, controllers,
120.0
854239Electronic integrated circuits excluding such as processors, controllers,
7507.6 853890Parts for use with the apparatus of headingno. 85.35,85.36 or 85.37,nes
99.6
854233 Electronic integrated circuits as amplifiers 4495.6 850490
Parts of electrical transformers, static converters and inductors
98.3
853890Parts for use with the apparatus of heading no. 85.35,85.36 or 85.37,nes
2958.5 853229 Electrical capacitors, fixed, nes 74.5
854129Transistors, other than photosensitive transistors, nes
2541.8 854110Diodes, other than photosensitive or light emitting diodes
70.6
850450 Inductors, electric 2369.4 854129Transistors, other than photosensitive transistors, nes
65.9
Source: UNCOMTRADE, EXIM Bank Analysis

118
5. IDENTIFICATION OF AREAS FOR COOPERATION
TRADE SPECIALIZATION INDEX FOR CHINA AND INDIA
Trade specialization index is used to measure the degree of net exportation by a country in a particular commodity. It basically compares the net flow of goods with the total flow of goods, thereby removing bias due to re-export activities, if any. It thus helps in identification of real producers of a commodity and not merely traders. The range of TSI is (+)1 to (-)1, where (+)1 indicates complete specialization and (-)1 indicates no specialization. Algebraically, it can be written as-
TSI = X-M
X+M
Where, X= exports of the commodity by the country and M=imports of the commodity by the country.
At the six digit HS code level, India and China will have complementary trade structure if one is a real producer of the good, while the other is not.
Trade specialization index of India for electronic goods indicate that India is a real producer in only 10.4 percent of total electronic products, which is fairly low. On the other hand, China is a real producer of 60.9 percent of total electronic products traded by the country. India has relatively higher specialization in subassembly category with 22.8 percent of total subassembly products having positive TSI. In the final goods category, India’s performance is below average with TSI being positive for only 6.6 percent of the products. On the other hand, China has greatest specialization in the final goods category, with 68.1 percent of goods in the final category having positive TSI (Table 28).
Identification of Electronic Sub-Sectors for Attracting FDI from China to India
At the six digit HS code level, three major points have been considered while identifying the products where India can attract investment from China:

119
• China’s outward investment in electronics sector has been increasing. As per the data from FDI Markets, outward FDI (capital investment) from China in the electronics industry increased from US$ 575 mn in 2008 to US$ 2,563 mn in 2012 before moderating to US$ 1,928.8 mn in 2013. Outward investment from China in the electronics industry accounted for 13.8 percent and 8.5 percent of the total outward investments from the country in 2012 and 2013, respectively. Quite a few of these investments are horizontal and were envisaged with the objective of serving the local Chinese market (import platform investment)48. Hence, an analysis of Chinese electronic imports becomes important.
• However, when it comes to investments into India in the electronics goods sector by
Chinese firms, they have cited market seeking as the major reason for investment. This implies that India’s import demand becomes a key parameter for the identification process.
• From the above two, a case can be made for identifying products where trade structures of India and China are complementary. If India’s exports are complementary to China’s imports, import platform investment can be attracted. If China’s exports are complementary to India’s imports, market seeking investment can be attracted.
The intersection of the three sets – a) where India and China have complementary trade pattern (i.e. where TSI for the product is at variance for India and China – positive for one and negative for the other and vice versa); b) where India has significant
Category India China
Components 12.1% 41.9%
Subassembly Products 22.8% 55.7%
Final Goods 6.6% 68.1%
All Electronic Products 10.4% 60.9%
Table 28: Share of Specialized Products in Each Category
Source: UNCOMTRADE, EXIM Bank Analysis
48Alon, Molodtsova & Zhang (2012). Macroeconomic Prospects for China’s outward FDI

120
Exhibit 41: Electronic Segments Where Investment from China could be Attracted (Total: 61 Products)
Exhibit 40: Criteria for Identification of Electronic Sub-Sectors for Attracting FDI from China to India
Source: UNCOMTRADE, EXIM Bank Analysis

121
imports (minimum threshold level of US$ 10 million) and; c) where China’s imports are above a threshold level (at least US$ 50 million) - is derived as the required set of electronic products where FDI could be attracted from China by India. Based on the above methodology, sixty one such products have been identified, accounting for 19.8 percent of China’s total imports of electronic goods, and 69.7 percent of India’s imports in total electronic goods in 2012 (Exhibit 41; Annexure 2). Most of these products are in the final electronic goods segment. Within the final goods segment, computer and storage devices is the most important sub-category where investment can be attracted.
Identification of Electronic Product Categories for Enhancing Exports from India to China
India can also strive towards enhancing its export capabilities in identified electronic goods. These would include products where:
• China is not a real producer currently and has got significant import demand (>US$ 50 million). Whether China is a real producer can be verified through the TSI index. China will not be a real producer in all those goods where TSI is negative.
• India has got a certain minimum amount of exports (>US$ 10
Exhibit 42: Product Categories for Enhancing Exports from India to China
Source: UNCOMTRADE, EXIM Bank Research

122
million), indicative of some production capabilities available in the country.
Twenty two such products have been identified, largely from the segments of medical devices and components. These products together account for 50.4 percent of total imports by China. These products account for 15.9 percent of India’s total electronics exports and 17.3 percent of India’s total electronics imports (Exhibit 42, Annexure 3). Among these products, computer data storage units (HS: 847170), electronic integrated circuits as memories (HS: 854232) and electronic integrated circuits as processors and controllers (HS: 854231) are important categories of imports by China.
Identification of Sectors for Establishing India-China Joint Ventures in the Electronic Sector of India
Many objectives have been identified by researchers for setting up of joint ventures. The prominent ones are: reducing risks, achieving economies
of scale, support technologies/patents, block competitors, jump trade barriers, expand internationally and integrate vertically with a partner.
While looking for a potential JV partner, companies look into various aspects like financial security, resource and management capabilities, production performance, reputation, etc. Hence, JVs can be attracted successfully only in those sectors where Indian companies already have a critical mass and experience. For the purpose of identifying such potential sectors, performance analysis of Indian companies has been undertaken with net profit as an indicative parameter measuring their operating success.
List of companies engaged in electronic production was obtained from the Prowess database, and taking 2011-12 as the reference period, those companies were selected whose profit after tax was positive49. Table 29 gives the list of products which these companies produce/trade. These segments could offer potential opportunities for India-China joint ventures.
49The companies for which 2012-13 data was available were few. Hence, 2011-12 data has been considered for the present analysis.

123
Medical equipment Line printers
Analytical instruments Control valves
Printed circuit boards LED lamps
Uninterrupted power supplies Other diodes & transistors
Control instrumentation & industrial electronics Diodes & transistors
Therapy equipments Level controllers
Microwave passive components Industrial fans, blowers, etc.
Weighing system, load cell Other automation electronics equipment
Filters Crystals
Electro cardio graphics Electronic lighters
Defence communication equipments Computer systems
Strategic electronics equipments Solar modules
Connectors Instrument cooling fans
Surgical equipments Industrial ultrasonic equipments
Piezo electric elements Semiconductor devices
Other testing & measuring instruments Integrated circuits
Thermal analysis equipments Computer peripherals
Soft ferrites Electronic components
VHF radio systems Reed switches
Solar appliances Switch mode power supply systems
Transmission equipments Process controllers
Electronics Integrated circuits, nec
Process control equipments Ph analysis equipment and ph meters
Electronic buzzers Television receivers, colour
Electrolytic capacitors Telephone components
Temperature controllers Computer terminals
Antennae for radios & TVs Communication & broadcasting equipments
Rotary switches Television receivers
Control panels
Table 29: Main Product Groups Where JVs can be Formed
Source: CMIE Prowess, EXIM Bank Analysis

124
Identification of Segments for Development in Software Industry to Meet the Requirements of Chinese Market.
While China excels in production of electronic hardware, India has substantial exports in the arena of computer and information services. India was the largest exporter of Computer and Information Services in 2012, accounting for 19.9 percent of total exports under this category (Table 30). China also has developed its computer and information services segment over the years. Value of export and import of computer and information services was in close range for China till 2005. However, exports have witnessed phenomenal
increase thereafter, gradually increasing the difference between the exports and the imports (Exhibit 43). The country remains as one of the top five countries in terms of computer software and services spending as a share of GDP50. Therefore, India can identify areas for cooperation where China’s demand is robust and aim towards catering to the market.
China’s software industry is an important area for the Chinese government, with incentives for both domestic growth and foreign investment. The software market in the country is diverse and fragmented, and according to an estimate, have over 16,000 local-certified software companies, approximately 40,000
Exhibit 43: China’s Trade in Computer and Information Services (Value in US$ mn)
Source: United Nations Service Trade Statistics Database, EXIM Bank Analysis
50UNCTAD Information Economy Report 2012.

125
Exporting Country Value of Export in 2012 (US$ bn) Share %
India 49.3 19.9%
Ireland 45.9 18.5%
Germany 20.3 8.2%
USA 17.3 7.0%
United Kingdom 14.9 6.0%
China 14.5 5.8%
Sweden 8.0 3.2%
Spain 6.5 2.6%
The Netherlands 6.5 2.6%
France 6.3 2.5%
World 248.1 100.0%
Table 30: Top Exporting Countries for Computer & Information Services
Source: TradeMap, EXIM Bank Analysis
Enterprise applications Segments 2010 Share % 2014 Share %
2010-14 CAGR %
Enterprise resources planning (ERP) 604 31% 1085 32% 16
Supply chain management (SCM) 133 7% 246 7% 17
Digital content creation (DCC) 88 4% 158 5% 16
Enterprise content management (ECM) 67 3% 148 4% 22
Customer relationship management (CRM) 63 3% 136 4% 21
Office suites 349 18% 604 18% 15
E-mail and calendaring 60 3% 114 3% 17
Others 599 31% 849 25% 9
Total 1963 100% 3341 100% 14
Table 31: China Enterprise Application Market (Value in US$ mn)
Source: Credit Suisse Equity Research, 2011, EXIM Bank Analysis

126
registered software products, and more than one million software-industry professionals. However, China’s software industry still lacks core technologies, high-end software development aptitude, and consistent high quality software products. Moreover, foreign brands relish a sizably voluminous market share in the high-end segment of the software market, with local software products comprising less than 30 percent of the market.
Indian companies can venture into the Chinese market for high-end software solutions, which require a certain level of customization. Some of the prominent areas where China has considerable demand as identified by the Department of Commerce, USA are:
l Application software and specialty software: Solutions pertaining to enterprise resource planning, customer relationship management, service-oriented architecture, middleware and open-source software have bright prospects in the Chinese market.
l High-end enterprise management systems software: Solutions that address database management
systems, systems management software products, networking security software products remain some of the fastest growing areas for foreign firms selling into the China marketplace.
l Specialty software: Customized software targeted for a specific industry or market sector is a market segment in which foreign firms have an estimated 70 percent of the market.
Total enterprise application market is estimated to have recorded a CAGR of 14 percent during 2010-2014 in China. Of this, enterprise resource planning, office suites and supply chain management are important segments, with respective shares of 32 percent, 18 percent and 7 percent in the total enterprise application market. The ERP segment is estimated to further grow by 20-25 percent annually during 2011-2015. In China, although the number of clients for ERP is more in small and medium enterprises, spending from large enterprises is much larger51.
Enterprise Resource Planning: Enterprise Resource Planning has been defined by Gartner as a technology strategy that integrates a
51Credit Suisse Equity Research 2011.

127
set of business functions through tight linkages- from operational business transactions to financial records. As wage costs become dearer in China, more and more firms are expected to opt for ERP for making processes cost-effective. China’s market for ERP services is highly fragmented and many global providers are also present. According to Gartner’s September 2010 report ‘Magic Quadrant for ERP Service Providers, China’, there were no Indian players in the market, although they have been able to succeed in many other advanced countries. Reasons cited for this has mainly been obstacles such as culture, language and business confidence. Some important requirements (characteristics of demand) for Chinese ERP buyers are given below, which can be useful for Indian players looking to enter the Chinese market:
• Customization: Chinese enterprises regard customized solution as against packaged solutions. Many manufacturing companies have their own customized local systems and look for customized option to fit their requirements. About 60 percent of ERP implementations in the country are customized.
• Cultural affinity: To tap into the Chinese market, players must familiarize with the business culture and language of the customers. Around 90 percent of ERP implementations were delivered on-site in China, and about 10 percent of them were delivered offshore.
• On-site delivery: On-site delivery consultants are an important consideration, especially for buyers who have multiple rollouts across the country.
• Software-as-a-Service (SaaS) ERP Offerings: Whole suite SaaS ERP implementations are rare in China. Some companies have adopted specific modules of SaaS ERP, such as for the purpose of accounting and expense management.
Supply Chain Management (SCM): ERP system consists of many modules which can be largely divided into: a) management related, and b) business process-related functions. Focus of customers is increasing in business process related functions, SCM being one of them. Globalization has made it necessary to dispense

128
purchase and supply functions more efficiently. This along with the rising cost of labour has been important factors in propelling the demand for SCM.
This demand in China largely comes from multinationals, and hence foreign software companies can play a greater role here. Moreover, companies having greater experience in global operations can perform better in these areas as compared to domestic players in China who have limited experience and proficiency. China is already a major player in the global supply chain trade. As more and more Chinese companies are
engaged in the global supply chains, the demand for such software is expected to increase.
Identification of Areas for Investment Where China Faces Temporary Trade Barriers
India can attract investment in those areas where China faces temporary trade barriers from other countries and hence would like to circumvent these trade barriers. These product categories can also be identified on a country-wise basis.
The scope of barriers is fairly large and includes wide array of non-tariff
Table 32: Trade Barriers Affecting China’s Trade in Electronics
Country/Region Name
Trade Barrier CommodityRelevant
HS codes
Import of the
commodity, 2012
(US$ mn)
Argentina Anti-Dumping Microwave Ovens 851650 1.61
Argentina Anti-Dumping Car Stereos 852721 85.69
Argentina Anti-Dumping Colour TVs 8528 106.60
Argentina Anti-Dumping Lighters used in Kitchens 961380 1.92
Brazil Anti-Dumping Other Permanent Magnets and Magnetized Articles 850519 19.23
Brazil Anti-Dumping Loudspeakers 851821 50.94European Union Anti-Dumping Microwave Ovens 851650 649.79
European Union
Anti-Dumping & Countervailing Duties
Wireless Wide Area Networking Modems 851762 15335.34
European Union Anti-Dumping Laser Optical Reading
Systems 852721 710.67

129
European Union Anti-Dumping Colour Television Receivers 8528 10765.91
European Union Anti-Dumping
Certain Cathode-Ray Colour Television Picture Tubes
854011 2.03
European Union Anti-Dumping Certain Cargo Scanning
Systems 902219 224.94
European Union
Anti-Dumping & Countervailing Duties
Certain Magnetic Disks (3.5 Micro disks) 852329 356.06
European Union
Anti-Dumping & Countervailing Duties
Compact Disks - Recordable (CD-Rs) 852340 1025.38
Mexico Anti-DumpingElectrical Equipment and Machinery and Parts Thereof
850110 376.37
Mexico Anti-Dumping Sound Equipment MI*
Turkey Anti-Dumping Colour TV Receivers with Integral Picture Tube 8528 1149.01
Turkey Anti-DumpingWall Clocks (Battery Accumulator or Main Powered)
910521 3.76
Turkey Safeguard** Certain Voltmeters and Ammeters 903039 7.12
USAAnti-Dumping & Countervailing Duties
Raw Flexible Magnets 850519 28.95
USA Anti-Dumping Colour Television Receivers 8528 1732.61*A cell entry for missing data (i.e., data which definitely exists, but which is difficult to be found) is filled in with MI.**India is exempt from this safeguard, while China is not.Commodities in bold are where the scope for attracting investment is relatively lesser on account of low level of imports of the product from the country imposing duty. An arbitrary threshold of US$ 10 million has been taken as significant for attracting investments.Source: Bown, Chad P. (2012) “Global Antidumping Database,” available at http://econ.worldbank.org/ttbd/gad/, Bown, Chad P. (2012) “Global Countervailing Duties Database,” available at http://econ.worldbank.org/ttbd/gcvd/, Bown, Chad P. (2012) “Global Safeguard Database,” available at http://econ.worldbank.org/ttbd/gsgd/, UNCOMTRADE, EXIM Bank Analysis

130
barriers as well. For the purpose of this analysis, three significant trade barriers have been considered, viz., Anti-Dumping duties, Countervailing duties, and Safeguards. Data for these three has been accessed from Temporary Trade Barriers Database52. Twenty seven commodities in six different countries/regions (including European Union) have been identified where China faces these trade barriers. However, import by some of the countries placing import-restrictions on electronic products is low, thereby limiting the prospects of investment in those products.
On the whole, China loses approximately US$ 32.63 billion of potential electronic exports to the world on account of these trade barriers. While most barriers are in the final electronic goods category, some are also in the component and subassembly category. Of all the countries imposing such restrictions on China, European Union has the maximum number of goods under these trade barriers.
Products featuring under monitors and projectors, not incorporating television reception apparatus; reception apparatus for television, whether or not incorporating radio-
broadcast receivers or sound or video recording or reproducing apparatus (HS code: 8528, Category: Television & Monitors) has witnessed significant import-restricting actions from across the globe. Under this category, imports from China have been banned by Argentina, EU, Turkey and USA. All these countries are also significant importers of the product, with total imports from these four countries under this HS code amounting to US$ 13,754.13 million in 2012 (Table 32). Hence, investments in this area can be attracted.
Within the sound and video recording devices segment, magnetic media for the recording of sound/of other phenomena, but excluding products of Ch. 37., other than cards incorporating a magnetic stripe (HS code: 852329) and optical media for the recording of sound/of other phenomena, but excluding products of Ch. 37 (HS code: 852340) are important categories where China faces anti-dumping and countervailing duties from European Union. Total imports under these two HS codes by European Union were US$ 1,381.44 million in 2012. China also faces barriers from Argentina and European Union in the category of microwave ovens (HS code: 851650).
52The database covers 95% of the global use of these particular import-restricting trade remedy instruments.

131
HS code Product descriptionMargins of preference
offered
84717011 Automatic Data Process Machines; Magnetic Reader Etc-For Floppy disks 20
84717029 Automatic data process machines; magnetic reader etc-other 10
84717032 Automatic Data Process Machines; Magnetic Reader Etc-For Cartridges 20
84719011 Automatic Data Process Machines; Magnetic Reader Etc-Of magnetic cards 10
84719012 Automatic Data Process Machines; Magnetic Reader Etc-Bar code readers 10
84719014 Scanners 10
84733019 Parts etc for typewriters & other office machines-other 10
84733031 HDA Head Disk Assembly of rigid disk units, mounted 10
85011011 Less than 1.8 degrees 100
85011019 Electric motors and generators (no sets)-other 10
85042100 Electric Transformers, Static Converters & Inductors -Having a power handling capacity not exceeding 650 20
85044030 DC converters 10
85173041* Electric Apparatus For Line Telephony Etc, Parts-With a trunk speed exceeding 72 kbits/second and s 10
85173061* Electric Apparatus For Line Telephony Etc, Parts-Of the crossconnect type 10
85173062* Electric Apparatus For Line Telephony Etc, Parts-With a serial interface speed of at least 4 mbits/ 10
85173069* Electric apparatus for line telephony etc, parts-other 10
85179099* Electric apparatus for line telephony etc, parts-other 10
85181000 Microphones and stands therefor 10
85232010* Magnetic Discs - Of a kind used in hard disc drives 100
85252019* Trans apparatus for radio-telephony etc; tv camera & receivers-other 10
85252021* Trans Apparatus For Radio-telephony Etc; Tv Camera & receivers-For base stations 10
85252023* Fixed terminals, without an incorporated energy so 10
85299090 Parts for television, radio and radar apparatus-other 10
85389020 Electronic assemblies, mounted 10
85409190 Other 10
90139000 liquid crystal devices nes; lasers; optical appliances; pt-parts and acces-sories 10
90189031 Lithotripters operating by shock waves 100
90189093 Computerized microwave apparatus for intra-urethra 100
90189094 Endoscopes 100
90189095 Clamps and clips, applicators and extractors there 100
*HS codes for these products have changed in subsequent revisions. Comparable six digit codes used in the current study are: 851762 for 851730; 851770 for 851790; 852329 for 852320 and 852520.
Table 33: List of Electronic Products in which India has Preferential Access in MERCOSUR
Source: Ministry of Commerce, Government of India; EXIM Bank Analysis

132
Within the components segment, China faces maximum trade barrier on account of these measures in the category of other permanent magnets and articles intended to become permanent magnets after magnetisation (HS code: 850519). Both Brazil and USA have placed import-restricting duties on China in this category. Total import for this product from both the countries amounted to US$ 48.18 million in 2012.
Identification of Areas for Investment Where India has Access to Preferential Duties
Although both China and India have greater access through trade agreements in many regions, India has concluded agreements with some countries/regions where China has not been able to gain preferential access. It is the latter category of agreements which are crucial from the point of view of attracting market-seeking investments from China. Even in countries where both India and China have FTA, some product categories can be identified for investment by Chinese companies
in India where FTA partners of China have put several items under sensitive list for imports from China, but not from India.
India MERCOSUR PTA
A Preferential Trade Agreement was signed between India and MERCOSUR in 2005 wherein the latter provided concession in 452 products. Of these 452 products, 30 are electronic products. Maximum preference is allowed by MERCOSUR in the medical electronics products category wherein four product categories benefit from 100 percent margin of preference53. These are lithotripters operating by shock waves (HS code: 90189031), computerized microwave apparatus for intra-urethra (HS code: 90189093), endoscopes (HS code: 90189094), and clamps and clips, applicators and extractors there (HS code: 90189095) (Table 33).
India ASEAN Agreement
Both India and China have entered into trade agreement with ASEAN. However, some of the products which
53Margin of preference is the percentage difference between MFN tariff and the preferential tariff for a product. Numerically, Margin of Preference= MFN tariff- Preferential tariff X 100 MFN tariff

133
HS code Description Country Access to India
847141 Non-portable digital edp machines with processor & i/o Cambodia NT-2
847150 Digital processing units not sold as complete systems Cambodia NT-2
847190 Automatic data processing equipment nes Cambodia NT-2
850132 DC motors, DC generators, of an output exceeding 750 with but not exceeding 75KW Cambodia NT-2
850490 Parts of electrical transformers, static converters and induc-tors Cambodia NT-2
850680 Primary cells & primary batteries nes Cambodia NT-1
851810 Microphones and stands therefor Cambodia NT-2
851821 Single loudspeakers, mounted in the same enclosure Cambodia NT-2
851829 Loudspeakers, nes Cambodia NT-2
852190 Video recording or reproducing apparatus nes Cambodia NT-1
852712 Pocket-size radio-cassette-players Cambodia NT-1
852713 Radio apparatus nes with sound recording/reproducing Cambodia NT-1
852990 Parts suitable for use solely/principally with the apparatus of headings 85.25 to 85.28 Cambodia NT-1
853720 Boards, panels, including numerical control panels, for a volt-age > 1,000 V Cambodia NT-2
850110 Electric motors of an output not exceeding 37.5 W Thailand NT-1
850132 DC motors, DC generators, of an output exceeding 750 with but not exceeding 75KW Thailand NT-1
850421 Liquid dielectric transformers having a power handling capac-ity </= 650 KVA Thailand NT-1
850422 Liquid dielectric transformer having a power handling cap >650 KVA but </= 10,000KVA Thailand NT-2
850680 Primary cells & primary batteries nes Thailand NT-2
851650 Microwave ovens Thailand NT-1
852721Radio receivers not capable of operation without external source of power for motor vehicle, combined with sound recording or reproducing apparatus
Thailand NT-1
852910 Aerials & aerial reflectors of all kinds; parts suitable for use therewith Thailand NT-1
852990 Parts suitable for use solely/principally with the apparatus of headings 85.25 to 85.28 Thailand NT-1
Table 34: List of Electronic Products which are in Sensitive List of ASEAN for China but not for India
Source: Ministry of Commerce, Government of India; China FTA Network; EXIM Bank Analysis

134
HS code Description Margin of Preference
852210 Pick-up cartridges 10
853180 Electric sound or visual signalling apparatus, nes 5
853190 Parts of electric sound or visual signalling apparatus 7
853223 Electrical capacitors, fixed, ceramic dielectric, single layer, nes 5
854020 Television camera tubes, image converter and other photo-cathode tubes 35
854040 Data/graphic display tubes, colour 20
854050 Data/graphic display tubes, monochrome 20
854060 Cathode-ray tubes, nes 20
854071 Magnetron tubes 50
854072 Klystron tubes 50
854081 Receiver or amplifier valves and tubes 10
901812 Ultrasonic scanning apparatus 15
902212 Computed tomography apparatus 10
902290 Parts & accessories for apparatus based on the use of X-rays or other radiations 10
902519 Thermometers, not combined with other instruments, nes 15
903039 Instruments and Apparatus, for measuring or checking volt-age, current, etc without a record dev 15
903089 Instruments & apparatus for measuring or checking electrical quantities nes 15
903281 Hydraulic or pneumatic automatic regulating or controlling instruments & app 15
903300 Parts & access nes for machines, appliances, instruments or apparatus of Chapter 90 20
961210 Typewriter or similar ribbons, prepared for giving impressions 10
961380 Lighters, nes 10
Table 35: Electronic Products where China has Preferential Access in Pakistan
Source: China FTA Network, EXIM Bank Analysis

135
are in the sensitive list of ASEAN countries for China are under the Normal Track-1 and Normal Track-2 list for India. Twenty three such products have been identified at the six digit level. For Normal Track-1 and Normal Track - 2 products, applied MFN tariff rates were to be reduced and subsequently eliminated over a period of time (Table 34). These products largely fall under the category of final electronic products and electronic subassemblies.
Agreement on South Asia Free Trade Area (SAFTA)
SAFTA is a free trade agreement among the countries of Bangladesh, Bhutan, India, Maldives, Nepal, Pakistan and Sri Lanka. Out of these countries, China has FTA only with Pakistan. However, even in Pakistan, China has margin of preference in only 21 commodities at HS 6-digit level (Table 35).
Investment in India will give Chinese companies access to the markets of SAARC countries. Although the market size of individual countries within SAARC might be small, collectively it is an attractive export destination.
India Japan CEPA
India has a trade agreement with Japan, while China doesn’t have any such agreement. Japan has given concessions to India on all electronic product categories.
India Korea CEPA
India also has a trade agreement with Korea, while China doesn’t have any such agreement. Except for the product category of other parts of automatic control panels, which has been put under the sensitive list, Korea has allowed concessions on all electronic products from India.

136
6. REVIEW OF SECURITY RELATED ISSUES: POLICIES IN CHINA AND INDIA
RELEVANT OVERSEAS DIRECT INVESTMENT REGULATIONS IN CHINA
The State Council published “Government-approved investment project directory (2013)” on 2nd December 2013 which significantly eased the process of approval and filing requirements for outbound investment projects from China. There are three key regulatory bodies for overseas investment in China. Of the following, NDRC is the most important entity for investment approvals:
• National Development and Reform Commission (NDRC)
• Ministry of Commerce (MOFCOM)
• State Administration of Foreign Exchange (SAFE)
Approval in the non-sensitive category of investment requires NDRC approval only if the size of overseas investment is greater than US$ 1 billion. For all other investment in the
non sensitive category, no approval is required, but filing is compulsory. In case of investment in sensitive countries or sensitive industries, both NDRC and MOFCOM approval is mandatory. Filing requirements also differ for Central State Owned Enterprises (SOEs) and entities other than Central SOEs.
The definition of sensitive countries and industries is not explicitly stated in the document. NDRC defines ‘sensitive countries’ as countries which have no diplomatic relations with China, or are under international sanctions, or are under situations of war and riot. Sensitive industries include segments like basic telecom operations, cross-border water resource development and utilization, large-scale land development, transmission lines, power grids, and news media.
From the point of view of electronics industry in India, approval require-ments for overseas investment by Chinese firm in power grids and basic telecom operations are a hurdle.

137
Use of power electronics in electricity network is crucial for fuller utilization of current assets, as well as for regulation of power. In the 12th Plan period, smart grid has been considered a key focus area. According to the Report of the Working Group on Power for the Twelfth Five Year Plan, smart grids having advanced metering infrastructure with two-way communications, along with customer interface, integration of renewable and electrical vehicles with the grid, intelligent sub-stations with self-healing, are emerging technologies
worldwide. Smart grids are expected to benefit many stakeholders, viz utilities, customers, the Government, and the regulators. The Ministry of Power, Government of India had also released a roadmap for development of the smart grid model.
Mandatory approvals from both NDRC and MOFCOM make the process of overseas investment from China into the power grid segment cumbersome. China has a relatively more developed electronics segment and could have immensely contributed
Investor Type Sensitivity Project Size NDRC
RequirementMOFCOM
Requirement
Entities other than Central SOEs
Non-Sensitive
<= US$ 300 million Local DRC Filing
Local MOFCOM Filing
> US$ 300 million; <= US$ 1 billion NDRC Filing Local MOFCOM
Filing
> US$ 1 billion NDRC Approval
Local MOFCOM Filing
Sensitive Countries/Regions or sensitive industries
All NDRC Approval
MOFCOM Approval
Central SOEs
Non-Sensitive<= US$ 1 billion NDRC Filing MOFCOM Filing
> US$ 1 billion NDRC Approval MOFCOM Filing
Sensitive Countries/Regions or sensitive industries
All NDRC Approval
MOFCOM Approval
Table 36: NDRC and MOFCOM Approval and Filing Requirements
Source: Covington & Burling LLP

138
towards greater deployment of power electronics in the power transmission and distribution segment, and also help towards the development of smart grid industry in India.
RELEVANT FOREIGN DIRECT INVESTMENT REGULATIONS IN INDIA
Foreign companies can make investments into India by incorporating a company as a joint venture or a wholly owned subsidiary under the Companies Act, 1956. They can also set up a liaison office, project office or a branch office which can undertake activities permitted under the Foreign Exchange Management (Establishment in India of Branch Office or Other Place of Business) Regulations, 2000. Country-specific restrictions exist for investments from China which are:
• Without prior permission of the Reserve Bank, no person being a citizen of Pakistan, Bangladesh, Sri Lanka, Afghanistan, Iran or China can establish in India, a Branch or a Liaison Office or a Project Office or any other place of business.
• Branch/Project Offices of a foreign entity, excluding a Liaison Office
are permitted to acquire property for their own use and to carry out permitted/incidental activities but not for leasing or renting out the property. However, entities from Pakistan, Bangladesh, Sri Lanka, Afghanistan, Iran, Bhutan or China are not allowed to acquire immovable property in India even for a Branch Office. These entities are allowed to lease such property for a period not exceeding five years.
• In those sectors where 100% FDI is permitted, RBI has provided the general permission for opening a branch office in SEZs for investors from all countries other than Pakistan, Afghanistan, Bangladesh, Sri Lanka, Iran and China.
In the electronic system design and manufacturing segment, 100% FDI is allowed under the automatic route. However, restrictions on investments exist in the segment of defence electronics. There restrictions emerge out of security concerns. Till recently, there were restrictions on brownfield investment in medical devices category, on account of lack of demarcation in policy for pharmaceuticals and medical devices. FDI up to 100% was permitted only

139
through the approval route in medical devices as well
Defence Electronics
In the Union Budget 2014-15, foreign investment in defence manufacturing sector has been raised from 26% to 49% with full Indian management and control under the Government approval route. Defence electronic items are largely covered in the M11 section of the munitions list54. Investment in defence electronics requires an industrial license and must comply with certain requirements as set by the Reserve Bank of India in Foreign Exchange Management (Transfer of Issue of Security by a Person Resident outside India) Regulations, 201355.
License for defence electronics is given only in close consultation with the Ministry of Defence, Government of India. Applicant of such a license
should also be an Indian company/ partnership firm. There is also no purchase guarantee for the products manufactured. There is a three year lock-in period for transfer of equity from one non-resident investor to another non-resident investor and such transfer is subject to prior approval of the Government. Arms and ammunitions produced by these manufacturers can’t be sold within the country to any other person or entity other than the Government entities. Moreover, export of these goods are also subject to policy as applicable to ordnance factories and defence PSUs. However, non-lethal items can be sold to persons or entities with prior approval from the Ministry of Defence, Government of India.
According to DIPP, defence industry attracted extremely low FDI during the period April 2000 to January 2014. Total FDI inflow into the sector during this period was a miniscule US$ 4.94 million.
54The full list of defence related items can be accessed from- http://dipp.nic.in/English/Inves-tor/Investers_Gudlines/defenceProducts_LicencingRequired_26April2013.pdf55Full list of requirements can be accessed from- http://rbidocs.rbi.org.in/rdocs/notification/PDFs/285NTI130913S.pdf

140
6. STRATEGY AND ROAD MAP
To neutralize India’s trade deficit in electronics goods, strategies may be undertaken as suggested under the following three broad heads: a) developing domestic electronic production capabilities, b) attracting investments from China in the electronics segment, and development of software industry to meet the needs of the Chinese market, and c) adopting good practices in the broader policy space. While the first two are specific to the electronics industry, the last one refers to a more general framework. It is imperative to improve India’s position on this general framework as the current day electronics production is characterized by global value chains. For India to become a significant part of such a value chain, it needs to adopt practices which other competing nations have adopted, and which can be viably adopted in the Indian case. Such a strategy would ease the process of doing business in the country, and as a result provide an opportunity for the country to be enmeshed in the global value chain.
Electronics industry consists of many segments and not all of them have the same kind of needs. Hence, it will be useful to look at the strategies not only from the overall perspective, but also at the segmental level.
DEVELOPING DOMESTIC CAPA-BILITIES
• Developing the Electronic Components category: Electronic components are the building blocks of a successful electronics industry. As has been observed in previous sections, its growth has been frail in India. Like India, Brazil also has seen a surge in the electronic components import. An influential effort has been taken by the Brazilian government in the form of Integrated Circuits Brazil (CI Brasil) program, from which cue can be taken by India. Established in 2007, this program has established training centers in ICT clusters and many semiconductor designers have graduated under this program. The program is taught in two training centres and the students receive a

141
support scholarship from the Brazilian National Council for Scientific and Technological Development. Under the program, the students are divided into three knowledge areas, where the designers get the following profiles:
- Digital Systems Design - Focus on the design of digital systems for medium and large companies, emphasizing the steps involved in the digital design flow for modern fabrication technologies;
- Mixed-Signals Systems Design- Focus on the design of basic analog electronic systems and interface, such as: operational amplifiers and comparators, analog to digital and digital to analog converters, phase - lock - loops and voltage controlled ascillators (VCOs);
- Radio Frequency Systems Design - Focus on blocks design used in integrated Radio Frequency communi-cation systems, such as: low noise amplifiers, Mixers, VCO, Frequency Synthesizers, Filters.
Such training help develop domestic technical pool. It is not that India is
aloof from such kind of initiatives. KarMic Training Centre, in India, is a rural VLSI training institute which offers specialized semiconductor design training to graduate engineers to prepare them for absorption into the design sector. Interestingly, it was a private initiative which absorbed these students upon graduation.
• Tax Related Incentives for Semiconductor Industry: Tax related incentives also go a long way in developing the electronics industry. Brazil started the Program for the Development of the Semiconductor and Display Industry (PADIS) which provides incentives for manufacture of semiconductor electronic devices, crystal and plasma displays and on-board chip systems. PADIS allows for several incentives, including zero percent corporate income tax for development and design, testing and packaging and diffusion (physical/chemical) processes. Countries like Japan, China and Taiwan also provide tax subsidy for manufacturing in the electronics and semiconductor manufacturing category, which is not provided in the Indian case. Japan provided subsidies and taxes under two laws- Machinery Industry Law (1956) and Electronics Industry Law (1957). Subsidies for R&D and loans, along with tax incentives were provided under these laws for firms

142
that developed or used advanced production technologies. In this direction, India recently provided for reimbursement of central taxes and duties in select high-tech units like fabs under the M-SIPS scheme. More such incentives along with simplification of tax structure are required.
• Venture Capital (VC) Invest-ment: Investment is crucial in the electronics industry and the Indian government has attempted to put emphasis on the VC funding route in the recent past. International experiences of VC in technology intensive industries have been quite positive. Chinese and Taiwanese semiconductor industries have expanded significantly as a result of VC investments. Israel also has a developed VC sector. The country had provided tax incentives to capital gains which had attracted foreign VC funds into the country.
In India, VC investment has more than doubled from US$ 600 million to US$ 1.4 billion between 2006 and 2012, principally driven by regulatory changes, including the elimination of tax on capital gains and the relaxation of rules preventing foreign investment.
However, bulk of the VC investment has been in the consumer services sector56.
Although VC firms might seem skeptical about their involvements in the electronics sector and might see these investments as high risk, low yield and unstable return, the government backing can help build trust in the sector. In Europe, the government supports VC in several ways. In Germany, the High-Tech Gründerfonds invests directly in emerging businesses which fund technology start-ups. The European Investment Fund, which is funded by member states of the European Union, also plays a key role through investment in VC growth funds.
• Setting Up of Clusters for Mobile Telecom: State of cluster development is considered as strength in the Indian case, among all other ways to promote innovation linkages57. It is essential to promote the concept of cluster development for mobile telecom in India, as the country has substantial prowess in the model of cluster development. Marshall (1919) was one of the pioneers in explaining the benefits from industrial clustering. Clusters of firms, predominantly in the same sector, could benefit by sharing
56Global venture capital insights and trends 2014, Ernst and Young57Global Innovation Report 2013

143
of sector-specific resources, skilled labor and also knowledge. These would minimize cost and promote efficiency seeking investment in this industry.
Finland’s “wireless valley” is an example of mobile telecom cluster which was a major component of “Mona” – a Finnish mobile services development program. The cluster comprised several related players, with terminal manufacturers (producing mobile phones) and network manufacturers (producing equipment needed for mobile networks) being a part of the core industries (Exhibit 44). A cluster for mobile telecom on similar lines can be set up in India.
• Development of Industrial Clusters for Medical Devices: Similarly, development of industrial clusters specifically for the medical devices industry would provide an impetus to the sector. In this regard, Gujarat Government has taken some initiatives, such as developing a specialized pharmaceutical machinery cluster in the State. More Central and State Government initiatives towards cluster development in this sector would help improve Indian capabilities in the segment.
• Guidance for Product Development in Medical Devices: US-FDA and European Medicines Agency give guidance to their national industry about product development. In a case study by
Exhibit 44: Map of the Finnish Mobile Cluster
Source: Helsinki (2002)

144
Szymon Jarosławski and Gayatri Saberwal (2013), lack of guidance and dialogue regarding product specifications has emerged as a major challenge for product innovations. The firms found it essential to engage with foreign regulatory agencies for their guidance, distinguishing their innovative products from other substandard ones and also to access global markets58. Such guidance needs to be provided by national regulatory agencies in India.
• Greater and More Transparent Procurement of Innovative Medical Devices: Share of general government expenditure on health as percentage of total expenditure on health in India has risen steadily over the years and is expected to continue
to rise. Given this trend, promotion of innovative technologies through government procurement is likely to gain significance (Exhibit 45).
Szymon Jarosławski and Gayatri Saberwal (2013) suggested greater government procurement of ‘innovative devices’ in the Indian case to encourage product innovations. The process of such procurement should also be made more transparent through use of evidence-based decision making59. Evidence-based practice is the use of the best available evidence together with a clinician’s expertise and a patient’s values and preferences in making health care decisions. Agencies in many European and Asian countries (like, Japan, Singapore and Malaysia)
58Szymon Jarosławski and Gayatri Saberwal (2013), Case studies of innovative medical device companies from India: barriers and enablers to development59Ibid.
Exhibit 45: General Government Expenditure on Health as Percentage of Total Expenditure on Health in India (%)
.0

145
appraise technologies and advise on their financing from public sources.
• Separate Regulatory Environ-ment for Medical Devices: Under the Drugs and Cosmetics Act, many medical devices have been currently notified as drugs. The difference between drugs and devices is stark. While drugs are based on chemistry and pharmacology, devices are based on engineering. While drug is regulated by licensing system, device is regulated by notified bodies in most countries. While in the case of a drug, the issue may be that of dosage, in the case of device, it may be of the size, especially in implantable devices. Moreover, the latter would be more risky than a drug, especially in later-phase trials. Industry and regulatory authorities have for long felt that provisions related to drugs can’t be applicable entirely for medical devices.
Not all medical devices have been classified as drugs. Those which are not considered “drugs” only require import or manufacturing license and no quality check system exists for them. Hence, Drugs and Cosmetics (Amendment) Bill, 2013 is an attempt towards specifying provisions specific to medical devices. For example, conditions have been specified under which medical devices shall be deemed to be misbranded,
adulterated, and spurious. The Bill needs speedy implementation.
• Stronger Linkages between Academia and Industry: Existing students and researchers engaged in biomedical engineering courses need to be motivated towards research suited to the development of medical devices in India through proper incentives. Through incentivizing research, India can enlarge the technical pool suited for a vibrant medical devices industry.
In promoting partnerships between industry and academia, India can take inspiration from the Innovation Law and Good Law of Brazil. These laws allowed automatic use of fiscal benefits for investment in R&D, without any need for a formal request.
Innovation Law has been enacted to strengthen the university-industry research relationship, promoting the shared use of science and technology infrastructure by research institutions and firms, allowing direct government grants for innovation in firms and stimulating the mobility of researchers within the S&T system. Public resources could be transferred as non-refundable funds for enterprises, sharing the costs and risks of innovative activities. The law permitted the creation of the Economic Subsidy Program, created in 2006

146
and coordinated by FINEP, which provides resources for research and development activities undertaken by industrial firms. Under this umbrella programme, four sub-programmes provide grants viz.: a) nationally competitive grants to firms of any size to develop new products and processes; b) grants to firms to hire researchers holding masters or PhD degrees; c) state-level competitive grants for innovation to small firms, to be implemented through partnerships of business federation, micro and small enterprises agency, etc.; and d) locally competitive milestone-based small grants to start-ups.
Good Law has been enacted in Brazil for authorizing the automatic use of fiscal benefits for companies that invest in R&D. The significant incentives under this Law include: deductions from income tax and social contributions on net profits from expenses on R&D (between 60% and 100%); reductions in the tax on industrial products for purchasing machines and equipment for R&D (50%); economic subsidies for scholarships of researchers in companies; and exemption from the Contribution for Intervention in the Economic Domain carried to payments of patent deposits. The Law also included provisions for funding firms which hire employees with Masters Degrees and PhDs.
• Creation of Fund for Promotion of Innovation in Analytical Instrument Category: A Fund can be created to support the premier science and technology related educational and research institutes in the country for the development of scientific instruments. Since, the amount of funding requirement can be quite large in case of some scientific instruments, programs of joint funding can be established with like-minded countries.
Joint funding in such analytical instruments can strengthen the scientific and technological capabilities of countries, leading to discovery and development of new knowledge, product, process or services, or improvement in existing knowledge, products, processes or services. India already has in place several cooperation agreements in the field of science and technology. However, there is need for more such agreements with focus on development of scientific instruments, in particular.
Motivation can be taken from the PRODEX program, which was a joint funding of European Union countries. It began in 1986 with the objective of providing funds “for the industrial development of scientific instruments or experiments, proposed by Institutes or Universities in the Participating

147
States that have been selected by European Space Agency for one of its programs in the various fields of space research (science, microgravity, earth observation, etc).”
• Creation of a Fund for Computer Hardware Component Production: In 2012-13, imported raw materials accounted for 78.7% of the total raw materials consumed by the computer hardware industry, as per the sample of companies taken from CMIE Prowess Database. The ratio was higher in comparison to the ratio in other sub-categories of communication equipment and other electronics. Around 46.1% of operating expenses incurred by this industry category has been on account of raw materials, stores and spares, which is indicative of immense potential which exists for electronic component producers (Exhibit 46).
According to Prathap (2013), value added in the electronics industry of India is merely 5-10%, with electronic giants like Samsung, Dell and Hewlett Packard importing nearly 90% of their electronic components. There is a need to increase the value added production of electronics in India. Boosting production of electronic components and subassemblies
gains greater significance in this context as substantial value addition happens at the components and subassembly stage of an electronics manufacturing process, contrary to other manufacturing activities. Many of the processes at these initial stages are capital and skill intensive (Pratap, 2013)60. Hence, for lowering the import intensity in this category and increasing the domestic value added production, promotion of production of computer hardware components is crucial.
Inspiration can be taken from the Electronics Industry Development Fund (EIDF) which was set up in China in 1986. It was first set up to support R&D and production of four key electronic products: integrated circuits, computers, software and program-controlled switching devices. Producers that were eligible to apply for support from the Fund had to meet the criteria of state-owned status and high local content of their products. The Fund later enlarged its support to include all major electronic products, components, and to include non-state owned firms61. A project catalogue was issued every year for identification of priority fields and grants were allocated through a combination of bidding and application by companies. The grants took the form of direct
60Surendra Pratap (2013), Workers in the Supply Chain of Electronics Industry in India: The Case of Samsung.61Zhongxiu Zhao et al. / 33 - 51, Vol. 15, N0. 3, 2007

148
Exhibit 46: Components of Operating Expenses of Computers, Peripherals and Storage Devices Industry
grants, loan interest subsidies, and capital investment.
ATTRACTING INVESTMENT FROM CHINA
• Development of Infrastructural Facilities: Infrastructure is an important element for attracting investments. This is especially important in the case of electronics industry because of large presence of global value chains which require
swift movement of goods across the nations. However, the current state of infrastructure and logistic services in India is inadequate. According to the World Bank’s Logistics Performance Index 2014, India is ranked 54th out of 160 countries which reflects of the relatively poor state of infrastructure and logistics. The index which lies in between values 1 and 5, takes into account “efficiency of customs clearance process, quality of trade and transport related infrastructure,

149
ease of arranging competitively priced shipments, quality of logistic services, ability to track and trace consignments, and frequency with which shipments reach the consignee within the scheduled time”. Germany was the best performing nation with an index of 4.12 in 2014, followed by the Netherlands (4.05), Belgium (4.04), United Kingdom (4.01) and Singapore (4.00) (Table 37). Holding other factors constant, Kumar (2001) had shown that infrastructure availability contributes to the FDI attractiveness of a country and also that export orientation of production of investing firms is significantly related to the infrastructure of the country62. Countries like Singapore and Hong Kong which rank high on the logistics performance index have attracted large investments in their electronics industries and established
an important presence in the global value chain for electronics. Hence, infrastructure development will have a crucial role to play in attracting FDI in the industry.
• Human Resource Development: India has not been able to use its human resources to the fullest. China has been able to utilize its labor effectively, as a result of which its GDP per person employed (constant 1990 PPP $) in 2011 stood at US$ 14,196, witnessing growth rates in the range of 8-9% during the last five years. For India, on the other hand, GDP per person employed was US$ 8,939 in 2011 after witnessing a moderation in y-o-y growth rate. Electronics companies require workforce with diverse knowledge and skills, and as the industry moves on a path with greater technological innovations,
Country Name 2014 2012 2010 2007
Germany 4.12 4.03 4.11 4.10
The Netherlands 4.05 4.02 4.07 4.18
Belgium 4.04 3.98 3.94 3.89
United Kingdom 4.01 3.90 3.95 3.99
Singapore 4.00 4.13 4.09 4.19
India 3.08 3.08 3.12 3.07
Table 37: Top Performing Nations in Logistics Performance Index
Source: World Bank
62Nagesh Kumar (2001), Infrastructure Availability, Foreign Direct Investment Inflows and Their Export-orientation: A Cross-Country Exploration.

150
the worker profile needs greater education and training. Without such a knowledge base, the conversion of sand to integrated circuits is an impossible task. In light of this, education standards in India needs to be synchronized with the industry requirements; it may be mentioned that only 9.8% of the labor force in India have had tertiary education in 2010 (Exhibit 47).
As per a Report by NSDC on Human Resource and Skill Requirements in the Electronics and IT Hardware Industry, the incremental requirement in India for level-2 and level-3 (which require technical knowledge and long drawn preparations) in the industry
will be the highest at 25-27% and 49-50%, respectively, in 2022. In order to attract investment into this industry, workforce needs to be trained as per the industry requirements.
The Right to Education Act has been successful in extending the reach of primary education in the country, with India inching towards achieving universal enrollments63. However, the scenario is not positive in higher education. In 2010, India’s Gross Enrolment Ratio (GER) was only 16% as compared to the world average of 27%. It also fared poorly in terms of other emerging economies like China and Brazil which had 26% and 36% GER, respectively64. One major
Exhibit 47: Distribution of Labour Force based on Educational Attainment (2010)
63ASER Survey
Source: World Bank, EXIM Bank Analysis
64Higher Education in India: Twelfth Five Year Plan(2012–2017) and beyond

151
problem which has emerged out of the studies concerning the education sector has been the presence of significant regulatory roadblocks like limitations on entry by foreign universities, and collaboration with foreign players. These regulatory hurdles need to be addressed, especially since the role of private players in higher education has been growing at a rapid pace.
• Enlarging the Technical Pool Required for Medical Devices: The number of colleges offering biomedical engineering/ bio-engineering courses in India is not much. Biomedical engineering is an interdisciplinary subject in which engineering and technology
is applied to medicine, surgery and healthcare of humans and other higher forms of life. It mainly involves bio-instrumentation, biomaterials, imaging, and biomedical devices. Such programs need to be promoted in more number of institutions, so that the skill set required for manufacture of medical electronics is enhanced.
• Creating Greater Market for Analytical Instruments through R&D Promotion: India ranks fairly low in gross expenditure on R&D (ranked 44th) and only 33.9% of it is financed by business enterprises. China on the other hand has 71.7% of its R&D by business enterprises (Table 38). R&D promotion will serve the dual purpose
Exhibit 48: Skill Requirements for the Industry by 2022
Source: NSDC

152
of creating robust innovation base in India and also create a greater market for electronic goods in India.
Israel, which ranks topmost in GERD (Gross Expenditure on R&D) had come up with novel ways to encourage R&D in the economy. It has got plethora of domestic R&D programs which can be categorized into-competitive R&D, pre-seed and seed programs, and pre-competitive and long-term R&D programs, along with crucial international cooperation R&D. India has already taken many steps to promote R&D in the country, but needs to focus more on incentivizing the business enterprises
and promoting collaborations among institutions.
In Israel, Life Sciences Fund has been created to bring about growth in the biotechnology industry. The Government of Israel had selected a private healthcare investment firm, Orbimed Partners, Israel, in an open tender to become the Fund’s general partner and its manager. The Fund is structured as a standard venture capital fund and capital commitments in a limited way has been made by the Israeli Government as a minority partner. Another initiative by the Israeli Government was setting up of Tnufa which is a national pre-seed
Rank Country GERD as % of GDP % financed by business enterprises
1 Israel 4.4 39.0
2 Finland 3.8 67.0
3 South Korea 3.7 71.8
4 Sweden 3.4 58.2
5 Japan 3.3 75.9
6 Denmark 3.1 60.2
7 Switzerland 2.9 68.2
8 Germany 2.8 65.6
9 Austria 2.8 44.6
10 United States 2.8 60.0
21 China 1.8 71.7
43 India 0.8 33.9
Table 38: Ranking of Countries Based on Gross Expenditure on R&D
Source: Global Innovation Report 2013

153
fund. It assists individual inventors and nascent start-up companies during the earliest stages of their projects. This includes evaluation of the technological and commercial potential of a project, filing for a patent, building a prototype, drafting a business plan and initial business development.
Apart from these, Bi-national Industrial R&D (BIRD) Foundation for joint R&D between American and Israeli companies has also been set up. Under this, one Israeli and one American company can jointly apply for BIRD support as long as they have combined capability and infrastructure to define, develop, manufacture, market, sell and support an innovative product based on industrial R&D. The BIRD Foundation offers conditional grants for joint development projects on a risk-sharing basis. The Foundation funds up to 50% of each company’s R&D expenses associated with the joint project. Repayments are due only if commercial revenues are generated as a direct result of the project. Israel has also set up other bi-national funds like SIIRD (Singapore), CIIRDF (Canada), KORIL-RDF (Korea) and US-Israel Science & Technology commission and Foundation.
• Favorable Duty Structure for Final Electronics Exports: The duty structure should be such that it should favour the production of final electronics goods over the components and subassemblies, and also support the domestic production over imports. China had established an export processing policy wherein raw materials such as parts and components and other intermediate imported goods did not have any duty imposed, as long as they were used to produce export goods. However in the Indian case, there exists no such enabling environment.
While there is no import duty on finished products, the Government has put tariff barriers on electronic components required to manufacture telecom hardware (Chattopadhyay, 2013)65. For example, while most of the six final electronics products in the category of phones, fax machines, and routers do not face basic custom duty (average effective rate of duty- 18.1%), electronic integrated circuits: Other (Hs code: 85423900) faces basic customs duty of 7.5% (effective rate of duty- 21.6%). Simplifying the taxes in favour of domestic manufacturing is essential. Preferential laws for usage of domestic products can also help incentivize investments.
65Utpal Chattopadhyay (2013), Making India a Telecom Manufacturing Hub: Emerging Issues and Challenges.

154
ADOPTION OF GOOD PRACTICES FOR DOING BUSINESS
Both India and China have put policies in place for development of the electronics industry. These policies in the spheres of taxation, manufacturing, science and technology, and trade, provide opportunities for businesses to expand. Some of the policies have a parallel in both the countries. Annexure 4 provides a detailed account of these policies.
India ranks fairly low in terms of starting a business. India does not have one-stop shop for business registration which is considered a good practice under this methodology, and this practice is being currently adopted by 96 economies across the world. Many economies adopting this practice have reported increased firm registrations. According to the Doing Business Report, this practice led to 17% increase in new firm registrations in Portugal.
Moreover, the minimum capital requirement which is basically intended to protect investors is also being reduced or eliminated across many countries, in order to boost the activity of small entrepreneurs. It has also been noted that the recovery rates in the case of bankruptcy is no higher in economies which have
adopted such a practice from those who have not.
With regard to paying of taxes, India has adopted most good practices except one tax per tax base. One tax per tax base basically implies simplification of the tax structure. Multiple taxations makes doing business difficult as it increases the compliance time, complicates tax administration and also increases the cost of revenue administration. This can significantly hurt investor confidence. Implementation of GST can significantly help simplify the tax structure in India.
As far as trading across borders is concerned, India has adopted only one of the three good practices. It neither uses risk based inspection, nor has a single window that integrates some of the relevant government agencies. Countries have reported benefits from the implementation of single window systems. According to the Doing Business Report, Korea Customs Service estimated US$ 18 million of benefits in 2010 from the single-window system and a total of US$ 3.47 billion from all its trade facilitation efforts. India also does not have a system of risk based inspection which limits the physical opening of containers through the use of risk profiles. India should adopt such

155
trade facilitating measures, especially keeping in mind the ensuing WTO Agreement on Trade Facilitation.
India has not adopted any of the good practices in enforcing contracts. This will require setting up of specialized courts for handling commercial disputes and allowing for electronic filing of complaints.
DEVELOPMENT OF SOFTWARE INDUSTRY
As discussed earlier, ERP and SCM are important segments in China’s enterprise application market. In
the ERP segment, Indian software companies need to provide more customized products and should also try to provide on-site delivery which is an important consideration for the Chinese customers. Indian players will also have to familiarize with the Chinese business culture and language as it is another important factor for Chinese ERP demand. Moreover, the business process-related functions of ERP system (like SCM) are more in demand in the Chinese market. So, there should be more emphasis on this particular segment.
Topic Good Practices
Starting a BusinessCan procedures be completed online? Is there a one-stop shop? Is there no paid-in minimum capital requirement?
Paying Taxes
Is electronic filing and payment available and used by major-ity of firms? Is self-assessment allowed? Is there one tax per tax base?
Trading Across Borders
Are risk-based inspections used? Is electronic submission and processing allowed?Is there a single window that links some of the relevant gov-ernment agencies?
Enforcing Contracts Is electronic filing of complaints allowed? Is there a specialized commercial court, division or judge?
Table 39: Good Practices in Areas Where India Performed Relatively Poor in Doing Business Index
Source: Doing Business, World Bank, EXIM Bank Analysis

156
SUM UP
Several steps have been taken towards the improvement of electronics industry in recent times by the Government of India, including the seminal National Electronics Policy 2012 (NEP), which envisages achieving a turnover of about US$ 400 billion by 2020. The policies enshrined in the NEP need to move in tandem with exploring opportunities presented by the electronics market in China, and attracting Chinese investors.
Going forward, rapid urbanization, rising personal disposable income, adoption of high-end technology devices, high rate of technology obsole-scence and product innovation, competitive pricing of products, easy financing schemes, expansion of organized retail and distribution networks, and several government initiatives are going to be the major drivers for the electronics
industry in India. On the back of these, there exists huge opportunity for the domestic manufacturers.
Select strategies for development of domestic capabilities and encouragement of FDI like establishment of training centres for electronic components production; promoting venture capital investment; development of dedicated clusters on the lines of Finnish mobile telecom cluster; guidance for product development, and strengthening of regulatory environment in the category of medical devices; development of stronger linkages between academia and industry; incentivizing innovative products through Government procurement as in the case of several countries like Japan, Singapore, European countries and Malaysia; engagement in international co-operation on R&D and electronics production; and streamlining tax structure, can help create an enabling environment for the domestic manufacturing.

157
HS Code Commodity Name Category Final Sub-
Category
850421 Liquid dielectric transformers having a power handling capacity </= 650 KVA Component -
850422 Liquid dielectric transformers having a power han-dling capacity >650 KVA but </= 10,000KVA Component -
850440 Static converters, nes Component -
850490 Parts of electrical transformers, static converters and inductors Component -
850511 Permanent magnets & articles intended to become permanent magnets, of metal Component -
850519 Permanent magnets & articles intended to become permanent magnets, nes Component -
853400 Printed circuits Component -
853649 Electrical relays for a voltage exceeding 60 V but not exceeding 1,000 volts Component -
853810 Boards, panels, etc for goods of heading no. 85.37,not equipped with their apparatus Component -
853890 Parts for use with the apparatus of heading no. 85.35,85.36 or 85.37,nes Component -
854011 Cathode-ray television picture tubes, including video monitor tubes, colour Component -
854140 Photosensitive semiconductor device, photovoltaic cells & light emit diodes Component -
850450 Inductors, electric Component -
853210 Fixed capacitors designed for use in 50/60 Hz circuits (power capacitors) Component -
853222 Electrical capacitors, fixed, aluminium electrolytic, nes Component -
853229 Electrical capacitors, fixed, nes Component -
853230 Electrical capacitors, variable or adjustable (pre-set) Component -
ANNEXURE I: CATEGORIZATION OF HS CODES IN THE ELECTRONICS SECTOR

158
853340 Variable resistors, including rheostats and poten-tiometers, nes Component -
853641 Electrical relays for a voltage not exceeding 60 volts Component -
854232 Electronic integrated circuits as memories Component -
961210 Typewriter or similar ribbons, prepared for giving impressions Component -
853290 Parts of electrical capacitors Component -
854129 Transistors, other than photosensitive transistors, nes Component -
854231Electronic integrated circuits as processors and controllers, whether or not combined with memo-ries
Component -
854290 Parts of electronic integrated circuits and micro assemblies Component -
853331 Wirewound variable resistors, including rheostat & potentiometers </=20 W Component -
854130 Thyristors, diacs and triacs, other than photosensi-tive devices Component -
854190 Parts of mounted piezo-electric crystals and semi-conductor devices Component -
854239 Electronic integrated circuits excluding such as processors, controllers Component -
854079 Microwave tubes, nes Component -
854089 Valve and tubes, nes Component -
853321 Electrical resistors fixed for a power handling capacity not exceeding 20 W Component -
854150 Semiconductor devices, nes Component -
854160 Mounted piezo-electric crystals Component -
853339 Wirewound variable resistors, including rheostat and potentiometers, nes Component -
854110 Diodes, other than photosensitive or light emitting diodes Component -
853225 Electrical capacitors, fixed, dielectric of paper or plastics, nes Component -
853310 Electrical resistors, fixed carbon, composition or film type Component -
853329 Electrical resistors, fixed, other than heating resis-tors, nes Component -
853390 Parts of electrical resistors, rheostats and poten-tiometers Component -

159
854121 Transistors, other than photosensitive, with a dis-sipation rate < 1 W Component -
854233 Electronic integrated circuits as amplifiers Component -
854099 Parts of valve and tubes, nes Component -
853224 Electrical capacitors, fixed, ceramic dielectric, multilayer, nes Component -
854081 Receiver or amplifier valves and tubes Component -
853221 Electrical capacitors, fixed, tantalum, nes Component -
853223 Electrical capacitors, fixed, ceramic dielectric, single layer, nes Component -
854020 Television camera tubes, image converter and other photocathode tubes Component -
854040 Data/graphic display tubes, colour Component -
854060 Cathode-ray tubes, nes Component -
854050 Data/graphic display tubes, monochrome Component -
854072 Klystron tubes Component -
854071 Magnetron tubes Component -
854091 Parts of cathode-ray tubes Component -
854012 Cathode-ray TV picture tube including video moni-tor tube, B&W/other monochrome Component -
847330 Parts & accessories of automatic data processing machines & units thereof
Subassem-blies -
847340 Parts and accessories of other office machines, nes
Subassem-blies -
847350 Parts and accessories for more than one office machine
Subassem-blies -
850110 Electric motors of an output not exceeding 37.5 W
Subassem-blies -
850132 DC motors, DC generators, of an output exceeding 750 with but not exceeding 75KW
Subassem-blies -
850133 DC motors, DC generators, of an output exceeding 75 KW but not > 375KW
Subassem-blies -
851770 Parts of telephone sets, telephones for cellular networks or for other data
Subassem-blies -
852910 Aerials & aerial reflectors of all kinds; parts suitable for use therewith
Subassem-blies -
853190 Parts of electric sound or visual signalling ap-paratus
Subassem-blies -
853710 Boards, panels, including numerical control panels ,for a voltage <=1000 V
Subassem-blies -

160
853720 Boards, panels, including numerical control panels, for a voltage > 1,000 V
Subassem-blies -
901590 Parts and accessories for use with the apparatus of heading No 90.15
Subassem-blies -
903090 Parts & access for instruments & apparatus for measuring or checking electrical quantities
Subassem-blies -
903300 Parts & access nes for machines, appliances, instruments or apparatus of Chapter 90
Subassem-blies -
851120 Ignition magnetos, magneto-generators and mag-netic flywheels
Subassem-blies -
852990 Parts suitable for use solely/principally with the apparatus of headings 85.25 to 85.28
Subassem-blies -
847329 Parts and accessories of calculating & accounting machines, nes
Subassem-blies -
850680 Primary cells & primary batteries nes Subassem-blies -
851890 Parts of microphones, loudspeakers, headphones, earphones & electrical sound amplifiers
Subassem-blies -
852290 Parts and accessories of apparatus of heading Nos 85.19 to 85.21, nes
Subassem-blies -
854390 Parts of electrical machines & apparatus having individual functions, nes
Subassem-blies -
901320 Lasers, other than laser diodes Subassem-blies -
901290 Parts and accessories for microscopes other than optical microscopes
Subassem-blies -
847310 Parts & accessories of typewriters & word-pro-cessing machines, o/t cases
Subassem-blies -
847321 Parts & accessories of electronic calculating ma-chines of heading No 84.70 nes
Subassem-blies -
852210 Pick-up cartridges Subassem-blies -
910911 Clock movements, complete & assembled, battery powered, for alarm clocks
Subassem-blies -
910919 Clock movements, complete and assembled, bat-tery powered, nes
Subassem-blies -
910811 Watch movements, assembled, battery powered with mechanical display
Subassem-blies -
910812 Watch movements, assembled, battery powered, with opto-electronic display
Subassem-blies -
901390 Parts and accessories of optical appliances and instruments, nes
Subassem-blies -

161
854320 Signal generators Final Analytical Instruments
854370 Electrical machines and apparatus, having indi-vidual functions, nes Final Analytical
Instruments
901210 Microscopes other than optical microscopes and diffraction apparatus Final Analytical
Instruments
901580 Surveying, hydrographic, oceanographic, meteo-rologic/geophysical instruments nes Final Analytical
Instruments
903010 Instruments & apparatus for measuring or detect-ing ionising radiations Final Analytical
Instruments
903033 Instruments and apparatus for measuring or checking voltage, current Final Analytical
Instruments
903210 Thermostats Final Analytical Instruments
854310 Electrical particle accelerators for electrons, pro-tons, etc Final Analytical
Instruments
854330 Machines & apparatus for electroplating, electroly-sis or electrophoresis Final Analytical
Instruments
901600 Balances of a sensitivity of 5 cg or better with or without weights Final Analytical
Instruments
902519 Thermometers, not combined with other instru-ments, nes Final Analytical
Instruments
903084 Instruments and appliances for measuring or checking electrical quantities Final Analytical
Instruments
903089 Instruments & apparatus for measuring or check-ing electrical quantities nes Final Analytical
Instruments
903289 Automatic regulating or controlling instruments and apparatus, nes Final Analytical
Instruments
901720 Drawing, marking-out or mathematical calculating instruments, nes Final Analytical
Instruments
903031 Multimeters Final Analytical Instruments
903020 Cathode-ray oscilloscopes and cathoderay oscil-lographs Final Analytical
Instruments
903039Instruments and Apparatus, for measuring or checking voltage, current, etc without a record dev
Final Analytical Instruments
903281 Hydraulic or pneumatic automatic regulating or controlling instruments & app Final Analytical
Instruments
903220 Manostats Final Analytical Instruments
903040 Instruments & apparatus, specially designed for telecommunications nes Final Analytical
Instruments

162
903032 Multimeters with recording device Final Analytical Instruments
903082 Instruments for checking semiconductor wafers Final Analytical Instruments
901420 Instruments & appliances for aeronautical/space navigation (other than compasses) Final Analytical
Instruments
901480 Navigational instruments and appliances nes Final Analytical Instruments
852580 Television cameras, digital cameras and video camera recorders Final Cameras and
projectors
852869 Projectors, not incorporating television reception apparatus Final Cameras and
projectors
852861 Projectors of a kind solely or principally used in an automatic data-processing system Final Cameras and
projectors
910521 Wall clocks, battery, accumulator or mains pow-ered Final Clocks &
Watches
910191 Pocket-watches & other watches battery powered & with case of precious metal Final Clocks &
Watches
910610 Time-registers; time-recorders Final Clocks & Watches
910511 Alarm clocks, battery, accumulator or mains powered Final Clocks &
Watches
910591 Clocks, nes, battery, accumulator or mains pow-ered Final Clocks &
Watches
910291 Pocket-watches and other watches battery or ac-cumulator powered, nes Final Clocks &
Watches
910310 Clocks with watch movements, battery/accumula-tor powered, excluding clocks of 9104 Final Clocks &
Watches
910212 Wrist-watches, battery/accumulator powered with opto-electronic display only, nes Final Clocks &
Watches
847141 Non-portable digital edp machines with proces-sor & i/o Final Computer and
storage devices
847190 Automatic data processing equipment nes Final Computer and storage devices
847130 Portable digital computers <10kg Final Computer and storage devices
847150 Digital processing units not sold as complete systems Final Computer and
storage devices
847160 Computer input/outputs, with/without storage Final Computer and storage devices
847170 Computer data storage units Final Computer and storage devices

163
847149 Digital data processing systems, nes Final Computer and storage devices
847180 Units of automatic data processing equipment nes Final Computer and
storage devices901812 Ultrasonic scanning apparatus Final Medical
901819 Electro-diagnostic apparatus, nes Final Medical
902214 X-rays apparatus, medical/surgical/veterinary use nes Final Medical
902219 Apparatus based on the use of X-rays for other uses Final Medical
902230 X-ray tubes Final Medical
902290 Parts & accessories for apparatus based on the use of X-rays or other radiations Final Medical
901811 Electro-cardiographs Final Medical
901813 Magnetic resonance imaging apparatus Final Medical
901890 Instruments and appliances used in medical or veterinary sciences, nes Final Medical
901814 Scintigraphic apparatus Final Medical
902140 Hearing aids, excluding parts and accessories Final Medical
902221 Apparatus based on the use of alpha beta/gamma radiations, for medical use Final Medical
901820 Ultra-violet or infra-red ray apparatus Final Medical
902229 Apparatus based on the use of alpha beta/gamma radiations, for other uses Final Medical
902212 Computed tomography apparatus Final Medical
902213 X-rays apparatus, dental use, nes Final Medical
902150 Pacemakers for stimulating heart muscles, exclud-ing parts & accessories Final Medical
847029 Electronic calculating machines, nes Final Officeequipment
847010 Electronic calculators capable of operation without an external source of power Final Office
equipment
847030 Calculating machines, nes Final Office equipment
847050 Cash registers Final Office equipment
847021 Electronic calculating machines, incorporating a printing device, nes Final Office
equipment853110 Burglar or fire alarms and similar apparatus Final Others
851650 Microwave ovens Final Others

164
853180 Electric sound or visual signalling apparatus, nes Final Others
961380 Lighters, nes Final Others
853120 Indicator panels incorporating liquid crystal device/light emitting diode Final Others
910690 Time of day recording apparatus, nes Final Others
950410 Video games of a kind used with a television receiver Final Others
851711 Line telephone sets with cordless handsets FinalPhones, Fax Machines, &
Routers
851712 Telephones for cellular networks mobile tele-phones or for other wireless Final
Phones, Fax Machines, &
Routers
851718 Telephone sets excluding line telephone sets with cordless handsets Final
Phones, Fax Machines, and
Routers
851762 Machines for the reception, conversion and trans-mission or regeneration Final
Phones, Fax Machines, and
Routers
851769 Apparatus for the transmission or reception of voice, images or other data Final
Phones, Fax Machines, and
Routers
851761 Base stations of apparatus for the transmission or reception of voice Final
Phones, Fax Machines, and
Routers
852610 Radar apparatus Final
Radar and Radio Navigation Equipment
852691 Radio navigational aid apparatus Final
Radar and Radio Navigation Equipment
852692 Radio remote control apparatus Final
Radar and Radio Navigation Equipment
852550 Transmission apparatus for radio-broadcasting or television, not incorporating reception apparatus Final Radio and TV
Transmission
852560 Transmission apparatus for radio-broadcasting or television, incorporating reception apparatus Final Radio and TV
Transmission
852712 Pocket-size radio-cassette-players Final Radios and Alarm Clocks

165
852713 Radio apparatus nes with sound recording/re-producing Final Radios and
Alarm Clocks
852799Radio-broadcast receivers, for mains operation only, not combined with sound recording or repro-ducing apparatus and not combined with a clock
Final Radios and Alarm Clocks
852729 Radio receivers not capable of operation without external source of power for motor vehicles, nes Final Radios and
Alarm Clocks
852719 Radio broad receivers capable of operation without an external source of power, nes Final Radios and
Alarm Clocks
852721
Radio receivers not capable of operation with-out external source of power for motor vehicle, combined with sound recording or reproducing apparatus
Final Radios and Alarm Clocks
852791 Radio-broadcast receivers, for mains operation only, combined with source Final Radios and
Alarm Clocks
852792Radio-broadcast receivers, for mains operation only, not combined with sound recording/reproduc-ing apparatus but combined with a clock
Final Radios and Alarm Clocks
851989Sound recording or sound reproducing apparatus excluding using magnetic, optical or semiconduc-tor media
Final
Sound and Video Recording Devices
852340 Optical media for the recording of sound or of other phenomena excluding products of chapter 37 Final
Sound and Video Recording Devices
852352 Cards incorporating one or more electronic inte-grated circuits smart cards Final
Sound and Video Recording Devices
852380Gramophone records and other media for the re-cording of sound or of other phenomena, whether or not recorded
Final
Sound and Video Recording Devices
852110 Video recording or reproducing apparatus mag-netic tape-type Final
Sound and Video Recording Devices
852190 Video recording or reproducing apparatus nes Final
Sound and Video Recording Devices

166
852351 Solid-state, non-volatile data storage devices for recording data from an external source Final
Sound and Video Recording Devices
852329Magnetic media for the recording of sound or of other phenomena excluding cards incorporating a magnetic stripe and goods of chapter 37
Final
Sound and Video Recording Devices
851930 Turntables record-decks Final
Sound and Video Recording Devices
852321 Cards incorporating a magnetic stripe for the re-cording of sound or of other phenomena Final
Sound and Video Recording Devices
851950 Telephone answering machines Final
Sound and Video Recording Devices
852359 Semiconductor media, unrecorded, for the record-ing of sound or of other phenomena Final
Sound and Video Recording Devices
851981 Sound recording or sound reproducing apparatus, using magnetic, optical or semiconductor media Final
Sound and Video Recording Devices
851920Sound recording or sound reproducing apparatus, operated by coins, banknotes, bank cards, tokens or by other means of payment
Final
Sound and Video Recording Devices
851810 Microphones and stands therefor Final Sound projection
851829 Loudspeakers, nes Final Sound projection
851830 Headphones, earphones and combined micro-phone/speaker sets Final Sound
projection
851840 Audio-frequency electric amplifiers Final Sound projection
851850 Electric sound amplifier sets Final Sound projection
851821 Single loudspeakers, mounted in the same en-closure Final Sound
projection

167
851822 Multiple loudspeakers, mounted in the same enclosure Final Sound
projection
852849 Cathode-ray tube monitors, not incorporating television reception apparatus Final Television and
Monitors
852859 Monitors, not incorporating television reception apparatus Final Television and
Monitors
852871 Reception apparatus for television, whether or not incorporating radio Final Television and
Monitors
852872 Reception apparatus for television, colour, whether or not incorporating radio Final Television and
Monitors
852873 Reception apparatus for television, black and white or other monochrome Final Television and
Monitors
852851 Monitors of a kind solely or principally used in an automatic data-processing system Final Television and
Monitors
852841Cathode-ray tube monitors of a kind solely or principally used in an automatic data-processing machine of heading 8471
Final Television andMonitors
Source: Stracery

168
HS Code Category Product Description
China’s Imports,
2012(US$ mn)
India’s Imports,
2012 (US$ mn)
854140 Component Photosensitive semiconductor device, photovoltaic cells and light emitting diodes
4422.12 871.94
850440 Component Static converters, nes 4616.61 715.32
850490 Component Parts of electrical transformers, static converters and inductors 1188.62 311.33
854011 Component Cathode-ray television picture tubes, including video monitor tubes, colour 224.47 175.67
853649 Component Electrical relays for a voltage exceed-ing 60 V but not exceeding 1,000 volts 212.55 147.63
850511 Component Permanent magnets and art intended to become permanent magnets of metal
438.49 76.48
854130 Component Transistors, diodes and triodes, other than photosensitive devices 217.13 50.50
853641 Component Electrical relays for a voltage not exceeding 60 volts 388.86 41.42
961210 Component Typewriter or similar ribbons, prepared for giving impressions 68.20 30.49
850519 Component Permanent magnets and articles in-tended to become permanent magnets 199.75 28.95
854091 Component Parts of cathode-ray tubes 122.29 16.75
853210 Component Fixed capacitors designed for use in 50/60 Hz circuits (power capacitors) 61.59 13.41
854370Final goods (Analytical Instruments)
Electrical machines and apparatus, having individual functions, nes 1399.50 403.61
903210Final goods (Analytical Instruments)
Thermostats 191.26 20.10
902519Final goods (Analytical Instruments)
Thermometers, not combined with other instruments, nes 59.53 13.94
ANNEXURE 2: PRODUCTS IN WHICH INVESTMENT FROM CHINA COULD BE ATTRACTED

169
852580
Final goods (Cameras and projec-tors)
Television cameras, digital cameras and video camera recorders 3187.85 584.54
847130
Final goods (Computer and storage devices)
Portable digital computers <10kg 396.52 2022.98
847150
Final goods (Computer and storage devices)
Digital processing units not sold as complete systems 1110.69 688.34
847160
Final goods (Computer and storage devices)
Computer input/outputs, with/without storage 768.06 267.73
847180
Final goods (Computer and storage devices)
Units of automatic data processing equipment and nes 1210.63 99.40
847149
Final goods (Computer and storage devices)
Digital data processing systems, nes 1296.64 58.47
847141
Final goods (Computer and storage devices)
Non-portable digital edp machines with processor and i/o 417.27 58.32
847190
Final goods (Computer and storage devices)
Automatic data processing equipment nes 299.15 53.16
901819 Final goods (Medical) Electro-diagnostic apparatus, nes 147.01 121.22
902214 Final goods (Medical)
X-rays apparatus, medical/surgical/veterinary use, nes 373.10 90.72
902140 Final goods (Medical)
Hearing aids, excluding parts and ac-cessories 69.80 46.83
847010Final goods (Office equipment)
Electronic calculators capable of operation without an external source of power
78.44 23.08
847050Final goods (Office equipment)
Cash registers 95.81 11.85
853120 Final goods (Others)
Indicator panels incorporating liquid crystal device/light emitting diode 321.20 27.17

170
853180 Final goods (Others)
Electric sound or visual signalling ap-paratus, nes 99.07 27.00
853110 Final goods (Others)
Burglar or fire alarms and similar ap-paratus 99.46 21.39
851712
Final goods (Phones, Fax Ma-chines, and Routers)
Telephones for cellular networks mo-bile telephones or for other wireless 1858.36 4591.36
851762
Final goods (Phones, Fax Ma-chines, and Routers)
Machines for the reception, conversion and transmission or regeneration 3099.81 1052.22
851769
Final goods (Phones, Fax Ma-chines, and Routers)
Apparatus for the transmission or re-ception of voice, images or other data 229.51 966.23
851761
Final goods (Phones, Fax Ma-chines, and Routers)
Base stations of apparatus for the transmission or reception of voice 77.13 39.27
852691
Final goods (Radar and Radio Navigation Equipment)
Radio navigational aid apparatus 386.06 19.41
852352
Final goods (Sound and Video Recording Devices)
Cards incorporating one or more elec-tronic integrated circuits smart cards 187.78 273.87
852351
Final goods (Sound and Video Recording Devices)
Solid-state, non-volatile data storage devices for recording data from an external source
2492.76 193.04
852190
Final goods (Sound and Video Recording Devices)
Video recording or reproducing ap-paratus nes 123.73 100.93
852329
Final goods (Sound and Video Recording Devices)
Magnetic media for the recording of sound or of other phenomena exclud-ing cards incorporating a magnetic stripe and goods of chapter 37
1246.53 32.85

171
851830Final goods (Sound pro-jection)
Headphones, earphones and com-bined microphone/ speaker sets 458.07 225.78
851829Final goods (Sound pro-jection)
Loudspeakers, nes 623.91 206.37
851822Final goods (Sound pro-jection)
Multiple loudspeakers, mounted in the same enclosure 98.78 33.18
851840Final goods (Sound pro-jection)
Audio-frequency electric amplifiers 88.37 18.98
851810Final goods (Sound pro-jection)
Microphones and stands therefor 546.84 16.52
852872
Final goods (Television and Moni-tors)
Reception apparatus for television, colour, whether or not incorporated 84.69 630.04
852851
Final goods (Television and Moni-tors)
Monitors of a kind solely or principally used in an automatic data-processing system
1258.66 469.76
852859
Final goods (Television and Moni-tors)
Monitors, not incorporating television reception apparatus excluding with 168.60 48.17
851770 Subassem-bly products
Parts of telephone sets, telephones for cellular networks or for other data 13574.51 2829.27
847330 Subassem-bly products
Parts and accessories of automatic data processing machines and units thereof
14978.15 1598.93
852990 Subassem-bly products
Parts suitable for use solely/principally with the application of headings 85.25 to 85.28
8148.74 981.78
903300 Subassem-bly products
Parts and accessories for machines, appliances, instruments or apparatus of Chapter 90
575.56 331.21
853710 Subassem-bly products
Boards, panels, including numerical control panels, for a voltage <=1000 V 2882.04 312.12
850110 Subassem-bly products
Electric motors of an output not ex-ceeding 37.5 W 1446.82 197.56
852910 Subassem-bly products
Aerials and aerial reflectors of all kinds; parts suitable for use therewith 236.31 116.65
853190 Subassem-bly products
Parts of electric sound or visual signal-ling apparatus 132.73 88.56

172
847340 Subassem-bly products
Parts and accessories of other office machines, nes 327.92 73.47
852290 Subassem-bly products
Parts and accessories of apparatus of heading Nos 85.19 to 85.21, nes 2691.09 55.33
901590 Subassem-bly products
Parts and accessories for use with the apparatus of heading No 90.15 186.82 35.48
851890 Subassem-bly products
Parts of microphones, loudspeakers, headphones, earphones and electric sound amplifier
395.11 31.51
847350 Subassem-bly products
Parts and accessories for more than one office machine 126.21 25.77
Source: UNCOMTRADE, EXIM Bank Analysis

173
HS Code Category Product description
Import by China, 2012 (US$
mn)
853890 Component Parts for use with the apparatus of heading no. 85.35,85.36 or 85.37,nes 3992.54
901890 Final goods (Medi-cal)
Instruments and appliances used in medical or veterinary sciences, nes 1507.77
853400 Component Printed circuits 14481.73
847340 Subassembly products
Parts and accessories of other office ma-chines 609.43
902214 Final goods (Medi-cal)
X-rays apparatus, medical/surgical/veterinary use 966.35
854390 Subassembly products
Parts of electrical machines and apparatus having individual functions 804.16
847170Final goods (Com-puter and storage devices)
Computer data storage units 25590.04
903289 Final goods (Ana-lytical Instruments)
Automatic regulating or controlling instru-ments and apparatus 3767.80
852329
Final goods (Sound and Video Recording Devices)
Magnetic media for the recording of sound or of other phenomena excluding cards incorporating a magnetic stripe and goods of chapter 37
1454.40
902290 Final goods (Medi-cal)
Parts and accessories for apparatus based on the use of X-rays or other radiations 554.85
901590 Subassembly products
Parts and accessories for use with the ap-paratus of heading No 90.15 233.38
902230 Final goods (Medi-cal) X-ray tubes 236.83
901580 Final goods (Ana-lytical Instruments)
Survey, hydrographic, oceanographic, me-teorological/ geophysical instruments 596.85
853210 Component Fixed capacitors designed for use in 50/60 Hz circuits (power capacitors) 61.63
901812 Final goods (Medi-cal) Ultrasonic scanning apparatus 906.82
ANNEXURE 3: PRODUCT CATEGORIES FOR ENHANCING EXPORTS FROM INDIA TO CHINA
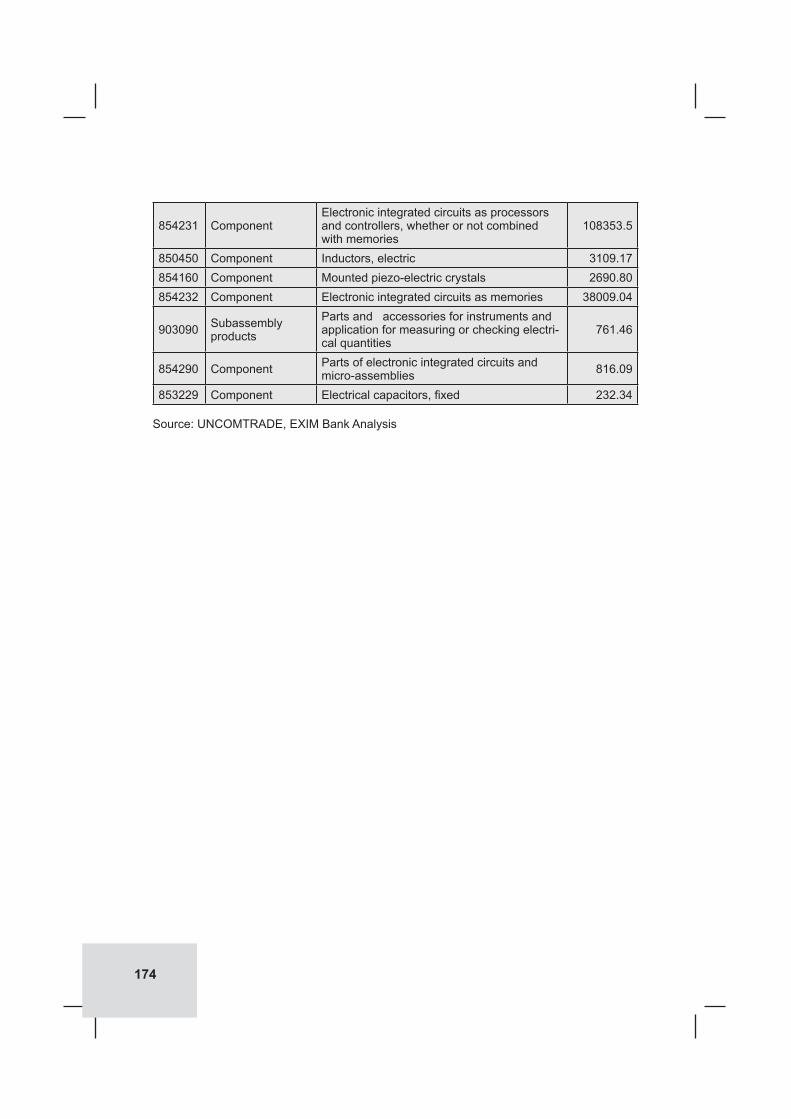
174
854231 Component Electronic integrated circuits as processors and controllers, whether or not combined with memories
108353.5
850450 Component Inductors, electric 3109.17854160 Component Mounted piezo-electric crystals 2690.80854232 Component Electronic integrated circuits as memories 38009.04
903090 Subassembly products
Parts and accessories for instruments and application for measuring or checking electri-cal quantities
761.46
854290 Component Parts of electronic integrated circuits and micro-assemblies 816.09
853229 Component Electrical capacitors, fixed 232.34
Source: UNCOMTRADE, EXIM Bank Analysis

175
ANNEXURE 4: POLICY DEVELOPMENTS IN INDIA AND CHINA RELEVENT ELECTRONICS INDUSTRY
TAX POLICY COMPARISON
China
The general corporate income tax rate for China is 25 percent but there are incentives for firms in the electronics industry. Major tax incentives relevant for the electronics industry are:
l Firms in the ‘High and New Technology Enterprises (HNTE)’ category face reduced tax rate of 15 percent. HNTE status needs to be applied for and is renewed every three years. Activities qualifying for HNTE incentive can happen outside of China but the share of such activity must be less than 40 percent.
l Expenditure for research and development is provided with additional deduction of 50 percent of the R&D expenditures, if it is not capitalized as intangible asset. If capitalized as intangible assets, they are amortized at 150 percent of its cost.
l Upon transfer of eligible technology, business tax exemption is provided. Enterprise income tax exemption is also provided for some technology transfers.
l Exemption on import duty is provided for eligible domestic and foreign invested R&D. On purchase of domestic equipment for R&D, a refund on VAT is also provided.
l For technology / software com-panies, first 5 million Yuan of income earned from technological transfer in a tax year is tax exempt from Enterprise Income Tax (EIT) and above 5 million Yuan is taxed at 50 percent reduced rate.
l Tax losses attributable to R&D super deduction claims can be carried forward up to 5 years.
l Integrated circuit manufacturing is exempt for the first two years from EIT and in the following three years, starting the first

176
profit-making year, manufacturers receive 50 percent reduction in EIT.
l Large investment in circuit manufacturing of amounts exceeding 8 billion RMB, or manufacturers who produce IC products with a line width of less than 0.25 millimetres face 15 percent EIT, or in case the operational period of the investment is more than 15 years, exempt from EIT in the first five years followed by a 50 percent reduction in the next five years, starting with the first profit-making year.
India
In India, the current corporate tax rate stands at 30 percent for domestic firms and 40 percent for foreign firms. Starting from 2015-16, corporate tax rate would be cut from 30 to 25 percent over a period of four years. Major tax incentives relevant to the electronics industry are:
l 100 percent deduction for R&D expenses that satisfy some criteria. 200 percent super deduction is provided for in-house R&D expenditures. 150-200 percent super deduction is also provided for payment to prescribed research institutions.
l Unused benefits can be carried for eight years in case the taxpayer is in a loss.
l Tax benefits are also provided for companies operating in SEZs of which prominent one from export perspective is 100 percent income tax exemption on export profits for five years, 50 percent for the following five years, and 50 percent of ploughed back export profit for the following five years. Other prominent tax incentives are:
o Duty free import/domestic procurement of goods for development, operation and maintenance of units.
o Exemption from minimum alternate tax.
o External Commercial Borrowings by units up to US$ 500 million in a year without any maturity restriction through recognized banking channels.
o Exemption from Central Sales Tax and Service Tax.
o Single window clearance for Central and State level approvals.

177
l Electronic Hardware Technology Parks also provide tax incentives for firms. Especially with regard to export profits, 100 percent of it is tax-exempted.
l Modified Special Incentive Package Scheme provides subsidy for investments in capital expenditure - 20 percent for investments in SEZs and 25 percent in non-SEZs- to units all across the electronics value chain and covering 29 verticals of electronics products. It also provides for reimbursement of countervailing duty / excise duty for capital equipment for the non-SEZ units. For high technology and high capital investment units, like fabs, reimbursement of central taxes and duties is also provided.
MANUFACTURING RELATED POLICY COMPARISON
China
l China has pronounced high-end equipment manufacturing, biotechnology, next generation IT as strategic emerging industries, along with other four industry segments. Together, these industries are expected to account for up to 15 percent of China’s GDP by 2020. Development of medical devices and integrated
circuits have received focus under this. These industries receive preferential policies.
l In 1988, the State Council approved and started the Torch Program (Huoju Jihua) in China - an initiative which explicitly highlighted the building of hi-tech industrial development zones as a main focus. By 2012, 105 new and high-tech industry development zones were established in the country, realizing annual industrial value of 5.22 trillion Yuan.
l Targeted government procure-ment programs have generated significant demand for electronic products in China. The country has emerged as one of the largest market for Radio-frequency identifications (RFIDs), driven by government procurements and increasing use by public entities of RFID tags for transportation logistics and contactless reusable tickets. Moreover, China’s Indigenous Innovation Policies introduced during and after 2006 are designed to develop an indigenous capacity to create innovation and advanced technology. As part of these policies, China has implemented rules related to government procurement, giving preferential treatment in the procurement process to

178
indigenous innovation products. Currently, the annual government procurement budget is estimated to be around US$ 1 trillion.
l Innovation Fund for Small and Medium Technology-based Firms (Innofund) is one of the largest Chinese government programs that support corporate R&D activities on corporate innovation outputs. Innofund mainly provides three forms of financing, namely, appropriation, bank loan interest subsidies, and equity investment. Appropriation is mainly the start-up capital provided to small firms founded by research personnel with their own scientific achievements. Partial subsidies are also provided to small and medium technology-based enterprises for new product development and pilot production. The appropriation amount to each project should not exceed 1 million RMB, with a maximum of two million for key projects.
Loan interest subsidies are mainly provided to small and medium technology-based enterprises that require loans from commercial banks to expand the production scale of innovation projects. The total amount of subsidy of an individual project is generally
within 1 million RMB and 2 million RMB for key projects. Equity investment is generally reserved for projects with high levels of technology, high innovation capacity, and market potential in emerging industries.
l Special incentives are provided for SMEs in China. Some prominent ones are:
o The VAT and sales tax threshold has been raised and EIT has been reduced for small and micro enterprises by the State Council until 2015.
o In 2012, the Central Government decided to establish a development fund in which 15 billion Yuan was to be injected in 5 years.
o Preferential policies also exist in government procurement for SMEs. Thirty percent of total budget by authorities should be earmarked for SMEs, with 60 percent of the amount specifically for the small and micro sized enterprises. While submitting tender for procurement, small and micro sized enterprises also get an additional price preference of 6-10 percent.

179
o It has also been mandated that banks’ credit support for small firms should not grow at a lower rate than the average growth of loans from banks. Small FIs meeting the loan growth target were also to be subjected to lower required reserve requirement which currently stands at 21 percent for major banks. Commercial banks were also barred from charging of fees like fund management fees and financial consulting fees for their services to small firms.
o The government has also set up a special fund for encouraging innovation in technology-intensive SMEs.
l According to ILO, Export Processing Zones are defined as industrial zones that offer generous and social incentives to attract foreign investors and in which imported materials are processed before being re-exported. According to ILO’s 2012 report, China has ten different kinds of EPZs: Special Economic Zone, Comprehensive Reform Testing District, Economic and Technology Development Zone, High-tech Industrial Development Zone, Bonded Zone, Export Processing Zone, Bonded Port
Areas, Bonded Logistics Zone, Comprehensive Free Trade Zone and Border Economic Cooperation Zone.
l China also has financial institutions like Export-Import Bank of India and China Export & Credit Insurance Corporation (SINOSURE) which provide impetus to the exports from the manufacturing segment through financing and insurance services.
India
l Large number of industries have been identified as strategic by the Government, including IT and electronic hardware industry, etc. Each of the strategic industries has received specific government policy intervention.
l Electronic Manufacturing Cluster (EMC) Scheme supports creation of world-class infrastructure for attracting investments in the Electronics Systems Design and Manufacturing Sector. The scheme supports grant assistance for setting up of both greenfield and brownfield EMCs. The financial assistance under the scheme is in the form of grant-in-aid only. For greenfield EMCs the assistance is 50 percent of the

180
project cost subject to a ceiling of Rs. 50 crore for every 100 acres of land, and for brownfield EMCs the assistance is upto 75 percent of the project cost subject to a ceiling of Rs. 50 crores.
l The Preference for Domestically Manufactured Electronics Goods Policy is applicable to all Ministries/ Departments (except Ministry of Defence). This is also applicable for procurement of electronic products made under all Centrally Sponsored Schemes and grants made by Central Government. The products notified for providing preference to domestic manufacturers are: desktop PCs, dot matrix printers, tablet PCs, laptop PCs, contact smart cards, contactless smart cards, LED products, biometric access control/authentication devices, biometric finger print sensors, and biometric iris sensors.
l An Electronic Development Fund (EDF) is proposed to be set up as a “Fund of Funds” to participate in “Daughter Funds” which in turn will provide risk capital to companies developing new technologies in the area of electronics, nano-electronics and Information Technology. Assuming that the average participation of EDF in Daughter Fund is 25 percent,
the policy will help leverage four times Government funding in the area of R&D and innovation. It will help create a battery of Daughter funds and Fund Managers who will be seeking good start-ups (potential winners) and selecting them based on professional considerations.
l Some of the key incentives provided for MSMEs in India are:
o MSMEs in India receive wide array of technological support. Some of the important organizations engaged in providing such support are Small Industries Development Organization and National Small Industries Corporation Limited. Apart from these, the National Manufacturing Competitiveness Programme has also implemented crucial measures to enhance the competitiveness of Indian MSMEs through technological support.
o Programmes have also been launched to help in marketing of MSME products. Examples of such initiatives are Vendor Development Programme wherein opportunity is provided to the small businesses to interact with

181
large public sector units and SSI-MDA Scheme wherein opportunity is provided to MSMEs for getting international exposure and becoming aware about existing export opportunities.
o Ministry of MSME, Government of India also has a ‘Scheme for Assistance to Training Institutions’ which provides assistance for setting up and strengthening Entrepreneurship Devel-opment Institutes (EDIs). These EDIs work towards entrepreneurship development and skill building programmes.
o Small Industries Development Bank of India works towards providing financial assistance to the MSMEs. It has a range of product and services for the small scale sector and has also set up various other institutional infrastructures for the SME sector. Apart from SIDBI, the National Small Industries Corporation and State Finance Corporations also provide financial assistance to the MSMEs. An SME fund has also been created which provides
assistance to SMEs at the rate of 200 basis points below the Bank’s prime lending rate. Apart from these, loans up to Rs. 100 lakh can be provided to micro and small enterprises without collateral/third party guarantees under the Govt. of India’s Credit Guarantee Fund Scheme for Micro and Small Enterprises.
l India currently has 173 operational SEZs with seven of them established by central government, namely Kandla, SEEPZ, Noida, MEPZ, Cochin, Falta and Vishakhapatnam. Number of incentives and facilities are offered to the units in the SEZs like exemption from central sales tax, exemption from services tax, single window clearance for approvals, etc. Moreover, the National Manufacturing Policy which aims to increase the share of manufacturing to 25 percent of GDP by 2022 proposed to launch National Investment and Manufacturing Zones (NIMZs). While the SEZs have been developed with a focus on exports, NIMZs are developed more on the lines of industrial towns having manufacturing and related facilities as well as other residential and social infrastructure.

182
l For encouraging exports of electronic hardware items, EHTP have been developed. Export profits under these are 100 percent tax exempt and CST is refundable. DTA sales are permissible upto 50 percent of FOB value of exports, subject to fulfilment of positive net foreign exchange on payment of concessional duties.
l India also has financial institutions like Export-Import Bank of India and Export Credit Guarantee Corporation of India which have a pivotal role in promoting foreign trade of India.
SCIENCE & TECHNOLOGY POLICY COMPARISON
China
l Total number of patent appli-cations for inventions in China in 2013 was 795,517, of which 207,688 were granted patents. Applications received for layout designs of integrated circuits were as high as 1,561 in 2013, taking the total during the period October 2001-December 2013 to 9,27966.
l Although obstacles remain in effective protection of IPR in China, the end of 11th Five Year Plan in China saw the strengthening of IP regime in the country. Third revision of the Patent Law which came into force on Feb 1, 2011 prescribed stricter conditions to patent granting, improved examination system for patents for design and compulsory license system, added system of preservation of evidence in proceedings, supplemented measures to protect public interests, and strengthen patent protection67. Many other crucial regulations were amended. The Supreme People’s Court also attempted to standardize the trial of intellectual property cases.
l China has in place the National Computer Network Emergency Response Technical Team (CNCERT) which is engaged in network security technical coordination. It maintains the safety of China public Internet and ensures the safe operation of the information network infrastructures and the vital information systems68. The organization releases weekly reports containing data for
66State Intellectual Property Office of the P.R.C67Ibid.68Official website of National Computer Network Emergency Response Technical Team/Co-ordination Center of China.

183
incidents of malware activities, website security, vulnerabilities and also incident handling undertaken by CNCERT. Furthermore, State Council had, in 2012, released a set of guidelines for guarding against such risk. This included requiring all energy and finance sectors, nuclear facilities, space programs and large infrastructure projects to be put under information security and supervision measures.
l Although some guidelines do exist as far as personal data protection is concerned, there are no specific laws in this regard in China.
l To improve the level of scientific research in the country, Ministry of Education had two core programs- Project 211 and Project 985. Both these projects were aimed at improving the research capacity of Chinese universities. In 2011, both these projects were closed to new universities. According to the Global Innovation Index 2013 report, China ranked 9th in terms of quality of its scientific research institutions. Although the international significance of Chinese universities has been growing, they have attracted
little scholarship (Zhang et. al., 2013).69
l The Ministry of Science and Technology also has several science and technology programmes like 863 program, National Key Technologies R&D program, 973 program, National Science and Technology Infrastructure Program, Environment Building for S&T industries, and Mega Projects for the 10th Science Research for the 10th Five Year Plan, which provide a boost to scientific research in the country.
India
l India has witnessed a y-o-y growth in patents filed and examined during 2012-13. However there has been a fall in patent granted from 2011-12 onwards. During the five year period 2008-09 to 2012-13, while both patents filed and patents examined have grown (CAGR) by 4.4 percent and 4.5 percent to reach the level of 43,674 and 12,268 respectively, patents granted have witnessed a negative CAGR of -28.8 percent. Of the total number of patent applications filed in 2012-13, 4,424
69Zhang et. al. (2013), Building Global-Class Universities: Assessing the Impact of the 985 Project.

184
were in the category of computer/electronics (10.1 percent)70.
l As per the report of the United State Trade Representative, India’s legal framework and enforcement system for IPR is weak. Challenges are growing in many of the areas which can hamper innovation climate. With respect to electronics industry in particular, the USTR has raised concerns over India’s Preferential Market Access policy for electro-nic products which appear to condition certain preferential treatment on the indigenous development of IPR.
l A scheme to support 3000 PhD (1500 in ESDM and 1500 in IT/ITES) has been approved in February, 2014 at an estimated cost of Rs.401 crore. Out of 1500 additional PhDs in ESDM, 500 would be full time and 1000 would be part time. In addition, 100 PhDs (full-time) are to be supported by industry/State Government as a part of this Scheme.
l Scheme on Skill Development in ESDM for Digital India has been approved on 09.12.2014 to cover all the States/UTs of the country in order to facilitate creation of an eco-system for development of
ESDM sector in the entire country, for facilitating skill development for 3,28,000 persons in ESDM sector at an outlay of Rs. 411 crore (approx.) in a period of 4 years.
l Under the Scheme of Financial Assistance for setting up of Electronics and ICT Academies, seven Electronics and ICT Academies are to be set up as a unit in IITs, IIITs, NITs, etc., for faculty/mentor development/up gradation to improve the employability of the graduates/diploma holders in various streams, through active collaboration of States/UTs with financial assistance from the Central Government. Electronics and ICT Academy would aim to provide specialized training to the faculties of the Engineering, Arts, Commerce & Science colleges, Polytechnics etc, by developing state-of-the-art facilities.
l Project on ‘Capacity building in the areas of Electronic Product Design and Production Technology’ has been approved on 01.5.2012 at a total estimated cost of Rs. 49.69 Crore. The project has been initiated for development of human resource at various levels including Certificate, Diploma, Post Graduate and Research
70Annual Report 2012-13, Controller General of Patents, Designs, and Trade Marks.

185
Professionals with adequate competence levels with a target of training 11,515 candidates in five years.
l As far as cyber security is concerned, India recently came out with the National Cyber Security Policy, 2013, which aims at “building a secure and resilient cyberspace for citizens, businesses and Government”. The Policy document contains strategies for building a robust cyber security system in India. Legal framework for cyber security already existed in the form of IT act of 2000 and IT (Amendment) Act of 2008.
l Although there is no specific legislation on data protection in India, some provisions intended to protect electronic data exists in the IT Act, 2000. Moreover, the Department of Information Technology, Government of India, adopted the Information Technology (Reasonable Security Practices and Procedures and Sensitive Data or Information) Rules, 2011, which requires corporate bodies collecting, receiving, possessing, storing, dealing or handling personal information to comply with certain procedures.
l Quality of scientific research institutions was considered as a major strength for India in the Global Innovation Index, 2013. The Department of Science and Technology, Government of India works towards strengthening institutional capacities in research and development. Major initiatives by the department include Fund for Infrastructure, Strengthening of S&T (FIST) and Promotion of University Research and Scientific Excellence (PURSE). Ministry of Human Resource Development in India has also played a seminal role in developing the science and technology environment. In recent times, it has proposed several legislations for restructuring higher education in India. Of this, prominent ones with focus on research orientation of Indian educational universities are ‘The Universities for Research and Innovation Bill, 2011’ and ‘The Foreign Education Institutions (Regulation of Entry and Operations) Bill 2010’. While the former aims at providing a framework for establishment of universities for research and innovation, the latter aims at maintaining the standards of higher education in the country.

186
l The Department of Science and Technology, Government of India has several programs for technology development like Drugs and Pharmaceutical Research Programme, Instrumentation Development Programme, National Program on Carbon Sequestration Research, Solar Energy Research Initiative, etc.
EASE OF DOING BUSINESS COMPARISON
China
l China ranked 96 in the World Bank’s Doing Business report. As compared to India, it fares well on the parameter of registering property, wherein it takes only 29 days in China and costs 3.6 percent of property value, as against 44 days in India and costing 7.0 percent of the property value.
l China’s tax structure is also relatively simplified as compared to India. While a total of 33 payments are required in the Indian case, mere 7 payments are required in China’s case. Simplifying the tax procedure in India by moving to GST will help improve the doing business
ranking considerably. More number of taxes requires greater interaction between businesses and tax collecting agencies, and complicates the process.
l China also fares well in the criteria of trading across borders, with the cost to export and import almost half of that in the Indian case. The number of documents required for exporting/importing into the country is also lesser in China’s case. Inland transportation and handling, and ports and terminal handling are major components of export cost in India, accounting for 53.4 percent of the total cost. On the other hand, it accounts for only 37.9 percent of China’s cost of exports. In absolute value terms, while the total logistic related costs amount to US$ 625 per container in India’s case, it is mere US$ 235 per container in China’s case. India needs to improve infrastructure facilities and give impetus to its logistic services industry in order to improve manufacturing and trading conditions as a whole. Good practices under this include providing a single window which is practiced across 73 economies of the world, including China which should be implemented in India. A common practice which

187
has been applied in as many as 134 countries across the globe is that of risk-based inspections. Administrations in these countries have developed systems for instituted risk profiles which allow them to use physical inspection in proportion to the potential risk of consignments. Such a system is not present in India, while it is present in China.
l Enforcing contracts is a strong point for China as it ranks 19th in terms of ease of contracts, measured in terms of the time, cost and procedural complexity of resolving a commercial lawsuit between two domestic businesses. It takes only 406 days in China to enforce a contract, requiring 37 procedures and costing 11.1 percent of claims. On the other hand, in India it requires 1,420 days, costing a huge 39.6 percent of total claims and requiring 46 procedures in total. Good practices for enforcing contracts across the world include maintenance of specialized commercial court, division or judge, which exists in 90 economies across the world, including China, but is not present in India. Electronic filing of complaints is also not practised much in India which is practiced
across 17 economies of the world.
l Resolving insolvency is essential for encouraging entrepreneurs to take risks and opt for innovation. While China ranks 78th in terms of resolving insolvency, India ranks 121st. It takes lesser time in China to resolve insolvency (1.7 years) as compared to India (4.3 years) and the recovery rate is also higher at 36.0 cents per dollar in China, against 25.6 cents per dollar in India. Promoting specialized courts to solve insolvency cases can make the system more efficient as the time factor is a major disability.
India
l Among all criteria, India fares the best in getting credit. It ranked 28th among all economies in this parameter. China on the other hand ranked 73rd. On a scale of 0 to 10, the strength of legal rights in India received a score of 8, while the depth of credit information received a score of 5 on a scale of 0 to 6.
l India also ranks fairly well in terms of protecting investors. It ranked 34th in this parameter. There is further scope for

188
improvement by strengthening the ability to sue directors for damages as represented by the ‘extent of director liability index’. Thirty economies across the globe have defined lucid rules on liability of company directors in the event of abusive related-party transactions. However, in the past year India strengthened minority investor protections by requiring greater disclosure of conflicts of interest by board members, increasing the remedies available in case of prejudicial related-party transactions and introducing additional safeguards for shareholders of privately held companies.
TRADE POLICY COMPARISONS
China
l Pre-shipment Inspection: China’s pre-shipment inspection (PSI) requirements are intended to protect public health, improve phytosanitary situation, protect environment and also to prevent entry of counterfeit goods into the country. Some foreign institutions have been designated to conduct such inspections and issue certificates. PSI for waste raw materials and of used material and electronic products is carried
out largely by inspection bodies abroad, but for large scale sets of equipment where technical support is considered necessary, the Chinese Government may send inspection and quarantine personnel abroad, upon the request of foreign inspection bodies, to provide technical guidance and consultancy. PSI is also essential in the case of import of commodities related to national security, with high value or complicated technology, and also for equipments exceeding certain dimensional attributes.
l Information Technology Agree-ment: China is a party to ITA and eliminated tariffs on all ITA products on 1 January 2005.
l Import Prohibitions: On the grounds of public interest, environmental protection or in accordance with international commitments, China has import prohibitions which are generally listed in ‘Catalogues of Commodities subject to Import Prohibitions’. In 2011, import prohibitions included second hand/used items or scraps in the machinery and electronic equipment category (Table 40).
l Licensing: China has an import licensing regime which applies

189
HS Code Description852190 Video recording or reproducing apparatus nes
901811 Electro-cardiographs
901812 Ultrasonic scanning apparatus
901813 Magnetic resonance imaging apparatus
901814 Scintigraphic apparatus
901819 Electro-diagnostic apparatus, nes
901820 Ultra-violet or infra-red ray apparatus
901890 Instruments and appliances used in medical or veterinary sciences, nes
902212 Computed tomography apparatus
902213 X-rays apparatus, dental use, nes
902214 X-rays apparatus, medical/surgical/veterinary use nes
902219 Apparatus based on the use of X-rays for other uses
902221 Apparatus based on the use of alpha beta/gamma radiations, for medical use
902229 Apparatus based on the use of alpha beta/gamma radiations, for other uses
902230 X-ray tubes
902290 Parts & accessories for apparatus based on the use of X-rays or other radia-tions
950410 Video games of a kind used with a television receiver
847110 Analogue or hybrid automatic data processing machines
847160 Computer input/outputs, with/without storage
851650 Microwave ovens
851711 Line telephone sets with cordless handsets
851721 Facsimiles machines
852110 Video recording or reproducing apparatus magnetic tape-type
852520 Transmission apparatus, for radiotelephony incorporating reception appara-tus
852530 Television cameras
852812 Colour television receivers
853400 Printed circuits
854011 Cathode-ray television picture tubes, inc video monitor tubes, colour
854210 Cards incorporating an electronic integrated circuit “smart cards”
Table 40: List of Electronic Products for which Import is Banned under Used Category
Source: MOFCOM, People’s Republic of China

190
HS Code DescriptionComponent
850440 Static converters, nes
853641 Electrical relays for a voltage not exceeding 60 volts
853649 Electrical relays for a voltage exceeding 60 V but not exceeding 1,000 volts
854011 Cathode-ray television picture tubes, inc video monitor tubes, colour
854012 Cathode-ray TV picture tube including video monitor tube, B&W/other mono-chrome
854040 Data/graphic display tubes, colour
854050 Data/graphic display tubes, monochrome
854060 Cathode-ray tubes, nes
Subassemblies850110 Electric motors of an output not exceeding 37.5 W
850132 DC motors, DC generators, of an output exceeding 750 with but not exceed-ing 75KW
853710 Boards, panels, including numerical control panels, for a voltage <=1000 V
853720 Boards, panels, including numerical control panels, for a voltage > 1,000 V
Final847050 Cash registers
847130 Portable digital computers <10kg
847141 Non-portable digital edp machines with processor & i/o
847160 Computer input/outputs, with/without storage
851650 Microwave ovens
851711 Line telephone sets with cordless handsets
851719 Telephone sets, nes
851721 Facsimiles machines
851730 Telephonic or telegraphic switching apparatus
851821 Single loudspeakers, mounted in the same enclosure
851822 Multiple loudspeakers, mounted in the same enclosure
851840 Audio-frequency electric amplifiers
851921 Record-players without loudspeaker, nes
851929 Record-players, nes
851992 Pocket-size cassette-players
851993 Cassette type sound reproduction equipment
Table 41: Category-wise Electronic Products Requiring CCC Mark

191
851999 Sound reproducing apparatus, not incorporating a sound recorder, nes
852110 Video recording or reproducing apparatus magnetic tape-type
852190 Video recording or reproducing apparatus nes
852520 Transmission apparatus, for radiotelephony incorporating reception appara-tus
852731 Radiobroadcast receivers combined with sound recording or reproducing ap-paratus nes
852732 Radiobroadcast receivers not combined with sound recording but combined with a clock, nes
852739 Radio-broadcast receivers nes
852790 Radio reception apparatus nes
852812 Colour television receivers
852813 Black and white television receivers
852821 Colour video monitors
852830 Video projectors
853110 Burglar or fire alarms and similar apparatus
Source: Office of Technology and Electronic Commerce (OTEC) division of the International Trade Administration, U.S. Department of Commerce
to all WTO members and non-members. These licenses are not transferrable and the issuances of these do not require any fees, charges, deposits or advance payments. In 2010, 87 tariff lines (at HS 8 digit level) were subject to non-automatic import licensing which included specific old mechanical and electronic products. Applicants for an import license need to apply before for an import permit which is issued by the Ministry of Environment Protection or MOFCOM, depending on the product. Upon obtaining the permit, a license is granted automatically to the importer which is valid for
one calendar year and can be extended.
l Export Finance, Insurance and Guarantees: China provides credit financing largely through the Export-Import Bank of China. Export credit insurance is provided by China Export & Credit Insurance Corporation (SINOSURE). There is no local content requirement to obtain export finance. One of the mandates of EXIM Bank of China is to facilitate export and import of Chinese mechanical and electronic products.
l CCC Safety License Require-ment: China Compulsory

192
Certification (CCC) mark is required to be obtained by the manufacturers before exporting to or selling products in China. Many electronic products require CCC mark (Table 41). However, under certain conditions as mentioned in CNCA announcement no.3 2005, these product categories can be exempt from certification.
l China RoHS: “Measures for Administration of the Pollution Control of Electronic Information Products (EIP)”, commonly known as RoHS is intended to restrict the use of hazardous materials in electronic equipments. All products manufactured on or after March 1st 2007 for sale in China must adhere to stage 1 requirements. Products imported into the country for the purpose of re-export or for manufacturing of other export products are excluded. The following require-ments need to be adhered to:
a) The hazardous substances which come under the ambit of this measure are Lead (Pb), Hexavalent Chromium (Cr6+), Mercury (Hg), Cadmium (Cd), Polybrominated Biphenyls (PBBs) and Polybrominated Diphenyl ethers (PBDEs). If an EIP doesn’t contain any of these, then the
following symbol needs to be used:
b) If any of the above mentioned hazardous substance is present above the maximum concentration value, then the following symbol needs to be used, with the number inside it representing the Environmental Friendly Use Period (EFUP):
c) The user manual of the EIP should contain table of names and contents of toxic and hazardous materials if the product contains them in quantities above the maximum concentration values. China’s maximum concentration values are 0.1 percent for all hazardous substances other than cadmium for which the level is set at 0.01 percent.
d) Packaging of EIPs should be in accordance with the GB18455-2001 standard.
India
l Generally, all electronic items are freely importable in India, with the exception of some defence related items. All electronic items, in general, are also freely exportable, with the exception of a small negative list which

193
includes items such as high power microwave tubes, high end super computer and data processing security equipment.
l Second hand capital goods are freely importable into India.
l Export Promotion Capital Goods scheme (EPCG): This allows manufacturer-exporters, including electronic exporters in India to import capital goods at zero percent customs duty for pre-production, production and post-production, subject to an export obligation equivalent to 6 times of duty saved on capital goods imported under EPCG scheme, to be fulfilled in 6 years reckoned from authorization issue-date. The concessional 3 percent duty EPCG scheme allows import, subject to an export obligation of 8 times of duty saved on the imported capital goods under the EPCG scheme, to be fulfilled in 8 years. The export obligation under EPCG Scheme can also be fulfilled by the supply of Information Technology Agreement (ITA-1) items to the domestic tariff area provided the realization is in free foreign exchange.
l Special Economic Zones (SEZs) are being set up for enabling hassle free manufacturing and trading for export purposes. Sales from Domestic Tariff Area to SEZs are currently treated as physical export. This entitles domestic suppliers to a plethora of benefits like Drawback benefits, CST exemption and Service Tax exemption.
l Supplies of Information Techno-logy Agreement items and notified zero duty telecom/electronic items in the Domestic Tariff Area by EOU/EHTP/STP/SEZ units are counted for the purpose of fulfilment of positive Net Foreign Exchange Earnings.
l Deemed Exports: “Deemed Exports” refer to those transactions in which the goods supplied do not leave the country, and the payment for such supplies is received either in Indian rupees or in free foreign exchange. Supply of goods to Export Oriented Units (EOUs) / Software Technology Park (STP) units / Electronic Hardware Technology Park (EHTP) units / Bio Technology Park (BTP) units in India are treated as deemed

194
exports. Moreover, supply of goods to EPCG Authorization holders also come under this category. Deemed exports are eligible for any/all of the following benefits in respect of manufacture and supply of goods qualifying as deemed exports.
- Advance Authorization for annual requirement/duty free import authorization.
- Deemed Export Drawback
- Exemption from terminal excise duty where supplies are made against international competitive bidding. In other
cases, refund of terminal excise duty is given
l The import of second hand computers including personal computers / laptops and r e f u r b i s h e d / r e c o n d i t i o n e d spares are restricted. However, second hand computers, laptops and computer peripherals including printer, plotter, scanner, monitor, keyboard and storage units can be imported freely as donations by certain category of donees, subject to the condition that the goods shall not be used for any commercial purpose and are non-transferable.

195
105. Biotechnology: Emerging Opportunities for India106. ASEAN Countries: A Study of India’s Trade and Investment Potential107. Essays on Globalisation and Wages in Developing Countries108. Select West African Countries: A Study of India’s Trade and Investment
Potential109. Indian Leather Industry: Perspective and Export Potential110. GCC Countries: A Study of India’s Trade and Export Potential111. Indian Petroleum Products Industry : Opportunities and Challenges112. Floriculture : A Sector Study113. Japanese & U.S. Foreign Direct Investments in Indian Manufacturing : An
Analysis114. Maghreb Region: A Study of India’s Trade and Investment Potential115. Strengthening R & D Capabilities in India116. CIS Region: A Study of India’s Trade and Investment Potential117. Indian Chemical Industry: A Sector Study118. Trade and Environment: A Theoretical and Empirical Analysis119. Indian Pharmaceutical Industry : Surging Globally120. Regional Trade Agreements: Gateway to Global Trade121. Knowledge Process Outsourcing: Emerging Opportunities for India122. Indian Mineral Sector and its Export Potential123. SAARC: An Emerging Trade Bloc124. Indian Capital Goods Industry - A Sector Study125. Financial Liberalization and Its Distributional Consequences126. ECOWAS: A Study of India’s Trade and Investment Potential127. Indian Textile and Clothing Industry in Global Context: Salient Features and
Issues128. Fair Trade : Fair Way of Enhancing Export Value129. Indian Automotive Industry: At The Crossroads130. CARICOM : A Gateway to the America131. IBSA : Enhancing Economic Cooperation Across Continents132. MSMEs and Globalisation: Analysis of Institutional Support System in India
and In Select Countries133. International Trade, Finance and Money: Essays in Uneven Development134. Sikkim: Export Potential and Prospects135. Mizoram: Export Potential and Prospects136. Floriculture: A Sector Study137. Biotechnology Industry in India: Opportunities for Growth138. Indian Gems and Jewellery: A Sector Study139. SADC: A Study of India’s Trade and Investment Potential140. Innovation, Imitation and North South Trade: Economic Theory and Policy
RECENT OCCASIONAL PAPERSOP. No. Title

196
141. COMESA (Common Market for Eastern and Southern Africa): A Study of India’s Trade and Investment Potential142. Indian Shipping Industry: A Catalyst for Growth143. New Renewable Energy in India: Harnessing the Potential144. Caribbean Community (CARICOM): A Study of India’s Trade and Investment Potential 145. West African Region: A Study of India’s Trade and Investment Potential 146. India’s Trade and Investment Relations with LDCs (Least Developed Countries): Harnessing Synergies147. Indian Electronic Industry : Perspectives and Strategies 148. Export Potential of Indian Plantation Sector: Prospects and Challenges149 MERCOSUR : A Study of India’s Trade and Investment Potential150. Openness and Growth of the Indian Economy: An Empirical Analysis151. The Commonwealth: Promoting a Shared Vision on Trade and
Investment152. Southern African Development Community (SADC): A Study of India’s Trade and Investment Potential153. Strategic Development of MSMEs: Comparison of Policy Framework and
Institutional Support Systems in India and Select Countries154. Indian Chemical Industry : Exploring Global Demand155. Technological Interventions In Indian Agriculture for Enhancement of Crop Productivity156. Exports of Services and Offshore Outsourcing: An Empirical Investigation
in the Indian Context157. Indian Ocean Rim Association for Regional Co-operation (IOR-ARC): A Study of India’s Trade and Investment Potential158. West Africa: A Study of India’s Trade and Investment Potential159. The Effects of Financial Openness: An Assessment of the Indian
Experience160. Comparison of Labour Laws: Select Countries161. India’s Trade and Investment Relations with Cambodia, Lao PDR, Myanmar, Vietnam (CLMV): Enhancing Economic Cooperation162. Indian Horticulture-Imperatives to Enhance Trade from India163. India’s Trade and Investment Relations with Gulf Cooperation Council
(GCC): Strengthening Economic Ties164. India’s Hi-Tech Exports: Potential Markets and Key Policy Interventions165. Outward Direct Investment from India: Trends, Objectives and Policy
Perspectives166. East African Community (EAC): A Study of India’s Trade and Investment
Potential167. Trade Liberalization, Product Variety and Growth168. Research & Development in BRICS: An Insight169. Indian Capital Goods Industry: A Sector Study170. Bangladesh: A Study of India’s Trade and Investment Potential

197
EXIM BANK’S MAJOR PROGRAMMESBank’s Major Programmes

198
AhmedabadSakar II, Floor 1 ,Next to Ellisbridge Shopping Centre, Ellisbridge P. O., Ahmedabad 380 006.Phone : (91 79) 26576852/26576843Fax : (91 79) 26577696E-mail : [email protected]
BangaloreRamanashree Arcade, Floor 4,18, M. G. Road, Bangalore 560 001.Phone : (91 80) 25585755/25589101-04Fax : (91 80) 25589107E-mail : [email protected]
ChandigarhPHD House, Floor 1, Sector 31-A, Dakshin Marg,Chandigarh 160 031Phone : (91 172) 2641910/12/39/49Fax : (91 172) 2641915E-mail : [email protected]
ChennaiOverseas Towers, Floors 4 & 5, No. 756-L,Anna Salai (Opp. TVS), Chennai - 600 002.Phone : (91 44) 28522830, 28522831Fax : (91 44) 28522832E-mail : [email protected]
GuwahatiNEDFI House, Floor 4, G. S. Road,Dispur, Guwahati-781006Phone : (91 361) 2237607, 2237609Fax : (91 361) 2237701E-mail : [email protected]
HyderabadGolden Edifice, Floor 2, 6-3-639/640, Raj Bhavan Road,Khairatabad Circle, Hyderabad 500 004.Phone : (91 40) 23307816-21 Fax : (91 40) 23317843E-mail : [email protected]
Kolkata Vanijya Bhawan, Floor 4, (International TradeFacilitation Centre), 1/1 Wood Street, Kolkata 700 016.Phone : (91 33) 22833419/22833420Fax : (91 33) 22891727E-mail : [email protected]
New DelhiStatesman House, Ground Floor,148, Barakhamba Road, New Delhi 110 001.Phone : (91 11) 23474800Fax : (91 11) 23322758/23321719E-mail : [email protected]
Pune44, Shankarseth Road, Pune 411 037.Phone : (91 20) 26403000Fax : (91 20) 26458846E-mail : [email protected]
EXPORT-IMPORT BANK OF INDIAHEAD OFFICE
Centre One Building, Floor 21, World Trade Centre Complex, Cuffe Parade, Mumbai 400 005.Phone : (91 22) 22172600 Fax : (91 22) 22182572 E-mail : [email protected]
Website : www.eximbankindia.in
LONDON BRANCH5th Floor, 35, King Street, London - EC2V8BB, United Kingdom,
Phone : (44) 20 77969040 Fax : (44) 20 76000936 E-mail: [email protected]
INDIAN OFFICES OVERSEAS OFFICES
Addis AbabaBole Kifle Ketema, Kebele - 19, (03/05)House No. 015-B,Addis Ababa, EthiopiaPhone : (251 116) 630079Fax : (251 116) 610170Email : [email protected]
DubaiLevel 5, Tenancy 1B,Gate Precinct Building No. 3,Dubai International Financial Centre,PO Box No. 506541, Dubai, UAE.Phone : (971 4) 3637462Fax : (971 4) 3637461E-mail : [email protected]
JohannesburgAtrium on 5th, Floor 2, Tower East,Sandton City, Johannesburg,South AfricaPhone : (27 11) 3265103/13 Fax : (27 11) 7844511E-mail : [email protected]
Singapore20, Collyer Quay,# 10-02, Singapore 049319.Phone : (65) 65326464Fax : (65) 65352131E-mail : [email protected]
Washington D.C.1750 Pennsylvania Avenue NW,Suite 1202, Washington D.C. 20006,United States of America.Phone : (1 202) 223 3238Fax : (1 202) 785 8487E-mail : [email protected]
YangonHouse No. 54/A, Ground Floor,Boyarnyunt Street,Dagon Township,Yangon, Myanmar.Phone : (95) 1389520Mob. : (95) 931281726Email : [email protected]
Copyright © 2022 FDOKUMEN