Paediatric Attention-Deficit Hyperactivity/Disorder Application ...
119
PANDAS: Paediatric Attention-Deficit Hyperactivity/Disorder Application Software by H. M. Mwamba Thesis submitted in fulfillment of degree of Master of Mechanical and Mechatronic Engineering in the Faculty of Engineering at Stellenbosch University December 2018 Supervisor: Prof. P. R. Fourie Co-Supervisor: Prof. D. Van den Heever
-
Upload
khangminh22 -
Category
Documents
-
view
3 -
download
0
Transcript of Paediatric Attention-Deficit Hyperactivity/Disorder Application ...

PANDAS: Paediatric Attention-Deficit Hyperactivity/Disorder Application Software
by
H. M. Mwamba
Thesis submitted in fulfillment of degree of Master of Mechanical and Mechatronic Engineering in the Faculty of Engineering at Stellenbosch University
December 2018
Supervisor: Prof. P. R. Fourie
Co-Supervisor: Prof. D. Van den Heever

Declaration
By submitting this thesis electronically, I declare that the entirety of the workcontained therein is my own, original work, that I am the sole author thereof(save to the extent explicitly otherwise stated), that reproduction and pub-lication thereof by Stellenbosch University will not infringe any third partyrights and that I have not previously in its entirety or in part submitted it forobtaining any quali�cation.
December 2018Date: . . . . . . . . . . . . . . . . . . . . . . . . . . . . . . .
Copyright© 2018 Stellenbosch UniversityAll rights reserved.
ii
Stellenbosch University https://scholar.sun.ac.za

Plagiarism Declaration
1. Plagiarism is the use of ideas, material and other intellectual propertyof another's work and to present it as my own.
2. I agree that plagiarism is a punishable o�ence because it constitutestheft.
3. I also understand that direct translations are plagiarism.
4. Accordingly all quotations and contributions from any source whatsoever(including the internet) have been cited fully. I understand that thereproduction of text without quotation marks (even when the source iscited) is plagiarism.
5. I declare that the work contained in this assignment, except where oth-erwise stated, is my original work and that I have not previously (in itsentirety or in part) submitted it for grading in this module/assignmentor another module/assignment.
Student number Signature
Initials and surname Date
iii
Stellenbosch University https://scholar.sun.ac.za

Abstract
Attention-de�cit/hyperactivity disorder (ADHD) is a common neuropsychi-atric disorder that impairs social, academic, and occupational functioning inchildren, adolescents and adults. It is estimated that approximately as highas 10% of South African children have ADHD. Some dilemmas are howeverpresent in terms of the treatment of the disorder: �rstly, there are no risk-freemethods for its treatment and secondly, no fully objective diagnostic assess-ments exist. To date, very few quantitative methods have been successfullyimplemented. It is therefore necessary to further investigate methods that ob-jectively diagnose, treat, and manage the disorder. The aim of the study isthus to develop a novel method that can be used as an aid to provide screeningof ADHD. The method proposed is the form of a tablet-based game with un-derlying algorithms. The objective of the method is to di�erentiate between anADHD individual versus a non-ADHD individual, based on the way they playthe game. A beta-testing phase was done and comprised of 30 children (19non-ADHD and 11 ADHD) between the ages of 4 and 18 years old. The ma-chine learning model that was used was linear support vector machine (SVM).Two datasets were used: 1) game-play dataset which included data such astask completion time and number of mistakes made and 2) accelerometer dataset from the tri-axial accelerometer. A feature set was extracted from thesetwo datasets and the best features were selected using sequential forward se-lection. These best features were then used for developing the classi�er. A testset accuracy of 85.7% was achieved. Leave-one-out cross-validation (LOOCV)was performed and its accuracy was 83.5%. An overall classi�cation accuracyof 86.5% was achieved. For the application of a screening tool, sensitivity wasdeemed an important metric and. The model achieved a sensitivity of 75%which was seen as acceptable. The results of the classi�er were indicative thata quantitative tool could indeed be developed to screen for ADHD.
iv
Stellenbosch University https://scholar.sun.ac.za

Uittreksel
Aandaga�eibaarheid-hiperaktiwiteitsindroom (ADHD) is 'n algemene neuro-psigiatriese versteuring wat sosiale-, akademiese- en beroepsfunksionering belem-mer by jong kinders, tieners en volwassenes. Dit is beraam dat ongeveer asmeer as 10% van Suid-Afrikaanse kinders ADHD het. Sommige dilemmasis egter teenwoordig met betrekking tot die behandeling van die versteur-ing: eerstens is daar geen risiko-vrye metodes van behandeling nie en twee-dens bestaan daar geen volledige objektiewe diagnostiese assessering nie. Totvandag toe is daar baie min kwantitatiewe metodes wat suksesvol geimplenteeris. Daarom is dit dus nodig om verdere metodes te ondersoek wat die versteur-ing objektief kan diagnoseer, behandel en bestuur. Die mikpunt van die studieis dus om 'n nuwe metode te ontwikkel wat gebruik kan word as 'n hulpmid-del om vinnige en akkurate keuring van ADHD te voorsien. Die voorgesteldemetode is in die vorm van 'n elektroniese tablet-gebasseerde speletjie met on-derliggende algoritmes. Die doel van die metode is om te onderskei tussen 'nindividu met ADHD en 'n individu sonder ADHD, gebasseer op die manierhoe hulle die speletjie speel. 'n Beta-toets fase wat bestaan uit 30 kinderstussen die ouderdomme van 4 en 18 jaar oud was gedoen (19 met ADHD en 11sonder ADHD). Die masjienleer model wat gebruik vir die studie was supportvector machine (SVM). 'n Test akkuraatheid van 85.7% was behaal. Leave-one-out cross-validation was gebruik word en 'n akkuraatheid van 83.5% wasbehaal. Ter afsluiting was dit gedemonstreer dat 'n kwantitatiewe hulpmiddelontwikkel kan word vir die keuring van ADHD.
v
Stellenbosch University https://scholar.sun.ac.za

Acknowledgements
I would like to extend the most sincere gratitude and thanks to the followingindividuals:
Prof. Pieter Fourie, for his guidance, vision, enthusiasm and inspiration,without which this project would not be possible. Prof. Fourie spoke to meat the end of my �nal year undergrad and convinced me to join him on thisproject. Ever since then, it's been a great journey towards creating a tangiblesolution that would change many people's lives for the better.
Romano Swart, my colleague, whose support and teamwork in the concep-tualisation phases of the game design was very valuable.
Mark Atkinson and his team, for delivering a high quality game that metthe requirements of the project within a feasible budget and time frame.
My family, for being an ever-present support structure throughout thecourse of the study and throughout all of my endeavours.
Lastly, I would like to extend great gratitude to Ms. Veronica Mwamfupe,whose moral support has been tremendous. She's encouraged me and pushedme in times when I stopped believing I could �nish this project.
vi
Stellenbosch University https://scholar.sun.ac.za

Dedications
To my late father, Willy Mwamba, a great man.
vii
Stellenbosch University https://scholar.sun.ac.za

Contents
Declaration ii
Plagiarism Declaration iii
Abstract iv
Uittreksel v
Acknowledgements vi
Dedications vii
Contents viii
List of Figures xi
List of Tables xiii
1 Introduction 11.1 Background . . . . . . . . . . . . . . . . . . . . . . . . . . . . . 11.2 Problem Formulation . . . . . . . . . . . . . . . . . . . . . . . . 21.3 Aim of Research and Objectives . . . . . . . . . . . . . . . . . . 2
1.3.1 Game Design . . . . . . . . . . . . . . . . . . . . . . . . 31.3.2 Data-Processing Model Design . . . . . . . . . . . . . . . 3
1.4 Motivation . . . . . . . . . . . . . . . . . . . . . . . . . . . . . . 31.5 Thesis Layout . . . . . . . . . . . . . . . . . . . . . . . . . . . . 4
2 Literature Review 52.1 Aetiology . . . . . . . . . . . . . . . . . . . . . . . . . . . . . . 5
2.1.1 Genetics . . . . . . . . . . . . . . . . . . . . . . . . . . . 62.1.2 Environmental Factors . . . . . . . . . . . . . . . . . . . 62.1.3 Neurobiological Factors . . . . . . . . . . . . . . . . . . . 7
2.2 Diagnosis . . . . . . . . . . . . . . . . . . . . . . . . . . . . . . 82.2.1 DSM-5 Criteria . . . . . . . . . . . . . . . . . . . . . . . 82.2.2 Rating Scales . . . . . . . . . . . . . . . . . . . . . . . . 102.2.3 Neuropsychological Tests . . . . . . . . . . . . . . . . . . 11
viii
Stellenbosch University https://scholar.sun.ac.za

CONTENTS ix
2.2.4 Neuropsycgological Test Perfomance . . . . . . . . . . . 142.2.5 Comorbidity . . . . . . . . . . . . . . . . . . . . . . . . . 152.2.6 Current Diagnostic Process in South Africa . . . . . . . . 15
2.3 Existing Computerized Tools . . . . . . . . . . . . . . . . . . . . 162.3.1 Conners CPT 3 . . . . . . . . . . . . . . . . . . . . . . . 162.3.2 MOXO . . . . . . . . . . . . . . . . . . . . . . . . . . . . 19
2.4 Existing Sensor-Based Tools . . . . . . . . . . . . . . . . . . . . 242.4.1 Objective Diagnosis of ADHD using IMUs . . . . . . . . 242.4.2 ADHD Diagnosis with EEG . . . . . . . . . . . . . . . . 26
2.5 Summary of Literature . . . . . . . . . . . . . . . . . . . . . . . 27
3 Design Speci�cation 293.1 Game Development . . . . . . . . . . . . . . . . . . . . . . . . . 29
3.1.1 Measurable Parameters from DSM-V . . . . . . . . . . . 303.1.2 Development Platform and Device Selection . . . . . . . 313.1.3 Game Theme . . . . . . . . . . . . . . . . . . . . . . . . 323.1.4 Game Task Description . . . . . . . . . . . . . . . . . . . 33
3.2 Data Gathering, Storage and Extraction . . . . . . . . . . . . . 393.2.1 Data Gathering . . . . . . . . . . . . . . . . . . . . . . . 403.2.2 Data Storage . . . . . . . . . . . . . . . . . . . . . . . . 413.2.3 Data Extraction . . . . . . . . . . . . . . . . . . . . . . . 42
4 Research Methodology 444.1 Research Approach . . . . . . . . . . . . . . . . . . . . . . . . . 444.2 Subjects . . . . . . . . . . . . . . . . . . . . . . . . . . . . . . . 45
4.2.1 Required Sample Size . . . . . . . . . . . . . . . . . . . . 454.2.2 Subject Selection: Inclusion and Exclusion Criteria . . . 454.2.3 Subject Categories . . . . . . . . . . . . . . . . . . . . . 464.2.4 Ethical Approval . . . . . . . . . . . . . . . . . . . . . . 464.2.5 Written Consent: Parents . . . . . . . . . . . . . . . . . 464.2.6 Written Assent: Children . . . . . . . . . . . . . . . . . . 47
4.3 Study Design . . . . . . . . . . . . . . . . . . . . . . . . . . . . 474.4 Measurement Methods . . . . . . . . . . . . . . . . . . . . . . . 48
4.4.1 Rationale . . . . . . . . . . . . . . . . . . . . . . . . . . 484.4.2 Standard Operating Procedure . . . . . . . . . . . . . . 494.4.3 List of Parameters . . . . . . . . . . . . . . . . . . . . . 49
4.5 Analysis . . . . . . . . . . . . . . . . . . . . . . . . . . . . . . . 494.5.1 What was Analysed between Subgroups? . . . . . . . . . 504.5.2 Sample Size Estimation . . . . . . . . . . . . . . . . . . 504.5.3 Structure of Study Database . . . . . . . . . . . . . . . . 52
5 Machine Learning 565.1 Datasets . . . . . . . . . . . . . . . . . . . . . . . . . . . . . . . 56
5.1.1 Distribution of Data . . . . . . . . . . . . . . . . . . . . 565.1.2 Train-test Set Split . . . . . . . . . . . . . . . . . . . . . 57
Stellenbosch University https://scholar.sun.ac.za

CONTENTS x
5.2 Feature Extraction . . . . . . . . . . . . . . . . . . . . . . . . . 575.2.1 Outlier Detection and Treatment . . . . . . . . . . . . . 575.2.2 Game-play Dataset . . . . . . . . . . . . . . . . . . . . . 585.2.3 Accelerometer Dataset . . . . . . . . . . . . . . . . . . . 59
5.3 Feature Selection . . . . . . . . . . . . . . . . . . . . . . . . . . 615.3.1 Preliminary Feature Selection . . . . . . . . . . . . . . . 615.3.2 Primary Feature Selection . . . . . . . . . . . . . . . . . 62
5.4 SVM Model Selection . . . . . . . . . . . . . . . . . . . . . . . . 66
6 Results and Discussion 696.1 Results . . . . . . . . . . . . . . . . . . . . . . . . . . . . . . . . 696.2 Discussion . . . . . . . . . . . . . . . . . . . . . . . . . . . . . . 72
7 Conclusion and Recommendations 747.1 Conclusion . . . . . . . . . . . . . . . . . . . . . . . . . . . . . . 747.2 Recommendations . . . . . . . . . . . . . . . . . . . . . . . . . . 75
References 77
Appendices 81
A Ethics 82A.1 Ethical Approval Letter . . . . . . . . . . . . . . . . . . . . . . . 82A.2 Parental Information Lea�et and Consent Form . . . . . . . . . . 86A.3 Participant Information Lea�et and Assent Form 4-11 y/o . . . . 93A.3 Participant Information Lea�et and Assent Form 12-18 y/o . . . 97
B DSM-5 Criteria 101
C NVIDIA K1 Shield Tablet Datasheet 105
Stellenbosch University https://scholar.sun.ac.za

List of Figures
2.1 Family Studies in ADHD [11] . . . . . . . . . . . . . . . . . . . . . 62.2 Extract of Connors Scale [21] . . . . . . . . . . . . . . . . . . . . . 102.3 Extract of Vanderbilt Scale [22] . . . . . . . . . . . . . . . . . . . . 102.4 Bender-Gestalt Test [26] . . . . . . . . . . . . . . . . . . . . . . . . 122.5 Evaluation and Diagnosis of ADHD . . . . . . . . . . . . . . . . . . 162.6 MOXO demonstration [33] . . . . . . . . . . . . . . . . . . . . . . . 192.7 Attentiveness Pro�le [33] . . . . . . . . . . . . . . . . . . . . . . . . 202.8 MOXO Performance Graph [33] . . . . . . . . . . . . . . . . . . . . 22
3.1 Game Development Sequence . . . . . . . . . . . . . . . . . . . . . 303.2 Panda character . . . . . . . . . . . . . . . . . . . . . . . . . . . . . 323.3 Tiles for Creating a Map . . . . . . . . . . . . . . . . . . . . . . . . 333.4 Disposable Items � Obstacles . . . . . . . . . . . . . . . . . . . . . 343.5 Map Example . . . . . . . . . . . . . . . . . . . . . . . . . . . . . . 343.6 Main Game Window . . . . . . . . . . . . . . . . . . . . . . . . . . 353.7 Scenario 1 � Character Approaching an Obstacle . . . . . . . . . . 363.8 Scenario 2 � Character Respawning after Collision . . . . . . . . . . 363.9 Scenario 3 � Character Moving to the Left Lane . . . . . . . . . . . 373.10 Scenario 4 � Character Moving to the Right Lane . . . . . . . . . . 383.11 Scenario 5 � Character Jumping over Obstacle . . . . . . . . . . . . 383.12 Scenario 6 � Character Throwing a Rock at an Approaching Obstacle 393.13 Scenario 7 � Character Reaching the End of the Task . . . . . . . . 393.14 Data Gathering and Storage . . . . . . . . . . . . . . . . . . . . . . 403.15 Transfer and Storage of Game Variables . . . . . . . . . . . . . . . 423.16 Data Extraction Flowchart . . . . . . . . . . . . . . . . . . . . . . . 43
4.1 Sequence of Research Activities . . . . . . . . . . . . . . . . . . . . 484.2 McNemar Test: Sample Size Determination with δ = 0.1 . . . . . . 534.3 McNemar Test: Sample Size Determination with δ = 0.15 . . . . . . 534.4 McNemar Test: Sample Size Determination with δ = 0.16 . . . . . . 544.5 McNemar Test: Sample Size Determination with δ = 0.17 . . . . . . 544.6 McNemar Test: Sample Size Determination with δ = 0.18 . . . . . . 554.7 McNemar Test: Sample Size Determination with δ = 0.2 . . . . . . 55
5.1 Box-and-whisker Plot of Fg . . . . . . . . . . . . . . . . . . . . . . 58
xi
Stellenbosch University https://scholar.sun.ac.za

LIST OF FIGURES xii
5.2 Correlation Matrix of Game-play Feature Set . . . . . . . . . . . . 625.3 Correlation Matrix of Aggregate Feature Set . . . . . . . . . . . . . 63
6.1 Confusion Matrix of SVM Classi�er . . . . . . . . . . . . . . . . . . 69
Stellenbosch University https://scholar.sun.ac.za

List of Tables
2.1 DSM-5 Criteria for ADHD . . . . . . . . . . . . . . . . . . . . . . . 92.2 Areas of Attention Measured during the CPT 3 Test . . . . . . . . 172.3 Classi�cation Accuracy, Sensitivity and Speci�city of Conners Tests 192.4 MOXO Criteria Table . . . . . . . . . . . . . . . . . . . . . . . . . 212.5 MOXO Severity Table . . . . . . . . . . . . . . . . . . . . . . . . . 212.6 Omission errors between ADHD and non-ADHD Children . . . . . 232.7 Omission errors between ADHD and non-ADHD Adolescents . . . . 242.8 Contexts Used for Diagnosing ADHD with IMUs . . . . . . . . . . 252.9 Classi�cation Performance of SVM for Diagnosing ADHD with IMUs 26
3.1 Measurable Parameters . . . . . . . . . . . . . . . . . . . . . . . . . 313.2 Labels given to Relevant DSM 5 Criteria . . . . . . . . . . . . . . . 313.3 List of Game-Play Variables . . . . . . . . . . . . . . . . . . . . . . 41
4.1 McNemar Test: 2 x 2 Contingency Table . . . . . . . . . . . . . . . 504.2 POWER Analysis . . . . . . . . . . . . . . . . . . . . . . . . . . . . 52
5.1 Breakdown of Subject Distribution . . . . . . . . . . . . . . . . . . 575.2 Training and Test Set . . . . . . . . . . . . . . . . . . . . . . . . . 575.3 Breakdown of Feature Set . . . . . . . . . . . . . . . . . . . . . . . 635.4 Feature Subsets . . . . . . . . . . . . . . . . . . . . . . . . . . . . . 645.5 LOOCV Error on Di�erent Feature Sets and Various C values . . . 67
6.1 Performance Metrics of SVM classi�er on Test Set . . . . . . . . . . 71
xiii
Stellenbosch University https://scholar.sun.ac.za

Chapter 1
Introduction
1.1 Background
Attention-de�cit/hyperactivity disorder (ADHD) is a brain disorder markedby an ongoing pattern of inattention and/or hyperactivity-impulsiveness thatinterferes with functioning or development [1]. It a�ects a great number of peo-ple worldwide and is especially prevalent in children although adult prevalenceis increasingly gaining attention. The exact origin of the disorder is uncertainand complex [2]. ADHD is one of the most common cognitive disorders, yetits diagnosis relies almost exclusively on subjective assessments of perceivedbehaviour [3]. This may result in inconsistent diagnoses. For example, whileone specialist may perceive a speci�c symptom as severe, another one couldperceive that same symptom as acceptable. Therefore, as the number of as-sessed symptoms increases, so does the complexity of the diagnosis.
ADHD is found mainly in children and adolescents. It is also found inadults, especially if they were previously diagnosed during childhood. Theworldwide prevalence of ADHD is approximated by Polanczyk et. al. as 5%.Although prevlance data in South Africa is incomplete, it is estimated to beas high as 10%, similar to that of the United States of America with regardsto youths.
The current diagnostic methods present some unresolved dilemmas. Firstly,there is a potential risk of overdiagnosing patients. Secondly, males are morelikely to be diagnosed compared to females of the same age [4]. Finally, ob-jective diagnostic methods are scarce. Although there are other unresolveddilemmas around the disorder, the previously mentioned ones are good ex-amples that highlight the complexity of ADHD diagnosis. Generally speaking,diagnosis relies on the specialist's experience as well as whether or not a speci�cpatient resembles the specialist's perceived concept of a prototypical ADHDpatient. Furthermore, since ADHD is more prevalent in males, specialists maybecome biased to perceive them as prototypical patients. This therefore re-
1
Stellenbosch University https://scholar.sun.ac.za

CHAPTER 1. INTRODUCTION 2
sults in males being more readily diagnosed, and possibly overdiagnosed, thanfemales [2].
In addition to diagnosis, other challenges of ADHD are its treatment andmanagement. For children between the ages of 6 and 18 years old, symptomsare typically identi�ed in a classroom setting. Specialists such as child psy-chologists will then interview the whole family and provide the parents and theteacher(s) with questionnaires called rating scales. Furthermore, the patientundergoes a series of psychometric tests. Based on the results of the ratingscales as well as those of the psychometric tests, a thorough diagnosis is madeand a treatment plan is drawn up. The patient then goes for follow-up ses-sions, generally after every 6 months. This process represents the ideal caseof identifying and diagnosing ADHD. In reality, however, many schoolchildrenare not identi�ed as potential ADHD patients. This presents the need for ascreening tool that may help identify the disorder from an early stage, such asin a classroom setting.
1.2 Problem Formulation
There are no guaranteed methods for the treatment of ADHD, nor are thereany objective tests to diagnose the disorder. To date, very few quantitativetechniques exist whereby the diagnosis or drug e�ectiveness can be demon-strated with any degree of accuracy. There is therefore an increasing need formore objective diagnosis and more e�ective treatment and management of thedisorder. In this study it was hypothesised that a person could be screened forADHD through the use of objective and quantitative software algorithms.
1.3 Aim of Research and Objectives
The aim of the study was to develop a novel method that provided quickscreening for the hyperactive subtype of ADHD. A concurrent study was donewhere the screening is done for the inattentive subtype of ADHD. The outputof the study was a diagnostic aid rather than a diagnostic tool. The �naldiagnosis is still to be issued by a specialist. The overall objectives werebroken down as follows:
∗ Identify measurable parameters for ADHD based on DSM-5 criteria andpsychometric tests;
∗ Design and develop diagnostic-aiding software tool;
∗ Perform beta-tests and gather data;
∗ Perform clinical trials and gather data;
∗ Use the gathered data to develop a predictive models;
Stellenbosch University https://scholar.sun.ac.za

CHAPTER 1. INTRODUCTION 3
1.3.1 Game Design
Mobile tablets have become popular and very accessible to the general publicwith the current advances in technology. Playing games on tablets has becomea ubiquitous activity. The software tool was developed in the study was basedon the fact that tablet games are popular and enjoyable. Although the aimof the tool was to aid diagnoses, it had an element of leisure, thus making itmore engaging for the subjects. To keep in line with the development of anovel software method, it was decided that the tool should be in the form ofa tablet-based game. Due to the high expectations of the game design, and tothe fact that the actual game design was not part of the scope of the study,gaming developers were outsourced and given a design speci�cation that metthe following objectives:
∗ Implement measurable parameters;
∗ Develop an overarching storyline;
∗ The duration of the game must be 2 to 3 minutes;
∗ Provide some form of scoring system based on the performance of theuser;
∗ Match the standard of current tablet-based games in terms of aestheticsand ease of use;
1.3.2 Data-Processing Model Design
The purpose of the data processing algorithms underlying the game interfacewas to analyse and process game data. The objectives of the algorithms arethe following:
∗ Gather real-time data (from the parameters) during game-play;
∗ Provide storage structure for the data;
∗ Clean the data (pre-processing);
∗ Create a statistical model with the data;
∗ Make predictions based on the model.
1.4 Motivation
It is desirable to develop a screening tool that serves as a diagnostic aid tospecialists. The most critical part of ADHD diagnosis is early detection. Thisbecomes di�cult in large and busy classroom environments. However, with ascreening tool, teachers and school psychologists can test all the children in
Stellenbosch University https://scholar.sun.ac.za

CHAPTER 1. INTRODUCTION 4
a school. In this manner, even the non-prototypical ADHD patients can beidenti�ed. Additionally, specialists can use the tool during the early stages ofconsultation.
Furthermore, it is desirable to ascertain the e�ectiveness of medication todetermine the correct diagnosis of ADHD in order to limit side e�ects due todrug overdose; to curb costs; to determine whether the dose should be increasedas a child grows older; and to determine which drug works more e�ectively (e.g.stimulant vs non-stimulant types of drugs). The use of a screening tool helpsmake this possible since its results are now quantitative, as opposed to thequalitative results of the traditional methods. The use of quantitative resultswill in turn enable treatment success and progress to be tracked.
The study is valuable because its outcome could potentially yield a prod-uct that will have a positive impact on society. In addition to the potential ofimpacting the lives of patients that su�er from the disorder, the research willadd value to the �eld of ADHD. As will be shown in literature, there are veryfew successful and fully operational objective diagnostic tools.
1.5 Thesis Layout
The thesis is divided into 7 chapters. Each chapter begins with an introduc-tion wherein the main theme(s) of that chapter is conveyed, as well as thesub-themes that will be discussed. Sub-themes will be presented in di�erentsections and the last section of a chapter provides a summary and synthesis.This structure is followed throughout the thesis, with the exception of the in-troductory and concluding chapters which follow their own structures.
Chapter 2 presents a literature review where ADHD is de�ned from a clin-ical point of view. The sub-themes include current diagnosis, existing com-puterised tools and existing sensor-based tools. Chapter 3 explains the designspeci�cation of the software tool. This comprises of two main themes, the gamedesign and the data-processing model design. The design speci�cation for thegame touches on topics such as device selection, functionality and aesthetics.The study methodology is given in Chapter 4 while Chapter 5 is dedicatedto machine learning. The chapter includes a theoretical explanation of themachine learning models that were chosen, as well as how those models wereapplied to the datasets. The results of the machine learning performance arepresented as a conclusion to the chapter. A discussion and analysis of theresults are given in Chapter 6. Finally, conclusions are drawn and recommen-dations are given in Chapter 7.
Stellenbosch University https://scholar.sun.ac.za

Chapter 2
Literature Review
There are various de�nitions that have been given to ADHD that are foundin literature. The key aspect that can be drawn from these de�nitions isthat ADHD has a great impact on behaviour. The de�nition of the term�behaviour� is given as the way in which one acts or conducts oneself, especially
towards others [5]. Therefore, by de�nition, it can be said that ADHD is amultidimensional disorder that a�ects the patient on a number of levels; suchas academically, socially, and personally. Furthermore, as will be discussed,the diagnosis is tiresome and expensive, with the estimated �nancial burdenbeing $3020 per annum for an adult [6]. The following chapter will present�ndings and research pertaining to ADHD and its diagnosis to date. Theliterature review will begin with a discussion on the aetiology. The importanceof the aetiology is that it explains the proposed origins and causes of ADHD.Furthermore, examples of factors that may cause ADHD are presented. Thenext topic that is covered is an idealised version of the current diagnosticprocedure in South Africa. Thereafter, continuous performance testing (CPT)will be explained and existing computerized tests that use this method will bepresented. As an indication of the accuracy of these tests, studies that haveused the tests will also be presented, as well as their shortcomings. Finally,the most recent objective assessment tools will be shown.
2.1 Aetiology
The aetiology of ADHD still remains unclear [2; 7; 8; 9]. The probability thatone will develop ADHD is not based on a single risk factor but a combinationthereof. Risk factors typically include genetics, environmental factors, neu-robiological factors, and psychosocial factors. Each of these risk factors arediscussed subsequently in more depth.
5
Stellenbosch University https://scholar.sun.ac.za

CHAPTER 2. LITERATURE REVIEW 6
2.1.1 Genetics
Similar to most psychiatric disorders, ADHD has a familial nature. Geneticrisk factors can be inherited from one generation to the next, although this isnot always necessarily true: some genetic risk factors are not passed on [10]. Insupport of the familial nature of the disorder, a study conducted by Faraone etal. concluded that the �rst degree relatives of a person su�ering from ADHDare two to eight times more likely to su�er from ADHD than relatives of aperson without ADHD [9]. Another family study found the same results: atwo to eightfold increase in the risk of developing ADHD when a parent orsibling su�ers from ADHD compared to the normal population [11]. To fur-ther support this theory, a study was done where three family studies wereanalysed [7]. The results of those three family studies are shown in Figure 2.1.It can be seen that the occurrence of ADHD in �rst-degree family members ofchildren with ADHD was almost four times as high as the non-ADHD controlgroup.
Another genetic factor that is observed in many studies is gender. Accord-ing to the worldwide prevalence rate, it was seen that the percentage is higherin males. The exact reasons for the higher occurrence are not fully understood.Typically, specialists are more biased to diagnose males as having the disorderbecause they resemble their prototypical patient. Overdiagnosis then becomesa potential risk [12]. It has been found that more boys receive treatment thangirls, where the male-to-female ratio ranges from 5:1 to 9:1 [13]. However,population studies show that the male-to-female ratio of ADHD patients isonly 3:1 [14].
2.1.2 Environmental Factors
A wide range of environmental factors are associated with ADHD, althoughnot all of them are de�nitely causal [10]. Environmental risks can be classi�ed
Figure 2.1: Family Studies in ADHD [11]
Stellenbosch University https://scholar.sun.ac.za

CHAPTER 2. LITERATURE REVIEW 7
as pre/peri natal, psychosocial, dietary or environmental toxins [2; 10]. Themost common prenatal risk is maternal smoking. It has been shown that therisk of having ADHD is related to the intensity of maternal smoking [15]. Somestudies have shown the child is at an increased risk when the mother uses al-cohol moderately [16]. According to studies the inattention subtype of ADHDis associated with prematurity and low birth weight [17]. However, This riskis not necessarily causal since prematurity is also caused by other underlyingfactors. Finally, brain injury can also cause dysfunction in important brainregions.
The mental health of a child can be associated with certain indicators suchas poverty and family adversity. It has been shown that children that aresubject to maltreatment and a harsh parenting style are more susceptible tobeing diagnosed with ADHD [10]. Caution must be taken when correlatingpsychosocial adversity with ADHD because the risk could either be a cause ora consequence of the disorder. Parent-child con�ict, for example, could be aconsequence of the ADHD and not necessarily the cause thereof.
Most dietary risks are associated with de�ciencies in certain importantdietary components. Studies generally show that although diet impacts theneurodevelopment of a child, not enough evidence is present to determinethe extent to which diet causes ADHD [2; 10]. In fact, diet becomes moreimportant in the treatment and management of ADHD and not as much incausing it. Toxic industrial products like polychlorinated biphenyls (PCBs)are environmental contaminants. Studies have reported that exposure to PCBnegatively impacts memory, cognitive functions, and response inhibition [18].These impairments can easily be related to ADHD. Similarly, it has beenfound that lead exposure also a�ects cognitive functions as well as alertnessand vigilance [18].
2.1.3 Neurobiological Factors
The neurobiology of ADHD is not fully understood. Most studies support thehypothesis that there is a relationship between the disorder and dysfunctionof the prefrontal cortex [7]. This region of the brain allows for inhibitory con-trol, which ADHD patients usually lack to some extent. Structural magneticresonance imaging (MRI) studies have shown that with ADHD patients, asopposed to the normal population, there was a decrease in total brain volumeand more speci�cally, in the regions of the brain involved with cognitive con-trol [19].
With regards to motor response, it is observed that children with ADHDmake both quick and long motor responses [7]. Here quick motor response areassociated with impulsiveness and long motor responses are associated withdelayed reaction in the response. The observed response variability is often
Stellenbosch University https://scholar.sun.ac.za

CHAPTER 2. LITERATURE REVIEW 8
attributed to the caudate nuclei. Studies show that the caudate nuclei has asmaller volume in children with ADHD [19]. The implication of this reducedvolume is that although a person with ADHD might formulate a response us-ing the appropriate level of executive function, they might still have troubleexecuting the motor component of that action [19].
The cerebellum is the part of the brain that is responsible for functions suchas time perception and time discrimination. When performing tasks involvingtime, children with ADHD show de�cits. It is becoming increasingly acceptedthat ADHD is a disorder of motor control and timing [20]. De�cits in ADHDpatients are caused by complex combinations of genetics and environmentalfactors, while neurobiological dysfunction is patient speci�c.
2.2 Diagnosis
Proper treatment of ADHD requires an accurate diagnosis. There currentlyexists no totally objective diagnostic method or test, although there are a fewthat are near-objective, as will be discussed in subsequent sections. Therefore,a large part of a diagnosis is made based on clinical criteria de�ned by theDiagnostic and Statistical Manual for Mental Disorders (DSM-5) or by theInternational Classi�cation of Mental Diseases (ICD-10) [2]. Both of thesetools are accepted and used worldwide and they provide a baseline for de�ningsymptoms for various mental disorders, ADHD being one of them. The twostandards use di�erent methods and cover di�erent variations of the ADHD:while DSM-5 is able to identify di�erent subtypes of ADHD, ICD-10 focuses ona much narrower range called hyperkinetic disorder which puts more emphasison hyperactivity. DSM-5 is currently used in South Africa. An importantaspect of the diagnosis is the clinical interview with parents, the child, andother signi�cant members in the child's life. This is necessary since the childmight not be able to report symptoms accurately as opposed to a parent orteacher who has had an opportunity to observe the child. At this stage, ratingscales may be used by parents, teachers and specialists. Rating scales arediscussed further in section 2.2.2. In addition to rating scales, psychometrictest batteries and intelligence tests are used in the diagnosis process. Theseare discussed brie�y in section 2.2.3.
2.2.1 DSM-5 Criteria
DSM-5 identi�es two classi�cations of ADHD: 1) inattention and 2) hyperac-tivity or impulsivity. Each classi�cation is de�ned by nine symptoms. Whenworking with persons under the age of 17 years old, six or more symptomshave to be persistently present in the last six months (from the time of evalu-ation) to a degree that is inconsistent with developmental level and negativelyimpacts directly on social and academic/occupational activities. For individ-
Stellenbosch University https://scholar.sun.ac.za

CHAPTER 2. LITERATURE REVIEW 9
uals older than 17 years old, at least 5 symptoms need to be present. Thesymptoms/criteria for both classi�cations are shown in Table 2.1. In additionto identifying six or more symptoms in a person, other factors must be anal-ysed. One of the factors is that the symptoms must be present in two or moresettings (for example, at home and at school). Another factor is that severalof the symptoms must have been present prior to the age of 12 years old (whenapplicable). Finally, there must be clear evidence that the symptoms interferewith, or reduce the quality of, social, academic, or occupational functioning.
Table 2.1: DSM-5 Criteria for ADHD
Inattention Hyperactivity/Impulsivity
1.Fails to give close attention to de-tails/makes careless mistakes
Often �dgets with or taps handsor feet or squirms in seat
2. Di�culty sustaining attentionOften leaves seat in situationswhen remaining seated is ex-pected
3.Does not listen when spoken todirectly
Often runs about or climbs in sit-uations where it is inappropriate
4.Does not follow through on in-structions and fails to �nish tasks
Often unable to play or engage inleisure activities quietly
5. Di�culty organizing tasksOften �on the go� acting as if�driven by a motor�
6.Avoids/dislikes tasks that requiresustained mental e�ort
Often talks excessively
7. Loses things necessary for tasksOften blurts out an answer beforea question has been completed
8.Easily distracted by extraneousstimuli
Often has di�culty waiting his orher turn
9. Forgetful in daily activitiesOften interrupts or intrudes onothers
DSM-5 identi�es three subtypes of ADHD, each with an associated level ofseverity, where the levels of severity are speci�ed as mild, moderate or severe.The three subtypes of ADHD are listed as follows:
314.01 (F90.2) Combined presentation: Both the inattention andhyperactivity impulsivity criteria are met for the past 6 months.
Stellenbosch University https://scholar.sun.ac.za

CHAPTER 2. LITERATURE REVIEW 10
314.00 (F90.0) Predominantly inattentive presentation: The inat-tention criterion is met but the hyperactivity-impulsivity criterion is notmet for the past 6 months.
314.01 (F90.1) Predominantly hyperactive/impulsive presenta-tion: The hyperactivity-impulsivity criterion is met but the inattentioncriterion is not met over the past 6 months.
2.2.2 Rating Scales
Rating scales are useful in assisting the diagnosis process. Various ratingscales are found and can be used by parents, teachers, and specialists. Theirpurpose is to generate an objective assessment that is based on the child'sbehaviour, social interaction and emotional state. Examples of scales includethe Swanson, Nolan and Pelham scale (SNAP), the Swanson, Kotkin, Agler,M-Flynn and Pelham scale (SKAMP), and the Connors' parent, teacher, andadolescent self-report scales, shown in Figure 2.2 [21]. These scales focus onclassroom behaviour and performance. The Vanderbilt scale, shown in Figure2.3 [22], takes into account classroom behaviour as well as comorbid conditions[8; 23].
Figure 2.2: Extract of Connors Scale [21]
Figure 2.3: Extract of Vanderbilt Scale [22]
Stellenbosch University https://scholar.sun.ac.za

CHAPTER 2. LITERATURE REVIEW 11
Although rating scales are a very useful element of the diagnosis, they caninclude up to 90 questions. It can therefore be argued that there is some subjec-tivity in answering so many questions as opposed to having fewer questions. Ina 2012 survey conducted by NeuropsychologySA, a website that aims to bringinformation to the neuropsychology community of South Africa, 20% of thethe psychologists and registered counsellors that work with ADHD indicatedthat their preferred rating scale was the Connors Comprehensive BehaviourRating Scales. This was the most popular rating scale by far due to its morecompact and direct form.
While there may be a wide range of rating scales available, each special-ist may have his/her own preference as to which one to use, based on theirexperience. That being said, there is no speci�c �rule� as to which scale touse. The general format of rating scales is similar to the �gures shown. Itcomprises of a series of symptoms and observed behaviours and for each onethe parent, teacher or specialist categorises its occurrences based on a scalesuch as: Never�Occasionally�Often�Very Often. Hence the term �rating scale�.The details of the parents and the child are also usually required as well aswhether or not the child is on medication. A scoring system is also provided,based on the number of questions for each occurrence and this classi�es thetype of disorder the child may have, if any.
2.2.3 Neuropsychological Tests
Psychological tests are often used when diagnosing ADHD. However, they donot provide su�cient speci�city to give insight as to what is causing the symp-toms. Therefore, to provide a more comprehensive diagnosis, neuropsycholog-ical tests are used. The tests consist of tasks that are speci�cally designedto measure a psychological function known to be linked to a particular brainstructure or pathway [24]. They provide speci�city into which underlying neu-rological processes are causing the symptoms. Neuropsychological tests mayalso be used to better understand the aetiology of a disorder, as well as ameans for testing intelligence.
There exists a wide range of neuropsychological tests and they evaluate oneor more of the following ten skills: 1. attention and concentration, 2. verbaland visual memory, 3. auditory and visual processing, 4. visual-spatial func-tioning, 5. language and reading skills, 6. sensory development and sensoryintegration, 7. gross and �ne motor development, 8. social skill development,9. executive functioning and 10. emotional and personality development. Ac-cording to NeuropsychologySA, the most popular test was the Bender-GestaltTest that is used by 28% of the psychologists and counsellors that were sur-veyed [25]. The rest of this section describes six common tests that are usedin the diagnosis process.
Stellenbosch University https://scholar.sun.ac.za

CHAPTER 2. LITERATURE REVIEW 12
Bender-Gestalt Test
The Bender-Gestalt Test is a tool used for the evaluation of visual-motor func-tioning and visual perception skills. This test is helpful in diagnosing braininjury and proper functioning of the brain. Some of the parameters that aremeasured include visual maturity, visual motor integration skills, style of re-sponding, reaction to frustration, ability to correct mistakes, planning andorganizational skills and motivation. The test is administered by pencil andpaper. Nine geometric �gures are drawn in black and these �gures are shownto the subject one at a time. The subject is then asked to copy the �gure ona blank sheet of paper, as precisely as possible. An eraser is made available tocorrect mistakes but no mechanical tools, such as rulers, may be used. Figure2.4 [26] shows an example of the test. On the left pane, the nine geometricshapes are presented. The right pane corresponds to what was drawn by asubject during the test. One of the reasons why this test is popular is theshort amount of time required to run the test.
Figure 2.4: Bender-Gestalt Test [26]
Wescheler Intelligence Scale for Children
The WISC test was developed by Dr. D. Weschler according to whom thede�nition of intelligence was described by an individual's ability to adapt andconstructively solve problems in the environment [27]. Weschler's approachwas that intelligence should be measured in terms of performance rather thancapacity [27]. The WISC test provides information regarding a child's cog-nitive functioning as well as IQ scores. The duration of the test is between65 and 80 minutes and consists of 10 core subtests and 5 additional subtests[27]. The age range is six years old to 16 years and 11 months old. Adult
Stellenbosch University https://scholar.sun.ac.za

CHAPTER 2. LITERATURE REVIEW 13
and pre-school Weschler tests are also found and have a similar structure tothe WISC test. The following 4 indices are measured by the WISC test: 1.Verbal Comprehension Index (VCI), 2. Perceptual Reasoning Index (PRI), 3.Working Memory Index (WMI), 4. Processing Speed Index (PSI).
Senior/Junior South African Individual Scales (SSAIS/JSAIS)
The Senior and Junior South African Individual Scales tests are a battery oftests that comprise of 22 tests that assess intelligence and cognitive ability.According to the previously mentioned survey, the JSAIS tests were the mostpopular intelligence tests, where 26% of the interviewed psychologists.
Continuous Performance Tests
Continuous performance tests or continuous performance tasks (CPT) mea-sure a person's sustained attention. The term sustained attention refers to theability to keep a consistent focus through a period of time, while external stim-uli are present. It is accepted that CPT is the most frequently used measureof attention in both practice and research [28]. An example of a computerizedCPT test is the Conners Continuous Performance Test 3rd edition (ConnersCPT 3) described in section 2.3.1.
Modi�ed Silhouettes Test
The Silhouettes test forms part of a broader battery of tests called the VisualObject and Space Perception (VOSP) battery and can be used independentlyof the battery [29]. In its totality, the VOSP battery consists of eight tests:four tests for object perception and four tests for space perception citeSiltest.The Silhouettes test falls under the object perception half of the VOSP battery.The test consists of a number of drawings of animals and inanimate objects(generally 30 items). Each drawing di�ers from the others in its angle ofview as well as the extent to which distinctive features can be identi�ed. Theobjective is to identify and name the items. Since language can be a potentialbarrier, other means of identi�cation, such as gestures or descriptions, maybe used [29]. As a rule, the test should be abandoned after �ve consecutivefailures [30].
Token Test
The Token Test assesses receptive language ability [31]. The test consists oftwenty di�erent tokens (a token refers to a distinct item) varying in shape(circle or rectangle), colour (red, green, blue, white, or yellow), and size (largeor small) [32]. The objective of the test is to identify and/or manipulate thetokens based on various spoken directions. The directions are given in orderof length and increasing di�culty. The original test consists of 61 commandsbut shortened versions of 36 commands are also used. The results of this test
Stellenbosch University https://scholar.sun.ac.za

CHAPTER 2. LITERATURE REVIEW 14
re�ect on factors such as short-term and working memory, language syntaxand semantic development, amongst others [31].
2.2.4 Neuropsycgological Test Perfomance
Persons with ADHD are expected to perform poorly in neuropsychologicaltests compared to those without ADHD [33]. This speculation is supported bya study wherein the performance of ADHD subjects was assessed relative topublished norms [33]. In the study, clinical data were collected for 78 childrenwith ADHD, where the mean age was 11 years and 10 months. The childrenhad all been referred for neurospychological treatment at hospitals in Texas.Inclusion criteria was age (6 to 17.9 years old) and intelligent quotient (IQ)higher than 70. All the children had been diagnosed based on DSM-4 criteriaby a clinical neuropsychologist.
During the study, 36% of participants were on stimulant medications, 35%were on antianxiety or antidepressant medication, 9% were on mood stabilizersand 4% were on antipsychotics. Despite the present comorbid disorders, thestudy showed that it did not a�ect the performance of the subjects. WISC-IIIestimates were available for 62 of the children in the sample where the meanIQ was within average range of 91.79. Using single-sample two-tailed t tests,the sample's mean was signi�cantly below the population mean (t-score). Thefollowing seven types of tests were done during the study: 1. attention span,2. sustained attention, 3. single-trial learning, 4. learning with repetition, 5.retention of learning, 6. response inhibition, and 7. working memory.
Each test categories consisted of various tests. Only the overall results willbe discussed. The attention span test consisted of the MAE Token Test whichmeasures language comprehension, attention span and auditory processing.Mean performance of the sample was at the 15th percentile relative to thepopulation performance. Fail rates for the attention span tests were between9 and 38%. The sustained attention test made use of a VCPT test that mea-sured the number of omissions and reaction time (RT). It was found that foremission errors, the sample performed more than 3 standard deviations belowthe normative mean. In contrast, reaction time was close to the normativemean. The fail rate for the omissions was 42% while that of the reaction timewas 17%. As far as the other tests go, similar trends were observed in theperformance. The sample score usually ranged between one to three standarddeviations lower than the normative mean. The fail rate was seen to rangebetween 10-50%. The reason for the wide range in fail rate was due to the factthat for each test, a di�erent sample size was used.
Hence, the afore-mentioned study supports the hypothesis that personswith ADHD are expected to perform poorly compared to persons withoutADHD. The study showed that there were statistically signi�cant weaknesses
Stellenbosch University https://scholar.sun.ac.za
CHAPTER 2. LITERATURE REVIEW 15
among the ADHD sample on a range of tests, compared to the norm. Academicperformance was also generally observed as being near and below the mean.Furthermore, the study revealed that out of all the tests, CPT tests were themost sensitive to the weaknesses in ADHD patients.
2.2.5 Comorbidity
When evaluating a person for ADHD, it is important to assess comorbidity.Comorbidity refers to the presence of one or more additional disorder thatco-occurs with a primary disorder. The implication of the comorbid natureof ADHD is that the complexity of diagnosis increases because other possi-ble disorders have to be accounted for. Some examples of conditions thatare comorbid with ADHD include: sleep disorder, learning disability, conductdisorder, anxiety, depression, sleep problems, ASD, hearing problems, epilep-sy/seizures, Tourette's, eating disturbances anger/violence, vision problems,suicidal thoughts and ODD.
2.2.6 Current Diagnostic Process in South Africa
An important aspect of the diagnosis is the clinical interview with parents,the child, and other signi�cant members in the child's life. This is necessarysince the child might not be able to report symptoms accurately as opposedto a parent or teacher who has had an opportunity to observe the child. Thecurrent overall process used to evaluate and diagnose ADHD in South Africanschoolchildren is shown in Figure 2.5 [2] (page 16). The process begins withthe identi�cation of suspected signs and symptoms of ADHD made by eitherschool personnel, parents or the schoolchildren themselves. These signs andsymptoms may vary from being behavioural, such as anger, aggression and lowself-esteem for example, to physical, such as hyperactivity and being messy.
Once signs and symptoms have been identi�ed, the clinical process begins,wherein the full medical history is compiled. This includes physical exam-inations and neurological and neuropsychological examinations. The DSM-5criteria are then assessed based on the medical history, as well as the suspectedsigns and symptoms. For the case where the criteria aren't met, re-evaluationis done to determine a proper diagnosis. On the other hand, when the cri-teria are met, comorbidities are checked for to determine whether ADHD isthe primary condition or if there are other conditions present. In the caseof the absence of comorbidities, the diagnosis is that ADHD is the primarychronic disorder. When comorbidities are present, however, the treatment isindividualised based on the most problematic symptom.
Stellenbosch University https://scholar.sun.ac.za

CHAPTER 2. LITERATURE REVIEW 16
Figure 2.5: Evaluation and Diagnosis of ADHD
2.3 Existing Computerized Tools
2.3.1 Conners CPT 3
The Conners Continuous Performance Test (CPT) 3rd edition is a computer-ized assessment that evaluates attention disorders and neurological function-ing. Its aim is to provide an objective evaluation of individuals aged eightyears and older. During the 14 minute-long assessment, subjects are to clickwhenever any letter except `X' appears on the screen. The four indexes thatare looked at are inattentiveness, impulsivity, sustained attention, and vigi-lance, as explained in Table 2.2. Based on the descriptions of the indices inTable 2.2, it can be suggested that the CPT 3 Test is more prone to pick
Stellenbosch University https://scholar.sun.ac.za

CHAPTER 2. LITERATURE REVIEW 17
up inattentiveness since there are �ve score areas for this index, as opposedto the other indices that only have three score areas. Furthermore, it is seenthat omission, commission and hit response time (HRT) are used in each index.
The normative sample that was used consisted of 1400 subjects represen-tative of the United States population in terms of demographic factors such asgender, race, geographical region and parental education level. Furthermore,the gender distribution in the normative sample was at a ratio of 1:1. The twomain age groups that the sample consisted of was the 8 to 17 years old groupand the 18+ years old group.
Table 2.2: Areas of Attention Measured during the CPT 3 Test
Dimension Score Description
Innatentiveness
Detectability (d')Discriminating between targets andnon-targets
Omissions Missed targets
Commissions Incorrect response to non-targets
HRTa Response speed
HRT SDb Response speed consistency
VariabilityVariability of response speed consis-tency
Impulsivity
HRT Response speed
Commissions Incorrect response to non-targets
PreservationsRandom anticipatory responses (i.e.HRT < 100 ms)
Sustained attention
HRT BlockChange
Change in response speed acrossblock of trials
Omissions byBlock
Missed targets by block
Commissionsby Block
Incorrect response to non-targets byblock
Vigilance
HRT ISIcChange in response speed at variousISIs
Omissions byISI
Missed targets by ISI
Commissionsby ISI
Incorrect responses to non-targetsby ISI
a: HRT = hit response time, b: SD = standard deviation, c: ISI = inter-stimulus interval
Stellenbosch University https://scholar.sun.ac.za

CHAPTER 2. LITERATURE REVIEW 18
Reliability
Test-retest reliability gives an indication on the consistency of the scores ob-tained from a speci�c subject over a period of time. The CPT 3 test wasadministered twice to a sample of 120 subjects from the general populationwithin a 1 to 5 week interval between the tests. The median test-retest corre-lation was 0.67 and this suggests good test-retest reliability.
Internal consistency was the other parameter that was measured to deter-mine the reliability of the CPT 3 test. Split-half reliability was used as anindication of internal consistency. The median split-half reliability was 0.92for the normative sample and 0.94 for the clinical sample. This shows that theCPT 3 test has very good internal consistency.
Validity
The validity of the Conners CPT 3 test could be shown when its results werecombined with that of other similar tests/assessments of attention. In the �rstinstance, this was demonstrated by taking the Conners CPT 3 results of asample of 112 non-ADHD and ADHD children under the age of 18 years old.For the same sample, the results of the Conners 3rd edition parents' ratingscale (Conners 3-P) were also collected. In the second instance, a sample of137 non-ADHD and ADHD adults was taken. Their Conners Adult ADHDRating Scales (CAARS) self-report results were combined with their ConnersCPT 3 results. Logistic regressions were used to determine the accuracy of thefollowing 3 parameters for the rating scales:
(i) Overall classi�cation accuracy: the ability to classify subjects correctlyas either ADHD or non-ADHD;
(ii) Sensitivity: the ability to correctly detect ADHD subjects;
(iii) Speci�city: the ability to correctly detect non-ADHD subjects.
Additionally, these same parameters were also determined when the Con-ners CPT 3 was used together with the Conners 3-P results and when theConners CPT 3 was used together with CAARS. It was seen that when theCPT 3 test was used together with rating scales, the classi�cation, sensitivityand speci�city both increased notably, as seen in Table 2.3. It can be seen thatthe Conners 3-P report performed acceptably in terms of the three parameters.However, when used together with the CPT 3 test, the overall classi�cationincreased by 4.5 %, the sensitivity by 3.5% and the speci�city by 6.3 %. TheCAARS result showed that the sensitivity performed quite poorly comparedto the speci�city of 94.6 % and the overall classi�cation accuracy of 89.1 %.When combined with Conners CPT 3, the sensitivity increased by just below10 % and the overall classi�cation accuracy and speci�city both increased by3.6 % and 2.7 %.
Stellenbosch University https://scholar.sun.ac.za

CHAPTER 2. LITERATURE REVIEW 19
Table 2.3: Classi�cation Accuracy, Sensitivity and Speci�city of Conners Tests
Parameter Conners 3-PConners 3-P& ConnersCPT 3
CAARSCAARS &
Conners CPT3
Accuracy 0.839 0.884 0.891 0.927Sensitivity 0.860 0.895 0.654 0.731Speci�city 0.810 0.873 0.946 0.973
2.3.2 MOXO
MOXO Analyticsis is an innovative, online, science-based and clinically vali-dated system [34]. MOXO provides age adjusted CPT tests accompanied witha detailed patient attentiveness pro�le. The test is based on the Conners CPT3 Test in the sense that the overall task to be completed is the same. Thatis, to respond to a speci�c visual stimulus. During the computerized test thepatient is required to press the space-bar on the computer's keyboard everytime a speci�c shape/object appears on the screen while visual and auditorydistractions are present. A screen-shot of a demo can be seen in Figure 2.6 [34].
Figure 2.6: MOXO demonstration [33]
The test can only be administered by a quali�ed professional. MOXOprovides a test for children between the age of 7 and 12 years old and forindividuals between 13 and 60 years old. The children's test is 15 minutes induration while the adult test is 18 minutes. For both test versions 8 di�cultylevels are present. The following four indices are measured during the tests
Stellenbosch University https://scholar.sun.ac.za

CHAPTER 2. LITERATURE REVIEW 20
and evaluated against the patient's age and gender-speci�c norm group: 1.Attention, 2. Timing, 3. Impulsiveness and 4. Hyperactivity.
The results of the test are presented graphically in the form of an atten-tiveness pro�le and a performance graph. Figure 2.7 [34] shows an example ofan attentiveness pro�le. The four indices are represented by the four capitalletters in the table. The examinee type describes the pro�le of the examinee interms of the indices. The number that appears next to each letter is the indexof performance level (1 to 4) determined by the standard z-score as describedin Table 2.4 [34].
Figure 2.7: Attentiveness Pro�le [33]
Finally the severity index, s (1 to 4), indicates performance outside thenorm range determined by the standard z-score as described in Table 2.5 [34].The severity index does not appear when the standard score is within normrange. The matrix that appears below the Examinee Type description in Fig-ure 2.7 graphically shows the index of performance of each attention index.The criteria table in Table 2.4 summarise this.
The last element of the attentiveness pro�le as seen in Figure 2.7 is theseverity table. As was explained, severity indicates performance that is outsidethe norm range. Table 2.5 shows the severity table that describes the severityof performance impairment.
Stellenbosch University https://scholar.sun.ac.za

CHAPTER 2. LITERATURE REVIEW 21
Table 2.4: MOXO Criteria Table
Level Colour z-score Description
1 Z ≥ 0Good performance, with highernorm range (average and above)
2 −0.825 ≤ Z < 0Standard performance, with middlenorm range (below average)
3 −1.65 < Z ≤ −0.825 Weak performance, within low normrange
4 −1.65 ≥ Z Di�culty in performance, outsidenorm range
Table 2.5: MOXO Severity Table
Level Severity Position in population
1 Low −1.95 < Z ≤ −1.65 (2% of population)2 Medium −2.25 < Z ≤ −1.95 (1.5% of population)3 High −2.55 < Z ≤ −2.25 (0.75% of population)4 Extreme −2.75 < Z ≤ −2.55 (0.75% of population)
For example, for the Examinee Type �A4s3 T3 I1 H4s2� shown in the topleft of Figure 2.7, the interpretation of the attentiveness pro�le type is asfollows:
1. Attention performance index is 4 with high severity, outside the normrange;
2. Timing performance index is 3, within the low-norm range;
3. Impulsivity performance index is 1, within the higher-norm range;
4. Hyperactivity performance index is 4 with medium severity, outside thenorm range
As previously mentioned, the other graphical representation of the resultsis presented in the form of a performance graph. This graph shows the per-formance score (0 to 100) for each index (attention, timing, impulsivity andhyperactivity) on the y-axis vs the di�erent game levels on the x-axis. Itmust be noted that the performance score is a re�ection of the number of keypresses and not based on the average score in the sample. In determining theperformance score for the attention and timing indices, the more key presses
Stellenbosch University https://scholar.sun.ac.za

CHAPTER 2. LITERATURE REVIEW 22
represent a higher score. In contrast, for the impulsiveness and hyperactivityindices, a higher score is achieved when the key presses are kept low. A typicalperformance graph is shown in Figure 2.8 [34].
Figure 2.8: MOXO Performance Graph [33]
In this example, it can be seen the the performance for the attention indexand for the time were generally stable throughout the test. The hyperactivitychanged drastically between levels. This can be explained by the fact thatsome levels include distractors while others do not. The impulsivity, althoughstable, showed poor performance.
Validity of MOXO
Two studies found in literature provide evidence of the validity of the MOXOtest in terms of its ability to correctly discriminate between ADHD and non-ADHD individuals. The rationale behind the studies in using MOXO was thatthe inclusion of the distracting auditory and visual stimuli improves the diag-nosis [35].
The �rst study that supports the validity of the MOXO test was conductedwith 663 children between 7 and 12 years old, with 345 children in the ADHDgroup 318 children in the non-ADHD group [36]. It was hypothesised thatADHD children would have more omission errors when pure visual, pure audi-tory, and a combination of both types of distracting stimuli were present. Theresults validated the hypothesis by showing that ADHD children committedmore omission errors than their non-ADHD peers across all test conditions
Stellenbosch University https://scholar.sun.ac.za

CHAPTER 2. LITERATURE REVIEW 23
Table 2.6: Omission errors between ADHD and non-ADHD Children
Level Distractor TypeADHD (N = 345) Non-ADHD (N = 318)
M SD M SD
1 Base line 1.80 2.57 0.80 1.302 Visuala 3.21 3.38 1.19 1.323 Visualb 2.73 3.09 1.18 1.424 Auditorya 2.50 3.21 0.95 1.255 Auditoryb 2.74 3.86 0.97 1.396 Combineda 3.52 3.90 1.58 1.647 Combinedb 3.45 4.17 1.75 2.178 No distractors 2.26 3.19 1.21 1.95
M = mean, SD = standard deviation, a = low distractibility, b = high distractibility
(no distracting stimuli, only auditory or visual stimuli, combined distractingstimuli) and all levels. Furthermore, the results showed that for non-ADHDchildren, the omission errors only increased when combined distractors wereused while for ADHD, the omission errors increased for all types of distractingstimuli. The detailed results of the study are shown in Table 2.6 [36].
As can be seen from Table 2.6, the means and standard deviations for eachdistractor type are smaller by approximately a factor of 0.5 for the non-ADHDgroup compared to the ADHD group. For both groups the combined distrac-tor with high distractibility gave the highest omission errors (4.17 SD for theADHD group and 2.17 SD for the non-ADHD group). The baseline distractortype gave the smallest omission errors (2.57 SD for the ADHD group and 1.3SD for the non-ADHD group). Based on these results, it can be suggestedthat MOXO can discriminate between an ADHD group and a non-ADHDgroup where the feature with the highest discrimination ability is the com-bined distractor with high distractibility.
The second study aimed to show that the MOXO adult's test could cor-rectly classify ADHD and non-ADHD teenagers. Adolescent ADHD is of in-terest because it is more complex to pick up compared to childhood ADHD.This is due to the fact that ADHD in adolescents and adults is accompaniedwith various comorbidities [37]. The study analysed the performance of 176adolescents between 13 and 18 years old on the MOXO test. The ADHD groupconsisted of 133 adolescents while the non-ADHD group was 43 adolescents.Similar to the two previous studies, the hypothesis was that ADHD adoles-cents would perform more poorly than their non-ADHD peers in the presenceof distracting stimuli. The detailed results of the study are shown in Table 2.7[35].
The results show that ADHD adolescents have more omission errors than their
Stellenbosch University https://scholar.sun.ac.za

CHAPTER 2. LITERATURE REVIEW 24
Table 2.7: Omission errors between ADHD and non-ADHD Adolescents
Distractor TypeADHD (N = 143) Non-ADHD (N = 33)
M SD M SD
No distractors 2.17 0.44 0.58 1.22Visual distractors 3.56 3.24 1.02 2.09Auditory distractors 2.46 2.95 0.81 2.14Combined distractors 3.92 3.49 0.88 2.45
M = mean, SD = standard deviation
non-ADHD peers. This can be seen by the mean values for the ADHD groupbeing almost double that of the non-ADHD group. Similar to the previousstudy, the omission error is higher for the combined stimulus (3.49 SD forthe ADHD group and 2.45 SD for the non-ADHD group). Finally, the lowestomission errors occurred in the absence of distractors (0.44 SD for the ADHDgroup and 1.22 SD for the non-ADHD group). The same conclusion can bedrawn as for the previous study. The MOXO test can be used to discriminatebetween ADHD adolescents and non-ADHD ones. Once more, the feature withthe highest discrimatory ability was the combined distractor.
2.4 Existing Sensor-Based Tools
So far, only computerized tests and software tools have been discussed assolutions to diagnose ADHD. However, literature shows that hardware canalso be used to give an indication of the presence of ADHD. This hardware ismainly in the form of sensors. The rest of the discussion will focus on two typesof sensor-based tools. The �rst tool is inertial measurement units (IMUs) andthe second is electroencephalography.
2.4.1 Objective Diagnosis of ADHD using IMUs
A study was conducted wherein miniature wireless inertial sensors were usedas an objective tool for diagnosing ADHD [38]. The rationale behind the useof IMUs is that they can accurately measure linear and rotational movementusing accelerometers and gyroscopes. The measured data can then be usedtogether with sophisticated data analysis methods such as machine learning,to develop a typical statistical pro�le that characterises an ADHD individualand a non-ADHD individual.
The subjects were 43 children between the ages of 6 and 11 years who werereferred to the Child and Adolescent Psychiatry Unit of the Department ofPsychiatry at Fundación Jiménez Díaz Hospital in Madrid, Spain. The ex-perimental group consisted of the children diagnosed with ADHD (N = 24)
Stellenbosch University https://scholar.sun.ac.za

CHAPTER 2. LITERATURE REVIEW 25
while the control group consisted of those that did not meet DSM 5 criteriafor ADHD (N = 19).
The procedure that was used to record data for each subject was to attachone IMU to the subject's belt (located at the waist) and another IMU was�xed to the ankle of the subject's dominant foot using a velcro strap. Thereason for having two IMUs was that the one attached to the belt would giveglobal measurements of the body while the one on the ankle would capturelocal movement. The two IMUs were attached to the subjects during theirhour-long visit to the psychiatric consultancy. The subjects were put into �vedi�erent contexts during their visit. In this study, the term �context� referredto the �where, what and with whom� of the subject's environment [38]. The�ve contexts are shown in Table 2.8 [38]
Table 2.8: Contexts Used for Diagnosing ADHD with IMUs
Label Context Description
WP Waiting room; with parentsWS Waiting room; with supervisor onlyCD Consultant's room; with psychiatristCP Consultant's room; with psychiatrist and parentsTT Taking the TOVA test; with supervisor only
The machine learning method that was used was a support vector machinewith a linear kernel. The most representative feature set was calculated forthe gyroscope and the accelerometer, for each sensor location and for each con-text. Age, gender and T.O.V.A score were also used as features. The followingfeature categories were used, where the number of features is shown in brack-ets: 1. high resolution histograms (35), 2. correlation between sensors/sensortypes (8), 3. basic statistics (52), 4. frequency domain (8), 5. nonlinear fea-tures (4), 6. structural features (20), 7. motion features (6), 8. total percontext (133) and 9. test of variables of attention (TOVA) score, age, gender(3). This resulted in a total of 688 features. Furthermore, a forward-selectionmethod was used to select the features that achieved the best classi�cation ac-curacy in each context. This resulted in a maximum of 15 features per context.
Table 2.9 [38] shows the classi�cation performance of each context, as wellas spec�city and sensitivity. It can be seen that the overall accuracy of theSVM is good, where the lowest accuracy was 81.40%. Speci�city and sensitiv-ity were satisfactory, although sensitivity was generally lower: the minimumsensitivity was 73.68% while the minimum speci�city was 81.81%. The resultsshow that the best classi�cation performance was achieved when all contexts
Stellenbosch University https://scholar.sun.ac.za

CHAPTER 2. LITERATURE REVIEW 26
Table 2.9: Classi�cation Performance of SVM for Diagnosing ADHD withIMUs
Context k Accuracy Sensitivity Speci�city
WP 5 0.8372 0.7368 0.9167WS 14 0.8537 0.8947 0.8181CD 7 0.8372 0.7368 0.9167CP 5 0.8140 0.5789 1TT 6 0.9302 0.8947 0.9583
All 10 0.9512 0.9444 0.9565
were combined. The reported accuracy for this setting was 95.12%, the sensi-tivity was 94.44%, and the speci�city was 95.65%. It was seen that the mostaccurate results in discriminating between ADHD and non-ADHD, other thanthe combined contexts, occurred when concentration was required. In this set-ting, the reported accuracy, sensitivity and speci�city were reported as 93.02%,89.47% and 94.83% respectively. Furthermore, it was seen that the IMU thatmeasured global movement provided better discrimination than the one thatmeasured locally [38].
2.4.2 ADHD Diagnosis with EEG
NEBA is the �rst FDA-approved medical device that uses EEG to help clin-icians to more accurately diagnose ADHD in children between the ages of 6and 17 years [39]. The device measures the electrical activity in the front partof the brain and this allows clinicians to determine whehter the symptoms aredue to ADHD or some comorbid disorder. The duration of the test is approx-imately 20 minutes. One of the greatest challenges with the device is its cost.Some specialists have questioned whether the device would be any better thancurrent diagnoses [40].
The most recent study spread over 13 independent sites and included 275children presenting signs and symptoms of ADHD [41]. Their full clinical eval-uation data was used in conjunction with the EEG data. Quali�ed clinicianswere used to perform di�erential diagnosis, while a separate team performedthe EEG tests and collected data. The gold standard used was consensus di-agnosis by a multidisciplinary team.
The results showed that out of the 209 children that were clinically diag-nosed as per site, 93 of them were overdiagnosed by the multidisciplinary team.Furthermore, 85 of the 93 children were also identi�ed by EEG. Ultimately,it was seen that the integration of EEG with the consensus diagnosis yielded
Stellenbosch University https://scholar.sun.ac.za

CHAPTER 2. LITERATURE REVIEW 27
a 97% accuracy. In conclusion, the results showed that the EEG integrationmay help reduce overdiagnosis.
2.5 Summary of Literature
Literature was reviewed using searches on two databases: Stellenbosch Univer-sity Library Database and Mendeley. For the former database, the advancedsearch option was chosen to narrow the searches to speci�c hits. The scope ofthe literature reviewed was limited to the following categories: aetiology, diag-nosis, treatment and existing methods. The year of publication was generallykept between 2005 and the current year. In some cases, older papers werethe most relevant ones or were referred to in other papers and were thereforeincluded in the review.
The method that was used was to search for articles and papers that in-cluded the term �ADHD" in the title. To re�ne the searches, di�erent com-binations of the following keywords were added to the main term: aetiology,causes, risk factor, genetic factor, prevalence, worldwide, gender, treatment,drugs, overdiagnosis, diagnosis, objective, computerised, neurophychological,software, machine learning, validity, sensitivity, speci�city. The papers thatwere reviewed were the ones that were most relevant in both databases interms of citations. In total, 30 articles were reviewed. Additionally, some in-formation was obtained directly from websites such as the online-based toolslike MOXO and.
The research community and specialists accept that the origin and causeof ADHD are both unknown [2; 7; 8; 9]. However, studies support the like-lihood of genetic inheritance and heritability of the disorder [7; 9; 11]. It isalso seen that environmental factors such as psychosocial and peri/pre-natalfactors contribute to the development of ADHD although such factors maybe consequential rather than causal [2; 10]. In terms of its neurobiology, it iswidely accepted that ADHD is associated with dysfunction of the prefrontalcortex [7; 19; 20].
Diagnosis of ADHD is based on clinical criteria de�ned by DSM 5 (or ICD10 for Europe) [2]. Proper diagnosis involves clinical interviews with the childand parents, psychometric testing (in South Africa the JSAIS test battery isoften used) and rating scales completed by parents/guardian, teachers andthe specialist [8; 23]. Since comorbidity is likely to occur, diagnosis must betreated as being patient-speci�c. Although data on prevalence in South Africais incomplete, it is generally considered to be similar for youth worldwide, be-tween 4 � 10 % [42; 43].
Stellenbosch University https://scholar.sun.ac.za

CHAPTER 2. LITERATURE REVIEW 28
Literature strongly shows that there is a need to develop objective toolsfor ADHD diagnosis. The method with the most accurate discriminatory abil-ity was found to be CPT testing with environmental distractors [35; 44; 36].MOXO is an example of a tool that uses this method [34]. Although it is agood baseline tool for discriminating between ADHD and non-ADHD, it doesnot include any form of cognitive testing and might therefore fail to discrim-inate between di�erent subtypes of the disorder. Another study showed thatan objective ADHD diagnosis can be made using inertial sensors attached toa subject [38]. Currently, there exists another FDA-approved device calledNEBA. It uses EEG signals to aid the clinician when making a diagnosis [39].
In conclusion, the literature reveals that there are increasing e�orts in de-veloping objective tools. However, although there may be many tools available,very few, except for MOXO, have been validated in terms of speci�city andsensitivity. Furthermore, no tool exists that uses an interactive market-placegame. Instead, most tools use CPT tasks and computerized neuropsychologicaltests.
Stellenbosch University https://scholar.sun.ac.za

Chapter 3
Design Speci�cation
A detailed description of the design process is given in the following chapter.The importance of the design speci�cation is that it transforms the user re-quirements into a prototype that meets the overall objectives of the study. Asdiscussed in the introductory chapter, the proposed method for achieving theobjectives was a multi-layered software tool. The top layer was the game anduser interface while the underlying layers consisted of data gathering tools,data-processing, and machine learning algorithms. This chapter will give adetailed speci�cation of each of the di�erent layers of the software tool. Assuch, each section of the chapter will deal with one of the layers. Since thedevelopment of the game was not the direct outcome of this research, it wasoutsourced to a gaming developer. The role of the developer was to create theback and front ends of the game. The back end dealt with the functionalityof the game from a programming perspective while the front end allowed forpre-constructed building blocks such as tiles and items to be drag-and-droppedto create the gaming environment. In this way, the researchers had freedomof design in terms of the layout of the environment.
3.1 Game Development
While the literature presented various traditional methods for diagnosing ADHD,the chosen approach for designing the software tool was to develop a game thatwas easy to play, without necessarily including some of the aspects of the tradi-tional methods. The development of the game began with translating DSM-5criteria into measurable parameters. Thereafter, possible game mechanics wereinvestigated. In this context the term �game mechanic� refers to how the userinteracts with the game itself (e.g. pressing a button to initiate an action vsusing voice commands to initiate an action), as well as how the objects andcharacters within the game environment interact with each other (e.g. 2D vs3D, range of motion of characters, etc.) The following step was to determinea game theme, a game task and a simple storyline with characters. The de-velopment sequence that was followed can be seen in Figure 3.1. The output
29
Stellenbosch University https://scholar.sun.ac.za

CHAPTER 3. DESIGN SPECIFICATION 30
of the sequence was a game, ready to be deployed on a device.
3.1.1 Measurable Parameters from DSM-V
DSM-5 criteria for ADHD were analysed with the aim being to translate theminto measurable parameters. It was seen that not all criteria could be trans-lated into quanti�able parameters. This was especially true with the criteriafor the hyperactivity subtype. Since the game was a screening tool, not allthe criteria had to be quanti�ed. The resulting parameters are given in Table3.1. The parameter names are given in the �rst column. As will be explainedsubsequently, each parameter has one or more variables associated to it. Thevalue of the variables is what is ultimately stored at the end of game-play. Therelevant DSM-5 criteria can be read from Table 3.2. The third column givesthe units that the variable(s) associated to each parameters is in. Finally, thelast column gives a brief description of the parameter.
1. Determine measurableparameters from DSM-5
2. Investigate possiblegame mechanics
3. Determine a gametheme
4. Define a gametask
5. Choose a gamemechanic for the task
6. Define a story-lineand characters
7. Select a gamingplatform
8. Select a gamingdevice
9. Develop the game 10. Deploy the gameon the device
Figure 3.1: Game Development Sequence
Stellenbosch University https://scholar.sun.ac.za

CHAPTER 3. DESIGN SPECIFICATION 31
Table 3.1: Measurable Parameters
Parameter DSM 5 Criteria Units Description
Mistakes made A,B,C,Enumber ofoccurrences
The total number ofmistakes made during atask
Task completiontime
A,B,C,D,E sThe amount of timetaken to complete a task
Task termination D yes/noWhether or not the userquit a task before com-pleting it
Distractibility B,Enumber ofoccurrences
The number of distrac-tions that a�ected theuser's performance in atask
Forgetfulness F yes/noThe user's ability toremember an item/fea-ture
Sustained atten-tion
B s
The amount of time theuser can focus on a spe-ci�c feature
Device motion G, I m.s−2Data from the device'saccelerometer and gyro-scope
Table 3.2: Labels given to Relevant DSM 5 Criteria
A Little attention given to detailB Di�culty keeping sustained attentionC Failure to follow through on instructionsD Avoidance of tasks that require sustained mental attentionE Distracted easily by external stimuliF Forgetfulness with regards to daily activitiesG Constant �dgety behaviourH Inability to quietly engage in leisure activitiesI Constantly active and �on the go�
3.1.2 Development Platform and Device Selection
Various gaming platforms can be used to develop games. The selection wasnarrowed down to two choices: Unreal Engine and Unity. Based on the gamingdeveloper's preference, Unreal Engine 4.18 was chosen. Ultimately, both theseplatforms are very well suited for development and deployment on various de-vices on di�erent operating systems such as Android and iOS. As mentioned
Stellenbosch University https://scholar.sun.ac.za

CHAPTER 3. DESIGN SPECIFICATION 32
previously, since the gaming development was outsourced, given a clear designspeci�cation, the choice of development platform was left to the developer.One of the bene�ts of using a dedicated gaming platform such as Unreal En-gine is its online marketplace. The marketplace gives developers access to awide range of packages called assets. Assets are items that are used to build thegaming environment. Furthermore, the marketplace categorises assets basedon their theme. Therefore, the use of assets reduces the amount of develop-ment.
Similar to selecting a suitable development platform for the game, the se-lection of a gaming device was recommended by the gaming developer. As aresult, the device that was selected for the study was the NVIDIA K1 Shieldtablet (see Appendix x for technical speci�cations). The K1 Shield is a spe-cialised gaming tablet with optimal processing and graphical performance. Itwas chosen as the testing device to eliminate the risk of hardware limitations(e.g. low processing and low memory for example) that may have occurredwith other devices. This allowed for greater freedom in the actual softwaredesign itself. Additionally, the smaller size of the tablet (221 x 126 x 9.2 mm),compared to most standard tablets, meant that it could be held with twohands by minors, whose hands may be too small to �rmly hold a large tablet.
3.1.3 Game Theme
The theme that was chosen took into account the age group of the subjectsthat were used for the research. Since the subjects were schoolchildren a jun-gle/tropical theme was seen as a logical choice. Furthermore, this theme wasseen as being culture neutral, as all schoolchildren could relate to the theme.The character that the user interacted with was a panda bear that was createdin Unreal Engine. Details such as skeletal structure, joint movements, physicsand animations were implemented for the character in a process called rigging.The panda character can be seen in Figure 3.2.
Figure 3.2: Panda character
Stellenbosch University https://scholar.sun.ac.za

CHAPTER 3. DESIGN SPECIFICATION 33
The game environment consisted of a map and disposable items. The mapwas used to de�ne the path that the character followed during game-play. Thebuilding blocks of the map were pre-constructed tiles that could be drag-and-dropped in sequence. There were 9 di�erent types of tiles that could be used,as seen in Figure 3.3. The last tile, seen on the bottom right of Figure 3.3was the �Finish Tile� and represented the end point of the map. The dispos-able items consisted of obstacles that the character had to avoid, as well ascollectable items or �pick-ups� that contributed to the user's �nal score. Thetypes of obstacles that were present can be seen in Figure 3.4 while Figure 3.5shows a small portion of the map, consisting of tiles in succession as well asdisposable items.
Figure 3.3: Tiles for Creating a Map
3.1.4 Game Task Description
The objective of the task was to travel on a raft from one end of a river to theother end as quickly as possible. This had to be done while avoiding obstaclesand collecting as many gems as possible. The speed of the raft increased asthe game progressed, provided that no obstacles were hit. Three straight laneswere present and the user was able to move to the left or right lane, while the
Stellenbosch University https://scholar.sun.ac.za

CHAPTER 3. DESIGN SPECIFICATION 34
Figure 3.4: Disposable Items � Obstacles
Figure 3.5: Map Example
Stellenbosch University https://scholar.sun.ac.za

CHAPTER 3. DESIGN SPECIFICATION 35
middle lane was the default lane. The main game window can be seen in Figure3.6. The top left corner displays the number of gems collected and the topright corner has two buttons. The button marked with the letter �M� allowedthe user to go to a welcome page while the button marked with �X� allowed theuser to terminate the game. The red buttons at the bottom of the screen wereused to navigate along the lanes of the river and avoid incoming obstacles. Theobstacles could be avoided by switching lanes, jumping over them, or throwinga rock in their direction (the throw and jump buttons are labelled �THROWBTN� and �JUMP BTN� respectively). These moves are explained in moredetail subsequently. The user was able to control the character and make themoves discussed previously by means of the following four button commands:left button command, right button command, jump button command andthrow button command.
Figure 3.6: Main Game Window
An important feature of game-play was respawning. This occurred everytime the character collided with an obstacle. Figure 3.7 shows a scenario wherethe character was approaching an obstacle. The respawn location was alwayslocated near the obstacle where collision occurred. The principle was that thegame would resume only 5 seconds after respawning. A noti�cation messageas well as a 5 second timer appeared on the screen. Upon resuming, the char-acter's speed would start from rest and begin to increase gradually. Therefore,the more obstacles collided with, the longer the duration of the game. andFigure 3.8 shows the respawning action that occurs after collision with thatobstacle.
As explained previously, the gaming device that was chosen was a NVIDIAK1 Shield tablet. Its convenient dimensions made it easy for children to hold
Stellenbosch University https://scholar.sun.ac.za

CHAPTER 3. DESIGN SPECIFICATION 36
Figure 3.7: Scenario 1 � Character Approaching an Obstacle
Figure 3.8: Scenario 2 � Character Respawning after Collision
it comfortably with both hands. The tablet was to be held in a �landscape�orientation (i.e. with each hand being on each short side of the tablet). Thedevice had to be held in this con�guration in order to get the most representa-tive data. As seen in Figures 3.7 and 3.8, the button commands were locatedin such a way that when the device was held correctly, the buttons could bepressed with the thumbs of each hand.
Buttons were chosen to navigate between lanes as opposed to the gyro-scope sensor of the device. The choice of using buttons was made with the
Stellenbosch University https://scholar.sun.ac.za
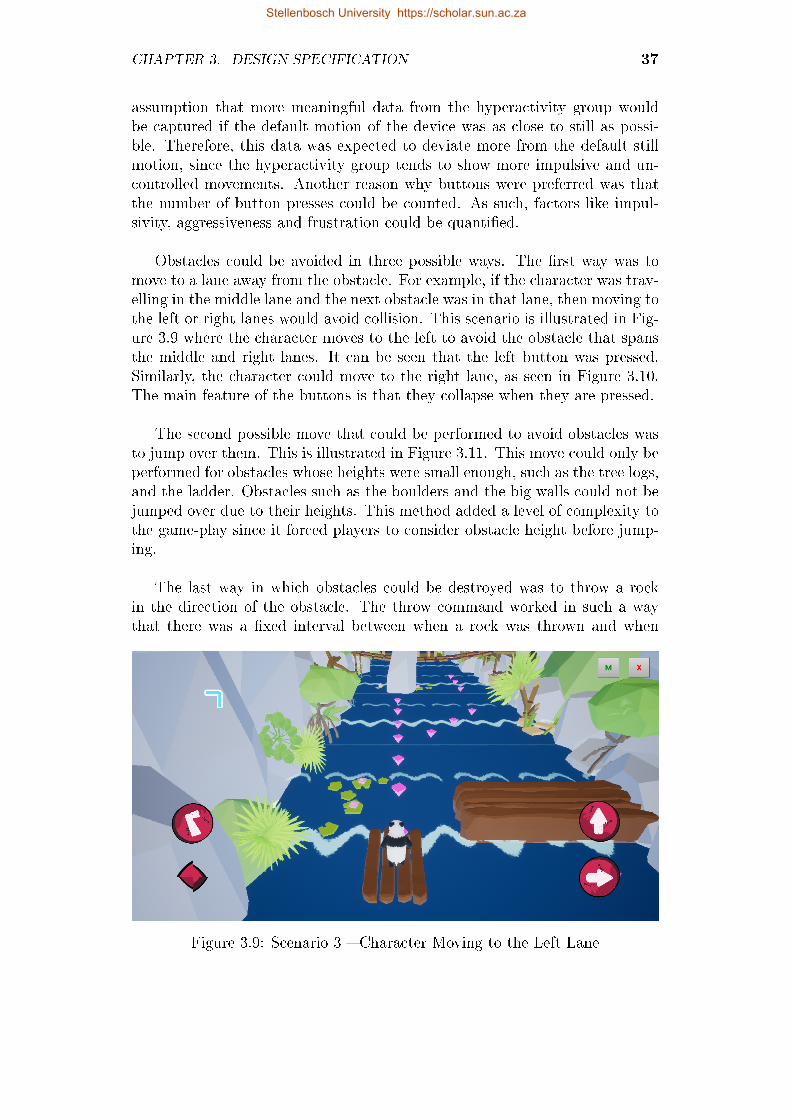
CHAPTER 3. DESIGN SPECIFICATION 37
assumption that more meaningful data from the hyperactivity group wouldbe captured if the default motion of the device was as close to still as possi-ble. Therefore, this data was expected to deviate more from the default stillmotion, since the hyperactivity group tends to show more impulsive and un-controlled movements. Another reason why buttons were preferred was thatthe number of button presses could be counted. As such, factors like impul-sivity, aggressiveness and frustration could be quanti�ed.
Obstacles could be avoided in three possible ways. The �rst way was tomove to a lane away from the obstacle. For example, if the character was trav-elling in the middle lane and the next obstacle was in that lane, then moving tothe left or right lanes would avoid collision. This scenario is illustrated in Fig-ure 3.9 where the character moves to the left to avoid the obstacle that spansthe middle and right lanes. It can be seen that the left button was pressed.Similarly, the character could move to the right lane, as seen in Figure 3.10.The main feature of the buttons is that they collapse when they are pressed.
The second possible move that could be performed to avoid obstacles wasto jump over them. This is illustrated in Figure 3.11. This move could only beperformed for obstacles whose heights were small enough, such as the tree logs,and the ladder. Obstacles such as the boulders and the big walls could not bejumped over due to their heights. This method added a level of complexity tothe game-play since it forced players to consider obstacle height before jump-ing.
The last way in which obstacles could be destroyed was to throw a rockin the direction of the obstacle. The throw command worked in such a waythat there was a �xed interval between when a rock was thrown and when
Figure 3.9: Scenario 3 � Character Moving to the Left Lane
Stellenbosch University https://scholar.sun.ac.za

CHAPTER 3. DESIGN SPECIFICATION 38
Figure 3.10: Scenario 4 � Character Moving to the Right Lane
the next rock was available to be thrown. For example, if the user threw arock, the next rock could only be thrown 5 seconds later. Obstacles could onlybe destroyed by throwing, provided the thrown rock made contact with thatobstacle. The throw command is shown in Figure 3.12. It can be seen thatwhen the button is pressed, a small rock is thrown away from the character.Further functionality of the buttons made it possible for the user to press twobuttons simultaneously in the following combinations: moving to the left laneand throwing/jumping or moving to the right lane and throwing/jumping.Finally, when the character completed the task, a message appeared as shown
Figure 3.11: Scenario 5 � Character Jumping over Obstacle
Stellenbosch University https://scholar.sun.ac.za

CHAPTER 3. DESIGN SPECIFICATION 39
Figure 3.12: Scenario 6 � Character Throwing a Rock at an ApproachingObstacle
in Figure 3.13.
3.2 Data Gathering, Storage and Extraction
Data gathering and storage formed part of the back-end of the software. Asdiscussed in the previous section, data was captured in real-time during game-play by means of game variables. These variables were then stored at the end ofa game session. The two tools for storing data were a FireBase database and a
Figure 3.13: Scenario 7 � Character Reaching the End of the Task
Stellenbosch University https://scholar.sun.ac.za

CHAPTER 3. DESIGN SPECIFICATION 40
Microsoft Excel 2016 Spreadsheet. The former was used to store game variablesfrom the back-end of the software while the latter was used for personal userdata, which was manually recorded into the spreadsheet for each game session.Data gathering and storage is illustrated in Figure 3.14.
3.2.1 Data Gathering
User speci�c personal data was recorded and stored manually in a spreadsheetfor each game session. For the study speci�cally, this data was not stored onthe FireBase database. However, for future development of the software tool,user data input will be part of the game itself. Personal user data was storedin the following variables:
1. Age
2. Gender
3. Race
4. Game enjoyment (yes or no)
5. Diagnosis (ADHD or normal)
6. Date and time stamp
Game variables were used to store game-play data in real time. The vari-ables were derived from the measurable parameters discussed in section 4.4.Two types of variables were de�ned: game-play variables and an accelerometervariables. Game-play variables were variables that were related for the typesof moves that the user made. For example, number of lane switches, numberof jumps and number of throws. The full list of game-play variables, is givenin Table 3.3. Each variable's units, typical expected range and description are
Figure 3.14: Data Gathering and Storage
Stellenbosch University https://scholar.sun.ac.za

CHAPTER 3. DESIGN SPECIFICATION 41
given. The values shown for the range are for one game session. For instance,during one game session, the total number of obstacles present in the mapis 30. Therefore, the range for the number of obstacles hit and obstacles de-stroyed is 0 to 30. Additionally, a unique session identi�er and a time stampwere generated for each session.
On the other hand, the accelerometer variables were used to store the rawdata from the accelerometer of the device. The accelerometer measured thedevice's acceleration in the x-plane, y-plane and z-plane. For the purpose ofthe software, the sampling rate for reading the accelerometer values was takenas 100Hz. Using the value for the maximum task completion time in Table ??,number of samples recorded in each plane ranged between 12000 and 30000.The accelerometer data was useful because it could help quantify the relativemotion of the device during game-play. This in turn would help to classifybetween non-ADHD and ADHD persons.
3.2.2 Data Storage
At the end of a game session, the game variables were sent to a FireBasedatabase using a WiFi connection. This data transfer was automatically trig-gered when the user reached the end of the task. This is explained graphically
Table 3.3: List of Game-Play Variables
Variable name Units Range Description
Left_cnt # occurrences 0 � 50number of �left� buttonpresses
Right_cnt # occurrences 0 � 50number of �right� but-ton presses
Throw_cnt # occurrences 0 � 50number of �throw� but-ton presses
Jump_cnt # occurrences 0 � 50number of �jump� but-ton presses
Obst_hit # occurrences 0 � 30number of obstacle col-lisions
Obst_des # occurrences 0 � 30number of obstacles de-stroyed
Gem_cnt # occurrences 0 � 120number of gems col-lected
Dur s 120 � 300 Task completion time
Qt binary 1 or 0Task termination beforereaching the end
Stellenbosch University https://scholar.sun.ac.za
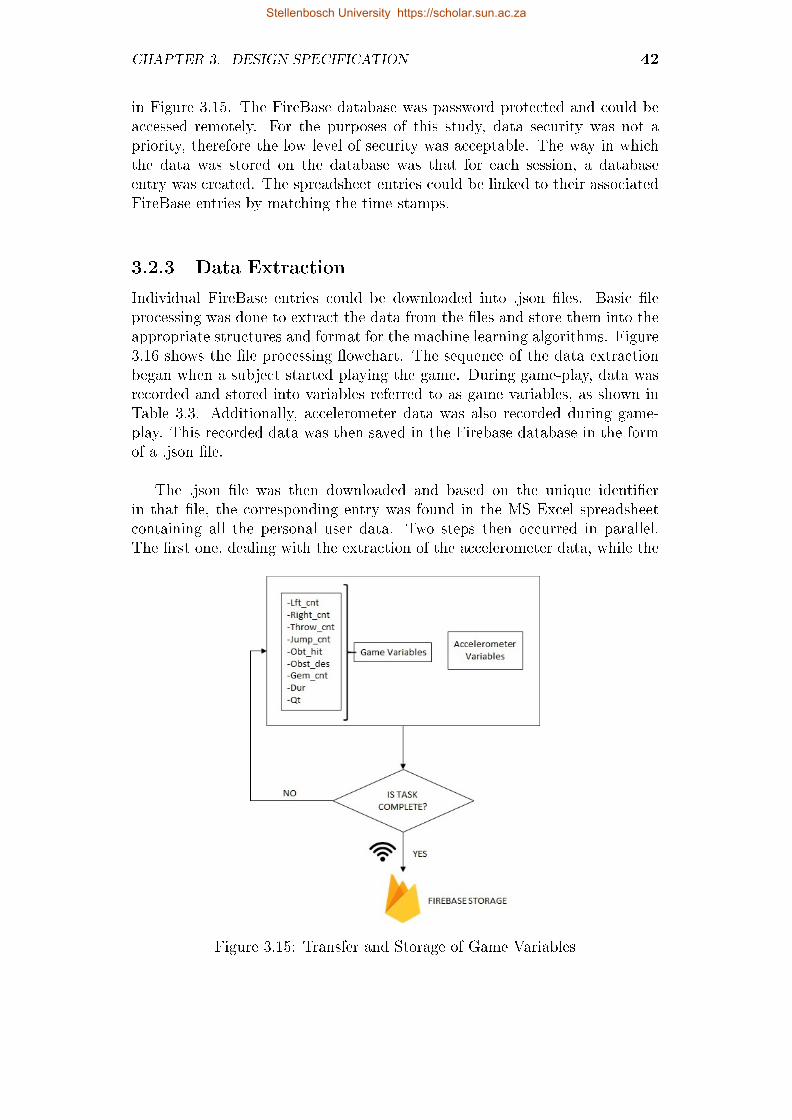
CHAPTER 3. DESIGN SPECIFICATION 42
in Figure 3.15. The FireBase database was password protected and could beaccessed remotely. For the purposes of this study, data security was not apriority, therefore the low level of security was acceptable. The way in whichthe data was stored on the database was that for each session, a databaseentry was created. The spreadsheet entries could be linked to their associatedFireBase entries by matching the time stamps.
3.2.3 Data Extraction
Individual FireBase entries could be downloaded into .json �les. Basic �leprocessing was done to extract the data from the �les and store them into theappropriate structures and format for the machine learning algorithms. Figure3.16 shows the �le processing �owchart. The sequence of the data extractionbegan when a subject started playing the game. During game-play, data wasrecorded and stored into variables referred to as game variables, as shown inTable 3.3. Additionally, accelerometer data was also recorded during game-play. This recorded data was then saved in the Firebase database in the formof a .json �le.
The .json �le was then downloaded and based on the unique identi�erin that �le, the corresponding entry was found in the MS Excel spreadsheetcontaining all the personal user data. Two steps then occurred in parallel.The �rst one, dealing with the extraction of the accelerometer data, while the
Figure 3.15: Transfer and Storage of Game Variables
Stellenbosch University https://scholar.sun.ac.za

CHAPTER 3. DESIGN SPECIFICATION 43
second one dealt with the game-play data. A .csv �le UserGamePlay.csv wascreated and contained each user's game-play variables, as well as personal datavariables. UserGamePlay.csv was one of the two matrices used as input data tothe machine learning algorithm. The dimension of the UserGamePlay matrixwas m × k, where m was the number of subjects used to train the machinelearning, and k the number of variables (nine game-play variables, and fourpersonal user data variables). The second matrix that was created was the A-matrix: an m × 3n matrix containing each user's accelerometer data. In thiscase n referred to the maximum number of accelerometer samples recordedduring a session (22000) and 3n corresponded to the 3 planes x, y and z.Matrix dimensions and derivations are explained in chapter 5.
START
Download .json file Find correspondingMS Excel entry
Extract personal userdata from MS Excel
Extract game-playdata from .json file
Store extracted data inUserGamePlay.csv file
YES
NO All entries covered?
Create X, Y and Z matricesfrom accelerometer .csv files
Create game-play matrixfrom UserGamePlay.csv
file
Use X, Y and Z to creatematrix for total acceleration END
Create .csv file forcurrent entry
Extract accelerometerdata from .json file
Store extracted datain .csv file
Figure 3.16: Data Extraction Flowchart
Stellenbosch University https://scholar.sun.ac.za

Chapter 4
Research Methodology
This chapter provides a detailed discussion of the chosen study design thatanswered the research question posed in chapter 1. The discussion beginswith a description of the research approach, a description of the subjects andthe selection method that was used. This will be followed by the ethicalconsiderations of the study. The research protocol will then be presented.This consists of a detailed sequence of activities and procedures that werefollowed during the study. Next, the measurements and calculations will bediscussed and this will be followed by a description of the data analysis (i.e.sample size estimations and statistical tests performed). Finally, a synthesisof the methodology will be given where possible limitations are evaluated.
4.1 Research Approach
Traditionally speaking, the diagnosis of ADHD relies on subjective and quali-tative assessments. The proposed method to answer the research question wasto use a quantitative approach to solve this qualitative problem. The departurepoint of the study was that certain parameters can be identi�ed from someof the diagnostic criteria for ADHD and used as metrics for quantifying thepresence, or lack thereof, of the disorder in a particular person. These param-eters were discussed in the chapter 3. One of the main aspects of the researchwas to gather data through a beta-testing phase and a clinical trial phase.This data was then used to develop a machine learning model. The standardoperating procedure for the beta-testing and clinical trial is discussed in sec-tion 4.4.2. The statistical analysis of the metrics was done through the use ofarti�cial intelligence, as discussed in Chapter 5. Classical statistical methodswere not complex enough to establish any cause-e�ect relationships or possibletrends (such as linear regression, polynomial regression or logistic regression)between the measured parameters and the presence of ADHD. Machine learn-ing methods were hence used to establish the desired statistically signi�cantrelationships between the parameters and the presence of ADHD. Althoughsuch relationships could be established, the machine learning tool was not a
44
Stellenbosch University https://scholar.sun.ac.za

CHAPTER 4. RESEARCH METHODOLOGY 45
standalone diagnostic tool. The reason for this was that a diagnosis for ADHDcould only positive if and only if, six of the nine DSM-V criteria for either ofthe subtypes (ADHD-hyperactivity or ADHD-inattentive) were present for aperiod of six months. This was not true for this particular tool for the follow-ing reasons: 1) not all the criteria were accounted for, only those that couldbe quanti�ed and 2) the tool could not directly account for the presence ofcriteria for a period of 6 months, as required for a positive diagnosis. Further-more, since most of the criteria for the ADHD-hyperactivity were subjectiveand could not be translated into measurable parameters, parameters from theADHD-inattentive criteria were used to model the ADHD-hyperactivity sub-type. With the use of arti�cial intelligence models, this choice of parameterwas acceptable since the models would be trained using those parameters, re-gardless of which subtype of ADHD they were speci�c to. In conclusion, thetool that was developed was a screening tool. Although it could not provide aclinical diagnosis, it could screen a person using a quantitative approach anddetermine whether they fell in the ADHD-hyperactivity group or in the normalgroup.
4.2 Subjects
The subjects consisted of children between the ages of 4 and 17 years old,both male and female (19 male and 11 female). Since the subjects were minor,inclusion was largely based on whether or not parental consent was given toparticipate in the study. Section 4.2.2 gives a more detailed breakdown of theinclusion and exclusion criteria.
4.2.1 Required Sample Size
According to the sample size estimation in section 4.5, the sample size thatyielded the optimal screening accuracy of 90% was 412 samples. However, itwas not chosen due to logistical considerations. Using an acceptable screeningerror of 16% (δ = 0.16) yielded a sample size of 156 samples. Therefore, givena sample size of 156 samples, one could di�erentiate statistically between aperson with ADHD and one without, while having 16% of the results beingincorrect, according to the method explained in section 4.5.
4.2.2 Subject Selection: Inclusion and Exclusion
Criteria
The main inclusion criteria was age. Since ADHD is most prevalent in minors,the age range was 4 to 17 years old. For children younger than 4 years old andfor adults, ADHD becomes less detectable although it may be present (thisis especially true for adults). Additionally, only schoolchildren were selected.To avoid bias in the data, gender ratio was kept as closely as possible to 1:1.
Stellenbosch University https://scholar.sun.ac.za

CHAPTER 4. RESEARCH METHODOLOGY 46
In this manner, one could possibly validate the �ndings in the literature thatstate that ADHD is more prevalent in boys than in girls.
Demographics were not taken into account when selecting subjects. Rather,the subjects that were chosen came from the private practice of Mrs Rose-Hannah Brown. Nonetheless, when analysing the data, the race of each subjectwas recorded as an additional feature to use for the statistical model. Featureselection is explained in section 5.
The main exclusion criteria was the presence of photo-sensitive epilepsy in thesubjects' medical records. Subjects that su�ered from this disorder or had ahistory thereof were excluded from the study. This precaution was taken be-cause the testing was based on playing a tablet game and this could negativelya�ect epileptic subjects. Finally, subject participation was voluntary and allsubjects could pull out of testing at any point.
4.2.3 Subject Categories
The subjects were classi�ed in the following three categories:
1. ADHD: subjects that have been diagnosed with ADHD in the past sixmonths, without taking into account whether the subjects were undermedication or not;
2. Normal (control group): subjects that do not have ADHD or presentADHD-like behaviour.
4.2.4 Ethical Approval
The ethical approval process was administered by the Health Research EthicsCommittee (HREC) of Stellenbosch University. According to the HREC, theresearch was identi�ed as a clinical trial because its purposes were to teste�ectiveness and e�cacy of a diagnosis-aiding tool. The risk of the researchwas minimal since the testing only consisted of playing a game on a tablet.Ethical approval was obtained on the 14th July 2017 and is valid until the 13th
July 2018. It was subsequently extended to July 2019.
4.2.5 Written Consent: Parents
For research involving minors, the HREC requires parental information lea�etsthat describe the study, as well as parental consent forms. Without these docu-ments, subject participation will not be allowed. The information lea�et givesa clear description of the research to the parents. This includes an overview ofwhat the research entails, a description of the types of tests that will be per-formed, the responsibilities of the parents, the duration of the tests, the risksinvolved with the tests and the mitigation thereof, the cost and remuneration
Stellenbosch University https://scholar.sun.ac.za

CHAPTER 4. RESEARCH METHODOLOGY 47
involved (if any), the location of the research site, and how the results will beprocessed. The contact details of the researchers, participating investigatorsand HREC are also included in the document.
The consent forms include a declaration for the consenting parent stating thatthey have read and understood all the information provided by the lea�et. Adeclaration for the investigator is also included. This declaration states thatthe investigator has provided all the necessary information pertaining to theresearch.
4.2.6 Written Assent: Children
For research involving minors, the HREC requires assent from the participants.The form consists of an information lea�et and a declaration. The informationlea�et describes to the child what the meaning of research is, what the researchis about, why he/she has been invited, the investigators, the research location,the duration of the tests, the details of the tests, the bene�ts and disadvan-tages of participating in the research, and contact details of the researchersand participating investigators.
The assent form for the child states that he/she understand what the researchis about, that the researcher has answered all of his/her questions, and thathe/she can withdraw from the research at any time. Since the age group forminors is large, there are two assent forms provided: one for children between 4and 11 years old and one for children between 12 and 17 years old. Both formshave the same details and they are presented in an age-appropriate manner.
4.3 Study Design
The study consisted of two main phases: 1) design and development, 2) testingand data collection. The sequence of research activities is illustrated in Figure4.1 where the testing activities are shown in the lightest blue, the design anddevelopment activities are shown in light blue, and the data collection phasesare shown in dark blue.
Beta-testing was done in order to collect data and develop a preliminarymachine learning model. Cross-validation was done to determine the over-all generalization capability of the model. To further validate the results, arandomly selected test set (a subset of the training set) was used to makepredictions with the machine learning model. These predictions were thencompared to the actual diagnoses given. According to the statistical analysisdescribed in section 4.5, the expected accuracy was 84%, given a sample sizeof 156. However, the preliminary beta-test model achieved an 85.6% accuracy,
Stellenbosch University https://scholar.sun.ac.za

CHAPTER 4. RESEARCH METHODOLOGY 48
with a sample size of 30.
4.4 Measurement Methods
Every measurement that was taken during the test phase of the study was cap-tured in the back-end of the software game. The advantage of using a softwaregame as a measurement tool was that the sensors and the data acquisitionsystem were all incorporated in the tablet that the game was loaded onto andthus creating a compact, single-device product.
4.4.1 Rationale
The rationale for the measurements was that the DSM-5 diagnostic criteriawere translated into measurable parameters and incorporated into the tabletgame. This approach ensured that the measurements made by the game wererelevant to ADHD on a diagnostic point of view. In summary, the parameterswere treated as a quantitative representation of the DSM 5 criteria.
1. De�neproblem
2. Reviewliterature to �ndexisting solutions
3. Design anddevelop the game
4. Get ethi-cal approval
5. Performbeta tests
COLLECTDATA
6. Developpredictive model 7. Clinical trials
COLLECTDATA
8. Implementpredictive model
9. Optimisethe model
10. Performblind tests
COLLECTDATA
11. Use model tomake predictions
12. Comparewith actualdiagnoses
13. Opti-mise model
Figure 4.1: Sequence of Research Activities
Stellenbosch University https://scholar.sun.ac.za

CHAPTER 4. RESEARCH METHODOLOGY 49
4.4.2 Standard Operating Procedure
Testing took place at Cape Gate Mediclinic. The role of the investigators dur-ing the testing phase included the administration of the game and assistingwith any medical needs that could have occurred during game-play.
In the measurement procedure, the test subject was placed in a well-litroom and was seated at a table. The tablet was presented to him/her andplaced on the table in front of them. The main investigator explained to thesubject what he/she had to do. The game was then launched on the tablet bythe investigator and the subject was allowed to play for the maximum durationof the test (8 minutes), unless he/she decided to quit.
For each subject, the investigator recorded their name, age, diagnosis(for control group), race and additional comments/observations into an Ex-cel spreadsheet on the Windows PC. During game-play, the parameters werecaptured and sent to a FireBase database via a WiFi connection. The datafrom the database was downloaded by the investigator and loaded into thatsame Excel spreadsheet for that speci�c subject. For feedback purposes, thesubject was asked what he/she thought of the game, upon completion thereof.Finally, the subject was told to leave the room and the next subject was calledin.
One of the key elements of the SOP was that the investigator had to giveclear instruction to the subject before launching the game. This was to preventmisuse of the game, although the game mechanic was self-explanatory. Theinvestigator also had to demonstrate to the subject how to hold the deviceto ensure that he/she feels comfortable when playing the game since for sometasks, the device had to be held in order to capture meaningful data from theaccelerometer and gyroscope sensors.
4.4.3 List of Parameters
The parameters that were monitored are shown in Table 3.1. The applicableDSM-5 criteria, units and description of each parameter are also given. It mustbe noted that the listed parameters do not represent all of the measurementsbut rather the main types of measurements.
4.5 Analysis
Meaningful results could only be attained through well-planned statisticalanalysis. The �rst step of the analysis was to consult with one of the Univer-sity's statisticians, Prof. D.G Nel. His recommendation was used to determinean estimate for the sample size as discussed in a subsequent section.
Stellenbosch University https://scholar.sun.ac.za

CHAPTER 4. RESEARCH METHODOLOGY 50
4.5.1 What was Analysed between Subgroups?
Data analysis was done using machine learning methods, as discussed in chap-ter 5. The advantage of machine learning is its ability to train itself givenenough samples and pick up on trends that the traditional statistical methodscould overlook. Nonetheless, when comparing the di�erent subgroups, the pa-rameters that were expected to be signi�cantly di�erent were analysed. Thisincluded task completion time, number of mistakes and device motion.
Through simple statistical analysis such as linear regression, it was seen thatthere were meaningful di�erences in these parameters for the di�erent groups.Preliminary analysis between subgroups was necessary in giving an indicationof whether or not more complex analyses such as machine learning would work.However, the failure of preliminary analysis to reveal any meaningful trendsdid not imply that machine learning would fail too.
4.5.2 Sample Size Estimation
The method used to determine sample size was the POWER analysis. Thismethod was applied to the McNemar test. In the McNemar test a 2 x 2contingency table as seen in Table 4.1 is used to compare two di�erent testmethods that have the same outcome. The parameters a, b, c and d are thenumber of samples for each category and N represents the total number ofsamples.
Table 4.1: McNemar Test: 2 x 2 Contingency Table
Method 1Positive
Method 1Negative
Row Total
Method 2 Positive a b a+ bMethod 2 Negative c d c+ d
Column Total a+ c b+ c N
In this research, Method 1 is analogous to the current diagnostic methods (asexplained in section 2.2). Method 2 is analogous to the new method producedby the research. For both methods, positive refers to the presence of ADHDin a sample while negative refers to the absence thereof.
For the McNemar test, the null hypothesis of marginal homogeneity statesthat the two marginal probabilities for each method are the same [45]. Thiscan be written mathematically as
H0 : δ = 0 (4.1)
H1 : δ 6= 0 (4.2)
Stellenbosch University https://scholar.sun.ac.za

CHAPTER 4. RESEARCH METHODOLOGY 51
δ represents the di�erence in the population proportion when a positive out-come occurred in Method 1, and the population proportion when that sameoutcome occurred in Method 2. In other words, the di�erence in populationproportion when Method 1 was positive and the population proportion whenMethod 2 was positive (the same can be calculated for when both methodswere negative). Mathematically δ can be expressed as
δ =a+ c
N− a+ b
N
δ =c− bN
(4.3)
To determine an estimate for the sample size, a POWER analysis was doneusing Statistica. The expertise of quali�ed statistician, Prof. D.G. Nel wassolicited. The input parameters that were required by Statistica were thefollowing:
(i) δ: the di�erence in population proportion when Method 1 was positiveand the population proportion when Method 2 was positive as describedin McNemar's method;
(ii) η: the total proportion of times di�erent events occur for the two methods(also referred to as the nuisance parameter). This was chosen as 0.4 basedon the statistician's recommendation;
(iii) α: the type 1 error-rate. This value is taken as 0.05 and means that oneis willing to accept that there is a 5% chance that the null hypothesis iswrong. 0.05 is the standard accepted value for α (try to �nd reference);
(iv) Power goal: in Statistica, the power goal refers to the minimum powerto be achieved when searching for an acceptable sample size. This valuewas chosen as 0.9 based on the statistician's recommendation.
The POWER analysis was applied to various cases where the value of δ waschanged as shown in Table 4.2. To stay as close as possible to the null hy-pothesis in equation (4.1), δ was kept less than 20%. Figures 4.2 to 4.7 givegraphical representations of the POWER calculations for the cases in Table4.2.
The signi�cance of the value of δ is the error in distinguishing between thetwo methods. In this case, Method 1 is analogous to the current diagnosticmethods (gold standard) and Method 2 is analogous to the new developedmethod. For each POWER analysis case, a power graph was obtained. Thegeneral trend of the power graph was that it resembled an exponential func-tion, where the required sample size (N) increased rapidly with small increasesin the power goal. Given the parameters in Table 4.2, the power graphs showthat changing δ values resulted in di�erent ranges for possible N values. For
Stellenbosch University https://scholar.sun.ac.za

CHAPTER 4. RESEARCH METHODOLOGY 52
Table 4.2: POWER Analysis
δ η α Power goalActual Powerfor Required
N
RequiredSample Size
0.1 0.4 0.05 0.9 0.9004 412
0.15 0.4 0.05 0.9 0.9003 178
0.16 0.4 0.05 0.9 0.9016 156
0.17 0.4 0.05 0.9 0.9013 137
0.18 0.4 0.05 0.9 0.9009 121
0.2 0.4 0.05 0.9 0.9002 96
small values of δ (δ = 0.1) the required sample size given a power goal of 0.9was large. For the larger values of δ (δ = 0.2), N was smaller than 100.
The required sample size that was chosen was 156 subjects. This occurredwith δ = 0.16. In other words, the error in distinguishing between the goldstandard method and the new method was 16% (84% accuracy). However, the�nal recommendation on the sample size was 200 subjects. The additional 44subjects were used as test subjects for the machine learning algorithms whilethe other 156 subjects were used to train the machine learning algorithms.
4.5.3 Structure of Study Database
Once an estimate for sample size and the list of measurements were determined,a database structure was implemented. The key aspect of the database wasthat it was created using FireBase, a cloud-based system and could thereforebe downloaded (in .txt or .csv formats) solely by the investigators, to increasedata security. For each subject that was tested, a new FireBase entry wascreated and the time and date of the entry was. When creating the statisticalmodel, all of the FireBase entries were downloaded into a single matrix whereeach row represented one subject and each column represented a feature.
Stellenbosch University https://scholar.sun.ac.za

CHAPTER 4. RESEARCH METHODOLOGY 53
Figure 4.2: McNemar Test: Sample Size Determination with δ = 0.1
Figure 4.3: McNemar Test: Sample Size Determination with δ = 0.15
Stellenbosch University https://scholar.sun.ac.za

CHAPTER 4. RESEARCH METHODOLOGY 54
Figure 4.4: McNemar Test: Sample Size Determination with δ = 0.16
Figure 4.5: McNemar Test: Sample Size Determination with δ = 0.17
Stellenbosch University https://scholar.sun.ac.za

CHAPTER 4. RESEARCH METHODOLOGY 55
Figure 4.6: McNemar Test: Sample Size Determination with δ = 0.18
Figure 4.7: McNemar Test: Sample Size Determination with δ = 0.2
Stellenbosch University https://scholar.sun.ac.za

Chapter 5
Machine Learning
Machine learning has gained traction in data processing applications. Thesigni�cance of the use of machine learning is that it can identify trends andcorrelations that could not be picked up by traditional statistical methods.The ability of machine learning algorithms to train themselves given a trainingdataset is also an advantage because models can be accurately developed usingspeci�c datasets. There are various kinds of machine learning algorithms, eachsuited for speci�c applications. For this study, the approach that was taken fordeveloping the machine learning model was to implement a support vector ma-chine classi�er (SVM) with a linear kernel. Two datasets were used to extractone feature set that contained gameplay feature, as well as statistical featuresfrom the accelerometer sensor. All the machine learning implementation wasdone in MATLAB. This chapter begins with a brief description of the datasetsthat were used. Next, feature extraction is explained and this is followed byfeature selection. Two feature selection methods are analysed. Finally, thechapter ends with a description of the classi�er using the best feature set.
5.1 Datasets
Two datasets were obtained during the beta-tests. The �rst one was the game-play dataset, which consisted of game-play variables as described in 3.3. Thesecond dataset was the accelerometer raw data from the x, y and z axes.Features were extracted from both of these datasets to form a single featurematrix that was used to develop the classi�er.
5.1.1 Distribution of Data
A total of 30 subjects took part in the beta-test. Subject age ranged between6 and 17 years of age. Table 5.1 gives a breakdown of the subject distribu-tion. Due to ethical considerations, all subjects were kept anonymous and onlyassigned a unique identifying number.
56
Stellenbosch University https://scholar.sun.ac.za

CHAPTER 5. MACHINE LEARNING 57
Table 5.1: Breakdown of Subject Distribution
Category Value
Mean subject age 10 years oldMaximum subject age 16 years oldMinimum subject age 5 years oldMale subjects 15Female subjects 15ADHD male subjects 6ADHD female subjects 7Non-ADHD male subjects 10Non-ADHD female subjects 7
Total subjects 30
5.1.2 Train-test Set Split
In order to train the classi�er, the aggregate feature matrix was split into atraining set, and test set. The split between the two sets was that approxi-mately 75% of the dataset was used for training, while the other 25% was usedfor testing. Since the dataset was small, leave one out cross-validation wasused (LOOCV). This type of cross-validation is explained in section 5.4. Thetest set was kept separate and used as new and �unseen� data into the trainedclassi�er. Table 5.2 shows how the data was split into the three di�erent sets.The split was done by choosing random observations and allocating them toeach of the sets according to the split ratio.
Table 5.2: Training and Test Set
Set % full set number of samples
Training 75 23Test 25 7
5.2 Feature Extraction
Feature extraction is an important step in building a classi�er, as it allowsfor raw data to be interpreted into meaningful information that can help theclassi�er distinguish one observation from another.
5.2.1 Outlier Detection and Treatment
Prior to calculating features to extract, outlier detection was performed. Themethod used took the interquartile range (IQR) into account where
Stellenbosch University https://scholar.sun.ac.za

CHAPTER 5. MACHINE LEARNING 58
IQR = Q3 −Q1 (5.1)
Q3 and Q1 represent the middle values of the �rst and third half of thedataset respectively. A data-point xi was seen as an outlier if it satis�ed oneof the following two conditions:
xi > Q3 + 1.5IRQ
xi < Q1 − 1.5IRQ
If either of the conditions were met, then xi was replaced by the equationproposed by [46]:
xi =xi−1 − xx+i
2(5.2)
This equation was also applied for the accelerometer dataset in order toclean it out. A visual representation of outlier detection is to use box-and-whisker plots. This is shown in Figure 5.1 for the game-play feature matrixFg. It is seen that only the throws feature had an outlier, which was replacedusing equation 5.2.
5.2.2 Game-play Dataset
For the game-play dataset, a feature matrix labelled Fg was used to store theextracted features. The matrix Fg was in the form
Fg =[f1 f2 f3 f4 . . . fk
]
Figure 5.1: Box-and-whisker Plot of Fg
Stellenbosch University https://scholar.sun.ac.za

CHAPTER 5. MACHINE LEARNING 59
where k was the number of features. In addition to the features listed in3.3, four more features were created: throw e�ciency, total button presses, di-rectional button presses and frequency of button presses. The throw e�ciency(TE) feature was calculated as follows:
TE =obstacles destroyed
total button presses(5.3)
The frequency of button presses (FBP) feature was calculated as follows:
FBP =total button presses
game duration(5.4)
Additionally to these features, user features were also added to Fg. The fulllist of features in Fg was as follows: number of left button presses, number ofright button presses, number of jumps, number of throws, number of obstaclesdestroyed, number of obstacles hit, number of gems collected, game duration,game enjoyment (boolean: 1 = enjoyed, 2 = did not enjoy), throw e�ciency,total button presses, directional button presses, frequency of button presses,age, race and gender. This resulted in k = 16.
Feature normalization was performed on Fg in order to ensure e�cientclassi�er training. The intuition with feature normalization is that each featureis mathematically transformed to have zero mean. Therefore, for each featurefi in Fg (where i = 1, 2, ..., k), the following applies
fi =fi − µi
si(5.5)
where µi is the average of all the observations for that feature and si is therange of the observations of that feature.
5.2.3 Accelerometer Dataset
The accelerometer dataset contained raw time-series data from the x, y and zaxes. Two types of features were extracted from these time-series: 1. statisticalfeatures and 2. morphological features. These types of features have beendemonstrated to provide good classi�er performance [46]. Furthermore, themodulus of the acceleration was also used as an additional time series to extractfeatures from. The modulus was calculated as
atotal =√a2x + a2y + a2z (5.6)
For the accelerometer dataset, a feature matrix labelled Fa was used tostore the extracted features. The matrix Fa was in the form
Fa =[f1 f2 f3 f4 . . . fn
]where n was the number of features.
Stellenbosch University https://scholar.sun.ac.za

CHAPTER 5. MACHINE LEARNING 60
Statistical Features
Statistical features were calculated on the dataset using some of MATLAB'sbuilt-in functions. Out of all the features, only the crest factor did not makeuse of MATLAB's library functions. The crest factor was calculated as follows:
CF =fmin − fmax
frms
× 0.5 (5.7)
where the numerator is the range and the denominator is the root meansquare (RMS). The following 18 statistical features were extracted: mean, stan-dard deviation, minimum, maximum, range, median, sum, variance, skewness,kurtosis, RMS, percentiles (10th, 25th, 50th, 75th and 90th), interquartilerange (IRQ) and crest factor. This resulted in a total of 72 features (18× 4),where each of these features was calculated for the x, y, z axes and for themodulus.
Morphological Features
Morphological features were those features that could be extracted by thevisual characteristics of the raw signals. The exact euclidean distance wasused to determine the distance between each of the three axes. It was thereforecalculated for the x-y, x-z and y-z pairs using the following equation:
ED =
√√√√ m∑i=1
(qi − ci)2 (5.8)
where the two time series Q = q1 . . . qm and C = c1 . . . cm are evaluated.The next feature that was calculated was autocorrelation coe�cient r1. Theautocorrelation coe�cient indicates how successive values of a given signalrelate to each other. The following equation was used for r1
r1 =
m∑t=2
(Yt − Y )(Yt−1 − Y )
m∑t=1
(Yt − Y )2(5.9)
where Y is the mean of signal Y . Zero-crossing detection was used to countthe number of x-intercepts of a signal. This was done using a built-in MATLABfunction �dsp.ZeroCrossingDetector�. Area features were also calculated for thesignals. This included positive area, negative area, total area, absolute totalarea and total absolute area. The distinction between the absolute total areaand the total absolute area was that the former was calculated as follows:
ATA = |Total Area| (5.10)
Stellenbosch University https://scholar.sun.ac.za

CHAPTER 5. MACHINE LEARNING 61
while the total absolute area was calculated as:
TAA = Areapositive + |Areanegative| (5.11)
Additionally, a feature was calculated for latency time. Latency time wasthe time at which the maximum value of a signal occurred. To summarize, thefollowing 10 morphological features were extracted: exact euclidean distance,autocorrelation coe�cient, positive area, negative area, total area, absolutetotal area, total absolute area, number of zero crossings, latency time, peak-to-peak time-window. This resulted in a total of 39 features (10×4−1), whereeach of these features was calculated for the x, y, z axes and for the modulus,except for the exact euclidean distance which was only calculated for the threepossible axis pairings.
Normalization
The �nal step in forming the feature matrix Fa was to normalize its elementsso as to achieve high e�ciency when creating the classi�er. Equation 5.5 wasalso used here for normalization.
5.3 Feature Selection
The feature matrices Fg and Fa were appended to form one feature matrix Ffor the classi�er. Prior to this step, a preliminary feature selection test wasdone, as described in the subsequent section. Three primary feature selectionmethods were used. The feature subset that yielded the best classi�cationresults was used. The three methods were: 1. brute/manual feature selection,2. principal component analysis and 3. genetic algorithm. These methods aredescribed after the preliminary feature selection section.
5.3.1 Preliminary Feature Selection
The test consisted of generating a correlation matrix using MATLAB's �corr�function for Fg and determining whether or not there were any strong linearcorrelations between any pairs of features (indicated by coe�cient value be-tween 0.95 and 1). If this was true, then one of the features from the pairswas removed, depending on the qualitative information that that feature gave.Figure 5.2 shows the correlation matrix of Fg.
As expected, the correlation coe�cients along the diagonal are 1, since itrepresents correlation of a feature with itself. It can be seen that there are twostrong correlation pairs. The �rst one between the number of obstacles de-stroyed and the number of throws. This is strong correlation is expected sincethe number of obstacles destroyed directly relates to the number of throws.
Stellenbosch University https://scholar.sun.ac.za
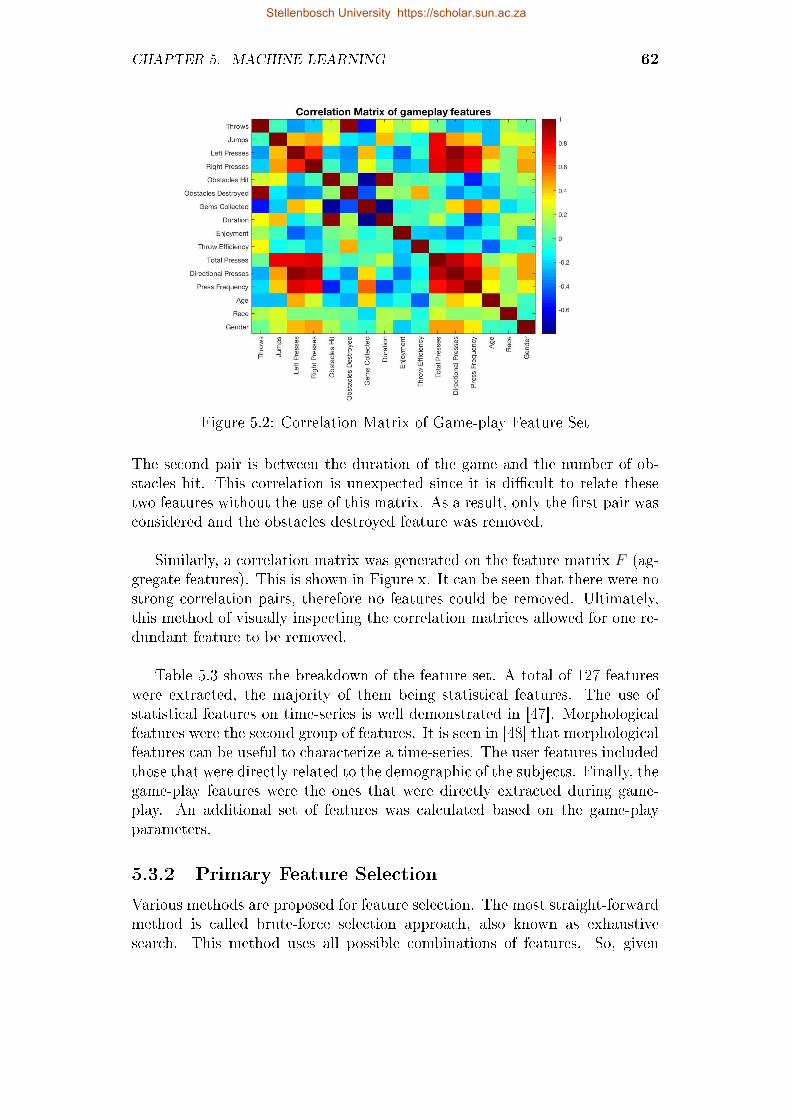
CHAPTER 5. MACHINE LEARNING 62
Figure 5.2: Correlation Matrix of Game-play Feature Set
The second pair is between the duration of the game and the number of ob-stacles hit. This correlation is unexpected since it is di�cult to relate thesetwo features without the use of this matrix. As a result, only the �rst pair wasconsidered and the obstacles destroyed feature was removed.
Similarly, a correlation matrix was generated on the feature matrix F (ag-gregate features). This is shown in Figure x. It can be seen that there were nostrong correlation pairs, therefore no features could be removed. Ultimately,this method of visually inspecting the correlation matrices allowed for one re-dundant feature to be removed.
Table 5.3 shows the breakdown of the feature set. A total of 127 featureswere extracted, the majority of them being statistical features. The use ofstatistical features on time-series is well demonstrated in [47]. Morphologicalfeatures were the second group of features. It is seen in [48] that morphologicalfeatures can be useful to characterize a time-series. The user features includedthose that were directly related to the demographic of the subjects. Finally, thegame-play features were the ones that were directly extracted during game-play. An additional set of features was calculated based on the game-playparameters.
5.3.2 Primary Feature Selection
Various methods are proposed for feature selection. The most straight-forwardmethod is called brute-force selection approach, also known as exhaustivesearch. This method uses all possible combinations of features. So, given
Stellenbosch University https://scholar.sun.ac.za

CHAPTER 5. MACHINE LEARNING 63
Figure 5.3: Correlation Matrix of Aggregate Feature Set
Table 5.3: Breakdown of Feature Set
Feature type Number of features
Statistical 72Morphological 39Game-play features 8Game-play-derived features 4User features 3
Total features 126
k features, 2k− 1 combinations are possible. This resulted in 2126− 1 = 8.5e37
combinations for the features extracted in the study. Practically speaking,using brute force is not feasible in �nite time.
Other methods and algorithms were thus used. In the study, �ve featuresubsets were selected using sequential forward selection (SFS) and manualselection. The six resulting subsets are shown in Table 5.4. It can be seen thatapplying feature selection helped reduce the dimensionality of the originalfeature set and thus improve e�ciency of the classi�er performance. Themethod that reduced the dimensionality the most was the SFS method usedon the full feature set. The SFS method was applied on the whole featureset to produce the subset FSFS, while Fcombined was a result of applying SFSto the game-play dataset Fg and adding this to FSFS. The manual methodsinvolved applying SFS to the game-play feature set Fg and combining it withmanually selected features from the accelerometer feature set Fa. The best
Stellenbosch University https://scholar.sun.ac.za

CHAPTER 5. MACHINE LEARNING 64
Table 5.4: Feature Subsets
Feature subset Selection method Number of features
Fall All features used 126FSFS SFS 10Fcombined SFS 21Fman1 SFS and manual 83Fman2 SFS and manual 55
feature subset was chosen based on its minimum LOOCV accuracy.
Leave-One-Out Cross-Validation
The LOOCV method can be used for small datasets, as it gives a more robustgeneralization error, as opposed to using a full validation set. LOOCV worksas follows:
1. Given a training set with n observations, split the training set into atraining subset and a test subset;
2. Set the test subset to be one single observation from the training set;
3. Set the training subset to be all the other observations from the trainingset, that is, training subset should have n− 1 observations;
4. Use the training subset to train the classi�er;
5. Use the classi�er to predict the output of the test subset;
6. Use a mean squared error (MSE) function (or some other error function)to determine the error between the prediction and the actual target valueof the test subset observation. MSE is given by
MSE = (yout − ypred)2 (5.12)
where yout is the target value of the observation that was left out andypred is the predicted output;
7. Repeat step 2 while choosing a di�erent observation;
8. Repeat steps 3 - 6;
9. Repeat steps 7 - 8 until each observation has been singled out, that is ntimes;
10. Take the sum of each iteration's MSE and divide it by n to get theLOOCV error
CVn =1
n
n∑t=1
MSEi (5.13)
Stellenbosch University https://scholar.sun.ac.za

CHAPTER 5. MACHINE LEARNING 65
Case 1: All Features Selected
The initial approach was to use all the features. Since the number of featureswas relatively small, this was seen as a feasible option. The disadvantage tothis approach was that there was no feature ranking or feature importance, asall the features were present.
Case 2: Sequential Forward Selection
With the SFS method, features are sequentially added to the feature set, usingsome criterion. SFS is one of the simplest sequential selection algorithms. Itis as follows:
1. Start with an empty feature set F0 = 0;
2. Select the next best feature f such that the objective function J(Fk + f)is maximized when combined with the features that have already beenselected;
3. Update Yk+1;
4. Repeat 2 and 3.
SFS was implemented in MATLAB using the �sequentialfs� function whichtakes on as inputs the following parameters: a function handle to the objectivefunction, a dataset with observations or samples and the direction of selection(forward in this case). The objective function that was used was a linearregression model. The output of the function is a logical row vector of lengthk, where k is the number of variables in the input dataset. The logical rowvector contains 1's at the indexes of the selected variables. The full feature setwas used with this implementation. This resulted in the 10 following features:number of obstacles hit, crest factor of modulus, total absolute area x-axis,positive area x-axis, positive area z-axis, latency time z-axis, peak-to-peaktime window of modulus, 25th percentile z-axis and skewness z-axis.
Case 3: Sequential Forward Selection on Combined Sets
SFS was applied to the game-play feature set to form a new subset of features.This new subset was then combined to the subset described in the previouscase. The SFS method was able to select the following 11 game-play features:number of left presses, number of right presses, obstacles hit, gems collected,game duration, game enjoyment, throw e�ciency, button press frequency, age,race and gender. The new feature subset therefore included 21 features.
Case 4: SFS and Manual Selection
The fourth approach was to once again use the selected game-play featuresfrom the SFS method and combine those with: 1. accelerometer morphological
Stellenbosch University https://scholar.sun.ac.za

CHAPTER 5. MACHINE LEARNING 66
features 2. accelerometer statistical features. Thus resulting in two additionalsubset of features containing 83 and 25 features respectively.
5.4 SVM Model Selection
The approach that was taken in building the SVM classi�er was based on therecommendation given in [49]. The method was as follows:
1. Transform data into the format for the SVM package;
2. Perform simple scaling and normalization on the data;
3. Consider the linear kernel ([38] agrees with this)
4. Tune the parameter C by using cross-validation (in the case of this study,LOOCV was used instead);
5. Use the tuned parameter C to train the whole training set
6. Test
In the study, the classi�er performed binary classi�cation where the targetoutputs were given by either 1 (presence of ADHD) or 0 (non-ADHD). Asexplained, the model was developed in MATLAB, using the built-in ��tcsvm�function. The inputs of the function were the following:
1. A scaled and normalized dataset X;
2. Target values y, where y ∈ [01];
3. Regularization parameter C. This parameter adds a penalty to features,thus reducing their overall e�ect. It is tuned to limit over-�tting;
4. The kernel type (linear);
The output of the function was a model in the SVM package format. Asexplained in section 5.2, LOOCV was used for validation. Furthermore, �veclassi�ers were developed for the LOOCV algorithm, each one corresponding toa feature set as derived in 5.4. The procedure that was used was the following:
1. Choose an initial value for C: C = 10;
2. Perform LOOCV on each of the �ve feature sets Fall, FSFS, Fcombined,Fman1, Fman2. Five models were developed for LOOCV:
i MODEL1 = �tcsvm(Fall,. . . );
ii MODEL2 = �tcsvm(FSFS,. . . );
iii MODEL3 = �tcsvm(Fcombined,. . . );
Stellenbosch University https://scholar.sun.ac.za

CHAPTER 5. MACHINE LEARNING 67
iv MODEL4 = �tcsvm(Fman1,. . . );
v MODEL5 = �tcsvm(Fman2,. . . );
3. Report LOOCV error of each classi�er;
4. Repeat steps 1 to 3 for a few di�erent values of C: C = 3, 1, 0.3;
5. Choose feature set with the lowest LOOCV error;
6. Use the corresponding C value to build a �nal model;
7. Train the model using the whole training set (not just a subset of thetraining set unlike in LOOCV);
8. Use the test set to predict outputs;
Table 5.5 shows the results of LOOCV error calculated for di�erent C valuesand for the di�erent feature sets. This approach resulted in a tuned parameterC, as well as an optimal feature set. It is clear from the table that the featureset with the highest error was the one that included all features. This wasexpected due to the higher dimensionality. The feature with the least featuresappeared to have been the optimal one, consistently showing low error on allvalues of C. Furthermore, there is some relationship between the number offeatures and the error: the higher the number of features, the higher the error.Ultimately, after using the smallest C value, it was seen that the combinedfeature set Fcombined outperformed the FSFS set in terms of error. Thereforefeature set that was thus chosen was Fcombined, where the minimum error of16.5% was found. Furthermore, the optimal C value was C = 0.3. Intuitively,Fcombined is a better representation of the feature setthan FSFS since the formercontains more representative features of the whole feature set.
The last step in developing the SVM model was to train the classi�er usingthe tuned parameter C = 0.3 and the feature set Fcombined. Previously, theclassi�er was trained for LOOCV using only a subset of the training set ofFcombined. Now, the classi�er is trained using the whole training set. Thisresulted in the following model
MODEL = fitcsvm(Ftrain, C, . . . )
Table 5.5: LOOCV Error on Di�erent Feature Sets and Various C values
Feature set # features C = 10 C = 3 C = 1 C = 0.3
Fall 126 0.5 0.5 0.5 0.5FSFS 10 0.25 0.1875 0.1875 0.1875Fcombined 21 0.4375 0.4375 0.415 0.165Fman1 83 0.46 0.4375 0.437 0.437Fman2 55 0.43 0.4 0.4 0.4
Stellenbosch University https://scholar.sun.ac.za

CHAPTER 5. MACHINE LEARNING 68
The model was then used on the test set to make predictions using MAT-LAB's built-in �predict� function, which took MODEL and the test set asinputs and returned a row vector of predicted outputs. The results and per-formance of the classi�er are discussed in the next chapter.
Stellenbosch University https://scholar.sun.ac.za

Chapter 6
Results and Discussion
6.1 Results
As mentioned previously, the small sample size that was used for the studyinduced certain limitations. Chief among them is the validity of the results.However, the results that will be discussed in this section are suggestive ratherthan conclusive.
The main results of the performance of the classi�er can be seen in theconfusion matrix in Figure 6.1. These results came from the test set. Sincetraining accuracy is not a good indication of a classi�er's performance, thetraining set confusion matrix was not calculated. Various performance metricswere derived from the confusion matrix and are explained next.
Figure 6.1: Confusion Matrix of SVM Classi�er
69
Stellenbosch University https://scholar.sun.ac.za

CHAPTER 6. RESULTS AND DISCUSSION 70
According to the confusion matrix, there were three true positives (TP),three true negatives (TN), one false negative (FN) and no false positives (FP).The following equations show the metrics that were used to evaluate perfor-mance. The accuracy or test set accuracy was calculated in the following way:
ACC =TP + TN
TP + TN + FP + FN(6.1)
The true positive rate (TPR), also known as the sensitivity or recall, wasgiven by
TPR =TP
TP + FN(6.2)
The true negative rate (TNR), also known as the speci�city, was given by
TNR =TN
TN + FP(6.3)
The positive predictive value (PPV), also known as the precision, was givenby
PPV =TP
TP + FP(6.4)
The negative predictive value (NPV) was given by
NPV =TN
TN + FN(6.5)
The F1 score which represents the harmonic mean of precision and sensi-tivity, was given by
F1 = 2PPV × TPRPPV + TPR
(6.6)
The false positive rate α, also known as the type I error, was given by
α = 1− TNR (6.7)
The false negative rate β, also known as the type II error, was given by
β = 1− TPR (6.8)
The values of the performance metrics are shown in Table 6.1. It can beseen that the test set accuracy and LOOCV accuracy are both high. This isexpected given a small dataset. The sensitivity (TPR) relates to the classi-�er's ability to classify ADHD test subjects as having ADHD. Sensitivity istherefore an important characteristic of the classi�er, especially if screeningis involved. Good classi�er performance would require for the classi�er tocorrectly identify subjects that are ADHD. Here the sensitivity is 0.75. This
Stellenbosch University https://scholar.sun.ac.za

CHAPTER 6. RESULTS AND DISCUSSION 71
Table 6.1: Performance Metrics of SVM classi�er on Test Set
Metric Symbol Value
LOOCV Accuracy CV 0.835Test Accuracy ACC 0.857True positive rate TPR 0.75True negative rate TNR 1.00Positive predictive value PPV 1.00Negative predictive value NPV 0.75Harmonic mean F1 0.857Type I error α 0.00Type II error β 0.25
means that 75% of the time, the classi�er will be able to detect the presence ofADHD. Although ADHD is sometimes di�cult to detect, even with classicalmethods, a sensitivity of 75% is quite low. The speci�city (TNR) relates to theclassi�er's ability to correctly reject non-ADHD test subjects. Therefore, thespeci�city is the proportion on non-ADHD test subjects that will be classi�edby the classi�er as not having ADHD. Since the speci�city here is 1, it showsthat all non-ADHD test subjects were correctly classi�ed.
The PPV relates to the relevance of the outputs that were classi�ed. Aprecision of 1 means that all the outputs that were classi�ed were relevant.The NPV of shows that 75% of relevant targets were selected.
The F1 score, mathematically speaking, is the harmonic mean of the pre-cision and recall. In other words, it shows the balance between precision andrecall. Values of F1 that are very high or very low, show that precision andrecall are not well balanced. This appeared to be the case with this classi�er.The high value of 85.7% suggests that the model may have high precision andlow recall, or vice versa.
The type I error of 0 suggests that the null hypothesis was true, and ac-cepted. Although this metric is not indicative given the dataset, it would havebeen approximately equal to 0.05 for a larger set. The type II error of 0.25 isquite large and suggests that there is 25% probability that the classi�er maypredict false positives.
In addition to the performance metrics that were discussed, a comparisonof the test set distribution and target set distribution was made. The followingobservations were made:
� The target values comprised of 4 ADHD subjects and 3 non-ADHD sub-jects;
Stellenbosch University https://scholar.sun.ac.za

CHAPTER 6. RESULTS AND DISCUSSION 72
� The predicted values comprised of 3 ADHD subjects and 4 non-ADHDsubjects;
� The test set comprised of 2 boys, 1 of which was ADHD;
� The test set comprised of 5 girls, 3 of which were ADHD;
� All the boys with ADHD were classi�ed correctly;
� All the boys without ADHD were classi�ed correctly;
� Out of the 3 girls with ADHD in the test set, 2 were classi�ed correctly;
� All the girls without ADHD were classi�ed correctly.
Although no major conclusions can be drawn from these few observationsit is interesting to note that the classi�er was able to correctly reject all theboys and girls that didn't have ADHD, as suggested by the 100% speci�city.Contrary to the claim that boys are more misdiagnosed than girls, the test setshows that all boys were correctly classi�ed. This observation does not resolvethe claim, however, since the dataset was not representative enough of a widerADHD population. It is also seen from these observations that the recall of75% is evident: 3 out of 4 ADHD subjects were predicted.
6.2 Discussion
As a concluding remark to the interpretation of the results, what was seenwas that a classi�er's performance does not solely rely on its test and cross-validation accuracies. Although cross-validation is a robust way to build classi-�ers and gives a general indication of how well the model will perform, modelsshould be chosen based on their practical application as well. For example,the classi�er built for this study was to be used for screening of ADHD. Thismeans that other metrics become very relevant for assessing the model. Suchmetrics include sensitivity, speci�city and recall.
According to the statistical analysis that was done to estimate a samplesize (chapter 4), it was recommended that a total of 200 subjects be used inorder to achieve a model accuracy of 84%. The main aim of the study was toconduct a clinical trial, given this sample size. The �rst step was to performbeta-tests on a smaller population (N = 30) in order to demonstrate the va-lidity of the use of machine learning models. Although the beta-test resultswere seen as preliminary results, they were indicative enough to be used todemonstrate that the research question could be answered. Given the timeconstraints on the study, it was decided that clinical trials would form partof future work. The aim was to develop a screening tool for ADHD, and thebeta-test was able to provide a solution for that. Nonetheless, this does not
Stellenbosch University https://scholar.sun.ac.za

CHAPTER 6. RESULTS AND DISCUSSION 73
imply that the model that was developed is not subject to further optimiza-tions. Such optimizations will be discussed in the next chapter.
Stellenbosch University https://scholar.sun.ac.za

Chapter 7
Conclusion and Recommendations
7.1 Conclusion
The overall objective of the study was to develop a screening tool for ADHDusing quantitative methods. In order to achieve this outcome, the overallobjective was broken down into measurable objectives, as discussed in the in-troduction. All of these objectives were successfully achieved, except for theclinical trial phase that was not conducted. Prior to this phase, a beta-testingphase was done and it was seen that the results from this phase were accept-able. Furthermore, due to logistical considerations, the planned clinical trialcould not be done and completed in time. Therefore, the results of the beta-testing phase, which could be seen as preliminary, were used instead.
The study began by analyzing some current methods that are used in the�eld, as well as their shortcomings. This literature served as proof in determin-ing the need for a novel method to provide screening for ADHD. The approachthat was taken was to develop a tablet-based game that would gather user dataduring game-play and make predictions, based on machine learning models,as to whether a subject may have ADHD or not. A game design speci�cationwas created and outsourced to gaming software developers. This was donesince the game development itself was not part of the scope of the study andto ensure that a high quality game would be delivered.
The beta-testing phase included 30 subjects, where the ADHD diagnosiswas given by an experienced paediatrician. Initially, the aim of this phasewas to develop preliminary models that would be used for the clinical trialthat would comprise of 200 subjects. The machine learning model that wasimplemented was SVM with a linear kernel. Due to the high dimensionalityof the dataset, features were extracted through statistical and morphologicalanalysis. Feature selection was then performed in order to have the most rep-resentative feature subset. Due to the small size of the dataset, leave-one-outcross-validation was chosen to determine the generalization error of the clas-
74
Stellenbosch University https://scholar.sun.ac.za

CHAPTER 7. CONCLUSION AND RECOMMENDATIONS 75
si�er, as well as to tune the regularization parameter. The feature set thatwas chosen consisted of 21 features that were selected using sequential forwardselection. This feature selection method outperformed the other 3 methodsthat were used. The selected features included 11 of the game-play featuresand 10 of the features extracted form the accelerometer.
Performance metrics of the classi�er revealed that although the test andLOOCV accuracies were good (85.7% and 83.5% respectively) care had to betaken when selecting a classi�er as being optimal. Important metrics, espe-cially for diagnosing/screening conditions included speci�city and sensitivity,which relate to how well a classi�er correctly rules out negatives and correctlyincludes positives. From a screening point of view, the penalty is not as largeas for diagnosis, but it is most desirable to have very high sensitivity and ac-ceptable to high speci�city. It was seen that the sensitivity was 75% while thespeci�city was 100%. The sensitivity was seen as low, while the speci�city,although being high, was speci�c to this small dataset and would most likelydecrease with a bigger dataset.
Finally, the study that was conducted was able to suggest an answer tothe research question that was presented, that is: a person can be screenedfor ADHD using quantitative methods. It was seen that the classi�er showedacceptable results, especially considering that those results were only prelimi-nary. It was demonstrated that, given a data acquisition method, in this casebeing the game tablet, meaningful data could be extracted and used to builda predictive model. The methods that were used to build the model werebased on an extensive literature review, where it was shown successfully howthose methods were performed with reliability and repeatability. Therefore,the classi�er developed for the study was not novel in itself, but it was thewhole design process that was novel.
7.2 Recommendations
The �rst recommendation is to use a larger sample size, possibly of more than200. Given the small sample size used in the beta-testing phase, the repeata-bility and robustness of the SVM model are unknown. The limitation of this isthat the results of the study are only indicative of the possibility of developingrobust models. Hand-in-hand with the �rst recommendation is to extract alarger feature set using methods such as mutual information, frequency fea-tures and wavelet features.
Due to the complexity of game development, a simple game with minimalfeatures was implemented. Next, it is recommended that a more interactiveand complex game be developed, where more features can be extracted andmore parameters can be monitored. A more complex implementation would
Stellenbosch University https://scholar.sun.ac.za

CHAPTER 7. CONCLUSION AND RECOMMENDATIONS 76
give a feature set with higher quality and possibly better classi�er performance.Furthermore, many studies have shown that the use of multivariate-time-series(MTS) can help accurately classify diseases such as cancer and even ADHD.Such MTS data is found in EEG, ECG and EMG. These could be implementedinto the game by placing sensors and electrodes on subjects. Additional phys-iological markers could be added, such as eye tracking and heart rate.
Finally, this study formed part of a joint project where the tool to bedeveloped was a tool to screen both subtypes of ADHD. While this studypertained to the development of a screening tool for the hyperactivity subtype,the other study dealt with the inattentive subtype. The aim of the two studieswas to independently di�erentiate between ADHD-inattentive and normal andADHD-hyperactive and normal. These two studies could then be combined infuture work to provide for a more robust tool. The tablet-based game wouldthen integrate the two games that were developed for both studies and covera wider spectrum of ADHD. Furthermore, this integrated tool could providebetter insight into factors such as drug e�ectiveness and quantitative trackingof subject performance. Ultimately, the aim would be to develop a tool that canscreen for a wider range of mental disorders that include ADHD, autism andTourrettes. By successfully demonstrating the use of quantitative techniques,this study served as a starting point for further research that can be done inthe �eld of mental disorder diagnosis.
Stellenbosch University https://scholar.sun.ac.za

References
[1] nimh.nih.gov: NIMH: Attention de�cit hyperactivity disorder. http://www.
nimh.nih.gov/health, 2016. Accessed: 29-06-2016.
[2] Schellack, N. and Meyer, H.: The management of attention de�cit-hyperactivitydisorder in children: evidence-based pharmacy practice. SA Pharmaceutical
Journal, vol. 79, no. 10, pp. 12�20, 2012.
[3] Gualtieri, C.T. and Johnson, L.G.: ADHD: Is objective diagnosis possible?Psychiatry (Edgmont), vol. 2, no. 11, p. 44, 2005.
[4] Bruchmüller, K., Margraf, J. and Schneider, S.: Is ADHD diagnosed in ac-cord with diagnostic criteria? overdiagnosis and in�uence of client gender ondiagnosis. Journal of consulting and clinical psychology, vol. 80, no. 1, p. 128,2012.
[5] Dictionary, O.E.: Oxford English Dictionary. 2003.
[6] Schoeman, R. and Liebenberg, R.: The south african society of psychiatrist-s/psychiatry management group management guidelines for adult attention-de�cit/hyperactivity disorder. South African Journal of Psychiatry, vol. 23,no. 1, pp. 1�14, 2017.
[7] Biederman, J.: Attention-de�cit/hyperactivity disorder: a selective overview.Biological psychiatry, vol. 57, no. 11, pp. 1215�1220, 2005.
[8] Dopheide, J.A. and Pliszka, S.R.: Attention-de�cit-hyperactivity disorder: anupdate. Pharmacotherapy: The Journal of Human Pharmacology and Drug
Therapy, vol. 29, no. 6, pp. 656�679, 2009.
[9] Faraone, S.V., Perlis, R.H., Doyle, A.E., Smoller, J.W., Goralnick, J.J., Holm-gren, M.A. and Sklar, P.: Molecular genetics of attention-de�cit/hyperactivitydisorder. Biological psychiatry, vol. 57, no. 11, pp. 1313�1323, 2005.
[10] Thapar, A., Cooper, M., Eyre, O. and Langley, K.: Practitioner review: whathave we learnt about the causes of ADHD? Journal of Child Psychology and
Psychiatry, vol. 54, no. 1, pp. 3�16, 2013.
[11] Asherson, P., Kuntsi, J. and Taylor, E.: Unravelling the complexity of attention-de�cit hyperactivity disorder: a behavioural genomic approach. 2005.
77
Stellenbosch University https://scholar.sun.ac.za

REFERENCES 78
[12] Bruchmüller, K., Margraf, J. and Schneider, S.: Is ADHD diagnosed in ac-cord with diagnostic criteria? overdiagnosis and in�uence of client gender ondiagnosis. Journal of consulting and clinical psychology, vol. 80, no. 1, p. 128,2012.
[13] Edition, F., Association, A.P. et al.: Diagnostic and statistical manual of men-tal disorders. American Psychological Association, Washington Google Scholar,1994.
[14] Barkley, R.A.: Attention-de�cit hyperactivity disorder: A handbook for diagnosis
and treatment. Guilford Publications, 2014.
[15] Langley, K., Rice, F., van den Bree, M.B. and Thapar, A.: Maternal smokingduring pregnancy as an environmental risk factor for attention de�cit hyper-activity disorder behaviour. a review. Minerva pediatrica, vol. 57, no. 6, pp.359�371, 2005.
[16] Bhutta, A.T., Cleves, M.A., Casey, P.H., Cradock, M.M. and Anand, K.: Cog-nitive and behavioral outcomes of school-aged children who were born preterm:a meta-analysis. Jama, vol. 288, no. 6, pp. 728�737, 2002.
[17] Linnet, K.M., Dalsgaard, S., Obel, C., Wisborg, K., Henriksen, T.B., Rodriguez,A., Kotimaa, A., Moilanen, I., Thomsen, P.H., Olsen, J. et al.: Maternal lifestylefactors in pregnancy risk of attention de�cit hyperactivity disorder and associ-ated behaviors: review of the current evidence. American Journal of Psychiatry,vol. 160, no. 6, pp. 1028�1040, 2003.
[18] Eubig, P.A., Aguiar, A. and Schantz, S.L.: Lead and PCBs as risk factors forattention de�cit/hyperactivity disorder. Environmental health perspectives, vol.118, no. 12, p. 1654, 2010.
[19] Valera, E.M., Faraone, S.V., Murray, K.E. and Seidman, L.J.: Meta-analysis ofstructural imaging �ndings in attention-de�cit/hyperactivity disorder. Biologi-cal psychiatry, vol. 61, no. 12, pp. 1361�1369, 2007.
[20] Toplak, M.E. and Tannock, R.: Time perception: modality and duration e�ectsin attention-de�cit/hyperactivity disorder (ADHD). Journal of abnormal child
psychology, vol. 33, no. 5, pp. 639�654, 2005.
[21] Conners cbrs. https://www.mhs.com/MHS-Assessment?prodname=cbrs, 2016.Accessed: 15-10-2016.
[22] NICHQ:vanderbilt assessment scales. https://www.nichq.org/sites/
default/files/resource-file/NICHQ_Vanderbilt_Assessment_Scales.
pdf, 2016. Accessed: 15-10-2016.
[23] Collett, B.R., Ohan, J.L. and Myers, K.M.: Ten-year review of rating scales. v:scales assessing attention-de�cit/hyperactivity disorder. Journal of the Ameri-
can Academy of Child & Adolescent Psychiatry, vol. 42, no. 9, pp. 1015�1037,2003.
Stellenbosch University https://scholar.sun.ac.za

REFERENCES 79
[24] Swanson, J., Oosterlaan, J., Murias, M., Schuck, S., Flodman, P., Spence, M.A.,Wasdell, M., Ding, Y., Chi, H.-C., Smith, M. et al.: Attention de�cit/hyperac-tivity disorder children with a 7-repeat allele of the dopamine receptor d4 genehave extreme behavior but normal performance on critical neuropsychologicaltests of attention. Proceedings of the National Academy of Sciences, vol. 97,no. 9, pp. 4754�4759, 2000.
[25] Neuropsychology sa. http://www.neuropsychologysa.co.za/sa-norms/,2015. Accessed: 20-09-2016.
[26] Koppitz, E.M.: The bender gestalt test for young children. 1964.
[27] Kaufman, A.S., Flanagan, D.P., Alfonso, V.C. and Mascolo, J.T.: Test review:Wechsler intelligence scale for children, (wisc-iv). Journal of PsychoeducationalAssessment, vol. 24, no. 3, pp. 278�295, 2006.
[28] Conners, C.K., Sta�, M., Connelly, V., Campbell, S., MacLean, M. and Barnes,J.: Conners� continuous performance test ii (cpt ii v. 5). Multi-Health Syst
Inc, vol. 29, pp. 175�96, 2000.
[29] Merten, T.: An analysis of theVOSP silhouettes test with neurological patients.Psychology Science, vol. 48, no. 4, p. 451, 2006.
[30] Warrington, E.K. and James, M.: The visual object and space perception battery.Thames Valley Test Company Bury St Edmunds, 1991.
[31] ATP:token test for children. www.academictherapy.com, 2016. Accessed: 15-10-2016.
[32] De Renzi, E. and Vignolo, L.A.: The token test: A sensitive test to detectreceptive disturbances in aphasics. Brain, vol. 85, no. 4, pp. 665�678, 1962.
[33] Muir-Broaddus, J.E., Rosenstein, L.D., Medina, D.E. and Soderberg, C.: Neu-ropsychological test performance of children with ADHD relative to test normsand parent behavioral ratings. Archives of Clinical Neuropsychology, vol. 17,no. 7, pp. 671�689, 2002.
[34] moxo adhdtest.com: New, pioneering, innovative ADHD diagnosis system.https://www.moxo-adhdtest.com/about-moxo-analytics, 2106. Accessed:20-09-2016.
[35] Berger, I. and Cassuto, H.: The e�ect of environmental distractors incorporationinto a CPT on sustained attention and ADHD diagnosis among adolescents.Journal of neuroscience methods, vol. 222, pp. 62�68, 2014.
[36] Cassuto, H., Ben-Simon, A. and Berger, I.: Using environmental distractors inthe diagnosis of ADHD. Frontiers in human neuroscience, vol. 7, 2013.
[37] Brown, T.E.: Attention-de�cit disorders and comorbidities in children, adoles-
cents, and adults. American Psychiatric Publishing, Inc., 2000.
Stellenbosch University https://scholar.sun.ac.za

REFERENCES 80
[38] O'Mahony, N., Florentino-Liano, B., Carballo, J.J., Baca-García, E. and Ro-dríguez, A.A.: Objective diagnosis of ADHD using IMUs. Medical engineering
& physics, vol. 36, no. 7, pp. 922�926, 2014.
[39] nebahealth.com: Neba health. https://nebahealth.com/faq.html#1, 2015.Accessed: 20-09-2016.
[40] Brauser, D.: Mixed reaction to FDA approval of ADHD brain-wave test. http://www.medscape.com/viewarticle/809079, 2013. Accessed: 05-11-2016.
[41] Snyder, S.M., Rugino, T.A., Hornig, M. and Stein, M.A.: Integration of an eegbiomarker with a clinician's adhd evaluation. Brain and behavior, vol. 5, no. 4,p. e00330, 2015.
[42] Perold, M., Louw, C. and Kleynhans, S.: Primary school teachers' knowledgeand misperceptions of attention de�cit hyperactivity disorder (ADHD). SouthAfrican Journal of Education, vol. 30, no. 3, pp. 0�0, 2010.
[43] Polanczyk, G., de Lima, M.S., Horta, B.L., Biederman, J. and Rohde, L.A.: Theworldwide prevalence of adhd: a systematic review and metaregression analysis.American journal of psychiatry, vol. 164, no. 6, pp. 942�948, 2007.
[44] Berger, I., Slobodin, O. and Cassuto, H.: Usefulness and validity of continuousperformance tests in the diagnosis of attention-de�cit hyperactivity disorderchildren. Archives of Clinical Neuropsychology, vol. 32, no. 1, pp. 81�93, 2017.
[45] McNemar, Q.: Note on the sampling error of the di�erence between correlatedproportions or percentages. Psychometrika, vol. 12, no. 2, pp. 153�157, 1947.
[46] Esmael, B., Arnaout, A., Fruhwirth, R.K. and Thonhauser, G.: A statisticalfeature-based approach for operations recognition in drilling time series. Inter-national Journal of Computer Information Systems and Industrial Management
Applications, vol. 5, pp. 454�461, 2015.
[47] Esmael, B., Arnaout, A., Fruhwirth, R.K. and Thonhauser, G.: A statisticalfeature-based approach for operations recognition in drilling time series. Inter-national Journal of Computer Information Systems and Industrial Management
Applications, vol. 5, pp. 454�461, 2015.
[48] Abootalebi, V., Moradi, M.H. and Khalilzadeh, M.A.: A new approach for eegfeature extraction in p300-based lie detection. Computer methods and programs
in biomedicine, vol. 94, no. 1, pp. 48�57, 2009.
[49] Hsu, C.-W., Chang, C.-C., Lin, C.-J. et al.: A practical guide to support vectorclassi�cation. 2003.
Stellenbosch University https://scholar.sun.ac.za

Appendices
81
Stellenbosch University https://scholar.sun.ac.za

A Ethics
A.1 Ethical Approval Letter
See following page.
82
Stellenbosch University https://scholar.sun.ac.za

Stellenbosch University https://scholar.sun.ac.za

Stellenbosch University https://scholar.sun.ac.za

Stellenbosch University https://scholar.sun.ac.za

A ETHICS 86
A.2 Parental Information Lea�et and Consent
Form
See following page.
Stellenbosch University https://scholar.sun.ac.za

1 of 6
PARENTAL INFORMATION LEAFLET AND CONSENT FORM
TITLE OF THE RESEARCH PROJECT:
PANDAS (Paediatric Attention-Deficit/Hyperactivity Disorder Application Software)
REFERENCE NUMBER: M17/05/019
RESEARCHERS NAME(S):
Prof. Pieter Fourie (Primary Investigator and Project Supervisor)
Dr. Dawie Van den Heever (Project Supervisor)
Mr. Hervé Mwamba (Researcher)
Mr. Romano Swarts (Researcher)
Ms. Rose-Hannah Brown (Counselling Psychologist)
ADDRESS:
Department of Mechanical and Mechatronic Engineering
Room 616
C/O Banhoek & Joubert Streets
Stellenbosch
7600
CONTACT NUMBER:
Office: (021) 808 3613 Cell: 082 551 1845 (Prof. Fourie) 083 556 8311 (Dr. Van den Heever) 084 784 2443 (Hervé) 084 041 1209 (Romano) 082 329 1307 (Rose-Hannah Brown) E-mail: [email protected] (Prof. Fourie)
[email protected] (Dr. Van den Heever)
[email protected] (Hervé)
[email protected] (Romano)
[email protected] (Rose-Hannah Brown)
Stellenbosch University https://scholar.sun.ac.za

2 of 6
Introduction
Your child has been invited to take part in a research study conducted by Hervé Mwamba and Romano Swarts, two Biomedical Engineering Masters students from Stellenbosch University. This document serves to give you a thorough overview and explanation of the project. Please take some time to read through the following information. It is very important that you fully and clearly understand what the research entails, and that you are comfortable with your child participating in the study. It is also important to note that your child’s participation is entirely voluntary, and you are free to decline to participate or withdraw from the study at any point before or after commencement. If you decline to participate or choose to withdraw from the study, you and/or your child will not be affected negatively in any way whatsoever. This study has been approved by the Committee for Human Research at Stellenbosch University and will be conducted according to the ethical guidelines and principles of the international Declaration of Helsinki, South African Guidelines for Good Clinical Practice and the Medical Research Council (MRC) Ethical Guidelines for Research. Testing for this study will take place at the Cape Gate Therapy Centre which is located at 51 Tanner Street, Brackenfell, 7560, Cape Town. If anything remains unclear or if you would like to talk to one of the researchers, please feel free to ask the study staff or doctor (Prof. Pieter Fourie) any questions about any part of this project.
What is this study all about?
The purpose of this study is to determine whether a specifically designed tablet game is able to detect whether or not ADHD symptoms are present in an individual. The study will be conducted at the Cape Gate Therapy Centre, where a group of 200 patients will be tested in the study. Game data will then be processed and the diagnostic results will be compared with the patients’ clinical diagnoses, if any have been made.
Methodology
Mine Runner
Mine Runner is an activity presented in the PANDA tablet game. The task features a panda on a cart, travelling through a dark mine. Sustained attention will be tested as the speed of the character increases over time and obstacles are introduced. The player is required to make use of a joystick to avoid oncoming obstacles, but the task becomes more difficult as distractions are introduced, attempting to force errors. Overall, the task has been designed to be immersive, attempting to keep the player engaged until the task has been completed.
River Rafting Task (RRT)
The River Rafting Task is a task presented in the PANDAS tablet game. The task features a panda on a float, racing down a turbulent river past sheer cliffs of sharp rock and green vegetation. Reflexes will be tested as the speed of the float increases over time and obstacles are introduced in the form of boulders and fallen trees. The player will have the option to avoid or destroy these obstacles, but the task becomes more difficult as distractions are introduced,
Stellenbosch University https://scholar.sun.ac.za

3 of 6
attempting to force errors. Overall, the task has been designed to be captivating (multiple sound and light effects), attempting to keep the player engaged until the task has been completed.
House Building Task (HBT)
The House Building Task is a task presented in the PANDAS tablet game. The task features a panda in need of shelter and having to repair a broken-down house in the forest. The task comes in the form of a puzzle, testing the level of cognitive function and problem solving whilst being immersed in a dense forest. The house will have holes (puzzles to be completed) in each of its four walls before the shelter can be used. Difficulty will increase as more holes are successfully completed (repaired) with the presented puzzle pieces. Overall, the task has been designed to be captivating (multiple sound and visual appeal), attempting to keep the player engaged until the task has been completed.
Other deviations from standard treatment associated with the study
No deviations will occur. Your child will simply be given a tablet on which to play a game. When the game has been completed, the tablet will be returned and the assessment is complete.
Why have you been invited to participate?
For this study, we need to test individuals between ages 4 to 18, as ADHD symptoms are most prominent and generally more easily detectable in these individuals. Your child has been invited to participate as they fall within the specified age range.
What are my responsibilities?
You do not have any responsibilities.
How long will this study take?
If you allow your child to participate in the study, your child will be asked to play a tablet game for a duration of approximately 15 minutes.
Will you benefit from taking part in this research?
Your child will not benefit directly from this project, since the results of the study will not be used in the treatment of your child.
Are there any risks involved in taking part in this research?
The mobile device (tablet) that will be used does not pose any risk to you or your child, unless handled incorrectly.
If you do not agree to take part, what other alternatives do you have?
As already mentioned, participation in this study is entirely voluntary. Any participant can withdraw from the study at any point, at the discretion of the parent or the child. Withdrawal from the study will not affect you or your child negatively in any way.
Stellenbosch University https://scholar.sun.ac.za

4 of 6
Who will have access to your medical records?
All information collected will be treated as strictly confidential. Should it be used in a publication or thesis, the identity of the participant will remain anonymous. Only HREC members, the study investigators and sponsors will have direct access to the information collected.
Will you be paid to take part in this study and are there any costs involved?
You will not be paid to take part in the study. Participation in the study is free.
What if something goes wrong?
In the unlikely event that your child is hurt as a result of his/her participation in the study, the supervising paediatrician, Prof. Pieter Fourie, will be informed immediately and will take appropriate steps.
Is there anything else that I should know or do?
You can contact Prof. Pieter Fourie at 082 551 1845 if you have any further queries.
You can contact the Committee for Human Research at (021) 938 9207 if you have any concerns or complaints that have not been adequately addressed by the study staff.
You will receive a copy of this information and consent form for your own records.
Stellenbosch University https://scholar.sun.ac.za

5 of 6
Declaration by Participant
By signing below, I agree to take part in a research study entitled, "PANDAS (Paediatric Attention-Deficit/Hyperactivity Disorder Application Software)". I declare that:
1. I have read (or have been read to) the contents of this document and agree to all information and/or conditions given therein.
2. Ample time has been given to me to ask and/or question the information and/or conditions in this document.
3. All questions that were posed by myself have been answered and I fully comprehend the entirety of this study.
4. I understand the risk involved in this study. 5. I understand that taking part in this study is voluntary and I have not been pressurised to
take part. 6. I may choose to leave the study at any time and will not be penalised or prejudiced in
any way. 7. I acknowledged that I am a volunteer participating in this study out of free will and have
not been forced to do so. Signed at_______________________________ on ____________________2017. Signature of Participant_________________ Signature of Witness_________________
Stellenbosch University https://scholar.sun.ac.za

6 of 6
Declaration by Investigator
I, (the investigator), hereby declare that: 1. I have fully explained the information in this document to. 2. I have informed the applicant to the best of my abilities. 3. I have encouraged the applicant to question the risks involved in this study. 4. I have encouraged the applicant to question the information and conditions set out in this
document. 5. That I have not forced the applicant to volunteer for the study.
Signed at_______________________________ on ____________________2017. Signature of Investigator _________________ Signature of Witness_________________
Stellenbosch University https://scholar.sun.ac.za

A ETHICS 93
A.3 Participant Information Lea�et and Assent
Form 4-11 y/o
See following page.
Stellenbosch University https://scholar.sun.ac.za

1 of 3
Assent template. Faculty of Health Sciences SU. Version 1. June 2009
STELLENBOSCH UNIVERSITY
FACULTY OF HEALTH SCIENCES
PARTICIPANT INFORMATION LEAFLET AND ASSENT FORM
TITLE OF THE RESEARCH PROJECT:
PANDAS (Paediatric Attention-Deficit/Hyperactivity Disorder Application Software) RESEARCHERS NAME(S):
Prof. Pieter Fourie Dr. Dawie van den Heever Mr. Hervé Mwamba Mr. Romano Swarts Ms. Rose-Hannah Brown ADDRESS:
Department of Mechanical and Mechatronic Engineering Room 616 C/O Banhoek & Joubert Streets Stellenbosch 7600 CONTACT NUMBER:
Office: (021) 808 3613 Cell: 082 551 1845 (Prof. Fourie) 083 556 8311 (Dr. Van den Heever) 084 784 2443 (Hervé) 084 041 1209 (Romano) 082 329 1307 (Rose-Hannah Brown) E-mail: [email protected] (Prof. Fourie) [email protected] (Dr. Van den Heever) [email protected] (Hervé) [email protected] (Romano) [email protected] (Rose-Hannah Brown)
Stellenbosch University https://scholar.sun.ac.za

2 of 3
Assent template. Faculty of Health Sciences SU. Version 1. June 2009
What is RESEARCH?
Research is looking for answers to questions we have. These questions can be about anything. The answers we find make people’s lives easier and things work better.
What is this research project all about?
Some children find it hard to concentrate. We have made a tablet game for lots of children to play so that we can see who finds it easy to focus and who does not.
Why have I been invited to take part in this research project?
You are the right age to help us with our project.
Who is doing the research?
Professor Fourie. Hervé and Romano will be helping him.
Where will this study take place?
This study will take place at the Cape Gate Therapy Centre in 51 Tanner Street, Brackenfell, 7560, Cape Town. How long will this study take?
The tablet game will take about 15 minutes.
What will happen to me in this study?
You will be in a room with one of the researchers. You will then be asked to play a tablet game once.
Can anything bad happen to me?
No, you will only be playing a game on a tablet.
Can anything good happen to me?
Hopefully, you will have fun.
Will anyone know I am in the study?
Only your parents and the researchers will know.
Who can I talk to about the study?
Prof. Pieter Fourie (082 551 1845) Dr. Dawie van den Heever (083 556 8311) Mr. Hervé Mwamba (084 784 2443) Mr. Romano Swarts (084 041 1209) Ms. Rose-Hannah Brown (082 329 1307)
Stellenbosch University https://scholar.sun.ac.za

3 of 3
Assent template. Faculty of Health Sciences SU. Version 1. June 2009
What if I do not want to do this?
You do not have to do anything you do not want to. Even if you want to take part now, you can still change your mind later. You will be allowed to leave at any time.
Do you understand this research study and are you willing to take part in it?
YES NO
Has the researcher answered all your questions?
YES NO
Do you understand that you can pull out of the study at any time?
YES NO
_________________________ ____________________ Signature of Child Date
Stellenbosch University https://scholar.sun.ac.za

A ETHICS 97
A.3 Participant Information Lea�et and Assent
Form 12-18 y/o
See following page.
Stellenbosch University https://scholar.sun.ac.za

1 of 3
Assent template. Faculty of Health Sciences SU. Version 1. June 2009
STELLENBOSCH UNIVERSITY
FACULTY OF HEALTH SCIENCES
PARTICIPANT INFORMATION LEAFLET AND ASSENT FORM
TITLE OF THE RESEARCH PROJECT:
PANDAS (Paediatric Attention-Deficit/Hyperactivity Disorder Application Software) RESEARCHERS NAME(S):
Prof. Pieter Fourie Dr. Dawie van den Heever Mr. Hervé Mwamba Mr. Romano Swarts Ms. Rose-Hannah Brown ADDRESS:
Department of Mechanical and Mechatronic Engineering Room 616 C/O Banhoek & Joubert Streets Stellenbosch 7600 CONTACT NUMBER:
Office: (021) 808 3613 Cell: 082 551 1845 (Prof. Fourie) 083 556 8311 (Dr. Van den Heever) 084 784 2443 (Hervé) 084 041 1209 (Romano) 082 329 1307 (Rose-Hannah Brown) E-mail: [email protected] (Prof. Fourie) [email protected] (Dr. Van den Heever) [email protected] (Hervé) [email protected] (Romano) [email protected] (Rose-Hannah Brown)
Stellenbosch University https://scholar.sun.ac.za

2 of 3
Assent template. Faculty of Health Sciences SU. Version 1. June 2009
What is RESEARCH?
Research is something we do to gain new knowledge about the way things (and people) work. We use research projects or studies to help us find out more about a disorder, disease or illness. Research also helps us to find better ways of helping, treating and caring for children who need it. What is this research project all about?
This research project aims to help find a better way to tell the difference between children who have difficulty paying attention and children who do not. The project will use a tablet game to do this.
Why have I been invited to take part in this research project?
The easiest stage to find out whether someone has a problem paying attention is between the ages of 4 and18.
Who is doing the research?
Professor Fourie, Mr. Hervé Mwamba and Mr. Romano Swarts will be doing the research. Hervé and Romano are both Masters students at Stellenbosch University, trying to find a better way to tell the difference between young people who have difficulty paying attention and those who do not.
Where will this study take place?
This study will take place at the Cape Gate Therapy Centre which is located at 51 Tanner Street, Brackenfell, 7560, Cape Town. How long will this study take?
The tablet game will take about 15 minutes.
What will happen to me in this study?
You will be in a room with one of the researchers where you will be asked to play a tablet game once. This will be enough to help us complete our study.
Can anything bad happen to me?
There is no known harm that can come to you.
Can anything good happen to me?
There are no known benefits to taking part in this study.
Will anyone know I am in the study?
Only your parents and the researchers will know. Your personal information and tablet game results will be kept secret. Information from the game will only be given to the research staff.
Who can I talk to about the study?
Prof. Pieter Fourie (082 551 1845) Dr. Dawie van den Heever (083 556 8311) Mr. Hervé Mwamba (084 784 2443) Mr. Romano Swarts (084 041 1209) Ms. Rose-Hannah Brown (082 329 1307)
Stellenbosch University https://scholar.sun.ac.za

3 of 3
Assent template. Faculty of Health Sciences SU. Version 1. June 2009
What if I do not want to do this?
If you are not comfortable taking part in the study, you do not have to take part. We want you to know that you can stop participating in this study at any time.
Do you understand this research study and are you willing to take part in it?
YES NO
Has the researcher answered all your questions?
YES NO
Do you understand that you can pull out of the study at any time?
YES NO
_________________________ ____________________ Signature of Child Date
Stellenbosch University https://scholar.sun.ac.za

B DSM-5 Criteria
See following page.
101
Stellenbosch University https://scholar.sun.ac.za

Cecil R. Reynolds, PhD
Randy W. Kamphaus, PhD
Attention-Deficit/Hyperactivity Disorder (ADHD)
314.0X (F90.X)
Stellenbosch University https://scholar.sun.ac.za

— 1 — Reprinted with permission from the Diagnostic and Statistical Manual of Mental Disorders, Fifth Edition
(Copyright © 2013). American Psychiatric Association. All Rights Reserved.
DSM-5™ Diagnostic Criteria
Attention-Deficit/Hyperactivity Disorder (ADHD) 314.0X (F90.X)
A. A persistent pattern of inattention and/or hyperactivity-impulsivity that interferes with functioning or development, as characterized by (1) and/or (2):
1. Inattention: Six (or more) of the following symptoms have persisted for at least 6 months to a degree that is inconsistent with developmental level and that negatively impacts directly on social and academic/occupational activities:
Note: The symptoms are not solely a manifestation of oppositional behavior, defiance, hostility, or failure to understand tasks or instructions. For older adolescents and adults (age 17 and older), at least five symptoms are required.
a. Often fails to give close attention to details or makes careless mistakes in schoolwork, at work, or during other activities (e.g., overlooks or misses details, work is inaccurate).
b. Often has difficulty sustaining attention in tasks or play activities (e.g., has difficulty remaining focused during lectures, conversations, or lengthy reading).
c. Often does not seem to listen when spoken to directly (e.g., mind seems elsewhere, even in the absence of any obvious distraction).
d. Often does not follow through on instructions and fails to finish schoolwork, chores, or duties in the workplace (e.g., starts tasks but quickly loses focus and is easily sidetracked).
e. Often has difficulty organizing tasks and activities (e.g., difficulty managing sequential tasks; difficulty keeping materials and belongings in order; messy, disorganized work; has poor time management; fails to meet deadlines).
f. Often avoids, dislikes, or is reluctant to engage in tasks that require sustained mental effort (e.g., schoolwork or homework; for older adolescents and adults, preparing reports, completing forms, reviewing lengthy papers).
g. Often loses things necessary for tasks or activities (e.g., school materials, pencils, books, tools, wallets, keys, paperwork, eyeglasses, mobile telephones).
h. Is often easily distracted by extraneous stimuli (for older adolescents and adults, may include unrelated thoughts).
i. Is often forgetful in daily activities (e.g., doing chores, running errands; for older adolescents and adults, returning calls, paying bills, keeping appointments).
2. Hyperactivity and impulsivity: Six (or more) of the following symptoms have persisted for at least 6 months to a degree that is inconsistent with developmental level and that negatively impacts directly on social and academic/occupational activities:
Note: The symptoms are not solely a manifestation of oppositional behavior, defiance, hostility, or a failure to understand tasks or instructions. For older adolescents and adults (age 17 and older), at least five symptoms are required.
a. Often fidgets with or taps hands or feet or squirms in seat.
b. Often leaves seat in situations when remaining seated is expected (e.g., leaves his or her place in the classroom, in the office or other workplace, or in other situations that require remaining in place).
Stellenbosch University https://scholar.sun.ac.za

— 2 — Reprinted with permission from the Diagnostic and Statistical Manual of Mental Disorders, Fifth Edition
(Copyright © 2013). American Psychiatric Association. All Rights Reserved.
c. Often runs about or climbs in situations where it is inappropriate. (Note: In adolescents or adults, may be limited to feeling restless.)
d. Often unable to play or engage in leisure activities quietly.
e. Is often “on the go,” acting as if “driven by a motor” (e.g., is unable to be or uncomfortable being still for extended time, as in restaurants, meetings; may be experienced by others as being restless or difficult to keep up with).
f. Often talks excessively.
g. Often blurts out an answer before a question has been completed (e.g., completes people’s sentences; cannot wait for turn in conversation).
h. Often has difficulty waiting his or her turn (e.g., while waiting in line).
i. Often interrupts or intrudes on others (e.g., butts into conversations, games, or activities; may start using other people’s things without asking or receiving permission; for adolescents and adults, may intrude into or take over what others are doing).
B. Several inattentive or hyperactive-impulsive symptoms were present prior to age 12 years.
C. Several inattentive or hyperactive-impulsive symptoms are present in two or more settings (e.g., at home, school, or work; with friends or relatives; in other activities).
D. There is clear evidence that the symptoms interfere with, or reduce the quality of, social, academic, or occupational functioning.
E. The symptoms do not occur exclusively during the course of schizophrenia or another psychotic disorder and are not better explained by another mental disorder (e.g., mood disorder, anxiety disorder, dissociative disorder, personality disorder, substance intoxication or withdrawal).
Specify whether:
314.01 (F90.2) Combined presentation: If both Criterion A1 (inattention) and Criterion A2 (hyperactivity-impulsivity) are met for the past 6 months.
314.00 (F90.0) Predominantly inattentive presentation: If Criterion A1 (inattention) is met but Criterion A2 (hyperactivity-impulsivity) is not met for the past 6 months.
314.01 (F90.1) Predominantly hyperactive/impulsive presentation: If Criterion A2 (hyperactivity-impulsivity) is met but Criterion A1 (inattention) is not met over the past 6 months.
Specify if:
In partial remission: When full criteria were previously met, fewer than the full criteria have been met for the past 6 months, and the symptoms still result in impairment in social, academic, or occupational functioning.
Specify current severity:
Mild: Few, if any, symptoms in excess of those required to make the diagnosis are present, and symptoms result in only minor functional impairments.
Moderate: Symptoms or functional impairment between “mild” and “severe” are present.
Severe: Many symptoms in excess of those required to make the diagnosis, or several symptoms that are particularly severe, are present, or the symptoms result in marked impairment in social or occupational functioning.
Stellenbosch University https://scholar.sun.ac.za

C NVIDIA K1 Shield Tablet
Datasheet
See following page.
105
Stellenbosch University https://scholar.sun.ac.za

Stellenbosch University https://scholar.sun.ac.za