
Neuropilin-1 identifies a subset of bone marrow Gr1-monocytes that can induce tumor vessel...
12
Published OnlineFirst December 7, 2012. Cancer Res Alessandro Carrer, Silvia Moimas, Serena Zacchigna, et al. and Inhibit Tumor Growth Monocytes That Can Induce Tumor Vessel Normalization - Neuropilin-1 Identifies a Subset of Bone Marrow Gr1 Updated Version 10.1158/0008-5472.CAN-12-0762 doi: Access the most recent version of this article at: E-mail alerts related to this article or journal. Sign up to receive free email-alerts Subscriptions Reprints and . [email protected] Publications Department at To order reprints of this article or to subscribe to the journal, contact the AACR Permissions . [email protected] Department at To request permission to re-use all or part of this article, contact the AACR Publications American Association for Cancer Research Copyright © 2012 on December 11, 2012 cancerres.aacrjournals.org Downloaded from Published OnlineFirst on December 7, 2012; DOI:10.1158/0008-5472.CAN-12-0762
Transcript of Neuropilin-1 identifies a subset of bone marrow Gr1-monocytes that can induce tumor vessel...

Published OnlineFirst December 7, 2012.Cancer Res Alessandro Carrer, Silvia Moimas, Serena Zacchigna, et al. and Inhibit Tumor GrowthMonocytes That Can Induce Tumor Vessel Normalization
−Neuropilin-1 Identifies a Subset of Bone Marrow Gr1
Updated Version 10.1158/0008-5472.CAN-12-0762doi:
Access the most recent version of this article at:
E-mail alerts related to this article or journal.Sign up to receive free email-alerts
SubscriptionsReprints and
[email protected] Department atTo order reprints of this article or to subscribe to the journal, contact the AACR
To request permission to re-use all or part of this article, contact the AACR Publications
American Association for Cancer Research Copyright © 2012 on December 11, 2012cancerres.aacrjournals.orgDownloaded from
Published OnlineFirst on December 7, 2012; DOI:10.1158/0008-5472.CAN-12-0762
Microenvironment and Immunology
Neuropilin-1 Identifies a Subset of Bone Marrow Gr1�Monocytes That Can Induce Tumor Vessel Normalizationand Inhibit Tumor Growth
Alessandro Carrer1, Silvia Moimas1,2, Serena Zacchigna1, Lucia Pattarini1, Lorena Zentilin1, Giulia Ruozi1,Miguel Mano1, Milena Sinigaglia1, Federica Maione3, Guido Serini3, Enrico Giraudo3,Federico Bussolino3, and Mauro Giacca1,2
AbstractImproving tumor perfusion, thus tempering tumor-associated hypoxia, is known to impair cancer
progression. Previous work from our laboratory has shown that VEGF-A165 and semaphorin 3A (Sema3A)promote vessel maturation through the recruitment of a population of circulating monocytes expressing theneuropilin-1 (Nrp1) receptor (Nrp1-expressing monocytes; NEM). Here, we define the characteristics of bonemarrow NEMs and assess whether these cells might represent an exploitable tool to induce tumor vesselmaturation. Gene expression signature and surface marker analysis have indicated that NEMs represent aspecific subset of CD11bþ Nrp1þ Gr1� resident monocytes, distinctively recruited by Sema3A. NEMs werefound to produce several factors involved in vessel maturation, including PDGFb, TGF-b, thrombospondin-1,and CXCL10; consistently, they were chemoattractive for vascular smooth muscle cells in vitro. When directlyinjected into growing tumors, NEMs, isolated either from the bone marrow or from Sema3A-expressingmuscles, exerted antitumor activity despite having no direct effects on the proliferation of tumor cells. NEMinoculation specifically promoted mural cell coverage of tumor vessels and decreased vascular leakiness.Tumors treated with NEMs were smaller, better perfused and less hypoxic, and had a reduced level ofactivation of HIF-1a. We conclude that NEMs represent a novel, unique population of myeloid cells that, onceinoculated into a tumor, induce tumor vessel normalization and inhibit tumor growth. Cancer Res; 72(24); 1–11. �2012 AACR.
IntroductionOver the last several years, multiple evidences have indicat-
ed that different bone marrow–derived myeloid cells partici-pate in various aspects of cancer development and progression(1–3). Among these are tumor-associatedmacrophages (TAM),which exert proangiogenic and protumorigenic activity (4).Other leukocyte populations recruited at the site of tumorgrowth are Tie-2 expressing monocytes (TEM; ref. 5) andmyeloid-derived suppressor cells, a variegated group ofCD11bþ Gr1þ cells able to foster tumor progression and
angiogenesis (6). Finally, tumor-derived TGF-b can drive thepolarization of neutrophils to acquire a protumoral phenotype(7). Of note, virtually all of the bone marrow–derived cell typesthat infiltrate human tumors appear to possess proangiogenicactivity (1) and their ablation is detrimental to tumor growth(8), a concept that is also currently being evaluated in clinicaltrials (9).
In growing tumors, leukocytes contribute to the excessiveproduction of proangiogenic factors, which leads to the for-mation of an abnormal vasculature, typically characterized byelevated vascular density, abnormal vessel morphology, andexcessive leakiness (10–12). These features seem to influencetumor progression positively, by inducing a constant state ofhypoxia and acidosis, which, in turn, favors the production oftumorigenic trophic factors, the natural selection of malignantcells and the further recruitment of protumorigenic myeloidcells (13). "Normalizing" the tumor vasculature might thusrepresent an effective strategy in cancer therapy, by exerting anegative effect on malignant progression, blunting tumorhypoxia, reducing vascular permeability, and enhancing drugpenetration (14, 15).
Here, we describe a novel myeloid cell population that,when injected into growing tumors, exerts antitumoralactivity by inducing tumor vessel maturation. In recentyears, we and others have observed that the overexpression
Authors' Affiliations: 1Molecular Medicine Laboratory, International Cen-tre for Genetic Engineering and Biotechnology (ICGEB); 2Department ofMedical Sciences, Faculty of Medicine, University of Trieste, Trieste; and3Department of Oncological Sciences and Division of Vascular Biology,Institute for Cancer Research and Treatment (IRCC), University of TorinoSchool of Medicine, Candiolo, Italy
Note: Supplementary data for this article are available at Cancer ResearchOnline (http://cancerres.aacrjournals.org/)
A. Carrer, S. Moimas, and S. Zacchigna contributed equally to this work.
Corresponding Author: Mauro Giacca, ICGEB, Padriciano 99, 34149Trieste, Italy. Phone: 39-040-375-7324; Fax: 39-040–375-7380; E-mail:[email protected]
doi: 10.1158/0008-5472.CAN-12-0762
�2012 American Association for Cancer Research.
CancerResearch
www.aacrjournals.org OF1
American Association for Cancer Research Copyright © 2012 on December 11, 2012cancerres.aacrjournals.orgDownloaded from
Published OnlineFirst on December 7, 2012; DOI:10.1158/0008-5472.CAN-12-0762
of the 165 amino acid isoform of VEGF-A (VEGF-A165) inadult tissues determines the recruitment of cells positive forthe myeloid antigen CD11b (16–18) and that these expressthe neuropilin-1 (Nrp1) receptor (17). These cells turned outto be essential in mediating mural cell coverage of thevasculature formed upon VEGF stimulation. Of note, sema-phorin-3A (Sema3A), which also binds Nrp1 similar toVEGF-A165, also stimulated massive infiltration of theseCD11bþ cells in the expressing tissues (17). These, togetherwith other results, clearly pointed out that Nrp1 was anessential receptor to mediate the recruitment of these cells.The infiltrating cells, which originate from the bone marrowand were negative for lineage-specific leukocyte antigens,among which CD3, CD4, CD8, and CD49b, are herein referredto as neuropilin-1 expressing monocytes (NEM).
Here, we characterize NEMs as a population of CD11bþNrp1þGr1� cells, which constitutes approximately 1.0%of thetotal number of bone marrow cells. We report that the intra-tumoral injection of NEMs, purified from either the bonemarrow or Sema3A-expressingmuscles, is capable ofmarkedlyreducing tumor growth by promoting the formation of a moremature vascular network, eventually resulting in enhancedtumor perfusion.
Materials and MethodsAnimal studies
C57BL/6 or Balb/c mice were injected subcutaneously(1 � 106 cells/mouse) with B16.F10 melanoma [CRL-6475;American Type Culture Collection (ATCC)] or 4T1 breastcarcinoma cells (CRL-2539; ATCC), respectively. Tumor vol-ume was evaluated daily using calipers and expressed in mm3
using the formula: V ¼ p/6 � (dmax2 � dmin/2; ref. 19).
Flow cytometry and cell sortingBone marrow pools from 4 animals were used for flow
cytometry using the following antibodies: anti-CD45-PE,anti-CD31-PE, anti-Flk1-PE, anti-Sca-1-PE, anti-c-kit-PE,anti-CD11c-PE, anti-CD14-PE, anti-isotype controls (all fromPharmingen Becton Dickinson), anti-CCR2-PE, anti-Flt-1-PE(from R&D), anti-CXCR4-PE, anti-CD49b, anti-F4/80-PE, anti-MHCII-PE (from eBioscience), anti-CD11b AlexaFluor647,anti-Tie-2-PE, anti-B220-PE (all from Biolegend), anti-Ly6C-PE, anti-CD25-PE, anti-CD16/32-PE, anti-Gr1-perCP (fromMiltenyi Biotec), and anti-Nrp1 (C-19; Santa Cruz Biotechnol-ogy). Sorting was carried out on a FACSAria II Instrument(Becton Dickinson Biosciences).
In vivo cell trackingSortedNEMs or Gr1þ cells were labeledwith the fluorescent
dye DiD (Invitrogen) following the manufacturer's instruc-tions. Cells were subsequently injected into B16.F10 tumorsand animals were sacrificed 6 days after injection.
Migration assaysMigration assays were conducted using 5-mm pore size
Transwell permeable supports (Costar, Corning Incorporated).Cells (2.5 � 105) were seeded in serum-free medium in theupper chamber, whereas recombinant Sema3A (500 ng/mL;
R&D) or FBS (10%) was placed in the lower chamber. Afterovernight incubation, migrated cells on the lower chamberwere labeled with Hoechst (2 mg/mL, Invitrogen). Each assaywas carried out in triplicate.
Tissue analysisTissues were harvested as described (17). The following
primary antibodies were used diluted 1:200 in blocking buffer:anti-CD11b, anti-Gr1, anti-CD31 (all from Pharmingen BectonDickinson), anti-Nrp1 (R&D Systems), anti–proliferating cellnuclear antigen (PCNA; F-2; Santa Cruz Biotechnology), Cy3-coniugated anti-a-SMA (1A4; Sigma), and anti-NG2 (Chemi-con). AlexaFluor-conjugated antibodies (1:1,000; MolecularProbes) were used as secondary antibodies.
For hypoxia detection, mice were injected intraperitoneallywith 60 mg/kg of Hypoxyprobe-1 (HPI Inc.). After 1 hour,animals were sacrificed and tumor masses were harvestedand processed. Tissue slices were fixed with PFA 4% for 30minutes at room temperature; unmasking with citrate bufferwas carried out for 20 minutes at 98�C and slices were thenincubated with the anti-Hypoxyprobe-1 fluorescein isothiocy-anate–conjugated antibody (HPI Inc.) for 40 minutes in thedark.
Fluorescence signals were quantified counting the numberof pixels that exceeded a fixed background threshold.
In vitro proliferation assayB16.F10 cells (1� 105) were labeled with calcein (500 ng/mL
for 30 minutes at 37�C; Invitrogen), seeded onto a 24-wellplate, and counted after 6 hours; then, freshly purified NEMsor Gr1þ cells were added. After an additional 40 hours, cellswere incubated with Hoechst dye (2 mg/mL; Invitrogen)for 15 minutes and counted. The proliferation indexwas calculated as a ratio between cell count at t ¼ 40 andt ¼ 0 hours.
Vessel permeability assayVessel permeability was analyzed by an adaptation of the
Miles' assay. Mice were injected intravenously (i.v.) with 250 mL0.5% Evans blue (Sigma) and sacrificed after 30 minutes. Thetumormass and liver were removed andweighted. The dyewasextracted by incubation in 2% formamide at 55�C and spec-trophotometrically quantified at 610 nm. For each animal,Evans blue content was expressed as a ratio between tumorand liver content.
Doxorubicin quantificationDoxorubicin (Sigma) was injected i.v. (10 mg/kg) in tumor-
bearing C57BL/6mice 4 hours before sacrifice. Tumors and theliver right lobe were harvested and weighted. Tissue-bounddoxorubicin was assessed as described previously (20), nor-malized according to tissue weight, and expressed as a ratiobetween tumor and liver content.
Power Doppler imagingPower Doppler images from subcutaneously growing tu-
mors (n¼ 5 per group) were obtained with a Vevo 770 system,using a 30 MHz probe. Power Doppler signals were assessed at
Carrer et al.
Cancer Res; 72(24) December 15, 2012 Cancer ResearchOF2
American Association for Cancer Research Copyright © 2012 on December 11, 2012cancerres.aacrjournals.orgDownloaded from
Published OnlineFirst on December 7, 2012; DOI:10.1158/0008-5472.CAN-12-0762
3 points along the longitudinal axis, located 0.2-cm away fromeach other.
Recovery of NEMs from Sema3A-expressing musclesProduction and use of the recombinant AAV2-Sema3A
(rAAV2-Sema3A) vector was as described previously (17).After 15 days, mice injected in the tibialis anterior of bothlegs [5 � 1010 viral particles (vp) per leg] were sacrificed, andmuscles were removed and mechanically minced. Tissue wasdigested with collagenase (0.225%; Worthington) at 37�C for60 minutes and filtered. The muscle-derived NEMs (mNEM)were purified using anti-CD11b–conjugated magnetic beads(Miltenyi Biotec).
Proliferation and migration of vascular smooth musclecellsVascular SMCs (vSMC; 1 � 105) from coronary artery
(Clonetics, Cambrex) were seeded in a 24-well plate. After6 hours, cells were incubated with EdU (Invitrogen) for 4hours. Then, cells were washed, the medium was replaced,and freshly purified NEMs or Gr1þ cells (2 � 104) wereadded. Twenty hours after EdU addition, cells were washedtwice in PBS, fixed in PFA 4%, and stained with a-SMAantibody (Sigma) for 2 hours at room temperature (1:400).EdU detection was carried out using Click-iT EdU CellProliferation Assay (Invitrogen).Migration assays were conducted using 8-mm pore size
Transwell permeable supports (Costar, Corning Inc.). vSMCswere stained with calcein (Invitrogen). Then, 1� 105 cells wereseeded in the upper chamber, whereas purified NEMs or Gr1þcells or FBS (20%) were added to the lower chamber. Afterovernight incubation,migrated cellswere labeledwithHoechst(2 mg/mL) and double-positive cells were counted. Assays werecarried out in triplicate.
Real-time PCR amplificationTotal RNA was extracted using TRIzol reagent (Invitrogen)
and reverse transcribed using hexameric random primers(Invitrogen). PCR conditions are reported in SupplementaryTable S1.
Statistical analysisData were analyzed using a 2-tailed Student t-test or a
nonparametricMann–WhitneyU test, with P< 0.05 consideredsignificant. Growth curves were analyzed by 2-way ANOVA forrepeated measures and post-hoc analysis. Cluster analysis wasconducted using the Genesis software (21). Data were inter-nally normalized according to the mean centering method.
ResultsCharacterization of NEMs from the bone marrowA freshly isolated bone marrow pool (n ¼ 4) was stained
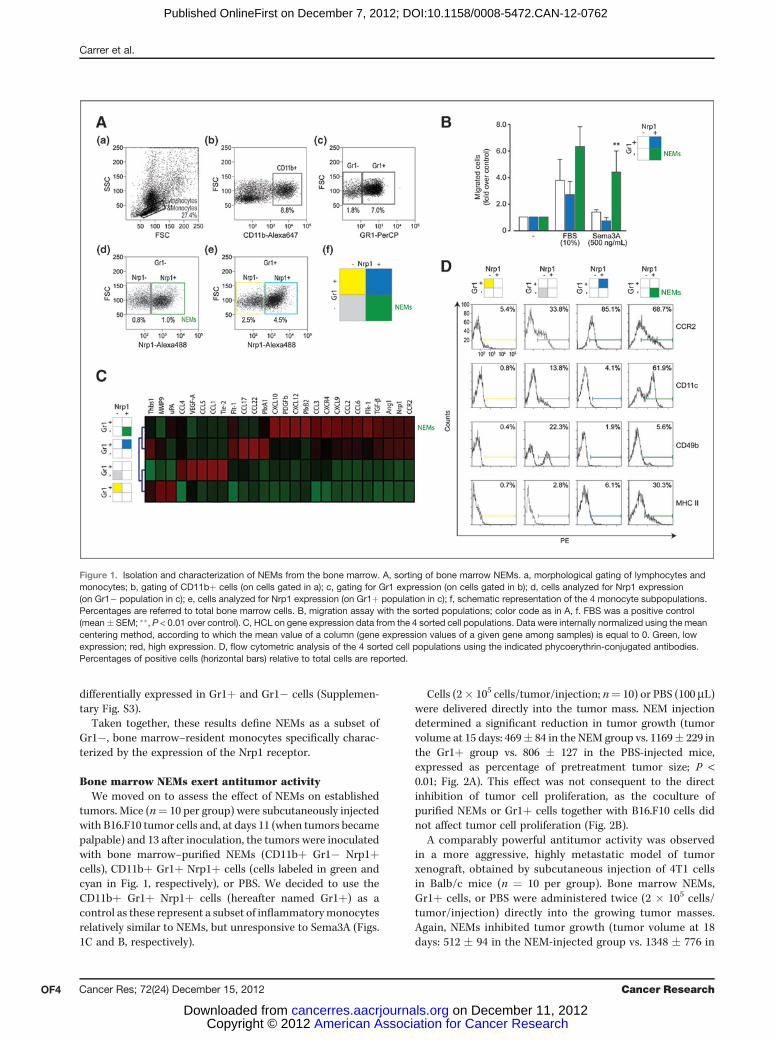
for CD11b, Gr1, and Nrp1 and analyzed by flow cytometryand cell sorting. The monocytic fraction was discriminatedaccording to morphological gating and CD11b positivity(Fig. 1A, a and b). According to the expression of the Gr1antigen, mouse monocytes are commonly divided intoGr1� (resident) or Gr1þ (inflammatory) cells (22–24); this
antigen was thus used to sort apart the 2 cell populations(Fig. 1A, c). Next, both Gr1þ and Gr1� cells were furthersorted according to expression of Nrp1 (Fig. 1A, d and e). Onthe basis of the combined expression of Nrp1 and Gr1, 4subsets of bone marrow–monocytic cells were thus eventu-ally obtained (Fig. 1A, f).
Our previous findings indicated that the cells attracted invivo by Sema3A were positive for Nrp1 and negative for Gr1(17). Therefore, we defined bone marrow NEMs as theNrp1þ Gr1� subset of CD11bþ cells, which correspondedto approximately 1% of total bone marrow cells (in greenin Fig. 1A, f).
Next, we wanted to verify the response of the 4 sortedpopulations to Sema3A. Cells were seeded onto the upperchamber in a Transwell plate and migration in response torSema3A was evaluated after 12 hours. Sema3A chemoat-tracted only the Gr1� subset of the Nrp1þ cells (Fig. 1B).
We then determined the gene expression profiles of the 4sorted CD11bþ cell subsets. In particular, we assessed thelevels of mRNAs of growth factors and receptors known to beinvolved in blood vessel formation, and followed this withmultivariate analysis to detect similarities. A graphic repre-sentation of the relative gene expression levels in the 4 cellsubsets is shown in Fig. 1C, along with the results of hierar-chical clustering linkage (HCL). This analysis indicated that the2 Nrp1þ cell populations were more closely clustered accord-ing to the gene panel analyzed. At the same time, this geneexpression analysis also indicated that the 4 cell subsetspossessed distinct expression signatures.
Comparative flow cytometric characterization of NEMsand of the other purified cell populations according tovarious cell surface antigens is shown in Fig. 1D. The CCR2antigen showed a different pattern of expression in the 4 cellsubsets. Most of the Gr1þ cells expressed this receptor,however at relatively low levels; in contrast, expression wasmore variable in the Gr1� subset (NEMs). The CD11cadhesion molecule was expressed at low levels, in both theGr1þ and the Nrp1� Gr1� subsets, whereas NEMs showed abimodal distribution with about 60% of these cells expres-sing this antigen. Moreover, approximately 30% of NEMsexpressed variable levels of MHC class II, whereas thesemolecules were absent from most of the other Nrp1þ andNrp1� cells. Finally, most NEMs were negative for integrina2 (CD49b), which instead showed a bimodal distribution inGr1� Nrp1� cells. Supplementary Fig. S1 shows quantifi-cation of 4 independent experiments.
NEMs were further characterized for the expression of anumber of other cell surface antigens (Supplementary Fig. S2).These cells were positive for the panleukocytic antigen CD45and for the FcgRIII receptor CD16, but negative for B220(expressed by B cells and plasmacytoid dendritic cells) andfor Ly6C (which is also seen by the Gr1 antibody used forsorting). The cells were also negative for the IL-2 receptor achain (CD25), which is usually present on activated T and Bcells and is considered a marker of classical monocyte acti-vation. NEMs were clearly negative for the Tie2 angiopoietinreceptor (5). Finally, both types of Nrp1þ cells produced plexinA1, A3, B2, B3, C1, and D1; plexins A1, A3, and B2 were
NEMs Induce Tumor Vessel Stabilization
www.aacrjournals.org Cancer Res; 72(24) December 15, 2012 OF3
American Association for Cancer Research Copyright © 2012 on December 11, 2012cancerres.aacrjournals.orgDownloaded from
Published OnlineFirst on December 7, 2012; DOI:10.1158/0008-5472.CAN-12-0762
differentially expressed in Gr1þ and Gr1� cells (Supplemen-tary Fig. S3).
Taken together, these results define NEMs as a subset ofGr1�, bone marrow–resident monocytes specifically charac-terized by the expression of the Nrp1 receptor.
Bone marrow NEMs exert antitumor activityWe moved on to assess the effect of NEMs on established
tumors. Mice (n¼ 10 per group) were subcutaneously injectedwith B16.F10 tumor cells and, at days 11 (when tumors becamepalpable) and 13 after inoculation, the tumors were inoculatedwith bone marrow–purified NEMs (CD11bþ Gr1� Nrp1þcells), CD11bþ Gr1þ Nrp1þ cells (cells labeled in green andcyan in Fig. 1, respectively), or PBS. We decided to use theCD11bþ Gr1þ Nrp1þ cells (hereafter named Gr1þ) as acontrol as these represent a subset of inflammatorymonocytesrelatively similar to NEMs, but unresponsive to Sema3A (Figs.1C and B, respectively).
Cells (2� 105 cells/tumor/injection; n¼ 10) or PBS (100 mL)were delivered directly into the tumor mass. NEM injectiondetermined a significant reduction in tumor growth (tumorvolume at 15 days: 469� 84 in the NEM group vs. 1169� 229 inthe Gr1þ group vs. 806 � 127 in the PBS-injected mice,expressed as percentage of pretreatment tumor size; P <0.01; Fig. 2A). This effect was not consequent to the directinhibition of tumor cell proliferation, as the coculture ofpurified NEMs or Gr1þ cells together with B16.F10 cells didnot affect tumor cell proliferation (Fig. 2B).
A comparably powerful antitumor activity was observedin a more aggressive, highly metastatic model of tumorxenograft, obtained by subcutaneous injection of 4T1 cellsin Balb/c mice (n ¼ 10 per group). Bone marrow NEMs,Gr1þ cells, or PBS were administered twice (2 � 105 cells/tumor/injection) directly into the growing tumor masses.Again, NEMs inhibited tumor growth (tumor volume at 18days: 512 � 94 in the NEM-injected group vs. 1348 � 776 in
Figure 1. Isolation and characterization of NEMs from the bone marrow. A, sorting of bone marrow NEMs. a, morphological gating of lymphocytes andmonocytes; b, gating of CD11bþ cells (on cells gated in a); c, gating for Gr1 expression (on cells gated in b); d, cells analyzed for Nrp1 expression(on Gr1� population in c); e, cells analyzed for Nrp1 expression (on Gr1þ population in c); f, schematic representation of the 4 monocyte subpopulations.Percentages are referred to total bone marrow cells. B, migration assay with the sorted populations; color code as in A, f. FBS was a positive control(mean� SEM; ��, P < 0.01 over control). C, HCL on gene expression data from the 4 sorted cell populations. Data were internally normalized using the meancentering method, according to which the mean value of a column (gene expression values of a given gene among samples) is equal to 0. Green, lowexpression; red, high expression. D, flow cytometric analysis of the 4 sorted cell populations using the indicated phycoerythrin-conjugated antibodies.Percentages of positive cells (horizontal bars) relative to total cells are reported.
Carrer et al.
Cancer Res; 72(24) December 15, 2012 Cancer ResearchOF4
American Association for Cancer Research Copyright © 2012 on December 11, 2012cancerres.aacrjournals.orgDownloaded from
Published OnlineFirst on December 7, 2012; DOI:10.1158/0008-5472.CAN-12-0762
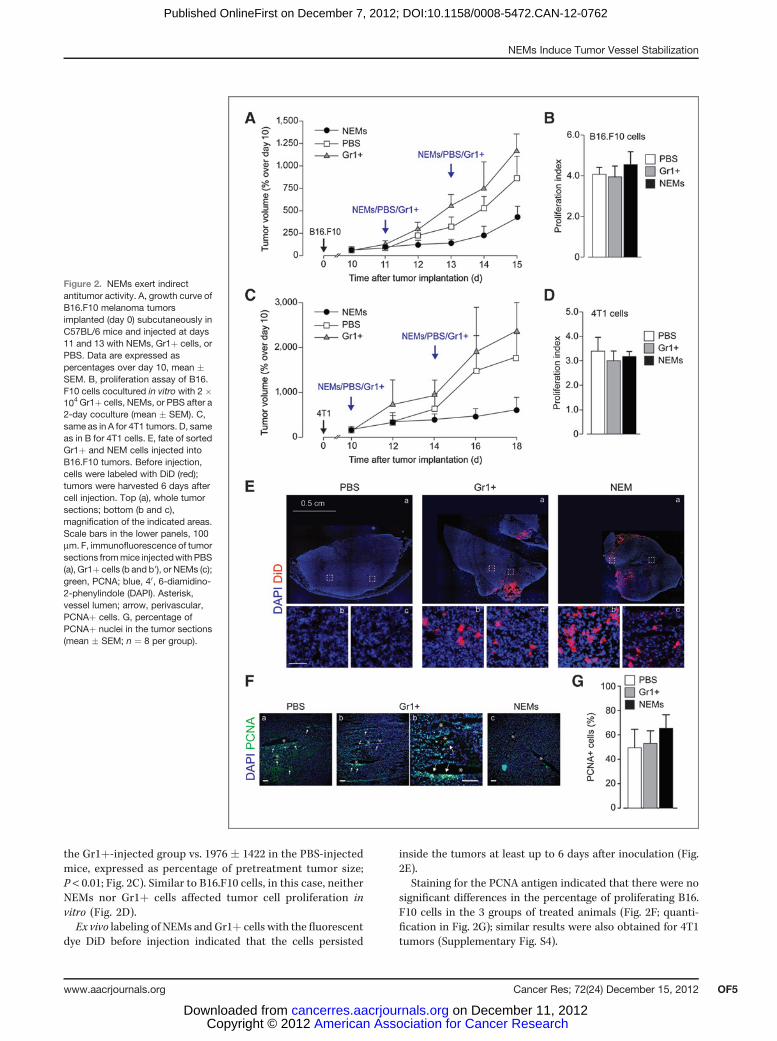
the Gr1þ-injected group vs. 1976 � 1422 in the PBS-injectedmice, expressed as percentage of pretreatment tumor size;P < 0.01; Fig. 2C). Similar to B16.F10 cells, in this case, neitherNEMs nor Gr1þ cells affected tumor cell proliferation invitro (Fig. 2D).Ex vivo labeling of NEMs and Gr1þ cells with the fluorescent
dye DiD before injection indicated that the cells persisted
inside the tumors at least up to 6 days after inoculation (Fig.2E).
Staining for the PCNA antigen indicated that there were nosignificant differences in the percentage of proliferating B16.F10 cells in the 3 groups of treated animals (Fig. 2F; quanti-fication in Fig. 2G); similar results were also obtained for 4T1tumors (Supplementary Fig. S4).
Figure 2. NEMs exert indirectantitumor activity. A, growth curve ofB16.F10 melanoma tumorsimplanted (day 0) subcutaneously inC57BL/6 mice and injected at days11 and 13 with NEMs, Gr1þ cells, orPBS. Data are expressed aspercentages over day 10, mean �SEM. B, proliferation assay of B16.F10 cells cocultured in vitro with 2 �104 Gr1þ cells, NEMs, or PBS after a2-day coculture (mean � SEM). C,same as in A for 4T1 tumors. D, sameas in B for 4T1 cells. E, fate of sortedGr1þ and NEM cells injected intoB16.F10 tumors. Before injection,cells were labeled with DiD (red);tumors were harvested 6 days aftercell injection. Top (a), whole tumorsections; bottom (b and c),magnification of the indicated areas.Scale bars in the lower panels, 100mm. F, immunofluorescence of tumorsections frommice injectedwith PBS(a), Gr1þ cells (b and b'), or NEMs (c);green, PCNA; blue, 40, 6-diamidino-2-phenylindole (DAPI). Asterisk,vessel lumen; arrow, perivascular,PCNAþ cells. G, percentage ofPCNAþ nuclei in the tumor sections(mean � SEM; n ¼ 8 per group).
NEMs Induce Tumor Vessel Stabilization
www.aacrjournals.org Cancer Res; 72(24) December 15, 2012 OF5
American Association for Cancer Research Copyright © 2012 on December 11, 2012cancerres.aacrjournals.orgDownloaded from
Published OnlineFirst on December 7, 2012; DOI:10.1158/0008-5472.CAN-12-0762
Together, these results are consistent with the conclusionthat NEMs markedly inhibit tumor growth when injectedintratumorally, albeit not directly affecting tumor cellproliferation.
NEMs promote tumor vessel stabilizationThe numerous clusters of PCNAþ cells detected in corre-
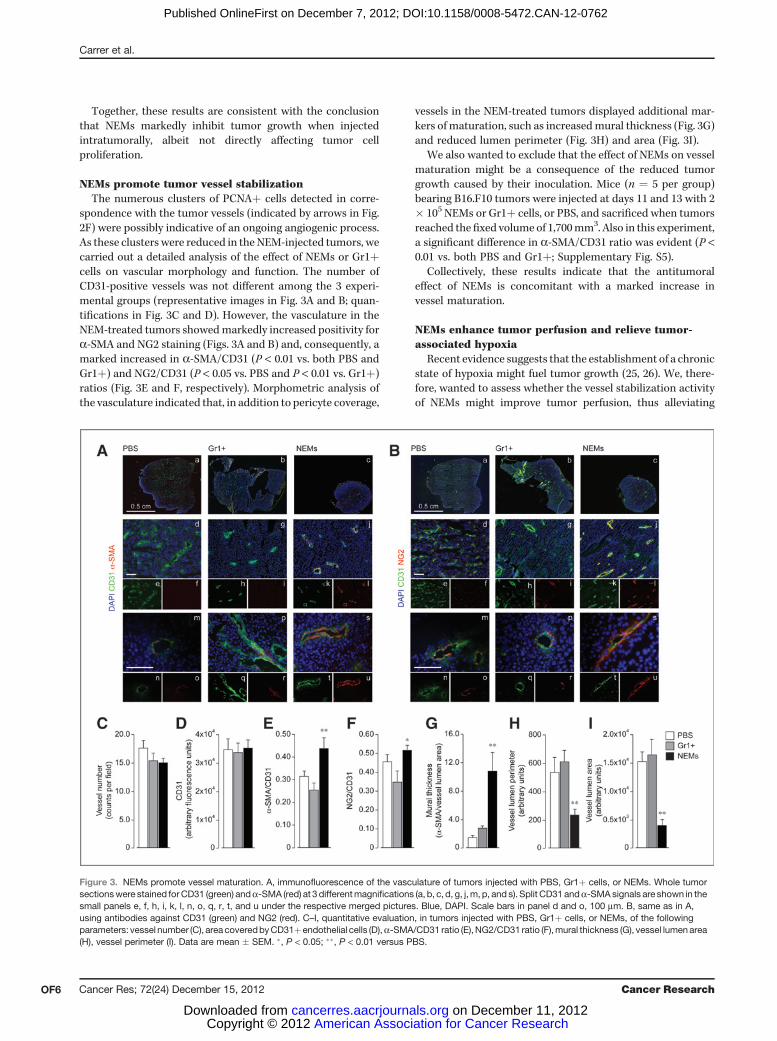
spondence with the tumor vessels (indicated by arrows in Fig.2F) were possibly indicative of an ongoing angiogenic process.As these clusters were reduced in the NEM-injected tumors, wecarried out a detailed analysis of the effect of NEMs or Gr1þcells on vascular morphology and function. The number ofCD31-positive vessels was not different among the 3 experi-mental groups (representative images in Fig. 3A and B; quan-tifications in Fig. 3C and D). However, the vasculature in theNEM-treated tumors showedmarkedly increased positivity fora-SMA and NG2 staining (Figs. 3A and B) and, consequently, amarked increased in a-SMA/CD31 (P < 0.01 vs. both PBS andGr1þ) and NG2/CD31 (P < 0.05 vs. PBS and P < 0.01 vs. Gr1þ)ratios (Fig. 3E and F, respectively). Morphometric analysis ofthe vasculature indicated that, in addition to pericyte coverage,
vessels in the NEM-treated tumors displayed additional mar-kers of maturation, such as increasedmural thickness (Fig. 3G)and reduced lumen perimeter (Fig. 3H) and area (Fig. 3I).
We also wanted to exclude that the effect of NEMs on vesselmaturation might be a consequence of the reduced tumorgrowth caused by their inoculation. Mice (n ¼ 5 per group)bearing B16.F10 tumors were injected at days 11 and 13 with 2� 105 NEMs or Gr1þ cells, or PBS, and sacrificed when tumorsreached thefixed volume of 1,700mm3. Also in this experiment,a significant difference in a-SMA/CD31 ratio was evident (P <0.01 vs. both PBS and Gr1þ; Supplementary Fig. S5).
Collectively, these results indicate that the antitumoraleffect of NEMs is concomitant with a marked increase invessel maturation.
NEMs enhance tumor perfusion and relieve tumor-associated hypoxia
Recent evidence suggests that the establishment of a chronicstate of hypoxia might fuel tumor growth (25, 26). We, there-fore, wanted to assess whether the vessel stabilization activityof NEMs might improve tumor perfusion, thus alleviating
Figure 3. NEMs promote vessel maturation. A, immunofluorescence of the vasculature of tumors injected with PBS, Gr1þ cells, or NEMs. Whole tumorsectionswere stained for CD31 (green) anda-SMA (red) at 3 differentmagnifications (a, b, c, d, g, j,m, p, and s). Split CD31 anda-SMA signals are shown in thesmall panels e, f, h, i, k, l, n, o, q, r, t, and u under the respective merged pictures. Blue, DAPI. Scale bars in panel d and o, 100 mm. B, same as in A,using antibodies against CD31 (green) and NG2 (red). C–I, quantitative evaluation, in tumors injected with PBS, Gr1þ cells, or NEMs, of the followingparameters: vessel number (C), area coveredbyCD31þendothelial cells (D),a-SMA/CD31 ratio (E),NG2/CD31 ratio (F),mural thickness (G), vessel lumenarea(H), vessel perimeter (I). Data are mean � SEM. �, P < 0.05; ��, P < 0.01 versus PBS.
Carrer et al.
Cancer Res; 72(24) December 15, 2012 Cancer ResearchOF6
American Association for Cancer Research Copyright © 2012 on December 11, 2012cancerres.aacrjournals.orgDownloaded from
Published OnlineFirst on December 7, 2012; DOI:10.1158/0008-5472.CAN-12-0762
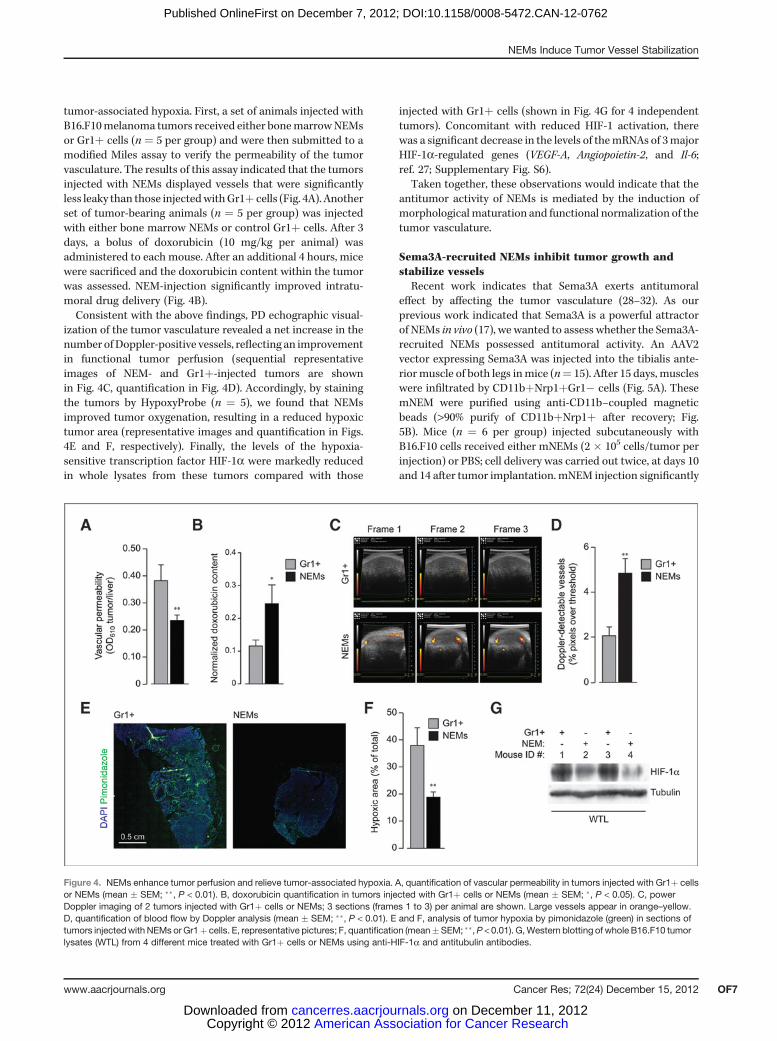
tumor-associated hypoxia. First, a set of animals injected withB16.F10melanoma tumors received either bonemarrowNEMsor Gr1þ cells (n ¼ 5 per group) and were then submitted to amodified Miles assay to verify the permeability of the tumorvasculature. The results of this assay indicated that the tumorsinjected with NEMs displayed vessels that were significantlyless leaky than those injectedwithGr1þ cells (Fig. 4A). Anotherset of tumor-bearing animals (n ¼ 5 per group) was injectedwith either bone marrow NEMs or control Gr1þ cells. After 3days, a bolus of doxorubicin (10 mg/kg per animal) wasadministered to each mouse. After an additional 4 hours, micewere sacrificed and the doxorubicin content within the tumorwas assessed. NEM-injection significantly improved intratu-moral drug delivery (Fig. 4B).Consistent with the above findings, PD echographic visual-
ization of the tumor vasculature revealed a net increase in thenumber ofDoppler-positive vessels, reflecting an improvementin functional tumor perfusion (sequential representativeimages of NEM- and Gr1þ-injected tumors are shownin Fig. 4C, quantification in Fig. 4D). Accordingly, by stainingthe tumors by HypoxyProbe (n ¼ 5), we found that NEMsimproved tumor oxygenation, resulting in a reduced hypoxictumor area (representative images and quantification in Figs.4E and F, respectively). Finally, the levels of the hypoxia-sensitive transcription factor HIF-1a were markedly reducedin whole lysates from these tumors compared with those
injected with Gr1þ cells (shown in Fig. 4G for 4 independenttumors). Concomitant with reduced HIF-1 activation, therewas a significant decrease in the levels of themRNAs of 3majorHIF-1a-regulated genes (VEGF-A, Angiopoietin-2, and Il-6;ref. 27; Supplementary Fig. S6).
Taken together, these observations would indicate that theantitumor activity of NEMs is mediated by the induction ofmorphologicalmaturation and functional normalization of thetumor vasculature.
Sema3A-recruited NEMs inhibit tumor growth andstabilize vessels
Recent work indicates that Sema3A exerts antitumoraleffect by affecting the tumor vasculature (28–32). As ourprevious work indicated that Sema3A is a powerful attractorof NEMs in vivo (17), we wanted to assess whether the Sema3A-recruited NEMs possessed antitumoral activity. An AAV2vector expressing Sema3A was injected into the tibialis ante-rior muscle of both legs inmice (n¼ 15). After 15 days, muscleswere infiltrated by CD11bþNrp1þGr1� cells (Fig. 5A). ThesemNEM were purified using anti-CD11b–coupled magneticbeads (>90% purify of CD11bþNrp1þ after recovery; Fig.5B). Mice (n ¼ 6 per group) injected subcutaneously withB16.F10 cells received either mNEMs (2 � 105 cells/tumor perinjection) or PBS; cell delivery was carried out twice, at days 10and 14 after tumor implantation. mNEM injection significantly
Figure 4. NEMs enhance tumor perfusion and relieve tumor-associated hypoxia. A, quantification of vascular permeability in tumors injected with Gr1þ cellsor NEMs (mean � SEM; ��, P < 0.01). B, doxorubicin quantification in tumors injected with Gr1þ cells or NEMs (mean � SEM; �, P < 0.05). C, powerDoppler imaging of 2 tumors injected with Gr1þ cells or NEMs; 3 sections (frames 1 to 3) per animal are shown. Large vessels appear in orange–yellow.D, quantification of blood flow by Doppler analysis (mean � SEM; ��, P < 0.01). E and F, analysis of tumor hypoxia by pimonidazole (green) in sections oftumors injectedwith NEMs orGr1þ cells. E, representative pictures; F, quantification (mean�SEM; ��,P < 0.01). G,Western blotting of whole B16.F10 tumorlysates (WTL) from 4 different mice treated with Gr1þ cells or NEMs using anti-HIF-1a and antitubulin antibodies.
NEMs Induce Tumor Vessel Stabilization
www.aacrjournals.org Cancer Res; 72(24) December 15, 2012 OF7
American Association for Cancer Research Copyright © 2012 on December 11, 2012cancerres.aacrjournals.orgDownloaded from
Published OnlineFirst on December 7, 2012; DOI:10.1158/0008-5472.CAN-12-0762
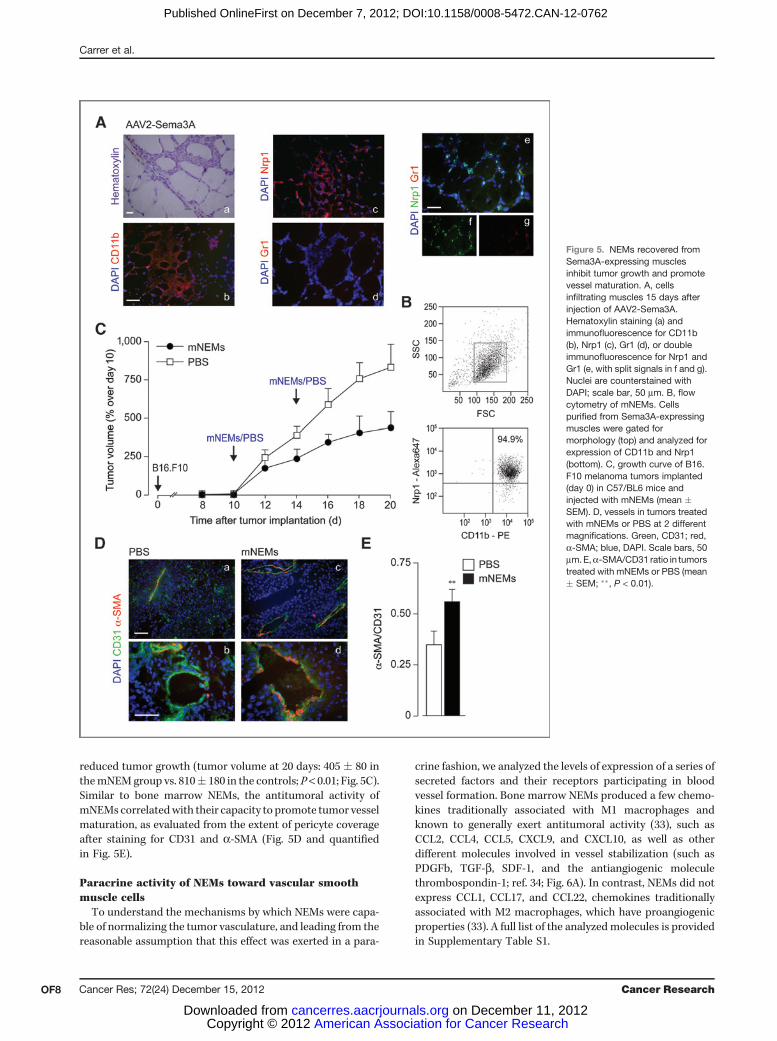
reduced tumor growth (tumor volume at 20 days: 405 � 80 inthemNEMgroup vs. 810� 180 in the controls; P< 0.01; Fig. 5C).Similar to bone marrow NEMs, the antitumoral activity ofmNEMs correlatedwith their capacity to promote tumor vesselmaturation, as evaluated from the extent of pericyte coverageafter staining for CD31 and a-SMA (Fig. 5D and quantifiedin Fig. 5E).
Paracrine activity of NEMs toward vascular smoothmuscle cells
To understand the mechanisms by which NEMs were capa-ble of normalizing the tumor vasculature, and leading from thereasonable assumption that this effect was exerted in a para-
crine fashion, we analyzed the levels of expression of a series ofsecreted factors and their receptors participating in bloodvessel formation. Bone marrow NEMs produced a few chemo-kines traditionally associated with M1 macrophages andknown to generally exert antitumoral activity (33), such asCCL2, CCL4, CCL5, CXCL9, and CXCL10, as well as otherdifferent molecules involved in vessel stabilization (such asPDGFb, TGF-b, SDF-1, and the antiangiogenic moleculethrombospondin-1; ref. 34; Fig. 6A). In contrast, NEMs did notexpress CCL1, CCL17, and CCL22, chemokines traditionallyassociated with M2 macrophages, which have proangiogenicproperties (33). A full list of the analyzedmolecules is providedin Supplementary Table S1.
Figure 5. NEMs recovered fromSema3A-expressing musclesinhibit tumor growth and promotevessel maturation. A, cellsinfiltrating muscles 15 days afterinjection of AAV2-Sema3A.Hematoxylin staining (a) andimmunofluorescence for CD11b(b), Nrp1 (c), Gr1 (d), or doubleimmunofluorescence for Nrp1 andGr1 (e, with split signals in f and g).Nuclei are counterstained withDAPI; scale bar, 50 mm. B, flowcytometry of mNEMs. Cellspurified from Sema3A-expressingmuscles were gated formorphology (top) and analyzed forexpression of CD11b and Nrp1(bottom). C, growth curve of B16.F10 melanoma tumors implanted(day 0) in C57/BL6 mice andinjected with mNEMs (mean �SEM). D, vessels in tumors treatedwith mNEMs or PBS at 2 differentmagnifications. Green, CD31; red,a-SMA; blue, DAPI. Scale bars, 50mm.E,a-SMA/CD31 ratio in tumorstreated with mNEMs or PBS (mean� SEM; ��, P < 0.01).
Carrer et al.
Cancer Res; 72(24) December 15, 2012 Cancer ResearchOF8
American Association for Cancer Research Copyright © 2012 on December 11, 2012cancerres.aacrjournals.orgDownloaded from
Published OnlineFirst on December 7, 2012; DOI:10.1158/0008-5472.CAN-12-0762
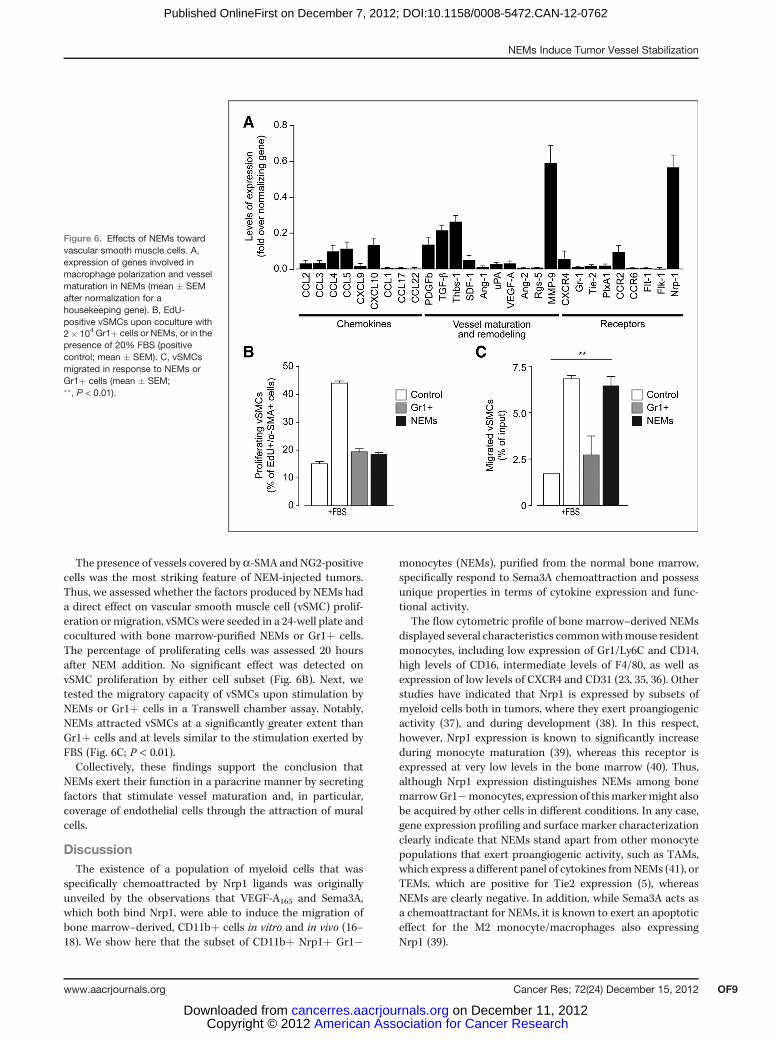
The presence of vessels covered bya-SMA and NG2-positivecells was the most striking feature of NEM-injected tumors.Thus, we assessed whether the factors produced by NEMs hada direct effect on vascular smooth muscle cell (vSMC) prolif-eration ormigration. vSMCs were seeded in a 24-well plate andcocultured with bone marrow-purified NEMs or Gr1þ cells.The percentage of proliferating cells was assessed 20 hoursafter NEM addition. No significant effect was detected onvSMC proliferation by either cell subset (Fig. 6B). Next, wetested the migratory capacity of vSMCs upon stimulation byNEMs or Gr1þ cells in a Transwell chamber assay. Notably,NEMs attracted vSMCs at a significantly greater extent thanGr1þ cells and at levels similar to the stimulation exerted byFBS (Fig. 6C; P < 0.01).Collectively, these findings support the conclusion that
NEMs exert their function in a paracrine manner by secretingfactors that stimulate vessel maturation and, in particular,coverage of endothelial cells through the attraction of muralcells.
DiscussionThe existence of a population of myeloid cells that was
specifically chemoattracted by Nrp1 ligands was originallyunveiled by the observations that VEGF-A165 and Sema3A,which both bind Nrp1, were able to induce the migration ofbone marrow–derived, CD11bþ cells in vitro and in vivo (16–18). We show here that the subset of CD11bþ Nrp1þ Gr1�
monocytes (NEMs), purified from the normal bone marrow,specifically respond to Sema3A chemoattraction and possessunique properties in terms of cytokine expression and func-tional activity.
The flow cytometric profile of bone marrow–derived NEMsdisplayed several characteristics commonwithmouse residentmonocytes, including low expression of Gr1/Ly6C and CD14,high levels of CD16, intermediate levels of F4/80, as well asexpression of low levels of CXCR4 and CD31 (23, 35, 36). Otherstudies have indicated that Nrp1 is expressed by subsets ofmyeloid cells both in tumors, where they exert proangiogenicactivity (37), and during development (38). In this respect,however, Nrp1 expression is known to significantly increaseduring monocyte maturation (39), whereas this receptor isexpressed at very low levels in the bone marrow (40). Thus,although Nrp1 expression distinguishes NEMs among bonemarrowGr1�monocytes, expression of thismarkermight alsobe acquired by other cells in different conditions. In any case,gene expression profiling and surface marker characterizationclearly indicate that NEMs stand apart from other monocytepopulations that exert proangiogenic activity, such as TAMs,which express a different panel of cytokines fromNEMs (41), orTEMs, which are positive for Tie2 expression (5), whereasNEMs are clearly negative. In addition, while Sema3A acts asa chemoattractant for NEMs, it is known to exert an apoptoticeffect for the M2 monocyte/macrophages also expressingNrp1 (39).
Figure 6. Effects of NEMs towardvascular smooth muscle cells. A,expression of genes involved inmacrophage polarization and vesselmaturation in NEMs (mean � SEMafter normalization for ahousekeeping gene). B, EdU-positive vSMCs upon coculture with2� 104 Gr1þ cells or NEMs, or in thepresence of 20% FBS (positivecontrol; mean � SEM). C, vSMCsmigrated in response to NEMs orGr1þ cells (mean � SEM;��, P < 0.01).
NEMs Induce Tumor Vessel Stabilization
www.aacrjournals.org Cancer Res; 72(24) December 15, 2012 OF9
American Association for Cancer Research Copyright © 2012 on December 11, 2012cancerres.aacrjournals.orgDownloaded from
Published OnlineFirst on December 7, 2012; DOI:10.1158/0008-5472.CAN-12-0762
Among the bone marrow Nrp1þmonocytes, only the Gr1�fraction (NEMs) was able to migrate in response to Sema3A;this is consistent with the observation that all the cells infil-trating the muscle overexpressing Sema3A were Gr1�. AfterSema3A stimulation, Nrp1 signals through heterodimerizationwith 1 of the 4 type A plexins, which serve as signal-transducingelements (42, 43). Gene expression analysis indicated that thelevels of plexin A1 and A3 were higher in NEMs compared withGr1þ cells, possibly suggesting that these 2 receptors areinvolved in the response to Sema3A. Further experiments areclearly required to verify this possibility.
Once inoculated in vivo, NEMs persisted in the injectedtumors and markedly inhibited tumor growth in the 2 inves-tigated tumor models. These cells were found to expressseveral factors involved in vessel maturation (includingPDGFb, TGF-b, and thrombospondin; ref. 44). The vasculatureof the tumors injected with NEMs showed increased pericytecoverage and mural thickness, more regular shape, reducedleakiness, and, most importantly, improved function. This isalso consistent with the observation that NEMs selectivelyproduced factors able to chemoattract vSMCs. In vivo, theultimate outcome of these effects was the improvement oftumor mass perfusion and reduction of tumor hypoxia, whichis a major determinant of tumor progression (13). Thesemorphological and functional parameters fit the concept ofvessel normalization, as originally put forward as a goal toimprove blood supply and enhance delivery of chemothera-peutic drugs by low-dose antiangiogenic agents (14, 45).
We and others have shown that Sema3A functions as potentantiangiogenic factors and inhibits tumor development (28–32). In particular, the ectopic delivery of an AAV vectorexpressing Sema3A into RipTag2 mice significantly reducedvascular density and branching, inhibited tumor growth andmetastasis, and substantially extended survival (28, 29). Con-sistentwith the possibility that the recruitment ofNEMsmight,at least in part, be responsible for the effects of Sema3A, wefound that the cells recruited by Sema3A in vivo actuallyexerted significant antitumoral activity. Thus, although noevidence exists at this moment to show that NEMs might playa physiological role during normal tumor development, theymight mediate the effects of Sema3A treatment on tumor
growth. In line with this concept, bone marrow NEM inoc-ulation can be conceived as an experimental treatment ableto normalize the tumor vasculature. The vascular phenotypeobtained by the inoculation of NEMs, at least in the inves-tigated tumor models, resembles that observed through avariety of genetic approaches, including the depletion ofendothelial HIF-1a (27), the overexpression of the histidinerich glycoprotein to skew the TAM response toward anM1 phenotype (25), or the haploinsuffiency of endothelialPHD2 (46). In addition, vascular normalization was observedupon administration of anti-PlGF antibodies (26). All theseconditions are known to improve tumor oxygenation andlessen tumor malignancy and invasiveness.
Disclosure of Potential Conflicts of InterestNo potential conflicts of interest were disclosed.
Authors' ContributionsConception and design: A. Carrer, S. Moimas, S. Zacchigna, G. Serini,E. Giraudo, F. Bussolino, M. GiaccaDevelopment of methodology: A. Carrer, S. Moimas, S. Zacchigna, M.SinigagliaAcquisition of data: S. Moimas, L. Pattarini, L. Zentilin, G. Ruozi, M. Mano,M. SinigagliaAnalysis and interpretation of data (e.g., statistical analysis, biostatistics,computational analysis): A. Carrer, S. Moimas, S. ZacchignaWriting, review, and/or revision of the manuscript: A. Carrer, S. Moimas,G. Serini, E. Giraudo, F. Bussolino, M. GiaccaAdministrative, technical, or material support (i.e., reporting or orga-nizing data, constructing databases): F. MaioneStudy supervision: S. Zacchigna, M. Giacca
AcknowledgmentsThe authors thankMauro Sturnega for assistance in animal experimentation,
Paolo Maiuri for immunofluorescence analysis, and Suzanne Kerbavcic foreditorial work.
Grant SupportFinancial support for this work was provided by grants from the "Fondazione
CR Trieste," Trieste, Italy, the FIRB RBAP11Z4Z9 project, and the EuropeanResearch Council (ERC) Advanced Grant 250124 FunSel to M. Giacca, and theAssociazione Italiana per la Ricerca sul Cancro (AIRC) to S. Zacchigna, G. Serini,E. Giraudo, and F. Bussolino.
The costs of publication of this article were defrayed in part by the payment ofpage charges. This article must therefore be hereby marked advertisement inaccordance with 18 U.S.C. Section 1734 solely to indicate this fact.
Received February 28, 2012; revised September 5, 2012; accepted September 5,2012; published OnlineFirst December 7, 2012.
References1. MurdochC,MuthanaM,Coffelt SB, LewisCE. The role ofmyeloid cells
in the promotion of tumour angiogenesis. Nat RevCancer 2008;8:618–31.
2. Papaspyridonos M, Lyden D. Chapter 11. The role of bone marrow-derived cells in tumor angiogenesis and metastatic progression.Methods Enzymol 2008;444:255–69.
3. Shojaei F, Zhong C, Wu X, Yu L, Ferrara N. Role of myeloid cells intumor angiogenesis and growth. Trends Cell Biol 2008;18:372–8.
4. Mantovani A, Sozzani S, Locati M, Allavena P, Sica A. Macrophagepolarization: tumor-associated macrophages as a paradigm forpolarized M2 mononuclear phagocytes. Trends Immunol 2002;23:549–55.
5. De Palma M, Venneri MA, Galli R, Sergi Sergi L, Politi LS, SampaolesiM, et al. Tie2 identifies a hematopoietic lineage of proangiogenicmonocytes required for tumor vessel formation and a mesenchymalpopulation of pericyte progenitors. Cancer Cell 2005;8:211–26.
6. Shojaei F, Wu X, Malik AK, Zhong C, Baldwin ME, Schanz S, et al.Tumor refractoriness to anti-VEGF treatment is mediated byCD11bþGr1þ myeloid cells. Nat Biotechnol 2007;25:911–20.
7. Fridlender ZG, Sun J, Kim S, Kapoor V, Cheng G, Ling L, et al.Polarization of tumor-associated neutrophil phenotype by TGF-beta:"N1" versus "N2" TAN. Cancer Cell 2009;16:183–94.
8. Gao D, Mittal V. The role of bone-marrow-derived cells in tumorgrowth, metastasis initiation and progression. Trends Mol Med2009;15:333–43.
9. Loges S, Schmidt T, Carmeliet P. "Antimyeloangiogenic" therapy forcancer by inhibiting PlGF. Clin Cancer Res 2009;15:3648–53.
10. Stockmann C, Doedens A, Weidemann A, Zhang N, Takeda N, Green-berg JI, et al. Deletion of vascular endothelial growth factor in myeloidcells accelerates tumorigenesis. Nature 2008;456:814–8.
11. Carmeliet P. Angiogenesis in life, disease and medicine. Nature2005;438:932–6.
Carrer et al.
Cancer Res; 72(24) December 15, 2012 Cancer ResearchOF10
American Association for Cancer Research Copyright © 2012 on December 11, 2012cancerres.aacrjournals.orgDownloaded from
Published OnlineFirst on December 7, 2012; DOI:10.1158/0008-5472.CAN-12-0762
12. McDonaldDM,ChoykePL. Imaging of angiogenesis: frommicroscopeto clinic. Nat Med 2003;9:713–25.
13. Wilson WR, Hay MP. Targeting hypoxia in cancer therapy. Nat RevCancer 2011;11:393–410.
14. Jain RK. Normalization of tumor vasculature: an emerging concept inantiangiogenic therapy. Science 2005;307:58–62.
15. Carmeliet P, Jain RK. Principles and mechanisms of vessel normal-ization for cancer and other angiogenic diseases. Nat Rev Drug Discov2011;10:417–27.
16. Grunewald M, Avraham I, Dor Y, Bachar-Lustig E, Itin A, Yung S, et al.VEGF-induced adult neovascularization: recruitment, retention, androle of accessory cells. Cell 2006;124:175–89.
17. Zacchigna S, Pattarini L, Zentilin L, Moimas S, Carrer A, Sinigaglia M,et al. Bone marrow cells recruited through the neuropilin-1 receptorpromote arterial formation at the sites of adult neoangiogenesis. J ClinInvest 2008;118:2062–75.
18. Zentilin L, TafuroS, ZacchignaS,ArsicN, Pattarini L, SinigagliaM, et al.Bone marrow mononuclear cells are recruited to the sites of VEGF-induced neovascularization but are not incorporated into the newlyformed vessels. Blood 2006;107:3546–54.
19. Tomayko MM, Reynolds CP. Determination of subcutaneous tumorsize in athymic (nude) mice. Cancer Chemother Pharmacol 1989;24:148–54.
20. Laginha KM, Verwoert S, Charrois GJ, Allen TM. Determination ofdoxorubicin levels in whole tumor and tumor nuclei in murine breastcancer tumors. Clin Cancer Res 2005;11:6944–9.
21. Sturn A, Quackenbush J, Trajanoski Z. Genesis: cluster analysis ofmicroarray data. Bioinformatics 2002;18:207–8.
22. Ingersoll MA, Spanbroek R, Lottaz C, Gautier EL, Frankenberger M,Hoffmann R, et al. Comparison of gene expression profiles betweenhuman and mouse monocyte subsets. Blood 2010;115:e10–9.
23. Auffray C, Sieweke MH, Geissmann F. Blood monocytes: develop-ment, heterogeneity, and relationship with dendritic cells. Annu RevImmunol 2009;27:669–92.
24. Geissmann F, Manz MG, Jung S, Sieweke MH, Merad M, Ley K.Development of monocytes, macrophages, and dendritic cells. Sci-ence 2010;327:656–61.
25. Rolny C, MazzoneM, Tugues S, Laoui D, Johansson I, Coulon C, et al.HRG inhibits tumor growth and metastasis by inducing macrophagepolarization and vessel normalization through downregulation of PlGF.Cancer Cell 2011;19:31–44.
26. Fischer C, Jonckx B, Mazzone M, Zacchigna S, Loges S, Pattarini L,et al. Anti-PlGF inhibits growth of VEGF(R)-inhibitor-resistant tumorswithout affecting healthy vessels. Cell 2007;131:463–75.
27. Keith B, Johnson RS, Simon MC. HIF1alpha and HIF2alpha: siblingrivalry in hypoxic tumour growth and progression. Nat Rev Cancer2012;12:9–22.
28. Maione F, Molla F, Meda C, Latini R, Zentilin L, Giacca M, et al.Semaphorin 3A is an endogenous angiogenesis inhibitor that blockstumor growth and normalizes tumor vasculature in transgenic mousemodels. J Clin Invest 2009;119:3356–72.
29. Maione F, Capano S, Regano D, Zentilin L, Giacca M, Casanovas O,et al. Semaphorin 3A overcomes cancer hypoxia and metastaticdissemination induced by antiangiogenic treatment in mice. J ClinInvest 2012;122:1832–48.
30. Casazza A, Fu X, Johansson I, Capparuccia L, Andersson F, Gius-tacchini A, et al. Systemic and targeted delivery of semaphorin 3Ainhibits tumor angiogenesis and progression in mouse tumor models.Arterioscler Thromb Vasc Biol 2011;31:741–9.
31. Acevedo LM, Barillas S, Weis SM, Gothert JR, Cheresh DA. Sema-phorin 3A suppresses VEGF-mediated angiogenesis yet acts as avascular permeability factor. Blood 2008;111:2674–80.
32. Kigel B, Varshavsky A, Kessler O, Neufeld G. Successful inhibition oftumor development by specific class-3 semaphorins is associatedwith expression of appropriate semaphorin receptors by tumor cells.PLoS One 2008;3:e3287.
33. Mantovani A, Sozzani S, Locati M, Schioppa T, Saccani A, Allavena P,et al. Infiltration of tumours by macrophages and dendritic cells:tumour-associated macrophages as a paradigm for polarized M2mononuclear phagocytes. Novartis Found Symp 2004;256:137–45;discussion 46–8, 259–69.
34. Carmeliet P, Jain RK. Angiogenesis in cancer and other diseases.Nature 2000;407:249–57.
35. Geissmann F, Jung S, Littman DR. Blood monocytes consist of twoprincipal subsets with distinct migratory properties. Immunity2003;19:71–82.
36. Saha P, Geissmann F. Toward a functional characterization of bloodmonocytes. Immunol Cell Biol 2010;89:2–4.
37. Pucci F, Venneri MA, Biziato D, Nonis A, Moi D, Sica A, et al. Adistinguishing gene signature shared by tumor-infiltrating Tie2-expressing monocytes, blood "resident" monocytes, and embryonicmacrophages suggests common functions and developmental rela-tionships. Blood 2009;114:901–14.
38. Fantin A, Vieira JM, Gestri G, Denti L, Schwarz Q, Prykhozhij S, et al.Tissue macrophages act as cellular chaperones for vascular anasto-mosis downstream of VEGF-mediated endothelial tip cell induction.Blood 2010;116:829–40.
39. Ji JD, Park-Min KH, Ivashkiv LB. Expression and function of sema-phorin 3A and its receptors in human monocyte-derived macro-phages. Hum Immunol 2009;70:211–7.
40. Karjalainen K, Jaalouk DE, Bueso-Ramos CE, Zurita AJ, Kuniyasu A,Eckhardt BL, et al. Targeting neuropilin-1 in human leukemia andlymphoma. Blood 2011;117:920–7.
41. Sica A, Larghi P, Mancino A, Rubino L, Porta C, Totaro MG, et al.Macrophage polarization in tumour progression. Semin Cancer Biol2008;18:349–55.
42. Neufeld G, Kessler O. The semaphorins: versatile regulators of tumourprogression and tumour angiogenesis. Nat Rev Cancer 2008;8:632–45.
43. Gaur P, Bielenberg DR, Samuel S, BoseD, Zhou Y, GrayMJ, et al. Roleof class 3 semaphorins and their receptors in tumor growth andangiogenesis. Clin Cancer Res 2009;15:6763–70.
44. Jain RK. Molecular regulation of vessel maturation. Nat Med 2003;9:685–93.
45. Jain RK. A new target for tumor therapy. N Engl J Med 2009;360:2669–71.
46. MazzoneM, Dettori D, Leite de Oliveira R, Loges S, Schmidt T, JonckxB, et al. Heterozygous deficiency of PHD2 restores tumor oxygenationand inhibits metastasis via endothelial normalization. Cell 2009;136:839–51.
NEMs Induce Tumor Vessel Stabilization
www.aacrjournals.org Cancer Res; 72(24) December 15, 2012 OF11
American Association for Cancer Research Copyright © 2012 on December 11, 2012cancerres.aacrjournals.orgDownloaded from
Published OnlineFirst on December 7, 2012; DOI:10.1158/0008-5472.CAN-12-0762