Neurophysiological effects of stimulation through electrodes in the human subthalamic nucleus
Upload
khangminh22Category
view
1download
0
Neurophysiological effects of various musicgenres on electroencephalographic (EEG)cerebral cortex activityp
ABRAHAM HAFIZ RODRIGUEZ1p , SARAH NATH ZALLEK2,MICHAEL XU2, JEAN ALDAG3, LORI RUSSELL-CHAPIN4,TOBIAS A. MATTEI5 and N. SCOTT LITOFSKY6
1 University of Illinois College of Medicine, Peoria, IL, USA2 Department of Neurology, University of Illinois College of Medicine, Peoria, IL, USA3 James Scholar Research Program, University of Illinois College of Medicine, Peoria, IL, USA4 Center for Collaborative Brain Research, Bradley University, Peoria, IL, USA5 Division of Neurological Surgery, Saint Louis University School of Medicine, St. Louis, MO, USA6 Division of Neurological Surgery, University of Missouri School of Medicine, Columbia, MO, USA
Received: August 19, 2019 • Accepted: October 06, 2019Published online: November 22, 2019
ABSTRACT
Background: Music has been associated with therapeutic properties for thousands of years across a vastnumber of diverse regions and cultures. This study expands upon our current understanding of music’sinfluence on human neurophysiology by investigating the effects of various music genres on cerebralcortex activity using electroencephalography (EEG). Methods: A randomized, controlled study designwas used. EEG data were recorded from 23 healthy adults, ages 19–28, while listening to a musicsequence consisting of five randomized songs and two controls. The five studied music genres include:Classical, Tribal Downtempo, Psychedelic Trance (Psytrance), Goa Trance, and Subject Choice. Results:Controls were associated with lower percentages of beta frequencies and higher percentages of alphafrequencies than the music genres. Psytrance was associated with higher percentages of theta and deltafrequencies than the other music genres and controls. The lowest percentages of beta frequencies andhighest percentages of alpha frequencies occurred in the occipital and parietal regions. The highestpercentages of theta and delta frequencies occurred in the frontal and temporal regions. Subjects withprior music training exhibited increased percentages of delta frequencies in the frontal region. Subjectgender and music preference did not have a significant influence on frequency band percentages.Conclusions: Findings from this study support those of previous music therapy studies and providenovel insights regarding music’s influence on human neurophysiology. These findings also support thehypothesis that music may promote changes in cerebral cortex activity that have similarities to non-rapid eye movement (NREM) sleep, while the listener remains awake.
KEYWORDS
brain, clinical, EEG, medicine, music, neuroscience
INTRODUCTION
Music has been associated with therapeutic properties for thousands of years across a vastnumber of diverse regions and cultures. The earliest documented reports of music therapy arefound in historical writings from many ancient civilizations including Egypt, China, India,Greece, and Rome (University Hospitals of Cleveland, 2011). The first recorded use of musictherapy in a medical setting dates back to World Wars I and II, when music was used torelieve pain and anxiety in soldiers with traumatic war injuries (University Hospitals of
Journal of PsychedelicStudies
5 (2021) 2, 128–148
DOI:10.1556/2054.2019.027© 2019 The Author(s)
ORIGINAL RESEARCHPAPER
p
By the author’s request, severaladjustments have been made in thewording of the article after the OnlineFirst publication. These changes donot affect the content.
pCorresponding author.E-mail: [email protected]
Unauthenticated | Downloaded 02/11/22 07:39 PM UTC
Cleveland, 2011). Music continues to be used today bycountless individuals across the world for a wide variety ofreasons. From ceremonies and celebrations, to routinelistening during work, exercise, and travel, countless peoplecontinue to rely on music for its many reported therapeuticproperties.
Over the last 30 years, a large number of scientific studieshave generated a robust body of evidence suggesting thatmusic can provide significant benefits as an adjuvant treat-ment modality in a variety of clinical settings (Aragon et al.,2002; Binek et al., 2003; Bradt and Dileo, 2009; Bradt et al.,2011; Bringman et al., 2009; Buffum et al., 2006; Chan et al.,2003, 2009; Chlan et al., 2000; Conrad et al., 2007; Cookeet al., 2005; Ebneshahidi and Mohseni, 2008; Evans, 2002;Galaal et al., 2007; Han et al., 2010; Hatem et al., 2006; Kimet al., 2011; Klassen et al., 2008; Kliempt et al., 1999; Korhanet al., 2011; Kotwal et al., 1998; Kwon et al., 2006; Lai and Li,2011; Lee et al., 2005, 2011, 2012; Lepage et al., 2001; Linet al., 2011; Loomba et al., 2012; Madson and Silverman,2010; Maeyama et al., 2009; Mattei et al., 2013; Ni et al.,2012; Nilsson, 2008, 2009; Nilsson et al., 2005; Rudin et al.,2007; Salimpoor et al., 2011; Sendelbach et al., 2006; Sha-banloei et al., 2010; Slevc and Okada, 2015; Smolen et al.,2002; Tam et al., 2008; Triller et al., 2006; Tse et al., 2005;Vaajoki et al., 2011; Voss et al., 2004; Wang et al., 2002;Yilmaz et al., 2003; Zalewsky et al., 1998; Zare et al., 2010).Some of the many beneficial effects of music therapy thathave been recently investigated include decreased pain andanxiety, decreased analgesic and anxiolytic medication re-quirements, improvements in mood, emotion, and quality oflife, improvements in the symptoms of chronic cognitiveillnesses such as Alzheimer’s dementia and Parkinson’sdisease, improvements in many physiological variablesincluding heart rate and blood pressure, and more (Aragonet al., 2002; Binek et al., 2003; Bradt and Dileo, 2009; Bradtet al., 2011; Bringman et al., 2009; Buffum et al., 2006; Chanet al., 2003, 2009; Chlan et al., 2000; Conrad et al., 2007;Cooke et al., 2005; Ebneshahidi and Mohseni, 2008; Evans,2002; Galaal et al., 2007; Han et al., 2010; Hatem et al., 2006;Kim et al., 2011; Klassen et al., 2008; Kliempt et al., 1999;Korhan et al., 2011; Kotwal et al., 1998; Kwon et al., 2006;Lai and Li, 2011; Lee et al., 2005, 2011, 2012; Lepage et al.,2001; Lin et al., 2011; Loomba et al., 2012; Madson andSilverman, 2010; Maeyama et al., 2009; Mattei et al., 2013; Niet al., 2012; Nilsson, 2008, 2009; Nilsson et al., 2005; Rudinet al., 2007; Salimpoor et al., 2011; Sendelbach et al., 2006;Shabanloei et al., 2010; Slevc and Okada, 2015; Smolen et al.,2002; Tam et al., 2008; Triller et al., 2006; Tse et al., 2005;Vaajoki et al., 2011; Voss et al., 2004; Wang et al., 2002;Yilmaz et al., 2003; Zalewsky et al., 1998; Zare et al., 2010).
Our current understanding of the neurophysiologicalmechanisms underlying the therapeutic effects of musicsuggests that the cerebral cortex, basal ganglia, and hypo-thalamic-pituitary-adrenal axis are involved to various de-grees (Baumgartner et al., 2006; Conrad et al., 2007; Jacobsand Friedman, 2004; Kabuto et al., 1993; Koelsch et al., 2003;Lin et al., 2010; Mattei et al., 2013; Salimpoor et al., 2011).Previous studies utilizing electroencephalography (EEG) to
examine cerebral cortex activity in subjects undergoingmusic therapy suggest that increased alpha, theta, and deltafrequency activity may be part of the central nervous systemresponse (Baumgartner et al., 2006; Jacobs and Friedman,2004; Kabuto et al., 1993; Lin et al., 2010). Together, thesefindings suggest that various types of music may promotechanges in central nervous system activity and hypotha-lamic-pituitary-adrenal axis function that have similarities tovarious stages of sleep, while the listener remains awake(Baumgartner et al., 2006; Britton et al., 2016; Conrad et al.,2007; Jacobs and Friedman, 2004; Kabuto et al., 1993; Linet al., 2010; Mattei et al., 2013; Salimpoor et al., 2011; Whiteand Richard, 2009).
Additionally, despite the recent expansion of scientificliterature exploring outcomes-based research aimed atinvestigating how common, popular music genres (e.g.,classical) may be beneficial for various applications relatedto mood, anxiety, pain, and other variables, there has beensignificantly less attention devoted to comparing differentmusic genres for potential variabilities in their efficacy andpotency to impact the human brain and body. Due to recentadvances in computer technology and music compositionsoftware, many forms of music are now being composeddigitally, including classical symphonies, theatrical sound-tracks, cultural music, and more. Digital music compositionallows for an expanded range of instruments, melodies,pitches, resonances, harmonies, and other musical variables,all assembled with precise timing and flawless uniformity,without the irregularities or errors that often occur duringorganic music composition with manual instruments.
This study aims to investigate the neurophysiologicalactivity associated with the therapeutic effects of music inhealthy young adults using EEG, by comparing percentagesof beta, alpha, theta, and delta frequencies in each majorregion of the cerebral cortex while subjects listen to a ran-domized sequence of five unique music genres and twocontrols. Interregion cortical comparisons will also beinvestigated, as well as potential influences of subject gender,music preference, and prior music training on resulting EEGdata. By utilizing a randomized, controlled design and avariety of carefully selected music genres, this study aims toexpand on our current understanding of how various typesof music may give rise to therapeutic effects in the humanbrain and body. By improving our understanding of theneurophysiological effects of various music genres ondifferent regions of the cerebral cortex, we can more effec-tively apply music as an adjuvant therapeutic tool in modernmedical practice for the benefit of humankind.
METHODS
Subject details
After institutional review board (IRB) approval (IRB#267944-1), 25 healthy adults with normal hearing function,ages 18–29, were recruited from the University of IllinoisCollege of Medicine at Peoria, Bradley University, and
Journal of Psychedelic Studies 5 (2021) 2, 128–148 129
Unauthenticated | Downloaded 02/11/22 07:39 PM UTC

Illinois Central College campuses. Subjects were asked toavoid caffeine, tobacco, and all other psychoactive chemicalsfor at least 6 hrs prior to their study participation. Subjectswere also asked to be adequately rested prior to studyparticipation. Informed consent was obtained from all sub-jects prior to data collection.
Study design
To investigate the suspected ability of various music genresto promote changes in cerebral cortex activity that havesimilarities to certain stages of sleep, our study aimed tomeasure percentages of beta, alpha, theta, and delta fre-quencies during each segment of a subject’s randomizedmusic sequence. Wakefulness characterized by alertness andactive cognition is predominately accompanied by beta fre-quencies (>13 Hz), whereas wakefulness characterized byrelaxation and drowsiness (e.g., meditation) is predomi-nately accompanied by alpha frequencies (8–12 Hz) (Brittonet al., 2016; White and Richard, 2009). Non-rapid eyemovement (NREM) sleep is generally categorized into 3stages (N1-3): N1 (Stage 1) is characterized by light NREMsleep and is predominately accompanied by theta fre-quencies (4–7 Hz), with a lesser prevalence of alpha fre-quencies (8–12 Hz). N2 (Stage 2) is characterized by deeperNREM sleep, and is predominately accompanied by thetafrequencies (4–7 Hz) interspersed with sleep spindles and K-complexes, with a lesser prevalence of delta frequencies (1–3Hz). N3 (Stage 3) is characterized by the deepest NREMsleep, and is predominately accompanied by delta fre-quencies (1–3 Hz) (Britton et al., 2016; White and Richard,2009). Rapid eye movement (REM) sleep is characterized bythe deepest stage of sleep, and is predominately accompa-nied by beta frequencies (>13 Hz) coupled with rapid eyemovements, dreaming, and muscle paralysis (Britton et al.,2016; White and Richard, 2009).
Data collection occurred at the Illinois NeurologicalInstitute (INI) Sleep Center at OSF Saint Francis MedicalCenter in Peoria, Illinois using a randomized, controlleddesign. Each subject participated in a single data gatheringsession approximately 1 hr in length, during which theycompleted a pre-music survey (Appendix), then listened to arandomized music sequence, and completed a post-musicsurvey (Appendix). EEG leads were placed by a certified INItechnician. After completing the pre-music survey, subjectswere fitted with professional, closed-ear, studio qualityheadphones, and a special blindfold that allowed subjects tokeep their eyes open in complete darkness throughout theduration of the music sequence. This blindfold was chosenso subjects could keep their eyes open throughout theduration of the music sequence without any visual input,since closure of the eyes often leads to states of relaxedwakefulness (predominately accompanied by alpha fre-quencies) and Stage 1 (N1) NREM sleep (predominatelyaccompanied by theta and alpha frequencies) (Britton et al.,2016; White and Richard, 2009).
Blindfold position was adjusted to achieve completedarkness for each subject before the music sequence began.
Subjects were asked to stay awake and to keep their eyesopen for the entire duration of the music sequence, and toreport on the post-music survey if they had fallen asleep orhad any other concerns that arose during the musicsequence. Subjects were asked not take breaks during themusic sequence. Timestamps were documented during eachsubject’s music sequence so that start and end points of eachsong and control could be clearly identified in the EEG data.Subjects briefly rated each song immediately after hearing it,without removing their blindfold or headphones, using averbal equivalent of a Visual Analog Scale (Appendix).Subjects were not informed of which music genre they hadjust listened to when providing this rating. After the musicsequence was complete, subjects ranked the songs relative toeach other as part of the post-music survey (Appendix).
Each subject’s music sequence consisted of five songs inrandomized order, flanked by controls (Victoria Fallswaterfall recording). Except for the subject-chosen song ineach music sequence, all subjects listened to the same pre-selected music genres and controls that had been chosen inadvance by the study team. One song was chosen to repre-sent each music genre, and the study team was very carefulto select a song that accurately represented each genre. Songorder for each subject’s music sequence was randomizedusing a standard permutation. The song lengths in eachsubject’s music sequence were standardized to the shortestsong of the sequence by removing an appropriate terminalsegment from the end of longer songs and controls. Eachsubject’s music sequence was flanked with a control ofidentical length at the beginning (Control 1) and end(Control 2). Brief 2.5-min control periods were placed be-tween songs in each music sequence for a neutral, stan-dardized transition between genres. All music used in thisstudy was high-quality 320 kbps digital MP3 format orbetter, purchased from various accredited online musicvendors. The music genres selected for this study werechosen because they are widely reported as therapeutic, andfor additional analytical reasons:
Classical music has been frequently used in previous musictherapy studies and is recognized throughout the world. Onestudy investigated the impact of classical music on variousphysiological parameters (e.g., blood pressure, heart rate,etc.) and hormones of the hypothalamic-pituitary-adrenalaxis (e.g., cortisol, growth hormone, etc.) in critically illpatients (Conrad et al., 2007). Classical music from world-renown composers such as Ludwig van Beethoven, Wolf-gang Amadeus Mozart, and Johann Sebastian Bach is widelyrecognized and is still commonly played in modern times bya variety of both public (e.g., radio, television) and privatelisteners. It is frequently reported to be therapeutic by lis-teners around the world. Song: Ludwig van Beethoven –Symphony No. 5 in C-Minor
Tribal Downtempo is a broad category of electronic musicthat features a blend of vocal chants, hand drumming, andorganic instruments, which have cultural and historicalrelevance to human ancestral past. Some of the commoninstruments featured in this music genre include the djembe,doumbek, various wooden flutes, and more, which contribute
130 Journal of Psychedelic Studies 5 (2021) 2, 128–148
Unauthenticated | Downloaded 02/11/22 07:39 PM UTC
to the tribal atmospheres present in this genre. TribalDowntempo varies widely in tempo, but is typically muchslower (<100 bpm) than more fast-paced genres of music,such as most types of electronic dance music. It is widelyreported to be therapeutic by listeners around the world.Song: Koan – When We Left Arkaim
Psychedelic Trance (Psytrance) is a unique genre of electronicdance music that features a large variety of melodies, har-monies, and atmospheres centered around a unique rhythmcomposition that is typically produced in a widely-recog-nized 4/4 time signature, but with sixteenth bass notes (i.e.,four bass notes per beat) instead of simple quarter notes. Thetypical tempo of Psytrance is around 140-160 beats-per-minute (bpm), which results in a frequency range similar tothe alpha frequency band (8–12 Hz) since there are four bassnotes for every beat (4 bass notes x 150 bpm 5 600 bpm 510 Hz). Psytrance is widely reported to be both therapeuticand trance-inducing. Psytrance was originally developedfrom another type of electronic dance music known as GoaTrance in the 1970s and 1980s, and has since spreadthroughout the world (St John, 2010). Song: M-Theory – L6Echo
Goa Trance (Goa) is very similar in composition to Psy-trance, except with a standard quarter note beat structure(i.e., no sixteenth bass notes), making it an excellent musicgenre for comparison to Psytrance. Although Goa Trancetypically utilizes a standard quarter-note beat structure, itstill is typically produced at a tempo very similar to Psy-trance (140–160 bpm), and with similar melodies, har-monies, and atmospheres. Like Psytrance, Goa Trance is alsowidely reported to be both therapeutic and trance-inducing.Goa Trance was originally developed on the coastal beachesof Goa, India through various collaborative organic anddigital music projects in the 1970s and 1980s, and eventuallyspread throughout the world (St John, 2010). Song: Goalien– Do It Now
Subject Song is a subject-chosen song that was included ineach subject’s personalized music sequence to evaluate theimportance of personal music preferences. Subjects wereasked to provide their three most favorite, pleasurable songsafter qualifying for the study. The study team then chose oneof these songs based on its availability in a high-qualitydigital format (e.g., MP3), and its similarity to the other fourmusic genres. If more than one song was available in anappropriate digital format, the principal investigator chosethe song that was least similar to the other four music genres.Typical songs selected by subjects included common musicgenres featured on popular radio and television stations,including Pop, Hip-Hop, Rock, etc.
Control (white noise) was selected to evaluate subjects’ ce-rebral cortical activity in response to non-musical sound, forcomparison to the cortical activity observed during the fivemusic genres described above. Consideration was given toartificial types of non-musical sound (e.g., television static,radio static, traffic sounds), including the background noiseencountered at OSF Saint Francis Medical Center where datacollection took place, but our study team opted to use anatural form of white noise (waterfall recording) to increasethe likelihood that subjects would complete the entire musicsequence with minimal discomfort and anxiety. Song: Vic-toria Falls waterfall (audio recording)
Data measurement
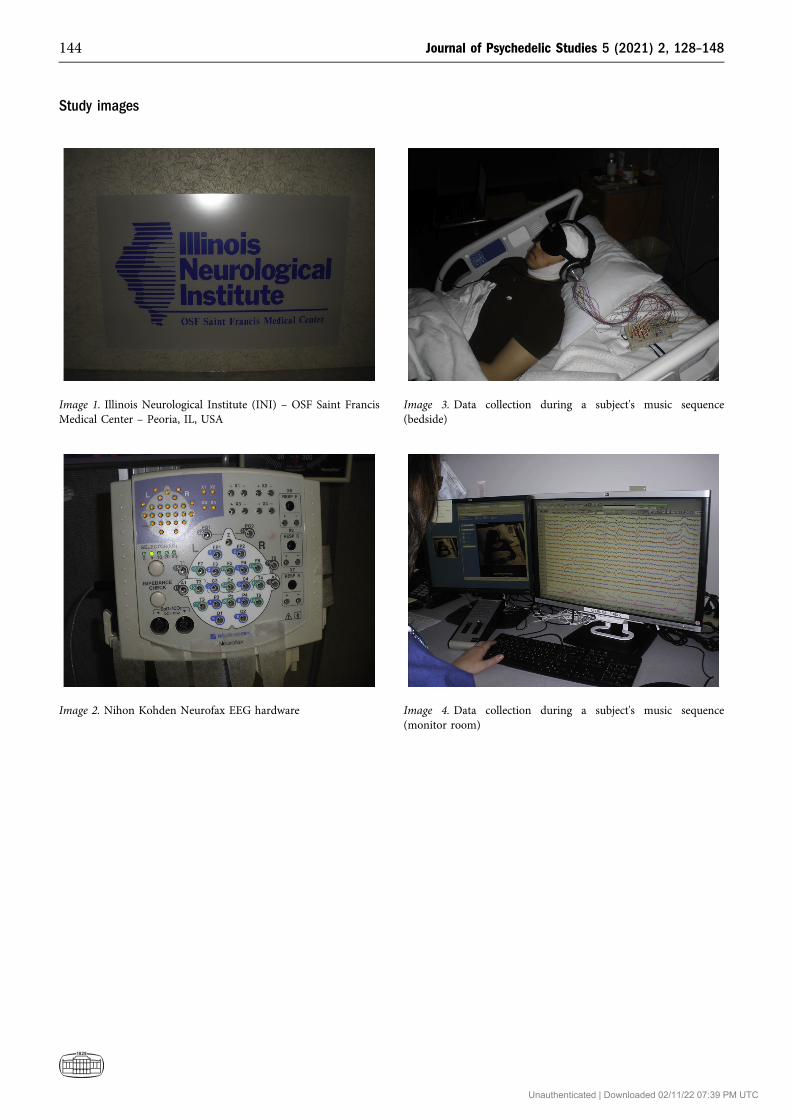
Subjective data were obtained using pre-music and post-music printed surveys (Appendix). EEG data were obtainedusing Nihon Kohden Neurofax EEG-1200A hardware andNeurofax QP 112AK v06-80 software (Appendix). 19 EEGelectrodes were placed according to the standard interna-tional 10–20 system by a certified INI technician. Mea-surement of recorded EEG data was then performed byexporting the raw, unedited data from the Neurofax soft-ware, converting to European Data Format Plus (EDFþ)format, then importing to Novatech WinEEG v2.7þ softwarefor quantitative spectral analysis. EEG data were analyzedusing a speed of 30 mm/s, gain of 100 mV, baseline of 0.00mV, low cut of 0.1 s (1.6 Hz), high cut of 50 Hz, notch of 50–70 Hz, and a ‘monopolar average 1’ montage. No additionalprocessing or modification of the EEG data was performed.
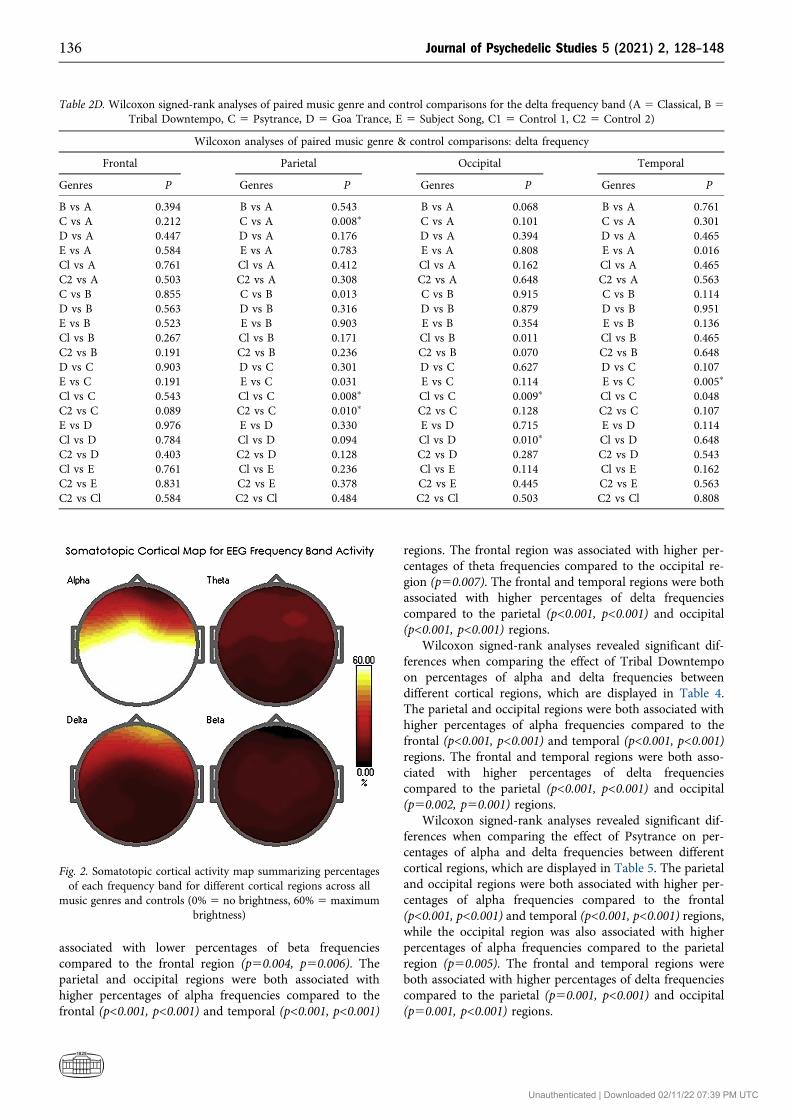
The percentages of beta, alpha, theta, and delta fre-quencies from each song and control of a subject’s musicsequence were determined by using the documented time-stamps to identify the corresponding EEG data for a givensong or control, then running the WinEEG artifact correc-tion tool, followed by the spectral analysis tool, to generate atable that displayed the percentages of each frequency bandthat occurred during the individual song or control. Thiswas performed by the principle investigator under theguidance of an attending INI neurologist at OSF SaintFrancis Medical Center. The settings used by our study teamwhen applying the WinEEG spectral analysis tool included:epoch length of 4 seconds, overlap of 50%, and Hanningtime windows. The EEG data were also grouped into corticalregions by averaging the resulting percentages from the in-dividual leads that correspond to each cortical lobe (e.g.,data from Fp1, Fp2, and Fz leads were averaged to generate a‘frontal region’ value for each song). Individual hemisphereswere not studied in isolation, so our study team did notperform left versus right interhemispheric comparisons.Somatotopic cortical maps were generated from the per-centage tables in WinEEG to visually represent the corticalregions where the highest percentages of each frequencyband occurred, using a brightness scale of 0–60% (0% 5 nobrightness, 60% 5 maximum brightness) to provide optimaldata visualization since no individual frequency bandshowed percentages greater than 60% in any cortical region.
Statistical analysis
Processed EEG data tables were exported from WinEEG andimported into a Microsoft Excel spreadsheet for analysisusing IBM SPSS software (version 21.0.0). Standarddescriptive statistics were calculated including mean, stan-dard deviation, range, and correlation coefficients. Wilcoxonsigned-rank tests were used to compare EEG results betweenpairs of music genres and controls, and between pairs ofindividual cortical regions. Spearman rank-order correlationtests were used to investigate possible influences of subjec-tive variables including subject music preference, gender,and prior music training. A strict statistical significance
Journal of Psychedelic Studies 5 (2021) 2, 128–148 131
Unauthenticated | Downloaded 02/11/22 07:39 PM UTC
threshold of P≤0.01 was used to help offset, in part, therelatively small sample size.
RESULTS
Twenty-three out of the twenty-five recruited subjects suc-cessfully participated in data collection. Two subjectsdropped out of the study prior to data collection; one subjectcancelled, and a second subject was outside of the requiredage range. Of the twenty-three participating study subjects,nine were male and fourteen were female. The subjects weredistributed among the following ages: 19 (2), 20 (1), 23 (3),24 (4), 25 (3), 26 (4), 27 (1), 28 (5), with a mean age of 24.7years. The ethnicity of these subjects included Chinese,
African, Caucasian, Hispanic, Arab, Indian, Ashkenazi Jew,and Asian/Pacific Islander. Seventeen subjects reported priormusic training (e.g., playing an instrument, singing in choir,etc.). Only one subject reported briefly falling asleep duringtheir music sequence.
Music genre comparisons
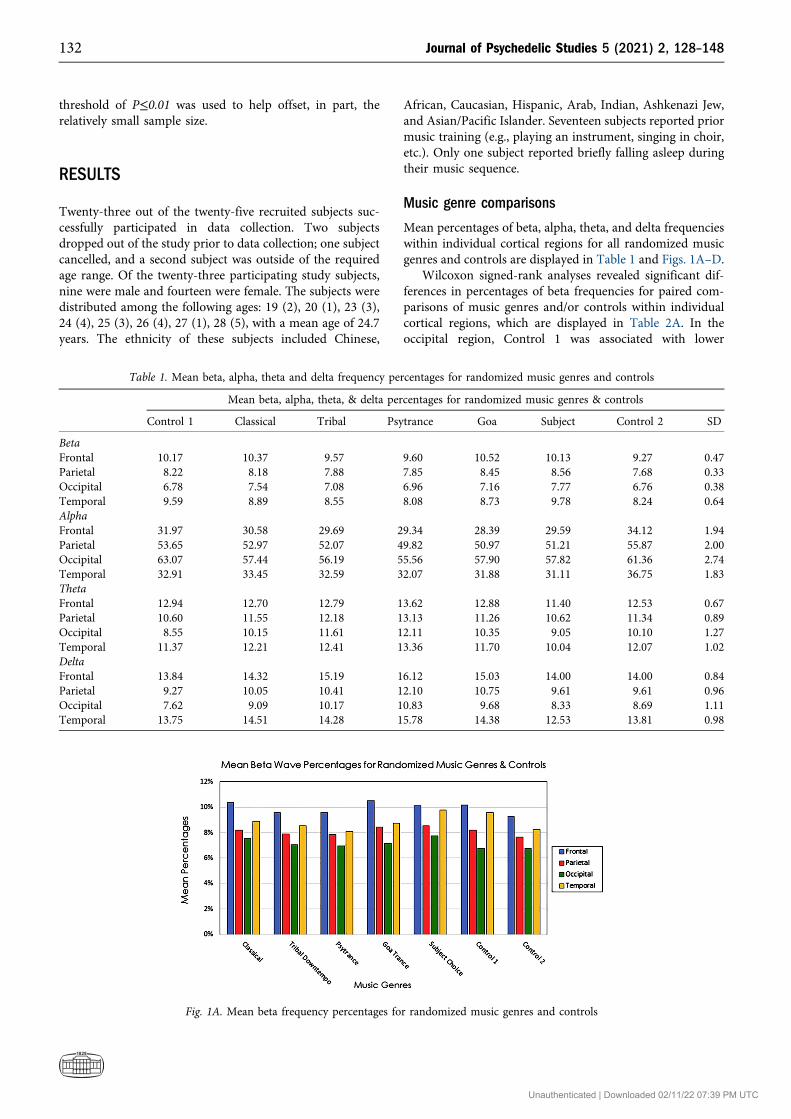
Mean percentages of beta, alpha, theta, and delta frequencieswithin individual cortical regions for all randomized musicgenres and controls are displayed in Table 1 and Figs. 1A–D.
Wilcoxon signed-rank analyses revealed significant dif-ferences in percentages of beta frequencies for paired com-parisons of music genres and/or controls within individualcortical regions, which are displayed in Table 2A. In theoccipital region, Control 1 was associated with lower
Table 1. Mean beta, alpha, theta and delta frequency percentages for randomized music genres and controls
Mean beta, alpha, theta, & delta percentages for randomized music genres & controls
Control 1 Classical Tribal Psytrance Goa Subject Control 2 SD
BetaFrontal 10.17 10.37 9.57 9.60 10.52 10.13 9.27 0.47Parietal 8.22 8.18 7.88 7.85 8.45 8.56 7.68 0.33Occipital 6.78 7.54 7.08 6.96 7.16 7.77 6.76 0.38Temporal 9.59 8.89 8.55 8.08 8.73 9.78 8.24 0.64AlphaFrontal 31.97 30.58 29.69 29.34 28.39 29.59 34.12 1.94Parietal 53.65 52.97 52.07 49.82 50.97 51.21 55.87 2.00Occipital 63.07 57.44 56.19 55.56 57.90 57.82 61.36 2.74Temporal 32.91 33.45 32.59 32.07 31.88 31.11 36.75 1.83ThetaFrontal 12.94 12.70 12.79 13.62 12.88 11.40 12.53 0.67Parietal 10.60 11.55 12.18 13.13 11.26 10.62 11.34 0.89Occipital 8.55 10.15 11.61 12.11 10.35 9.05 10.10 1.27Temporal 11.37 12.21 12.41 13.36 11.70 10.04 12.07 1.02DeltaFrontal 13.84 14.32 15.19 16.12 15.03 14.00 14.00 0.84Parietal 9.27 10.05 10.41 12.10 10.75 9.61 9.61 0.96Occipital 7.62 9.09 10.17 10.83 9.68 8.33 8.69 1.11Temporal 13.75 14.51 14.28 15.78 14.38 12.53 13.81 0.98
Fig. 1A. Mean beta frequency percentages for randomized music genres and controls
132 Journal of Psychedelic Studies 5 (2021) 2, 128–148
Unauthenticated | Downloaded 02/11/22 07:39 PM UTC
percentages of beta frequencies compared to both Classical(p50.002) and Subject Song (p50.008), while Control 2 wasassociated with lower percentages of beta frequenciescompared to Subject Song (p50.008) only. In the temporal
region, Tribal Downtempo, Psytrance, and Control 2 wereassociated with lower percentages of beta frequenciescompared to Control 1 (p50.006, p50.008, p50.010), whileboth Psytrance and Goa Trance were associated with lower
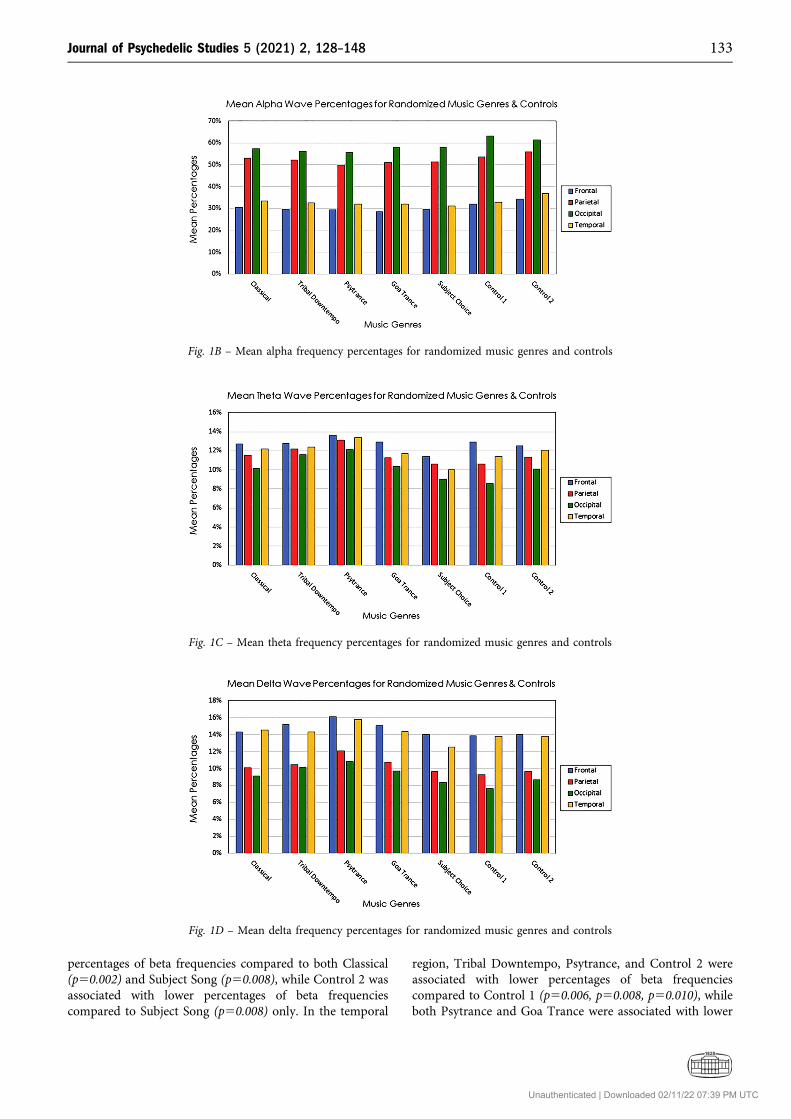
Fig. 1B – Mean alpha frequency percentages for randomized music genres and controls
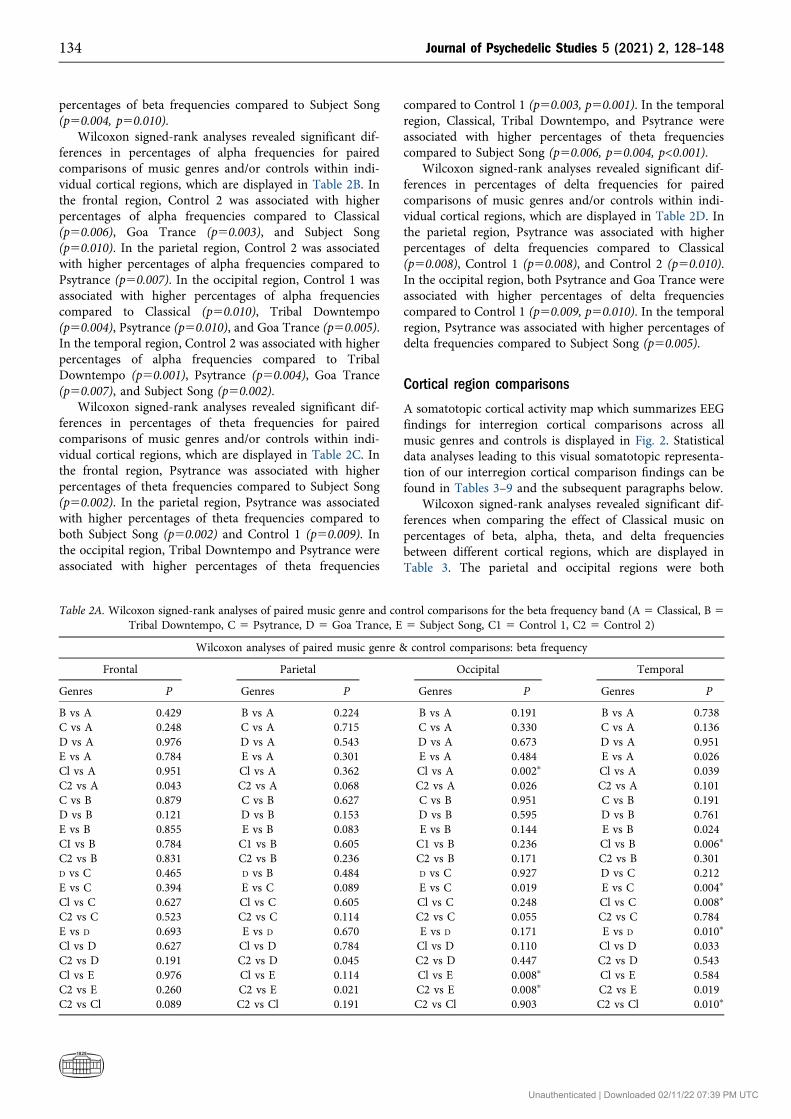
Fig. 1C – Mean theta frequency percentages for randomized music genres and controls
Fig. 1D – Mean delta frequency percentages for randomized music genres and controls
Journal of Psychedelic Studies 5 (2021) 2, 128–148 133
Unauthenticated | Downloaded 02/11/22 07:39 PM UTC
percentages of beta frequencies compared to Subject Song(p50.004, p50.010).
Wilcoxon signed-rank analyses revealed significant dif-ferences in percentages of alpha frequencies for pairedcomparisons of music genres and/or controls within indi-vidual cortical regions, which are displayed in Table 2B. Inthe frontal region, Control 2 was associated with higherpercentages of alpha frequencies compared to Classical(p50.006), Goa Trance (p50.003), and Subject Song(p50.010). In the parietal region, Control 2 was associatedwith higher percentages of alpha frequencies compared toPsytrance (p50.007). In the occipital region, Control 1 wasassociated with higher percentages of alpha frequenciescompared to Classical (p50.010), Tribal Downtempo(p50.004), Psytrance (p50.010), and Goa Trance (p50.005).In the temporal region, Control 2 was associated with higherpercentages of alpha frequencies compared to TribalDowntempo (p50.001), Psytrance (p50.004), Goa Trance(p50.007), and Subject Song (p50.002).
Wilcoxon signed-rank analyses revealed significant dif-ferences in percentages of theta frequencies for pairedcomparisons of music genres and/or controls within indi-vidual cortical regions, which are displayed in Table 2C. Inthe frontal region, Psytrance was associated with higherpercentages of theta frequencies compared to Subject Song(p50.002). In the parietal region, Psytrance was associatedwith higher percentages of theta frequencies compared toboth Subject Song (p50.002) and Control 1 (p50.009). Inthe occipital region, Tribal Downtempo and Psytrance wereassociated with higher percentages of theta frequencies
compared to Control 1 (p50.003, p50.001). In the temporalregion, Classical, Tribal Downtempo, and Psytrance wereassociated with higher percentages of theta frequenciescompared to Subject Song (p50.006, p50.004, p<0.001).
Wilcoxon signed-rank analyses revealed significant dif-ferences in percentages of delta frequencies for pairedcomparisons of music genres and/or controls within indi-vidual cortical regions, which are displayed in Table 2D. Inthe parietal region, Psytrance was associated with higherpercentages of delta frequencies compared to Classical(p50.008), Control 1 (p50.008), and Control 2 (p50.010).In the occipital region, both Psytrance and Goa Trance wereassociated with higher percentages of delta frequenciescompared to Control 1 (p50.009, p50.010). In the temporalregion, Psytrance was associated with higher percentages ofdelta frequencies compared to Subject Song (p50.005).
Cortical region comparisons
A somatotopic cortical activity map which summarizes EEGfindings for interregion cortical comparisons across allmusic genres and controls is displayed in Fig. 2. Statisticaldata analyses leading to this visual somatotopic representa-tion of our interregion cortical comparison findings can befound in Tables 3–9 and the subsequent paragraphs below.
Wilcoxon signed-rank analyses revealed significant dif-ferences when comparing the effect of Classical music onpercentages of beta, alpha, theta, and delta frequenciesbetween different cortical regions, which are displayed inTable 3. The parietal and occipital regions were both
Table 2A. Wilcoxon signed-rank analyses of paired music genre and control comparisons for the beta frequency band (A 5 Classical, B 5Tribal Downtempo, C 5 Psytrance, D 5 Goa Trance, E 5 Subject Song, C1 5 Control 1, C2 5 Control 2)
Wilcoxon analyses of paired music genre & control comparisons: beta frequency
Frontal Parietal Occipital Temporal
Genres P Genres P Genres P Genres P
B vs A 0.429 B vs A 0.224 B vs A 0.191 B vs A 0.738C vs A 0.248 C vs A 0.715 C vs A 0.330 C vs A 0.136D vs A 0.976 D vs A 0.543 D vs A 0.673 D vs A 0.951E vs A 0.784 E vs A 0.301 E vs A 0.484 E vs A 0.026Cl vs A 0.951 Cl vs A 0.362 Cl vs A 0.002p Cl vs A 0.039C2 vs A 0.043 C2 vs A 0.068 C2 vs A 0.026 C2 vs A 0.101C vs B 0.879 C vs B 0.627 C vs B 0.951 C vs B 0.191D vs B 0.121 D vs B 0.153 D vs B 0.595 D vs B 0.761E vs B 0.855 E vs B 0.083 E vs B 0.144 E vs B 0.024CI vs B 0.784 C1 vs B 0.605 C1 vs B 0.236 Cl vs B 0.006p
C2 vs B 0.831 C2 vs B 0.236 C2 vs B 0.171 C2 vs B 0.301D vs C 0.465 D vs B 0.484 D vs C 0.927 D vs C 0.212E vs C 0.394 E vs C 0.089 E vs C 0.019 E vs C 0.004p
Cl vs C 0.627 Cl vs C 0.605 Cl vs C 0.248 Cl vs C 0.008p
C2 vs C 0.523 C2 vs C 0.114 C2 vs C 0.055 C2 vs C 0.784E vs D 0.693 E vs D 0.670 E vs D 0.171 E vs D 0.010p
Cl vs D 0.627 Cl vs D 0.784 Cl vs D 0.110 Cl vs D 0.033C2 vs D 0.191 C2 vs D 0.045 C2 vs D 0.447 C2 vs D 0.543Cl vs E 0.976 Cl vs E 0.114 Cl vs E 0.008p Cl vs E 0.584C2 vs E 0.260 C2 vs E 0.021 C2 vs E 0.008p C2 vs E 0.019C2 vs Cl 0.089 C2 vs Cl 0.191 C2 vs Cl 0.903 C2 vs Cl 0.010p
134 Journal of Psychedelic Studies 5 (2021) 2, 128–148
Unauthenticated | Downloaded 02/11/22 07:39 PM UTC
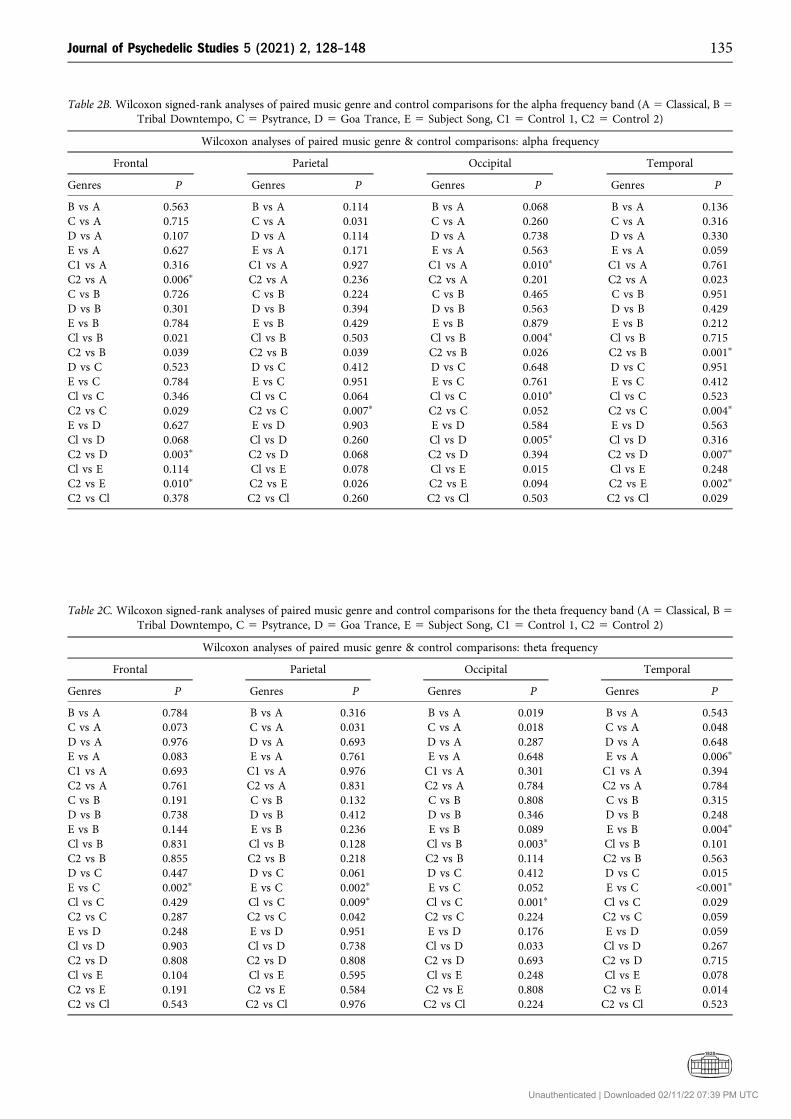
Table 2B. Wilcoxon signed-rank analyses of paired music genre and control comparisons for the alpha frequency band (A 5 Classical, B 5Tribal Downtempo, C 5 Psytrance, D 5 Goa Trance, E 5 Subject Song, C1 5 Control 1, C2 5 Control 2)
Wilcoxon analyses of paired music genre & control comparisons: alpha frequency
Frontal Parietal Occipital Temporal
Genres P Genres P Genres P Genres P
B vs A 0.563 B vs A 0.114 B vs A 0.068 B vs A 0.136C vs A 0.715 C vs A 0.031 C vs A 0.260 C vs A 0.316D vs A 0.107 D vs A 0.114 D vs A 0.738 D vs A 0.330E vs A 0.627 E vs A 0.171 E vs A 0.563 E vs A 0.059C1 vs A 0.316 C1 vs A 0.927 C1 vs A 0.010p C1 vs A 0.761C2 vs A 0.006p C2 vs A 0.236 C2 vs A 0.201 C2 vs A 0.023C vs B 0.726 C vs B 0.224 C vs B 0.465 C vs B 0.951D vs B 0.301 D vs B 0.394 D vs B 0.563 D vs B 0.429E vs B 0.784 E vs B 0.429 E vs B 0.879 E vs B 0.212Cl vs B 0.021 Cl vs B 0.503 Cl vs B 0.004p Cl vs B 0.715C2 vs B 0.039 C2 vs B 0.039 C2 vs B 0.026 C2 vs B 0.001p
D vs C 0.523 D vs C 0.412 D vs C 0.648 D vs C 0.951E vs C 0.784 E vs C 0.951 E vs C 0.761 E vs C 0.412Cl vs C 0.346 Cl vs C 0.064 Cl vs C 0.010p Cl vs C 0.523C2 vs C 0.029 C2 vs C 0.007p C2 vs C 0.052 C2 vs C 0.004p
E vs D 0.627 E vs D 0.903 E vs D 0.584 E vs D 0.563Cl vs D 0.068 Cl vs D 0.260 Cl vs D 0.005p Cl vs D 0.316C2 vs D 0.003p C2 vs D 0.068 C2 vs D 0.394 C2 vs D 0.007p
Cl vs E 0.114 Cl vs E 0.078 Cl vs E 0.015 Cl vs E 0.248C2 vs E 0.010p C2 vs E 0.026 C2 vs E 0.094 C2 vs E 0.002p
C2 vs Cl 0.378 C2 vs Cl 0.260 C2 vs Cl 0.503 C2 vs Cl 0.029
Table 2C. Wilcoxon signed-rank analyses of paired music genre and control comparisons for the theta frequency band (A 5 Classical, B 5Tribal Downtempo, C 5 Psytrance, D 5 Goa Trance, E 5 Subject Song, C1 5 Control 1, C2 5 Control 2)
Wilcoxon analyses of paired music genre & control comparisons: theta frequency
Frontal Parietal Occipital Temporal
Genres P Genres P Genres P Genres P
B vs A 0.784 B vs A 0.316 B vs A 0.019 B vs A 0.543C vs A 0.073 C vs A 0.031 C vs A 0.018 C vs A 0.048D vs A 0.976 D vs A 0.693 D vs A 0.287 D vs A 0.648E vs A 0.083 E vs A 0.761 E vs A 0.648 E vs A 0.006p
C1 vs A 0.693 C1 vs A 0.976 C1 vs A 0.301 C1 vs A 0.394C2 vs A 0.761 C2 vs A 0.831 C2 vs A 0.784 C2 vs A 0.784C vs B 0.191 C vs B 0.132 C vs B 0.808 C vs B 0.315D vs B 0.738 D vs B 0.412 D vs B 0.346 D vs B 0.248E vs B 0.144 E vs B 0.236 E vs B 0.089 E vs B 0.004p
Cl vs B 0.831 Cl vs B 0.128 Cl vs B 0.003p Cl vs B 0.101C2 vs B 0.855 C2 vs B 0.218 C2 vs B 0.114 C2 vs B 0.563D vs C 0.447 D vs C 0.061 D vs C 0.412 D vs C 0.015E vs C 0.002p E vs C 0.002p E vs C 0.052 E vs C <0.001p
Cl vs C 0.429 Cl vs C 0.009p Cl vs C 0.001p Cl vs C 0.029C2 vs C 0.287 C2 vs C 0.042 C2 vs C 0.224 C2 vs C 0.059E vs D 0.248 E vs D 0.951 E vs D 0.176 E vs D 0.059Cl vs D 0.903 Cl vs D 0.738 Cl vs D 0.033 Cl vs D 0.267C2 vs D 0.808 C2 vs D 0.808 C2 vs D 0.693 C2 vs D 0.715Cl vs E 0.104 Cl vs E 0.595 Cl vs E 0.248 Cl vs E 0.078C2 vs E 0.191 C2 vs E 0.584 C2 vs E 0.808 C2 vs E 0.014C2 vs Cl 0.543 C2 vs Cl 0.976 C2 vs Cl 0.224 C2 vs Cl 0.523
Journal of Psychedelic Studies 5 (2021) 2, 128–148 135
Unauthenticated | Downloaded 02/11/22 07:39 PM UTC
associated with lower percentages of beta frequenciescompared to the frontal region (p50.004, p50.006). Theparietal and occipital regions were both associated withhigher percentages of alpha frequencies compared to thefrontal (p<0.001, p<0.001) and temporal (p<0.001, p<0.001)
regions. The frontal region was associated with higher per-centages of theta frequencies compared to the occipital re-gion (p50.007). The frontal and temporal regions were bothassociated with higher percentages of delta frequenciescompared to the parietal (p<0.001, p<0.001) and occipital(p<0.001, p<0.001) regions.
Wilcoxon signed-rank analyses revealed significant dif-ferences when comparing the effect of Tribal Downtempoon percentages of alpha and delta frequencies betweendifferent cortical regions, which are displayed in Table 4.The parietal and occipital regions were both associated withhigher percentages of alpha frequencies compared to thefrontal (p<0.001, p<0.001) and temporal (p<0.001, p<0.001)regions. The frontal and temporal regions were both asso-ciated with higher percentages of delta frequenciescompared to the parietal (p<0.001, p<0.001) and occipital(p50.002, p50.001) regions.
Wilcoxon signed-rank analyses revealed significant dif-ferences when comparing the effect of Psytrance on per-centages of alpha and delta frequencies between differentcortical regions, which are displayed in Table 5. The parietaland occipital regions were both associated with higher per-centages of alpha frequencies compared to the frontal(p<0.001, p<0.001) and temporal (p<0.001, p<0.001) regions,while the occipital region was also associated with higherpercentages of alpha frequencies compared to the parietalregion (p50.005). The frontal and temporal regions wereboth associated with higher percentages of delta frequenciescompared to the parietal (p50.001, p<0.001) and occipital(p50.001, p<0.001) regions.
Table 2D. Wilcoxon signed-rank analyses of paired music genre and control comparisons for the delta frequency band (A 5 Classical, B 5Tribal Downtempo, C 5 Psytrance, D 5 Goa Trance, E 5 Subject Song, C1 5 Control 1, C2 5 Control 2)
Wilcoxon analyses of paired music genre & control comparisons: delta frequency
Frontal Parietal Occipital Temporal
Genres P Genres P Genres P Genres P
B vs A 0.394 B vs A 0.543 B vs A 0.068 B vs A 0.761C vs A 0.212 C vs A 0.008p C vs A 0.101 C vs A 0.301D vs A 0.447 D vs A 0.176 D vs A 0.394 D vs A 0.465E vs A 0.584 E vs A 0.783 E vs A 0.808 E vs A 0.016Cl vs A 0.761 Cl vs A 0.412 Cl vs A 0.162 Cl vs A 0.465C2 vs A 0.503 C2 vs A 0.308 C2 vs A 0.648 C2 vs A 0.563C vs B 0.855 C vs B 0.013 C vs B 0.915 C vs B 0.114D vs B 0.563 D vs B 0.316 D vs B 0.879 D vs B 0.951E vs B 0.523 E vs B 0.903 E vs B 0.354 E vs B 0.136Cl vs B 0.267 Cl vs B 0.171 Cl vs B 0.011 Cl vs B 0.465C2 vs B 0.191 C2 vs B 0.236 C2 vs B 0.070 C2 vs B 0.648D vs C 0.903 D vs C 0.301 D vs C 0.627 D vs C 0.107E vs C 0.191 E vs C 0.031 E vs C 0.114 E vs C 0.005p
Cl vs C 0.543 Cl vs C 0.008p Cl vs C 0.009p Cl vs C 0.048C2 vs C 0.089 C2 vs C 0.010p C2 vs C 0.128 C2 vs C 0.107E vs D 0.976 E vs D 0.330 E vs D 0.715 E vs D 0.114Cl vs D 0.784 Cl vs D 0.094 Cl vs D 0.010p Cl vs D 0.648C2 vs D 0.403 C2 vs D 0.128 C2 vs D 0.287 C2 vs D 0.543Cl vs E 0.761 Cl vs E 0.236 Cl vs E 0.114 Cl vs E 0.162C2 vs E 0.831 C2 vs E 0.378 C2 vs E 0.445 C2 vs E 0.563C2 vs Cl 0.584 C2 vs Cl 0.484 C2 vs Cl 0.503 C2 vs Cl 0.808
Fig. 2. Somatotopic cortical activity map summarizing percentagesof each frequency band for different cortical regions across all
music genres and controls (0% 5 no brightness, 60% 5 maximumbrightness)
136 Journal of Psychedelic Studies 5 (2021) 2, 128–148
Unauthenticated | Downloaded 02/11/22 07:39 PM UTC
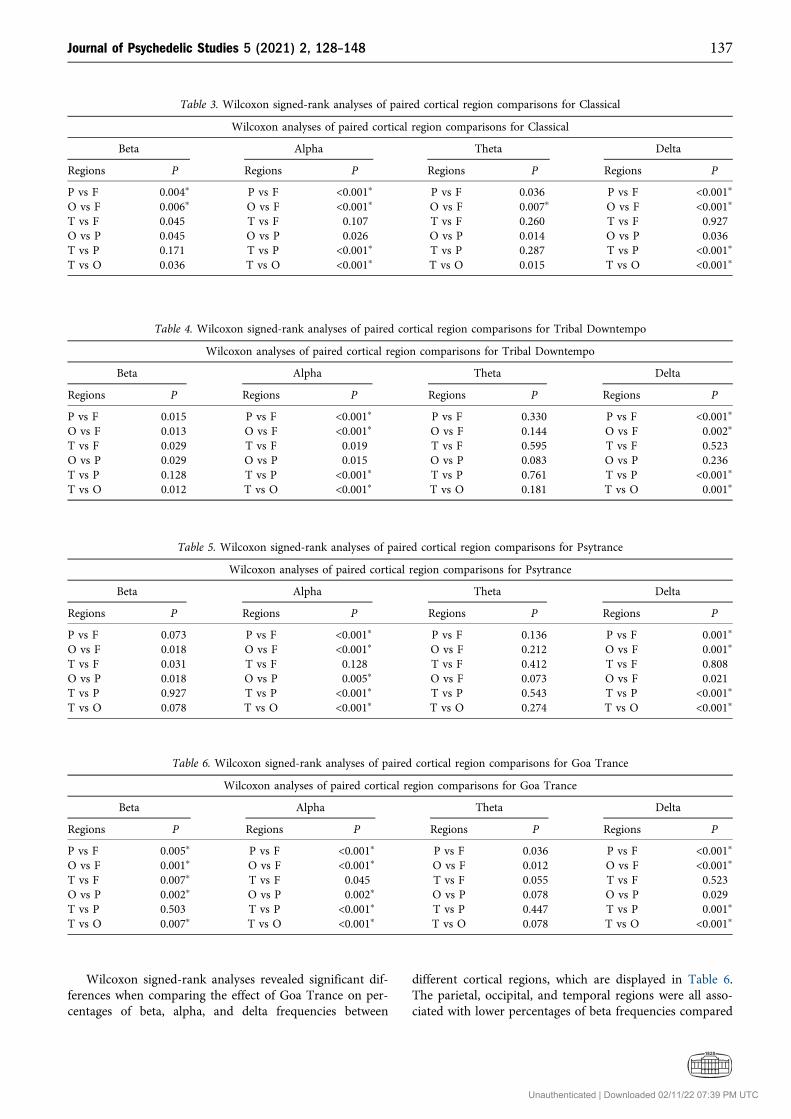
Wilcoxon signed-rank analyses revealed significant dif-ferences when comparing the effect of Goa Trance on per-centages of beta, alpha, and delta frequencies between
different cortical regions, which are displayed in Table 6.The parietal, occipital, and temporal regions were all asso-ciated with lower percentages of beta frequencies compared
Table 3. Wilcoxon signed-rank analyses of paired cortical region comparisons for Classical
Wilcoxon analyses of paired cortical region comparisons for Classical
Beta Alpha Theta Delta
Regions P Regions P Regions P Regions P
P vs F 0.004p P vs F <0.001p P vs F 0.036 P vs F <0.001p
O vs F 0.006p O vs F <0.001p O vs F 0.007p O vs F <0.001p
T vs F 0.045 T vs F 0.107 T vs F 0.260 T vs F 0.927O vs P 0.045 O vs P 0.026 O vs P 0.014 O vs P 0.036T vs P 0.171 T vs P <0.001p T vs P 0.287 T vs P <0.001p
T vs O 0.036 T vs O <0.001p T vs O 0.015 T vs O <0.001p
Table 4. Wilcoxon signed-rank analyses of paired cortical region comparisons for Tribal Downtempo
Wilcoxon analyses of paired cortical region comparisons for Tribal Downtempo
Beta Alpha Theta Delta
Regions P Regions P Regions P Regions P
P vs F 0.015 P vs F <0.001p P vs F 0.330 P vs F <0.001p
O vs F 0.013 O vs F <0.001p O vs F 0.144 O vs F 0.002p
T vs F 0.029 T vs F 0.019 T vs F 0.595 T vs F 0.523O vs P 0.029 O vs P 0.015 O vs P 0.083 O vs P 0.236T vs P 0.128 T vs P <0.001p T vs P 0.761 T vs P <0.001p
T vs O 0.012 T vs O <0.001p T vs O 0.181 T vs O 0.001p
Table 5. Wilcoxon signed-rank analyses of paired cortical region comparisons for Psytrance
Wilcoxon analyses of paired cortical region comparisons for Psytrance
Beta Alpha Theta Delta
Regions P Regions P Regions P Regions P
P vs F 0.073 P vs F <0.001p P vs F 0.136 P vs F 0.001p
O vs F 0.018 O vs F <0.001p O vs F 0.212 O vs F 0.001p
T vs F 0.031 T vs F 0.128 T vs F 0.412 T vs F 0.808O vs P 0.018 O vs P 0.005p O vs F 0.073 O vs F 0.021T vs P 0.927 T vs P <0.001p T vs P 0.543 T vs P <0.001p
T vs O 0.078 T vs O <0.001p T vs O 0.274 T vs O <0.001p
Table 6. Wilcoxon signed-rank analyses of paired cortical region comparisons for Goa Trance
Wilcoxon analyses of paired cortical region comparisons for Goa Trance
Beta Alpha Theta Delta
Regions P Regions P Regions P Regions P
P vs F 0.005p P vs F <0.001p P vs F 0.036 P vs F <0.001p
O vs F 0.001p O vs F <0.001p O vs F 0.012 O vs F <0.001p
T vs F 0.007p T vs F 0.045 T vs F 0.055 T vs F 0.523O vs P 0.002p O vs P 0.002p O vs P 0.078 O vs P 0.029T vs P 0.503 T vs P <0.001p T vs P 0.447 T vs P 0.001p
T vs O 0.007p T vs O <0.001p T vs O 0.078 T vs O <0.001p
Journal of Psychedelic Studies 5 (2021) 2, 128–148 137
Unauthenticated | Downloaded 02/11/22 07:39 PM UTC
to the frontal region (p50.005, p50.001, p50.007), while theoccipital region was also associated with lower percentagesof beta frequencies compared to the parietal (p50.002) andtemporal (p50.007) regions. The parietal and occipital re-gions were both associated with higher percentages of alphafrequencies compared to the frontal (p<0.001, p<0.001) andtemporal (p<0.001, p<0.001) regions, while the occipital re-gion was also associated with higher percentages of alphafrequencies compared to the parietal region (p50.002). Thefrontal and temporal regions were both associated with higherpercentages of delta frequencies compared to the parietal(p<0.001, p50.001) and occipital (p<0.001, p<0.001) regions.
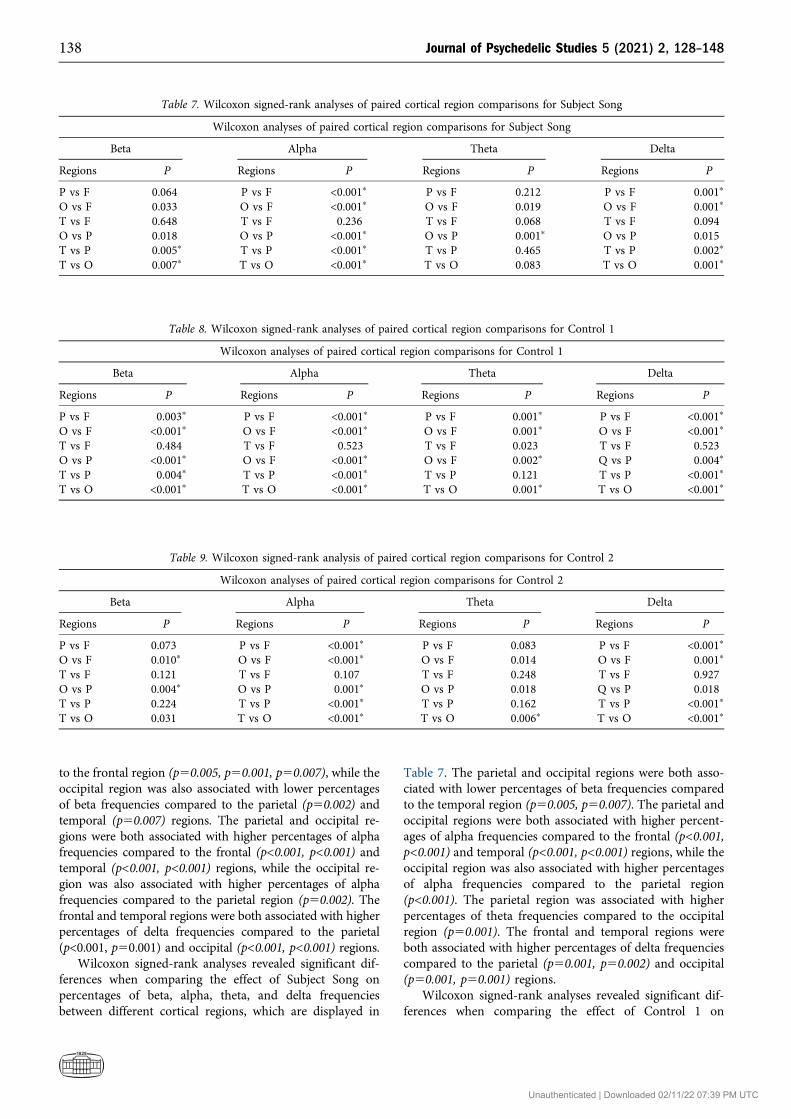
Wilcoxon signed-rank analyses revealed significant dif-ferences when comparing the effect of Subject Song onpercentages of beta, alpha, theta, and delta frequenciesbetween different cortical regions, which are displayed in
Table 7. The parietal and occipital regions were both asso-ciated with lower percentages of beta frequencies comparedto the temporal region (p50.005, p50.007). The parietal andoccipital regions were both associated with higher percent-ages of alpha frequencies compared to the frontal (p<0.001,p<0.001) and temporal (p<0.001, p<0.001) regions, while theoccipital region was also associated with higher percentagesof alpha frequencies compared to the parietal region(p<0.001). The parietal region was associated with higherpercentages of theta frequencies compared to the occipitalregion (p50.001). The frontal and temporal regions wereboth associated with higher percentages of delta frequenciescompared to the parietal (p50.001, p50.002) and occipital(p50.001, p50.001) regions.
Wilcoxon signed-rank analyses revealed significant dif-ferences when comparing the effect of Control 1 on
Table 7. Wilcoxon signed-rank analyses of paired cortical region comparisons for Subject Song
Wilcoxon analyses of paired cortical region comparisons for Subject Song
Beta Alpha Theta Delta
Regions P Regions P Regions P Regions P
P vs F 0.064 P vs F <0.001p P vs F 0.212 P vs F 0.001p
O vs F 0.033 O vs F <0.001p O vs F 0.019 O vs F 0.001p
T vs F 0.648 T vs F 0.236 T vs F 0.068 T vs F 0.094O vs P 0.018 O vs P <0.001p O vs P 0.001p O vs P 0.015T vs P 0.005p T vs P <0.001p T vs P 0.465 T vs P 0.002p
T vs O 0.007p T vs O <0.001p T vs O 0.083 T vs O 0.001p
Table 8. Wilcoxon signed-rank analyses of paired cortical region comparisons for Control 1
Wilcoxon analyses of paired cortical region comparisons for Control 1
Beta Alpha Theta Delta
Regions P Regions P Regions P Regions P
P vs F 0.003p P vs F <0.001p P vs F 0.001p P vs F <0.001p
O vs F <0.001p O vs F <0.001p O vs F 0.001p O vs F <0.001p
T vs F 0.484 T vs F 0.523 T vs F 0.023 T vs F 0.523O vs P <0.001p O vs F <0.001p O vs F 0.002p Q vs P 0.004p
T vs P 0.004p T vs P <0.001p T vs P 0.121 T vs P <0.001p
T vs O <0.001p T vs O <0.001p T vs O 0.001p T vs O <0.001p
Table 9. Wilcoxon signed-rank analysis of paired cortical region comparisons for Control 2
Wilcoxon analyses of paired cortical region comparisons for Control 2
Beta Alpha Theta Delta
Regions P Regions P Regions P Regions P
P vs F 0.073 P vs F <0.001p P vs F 0.083 P vs F <0.001p
O vs F 0.010p O vs F <0.001p O vs F 0.014 O vs F 0.001p
T vs F 0.121 T vs F 0.107 T vs F 0.248 T vs F 0.927O vs P 0.004p O vs P 0.001p O vs P 0.018 Q vs P 0.018T vs P 0.224 T vs P <0.001p T vs P 0.162 T vs P <0.001p
T vs O 0.031 T vs O <0.001p T vs O 0.006p T vs O <0.001p
138 Journal of Psychedelic Studies 5 (2021) 2, 128–148
Unauthenticated | Downloaded 02/11/22 07:39 PM UTC

percentages of beta, alpha, theta, and delta frequencies be-tween different cortical regions, which are displayed in Ta-ble 8. The parietal and occipital regions were both associatedwith lower percentages of beta frequencies compared to thefrontal (p50.003, p<0.001) and temporal (p50.004, p<0.001)regions, while the occipital region was also associated withlower percentages of beta frequencies compared to the pa-rietal region (p<0.001). The parietal and occipital regionswere both associated with higher percentages of alpha fre-quencies compared to the frontal (p<0.001, p<0.001) andtemporal (p<0.001, p<0.001) regions, while the occipitalregion was also associated with higher percentages of alphafrequencies compared to the parietal region (p<0.001). Thefrontal, parietal, and temporal regions were all associatedwith higher percentages of theta frequencies compared tothe occipital region (p50.001, p50.002, p50.001), while thefrontal region was also associated with higher percentages oftheta frequencies compared to the parietal region (p50.001).The frontal and temporal regions were both associated withhigher percentages of delta frequencies compared to theparietal (p<0.001, p<0.001) and occipital (p<0.001, p<0.001)regions, while the parietal region was also associated withhigher percentages of delta frequencies compared to theoccipital region (p50.004).
Wilcoxon signed-rank analyses revealed significant dif-ferences when comparing the effect of Control 2 on per-centages of beta, alpha, theta, and delta frequencies betweendifferent cortical regions, which are displayed in Table 9.The occipital region was associated with lower percentagesof beta frequencies compared to both the frontal (p50.010)and parietal (p50.004) regions. The parietal and occipitalregions were both associated with higher percentages ofalpha frequencies compared to the frontal (p<0.001,p<0.001) and temporal (p<0.001, p<0.001) regions, while theoccipital region was also associated with higher percentagesof alpha frequencies compared to the parietal region(p50.001). The temporal region was associated with higherpercentages of theta frequencies compared to the occipitalregion (p50.006). The frontal and temporal regions wereboth associated with higher percentages of delta frequenciescompared to the parietal (p<0.001, p<0.001) and occipital(p50.001, p<0.001) regions.
Subject music preference
Mean subject ratings and rankings for music genres andcontrols are displayed in Table 10. A positive correlation(R50.579) was found between subject ratings for GoaTrance and theta frequency percentages in the temporalregion (p50.004). There were no other significant correla-tions observed between subject ratings and frequency band
percentages for any other music genre or control in anycortical region. No significant correlations were observedbetween subject rankings and frequency band percentagesfor any music genre or control in any cortical region.
Subject gender and music training
Gender was not found to have a significant influence onbeta, alpha, theta, or delta frequency percentages in anycortical region. Music training was associated with higherdelta frequency percentages in the frontal region (p50.002),as displayed in Fig. 3.
DISCUSSION
Several findings from this study support those of previousmusic therapy studies, while other findings provide novelinsights regarding how different music genres and pertinentvariables affect neurophysiological activity in the humancerebral cortex. This study also provides further supportiveevidence that various genres of music may impact the cen-tral nervous system by promoting changes in cerebral cortexactivity that have similarities to NREM sleep, while thelistener remains awake (Baumgartner et al., 2006; Brittonet al., 2016; Jacobs and Friedman, 2004; Kabuto et al., 1993;Lin et al., 2010; White and Richard, 2009).
Music genre comparisons
Lower percentages of beta frequencies were found to bestrongly associated with several music genres and controlswithin individual cortical regions, including Control 1 and 2in the occipital region, and Tribal Downtempo, Psytrance,Goa Trance, and Control 2 in the temporal region. Giventhat decreased beta frequency activity is observed duringstages of NREM sleep, these findings support those of pre-vious music therapy studies which suggest that various typesof music may impact the central nervous system by pro-moting changes in cerebral cortex activity that have simi-larities to NREM sleep, while the listener remains awake(Baumgartner et al., 2006; Britton et al., 2016; Jacobs andFriedman, 2004; Kabuto et al., 1993; Lin et al., 2010; Whiteand Richard, 2009). However, given that our chosen non-musical control (Victoria Falls waterfall audio recording)was quite pleasant and was associated with a similarreduction in percentages of beta frequencies in comparisonto several other music genres, it is difficult to draw strongconclusions from these findings. Future studies should betterinvestigate music genres and non-musical controls byincluding a randomized control within each subject’s music
Table 10. Mean subject ratings (1 5 worst, 10 5 best) and rankings (1 5 best, 5 5 worst) for music genres and controls
Mean subject ratings & ranking tor randomized music genres & controls
Control 1 Classical Tribal Psytrance Goa Subject Control 2 SD
Ratings 3.17 7.80 6.43 5.94 5.91 9.63 N/A 2.16Rankings N/A 2.70 3.43 3.74 3.91 1.22 N/A 1.10
Journal of Psychedelic Studies 5 (2021) 2, 128–148 139
Unauthenticated | Downloaded 02/11/22 07:39 PM UTC

sequence, and by selecting controls that are less pleasant orrelaxing (e.g., television static, radio static, traffic noise, etc.).
Higher percentages of alpha frequencies were found to bemost strongly associated with controls within individualcortical regions. Most of these significant differences wereassociated with Control 2 (frontal, parietal, and temporalregions), whereas only one was associated with Control 1(occipital region). These results may be related to thepleasant nature of our chosen control (Victoria Fallswaterfall audio recording), as suggested by previous music-EEG studies that observed increased alpha frequency activityin response to pleasant music (Kabuto et al., 1993; Lin et al.,2010). The only difference between Control 1 and 2 is thatControl 2 was played at the end of each subject’s musicsequence, whereas Control 1 was played at the beginning ofthe sequence. This suggests that subjects may have beenmore relaxed towards the end of their music sequence. Thispossibility was anticipated during planning of this study, andwas controlled for by randomizing the sequence of musicgenres for each subject, and thus, the potentially relaxingnature of the overall music sequence should not havesignificantly impacted the results we observed across themusic genres investigated in this study. In future studies, itwould be helpful to incorporate a randomized control in themusic sequence, in addition to the flanking controls, to betterassess cortical responses for a control that does not alwaysoccur at the same points in a subject’s music sequence. Itwould also be helpful to select a less pleasant control, such astelevision static, radio static, or an audio recording that isrepresentative of typical non-musical noise encounteredduring one’s usual daily routine, such as traffic noise.
Higher percentages of theta frequencies were found to bemost strongly associated with Psytrance within individualcortical regions. Tribal Downtempo and Classical alsoexhibited significant but weaker associations. The superiorassociation observed between Psytrance and higher per-centages of theta frequencies may be attributed to its uniquesixteenth note rhythmic beat structure, as that is the primarydifference between Psytrance and the other music genresinvestigated in this study, including Goa Trance. Goa Trancelacks the unique sixteenth note rhythmic beat structure that
is found in Psytrance, but is otherwise very similar. Furtherinvestigation is warranted to better clarify the reasons whyPsytrance exhibited a superior association with higher per-centages of theta frequencies compared to the other studiedmusic genres. Given that increased theta frequency activity isobserved during stages of NREM sleep, these findings sup-port those of previous music therapy studies which suggestthat various types of music may impact the central nervoussystem by promoting changes in cerebral cortex activity thathave similarities to NREM sleep, while the listener remainsawake (Baumgartner et al., 2006; Jacobs and Friedman, 2004;Kabuto et al., 1993; Lin et al., 2010).
Higher percentages of delta frequencies were found to bemost strongly associated with Psytrance within individualcortical regions. Goa Trance also exhibited a significant butweaker association. The superior association observed be-tween Psytrance and higher percentages of delta frequenciesmay again be attributed to its unique sixteenth note rhyth-mic beat structure. However, the finding that Goa Trancealso had a significant association, although far less robustthan what was observed for Psytrance, suggests that thecompositional structure of Goa Trance may be similarenough to that of Psytrance that there is some overlap orsharing in their ability to increase delta frequency activity inthe cerebral cortex of listeners. Goa Trance has a very similarcompositional structure to that of Psytrance, and although itlacks the sixteenth note beat structure found in Psytrance, itstill is typically composed of melodies and harmonies madefrom sixteenth notes layered over a standard quarter notebeat structure. Further investigation is warranted to betterclarify the reasons why Psytrance exhibited a superior as-sociation with higher percentages of delta frequenciescompared to the other studied music genres. Given thatincreased delta frequency activity is observed during stagesof NREM sleep, these findings support those of previousmusic therapy studies which suggest that various types ofmusic may impact the central nervous system by promotingchanges in cerebral cortex activity that have similarities toNREM sleep, while the listener remains awake (Baumgartneret al., 2006; Jacobs and Friedman, 2004; Kabuto et al., 1993;Lin et al., 2010).
Fig. 3. Impact of music training on percentages of delta frequencies in the frontal region
140 Journal of Psychedelic Studies 5 (2021) 2, 128–148
Unauthenticated | Downloaded 02/11/22 07:39 PM UTC
Overall, we observed several findings consistent withprevious music therapy studies, including findings whichsuggest that various types of music influence the centralnervous system by promoting changes in cerebral cortexactivity that have similarities to NREM sleep, while thelistener remains awake (Baumgartner et al., 2006; Jacobs andFriedman, 2004; Kabuto et al., 1993; Lin et al., 2010).Additionally, by comparing a variety of carefully selectedmusic genres and controls, we observed potentially novelinsights regarding how some music genres may have a morerobust association with these changes in cerebral cortexactivity, such as the observed findings regarding Psytranceand higher percentages of theta and delta frequencies.
Cortical region comparisons
Lower percentages of beta frequencies and higher percent-ages of alpha frequencies were found to be most stronglyassociated with the parietal and occipital regions in com-parison to other cortical regions, with the most robust as-sociation being observed in the occipital region. Thesefindings were rather consistent across all music genres andcontrols. The observed association of lower percentages ofbeta frequencies in both the parietal and occipital regionsappears to be closely correlated to the association weobserved of higher percentages of alpha frequencies in boththe parietal and occipital regions. Both the frontal andtemporal regions showed significantly higher percentages oftheta and delta frequencies when compared to other corticalregions. In contrast, the lowest percentages of theta fre-quencies were observed in the parietal and occipital regions.These findings suggest that individual cortical regions haveunique, region-specific responses to music that remainsomewhat consistent across a variety of musical (i.e., musicgenres) and non-musical (i.e., controls) auditory input.
Given that the unique responses of each individualcortical region were observed to be rather consistent acrossall music genres and controls, these findings suggest thatalthough individual cortical regions exhibit different fre-quency band responses in comparison to each other whensubjected to a particular music genre, individual corticalregions still respond rather consistently across a wide varietyof musical (i.e., music genres) and non-musical (i.e., con-trols) auditory input. These findings are similar to what wasobserved in other music-EEG studies, including one whichreported increased alpha frequency activity in the occipitalregion in response to Classical music and other “pleasant”types of music (Kabuto et al., 1993; Lin et al., 2010).
Subject music preference
The observed correlation between subject music genre ratingsand the association of Goa Trance with higher percentages oftheta frequencies in the temporal region suggests that subjectmusic preference may possibly influence the amount of thetaactivity in the temporal region when listening to music, butthis finding is likely spurious since no other relationship wasfound between subject ratings or rankings for any othermusic genre or control in any cortical region. This finding,
although statistically significant, is rather inconclusive, andfurther investigation is both warranted and encouraged.Given that no other significant correlations were observedbetween subject music preferences and percentages of beta,alpha, theta, or delta frequencies, these findings suggestoverall that subject music preference does not significantlyinfluence the percentages of each frequency band that aregenerated within a given cortical region when listening tovarious music genres. Overall, our findings suggest thatpersonal music preferences do not have a significant influ-ence on frequency band percentages in the cerebral cortex.
The lack of significant correlations observed betweensubject music preferences and frequency band percentagesin all cortical regions is supported by other findings dis-cussed in previous sections of this study, such as the findingthat the music genres which were most effective at signifi-cantly modifying percentages of beta, alpha, theta, or deltafrequencies were not rated or ranked very favorably by mostsubjects (e.g., Controls, Psytrance, etc.). However, it isimportant to note that these findings do not address thelikely possibility that personal music preferences may stillplay an important role in the subjective sensations (e.g.,relaxation, pleasure, happiness, etc.) that are experiencedwhen listening to various music genres.
Subject gender and music training
The lack of significant findings observed when examining theeffect of subject gender on percentages of beta, alpha, theta,and delta frequencies in the cerebral cortex suggests that musichas a similar impact on EEG activity in males and femaleswithin individual frequency bands and cortical regions.However, our study did not compare individual EEG leads,individual cerebral hemispheres, or other related variables thatcould still potentially be influenced by gender. Although ourstudy did not find any gender-related differences whencomparing individual frequency bands and cortical regions, aprevious music-EEG study did observe gender-related differ-ences in cortical music processing when comparing individualcerebral hemispheres (Koelsch et al., 2003). Given this finding,future studies should examine both interregional and inter-hemispheric cortical comparisons to further elucidate potentialgender-related differences in cortical music processing.
The finding that subjects with prior music trainingshowed higher percentages of delta frequencies in the frontalregion suggests that music training may enable subjects tohave stronger neurophysiological responses to music in thefrontal cortex, at least in regards to delta activity. Thisfinding may potentially be related to the frontal lobe’s as-sociation with executive function, judgment, cognition, andabstract thought. This possibility is supported by othermusic therapy studies which have described multiplecognitive processes, including some with contribution fromthe frontal lobe, that have been associated with musicperception and processing (Maeyama et al., 2009; Shabanloeiet al., 2010). Given that prior music training did not have asignificant influence on percentages of beta, alpha, theta, ordelta frequencies in any other area of the cerebral cortex, the
Journal of Psychedelic Studies 5 (2021) 2, 128–148 141
Unauthenticated | Downloaded 02/11/22 07:39 PM UTC
potential influence of prior music training on musicperception and cortical processing may be limited to thefrontal lobe.
Study limitations and future research
This study has a number of limitations that could beimproved during future research. A larger sample size wouldbe beneficial and would allow for stronger conclusions to bedrawn. Subjects could be asked to abstain from routinelyencountered psychoactive chemicals for a longer period oftime (e.g., >12 h), since many medications and chemicalscontinue having psychoactive effects beyond the 6-h abstinentperiod required by this study. Subjects also could be screenedto rule out recent consumption of long-acting psychoactivechemicals, such as certain amphetamines (e.g., Adderall),benzodiazepines (e.g., Klonopin), antidepressants (e.g.,Zoloft), etc. Future studies may be improved by utilizingdifferent subject groups based on certain variables (e.g., age,ethnicity, etc.), allowing for intergroup comparisons and adeeper understanding of the resulting EEG data.
Future studies may be improved by focusing on a smallernumber of variables during the investigation. Because ourstudy attempted to investigate a large number of differentvariables, there were many pieces of data we collected fromsubjects that we were unable to include in our analysis due tolimitations in time, personnel, and length of this manuscript.For example, we assessed the ethnicity of each subject usingour pre-music questionnaire, as well as the familiarity of eachsubject with the music genres utilized in our study, but wereunable to thoroughly investigate these data and variables.Although we did investigate the potential influence of subjectmusic preference in this study, we did not investigate otherclosely related variables using other subjective informationthat we gathered in our pre-music questionnaire, such assubject ethnicity and familiarity with each music genre.
Future studies may be improved by using a non-musicalcontrol that more accurately represents commonlyencountered non-musical noise (e.g., television static, radiostatic, traffic noise, footsteps, etc.). The soft, monotonouswaterfall recording used as the only control in this study wassuboptimal, as it was quite pleasant and relaxing for manysubjects, which may have influenced some of our findingsand confounded various comparative analyses. Selecting amore common, less pleasant non-musical control wouldprovide a stronger comparison between music genres andnon-musical sound in future studies. The randomized musicsequences could potentially be improved if the non-musicalcontrol was randomized like the other music genres, ratherthan only flanking each music sequence with controls at thebeginning and end. Choosing not to randomize the non-musical controls somewhat limited this study’s ability toassess how subjects truly responded to the controls. Musicsequences used in future studies that standardize the lengthof each song may benefit from gradually fading in thebeginning and/or fading out the ending of each song toavoid any unintended abruptness that is created during theprocess of standardizing song lengths (e.g., cropping), and to
avoid atypical introductions or endings of songs that are nottruly representative of that music genre (e.g., lyrics at thebeginning or end of a song that does not typically havelyrics, such as classical music).
Future studies should consider investigating additionalmusic genres, as there are many common and popular musicgenres that we did not investigate in this study. In addition tostudying other music genres, future studies could also inves-tigate audio recordings from individual musical instruments,such as the piano, flute, trumpet, violin, etc. Future studiesshould also be performed to investigate the influence of lyricsin music by comparing lyrical to non-lyrical music. Futurestudies should also consider investigating other importantvariables that distinguish different music genres from eachother, such as tempo, time signature, harmonics, melody,pitch, tone, etc. For example, it is possible that faster musicgenres may be associated with significantly different EEGactivity compared to slower music genres. Future studiescould also be improved by utilizing EEG power analysis ofeach frequency band, rather than examining the percentagesof each frequency band, as frequency band power analysis isoften utilized by studies that analyze EEG data.
Future studies could also be improved by taking into ac-count the unilateral nature of certain EEG leads to allow forinterhemispheric comparisons, as has been done in someprevious music therapy studies (Koelsch et al., 2003). Ratherthan simply grouping individual leads according to corticalregion, individual leads could easily be grouped based on bothcortical region and hemisphere (e.g., left temporal, rightfrontal, etc.), allowing for additional comparisons and vari-ables to be analyzed with little additional effort. Future studiescould also combine monitoring of various therapeutic vari-ables with monitoring of EEG data to draw stronger corre-lations between therapeutic outcomes and specific EEGfindings. For example, it would require little additional effortto monitor basic physiological variables such as blood pres-sure, heart rate, etc., and subjective variables such as mood,pleasure, anxiety, etc., while subjects complete their musicsequence using a data collection protocol similar to this study.
Potential bias in the study could be prevented by blindingthe individuals who measured the EEG data from the orderof the songs in each music sequence. Potential bias could alsobe prevented by using multiple representative songs for eachmusic genre, and by having multiple individuals select thesongs used to represent each music genre, given that differentindividuals may disagree as to whether or not an individualsong is an appropriate representation of a broad music genre.This study used only one song to represent each music genre,and only one individual selected the songs (except for SubjectSong). This study was also biased by the age and occupationof the subjects, as most subjects were young adults who weregraduate or undergraduate students.
CONCLUSIONS
Controls were associated with lower percentages of betafrequencies than the music genres, while Psytrance, Goa
142 Journal of Psychedelic Studies 5 (2021) 2, 128–148
Unauthenticated | Downloaded 02/11/22 07:39 PM UTC

Trance, and Tribal Downtempo also had significant butweaker associations. Controls were also associated withhigher percentages of alpha frequencies than the musicgenres. Psytrance was associated with higher percentages oftheta frequencies than the other music genres and controls,while Tribal Downtempo and Classical also had significantbut weaker associations. Psytrance was also associated withhigher percentages of delta frequencies than the other musicgenres and controls, while Goa Trance also had a significantbut weaker association.
The lowest percentages of beta frequencies and thehighest percentages of alpha frequencies across all musicgenres and controls occurred in the occipital and parietalregions. The highest percentages of theta and delta fre-quencies across all music genres and controls occurred in thefrontal and temporal regions. Subjects with prior musictraining exhibited higher percentages of delta frequencies inthe frontal region. Subject gender and music preference didnot have a significant influence on frequency band per-centages.
Findings from this study support those of previous musictherapy studies and provide novel insights regarding music’sinfluence on human neurophysiology. These findings alsosupport the hypothesis that music may promote changes incerebral cortex activity that have similarities to NREM sleep,while the listener remains awake. Additionally, findingsfrom this study suggest that certain music genres may have amore robust association with these changes in cerebralcortex activity than other genres.
This study expands upon our current understanding ofmusic’s influence on the human brain and body byproviding evidence that further elucidates the neurophysi-ological activity that arises in the cerebral cortex whenlistening to various music genres. Future studies are neededto better investigate and clarify these findings. The authorsof this study encourage the scientific and medical commu-nities to further investigate music’s therapeutic propertiesand its ability to influence human physiology. By improvingour understanding of the physiological effects of music, wecan more effectively apply music as an adjuvant therapeuticmodality to benefit humankind.
APPENDIX
Neurofax EEG system (EEG-1200A)• Product URL: https://eu.nihonkohden.com/en/products/
neurology/neurofax.html
• Manufacturer URL: https://eu.nihonkohden.com
WinEEG analysis software• User Manual: http://bio-medical.com/media/support/wineeg.pdf
• Product URL: https://bio-medical.com/wineeg-advanced-software-for-mitsar.html
• Manufacturer URL: http://www.novatecheeg.com
Pre-music questionnaire• What is your Name? What is your Age? What is yourGender? What is your Ethnicity?
• Have you ever had any type of musical training, e.g., haveyou ever composed or produced music, played a musicalinstrument, or had singing lessons?
• If so, what music training do you have and how much?
• What are your three most favorite genres of music (any)?• What are your three least favorite genres of music (any)?
• Have you heard songs from any of this study’s musicgenres before?
1. If so, how many times have you heard a song from eachgenre?
2. If so, how do you feel about the genres (i.e., like, dislike,neutral)?
• How much sleep did you get last night?
• How tired do you feel on a scale of 1–10 (15 very alert; 105 extremely tired)?
Visual Analog Scale (VAS) used for subject rating ofeach music genre
Post-music questionnaire• Now that you have heard all five music genres, will youplease rank the songs you heard in order of how much youliked them?
• List the songs in order of how much you liked them,starting with the song you liked most in the #1 position atthe top, and finishing with the song you liked least in the#5 position at the bottom.
• Did you fall asleep at all during the music therapy session?
• Do you have any questions or concerns?
Journal of Psychedelic Studies 5 (2021) 2, 128–148 143
Unauthenticated | Downloaded 02/11/22 07:39 PM UTC
Study images
Image 1. Illinois Neurological Institute (INI) – OSF Saint FrancisMedical Center – Peoria, IL, USA
Image 2. Nihon Kohden Neurofax EEG hardware
Image 3. Data collection during a subject's music sequence(bedside)
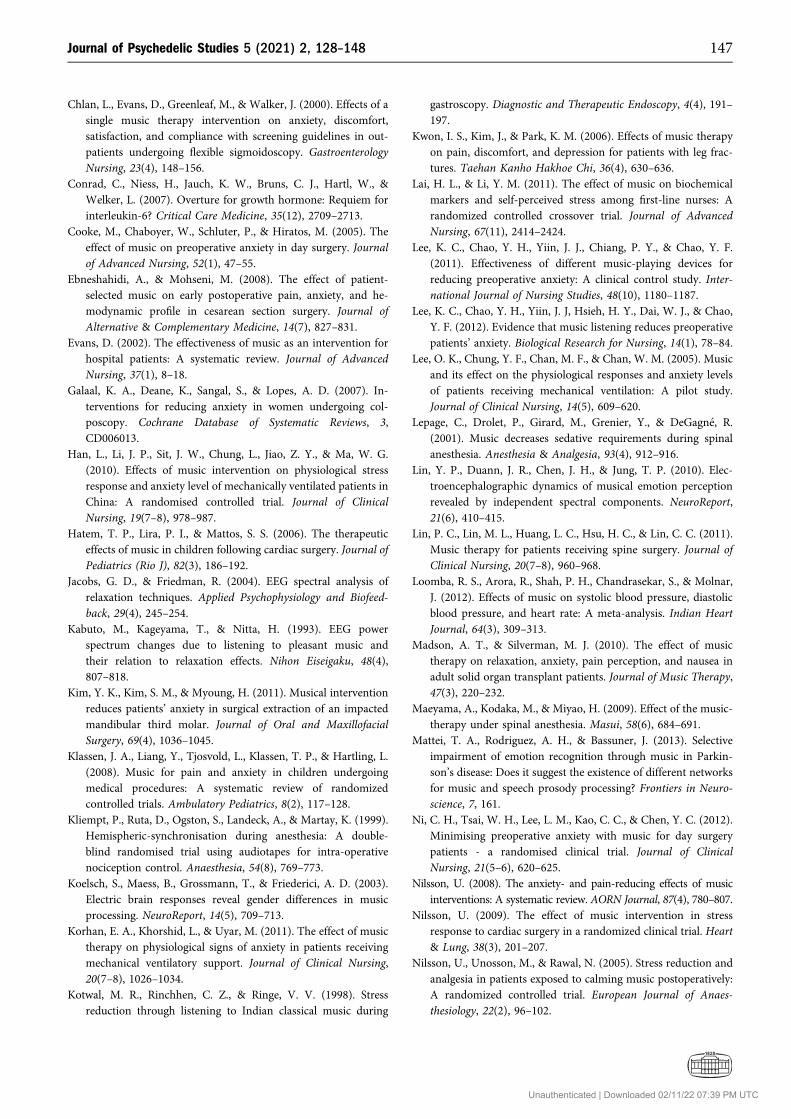
Image 4. Data collection during a subject's music sequence(monitor room)
144 Journal of Psychedelic Studies 5 (2021) 2, 128–148
Unauthenticated | Downloaded 02/11/22 07:39 PM UTC
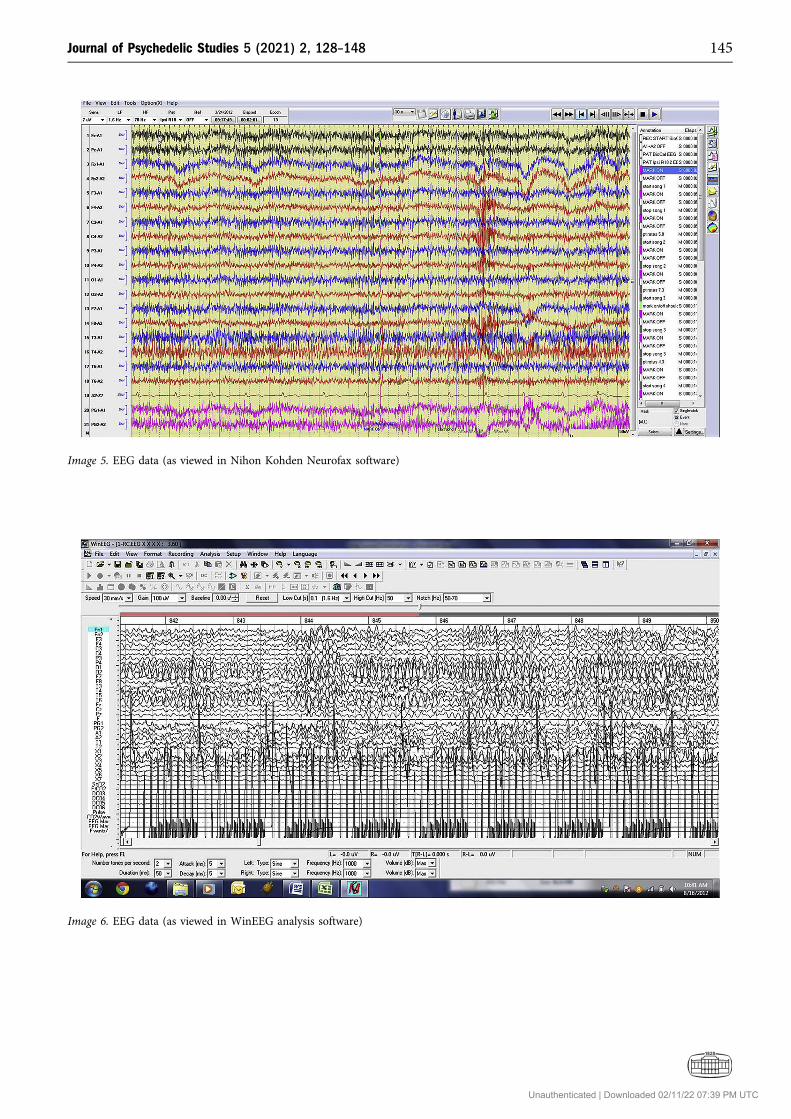
Image 5. EEG data (as viewed in Nihon Kohden Neurofax software)
Image 6. EEG data (as viewed in WinEEG analysis software)
Journal of Psychedelic Studies 5 (2021) 2, 128–148 145
Unauthenticated | Downloaded 02/11/22 07:39 PM UTC

REFERENCES
Aragon, D., Farris, C., & Byers, J. F. (2002). The effects of harpmusic in vascular and thoracic surgical patients. AlternTherHealth Med, 8(5), 52–54, [56–60].
Baumgartner, T., Esslen, M., & J€ancke, L. (2006). From emotionperception to emotion experience: Emotions evoked by picturesand classical music. International Journal of Psychophysiology,60(1), 34–43. [Epub 2005].
Binek, J., Sagmeister, M., Borovicka, J., Knierim, M., Magdeburg, B.,& Meyenberger, C. (2003). Perception of gastrointestinalendoscopy by patients and examiners with and without back-ground music. Digestion, 68(1), 5–8.
Bradt, J., & Dileo, C. (2009). Music for stress and anxiety reductionin coronary heart disease patients. Cochrane Database of Sys-tematic Reviews, 2.
Bradt, J., Dileo, C., Grocke, D., & Magill, L. (2011). Music in-terventions for improving psychological and physical outcomesin cancer patients. Cochrane Database of Systematic Reviews, 8.
Bringman, H., Giesecke, K., Th€orne, A., & Bringman, S. (2009).Relaxing music as pre-medication before surgery: A rando-mised controlled trial. Acta Anaesthesiologica Scandinavica,53(6), 759–764.
BrittonJ. W., FreyL. C., HoppJ. L. , authors; St. Louis, E. K., Frey, L.C. editors. (2016). Electroencephalography (EEG): An intro-ductory text and atlas of normal and abnormal findings inadults, children, and infants [internet]. Chicago: AmericanEpilepsy Society.
Buffum, M. D., Sasso, C., Sands, L. P., Lanier, E., Yellen, M., &Hayes, A. (2006). A music intervention to reduce anxiety beforevascular angiography procedures. Journal of Vascular Nursing,24(3), 68–73.
Chan, M. F., Chan, E. A., Mok, E., & Kwan Tse, F. Y. (2009). Effectof music on depression levels and physiological responses incommunity-based older adults. International Journal of MentalHealth Nursing, 18(4), 285–294.
Chan, Y. M., Lee, P. W., Ng, T. Y., Ngan, H. Y., & Wong, L. C.(2003). The use of music to reduce anxiety for patients under-going colposcopy: A randomized trial. Gynecologic Oncology,91(1), 213–217.
Image 7. Quantitative analysis of EEG data (as viewed in WinEEG analysis software)
Image 8. Thank you to Illinois Neurological Institute for providingfunding for this study
146 Journal of Psychedelic Studies 5 (2021) 2, 128–148
Unauthenticated | Downloaded 02/11/22 07:39 PM UTC
Chlan, L., Evans, D., Greenleaf, M., & Walker, J. (2000). Effects of asingle music therapy intervention on anxiety, discomfort,satisfaction, and compliance with screening guidelines in out-patients undergoing flexible sigmoidoscopy. GastroenterologyNursing, 23(4), 148–156.
Conrad, C., Niess, H., Jauch, K. W., Bruns, C. J., Hartl, W., &Welker, L. (2007). Overture for growth hormone: Requiem forinterleukin-6? Critical Care Medicine, 35(12), 2709–2713.
Cooke, M., Chaboyer, W., Schluter, P., & Hiratos, M. (2005). Theeffect of music on preoperative anxiety in day surgery. Journalof Advanced Nursing, 52(1), 47–55.
Ebneshahidi, A., & Mohseni, M. (2008). The effect of patient-selected music on early postoperative pain, anxiety, and he-modynamic profile in cesarean section surgery. Journal ofAlternative & Complementary Medicine, 14(7), 827–831.
Evans, D. (2002). The effectiveness of music as an intervention forhospital patients: A systematic review. Journal of AdvancedNursing, 37(1), 8–18.
Galaal, K. A., Deane, K., Sangal, S., & Lopes, A. D. (2007). In-terventions for reducing anxiety in women undergoing col-poscopy. Cochrane Database of Systematic Reviews, 3,CD006013.
Han, L., Li, J. P., Sit, J. W., Chung, L., Jiao, Z. Y., & Ma, W. G.(2010). Effects of music intervention on physiological stressresponse and anxiety level of mechanically ventilated patients inChina: A randomised controlled trial. Journal of ClinicalNursing, 19(7–8), 978–987.
Hatem, T. P., Lira, P. I., & Mattos, S. S. (2006). The therapeuticeffects of music in children following cardiac surgery. Journal ofPediatrics (Rio J), 82(3), 186–192.
Jacobs, G. D., & Friedman, R. (2004). EEG spectral analysis ofrelaxation techniques. Applied Psychophysiology and Biofeed-back, 29(4), 245–254.
Kabuto, M., Kageyama, T., & Nitta, H. (1993). EEG powerspectrum changes due to listening to pleasant music andtheir relation to relaxation effects. Nihon Eiseigaku, 48(4),807–818.
Kim, Y. K., Kim, S. M., & Myoung, H. (2011). Musical interventionreduces patients’ anxiety in surgical extraction of an impactedmandibular third molar. Journal of Oral and MaxillofacialSurgery, 69(4), 1036–1045.
Klassen, J. A., Liang, Y., Tjosvold, L., Klassen, T. P., & Hartling, L.(2008). Music for pain and anxiety in children undergoingmedical procedures: A systematic review of randomizedcontrolled trials. Ambulatory Pediatrics, 8(2), 117–128.
Kliempt, P., Ruta, D., Ogston, S., Landeck, A., & Martay, K. (1999).Hemispheric-synchronisation during anesthesia: A double-blind randomised trial using audiotapes for intra-operativenociception control. Anaesthesia, 54(8), 769–773.
Koelsch, S., Maess, B., Grossmann, T., & Friederici, A. D. (2003).Electric brain responses reveal gender differences in musicprocessing. NeuroReport, 14(5), 709–713.
Korhan, E. A., Khorshid, L., & Uyar, M. (2011). The effect of musictherapy on physiological signs of anxiety in patients receivingmechanical ventilatory support. Journal of Clinical Nursing,20(7–8), 1026–1034.
Kotwal, M. R., Rinchhen, C. Z., & Ringe, V. V. (1998). Stressreduction through listening to Indian classical music during
gastroscopy. Diagnostic and Therapeutic Endoscopy, 4(4), 191–197.
Kwon, I. S., Kim, J., & Park, K. M. (2006). Effects of music therapyon pain, discomfort, and depression for patients with leg frac-tures. Taehan Kanho Hakhoe Chi, 36(4), 630–636.
Lai, H. L., & Li, Y. M. (2011). The effect of music on biochemicalmarkers and self-perceived stress among first-line nurses: Arandomized controlled crossover trial. Journal of AdvancedNursing, 67(11), 2414–2424.
Lee, K. C., Chao, Y. H., Yiin, J. J., Chiang, P. Y., & Chao, Y. F.(2011). Effectiveness of different music-playing devices forreducing preoperative anxiety: A clinical control study. Inter-national Journal of Nursing Studies, 48(10), 1180–1187.
Lee, K. C., Chao, Y. H., Yiin, J. J, Hsieh, H. Y., Dai, W. J., & Chao,Y. F. (2012). Evidence that music listening reduces preoperativepatients’ anxiety. Biological Research for Nursing, 14(1), 78–84.
Lee, O. K., Chung, Y. F., Chan, M. F., & Chan, W. M. (2005). Musicand its effect on the physiological responses and anxiety levelsof patients receiving mechanical ventilation: A pilot study.Journal of Clinical Nursing, 14(5), 609–620.
Lepage, C., Drolet, P., Girard, M., Grenier, Y., & DeGagn�e, R.(2001). Music decreases sedative requirements during spinalanesthesia. Anesthesia & Analgesia, 93(4), 912–916.
Lin, Y. P., Duann, J. R., Chen, J. H., & Jung, T. P. (2010). Elec-troencephalographic dynamics of musical emotion perceptionrevealed by independent spectral components. NeuroReport,21(6), 410–415.
Lin, P. C., Lin, M. L., Huang, L. C., Hsu, H. C., & Lin, C. C. (2011).Music therapy for patients receiving spine surgery. Journal ofClinical Nursing, 20(7–8), 960–968.
Loomba, R. S., Arora, R., Shah, P. H., Chandrasekar, S., & Molnar,J. (2012). Effects of music on systolic blood pressure, diastolicblood pressure, and heart rate: A meta-analysis. Indian HeartJournal, 64(3), 309–313.
Madson, A. T., & Silverman, M. J. (2010). The effect of musictherapy on relaxation, anxiety, pain perception, and nausea inadult solid organ transplant patients. Journal of Music Therapy,47(3), 220–232.
Maeyama, A., Kodaka, M., & Miyao, H. (2009). Effect of the music-therapy under spinal anesthesia. Masui, 58(6), 684–691.
Mattei, T. A., Rodriguez, A. H., & Bassuner, J. (2013). Selectiveimpairment of emotion recognition through music in Parkin-son’s disease: Does it suggest the existence of different networksfor music and speech prosody processing? Frontiers in Neuro-science, 7, 161.
Ni, C. H., Tsai, W. H., Lee, L. M., Kao, C. C., & Chen, Y. C. (2012).Minimising preoperative anxiety with music for day surgerypatients - a randomised clinical trial. Journal of ClinicalNursing, 21(5–6), 620–625.
Nilsson, U. (2008). The anxiety- and pain-reducing effects of musicinterventions: A systematic review. AORN Journal, 87(4), 780–807.
Nilsson, U. (2009). The effect of music intervention in stressresponse to cardiac surgery in a randomized clinical trial. Heart& Lung, 38(3), 201–207.
Nilsson, U., Unosson, M., & Rawal, N. (2005). Stress reduction andanalgesia in patients exposed to calming music postoperatively:A randomized controlled trial. European Journal of Anaes-thesiology, 22(2), 96–102.
Journal of Psychedelic Studies 5 (2021) 2, 128–148 147
Unauthenticated | Downloaded 02/11/22 07:39 PM UTC
Rudin, D., Kiss, A., Wetz, R. V., & Sottile, V. M. (2007). Music inthe endoscopy suite: A meta-analysis of randomized controlledstudies. Endoscopy, 39(6), 507–510.
Salimpoor, V. N., Benovoy, M., Larcher, K., Dagher, A., & Zatorre,R. J. (2011). Anatomically distinct dopamine release duringanticipation and experience of peak emotion to music. NatureNeuroscience, 14(2), 257–262.
Sendelbach, S. E., Halm, M. A., Doran, K. A., Miller, E. H., &Gaillard, P. (2006). Effects of music therapy on physiologicaland psychological outcomes for patients undergoing cardiacsurgery. Journal of Cardiovascular Nursing, 21(3), 194–200.
Shabanloei, R., Golchin, M., Esfahani, A., Dolatkhah, R., &Rasoulian, M. (2010). Effects of music therapy on pain andanxiety in patients undergoing bone marrow biopsy and aspi-ration. AORN Journal, 91(6), 746–751.
Slevc, L. R., & Okada, B. M. (2015). Processing structure in lan-guage and music: A case for shared reliance on cognitive con-trol. Psychonomic Bulletin & Review, 22(3), 637–652.
Smolen, D., Topp, R., & Singer, L. (2002). The effect of self-selectedmusic during colonoscopy on anxiety, heart rate, and bloodpressure. Applied Nursing Research, 15(3), 126–136.
St. John, G. (2010). Psytrance: An introduction. In The local scenesand global culture of psytrance. Routledge.
Tam, W. W., Wong, E. L., & Twinn, S. F. (2008). Effect of music onprocedure time and sedation during colonoscopy: A meta-analysis. World Journal of Gastroenterology, 14(34), 5336–5343.
Triller, N., Erzen, D., Duh, S., PetrinecPrimozic, M., & Kosnik, M.(2006). Music during bronchoscopic examination: The physi-ological effects. A randomized trial. Respiration, 73(1), 95–99.
Tse, M. M., Chan, M. F., & Benzie, I. F. (2005). The effect of musictherapy on postoperative pain, heart rate, systolic blood
pressures and analgesic use following nasal surgery. Journal ofPain & Palliative Care Pharmacotherapy, 19(3), 21–29.
University Hospitals of Cleveland (2011). History of music therapy.Retrieved January 9, from University Hospitals Music asMedicine: http://www.musicasmedicine.com/about/history.cfm..
Vaajoki, A., Kankkunen, P., Pietil€a, A. M., & Vehvil€ainen-Julkunen,K. (2011). Music as a nursing intervention: Effects of musiclistening on blood pressure, heart rate, and respiratory rate inabdominal surgery patients. Nursing and Health Sciences, 13(4),412–418.
Voss, J. A., Good, M., Yates, B., Baun, M. M., Thompson, A., &Hertzog, M. (2004). Sedative music reduces anxiety and painduring chair rest after open-heart surgery. Pain, 112(1–2), 197–203.
Wang, S. M., Kulkarni, L., Dolev, J., & Kain, Z. N. (2002). Musicand preoperative anxiety: A randomized, controlled study.Anesthesia & Analgesia, 94(6), 1489–1494.
White, N. E., & Richard, L. M. (2009). Chapter 2 – History of thescientific standards of QEEG normative databases. Introductionto quantitative EEG and neurofeedback. 2nd ed. (pp. 29–60).
Yilmaz, E., Ozcan, S., Basar, M., Basar, H., Batislam, E., & Ferhat,M. (2003). Music decreases anxiety and provides sedation inextracorporeal shock wave lithotripsy. Urology, 61(2), 282–286.
Zalewsky, S., Vinker, S., Fiada, I., Livon, D., & Kitai, E. (1998).Background music in the family physician’s surgery: Patientreactions. Harefuah, 135(3–4), 96–97, [168, 167].
Zare, M., Ebrahimi, A. A., & Birashk, B. (2010). The effects ofmusic therapy on reducing agitation in patients with Alz-heimer’s disease, a pre-post study. Int J Geriatr Psychiatry,25(12), 1309–1310.
Open Access. This is an open-access article distributed under the terms of the Creative Commons Attribution-NonCommercial 4.0 International License (https://creativecommons.org/licenses/by-nc/4.0/), which permits unrestricted use, distribution, and reproduction in any medium for non-commercial purposes, provided theoriginal author and source are credited, a link to the CC License is provided, and changes – if any – are indicated.
148 Journal of Psychedelic Studies 5 (2021) 2, 128–148
Unauthenticated | Downloaded 02/11/22 07:39 PM UTC
Copyright © 2022 FDOKUMEN


![Texte und Textsorten [Texts and Genres in Political Discourse, handbook article]](https://static.fdokumen.com/doc/165x107/6321856abc33ec48b20e660f/texte-und-textsorten-texts-and-genres-in-political-discourse-handbook-article.jpg)