Optimal estimation methods under weakened linear restrictions in regression

ARTICLE
Received 7 Aug 2014 | Accepted 30 Mar 2015 | Published 13 May 2015
Neuronal development is promoted by weakenedintrinsic antioxidant defences due to epigeneticrepression of Nrf2Karen F.S. Bell1, Bashayer Al-Mubarak1,*, Marc-Andre Martel1,*, Sean McKay1,*, Nicola Wheelan1,*,
Philip Hasel1,*, Nora M. Markus1,*, Paul Baxter1, Ruth F. Deighton1, Andrea Serio2, Bilada Bilican2,
Sudhir Chowdhry3, Paul J. Meakin3, Michael L.J. Ashford3, David J.A. Wyllie1, Robert H. Scannevin4,
Siddharthan Chandran2, John D. Hayes3 & Giles E. Hardingham1
Forebrain neurons have weak intrinsic antioxidant defences compared with astrocytes, but
the molecular basis and purpose of this is poorly understood. We show that early in mouse
cortical neuronal development in vitro and in vivo, expression of the master-regulator
of antioxidant genes, transcription factor NF-E2-related-factor-2 (Nrf2), is repressed by
epigenetic inactivation of its promoter. Consequently, in contrast to astrocytes or young
neurons, maturing neurons possess negligible Nrf2-dependent antioxidant defences, and
exhibit no transcriptional responses to Nrf2 activators, or to ablation of Nrf2’s inhibitor Keap1.
Neuronal Nrf2 inactivation seems to be required for proper development: in maturing
neurons, ectopic Nrf2 expression inhibits neurite outgrowth and aborization, and electro-
physiological maturation, including synaptogenesis. These defects arise because Nrf2 activity
buffers neuronal redox status, inhibiting maturation processes dependent on redox-sensitive
JNK and Wnt pathways. Thus, developmental epigenetic Nrf2 repression weakens neuronal
antioxidant defences but is necessary to create an environment that supports neuronal
development.
DOI: 10.1038/ncomms8066 OPEN
1 Centre for Integrative Physiology, University of Edinburgh, Edinburgh EH8 9XD, UK. 2 MRC Centre for Regenerative Medicine, University of Edinburgh,Edinburgh EH16 4SB, UK. 3 Medical Research Institute, University of Dundee, Ninewells Hospital and Medical School, Dundee DD1 9SY, UK. 4 Biogen Idec,14 Cambridge Center, Cambridge, Massachusetts 02142, USA. * These authors contributed equally to this work. Correspondence and requests for materialsshould be addressed to G.H. (email: [email protected]).
NATURE COMMUNICATIONS | 6:7066 | DOI: 10.1038/ncomms8066 | www.nature.com/naturecommunications 1
& 2015 Macmillan Publishers Limited. All rights reserved.

In isolation, neurons tend to be more vulnerable to oxidativeinsults than astrocytes partly as a result of weaker antioxidantdefences resulting from lower levels of glutathione and
reduced catalase activity1,2. Astrocytic-derived extrinsic supportis known to play an important role in protecting neurons againstexcessive reactive oxygen species (ROS) production3–5, which islikely to be an important factor in maintaining neuronal viabilitythroughout an organisms lifetime. However, the molecularmechanisms underlying these cell-type-specific differences inantioxidant defences are unclear. Understanding the basis for thelow intrinsic antioxidant capacity of neurons may providetherapeutic targets aimed at boosting their antioxidant defencesas a protective strategy against acute and chronic neurologicaland neurodegenerative disorders associated with oxidative stress6.
The biological rationale for the relatively weak intrinsicantioxidant defences of neurons is unknown. At face value, itseems paradoxical that neurons should be endowed withrelatively weak antioxidant defences: not only do they generatemore ROS than most cell types because of high metabolic activity,but also their post-mitotic and non-regenerative nature meansthat they must survive for many years without being rendereddysfunctional by accumulating oxidative damage. Forebrainneurons receive significant antioxidant support from surroundingastrocytes4,5 (for example, via supply of precursors forglutathione biosynthesis7), which is then utilized by neuronalsystems8, however, the reason why neurons have evolved to neednon-cell autonomous protection is unclear.
The transcription factor NF-E2-related factor 2 (Nrf2) is amaster regulator of antioxidant defences that controls a battery ofantioxidant and detoxification genes containing cognate-bindingsites within their promoters (referred to as antioxidant responseelements, AREs)9. Nrf2 is widely thought to be ubiquitouslyexpressed and has been shown to protect cells against a variety ofstress-induced diseases, and become dysregulated in certaincancers10,11. Basal levels of nuclear Nrf2 are normally quite low,as it is targeted for ubiquitin-mediated degradation by itsinhibitor Keap1 in the cytoplasm. However, in response tooxidative stress or small-molecule inhibitors of Keap1, Nrf2accumulates and translocates to the nucleus where it activates abattery of antioxidant and detoxification genes11,12. Examples ofNrf2 target genes include Catalase (Cat) and glutamate-cysteine-ligase catalytic subunit (Gclc), which catalyses the rate-limitingstep of glutathione biosynthesis13–15. Activation of Nrf2-mediatedgene expression in astrocytes, either via overexpression orpharmacological activation, confers non-cell autonomousprotection to surrounding neurons in a variety of models,including rodent models of neurodegenerative disease, as well ashuman stem cell-derived neuron-astrocyte systems7,16,17.However, the neuronal Nrf2 pathway has been reportedto be weak4,5, although how and why this is the case, is notwell understood.
We show here that both basal and inducible Nrf2 activity incortical neurons is extremely low due to epigenetic repression ofthe Nrf2 gene promoter early in development. Moreover, we showthat inactivation of the Nrf2 pathway provides a more flexibleredox environment, which is crucial for key redox-sensitivesignalling pathways that mediate early neuronal development.Collectively, our study provides both the molecular mechanismand the biological reason behind the apparent paradox of weakneuronal intrinsic antioxidant defences.
ResultsLimited role for Nrf2 in neuronal antioxidant defenses. Asforebrain neurons have been reported to support lower basal andinduced Nrf2-dependent gene expression than astrocytes4,5,
we hypothesized that this may contribute to their differentialvulnerability to oxidative stress. We observed that corticalneurons were more sensitive to an oxidative insult (H2O2) thanastrocytes but that, unlike astrocytes, Nrf2 deficiency did not altertheir vulnerability (Fig. 1a). Moreover, although neuronalexpression of Cat and Gclc, key antioxidant Nrf2 target genes,was lower than in astrocytes (Fig. 1b), Nrf2 deficiency did notaffect their levels in neurons (Fig. 1c), but did in astrocytes(Fig. 1d). Thus, in cortical neurons, basal Nrf2 activity does notcontribute to intrinsic antioxidant defences, partly explaining whyneuronal defences are weak compared with astrocytes.
Hypo-expression of Nrf2 in cortical neurons. Neither pharma-cological activation of Nrf2 by tert-butyl hydroquinone (tBHQ),nor genetic activation of Nrf2 by Keap1-knockout, triggeredinduction of the Nrf2 target genes Hmox1, Srxn1 and xCT inneurons (Fig. 1e–g). In contrast, astrocytes, either on their own orin a mixed culture preparation (containing 90% neurons and 10%astrocytes) supported robust pharmacological activation (Fig. 1e,f)that was abolished in Nrf2–/– cultures (Supplementary Fig. 1a forHmox118, for xCT and Srxn1), as well as elevated Nrf2 target geneexpression in a Keap1-deficient background (Fig. 1h,i). We alsoperformed experiments under 5% O2 conditions to eliminate thepossibility that the neuronal Nrf2 pathway was maximally inducedby ambient air conditions. However, unlike mixed astrocyte/neuronal cultures, neuronal cultures showed no induction of Nrf2target genes by tBHQ at 5% O2 (Fig. S1b).
Cortical neurons are therefore unable to mount significantNrf2-mediated transcriptional responses, raising the questionabout the mechanistic basis for this. Although Nrf2 protein isdynamically regulated at the level of Keap1-mediated degrada-tion, the fact that no gene induction was observed in Keap1–/–
neurons suggests the lack of a functional Nrf2 pathway is due topre-translational events. This concept is supported by ourobservations that forced expression of Nrf2 in neurons inducesexpression of Nrf2 target genes such as Srxn1 (ref. 19) andHmox1 (Supplementary Fig. 1c), resulting in the protection ofneurons against oxidative stress19 and oxygen-glucosedeprivation (Supplementary Fig. 1d). This suggests that Nrf2target genes are amenable to activation in neurons when Nrf2 ispresent, but that levels of endogenous neuronal Nrf2 areinsufficient to mediate such induction. We therefore studiedneuronal Nrf2 mRNA expression and found it to be less than 2%of that found in astrocytes (Fig. 1j) consistent with previousobservations4,5. Moreover, the increase in Nrf2 protein stimulatedin neurons by tBHQ or proteosomal inhibition is markedly lowerthan in astrocytes or mixed neuronal-astrocyte cultures (Fig. 1k,l).
We wanted to determine whether hypo-expression of Nrf2 isalso a feature of neurons in vivo. Adult mouse cortices weresubjected to fluorescence-activated cell sorting (FACS), usinga method that separates neurons from non-neurons basedon NeuN-positive immunofluorescence, while preserving thecapacity to extract RNA20 (Supplementary Fig. 1e). As well aspredictable positive and negative enrichment for neuronal andnon-neuronal markers, NeuNþ cells were found to express verylow levels of Nrf2 (Fig. 1m), consistent with our in vitroobservations. We also investigated whether neuronal Nrf2 hypo-expression is relevant to the human. Cortical-patterned neuronsand astrocytes were generated from the same human embryonicstem cell (hESC) line (H9) as described previously17,21,22.Strikingly, hESC-derived neurons expressed far less Nrf2 thanhESC-derived astrocytes (Fig. 1n, for comparison, GRIN1 showedthe reverse enrichment). Thus, in vitro, in vivo and in a modelhuman system, Nrf2 is severely underexpressed in neurons ascompared with astrocytes.
ARTICLE NATURE COMMUNICATIONS | DOI: 10.1038/ncomms8066
2 NATURE COMMUNICATIONS | 6:7066 | DOI: 10.1038/ncomms8066 | www.nature.com/naturecommunications
& 2015 Macmillan Publishers Limited. All rights reserved.

Epigenetic repression of Nrf2 in developing neurons. Wehypothesized that the hypo-expression of Nrf2 in neurons couldbe a result of epigenetic repression. Chromatin immunoprecipi-tation (ChIP) analysis of acetylated histone H3 associated with
the Nrf2 promoter revealed a strong degree of hypo-acetylation inneurons as compared with astrocytes (Fig. 2a left), whereasno differences were found at the Beta-actin gene promoter(Fig. 2a right). We next investigated whether Nrf2 promoter
80
60
40
20
0– 25 50 100 – 100 200 400
Neurons Astrocytes
Astrocytes
Astroc
ytes
H2O2 (μM)
10
1.0
Neurons Astrocytes
Astrocytes
Neurons
ConHmox1GFAPDAPI
Nrf2NeuronDAPI
tBHQ
*
*
*
ContBHQ
Rel
ativ
e H
mox
1 in
mix
ed c
ultu
res
12
10
8
Rel
ativ
e ex
pres
sion
Rel
ativ
e ex
pres
sion
Rel
ativ
e ex
pres
sion
Rel
ativ
e ex
pres
sion
Rel
ativ
e ex
pres
sion
Cel
l dea
th (
%)
6
4
2
0
120
kDa
64
39
Con tBHQ MG132
18
FAC-sorted NeuN(+)(adult cortex)
16
1412
1.00
0.75
0.50
30
25
1.0
0.5
0.0
*
*Astrocytes
Human ESC-derived
Neurons
Exp
ress
ion
rela
tive
to N
euN
(–)
cells
NeuN(–)expression
0.25*
**0.00
Nrf2Nrf2Gfa
pM
alGrin
1
Grin1
MG – TB MG – TB MG – TB
Rel
ativ
e N
rf2
expr
essi
on
100
80
60
40
20
0
Mixed
Mixed
Mixe
d
Neurons
Neurons
Neuro
ns
4
3
2
1
0
4
3
2
1
0
4
3
2
1
NS
Keap1+/+
Keap1–/–
Keap1+/+
Keap1–/–
Keap1+/+
Keap1–/–
0
4
7
* *
*
3
2
1
0
ContBHQ
**
*
*
Astroc
ytes
Neuro
ns
Hmox
1
Srxn1
xCT
Hmox
1
Srxn1
xCT
Hmox
1
Srxn1
xCT
Hmox
1
Srxn1
xCT
Hmox
1
Srxn1
xCT
Mixed
CatGclc
CatGclc
0.5
0.0
1.0
0.5
0.0Nrf2+/+
Nrf2+/+
Nrf2–/–
Nrf2–/–
Nrf2+/+ Nrf2–/–
NeuronsMixedAstrocytes
8 *
**
**
*
6
4
2
0
Rel
ativ
e ex
pres
sion
Rel
ativ
e ex
pres
sion
Rel
ativ
e ex
pres
sion
Cat Gclc
Nrf2
�-Actin
Figure 1 | The Nrf2 pathway is weak in cortical neurons. (a) Impact of Nrf2 deficiency on vulnerability to H2O2 treatment, in DIV10 astrocytes (498%
GFAPþ astrocytes) or neurons (cortical cultures containing 498% NeuNþ neurons, o0.02% GFAPþ astrocytes). Cells were treated with H2O2, fixed
after 24 h, DAPI stained and scored for survival/death based on nuclear morphology. *Po0.05, Student’s t-test here and throughout unless otherwise
stated (neurons: n¼4, 700–2000 cells analysed per condition per genotype (PCPG); astrocytes wt n¼ 5, 700–2,000 cells PCPG, ko n¼ 7, 2,100–2,700
cells PCPG). Data are displayed as mean±s.e.m. throughout. (b) Nrf2 target genes Cat and Gclc expression analysed by qRT–PCR, normalized to 18s rRNA,
expressed relative to the level in pure neuronal cultures. Mixed cultures: approximately 10% GFAPþ astrocytes, 90% NeuNþ neurons. *Po0.05, Cat
n¼ 6, Gclc n¼ 7. (c,d) Impact of Nrf2 deficiency on Cat or Gclc mRNA expression in neurons (c) and astrocytes (d). *Po0.05 compared with wild type
(WT); Cat n¼4, Gclc n¼ 5. (e) qRT–PCR analysis of Nrf2 target gene (Hmox1, Srxn1 and xCT) expression in response to tBHQ (10 mM, 8 h) treatment of
neuronal or mixed cultures. *Po0.05 (n¼ 5–6). (f) Immunohistochemical analysis of Hmox1 expression in tBHQ-treated mixed cultures. *Po0.05 (n¼ 5).
Upper: example pictures illustrating elevation of Hmox1 in astrocytes within tBHQ-treated mixed cultures. Scale bar, 25mm. (g–i) The effect of Keap1
deficiency on Nrf2 target genes. *Po0.05 (compared with WT control (Con), n¼8–15). (j) Nrf2 mRNA analysed in parallel cultures of the indicated types.
*Po0.05, (n¼ 10). (k) Western blot analysis of Nrf2 expression in different cell types treated with tBHQ (TB; 10mM) or MG132 (MG; 5 mM) for 16 h.
(l) Images of mixed cultures treated as indicated and stained with an anti-Nrf2 antibody (red) and a neuronal marker (Milli-Mark). White arrows highlight
lack of Nrf2 induction in neurons. Scale bar, 25 mm. (m) qRT–PCR analysis of Nrf2 and neuronal/non-neuronal marker gene expression in RNA isolated from
FAC-sorted adult cortical NeuNþ neurons, expressed relative to levels in NeuN� cells. *Po0.05 (n¼4). See Supplementary Fig. 1e. (n) Expression of
NRF2 (NEF2L2) and GRIN1 analysed in astrocytes and neurons derived from H9 hESCs. *Po0.05 (n¼ 3). NS, not significant.
NATURE COMMUNICATIONS | DOI: 10.1038/ncomms8066 ARTICLE
NATURE COMMUNICATIONS | 6:7066 | DOI: 10.1038/ncomms8066 | www.nature.com/naturecommunications 3
& 2015 Macmillan Publishers Limited. All rights reserved.

hypo-acetylation and transcriptional repression could be reversedby inhibiting histone deacetylases. Treatment of neurons with theClassI/II histone deacetylase (HDAC) inhibitor trichostatin A(TSA) boosted Nrf2 promoter H3 acetylation (Fig. 2b left),without affecting H3 acetylation at the Beta-actin promoter(Fig. 2b right), and resulted in increased Nrf2 expression (Fig. 2c),an effect also observed in hESC-derived neurons (Fig. 2d). Incontrast, TSA did not increase Nrf2 expression in astrocytes ofmouse or hESC origin (Supplementary Fig. 2a,b). TSA adminis-tration in vivo to adult mice also boosted Nrf2 expression inNeuNþ (Fig. 2e) but not NeuN� cortical cells (SupplementaryFig. 2c). Thus, neuronal Nrf2 is amenable to derepression byHDAC inhibition in vitro, in vivo and in human neurons. Thisraised the question as to whether neuronal responsiveness to Nrf2activators could also be restored. Indeed, the Nrf2 target geneSrxn1 was induced by tBHQ treatment in neurons that had beenpre-treated with TSA (Fig. 2f). Thus, epigenetic repression of theNrf2 promoter is a major reason why there is an absence of afunctional Keap1-Nrf2 pathway in neurons, and reactivation ofthe pathway by HDAC inhibition is achievable.
Neuronal Nrf2 repression is developmentally regulated. AsNrf2 is widely considered to be ubiquitously expressed, itsrepression in neurons is unusual, raising the question as towhether the Nrf2 shut-off might be mapped to a specific devel-opmental window. We observed that highly immature 2 days invitro-DIV2 neurons expressed high levels of Nrf2 mRNA,
compared with DIV9 (Fig. 3a). In vivo, P0 FAC-sorted NeuNþ
and NeuN� cells expressed similar amounts of Nrf2 mRNA(Fig. 3b). As Nrf2 mRNA levels overall (in total cortical homo-genate) were found to greatly exceed those in the P0 cortex thanin the adult (Fig. 3c), it is apparent that P0 cortical neuronsexpress high levels of Nrf2 in vivo, as compared with adultneurons. Moreover, in our hESC system, we compared Nrf2mRNA levels in hESC-derived cortical-patterned neurons withthose in their direct precursors (hESC-derived neural precursorcells (NPCs)) as well as undifferentiated hESCs. We found Nrf2mRNA levels are similar in undifferentiated hESCs, hESC-derivedNPCs and, indeed, hESC-derived astrocytes (Fig. 3d). Only whenNPCs are allowed to differentiate to neurons do levels of Nrf2markedly decline (Fig. 3d). Thus, in vitro, in vivo and in a humanstem cell-based system, neuronal Nrf2 expression becomesrepressed during a developmental window early in neuronalcommitment. The epigenetic repression of Nrf2 described inFig. 2 takes place during the early stages of development. Inagreement with this hypothesis, ChIP studies revealed a devel-opmental drop in Nrf2 promoter histone H3 acetylation betweenDIV2 and DIV9 in neurons (Fig. 3e). Moreover, and in contrastto DIV9 neurons, TSA treatment of DIV2 neurons did not resultin increased Nrf2 expression (Fig. 3f), indicative of a relativelyactive, unrepressed promoter at this developmental stage.
The developmental shut-off of Nrf2 expression is alsoassociated with reduced expression of the Nrf2 target genesHmox1, Srxn1, xCt, Cat and Gclc (Fig. 3g), strongly suggestingthat very early in development, the Nrf2 pathway in neurons is
Anti-AcH3 ChIP Anti-AcH3 ChIP (neurons)
1.0* NS
0.9
0.8
6
* **
*#
#
NS
Nrf2Srxn1
NS
Rel
ativ
e ex
pres
sion
5
4
3
1
0–– – –
–+ +
(12) (18) (18) TSA (h)
Time (h)0 12 18
± TSA ± tBHQHarvest
RNA
tBHQ
2
FAC-sorted NeuN(+)(adult cortex)
0.6
0.4
0.2
0.0Veh. TSA
*
Rel
ativ
e N
rf2
expr
essi
on0.8
1.0
0.8
0.6
0.4
0.2
0.0
Inpu
t:β a
ctin
pro
m(r
elat
ive)
Inpu
t:β a
ctin
pro
m(r
elat
ive)
Inpu
t:Nrf
2 pr
om(r
elat
ive)
Inpu
t:Nrf
2 pr
om(r
elat
ive)
0.75×10⁻⁵ 1×10⁻⁵
210
Con TSA Con
1.5
1.0
Nrf
2 in
duct
ion
Nrf
2 in
duct
ion
0.5
0.0
4
3
**
*2.0
1.5
1.0
0.5
0.0
2
1
0TSA Con TSA Con TSA
2×10⁻⁵
0
Neuro
ns
Astroc
ytes
Neuro
ns
NeuronshESC-
neurons
Astroc
ytes
Figure 2 | The Nrf2 promoter is epigenetically repressed in cortical neurons. (a) ChIP analysis of acetylated histone H3 (Ac-H3) occupancy at the Nrf2
(left) and b-actin (right) promoters in neurons and astrocytes, normalized to input and expressed relative to each other. *Po0.05, NS¼ no significant
difference (n¼ 5). (b) Effect of TSA treatment (8 h) on Ac-H3 levels at the Nrf2 and b-actin promoters in neurons. *Po0.05 (n¼ 5). (c,d) Effect of TSA
treatment on Nrf2 expression in mouse cortical neurons (c) and human H9 ESC-derived neurons (d), normalized to Rpl13a. *Po0.05 (n¼ 3).
(e) Adult mice were subjected to intra-peritoneal injection of TSA (10 mg kg� 1) or vehicle (Veh.) and at 8 h culled and cortical neurons obtained by
enzymic dissociation of the cortex followed by FAC-sorting of NeuNþ cells. RNA was extracted immediately and Nrf2 expression studied. *Po0.05, (n¼ 7
(Veh.), 4 (TSA)). (f) Pre-treating cultured cortical neurons with TSA renders the neuronal Nrf2 pathway amenable to activation by tBHQ. Neurons were
treated as indicated in the schematic, and expression of Nrf2 and Nrf2 target gene Srxn1 analysed by qRT–PCR. (Po0.05 analysis of variance plus Tukey’s
post-hoc test, *significant difference compared with control untreated cells; #significant effect of tBHQþTSA compared with TSA alone condition). ‘NS’
emphasizes non-significant effect of tBHQ versus untreated neurons (n¼4 except control (no TSA, no tBHQ, n¼ 5)).
ARTICLE NATURE COMMUNICATIONS | DOI: 10.1038/ncomms8066
4 NATURE COMMUNICATIONS | 6:7066 | DOI: 10.1038/ncomms8066 | www.nature.com/naturecommunications
& 2015 Macmillan Publishers Limited. All rights reserved.
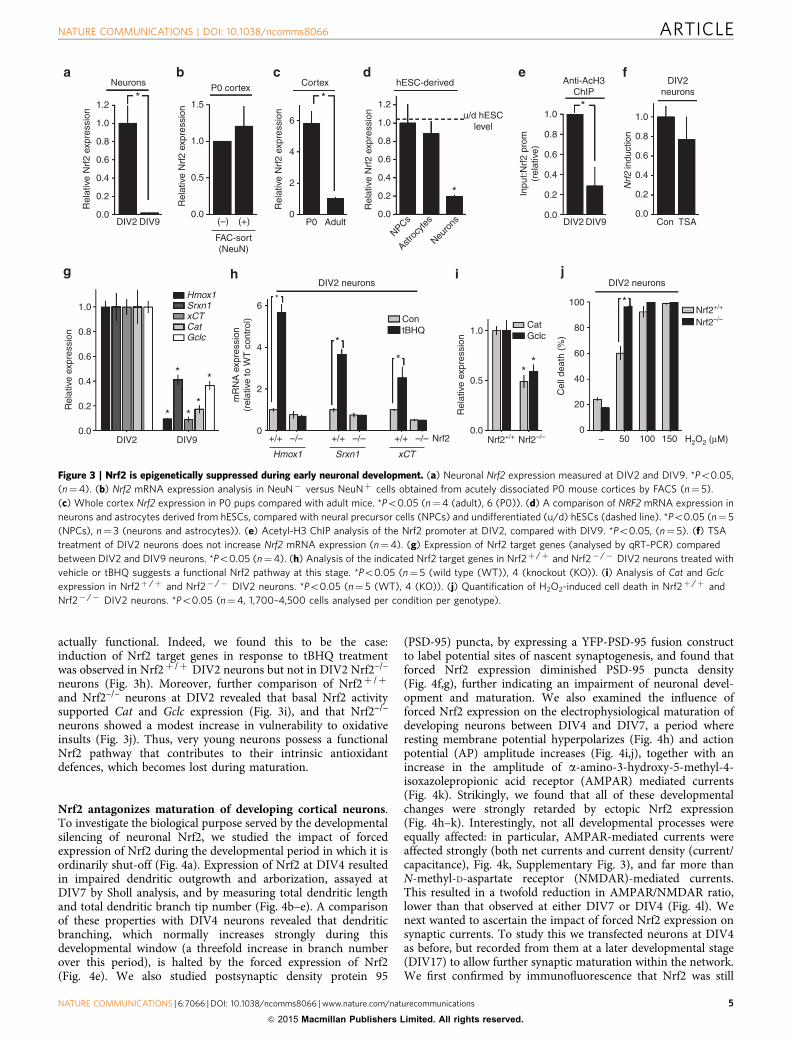
actually functional. Indeed, we found this to be the case:induction of Nrf2 target genes in response to tBHQ treatmentwas observed in Nrf2þ /þ DIV2 neurons but not in DIV2 Nrf2–/–
neurons (Fig. 3h). Moreover, further comparison of Nrf2þ /þ
and Nrf2–/– neurons at DIV2 revealed that basal Nrf2 activitysupported Cat and Gclc expression (Fig. 3i), and that Nrf2–/–
neurons showed a modest increase in vulnerability to oxidativeinsults (Fig. 3j). Thus, very young neurons possess a functionalNrf2 pathway that contributes to their intrinsic antioxidantdefences, which becomes lost during maturation.
Nrf2 antagonizes maturation of developing cortical neurons.To investigate the biological purpose served by the developmentalsilencing of neuronal Nrf2, we studied the impact of forcedexpression of Nrf2 during the developmental period in which it isordinarily shut-off (Fig. 4a). Expression of Nrf2 at DIV4 resultedin impaired dendritic outgrowth and arborization, assayed atDIV7 by Sholl analysis, and by measuring total dendritic lengthand total dendritic branch tip number (Fig. 4b–e). A comparisonof these properties with DIV4 neurons revealed that dendriticbranching, which normally increases strongly during thisdevelopmental window (a threefold increase in branch numberover this period), is halted by the forced expression of Nrf2(Fig. 4e). We also studied postsynaptic density protein 95
(PSD-95) puncta, by expressing a YFP-PSD-95 fusion constructto label potential sites of nascent synaptogenesis, and found thatforced Nrf2 expression diminished PSD-95 puncta density(Fig. 4f,g), further indicating an impairment of neuronal devel-opment and maturation. We also examined the influence offorced Nrf2 expression on the electrophysiological maturation ofdeveloping neurons between DIV4 and DIV7, a period whereresting membrane potential hyperpolarizes (Fig. 4h) and actionpotential (AP) amplitude increases (Fig. 4i,j), together with anincrease in the amplitude of a-amino-3-hydroxy-5-methyl-4-isoxazolepropionic acid receptor (AMPAR) mediated currents(Fig. 4k). Strikingly, we found that all of these developmentalchanges were strongly retarded by ectopic Nrf2 expression(Fig. 4h–k). Interestingly, not all developmental processes wereequally affected: in particular, AMPAR-mediated currents wereaffected strongly (both net currents and current density (current/capacitance), Fig. 4k, Supplementary Fig. 3), and far more thanN-methyl-D-aspartate receptor (NMDAR)-mediated currents.This resulted in a twofold reduction in AMPAR/NMDAR ratio,lower than that observed at either DIV7 or DIV4 (Fig. 4l). Wenext wanted to ascertain the impact of forced Nrf2 expression onsynaptic currents. To study this we transfected neurons at DIV4as before, but recorded from them at a later developmental stage(DIV17) to allow further synaptic maturation within the network.We first confirmed by immunofluorescence that Nrf2 was still
Neurons P0 cortex Cortex
**
0
2
4
6
1.2
1.0
0.8
0.6
0.4
0.2
0.0
Hmox1Srxn1xCTCatGclc
*
**
*
*
mR
NA
exp
ress
ion
(rel
ativ
e to
WT
con
trol
)
Rel
ativ
e ex
pres
sion
2
6
4
0
1.0
0.8
0.6
0.4
0.2
0.0
1.2
1.0
0.8
0.6
0.4
0.2
0.0
1.0
Anti-AcH3ChIP
u/d hESClevel
hESC-derived DIV2neurons
*
0.8
0.6
0.4
0.2
0.0DIV2
DIV2
NPCs
Astroc
ytes
Neuro
ns DIV9
DIV9
Con TSA
1.0
0.8
0.6
0.4
0.2
0.0
1.5
1.0
0.5
0.0
Rel
ativ
e N
rf2
expr
essi
on
Rel
ativ
e N
rf2
expr
essi
on
Rel
ativ
e N
rf2
expr
essi
on
Inpu
t:Nrf
2 pr
om(r
elat
ive)
Nrf
2 in
duct
ion
Rel
ativ
e N
rf2
expr
essi
on
Rel
ativ
e ex
pres
sion
DIV2 DIV9 P0 Adult
FAC-sort(NeuN)
DIV2 neurons
ContBHQ
CatGclc
**
DIV2 neurons
Nrf2+/+
Nrf2–/–
*
*
*
(–) (+)
*
Cel
l dea
th (
%)
100 *
80
60
40
20
0
1.0
0.5
0.0Nrf2+/++/+ Nrf2 Nrf2–/– – 50 100 150 H2O2 (μM)–/–+/++/+ –/–
Srxn1 xCTHmox1
–/–
Figure 3 | Nrf2 is epigenetically suppressed during early neuronal development. (a) Neuronal Nrf2 expression measured at DIV2 and DIV9. *Po0.05,
(n¼4). (b) Nrf2 mRNA expression analysis in NeuN� versus NeuNþ cells obtained from acutely dissociated P0 mouse cortices by FACS (n¼ 5).
(c) Whole cortex Nrf2 expression in P0 pups compared with adult mice. *Po0.05 (n¼4 (adult), 6 (P0)). (d) A comparison of NRF2 mRNA expression in
neurons and astrocytes derived from hESCs, compared with neural precursor cells (NPCs) and undifferentiated (u/d) hESCs (dashed line). *Po0.05 (n¼ 5
(NPCs), n¼ 3 (neurons and astrocytes)). (e) Acetyl-H3 ChIP analysis of the Nrf2 promoter at DIV2, compared with DIV9. *Po0.05, (n¼ 5). (f) TSA
treatment of DIV2 neurons does not increase Nrf2 mRNA expression (n¼4). (g) Expression of Nrf2 target genes (analysed by qRT–PCR) compared
between DIV2 and DIV9 neurons. *Po0.05 (n¼4). (h) Analysis of the indicated Nrf2 target genes in Nrf2þ /þ and Nrf2� /� DIV2 neurons treated with
vehicle or tBHQ suggests a functional Nrf2 pathway at this stage. *Po0.05 (n¼ 5 (wild type (WT)), 4 (knockout (KO)). (i) Analysis of Cat and Gclc
expression in Nrf2þ /þ and Nrf2� /� DIV2 neurons. *Po0.05 (n¼ 5 (WT), 4 (KO)). (j) Quantification of H2O2-induced cell death in Nrf2þ /þ and
Nrf2� /� DIV2 neurons. *Po0.05 (n¼4, 1,700–4,500 cells analysed per condition per genotype).
NATURE COMMUNICATIONS | DOI: 10.1038/ncomms8066 ARTICLE
NATURE COMMUNICATIONS | 6:7066 | DOI: 10.1038/ncomms8066 | www.nature.com/naturecommunications 5
& 2015 Macmillan Publishers Limited. All rights reserved.

expressed from the plasmid at DIV17 (data not shown) and thatAMPAR current and current density were reduced(Supplementary Fig. 3b,c), as is the case at DIV7 (Fig. 4k and
Supplementary Fig. 3a). To assess the magnitude of synapticactivity, we measured the average charge transfer during aspontaneous polysynaptic excitatory postsynaptic currents
Assessbaseline
properties
T’fect Conplasmid+ eGFP
0 1 2 3 4 5 6 7 16 17 DIV
DIV 7 (Con)
DIV 4 (Con)
DIV 7 (Nrf2)
DIV 7 (Con)
DIV 4 (Con)DIV 7 (Nrf2)
*
*
* * * * * * * * * * * * * *# # #
25
20
15
10
5
0
DIV 4DIV 7
1,000
750
500
250
0
Den
driti
c le
ngth
(μm
)
Den
driti
c br
anch
tips
10
8
6
4
2
0
Inte
rsec
tions
*
5 ms
20 m
V
80
60
40
20
0
AP
am
plitu
de (
mV
)
Assesssynapticactivity
Assessdevelopment
T’fect Nrf2 orCon plasmid
+ eGFP
Distance from soma (μm)0 50 100 150
ConCon
Con
*
Pun
cta
per
100
μm
25
20
15
10
5
0
mE
PS
C fr
eq (
Hz)
EP
SC
siz
e (p
Q)
AM
PA:N
MD
A r
atio
AM
PAR
cur
rent
(pA
)
10
8
6
3
1
0
DIV7 (Con)
DIV7 (Nrf2)
0.6
0.4
0.2
0.0
200p
A
250
200
150
100
50
0
200
400
0
*
0
–20
–40
–60Res
ting
mem
bran
epo
tent
ial (
mV
)
(mV)Con
DIV 4
DIV 4
DIV 7
DIV 7
Nrf2Nrf2
Nrf2
Con ConNrf2
DIV 4DIV 7
Con ConNrf2 Con
DIV 4DIV 7 DIV 17
DIV 17 (Nrf2)
DIV 17 (Nrf2)
DIV 17 (Con)
DIV 17 (Con) DIV 4–17DIV 4–17
*** *
Con ConNrf2 Nrf2 Con
DIV 17
Nrf2
Con Con
DIV 4DIV 4 DIV 7DIV 7
Con ConNrf2Con ConNrf2Nrf2
4 s
Figure 4 | Forced Nrf2 expression in young neurons impairs development. (a) Schematic demonstrating the experimental timeline. Neurons were
developmentally assessed (either morphologically or electrophysiologically) on DIV7 or DIV17 (for synaptic activity). For baseline DIV4 neuronal morphology
and electrophysiological properties, neurons were transfected on DIV3 and assessed 24 h later. (b) Example images of transfected neurons on either DIV7 or
DIV4 as indicated. Scale bar, 50mm. (c) Sholl analysis of dendritic morphology of control (DIV4 and DIV7) and Nrf2-transfected (DIV7) neurons. Two-way
analysis of variance plus Tukey’s post-hoc test here and throughout the figure. *Po0.05 compared with DIV7 (control (Con)); #Po0.05 compared with DIV4
(Con); 40–48 neurons analysed per condition within n¼4 independent experiments. (d,e) Dendritic length (d) and branch tip number (e) were analysed in
the population of neurons studied in c. *Po0.05 (n¼4). (f) Example images of PDS-95 puncta in DIV8 neurons transfected with YFP-tagged PSD-95 plus
either a plasmid encoding Nrf2 (pNrf2) or control plasmid on DIV4 (scale bar, 10mm). (g) Quantification of f showing a reduction in PSD-95 density in pNrf2-
transfected DIV8 neurons (*Po0.05, dendrites from 24 to 30 neurons were studied for each condition within n¼ 3 independent experiments). (h) Neuronal
Nrf2 expression between DIV4–7 causes a significant change in resting membrane potential, as compared with controls (*Po0.05, n¼ 11,9,7). (i) Example
whole-cell current-clamp traces of evoked action potentials (APs) recorded from neurons transfected as indicated. (j) Quantification of AP amplitude in
neurons transfected as indicated (*Po0.05, n¼9,9,8). (k) AMPA receptor currents measured in DIV7 and DIV4 neurons transfected as indicated (*Po0.05,
n¼ 11,10,8). (l) The AMPA/NMDA ratio was calculated in neurons expressing pNrf2 as compared with control plasmid (Po0.05, n¼ 11,10,8). (m) Neurons
were transfected with either control plasmid or pNrf2, plus an eGFP co-transfection marker on DIV4. On DIV17, EPSCs were recorded over a 5-min period and
the average charge transfer (pQ) calculated. *Po0.05 (n¼ 8). Example traces are shown to the right. Scale bar, 500 pA, 500 ms. (n) mEPSC frequency
measured in neurons transfected as indicated on DIV4 and recorded on DIV17. *Po0.05 (n¼9 control, n¼ 8 Nrf2).
ARTICLE NATURE COMMUNICATIONS | DOI: 10.1038/ncomms8066
6 NATURE COMMUNICATIONS | 6:7066 | DOI: 10.1038/ncomms8066 | www.nature.com/naturecommunications
& 2015 Macmillan Publishers Limited. All rights reserved.
(EPSCs), and found that in Nrf2-expressing cells the EPSC sizewas far lower than in control-transfected neurons (Fig. 4m),consistent with there being fewer functional synapses. In addition,we analysed the influence of spontaneous tetrodotoxin-insensitiveminiature EPCSs (mEPSCs). mEPSC frequency offers a func-tional measure of synapse number. We found that Nrf2 expres-sion caused a strong reduction in mEPSC frequency (Fig. 4n) butnot size (Supplementary Fig. 3j), consistent with there being fewerfunctional synapses, in agreement with the YFP-PSD-95 data(Fig. 4g) and the tetrodotoxin-sensitive synaptic EPSC results(Fig. 4m). Collectively, these data provide functional evidencethat synaptic development is retarded by Nrf2.
Next we investigated whether forced expression of Nrf2 inmore mature neurons that are developing less rapidly may be lessdeleterious to neuronal function. We investigated the influence ofNrf2 expression between DIV14 and 17, which provides a 3-dayexpression window similar to the DIV4–7 window used in theearlier assessments. In contrast to DIV4–7, when AMPARcurrents are increasing dramatically (Fig. 4k), AMPAR currentshave stabilized by DIV14 (Supplementary Fig. 3d). Interestingly,we found that Nrf2 expression during DIV14–17 did notinfluence AMPAR currents (Supplementary Fig. 3e, expressionof Nrf2 was confirmed (data not shown)). Dendritic analysis isproblematic at DIV17 due to extensive, overlapping processesfrom neighbouring transfected cells. However, measurement ofmembrane capacitance provides a surrogate measure of mem-brane area (and therefore outgrowth). Consistent with thedendrite analysis data (Fig. 4b–e), membrane capacitanceincreases sharply between DIV4 and 7, and this increase isinhibited by Nrf2 (Supplementary Fig. 3f). In contrast, membranecapacitance is stable between DIV14 and 17 (SupplementaryFig. 3g) and Nrf2 expression between DIV14 and 17 has no effectcompared with control-transfected neurons (SupplementaryFig. 3h). Of note, Nrf2 expression over an extended window(DIV4–17) does reduce membrane capacitance (SupplementaryFig. 3i), just as it impairs synaptic maturation (Fig. 4m).
Collectively, these data indicate that forced expression of Nrf2in neurons early in differentiation (around DIV4) at a time whenit is normally subject to repression is deleterious to theirdevelopment. These developmental defects become apparentquickly (by DIV7), potentially because growth and electrophy-siological maturation is rapid at this stage. Moreover, thesedefects are still observed later on (DIV17) so long as Nrf2expression is initiated early, but not if expression is initiated laterin development (DIV14). We suggest that downregulation ofNrf2 early in development might help establish a redoxenvironment, which is permissive for signalling pathwaysinvolved in neuronal maturation during a critical developmentalwindow over which particularly rapid electrical and morpholo-gical maturation takes place.
Developmentally important pathways are repressed by Nrf2.The Wnt signalling pathway plays a key role in neuronal differ-entiation23; both canonical (via b-catenin) and non-canonical(via Rac and JNK) Wnt signalling contribute to dendriticdevelopment and synaptogenesis24,25. Consistent with this, wefound dominant negative mutants of b-catenin (b-cat-ARM-Myc) or Rac (Rac-N17) interfered with dendritic development(Fig. 5a–c), with Rac-N17 having a considerably stronger effect(Fig. 5a–c). The highly specific peptide inhibitor D-JNKI-1 alsoimpaired dendritic outgrowth and arborization (Fig. 5e–g).PSD-95 clustering was also impaired by interfering withb-catenin, Rac or JNK (Fig. 5d,h). In addition, expression ofRac-N17, or JNK inhibition, also resulted in lower AMPARcurrents (Supplementary Fig. 4a). Thus, cortical neuronaldevelopment is impaired by inhibition of Rac and JNK,
mediators of non-canonical Wnt signalling, as well as via theinterference of canonical Wnt signalling via inhibition ofb-catenin, consistent with previous findings in hippocampalneurons23–25.
The Wnt pathway is known to be sensitive to cellular redoxstatus, and can be potentiated by ROS (H2O2) at least in part viainactivation of the Dishevelled (Dvl) inhibitor nucleoredoxin(Nrx), which is redox-sensitive26. However, Wnt pathwayregulation by ROS in neurons is not well-studied. Moreover, arecent study demonstrated that ROS generation is important forWnt-dependent differentiation in a neural progenitor cell line, aswell as for the dissociation of Nrx from Dvl27. To investigatepotential redox regulation of Wnt signalling in cortical neurons,we used a mixed culture preparation (90% neurons, 10%astrocytes) in which doses of up to 50 mM H2O2 were notneuro-toxic, and a transfection protocol that overwhelminglytargets neurons over astrocytes28. We found that mild sub-toxicdoses of H2O2 potentiated Wnt signalling as assayed bymeasuring b-catenin-dependent TCF/LEF-luciferase reporteractivity (M50 Super 8x TOPFlash b-catenin reporter, Fig. 5i,j).It seems likely that Nrx is involved in this potentiation becauseNrx-directed short hairpin RNA (shRNA) both increased basalWnt pathway activity and partly occluded the potentiating effectof mild sub-toxic doses of H2O2 (Fig. 5i). Forced expression ofNrf2 both lowered basal Wnt reporter activity, and abolished itspotentiation by H2O2 treatment (Fig. 5j). We also observed thatthe same low H2O2 conditions that boosted Wnt signalling alsoserved to activate JNK signalling, again in a manner inhibited byNrf2 expression (Fig. 5k,l). It should be recognized, however, thatJNK also has other redox-sensitive upstream activators such asASK1. Nevertheless, these data show that developmentallyimportant signalling pathways are sensitive to the redox statusof maturing neurons, and are inhibited by ectopic Nrf2. Thissuggests that Nrf2 expression boosts antioxidant levels to such apoint that low ROS levels are unable to activate redox-sensitivesignalling pathways because they are rapidly inactivated in thecell. To visualize this directly, we employed the Grx1-roGFPgenetically encoded reporter of cellular redox potential, Grx1-roGFP229, which is highly sensitive to small fluctuations in redoxpotential29. Small doses of H2O2 produced strong fluctuations inthe probe signal (Fig. 5m,n, Supplementary Fig. 4c). In Nrf2-expressing neurons, the same doses of H2O2 elicited far weakerresponses, conclusively showing that Nrf2 expression boosts thecapacity of neurons to buffer their redox potential, providing anexplanation for Nrf2’s inhibitory effects on H2O2-inducedactivation of JNK and Wnt signalling.
Collectively, these observations raise the possibility that theeffects of Nrf2 expression during development are partly due tointerference with Wnt-dependent development, the importanceof which we have confirmed above. To investigate this we testedwhether either dominant-negative b-cat-ARM or Rac-N17expression had any influence on neuronal development againsta background of forced Nrf2 expression, focusing on dendriticoutgrowth and arborization. We found that the effect of eitherdominant-negative b-cat-ARM or Rac-N17 on dendritic arbor-ization were entirely non-additive to the effects of Nrf2expression (Fig. 6a–c and Fig. 6d–f, respectively). This issuggestive of a common pathway: that is, that the effects offorced Nrf2 expression are due in part to Wnt pathway inhibition.Furthermore, these data also suggest that a key reason forNrf2 shut-off during development is to allow Wnt-dependentdevelopment and maturation processes to take place.
Rescue of developmental deficits induced by Nrf2. Finally, weinvestigated whether the deleterious effects of Nrf2 expression ondendritic outgrowth and arborization could be rescued by
NATURE COMMUNICATIONS | DOI: 10.1038/ncomms8066 ARTICLE
NATURE COMMUNICATIONS | 6:7066 | DOI: 10.1038/ncomms8066 | www.nature.com/naturecommunications 7
& 2015 Macmillan Publishers Limited. All rights reserved.

artificially activating canonical and non-canonical Wnt signallingor JNK. We found that expression of both a constitutively activeform of b-catenin (b-catenin-S33Y, Fig. 6g–j) or Rac (Rac1-Q61L,Fig. 6k–n) or overexpression of JNK1 (Jnk/1a, Fig. 6o–r) partlyrescued neurons from the morphological deficits caused by Nrf2expression. Nrf2 expression was not affected (SupplementaryFig. 4e). Nrx shRNA also partly rescued dendritic length, but notbranch tip number (Supplementary Fig. 4f). Collectively, these
data support a model whereby Nrf2-driven antioxidant defencesrepress the activity of redox-sensitive Wnt and JNK pathways,leading to deficits in neuronal development. They also offer abiological reason behind the developmental epigenetic shut-off ofthe Nrf2 promoter: by slightly weakening neurons’ intrinsicantioxidant defences via Nrf2 inactivation, a more permissiveenvironment is provided for redox-sensitive signalling pathwayscritical for neuronal development.
Control Nrf2
8
1,00020
2015
15
1010
5 5
0 0
25
750
500
250
0
6
4
Inte
rsec
tions
Inte
rsec
tions
2
0
8
6
4
TC
F/L
EF
repo
rter
act
ivity
% O
f max
390
/490
rat
io
% O
f max
390
/490
rat
io
TC
F/L
EF
repo
rter
act
ivity
Pi-J
un/J
un
2
0
0
Distance from soma (μm)
Den
driti
c le
ngth
(μm
)
1000
Con
Con
ConD-JNKI1
D-JNKI1
750
500
250
0
Den
driti
c le
ngth
(μm
)
Pun
cta
per
100
μm
20
15
10
5
0
25
Pun
cta
per
100
μm
Den
driti
c br
anch
tips
25
20
15
10
5
0
Den
driti
c br
anch
tips
* **
*
* * *
*
*
*
Con
2.0
1.5
1.0
0.5
0.0– –
– –+ +DJI
Nrf2
ConNrf2
H2O2H2O2
H2O2H2O2
Pi-Jun
c-Jun
Pi-Jun
c-Jun
Pi-J
un/J
un
2.0
* * * *
1.5
1.0
0.5
0.0
Nrf2
1.4
1.2
1.0
0.8
0.6
0.4
0.2
0.0
*
*#
#
* * * * *
* * *
*
* *
*
** *
* *
50 100 150
0
3 Con shRNA
Nrx shRNA
2
1
0
50
25
0– 10 20
75
100
80
40
200 2 4 6
Time (min)
0 2 4 6
Time (min)
60
100
% O
f max
390
/490
rat
io
80
40
20
60
100
– 25 50
Grx1-roGFP2
**
H2O2 (μM)
H2O2 (μM)
– 25 50 H2O2 (μM)
Distance from soma (μm)
50 100 150
Con ConDN-βCat
DN-βCat
Rac-N17
Con
DN-βCat
Con
D-JNKI1
Con
D-JNKI1
Con
D-JNKI1
Rac-N
17 Con
DN-βCat
Rac-N
17 Con
DN-βCat
Rac-N
17
Rac-N17
10 μM 10 μM20 μM 20 μM
ARTICLE NATURE COMMUNICATIONS | DOI: 10.1038/ncomms8066
8 NATURE COMMUNICATIONS | 6:7066 | DOI: 10.1038/ncomms8066 | www.nature.com/naturecommunications
& 2015 Macmillan Publishers Limited. All rights reserved.

DiscussionWe have shown that Nrf2 expression is shut-off during neuronaldevelopment, contributing to weakened antioxidant defences, andhave provided an explanation for the paradoxical inactivation ofthis cytoprotective pathway by demonstrating the inhibitoryeffect of Nrf2 on key developmental processes and pathways.
Cellular antioxidant defences must be carefully tuned to therequirements of the cell. Not only does the redox potential of thecell need to be appropriate for the stability of proteins and othermolecules, but also the redox buffering capacity of the cell muststrike a balance between limiting excessive ROS levels, whileallowing redox signalling for physiological processes30. In thelatter case, there is evidence that redox signalling directsdifferentiation and development in the nervous system andelsewhere. Mitochondrially derived ROS are important foradipocyte differentiation31 and are involved in promoting theoxidation of Nrx and activation of Wnt-dependent epidermaldifferentiation and hair follicle development32. Interestingly,ectopic expression of the Drosophila Nrf2 homologue CncC inthe compound eye causes a rough-eye phenotype33, consistentwith excessive Nrf2-induced activity being deleterious for normaldifferentiation and development.
There is growing evidence supporting a role for ROS inpromoting neurogenesis and neuronal differentiation34–36.Differentiation of PC12 cells, Neuro2a cells, the human neuralprogenitor ReNcell VM197 line and also of rat cortical precursorsis associated with ROS generation and is affected by antioxidanttreatment27,34,36. Mechanistically, a link between ROS signallingand JNK-dependent synapse development has been demonstratedin the context of Drosophila neuromuscular junctiondevelopment37. Moreover, it is apparent that physiologicallyappropriate levels of ROS must be maintained, as excessiveoxidative stress can cause synapse overgrowth37. In addition tosynaptic growth, JNK plays roles in dendritic arborization andaxon formation, in part by controlling microtubule dynamics38.As a downstream effector of non-canonical Wnt signalling as wellas redox-sensitive upstream activators such as ASK1, JNK ispotentially regulatable by fluctuations in cellular redox potentialvia a variety of mechanisms. Wnt signalling is anotherdevelopmental pathway potentiated by mild ROS exposure26,27.In neurons, Wnt signalling directs progenitor differentiation,dendritic development and synaptogenesis23–25,27 via bothcanonical and non-canonical pathways. Moreover, Rac, partof the non-canonical pathway, promotes AMPAR clustering andexcitatory neurotransmission39. Our study indicates that theseand potentially other pathways are inhibited by Nrf2-mediatedgene expression in developing neurons, providing a biological
reason behind the developmental shut-off of Nrf2 expression.Our working hypothesis is that Nrf2-directed antioxidant geneexpression limits redox fluctuations that help to potentiate redox-sensitive signalling pathways. Two recent studies have shed lighton the possible sources of these redox fluctuations. Bursts ofmitochondrial superoxide production, mediated by transientmitochondrial permeability transition pore opening and causedby Ca2þ signals, have been implicated in promoting ROS-dependent neural progenitor differentiation36. The key trigger forthis may be mitochondrial Ca2þ uptake, which has been shownto be critical for mitochondrial ROS production and ROS-dependent neural progenitor differentiation in a separate study27.However, beyond redox control of key redox-sensitive signallingpathways, it remains possible that Nrf2 may control theexpression of genes that directly interfere with neuronaldifferentiation.
Activation of Nrf2-mediated transcription in astrocytes, eithervia forced Nrf2 expression or treatment with small-moleculeKeap1 inhibitors, confers protection on nearby neurons4,7,40. Thisinvolves the production and release of astrocytic glutathione4, aprocess that is conserved in human stem cell-derived astrocytes41.Astrocytic Nrf2 is able to ameliorate pathology in models of avariety of neurodegenerative diseases, including ALS andParkinson’s disease7,16,40,42. It had been reported, using anARE-reporter gene that neurons respond less well to Nrf2activators than astrocytes, the basis for which was unclear4. Thisfinding is consistent with our observations that neitherpharmacological inducers of Nrf2 nor genetic ablation of Keap1can induce Nrf2-mediated responses in cortical neurons, becauseof the transcriptional repression of the Nrf2 gene itself. Our workalso demonstrates that Nrf2 repression is also a feature of neuronsin vivo (using acute FAC-sorting) and in neurons derived fromhESCs. Mechanistically, we showed that histone H3 associatedwith the Nrf2 gene promoter becomes hypo-acetylated duringdevelopment, resulting in transcriptional repression. However,Class I/II HDAC inhibition resulted in only partial derepressionof Nrf2, suggestive of additional repression mechanisms.Interestingly, the polycomb group protein EZH2, a histone H3Lys27 (H3K27) trimethyltransferase, was recently identified as anegative regulator of Nrf2 expression in lung epithelial cells,raising the possibility that this may contribute to Nrf2 repressionin neurons. The potential role of Class III HDACs remains to beexplored.
Activation of Nrf2 by mild oxidative stress is a classicalcytoprotective response that enables antioxidant defences to beboosted under conditions of demand11. The shut-off of Nrf2 inmaturing neurons means that this route is either unavailable to
Figure 5 | Nrf2 inhibits redox-sensitive neuronal developmental signalling pathways. (a) Sholl analysis of neurons transfected DIV4–7 with DN-bCat:
bcat ARM-Myc; Rac-N17: Rac N17-Myc. *Po0.05 compared with control (Con): two-way analysis of variance (ANOVA) plus Dunnett’s post-hoc, n¼ 3, 24
cells per condition. (b,c) Total dendritic length (b) and branch tip number (c) calculated for the cells analysed in a. *Po0.05, one-way ANOVA plus
Dunnett’s post-hoc. (d) YFP-PSD-95 puncta density measured. *Po0.05, n¼4 (32–40 cells quantified per condition). Example pictures to the right (scale
bar, 10 mm). (e) Sholl analysis of neurons treated daily±D-JNKI1 (2mM) DIV4–6. *Po0.05, two-way ANOVA plus Sidak’s post-hoc, n¼4 (40 cells per
treatment). (f,g) Dendritic length (f) and branch tip number (g) measured in the cells treated as in e. *Po0.05 Student’s t-test, n¼4 (20 cells per
treatment). (h) YFP-PSD-95 puncta density measured. *Po0.05 (n¼ 3, 24 cells per condition). Example pictures to the right (scale bar, 10mm).
(i) Neurons were transfected with a TCF/LEF-luciferase reporter of Wnt signalling, a pTK-renilla Con, Dvl1 plasmid, plus Con or Nrx-directed shRNA vector
(ratio: 2:1:2:2). 48 h post-transfection, neurons were treated with H2O2 for 16 h, and reporter activity measured (normalized to Renilla). *Po0.05, n¼ 3:
two-way ANOVA with Bonferroni’s post-hoc test here and for j. #Difference between H2O2-stimulated values and the corresponding Con. (j) Neurons were
transfected with the Wnt reporter, Renilla, Dvl1 plasmid, plus Con or Nrf2 vectors (ratio: 2:1:2:2). H2O2-induced Wnt activity measured as for i. *Po0.05,
n¼4. (k) Western analysis of H2O2 (25mM)-induced c-Jun (Ser-73) phosphorylation±D-JNKI-1 (DJI) pretreatment. *Po0.05 (n¼ 3). (l) Western
analysis of H2O2-induced c-Jun (Ser-73) phosphorylation in neurons nucleofected with Con or Nrf2-encoding plasmids. *Po0.05, two-tailed t-test (n¼ 3).
(m,n) Nrf2 activity buffers neuronal redox potential. Neurons expressing Grx1-roGFP plus either Con (globin) or Nrf2-encoding plasmids were imaged
during H2O2 treatment. Ratios (ex¼ 387±5 and 494±10; em¼ 530±10 in both cases) for each cell were calculated and normalized to the maximal ratio
obtained by treating cells with high H2O2 (100mM). *Po0.05, two-way ANOVA, plus Bonferronni’s post-hoc, n¼ 6 (30 (Con) and 35 (Nrf2) cells
analysed). (n) Example traces of single experiments relating to m.
NATURE COMMUNICATIONS | DOI: 10.1038/ncomms8066 ARTICLE
NATURE COMMUNICATIONS | 6:7066 | DOI: 10.1038/ncomms8066 | www.nature.com/naturecommunications 9
& 2015 Macmillan Publishers Limited. All rights reserved.

neurons, or of limited relevance. However, other adaptivestrategies exist to help match antioxidant capacity to oxidantexposure. Mild oxidative stress, and sublethal episodes ofischaemia in vitro and in vivo can activate Nrf2-dependent geneexpression in astrocytes, which contribute to neuroprotectivepreconditioning in vitro43,44. Synaptic activity, an energeticallyexpensive process that places metabolic demands on the celland increases ROS production45 also triggers the expression of
antioxidant genes, boosting intrinsic antioxidant defences28,46,including that of the glutathione (GSH) system47. Of note, someof these genes are known Nrf2 target genes but are induced inneurons via Nrf2-independent mechanisms involving factors AP-1 and ATF4 (refs 18,28,48). Moreover, neuronal activity hasrecently been reported to increase Nrf2 protein accumulation inastrocytes49. In addition, other neuroprotective transcriptionfactors may help to compensate for Nrf2’s repression, including
8
1,00025
20
15
10
5
0
750
500
250
0
6
4
2
00 50 100
Con + Con
Con + Con
Con Con
Nrf2
Rac-N17
Rac-N17Nrf2 + Con
Nrf2 + ConNrf2+βCatS33Y
Nrf2 +
βCat
S33Y
Nrf2Con
Nrf2 +
βCat
S33Y
Nrf2Con
βCatS33Y
Nrf2+Rac-N17
Con + Con
Nrf2 + Con
Nrf2+DN-βCat
DN-βCat
150
0 50 100 150
Con
ConRac-N17
Con
Nrf2
Con Nrf2 Con Nrf2
Con Nrf2
Distance from soma (μm)
Distance from soma (μm)
0 50 100 150
Distance from soma (μm)
*
*
**
**
**
* **
*
* * * * * * *
**
*
*
**
**
**
**
NS
NS
NS
NS
Con
DN-βCat
Con
DN-βCat*
** *
**
Inte
rsec
tion
8
6
4
2
0
Inte
rsec
tion
6
4
2
0
Inte
rsec
tions
Den
driti
c le
ngth
(μm
)
1,000
750
500
250
0
1000
750
500
250
0
Den
driti
c le
ngth
(μm
)D
endr
itic
leng
th (
μm)
20
15
10
5
0
Den
driti
c br
anch
tips
Den
driti
c br
anch
tips
25
20
15
10
5
0D
endr
itic
bran
ch ti
ps
Figure 6 | Activation of the JNK or Wnt pathways rescues detrimental Nrf2-dependent alterations in neuronal maturation. (a–f) Expression of Nrf2
occludes the deleterious effects of DN-bCat or Rac-N17 on neuronal development. Neurons were transfected on DIV4 with the indicated plasmids, plus
GFP to visualize the cells, and studied at DIV7. Where used, quantities of DN-bCat, Rac-N17 and Nrf2 were always kept constant, and control plasmid used
to ensure that total quantity of transfected DNA was also constant. (a,d) Sholl analysis of neurons transfected as indicated. *Po0.05, two-way analysis of
variance (ANOVA), plus Tukey’s post-hoc test: *indicates difference between equivalent ‘Con’ and ‘Nrf2’ conditions. 15–24 cells analysed within n¼ 3
independent experiments. Note that the same ‘Con’ and ‘Nrf2’ conditions are shown for a and d because the DN-bCat and Rac-N17 experiments were
performed at the same time, with the data separated for easier visualization. (b,c,e,f) Dendrite length (b,e) and branch tip number (c,f) were calculated in
neurons transfected with the indicated plasmids. *Po0.05, two-way ANOVA with Tukey’s post-hoc test; 15–24 cells analysed per condition within n¼ 3
experiments. (g–r) Activation of Wnt, JNK or Rac signalling rescues the detrimental impact of Nrf2 expression on neuronal morphology. DIV4 neurons
were transfected with the indicated plasmids and Sholl, dendritic length and branch tip analysis performed as previously. (g,k,o) Sholl analysis: *Po0.05,
two-way ANOVA with Bonferronni’s post-hoc test. *A significant rescue, comparing the Nrf2 only condition to Nrf2þbCatS33Y or RacQ61L, or JNK1a
(n¼4, 32–36 cells analysed in total per condition). (h,i,l,m,p,q) *Po0.05, one-way ANOVA with Dunnett’s post-hoc test (n¼4, 32–36 cells analysed in
total per condition). (j,n,r) Example images of neurons analysed. Scale bar, 50mm.
ARTICLE NATURE COMMUNICATIONS | DOI: 10.1038/ncomms8066
10 NATURE COMMUNICATIONS | 6:7066 | DOI: 10.1038/ncomms8066 | www.nature.com/naturecommunications
& 2015 Macmillan Publishers Limited. All rights reserved.

nuclear factor-kB, whose activity increases during neuronalmaturation and which controls anti-apoptotic gene expressionas well as MnSOD50–52. These and other mechanisms may haveevolved to help mitigate the effects of low Nrf2 expression inneurons.
Another important question is whether (re)activation of theNrf2 pathway in mature neurons offers a viable neuroprotectivestrategy. In the context of antioxidant defences, Nrf2 activation inneurons is likely to be beneficial, rendering neurons resistant tooxidative insults as well as ischaemic-like conditions in vitro.Moreover, we observed that forced Nrf2 expression retardedneuronal development DIV4–7 but not when initiated over a latertime window (DIV14–17). Nevertheless, further investigations arerequired (and planned) to determine whether prolonged Nrf2activation in mature neurons would have deleterious functionalconsequences. In addition to being involved in synaptogenesis,the Wnt pathway has recently been implicated in synapsemaintenance53, raising the possibility that perturbations thatinterfere with this pathway may functionally compromise matureneurons. If this were the case, then the continued repression ofNrf2 in mature neurons could be desirable, so that transcriptionalresponses in the brain to Nrf2-activating drugs are preferentiallyinduced in non-neuronal cells. Alternatively, it could be that Nrf2repression is needed only very early in development during aperiod of particularly rapid electrical and morphologicalmaturation. One can speculate that during this early period,redox signalling is important for potentiating and maximizing thestrength of developmental signalling pathways. However, inmature neurons there may not be a need for such a potentiation,and lower levels of pathway activity (for example, to sustainsynapse maintenance) may suffice. If this is the case, thenderepression of the neuronal Nrf2 promoter could be a promisingtherapeutic strategy for brain disorders associated with oxidativestress.
The data presented here suggests that derepression of the Nrf2promoter by HDAC inhibition may render the neuronal Nrf2pathway partly activatable by classical inducers, which block theactions of Keap1. Interestingly, while classical inducers such astBHQ fail to induce a significant response in neurons, the enone-type electrophilic compound curcumin and its correspondingdienone, NEPP11 have been reported to activate Nrf2 target geneexpression directly in neurons54,55. Of note, curcumin is knownto inhibit Class I HDACs and DNA methylation (as well asbeing an activator of Nrf2 via blocking its Keap1-mediateddegradation), raising the possibility that its action involves bothderepression of the Nrf2 promoter and inhibition of Keap1-mediated protein degradation. Regardless, to fully derepress Nrf2,further research is necessary to uncover the molecular mechanismof its developmental repression. Neuron-specific chromatinremodelling and other epigenetic changes are known to beimportant for development56,57, so it is possible that Nrf2 is atarget for these pathways. For example, Brg1/hBrm-AssociatedFactor (BAF) chromatin remodelling complexes are capable ofboth gene activation and repression, depending on theircomposition, and neuron-specific BAF complexes are criticalfor dendritic outgrowth and synaptogenesis57.
Of course, even if Nrf2 expression in neurons is derepressed, itstill needs to be activated by an appropriate small molecule tomediate a response. Although several Nrf2-activating moleculeshave demonstrated efficacy in a variety of preclinical animalmodels of brain disease, BG-12 (dimethyl fumarate) has emergedas a particularly promising agent. BG-12 is a cytoprotectivecompound licensed for relapsing remitting multiple sclerosis,which activates Nrf2-mediated gene expression and has amechanism of action (at least in animal models) that is dependenton Nrf2 (refs 58,59). Alternatively, it could be that in targetingNrf2 in neurons a balance might be struck between boosting theNrf2 pathway while preventing an overloading of excessive redox-
Con + Con
Con + Con
Con
Con Con
Con
Nrf2
Nrf2
Nrf2 + Con
Nrf2 + Con
Nrf2+RacQ61L
Nrf2+JNK1a
Nrf2+R
acQ61
LNrf2Con
Nrf2+R
acQ61
LNrf2Con
Nrf2+J
NK1aNrf2Con
Nrf2+J
NK1aNrf2Con
RacQ61L
JNK1a
Distance from soma (μm)
**
**
*
**
**
*****
*
**
*
*
6
4
2
00 50 100 150
0
250
500
750
1,000
0
250
500
750
1,000
20
15
10
5
0
20
25
15
10
5
0
Distance from soma (μm)
0 50 100 150
Inte
rsec
tions
6
4
2
0
Inte
rsec
tions
Den
driti
c le
ngth
(μm
)D
endr
itic
leng
th (
μm)
Den
driti
c br
anch
tips
Den
driti
c br
anch
tips
Figure 6 | Continued.
NATURE COMMUNICATIONS | DOI: 10.1038/ncomms8066 ARTICLE
NATURE COMMUNICATIONS | 6:7066 | DOI: 10.1038/ncomms8066 | www.nature.com/naturecommunications 11
& 2015 Macmillan Publishers Limited. All rights reserved.

buffering enzymes, or in only targeting those cells that arestressed and in need of antioxidant support. To this end, thedevelopment of so-called ‘pathologically activated therapeutics’ inwhich oxidative stress modifies a pro-drug to become a functionalNrf2 activator may offer a promising strategy to activate Nrf2only where it is needed60.
To conclude, the striking shut-down of the powerful Nrf2cytoprotective pathway in neurons explains both the relativevulnerability of neurons to oxidative stress and their reliance onastrocytic support, but appears to be necessary for properneuronal development.
MethodsCell culture. Cortical cells were cultured from E17.5 CD1 mouse embryos, Nrf2–/–
and wild-type embryos (c57Blk/6), and Keap-1–/– and wild-type embryos, essen-tially as previously described61,62. Briefly, cortices were dissociated in papain for2� 20 min and plated at a density of between 9 and 13� 104 neurons per cm2.Three cell culture types were prepared: mixed28 neuronal/astrocyte cultures (90%NeuNþ neurons and 10% GFAPþ astrocytes), highly enriched neuronal43 cultures(498% NeuNþ neurons and o0.2% GFAPþ astrocytes) and highly enrichedastrocyte28 cultures (496% GFAPþ astrocytes). Mixed neuronal/astrocytecultures and highly enriched neuronal cultures were prepared in Neurobasalgrowth medium plus 1% rat serum (Harlan Laboratories), B27 (Life TechnologiesLtd), 1 mM glutamine and 1� antibiotic/antimycotic (Life Technologies Ltd),whereas astrocyte cultures were obtained by plating cells at low density inDMEMþ 10% Fetal Bovine Serum and 1� antibiotic/antimycotic (all LifeTechnologies Ltd). To prevent astrocyte proliferation in neuron-containingcultures, the anti-mitotic drug Cytosine b-D-arabino- furanoside hydrochloride(1.2 mM) was applied either immediately post plating (pure neuronal cultures) oron DIV4 (mixed cultures). Cultures were utilized as indicated between DIV3 and17, and were fed with the above described appropriate growth medium on DIV4.Before experimentation cells were removed from growth medium and washed andplaced in a minimal defined medium63 containing 10% minimum essential media(Life Technologies Ltd) and 90% Salt-Glucose-Glycine (SGG) medium, which iscomprised of 114 mM NaCl, 0.219% NaHCO3, 5.292 mM KCl, 1 mM MgCl2, 2 mMCaCl2, 10 mM HEPES, 1 mM Glycine, 30 mM Glucose, 0.5 mM sodium pyruvate,0.1% Phenol Red; osmolarity 325 mosm l� 1) for at least 3 h. When cultures wereused 4DIV14, a 1:1 replacement of conditioned media with fresh growth media,which lacked serum but was supplemented with glucose (10 mM), was conductedon DIV9 and 12. On DIV14, SGG supplemented with Insulin-Transferrin-Selenium was used as the replacement media.
Establishment and maintenance of the hESC lines H9 and HUES9 (HarvardUniversity, Cambridge, MA, USA) are as previously described41. Briefly, hESC lineswere cultured and regularly passaged on a feeder layer consisting of irradiatedmouse embryonic fibroblasts. The neuralization and differentiation of NPCs intoneurons and astrocytes followed our established protocols21,22,41. Briefly, humanPSCs were neurally converted (to NPCs) in suspension in chemically definedmedium as described21,22. The media were changed to Base media (A-DMEM/F12,1% P/S, 1% Glutamax, 1% N2), 0.4% B27, 2.5 ng ml� 1 FGF2 upon observation ofradially organized structures in neurospheres (10–21 days) and plated on Laminin(Sigma)-coated tissue culture plates (Nunc) a week later. Neural rosettes weremechanically isolated, dissociated with Accutase (Sigma) and 20–40 k cells wereplated in one Laminin-coated well of a 96-well plate in proliferation media (Basemedia, 0.1% B27, 10 ng ml� 1 FGF2 and 10 ng ml� 1 EGF where stated). aNPCswere grown to high density before passaging 1:2 with Accutase on laminin-coatedplates until passage 5–6 and maintained on 1:100 Reduced-growth factor Matrigel(BD Biosciences)-coated plates thereafter. For neuronal differentiation, NPCs wereplated in default media (A-DMEM/F12, 1% P/S, 0.5% Glutamax, 0.5% N2, 0.2%B27, 2 mg ml� 1 Heparin (Sigma)) on poly-D-lysine (Sigma), laminin (Sigma),fibronectin (Sigma) and Matrigel-coated coverslips for differentiation and fed twicea week. Default media were supplemented with 10 mM forskolin (Tocris) in weeks2 and 3. From week 4 onwards, forskolin was removed and default media weresupplemented with 5 ng ml� 1 brain-derived neurotrophic factor and 5 ng ml� 1
glial-derived neurotrophic factor. For astrocytic differentiation, NPCs were platedin modified basal plating medium supplemented with BMP2 and BMP4 (R&D) at10 ng ml� 1 and Leukemia Inhibitory Factor (Sigma) at 20 ng ml� 1.
Transfection and plasmids. Neuronal transfections were carried out usingLipofectamine 2000 (2.33 ml per well, 1 mg ml� 1, Life Technologies Ltd) on DIV 3,4 and 8 neurons. For neurons subject to oxygen glucose deprivation (OGD),transfections were carried out in a trophically deprived transfection medium (TMo,90% SGGþ 10% minimum essential media63). Non-OGD-related transfectionswere carried out in normal transfection medium (TMits, TMo plus an Insulin-Transferrin-Sodium Selenite Media Supplement). As reported previously, thetransfection efficiency for this protocol is approximately 5% for mixed cultures,with 99% of the total transfected cells being neuronal in nature, as determined byNeuN staining19. Constructs were co-transfected with peGFP in order to identify
successfully transfected cells. To ensure that GFP-positive neurons also express theplasmid of interest, a favourable ratio was used (enhanced GFP-encoding plasmid(pEGFP)/plasmid of interest, 1:2), as previously validated in the case of RFP-encoding plasmid (pRFP)28. In all experimental comparisons, the amount of DNAtransfected per plasmid of interest as well as the total amount of DNA from allplasmids (0.6–0.7 mg cDNA per well) was identical, with control plasmid beingutilized to balance amounts where required. Transfections were carried out usingLipofectamine as previously described63, with cells incubated with transfectionmixture for 3 h before removal and transfer back to pre-transfection incubationmedium. Transfections designed for morphological assessment of neuriteoutgrowth were performed at a lower dilution (1/16 of the normal full strength,diluted in TMits) in order to reduce the total number of transfected cells. Thisenabled accurate tracking of neurite projections from a single cell despite the highdensity of the culture. The diluted DNA/lipofectamine transfection mixture was lefton for 3 h as with other full-strength transfections. For transfections on youngerneurons (DIV3–4), cells were returned to growth medium, and fed on DIV 4following the termination of the transfection protocol as usual. Neurons were thenassessed on the indicated day as appropriate. In all instances the utilized controlplasmid was b-globin, referred to as control plasmid (here and throughout).Plasmids expression was confirmed (Supplementary Fig. 4d) andhave been previously described: pEF-Nrf2 (ref. 64), M50 Super 8x TOPFlash65,pcDNA3-S33Y b-catenin-Flag66, pcDNA3-EGFP-Rac1-Q61L-myc, b-catenin-ARM-myc67, Rac N17-myc68, pCDNA3-Jnk1a1 (ref. 69), NRX-RNAi in pSuperand control-RNAi in pSuper26, Grx1-roGFP29, DVl1-HA25. The PSD-95-YFPvector was kindly provided by Noboru Komiyama.
Electrophysiological recording and analysis. Coverslips containing corticalDIV4–17 neurons were transferred to a recording chamber perfused (at a flow rateof 3–5 ml min� 1) with an external recording solution composed of (in mM):150 NaCl, 2.8 KCl, 10 HEPES, 2 CaCl2, 1 MgCl2, 10 glucose, 0.1 glycine and 0.002strychnine, pH 7.3 (320–330 mOsm). Patch-pipettes were made from thick-walledborosilicate glass (Harvard Apparatus, Kent, UK) and filled with a K-gluconate-based internal solution containing (in mM): 155 K-gluconate, 2 MgCl2,10 Na-HEPES, 10 Na-PiCreatine, 2 Mg2-ATP and 0.3 Na3-GTP, pH 7.3(300 mOsm). To ensure sufficient voltage-clamp of EPSCs, QX-314 (5 mM) wasincluded in the internal solution to block voltage-gated conductances. Electrodetips were fire-polished for a final resistance ranging between 5 and 10 MO.Currents were recorded at room temperature (21±2 �C) using either an Axopatch-1C or Axon Multiclamp 700B amplifier (Molecular Devices). Neurons werevoltage-clamped at –60 mV, and recordings were rejected if the holding currentwas greater than –100 pA or if the series resistance drifted by more than 20% of itsinitial value (o30 MO). Whole-cell currents were analysed using WinEDR v3.2software (John Dempster, University of Strathclyde, UK). To measure AMPAreceptor-mediated currents, 50 mM S-AMPA (Tocris) was applied for 5–10 s toreach a steady-state plateau, washed out for 1–2 min, then re-applied to elicit asecond response. The same procedure was used to acquire whole-cell NMDARcurrents (100 mM NMDA, Tocris Bioscience), except using Mg2þ -free externalrecording solution in which MgCl2 was substituted with 2 mM NaCl. All currentswere quantified as a 1 s average of the steady-state plateau minus the baseline at thesecond agonist application, and normalized to the cell capacitance. Analysis ofEPSC areas was carried out in OriginLab. mEPSC frequencies and amplitudes wereanalysed using MiniAnalysis (Synaptosoft) with the detection threshold set at–5 pA. To be included for analysis, mEPSCs needed to possess a monotonic riseand an exponential decay. Overall mEPSCs recorded from globin or Nrf2-trans-fected cells had mean 10–90% rise times of o1.5 ms and mean decay time con-stants of o3 ms.
OGD insult and cell fate tracking. DIV 7 neurons were transfected with eitherpEF-Nrf2 or control plasmid, plus peGFP. On DIV9, GFP-expressing neurons wereimaged using a Leica AF6000 LX imaging system and DFC350 FX digital camera,and their locations mapped using the Leica ‘Mark and Find’ software application.Once GFPþ neurons were identified, imaged and plate/well locations saved,they were returned to the incubator to re-equilibrate. Following a 3-h period ofequilibration, neurons were then exposed to 3 h OGD. Cells were washed andincubated in a glucose-free, balanced salt solution (SGG with mannitol substitutedfor glucose), previously degassed with 95% N2–5% C02 and placed in an anoxicmodular incubator chamber for 3 h (as compared with cells washed and incubatedin normoxic glucose-containing media). After 18–20 h (DIV 10), saved plate andwell locations were reloaded and images of the same cells were captured. Cell deathwas assessed by counting the number of surviving GFPþ neurons pre- andpost- exposure to OGD. The user was blind during both image capture and celldeath analysis. In the vast majority of cases, neuronal death was easily identifiableby the replacement of a healthy GFP-expressing cell with the presence offragmented neurites and fluorescent cell debris. Cell death is presented as thepercentage of dead neurons/total post-OGD. Approximately 125 neurons weremonitored for each plasmid across four independent experiments.
Peroxide-induced cell death. Cultures were transferred to TMo for at least 3 hbefore the start of the experiment (DIV as indicated). Cells were then treated with
ARTICLE NATURE COMMUNICATIONS | DOI: 10.1038/ncomms8066
12 NATURE COMMUNICATIONS | 6:7066 | DOI: 10.1038/ncomms8066 | www.nature.com/naturecommunications
& 2015 Macmillan Publishers Limited. All rights reserved.

H2O2 (dose as indicated) and cell death determined 24 h later via fixation with 4%formaldehyde and nuclear staining with 4-,6-diamidino-2-phenylindole (DAPI).As previously described28, images were captured and cell death quantified using anautomated technique created in Image J, which takes advantage of the largedifference in the nuclear size of living or dead cells. The automated system thenyields the number of dead versus living cells, enabling the user to calculate thenumber of dead cells as a percentage of the total cell population. For DAPI-assistedautomated quantification, cells were imaged under the � 10 objective, allowingB1,000 cells to be imaged at a time, with at least 12 images per treatment, allowingapproximately 12,000 cells to be quantified per experiment, in at least threeindependent experiments. During both image capture and image quantification,the user was blind.
Morphological assessment of neurite branching. Neurons were transfected withefGFP plus plasmid(s) of interest on DIV3/4 and left until DIV 4/7, whereuponthey were fixed, stained (as described in immunofluorescence below) and thenimaged at � 20 for morphological analysis. Images were subjected to Sholl analysis,as well as measurement of dendritic length and branch tip number, as facilitated bythe use of Image J software. Sholl analysis provides an assessment of dendriticarborization and branch complexity via quantification of the number of inter-secting branch points across concentric circles spaced at specific distances from thesoma. Sholl analysis parameters were as follows: origin of the concentric radii wasset at the midpoint of the longest axis of the soma, starting radius: 10 mm, endingradius: 170 mm, radius step size: 10 mm. Dendritic length represents the totalsummed length of all dendrite branches present. Branch tip number refers to thesum total of all terminal branch tips in a given neuron. In general, an average ofeight to ten neurons were quantified for Scholl analysis, dendritic length andbranch tip number for each investigated condition in a given experiment. Countsfor the eight to ten cells were then averaged per biological replicate, with at leastthree replicates quantified in total.
PSD-95 density analysis and quantification. DIV 4 neurons were transfectedwith the plasmid of interest plus YFP-tagged PSD-95, as described above. OnDIV8, neurons were washed twice with pre-warmed TMO (to eliminate issues ofautofluorescence associated with Neurobasal-A medium containing growth med-ium) and images of live PSD-95 expressing neurons were captured at � 20. PSD-95density analysis was then performed on captured images using ImageJ software(Wayne Rasband, US National Institutes of Health, Bethesda, MD, USA). The useof immunostaining with antibodies against PSD-95 was deemed undesirable asstaining intensity was too high to accurately separate distinct PSD-95 puncta. Liveimaging of endogenous YFP signals from transfected YFP-tagged PSD-95 wasoptimal. Because of the impact on Nrf2 expression on dendritic branching,quantification of secondary dendritic branches was not always possible. In an effortto maintain consistency, the number of PSD-95 puncta along the full length of onedendritic branch (including primary and secondary sections) was totalled and thendivided by the total length of the branch of interest. This density is presented as thetotal number of PSD-95 puncta per 100 mm, for simplicity. At least eight dendriticsections from independent cells were quantified per condition, with at least threebiological replicates throughout all experiments.
RNA isolation, reverse transcription (RT)–PCR and qPCR. RNA was isolatedusing the Roche High Pure RNA Isolation Kit (including optional DNase treat-ment), according to the manufacturer’s instructions (Roche). For quantitative PCR(qPCR), cDNA was synthesized from 1 to 3 mg RNA using the Roche TranscriptorFirst Strand cDNA Synthesis Kit, according to the manufacturer’s instructions.cDNA was then stored at � 20 �C or immediately diluted (equivalent of 6 ng ofinitial RNA per 15ml qPCR reaction, per gene of interest) for real-time PCR in aStratagene Mx3000P QPCR System (Agilent Technologies), using the Roche FSuniversal SYBR Green MasterRox mix, according to the manufacturer’s instruc-tions. The required amount of template was mixed with water, SYBR GreenMasterRox mix and forward and reverse primers (200 nM each final concentration)to the required reaction volume. Technical replicates as well as no template and noRT negative controls were included and at least three biological replicates werestudied per study. Primer sequences are described in Supplementary Table 1. TheqRT-PCR cycling programme was 10 min at 95 �C; 40 cycles of 30 s at 95 �C, 40 s at60 �C with detection of fluorescence and 30 s at 72 �C; 1 cycle (for dissociationcurve) of 1 min at 95 �C and 30 s at 55 �C with a ramp up to 30 s at 95 �C (ramprate: 0.2 �C s� 1) with continuous detection of fluorescence on the 55–95 �C ramp.Data were analysed using the MxPro qPCR analysis software (Stratagene), with 18 sor GAPDH expression utilized as an internal normalizer. For murine experimentsinvolving TSA application, expression of the housekeeping gene RPL13A, whichencodes the ribosomal highly basic 23-kDa protein, was used as the internalstandard for normalization, as RPL13A expression is unaffected by TSAapplication70.
Chromatin immunoprecipitation. ChIP was performed using the MAGnifyChromatin Immunoprecipitation System (Life Technologies Ltd), according to themanufacturer’s instructions. Briefly 2� 60 mm dishes were used per treatment(B4.5� 106 cells). Cells were washed once with pre-warmed media and then
incubated in media plus paraformaldehyde (1% final concentration) at roomtemperature for 8 min to enable protein/DNA cross-linking. Fixation was thenquenched by addition of glycine (final concentration 125 mM, 5 min). Dishes werethen transferred to ice, and cells washed and resuspended in ice-cold DNAse-freePBS, using plastic scrapers. Cell lysates were then transferred to microcentrifugetubes and spun at 200g for 10 min to pellet. Following removal and discard of thesupernatant, the cell pellet was resuspended (via mild pulsing on the vortex) in lysisbuffer plus protease inhibitors, and left on ice for 5 min before being sonicatedusing a Branson 450 Sonifier (five 20 s pulses at 10% power, 15 s intervals betweenpulses), to yield chromatin fragments of roughly 200–500 bp in length (as deter-mined by sonication optimization test experiments). At this stage, a fraction ofeach sample was kept aside as input control. For immunoprecipitation, a portion ofthe sheared chromatin sample was diluted tenfold with dilution buffer and thenimmunoprecipitated via 2 h incubation with Dynabeads Protein A/G pre-coupledto either rabbit anti-acetyl-Histone H3 antibodies (AcH3, 2.5 mg per sample, MerckMillipore) or normal IgG. Lysine 14 acetylation is a marker of genes being activelytranscribed into RNA, thus immunoprecipitation with anti-AcH3 antibodies allowsan assessment of the relative activity at a promoter of interest. Following extensivewashing with immunoprecipitation buffers 1 and 2, cross-linking was reversed viaheat and reverse crosslinking buffer. DNA was purified from the samples by DNApurification magnetic beads before elution in DNA elution buffer. The relativeassociation of AcH3 to the Nrf2 or b actin promoters was then quantitativelyassessed in input control and immunoprecipitated samples via real-time qPCR(as described above) using validated primers directed against the mouse Nrf2 andb-actin promoter regions (for sequences see Supplementary Table 1). In allinstances, samples were normalized to their respective non-immunoprecipitatedinput controls.
Fluorescent-activated cell sorting. All procedures were authorized under a UKHome Office approved project licence and adhered to regulations specified in theAnimals (Scientific Procedures) Act (1986). Cortical cells obtained from 12- to14-week-old adult CD1 male mice were processed essentially as described in ref. 20.Briefly, mice were culled via decapitation, cortices quickly removed in Hibernate A(Hib A, Life Technologies Ltd) and then minced on ice before incubation inAccutase (Merck Millipore) for 30 min at 4 �C on a rotator. After centrifugation,cortices were resuspended in Hib A and homogenized with a fire-polished Pasteurpipette. Debris was removed via filtration through a 40 mM filter and three-stepPercoll gradient. Cell pellets were resuspended in Hib A and an equal amount ofcold absolute ethanol was added. Cells were then left on ice for 15 min withoccasional inversion, before centrifugation and resuspension in RNAse/DNAse-free PBS and incubation with an anti-NeuN primary antibody (6:1,000, MerckMillipore) for 30 min at 4 �C on a rotator. Cells were washed, resuspended inRNAse/DNAse-free PBS containing Cy3-donkey anti-mouse secondary antibodyand left to rotate for 15 min at 4 �C (1:200, Stratech Scientific Limited), beforewashing and resuspension in RNAse/DNAse-free PBS. Cells were briefly incubatedwith DNA-binding dye 7AAD (Life Technologies Ltd) to identify nucleated eventsand facilitate gating and sort parameters, before sorting using a FACS-Jazz cellsorter (BD Biosciences). All non-7AADþ events were omitted as they wereconsidered non-nuclear. To establish the normal light scattering characteristics ofthe gated population (7AADþ events), a sample that had not been exposed toantibodies was first sorted. Following this a sample that had only been exposed tothe Cy-3-conjugated secondary antibody was sorted to establish the maximumthreshold for nonspecific binding. Following establishment of the appropriategating thresholds, experimental samples were sorted into two tubes based ontheir emission profile as either NeuNþ /7AADþ or NeuN� /7AADþ (seeSupplementary Fig. 1e). A total of 300 K NeuNþ and 300 K NeuN� cells werecollected per repeat. Purity testing was done for each n to ensure sorting accuracy,sorted samples consistently showed 498% purity profiles (see Supplementary Fig1e). RNA was immediately isolated as describe above using the Roche High-PureRNA Isolation Kit. Following RNA isolation and cDNA synthesis, expression ofcell-specific gene markers was assessed by qRT–PCR to confirm enrichment ofneuronal and non-neuronal genes in appropriate NeuNþ and NeuN� FACSpopulations.
Reporter assays. A firefly luciferase-based reporter gene construct (M50 Super 8xTOPFlash, a Beta-catenin reporter with TCF/LEF sites upstream of a luciferasereporter) was transfected along with a renilla expression vector (pTK-RL), andwhere relevant, other expression vectors of interest on DIV8. Neurons werestimulated with H2O2 48 h after transfection (for 16 h). Luciferase assays wereperformed using the Dual Glo assay kit (Promega) with Firefly luciferase-basedreporter gene activity normalized to the Renilla control (pTK-RL plasmid) inall cases. All luminescent assays were performed on a FLUOstar OPTIMA(BMG Labtech). Light collection time and gain were set such that counts weresubstantially lower than the maximum level collectable.
Immunofluorescence. Cells were fixed with formaldehyde, washed with PBS,permeabilized with PBSþNP-40 (Life Technologies Ltd) and washed again beforeovernight rotating incubation with primary antibodies diluted in PBS at 4 �C. Thefollowing day, cells were washed and antibody binding visualized via biotinylated
NATURE COMMUNICATIONS | DOI: 10.1038/ncomms8066 ARTICLE
NATURE COMMUNICATIONS | 6:7066 | DOI: 10.1038/ncomms8066 | www.nature.com/naturecommunications 13
& 2015 Macmillan Publishers Limited. All rights reserved.

secondary antibody/fluorophore-conjugated streptavidin. Where required, nucleiwere counter-stained with DAPI. In all instances, non-saturating images werecaptured on a Leica AF6000 LX imaging system. Employed primary antibodiesinclude: rabbit anti-Hmox1 (1:1,000, Stressgen Biotechnologies), mouse anti-GFAP(1:400, Sigma), rabbit anti-GFP (1:750, Life Technologies Ltd), Milli-Markneuronal antibody cocktail (Millipore, 1:500) and Anti-Nrf2 (Cell Signaling).To measure Hmox1 immunofluorescence intensity, non-saturating images at � 20were captured using the Leica AF6000 LX imaging system with DFC350 FX digitalcamera. Fluorescence intensity was quantified using Image J software. Fluorescenceintensity was quantified for each cell across four or five fields, with each fieldcontaining 10–18 cells. To ensure consistency, settings were maintained across allconditions in a given experiment. Background intensity was subtracted from cel-lular intensity, and resulting values of approximately 70 cells per condition wereaveraged and normalized to control.
Western blotting. For protein extraction experiments, cells were cultured in35 mm dishes. To minimize the chance of post-translational modifications duringthe harvesting process, cells were immediately lysed in � 1.5 sample buffer (1.5 MTris (pH 6.8); 15% glycerol; 3% SDS; 7.5% b-mercaptoethanol; bromophenol blue0.0375%) and boiled at 100 �C for 10 min. Approximately 30 mg of protein wasloaded per lane and the gel then subjected to gel electrophoresis and westernblotting using the Xcell Surelock system with precast gradient gels (4–20%,Life Technologies Ltd), according to the manufacturer’s instructions. Gels wereblotted onto polyvinylidene difluoride membranes, and blocked for 1 h at roomtemperature with 5% (w/v) non-fat dried milk in TBS with 0.1% Tween-20.Membranes were incubated overnight at 4 �C with primary antibodies diluted inthe blocking solution: Anti-cJun (1:1,000, Cell Signalling), Anti-pSer73-cJun(1:1,000, Cell Signalling), Anti-Nrf2 (1:1,000, Cell Signaling), anti-b-actin (1:2,000,Sigma). For visualization of western blots, HRP-based secondary antibodies wereused followed by chemiluminescent detection on Kodak X-Omat film. Appropriateexposures were taken such that bands were not saturated. Where required astripping agent was utilized to enable detection of the same blot with a secondantibody, as achieved through the use of Re-Blot Plus Stripping Solution(Millipore). Western blots were analysed by digitally scanning the blots, followedby densitometric analysis (ImageJ). Signals were normalized to either amounts ofp-c-Jun relative to cJun, or to amounts of Nrf2 relative to b-actin as loadingcontrol. For figure preparation of example western blots, linear adjustment ofbrightness/contrast was applied (Photoshop) equally across the entire image, takingcare to maintain some background intensity.
Statistical analysis. Paired t-tests were used to compare non-independent datapairs, whereas Student’s t-tests were utilized when the two groups were not related.For studies employing multiple testing, we used a one- or two-way analysis ofvariance followed by Tukey’s or Bonferroni’s post-hoc test as appropriate. For alltests significance was set at *Po0.05. Analysis of cell death, dendritic morphologyand PSD-95 puncta density was performed blind to the mouse genotype or otherexperimental history (drug treatment, plasmid transfected and so on). Error barsrepresent standard error of the mean.
References1. Fernandez-Fernandez, S., Almeida, A. & Bolanos, J. P. Antioxidant and
bioenergetic coupling between neurons and astrocytes. Biochem. J. 443, 3–11(2012).
2. Dringen, R., Pawlowski, P. G. & Hirrlinger, J. Peroxide detoxification by braincells. J. Neurosci. Res. 79, 157–165 (2005).
3. Dringen, R., Pfeiffer, B. & Hamprecht, B. Synthesis of the antioxidantglutathione in neurons: supply by astrocytes of CysGly as precursor forneuronal glutathione. J. Neurosci. 19, 562–569 (1999).
4. Shih, A. Y. et al. Coordinate regulation of glutathione biosynthesis and releaseby Nrf2-expressing glia potently protects neurons from oxidative stress.J. Neurosci. 23, 3394–3406 (2003).
5. Dringen, R. & Hirrlinger, J. Glutathione pathways in the brain. Biol. Chem. 384,505–516 (2003).
6. Halliwell, B. Oxidative stress and neurodegeneration: where are we now?J. Neurochem. 97, 1634–1658 (2006).
7. Vargas, M. R. & Johnson, J. A. The Nrf2-ARE cytoprotective pathway inastrocytes. Expert. Rev. Mol. Med. 11, e17 (2009).
8. Diaz-Hernandez, J. I., Almeida, A., Delgado-Esteban, M., Fernandez, E. &Bolanos, J. P. Knockdown of glutamate-cysteine ligase by small hairpin RNAreveals that both catalytic and modulatory subunits are essential for the survivalof primary neurons. J. Biol. Chem. 280, 38992–39001 (2005).
9. Hayes, J. D., McMahon, M., Chowdhry, S. & Dinkova-Kostova, A. T. Cancerchemoprevention mechanisms mediated through the Keap1-Nrf2 pathway.Antioxid. Redox. Signal. 13, 1713–1748 (2010).
10. Suzuki, T., Motohashi, H. & Yamamoto, M. Toward clinical application of theKeap1-Nrf2 pathway. Trends Pharmacol. Sci. 34, 340–346 (2013).
11. Ma, Q. Role of nrf2 in oxidative stress and toxicity. Annu. Rev. Pharmacol.Toxicol. 53, 401–426 (2013).
12. Higgins, L. G. et al. Transcription factor Nrf2 mediates an adaptive response tosulforaphane that protects fibroblasts in vitro against the cytotoxic effects ofelectrophiles, peroxides and redox-cycling agents. Toxicol. Appl. Pharmacol.237, 267–280 (2009).
13. Dreger, H. et al. Nrf2-dependent upregulation of antioxidative enzymes: a novelpathway for proteasome inhibitor-mediated cardioprotection. Cardiovasc. Res.83, 354–361 (2009).
14. Hayes, J. D. & Dinkova-Kostova, A. T. The Nrf2 regulatory network providesan interface between redox and intermediary metabolism. Trends Biochem. Sci.39, 199–218 (2014).
15. Zhu, H. et al. Antioxidants and phase 2 enzymes in macrophages: regulation byNrf2 signaling and protection against oxidative and electrophilic stress. Exp.Biol. Med. (Maywood) 233, 463–474 (2008).
16. Calabrese, V., Cornelius, C., Dinkova-Kostova, A. T., Calabrese, E. J. &Mattson, M. P. Cellular stress responses, the hormesis paradigm, and vitagenes:novel targets for therapeutic intervention in neurodegenerative disorders.Antioxid. Redox. Signal. 13, 1763–1811 (2010).
17. Gupta, K., Chandran, S. & Hardingham, G. E. Human stem cell-derivedastrocytes and their application to studying Nrf2-mediated neuroprotectivepathways and therapeutics in neurodegeneration. Br. J. Clin. Pharmacol. 75,907–918 (2012).
18. Deighton, R. F. et al. Nrf2 target genes can be controlled by neuronal activityin the absence of Nrf2 and astrocytes. Proc. Natl Acad. Sci. USA 111,E1818–E1820 (2014).
19. Soriano, F. X. et al. Induction of sulfiredoxin expression and reductionof peroxiredoxin hyperoxidation by the neuroprotective Nrf2 activator3H-1,2-dithiole-3-thione. J. Neurochem. 107, 533–543 (2008).
20. Guez-Barber, D. et al. FACS purification of immunolabeled cell types fromadult rat brain. J. Neurosci. Methods 203, 10–18 (2012).
21. Bilican, B. et al. Physiological normoxia and absence of EGF is required for thelong-term propagation of anterior neural precursors from human pluripotentcells. PLoS One 9, e85932 (2014).
22. Livesey, M. R. et al. Maturation of AMPAR composition and the GABAARreversal potential in hPSC-derived cortical neurons. J. Neurosci. 34, 4070–4075(2014).
23. Budnik, V. & Salinas, P. C. Wnt signaling during synaptic development andplasticity. Curr. Opin. Neurobiol. 21, 151–159 (2011).
24. Yu, X. & Malenka, R. C. Beta-catenin is critical for dendritic morphogenesis.Nat. Neurosci. 6, 1169–1177 (2003).
25. Rosso, S. B., Sussman, D., Wynshaw-Boris, A. & Salinas, P. C. Wnt signalingthrough Dishevelled, Rac and JNK regulates dendritic development. Nat.Neurosci. 8, 34–42 (2005).
26. Funato, Y., Michiue, T., Asashima, M. & Miki, H. The thioredoxin-relatedredox-regulating protein nucleoredoxin inhibits Wnt-beta-catenin signallingthrough dishevelled. Nat. Cell Biol. 8, 501–508 (2006).
27. Rharass, T. et al. Ca2þ -mediated mitochondrial reactive oxygen speciesmetabolism augments Wnt/beta-catenin pathway activation to facilitate celldifferentiation. J. Biol. Chem. 289, 27937–27951 (2014).
28. Papadia, S. et al. Synaptic NMDA receptor activity boosts intrinsic antioxidantdefenses. Nat. Neurosci. 11, 476–487 (2008).
29. Gutscher, M. et al. Real-time imaging of the intracellular glutathione redoxpotential. Nat. Methods 5, 553–559 (2008).
30. Bindoli, A. & Rigobello, M. P. Principles in redox signaling: from chemistry tofunctional significance. Antioxid. Redox. Signal. 18, 1557–1593 (2013).
31. Tormos, K. V. et al. Mitochondrial complex III ROS regulate adipocytedifferentiation. Cell. Metab. 14, 537–544 (2011).
32. Hamanaka, R. B. et al. Mitochondrial reactive oxygen species promoteepidermal differentiation and hair follicle development. Sci. Signal. 6, ra8(2013).
33. Sykiotis, G. P. & Bohmann, D. Keap1/Nrf2 signaling regulates oxidative stresstolerance and lifespan in Drosophila. Dev. Cell 14, 76–85 (2008).
34. Vieira, H. L., Alves, P. M. & Vercelli, A. Modulation of neuronal stem celldifferentiation by hypoxia and reactive oxygen species. Prog. Neurobiol. 93,444–455 (2011).
35. Kennedy, K. A., Sandiford, S. D., Skerjanc, I. S. & Li, S. S. Reactive oxygenspecies and the neuronal fate. Cell. Mol. Life Sci. 69, 215–221 (2012).
36. Hou, Y., Mattson, M. P. & Cheng, A. Permeability transition pore-mediatedmitochondrial superoxide flashes regulate cortical neural progenitordifferentiation. PLoS ONE 8, e76721 (2013).
37. Milton, V. J. et al. Oxidative stress induces overgrowth of the Drosophilaneuromuscular junction. Proc. Natl Acad. Sci. USA 108, 17521–17526 (2011).
38. Coffey, E. T. Nuclear and cytosolic JNK signalling in neurons. Nat. Rev.Neurosci. 15, 285–299 (2014).
39. Wiens, K. M., Lin, H. & Liao, D. Rac1 induces the clustering of AMPAreceptors during spinogenesis. J. Neurosci. 25, 10627–10636 (2005).
40. Gan, L. & Johnson, J. A. Oxidative damage and the Nrf2-ARE pathway inneurodegenerative diseases. Biochim. Biophys. Acta. 1842, 1208–1218 (2013).
ARTICLE NATURE COMMUNICATIONS | DOI: 10.1038/ncomms8066
14 NATURE COMMUNICATIONS | 6:7066 | DOI: 10.1038/ncomms8066 | www.nature.com/naturecommunications
& 2015 Macmillan Publishers Limited. All rights reserved.

41. Gupta, K. et al. Human embryonic stem cell derived astrocytes mediatenon-cell-autonomous neuroprotection through endogenous and drug-inducedmechanisms. Cell Death Differ. 19, 779–787 (2012).
42. Hardingham, G. E. & Lipton, S. A. Regulation of neuronal oxidative andnitrosative stress by endogenous protective pathways and disease processes.Antioxid. Redox. Signal. 14, 1421–1424 (2011).
43. Bell, K. F. et al. Mild oxidative stress activates Nrf2 in astrocytes, whichcontributes to neuroprotective ischemic preconditioning. Proc. Natl Acad. Sci.USA 108, E1–E2 author reply E3-4 (2011).
44. Bell, K. F., Fowler, J. H., Al-Mubarak, B., Horsburgh, K. & Hardingham, G. E.Activation of Nrf2-regulated glutathione pathway genes by ischemicpreconditioning. Oxid. Med. Cell Longev. 2011, 689524 (2011).
45. Hongpaisan, J., Winters, C. A. & Andrews, S. B. Strong calcium entry activatesmitochondrial superoxide generation, upregulating kinase signaling inhippocampal neurons. J. Neurosci. 24, 10878–10887 (2004).
46. Bell, K. F. & Hardingham, G. E. CNS peroxiredoxins and their regulation inhealth and disease. Antioxid. Redox. Signal. 14, 1467–1477 (2011).
47. Baxter, P. S. et al. Synaptic NMDA receptor activity is coupled to the transcriptionalcontrol of the glutathione system. Nat. Commun 6, 6761–6773 (2015).
48. Lewerenz, J. et al. Phosphoinositide 3-kinases upregulate system xc- viaeIF2alpha and ATF4—a pathway active in glioblastomas and epilepsy. Antioxid.Redox. Signal. 20, 2907–2922 (2013).
49. Habas, A., Hahn, J., Wang, X. & Margeta, M. Neuronal activity regulatesastrocytic Nrf2 signaling. Proc. Natl Acad. Sci. USA 110, 18291–18296 (2013).
50. Furukawa, K., Estus, S., Fu, W., Mark, R. J. & Mattson, M. P. Neuroprotectiveaction of cycloheximide involves induction of bcl-2 and antioxidant pathways.J. Cell Biol. 136, 1137–1149 (1997).
51. Bhakar, A. L. et al. Constitutive nuclear factor-kappa B activity is required forcentral neuron survival. J. Neurosci. 22, 8466–8475 (2002).
52. Mattson, M. P. NF-kappaB in the survival and plasticity of neurons.Neurochem. Res. 30, 883–893 (2005).
53. Dickins, E. M. & Salinas, P. C. Wnts in action: from synapse formation tosynaptic maintenance. Front. Cell Neurosci. 7, 162 (2013).
54. Satoh, T. et al. Activation of the Keap1/Nrf2 pathway for neuroprotection byelectrophilic [correction of electrophillic] phase II inducers. Proc. Natl Acad.Sci. USA 103, 768–773 (2006).
55. Gonzalez-Reyes, S., Guzman-Beltran, S., Medina-Campos, O. N. &Pedraza-Chaverri, J. Curcumin pretreatment induces Nrf2 and an antioxidantresponse and prevents hemin-induced toxicity in primary cultures of cerebellargranule neurons of rats. Oxid. Med. Cell Longev. 2013, 801418 (2013).
56. Tyssowski, K., Kishi, Y. & Gotoh, Y. Chromatin regulators of neuraldevelopment. Neuroscience 264, 4–16 (2014).
57. Vogel-Ciernia, A. & Wood, M. A. Neuron-specific chromatin remodeling: amissing link in epigenetic mechanisms underlying synaptic plasticity, memory,and intellectual disability disorders. Neuropharmacology 80, 18–27 (2014).
58. Linker, R. A. et al. Fumaric acid esters exert neuroprotective effects inneuroinflammation via activation of the Nrf2 antioxidant pathway. Brain 134,678–692 (2011).
59. Scannevin, R. H. et al. Fumarates promote cytoprotection of central nervoussystem cells against oxidative stress via the nuclear factor (erythroid-derived 2)-like 2 pathway. J. Pharmacol. Exp. Ther. 341, 274–284 (2012).
60. Satoh, T., McKercher, S. R. & Lipton, S. A. Nrf2/ARE-mediated antioxidantactions of pro-electrophilic drugs. Free Radic. Biol. Med. 65, 645–657 (2013).
61. Hasel, P., McKay, S., Qiu, J. & Hardingham, G. E. Selective dendriticsusceptibility to bioenergetic, excitotoxic and redox perturbations in corticalneurons. Biochim. Biophys. Acta. doi: 10.1016/j.bbamcr.2014.12.021 (2015).
62. Wahl, A. S. et al. Hypoxic/ischemic conditions induce expression of theputative pro-death gene Clca1 via activation of extrasynaptic N-methyl-D-aspartate receptors. Neuroscience 158, 344–352 (2009).
63. Papadia, S., Stevenson, P., Hardingham, N. R., Bading, H. & Hardingham, G. E.Nuclear Ca2þ and the cAMP response element-binding protein family
mediate a late phase of activity-dependent neuroprotection. J. Neurosci. 25,4279–4287 (2005).
64. Kotkow, K. J. & Orkin, S. H. Dependence of globin gene expression in mouseerythroleukemia cells on the NF-E2 heterodimer. Mol. Cell. Biol. 15, 4640–4647(1995).
65. Veeman, M. T., Slusarski, D. C., Kaykas, A., Louie, S. H. & Moon, R. T.Zebrafish prickle, a modulator of noncanonical Wnt/Fz signaling, regulatesgastrulation movements. Curr. Biol. 13, 680–685 (2003).
66. Kolligs, F. T., Hu, G., Dang, C. V. & Fearon, E. R. Neoplastic transformation ofRK3E by mutant beta-catenin requires deregulation of Tcf/Lef transcription butnot activation of c-myc expression. Mol. Cell. Biol. 19, 5696–5706 (1999).
67. Zhurinsky, J., Shtutman, M. & Ben-Ze’ev, A. Differential mechanisms ofLEF/TCF family-dependent transcriptional activation by beta-catenin andplakoglobin. Mol. Cell. Biol. 20, 4238–4252 (2000).
68. Nobes, C. D. & Hall, A. Rho GTPases control polarity, protrusion, andadhesion during cell movement. J. Cell Biol. 144, 1235–1244 (1999).
69. Derijard, B. et al. JNK1: a protein kinase stimulated by UV light and Ha-Rasthat binds and phosphorylates the c-Jun activation domain. Cell 76, 1025–1037(1994).
70. Mogal, A. & Abdulkadir, S. A. Effects of Histone Deacetylase Inhibitor(HDACi); Trichostatin-A (TSA) on the expression of housekeeping genes. Mol.Cell Probes. 20, 81–86 (2006).
AcknowledgementsThis study is dedicated to the memory of Marc-Andre Martel, our friend and colleaguewho is sorely missed. We are grateful to Masayuki Yamamoto for providing theNrf2� /� and Keap1þ /� mice, and to Tobias Dick, Eric Fearon, Patricia Salinas,Hiroaki Miki, Gary Bokoch, Roger Davis, Noboru Komiyama and Randall Moon forplasmids. This work was supported by the MRC, the Wellcome Trust, the BBSRC, theRoyal Society, ’Nplast’ Marie-Curie Initial Training Network, and a BiogenIdec/University of Edinburgh Joint Discovery Research Collaboration.
Author contributionsG.E.H. and K.F.S.B conceived the idea and wrote the manuscript. G.E.H., K.F.S.B., M.-A.M., D.J.A.W., R.H.S. and J.D.H. designed the research. K.F.S.B., B.A.-M., M.-A.M.,S.M., N.W., P.H., N.M.M., P.B., R.F.D., A.S. and B.B. performed the research. K.F.S.B.,B.-A.M., M.-A.M., S.M., N.W., P.H., N.M.M., P.B. and R.F.D. analysed the data. S.C.,P.M., M.L.J.A. contributed reagents, materials and analytical tools. The overall con-tribution of B.A.-M., M.-A.M., S.M. and N.W. to the study is equal, and the contributionof N.M.M. and P.H. is also equal.
Additional informationSupplementary Information accompanies this paper at http://www.nature.com/naturecommunications
Competing financial interests: The authors declare no competing financial interest.
Reprints and permission information is available online at http://npg.nature.com/reprintsandpermissions/
How to cite this article: Bell, K.F.S. et al. Neuronal development is promoted byweakened intrinsic antioxidant defences due to epigenetic repression of Nrf2. Nat.Commun. 6:7066 doi: 10.1038/ncomms8066 (2015).
This work is licensed under a Creative Commons Attribution 4.0International License. The images or other third party material in this
article are included in the article’s Creative Commons license, unless indicated otherwisein the credit line; if the material is not included under the Creative Commons license,users will need to obtain permission from the license holder to reproduce the material.To view a copy of this license, visit http://creativecommons.org/licenses/by/4.0/
NATURE COMMUNICATIONS | DOI: 10.1038/ncomms8066 ARTICLE
NATURE COMMUNICATIONS | 6:7066 | DOI: 10.1038/ncomms8066 | www.nature.com/naturecommunications 15
& 2015 Macmillan Publishers Limited. All rights reserved.
Copyright © 2022 FDOKUMEN