Neuronal arborizations, spatial innervation, and emergent network connectivity
15
1 Springer Series in Computational Neuroscience Hermann Cuntz, Michiel W.H. Remme, Benjamin Torben-Nielsen (Editors) The Computing Dendrite - From Structure to Function *** Preprint *** Chapter 4 Neuronal Arborizations, Spatial Innervation and Emergent Network Connectivity 1* Jaap van Pelt, 2 Harry B.M. Uylings, 1 Arjen van Ooyen 1 Computational Neuroscience Group, Department of Integrative Neurophysiology CNCR, VU University Amsterdam, the Netherlands 1* [email protected] 2 Dept. Anatomy & Neuroscience, VU University Medical Center, Amsterdam, the Netherlands Abstract Neurons innervate space by their axonal and dendritic arborizations. Synapses can form when axons and dendrites are in close proximity. The geometry of neurons and their numerical densities in space are thus primary factors in the formation of synaptic connectivity of neuronal networks. A simulator of neuronal morphology based on principles of neural development (NETMORPH) has been used to show that realistic network connectivities emerge from realistic neuronal morphologies and simple proximity-based synapse formation rules. Key Words neuronal morphology, network connectivity, presynaptic distances, postsynaptic distances, pathdistances, Euclidean distances, synapse multiplicity, network simulator, NETMORPH 4.1 Introduction Activity dynamics underlying cognition depends crucially on the patterns and strengths of synaptic connections between neurons. Neurons innervate space by their axonal and dendritic arborizations as determined by their geometries. Axonal and dendritic arborizations are complex and show large variations in all their shape characteristics, such as in the number of segments and segment lengths, branching angles, tortuosity of branches, orientation of branches, thickness of branches, topology of their tree patterns, and their global 3D embedding, which may show some spherical symmetry or axial symmetry or even flat 2D patterns such as in Purkinje cells. Synapses can form only at those locations where axons and dendrites come sufficiently close to each other (Peters 1979). The geometry of neuronal arborisations and the numerical densities of neurons are therefore important determinants of synaptic connectivity of neuronal networks. How neuronal morphology shapes neuronal network connectivity is, however, still poorly understood. From a computational point of view this question can be addressed by creating neuronal networks of computer generated or experimentally reconstructed neurons along with their axonal and dendritic arborizations in a given space and studying the emergent connectivity by applying Peters' rule (Peters 1979). The use of experimentally reconstructed
-
Upload
independent -
Category
Documents
-
view
3 -
download
0
Transcript of Neuronal arborizations, spatial innervation, and emergent network connectivity
1
Springer Series in Computational Neuroscience
Hermann Cuntz, Michiel W.H. Remme, Benjamin Torben-Nielsen (Editors)
The Computing Dendrite - From Structure to Function
*** Preprint ***
Chapter 4
Neuronal Arborizations, Spatial Innervation and
Emergent Network Connectivity
1*Jaap van Pelt,
2Harry B.M. Uylings,
1Arjen van Ooyen
1 Computational Neuroscience Group, Department of Integrative Neurophysiology
CNCR, VU University Amsterdam, the Netherlands 1*
[email protected] 2 Dept. Anatomy & Neuroscience, VU University Medical Center, Amsterdam, the Netherlands
Abstract Neurons innervate space by their axonal and dendritic arborizations. Synapses can form when
axons and dendrites are in close proximity. The geometry of neurons and their numerical
densities in space are thus primary factors in the formation of synaptic connectivity of
neuronal networks. A simulator of neuronal morphology based on principles of neural
development (NETMORPH) has been used to show that realistic network connectivities
emerge from realistic neuronal morphologies and simple proximity-based synapse formation
rules.
Key Words neuronal morphology, network connectivity, presynaptic distances, postsynaptic distances,
pathdistances, Euclidean distances, synapse multiplicity, network simulator, NETMORPH
4.1 Introduction
Activity dynamics underlying cognition depends crucially on the patterns and strengths of
synaptic connections between neurons. Neurons innervate space by their axonal and dendritic
arborizations as determined by their geometries. Axonal and dendritic arborizations are
complex and show large variations in all their shape characteristics, such as in the number of
segments and segment lengths, branching angles, tortuosity of branches, orientation of
branches, thickness of branches, topology of their tree patterns, and their global 3D
embedding, which may show some spherical symmetry or axial symmetry or even flat 2D
patterns such as in Purkinje cells. Synapses can form only at those locations where axons and
dendrites come sufficiently close to each other (Peters 1979). The geometry of neuronal
arborisations and the numerical densities of neurons are therefore important determinants of
synaptic connectivity of neuronal networks.
How neuronal morphology shapes neuronal network connectivity is, however, still
poorly understood. From a computational point of view this question can be addressed by
creating neuronal networks of computer generated or experimentally reconstructed neurons
along with their axonal and dendritic arborizations in a given space and studying the emergent
connectivity by applying Peters' rule (Peters 1979). The use of experimentally reconstructed
2
neurons has the advantage of best morphological realism of their arborizations. For instance,
NeuroConstruct (Gleeson et al. 2007) is a modeling tool for creating complex neuronal
networks in 3D space using imported experimentally reconstructed neuronal morphologies.
The efforts of collecting accurate and complete reconstructions are time costly and
large. Thanks to the initiative of creating the NeuroMorpho.Org database, an increasing
number of reconstructions has become available (Ascoli 2006; Ascoli et al. 2007). For the
construction of large networks, however, the finite datasets require the use of many copies of
the same neuron. The use of computer generated neuronal arborizations has the advantage that
neurons can be produced in any desired number and, depending on the generator, also with
full and realistic variation between the individual neurons. A number of different neuronal
morphological simulators are presently available in the field of computational
neuromorphology, which differ amongst others in the algorithms used. Neurons may be
generated by sampling experimental distributions of quantified neuronal shape parameters.
These algorithms produce neurons with realistic variations in neuronal shapes. An important
example of such an algorithm is L-Neuron (Senft and Ascoli 1999; Ascoli and Krichmar
2002; Samsonovich and Ascoli 2007) which was inspired by earlier work of Burke et al.
(1992). Also the simulator NeuGen (Eberhard et al. 2006) uses this algorithmic approach. An
algorithm explored by Luczak (2006) uses diffusion limited aggregation (DLA) for generating
neuron-like arborizations. A recently developed algorithm by Cuntz et al. (2010) regards
arborizations as locally optimized graphs and neuronal morphologies are generated by using
the minimal spanning tree principle. Costa and Coelho (2005; 2008) generated 2D neuronal
morphologies by statistically sampling a probabilistic model of neuronal geometry based on
branch probabilities per branch level using a Monte Carlo approach, and form connections
when neuronal trees overlap in 2D. Torben-Nielsen et al. (2008; 2008) developed an
algorithm (KDE-Neuron and EvOL-Neuron) for generating arborizations automatically from
a set of experimentally reconstructed neurons, without making a priori assumptions about the
distributions generating the real data. Neuronal arborizations may also be produced by
algorithms inspired by the developmental process of neurite outgrowth and branching. The
simulator CX3D (Zubler and Douglas 2009) is a tool for simulating the growth of cortex in
3D space. It includes actions such as cell division, cell migration and neurite outgrowth. The
simulated neurons have a physical implementation in space and may secrete and react to
chemical components. CX3D combines mechanistic and stochastic rules for elongation and
branching in the morphogenesis of single neurons. The simulator NETMORPH (Koene et al.
2009) is a simulation framework for generating realistic neuron morphologies also based on
rules for neuronal development. It uses a phenomenological approach in modelling the
development of neuronal morphology versus developmental time. Real neurons grow out by
the actions of growth cones at the tips of outgrowing neurites. These actions include migration
(elongation of the neurite), branching (into two daughter growth cones), turning (changing
direction of outgrowth), and retraction (shortening of the neurite). The simulator
NETMORPH uses the dendritic outgrowth model of Van Pelt et al. (e.g. 2001) which
describes these actions in a stochastic way and which has been shown to generate realistic
dendritic morphologies.
In this chapter, we show examples of networks created with NETMORPH, and
emergent synaptic connectivities in a single layer of rat cortical L2/3 pyramidal neurons. This
choice was based on the availability of experimental data on L2/3 pyramidal cell
morphologies and pyramidal-pyramidal cell connectivity. The question was addressed
whether model neurons, generated with the NETMORPH simulator, and placed in realistic
densities in space resulted in networks with realistic synaptic connectivity patterns.
We found that networks formed by the realistic neuron morphologies generated with
NETMORPH show connectivity patterns that are in very good agreement with the available
3
experimental data. For a number of connectivity properties experimental data was not yet
available and these outcomes must therefore be regarded as predictions.
4.2 NETMORPH simulator
In the simulator NETMORPH, neurons, with their cell bodies initially placed in a 3D space,
grow out independently from each other and fill the space with their axonal and dendritic
arborizations. Candidate synaptic locations are searched for on the basis of the proximity of
axonal and dendritic branches in conjunction with a `crossing criterion' for any pair of axonal
and dendritic line-pieces that constitute the branches (Van Pelt et al. 2010). The synaptic
locations are thus purely based on the 3D cell geometries.
A simulation run of NETMORPH is based on a script, a text file that contains parameter
identifiers with associated values specifying the duration, the time step, and other parameters
required for the growth process. These include the model specifications (parameters) and the
various probability density functions from which random samples are to be drawn. The
structure of the scripts, and the parameters that can be used to specify the growth process, are
explained in the manual of NETMORPH (Koene et al. 2009). The NETMORPH simulator is
used for both the optimization process in an iterative fashion, and for running the final
simulations with the optimised growth parameter values. The optimization process aims at
findings those parameter values that result in morphologies optimally matching experimental
data of reconstructed neurons. A network simulation requires a network initialization step
including the specification of the space, cell types, positions of the cell bodies, etc.
4.2.1 Model of neurite outgrowth in the NETMORPH simulator
An important requirement of a simulator of neuronal morphology is that the simulated
structures are realistic both in their shapes and in the variability in shapes. The outgrowth
model used by NETMORPH is based on stochastic phenomenological rules for branching and
elongation of neuritic segments (growth ones), formulated by Van Pelt et al., and has been
shown to accurately describe the geometry of dendrites of various cell types (e.g., Van Pelt et
al. 2001; Van Pelt and Uylings 2003; 2005). Note, that the current version of NETMORPH
has also been used for generating axonal arborizations (see Discussion for axonal outgrowth
rules).
The growth model is a phenomenological one aiming at describing the growth actions, not a
biophyical one that would describe the mechanisms underlying the growth actions. The model
is based on a minimal set of growth rules formulated as close as possible to the observables
in the neurite outgrowth process. These growth rules concern the branching process,
producing topological trees, and the elongation process defining the lengthening of the
segments. The modular structure allowed each growth rule to be validated separately on
experimental data.
Neurite outgrowth starts with the formation of an initial segment emerging from the cell body
and with a growth cone at the tip. The growth cone elongates the neurite, can change
outgrowth direction, and can branch, creating two daughter growth cones. Note that on a
smaller time scale growth cone behavior shows more complex dynamic behavior including
phases of retraction.
4.2.2 Branching
During outgrowth, each growth cone j in a growing tree has a branching probability given at
time ti with time step t by
4
ji
i
SE
i
tt
n
ij neeC
Btp
2)1( // (1)
with
i k
i
n
k
S
i
nn
C12
1 .
(e.g. Van Pelt and Uylings 2002; 2003; 2005; 2007). The equation is the product of three
factors: a factor /ite
that decreases exponentially with time constant with developmental
time; a factor jS2 , modulated by the parameter S, that changes with the growth cone’s
centrifugal order (the number of branch points between the tip and the root of the tree); and
a factor E
in that decreases with the momentary number (ni) of growth cones in the tree. This
last factor reflects competition between growth cones for resources. Parameter E denotes the
strength of competition. After each branching event, the branching probability thus decreases.
The parameter B∞ determines the expected number of terminal segments in the final tree for
E=0. The coefficient inC is a normalization term to be updated at each branching event. The
branching process of a tree is thus fully defined by the parameters B , E, S, τ, and the period
of growth T. Examples of optimized values for these parameters for a variety of cell types are
summarized in Van Pelt et al. (2001b).
4.2.3 Elongation
The rate of elongation of a growth cone may vary considerably (e.g., Lamoureaux et al. 1998;
da Costa et al. 2002), also on the time scale of the chosen time steps Δt. In NETMORPH a
more coarse grained approach is used by taking an averaged elongation rate for the period in
which a terminal segment is elongating up to the occurrence of its next branching event. The
daughter segments emerging from a branching event are then subsequently given an
elongation rate up to their next branching events. NETMORPH assigns the elongation rates
by randomly sampling a Gaussian distribution with mean eri-mn and standard deviation eri-sd
(eri stands for elongation rate initialization). Alternatively, NETMORPH includes the option
to select an elongation competition model. In addition to influencing branching probability,
competition between growth cones for limited resources may also affect elongation rate (see
also Van Ooyen et al. 2001; Van Ooyen 2011), which can be described as
Ftnt )()( 0 (2)
with parameter F determining the strength of competition (Van Pelt and Uylings 2003). For
F=0, terminal segments elongate with rate 0 independent of the number of terminal
segments. For F>0, elongation rates depend on the momentary number of terminal segments.
For F=1, elongation rates are inversely correlated with the number of terminal segments,
implying that the total tree increase its length with rate 0 . Strong experimental evidence for
such dependencies is, however, not yet available. Therefore, this option has not been used in
the simulations described in this chapter, i.e., F=0.
4.2.4 Neurite turning and direction of outgrowth after branching
5
The direction of outgrowth of growth cones is subject to different factors with intrinsic ones
(such as cytoskeletal stiffness) and external ones (such as trophic and tropic factors, and
irregularities of the surrounding tissue). NETMORPH uses a stiffness rule in combination
with a stochastic factor to calculate momentary outgrowth directions of all dendritic growth
cones (Koene et al. 2009).
4.2.5 Flatness of bifurcations
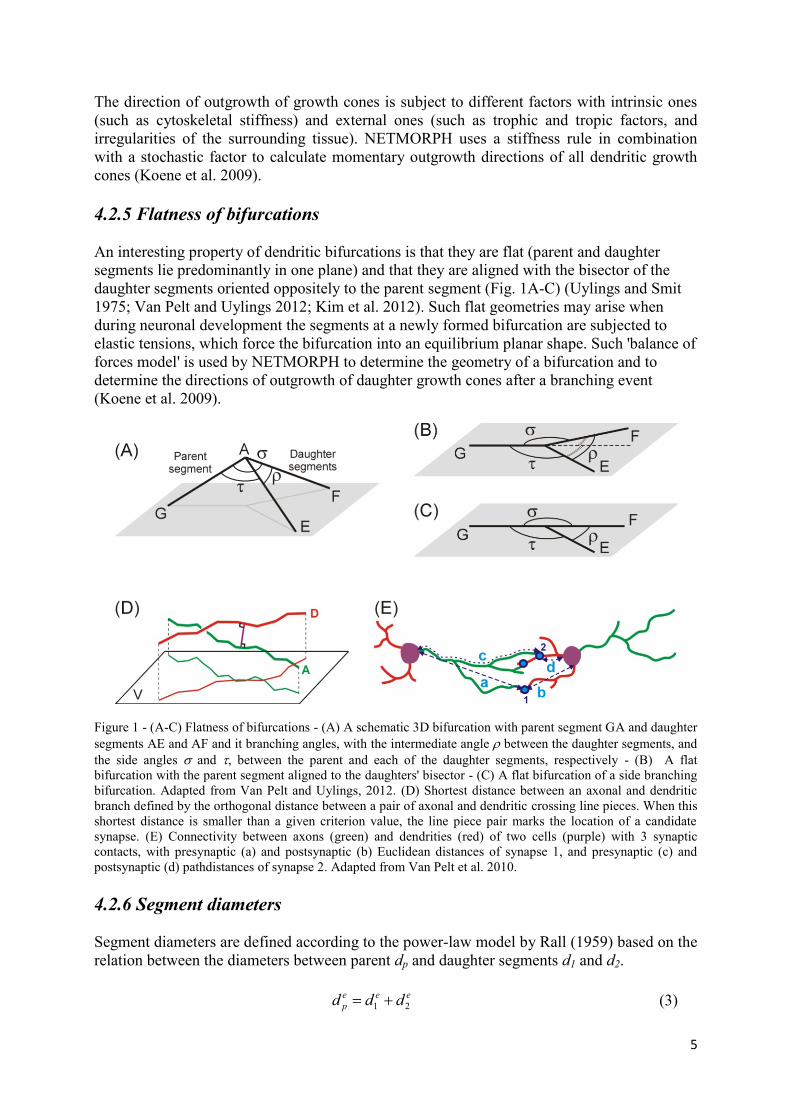
An interesting property of dendritic bifurcations is that they are flat (parent and daughter
segments lie predominantly in one plane) and that they are aligned with the bisector of the
daughter segments oriented oppositely to the parent segment (Fig. 1A-C) (Uylings and Smit
1975; Van Pelt and Uylings 2012; Kim et al. 2012). Such flat geometries may arise when
during neuronal development the segments at a newly formed bifurcation are subjected to
elastic tensions, which force the bifurcation into an equilibrium planar shape. Such 'balance of
forces model' is used by NETMORPH to determine the geometry of a bifurcation and to
determine the directions of outgrowth of daughter growth cones after a branching event
(Koene et al. 2009).
Figure 1 - (A-C) Flatness of bifurcations - (A) A schematic 3D bifurcation with parent segment GA and daughter
segments AE and AF and it branching angles, with the intermediate angle between the daughter segments, and
the side angles and , between the parent and each of the daughter segments, respectively - (B) A flat
bifurcation with the parent segment aligned to the daughters' bisector - (C) A flat bifurcation of a side branching
bifurcation. Adapted from Van Pelt and Uylings, 2012. (D) Shortest distance between an axonal and dendritic
branch defined by the orthogonal distance between a pair of axonal and dendritic crossing line pieces. When this
shortest distance is smaller than a given criterion value, the line piece pair marks the location of a candidate
synapse. (E) Connectivity between axons (green) and dendrities (red) of two cells (purple) with 3 synaptic
contacts, with presynaptic (a) and postsynaptic (b) Euclidean distances of synapse 1, and presynaptic (c) and
postsynaptic (d) pathdistances of synapse 2. Adapted from Van Pelt et al. 2010.
4.2.6 Segment diameters
Segment diameters are defined according to the power-law model by Rall (1959) based on the
relation between the diameters between parent dp and daughter segments d1 and d2.
eee
p ddd 21 (3)
6
Empirical values for the exponent e for different cell types were summarized in Van Pelt and
Uylings (2005). NETMORPH determines the segment diameters after the outgrowth process
has ended.
4.3 Neuronal morphologies
Whether a simulator produces realistic neuronal shapes can only quantitatively be assessed by
comparing shape properties of real and simulated neurons. Axonal and dendritic branching
patterns are complex and require many different shape parameters to quantify their metrical
and topological properties and their embedding in 3D space (e.g. Uylings and Van Pelt, 2002;
Gillette et al. 2001). The shape parameters of the individual trees, used for the automatic
optimization of the growth parameters, are the number of segments, the lengths of
intermediate and terminal segments, the path distance of the terminal tips to the cell body, the
tree asymmetry index (topological arrangement of the segments in the formation of the tree),
and the mean centrifugal order (mean of the number of segments at successive centrifugal
orders in the tree). In the optimization process the distributions of these shape parameters
were compared with the experimental ones, both in their mean values and their standard
deviations. The spatial innervation of the arborizations also depends on the curvature and
orientation of the branches. These shape properties are in NETMORPH controlled by the
stiffness parameters and the angular distributions for the outgrowth directions of growth
cones. These parameters were optimized separately.
4.3.1 Parameter optimization
The outgrowth rules in NETMORPH are determined by a main set of six growth parameters
(E, S, B∞, τ, eri-mn and eri-sd) used for (semi-) automatic optimization and an additional set
of parameters that are set separately. The outgrowth parameters for a given neuron type need
to be optimized for an experimental morphological dataset of this type of neurons. Some
growth parameter values have a direct relation with the generated morphological shapes. The
topological properties of branching patterns emerge from the branching rules, while the
metrical properties emerge from both the branching and the elongation rules. For instance, the
parameters B(T) and E directly determine the mean and standard deviation of the degree
distribution of the generated trees at developmental time T and the user can find the best B-E
values using for instance the graphs in Van Pelt et al. (2001) or in Van Pelt and Uylings
(2002). The parameter B in Eq. (1) relates to B(T) via )1/()( /TeTBB
. The parameter
S in Eq. (1) relates to the mean topological asymmetry of the trees via the graphs in Van Pelt
et al. (2001). The ratio of intermediate and terminal segment length depends on the decay
constant in Eq. (1). The smaller this value the more rapidly in time the branching
probability decreases and the longer the segments become (unless the elongation rate
decreases as rapidly). Nevertheless, finding the optimal parameter values typically implicates
an iterative process of selecting a parameter set, generating a sample of model neurons,
analysing their shapes and comparison with the shapes in the experimental dataset. Such
optimization may proceed manually by selecting certain values for the parameters, but
automated procedures are also available, such as genetic algorithms or maximum likelihood
optimization methods. Note, that the six growth parameter values were optimized only for
generating realistic neuronal morphologies, not for producing particular connectivity patterns.
4.4 Synaptic connectivity
7
Axons and dendrites can only form connections at locations where they are in sufficiently
close proximity (Peters 1979) which depends on the size of axonal boutons and dendritic
spines and the 'capture range' of growth cone filopodia. In NETMORPH such locations are
searched, after having filled a space with axonal and dendritic ramifications, by using a preset
criterion for the required proximity, typically in the range of a few micron. NETMORPH uses
a recently developed algorithm for this search which combines a crossing requirement of a
line piece pair (Fig. 1D), and the criterion for the orthogonal distance between these line
pieces (Van Pelt et al. 2010). Note that these locations are based on geometrical
considerations only and thus mark candidate sites for synapses. Whether synapses will
actually occur depends on many other biological factors. In the following all these candidate
sites are taken into account, no selection is thus made here.
4.4.1 Connectivity - terminology and measures
Two neurons are connected when they share at least one synaptic contact (Fig. 1E). The
number of contacts per connection (multiplicity) is defined as the number of synapses from a
given neuron projecting on the dendrites of another neuron. A synaptic contact is between the
axon of a presynaptic neuron and a dendrite of a postsynaptic neuron. A synaptic contact is at
certain distances from its presynaptic and its postsynaptic cell body, respectively. These
distances can be measured as Euclidean distances (straight line between synapse location and
soma center) or as path distances along the arborizations themselves. The Euclidean distance
between the somata of two connected neurons is called the connection length.
4.4.2 Connectivity - statistical measures of connectivity
The connection probability between two neurons is defined as the probability that two
randomly selected neurons in a network are connected, i.e., have at least one synaptic contact
from the axon of one of the neurons onto the dendrite of the other neuron.
The connection probability versus Euclidean distance between two neurons is defined as the
probability that two randomly selected neurons in a network at a given Euclidean distance
from each other are connected.
A distinction can be made between directed or undirected connections. The directed or one-
way connection probability is defined as the probability that a given (presynaptic) neuron has
at least one synaptic contact with another given (postsynaptic) neuron. Note that in a network
of N neurons there are N(N-1) directed neurons pairs but N(N-1)/2 undirected neuron pairs.
4.4.3 NETMORPH example
For studying emergent network connectivity simulations were run mimicking a network of rat
Layer 2/3 pyramidal neurons. A number of 250 cell bodies was uniform randomly placed
within a cylinder with a height of 380 m. This number was mainly restricted by the
computational load of the simulation. A radius of 93 m was adopted to obtain a realistic
density of neurons (about 75000 per mm3, Hellwig 2000). A minimum distance of 20 m was
taken between the cell bodies. Each pyramidal cell was initialized with root points for an axon
and an apical dendrite and a number of root points for basal dendrites uniform randomly
selected between the numbers 4 and 8. The growth of the pyramidal cells has been simulated
over a period of 18 days, a period in which these cells in the rat cortex obtain their mature
total length (Uylings et al. 1994). Examples of simulated neurons are shown in Fig. 2B, while
Fig. 3 illustrates the density of axonal and dendritic fibers in the network. Evidently, the
8
axonal and dendritic arborizations covered a space much larger than the cylinder used for
placing the cell bodies. Synapses thus could occur at all places where axonal and dendritic
branches were present.
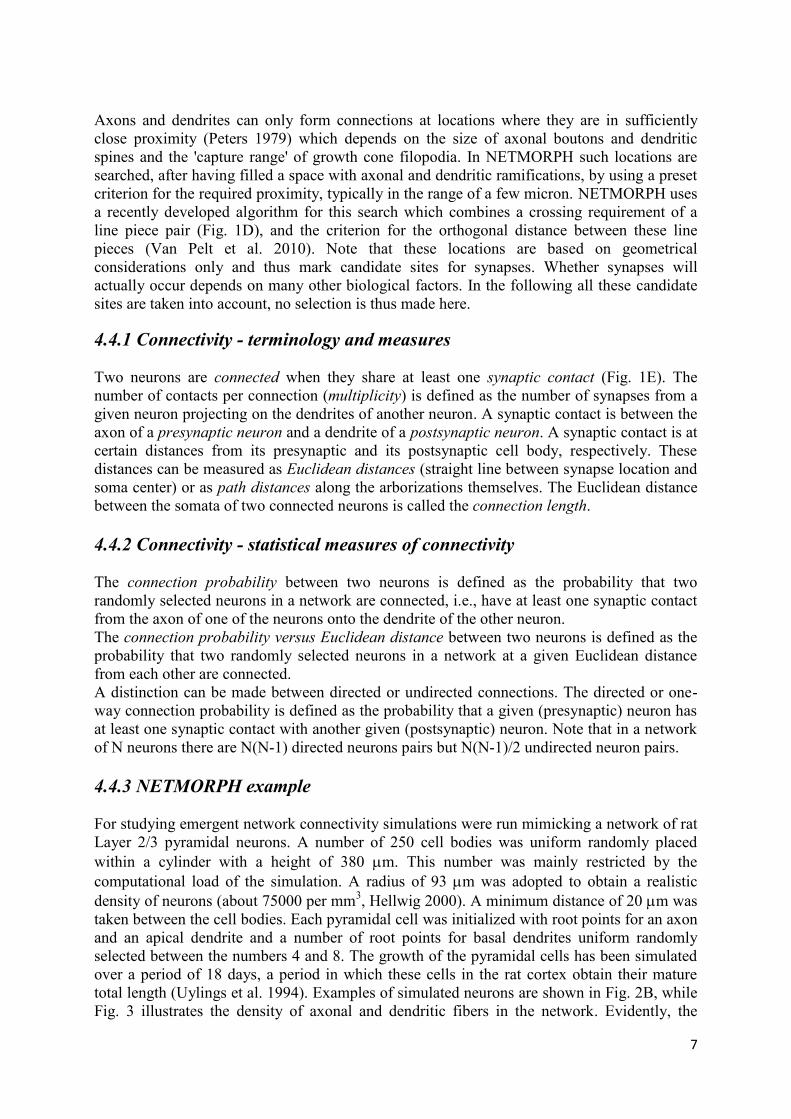
Figure 2. (A) Four examples of rat neocortical Layer 2/3 pyramidal neurons, obtained from the Svoboda data set
in NeuroMorpho.Org (Ascoli 2006; Ascoli et al. 2007). (B) Four examples of NETMORPH generated rat
cortical L2/3 pyramidal neurons. Apical and basal dendrites in red and axons in green. Adapted from Van Pelt et
al. (2010).
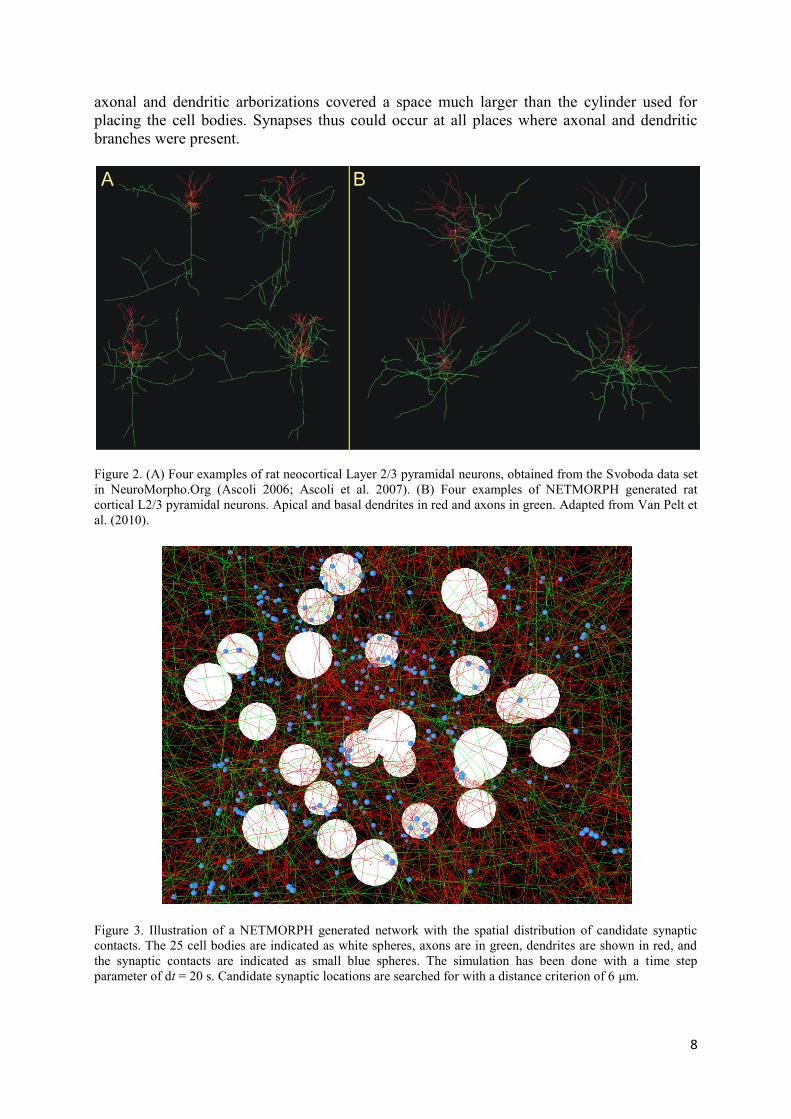
Figure 3. Illustration of a NETMORPH generated network with the spatial distribution of candidate synaptic
contacts. The 25 cell bodies are indicated as white spheres, axons are in green, dendrites are shown in red, and
the synaptic contacts are indicated as small blue spheres. The simulation has been done with a time step
parameter of dt = 20 s. Candidate synaptic locations are searched for with a distance criterion of 6 μm.
9
4.4.4 Validation of morphological shapes
The similarity between model and real neuronal shapes has been assessed quantitatively by
comparing both the mean and standard deviation of the distributions of the quantitative shape
parameters mentioned earlier for both axons and dendrites. Also visually do the NETMORPH
examples shown in Fig. 2B agree very well with the experimental reconstructed neurons in
Fig. 2A. Nevertheless, the visual comparison does show some differences in the pattern of
axonal fibers which in the experimental data clearly show downward and sideward orientation
preferences, which is not shown in the NETMORPH axons (see Discussion).
For illustration an example of a connected network of 25 neurons with a realistic numerical
density is shown in Fig. 3. Axonal and dendritc fibers are indicated as green and red line
pieces, respectively. In this example the candidate synapse locations were searched using a
distance criterion of 6 m, and are indicated as blue dots. Note that the actual simulations
were done for networks of 250 neurons.
4.4.5 Connection probability versus intersomal Euclidean distance
With the set of identified synapses in the network of 250 neurons the one-way connection
probability was determined by dividing the number of connected pre- and postsynaptic neuron
pairs with a given intersomal distance by the total number of directed pairs of neurons with a
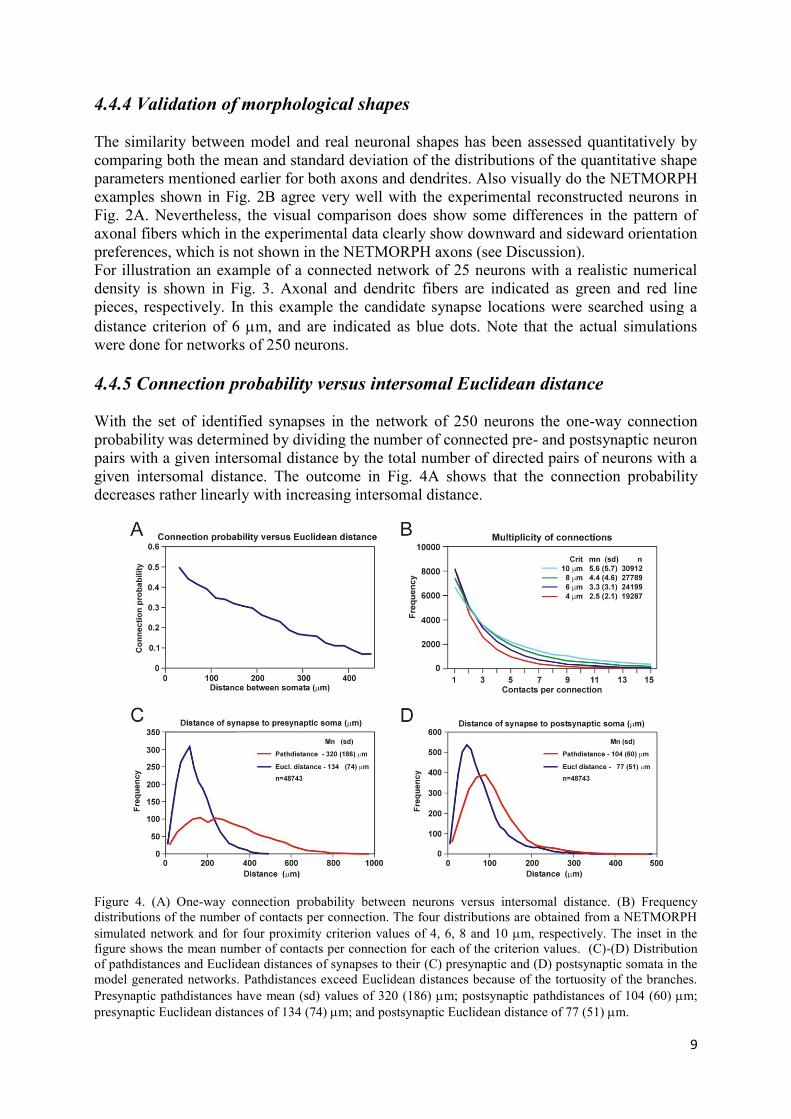
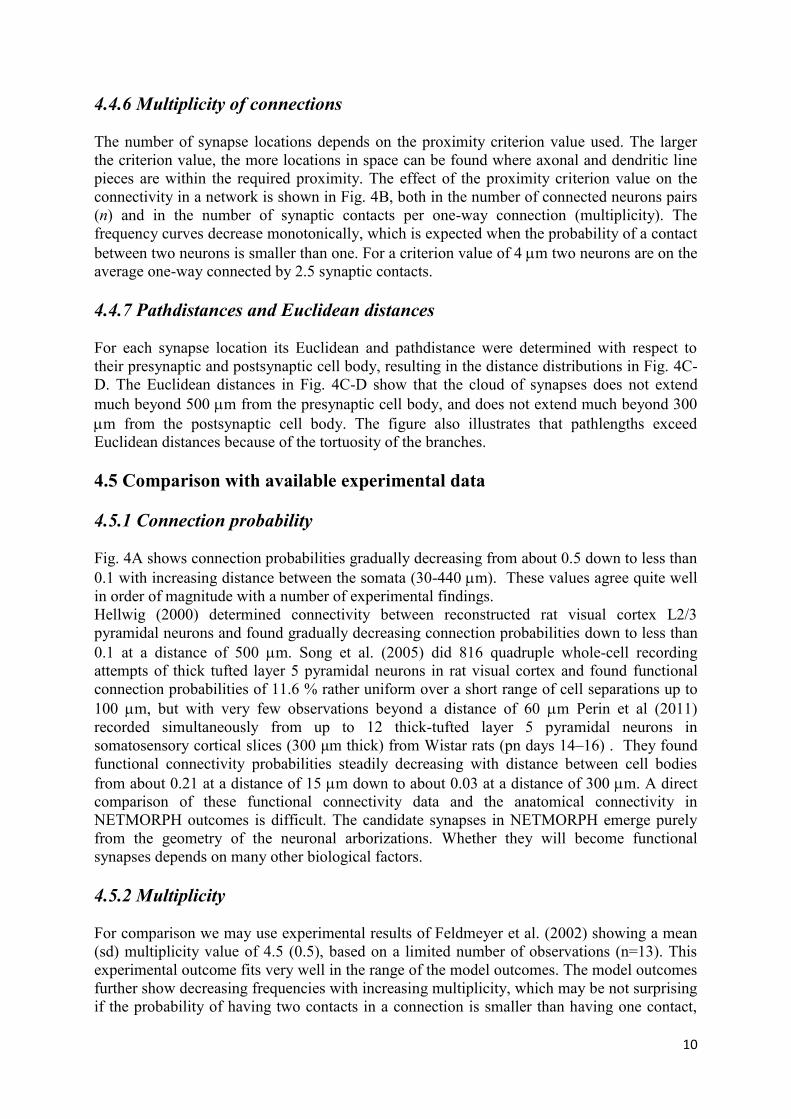
given intersomal distance. The outcome in Fig. 4A shows that the connection probability
decreases rather linearly with increasing intersomal distance.
Figure 4. (A) One-way connection probability between neurons versus intersomal distance. (B) Frequency
distributions of the number of contacts per connection. The four distributions are obtained from a NETMORPH
simulated network and for four proximity criterion values of 4, 6, 8 and 10 m, respectively. The inset in the
figure shows the mean number of contacts per connection for each of the criterion values. (C)-(D) Distribution
of pathdistances and Euclidean distances of synapses to their (C) presynaptic and (D) postsynaptic somata in the
model generated networks. Pathdistances exceed Euclidean distances because of the tortuosity of the branches.
Presynaptic pathdistances have mean (sd) values of 320 (186) m; postsynaptic pathdistances of 104 (60) m;
presynaptic Euclidean distances of 134 (74) m; and postsynaptic Euclidean distance of 77 (51) m.
10
4.4.6 Multiplicity of connections
The number of synapse locations depends on the proximity criterion value used. The larger
the criterion value, the more locations in space can be found where axonal and dendritic line
pieces are within the required proximity. The effect of the proximity criterion value on the
connectivity in a network is shown in Fig. 4B, both in the number of connected neurons pairs
(n) and in the number of synaptic contacts per one-way connection (multiplicity). The
frequency curves decrease monotonically, which is expected when the probability of a contact
between two neurons is smaller than one. For a criterion value of 4 m two neurons are on the
average one-way connected by 2.5 synaptic contacts.
4.4.7 Pathdistances and Euclidean distances
For each synapse location its Euclidean and pathdistance were determined with respect to
their presynaptic and postsynaptic cell body, resulting in the distance distributions in Fig. 4C-
D. The Euclidean distances in Fig. 4C-D show that the cloud of synapses does not extend
much beyond 500 m from the presynaptic cell body, and does not extend much beyond 300
m from the postsynaptic cell body. The figure also illustrates that pathlengths exceed
Euclidean distances because of the tortuosity of the branches.
4.5 Comparison with available experimental data
4.5.1 Connection probability
Fig. 4A shows connection probabilities gradually decreasing from about 0.5 down to less than
0.1 with increasing distance between the somata (30-440 m). These values agree quite well
in order of magnitude with a number of experimental findings.
Hellwig (2000) determined connectivity between reconstructed rat visual cortex L2/3
pyramidal neurons and found gradually decreasing connection probabilities down to less than
0.1 at a distance of 500 m. Song et al. (2005) did 816 quadruple whole-cell recording
attempts of thick tufted layer 5 pyramidal neurons in rat visual cortex and found functional
connection probabilities of 11.6 % rather uniform over a short range of cell separations up to
100 m, but with very few observations beyond a distance of 60 m Perin et al (2011)
recorded simultaneously from up to 12 thick-tufted layer 5 pyramidal neurons in
somatosensory cortical slices (300 μm thick) from Wistar rats (pn days 14–16) . They found
functional connectivity probabilities steadily decreasing with distance between cell bodies
from about 0.21 at a distance of 15 m down to about 0.03 at a distance of 300 m. A direct
comparison of these functional connectivity data and the anatomical connectivity in
NETMORPH outcomes is difficult. The candidate synapses in NETMORPH emerge purely
from the geometry of the neuronal arborizations. Whether they will become functional
synapses depends on many other biological factors.
4.5.2 Multiplicity
For comparison we may use experimental results of Feldmeyer et al. (2002) showing a mean
(sd) multiplicity value of 4.5 (0.5), based on a limited number of observations (n=13). This
experimental outcome fits very well in the range of the model outcomes. The model outcomes
further show decreasing frequencies with increasing multiplicity, which may be not surprising
if the probability of having two contacts in a connection is smaller than having one contact,
11
etc. The number of observations in the Feldmeyer data (n=13) is, however, too small to draw
any conclusion about the shape of the experimental distribution.
4.5.3 Pre- and postsynaptic distances
Experimental data of Le Bé et al. (2007) shows a distribution of postsynaptic pathdistances
(n=55) with mean(sd) of 130(138) m, and thus with a SEM value of 18 m. Although the
synapses originate from layer 5 corticocallosal projecting neurons, their positions on the
dendrites compare quite well with the model outcomes, also in the shape of the distribution,
with few observations at higher distances. For comparison of postsynaptic Euclidean
distances we may use experimental data of Feldmeyer et al. (2002) who measured
connectivity between 13 pairs of L4 spiny neurons projecting onto L2/3 pyramidal neurons
resulting in a mean(sd) of the geometric postsynaptic distances (n=59) of 67.2(33.6) m.
Although the synapses in this study originate from layer 4 spiny neurons, their positions on
the dendrites compare quite well with the model outcomes, also in the shape of the
distribution, with few observations at higher distance. Our NETMORPH outcomes on pre-
and postsynaptic pathdistances also agree very well with qualitative experimental data from at
least seven rat somatosensory cortical pyramidal neurons recently published by Hill et al.
(2012). Experimental data of presynaptic path- and Euclidean distances was not yet available
for comparison, making this distribution a prediction for future validation.
4.6 Discussion
4.6.1. Growth model assumptions
4.6.1.1 Stochastic approach
The dendritic growth model, as earlier developed by Van Pelt et al. (e.g., Van Pelt et al. 2001;
2005), described growth cone behavior in a stochastic way. This approach was based on the
consideration that the actual behavior of growth cones within neural tissue depends on a
multitude of mechanisms, interactions and environmental structural, molecular and chemical
conditions, and that a statistical approach was most appropriate. Indeed, the variability in
dendritic shape parameters could fully be described by the stochasticity in the modeled
growth cone behavior.
4.6.1.2 Exponential decreasing baseline branching rate
An interesting outcome of the model-based analysis of the growth rate of outgrowing
dendrites (Van Pelt and Uylings 2003) was that it required the assumption of an exponential
decreasing baseline branching rate (Eq. 1). This prediction may refer to intracellular processes
during dendritic outgrowth that reduce the branching probability of individual growth cones
with time.
4.6.1.3 Competition between growth cones
For the dendritic growth model to produce realistic dendritic branching patterns, it was also
necessary to include a dependence of the branching probability on the total number of growth
cones in the dendritic tree. Such dependence may point to competition between growth cones
12
during outgrowth. Such competition has indeed been observed in time-lapse movies of
outgrowing neurites in tissue culture (da F Costa et al. 2002).
4.6.1.4 Axonal outgrowth
The outgrowth model used by NETMORPH has initially been developed for and validated by
dendritic arborizations of a large variety of cell types. The stochastic rules for dendritic
branching and elongation did not include interactions of growth cones with their environment
as it was assumed that this environment was homogeneous for the space of dendritic
coverage. In the example the dendritic outgrowth model has also been applied for the
generation of axonal arborizations. Although the dendritic shapes indeed appeared to agree
very well with the experimental reconstructed neurons, the visual comparison of the pattern of
axonal fibers did show some differences in the downward and sideward orientation
preferences. As mentioned earlier, axonal growth cones migrate and branch in dependence of
external cues and these interactions need to be included in the axonal outgrowth rules in
NETMORPH which will further improve the realism of the 3D shape of axonal arborizations.
In addition, axonal growth cones grow out over longer distances and in areas with different
environmental cues that may influence their branching and elongation behavior. The
assumption of spatial homogeneity is therefore not appropriate for axonal outgrowth. A neural
simulator thus needs to specify the environment in which axons grow out, and the rules for
interaction of axonal growth cones with the local environmental cues. Presently,
NETMORPH is being extended with options for defining areas qualified by spatial scalar and
vector fields. Scalar fields represent trophic actions on growth cones that modulate branching
probability and elongation rate, and vector fields represent tropic actions on growth cones that
modulate the direction of outgrowth of growth cones.
4.6.1.5 Independent outgrowing neurons
The simulator NETMORPH presently assumes that neurons grow out independently of each
other and that synaptic connectivity fully depends on the geometry of the neurons. The
independency assumption may be challenged when growth cone-environment interactions are
being implemented for axon outgrowth, and in particular when the environment becomes
influenced by the presence of other neurons. An interesting finding in this context was
recently published by Hill et al. (2012). They compared pre-and postsynaptic path length
distributions from experimental data with predictions from artificial networks composed of
the reconstructed neurons and synapse formation based on geometrical considerations. They
concluded that the predicted statistical connectivity was a good predictor of the
experimentally observed functional connectivity. This finding may suggest that, even when
neurite outgrowth proceeds by growth cones influenced by their local environments, the
number of factors involved in such modulation is still so large that a stochastic approach is
justified.
4.6.1.6 Incomplete reconstructions
In the given example the outgrowth parameters are optimised on the morphologial properties
of reconstructions, made available via the NeuroMorpho.Org database (Ascoli 2006; Ascoli et
al. 2007). These reconstructions were all obtained from sliced tissue, containing only the parts
of the axonal and dendritic arborizations within the slices (with thicknesses less than or equal
to about 300 m). By proper slicing and selecting only centrally placed neurons, the loss of
cut branches can be minimized, but axons will certainly lose their long distance projections.
13
Therefore the growth rules have been optimized on the morphological properties of the
dendritic and axonal parts within the slices. Consequently, the axons and dendrites generated
by NETMORPH agree with these properties.
In the example discussed above the neuronal cell bodies were placed within a limited
cylindrical space of height 380 m and radius 93 m. The space covered by the dendritic
arborizations thus extends this cylinder by the dendritic Euclidean pathlengths, making
synaptic connections only possible for the axonal arborizations within this dendritic space.
Thus, long-distance parts of axonal arborizations were not required for these spatial
dimensions.
4.6.2 Future developments
Computational modeling is an essential tool towards understanding the brain. Cognition
emerges from the activity dynamics in the neuronal networks comprising the brain. Modelers
are thus challenged by the need of producing tools for reproducing the structural components
of the brain and for simulating the activity dynamics on these structures. It depends on the
questions addressed to what spatial and temporal details (granularity) these tools need to be
developed.
The connectivity patterns in neuronal networks depend on the morphological characteristics
of neuronal arborizations. This underscores the need for simulators able to generate neuronal
arborizations with sufficient level of realism and detail. While the simulator NETMORPH has
shown its functionality in generating dendritic arborizations, extensions are needed to
reproduce axonal arborizations in more realistic detail. Such extensions include interactions of
outgrowing neurites with local environmental cues. Preliminary work using scalar and vector
fields for trophic and tropic actions indeed showed improved realism in the typical orientation
preferences of axonal fibers and layer specific branching rates.
Long range axonal connections, however, require also detailed qualifications of brain areas
for axon guidance, and complex interaction rules to be included in the simulator. Finding a
good balance between the need for a low-dimensional outgrowth model and a rich and
realistic repertoire of emergent structures and connectivities will be a major challenge in
further developments of the simulator.
Dendritic and axonal arborizations may also statistically be represented by socalled density
fields. The generation of connected networks from these density fields is still a challenge and
a topic of ongoing research.
Acknowledgments This work was supported by grants from the Netherlands Organization for
Scientific Research (NWO) through the Program Computational Life Sciences (grant number
635.100.005), the MC-RTN project NEURoVERS-it (grant number 019247) of the European Union,
and the BIO-ICT project SECO (grant number 216593) of the 7th Framework Programme of the
European Union.
References
Aćimović J, Mäki-Marttunen T, Havela R, Teppola H, and Linne M-L. Modeling of neuronal growth in vitro:
Comparison of simulation tools NETMORPH and CX3D. EURASIP Journal on Bioinformatics and
Systems Biology Volume 2011, Article ID 616382, 2011 doi:10.1155/2011/616382.
Ascoli G, Krichmar J. L-neuron: A modeling tool for the efficient generation and parsimonious description of
dendritic morphology. Neurocomputing 2002;32-33:1003-1011.
Ascoli GA. Mobilizing the base of neuroscience data: the case of neuronal morphologies. Nature Rev. Neurosci.
2006;7:318-324
14
Ascoli GA, Donohue DE, Halavi M. NeuroMorpho.Org: a central resource for neuronal morphologies.J
Neurosci. 2007;27(35):9247-51
Burke RE, Marks WB, Ulfhake B. A parsimonious description of motoneuron dendritic morphology using
computer simulation. J. Neurosc. 1992;12:2403-2416.
Cuntz H, Forstner F, Borst A, Häusser M. One Rule to Grow Them All: A General Theory of Neuronal
Branching and Its Practical Application. PLoS Comput Biol 2010;6(8):e1000877.
doi:10.1371/journal.pcbi.1000877.
Costa LdaF, Coelho RC. Growth driven percolations: the dynamics of connectivity in neuronal systems.
European Physical Journal B 2005;47:571-581
Costa LdaF, Coelho RC. Growth-Driven Percolations: The Dynamics of Community Formation in Neuronal
Systems. arXiv:q-bio/0411009v1;2008 [q-bio.NC].
Costa LdaF, Manoel ETM, Faucereau F, Chelly J, van Pelt J, Ramakers GJA. A shape analysis framework for
neuromorphometry. Network: Comput. Neural Syst. 2002;13:283-310.
Eberhard JP, Wanner A, Wittum G. NeuGen: A tool for the generation of realistic morphology of cortical
neurons and neuronal networks in 3D. Neurocomputing 2006;70(1-3):327-342.
Feldmeyer D, Lübke J, Silver RA, Sakmann B. Synaptic connections between layer 4 spiny neurone- layer 2/3
pyramidal cell pairs in juvenile rat barrel cortex: physiology and anatomy of interlaminar signalling within
a cortical column. The Journal of Physiology 2002;538:803-822.
Gillette T, Brown K, Ascoli G. The DIADEM Metric: Comparing multiple reconstructions of the same neuron.
Neuroinform 2001;9:233-245.
Gleeson P, Steuber V, Silver RA. neuroConstruct: a tool for modeling networks of neurons in 3D space. Neuron
2007;54(2):219-35.
Hellwig B. A quantitative analysis of the local connectivity between pyramidal neurons in layers 2/3 of the rat
visual cortex. Biol. Cybern. 2000;82:111-121.
Hill SL, Wang Y, Riachi I, Schurmann F, Markram H. Statistical connectivity provides a sufficeint foundations
for specific functional conenctivity in neocortical neural circuits. PNAS 2012;
www.pnas.org/cgi/doi/10.1073/pnas.1202128109.
Kim Y, Sinclair R, Chindapol N, Kaandorp JA, De Schutter E. Geometric Theory Predicts Bifurcations in
Minimal Wiring Cost Trees in Biology Are Flat. PLoS Comput Biol 2012;8(4):e1002474.
doi:10.1371/journal.pcbi.1002474.
Koene RA, Tijms B, van Hees P, Postma F, de Ridder S, Ramakers G, van Pelt J, van Ooyen A. NETMORPH:
A framework for the stochastic generation of large scale neuronal networks with realistic neuron
morphologies. Neuroinformatics 2009;7:195-210.
Lamoureux P, Buxbaum RE, Heidemann SR. Axonal outgrowth of cultured neurons is not limited by growth
cone competition. J. Cell Science 1998;111:3245-3252.
Le Be´ JV, Silberberg G, Wang Y, Markram H. Morphological, Electrophysiological, and Synaptic Properties of
Corticocallosal Pyramidal Cells in the Neonatal Rat Neocortex. Cerebral Cortex 2007;17:2204-2213.
Luczak A. Spatial embedding of neuronal trees modeled by diffusive growth. J. Neurosci. Meth. 2006;157:132-
141.
Mäki-Marttunen T, Aćimović J, Nykter M, Kesseli J, Ruohonen K, Yli-Harja O, Linne M-L. Information
diversity in structure and dynamics of simulated neuronal networks. Front. Comput. Neurosci. 2011 doi:
10.3389/fncom.2011.00026.
Perin R, Berger TK, Markram H. A synaptic organization principle for cortical neuronal groups. PNAS
2011;108(13):5419-5424. www.pnas.org/cgi/doi/10.1073/pnas.1016051108.
Peters A. Thalamic input to the cerebral cortex. Trends in Neuroscience 1979;(2):1183–1185.
Rall W. Branching dendritic trees and motoneuron membrane resistivity. Experimental Neurology 1959;1:491–
527.
Senft S, Ascoli G. Reconstruction of brain networks by algorithmic amplification of morphometry data. Lecture
Notes in Computer Science 1999;1606:25–33.
Samsonovich A, Ascoli G. Computational models of dendritic morphology: From parsimonious description to
biological insight. In: Laubichler M, G. Müller G, editors. Modeling Biology, Structures, Behaviors,
Evolution. Cambridge, Massachusetts: MIT Press; 2007. p.91-113.
Song S, Sjöström PJ, Reigl M, Nelson S, Chklovskii DB. Highly nonrandom features of synaptic connectivity in
local cortical circuits. PLoS Biology 2005;3(3):e68.
Torben-Nielsen B, Vanderlooy S, Postma EO. Non-parametric algorithmic generation of neuronal morphologies.
Neuroinformatics 2008;6:257--277.
Torben-Nielsen B, Tuyls K, Postma EO. EvOL-Neuron: virtual neuron generation, Neurocomputing 2008;71(4-
6):963-972.
Uylings H, Smit G. Three dimensional branching structure of pyramidal cell dendrites. Brain Research
1975;87:55–60.
15
Uylings HBM, van Pelt J, Parnavelas JG, Ruiz-Marcos A. Geometrical and topological characteristics in the
dendritic development of cortical pyramidal and nonpyramidal neurons. In: van Pelt J, Corner MA, Uylings
HBM, Lopes da Silva FH, editors. Progress in Brain Research, Vol 102, The Self-Organizing Brain: From
Growth Cones to Functional Networks. Amsterdam: Elsevier, 1994, pp. 109-123.
Uylings HBM, van Pelt J. Measures for quantifying dendritic arborizations. Network: Comput. Neural Syst.
2002;13:397-414.
Van Ooyen A. Using theoretical models to analyse neural development. Nature Reviews Neuroscience
2011;12:311-326. (invited review).
Van Ooyen A, Graham BP, Ramakers GJA. Competition for tubulin between growing neurites during
development. Neurocomputing 2001;38-40:73-78.
Van Pelt J, Uylings HBM. Branching rates and growth functions in the outgrowth of dendritic branching
patterns. Network: Comput. Neural Syst. 2002;13:261-281.
Van Pelt J, Uylings HBM. Growth functions in dendritic outgrowth. Brain and Mind 2003;4:51-65.
Van Pelt J, Uylings HBM. (2005) Natural variability in the geometry of dendritic branching patterns. In: Reeke
GN, Poznanski RR, Lindsay KA, Rosenberg JR, Sporns O, editors. Modeling in the Neurosciences: From
Biological Systems to Neuromimetic Robotics. CRC Press 2005, pp. 89-115.
Van Pelt J, Uylings HBM. Modeling neuronal growth and shape. In: Laubichler MD, Müller GB, editors.
Modeling Biology - Structures, Behaviors, Evolution. Cambridge: The MIT Press; 2007. p. 195-215.
Van Pelt J, Uylings HBM. The flatness of bifurcations in 3D dendritic trees: an optimal design. Front. Comput.
Neurosci. 2012;5:54. doi: 10.3389/fncom.2011.00054.
Van Pelt J, Van Ooyen A, Uylings HBM. Modeling dendritic geometry and the development of nerve
connections. In: de Schutter E, Cannon RC (CD-ROM)), editors. Computational Neuroscience: Realistic
modeling for experimentalist. Boca Raton: CRC Press; 2001. p.179-208.
Van Pelt J, Carnell A, de Ridder S, Mansvelder HD, van Ooyen A. An algorithm for finding candidate synaptic
sites in computer generated networks of neurons with realistic morphologies. Front. Comput. Neurosci.
2010;4:148. doi:10.3389/fncom.2010.00148.
Zubler F, Douglas RA. framework for modeling the growth and development of neurons and networks. Front.
Comput. Neurosci. 2009;3:25. doi: 10.3389/neuro.10.025.2009.