Organization Detection Using Emergent Computing
11
Organization Detection Using Emergent Computing Cyrille Bertelle, Antoine Dutot, Fr´ ed´ eric Guinand, Damien Olivier To cite this version: Cyrille Bertelle, Antoine Dutot, Fr´ ed´ eric Guinand, Damien Olivier. Organization Detection Using Emergent Computing. International Transactions on Systems Science and Applications, 2006, 2 (1), pp.61-69. <hal-00430530> HAL Id: hal-00430530 https://hal.archives-ouvertes.fr/hal-00430530 Submitted on 8 Nov 2009 HAL is a multi-disciplinary open access archive for the deposit and dissemination of sci- entific research documents, whether they are pub- lished or not. The documents may come from teaching and research institutions in France or abroad, or from public or private research centers. L’archive ouverte pluridisciplinaire HAL, est destin´ ee au d´ epˆ ot et ` a la diffusion de documents scientifiques de niveau recherche, publi´ es ou non, ´ emanant des ´ etablissements d’enseignement et de recherche fran¸cais ou ´ etrangers, des laboratoires publics ou priv´ es.
-
Upload
univ-lehavre -
Category
Documents
-
view
0 -
download
0
Transcript of Organization Detection Using Emergent Computing

Organization Detection Using Emergent Computing
Cyrille Bertelle, Antoine Dutot, Frederic Guinand, Damien Olivier
To cite this version:
Cyrille Bertelle, Antoine Dutot, Frederic Guinand, Damien Olivier. Organization DetectionUsing Emergent Computing. International Transactions on Systems Science and Applications,2006, 2 (1), pp.61-69. <hal-00430530>
HAL Id: hal-00430530
https://hal.archives-ouvertes.fr/hal-00430530
Submitted on 8 Nov 2009
HAL is a multi-disciplinary open accessarchive for the deposit and dissemination of sci-entific research documents, whether they are pub-lished or not. The documents may come fromteaching and research institutions in France orabroad, or from public or private research centers.
L’archive ouverte pluridisciplinaire HAL, estdestinee au depot et a la diffusion de documentsscientifiques de niveau recherche, publies ou non,emanant des etablissements d’enseignement et derecherche francais ou etrangers, des laboratoirespublics ou prives.
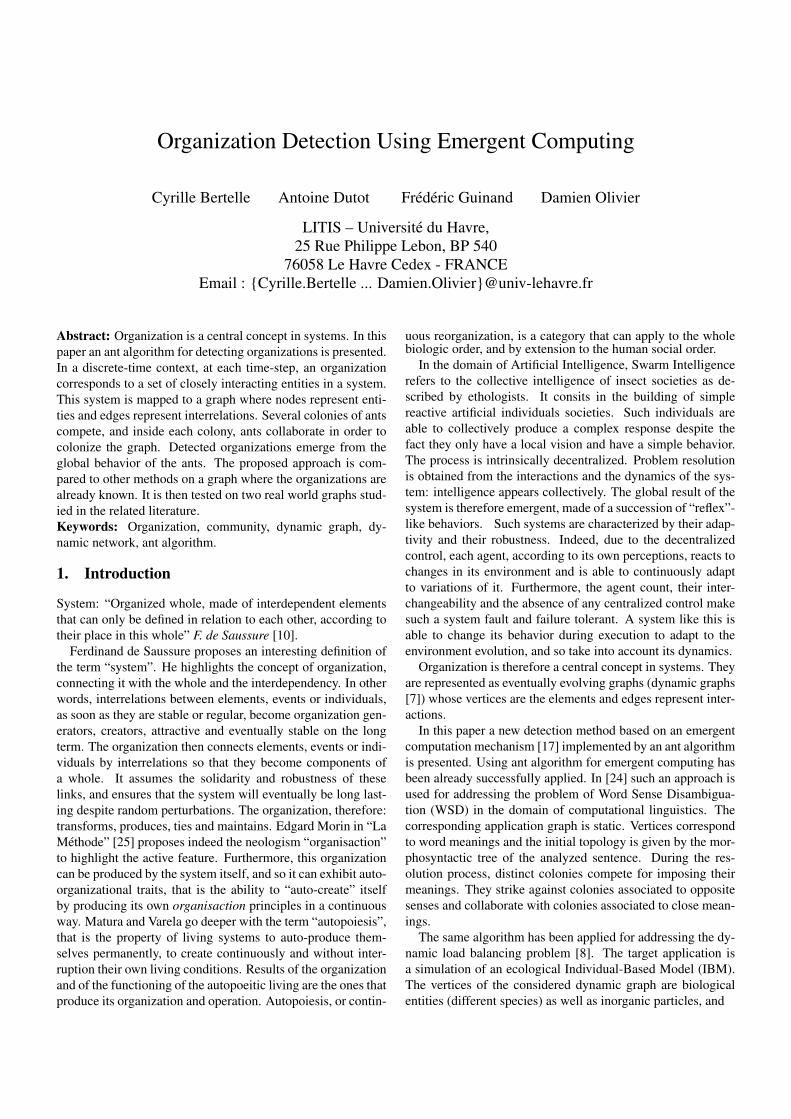
Organization Detection Using Emergent Computing
Cyrille Bertelle Antoine Dutot Frédéric Guinand Damien Olivier
LITIS – Université du Havre,25 Rue Philippe Lebon, BP 540
76058 Le Havre Cedex - FRANCEEmail : {Cyrille.Bertelle ... Damien.Olivier}@univ-lehavre.fr
Abstract: Organization is a central concept in systems. In thispaper an ant algorithm for detecting organizations is presented.In a discrete-time context, at each time-step, an organizationcorresponds to a set of closely interacting entities in a system.This system is mapped to a graph where nodes represent enti-ties and edges represent interrelations. Several colonies of antscompete, and inside each colony, ants collaborate in order tocolonize the graph. Detected organizations emerge from theglobal behavior of the ants. The proposed approach is com-pared to other methods on a graph where the organizations arealready known. It is then tested on two real world graphs stud-ied in the related literature.Keywords: Organization, community, dynamic graph, dy-namic network, ant algorithm.
1. Introduction
System: “Organized whole, made of interdependent elementsthat can only be defined in relation to each other, according totheir place in this whole” F. de Saussure [10].
Ferdinand de Saussure proposes an interesting definition ofthe term “system”. He highlights the concept of organization,connecting it with the whole and the interdependency. In otherwords, interrelations between elements, events or individuals,as soon as they are stable or regular, become organization gen-erators, creators, attractive and eventually stable on the longterm. The organization then connects elements, events or indi-viduals by interrelations so that they become components ofa whole. It assumes the solidarity and robustness of theselinks, and ensures that the system will eventually be long last-ing despite random perturbations. The organization, therefore:transforms, produces, ties and maintains. Edgard Morin in “LaMéthode” [25] proposes indeed the neologism “organisaction”to highlight the active feature. Furthermore, this organizationcan be produced by the system itself, and so it can exhibit auto-organizational traits, that is the ability to “auto-create” itselfby producing its own organisaction principles in a continuousway. Matura and Varela go deeper with the term “autopoiesis”,that is the property of living systems to auto-produce them-selves permanently, to create continuously and without inter-ruption their own living conditions. Results of the organizationand of the functioning of the autopoeitic living are the ones thatproduce its organization and operation. Autopoiesis, or contin-
uous reorganization, is a category that can apply to the wholebiologic order, and by extension to the human social order.
In the domain of Artificial Intelligence, Swarm Intelligencerefers to the collective intelligence of insect societies as de-scribed by ethologists. It consits in the building of simplereactive artificial individuals societies. Such individuals areable to collectively produce a complex response despite thefact they only have a local vision and have a simple behavior.The process is intrinsically decentralized. Problem resolutionis obtained from the interactions and the dynamics of the sys-tem: intelligence appears collectively. The global result of thesystem is therefore emergent, made of a succession of “reflex”-like behaviors. Such systems are characterized by their adap-tivity and their robustness. Indeed, due to the decentralizedcontrol, each agent, according to its own perceptions, reacts tochanges in its environment and is able to continuously adaptto variations of it. Furthermore, the agent count, their inter-changeability and the absence of any centralized control makesuch a system fault and failure tolerant. A system like this isable to change its behavior during execution to adapt to theenvironment evolution, and so take into account its dynamics.
Organization is therefore a central concept in systems. Theyare represented as eventually evolving graphs (dynamic graphs[7]) whose vertices are the elements and edges represent inter-actions.
In this paper a new detection method based on an emergentcomputation mechanism [17] implemented by an ant algorithmis presented. Using ant algorithm for emergent computing hasbeen already successfully applied. In [24] such an approach isused for addressing the problem of Word Sense Disambigua-tion (WSD) in the domain of computational linguistics. Thecorresponding application graph is static. Vertices correspondto word meanings and the initial topology is given by the mor-phosyntactic tree of the analyzed sentence. During the res-olution process, distinct colonies compete for imposing theirmeanings. They strike against colonies associated to oppositesenses and collaborate with colonies associated to close mean-ings.
The same algorithm has been applied for addressing the dy-namic load balancing problem [8]. The target application isa simulation of an ecological Individual-Based Model (IBM).The vertices of the considered dynamic graph are biologicalentities (different species) as well as inorganic particles, and

the edges represent the interactions between these entities.The underlying organizations are groups of biological enti-
ties. Indeed, during the execution, entities self-organize them-selves in groups according to different situations. As condi-tions change during the simulation, groups may appear or dis-appear in an unpredictable way. The idea was to use thesegroups as the basis for performing efficiently load balancing.The same method was also applied for building clusters of pro-teins from an homology graph. In such a static graph, verticescorrespond to proteins and edges to closeness with respect tohomology [6]. Based on some recent works [33, 31], a methodto interface the algorithm with other simulations taking into ac-count both inorganic particles organization and biological enti-ties organizations in order to detect specialized trophic chainsis currently studied.
The rest of this paper is organized as follows: the next sec-tion presents other comparable methods for organization orcommunity detection. Section 3. describes in detail the ap-proach, the implemented method and proposes a model for it.Results that can be expected by the method are presented insection 4., and some perspectives are drawn in the conclusion.
2. State of the Art
Finding organizations in graphs has been studied recently [2,26], but two domains have already worked in this direction:
• Graph partitioning;• Hierarchical clustering.
More recently, Girvan and Newman [20] suggested an elegantglobal algorithm based on hierarchical clustering that extendedthe concept of vertex betweenness centrality of Freeman [18]also to edges. Newman also suggested a stochastic approaches,like the random walk [29]. For a general review an discusionon the existing approaches see [9].
2.1 Graph Partitioning
Graph partitioning is a problem which appears in many differ-ent applications as VLSI design, data-mining, finite elementand parallel computing, but the problem of finding organiza-tion can be considered.
Given a graph G = (V,E), where V is the set of vertex andE the set of edges that determines the connectivity betweenthe nodes. Both vertex and edges can be weighted, where |v|is the weight of a vertex v, and |e| is the weight of edge eeven if in most of the literature, they are given unit weights.The graph partitioning problem consists on dividing G into kdisjoint partitions. The goal is to minimize the number of cutsin the edges of the partition, and on the other hand reduce theimbalance of the weight of the subdomains. The weight of asubdomain is the sum of the weights of the vertex allocated init.
As this is an NP-complete problem [19], for graphs with alarge order it is not possible to guarantee the achievement ofthe best solution in a reasonable computation time: when thesize of the graph increases, the execution time of an algorithmcapable of solving the problem can be assumed to grow expo-nentially. Therefore the problem is practically unsolvable formost graphs and heuristic and probabilistic methods are con-sidered to obtain solutions.
The methods presented below (2.1.1 and 2.1.2) use recursivebisection. First the graph is divided in two partitions, then eachcluster is divided in two, and so on. This method needs log2(k)steps to divide the graph in k partitions.
2.1.1 Spectral Methods
A spectral method (i.e., methods using the eigenvalues andeigenvectors of a matrix representation of a graph) is based onthe analysis of the adjacency matrix A = [aij ] [16, 11]. It con-sists to analyze properties of A. In particular, it is necessaryto calculate the Laplacian matrix L = D − A and the normalmatrix N = D−1A where D is the diagonal degree matrix ofvertices, if kij is an element of the matrix D,
kii =card(V )∑
k=1
aik and aik = 0 when i 6= k.
The smallest eigenvalue of L is 0, the second eigenvalue ofthe Laplacian matrix of a graph, λ2(L(G)), is the algebraicconnectivity of graph G. Thus the vector v2 corresponding toλ2(L(G)) is the eigenvector of algebraic connectivity, and hasspecial properties. It is possible to divide the graph into twocluster with the minimal amount of connectivity between themwith the following scheme: If v2(n) < 0, place n in G1. Ifnot, place n in G2.
2.1.2 Iterative Improvement
The Kernighan/Lin Algorithm [21] addresses the problem byproviding a method to improve upon an initial allocation ofnodes between two subgraphs. Thus the algorithm starts withbalanced partition and exchanges vertices in each subgraph toimprove cutsize. Till the cutsize is improved, the vertex pairs(one in each subgraph) which give the largest decrease in cut-size are exchanged. These vertices are locked. If no improve-ment is possible and some vertices are still unlocked, the ver-tices which give the smallest increase are exchanged. The algo-rithm by Fiduccia and Mattheyses [15] improves this method,providing an extremely efficient linear-time technique.
2.2 Hierarchical Clustering
These methods are generally used to analyze data [14]. Theseare statistical methods for finding relatively homogeneousclusters of cases based on measured characteristics. Themethod starts with each case in a separate cluster and thencombines the clusters sequentially, reducing the number ofclusters at each step until only one cluster is left. When thereare N cases, this involves N − 1 clustering steps, or fusions.This hierarchical clustering process can be represented as atree, or dendrogram and are generally based on an agglom-eration algorithm.
This kind of methods can be used on graph. The main goalis to group the vertices in subsets which represent the organi-zations. A similarity measure dij based on the graph structureis introduced between each pair of vertices. The algorithm be-gins with one organizations for one vertex, then in the follow-ing steps, the distance between each organizations is computedand the closest is merged.

2.3 Stochastic Approaches and Collective Explorations
Stochastic approach are generally based on random walk ingraphs [29] and its derivatives. A random walk is a simplestochastic process. It is a formalization of the intuitive ideaof taking successive steps, each in a random direction. Thusif a simple random walk in an undirected graph G is consid-ered, at each time step, if the walk is located at vertex u, itmoves forward to a vertex v chosen uniformly at random fromthe neighbors of u. To detect organizations, the main idea layson the fact that small random walks tend to be trapped intothem [30, 32]. A dissimilarity index [36] between two nearest-neighboring vertices of the graph is measured by a randomwalk. It is used to determine if nearest-neighboring verticesmust be in the same organization. It integrates both the localand the global structural information of the given graph andbias can be introduced.
Multi-agents system can be used to detect organizations,Young et al. [34] proposed the following method : agentsperform slightly biased walks on a graph and retain a list ofthe vertices they traverse. Based on this information, the agentthen follow a simple voting routine whereby nodes are mergedinto organizations and excluded from others. After this pro-cess, a simple clean up scheme can be employed to deliver thedesired number of organizations.
3. The Model
The goal is to find organizations inside a graph G = (V,E)representing entities V , and their interactions E. If interactionshave various degrees of importance, edges can be weighted,this weight being noted |e| for the edge e. Organizations areinformally defined in the graph G as: a set of entities moreclosely connected with each other than with the other parts ofthe graph. Note that this definition is very close to the vari-ous definitions of a community found in the literature. Moreclosely connected means here that there can be more edges, butalso that these edges may have stronger weights.
3.1 The Method
Several colonies of ants that travel inside the graph to detectorganizations are used. As said above, ants are simple entitiesthat collectively exhibit intelligent behavior. In our methodcollaboration between ants of a same colony allow to detectorganizations, whereas competition between distinct coloniesallows to separate organizations.
The algorithm used can be referred to as an ant algorithm,however it departs from the usual ACO (Ant Colony Optimiza-tion) as described in [12] since it never globally evaluates so-lutions, that is, it does not use an objective function. In our al-gorithm, ants auto-organize themselves and produce solutionsthat can be observed in the graph, but these solutions are neverretrofitted in the algorithm.
The ant algorithm use several colonies of ants, each ofa distinct color. Ants travel inside the graph an lay downpheromones, information that can be detected by other ants.Pheromones are also colored. Ants tend to be repulsed bypheromones of other colors. Furthermore, in the case ofa weighted graph, ants tend to favor edges with importantweights.
The algorithm principle is to color organizations usingpheromones. Each colony will collaborate to colonize zones,whereas colonies compete to maintain their own colored zone(see figure 1). Solutions will therefore emerge and be main-tained by the ant behavior. The solutions will be the color ofeach vertex in the graph. Indeed, colored pheromones are de-posited by ants on edges. The color of a vertex is obtainedfrom the color having the largest proportion of pheromones onall incident edges.
3.2 The Ant Algorithm
Algorithm 1: Ant behaviorn: current nodet: current timeA: fear of hostile environment thresholdT : resting time∆t: time counterif degree(n)=0 then
Jump randomly on another nodeelse
w ← Sum of all weights on each incident edge to nτ ← Sum of all pheromones of all colors on eachincident edge to nτc ← Sum of pheromones of the ant color on eachincident edge to na← τc
τif ∆t < T then
Choose an edge to cross in a weighted randomfashion, using edges weight (if available)Lay down a small amount of pheromone of the antcolor on this edgen← vertex at the other end of the chosen edge∆t← ∆t + 1
elseif a < A then
Jump randomly on another node∆t← 0
elseChoose an edge to cross in a weighted randomfashion, using edges weight (if available)Lay down a small amount of pheromone ofthe ant color on this edgen← vertex at the other end of the chosen edge
A colored dynamic graph G(t) = (E(t), V (t), C(t)) is de-fined such that:
• V (t) is the set of vertices at time t. Each vertex v ischaracterized by:
• a color c ∈ C(t),
• E(t) is the set of edges at time t. Each edge e is char-acterized by:
• a weight |e| ∈ N+ that corresponds to in-teraction importance between the elements ateach end of edge e.• a quantity of pheromones of each color.
• C(t) is a set of colors representing the ant colonies attime t.

� � � �� � � �� � � �
� � � �� � � �
� �� �� �
� �� �
� � �� � �� � �
� � �� � �
� � � �� � � �� � � �
� � � �� � � �
� � �� � �� � �� � �
� � �� � �� � �� � �� � �� � �� � �� � �
� � �� � �� � �� � �
� � �� � �� � �� � �
� � �� � �� � �� � �
� � �� � �� � �� � �
� � �� � �� � �
� � �� � �
� � � �� � � �� � � �
� � �� � �� � �
� � � �� � � �� � � �� � � �
� � �� � �� � �� � �
� � �� � �� � �� � �
� � �� � �� � �� � �
� � �� � �� � �� � �
� � �� � �� � �� � �
� � �� � �� � �
� � �� � �� � �
� �� �� �
� �� �� �
! ! !! ! !
" " " "" " " "" " " "
# # ## # ## # #
$ $ $$ $ $$ $ $
% % %% % %
& & && & && & &
' ' '' ' '
( ( (( ( (( ( (( ( (
) ) )) ) )) ) )) ) )
* * ** * ** * ** * *
+ + ++ + ++ + ++ + +
, , ,, , ,, , ,, , ,
- - -- - -- - -- - -
. . .. . .. . .
/ / // / /
0 00 00 00 0
1 11 11 11 1
2 2 2 22 2 2 22 2 2 2
3 3 33 3 3
4 4 4 44 4 4 44 4 4 44 4 4 4
5 5 55 5 55 5 55 5 5
6 6 6 66 6 6 66 6 6 6
7 7 7 77 7 7 7
8 8 88 8 88 8 8
9 9 99 9 9
: : : :: : : :: : : :: : : :
; ; ;; ; ;; ; ;; ; ;
< < < << < < << < < << < < <
= = == = == = == = =
> > >> > >> > >> > >
? ? ?? ? ?? ? ?? ? ?
Fig. 1. Example of a colored dynamic graph.
The colored ants behavior is defined by algorithm 1. This al-gorithm is to be repeated iteratively for each ant. At each itera-tion the algorithm decides the node the ant will visit next. Twoparameters are used T and A. A is a parameter that controlcompetition among ants. When the proportion of pheromonehaving the same color as the ant compared to other colors isunder A, the ant is in an hostile environment and flee to an-other zone of the graph chosen randomly. T is a stabilizingparameter avoiding that an ant flee all the time from node tonode when they always fall in hostile environment. It allowsthem to better colonize zones. Usually, T = 2 and A is set to1 on the number of colonies.
Given this algorithm each colony competes to create colo-nized areas. As shown on figure 1, the same colony can occupytwo or more distinct zones, and ideally it would be possible touse a small number of colonies to discover all the organizationsin the graph. However it is also possible that two organizationsside by side be colonized by the same colony. To avoid thisissue, the algorithm starts with only two colonies (or more ifit can be estimated that the graph necessarily contains moreorganizations) and introduces new colonies, keeping the antpopulation constant, until it is no more possible to add more.
For each vertex of the graph a main color is computed and itsproportion compared to other colors is determined (see figure2). A vertex color is considered stable if it is larger than a giventhreshold ω. It is then possible to compute this proportion forall vertices of the graph and determine a global stability. Thisis this number that is used to know if it is possible to add morecolonies or not. If the addition of another colony gives a sta-bility that cannot reach ω, it is considered no more possible toadd a colony. Usually, ω is set to 80%.
4. Results
In this section, a comparison of our algorithm results on a wellknown graph and then an exploration of graphs extracted from
book databases is presented.The Zachary Karate Club [35] is a real world data set already
studied for example in [28, 29, 27, 3] that can be defined asa graph of 33 vertices. In these articles the authors proposeseveral algorithms whose results are shown on figure 3(a). Asit can be seen on figure 3(b), our algorithm matches exactlythese results. In this representation, large circles drawn aboveedges represent the dominant pheromone color and the totalpheromone intensity on the edge.
Browsing the Amazon.com book seller databases, it is possi-ble, knowing the initial ISBN of a book to find all other booksbought by customers at the same time. In the graphs shownon figure 4 and 5, each vertex represents a book, and eachedge represents a link “customers having bought this book alsobought”. Books suggested this way are almost always on simi-lar topics. The graph obtained therefore contains areas on widetopics like “the web”, “programming”, “architecture”, or “sys-tems”.
The figure 4 is extracted starting at one edition of “The art ofcomputer programming, volume 1” [22]. The algorithm found9 distinct partitions of different sizes. Two movies of largergraphs can also be downloaded in [4, 5].
Our method was applied to a protein homology graph. Insuch a graph each vertex is a protein, and an edge exists be-tween two proteins if they are considered close if they are func-tionally related. The graph has been taken from [1]. You cansee on the movie [6] an application of our method to such agraph, exhibiting cluster of similar proteins.
5. Discussion and conclusion
An ant algorithm using emergent computing to detect organi-zations in graphs representing numerous elements in interac-tion was presented in this paper. The ant algorithm use both

Fig. 2. Example of a dynamic colored graph at five stages of its evolution with organization detection.
collaboration and competition mechanisms, and does not useany objective function. Solutions emerge from the ant behav-ior as colored areas in the graph.
Organizations are long lasting compared to their con-stituents. Identically the solutions proposed by the algorithmare maintained by the continuous exploration operated by ants.This implies that any change in the graph and therefore in theorganization structure can be considered immediately, chang-ing continuously the solution accordingly.
As vertices colors are given by the colored pheromone im-portance on all incident edges, it is possible to take into ac-count several colors per edge (most prominent, second, third,etc.). This allows to detect areas where organizations overlap.Indeed organizations are not all completely distinct and such afeature could allow the detection of two closely related organi-
zations where another method would only detect one.The algorithm still presents some limitations. The major one
is the number of colonies that must be fixed at the beginningand be less or equal to the number of organizations. Actually,to solve this problem the algorithm starts with a small numberof colonies, and then introduces colonies one by one, while ωremains stable.
A method allowing to accelerate the solution emergent byadding weights to unweighted graphs using a graph layout isactually investigated. Graph layouts are geometrical descrip-tions of graphs that try to give a planar or tri-dimensional repre-sentation of the graph with the less edge intersection and nodeoverlapping possible. Figures presented in this article use sucha graph layout based on repulsive and attractive forces [13, 23].As such force based layouts tend to push organizations (fol-

(a) Found by M. Newman in [29]
(b) Found by our algorithm
Fig. 3. Organizations in the Zachary Karate Club.

Fig. 4. Exploration of the Amazon.com databases starting from “The Art of Computer Programming” at 12 recursive levels.
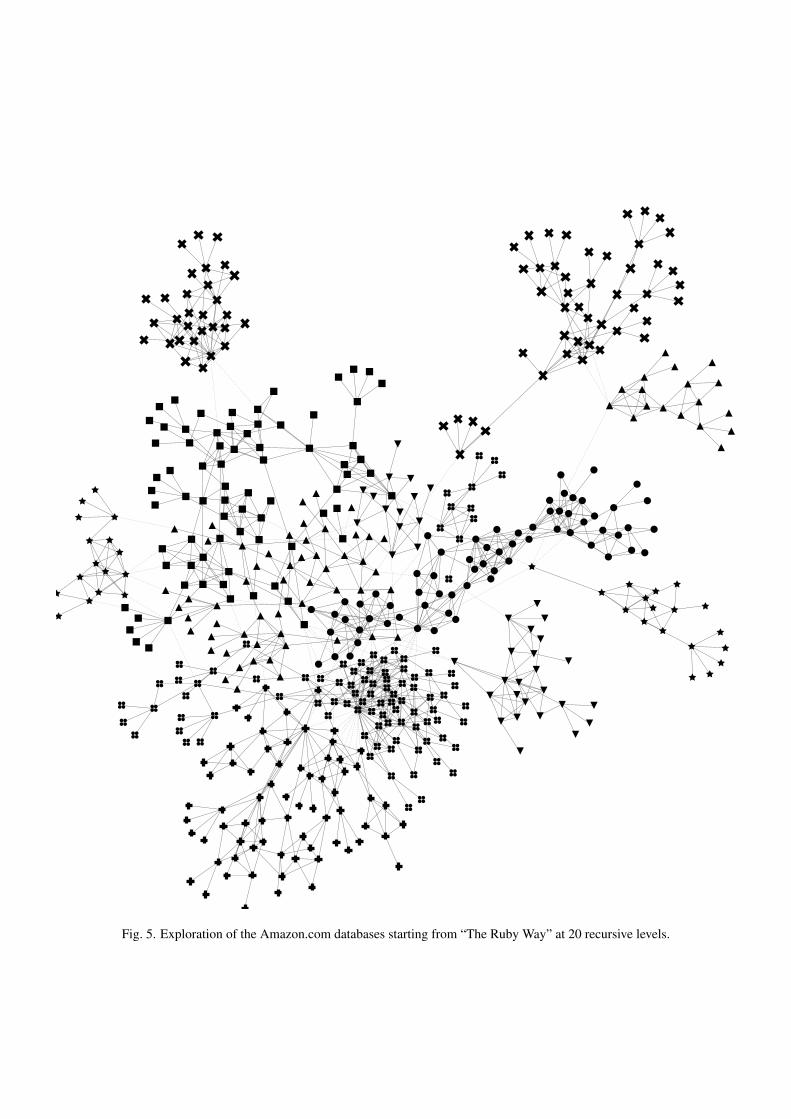
Fig. 5. Exploration of the Amazon.com databases starting from “The Ruby Way” at 20 recursive levels.

lowing our definition, set of nodes more closely tied togetherthan with others) one from another, tightly connected nodesare closer and loosely connected nodes are farther (see for ex-ample figure 4). It is thus possible to use edge length to addweights used by ants to discover organizations.
Although the algorithm presented here is only dedicated toorganization detection, variations of it has been used to dy-namically and adaptively distribute simulations made of largenumber of interacting entities [8].
References
[1] A T Adai, S V Date, S Wieland, and E M Marcotte, Lgl:creating a map of protein function with an algorithm forvisualizing very large biological networks, MolecularBiology 2004, Vol. 340, No 1 , pp. 179–190.
[2] R Albert and A L Barabasi, Statistical mechanics of com-plex networks, Reviews of Modern Physics 2002, Vol.74, pp. 47–97.
[3] J-P Bagrow and E M Bollt, Local method for detectingcommunities, Physical Review E October 2005, Vol. 72No 4, pp. 046108.
[4] C Bertelle, A Dutot, F Guinand, and D Olivier, Graphextracted from the amazon.com databases, colored with5 colors, http://www-lih.univ-lehavre.fr/~dutot/videos/videoGraphAmazon15_5colors.avi.
[5] C Bertelle, A Dutot, F Guinand, and D Olivier, Graphextracted from the amazon.com databases, colored with8 colors, http://www-lih.univ-lehavre.fr/~dutot/videos/videoGraphAmazon30.avi.
[6] C Bertelle, A Dutot, F Guinand, and D Olivier,Protein homology graph colored with 6 col-ors, http://www-lih.univ-lehavre.fr/~dutot/videos/ProteinHomology1.avi.
[7] C Bertelle, A Dutot, F Guinand, and D Olivier, Dynamicplacement using ants for objects based simulations, Inproceedings of DOA 2003. Catania (Sicily) Vol. 2888 ofLNCS 2003 pp 1263–1274.
[8] A Cardon, A Dutot, F Guinand, and D Olivier, Compet-ing Ants for Organization Detection: application to Dy-namic Distribution Springer Verlag 2006, chapter 2, pp27–54.
[9] L Danon, J Dutch, A Diaz-Guilera, and A Arenas, Com-paring community structure identification, Stat. Mech.2005, Vol. pp. 09008.
[10] F de Saussure, Cours de linguistique générale, PayotGeneva 1931.
[11] W E Donath and A J Hoffman, Lower bounds for parti-tioning of graphs, IBM J. Res. Develop. 1973, Vol. 17,pp. 420–425.
[12] M Dorigo and T Stützle, Ant Colony Optimization, MITPress 2004.
[13] P Eades, A heuristic for graph drawing, In CongressusNumerantium Vol. 42 1984, pp 149–160.
[14] B S Everitt, S Landau, and M Leese, Cluster Analysis,H Arnold 4th edition 2001.
[15] C Fiduccia and R Mattheyses, A linear time heuristic forimproving network partitions, In Proceedings of 19th
Design Automation Conference 1982, pp 175–181.
[16] M Fiedler, Algebraic connectivity of graphs, Czechoslo-vak Mathematical Journal 1973, Vol. 23, No 98 , pp. 298–305.
[17] S Forrest, Emergent Computation chapter Emergentcomputation: self-organizing, collective, and cooperativephenomena innatural and artificial computing networks,MIT Press Cambridge, MA 1991, pp 1–11.
[18] L C Freeman, A set of measures of centrality based uponbetweenness, Sociometry 1977, Vol. 40, pp. 35–41.
[19] M R Garey and D S Johnson, Computers and Intractabil-ity: A Guide to the Theory of NP-Completeness, NumberISBN 0-7167-1044-7. W H Freeman and Company NewYork-San Francisco 1979.
[20] M Girvan and M E J Newman, Community structurein social and biological networks, Proceedings of theNational Academy of Sciences of The United States ofAmerica 2002, Vol. 99, pp. 7821–7826.
[21] B Kernighan and S Lin, An efficient heuristic procedurefor partitioning of electrical circuits, Bell Systems Tech-nical Journal 1970, Vol. 1, pp. 291–307.
[22] D E Knuth, The Art of Computer Programming: volume1, Fundamental Algorithms, Reading, Massachusetts:Addison-Wesley 1997.
[23] J Kruskal and J Seery, Designing network diagrams, InFirst General Conf. on Social Graphics 1980 pp 22–50.
[24] M Lafourcade and F Guinand, Algorithme de fourmispour le traitement de la langue naturelle. To appear inInternational Journal of Computational Intelligence Re-search. In Proceedings of ROADEF 2005, pp 239–240,
[25] E Morin, La méthode - 1 - La nature de la nature, Seuil,Nouvelles Éditions 1981.
[26] M E J Newman, The structure and function of complexnetworks, SIAM Review 2003, Vol. 45, pp. 167–256.
[27] M E J Newman, Detecting community structure in net-works, Eur. Phys. J. B. 2004, Vol. 38, pp. 321–330.
[28] M E J Newman, Fast algorithm for detecting communitystructure in networks, Physical Review E 2004, Vol. 69,pp. 066133.
[29] M E J Newman and M Girvan, Finding and evaluatingcommunity structure in networks, Physical Review E2004, Vol. 69, pp. 026113,.
[30] P Pons and M Latapy, Computing communities in largenetworks using random walks, In Proceedings of the20th International Symposium on Computer and Infor-mation Sciences (ISCIS’05) Vol. 3733 of Lecture Notesin Computer Science Istanbul, Turkey October 2005.Springer pp 284–293.
[31] G Prevost, Modélisation multi-niveaux d’écosystèmeaquatique par des approches mixtes., PhD thesis Univer-sité du Havre Décembre 2005.
[32] B Tadic, Exploring complex graphs by random walks,AIP Conference Proceedings 2003, Vol. 661, pp. 24–27.
[33] P Tranouez, Contribution à la modélisation et à la priseen compte informatique de niveaux de description multi-ples, PhD thesis Université du Havre 2005.
[34] M Young, J Sager, G Csardi, and P Haga, Anagent-based algorithm for detecting community structurein networks, in arXiv at http://www.citebase.org/cgi-bin/citations?id=oai:arXiv.org:cond-mat/0408263 2004.
[35] W W Zachary, An information flow model for conflictand fission of small groups, Journal of AnthropologicalReasearch 1977, Vol. 33, No 4 , pp. 452–473.
[36] H Zhou, Distance, dissimilarity index, and network com-munity structure, Physical Review E 2003, Vol. 67, pp.10.
Authors Bios
Cyrille Bertelle is professor in Computer Sciences in LeHavre University. His activities concern complex systemsmodelling: their conceptual formalization, their distributedimplementation and their applications in various domains:aquatic ecosystems, game theory, logistic and cognitive sci-ences. He focuses his studies on emerging computing usingcollective intelligence methods. He manages a reserch mas-
ter on complex systems modelling based on both mathematicaland computer sciences approaches.
Antoine Dutot is an assistant professor in the University ofLe Havre. He is a member of the Computer Science, Infor-mation Processing, and Systems Lab (LITIS). He is actuallyworking on organization detection methods using distributedartificial intelligence, as well as dynamic load balancing.
Frédéric Guinand received his MSc degree in computerscience in 1991, and his PhD degree in computer science in1995 both from the Institut National Polytechnique de Greno-ble (INPG - France). He is currently a professor in the Depart-ment of Computer Science and in the Computer Science Lab-oratory (LITIS) of Le Havre University. He previously workedas a research scientist in the LITH Laboratory of the SwissFederal Institute of Technology (EPFL Lausanne - Switzer-land). His main research interests are in the area of mobile anddistributed Computing, bioinformatics and complex systems.
Damien Olivier is an assistant professor in the University ofLe Havre. He is a member of the Computer Science, Informa-tion Processing, and Systems Lab (LITIS). His major fields ofinterest are distributed artificial intelligence and bioinformatic.Actually he works on swarm intelligence and emergent com-puting for dynamic load balancing and also on artificial im-mune systems. He has regularly published papers in academicjournals.