Organization Studies
45
1 A New Order of Things: Network Mechanisms of Field Evolution in the Aftermath of an Exogenous Shock Leonardo Corbo School of Management and Economics Catholic University of Porto [email protected] Raffaele Corrado Management Department University of Bologna [email protected] Simone Ferriani Management Department University of Bologna [email protected] & Cass Business School City University London Forthcoming in Organization Studies
-
Upload
khangminh22 -
Category
Documents
-
view
0 -
download
0
Transcript of Organization Studies

1
A New Order of Things: Network Mechanisms of Field Evolution in the Aftermath of an Exogenous Shock
Leonardo Corbo School of Management and Economics
Catholic University of Porto [email protected]
Raffaele Corrado Management Department University of Bologna [email protected]
Simone Ferriani Management Department University of Bologna [email protected]
& Cass Business School City University London
Forthcoming in Organization Studies

2
Abstract
This study examines the role of a major environmental shock in triggering change in the social
structure of an organizational field. Based on the longitudinal analysis of changing network
configurations in the global airline industry, we explore how logics of attachment shift before,
during and after an exogenous shock and how the rewiring of network ties in response to the shock
may act as a countervailing force to the network dynamics that drive field stratification. Using the
terrorist attacks of September 11 2001 as a natural experiment, our work reveals how shocks may
affect key mechanisms of network evolution thus altering tie distribution and access among
members of the field. Overall this article contributes to emergent literature on field dynamics by
exposing the evolution of interorganizational dynamics when external events produce unsettled
times that render extant logics brittle and open prospect for change.
Keywords
Network change, environmental jolt, field evolution, rules of attachment, core/periphery
INTRODUCTION
The agentic turn in institutional theory has marked a shift in attention from the normative forces that
stabilize interorganizational fields toward consideration of the processes by which such fields
transform (Fligstein, 2001). Opportunities for radical transformation of existing fields have often
been suggested to arise primarily from large scale events that impose crises on the field and are
experienced as severe ruptures in its social structure (Meyer, 1982; Sine and David, 2003). There
are a number of studies that have highlighted the role of exogenous shocks in exposing rules that
had been taken for granted, calling into question the perceived benefits of those rules, and
undermining the calculations on which field relations had been based (McAdam and Scott, 2005). It
is during these convulsive moments that, as pointed out by Fligstein and McAdam (2012: 4) “new
logics of action and interaction come into existence” that may shuffle resources and thereby alter
the relationships within the field. Powell et al. (2005: 1190) similarly note that “shocks to any
system […] can destabilize it and result in a tip in the rules of affiliation and the resulting
combinatorial possibilities”. Scholars in the social movement theory too have advanced the idea that

3
exogenous shocks may alter the underlying social fabric of fields by catalysing the mobilization of
peripheral actors who can advance their position in the social structure (Thornton, 2002).
In our view, belying the abundant evidence that emphasizes the role of exogenous shocks in
subverting the existing social order, is the comparative absence of theoretical and empirical work on
the network mechanisms – those that are thought to regulate the likelihood that particular
relationships materialize – that bring about such transformations. Prior work on change in
interorganizational fields has emphasized the tendency of interorganizatinal networks to reproduce
themselves over time (Gulati and Gargiulo, 1999), resulting in increasingly stratified social
structures. According to this view, which is reminiscent of the Mertonian principle of the rich get
richer, highly connected organizations in the pre-existing network structure are more likely to form
subsequent ties with highly connected partners, while firms that are not as well connected remain in
the periphery of the network. Yet, in contrast to the prevailing self-reproducing conception of the
social structure, theorists have raised the possibility that networks change because of external crises
that produce unsettled times, rendering existing logics of action and interaction brittle and opening
prospects for transformation (Madhavan et al., 1998). Unfortunately such punctuated accounts of
socio-economic change say little about what logics of attachment are poised for change consequent
to exogenous shocks or how such logics cumulatively shape the evolutionary trajectory at the
interorganizational field level. Addressing this knowledge gap is important for the advancement of
current understanding in field dynamics, as the way fields change rests on the particular
relationships of its actors and “change to these relationships are a powerful source of change to a
field” (Sauder, 2008: 210). Accordingly the present article asks, How do field actors alter their
interorganizational affiliations in response to transient shocks that disrupt fields temporarily? What
logics of attachment prevail in the aftermath of large scale-events that have the effect of creating a
sense of generalized uncertainty? These questions lie at the heart of field theory, as they draw our
attention to the relational “structuration” of organizational fields (Phillips et al., 2000).

4
The theoretical orientation we follow to address these questions brings together ideas
generated by field and network theorists. From field theorists we borrow the understanding of field
as a “network or configuration of relations between positions” (Bourdieu and Wacquant, 1992: 17)
and as social arenas where actors frame their actions vis-à-vis one another and struggle to secure
and preserve social and material benefits (Fligstein and McAdam, 2011). This competition gives
rise to social structure, understood here as social topology, which constitutes different profit
opportunities (Fligstein, 2001). As noted by Beckert (2010: 612) “since profit stems from the
relative position of a firm in the network actors have diverging interests with regard to the
reproduction and change of existing network”. In its simplest expression this is a struggle between
incumbent actors who embrace a frame of reference that encapsulates their self-serving view of the
field and thus strive for the reproduction of network positions, and peripheral actors who seek
avenues for improving their position.
From network theorists we borrow arguments concerning how the topology of a network
and the mechanisms of tie formation/dissolution among its constituents orient the choice of partners
and ultimately shape the structure of the field. Drawing on network evolution literature (Gulati and
Gargiulo, 1999; Snijders, 2001; Powell et al., 2005; Rivera et al., 2010) we explore different
sources of attachment bias and examine if and how these simple rules that guide the process of
partner selection shift in the aftermath of an exogenous shock that destabilizes the entire field. In
doing so, we move away from the depiction of social change as an invariant process affecting all
actors equally, and emphasize instead its different ramifications depending on an actor’s location in
the overall network, as that structure evolves over time (Powell et al., 2005; Powell and Owen-
Smith, 2012). Our intuition is that patterns of interorganizational network ties provide a lens
through which to view critical junctures that question extant logics and open prospect for change,
enabling us to shed light on organizational responses to external events.

5
To explore these ideas empirically and inform our understanding of the interorganizational
dynamics characterizing fields that undergo cataclysmic upheavals we focus on the global airline
industry in the aftermath of the September 11 2001 terrorist attacks (henceforth 9/11), which
caused one of the most severe crises ever experienced by civil aviation worldwide. Given the
exploratory, theory-building nature of the study we employ a hybrid research design that combines
qualitative data analysis with quantitative social network analysis, enabling us to capture “a more
complete, holistic and contextual portrayal of the units under study” (Jick, 1979: 603). We first
offer a comprehensive overview of the main factors that have shaped the evolution of the
commercial field of global air transportation over the past fifteen years. We turn next to a closer
examination of the dynamics of interorganizational attachment of field members. To assess the
evolving topology of the field in relation to the occurrence of the shock we draw on 9 years (1998-
2006) of alliance records that capture the formation and dissolution of collaborative relationships.
From this data we extract and map several network properties in the periods pre-, during and post-
shock which offer an appreciative understanding of how the logics of attachment switch, with
divergent ramifications depending on whether the actors are central or peripheral players in the
context of the field. We then turn to a statistical analysis of the micro-mechanisms that govern
actors’ interorganizational choices and link these mechanisms to the evolution of field-level
network patterns. For this analysis we use stochastic actor-based models for network dynamics
(Snijders, 2005; Snijders et al., 2010). This modelling approach is especially appropriate for our
analysis for at least two reasons. In the first place, it focuses on the micro-level mechanisms that
drive actors’ choices as factors of change at the network level. Further, it overcomes the problems
that network interdependence poses to estimation and testing, and is the only tried and tested
approach that does so in a truly longitudinal fashion. Using actor-based stochastic network models
(Snijders, 2005) we examine a few mechanisms that have been featured in previous work on
network evolution: degree distribution, assortativity (or degree-based homophily), transitivity, and

6
preferential attachment. Each of these statistics provides a different yet complementary insight into
the interplay of network dynamics and field structuration in the aftermath of an environmental
shock. We trace these bases of interaction in the pre-, during and post-shock period and in doing so
we address recent calls to increase our understanding of whether “different [network] mechanisms
play greater or lesser roles as networks evolve” (Rivera et al., 2010: 108).
Our findings suggest that the shock engenders a blended logic of partner selection. On the
one hand, we find systematic differences in the pre- and post-shock eras in the pattern of
connections that link the most prominent members of the field to one another and to more
peripheral alters. More specifically, the shock appears to push the network towards disassortativity
and “poor get richer” dynamics (or preferential avoidance) (Qiao et al., 2014) causing an inversion
in the correlation patterns in the degree of connected nodes and making peripheral actors more
attractive partners. On the other hand, we find that the shock accelerates the clustering tendency of
the network as captured by different measures of network transitivity. After the upheaval, in other
words, interactions with a common third party induce stronger triadic closure resulting in a more
cohesive structure. Thus, in the wake of the exogenous shock triadic closure, disassortativity and
preferential avoidance operate as simultaneous structuring forces, with the former enhancing
cohesion and reliability of exchanges (Uzzi, 1997) and the latter two preventing insularity and
pulling in peripheral players, more likely to aid in exploration and renewal. In the closing part of the
manuscript we offer a discussion of the study’s main implications, limitations and promising areas
for future research.
THEORETICAL ORIENTATION
Fields, networks and shocks
Bourdieu (1984, 1992) has presented one of the most elaborate theoretical statements about the
structure of fields. Bourdieu positions actors in social space, or topography, where they compete to

7
secure and preserve social, material and symbolic benefits. This competition gives rise to social
structure, understood here as social topology, which positions actors relative to each other
according to the combination of symbolic and social resources available to them. The structural
outcomes of this competition are usually conceptualized as dichotomies that classify actors into
incumbents and challengers, insiders and outsiders, core and peripheral players (Anheier et al., 1995;
Fligstein and McAdam, 2012). On the one hand core players serve as arbiters for the direction of
the field. Being strongly embedded in the field and dependent upon the worldview subsumed by it
they use their clout to reinforce the existing institutional arrangements, especially when their
interests appear to be well served by the prevailing settlement. Peripheral players, on the other hand,
strive to improve their position and change the balance of control over resources within the field but
they are hindered by their low status and limited resources in convincing others to partake in their
project. As a result, the social structure of fields proves typically highly resistant to peripheral
players’ challenges.
In rare instances, however, such stratification order may not be strong enough to forestall
convulsive moments triggered by exogenous shocks or other dramatic events that suddenly alter the
relations within the field, setting in motion “a period of prolonged and widespread crisis in which
actors struggle to reconstitute all aspects of social life” (Fligstein and McAdam, 2011: 32). Events
of such kind include the French Revolution, the Great Depression and the economic crisis of the
1970s. These events, also known as environmental jolts, represent significant milestones in the
evolution of a field and play a key role in enabling transformative change (Fligstein, 1997, 2011;
Meyer, 1982) by reshuffling control over resources and thereby providing avenues for action for
some actors while hindering others. After such moments of possibility things eventually settle down
and a more stable order returns. Unfortunately, such punctuated accounts of social change say little
about what precise patterns of interaction emerge, take root and transform in response to sudden
shifting environmental circumstances. Do core actors respond to exogenous shocks by turning their

8
attention inward to connections with other core players, thus creating an increasingly stratified elite?
Alternatively, do they prospect for more diverse peripheral partners who seek the legitimacy and
resources that accrue from affiliation to core players?
The perspective we adopt to tackle these questions rests on the idea that organizational fields
are structured by relationships that function both as pipes through which resources and practices are
diffused and as prisms that provide signals of status and identity (Podolny, 2001). Because
differently positioned organizations garner different status and control benefits, some organizations
may be more responsive to suddenly shifting circumstances. As suggested by Fligstein and
McAdam (2011: 10): “Different actors in different positions will vary in their interpretation of
events and respond to them from their own point of view”. Our intuition is that the patterns of
interaction that link central members of the network with one another and with less well-positioned
alters offer a lens through which to examine periods of ferment, enabling us to flesh out endogenous
network mechanisms that operate in response to exogenous events. In particular, by examining the
dynamics of interorganizational tie formation and dissolution of field members in the pre- and post-
jolt eras, we can distil how rules of attachment vary over time. As we shall see the actors may well
play by different rules of partner selection at different stages in the evolution of the network,
depending on their position in the social structure and the characteristics of their current and/or
prospective partners.
Dynamics of network change in interorganizational fields
We enter the discussion of interorganizational network dynamics with data from a field where
political and market forces loom large in shaping patterns of attachment. Unlike other industries
where collaborative ties are forged to last, the airline industry has been characterized over the past
twenty years by strong pressure towards deregulation and liberalization that have resulted in a high
rate of formation and dissolution of interorganizational linkages. Because of endogenous and
9
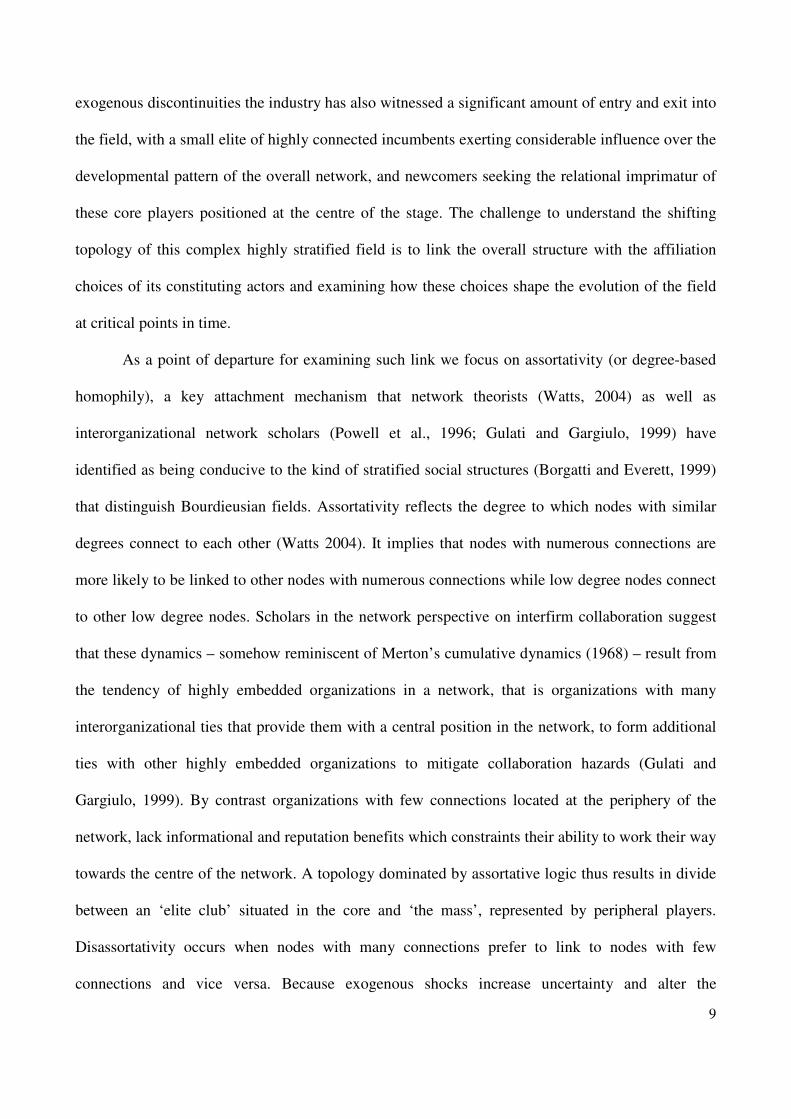
exogenous discontinuities the industry has also witnessed a significant amount of entry and exit into
the field, with a small elite of highly connected incumbents exerting considerable influence over the
developmental pattern of the overall network, and newcomers seeking the relational imprimatur of
these core players positioned at the centre of the stage. The challenge to understand the shifting
topology of this complex highly stratified field is to link the overall structure with the affiliation
choices of its constituting actors and examining how these choices shape the evolution of the field
at critical points in time.
As a point of departure for examining such link we focus on assortativity (or degree-based
homophily), a key attachment mechanism that network theorists (Watts, 2004) as well as
interorganizational network scholars (Powell et al., 1996; Gulati and Gargiulo, 1999) have
identified as being conducive to the kind of stratified social structures (Borgatti and Everett, 1999)
that distinguish Bourdieusian fields. Assortativity reflects the degree to which nodes with similar
degrees connect to each other (Watts 2004). It implies that nodes with numerous connections are
more likely to be linked to other nodes with numerous connections while low degree nodes connect
to other low degree nodes. Scholars in the network perspective on interfirm collaboration suggest
that these dynamics – somehow reminiscent of Merton’s cumulative dynamics (1968) – result from
the tendency of highly embedded organizations in a network, that is organizations with many
interorganizational ties that provide them with a central position in the network, to form additional
ties with other highly embedded organizations to mitigate collaboration hazards (Gulati and
Gargiulo, 1999). By contrast organizations with few connections located at the periphery of the
network, lack informational and reputation benefits which constraints their ability to work their way
towards the centre of the network. A topology dominated by assortative logic thus results in divide
between an ‘elite club’ situated in the core and ‘the mass’, represented by peripheral players.
Disassortativity occurs when nodes with many connections prefer to link to nodes with few
connections and vice versa. Because exogenous shocks increase uncertainty and alter the

10
configuration of the resource space, a change in the assortative logic of the field may follow it. As
noted by Ahuja et al. (2012: 437): “Significant changes in assortativity might signal a shift in the
resource requirements for success in the interorganizational field”.
We supplement the idea of assortativity with other attachment mechanisms that sociologists
have repeatedly found to be important in the evolution of social structures. The first mechanism,
which nicely complements the assortative one, is preferential attachment or the tendency of an
organization to attach to another organization that already has ties. Preferential attachment
purportedly occurs because actors looking for new connections use an actor’s degree as a proxy for
their fitness (Rivera et al., 2010). The extreme case would result into a star network with one central
node being connected to every other node, leading to an average path length under two. Significant
evidence indicates that alliance networks are structured by preferential attachment because larger
and more prestigious firms tend to attract and sustain a far greater number of alliances than smaller
or less prestigious firms (Stuart, 1998). Underlying this logic of attachment in interorganizational
networks is the understanding of organizations as status-seeking (Podolny, 1994). Because
organizations’ status rankings are a function of the status rankings of their partners, lower status
organizations search for ties to higher status organizations who attempt to avoid ties with lower
status players. The second mechanism we analyse is based on Simmel’s triadic closure (Simmel,
1950) or the tendency of open triads to close. Triads, subsets of three actors and the possible ties
among them, play a key role in relating micro-structural tendencies with macro-structural patterns
being at the intersection between dyadic relationships and overall networks (or parts of it). Triads
are central to the formation of relationships due to the transitivity principle (Granovetter, 1973).
Transitivity is the tendency of forming mutual ties by two actors A and B that are connected to a
third common party C, thus resulting in triadic closure. At the dyadic level this implies that prior
indirect ties – at geodesic distance of two – turn into direct ties. Triadic closure is a very strong
structural tendency and empirical evidence consistent with it has been found in a variety of

11
interorganizational settings (see for instance Madhavan et al., 2004; Lazzarini et al., 2008; Ferriani
et al., 2013). The third mechanism we examine is nodal degree or the simple tendency of actors to
instantiate new relationships. Within our setting this mechanism captures the extent to which
airlines respond to the changed environmental conditions by expanding or reducing their alliance
network. On the one hand, to cope with the increased uncertainty that follows exogenous shocks
firms may strengthen existing ties and refrain from establishing new ones (Krackhard,t 1992). An
example of this pattern can be found in Podolny (1994), who posits that the proclivity of
organizations to re-instantiate past relationships increases with uncertainty in market conditions. On
the other hand, under increasing uncertainty firms might seek more flexibility and options (Owen-
Smith and Powell 2004), which would suggest that large upheavals in a network or shocks that
change the environmental or market conditions within which a network is embedded may lead to
greater partnering activity and a consequent increase in the parameter capturing the actor’s
propensity to establish new ties. A similar conundrum is present in organizational theory (Staw et
al., 1981), do firms respond to threat by becoming more active or by becoming more rigid?
By analysing how these mechanisms play out in the wake of an exogenous shock we seek to
extend prior related research on interorganizational change and field dynamics that has attended to
such key aspects as logics of attachment (Powell et al., 2005), network topology (Sytch et al., 2012),
and more broadly the impact of industry events on the relational structuration of fields (Madhavan
et al., 1998; Powell and Owen-Smith, 2012). While a more comprehensive view of
interorganizational network change might include other network mechanisms, our main objective
here is to make a first step towards more clarity and analytical tractability in studying the relational
dynamics that shape fields at critical evolutionary junctures that open prospects for change.
EMPIRICAL SETTING: THE GLOBAL AIRLINE INTERORGANIZATIONAL FIELD

12
Our empirical focus is on the commercial field of air transportation, which has undergone
deregulation and liberalization in the 1980s and 1990s, significant development of bilateral airline
alliances as preferred mode of expansion in the 1990s, and the emergence of multilateral alliances
and consolidation in the late 1990s and early 2000s. This field is known for being inherently global,
characterized by a mixture of competition and collaboration. Globalization and deregulation have
been identified as the two phenomena that have radically changed the air transport industry and its
rules over the past thirty years (Iatrou and Oretti, 2007). Globalization forced airlines to cater for
the needs of a global market by operating across national boundaries. Deregulation and
liberalization increased competition dramatically and paved the way for the emergence of low cost
carriers. Faced with these challenges, the commercial airline industry has been marked by a heavy
reliance on interorganizational networks (Iatrou and Oretti, 2007). For example, in 2000 more than
80% of global airline carriers engaged in some form of alliance (Baker, 2001). In the early years of
cooperation, alliances were confined to tie formation between two carriers mainly in the form of a
code-sharing agreement where two airlines cross-sell each other’s capacity on selected routes, or
one carrier markets its code on another’s flights. Cooperation at this level was generally limited to
specific routes or regions, and the carriers involved are still marketed as independent companies.
Starting from the mid-1990s, the pressures stemming from both deregulation and globalization
increased sensitively influencing the nature of competition within the airline industry. Once again,
airlines reaction was to forge alliances. In their quest to achieve global reach, based on the
assumption that those that offer a global service (with a credible presence in each of the major air
travel markets) will be in the strongest competitive position, airlines realized that multilateral
alliances or constellations (Gomes-Casseres, 1994) would have been more adequate for that
purpose1. By the end of the 1990s the field was divided into constellation members and non-aligned
carriers which enjoyed relatively more freedom in their partnership choices. This is the period we

13
focus on, with data from 1998 to 2006. Figure 1 illustrates the evolution of airline membership in
alliance constellations.
[Figure 1 about here]
The main three multilateral airline alliances are Star Alliance, SkyTeam and oneworld which
control the 69% of world revenue passenger kilometres. At the time of our study, there were two
additional constellations, Qualiflyer and Wings. These constellations involve full marketing
cooperation with respect to frequent flyer programs (FFPs) and promotion (including investments in
common brand name), besides joint access to airport facilities controlled by individual members
(Lazzarini, 2007: 347). They also offer comprehensive code-sharing agreements involving several
routes instead of bilateral agreements comprising few routes (Oum and Yu, 1998). However, the
interorganizational field we explore is not stable, it shifts markedly through the formation of new
alliances and dissolution of existing ones, as agreements are ended, new players join the ranks and
businesses fail. The evolving structure of these interorganizational linkages is the focus of our
network study. We analyse patterns in the formation and dissolution of ties between airlines in the
wake of the 9/11 terrorist attacks as a key trigger to field transformation.
DATA AND METHODS
We explored the evolutionary dynamics of the global airline industry using longitudinal data on
alliances formed between 1998 and 2006. In line with prior work (Lazzarini, 2007) we identified an
alliance as any code-sharing agreement between two airline companies. All airlines that had formed
at least one alliance during the period of our study were included in the database. Data on airline
alliances and their change over time were collected through company reports and several issues of
the Airline Business magazine. These issues contain data on code-sharing agreements but exclude

14
cooperation on frequent flyer programs as well as alliances among charter and cargo carriers which
are not the focus of this study.
We used these data to build a series of sociomatrices. These are binary symmetric matrices
whose entry on row i and column j (Xij, same as Xji) equals to 1 if a code-sharing agreement
existed between companies i and j, and 0 otherwise. One sociomatrix was coded for each year of the
interval 1998-2006, our period of observation, and this resulted in a panel network dataset of nine
adjacency matrices. We used this panel network dataset for modelling the evolution of the network
of code-sharing agreements between airlines across the period of observation using the SIENA
actor-based models of network change (Snijders, 2005). These models reconcile the inquiry of the
macro-level evolution of the network with a focus on the individual choices of the actors (Felin and
Foss, 2005), thus making possible to strike a balance between the competing emphases on structure
or agency in the study of networks. Within this framework the global evolution of the network is
modelled as driven by the choices actors make about establishing new ties or interrupting old ones,
based on their preferences about local configurations of ties. While the emergent result of these
choices drives the evolution of the whole network, choices themselves are conditioned by broad
network patterns that are outside the control of any individual actor. The statistical modelling of the
evolution of the airline alliance network is preceded by a mapping of the evolution of the field in
the pre-, the during and post-jolt periods, based on a variety of network diagnostics which allow us
to delineate a rich contextual framework with which to better understand the changing dynamics of
the network over time.
Information on airlines operations were collected from IATA and ICAO statistics. The
database includes information on individual airlines observed over time. The final sample consists
of an unbalanced panel of 261 airlines, including companies that have disappeared from the
business arena and those that were founded during the analysis period. Among these a subsample
was selected that consisted of the companies that met at least one of these requirements: 1) they

15
were included in the Lazzarini (2007) sample, 2) they were identified by industry experts as
important field players 3) they belonged to the main connected component of the network at least
once across the nine observed years 1998-2006. This resulted in a subsample of 132 actors observed
across the nine years period that decreased from the 128 actors observed in 1998 to the 107 in 2006.
The information about code-sharing agreements was coded in nine binary and symmetric adjacency
matrices 132x132.
In addition to the quantitative data, and in order to gain a more nuanced understanding of
our quantitative findings, we collected qualitative evidence by performing eleven semi-structured
interviews with experienced professionals and key informants in the airline industry (see Table 1).
The questions asked were open-ended ones and aimed at uncovering the role and importance of the
alliance network in the pre and post 9/11 eras. All informants are experts in alliance management
and/or business development. These interviews had an approximate length of one hour each and
were carried between February 2012 and May 2014. All interviews were digitally recorded and
transcribed. Despite the information being mainly retrospective, these interviews provided valuable
insight into the firms’ alliance tactics and resilience strategies in the face of the 9/11 terrorist attacks
that add richness to our quantitative findings. We draw on selective quotes from some of the
managers we interviewed wherever relevant in the paper.
[Table 1 about here]
Network mechanisms
In our modelling approach actors are assumed to add or remove outgoing ties according to their
preferences for alternative local network configurations, formalized as a hypothesized random
utility function. The parameter estimates thus provide a model for the rules governing the dynamic
change in the network (Snijders et al., 2010). The parameters we focus on are those that

16
operationalize the attachment mechanisms in each of the four variants presented earlier:
assortativity, preferential attachment, triadic closure and nodal degree (note that while we include
the variable ‘Degree’ among our controls, as it is common practice to do so in SIENA models to
account for the baseline relational tendency of network members, yet this variable assumes for us
special theoretical interest when interacted with the time dummies). We now describe such
structural effects along with the control variables.
Parameters of interest. The mechanism of triadic closure in our models is represented by the
‘Transitive Triads’ parameter. This parameter measures the extent to which two airlines that share a
network contact (i.e. maintain a code-sharing agreement with the same third company) tend to
establish a code-sharing agreement among them. This micro-level mechanism, which may be
represented graphically by a closed triangle and is often referred to either as triadic closure,
transitive closure or simply transitivity, has important large scale consequences for the structure of
the network. In fact, the higher is the transitivity in the network (i.e. the more frequent are closed
triads or triangles), the more the network tends to be structured into internally cohesive subgroups.
The ‘Degree Assortativity’ parameter measures the propensity of network actors to establish ties
with other actors that have similar degree to them. In our context this means that airlines with many
code-sharing agreements tend to establish new agreements (or keep existing ones) with other
companies that themselves have already many such agreements, and airlines with few agreements
tend to ally with companies that similarly have few agreements. The ‘Degree of Alter’ parameter
operationalizes the preferential attachment mechanism through which popular actors (i.e. actors
with high degree) become even more popular. This parameter measures the extent to which network
actors (independently from their own degree) tend to choose as new contacts other actors who
already have high degree; in our context this translates into airlines preference (independently from
how many code-sharing agreements they have) to establish new agreements with partners that
already have many code-sharing agreements.
17
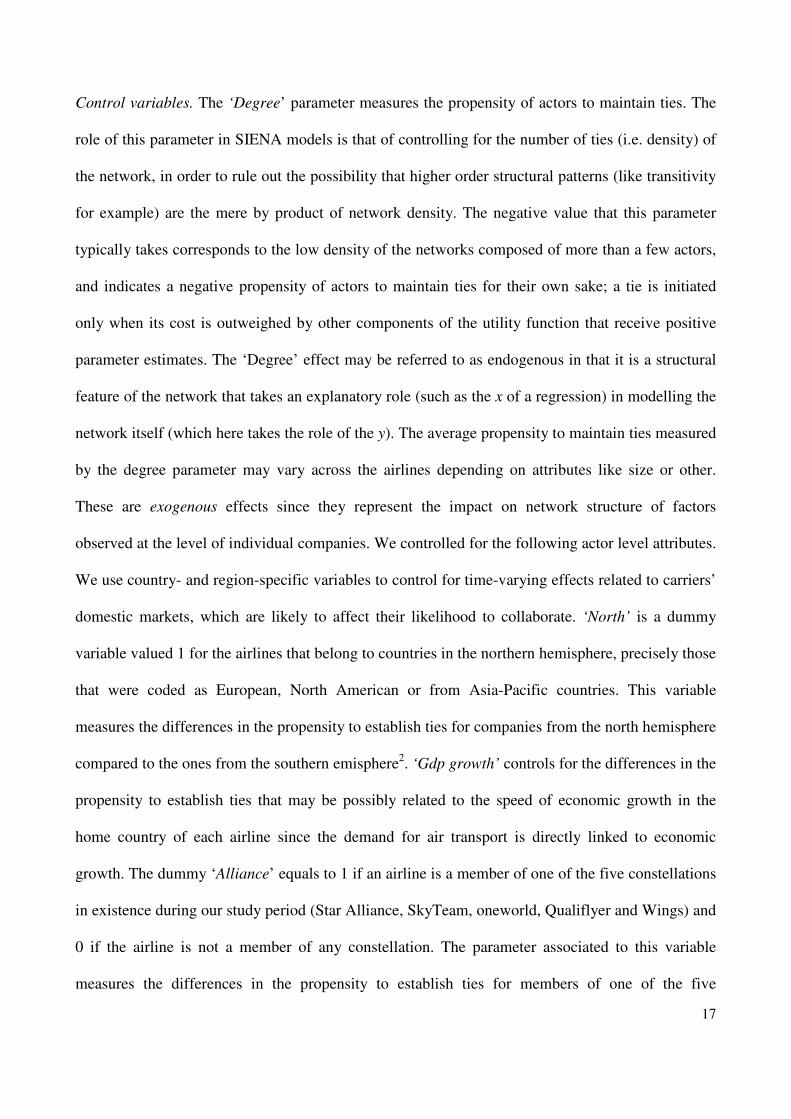
Control variables. The ‘Degree’ parameter measures the propensity of actors to maintain ties. The
role of this parameter in SIENA models is that of controlling for the number of ties (i.e. density) of
the network, in order to rule out the possibility that higher order structural patterns (like transitivity
for example) are the mere by product of network density. The negative value that this parameter
typically takes corresponds to the low density of the networks composed of more than a few actors,
and indicates a negative propensity of actors to maintain ties for their own sake; a tie is initiated
only when its cost is outweighed by other components of the utility function that receive positive
parameter estimates. The ‘Degree’ effect may be referred to as endogenous in that it is a structural
feature of the network that takes an explanatory role (such as the x of a regression) in modelling the
network itself (which here takes the role of the y). The average propensity to maintain ties measured
by the degree parameter may vary across the airlines depending on attributes like size or other.
These are exogenous effects since they represent the impact on network structure of factors
observed at the level of individual companies. We controlled for the following actor level attributes.
We use country- and region-specific variables to control for time-varying effects related to carriers’
domestic markets, which are likely to affect their likelihood to collaborate. ‘North’ is a dummy
variable valued 1 for the airlines that belong to countries in the northern hemisphere, precisely those
that were coded as European, North American or from Asia-Pacific countries. This variable
measures the differences in the propensity to establish ties for companies from the north hemisphere
compared to the ones from the southern emisphere2. ‘Gdp growth’ controls for the differences in the
propensity to establish ties that may be possibly related to the speed of economic growth in the
home country of each airline since the demand for air transport is directly linked to economic
growth. The dummy ‘Alliance’ equals to 1 if an airline is a member of one of the five constellations
in existence during our study period (Star Alliance, SkyTeam, oneworld, Qualiflyer and Wings) and
0 if the airline is not a member of any constellation. The parameter associated to this variable
measures the differences in the propensity to establish ties for members of one of the five
18
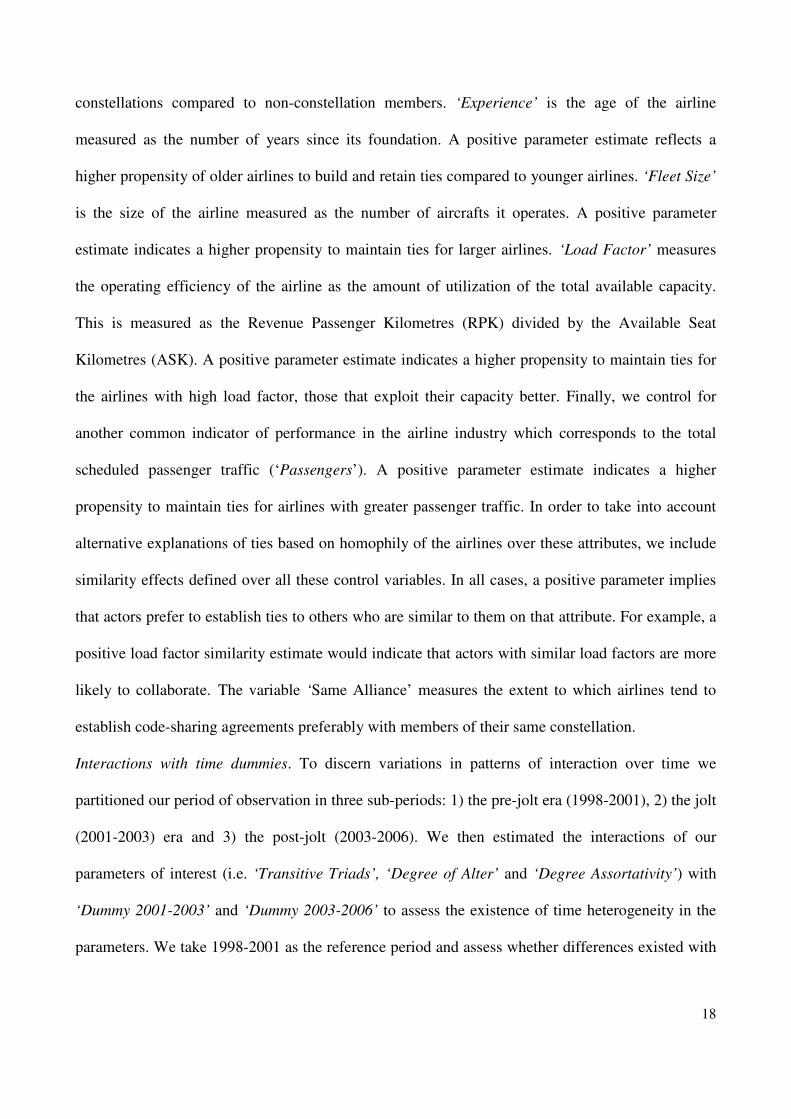
constellations compared to non-constellation members. ‘Experience’ is the age of the airline
measured as the number of years since its foundation. A positive parameter estimate reflects a
higher propensity of older airlines to build and retain ties compared to younger airlines. ‘Fleet Size’
is the size of the airline measured as the number of aircrafts it operates. A positive parameter
estimate indicates a higher propensity to maintain ties for larger airlines. ‘Load Factor’ measures
the operating efficiency of the airline as the amount of utilization of the total available capacity.
This is measured as the Revenue Passenger Kilometres (RPK) divided by the Available Seat
Kilometres (ASK). A positive parameter estimate indicates a higher propensity to maintain ties for
the airlines with high load factor, those that exploit their capacity better. Finally, we control for
another common indicator of performance in the airline industry which corresponds to the total
scheduled passenger traffic (‘Passengers’). A positive parameter estimate indicates a higher
propensity to maintain ties for airlines with greater passenger traffic. In order to take into account
alternative explanations of ties based on homophily of the airlines over these attributes, we include
similarity effects defined over all these control variables. In all cases, a positive parameter implies
that actors prefer to establish ties to others who are similar to them on that attribute. For example, a
positive load factor similarity estimate would indicate that actors with similar load factors are more
likely to collaborate. The variable ‘Same Alliance’ measures the extent to which airlines tend to
establish code-sharing agreements preferably with members of their same constellation.
Interactions with time dummies. To discern variations in patterns of interaction over time we
partitioned our period of observation in three sub-periods: 1) the pre-jolt era (1998-2001), 2) the jolt
(2001-2003) era and 3) the post-jolt (2003-2006). We then estimated the interactions of our
parameters of interest (i.e. ‘Transitive Triads’, ‘Degree of Alter’ and ‘Degree Assortativity’) with
‘Dummy 2001-2003’ and ‘Dummy 2003-2006’ to assess the existence of time heterogeneity in the
parameters. We take 1998-2001 as the reference period and assess whether differences existed with
19
respect to such period in the network structural dynamics in 2001-2003 (Dummy 2001-2003) and in
2003-2006 (Dummy 2003-2006).
Estimation procedure
We model the evolution of the network of code-sharing agreements by using SIENA actor-based
models of network change (Snijders, 2005). These models are actor-based since they analyse
network evolution as resulting from the aggregation of the choices that individual actors make to
create new ties or discontinue old ones. In our alliance network the creation of a tie is modelled as
the common choice of two airlines where one takes the initiative and the other has to confirm; for
the dissolution of an alliance the confirmation is not required (unilateral initiative and reciprocal
confirmation; Ripley et al., 2013: 43). Individual network actors choose with whom to create a new
tie or discontinue an old one based on their preferences about local configurations of relations. The
dynamic tendencies of the network are then modelled as the components of the utility function that
the airlines try to maximize by choosing other airlines with whom to initiate a new alliance or
dissolve an existing one. The parameters associated to the components of the utility function are
estimated by simulations of the evolution of the network between consecutive observations that are
iterated until convergence on a set of parameter estimates is obtained. Based on these parameter
estimates another series of simulations is performed which produces an estimate of the standard
errors. Simulations allow an assessment of the probability distribution of the parameters estimates
that is needed for testing, whose exact analytical form remains unknown. This is a general issue in
analysing network dynamics, because of the departure from the standard assumption of
independence of observations that is intrinsic to the task of assessing structural tendencies,
equivalent to that of assessing forms of interdependence between ties. Structural zeros in the
adjacency matrices are used for dealing with changing membership in the network during the
observed period, as explained by Ripley et al. (2013).

20
RESULTS
Table 2 shows the descriptive statistics. We include the number of companies present each year as
well as the average and the standard deviations of the control variables included in our models,
namely the size of the companies, in our case computed using fleet size, their experience and load
factor, the percentage of airlines belonging to one of the three regions of the northern part of the
hemisphere, GDP percent growth and the passengers carried. Table 3 shows the correlations of the
variables included in the estimations. We also computed the Jaccard index to gauge the similarity of
two consecutive observations and hence the amount of change in the network. The Jaccard index
measures the similarity of two networks by discarding the ties that do not exist in either network, in
order to avoid inflating the similarity of sparse networks whose adjacency matrices are filled mainly
with zeros. This index remains within an acceptable range during the observation period, with a
maximum in 2004-2005 (Jaccard = .84; slow change) and a minimum in 1998-1999 (Jaccard = .63;
fast change).
[Tables 2, 3 and 4 about here]
Table 4 shows the results of the SIENA models. The convergence of the estimation
algorithm was very good for all models, with the t statistics for all parameters below 0.1, which is
the typical convergence threshold in SIENA models. In SIENA models all the parameters are
coefficients of the utility function that actors try to maximize by choosing to create new ties, to
maintain existing ties, or to terminate them. If a parameter is positive, then there is a higher
probability of moving toward a network configuration where that variable has a higher value or, in
other words, that the variable associated with such parameter drives network evolution; the opposite
is true if the parameter value is negative (Lazega et al., 2011).

21
In the control model (model 1), we included both endogenous and exogenous effects. The
degree parameter is significant and negative suggesting that actors are generally reluctant to form
ties. This finding is common in network evolution models as actors draw no benefit from forming
random ties to other network members which are not part of specific local structures. With respect
to firm characters we find that actors with significant experience are more likely to be involved in
tie formation. For the similarity measures, we find that airlines that belong to Europe, Asia-Pacific
and North America (north hemisphere), airlines that belong to the same multilateral alliance, and
airlines originating from countries with similar GDP growth are more likely to cooperate with each
other. On the other hand, we observe that experienced firms are more likely to choose partners with
less experience, and vice versa.
In models 2a and 2b we include the parameters of interest which correspond to the rules of
attachment described earlier (we have two variants of this model as we found “assortativity” and
“degree of alter” highly correlated. Accordingly, the effects of these two variables were estimated
separately). The positive and significant parameter ‘transitive triads’ indicates that open triads tend
to close. As previously noted this result is quite recurrent in a variety of networks since actors
generally tend to become “friends of their friends” (Granovetter, 1973). The parameter ‘degree
assortativity’ is negative but not significant. Therefore, when one considers the whole 9-year period,
the presence of assortative mixing based on degree is not confirmed. Similarly, there is no
significant preferential attachment (or rich get richer) effect as the parameter ‘degree of alter’ is
positive but not significant. With the exception of experience and experience similarity, controls
that are significant in model 1 continue to be significant, and in the same direction, in both models 2
and 3.
The social dynamics of the network vary when one takes into account time heterogeneity. We
do so in models 3a and 3b, where we interact the variables of theoretical interest with two time
dummies capturing the jolt (2001-2003) and post jolt (2003-2006) periods. The parameter ‘degree’

22
remains negative and significant. However, the interaction between ‘degree’ and the two time
dummies is positive and significant suggesting that in the aftermath of the shock the cost of
establishing linkages decreases or, stated differently, actors are relatively more inclined towards
creating new partnerships. We integrate this finding with a portrait of the trends in degree
distributions for the years 1998-2006, illustrated in figure 2. Degree distributions are often used as a
diagnostic indicator to assess if tie formation in a network is equiprobable for all pairs of nodes or
biased proportional to existing ties of potential partners (Powell et al., 2005). Figure 2 shows the
degree distribution in the airline field for three distinct periods, before, during, and after the jolt.
The x-axis indicates the number of ties per company (i.e. degree) and the y-axis indicates the
number of companies. We see in the picture that the number of companies having very few
connections drops significantly over the three periods. This result suggests that the years after 2001
marked a long-term shift in relational logics leading to an increasingly less stratified field.
[Figure 2 about here]
When interacted with the time dummies, the parameter for degree assortativity changes
significantly. We find that both in the immediate aftermath of the jolt and in the period that
followed, disassortativity occurs as confirmed by the negative and significant interactions between
‘degree assortativity’ and both time dummies. Actors that occupy prominent positions in the field
exhibit an increasing propensity towards forging alliances with more peripheral actors and vice
versa. Since disassortativity is often driven by complementarity needs (Ahuja et al., 2012), a
possible interpretation is that the jolt induces actors towards a stronger preference for diversity.
Note that most high-degree airlines belonged to the Northern hemisphere (namely Asia, Europe and
North America) and that 9/11 hit these regions more severely. Not only a reorientation of these
carriers’ alliance strategy towards diversity allowed them to compensate for demand reduction in

23
their Transatlantic and Transpacific routes, but it also enabled them to expand their presence in
local markets which were less hit by the jolt. At the same time, peripheral players attaching to high
degree players could take advantage of status and reputation transfer. One such example is provided
by the code-sharing agreement established between Lufthansa and the much smaller regional carrier
Aegean Airlines. The latter’s CEO commented the cooperation between the two carriers as follows
(Aegean, 2005):
“Lufthansa, one of the world’s leading airlines, has done us proud by recognising us as
a strong regional partner. We are delighted at becoming Lufthansa’s partner in Greece
as we are with the opportunity of offering our passengers connections into Lufthansa's
global route network”
The tendency towards transitive closure is stronger both in the jolt and post-jolt periods as
indicated by the positive and statistically significant interaction terms between “transitive triads”
and the two time dummies. The increase in clustering after the shock is significant especially in the
immediacy of the shock, suggesting that the large upheaval in the network acts as a catalyst for
retrenchment and cohesion. In other words, the jolt seems to trigger relationships that increase the
organizations’ embeddedness into the network rather than a motivation to alter the present structure
with new bridging ties (Galaskiewicz and Shatin, 1981; Podolny, 1994). These findings suggest that
the returns to cohesion, such as reliability and trust, provide especially appealing benefits when
field actors have to cope with convulsive moments triggered by exogenous shocks that suddenly
disturb field-level consensus causing indeterminacy (Clemens and Cook, 1999).
The interaction between degree of alter and the time dummies yields also interesting results.
Both interactions are negative although the degree of alter parameter is significant only in the post-
jolt period. These results support a ‘poor get richer’ argument indicating that actors with lower

24
degrees become more attractive partners in the post-jolt period compared to the period before the
jolt. Our perspective on this trend builds on the idea of “structure-loosening” event (Madhavan et
al., 1998). A structure-loosening event is believed to occur when the poor get richer or when highly
central actors forgo a central position while more peripheral actors become more central. To explore
this argument, we turn to examine the core-periphery dynamics of the field over the study period. In
an idealized core-periphery structure, the core is a group of nodes that are connected to all other
nodes of both the core and the periphery. The periphery is a group of nodes that are not connected
to each other but only to the nodes in the core. Although no real social network conforms to this
ideal, an algorithm is used to maximize the density within the core and to minimize the density
within the periphery. This can be accomplished with a genetic algorithm first proposed by Borgatti
and Everett (1999) and implemented in UCINET VI package (Borgatti et al., 2002). The resulting
partition of the network into core and peripheral members over the 9 year period of the study is
depicted in figure 3 which shows trends for core and peripheral organizations annually. Note that
starting from 2001 and throughout the post-jolt period the two curves have opposite trends with the
periphery thinning and the core growing. The difference in size between these two partitions
becomes increasingly less pronounced up to 2004, when the two trends change direction and the
magnitude of the core-periphery divide picks some momentum once again. The number of
peripheral organizations declines especially rapidly after 2001 while organizations in the core
increase and subsequently almost stabilize.
[Figure 3 about here]
Robustness checks
An event focus tracks the evolution of an interorganizational field over time by examining structure
through various ‘windows of time’ (Doreian, 1986). The window’s length depends on specific
events. A key advantage of this approach is that both managers and researchers are likely to agree

25
that industry events provide more relevant ‘check points’ for network evolution than arbitrary time
periods (Madhavan et al., 1998). Since the jolt we studied took place in September 11 2001, we
chose 2001 as a starting year for the jolt period. This choice was driven both by previous
contributions studying the effects of the 9/11 (Bradley et al., 2011) and by interviews with airline
alliance managers. However, to test for the possibility that the duration of the post-jolt period may
have a different length, we used alternative time windows. In particular, we re-ran our full model
using the following windows for the jolt period: 1) 2001-2002, 2) 2002-2003, and 3) 2002-2004.
Results from these analyses – available from the authors – do not differ substantially from the
results obtained with the 2001-2003 time window for the jolt period.
In order to control for alternative measures of the dynamics in the local (triadic) structure,
we run transitive ties effect which is similar to the transitive triads effect, but instead of considering
for each other actor j how many two-paths i → h → j there are, it only considers whether there is at
least one such indirect connection (Ripley et al., 2013). This analysis – available from the authors –
did not yield different results from the model with the transitive triads thus providing additional
robustness to our results. Additionally, to explore the changes in relational logics presaged in the
figures and tables presented above, we offer in the appendix additional insights into the triadic
combination of core and peripheral organizations in the pre-, during and post- jolt periods.
DISCUSSION
Accounting for social change is one of the enduring problems of social science. Many such
accounts paint organizations as “plaint in response to exogenous shocks, whose effects appear to
radiate outward like a tsunami toppling those in its path” (Powell and Owen-Smith, 2012: 466).
Whether in the form of social upheavals, technological disruptions, regulatory change or
environmental shocks (e.g., Davis et al., 1994; Kraatz and Moore, 2002; Meyer et al., 2005), jolts

26
can disturb field-level consensus triggering alternative logics of action and interaction and thus
rupturing the creation and re-creation of stable systems of relationships. Unfortunately, these
punctuated accounts of organizational life do not tell us much about how organizations restructure
their ties after such convulsive moments, and even less explored is the subsequent evolutionary
trajectory of the network in which such organizations are embedded. We sought to address this gap
through an analytical strategy rooted in the understanding of markets as fields (Bourdieu and
Wacquant, 1992) structured by relationships that both channel the flow of information and
resources and provide signals of status and identity. These networks mark past experiences but are
also a roadmap of future prospects. Thus, by examining the dynamics of interorganizational tie
formation and dissolution over time we set out to expose changes in the logics of attachment
guiding actors’ interorganizational affiliations in the aftermath of an exogenous shock.
Drawing on rich qualitative as well as quantitative evidence on the interorganizational
structuration of the global field of commercial airlines in response to the terroristic attacks of
September 11 2001, we illustrated a pattern of network transformation conducive to a gradually less
stratified and more inclusive field. Through a combination of methods ranging from the analysis of
interview material, to social network analysis to actor-based statistical modelling we documented
the emergence of a blended logic of partner selection that combines both “conservatism” through
triadic closure and outreach to peripheral members through disassortativity and preferential
avoidance. Purely from the perspective of network dynamics, the picture suggested by the analysis
of the mechanisms of network change is that the members of the network respond to the negative
shock by pursuing a mix of consolidating and expansive ties (i.e. a hybrid network structure). They
consolidate positions by closing open triads at a greater rate, thereby increasing their embeddedness
into the network, but they simultaneously prospect for less connected members and newcomers,
thus enabling the formation of a more permeable network core. This strikes us as particularly
interesting, for two reasons. First, we surmise that this tension between cohesion and outreach to

27
peripheral members is key to determine the overall poisedness of the field in the face of exogenous
shocks. In the airline industry the mix of conserving and prospective ties has resulted in a porous
core that neither calcified nor dramatically transformed despite the major turmoil that shook the
system. Exploring the durability and resiliency of these at least partially diverging
interorganizational arrangements that emerge in response to external shocks is a fascinating area for
future inquiry. Second, research on the social structure of fields has had relatively little to say so far
in respect to possible mechanisms that may curb the stratification order that conserves the privileges
of the field’s core members. One possibility suggested here is that the environmental jolt creates an
‘occasion’ for field restructuring by catalysing the emergence of a less skewed distribution of
interorganizational ties and fostering greater integration between the core and the periphery of the
network. And the fact that these affiliation dynamics persist both in the immediacy of the jolt and in
the longer term suggests that the rewiring of the network is not a temporary response to a situation
of sudden crisis but the expression of a new logic of interaction that comes into existence.
CONCLUSIONS
Research on the formation and dissolution of interorganizational ties has been flourishing in
management and sociology (e.g., Gulati and Gargiulo, 1999; Madhavan et al., 1998; Powell et al.,
2005). By progressively recognizing that actors in an interorganizational field are not only situated
in space but also in time, these and other studies have contributed to a better understanding of how
and why fields evolve to take the forms that they do. Much of this research has highlighted the role
of the endogenous influence of the network structure in which an organization is embedded in
affecting that organization’s opportunities to select its partners and so position itself in the field.
Existing structures have been found to provide social cues about the reliability of future partners
and their competencies which in turn reduce the search costs and the risks associated with
28
opportunism (Gulati, 1995). Yet, not all ties are predicted by network endogeneity and other factors
other than network structure may motivate tie dynamics.
In this study we have focused on one such factor exogenous to the network and to the entire
field, as an attempt to move away from accounts of how networks reproduce themselves and gain
instead a better understanding of why and how logics of attachment change. Indeed, it is relatively
unknown “whether different mechanisms play greater or lesser roles as networks evolve” (Rivera et
al., 2010: 108). A central contribution of our study, therefore, is to expose such mechanisms and
show how they change over time as a result of an exogenous shock that undermines the calculations
on which field relations had been based.
From a methodological standpoint we wish to emphasize that the mechanisms of tie
formation and dissolution we have examined rest on complex processes, operating both at the level
of actors’ attributes and at the endogenous level of their relationships. The interplay of these
mechanisms makes the disambiguation of causal relationships in the dynamics of tie formation and
dissolution particularly hard to pin down (Rivera et al., 2010). Achieving this goal is made more
difficult by the methodological challenge of endogeneizing network change (Fligstein and Stone
Sweet, 2002) due to the composite dependence structure of the tie variables. The statistical
modelling approach we use in this paper offers a distinctive and powerful toolkit for addressing this
issue. It is distinctive because it focuses on the evolution of the entire network, and not only on
dyadic tie formation, which can account simultaneously for generative mechanisms across different
levels without making unrealistic assumptions of dyadic independence, thus allowing us to model
interdependencies and assess network evolution properly (Ferriani et al., 2013). It is also powerful
because it is based on maximum-likelihood estimation, which has been shown to be superior in
estimating network change compared to the pseudo-likelihood estimators traditionally used for
inference from exponential random graph models (Van Duijn et al., 2009). The stochastic actor-
based models for network dynamics implemented by SIENA rely on simulations for estimation and
29
testing and can be compared to other simulation based methods: they embody a logic similar to
agent-based models (ABMs; Gilbert, 2008) in that they focus on the micro-mechanisms of actors
choices as drivers of macro-structural change. The difference with ABMs is that SIENA models are
based on observed rather than simulated data. They can also be compared to other network
modelling approaches, like exponential random graph models (ERGMs; Robins et al., 2007), which
also overcome the estimation and testing problems posed by network interdependence. ERGMs,
however, are cross-sectional and “can best be understood as a model of a process in equilibrium”
(Snijders et al., 2010: 57), while SIENA models are longitudinal and more general than ERGMs,
because they do not require the equilibrium assumption. By using SIENA to analyse the evolution
of the interfirm collaboration network in the airline industry, our study aims to contribute to the
small but growing research that uses stochastic actor-oriented model for network dynamics (Ebbers
and Wijnberg, 2010; Balland et al., 2013; Ferriani et al., 2013).
This research is not without caveats. The single and negative event we chose may put some
limits to the generalizability of our results. First, given the idiosyncratic nature of each event, it is
necessary to take into account the properties of shocks when examining their impact on networks.
Future studies may start discriminating between different types of shocks based on several
dimensions such as: 1) the sign of the shock (positive versus negative), 2) the locus in which the
shock takes place (within or outside the field), 3) the influence field actors can exert on the event
(low versus moderate), 4) the magnitude of the shock (low versus high impact), and its 5) duration
(short-term versus long-term). Moreover, field-specific factors may influence the relationship
between the type of shock and the network rewiring that ensues. Examples of such factors include,
among others, the stage of maturity of the industry and the distinction between service and
manufacturing industries. The patterns found in our study may for instance not be the same in less
bureaucratic and younger industries. Third, an issue worth noting is that the exogenous shock we
focused on took place somewhat in between two other disruptive events: the Asian financial crisis,
30
widely regarded as an environmental jolt that suddenly reduced global environmental munificence
(Wan and Yiu, 2009), which reached its apex in the period 1998-1999; and the pandemic crisis
caused by SARS in 2003. The sequencing of these events (Asian crisis, 9/11, SARS) over a
relatively short span of time (6 years) means that some of their effects may have been intertwined.
For instance, it is quite possible that some airlines may have first changed their dynamics of
affiliation in response to the Asian crisis and then reinforced such transition in response to 9/11 first
and the SARS next. This may explain the acceleration observed in triadic closure and, more
generally, the persistence of all network effects in the post-jolt period. If this is indeed the case, the
sample may have provided us with a conservative test of our central claim that jolts have the
potential to subvert the field’s prevailing logics of attachment. Finally, interesting results could
emerge from the interactions between different levels of analysis. For instance, using the variables
we identified in this paper future research could explore: 1) whether transitive triads between firms
sharing a common attribute are more likely to occur before or after an environmental jolt, 2)
whether homophilous ties are more likely when two firms share a common partner before and after
an environmental jolt. We hope our initial findings provide new insights, encouraging scholars to
undertake more research on situations far from equilibrium and explore their effects on the
evolution of networks and fields.
Acknowledgements
The authors would like to thank Guest Editor Ajay Mehra and the three anonymous reviewers for
their very helpful suggestions and insightful feedback. Airline executives who took time from their
busy schedules to offer their views and insights on the evolution of airline alliances are also
gratefully acknowledged. An earlier version of this paper was presented at the 2013 Academy of
Management Meeting in Orlando, Florida and the 2012 Strategic Management Society Conference
in Prague, Czech Republic. The authors contributed equally. All errors and omissions remain ours.
Funding
31
We gratefully acknowledge financial assistance from the MIUR-PRIN Funding Scheme (Project:
“Collaboration and Combination: A Relational Analysis of Creativity”, Grant 20124AE52R).
Notes
1. Constellation members are linked through dyadic collaborative agreements but not all of
them are necessarily tied to one another (Gomes-Casseres, 1994). In other words, ties with
non-constellation members and with members of other constellations are still possible.
2. We followed the division suggested in the Airline Business magazine which identifies six
regions: Africa, Asia-Pacific, Central-South America, Europe, Middle East and North
America. The patterns of the average degrees from the six geographical areas showed a
similarity among the companies from the northern hemisphere (Asia-Pacific, Europe and
North-America) on one hand, and those from the southern on the other, with the former
characterized by similar and higher average degrees across the period of observation. Since
exogenous covariates are included in SIENA models for controlling actors’ degree
heterogeneity, we aggregated the six geographical areas in the two hemispheres to reflect the
heterogeneity of these two patterns, without burdening the estimation with redundant
parameters.
REFERENCES
Aegean
2005 ‘Lufthansa and Aegean Airlines starting extensive cooperation Passengers will benefit from
increased number of flights and improved connections’. Retreived from http://en.aegeanair.com/all-
about-us/press-office/press-releases/press-release/?prid=179 on October 8th
2014.
Ahuja, Gautam, Giuseppe Soda, and Akbar Zaheer.
2012 ‘The genesis and dynamics of organizational networks’. Organization Science 23/2: 434-448.
Anheier, Helmut K., Jurgen Gerhards, and Frank P. Romo
1995 ‘Forms of capital and social structure in cultural fields: Examining Bourdieu's social
topography’. American Journal of Sociology 859-903.
Baker, Colin
2001 ‘The global groupings’. Airline Business 17: 40-45.
Balland, Pierre-Alexandre, Mathijs De Vaan, and Ron Boschma
2013 ‘The dynamics of interfirm networks along the industry life cycle: The case of the global
video game industry, 1987–2007’. Journal of Economic Geography 13/5: 741-765.
Beckert, Jens
2010 ‘How do fields change? The interrelations of institutions, networks, and cognition in the
dynamics of markets’. Organization Studies 31/5: 605-627.
32
Borgatti, Stephen P., and Martin G. Everett
2000 ‘Models of core/periphery structures’. Social networks 21/4: 375-395.
Borgatti, Stephen P., Martin G. Everett, and Linton C. Freeman.
2002 Ucinet for Windows: Software for social network analysis, Harvard, MA: Analytic
Technologies
Bourdieu, Pierre
1984 Distinction: A social critique of the judgement of taste. Cambridge, MA: Harvard University
Press.
Bourdieu, Pierre, and Loïc J.D. Wacquant
1992 An invitation to reflexive sociology. Chicago, IL: University of Chicago Press.
Bradley, Steven W., Howard Aldrich, Dean A. Shepherd, and Johan Wiklund
2011 ‘Resources, environmental change, and survival: Asymmetric paths of young independent and
subsidiary organizations’. Strategic Management Journal 32/5: 486-509.
Clemens, Elisabeth S., and James M. Cook
1999 ‘Politics and institutionalism: Explaining durability and change’. Annual Review of Sociology
441-466.
Davis, Gerald F., Kristina A. Diekmann, and Catherine H. Tinsley
1994 ‘The decline and fall of the conglomerate firm in the 1980s: The deinstitutionalization of an
organizational form’. American Sociological Review 547-570.
Doreian, Patrick.
1986 ‘On the evolution of group and network structure II: Structures within structure’. Social
Networks 8/1: 33-64.
Ebbers, Joris J., and Nachoem M. Wijnberg
2010 ‘Disentangling the effects of reputation and network position on the evolution of alliance
networks’. Strategic Organization 8/3: 255-275.
Felin, Teppo, and Nicolai J. Foss.
2005 ‘Strategic organization: A field in search of micro-foundations’. Strategic Organization 3/4:
441-455.
Ferriani, Simone, Fabio Fonti, and Raffaele Corrado
2013 ‘The social and economic bases of network multiplexity: Exploring the emergence of
multiplex ties’. Strategic Organization 11/1: 7-34.
Fligstein, Neil
2001 ‘Social skill and the theory of fields’. Sociological theory 19/2: 105-125.
Fligstein, Neil, and Alec Stone Sweet
2002 ‘Constructing Markets and Polities: An Institutionalist Account of European Integration’.
American Journal of Sociology 107: 1206-1243.

33
Fligstein, Neil, and Doug McAdam
2011 ‘Toward a general theory of strategic action fields’. Sociological Theory 29/1: 1-26.
Fligstein, Neil, and Doug McAdam
2012 A theory of fields, Oxford, UK: Oxford University Press.
Galaskiewicz, Joseph, and Deborah Shatin
1981 ‘Leadership and networking among neighborhood human service organizations’.
Administrative Science Quarterly 434-448.
Gilbert, Nigel
2008 Agent-based models. London, UK: Sage Publications.
Gomes-Casseres, Benjamin
1994 ‘Group vs. group: How alliance networks compete’. Harvard Business Review 72/4: 62-67.
Granovetter, Mark S.
1973. ‘The strength of weak ties’. American Journal of Sociology 78: 1360-1380.
Gulati Ranjay, and Gargiulo, Martin
1999. ‘Where do interorganizational networks come from?’ American Journal of Sociology 104/5:
1439–1493.
Gulati, Ranjay, Maxim Sytch, and Adam Tatarynowicz
2012 ‘The rise and fall of small worlds: Exploring the dynamics of social structure’. Organization
Science 23/2: 449-471.
Iatrou, Kostas, and Oretti, Mauro
2007 Airline choices for the future: From alliances to mergers. Burlington, VT: Ashgate.
Jick, Todd D.
1979 ‘Mixing qualitative and quantitative methods: Triangulation in action’. Administrative Science
Quarterly 602-611.
Kraatz, Matthew S., and James H. Moore
2002 ‘Executive migration and institutional change’. Academy of Management Journal 45/1: 120-
143.
Krackhardt, David
1992 ‘The strength of strong ties: The importance of philos in organizations in Networks and
Organizations: Structure, Form, and Action N. Nohria, and R.G Eccles (eds.). Boston, MA:
Harvard Business School Press.
Lazega, Emmanuel, Lise Mounier, Tom Snijders, and Paola Tubaro.
2012 ‘Norms, status and the dynamics of advice networks: A case study’. Social Networks 34/3:
323-332.
Lazzarini, Sergio G.
34
2007 ‘The impact of membership in competing firm constellations: evidence on the operational
performance of global airlines’. Strategic Management Journal 28(4): 345-367.
Lazzarini, Sergio G., Danny P. Claro, and Luiz F. Mesquita
2008 ‘Buyer–supplier and supplier–supplier alliances: do they reinforce or undermine one
another?.’Journal of Management Studies 45/3: 561-584.
Madhavan, Ravindranath, Balaji R. Koka, and John E. Prescott.
1998 ‘Networks in transition: How industry events (re) shape interfirm relationships’. Strategic
Management Journal 19/5: 439-459.
Madhavan, Ravindranath, Devi R. Gnyawali, and Jinyu He
2004. Two's company, three's a crowd? Triads in cooperative competitive networks. Academy of
Management Journal 47/6: 918-927.
McAdam, Doug, W. Richard Scott.
2005 ‘Organizations and movements’ in Social Movements and Organization Theory in G. Davis, D.
McAdam, W. R. Scott, and M. Zald (eds.). Cambridge: Cambridge University Press.
Merton, Robert K.
1968 ‘The Matthew effect in science’. Science 159/3810: 56-63.
Meyer, Alan D.
1982 ‘Adapting to environmental jolts’. Administrative Science Quarterly 27/4: 515-537.
Meyer, Alan D., Vibha Gaba, and Kenneth A. Colwell.
2005 ‘Organizing far from equilibrium: Nonlinear change in organizational fields’. Organization
Science 16/5: 456-473.
Oum, Tae Hoon, and Yu Chunyan
1998 Winning airlines: Productivity and cost competitiveness of the world’s major airlines. Boston,
MA: Kluwer Academic Publishers.
Phillips, Nelson, Thomas B. Lawrence, and Cynthia Hardy
2004 ‘Discourse and institutions’. Academy of Management Review 29/4: 635-652.
Podolny, Joel M.
1994 ‘Market uncertainty and the social character of economic exchange’. Administrative Science
Quarterly 458-483.
Podolny, Joel M.
2001 ‘Networks as the pipes and prisms of the market’. American Journal of Sociology 107/1: 33-
60.
Powell, Walter W., Kenneth W. Koput, and Laurel Smith-Doerr
1996 ‘Interorganizational collaboration and the locus of innovation: Networks of learning in
biotechnology’. Administrative Science Quarterly 41/1: 116-145.
Powell, Walter W., Douglas R. White, Kenneth W. Koput, and Jason Owen-Smith

35
2005 ‘Network dynamics and field evolution: The growth of interorganizational collaboration in the
life sciences’. American Journal of Sociology 110/4: 1132-1205.
Powell, Walter W., and Jason Owen-Smith
2012 ‘An open elite: Arbiters, catalysts, or gatekeepers in the dynamics of industry evolution?’ in J.
Padgett and W.W. Powell (eds.) The Emergence of Organizations and Markets. Princeton, NJ:
Princeton University Press.
Qiao, Jian, Hong-Qiao Huang, Guo-Ying Li, and Ying Fan
2014 ‘Bridging the gap between different social networks’. Physica A: Statistical Mechanics and its
Applications 410: 535-549.
Ripley, Ruth M., Tom A.B. Snijders, Zsófia Boda, András Vörös, and Paulina Preciado
2013 Manual for SIENA version 4.0 (version October 30, 2013). Oxford: University of Oxford,
Department of Statistics Nuffield College http://www.stats.ox.ac.uk/siena/
Rivera, Mark T., Sara B. Soderstrom, and Brian Uzzi
2010 ‘Dynamics of dyads in social networks: Assortative, relational, and proximity mechanisms’.
Annual Review of Sociology 36: 91-115.
Robins, Gary, Tom Snijders, Peng Wang, Mark Handcock, and Philippa Pattison
2007 ‘Recent developments in exponential random graph (p*) models for social networks’. Social
Networks 29/2: 192-215.
Sauder, Michael
2008 ‘Interlopers and field change: The entry of US news into the field of legal education’.
Administrative Science Quarterly 53/2: 209-234.
Simmel, George
1950 The Sociology of Georg Simmel. New York: Free Press.
Sine, Wesley D., and Robert J. David
2003 ‘Environmental jolts, institutional change, and the creation of entrepreneurial opportunity in
the US electric power industry’. Research Policy 32/2: 185-207.
Snijders, Tom A.B.
2001 ‘The statistical evaluation of social network dynamics’. Sociological Methodology 31/1: 361-
395.
Snijders, Tom A. B.
2005 Models for longitudinal network data. in Models and methods in social network analysis. P.
Carrington, J. Scott, and S. Wasserman (Eds.). New York: Cambridge University Press.
Snijders, Tom A.B., Gerhard G. Van de Bunt, and Christian E.G. Steglich
2010 ‘Introduction to stochastic actor-based models for network dynamics’ Social Networks 32/1:
44-60.
Staw, Barry M., Lance E. Sandelands, and Jane E. Dutton

36
1981 ‘Threat rigidity effects in organizational behavior: A multilevel analysis’ Administrative
Science Quarterly 501-524.
Stuart, Toby E.
1998 ‘Network positions and propensities to collaborate: An investigation of strategic alliance
formation in a high-technology industry’. Administrative Science Quarterly 106/6:668-698.
Thornton, Patricia H.
2002 ‘The rise of the corporation in a craft industry: Conflict and conformity in institutional logics’.
Academy of Management Journal 45/1: 81-101.
Uzzi, Brian
1997 ‘Social structure and competition in interfirm networks: The paradox of embeddedness’
Administrative Science Quarterly 35-67.
van Duijn, Marijtje AJ, Krista J. Gile, and Mark S. Handcock
2009 ‘A Framework for the Comparison of Maximum Pseudo-Likelihood and Maximum
Likelihood Estimation of Exponential Family Random Graph Models’ Social Networks 31/1: 52-62.
Wan, William P., and Daphne W. Yiu
2009 ‘From crisis to opportunity: Environmental jolt, corporate acquisitions, and firm
performance’. Strategic Management Journal 30/7: 791-801.
Watts, Duncan J.
2004 ‘The" new" science of networks’. Annual Review of Sociology 243-270.

37
APPENDIX
Table 1. Details of key informants
Company Position Region of origin
Aeroflot Deputy General Director for Strategy and Alliances Europe
Aeromexico Director Alliances Latin America
Austrian Senior Director Partner Management Europe
CSA Czech Airlines Head of Alliances & International Relations Europe
Delta Director Alliances North America
JAL Alliance Manager Asia-Pacific
KLM Senior VP Strategy & Corporate Development Europe
Lufthansa Senior Manager Alliances and Cooperations Europe
n.a. Former CEO oneworld North America
SkyTeam VP Sales Europe
SWISS Head of Emergency Response Process Management Europe

38
Table 2. Descriptive statistics (means and standard deviations)
Nr. of Companies
Companies from North Hemisphere*
(%)89 (70.1%) 89 (70.1%) 87 (69.6%) 89 (71.2%) 85 (72.0%) 82 (71.3%) 81 (72.3%) 78 (71.6%) 77 (72.0%)
Average Experience
(Std. Dev.)42.03 (22.77) 43.03 (22.77) 44.62 (22.46) 45.27 (22.94) 45.58 (23.51) 46.69 (23.63) 48.23 (23.52) 49.43 (23.72) 50.35 (23.81)
Average Fleet Size
(Std. Dev.)95.83 (125.81) 80.38 (119.89) 81.03 (122.31) 80.76 (123.49) 81.97 (117.48) 82.95 (111.88) 92.35 (115.77) 88.97 (115.78) 98.67 (115.99)
Average GDP Growth
(Std. Dev.)0.025 (0.04) 0.035 (0.03) 0.046 (0.02) 0.025 (0.02) 0.030 (0.03) 0.039 (0.03) 0.053 (0.03) 0.047 (0.03) 0.054 (0.03)
Average Load Factor
(Std. Dev.)0.667 (0.06) 0.665 (0.07) 0.678 (0.07) 0.676 (0.06) 0.685 (0.07) 0.680 (0.06) 0.708 (0.06) 0.714 (0.06) 0.733 (0.06)
Average Passengers
(Std. Dev.)12.10 (17.99) 11.71 (17.88) 12.07 (18.01) 12.70 (18.00) 12.58 (17.97) 12.32 (17.86) 14.72 (19.74) 14.72 (20.58) 16.56 (20.85)
* North America, Europe and Asia-Pacific
2005 2006
127 127 125 125 118 115 112 109 107
Descriptive Statistics:
Nr. of Companies, Region, Experience, Fleet Size, GDP Growth, Load Factor, Passengers
2000 2001 2002 2003 20041998 1999

39
Table 3. Correlation matrix (degree assortativity)
Variable 1 2 3 4 5 6 7 8 9 10 11 12 13 14 15 16 17 18 19 20 21 22
1. Degree (Density)
2. North Hemisphere 0.368
3. Same Hemisphere -0.551 -0.384
4. Alliance Member 0.207 -0.093 0.010
5. Same Alliance -0.082 0.022 -0.089 -0.361
6. Experience 0.115 0.245 -0.020 -0.226 0.026
7. Experience Similarity -0.029 0.041 0.057 0.057 -0.055 -0.282
8. Fleet Size 0.014 -0.043 -0.027 0.073 -0.063 -0.136 0.052
9. Fleet Size Similarity 0.029 -0.029 -0.038 0.074 -0.046 -0.061 0.020 0.802
10. GDP Growth -0.073 0.024 0.002 0.054 -0.011 0.055 0.026 0.021 0.029
11. GDP Growth Similarity -0.074 0.050 -0.024 -0.062 0.007 -0.102 0.032 -0.064 -0.036 -0.102
12. Load Factor -0.038 -0.195 0.040 -0.082 0.012 -0.062 0.046 0.040 0.074 -0.107 -0.128
13. Load Factor Similarity -0.016 0.147 -0.050 0.000 0.015 0.062 -0.119 -0.028 -0.065 -0.041 0.021 -0.246
14. Passengers 0.076 0.029 -0.014 -0.112 0.040 0.163 -0.071 -0.851 -0.663 -0.019 0.033 -0.092 -0.016
15. Passengers Similarity 0.041 0.045 -0.017 -0.106 0.026 0.118 -0.051 -0.630 -0.838 -0.035 0.010 -0.098 0.028 0.766
16. Transitive Triads 0.201 -0.009 -0.045 0.034 -0.347 -0.015 -0.010 0.065 -0.001 -0.003 0.010 0.014 -0.048 -0.017 0.022
17. Degree Assortativity -0.657 -0.210 0.034 -0.253 0.259 -0.205 0.017 -0.078 -0.050 0.051 0.083 -0.029 -0.018 -0.045 -0.032 -0.644
18. Degree (Density) x Dummy 2001-2003 0.092 -0.038 0.033 -0.012 -0.013 0.005 -0.014 0.049 0.016 0.012 -0.023 -0.062 -0.011 -0.040 -0.018 -0.001 -0.042
19. Degree (Density) x Dummy 2003-2006 0.279 0.069 -0.020 0.036 0.005 -0.067 -0.001 0.034 0.021 -0.168 0.082 -0.174 0.060 -0.008 -0.025 0.002 -0.128 0.312
20. Degree Assortativity x Dummy 2001-2003 0.009 0.113 -0.048 -0.050 0.025 0.053 0.018 0.042 0.054 0.016 -0.032 0.016 0.011 -0.006 -0.010 0.054 -0.064 -0.693 -0.237
21. Degree Assortativity x Dummy 2003-2006 -0.073 0.063 -0.010 -0.021 -0.014 0.078 0.006 0.034 -0.021 0.028 -0.037 0.018 -0.016 -0.014 0.060 0.097 -0.065 -0.297 -0.682 0.486
22. Transitive Triads x Dummy 2001-2003 -0.057 -0.098 0.056 0.008 -0.047 -0.043 0.018 -0.020 -0.028 0.027 -0.002 0.000 -0.013 0.001 0.001 -0.054 0.075 0.201 0.081 -0.730 -0.390
23. Transitive Triads x Dummy 2003-2006 -0.051 -0.072 0.040 -0.037 -0.046 -0.036 0.060 0.008 0.015 0.057 -0.034 0.024 0.007 -0.032 -0.046 -0.099 0.100 0.101 0.155 -0.374 -0.704 0.523

40
Correlation matrix (degree of alter)
Variable 1 2 3 4 5 6 7 8 9 10 11 12 13 14 15 16 17 18 19 20 21 22
1. Degree (Density)
2. North Hemisphere 0.408
3. Same Hemisphere -0.480 -0.452
4. Alliance Member 0.241 -0.113 -0.015
5. Same Alliance -0.185 0.012 0.055 -0.406
6. Experience 0.188 0.196 -0.030 -0.231 0.057
7. Experience Similarity -0.062 0.007 0.029 0.040 -0.046 -0.277
8. Fleet Size 0.061 -0.038 -0.058 0.020 -0.035 -0.145 0.021
9. Fleet Size Similarity 0.054 -0.028 -0.071 0.037 -0.024 -0.087 0.010 0.824
10. GDP Growth -0.032 0.042 -0.006 0.030 0.018 0.135 -0.015 0.002 0.037
11. GDP Growth Similarity -0.015 0.064 -0.018 -0.039 -0.004 -0.056 0.007 -0.013 0.015 -0.097
12. Load Factor 0.032 -0.148 0.013 -0.059 0.035 -0.057 0.039 0.020 0.059 -0.136 -0.116
13. Load Factor Similarity -0.074 0.086 -0.077 -0.042 0.027 0.008 -0.075 -0.085 -0.104 -0.055 0.074 -0.207
14. Passengers 0.029 0.004 -0.008 -0.084 0.012 0.177 -0.054 -0.846 -0.671 0.002 0.010 -0.054 0.040
15. Passengers Similarity 0.012 0.014 0.007 -0.099 -0.003 0.138 -0.053 -0.631 -0.830 -0.049 -0.004 -0.053 0.049 0.765
16. Transitive Triads 0.280 0.040 -0.089 0.043 -0.317 -0.022 -0.010 0.021 -0.025 -0.002 0.056 -0.019 -0.047 0.009 0.035
17. Degree of Alter -0.833 -0.255 0.112 -0.255 0.232 -0.233 0.069 -0.063 -0.040 0.032 -0.008 -0.047 0.044 -0.044 -0.029 -0.544
18. Degree (Density) x Dummy 2001-2003 0.046 -0.044 0.081 -0.061 0.032 0.014 0.034 0.026 -0.011 -0.010 -0.023 -0.034 -0.012 -0.031 0.020 -0.024 -0.040
19. Degree (Density) x Dummy 2003-2006 0.129 -0.025 0.083 -0.009 0.000 -0.074 -0.006 0.004 0.022 -0.149 0.052 -0.111 -0.010 0.012 -0.005 -0.001 -0.078 0.307
20. Degree of Alter x Dummy 2001-2003 -0.006 0.069 -0.094 0.015 0.005 0.004 -0.040 0.009 0.034 0.080 0.007 0.023 -0.017 0.009 -0.037 0.019 0.019 -0.851 -0.278
21. Degree of Alter x Dummy 2003-2006 -0.043 0.069 -0.097 -0.022 0.036 0.017 0.003 0.051 -0.012 0.088 -0.006 0.022 0.027 -0.061 -0.008 0.031 0.021 -0.314 -0.843 0.394
22. Transitive Triads x Dummy 2001-2003 -0.033 -0.015 0.087 -0.003 -0.024 -0.025 0.022 0.019 0.018 -0.070 -0.026 -0.041 0.039 -0.036 -0.020 0.002 -0.006 0.293 0.084 -0.636 -0.245
23. Transitive Triads x Dummy 2003-2006 -0.026 -0.026 0.093 -0.005 -0.092 0.061 0.013 -0.007 0.018 -0.053 -0.054 -0.034 -0.013 0.013 0.002 -0.046 -0.002 0.120 0.232 -0.288 -0.585 0.461

41
Table 4. SIENA models for the evolution of interorganizational networks
Estim. SE p-value Estim. SE p-value Estim. SE p-value Estim. SE p-value Estim. SE p-value
Degree (Density) -0.870 0.048 <0.001 *** -1.124 0.060 <0.001 *** -1.240 0.080 <0.001 *** -1.075 0.065 <0.001 *** -1.241 0.085 <0.001 ***
North Hemisphere 0.143 0.090 0.113 -0.094 0.087 0.282 -0.127 0.088 0.150 -0.068 0.089 0.445 -0.120 0.091 0.187
Same Hemisphere 0.202 0.061 <0.001 *** 0.163 0.055 0.003 ** 0.162 0.054 0.003 ** 0.171 0.056 0.002 ** 0.182 0.057 0.001 **
Alliance Member 0.143 0.088 0.105 -0.049 0.087 0.570 -0.110 0.089 0.217 -0.082 0.092 0.370 -0.162 0.094 0.084 †
Same Alliance 1.336 0.127 <0.001 *** 0.600 0.137 <0.001 *** 0.696 0.140 <0.001 *** 0.580 0.141 <0.001 *** 0.714 0.141 <0.001 ***
Experience 0.007 0.002 <0.001 *** 0.002 0.002 0.243 0.001 0.002 0.518 0.002 0.002 0.222 0.001 0.002 0.617
Experience Similarity -0.251 0.110 0.022 * -0.198 0.110 0.072 † -0.188 0.109 0.084 † -0.195 0.115 0.090 † -0.175 0.109 0.110
Fleet Size 0.000 0.001 0.716 0.000 0.001 0.934 0.000 0.001 0.758 0.000 0.001 1.000 0.000 0.001 0.817
Fleet Size Similarity 0.727 0.543 0.181 0.323 0.597 0.588 0.184 0.647 0.776 0.251 0.577 0.664 0.136 0.627 0.828
GDP Growth 1.465 1.090 0.179 1.844 1.093 0.092 † 1.914 1.069 0.073 † 1.442 1.107 0.192 1.490 1.171 0.203
GDP Growth Similarity 0.962 0.316 0.002 ** 1.183 0.313 <0.001 *** 1.229 0.321 <0.001 *** 1.142 0.315 <0.001 *** 1.176 0.308 <0.001 ***
Load Factor -0.095 0.635 0.881 -0.208 0.644 0.747 -0.349 0.638 0.584 -0.687 0.650 0.290 -0.811 0.649 0.211
Load Factor Similarity 0.317 0.239 0.185 0.132 0.235 0.576 0.108 0.241 0.653 0.119 0.236 0.614 0.109 0.241 0.651
Passengers 0.009 0.007 0.209 0.005 0.007 0.526 0.004 0.007 0.574 0.005 0.007 0.532 0.004 0.007 0.588
Passengers Similarity -0.455 0.492 0.355 -0.311 0.525 0.553 -0.300 0.552 0.587 -0.231 0.506 0.649 -0.257 0.523 0.623
Transitive Triads 0.309 0.021 <0.001 *** 0.275 0.020 <0.001 *** 0.307 0.021 <0.001 *** 0.267 0.019 <0.001 ***
Degree Assortativity 0.000 0.000 0.182 -0.001 0.000 0.096 †
Degree of Alter 0.008 0.008 0.305 0.010 0.008 0.202
Degree (Density) x Dummy 2001-2003 0.220 0.110 0.046 * 0.255 0.151 0.091 †
Degree (Density) x Dummy 2003-2006 0.358 0.113 0.002 ** 0.424 0.148 0.004 **
Degree Assortativity x Dummy 2001-2003 -0.001 0.001 0.046 *
Degree Assortativity x Dummy 2003-2006 -0.001 0.001 0.030 *
Degree of Alter x Dummy 2001-2003 -0.025 0.016 0.134
Degree of Alter x Dummy 2003-2006 -0.033 0.015 0.023 *
Transitive Triads x Dummy 2001-2003 0.157 0.053 0.003 ** 0.133 0.048 0.006 **
Transitive Triads x Dummy 2003-2006 0.095 0.047 0.042 * 0.083 0.041 0.04 *
† p<0.1, * p <0.05, ** p <0.01, *** p <0.001
ControlsControls
Main Effects
Controls
Main Effects
Time Heterogeneity
Model 1 Model 2a Model 3aModel 2b
Controls
Main Effects
Model 3b
Controls
Main Effects
Time Heterogeneity

42
Figure 1. Constellation membership evolution
0
5
10
15
20
25
30
35
40
1998 1999 2000 2001 2002 2003 2004 2005 2006
No
. o
f co
mp
an
ies
Figure 2. Degree distributions in the pre-, during, and post-jolt periods
0
2
4
6
8
10
12
14
16
18
0 2 4 6 8 10 12 14 16 18 20 22 24 26 28 30 32
1998-2000 2001-2003 2004-2006
Horizontal axis: number of ties per company by year; Vertical axis: number of companies

43
Figure 3. Annual count of core and peripheral organizations, 1998-2006, full sample
0.00
10.00
20.00
30.00
40.00
50.00
60.00
70.00
80.00
90.001
99
8
19
99
20
00
20
01
20
02
20
03
20
04
20
05
20
06
Core Periphery

44
APPENDIX
Consider the table below where we partitioned the closed triads for the three representative time
periods (1998, 2002, and 2006) and by type of triad. With respect to the type of closed triad, we
distinguish among core triads that link three members of the core (C-C-C); periphery triads that link
three members of the periphery (P-P-P); core-periphery triads that link two members of the core and
one member of the periphery (C-C-P) and periphery-core triads that link two members of the
periphery and one member of the core (P-P-C). The number of closed triads snowballs through the
decade. In 1998 there were 310 closed triads and more than twice as much in 2006. As the overall
field becomes less stratified in the post-jolt periods, it also increases its internal cohesiveness as
more pathways between the core and the periphery are created.
Table 1. Closed triads by year and type
1998 2002 2006
C-C-C 205 314 339
C-C-P 90 120 214
P-P-P 5 19 18
P-P-C 10 38 69
Total 310 491 640
In the turmoil and uncertainty that follows the tragic events of the early 2000s, all field
members become increasingly embedded into the network. Yet, it is the dramatic upsurge in the
amalgamation of core and peripheral players that stands out most vividly in these cohesive
dynamics. Indeed, closed blended triads involving both core and peripheral members exhibit by far
the strongest increases in the post jolt period, with C-C-P triads growing two and half times and P-

45
P-C triads showing the sharpest increase, with a sevenfold jump. Cohesion within the core remains
dominant throughout the period, with C-C-C triads accounting for well over 50% of the total
triangles in the in the network. But at the same time core members become more involved with
peripheral players, using their gravitational pull to draw peripheral players closer and embed them
into core interconnections. The core, in other words, grows more cohesive, but not at the expenses
of the periphery. Instead, this growth appears to be the result of a well-connected yet increasingly
permeable core. As more organizations are entwined in the core, the logic of attachment shifts.
View publication statsView publication statsView publication statsView publication stats