
Understanding Emergent Behaviour within the Economic ...
60
Prepared for the National Infrastructure Commission 27 th March 2020 Dr Neil Carhart Dr Maria Pregnolato Dr Ges Rosenberg Understanding Emergent Behaviour within the Economic Infrastructure System-of-Systems
-
Upload
khangminh22 -
Category
Documents
-
view
1 -
download
0
Transcript of Understanding Emergent Behaviour within the Economic ...
Prepared for the National Infrastructure Commission
27th March 2020
Dr Neil Carhart
Dr Maria Pregnolato
Dr Ges Rosenberg
Understanding Emergent Behaviour
within the Economic Infrastructure
System-of-Systems
1
Understanding Emergent Behaviour
within the Infrastructure
System-of-Systems
Prepared for the National Infrastructure Commission
27th March 2020
This report was produced to inform the National Infrastructure Commission’s study on resilience.
The views expressed and recommendations set out in this report are the authors’ own and do
not necessarily reflect the position of the National Infrastructure Commission.
Acknowledgements
We are indebted to Professors Dick Taylor and Graeme Collinson for providing valuable comments on
an earlier draft. Thanks also to Chris Elliot, Tim Chapman and Prof Nilay Shah for suggestions and
recommendations during the initial stages of the project. This report synthesizes a number of existing
sources, and while their authors have had no direct input, we are nevertheless grateful for their prior
work in this area.

3
EXECUTIVE SUMMARY
The UK’s economic infrastructure can be viewed as a complex system-of-systems exhibiting emergent
phenomena and behaviours. It is a system-of-systems in the sense that it is comprised of interacting
constituent systems, operated largely independently of one another, concerning areas such as energy,
transport, water and communications. The interactions between these constituent systems, and
between the constituent systems and the whole system-of-systems, give rise to behaviours and
characteristics that are not present in any of the individual constituents themselves. Such emergent
phenomena include beneficial characteristics such as integrated transport, sustainability and
resilience, but also unwanted emergent failures, i.e. unexpected disruptive events at the global level
that arise from complex interactions involving local level constituent parts.
This review explores the nature of emergence in the context of the national economic infrastructure
system-of-systems. It identifies and describes eight real examples of economic infrastructure
experiencing significant failure events that can be described as emergent or arising at least in part
from emergent behaviour.
The second part summarises why current methods of understanding failure events - and engineering
resilience into such complex system-of-systems - are flawed at dealing with the traits of emergence.
Three approaches are identified that have the potential to complement existing tools by addressing
these flaws, helping organisations understand emergent behaviours and undertake associated policy
analysis. These approaches are briefly described along with examples of their application. Each
method is assessed in terms of its usability and ability to depict complex system-of-systems.
Infrastructure as a System-of-Systems A system is a set of parts interacting in such a way that it possesses emergent qualities not present in any
of the parts themselves [1]. A system’s component parts tend to exist explicitly or implicitly in the
service of the overall system and its objectives. A system-of-systems exists at a higher level where the
systems are themselves components in the service of higher-level outcomes. It is argued that this is
different from scaling up the concept of the system, as each component/constituent system is also
autonomously controlled in the service of its own local objectives which may not always be optimal for
achieving the higher-level outcomes. For various political and economic reasons the economic
infrastructure system-of-systems is comprised of many such tightly coupled autonomous networks, each
containing agents with their own individual goals [2]. This can impact the resilience of the system-of-
systems through mechanisms such as ‘tragedy of the commons’ style problems with agents competing
for common pool resources [3] or decisions made within one constituent system with limited
information regarding the potential state of the other constituent systems [4]. Ensuring the
sustainability of higher-level outcomes in the face of such fragmentation can be challenging [5].
Emergence The phenomena that emerge at the system-of-system level must be coherent and meaningful at that
level, discrete and sufficiently different from anything that exists at the constituent system levels.
Therefore, an emergent failure from the system-of-systems perspective is not the failure of a
component asset within a constituent system (e.g. the failure of an ATM or water treatment facility)
4
even if that failure is the consequences of a complex chain of cause and effect through various other
systems. Such failures would always ‘belong’ to the system to which the asset belongs.
Outcomes or services facilitated by the interactions between lower-level constituent systems emerge
as discrete entities at the system-of-systems level. These include things like heating a home,
connecting with family or selling a cup of coffee. Such things are not meaningful in the context of
isolated constituent systems. These outcomes/services are examples of nominal or simple
emergence. They are entirely deducible and predictable from the lower levels. From a practical
standpoint, it may be unnecessarily confusing or distracting to refer to these outcomes/services as
emergent at all. However, the failure of these system-of-systems outcomes may concern other forms
of emergence, ones that are not foreseeable or deducible.
It is said that emergent failures of this nature are commonly exhibited by the infrastructure system-
of-systems in particular, where it is counterintuitive to anticipate such global conditions from local
actions [6] [7].
It is useful to consider different types of emergence [8]. The aforementioned nominal, simple or weak
emergence involves traditional bottom-up feedforward processes from the local to the global.
Components always have the same behaviours irrespective of the behaviour of other parts, the wider
environment or the global whole. Strong Moderated Emergence concerns situations where top-down
feedback processes from the global to the local impose constraining or reinforcing influences on the
parts. As the global system influences the behaviour of the constituent systems, the global behaviour
cannot be deduced by studying the constituents in isolation. Strong Multiple Emergence represents
top-down feedback processes from the global to the local that impose both constraining and
reinforcing influences on the parts. This can result in a mixture of stability and chaos over different
timescales.
Emergence presents numerous challenges as the combinations of local and global factors cause global
changes that are non-obvious (i.e. requiring certain knowledge and insight), unexpected (i.e. a known
possibility with an underestimated probability), unanticipated (i.e. an unknown or unrecognised
possibility) or counterintuitive (i.e. goes against current understanding). These could refer to the
overall event or the disproportionate scale of its impacts [6]. In such a case, of course emergence
must be defined in relation to a specific observer. What is non-obvious or unexpected to some, might
be expected to others. This might relate to their knowledge or the tools available to them. Some
argue that a scientific phenomenon cannot be dependent on the subjective knowledge or ignorance
of the observer, leading to the suggestion of novelty as a key feature of emergence [9]. In its strongest
form though emergence undermines the efficacy of anticipation as the sole means of reducing the
risks of unwanted events. It suggests some events are inherently unpredictable regardless of
knowledge of the constituent parts or the rules that govern their behaviours.
Generic observed emergent misbehaviours [10] include ‘Unwanted Synchronisation’ where normally
uncorrelated constituent systems become correlated through global level influences, ‘Unwanted
Oscillation’ where feedback loops within the system-of-systems cause constituent systems to
fluctuate between states, ‘Deadlock’ where circular dependencies arise between constituent systems,
and ‘Livelock’ where constituent systems constantly change in reaction to one another but cannot find
a compatible stable state.

5
Emergent Failure Events within the Economic Infrastructure System of
Systems The following events have been chosen as they exhibit, in part or in whole, aspects of emergent
system-of-systems failures within the infrastructure sector.
• Howard Street Tunnel Fire, USA, 2001
• New York Power Cut, USA, 2003
• Buncefield Explosion, UK, 2005
• Gloucester Floods, UK, 2007
• Superstorm Sandy, USA, 2012
• Storm Desmond, UK, 2015
• Low Frequency Demand Disruption, UK, 2019
• Victoria & London Bridge Disruption, UK, 2019
For example, the Buncefield Explosion led to unwanted synchronization as an emergent misbehaviour
in the form of panic buying at petrol stations by diverse agents. Misunderstanding/miscommunication
at the global level from fuel shortages at Heathrow invoked a large group of people to collectively
purchase petrol at the same time risking problems in private fuel supply, and as seen in other similar
events, potentially jeopardising recovery and emergency services.
During Super Storm Sandy it was noted that the power outages hampered the ability to remove flood
waters and resultant fuel shortages affected emergency response vehicles and the ability to recover
the power supplies [11]. It is in these interdependency pathways from the local component level to
the global system-of-systems and back down to the local components that situations could be said to
exhibit Strong Multiple Emergence.
The 2019 ‘Victoria and London Bridge Disruption’ exhibited a form of moderated emergent
misbehaviour that sits somewhere between deadlock and livelock when backup systems did not
engage. The system behaved as designed but the signals from the global level were not sufficient to
initiate the necessary corrective actions among the constituent systems. The event cannot be traced
to the failure of a single individual system. No components failed in terms of their own local rules or
otherwise operated differently from their designed intentions. Indeed, the very fact that the power
system itself did not critically fail is key factor in the event’s occurrence.
In events such as Super Storm Sandy or Strom Desmond, Constituent systems can be seen to oscillate
between states in reaction to global level events, they adapt through internal process into globally
incompatible states, they compete for limited global level resources and exhibit other emergent
misbehaviours. The initiating event and its consequences may be unpredictable, but it may be
possible to engineer a system such that the response and recovery reduces the occurrence of such
behaviours.
Potential Tools Most traditional methods for conceptualising failures and designing resilience reduce system-of-
systems to their discrete constituent systems. They are largely based on sequential chains of causality,
tend to ignore feedback between constituent systems and between the constituent systems and the
overall performance of the system-of-systems, focus on the local level within a constituent system
and aim to produce prescriptive interventions. Approaches grounded in Systems Theory have been
proposed to address these shortfalls and as such help diagnose and manage emergence. Chapter 3
looks at three prominent approaches:

6
• AcciMapping – a visualisation of information and decisions as they are communicated up and
down hierarchies of control between the local level parts of the constituent systems and the
overall governance of the system-of-systems
• Functional Resonance Accident Model (FRAM) – a tool for modelling the combinations of
performance variability across the functions from which the system-of-systems is comprised
• System Theoretic Accident Model and Process (STAMP) – a process for identifying inadequate
enforcement of constraints, inadequate control and inadequate feedback mechanisms by
modelling the hierarchical control structure and interactions within the system.
They assume that, given the complexity of the systems of interest, it is simply not practical, safe or
efficient to operate under the assumption that with enough effort every eventuality could be
predicted; hence alternative methods are required to manage them and limit their consequences at a
more fundamental, systemic level. They have been developed in the context of accident analysis, but
are increasingly seeing use in proactively engineering hazard agnostic resilience into complex systems.
While they can be relatively flexible in their application, they lack guidance on how they should be
applied and have varying levels of application in practice.
7
CONTENTS
Executive Summary ................................................................................................................................. 1
Contents .................................................................................................................................................. 7
1 Introduction ................................................................................................................................... 8
1.1 Systems & Systems-of-Systems .............................................................................................. 8
1.2 Emergence ............................................................................................................................ 10
1.3 Emergent System Failure ...................................................................................................... 14
1.4 What are the characteristics or features of emergent phenomena/events? ....................... 17
2 Case Studies ................................................................................................................................. 21
Howard Street Tunnel Fire, USA ....................................................................................................... 26
Northeast Blackout, USA .................................................................................................................. 28
Buncefield Explosion, UK .................................................................................................................. 30
Gloucestershire Floods, UK ............................................................................................................... 32
Superstorm Sandy, USA .................................................................................................................... 33
Storm Desmond, UK ......................................................................................................................... 35
Low Frequency Demand Disruption, UK ........................................................................................... 37
Victoria & London Bridge Disruption, UK ......................................................................................... 39
3 System Modelling Maturity .......................................................................................................... 40
3.1 Issues with traditional approaches ....................................................................................... 41
3.2 Metrics for the appraisal of the tools maturity .................................................................... 43
3.2.1 Evaluation of Systems Approach ................................................................................... 43
3.2.2 Evaluation of Usability .................................................................................................. 43
3.3 Systems Modelling and Policy Analysis Approaches ............................................................. 44
3.3.1 AcciMapping.................................................................................................................. 44
3.3.2 Functional Resonance Accident Model (FRAM) ............................................................ 46
3.3.3 System-Theoretic Accident Model and Process (STAMP) ............................................. 49
4 References .................................................................................................................................... 54
8
1 INTRODUCTION
This report was prepared by a team at the University of Bristol for the National Infrastructure
Commission. It investigates the understanding of emergent behaviour within the economic
infrastructure system-of-systems.
There is a large amount of academic literature exploring the theory of emergent failures at the system
and system-of-systems scale. There is an equally significant body of work demonstrating such failures
using hypothetical quantified models of infrastructure networks. There are however relatively few
sources identifying and describing specific infrastructure related case studies explicitly as emergent
system or system-of-systems failures. It is perhaps unsurprising that many of methods advocated for
dealing with emergent failures have seen little use in industrial practice.
There is value in understanding the maturity of the approaches that have been positioned to model
and analyse such events as well as their practical usability. As such, this project has two aims:
• Identify and describe case studies of emergent failures within economic infrastructure
systems.
• Identify and assess the maturity of systems modelling and policy analysis approaches to
understand and manage such failures.
Eight case studies have been chosen from a longlist of sixteen. . The details of each case study are
summarised in Chapter 2 of this report, with an explanation of why they can be considered examples
of emergent system-of-systems failures.
While it is possible to conceptualise some individual economic infrastructure assets (e.g. nuclear
power stations) and entire economic infrastructure sectors (e.g. the rail transport sector) as complex
systems in their own right, the focus of this report will be on failures emerging at the system-of-
systems level. In other word it will primarily concern emergent system failures that cross sectoral
boundaries. In exploring such events it will not be limited to technical issues and will also consider
the organisational, cultural, political and economic factors.
Chapter 3 of this report then looks at the maturity of potential system modelling and policy analysis
approaches that may offer the means to better address such emergent events.
1.1 SYSTEMS & SYSTEMS-OF-SYSTEMS Von Bertalanffy [12] described the rise of the systems paradigm as a reaction to problems which are
not well suited to the classic analytical approach (p18). He outlined how the analytical approach is
based on two conditions; firstly, that the “interactions between “parts” be non-existent or weak
enough to be neglected” and secondly, that “the relations describing the behaviour of the parts be
linear” so that the actions can be summed. Working with these assumptions the classical process of
analysis can be described as having three stages [13,14]:
1) The problem is taken apart into simpler problems 2) Those are studied in isolation to find out how they work 3) These are reassembled in order to gain understanding about the whole.
This process of reductionism follows from Descartes’ discourse on the method of enquiry, but can be
seen as deficient by those who believe the Aristotelian view that the whole can be greater than the
sum of its parts. When dealing with situations or technologies where there are important interactions
between each of the constituent parts, and between the parts and their operational context then a
9
fundamental assumption of the analytical approach is undermined. Where those relationships give
rise to characteristics or behaviours not seen in any of the parts individually, or predictably from their
accumulation, then a different approach is required.
These sorts of technologies can be referred to as Systems. As the Royal Academy of Engineering
explains: “A system is a set of parts which, when combined, have qualities that are not present in any
of the parts themselves. Those qualities are the emergent properties of the system” [1]. ISO/IEC/IEEE
15288 defines a system as a “combination of interacting elements organized to achieve one or more
stated purposes”. The parts (components or sub-systems) interact with each other and the environment
in complex ways.
Systems Theory holds that in some systems there are characteristics, behaviours and problems that
can be seen at the whole system level that are not present in any of the individual components.
These are often referred to as emergent properties [15–19]. That is not to say there is no explanation
for their existence. However, in some cases they cannot be practicably determined or predicted from
the study of the components in isolation from one another or when taken out of the context of the
system as a whole [14,19–21]. These ideas are further explored in the following sub-section.
Almost any complex modern technological artefact from automobiles and aircraft to mobile phones
and microprocessors can be considered at the scale of their operation to have valued properties that
emerge from the interaction of more fundamental components.
The emergent properties and behaviours are often of value, but it also follows that things that are not
valued - such as hazards, failures and sub-optimal performance - can emerge [22,23]. This gained wide
acceptance when those working in the field published Resilience Engineering: Concepts and Precepts [24],
suggesting that resilience is an emergent property of a system.
The concept of a component being safe or reliable has little meaning out of the specific context within
which it normally sits. A component may be safe in isolation or in a certain system, but unsafe in another
[25], therefore it must be considered in terms of its interactions and purpose. Furthermore, it can be shown
that significant failures can result at the system level from the unexpected combination of the normal, safe
and reliable actions of its components [26,27].
A system-of-systems exists at a higher level where the systems are themselves now components in the
service of higher-level outcomes. It is argued that this is different from scaling up the concept of the
system, as each component/constituent system is now autonomously controlled in the service of its own
local objectives. Indeed, for various political and economic reasons the economic infrastructure system-
of-systems is comprised of “a large number of tightly coupled networks in which there is a multitude of
agents with differing goals” [2]. This can impact resilience of the system-of-systems though ‘tragedy
of the commons’ style problems with common pool resources [3] and “blind spots” or limited
information within one system about the potential state of other systems [4]. A report by the
Institution of Civil Engineers noted that “maintaining an enduring, coherent, system-wide, whole-life
asset-centric risk-management approach is difficult in a fragmented world informed by specialists who
inevitably may not see the integrated picture.” [5].
What does it really mean, at a practical level, to say something emerges at the level of the system-of-
systems? As will be discussed further in the following sub-section, the thing that emerges has to be
coherent and meaningful at this level in its own right, discrete and sufficiently different from anything
that exists at the lower constituent system levels. Mair [28] identifies emergence as a key
characteristic of complex systems-of-systems defining it as where “The system performs functions and
carries out purposes that do not reside in any component system. These behaviors are emergent
10
properties of the entire system-of-systems and cannot be localized to any component system. The
purposes of the systems-of-systems are fulfilled by these behaviors.” Therefore, an emergent failure
can never be the failure of a component asset within a system (e.g. the failure of an ATM or water
treatment facility) even if that failure is the consequences of a complex chain or network through
various other systems and components. Such failures would still always ‘belong’ to the system the
asset belongs to. It isn’t separate or distinct from the lower system - it doesn’t only have meaning at
the system-of-systems level – in the way that a resultant inability to heat a home or conduct a business
might.
The only thing that exists as something discrete at the system-of-systems level are the outcomes or
services that are the product of interactions between multiple lower level systems. These include
things like connecting with family or selling a cup of coffee. Those who specialise in the study of
emergence, discussed below, may refer to these outcomes/services as examples of nominal or simple
emergence. They are entirely deducible and predictable from the lower levels. In fact, the lower levels
are purposefully engineered to produce these outcomes. This is true of many assets that are in part
designed through Systems Engineering, from aeroplanes to mobile phones. In this respect, from a
practical standpoint, it may be unnecessarily confusing or distracting to refer to these
outcomes/services as emergent at all. They are certainly distinct from the types of emergent
properties of interest here. However, the failure of system-of-systems outcomes may be a higher
form of emergence, one not foreseeable or deducible. When those outcomes fail to manifest at the
system-of-systems level through the usual means, they place pressures on alternate ways to facilitate
them, if such ways exist. If, in a crisis, it Is not possible to contact someone by telephone or email,
then it might be necessary to contact them in person, using physical transport. This puts pressure on
road assets, fuel assets and all the other elements of infrastructure that facilitate mobility (something
that only exists at the system-of-systems level). Thus, the failure of an outcome at the system-of-
systems level puts pressure back down onto components that are otherwise distinct from the things
that have been disrupted. As this can involve high degrees of adaptation it might be difficult to foresee
such actions. Something which under normal circumstances might be formed from the bottom-up is
suddenly shaped by influences from the top down. In such scenarios the behaviour of lower level
systems cannot be ascertained by looking at the lower levels alone.
It all comes back to purpose, outcomes and needs. What do people need? What outcomes do they
value? What purposes are bestowed by them on the economic infrastructure services that facilitate
the fulfilment of these needs? Emergence in the context of the economic infrastructure system-of-
systems is hard to visualise when not thinking in terms of outcomes or services. If infrastructure is
only observed in terms of its physical assets, then the things that fail will always be things that
ultimately happen within a sector. With this in mind, the following sub-section explores the meaning
of emergence in more detail.
1.2 EMERGENCE It has been established in defining a system that the combination of the component parts produces
new qualities which can be said to emerge from their interaction. Lewes [29], as noted by Goldstein
[30], coined the term in its largely current usage over 100 years ago when he wrote:
“although each effect is the resultant of its components, we cannot always trace the steps
of the process, so as to see in the product the mode of operation of each factor. In the
latter case, I propose to call the effect an emergent. It arises out of the combined
agencies, but in a form which does not display the agents in action”

11
An alternative, but essentially similar explanation was offered by Ashby [31]: “When the knowledge
of the parts is so complete, the prediction [of how the whole will behave] can also be complete, and
no extra property can emerge. Often, however, the knowledge is not, for whatever reason, complete
. . . and a new property can, if we please, be said to "emerge". Ashby’s definition introduces the notion
of imperfect knowledge.
Dueñas-Osorio [6] and Kroger & Zio [7] have identified emergence as being commonly exhibited by
the infrastructure system-of-systems with the later positing a further explanation of emergence in
the context of critical infrastructure vulnerability:
“The local interaction of a plethora of system components often results in global
behaviour, which is difficult or even counterintuitive to anticipate. In general, such
hard-to-predict collective phenomena are referred to as “emergent behaviour”.”
The concept can be refined through the spectrum of strong to weak emergence [32]. Strong
Emergence refers to properties or behaviours that are not possible to predict (“even in principle” [32])
from studying the component parts. No amount of investigating or modelling those components will
allow you to predict all the behaviours that could emerge. The high-level behaviours can be described
as weakly emergent if they are merely unexpected given the behaviours of the components.
Chalmers [32] believed that consciousness was the only clear case of strong emergence. All other
types of emergence could be argued to be a product of the observer [33]. Things that may have been
considered unpredictable 20 years ago may, with modern sensors and computational capability, now
be predictable. Therefore, under this definition, behaviours described as emergent, that seemed
uneducable even in principle, 20 years ago, may now be predictable.
But the question that arises is, does this distinction matter? If even so called “Weak Emergence” is
unexpected, some may be so complicated to predict as to be effectively unpredictable from a study
of lower level components, behaviours and phenomena given current and foreseeable information,
knowledge and computation capabilities. If knowledge was complete then we could predict all
behaviours and nothing could be said to be emergent, but knowledge is rarely (arguably never)
complete and so new unexpected properties do emerge [31].
It may also be useful to recognise two different types of uncertainty: Epistemically and Aleatory
uncertainty. Epistemology is the study of knowledge, epistemically uncertainty exists because of a
lack of knowledge. Research can collate and uncover relevant knowledge and therefore reduce
epistemic uncertainty. Aleatory uncertainty refers to a fundamental randomness or chaotic
behaviour. We may be able to make predictions with confidence bounds, but the aleatory uncertainty
is essentially irreducible.
Chalmers continues: “we might suggest that weakly emergent properties are interesting, non-obvious
consequences of low-level properties.” It is easier to consider them at the level they are observed
than to understand how the levels below create them. Even if we park Strong Emergence, there may
still be a scale of Weak Emergence based on the effectiveness and efficacy with which we can predict
Weak Emergence. Properties that are in principle predictable, but in practice are not.
Bedau [34] argues that while Weak Emergence is observable and can be simulated, it is not deducible
from a reductionist approach. Indeed, while each component, sub-system or agent may be
deterministic, their interactions can still give rise to essentially emergent, unexpected behaviours.
Moreover, none of these discussions of emergence consider the idea that the operational context and
wider environment may play an important role in the behaviour of the system, and this equally makes
analysis by reduction to the components unhelpful in understanding the systems overall behaviour.
12
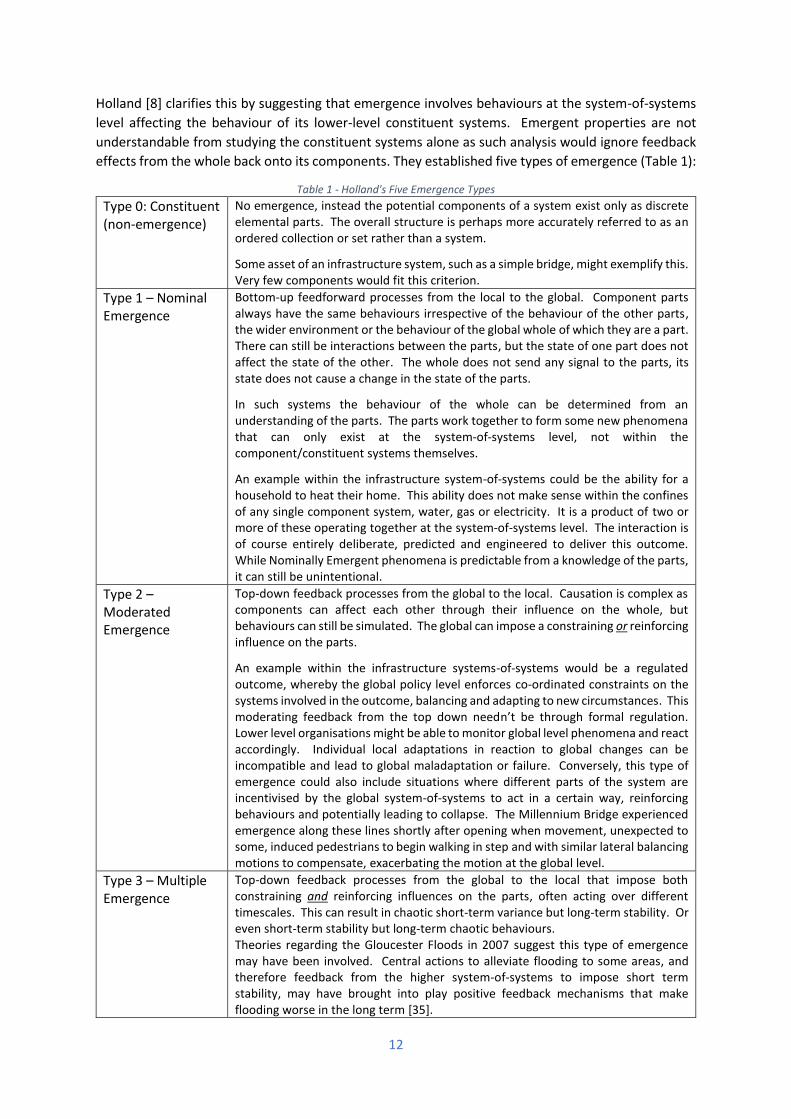
Holland [8] clarifies this by suggesting that emergence involves behaviours at the system-of-systems
level affecting the behaviour of its lower-level constituent systems. Emergent properties are not
understandable from studying the constituent systems alone as such analysis would ignore feedback
effects from the whole back onto its components. They established five types of emergence (Table 1):
Table 1 - Holland's Five Emergence Types
Type 0: Constituent (non-emergence)
No emergence, instead the potential components of a system exist only as discrete elemental parts. The overall structure is perhaps more accurately referred to as an ordered collection or set rather than a system.
Some asset of an infrastructure system, such as a simple bridge, might exemplify this. Very few components would fit this criterion.
Type 1 – Nominal Emergence
Bottom-up feedforward processes from the local to the global. Component parts always have the same behaviours irrespective of the behaviour of the other parts, the wider environment or the behaviour of the global whole of which they are a part. There can still be interactions between the parts, but the state of one part does not affect the state of the other. The whole does not send any signal to the parts, its state does not cause a change in the state of the parts.
In such systems the behaviour of the whole can be determined from an understanding of the parts. The parts work together to form some new phenomena that can only exist at the system-of-systems level, not within the component/constituent systems themselves.
An example within the infrastructure system-of-systems could be the ability for a household to heat their home. This ability does not make sense within the confines of any single component system, water, gas or electricity. It is a product of two or more of these operating together at the system-of-systems level. The interaction is of course entirely deliberate, predicted and engineered to deliver this outcome. While Nominally Emergent phenomena is predictable from a knowledge of the parts, it can still be unintentional.
Type 2 – Moderated Emergence
Top-down feedback processes from the global to the local. Causation is complex as components can affect each other through their influence on the whole, but behaviours can still be simulated. The global can impose a constraining or reinforcing influence on the parts.
An example within the infrastructure systems-of-systems would be a regulated outcome, whereby the global policy level enforces co-ordinated constraints on the systems involved in the outcome, balancing and adapting to new circumstances. This moderating feedback from the top down needn’t be through formal regulation. Lower level organisations might be able to monitor global level phenomena and react accordingly. Individual local adaptations in reaction to global changes can be incompatible and lead to global maladaptation or failure. Conversely, this type of emergence could also include situations where different parts of the system are incentivised by the global system-of-systems to act in a certain way, reinforcing behaviours and potentially leading to collapse. The Millennium Bridge experienced emergence along these lines shortly after opening when movement, unexpected to some, induced pedestrians to begin walking in step and with similar lateral balancing motions to compensate, exacerbating the motion at the global level.
Type 3 – Multiple Emergence
Top-down feedback processes from the global to the local that impose both constraining and reinforcing influences on the parts, often acting over different timescales. This can result in chaotic short-term variance but long-term stability. Or even short-term stability but long-term chaotic behaviours. Theories regarding the Gloucester Floods in 2007 suggest this type of emergence may have been involved. Central actions to alleviate flooding to some areas, and therefore feedback from the higher system-of-systems to impose short term stability, may have brought into play positive feedback mechanisms that make flooding worse in the long term [35].
13
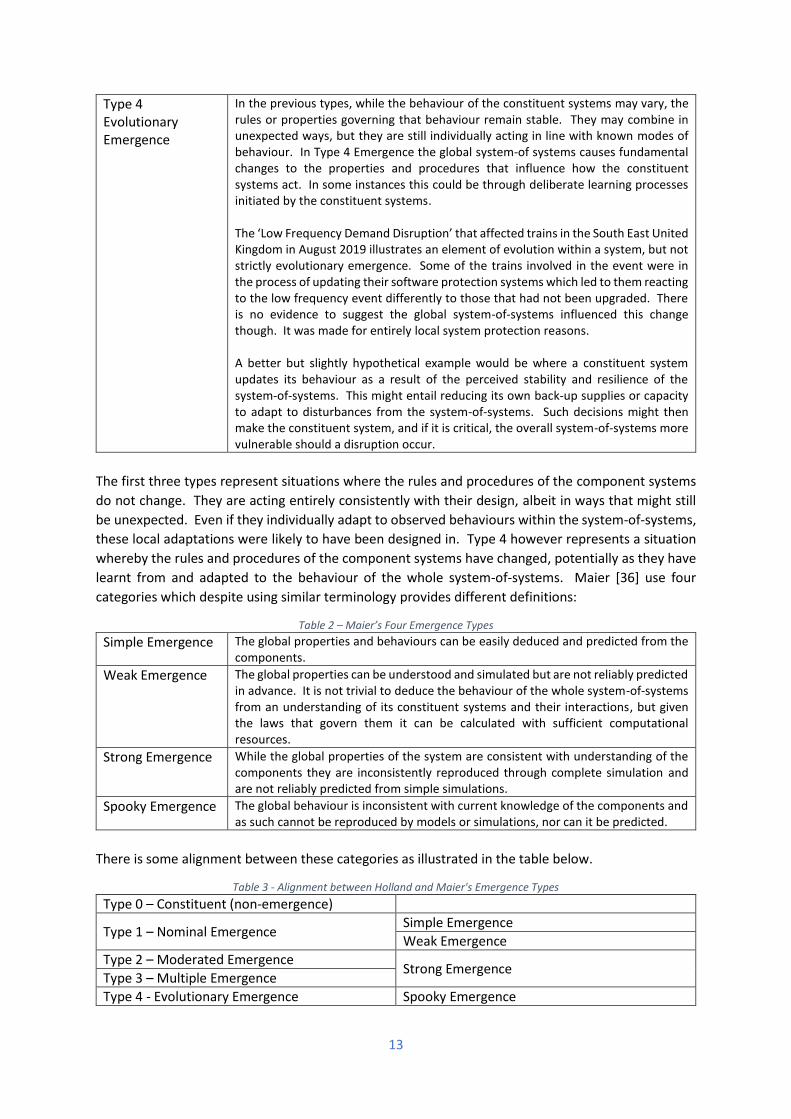
Type 4 Evolutionary Emergence
In the previous types, while the behaviour of the constituent systems may vary, the rules or properties governing that behaviour remain stable. They may combine in unexpected ways, but they are still individually acting in line with known modes of behaviour. In Type 4 Emergence the global system-of systems causes fundamental changes to the properties and procedures that influence how the constituent systems act. In some instances this could be through deliberate learning processes initiated by the constituent systems. The ‘Low Frequency Demand Disruption’ that affected trains in the South East United Kingdom in August 2019 illustrates an element of evolution within a system, but not strictly evolutionary emergence. Some of the trains involved in the event were in the process of updating their software protection systems which led to them reacting to the low frequency event differently to those that had not been upgraded. There is no evidence to suggest the global system-of-systems influenced this change though. It was made for entirely local system protection reasons. A better but slightly hypothetical example would be where a constituent system updates its behaviour as a result of the perceived stability and resilience of the system-of-systems. This might entail reducing its own back-up supplies or capacity to adapt to disturbances from the system-of-systems. Such decisions might then make the constituent system, and if it is critical, the overall system-of-systems more vulnerable should a disruption occur.
The first three types represent situations where the rules and procedures of the component systems
do not change. They are acting entirely consistently with their design, albeit in ways that might still
be unexpected. Even if they individually adapt to observed behaviours within the system-of-systems,
these local adaptations were likely to have been designed in. Type 4 however represents a situation
whereby the rules and procedures of the component systems have changed, potentially as they have
learnt from and adapted to the behaviour of the whole system-of-systems. Maier [36] use four
categories which despite using similar terminology provides different definitions:
Table 2 – Maier’s Four Emergence Types
Simple Emergence The global properties and behaviours can be easily deduced and predicted from the components.
Weak Emergence The global properties can be understood and simulated but are not reliably predicted in advance. It is not trivial to deduce the behaviour of the whole system-of-systems from an understanding of its constituent systems and their interactions, but given the laws that govern them it can be calculated with sufficient computational resources.
Strong Emergence While the global properties of the system are consistent with understanding of the components they are inconsistently reproduced through complete simulation and are not reliably predicted from simple simulations.
Spooky Emergence The global behaviour is inconsistent with current knowledge of the components and as such cannot be reproduced by models or simulations, nor can it be predicted.
There is some alignment between these categories as illustrated in the table below.
Table 3 - Alignment between Holland and Maier's Emergence Types
Type 0 – Constituent (non-emergence)
Type 1 – Nominal Emergence Simple Emergence
Weak Emergence
Type 2 – Moderated Emergence Strong Emergence
Type 3 – Multiple Emergence
Type 4 - Evolutionary Emergence Spooky Emergence
14
1.3 EMERGENT SYSTEM FAILURE An emergent system-of-systems failure may refer to a number of different things. It has been described
as “A way in which a failure can occur that cannot be traced to a single individual system” [37], but it
could also include instances where the state of individual systems combine in unexpected ways to
create a failure at the system-of-systems layer. This failure may be unexpected because the
combination was not (or could not be) anticipated or unexpected in the sense that is
disproportionately large (i.e. non-linear) compared to the disruption experienced at the component
system layer [38].
At its most extreme, emergent system-of-systems failure might occur as a result of unexpected
combinations of component system states that are otherwise considered normal [39]. In this sense
the component systems may not have experienced failure or even degraded performance. It is
conceivable that a component system considered locally to have been improved creates impacts in,
or incompatibilities with, other component systems that bring about failure of the system-of-systems.
Such behaviour that is locally adaptive but globally maladaptive is a form of the aforementioned
‘tragedy of the commons’ archetypal failure mode [40]. Incentives to optimise local performance may
result in actions that are globally sub-optimal. Along similar lines, a component within a system might
be purposefully sacrificed in order to adapt the system such that it survives a local disturbance without
realising that the component is critical to the functioning of a totally different system, ultimately
resulting in the failure of the entire system-of-systems. This exemplifies a specific type of the ‘fixes
that fail’ archetypal failure mode whereby an effort to improve performance ultimately makes things
worse [41]. This could also be linked to Simon’s notion of Bounded Rationality [42,43] described by
Donella Meadows as when “people make quite reasonable decisions based on the information they
have. But they don't have perfect information, especially about more distant parts of the system.”[44].
In a complex system-of-systems one component may not know what data requirements the others
have; they may not know what information they should be sharing and may not have the expertise to
ask the right questions to find out. Levels of trust may be too low between those tasked with operating
different parts of the system-of-system to share information effectively or build the relationships to
find out what information is required.
Interactions within the system, or between the system and its environment, might cause it to drift
into a vulnerable state such that it is susceptible to a small disturbance or perhaps otherwise normal
event. Significant triggering events, like natural disasters or terrorist attacks, reveal previously hidden
vulnerabilities in the system-of-systems. These take the form of relationships between systems that
are unnoticed or under-considered. Only a holistic systems approach to consider the system-of-
systems would allow for these to be identified in advance and treated with appropriate care.
Smaller scale triggering events, like component failure or human error, can reveal previously hidden
relationships, but they can also reveal inherent vulnerabilities in the broader system that allowed
them to take place, or allowed them to have the impacts they did.
It can be difficult to identify or perceive documented incidents as examples of emergent failures for
two reasons:
• Post-hoc rationalisation and the need to extract a communicable linear narrative from which
to learn renders something that was unexpected as if it were simple and easily predictable;
• Current methods for investigating failure have a tendency to promote the identification of
triggering events and root causes at the expense of more complex underlying mechanisms of
complexity.
15
Current methods for understanding and managing such events concentrate on local variations and
proximate triggers without looking at how the system evolved into a vulnerable state. They ignore
multiple factors in favour of a simple chain of cause and effect. They search for a root cause rather
than complex pattern of behaviours.
Dekker [45] reflects on the Newtonian-Cartesian mode of thinking that pushes the “search for the
broken component”. It can distract from understanding why the component broke. What were the
conditions that allowed it to break? What allowed those conditions to develop? Dekker argues that
reductionist analysis, enquiring ever more narrowly, fails to answer these questions which instead
require a broader view outwards. He writes: “We have to begin to probe the hugely intertwined webs
of relationships that spring out and away from the broken part, into the organizational, the
institutional, the social. Yet often our quest to understand why parts are broken simply leads us to
other broken parts. The decompositional logic is almost everywhere.”
Graham [46] observed that “The political nature of infrastructure disruption is often rendered invisible
by media discussions of such events as mere “technical” malfunctions or environmental “Acts of God.”
The notion that urban natures are actually produced through the long-term agency of political
infrastructural assemblages renders such perspectives unhelpful, however. Such understandings
hammer home the key point that, in infrastructurally mediated natures, there is no such thing as a
natural disaster.”
While it may be possible to rationalise post-hoc and explain the mechanisms of causality, the fact that
they occurred, and occurred at the scale they did was precisely because we did not fully understand
the interdependencies in advance. In this sense the resulting impacts were unexpected and emergent.
The complexity and fragmented control of the economic infrastructure system-of-systems means that
it is, in any practical sense, not possible to predict in advance what all the potential consequences of
an action taken within a component system might be. If, as strong/spooky emergence implies, some
global level phenomena might not be determinable from an understanding of the parts, then it
suggests anticipation alone is not a sufficient means to deal with such events. Efforts to predict and
anticipate will valuably reduce epistemic uncertain arising from lack of knowledge, but it can only go
part way to reducing aleatoric uncertainty associated with randomness. It may be the case that some
residual uncertainty will always exist regardless of the resources expended on building ever more
complex predictive models. At some point those resources may be better spent on that system-of-
systems to improve resilience capabilities to unexpected events.
Hollnagel describes the situation in terms of two paradigms, Safety-I and Safety-II [47]. The Safety-I
paradigm assumes accidents or other unwanted outcomes occur when things fail. Safety is the
absence of failure. The process of making the system safe or reliable is one of ensuring components
(be they human, procedural or technical) do not fail. Under this paradigm functioning components
necessarily lead to success, and malfunctioning components necessarily lead to failure. Post-hoc
explanations of unwanted events are described in terms of component failure. This paradigm assumes
the system can be decomposed into components and the interactions between them be negligible
enough that they can be considered in isolation. It can lead to a view that variability is undesirable
and should be limited. Safety-II on the other hand believes a system’s reliability is related to its ability
to adapt and cope with variation. It is the everyday variation of components in the face of an ever-
changing context that enable it to persist. It is this same everyday variation of components that in a
specific context can enable failure. Humans are often left ‘in the loop’ as it is not yet possible to design
an automated controller with sufficient capacity to adapt to unexpected events. Hollnagel was
16
developing Weick’s idea that reliability is a dynamic non-event or “an ongoing condition in which
problems are momentarily under control due to compensating changes in components” [48].
If a system-of-systems failure event involves the energy grid, it may be possible after the fact to
identify a component within it (human or technical) that had varied from its usual state. Safety-I may
see this as a malfunction, a contributary cause to the failure event and something to be eliminated in
the future. Safety-II might postulate how many times under normal operation of the grid the
component makes that exact same adaptation in the process of successfully maintaining performance.
Such successes pass without note and hence at a system-of-systems level there is no awareness of the
component variation. There is no way of knowing how many times a day drivers break the speed limit
or jump a red light in order to avoid an accident.
A Safety-I mindset will lead to actions which reduce variability and adaptation among system
components as this is seen as the cause of failure. Should unanticipated events occur it is the capacity
to adapt that can save the system from failure; a capacity that may have been eroded through the
Safety-I actions. As has been discussed, there may be a limit to the degree to which emergent failures
can be predicted.
Under a System II paradigm system-of-systems failures do not necessarily require failure or even
malfunction at the local constituent system level. The ‘Victoria and London Bridge Disruption’ within
the rail sector in December 2019 profiled in the following Chapter exhibits elements of this. The
energy supply did not fail, though the voltage did fluctuate (whether this was outside of agreed levels
has yet to be determined). This caused protection systems within rail signals to disconnect them to
prevent damage. Under normal circumstances this adaptation would be beneficial and celebrated,
however, the backup power systems did not initiate as power had not been lost. While it might be
possible to suggest that the back-up power systems ‘failed’ they were acting in accordance with their
own procedures, and again under other circumstances this configuration may be welcomed.
Safety-I and Safety-II are not in competition. There is no correct view. As with the Systems Approach
and Reductionism or the Newtonian View and General Relativity they both provide useful insights but
are applicable in different contexts. Safety-I works well for simple mechanistic, linear systems, but is
less suitable for complex systems where Safety-II is more applicable.
The combination of everyday variation in complex systems can lead to so-called ‘Normal Accidents’
[26]. Taleb [49] builds on these ideas with the concept of antifragility, suggesting that some systems
can be structured such that they actively improve as a result of disturbances, learning and improving
their capacity to adapt. The more sensitive a system is to these disturbances the more it can improve.
Furthermore, while the impacts of the emergent failure are visible, the causes may be transient and
no longer observable after the fact [47]. The system-of-system level failure might arise from the
combination of system-level states or behaviours that only existed at a particular point in time, which
themselves may be the result of component-level states or behaviours that were equally temporary.
Hence, after the fact the true causes are not identifiable.
As a result of current methods of analysis vulnerabilities inherent in or exacerbated by the structure
of the system-of-systems can be overlooked or dismissed in the context of a significant triggering
event like a storm or flood, a component failure or human-error. Interdependencies between
component systems which were not known in advance of a system-of-systems failure are
retrospectively contextualised within a narrative that overplays the degree to which they could have
been known.
17
The following section identifies case studies which are, to greater or lesser extents, commonly
conceptualised through this lens. Because with the benefit of hindsight the causal pathways have
been illuminated and key triggers, errors or failures have been identified, the unexpected nature of
the interdependencies and their impacts is overlooked. This is the post-hoc rationalisation
characteristic of high-impact low-probability Black Swan events [50].
1.4 WHAT ARE THE CHARACTERISTICS OR FEATURES OF EMERGENT PHENOMENA/EVENTS? The following section describes eight infrastructure system-of-systems events as exemplars of
emergent failures. While the features and typologies described above will be used to illustrate this, it
would also be useful to establish, and identify within the eight events, any known characteristics of
emergent properties/events. As such this final section concludes the discussion on emergence and
emergent failures by summarising some key traits that will provide a lens through which to assess the
following case studies.
As apparent from the definitions of emergence provided earlier, emergence is when combinations of
local and global factors cause global-level changes that are non-obvious (i.e. requiring certain
knowledge and insight), unexpected (i.e. a known possibility with an underestimated probability),
unanticipated (i.e. an unknown or unrecognised possibility) or counterintuitive (i.e. goes against
current understanding). These could refer to the overall event or its scale. Indeed some have defined
network emergence as when “a very small perturbation can result in disproportionate system
damage” [6]. In such a case emergence has to be defined in relation to a specific observer. What is
non-obvious or unexpected to some, might be expected to others. This might relate to their
knowledge, expertise, worldview, governance duties or the tools available to them.
Some see this as a problem, arguing that a scientific phenomenon cannot be dependent on the
subjective knowledge or ignorance of the observer, leading instead to the suggestion of novelty as a
key feature of emergence [9]. Thus, the emergent phenomena or event has not been seen before,
independent of the observer. This leaves the door open to the idea that emergence can be a
temporary, epistemic notion that disappears once the novelty has been removed. The threshold for
novelty is less clear, as any significant event within a sufficiently multifaceted complex system will
differ in some respect from those that have gone before. The importance of novelty is recognised by
those who have attempted to define the characteristics of emergent phenomena and attempt to
clarify this point. Goldstein [30] for example reviews the relevant literature on emergence leading
him to describe some common properties that identify phenomena as emergent:
• Radical novelty – features not previously seen that are not deducible or able to be fully
anticipated
• Coherence or correlation – the properties/event appears as an integrated whole in its own
right
• Global or macro level – the coherence and phenomena is observed at this level not at the
individual components, as previously mentioned this makes most sense in the context of
infrastructure when considering the outcomes and services facilitated by constituent
systems at the system-of-systems level
• Dynamical – evolve over time
• Ostensive – recognised only when they become manifest or probable, essentially this is the
same as unpredictability.
Stepney et al. [9] offer the following characteristics exhibited by emergent systems:
18
• Far-from-equilibrium – it is entropic and dependent on its context and environment to
provide stability
• Levels – it exists hierarchically, e.g. coherent at the global, whole or macro level, distinct
from the local, constituent or micro level
• Languages – different terminology is used to described to describe local and global
phenomena
Both Goldstein and Stepney et al. note how different these characteristics can be as they manifest in
different disciplines. These are the minimum threshold characteristics of emergent events, they don’t
shed light on why events emerge. This is instead related to the structure and nature of cause and
effect propagation through the system-of-systems as discussed in the previous section. A novel or
unexpected event is not necessarily an emergent event. Plenty of simple man-made or natural
component failures could be described as novel, but a commonplace and expected event can at best
only be conceptualised as simple or nominal emergence.
Within this are a whole taxonomy of emergent misbehaviours, as first postulated by Mogul [10]:
• Thrashing – Competition over a scarce resource which can cause the resource and the
impact of limited access to be switched between the competing parts over time
• Unwanted synchronization – Constituent systems which are normally uncorrelated become
correlated though global level influences
• Unwanted oscillation – accidental or poorly designed feedback loops cause the system to
oscillate between states
• Deadlock – global system fails as a result of circular dependencies within the constituents
• Livelock – global system fails as two or more constituents constantly change in response to
the others such that no mutually compatible state can be found
Other specific types that might be of relevance to infrastructure system-of-systems events include:
• The aforementioned scenario whereby local adaptation decisions (purposeful to local goals)
are globally maladaptive
• Acceptable local changes cause acceptable global changes that in turn unexpectedly
influence local states in unacceptable ways
• Acceptable local changes remain hidden to other constituent systems until they are forced to
adapt and it is revealed that their adaptation plans are misaligned with the previously
modified state of the other system(s)
It is clear from these characteristics and wider concepts of emergence that the phenomena occur
through relationships or interdependencies between components or systems. The final section in this
Chapter briefly summarises the different ways in which two systems can be interdependent and affect
one another.
1.5 INTERDEPENDENCY The nature of the relationships between systems can be an important factor in understanding the
evolution of emergent system-of-systems failures. The most influential interdependency classification
system developed by Rinaldi et al [51] uses six dimensions:
• Type of Interdependency
• Infrastructure Environment
• Response Behaviour
• Infrastructure Characteristics
19
• Type of Failure
• State of Operations
These characteristics have been combined with those proposed by others [52–55] into a taxonomy
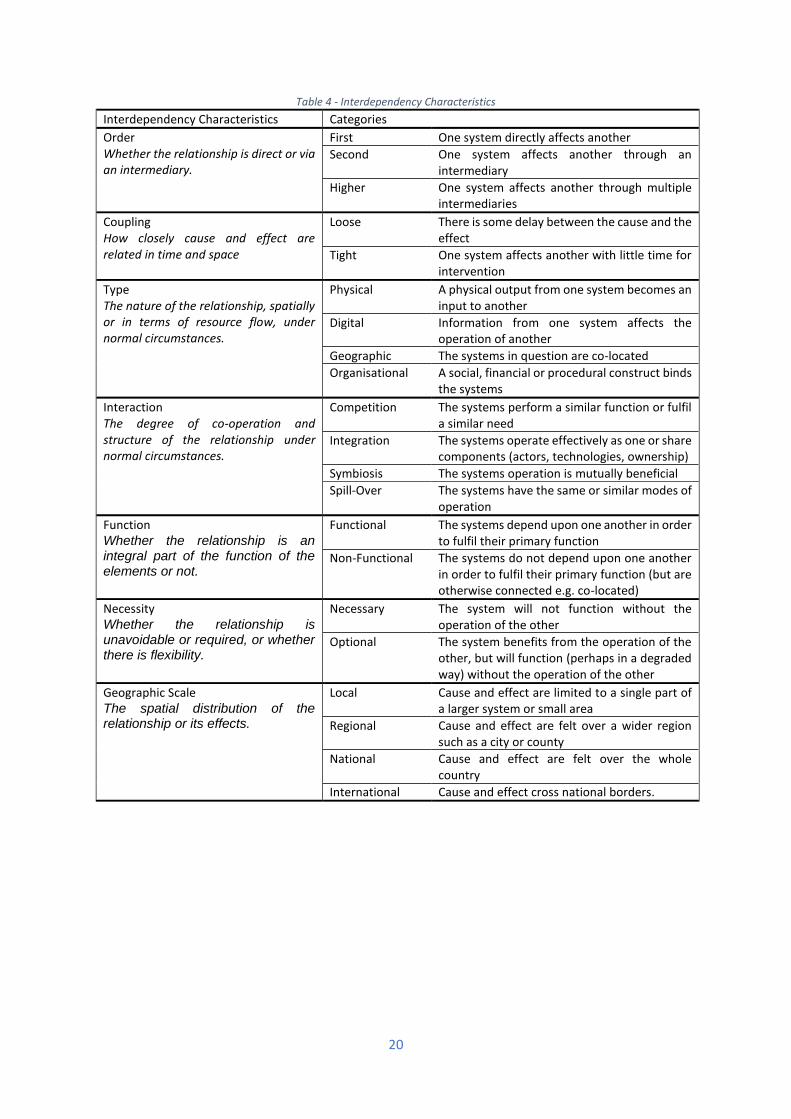
for infrastructure interdependency developed by Carhart and Rosenberg [56] adapted in Table 4 on
the following page. This has been used for the basis of characterising the relationships between
infrastructure systems in the Case Study Longlist on the following pages. This has some alignment
with alternative approaches for characterising infrastructure failures [57,58].
Much of the work in this space considers causes that are proximal in time to the failure event, yet
many of the influencing factors may be distant in time and space. This is particularly true when
considering policy decisions and large physical infrastructure systems that may change gradually over
decades. The operational context within which these infrastructure systems sit is continually
changing, sometimes fast and sometimes slow. The demands placed upon them will change
accordingly.
Any single event may result from multiple infrastructure interdependencies and therefore exhibit
many different types of characteristic. For example, the same event may one system directly affecting
another, as well as a chain of cause and effect through multiple systems. The initial selection of the
Case Studies profiled in Chapter 2 was informed by a preliminary consideration of the types of
interdependency involved in order to ensure the refined short-list illustrates a range of scenarios
demonstrating different interdependency characteristics and categories.
20
Table 4 - Interdependency Characteristics
Interdependency Characteristics Categories
Order Whether the relationship is direct or via an intermediary.
First One system directly affects another
Second One system affects another through an intermediary
Higher One system affects another through multiple intermediaries
Coupling How closely cause and effect are related in time and space
Loose There is some delay between the cause and the effect
Tight One system affects another with little time for intervention
Type The nature of the relationship, spatially or in terms of resource flow, under normal circumstances.
Physical A physical output from one system becomes an input to another
Digital Information from one system affects the operation of another
Geographic The systems in question are co-located
Organisational A social, financial or procedural construct binds the systems
Interaction The degree of co-operation and structure of the relationship under normal circumstances.
Competition The systems perform a similar function or fulfil a similar need
Integration The systems operate effectively as one or share components (actors, technologies, ownership)
Symbiosis The systems operation is mutually beneficial
Spill-Over The systems have the same or similar modes of operation
Function Whether the relationship is an integral part of the function of the elements or not.
Functional The systems depend upon one another in order to fulfil their primary function
Non-Functional The systems do not depend upon one another in order to fulfil their primary function (but are otherwise connected e.g. co-located)
Necessity Whether the relationship is unavoidable or required, or whether there is flexibility.
Necessary The system will not function without the operation of the other
Optional The system benefits from the operation of the other, but will function (perhaps in a degraded way) without the operation of the other
Geographic Scale The spatial distribution of the relationship or its effects.
Local Cause and effect are limited to a single part of a larger system or small area
Regional Cause and effect are felt over a wider region such as a city or county
National Cause and effect are felt over the whole country
International Cause and effect cross national borders.
21
2 CASE STUDIES
Emergence is a difficult concept to visualise. Much of the research attempting to explore and
demonstrate emergence in its various forms does so through theoretical mathematical models. Real
world examples can make the concepts more tangible and understandable. Lower order forms of
simple or nominal emergence are common but are either trivial or handled sufficiently with common
tools and approaches. Higher order forms of strong emergence can be hard to identify and even
harder to explain and comprehend. They are by their nature a product of complex interactions up and
down the hierarchy from constituent systems to the system-of-systems. When they do occur, it is
often part of some much larger process. Nevertheless, there is value in exploring the concepts
described in the previous Chapter through practical examples. This Chapter attempts to provide such
examples specifically from the domain of infrastructure-related failure events.
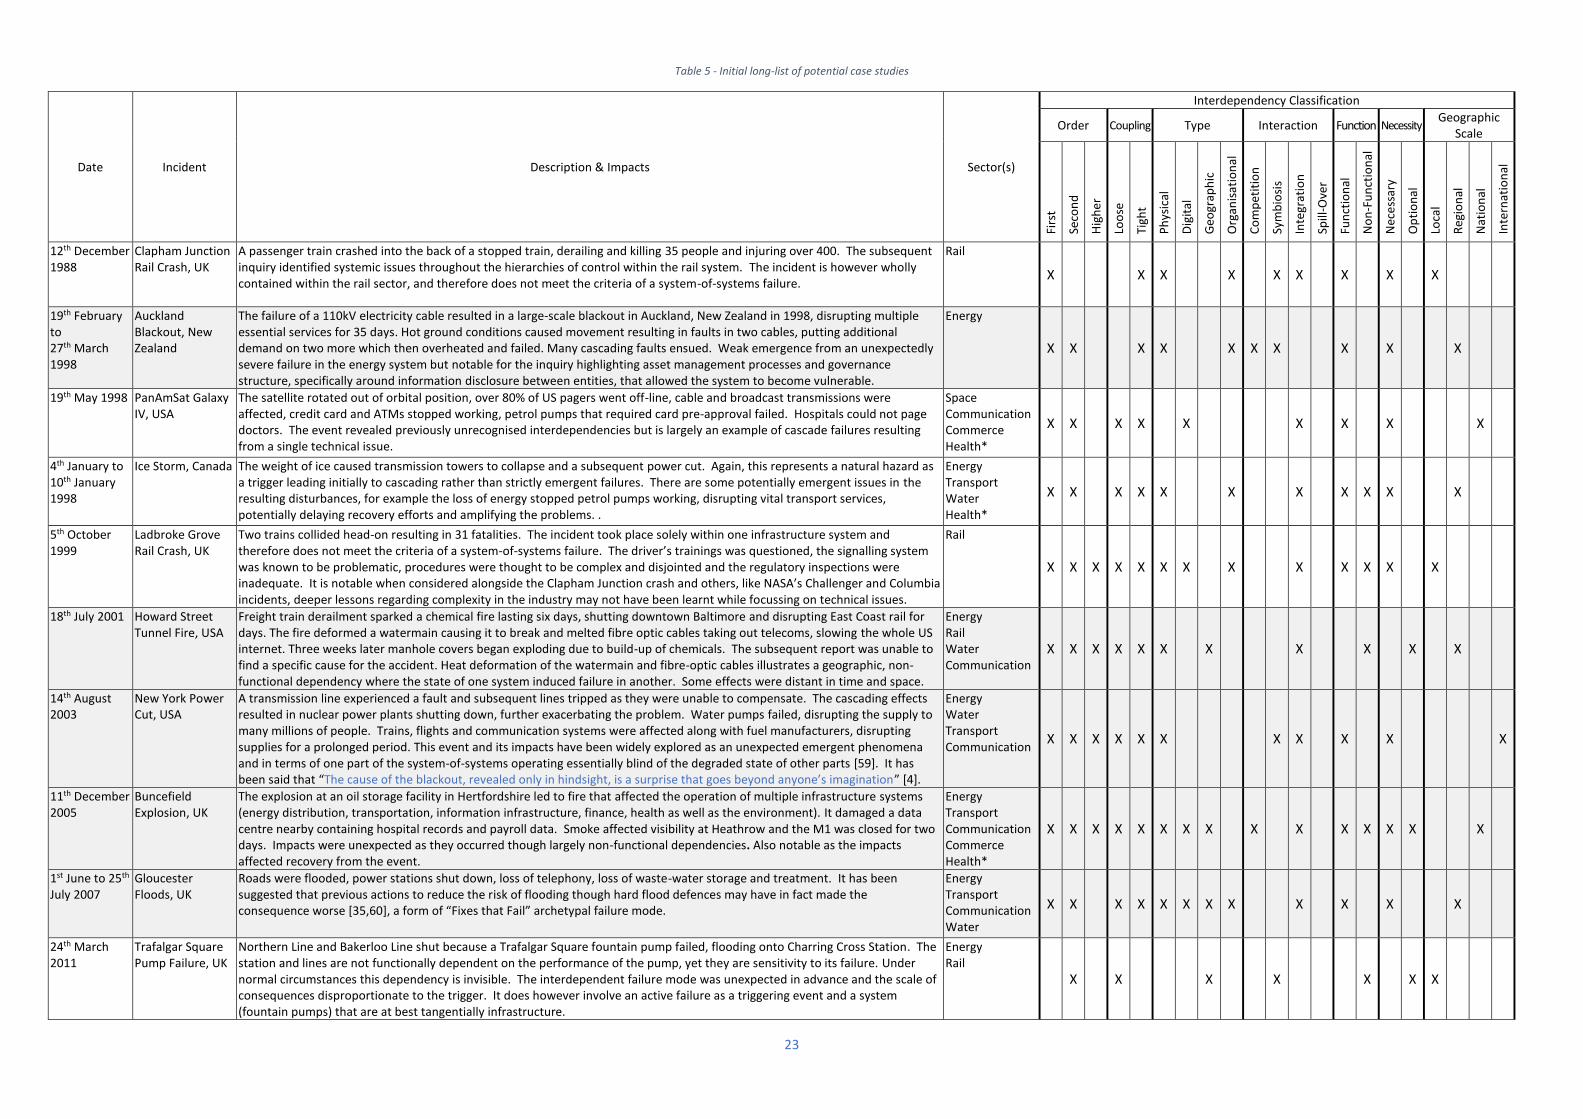
An initial set of sixteen potential events were identified. These are outlined in Table 5 on the following
two pages. An assessment of the interdependency characteristics involved in each event was
undertaken. The list was then refined based on simple criteria. Firstly, it was intended that events
should take place across the infrastructure system-of-systems. That is to say they should involve
multiple sectors rather than emergence from the sub-systems to the system level within a single
sector. Secondly, the selection should include examples which exhibit a range of different
interdependency types. Thirdly, the case studies should include examples of the different forms of
emergence as outlined in Chapter 1. This final point required some preliminary consideration of the
events.
Ultimately, the following events were chosen as they exhibit, in part or in whole, aspects of so-called
emergent system-of-systems failures within the infrastructure sector.
• Howard Street Tunnel Fire, USA, 2001
• New York Power Cut, USA, 2003
• Buncefield Explosion, UK, 2005
• Gloucester Floods, UK, 2007
• Superstorm Sandy, USA, 2012
• Storm Desmond, UK, 2015
• Low Frequency Demand Disruption, UK, 2019
• Victoria & London Bridge Disruption, UK, 2019
In many cases the triggering event was extreme weather or entirely predictable component failures,
but the subsequent progression of the event and nature of the consequences demonstrate behaviours
that are emergent from the system-of-systems. Similarly, some events involve relatively simple and
entirely foreseeable cascade failures. Again, these should not be a distraction from the emergent
aspects also exhibited. While the very existence of emergent behaviours in this context is contentious,
many of the methods postulated for their management can help to reduce epistemic uncertainties
and therefore improve the foreseeability of cascade failures.

22
THIS PAGE INTENTIONALLY LEFT BLANK
23
Table 5 - Initial long-list of potential case studies
Date Incident Description & Impacts Sector(s)
Interdependency Classification
Order Coupling Type Interaction Function Necessity Geographic
Scale
Firs
t
Seco
nd
Hig
her
Loo
se
Tigh
t
Ph
ysic
al
Dig
ital
Geo
grap
hic
Org
anis
atio
nal
Co
mp
etit
ion
Sym
bio
sis
Inte
grat
ion
Spill
-Ove
r
Fun
ctio
nal
No
n-F
un
ctio
nal
Nec
ess
ary
Op
tio
nal
Loca
l
Reg
ion
al
Nat
ion
al
Inte
rnat
ion
al
12th December 1988
Clapham Junction Rail Crash, UK
A passenger train crashed into the back of a stopped train, derailing and killing 35 people and injuring over 400. The subsequent inquiry identified systemic issues throughout the hierarchies of control within the rail system. The incident is however wholly contained within the rail sector, and therefore does not meet the criteria of a system-of-systems failure.
Rail
X X X X X X X X X
19th February to 27th March 1998
Auckland Blackout, New Zealand
The failure of a 110kV electricity cable resulted in a large-scale blackout in Auckland, New Zealand in 1998, disrupting multiple essential services for 35 days. Hot ground conditions caused movement resulting in faults in two cables, putting additional demand on two more which then overheated and failed. Many cascading faults ensued. Weak emergence from an unexpectedly severe failure in the energy system but notable for the inquiry highlighting asset management processes and governance structure, specifically around information disclosure between entities, that allowed the system to become vulnerable.
Energy X X X X X X X X X X
19th May 1998 PanAmSat Galaxy IV, USA
The satellite rotated out of orbital position, over 80% of US pagers went off-line, cable and broadcast transmissions were affected, credit card and ATMs stopped working, petrol pumps that required card pre-approval failed. Hospitals could not page doctors. The event revealed previously unrecognised interdependencies but is largely an example of cascade failures resulting from a single technical issue.
Space Communication Commerce Health*
X X X X X X X X X
4th January to 10th January 1998
Ice Storm, Canada The weight of ice caused transmission towers to collapse and a subsequent power cut. Again, this represents a natural hazard as a trigger leading initially to cascading rather than strictly emergent failures. There are some potentially emergent issues in the resulting disturbances, for example the loss of energy stopped petrol pumps working, disrupting vital transport services, potentially delaying recovery efforts and amplifying the problems. .
Energy Transport Water Health*
X X X X X X X X X X X
5th October 1999
Ladbroke Grove Rail Crash, UK
Two trains collided head-on resulting in 31 fatalities. The incident took place solely within one infrastructure system and therefore does not meet the criteria of a system-of-systems failure. The driver’s trainings was questioned, the signalling system was known to be problematic, procedures were thought to be complex and disjointed and the regulatory inspections were inadequate. It is notable when considered alongside the Clapham Junction crash and others, like NASA’s Challenger and Columbia incidents, deeper lessons regarding complexity in the industry may not have been learnt while focussing on technical issues.
Rail
X X X X X X X X X X X X X
18th July 2001 Howard Street Tunnel Fire, USA
Freight train derailment sparked a chemical fire lasting six days, shutting downtown Baltimore and disrupting East Coast rail for days. The fire deformed a watermain causing it to break and melted fibre optic cables taking out telecoms, slowing the whole US internet. Three weeks later manhole covers began exploding due to build-up of chemicals. The subsequent report was unable to find a specific cause for the accident. Heat deformation of the watermain and fibre-optic cables illustrates a geographic, non-functional dependency where the state of one system induced failure in another. Some effects were distant in time and space.
Energy Rail Water Communication
X X X X X X X X X X X
14th August 2003
New York Power Cut, USA
A transmission line experienced a fault and subsequent lines tripped as they were unable to compensate. The cascading effects resulted in nuclear power plants shutting down, further exacerbating the problem. Water pumps failed, disrupting the supply to many millions of people. Trains, flights and communication systems were affected along with fuel manufacturers, disrupting supplies for a prolonged period. This event and its impacts have been widely explored as an unexpected emergent phenomena and in terms of one part of the system-of-systems operating essentially blind of the degraded state of other parts [59]. It has been said that “The cause of the blackout, revealed only in hindsight, is a surprise that goes beyond anyone’s imagination” [4].
Energy Water Transport Communication
X X X X X X X X X X X
11th December 2005
Buncefield Explosion, UK
The explosion at an oil storage facility in Hertfordshire led to fire that affected the operation of multiple infrastructure systems (energy distribution, transportation, information infrastructure, finance, health as well as the environment). It damaged a data centre nearby containing hospital records and payroll data. Smoke affected visibility at Heathrow and the M1 was closed for two days. Impacts were unexpected as they occurred though largely non-functional dependencies. Also notable as the impacts affected recovery from the event.
Energy Transport Communication Commerce Health*
X X X X X X X X X X X X X X X
1st June to 25th July 2007
Gloucester Floods, UK
Roads were flooded, power stations shut down, loss of telephony, loss of waste-water storage and treatment. It has been suggested that previous actions to reduce the risk of flooding though hard flood defences may have in fact made the consequence worse [35,60], a form of “Fixes that Fail” archetypal failure mode.
Energy Transport Communication Water
X X X X X X X X X X X X
24th March 2011
Trafalgar Square Pump Failure, UK
Northern Line and Bakerloo Line shut because a Trafalgar Square fountain pump failed, flooding onto Charring Cross Station. The station and lines are not functionally dependent on the performance of the pump, yet they are sensitivity to its failure. Under normal circumstances this dependency is invisible. The interdependent failure mode was unexpected in advance and the scale of consequences disproportionate to the trigger. It does however involve an active failure as a triggering event and a system (fountain pumps) that are at best tangentially infrastructure.
Energy Rail
X X X X X X X
24
Date Incident Description & Impacts Sector(s)
Interdependency Classification
Order Coupling Type Interaction Function Necessity Geographic
Scale
Firs
t
Seco
nd
Hig
her
Loo
se
Tigh
t
Ph
ysic
al
Dig
ital
Geo
grap
hic
Org
anis
atio
nal
Co
mp
etit
ion
Sym
bio
sis
Inte
grat
ion
Spill
-Ove
r
Fun
ctio
nal
No
n-F
un
ctio
nal
Nec
ess
ary
Op
tio
nal
Loca
l
Reg
ion
al
Nat
ion
al
Inte
rnat
ion
al
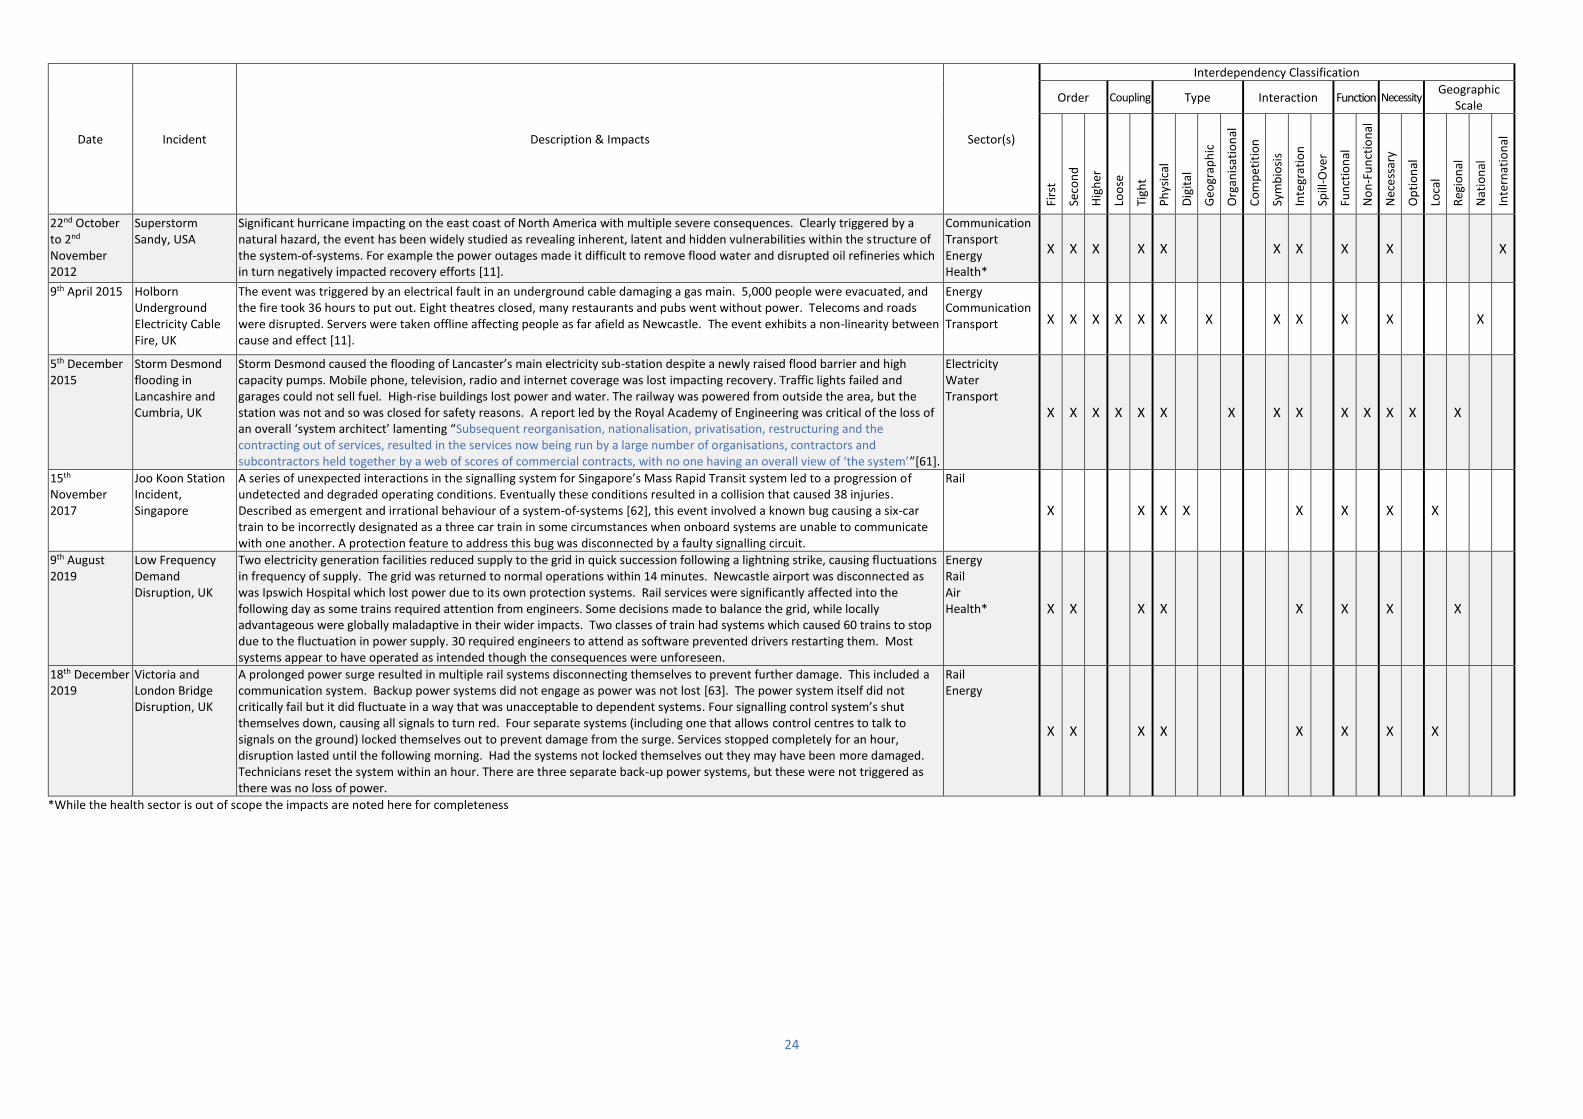
22nd October to 2nd November 2012
Superstorm Sandy, USA
Significant hurricane impacting on the east coast of North America with multiple severe consequences. Clearly triggered by a natural hazard, the event has been widely studied as revealing inherent, latent and hidden vulnerabilities within the structure of the system-of-systems. For example the power outages made it difficult to remove flood water and disrupted oil refineries which in turn negatively impacted recovery efforts [11].
Communication Transport Energy Health*
X X X X X X X X X X
9th April 2015 Holborn Underground Electricity Cable Fire, UK
The event was triggered by an electrical fault in an underground cable damaging a gas main. 5,000 people were evacuated, and the fire took 36 hours to put out. Eight theatres closed, many restaurants and pubs went without power. Telecoms and roads were disrupted. Servers were taken offline affecting people as far afield as Newcastle. The event exhibits a non-linearity between cause and effect [11].
Energy Communication Transport X X X X X X X X X X X X
5th December 2015
Storm Desmond flooding in Lancashire and Cumbria, UK
Storm Desmond caused the flooding of Lancaster’s main electricity sub-station despite a newly raised flood barrier and high capacity pumps. Mobile phone, television, radio and internet coverage was lost impacting recovery. Traffic lights failed and garages could not sell fuel. High-rise buildings lost power and water. The railway was powered from outside the area, but the station was not and so was closed for safety reasons. A report led by the Royal Academy of Engineering was critical of the loss of an overall ‘system architect’ lamenting “Subsequent reorganisation, nationalisation, privatisation, restructuring and the contracting out of services, resulted in the services now being run by a large number of organisations, contractors and subcontractors held together by a web of scores of commercial contracts, with no one having an overall view of ‘the system’”[61].
Electricity Water Transport
X X X X X X X X X X X X X X
15th November 2017
Joo Koon Station Incident, Singapore
A series of unexpected interactions in the signalling system for Singapore’s Mass Rapid Transit system led to a progression of undetected and degraded operating conditions. Eventually these conditions resulted in a collision that caused 38 injuries. Described as emergent and irrational behaviour of a system-of-systems [62], this event involved a known bug causing a six-car train to be incorrectly designated as a three car train in some circumstances when onboard systems are unable to communicate with one another. A protection feature to address this bug was disconnected by a faulty signalling circuit.
Rail
X X X X X X X X
9th August 2019
Low Frequency Demand Disruption, UK
Two electricity generation facilities reduced supply to the grid in quick succession following a lightning strike, causing fluctuations in frequency of supply. The grid was returned to normal operations within 14 minutes. Newcastle airport was disconnected as was Ipswich Hospital which lost power due to its own protection systems. Rail services were significantly affected into the following day as some trains required attention from engineers. Some decisions made to balance the grid, while locally advantageous were globally maladaptive in their wider impacts. Two classes of train had systems which caused 60 trains to stop due to the fluctuation in power supply. 30 required engineers to attend as software prevented drivers restarting them. Most systems appear to have operated as intended though the consequences were unforeseen.
Energy Rail Air Health* X X X X X X X X
18th December 2019
Victoria and London Bridge Disruption, UK
A prolonged power surge resulted in multiple rail systems disconnecting themselves to prevent further damage. This included a communication system. Backup power systems did not engage as power was not lost [63]. The power system itself did not critically fail but it did fluctuate in a way that was unacceptable to dependent systems. Four signalling control system’s shut themselves down, causing all signals to turn red. Four separate systems (including one that allows control centres to talk to signals on the ground) locked themselves out to prevent damage from the surge. Services stopped completely for an hour, disruption lasted until the following morning. Had the systems not locked themselves out they may have been more damaged. Technicians reset the system within an hour. There are three separate back-up power systems, but these were not triggered as there was no loss of power.
Rail Energy
X X X X X X X X
*While the health sector is out of scope the impacts are noted here for completeness

25
Perhaps the most important factor to keep in mind concerns the tendency towards post-hoc
rationalisation. The case studies attempt to describe the events as clearly as possible, but such a
narrative can give the false impression that the events were simple and predictable in advance of their
occurrence.
Many of the aspects of these events were unexpected, but the most meaningful debate concerning
emergence is whether they could be expected. To believe they could is to believe that such complex
systems cannot become chaotic and that they do not involve irreducible aleatory uncertainty or
randomness to any meaningful degree. Many of the tools discussed in Chapter 3 assume that, given
the complexity of the systems of interest, it is simple not practical, safe or efficient to operate under
the assumption that with enough effort every eventuality could be predicted; hence alternative
methods are required to manage them and limit their consequences. The complexity and fragmented
control of the infrastructure system-of-systems means that it is, in any practical sense, not possible to
predict in advance what all the potential consequences of an action taken within a component system
might be.
While the impacts of the emergent failure are visible, the causes may be transient and no longer
observable after the fact [47]. The system-of-system level failure might arise from the combination
of system-level states or behaviours that only existed for a point in time, which themselves may be
the result of component-level states or behaviours that were equally temporary. Hence, after the fact
the true causes are not identifiable.
As a result of current methods of analysis, vulnerabilities inherent in or exacerbated by the structure
of the system-of-systems can be overlooked or dismissed in the context of a significant triggering
event like a storm or flood, a component failure or human-error. Interdependencies between
component systems which were not known in advance of a system-of-systems failure are
retrospectively contextualised within a narrative that overplays the degree to which they could have
been known.
In each case the criteria of surprise and novelty are first considered. While not necessarily the defining
for most interesting aspects of an emergent system-of-systems event, if these fundamental criteria
are not met then the event cannot be considered emergent. If the cases had not been
expected/anticipated, nor had they been seen before then they meet the basic threshold warranting
further consideration.
26
Event #1 HOWARD STREET TUNNEL FIRE, USA
Date 18th July 2001
Description At 15:08 on the 18th of July a sixty-car freight train derailed 11 of its cars in a tunnel beneath Howard Street, Baltimore. One chemical tank in transit was breached providing the initial fuel for a fire lasting five days as other cars carrying paper, acidic chemicals and other materials burned. The fire was so intense that access was restricted for several days. The fire and its consequences shut down downtown Baltimore and disrupted East Coast rail for days. At 17:07 the incident commander concluded there was no immediate threat of explosion and ordered a shelter-in-place strategy [64]. The fire deformed a water main above the tunnel causing it to break and flood the surrounding streets, some to a depth of 30cm, for many days [65]. The pipe deformed the foundations of a light rail service disrupting its operation. The combined impacts of the flood and fire damaged electricity cables cutting off power to 1200 buildings [66]. The flood affected telecoms cables disrupted phone services across the city. The fire melted backbone fibre optic cables carried through the tunnel serving seven of the largest ISPs in the US, slowing the country’s entire internet system. The effects even reached the US embassy in Zambia which was unable to send or receive emails as a result. The rail communications systems were damaged meaning communication with the control centre was lost. On August 11th, 25 days after the initial event, manhole covers began exploding into the air and some traffic signals were disrupted as a result of a build-up of chemicals in storm drains and conduit vaults igniting. The recovery and clean-up costs alone were estimated at $12 million [67]. The wider economic impacts from the disruption make the overall cost much higher.
Emergence The event shows a number of consequences arising in multiple infrastructure systems, some disparate in time and space. A technical report for the US Department of Energy describes the event as involving both cascading and unexpected impacts [66]. The scale and nature of the resultant impacts had a degree of novelty. While the impacts involve multiple sectors, the investigations have largely focused on the derailment and fire. Even with this focus it is possible to highlight many of the characteristics claimed of emergent system-of-systems failures. The severity of the fire made it difficult to identify the initiating factors for the derailment, but there was no evidence to suggest defective rails, defects in the train itself or unusual train handling from the engineer [64]. Other scenarios considered include sand in the tunnel, track geometry issues and foreign objects. It was postulated that the water main may have ruptured first and contributed to the derailment, but metallurgical examinations of the pipe and the timing of pressure drops in the system indicated otherwise. [64]. This somewhat aligns with the suggestion that the causes of so-called emergent events in complex systems-of-systems may only temporarily exist as a factor of interactions between components, only to leave no trace of ever being present after the event. The subsequent report was unable to find a specific cause for the accident which aligns with the notion that an emergent system-of-systems failure is not the result of any individual system, but this is almost inconsequential to the ‘perfect storm’ of interacting issues. The train itself was carrying flammable gas, paper and acid. Heat deformation of watermain and fibre-optic cables illustrates a geographic, non-functional dependency allowing the state of one system to induce failure in another. Some effects were distant in time and space. There is also evidence of asynchronous evolution and issues with the communication of change across the sectoral boundaries of the system-of-systems such that parts of the system were in a state that was not expected of them by other parts. The National transport Safety Board investigation noted that: “it became apparent that information about modifications and construction in or near the tunnel had not been reliably documented or exchanged among interested parties” [64]. For example, the City of Baltimore was unaware of a void in the tunnel wall directly below the water main relating to a repair process, they were unaware of a moved manhole and had not been informed when it was discovered a sewer thought to be 19ft below the surface was actually 8ft below. Indeed “A manhole fifty feet from

27
the water main break point had an unexpected connection to an alcove in the tunnel” that allowed firefighters to feed a hose in and suppress the fire [68]. Despite being a designated hazardous materials route: “Emergency preparedness documents compiled by the Baltimore Office of Disaster Control and Civil Defense that were reviewed by Safety Board investigators do not contain information on hazardous materials discharge response procedures specific to tunnel environments or infrastructure information on the Howard Street Tunnel” [64]. In other words, while the city was generally well prepared for disaster response they “had not postulated an event with both a fire and a hazardous materials event” nor had they coordinated with the railroad to prepare for events inside the tunnel [68]. This issue was also highlighted as a recurring theme in interviews conducted as part of the US Department of Transportation investigation [69]. Once again, while hindsight might suggest such an event could be anticipated, the evidence suggests it was not expected. The consequences were equally unexpected as evidenced by the fact that the US Nuclear Regulatory Commission required casks for the transportation of nuclear waste to withstand fires of 1,475 degrees Fahrenheit for 8 hours. The Howard Tunnel fire, a route for the transportation of such material, burned at 1,800 degrees for the first 3 hours and prolonged at 1,500 degrees for over 24 hours [68].
28
Event #2 NORTHEAST BLACKOUT, USA
Date 14th August 2003
Description Around midday on the 14th of August 2003 inaccurate input data to a software system monitoring tool left it ineffective, just over an hour later a generation unit tripped, shortly followed by the failure of network control room’s alarm and logging system. At around 15:00 a series of transmission lines came into contact with overgrown trees causing them to trip. Subsequent lines tripped as they were unable to compensate for the increased demand being placed upon them. The cascading effects resulted in nuclear power plants shutting down, further exacerbating the problem. In total 400 transmission lines, 531 generating units and over 260 power plants tripped, equating to around 63GW of energy [59]. Over 50 million people across eight states and two provinces were affected. The deaths of 11 people were in-part attributed to the impacts of the blackout, which is estimated to have in total cost $6 billion [70]. Some have suggested the costs could have been as high as $8.2 or $10 billion [71]. Failures within the energy grid have been well documented and analysed, but the significant and widespread impacts on other infrastructure systems and services have received less attention, perhaps as a result of the seemingly simple cascading nature of their failure. Water pumps and water treatment plants shut down disrupting the supply to many millions of people. Water pressure dropped risking contamination of supplies. Areas of Ontario, Ohio and New York saw major sewage spills. Flights were affected as power for security screening and electronic ticket services was lost. Petrol station pumps lost power and fuel processing facilities were shut down, disrupting supplies for a prolonged period after power was restored. Some agencies had backup generators, but these were not stored locally and could not be accessed and brought to site due to traffic congestion [72]. Cellular and two-way radio communications worked initially as they switched to their local back-up batteries, but in many locations as the event continued the stored power ultimately depleted and the services were lost. Analog, wired telephone systems continued to largely operate, though in Ohio, Department of Transport staff did not initially realise they were missing calls as their phones’ ringers required separate power [72]. The New York Times reported traffic signalling failing and roads became gridlocked even to emergency services [73]. Subway and Amtrack trains stopped, in some instances trapping passengers on bridges and in tunnels on un-air-conditioned trains. Around 12,000 signals had to be checked, many through visual inspection, before services could be restored. While ferries in New York were still able to operate, they became overwhelmed by passengers who had no other means of transport. In Detroit the Detroit-Windsor Tunnel link between the US and Canada was shut when it lost power, despite being served by four separate and independent power feeds [72]. This meant that key workers, such as Canadian nurses employed in American hospitals, could not get to work. Furthermore, US and Canadian transport officials were unaware of how to contact each other to resolve the cross-border issues [72]. Companies attempting to recover their online systems found that there supposedly independent back-ups were still within the blackout zone, with one Chief Executive a firm involved in such data protection and disaster recovery commenting that “The education coming out of this disaster is you can't predict a disaster'' [74]. Some agencies discovered that their backup power systems did not cover all essential items. For example some found their computers were switched to the private backup generators, but card access to the building and air-conditioning were not, despite this providing a critical cooling function for the servers [72]. Similar issues affected transport tunnels, which did not connect ventilation to local back-up systems, meaning the flow of traffic had to be restricted to prevent the build-up of airborne particulates.
Emergence This event and its impacts have been widely explored as an unexpected emergent phenomena and in terms of one part of the system or system-of-systems operating essentially blind of the degraded state of other parts [59]. For example FirstEnergy’s Supervisory Control and Data Acquisition (SCADA) system failed at 14:14 prior to any of their transmission lines tripping, and did not initially realise that this was the case [75]. Most of the analysis and emergent features related to this event are focussed within the energy system itself, as opposed to the propagation through the wider infrastructure system-of-
29
systems. As such it is of less interest to this report than some of the other case studies, but it is nonetheless included for completeness as it is a high-profile example of an emergent failure event. System wide disturbances in the US energy infrastructure across wide areas actually occur more frequently than a normal probability distribution would suggest, and with common features such as tree contact and an inability of operators to visualise system wide effects [75]. However, in this instance it has been argued that “The cause of the blackout, revealed only in hindsight, is a surprise that goes beyond anyone’s imagination. It was a trivial incidence in Parma, Ohio, a suburb of Cleveland, where untrimmed overgrown trees severed one section of a high-voltage power transmission line” [4]. They go on to describe it as a surprise, a manifestation of blind spots and phenomena that are widely perceived but not understood. The CEO of FirstEnergy Corp, in testimony to the House Energy and Commerce Committee said “events on our system, in and of themselves, could not account for the widespread nature of the outage.” [76]. The event demonstrates some of the features of such blind spots: decisions are made with imperfect information, using imperfect heuristics, imperfect tools and with a lack of cross-domain knowledge [4]. Elsewhere it is described in terms of a “complex combination of latent problems and catalytic events” [77]. While these statements are largely concerned with the failure of the energy system, rather than the wider impacts on the infrastructure system-of-systems, it seemingly meets the criteria of being novel and unexpected. The interesting emergence issues are of course those at the infrastructure system-of-systems level: “The extent of affected infrastructures was not predicted; this is an example of hidden vulnerabilities” [78]. Officials in Cleveland found they could not use the emergency response centre as it had no backup power, something that took eight hours to rectify [72] “Although many cities believe they have adequate backup power in the case that one or two of the treatment plants and/or pumping stations are down by pulling power from separated substation and not investing in on-site power, they are usually unprepared for large-scale blackouts that cut off the whole city’s power supply.” [66]. As certain forms of mobility service failed at the system-of-systems level, pressure increased on others as a form of Strong Emergence. Issues can arise when local decisions are made within one part of the system-of-systems without knowing the state of other parts. It has already been established that this was the case in managing the electricity grid (i.e. First Energy’s alarm system failed and they had limited situational awareness of the condition o the grid) , but it also affected other infrastructure systems like transport. One specific incident highlights the importance of an often overlooked ‘soft’ factor: “one agency official in Detroit noted that long-standing rivalry with another agency made it almost impossible for the two to collaborate in even a basic way, although their cooperation might have eased congestion during the blackout” [72]. Trust between organisations, agencies and individuals can become critical. Another stakeholder is quoted in the same source explaining: "If you know each others' resources and understand each others' needs, you start to develop a comfort level. Even if you have no way to communicate during an emergency like the blackout, the operator in Virginia can still anticipate your needs based on the last 10 times you've worked together and will start using his equipment to assist.”
30
Event #3 BUNCEFIELD EXPLOSION, UK
Date 11th December 2005
Description The explosion at an oil storage facility in Hertfordshire in December 2005 injured over 40 people, caused damage to the surrounding environment and impacted many businesses. The resulting fire affected the operation of multiple infrastructures (energy distribution, transportation, information infrastructure, finance and health). Had the event not happened on a Sunday morning the impacts to life may have been even greater. The emergency response was estimated to cost £7 million, with short term recovery around £2.2 million and long-term recovery £100 million over the 10 years that followed [79]. Furthermore some £625 million insurance claims were associated with the event, with overall cost estimates of £894 million [80]
According to the COMAH report by the HSE, Environment Agency and SEPA following the conclusion of legal proceedings [81], the triggering event involved the failure of two components intended to prevent a fuel tank from over-filling, including the means to alert operators of the situation. Two forms of containment (bund and catchment drains) both also failed. Petrol overflowed the tank, forming a vapor cloud that ignited and burned for five days. There were multiple systemic factors contributing to these trigger failures within the responsible organisations, for example the filling gauge required a padlock to ensure its check lever was in the correct position but this was not communicated from the supplier to the installer or maintainer and as such was never installed; the operators did not have direct control over the rate at which fuel flowed into the tank. These factors are not the focus of this case study which is instead concerned with highlighting the wider system-of-systems issues. The fire and resulting smoke cloud lead to thousands of people being evacuated from their homes and hundreds of schools shutting. The M1 was shut between junctions 12 and 6a along with what is now the A414. Heathrow airport, which received its airline fuel from the facility was forced to restrict the supplies to airlines. This meant some flights had to make intermediary stops or fuel at alternative locations before arriving at Heathrow [82]. This continued for many months. Rumours of fuel shortages led to panic buying at petrol stations, despite the probability of such shortages being very low. 36 buildings were damaged, six requiring demolition. Even those buildings left undamaged could not be reached due to transport disruptions. This included the warehouse of fashion retailer ASOS which was forced to cease trading in the run up to Christmas, affecting its share price [83]. A data centre on the site was damaged, affecting patient records for local hospitals, data for several local authorities and a payroll scheme of around £1.4billion [84]. There was evidence that the foam used to the fight the fire, which poses a known health risk, had accumulated in a ground water bore hole. A pumping station was closed as a precaution and the chemical did not reach the public water supply.
Emergence The COMAH report states that “The severity of the explosion was far greater than could reasonably have been anticipated based on knowledge at the time and the conditions at the site.” [p12, 81]. The HAZID processes used in preparing the safety case had not identified the triggering events as a worst-case scenario, in fact Seveso II safety reports “did not foresee any scenario of this kind” [85]. Paltrinieri et al. explain that it “was not considered sufficiently probable or reasonably realistic, either by the industry or competent authorities”. They demonstrate, with reference to their confirmation of Rasmussen’s theory [86], that the current methods used to manage risks did not work because “atypical accident scenarios are a product and a combination of failures from different levels of the sociotechnical system” but add that they could have been had more attention been paid to warning signals and lessons from elsewhere. Based on this it would seem that the scale of the blast itself, and therefore the consequences were at least unexpected and furthermore it could be argued such an event would never be expected using current approaches. Panic buying at petrol stations is an example of unwanted synchronization as an emergent misbehaviour, which is of interest as it involves social factors. Misunderstanding/miscommunication

31
at the global level from fuel shortages at Heathrow invokes a collective response from a large enough group of people to purchase petrol at the same time (which they otherwise would not have done) risking problems in private fuel supply. The impacts on Heathrow and air transport are a cascading effect through functional dependencies. The airlines depend on the depot functioning for their normal functioning. When the depot is disrupted, they are disrupted. However, part of the reason the wider system-of-systems impacts were unexpected was the role of often overlooked non-functional dependencies. That is to say many of the assets and services that were disrupted do not depend on the Buncefield depot to operate. If the Buncefield facility went offline for routine maintenance, they would not be affected. The geographic dependency of the warehouse and data centre, and their impacts on other services are nonetheless cascade failures of a different kind. Under the definitions of Holland [8] and Maier [36] these would still qualify as Nominal or Weak Emergence. Commercial pressures and policy creep had, over time, meant that additional buildings (commercial and residential) had been built near the facility subsequent to its original operating licence. The geographic interdependencies disrupting the function of access roads, hampering recovery from the event appears to be Type 2 – Moderated Emergence or even Type 3 - Multiple Emergence as the global impacts (e.g. smoke) begin to affect the components, the components begin to affect one another and in combination effect the global event, albeit in a way that is compatible with known processes [8].
32
Event #4 GLOUCESTERSHIRE FLOODS, UK
Date July 2007
Description Heavy rainfall in the summer of 2007 resulted in severe flooding across many parts of the UK. Gloucestershire was particularly badly affected in July, such that 420, 000 people had lost access to treated water by the 24th of July and was not returned until the 7th of August. Roads were flooded and impassable, cutting off some communities. Many drivers were stuck on the M5, some abandoned their cars which made it difficult to reopen the motorway. A substation was shut down before being recovered the following day. Some telecommunications were lost along with waste-water storage and treatment. The total economic costs of the summer 2007 floods across the whole of England were estimated at the time to be £3.2 billion [87]. Gloucester County Council spent £25 million repairing roads alone [88]. The impacts were wide reaching across the infrastructure system-of-systems, particularly in terms of potable water, but largely as a result of cascading failures or direct impacts from the natural disaster that triggered the event. The amount of rain was relatively well predicted by the Met Office, the Environment Agency were able to use this to map flooding, but the interdependencies between some infrastructure systems remained an unknown factor prior to the event [84]. The scale of the event could be described as emergent due to factors established in the underlying state of the infrastructure system-of-systems, in turn impacted by policy decisions made prior to the event.
Emergence The severity of the flooding could be considered an emergent property of systemic factors developing longitudinally in time across the hierarchy of governance and control. As discussed by Montgomery et al [35,60] a number of casual mechanisms can be found in the underlying system that facilitated the scale of the floods, e.g. “floods have historically resulted in an increase in demand for ‘hard’ flood defences. This typically results in an immediate increase in adaptive capacity and resilience, reducing flood risk. However, a combination of hard flood defences and increased impermeable surfaces through urbanisation has led to an increase in flow rate […] this can increase surface water flooding, leading to increased pressure on drainage systems and exacerbating flood risk. It also increases erosion which, in time, reduces the durability and robustness of infrastructure, decreasing resilience, and again increasing flood risk.” In other words, actions to reduce flooding may have, over time, increased the risk of flooding. This is an unintended result, and as such it must be considered unexpected. Such failed policy interventions, the feedback from the top down, changing assets and constituent systems which combine to produce worse system-of-systems level outcomes, demonstrates Strong Emergence (at minimum Type 3 and potentially Type 4).
33
Event #5 SUPERSTORM SANDY, USA
Date 22nd October to 2nd November 2012
Description In late 2012 Hurricane Sandy swept through the Caribbean and North America. Its effects were significant and wide-reaching. The impacts in New York are well documented and, despite a natural trigger, the subsequent investigation provide insights into the emergence of failure within an infrastructure system-of-systems. The details and quotes in this summary are taken from the comprehensive report published by the city into the event, and the lessons for moving forward: ‘A Stronger, More Resilient New York’ [89] The overall costs to the city was estimated at around $19 billion ($13 billion of damage and $6 billion of lost economic activity). In total 51sq miles of New York City flooded leading to the tragic loss of 43 lives. Almost 2 million people lost power, some prior to the storm as action was taken to protect the grid. Many impacts cascaded from this loss of power or from the direct impacts of the winds and flood water. While some of these impacts will be summarised, the focus here remains on the aspects that appear to show the characteristics of emergence. Electricity Utilities took pre-emptive action to protect their critical assets, constructing temporary barriers to protect against the predicted 11ft (3.4m) surge at Battery, Manhattan. The flood waters ultimately rose to 14ft (4.3m) overtopping some defences. Bowling Green, Fulton and Brighton Beach networks were shut down as a precaution. The structure of the energy transmission system meant that even those outside of the expected flood zone lost their supply, including New York Downtown Hospital. The storm caused power stations to shut down and the loss of interconnectors with neighbouring New Jersey. Key substations “including substations that, based on earlier surge forecasts, were not expected to be impacted” failed due to flooding. Some equipment was severely damaged by saltwater, others were so critical their damage led to grid level failures. Disruptions on the distribution level assets increased stresses on the transmission system. The transmission system bringing power in from the north of the city could not support the load. This situation would have been much worse had the event happened in the summer months. Some gas-fired power stations anticipated supply issues and switched to liquid fuel as a pre-emptive measure. They then had problems accessing enough supplies of liquid fuel. Fuel All petrol stations and fuel terminals in the metropolitan areas were offline for three days after the storm passed, 20% were still offline 7 days later. Police Officers were diverted to maintain order and traffic flow at the few operational stations. While some petrol stations lost power and therefore the ability to pump fuel, 90% of the affected stations were outside of the areas experiencing power outages and were not offline for first-order cascade failures. The largest disruption to liquid fuel provision arose from impacts to the supply chain, with refineries forced to shut due to storm damage and power outages. Some refineries lost power to their pumps, meaning they were unable to dispense fuel to tankers. Fuel tanks, pipelines, ports and other fuel infrastructure was damaged. Some refineries, that were otherwise unaffected by damage or power cuts were unable to receive deliveries due to restrictions placed on port traffic as a result of increased levels of debris in the water. The scale of the impacts and recovery was hampered by an inability to gather information on the state of the liquid fuel systems:
“a lack of available information on the operational status of terminals, pipelines, refineries, and other key infrastructure delayed situational awareness for several days. Duplicative efforts among different governmental entities to secure information further delayed diagnosis of the cause of the supply disruptions and resulted in conflicting reports and, at least initially, responses that did not properly address the underlying issues” [p136, 89]
Commercial supply agreements tied petrol stations into certain suppliers meaning they could not take advantage of alternative sources of fuel. Local, state and federal regulations restrict the movement of fuel into the city: “New York State’s price-gouging law, which was meant to prevent predatory price increases during emergencies, may actually have had the perverse effect of constraining fuel supply”. Retailers were unclear about how much they could raise prices to cover the additional costs
34
of transporting the fuel over longer distances. Significantly “personnel and entire fleets that were critical to storm response had difficulties refuelling”. This included hospital staff and utility engineers critical to restoring services. Telecommunications Telecommunication services were lost as a direct result of the loss of power, and in coastal areas, through direct damage to assets. Backup batteries powering mobile phone masts worked but could only provide power for 4 to 8 hours. Restoring services was hampered as engineers could not gain access to restricted bridges, having not been designated critical to recovery. Roads and subway services were flooded causing severe disruption to the transport networks. The loss of power made pumping or ‘dewatering’ the flooded subways problematic resulting in increased damage to sensitive equipment. Drinking water was maintained through most of the city, though power outages prevented pumping in high-rise buildings and a fire disrupted one treatment facility. Wastewater was affected with several sites discharging untreated or partially treated sewage due to flooding. General supplies were hampered as logistics operators were unable to source fuel. In some instances, they faced additional delays at bridge crossings that were restricted to multi-occupancy vehicles, delivery trucks being largely only operated by a single driver.
Emergence Clearly triggered by a natural hazard, the event has been widely studied as revealing inherent, hidden vulnerabilities within the structure of the system-of-systems. The introduction to the City of New York’s comprehensive review notes:
“Disruptions to some systems (such as power) affected the functioning of others (healthcare, transportation, and telecommunications, among others). The trials of some communities (flooding and power outages in hubs like Southern Manhattan) created tribulations for others (those living elsewhere who could not work because their offices could not open). The storm was a reminder of how interconnected the city’s systems are.” [p14, 89]
The full nature and consequences of the storm was unexpected and “took an improbable set of factors coming together in exactly the worst way” [p11, 89]. Waters being higher than anticipated is clearly a shortfall in prediction capability, but it is separate from whether the effects and failures within the infrastructure system-of-systems could have been expected. While many of the features and impacts are described as unexpected, in most cases the flooding of individual assets and disruption to services wouldn’t meet the criteria of novelty. Others have noted the combinatory effects, for example: “Extensive power outages made it more difficult to remove flood water from metro tunnels […]. The liquid fuel supply chain broke down due to direct flood damage to terminals, refineries and pipelines, combined with power outages and traffic restrictions on the waterways […]. The fuel shortage, in turn, affected emergency response services and efforts to restore power supply.” [11]. It is in these interdependency pathways from the local component level to the global system-of-systems and back down to the local components that situations could be said to exhibit Type 3 – Multiple Emergence. The local decision to improve energy security by pre-emptively switching some gas-fired power stations to liquid fuel actually left the electricity system more vulnerable and exacerbated fuel supply challenges. This is a form of unwanted synchronization and a common failure mode established. The lack of liquid fuel at petrol station forecourts was not a direct cascade failure from the power outages. The majority of the liquid fuel infrastructure within the city was not damaged and nor did it lose power. Instead disruptions resulted from a combination of geographically distant power outages, storm damage, commercial arrangements, legal restrictions and operational decision making within a different sector. As these factors combined, they created pressures that meant the public at large could not get to work, resources were diverted from recovery to maintaining order and most importantly, hampering recovery efforts as responders were unable to source fuel for their vehicles.
35
Event #6 STORM DESMOND, UK
Date 5th December 2015
Description Strom Desmond impacted large parts of the UK and resulted in the largest flood witnessed in the North East region of the UK in over 558 years, indeed a flood on such a scale is thought to have a recurrence of less than 1 in 2,200 years [90]. One energy provider reacted to previous floods in 2009 by spending £7.9m defending its substation infrastructure to similar events by raising flood barriers and installing high-capacity pumps. Unfortunately these defences were not adequate against the rainfall brought by Storm Desmond [91]. Many households and businesses were directly affected by flooding, with more affected by the subsequent disruptions to the electricity supply. PwC estimated the total economic costs of Storm Desmond in the region of £400-500 million [92]. As with many of the large-scale weather-related events within the broader collapse of the system are smaller examples of unexpected vulnerabilities. Traffic lights failed and garages could not sell fuel. Twenty-two bridges were damaged or destroyed, with 131 requiring inspection. [91] One village became completely cut off when its bridge collapsed while another town was divided in two until a temporary solution was installed the following year. For some, including children travelling to school, journeys increased from 20 minutes to 1.5 hours [91]. These had long-term impacts for local residents, but the short-term critical impacts on recovery and restoration efforts cannot be overlooked. High-rise buildings lost power and water. The railway was powered from outside the area, but the station was not and so was closed for safety reasons outside of daylight hours. Some shops were unable to open the following day due to flooding, while others that weren’t flooded couldn’t open due to lack of power. Lancaster escaped the worst of the direct impacts from the flooding but observed some cascading failures due to the loss of power, some of which result from the proactive decision to take a facility offline to avoid additional damage should it fail catastrophically. In some areas cash machines and card payment systems went down due to lack of power. This meant people could only pay for things with cash at a time when access to cash became challenging. “By 4pm, there were still many people wanting to buy groceries but, to comply with Sunday trading regulations, the supermarket closed. It was not obvious which national or local body had the power to relax these laws in an emergency.” [61] Lancaster Royal Infirmary had 14 days fuel and backup generator redundancy, but still experienced challenges as it became the central contact for all medical enquiries. It acted as a community centre, providing food and the capability for people to charge their electronic devices. Most worrying were problems with community care including the ability to perform home dialysis, monitor home care alarms or operate pharmacies [61] Mobile phone, television, radio and internet coverage was lost impacting recovery. One school in Lancaster reported that when power was lost to their security alarm the monitoring company, based in Belfast had no local knowledge of the situation and had trouble contacting any related parties [61]..As power was likely to be off for several days, Lancaster University made the decision to close for the winter break a week earlier than planned but relied on staff physically knocking on doors in accommodation blocks to inform students. As this communications relied on word of mouth it became corrupted: “According to the police, a crowd of several hundred overseas students arrived at Lancaster police station expecting to find transport.” [61].
Emergence The scale of the storm was unexpected and, as a record-breaking event, novel. But there is no suggestion that the triggering weather event was an emergent property of the infrastructure system-of-systems. Protecting against damage from another similar storm might detract resources from more fundamental changes that would protect the system against a whole range of triggering events from natural hazards to man-made disasters. What is observable from the event is the disconnect between a system that operates in an interdependent way, and its governance that remains fragmented. In this dichotomy issues emerge from a combination of interactions between components, and up-and-down the hierarchies of control.

36
A report by the Royal Academy of Engineering, Institution of Engineering and Technology and Lancaster University refers to the infrastructure as a “complex and brittle system”. It is critical of the loss of an overall ‘system architect’ lamenting “Subsequent reorganisation, nationalisation, privatisation, restructuring and the contracting out of services, resulted in the services now being run by a large number of organisations, contractors and subcontractors held together by a web of scores of commercial contracts, with no one having an overall view of ‘the system’.” [61]. This report claims commercial or regulatory pressures incentivised some actors in ways that worked against the resilience of the system-of-systems, principally by improving efficiency at the expense of redundancy (Type 2 Moderated Emergence). This is often also characterised as locally adaptive decisions that are globally maladaptive.
37
Event #7 LOW FREQUENCY DEMAND DISRUPTION, UK
Date 9th August 2019
Description Just before 5pm on Friday 9th August 2019 two electricity generation facilities tripped in quick succession following a lightning strike on a transmission cable, reducing supply to the grid and, causing fluctuations in frequency of supply. Frequency is normally maintained at 50Hz (+/- 0.5Hz), but in this event the frequency dropped below 49Hz (reaching a low of 48.8Hz) for 33 seconds. According to a report by the Emergencies Executive Committee [93], the transmission network protection system cleared the lightning strike, but this was followed by the loss of a turbine at Little Barford Power Station due initially to a discrepancy between speed readings on the turbine shaft the cause of which is unknown. Hornsea-1’s voltage control system initially reacted to fluctuations from the lightning strike at a local level but then “responded unexpectedly” activating protection systems which de-loaded two units. The control system had some elements that assumed all three units at Hornsea-1 would be operational, but at this point one was running at a reduced load for testing. Some embedded generators (those connected to the distribution grid not the transmission network) also failed though five different modes. Two were related to planned protection systems relating to the rate of change in the system, though it is noted “the losses on the day [from this planned trip] were higher than expected”. 200MW were lost when the frequency dropped to 49Hz (“this was not expected”) and the fourth mode involved an “unexpected increase in electricity demand” occurring concurrently. A final loss of 550MW occurred when the Low Frequency Demand Disconnection (LFDD) process was initiated. The total loss from embedded generators was around the same as from the two large suppliers that initiated the fluctuation. Around 1.1 million customers were disconnected as pre-agreed with Distribution Network Operators (DNOs) though the LFDD. The grid was returned within 14 minutes. DNOs reconnected all customers within 45 minutes. Newcastle airport was disconnected as part of the load management process, its back-up generators initiating as designed .A second airport was not disconnected but temporarily switched to its back-up generators, revealing a latent fault with the internal network that means some services (e.g. check-in and baggage screening) were unavailable for 50 minutes. Ipswich Hospital lost power due to its own protection systems. Ipswich Hospital was not disconnected from the grid. Its own protection system reacted to the fluctuation in frequency by switching the hospital to its own 11 back-up generators, one of which then failed to operate. A further two hospitals were disconnected and their back-up generation worked as designed. Around 3,000 people lost water for ~30 minutes when the associated booster water pumping stations failed to switch to their back-up generators. An oil refinery initiated a controlled shut-down process and then took several weeks (as is normal) to be fully operational [94] The rail network (signalling etc.) was prioritised as an essential service and power maintained, however rail services were still significantly affected into the following day as some trains require attention from engineers. BS EN 50163:2004 specifies rail systems have traction power resilient to lower frequencies of 47Hz, though are only required to operate normally between 49Hz and 51Hz. While most trains were unaffected, onboard protection systems shut down 29 trains within 200ms of the frequency dropping below 49Hz. Seven of these could be reset by the driver but 22 could only be reset by a technician. An additional 2 trains unaffected by the frequency variation were effectively trapped by those that had shut themselves down. Subsequent investigations noted that the trains were in the process of a staged software upgrade. Those operating version 3.27.x were locked out permanently and required an engineer to reset them, while those operating 3.25.x were able to be reset by the driver. The updated software was intended to prevent a known safety issue wherein the system initiated a lock-out on experiencing an out of specification event, the driver reset the system to remove the lock-out without knowing the causes for the lock-out, and in doing so places the system back into an out of specification and potentially unsafe
38
condition [95]. A low power frequency was identified as such an event that would warrant permanent lock-out. The ORR report into the event postulates that as a lock-out is only required when the power supply frequency is out of the acceptable range, the system could be designed such that it automatically resets once the power supply frequency returns to the acceptable level. They write: “the service-disrupting implications of imposing a lock-out requiring a driver or – as in this case – a technician to reset appear not to have been given weight when developing the protection parameters for the on-train software” [95]. They go one to say that the trains’ collective response was “in accordance with the software design, but was not an explicit intention”. This record that the train operated as intended by Siemens, published by the ORR in January 2020, seemingly contradicts a technical report provided to National Grid by Govia Thameslink Railway, published in September 2019. This very explicitly states: “Siemens have also clarified that there should not have been a Permanent Lockout on the train following a protective shutdown caused by a supply voltage frequency drop. All trains should have been recoverable via Battery Reset whereas 30 trains were not recoverable. This was not the intended behaviour of the train.” They go on to say: “the affected Class 700 and 717 sets did not react according to their design intent in these circumstances. The risk of this happening was not known prior to the power event on Friday 9 August.”
Emergence It is useful to consider the event in terms of three constituent parts: 1. The concurrent disconnection of two generators 2. The disconnection and maintenance of supply to essential services 3. The interactions between the rail and energy systems
The event was initiated by two concurrent and related failures. National Grid’s initial investigation concluded that the incident was dealt with “in line with the design and in compliance with the Grid Code requirements on fault clearance”[96]. In other words, the local recovery of the national power system occurred as intended. The decisions made within the energy grid (local adaptations) to minimise impacts had significant consequences on other dependent systems and therefore on global system-of-systems level outcomes such as mobility and connectivity. It is possible that a more globally optimal course of action could have been taken at the local level, but knowing this would require a review of the options that could have been taken and an ability to track their consequences through the system-of-systems. Distributed generators disconnected through modes relating to actions to balance the grid. This also illustrates aspects of unwanted synchronization as normally uncorrelated constituent systems were correlated through global influences. The frequency was returned to 50Hz within 3 minutes and 36 seconds, though this is somewhat moot as the affected trains locked themselves out in 0.2seconds of frequency dropping to 49Hz. Neither Ipswich Hospital nor Newcastle Airport were in protected zones that would prevent their power from being cut. In their interim report, the Department for Business, Energy and Industrial Strategy [94] questions why some essential service providers were on the list for low frequency demand disconnection (“work is required to develop a shared understanding between electricity network companies and essential services of how electricity disruptions affect the services that people rely on every day”) and suggest further study to understand the range of events and conditions it is suitable to disconnect these services and to ensure appropriate mitigation is in place. The final report suggests that to prevent such events cross-sector dependencies must be understood [p18, 93]. Most systems appear to have operated as intended though the consequences were unforeseen. The case illustrates the important role of automated control systems making decisions based on limited available evidence and anticipated scenarios and conditions. The involvement of such automation is predicted to increase.
39
Event #8 VICTORIA & LONDON BRIDGE DISRUPTION, UK
Date 18th December 2019
Description A power surge increased the voltage to signalling systems for 20 seconds. The systems are designed to cope with voltage fluctuations, but 20 seconds is unusually long. Four rail signalling control systems shut themselves down in response to the power surge, causing all signals to turn red in the East Croydon, Selhurst, Norwood Junction and Streatham areas. Four separate systems (including one that allows control centres to talk to local signals on the ground) locked themselves out to prevent damage from the surge. Had they not locked themselves out, the disruption may have been more severe as components would require replacing [63].
Backup power systems did not engage as they are configured to only do so when power is lost from the supply, not when the supply surges or when the rail systems lock themselves out from the supply.
Network Rail’s Managing Director for the Southern Region wrote: “We have three different power supplies that we can switch between: two railway supplies that can be fed independently, and the domestic power supply to people’s houses. Because there was no actual power failure – the power was never interrupted – these systems were not triggered.” [63].
Services stopped completely for an hour at one of their busiest times during the evening commute. Disruption lasted until the following morning. Had the systems not locked themselves out they may have been more damaged. Technicians reset the system within an hour. There are three separate back-up power systems but these were not triggered as there was no loss of power.
Emergence In response to the event Network Rail’s Managing Director for the Southern Region was cautious to avoid placing undue prominence on the upstream dependencies: “We recognise it would be easy to look for others to blame in these situations but the reality is that while our power supply is very reliable, we still have to review our equipment to make us more resilient in future.”
This seemingly discourages any attempt to see the event as a simple cascade failure that can be conceptualised as the consequences of a root cause to be found elsewhere in the system-of-systems. This search for the root cause can distract from attempts to understand more complex interactions within the system-of-systems [45]. This speaks to the concept of Safety II [47] and the notion of stochastic resonance across infrastructure systems [97]. Safety-II believes a system’s reliability is related to its ability to adapt and cope with variation and that significant disruptions can occur at the system-of-systems level without any component parts failing.
The failure of backup systems to engage represents a form of moderated emergent misbehaviour that sits somewhere between deadlock and livelock. The system behaved as designed but the signals from the global level were not sufficient to initiate the necessary corrective actions among the constituent systems.
The event cannot be traced to the failure of a single individual system. This event exhibits an aspect of emergence in the sense that no components failed or operated differently from their designed intentions. Indeed, the very fact that the power system itself did not critically fail is key factor in the event’s occurrence.
The overvolt event could be anticipated and though the probability is low - and could be described as unexpected - it is nonetheless the sort of event that requires the signals to have a fail-safe design. There are outstanding questions as to whether the voltage fluctuations were within agreed limits, or whether there even are agreed acceptable durations of such variance. The fail-safe design is itself an acceptance of the inability to predict every potential disruption. The need to physically reset the equipment in this event may also be further evidence to suggest that any procedural system based on reacting to all anticipated scenarios had done all it could, and the final preventative measure of disconnection was required. Despite this, the event would be unlikely to meet any threshold above very weak emergence. It does however highlight important considerations over the resilience. In many ways the automatic disconnection is an act of resilience, limiting additional damage and ensuring more rapid recovery than would arise from having to replace damaged components. But this is not to say that the sensitivity or scale of disruption could not be further minimised. For example, if power to the communication systems could be maintained then there is a possibility the signals could be reset from a control centre without the need for manual interventions.
40
3 SYSTEM MODELLING MATURITY
If it is accepted that the above cases exhibit features of emergent phenomena and such phenomena
are characterised by their radical novelty and unexpected nature, then reducing their
occurrence/impacts essentially leaves two options: (i) improve the anticipation of such radically novel
and currently unexpected events and/or (ii) accept a limit to anticipation and improve event agnostic
resilience of the system-of-systems. The first attempts to reduce the epistemic uncertainty. This
might mean addressing the way in which potential events are currently identified, gathering more
data, gathering different data, using different model, improving modelling capabilities etc. The
novelty and unexpected nature of the events is removed by virtue of essentially looking harder, or
differently. Current approaches may shape the way in which we look and therefore the sorts of
possibilities that are identified, or more crucially, not identified. There is a limit to the efficacy of this
if, as the emergence theorist suggest, strong/spooky or other higher order concepts of emergence
exist.
The second addresses the novelty and unexpected nature of the events, sidestepping the challenges
of strong/spooky emergence. Even if emergence is a temporarily subjective notion, these efforts still
aim to make the system more reliable. Both options require different approaches to those currently
in widespread use.
This Chapter sets out the case for modelling approaches that differ from those in most common use
by considering why such conventional approaches are limited in their attempts to handle emergence.
The three approaches outlined here have the potential to reduce epistemic uncertainty by providing
a perspective on the nature of emergent system-of-systems failures not offered by more commonly
used tools. In addition to this AcciMapping and the Systems Theoretic Accident Model and Process
provide insights into the control structure of complex systems-of-systems which allow for them to be
engineered in ways that make them more resilient to unanticipated events.
The Chapter also summarises an assessment of the maturity of tools that claim to be better suited to
tackle the challenges of emergence before outlining such tools and evaluating their maturity based on
previous work by Underwood and Waterson [98]. Previous reviews [52,99,100] highlight such
qualitative and semi-quantitative methods as network and graph theory, topological models, petri-
nets, input-output models, agent based models, spatial and time series analysis, matrix
representations and hierarchical models. The strengths of such approaches in dealing with emergence
come from their ability to model interdependencies within the infrastructure system-of-systems.
Kroger and Nan [101] differentiate between knowledge-based and model-based approaches for
understanding infrastructure interdependencies providing insight into emergent failures. Knowledge-
based approaches aim to structure available information and tend to be easier to understand whereas
model-based approaches require mathematically characterisation and as such offer the promise of
deeper analysis. A study of 162 papers published into infrastructure interdependency modelling
identified 40 different approaches, with the most commonly used being network/graph theory and
input-output models (accounting for around 22% of papers each) [102]. These approaches have their
limitations, for example input-output models do not capture geographic interdependencies [100]. In
fact very few approaches have been found to address both functional and geographic relationships
between infrastructure systems [103]. This is not a failing of these modelling tools which do not claim
to capture all types of relationships. Interpreting the models as if they do capture all the ways in which
the state of one constituent system can affect another is however hazardous. Eusgeld argued that the
classic reliability theories being used to predict complex infrastructure system behaviours “lack the
41
capability to completely capture the underlying structure of the system and the ability to adapt to
failures” [78].
3.1 ISSUES WITH TRADITIONAL APPROACHES Traditional approaches being used to understand and predict complex emergent behaviours in
infrastructure systems have been shown to exhibit similar inherent issues.
Traditional methods are Reductionist...
Higher order forms of emergence cannot be deduced by reducing the whole to its constituent parts.
As Rasmussen writes “The usual approach to modelling socio-technical systems is by decomposition
into elements that are modelled separately. This has some peculiar effects.” [p186, 86]. Reduction to
the parts results in a reduced understanding of the global behaviour of the system [104]. This is
particularly relevant when considering reliability and risk as these are themselves emergent properties
with dimensions that only have meaning at the system-of-systems level [22,23]. The safety or
reliability of a component has little meaning out of the system context. A component may be safe in
isolation or in a certain system, but unsafe in another [25] therefore it must be considered in terms of
its interactions and purpose.
Traditional methods are based on sequential chains of causality and tend to ignore feedback...
The use of sequential chains of causality work for simple systems experiencing component failure, but
do not work for complex systems [25,105,106]. The use of sequential chains, the earliest form of
accident model, is a specific type of reductionist decomposition. Despite theoretical progression to
more advanced models this view still plays an important role in organising data. In a recent review,
Leveson [107] summarised some of the ways in which event chains could be problematic:
• They do not cover non-linear interactions distant in time and space.
• They do not cover situations where no component explicitly failed.
• They do not go far enough in time to capture slow migrations or drift.
• They do not adequately cope with human decision making and associated mistakes.
Additionally, they tend to only capture a particular series of events, not the varying functionality of
the system [86] and importantly, this simplified view is not backed by empirical evidence [23].
Sequential, event-chain based models are also challenging because they force the idea of an initiating
Root Cause. The frame of reference or paradigm of those conducting the investigation can influence
the identification of a Root Cause, with a tendency to stop when information becomes harder to find,
when a familiar cause is identified, or when a cause with a known cure is found [108]. This influence
of sequential chains has been called “root cause seduction” [109,110]. It leads to the view that global
issues can be addressed by improving local component reliability. This is an attractive course of action
as it carries a perceived certainty that a ‘fix’ has been implemented, while acknowledging the
complexity can bring a sense of hopelessness [110].
Feedback between constituent systems or as mediated through the system-of-systems and downward
causation are the source of “unexpected, counter intuitive, emergent properties” [p620, 104] and yet
these are overlooked by sequential models. It has been suggested that it is possible to “tame
complexity through new forms of feedback” [22] but this requires first understanding the underlying
structure of the system in these terms, something that is not possible when using the types of models.
The current methods are non-contextual and focus on the local level...
It has already been argued that focussing solely at the local level of analysis is anathema to fully
understanding emergence at the global level. It is therefore relevant to note that many approaches
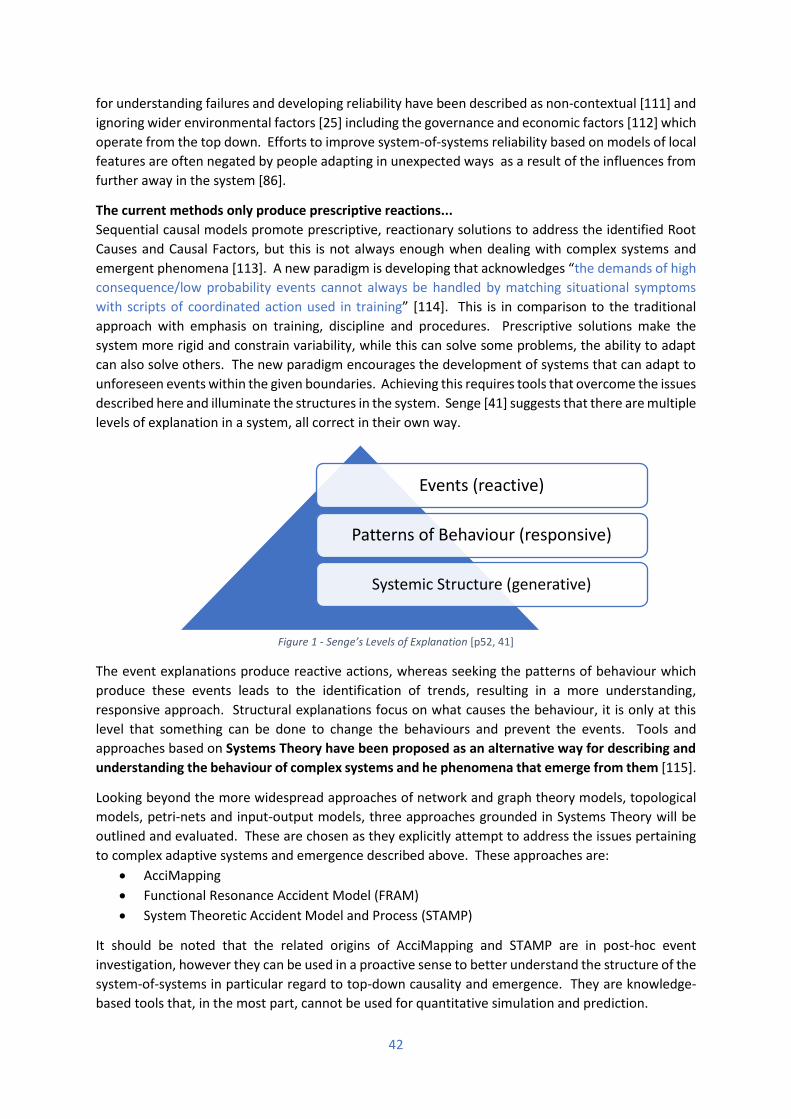
42
for understanding failures and developing reliability have been described as non-contextual [111] and
ignoring wider environmental factors [25] including the governance and economic factors [112] which
operate from the top down. Efforts to improve system-of-systems reliability based on models of local
features are often negated by people adapting in unexpected ways as a result of the influences from
further away in the system [86].
The current methods only produce prescriptive reactions...
Sequential causal models promote prescriptive, reactionary solutions to address the identified Root
Causes and Causal Factors, but this is not always enough when dealing with complex systems and
emergent phenomena [113]. A new paradigm is developing that acknowledges “the demands of high
consequence/low probability events cannot always be handled by matching situational symptoms
with scripts of coordinated action used in training” [114]. This is in comparison to the traditional
approach with emphasis on training, discipline and procedures. Prescriptive solutions make the
system more rigid and constrain variability, while this can solve some problems, the ability to adapt
can also solve others. The new paradigm encourages the development of systems that can adapt to
unforeseen events within the given boundaries. Achieving this requires tools that overcome the issues
described here and illuminate the structures in the system. Senge [41] suggests that there are multiple
levels of explanation in a system, all correct in their own way.
Figure 1 - Senge’s Levels of Explanation [p52, 41]
The event explanations produce reactive actions, whereas seeking the patterns of behaviour which
produce these events leads to the identification of trends, resulting in a more understanding,
responsive approach. Structural explanations focus on what causes the behaviour, it is only at this
level that something can be done to change the behaviours and prevent the events. Tools and
approaches based on Systems Theory have been proposed as an alternative way for describing and
understanding the behaviour of complex systems and he phenomena that emerge from them [115].
Looking beyond the more widespread approaches of network and graph theory models, topological
models, petri-nets and input-output models, three approaches grounded in Systems Theory will be
outlined and evaluated. These are chosen as they explicitly attempt to address the issues pertaining
to complex adaptive systems and emergence described above. These approaches are:
• AcciMapping
• Functional Resonance Accident Model (FRAM)
• System Theoretic Accident Model and Process (STAMP)
It should be noted that the related origins of AcciMapping and STAMP are in post-hoc event
investigation, however they can be used in a proactive sense to better understand the structure of the
system-of-systems in particular regard to top-down causality and emergence. They are knowledge-
based tools that, in the most part, cannot be used for quantitative simulation and prediction.
Events (reactive)
Patterns of Behaviour (responsive)
Systemic Structure (generative)
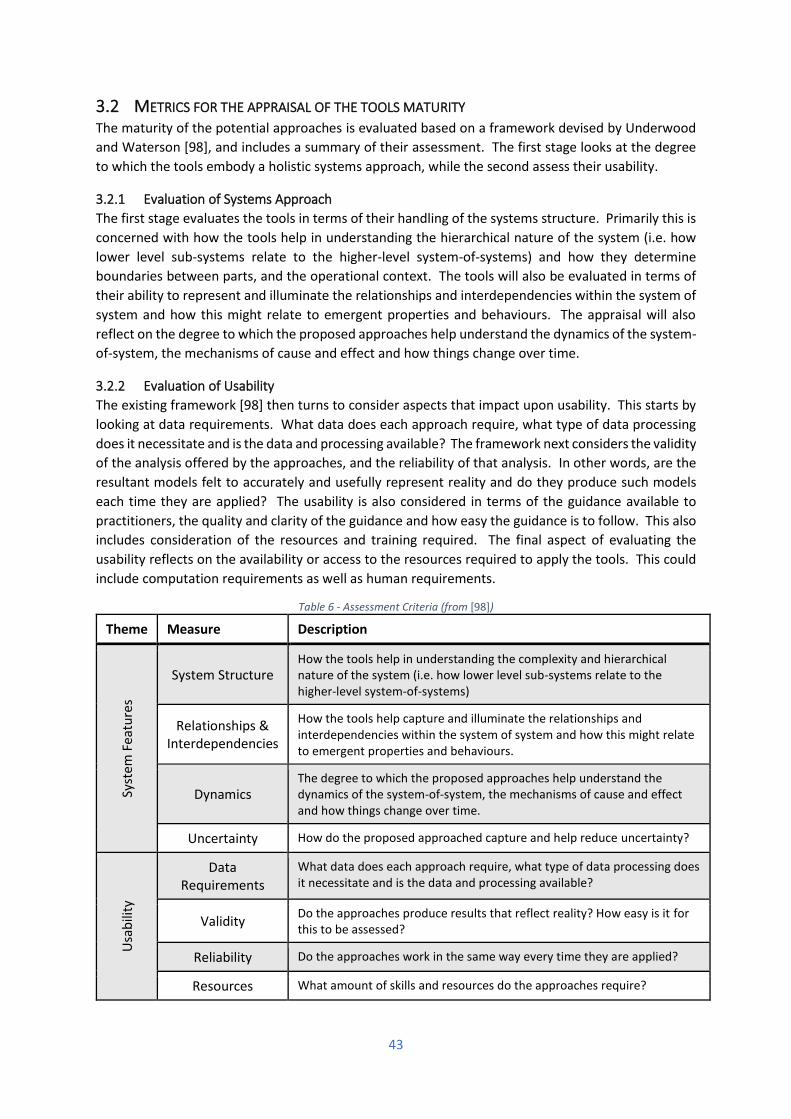
43
3.2 METRICS FOR THE APPRAISAL OF THE TOOLS MATURITY The maturity of the potential approaches is evaluated based on a framework devised by Underwood
and Waterson [98], and includes a summary of their assessment. The first stage looks at the degree
to which the tools embody a holistic systems approach, while the second assess their usability.
3.2.1 Evaluation of Systems Approach
The first stage evaluates the tools in terms of their handling of the systems structure. Primarily this is
concerned with how the tools help in understanding the hierarchical nature of the system (i.e. how
lower level sub-systems relate to the higher-level system-of-systems) and how they determine
boundaries between parts, and the operational context. The tools will also be evaluated in terms of
their ability to represent and illuminate the relationships and interdependencies within the system of
system and how this might relate to emergent properties and behaviours. The appraisal will also
reflect on the degree to which the proposed approaches help understand the dynamics of the system-
of-system, the mechanisms of cause and effect and how things change over time.
3.2.2 Evaluation of Usability
The existing framework [98] then turns to consider aspects that impact upon usability. This starts by
looking at data requirements. What data does each approach require, what type of data processing
does it necessitate and is the data and processing available? The framework next considers the validity
of the analysis offered by the approaches, and the reliability of that analysis. In other words, are the
resultant models felt to accurately and usefully represent reality and do they produce such models
each time they are applied? The usability is also considered in terms of the guidance available to
practitioners, the quality and clarity of the guidance and how easy the guidance is to follow. This also
includes consideration of the resources and training required. The final aspect of evaluating the
usability reflects on the availability or access to the resources required to apply the tools. This could
include computation requirements as well as human requirements.
Table 6 - Assessment Criteria (from [98])
Theme Measure Description
Syst
em F
eatu
res
System Structure How the tools help in understanding the complexity and hierarchical nature of the system (i.e. how lower level sub-systems relate to the higher-level system-of-systems)
Relationships & Interdependencies
How the tools help capture and illuminate the relationships and interdependencies within the system of system and how this might relate to emergent properties and behaviours.
Dynamics The degree to which the proposed approaches help understand the dynamics of the system-of-system, the mechanisms of cause and effect and how things change over time.
Uncertainty How do the proposed approached capture and help reduce uncertainty?
Usa
bili
ty
Data Requirements
What data does each approach require, what type of data processing does it necessitate and is the data and processing available?
Validity Do the approaches produce results that reflect reality? How easy is it for this to be assessed?
Reliability Do the approaches work in the same way every time they are applied?
Resources What amount of skills and resources do the approaches require?
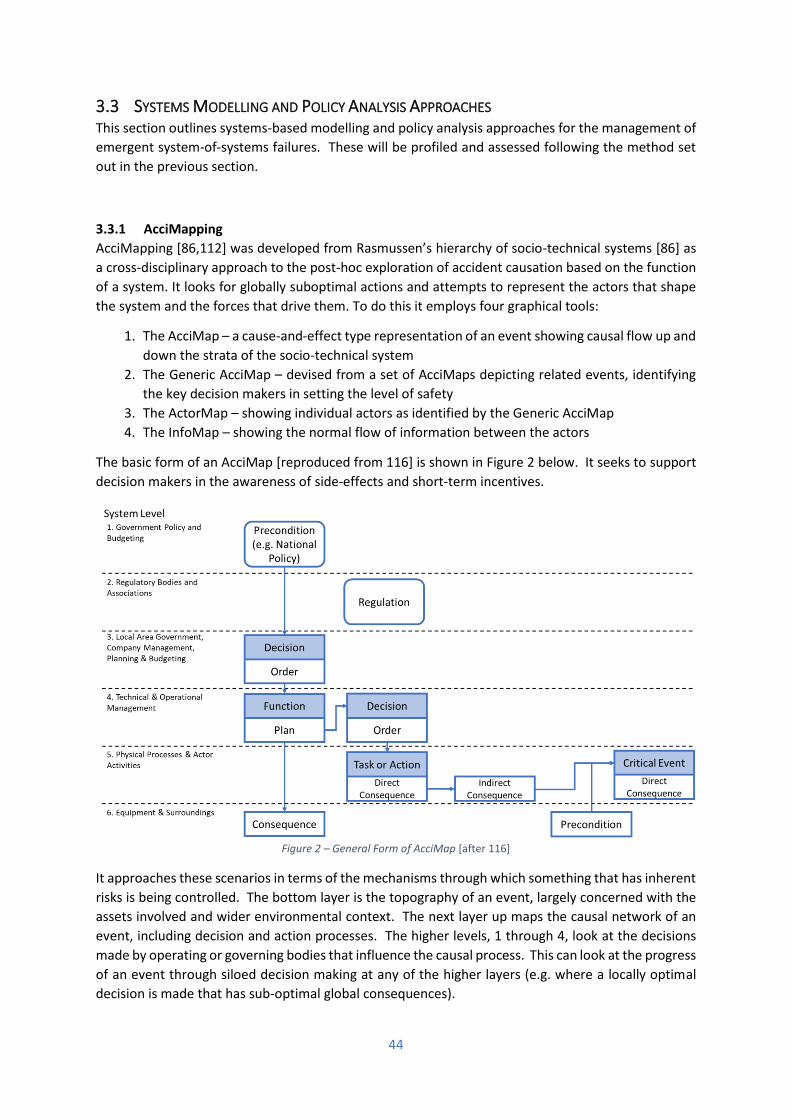
44
3.3 SYSTEMS MODELLING AND POLICY ANALYSIS APPROACHES This section outlines systems-based modelling and policy analysis approaches for the management of
emergent system-of-systems failures. These will be profiled and assessed following the method set
out in the previous section.
3.3.1 AcciMapping
AcciMapping [86,112] was developed from Rasmussen’s hierarchy of socio-technical systems [86] as
a cross-disciplinary approach to the post-hoc exploration of accident causation based on the function
of a system. It looks for globally suboptimal actions and attempts to represent the actors that shape
the system and the forces that drive them. To do this it employs four graphical tools:
1. The AcciMap – a cause-and-effect type representation of an event showing causal flow up and
down the strata of the socio-technical system
2. The Generic AcciMap – devised from a set of AcciMaps depicting related events, identifying
the key decision makers in setting the level of safety
3. The ActorMap – showing individual actors as identified by the Generic AcciMap
4. The InfoMap – showing the normal flow of information between the actors
The basic form of an AcciMap [reproduced from 116] is shown in Figure 2 below. It seeks to support
decision makers in the awareness of side-effects and short-term incentives.
Figure 2 – General Form of AcciMap [after 116]
It approaches these scenarios in terms of the mechanisms through which something that has inherent
risks is being controlled. The bottom layer is the topography of an event, largely concerned with the
assets involved and wider environmental context. The next layer up maps the causal network of an
event, including decision and action processes. The higher levels, 1 through 4, look at the decisions
made by operating or governing bodies that influence the causal process. This can look at the progress
of an event through siloed decision making at any of the higher layers (e.g. where a locally optimal
decision is made that has sub-optimal global consequences).
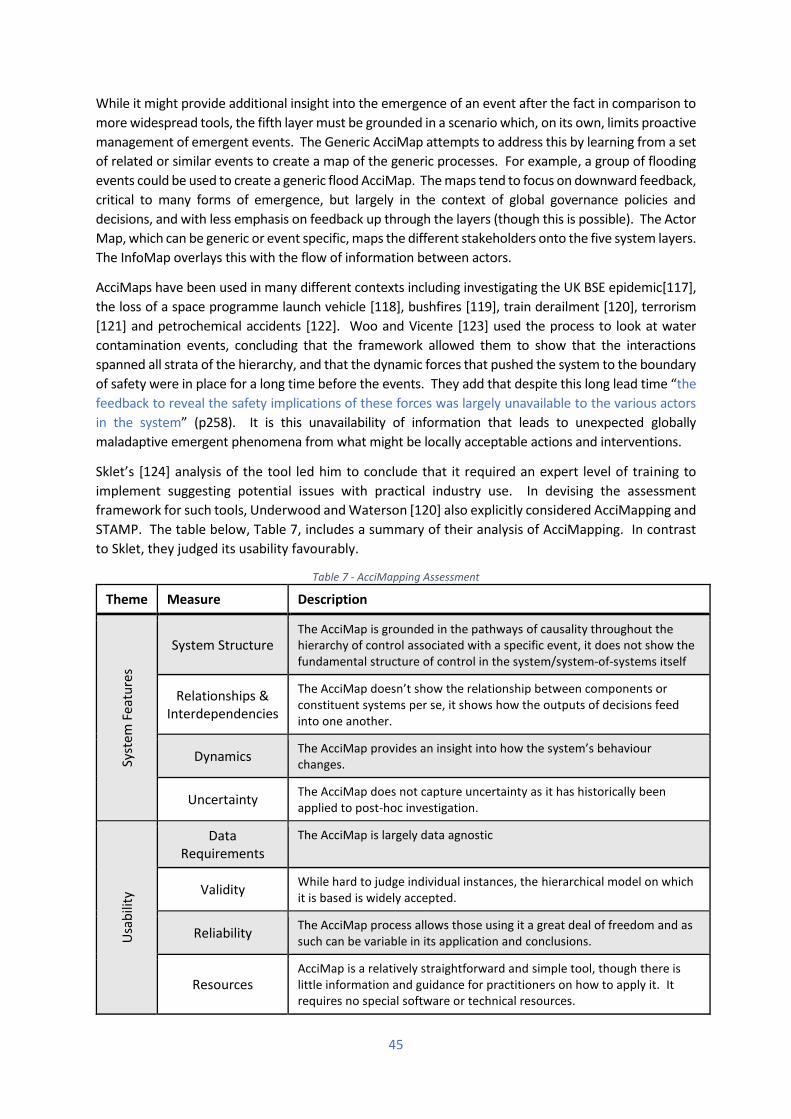
45
While it might provide additional insight into the emergence of an event after the fact in comparison to
more widespread tools, the fifth layer must be grounded in a scenario which, on its own, limits proactive
management of emergent events. The Generic AcciMap attempts to address this by learning from a set
of related or similar events to create a map of the generic processes. For example, a group of flooding
events could be used to create a generic flood AcciMap. The maps tend to focus on downward feedback,
critical to many forms of emergence, but largely in the context of global governance policies and
decisions, and with less emphasis on feedback up through the layers (though this is possible). The Actor
Map, which can be generic or event specific, maps the different stakeholders onto the five system layers.
The InfoMap overlays this with the flow of information between actors.
AcciMaps have been used in many different contexts including investigating the UK BSE epidemic[117],
the loss of a space programme launch vehicle [118], bushfires [119], train derailment [120], terrorism
[121] and petrochemical accidents [122]. Woo and Vicente [123] used the process to look at water
contamination events, concluding that the framework allowed them to show that the interactions
spanned all strata of the hierarchy, and that the dynamic forces that pushed the system to the boundary
of safety were in place for a long time before the events. They add that despite this long lead time “the
feedback to reveal the safety implications of these forces was largely unavailable to the various actors
in the system” (p258). It is this unavailability of information that leads to unexpected globally
maladaptive emergent phenomena from what might be locally acceptable actions and interventions.
Sklet’s [124] analysis of the tool led him to conclude that it required an expert level of training to
implement suggesting potential issues with practical industry use. In devising the assessment
framework for such tools, Underwood and Waterson [120] also explicitly considered AcciMapping and
STAMP. The table below, Table 7, includes a summary of their analysis of AcciMapping. In contrast
to Sklet, they judged its usability favourably.
Table 7 - AcciMapping Assessment
Theme Measure Description
Syst
em F
eatu
res
System Structure The AcciMap is grounded in the pathways of causality throughout the hierarchy of control associated with a specific event, it does not show the fundamental structure of control in the system/system-of-systems itself
Relationships & Interdependencies
The AcciMap doesn’t show the relationship between components or constituent systems per se, it shows how the outputs of decisions feed into one another.
Dynamics The AcciMap provides an insight into how the system’s behaviour changes.
Uncertainty The AcciMap does not capture uncertainty as it has historically been applied to post-hoc investigation.
Usa
bili
ty
Data Requirements
The AcciMap is largely data agnostic
Validity While hard to judge individual instances, the hierarchical model on which it is based is widely accepted.
Reliability The AcciMap process allows those using it a great deal of freedom and as such can be variable in its application and conclusions.
Resources AcciMap is a relatively straightforward and simple tool, though there is little information and guidance for practitioners on how to apply it. It requires no special software or technical resources.
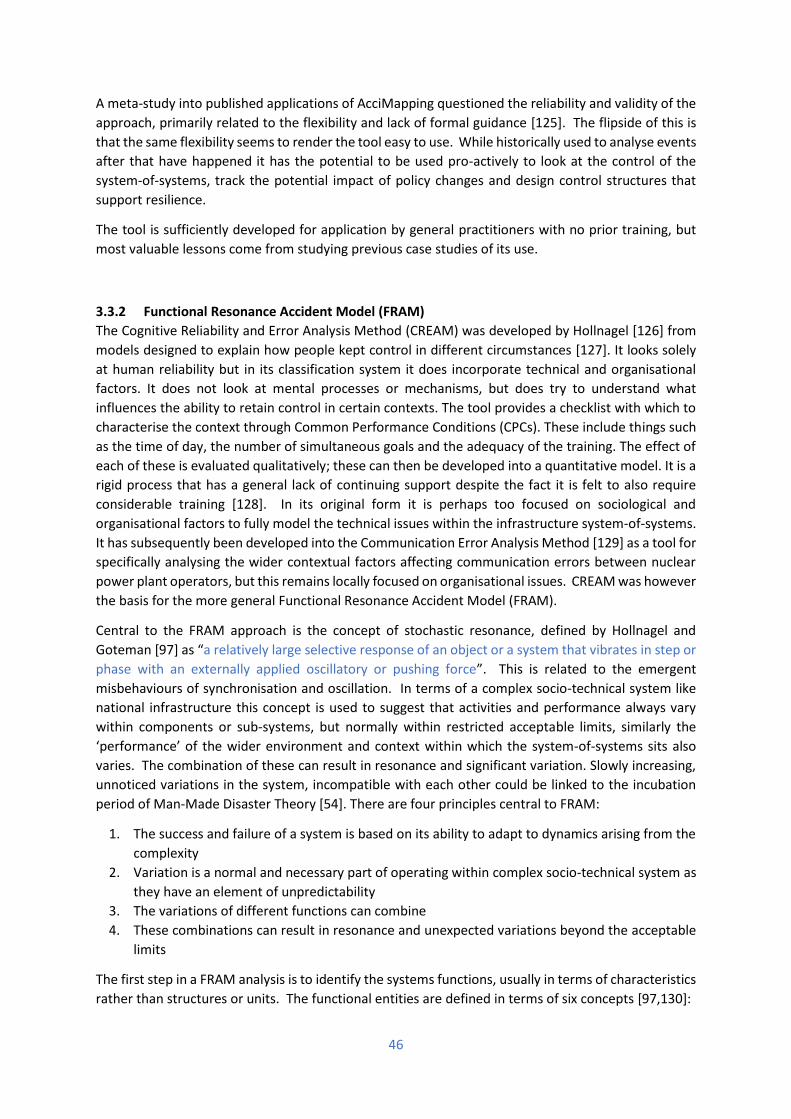
46
A meta-study into published applications of AcciMapping questioned the reliability and validity of the
approach, primarily related to the flexibility and lack of formal guidance [125]. The flipside of this is
that the same flexibility seems to render the tool easy to use. While historically used to analyse events
after that have happened it has the potential to be used pro-actively to look at the control of the
system-of-systems, track the potential impact of policy changes and design control structures that
support resilience.
The tool is sufficiently developed for application by general practitioners with no prior training, but
most valuable lessons come from studying previous case studies of its use.
3.3.2 Functional Resonance Accident Model (FRAM)
The Cognitive Reliability and Error Analysis Method (CREAM) was developed by Hollnagel [126] from
models designed to explain how people kept control in different circumstances [127]. It looks solely
at human reliability but in its classification system it does incorporate technical and organisational
factors. It does not look at mental processes or mechanisms, but does try to understand what
influences the ability to retain control in certain contexts. The tool provides a checklist with which to
characterise the context through Common Performance Conditions (CPCs). These include things such
as the time of day, the number of simultaneous goals and the adequacy of the training. The effect of
each of these is evaluated qualitatively; these can then be developed into a quantitative model. It is a
rigid process that has a general lack of continuing support despite the fact it is felt to also require
considerable training [128]. In its original form it is perhaps too focused on sociological and
organisational factors to fully model the technical issues within the infrastructure system-of-systems.
It has subsequently been developed into the Communication Error Analysis Method [129] as a tool for
specifically analysing the wider contextual factors affecting communication errors between nuclear
power plant operators, but this remains locally focused on organisational issues. CREAM was however
the basis for the more general Functional Resonance Accident Model (FRAM).
Central to the FRAM approach is the concept of stochastic resonance, defined by Hollnagel and
Goteman [97] as “a relatively large selective response of an object or a system that vibrates in step or
phase with an externally applied oscillatory or pushing force”. This is related to the emergent
misbehaviours of synchronisation and oscillation. In terms of a complex socio-technical system like
national infrastructure this concept is used to suggest that activities and performance always vary
within components or sub-systems, but normally within restricted acceptable limits, similarly the
‘performance’ of the wider environment and context within which the system-of-systems sits also
varies. The combination of these can result in resonance and significant variation. Slowly increasing,
unnoticed variations in the system, incompatible with each other could be linked to the incubation
period of Man-Made Disaster Theory [54]. There are four principles central to FRAM:
1. The success and failure of a system is based on its ability to adapt to dynamics arising from the
complexity
2. Variation is a normal and necessary part of operating within complex socio-technical system as
they have an element of unpredictability
3. The variations of different functions can combine
4. These combinations can result in resonance and unexpected variations beyond the acceptable
limits
The first step in a FRAM analysis is to identify the systems functions, usually in terms of characteristics
rather than structures or units. The functional entities are defined in terms of six concepts [97,130]:
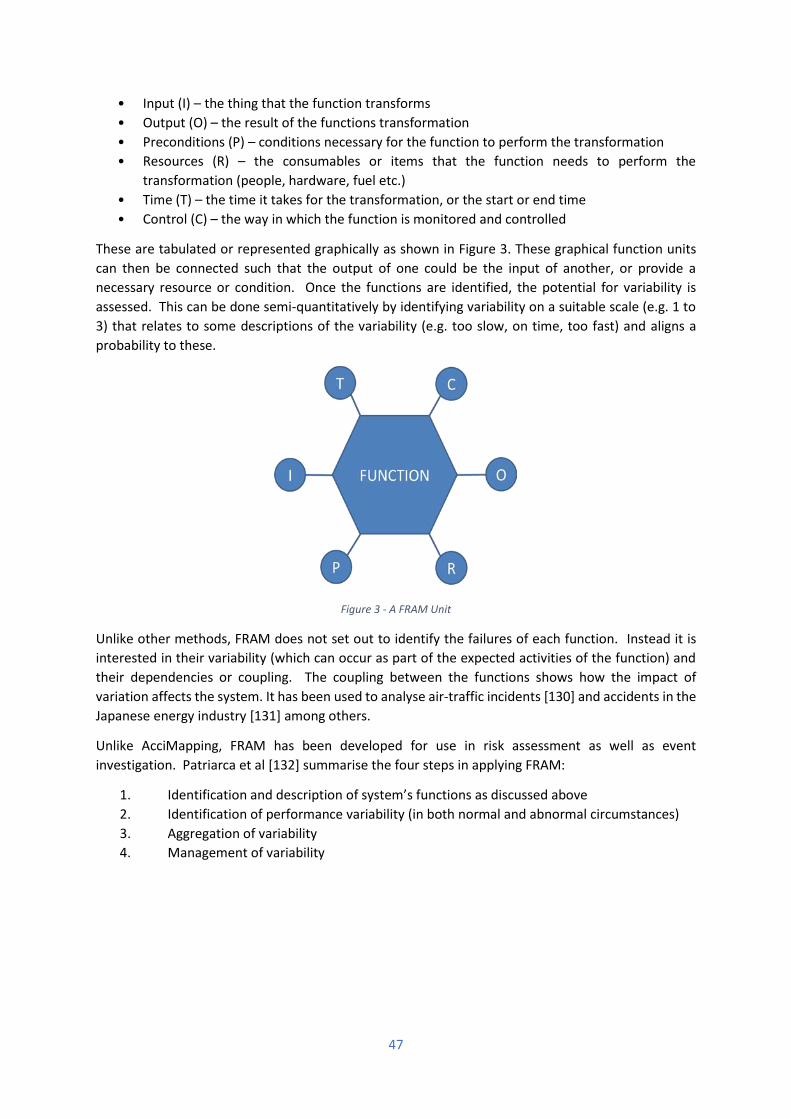
47
• Input (I) – the thing that the function transforms
• Output (O) – the result of the functions transformation
• Preconditions (P) – conditions necessary for the function to perform the transformation
• Resources (R) – the consumables or items that the function needs to perform the
transformation (people, hardware, fuel etc.)
• Time (T) – the time it takes for the transformation, or the start or end time
• Control (C) – the way in which the function is monitored and controlled
These are tabulated or represented graphically as shown in Figure 3. These graphical function units
can then be connected such that the output of one could be the input of another, or provide a
necessary resource or condition. Once the functions are identified, the potential for variability is
assessed. This can be done semi-quantitatively by identifying variability on a suitable scale (e.g. 1 to
3) that relates to some descriptions of the variability (e.g. too slow, on time, too fast) and aligns a
probability to these.
Figure 3 - A FRAM Unit
Unlike other methods, FRAM does not set out to identify the failures of each function. Instead it is
interested in their variability (which can occur as part of the expected activities of the function) and
their dependencies or coupling. The coupling between the functions shows how the impact of
variation affects the system. It has been used to analyse air-traffic incidents [130] and accidents in the
Japanese energy industry [131] among others.
Unlike AcciMapping, FRAM has been developed for use in risk assessment as well as event
investigation. Patriarca et al [132] summarise the four steps in applying FRAM:
1. Identification and description of system’s functions as discussed above
2. Identification of performance variability (in both normal and abnormal circumstances)
3. Aggregation of variability
4. Management of variability
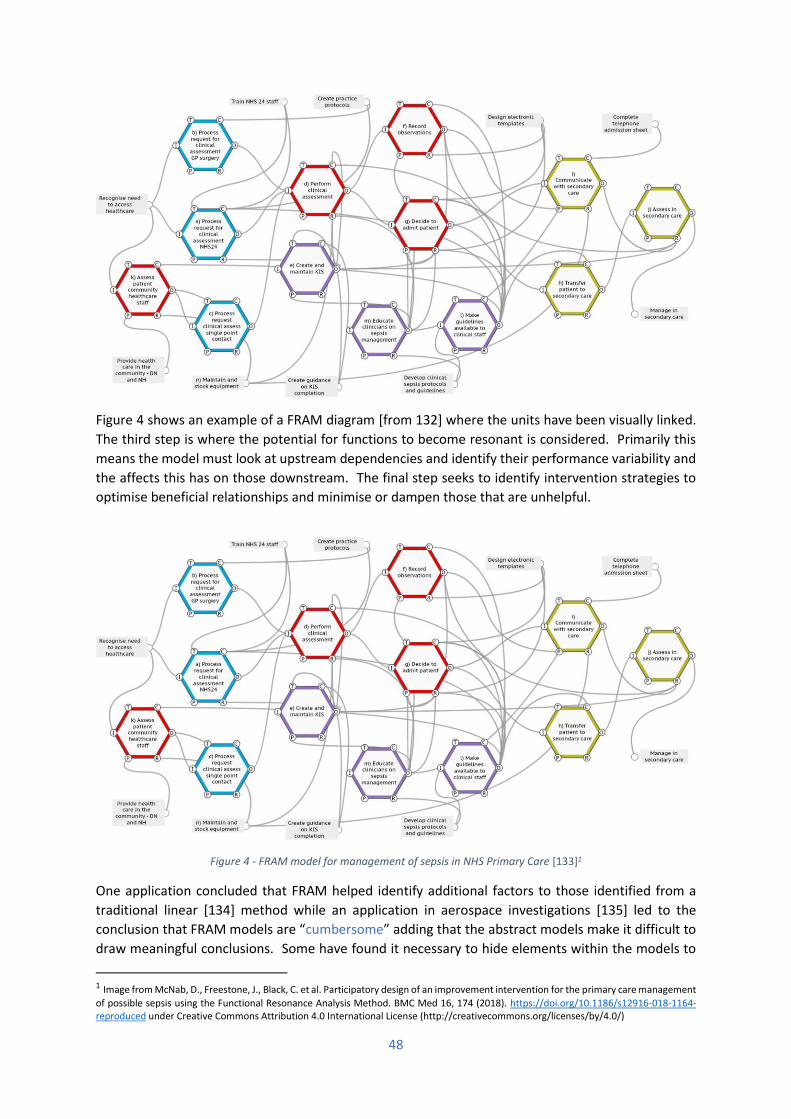
48
Figure 4 shows an example of a FRAM diagram [from 132] where the units have been visually linked.
The third step is where the potential for functions to become resonant is considered. Primarily this
means the model must look at upstream dependencies and identify their performance variability and
the affects this has on those downstream. The final step seeks to identify intervention strategies to
optimise beneficial relationships and minimise or dampen those that are unhelpful.
Figure 4 - FRAM model for management of sepsis in NHS Primary Care [133]1
One application concluded that FRAM helped identify additional factors to those identified from a
traditional linear [134] method while an application in aerospace investigations [135] led to the
conclusion that FRAM models are “cumbersome” adding that the abstract models make it difficult to
draw meaningful conclusions. Some have found it necessary to hide elements within the models to
1 Image from McNab, D., Freestone, J., Black, C. et al. Participatory design of an improvement intervention for the primary care management
of possible sepsis using the Functional Resonance Analysis Method. BMC Med 16, 174 (2018). https://doi.org/10.1186/s12916-018-1164-reproduced under Creative Commons Attribution 4.0 International License (http://creativecommons.org/licenses/by/4.0/)
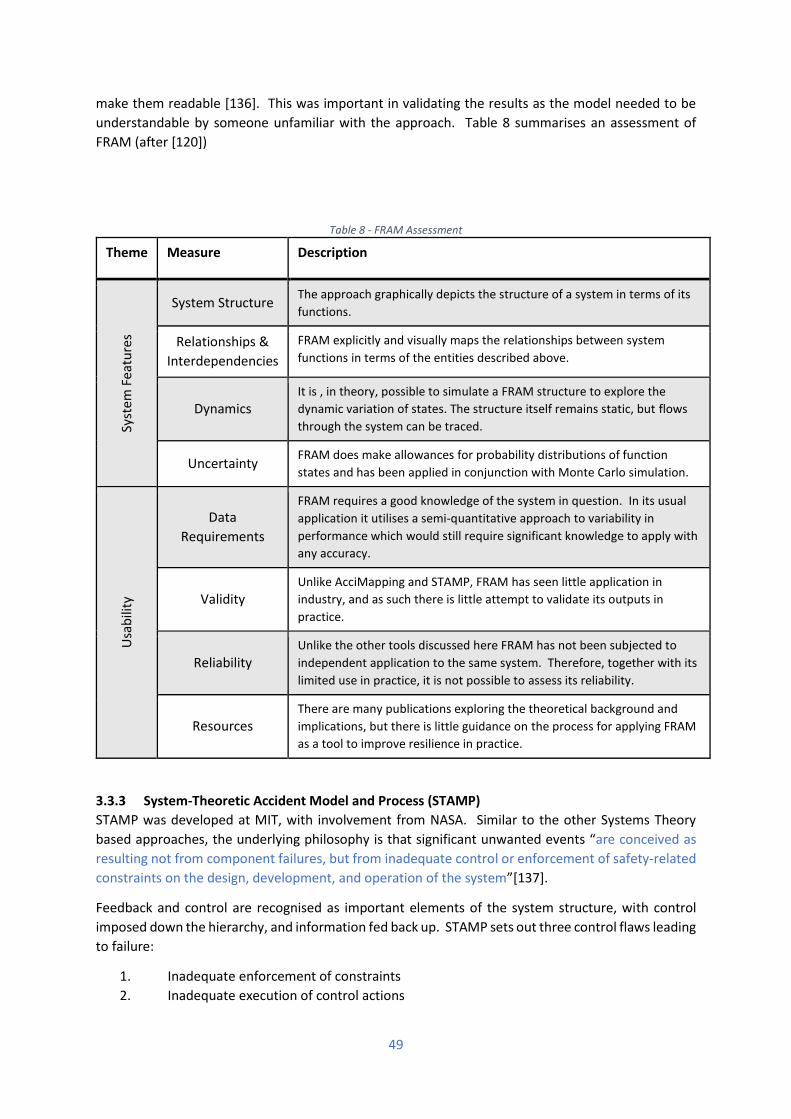
49
make them readable [136]. This was important in validating the results as the model needed to be
understandable by someone unfamiliar with the approach. Table 8 summarises an assessment of
FRAM (after [120])
Table 8 - FRAM Assessment
Theme Measure Description
Syst
em F
eatu
res
System Structure The approach graphically depicts the structure of a system in terms of its
functions.
Relationships &
Interdependencies
FRAM explicitly and visually maps the relationships between system
functions in terms of the entities described above.
Dynamics It is , in theory, possible to simulate a FRAM structure to explore the
dynamic variation of states. The structure itself remains static, but flows
through the system can be traced.
Uncertainty FRAM does make allowances for probability distributions of function
states and has been applied in conjunction with Monte Carlo simulation.
Usa
bili
ty
Data
Requirements
FRAM requires a good knowledge of the system in question. In its usual
application it utilises a semi-quantitative approach to variability in
performance which would still require significant knowledge to apply with
any accuracy.
Validity Unlike AcciMapping and STAMP, FRAM has seen little application in
industry, and as such there is little attempt to validate its outputs in
practice.
Reliability Unlike the other tools discussed here FRAM has not been subjected to
independent application to the same system. Therefore, together with its
limited use in practice, it is not possible to assess its reliability.
Resources There are many publications exploring the theoretical background and
implications, but there is little guidance on the process for applying FRAM
as a tool to improve resilience in practice.
3.3.3 System-Theoretic Accident Model and Process (STAMP)
STAMP was developed at MIT, with involvement from NASA. Similar to the other Systems Theory
based approaches, the underlying philosophy is that significant unwanted events “are conceived as
resulting not from component failures, but from inadequate control or enforcement of safety-related
constraints on the design, development, and operation of the system”[137].
Feedback and control are recognised as important elements of the system structure, with control
imposed down the hierarchy, and information fed back up. STAMP sets out three control flaws leading
to failure:
1. Inadequate enforcement of constraints
2. Inadequate execution of control actions
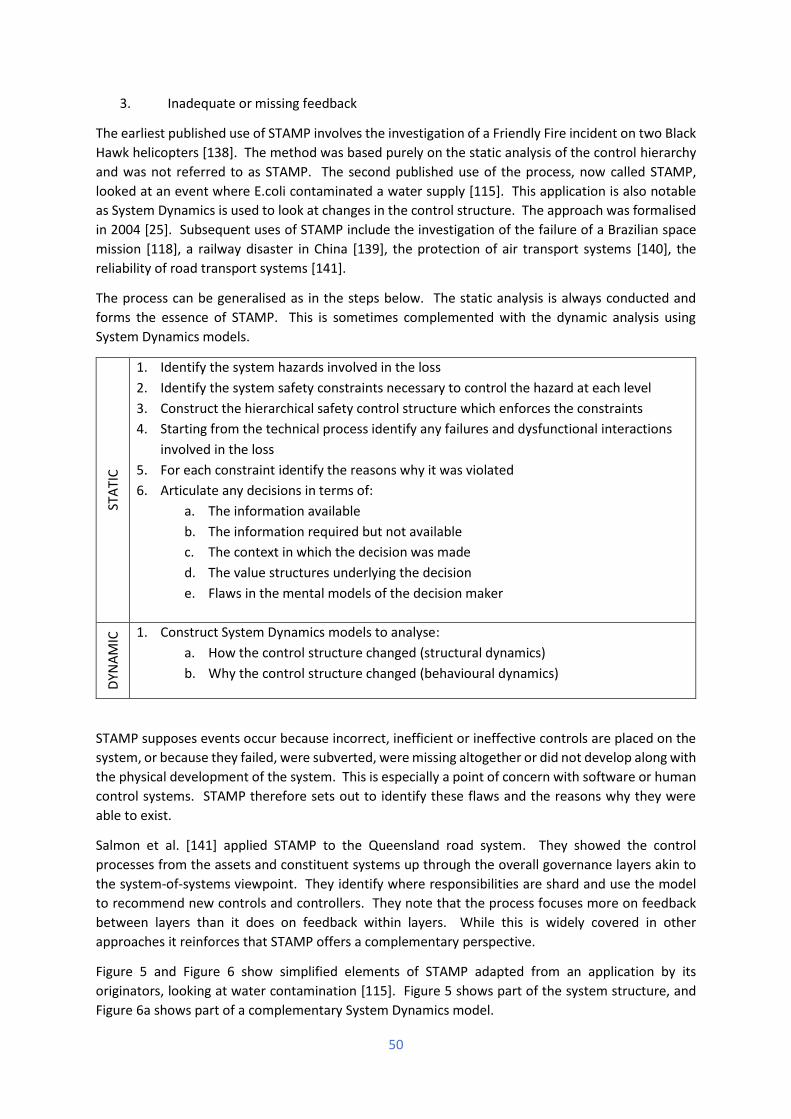
50
3. Inadequate or missing feedback
The earliest published use of STAMP involves the investigation of a Friendly Fire incident on two Black
Hawk helicopters [138]. The method was based purely on the static analysis of the control hierarchy
and was not referred to as STAMP. The second published use of the process, now called STAMP,
looked at an event where E.coli contaminated a water supply [115]. This application is also notable
as System Dynamics is used to look at changes in the control structure. The approach was formalised
in 2004 [25]. Subsequent uses of STAMP include the investigation of the failure of a Brazilian space
mission [118], a railway disaster in China [139], the protection of air transport systems [140], the
reliability of road transport systems [141].
The process can be generalised as in the steps below. The static analysis is always conducted and
forms the essence of STAMP. This is sometimes complemented with the dynamic analysis using
System Dynamics models.
STA
TIC
1. Identify the system hazards involved in the loss
2. Identify the system safety constraints necessary to control the hazard at each level
3. Construct the hierarchical safety control structure which enforces the constraints
4. Starting from the technical process identify any failures and dysfunctional interactions
involved in the loss
5. For each constraint identify the reasons why it was violated
6. Articulate any decisions in terms of:
a. The information available
b. The information required but not available
c. The context in which the decision was made
d. The value structures underlying the decision
e. Flaws in the mental models of the decision maker
DYN
AM
IC 1. Construct System Dynamics models to analyse:
a. How the control structure changed (structural dynamics)
b. Why the control structure changed (behavioural dynamics)
STAMP supposes events occur because incorrect, inefficient or ineffective controls are placed on the
system, or because they failed, were subverted, were missing altogether or did not develop along with
the physical development of the system. This is especially a point of concern with software or human
control systems. STAMP therefore sets out to identify these flaws and the reasons why they were
able to exist.
Salmon et al. [141] applied STAMP to the Queensland road system. They showed the control
processes from the assets and constituent systems up through the overall governance layers akin to
the system-of-systems viewpoint. They identify where responsibilities are shard and use the model
to recommend new controls and controllers. They note that the process focuses more on feedback
between layers than it does on feedback within layers. While this is widely covered in other
approaches it reinforces that STAMP offers a complementary perspective.
Figure 5 and Figure 6 show simplified elements of STAMP adapted from an application by its
originators, looking at water contamination [115]. Figure 5 shows part of the system structure, and
Figure 6a shows part of a complementary System Dynamics model.
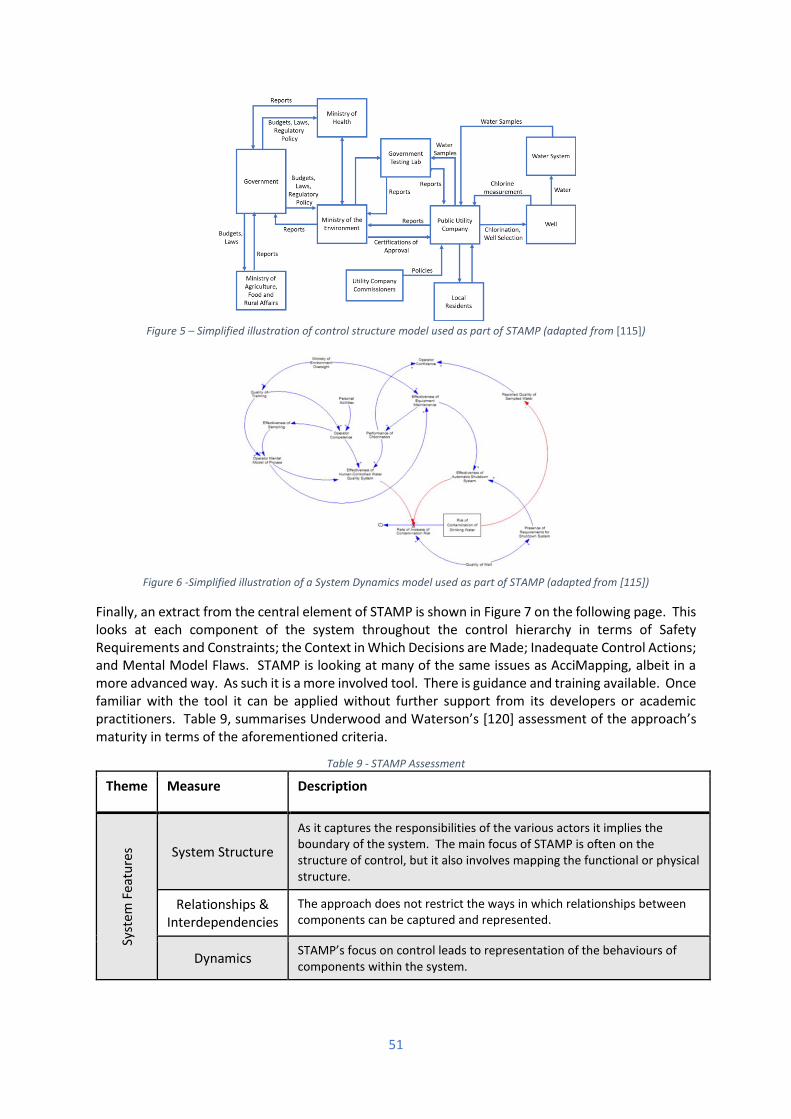
51
Figure 5 – Simplified illustration of control structure model used as part of STAMP (adapted from [115])
Figure 6 -Simplified illustration of a System Dynamics model used as part of STAMP (adapted from [115])
Finally, an extract from the central element of STAMP is shown in Figure 7 on the following page. This looks at each component of the system throughout the control hierarchy in terms of Safety Requirements and Constraints; the Context in Which Decisions are Made; Inadequate Control Actions; and Mental Model Flaws. STAMP is looking at many of the same issues as AcciMapping, albeit in a more advanced way. As such it is a more involved tool. There is guidance and training available. Once familiar with the tool it can be applied without further support from its developers or academic practitioners. Table 9, summarises Underwood and Waterson’s [120] assessment of the approach’s maturity in terms of the aforementioned criteria.
Table 9 - STAMP Assessment
Theme Measure Description
Syst
em F
eatu
res System Structure
As it captures the responsibilities of the various actors it implies the boundary of the system. The main focus of STAMP is often on the structure of control, but it also involves mapping the functional or physical structure.
Relationships & Interdependencies
The approach does not restrict the ways in which relationships between components can be captured and represented.
Dynamics STAMP’s focus on control leads to representation of the behaviours of components within the system.
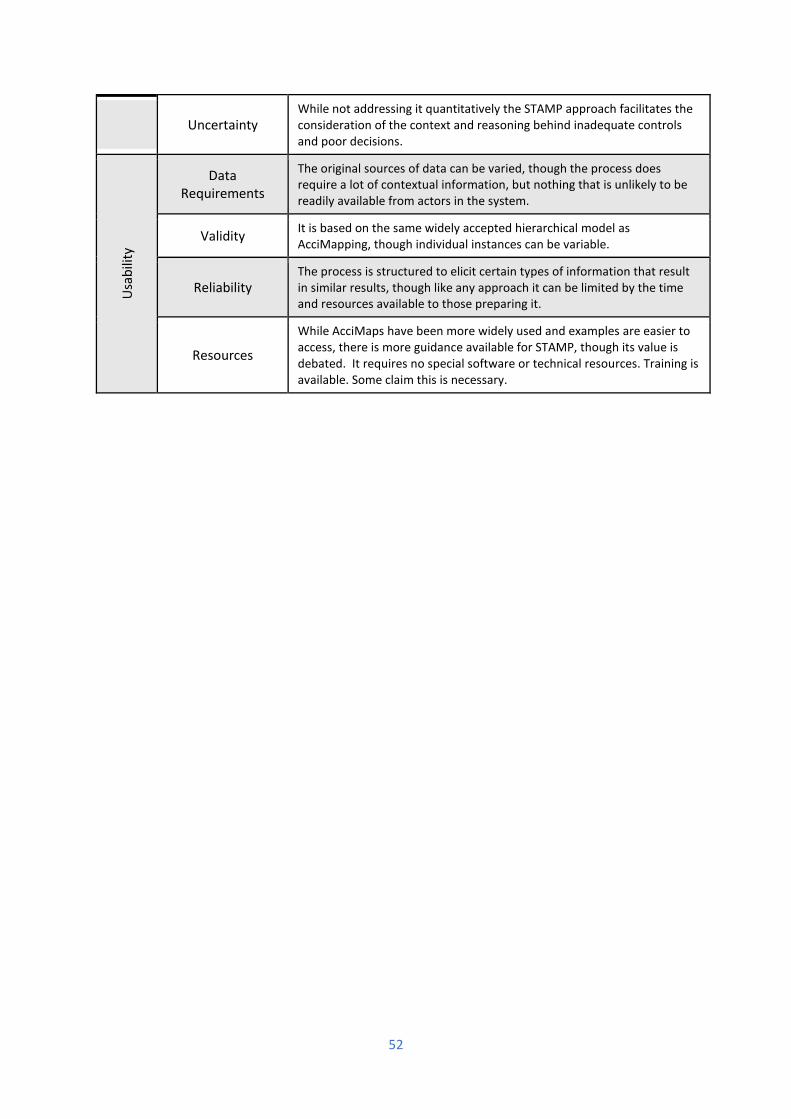
52
Uncertainty While not addressing it quantitatively the STAMP approach facilitates the consideration of the context and reasoning behind inadequate controls and poor decisions.
Usa
bili
ty
Data Requirements
The original sources of data can be varied, though the process does require a lot of contextual information, but nothing that is unlikely to be readily available from actors in the system.
Validity It is based on the same widely accepted hierarchical model as AcciMapping, though individual instances can be variable.
Reliability The process is structured to elicit certain types of information that result in similar results, though like any approach it can be limited by the time and resources available to those preparing it.
Resources
While AcciMaps have been more widely used and examples are easier to access, there is more guidance available for STAMP, though its value is debated. It requires no special software or technical resources. Training is available. Some claim this is necessary.
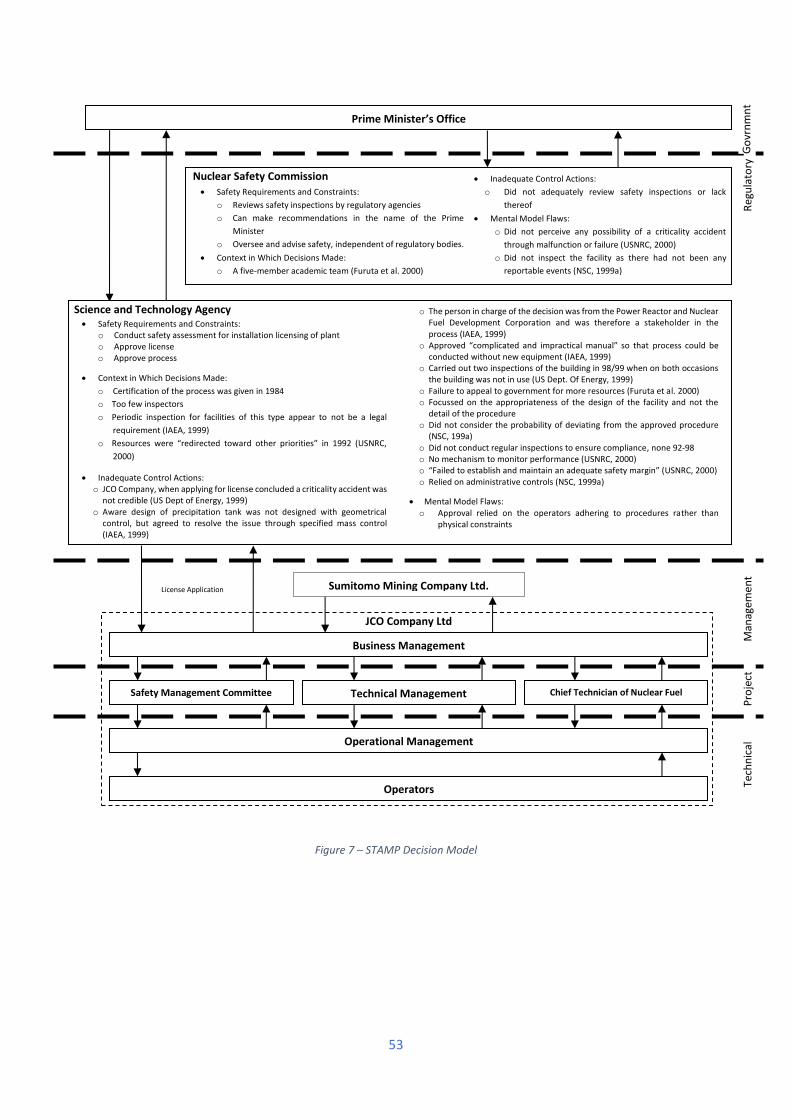
53
Figure 7 – STAMP Decision Model
JCO Company Ltd
Prime Minister’s Office
Sumitomo Mining Company Ltd.
Business Management
Technical Management
Operational Management
Operators Tech
nic
al
Pro
ject
M
anag
eme
nt
Reg
ula
tory
Go
vrn
mn
t
Chief Technician of Nuclear Fuel Safety Management Committee
License Application
Science and Technology Agency • Safety Requirements and Constraints:
o Conduct safety assessment for installation licensing of plant o Approve license o Approve process
• Context in Which Decisions Made:
o Certification of the process was given in 1984
o Too few inspectors
o Periodic inspection for facilities of this type appear to not be a legal
requirement (IAEA, 1999)
o Resources were “redirected toward other priorities” in 1992 (USNRC,
2000)
• Inadequate Control Actions: o JCO Company, when applying for license concluded a criticality accident was
not credible (US Dept of Energy, 1999) o Aware design of precipitation tank was not designed with geometrical
control, but agreed to resolve the issue through specified mass control (IAEA, 1999)
o The person in charge of the decision was from the Power Reactor and Nuclear Fuel Development Corporation and was therefore a stakeholder in the process (IAEA, 1999)
o Approved “complicated and impractical manual” so that process could be conducted without new equipment (IAEA, 1999)
o Carried out two inspections of the building in 98/99 when on both occasions the building was not in use (US Dept. Of Energy, 1999)
o Failure to appeal to government for more resources (Furuta et al. 2000) o Focussed on the appropriateness of the design of the facility and not the
detail of the procedure o Did not consider the probability of deviating from the approved procedure
(NSC, 199a) o Did not conduct regular inspections to ensure compliance, none 92-98 o No mechanism to monitor performance (USNRC, 2000) o “Failed to establish and maintain an adequate safety margin” (USNRC, 2000) o Relied on administrative controls (NSC, 1999a)
• Mental Model Flaws: o Approval relied on the operators adhering to procedures rather than
physical constraints
Nuclear Safety Commission • Safety Requirements and Constraints:
o Reviews safety inspections by regulatory agencies
o Can make recommendations in the name of the Prime
Minister
o Oversee and advise safety, independent of regulatory bodies.
• Context in Which Decisions Made:
o A five-member academic team (Furuta et al. 2000)
• Inadequate Control Actions:
o Did not adequately review safety inspections or lack
thereof • Mental Model Flaws:
o Did not perceive any possibility of a criticality accident
through malfunction or failure (USNRC, 2000)
o Did not inspect the facility as there had not been any
reportable events (NSC, 1999a)
54
4 CONCLUSIONS
A system is a set of parts interacting in such a way that it possesses emergent qualities not present in any
of the parts themselves. A system-of-systems is higher level entity further complicated by the autonomy
of its constituent systems which may be operating in accordance with their own local goals alongside those
of the overall system-of systems.
The phenomena that emerge at the system-of-system level must be coherent and meaningful at that
level, distinct from anything that exists at the lower constituent system levels. Such emergent
phenomena include societal level services and outcomes. System-of-systems emergent failures occur
when these services or outcomes fail.
Emergence exists on a spectrum. At one end is the well understood and determinate Weak or Nominal
Emergence. The constituent systems always behave in the same way and combine in predictable ways
to produce known or easily knowable outcomes.
Strong Moderated Emergence concerns situations where top-down feedback processes from the
global to the local impose constraining or reinforcing influences on the parts. Because the global
macro system influences the behaviour of the constituent systems, the global behaviour cannot be
deduced by studying the constituents in isolation.
Strong Multiple Emergence represents top-down feedback processes from the global to the local that
impose both constraining and reinforcing influences on the parts. This can result in chaotic short-term
variance but long-term stability.
In Spooky or Evolutionary Emergence, the system-of-systems causes constituent systems to behave in
ways that are completely at odds with current understanding.
In its strongest form emergence undermines the efficacy of anticipation as the sole means of reducing
the risks of unwanted events. It suggests some events are inherently unpredictable regardless of
knowledge of the constituent parts or the rules that govern their behaviours.
It can be difficult to identify or perceive documented incidents as examples of emergent failures due
to the post-hoc rationalisation created though most failure paradigms. The need to extract a
communicable linear narrative from which to learn and design corrective actions often positions
something that was unexpected as if it were simple and easily predictable.
Traditional tools for thinking about failure events are reductionist, based on sequential chains of
causality, tend to ignore feedback, focus on the local level and aim to produce prescriptive
intervention actions. A set of approaches grounded in Systems Theory have been proposed to address
these shortfalls that are better suited to manage emergence. While they have mainly be applied to
investigate systemic failures, they show promise in proactively understanding and engineering
complex systems-of-systems in order to improve their resilience to emergent failures independently
of anticipating the exact nature of the failures.
55
5 REFERENCES
[1] The Royal Academy of Engineering. Creating Systems that Work: Principles of engineering systems for the 21st Century. 2007.
[2] Sarriegi JM, Sveen FO, Torres JM, Gonzalez JJ. Adaptation of modelling paradigms to the CIs interdependencies problem. Lect. Notes Comput. Sci. (including Subser. Lect. Notes Artif. Intell. Lect. Notes Bioinformatics), 2009. doi:10.1007/978-3-642-03552-4_27.
[3] Cedergren A, Lidell K, Lidell K. Critical infrastructures and the tragedy of the commons dilemma: Implications from institutional restructuring on reliability and safety. J Contingencies Cris Manag 2019. doi:10.1111/1468-5973.12262.
[4] Blackwell J, Tolone WJ, Lee SW, Xiang WN, Marsh L. An ontology-based approach to blind spot revelation in critical infrastructure protection planning. Lect. Notes Comput. Sci. (including Subser. Lect. Notes Artif. Intell. Lect. Notes Bioinformatics), 2009. doi:10.1007/978-3-642-03552-4_34.
[5] Institution of Civil Engineers. In Plain Sight: Assuring the whole-life safety of infrastructure. London, UK: 2018.
[6] Dueñas-Osorio L, Vemuru SM. Cascading failures in complex infrastructure systems. Struct Saf 2009. doi:10.1016/j.strusafe.2008.06.007.
[7] Kroger W, Zio E. Vulnerable systems. Springer; 2011. [8] Holland OT. Taxonomy for the modeling and simulation of emergent behavior systems. Agent Dir. Simul.
Symp. ADS 2007 - Proc. 2007 Spring Simul. Multiconference, SpringSim 2007, 2007. [9] Stepney S, Polack FAC, Turner HR. Engineering emergence. Proc. IEEE Int. Conf. Eng. Complex Comput.
Syst. ICECCS, 2006. doi:10.1109/iceccs.2006.1690358. [10] Mogul JC. Emergent (mis)behavior vs. complex software systems. Proc. 2006 EuroSys Conf., 2006, p. 293.
doi:10.1145/1217935.1217964. [11] Goldbeck N, Angeloudis P, Ochieng WY. Resilience assessment for interdependent urban infrastructure
systems using dynamic network flow models. Reliab Eng Syst Saf 2019. doi:10.1016/j.ress.2019.03.007. [12] Von Bertalanffy L. General System Theory: Foundations, Development, Applications. George Braziller;
1968. doi:citeulike-article-id:1199862. [13] Ackoff RL. The Future of Operational Research is Past. J Oper Res Soc 1979;30:93–104. [14] Ackoff RL. OR: after the post mortem. Syst Dyn Rev 2001;17:341–6. doi:10.1002/sdr.222. [15] Checkland P. Systems thinking, systems practice. Chichester: Wiley; 1981. [16] Checkland P. Soft systems methodology: a thirty year retrospective. Syst Res Behav Sci 2000;17:S11–58.
doi:citeulike-article-id:695036. [17] Corning PA. The re-emergence of “emergence”: A venerable concept in search of a theory. Complexity
2002;7:18–30. [18] Jackson MC. Systems approaches to management. New York: Kluwer/Plenum; 2000. [19] Verschuren PJM. Holism versus Reductionism in Modern Social Science Research. Qual Quant
2001;35:389–405. doi:10.1023/a:1012242620544. [20] Ackoff RL. The systems revolution. Long Range Plann 1974;7:2–20. [21] Ackoff RL. Systems, Messes and Interactive Planning. In: Trist E, Emery F, Murray H, editors. Soc.
Engagem. Soc. Sci. A Tavistock Anthol. Socio-Ecological Perspect., vol. 3, Philadelphia: University of Pennsylvania Press; 1997, p. 417–38.
[22] Woods DD, Cook RI. Nine Steps to Move Forward from Error. Cogn Technol Work 2002;4:137–44. [23] Dekker S. Chronicling the Emergence of Confused Consensus. In: Hollnagel E, Woods DD, Leveson N,
editors. Resil. Eng. concepts precepts, Ashgate; 2006. [24] Hollnagel E, Woods DD, Leveson N. Resilience Engineering - Concepts and Precepts 2006. [25] Leveson N. A new accident model for engineering safer systems. Saf Sci 2004;42:237–70. [26] Perrow C. Normal Accidents. New York: Basic Books; 1984. [27] Pidgeon N. The Limits to Safety? Culture, Politics, Learning and Man-Made Disasters. J Contingencies Cris
Manag 1997;5:1–14. [28] Maier MW. Architecting principles for systems-of-systems. Syst Eng 1998. doi:10.1002/(SICI)1520-
6858(1998)1:4%3C267::AID-SYS3%3E3.0.CO;2-D. [29] Lewes GH. Problems of Life and Mind, Volume 2. Boston: Houghton, Osgood and Co.; 1875. [30] Goldstein J. Emergence as a Construct: History and Issues. Emergence 1999;1.
doi:10.1207/s15327000em0101_4.
56
[31] Ashby WR. An Introduction to Cybernetics. London, UK: CHAPMAN & HALL LTD; 1956. [32] Chalmers D. Strong and Weak Emergence. In: Clayton P, Davies P, editors. Re-Emergence Emerg.
Emergentist Hypothesis from Sci. to Relig., 2006. doi:10.1093/acprof:oso/9780199544318.001.0001. [33] Mittal S. Emergence in stigmergic and complex adaptive systems: A formal discrete event systems
perspective. Cogn Syst Res 2013. doi:10.1016/j.cogsys.2012.06.003. [34] Bedau MA. Weak emergence. Philos Perspect 1997;11:375–99. doi:10.2307/2216138. [35] Montgomery MJ, Pearce OJD, Pocock DC, Cornell S, Broyd TW, Young K. A system dynamics approach
for improving infrastructure resilience. Proc Inst Civ Eng Spec Ed Infrastruct Resil (Accepted Awaiting Publ 2012;November S.
[36] Maier MW. The Role of Modeling and Simulation in System of Systems Development. In: Rainey LB, Tolk A, editors. Model. Simul. Support Syst. Syst. Eng. Appl., John Wiley & Sons, Inc.; 2014. doi:10.1002/9781118501757.ch1.
[37] Alexander R, Hall-May M, Kelly T. Characterisation of systems of systems failures. Proc. 22nd Int. Syst. Saf. Conf., 2004.
[38] Agarwal J, Liu M, Blockley D. A systems approach to vulnerability assessment. Vulnerability, Uncertainty, Risk Anal. Model. Manag. - Proc. ICVRAM 2011 ISUMA 2011 Conf., 2011. doi:10.1061/41170(400)28.
[39] Leveson NG. Applying systems thinking to analyze and learn from events. Saf Sci 2011;49:55–64. [40] Woods D, Branlat M. Basic patterns in how adaptive systems fail. In: Hollnagel E, Paries J, Woods DD,
Wreathall J, editors. Resil. Eng. Pract. A Guideb., Ashgate Publishing Company; 2011. doi:10.1201/9781317065265-10.
[41] Senge PM. The Fifth Discipline: The Art and Practice of the Learning Organisation. London: Century Business; 1990.
[42] Simon HA. A Behavioral Model of Rational Choice. Q J Econ 1955. doi:10.2307/1884852. [43] Simon HA. Bounded Rationality and Organizational Learning. Organ Sci 1991;2:125–34.
doi:10.1287/orsc.2.1.125. [44] Meadows DH, Wright D. Thinking in Systems: A Primer. Chelsea Green Pub.; 2008. [45] Dekker S. Drift into failure: From hunting broken components to understanding complex systems. CRC
Press; 2016. [46] Graham S. Disrupted cities: When infrastructure fails. 2009. doi:10.4324/9780203894484. [47] Hollnagel E. Safety-I and safety-II: The past and future of safety management. Ashgate Pub Ltd.; 2014.
doi:10.1080/00140139.2015.1093290. [48] Weick KE. Organizational Culture as a Source of High Reliability. Calif Manage Rev 1987;29:112–27. [49] Taleb NN. Antifragile. Antifragile, 2012. [50] Taleb NN. The Black Swan: The Impact of the Highly Improbable. Random House Group; 2007. [51] Rinaldi SM, Peerenboom JP, Kelly TK. Identifying, understanding, and analyzing critical infrastructure
interdependencies. IEEE Control Syst Mag 2001;21:11–25. doi:10.1109/37.969131. [52] Pederson P, Dudenhoeffer D, Hartley S, Permann M. Critical Infratructure Interdependency Modeling: A
Survey of U.S. and International Research. Idaho Falls, Idaho: 2006. [53] Zimmerman R. Understanding the Implications of Critical Infrastructure Interdependencies for Water.
In: Voeller JG, editor. Wiley Handb. Sci. Technol. Homel. Secur., Hoboken, NJ, USA: John Wiley & Sons, Inc.; 2008.
[54] Zimmerman R, Restrepo CE. The next step: quantifying infrastructure interdependencies to improve security. Int J Crit Infrastructures 2006;2:215–30.
[55] Raven R, Verbong G. Multi-Regime Interactions in the Dutch Energy Sector: The Case of Combined Heat and Power Technologies in the Netherlands 1970–2000. Technol Anal Strateg Manag 2007;19:491–507. doi:10.1080/09537320701403441.
[56] Carhart NJ, Rosenberg G. A Framework for Characterising Infrastructure Interdependencies. Int J Complex Appl Sci Technol 2016;1.
[57] Chang SE, McDaniels TL, Mikawoz J, Peterson K. Infrastructure failure interdependencies in extreme events: Power outage consequences in the 1998 Ice Storm. Nat Hazards 2007. doi:10.1007/s11069-006-9039-4.
[58] McDaniels T, Chang S, Peterson K, Mikawoz J, Reed D. Empirical Framework for Characterizing Infrastructure Failure Interdependencies. J Infrastruct Syst 2007;13:175–84. doi:10.1061/(ASCE)1076-0342(2007)13:3(175).
[59] Andersson G, Donalek P, Farmer R, Hatziargyriou N, Kamwa I, Kundur P, et al. Causes of the 2003 major grid blackouts in North America Europe, and recommended means to improve system dynamic performance. IEEE Trans Power Syst 2005. doi:10.1109/TPWRS.2005.857942.
57
[60] Cornell S, Young K, Broyd T, Pocock D, Montgomery M, Pearce O. An innovative approach for improving infrastructure resilience. Proc ICE - Civ Eng 2012;165:27–32. doi:10.1680/cien.11.00062.
[61] Kemp R, The Royal Academy of Engineering, The Institution of Engineering and Technology, Lancaster University. Living without electricity - One city’s experience of coping with loss of power. 2016.
[62] Van Bossuyt DL, Orhalloran BM, Arlitt RM. Irrational system behavior in a system of systems. 2018 13th Syst. Syst. Eng. Conf. SoSE 2018, 2018. doi:10.1109/SYSOSE.2018.8428778.
[63] Halsall J. Disruption at Victoria and London Bridge: how it happened and what we are doing about it 2019. https://www.networkrail.co.uk/running-the-railway/our-regions/southern/disruption-at-victoria-and-london-bridge/.
[64] National Transportation Safety Board. Railroad Accident Brief DCA-01-MR-004. 2001. [65] McGrattan K, Hamins A. Numerical simulation of the Howard Street Tunnel Fire. Fire Technol 2006.
doi:10.1007/s10694-006-7506-9. [66] Wilbanks TJ, Fernandez SJ (Steven J. Climate Change and Infrastructure, Urban Systems, and
Vulnerabilities: Technical Report for the U.S. Department of Energy in Support of the National Climate Assessment. Washington D.C: Island Press; 2013.
[67] CSX to Pay $2 Million for Cleanup Costs from Baltimore Tunnel Fire. Insur J 2006. [68] Ramsay JD, Kiltz LA. Critical Issues in Homeland Security : a Casebook. Routledge; 2018. [69] US Department of Transportation ITS Joint Program Office. Effects of Catastrophic Events on
Transportation System Management and Operations, Howard Street Tunnel Fire, Baltimore City, Maryland – July 18, 2001. 2002.
[70] Minkle JR. The 2003 Northeast Blackout--Five Years Later - Scientific American. Sci Am 2008. https://www.scientificamerican.com/article/2003-blackout-five-years-later/ (accessed March 6, 2020).
[71] Electricity Consumers Resources Council (ELCON). The Economic Impacts of the August 2003 Blackout. 2004.
[72] DeBlasio AJ, Regan TJ, Zirker ME, Lovejoy K, Fichter K. Learning from the 2003 blackout. Public Roads 2004;68.
[73] Kennedy R. THE BLACKOUT OF 2003: TRANSPORTATION; Thousands Stranded on Foot by Crippled Trains, Crawling Buses and Traffic Gridlock. New York Times 2003.
[74] Schwartz J. Disaster Plans Get New Scrutiny After Blackout. New York Times 2003. [75] U.S.-Canada Power System Outage Task Force. Final Report on the August 14, 2003 Blackout in the
United States and Canada: Causes and Recommendations. 2004. [76] Committee on Energy and Commerce. Blackout 2003: How did it happen and why? Hearing before the
Committee on Energy and Commerce, House of Representaives, One Hundred Eitght Congress, First Session 2003:Serial 108-54.
[77] Johnson CW. Understanding failures in international safety infrastructure: a comparison of European and North American power failures. roceedings 26th Int. Conf. Syst. Safety, Vancouver, BC, 25‐29 August, 2008.
[78] Eusgeld I, Nan C, Dietz S. “System-of-systems” approach for interdependent critical infrastructures. Reliab Eng Syst Saf 2011;96:679–86.
[79] Multi-Agency Recovery Group. Buncefield Multi-Agency Recovery Plan: Recovering from the largest peacetime fire in Europe. 2006.
[80] Creutzfeldt N, Hodges C. Parallel public and private responses: The Buncefield explosion. In: Hensler DR, Hodges C, Tzankova I, editors. Cl. Actions Context, 2016, p. 320–41.
[81] COMAH. Buncefield: Why did it happen? 2005. [82] BBC NEWS | England | Oil fire leads to plane pitstops n.d.
http://news.bbc.co.uk/1/hi/england/4534014.stm (accessed February 18, 2020). [83] Smith L. Buncefield aftermath blights online retailer | Business | The Guardian. Guard 2005.
https://www.theguardian.com/business/2005/dec/24/buncefieldfueldepotfire2005.retail (accessed February 18, 2020).
[84] Bloomfield R, Chozos N, Nobles P. Infrastructure Interdependency Analysis: Requirements, capabilities and strategy. 2009.
[85] Paltrinieri N, Dechy N, Salzano E, Wardman M, Cozzani V. Lessons Learned from Toulouse and Buncefield Disasters: From Risk Analysis Failures to the Identification of Atypical Scenarios Through a Better Knowledge Management. Risk Anal 2012. doi:10.1111/j.1539-6924.2011.01749.x.
[86] Rasmussen J. Risk management in a dynamic society: a modelling problem. Saf Sci 1997;27:183–213. [87] DEFRA, Environment Agency. The costs of the summer 2007 floods in England. Bristol, UK: 2010. [88] 10 years on from the 2007 summer floods - Gloucestershire County Council n.d.
58
https://www.gloucestershire.gov.uk/gloucestershire-county-council-news/news-july-2017/10-years-on-from-the-2007-summer-floods/ (accessed March 6, 2020).
[89] The City of New York. A Stronger, More Resilient New York. 2013. [90] Chiverrell RC, Sear DA, Warburton J, Macdonald N, Schillereff DN, Dearing JA, et al. Using lake sediment
archives to improve understanding of flood magnitude and frequency: Recent extreme flooding in northwest UK. Earth Surf Process Landforms 2019;44:2366–76. doi:10.1002/esp.4650.
[91] JBA Trust, Zurich. Flooding after Storm Desmond - PERC UK 2015. 2016. [92] PwC. Updated estimates on cost of Storm Desmond - PwC - Press room 2015.
https://pwc.blogs.com/press_room/2015/12/updated-estimates-on-cost-of-storm-desmond-pwc.html (accessed March 6, 2020).
[93] Department for Business Energy & Industrial Strategy. GB power system disruption on 9 August 2019: Energy Emergencies Executive Committee (E3C): Final report. 2020.
[94] Department for Business Energy & Industrial Strategy. GB POWER SYSTEM DISRUPTION – 9 AUGUST 2019: Energy Emergencies Executive Committee: Interim Report. 2019.
[95] Office of Rail and Road Regulation. Report following railway power disruption on 9th August 2019. 2020. [96] Natyional Grid ESO. Interim Report into the Low Frequency Demand Disconnection (LFDD) following
Generator Trips and Frequency Excursion on 9 Aug 2019. 2019. [97] Hollnagel E, Goteman O. The functional resonance accident model. Proc Cogn Syst Eng Process Plant,
2004 2004:155–61. [98] Underwood P, Waterson P. A critical review of the stamp, fram and accimap systemic accident analysis
models. Adv. Hum. Asp. Road Rail Transp., 2012. doi:10.1201/b12320. [99] Bloomfield R, Salako K, Wright D, Chozos N, Nobles P. Infrastructure interdependency analysis: an
introdctory research review. 2009. [100] Ouyang M. Review on modeling and simulation of interdependent critical infrastructure systems. Reliab
Eng Syst Saf 2014;121:43–60. [101] Kröger W, Nan C. Addressing Interdependencies of Complex Technical Networks, Springer, Cham; 2014,
p. 279–309. doi:10.1007/978-3-319-03518-5_13. [102] Satumtira G, Duenas-Osorio L. Synthesis of Modeling and Simulation Methods on Critical Infrastructure
Interdependencies Research. In: Gopalakrishnan K, Peeta S, editors. Sustain. Resilient Crit. Infrastruct. Syst. Simulation, Model. Intell. Eng., Berlin, Germany: Springer; 2010, p. 300.
[103] Johansson J, Hassel H. An approach for modelling interdependent infrastructures in the context of vulnerability analysis. Reliab Eng Syst Saf 2010;95:1335–44. doi:10.1016/j.ress.2010.06.010.
[104] Le Coze J. Are organisations too complex to be integrated in technical risk assessment and current safety auditing? Saf Sci 2005;43:613–38.
[105] Hollnagel E. Understanding accidents-from root causes to performance variability. Hum Factors Power Plants, 2002 Proc 2002 IEEE 7th Conf 2002:1–6.
[106] Hollnagel E, Goteman O. “The Functional Resonance Accident Model.” Cogn Syst Eng Process Plant 2004 2004:155–61.
[107] Leveson N. Engineering a safer world: Systems thinking applied to safety. MIT Press; 2011. [108] Rasmussen J, Nixon P, Warner F. Human Error and the Problem of Causality in Analysis of Accidents [and
Discussion]. Philos Trans R Soc London Ser B, Biol Sci 1990;327:449–62. [109] Carroll JS. Incident Reviews in High-Hazard Industries: Sense Making and Learning Under Ambiguity and
Accountability. Organ Environ 1995;9:175–97. doi:10.1177/108602669500900203. [110] Carroll JS. Organizational Learning Activities in High-hazard Industries: The Logics Underlying Self-
Analysis. J Manag Stud 1998;35:699–717. [111] Reiman T, Oedewald P. Assessment of complex sociotechnical systems - Theoretical issues concerning
the use of organizational culture and organizational core task concepts. Saf Sci 2007;45:745–68. [112] Svedung I, Rasmussen J. Graphic representation of accident scenarios: mapping system structure and
the causation of accidents. Saf Sci 2002;40:397–417. [113] Doytchev D, Hibberd RE. Organizational learning and safety in design: experiences from German
industry. J Risk Res 2009;12:295–312. [114] Huber S, Wijgerden I van, Witt A de, Dekker SWA. Learning from organizational incidents: Resilience
engineering for high-risk process environments. Process Saf Prog 2009;28:90–5. [115] Leveson N, Daouk M, Dulac N, Marais K. “A Systems Theoretic Approach to Safety Engineering” 2003. [116] Rasmussen J, Svedung I. Proactive Risk Management in a Dynamic Society. 2000. [117] Cassano-Piche A, Vicente KJ, Jamieson GA. A Sociotechnical Systems Analysis of the BSE Epidemic in the
UK Through Case Study. Hum Factors Ergon Soc Annu Meet Proc 2006;50:386–90.
59
[118] Johnson CW, de Almeida IM. An investigation into the loss of the Brazilian space programme’s launch vehicle VLS-1 V03. Saf Sci 2008;46:38–53.
[119] Salmon PM, Goode N, Archer F, Spencer C, McArdle D, McClure RJ. A systems approach to examining disaster response: Using Accimap to describe the factors influencing bushfire response. Saf Sci 2014. doi:10.1016/j.ssci.2014.05.003.
[120] Underwood P, Waterson P. Systems thinking, the Swiss Cheese Model and accident analysis: A comparative systemic analysis of the Grayrigg train derailment using the ATSB, AcciMap and STAMP models. Accid Anal Prev 2013. doi:10.1016/j.aap.2013.07.027.
[121] Jenkins DP, Salmon PM, Stanton NA, Walker GH. A systemic approach to accident analysis: A case study of the Stockwell shooting. Ergonomics 2010;53:1–17.
[122] Hopkins A. An AcciMap of the Esso Australia gas plant explosion. In: Svedung I, Cojazzi GGM, editors. 18th ESReDA Semin. Risk Manag. Hum. Reliab. Soc. Context, Karlstad, Sweeden: Office for Official Publications for the European Communities; 2000.
[123] Woo DM, Vicente KJ. Sociotechnical systems, risk management, and public health: comparing the North Battleford and Walkerton outbreaks. Reliab Eng Syst Saf 2003;80:253–69.
[124] Sklet S. Comparison of some selected methods for accident investigation. J Hazard Mater 2004;111:29–37.
[125] Waterson P, Jenkins DP, Salmon PM, Underwood P. ‘Remixing Rasmussen’: The evolution of Accimaps within systemic accident analysis. Appl Ergon 2017;59:483–503. doi:10.1016/j.apergo.2016.09.004.
[126] Hollnagel E. Cognitive reliability and error analysis method: CREAM. Elsevier; 1998. [127] Konstandinidou M, Nivolianitou Z, Kiranoudis C, Markatos N. A fuzzy modeling application of CREAM
methodology for human reliability analysis. Reliab Eng Syst Saf 2006;91:706–16. [128] Lock R, Storer T, Sommerville I, Baxter G. Responsibility modelling for risk analysis. ESREL ’09 2009. [129] Lee SM, Ha JS, Seong PH. CREAM-based communication error analysis method (CEAM) for nuclear power
plant operators’ communication. J Loss Prev Process Ind 2011;24:90–7. [130] Hollnagel E, Pruchnicki S, Woltjer R, Etcher S. Analysis of Comair Flight 5191 with the Functional
Resonance Accident Model . 8th Int Symp Aust Aviat Psychol Assoc 2008. [131] Komatsubara A. Human defense-in-depth is dependent on culture. 2nd Symp Resil Eng 2006. [132] Patriarca R, Di Gravio G, Costantino F. A Monte Carlo evolution of the Functional Resonance Analysis
Method (FRAM) to assess performance variability in complex systems. Saf Sci 2017;91:49–60. doi:10.1016/j.ssci.2016.07.016.
[133] McNab D, Freestone J, Black C, Carson-Stevens A, Bowie P. Participatory design of an improvement intervention for the primary care management of possible sepsis using the Functional Resonance Analysis Method. BMC Med 2018;16:174. doi:10.1186/s12916-018-1164-x.
[134] Herrera IA, Woltjer R. Comparing a multi-linear (STEP) and systemic (FRAM) method for accident analysis. Reliab Eng Syst Saf 2010;95:1269–75.
[135] van Meer M, Ghobbar AA, Stoop J. Systemic Safety Investigations for Aerospace MROs. 27th Int Congr Aeronaut Sci 2010.
[136] Furniss D, Curzon P, Blandford A. Using FRAM beyond safety: a case study to explore how sociotechnical systems can flourish or stall. Theor Issues Ergon Sci 2016;17:507–32. doi:10.1080/1463922X.2016.1155238.
[137] Leveson N, Daouk M, Dulac N, Marais KB. “Applying STAMP in accident analysis” 2003. [138] Leveson N, Allen P, Storey MA. The analysis of a friendly fire accident using a systems model of accidents.
20th Int Conf Syst Saf 2002. [139] Ouyang M, Hong L, Yu M-H, Fei Q. STAMP-based analysis on the railway accident and accident spreading:
Taking the China-Jiaoji railway accident for example. Saf Sci 2010;48:544–55. [140] Laracy JR, Leveson NG. Apply STAMP to critical infrastructure protection. 2007 IEEE Conf. Technol.
Homel. Secur. Enhancing Crit. Infrastruct. Dependability, 2007. doi:10.1109/THS.2007.370048. [141] Salmon PM, Read GJM, Stevens NJ. Who is in control of road safety? A STAMP control structure analysis
of the road transport system in Queensland, Australia. Accid Anal Prev 2016. doi:10.1016/j.aap.2016.05.025.