Neurobehavioral dynamics following chronic sleep restriction: Dose-response effects of one night for...
17
SLEEP, Vol. 33, No. 8, 2010 1013 Neurobehavioral Recovery Dynamics from Sleep Restriction—Banks et al RECOVERY OF NEUROBEHAVIORAL FUNCTIONS FROM CHRONIC CURTAILMENT OF SLEEP DURATION AS A RESULT OF WORK, MEDICAL CONDITIONS, OR lifestyle 1 is not well understood. It has been rarely studied, de- spite the fact that a common sleep pattern for millions of people involves sleep restriction for 5 weekdays/workdays, followed by sleep extension on at least one weekend night (or day off from work). 2-4 Much of what is known about recovery from sleep loss has been based on total sleep deprivation experi- ments, where robust NREM EEG slow wave activity (SWA, 0.5-4.5Hz) responses are the norm. 5-9 Experiments in chroni- cally sleep-restricted rats revealed increased recovery sleep du- ration, NREM and REM sleep durations, and elevated SWA, while only a small portion of the chronically lost sleep was ac- tually recovered. 10,11 Experiments in healthy humans have confirmed that chronic reduction of sleep can result in waking neurobehavioral deficits that become progressively worse over days; 12-15 that the rate of accumulation of waking deficits is a function of the magnitude of the sleep restriction; 12,15,16 and that measures of sleepiness, performance lapsing, and cognitive slowing can accumulate to deficit levels found for total sleep deprivation. 15 These findings indicate that waking brain impairment from chronic sleep loss is sleep dose-dependent, that it can be as severe as that result- ing from total sleep deprivation, and that the “sleep debt” is a result of prior sleep-wake history extending back in time more than a day. Thus, chronic sleep restriction appears to induce slow changes (spanning days to weeks) in neural processes mediating alertness, attention and other aspects of cognitive functioning, including learning and memory. 17 How these slow (cumulative) changes are reversed via the dynamics of recovery sleep is not known. Kleitman suggested “sleep debts” are “liquidated” by extend- ing recovery sleep duration (p. 317). 18 However, the primary RAPID PUBLICATION Neurobehavioral Dynamics Following Chronic Sleep Restriction: Dose-Response Effects of One Night for Recovery Siobhan Banks, PhD 1,2 ; Hans P. A. Van Dongen, PhD 3 ; Greg Maislin, MS, MA 4 ; David F. Dinges, PhD 1 1 Division of Sleep and Chronobiology, Department of Psychiatry, University of Pennsylvania School of Medicine, Philadelphia, PA; 2 Centre for Sleep Research, University of South Australia, Adelaide, South Australia, Australia; 3 Sleep and Performance Research Center, Washington State University, Spokane, WA; 4 Biomedical Statistical Consulting, Wynnewood, PA Objective: Establish the dose-response relationship between increasing sleep durations in a single night and recovery of neurobehavioral func- tions following chronic sleep restriction. Design: Intent-to-treat design in which subjects were randomized to 1 of 6 recovery sleep doses (0, 2, 4, 6, 8, or 10 h TIB) for 1 night following 5 nights of sleep restriction to 4 h TIB. Setting: Twelve consecutive days in a controlled laboratory environment. Participants: N = 159 healthy adults (aged 22-45 y), median = 29 y). Interventions: Following a week of home monitoring with actigraphy and 2 baseline nights of 10 h TIB, subjects were randomized to either sleep restriction to 4 h TIB per night for 5 nights followed by randomization to 1 of 6 nocturnal acute recovery sleep conditions (N = 142), or to a control condition involving 10 h TIB on all nights (N = 17). Measurements and Results: Primary neurobehavioral outcomes included lapses on the Psychomotor Vigilance Test (PVT), subjective sleepiness from the Karolinska Sleepiness Scale (KSS), and physiological sleepiness from a modified Maintenance of Wakefulness Test (MWT). Secondary outcomes included psychomotor and cognitive speed as measured by PVT fastest RTs and number correct on the Digit Symbol Substitution Task (DSST), respectively, and subjective fatigue from the Profile of Mood States (POMS). The dynamics of neurobehavioral outcomes following acute recovery sleep were statistically modeled across the 0 h-10 h recovery sleep doses. While TST, stage 2, REM sleep and NREM slow wave energy (SWE) increased linearly across recovery sleep doses, best-fitting neurobehavioral recovery functions were exponential across recovery sleep doses for PVT and KSS outcomes, and linear for the MWT. Analyses based on return to baseline and on estimated intersection with control condi- tion means revealed recovery was incomplete at the 10 h TIB (8.96 h TST) for PVT performance, KSS sleepiness, and POMS fatigue. Both TST and SWE were elevated above baseline at the maximum recovery dose of 10 h TIB. Conclusions: Neurobehavioral deficits induced by 5 nights of sleep restricted to 4 h improved monotonically as acute recovery sleep dose in- creased, but some deficits remained after 10 h TIB for recovery. Complete recovery from such sleep restriction may require a longer sleep period during 1 night, and/or multiple nights of recovery sleep. It appears that acute recovery from chronic sleep restriction occurs as a result of elevated sleep pressure evident in both increased SWE and TST. Keywords: Recovery sleep, sleep dose response, chronic sleep restriction, neurobehavioral, homeostatic sleep drive, sleep duration, sleep depri- vation, sleep loss, sleep need, PVT, KSS, MWT Citation: Banks S; Van Dongen HPA; Maislin G; Dinges DF. Neurobehavioral dynamics following chronic sleep restriction: dose-response effects of one night for recovery. SLEEP 2010;33(8):1013-1026. Submitted for publication March, 2010 Submitted in final revised form May, 2010 Accepted for publication May, 2010 Address correspondence to: David F. Dinges, PhD, Division of Sleep and Chronobiology, Department of Psychiatry, University of Pennsylvania School of Medicine, 1013 Blockley Hall, 423 Guardian Drive, Philadel- phia, PA 19104-6021; Tel: (215) 898-9949; E-mail: [email protected]. upenn.edu
Transcript of Neurobehavioral dynamics following chronic sleep restriction: Dose-response effects of one night for...

SLEEP, Vol. 33, No. 8, 2010 1013 Neurobehavioral Recovery Dynamics from Sleep Restriction—Banks et al
RECOVERY OF NEUROBEHAVIORAL FUNCTIONS FROM CHRONIC CURTAILMENT OF SLEEP DURATION AS A RESULT OF WORK, MEDICAL CONDITIONS, OR lifestyle1 is not well understood. It has been rarely studied, de-spite the fact that a common sleep pattern for millions of people involves sleep restriction for 5 weekdays/workdays, followed by sleep extension on at least one weekend night (or day off from work).2-4 Much of what is known about recovery from sleep loss has been based on total sleep deprivation experi-ments, where robust NREM EEG slow wave activity (SWA, 0.5-4.5Hz) responses are the norm.5-9 Experiments in chroni-cally sleep-restricted rats revealed increased recovery sleep du-
ration, NREM and REM sleep durations, and elevated SWA, while only a small portion of the chronically lost sleep was ac-tually recovered.10,11
Experiments in healthy humans have confirmed that chronic reduction of sleep can result in waking neurobehavioral deficits that become progressively worse over days;12-15 that the rate of accumulation of waking deficits is a function of the magnitude of the sleep restriction;12,15,16 and that measures of sleepiness, performance lapsing, and cognitive slowing can accumulate to deficit levels found for total sleep deprivation.15 These findings indicate that waking brain impairment from chronic sleep loss is sleep dose-dependent, that it can be as severe as that result-ing from total sleep deprivation, and that the “sleep debt” is a result of prior sleep-wake history extending back in time more than a day. Thus, chronic sleep restriction appears to induce slow changes (spanning days to weeks) in neural processes mediating alertness, attention and other aspects of cognitive functioning, including learning and memory.17 How these slow (cumulative) changes are reversed via the dynamics of recovery sleep is not known.
Kleitman suggested “sleep debts” are “liquidated” by extend-ing recovery sleep duration (p. 317).18 However, the primary
RAPID PUBLICATION
Neurobehavioral Dynamics Following Chronic Sleep Restriction: Dose-Response Effects of One Night for RecoverySiobhan Banks, PhD1,2; Hans P. A. Van Dongen, PhD3; Greg Maislin, MS, MA4; David F. Dinges, PhD1
1Division of Sleep and Chronobiology, Department of Psychiatry, University of Pennsylvania School of Medicine, Philadelphia, PA; 2Centre for Sleep Research, University of South Australia, Adelaide, South Australia, Australia; 3Sleep and Performance Research Center, Washington State University, Spokane, WA; 4Biomedical Statistical Consulting, Wynnewood, PA
Objective: Establish the dose-response relationship between increasing sleep durations in a single night and recovery of neurobehavioral func-tions following chronic sleep restriction.Design: Intent-to-treat design in which subjects were randomized to 1 of 6 recovery sleep doses (0, 2, 4, 6, 8, or 10 h TIB) for 1 night following 5 nights of sleep restriction to 4 h TIB.Setting: Twelve consecutive days in a controlled laboratory environment.Participants: N = 159 healthy adults (aged 22-45 y), median = 29 y).Interventions: Following a week of home monitoring with actigraphy and 2 baseline nights of 10 h TIB, subjects were randomized to either sleep restriction to 4 h TIB per night for 5 nights followed by randomization to 1 of 6 nocturnal acute recovery sleep conditions (N = 142), or to a control condition involving 10 h TIB on all nights (N = 17).Measurements and Results: Primary neurobehavioral outcomes included lapses on the Psychomotor Vigilance Test (PVT), subjective sleepiness from the Karolinska Sleepiness Scale (KSS), and physiological sleepiness from a modified Maintenance of Wakefulness Test (MWT). Secondary outcomes included psychomotor and cognitive speed as measured by PVT fastest RTs and number correct on the Digit Symbol Substitution Task (DSST), respectively, and subjective fatigue from the Profile of Mood States (POMS). The dynamics of neurobehavioral outcomes following acute recovery sleep were statistically modeled across the 0 h-10 h recovery sleep doses. While TST, stage 2, REM sleep and NREM slow wave energy (SWE) increased linearly across recovery sleep doses, best-fitting neurobehavioral recovery functions were exponential across recovery sleep doses for PVT and KSS outcomes, and linear for the MWT. Analyses based on return to baseline and on estimated intersection with control condi-tion means revealed recovery was incomplete at the 10 h TIB (8.96 h TST) for PVT performance, KSS sleepiness, and POMS fatigue. Both TST and SWE were elevated above baseline at the maximum recovery dose of 10 h TIB.Conclusions: Neurobehavioral deficits induced by 5 nights of sleep restricted to 4 h improved monotonically as acute recovery sleep dose in-creased, but some deficits remained after 10 h TIB for recovery. Complete recovery from such sleep restriction may require a longer sleep period during 1 night, and/or multiple nights of recovery sleep. It appears that acute recovery from chronic sleep restriction occurs as a result of elevated sleep pressure evident in both increased SWE and TST.Keywords: Recovery sleep, sleep dose response, chronic sleep restriction, neurobehavioral, homeostatic sleep drive, sleep duration, sleep depri-vation, sleep loss, sleep need, PVT, KSS, MWTCitation: Banks S; Van Dongen HPA; Maislin G; Dinges DF. Neurobehavioral dynamics following chronic sleep restriction: dose-response effects of one night for recovery. SLEEP 2010;33(8):1013-1026.
Submitted for publication March, 2010Submitted in final revised form May, 2010Accepted for publication May, 2010Address correspondence to: David F. Dinges, PhD, Division of Sleep and Chronobiology, Department of Psychiatry, University of Pennsylvania School of Medicine, 1013 Blockley Hall, 423 Guardian Drive, Philadel-phia, PA 19104-6021; Tel: (215) 898-9949; E-mail: [email protected]

SLEEP, Vol. 33, No. 8, 2010 1014 Neurobehavioral Recovery Dynamics from Sleep Restriction—Banks et al
model of human sleep homeostasis, the two-process model,19,20 posits that the intensity and temporal dynamics of NREM EEG SWA, more so than sleep duration, reflect the recovery process. For example, the two-process model predicts only an initial modest (~10%-20%) elevation in SWA over the first few days of sleep restricted to 4 h per night, which has been experimen-tally confirmed,15,21 although increases of 50% have been re-ported for a broader EEG frequency band (1.25-7.75 Hz).22 The relatively modest increment in SWA during and following sleep restriction is not congruent with the large cumulative neurobe-havioral deficits that develop across days of sleep restriction.15 The apparent uncoupling during chronic sleep restriction of the putative marker of homeostatic sleep drive (SWA) and wak-ing neurobehavioral functions suggests that sleep duration and/or other aspects of sleep (e.g., REM sleep) may also have a critical role in recovery of neurobehavioral capability following chronic sleep restriction. On the other hand, the high degree of colinearity among SWA, TST and the duration of sleep stages may prevent attributing recovery from chronic sleep restriction to a specific physiological feature of sleep.
The dynamics of recovery of human waking alertness and neurobehavioral functions following chronic sleep restriction have not been systematically investigated. Experiments in healthy adults scheduled to 7 nights of sleep restricted to 3 h-7 h TIB12 or 5 nights of sleep restricted to 4 h TIB22 yielded data suggesting that some neurobehavioral functions may not return to baseline following up to 3 recovery sleep periods limited to 8 h TIB.12,23 Studying the dynamics of recovery from cumulative sleep loss is critical to a range of behavioral guidelines (e.g., days off duty for recovery from work schedules),24 biological questions (e.g., mechanisms and rates of homeostatic sleep drive build-up and dissipation),25 and theoretical issues (e.g., processes to instantiate into mathematical models predicting sleep and alertness).26-28The present experiment was designed to provide the first systematic, randomized, sleep dose-response data on the dynamic recovery of neurobehavioral functions when a single recovery sleep opportunity follows 5 days of nocturnal sleep restriction to 4 h TIB. The study tested the hy-pothesis that following sleep restriction, recovery of primary measures of neurobehavioral alertness would increase mono-tonically in relation to the duration of time allowed for recovery sleep. We also sought to determine the features of sleep that parallel this recovery.
METHODSA total of 159 healthy adults completed a 12-day laboratory
protocol (i.e., a total of 1,908 experimental days in the labo-ratory). The study was approved by the Institutional Review Board of the University of Pennsylvania, and all subjects were compensated for their participation. There were no serious ad-verse events during the study.
SubjectsHealthy individuals, aged 22-45 y, were recruited to the
study in response to study advertisements. They reported ha-bitual nightly sleep durations between 6.5 h and 8.5 h, and ha-bitual morning awakenings between 06:00 and 09:00, with no evidence of habitual napping and no sleep disturbances (i.e., no complaints of insomnia, daytime sleepiness, or other sleep-
wake disturbances). They were free of acute and chronic medi-cal and psychological conditions, as established by interviews, clinical history, questionnaires, physical exams, and blood and urine tests. Subjects were monitored at home with actigraphy, sleep-wake diaries, and time-stamped phone records for time to bed and time awake during the week immediately before the 12-day laboratory phase and for 1 week after the laboratory phase. A behavioral estimate of circadian phase position was obtained with a morningness/eveningness questionnaire.29 Subjects re-cruited to the study were nonsmokers and had a body mass in-dex (BMI) between 19 and 30. They did not participate in shift work, transmeridian travel, or irregular sleep/wake routines in the 60 days prior to the study. Sleep health was established by a night of laboratory PSG and oximetry measurements. Sub-jects were not permitted to use caffeine, alcohol, tobacco, and medications (except oral contraceptives) in the week before the laboratory experiment, as verified by blood and urine screens. Out of a total of 171 eligible subjects empanelled into the 12-day laboratory protocol, n = 6 (3.5%) withdrew before the pro-tocol was completed for personal reasons (primarily related to time commitment required), and n = 6 (3.5%) were withdrawn for non-serious health reasons (e.g., gastrointestinal problems, headache, etc.).
Laboratory ProtocolSubjects were studied in small groups for 12 consecutive
days (continuously for 288 h) in the Sleep and Chronobiol-ogy Laboratory at the Hospital of the University of Pennsyl-vania, with daily clinical checks of vital signs and symptoms by nurses (with an independent physician on call). They were randomized as a group (n = 4 to 5 per group) to either the sleep restriction condition (N = 142) or control condition (N = 17). In the sleep restriction condition, subjects had 2 initial baseline nights (B1, B2) of 10 h TIB per night (22:00–08:00), followed by 5 nights (SR1-SR5) of sleep restricted to 4 h TIB per night (04:00–08:00). Sleep restriction to 4 h for 5 consecutive nights was selected because this degree of sleep restriction produces cumulative neurobehavioral deficits in most healthy adults15 and it is within the range of sleep restriction that can occur as a result of lifestyle factors.
To model recovery of neurobehavioral measures of alertness across a dynamic range of recovery sleep opportunities, subjects were then randomized to one of 6 doses of sleep on the recovery (REC) night: 0 h TIB (no sleep), 2 h TIB (06:00-08:00), 4 h TIB (04:00-08:00), 6 h TIB (02:00-08:00), 8 h TIB (00:00-08:00), or 10 h TIB (22:00-08:00). The remaining 4 nights of the study involved other conditions not reported here. The control condi-tion involved all the same procedures as the sleep restriction condition, except that subjects were allowed 10 h TIB (22:00–08:00) every night of the protocol. Subjects were informed of their randomization to the sleep restriction or control condition on the second baseline night (B2), and if they were assigned to the sleep restriction condition they were informed of their re-covery sleep dose during the afternoon of sleep restriction day 4 (SR4). Subjects were behaviorally monitored by trained staff continuously throughout the protocol to ensure adherence to the experimental protocol. They had daily contact with the Project Manager and/or the Principal Investigators. Demand character-istics were controlled by ensuring subjects remained blinded to

SLEEP, Vol. 33, No. 8, 2010 1015 Neurobehavioral Recovery Dynamics from Sleep Restriction—Banks et al
their recovery condition, by continuous monitoring of subjects’ performance for adherence, and by sustained encouragement of subjects to perform to the best of their ability at all times.
Subjects wore a wrist actigraph throughout the 12-day labo-ratory protocol (as well as 1 week before and after the labora-tory protocol). On protocol days B1, B2, SR1, SR5, and REC, they wore ambulatory EEG and ECG recording equipment throughout the day and night. During the days without EEG, subjects were given shower opportunities between 14:30 and 16:00. Meals were provided at regular times throughout the protocol (08:30-10:00; 12:30-14:00; 18:30-20:00). The light levels in the laboratory were held constant at < 50 lux during scheduled wakefulness and < 1 lux during scheduled sleep pe-riods. Ambient temperature was maintained between 22°-24°C.
Neurobehavioral OutcomesSubjects completed 30-min bouts of computerized neurobe-
havioral assessments every 2 h during scheduled wakefulness, beginning at 08:00 each day. Those randomized to the sleep restriction condition had additional, abbreviated test bouts (20 min) after 20:00 during the sleep restriction phase of the study, and also on the day before recovery sleep if they were random-ized to a sleep dose < 10 h TIB. The 30-min neurobehavioral assessment bouts included a 10-min Psychomotor Vigilance Test (PVT; ISI 2-10s),30-32 a 3-min Digit Symbol Substitution Task (DSST),33 the Karolinska Sleepiness Scale (KSS),34 and the Profile of Mood States (POMS).35 Daily averages of out-come variables (see below) were computed over the test bouts administered during a 12-h period from morning to early eve-ning (08:00, 10:00, 12:00, 14:00, 16:00, 18:00, 20:00). Be-tween neurobehavioral test bouts, subjects were permitted to read, watch movies and television, play card/board games, and interact with laboratory staff to help them stay awake, but no naps/sleep or vigorous activities (e.g., exercise) were allowed.
A modified MWT, used to measure the ability to stay awake in a soporific environment, was completed on baseline day 2 (B2), sleep restriction day 5 (SR5) and on the recovery day (REC). The MWT procedure was modified from that described in earlier studies,36-38 in that a single MWT trial limited to 30 min was conducted between 14:30 and 16:00. All other aspects of the test including EEG montage (C3/A2, O2/A1), environ-ment, and sleep onset definition were as previously described.36 Before each trial, subjects were instructed to “keep eyes open and try not to fall asleep,” and the lights were dimmed to 10 lux. Each trial was terminated at the first occurrence of a microsleep (10 s of EEG theta activity) or at 30 min if sleep onset was not achieved.36,37 The latency to the onset of the microsleep was measured, or if sleep onset was not reached, a value of 30 min was recorded.
Neurobehavioral outcomes for this study were selected for their representativeness of different waking functional domains of alertness and for their known sensitivity to sleep-wake dy-namics, including chronic partial sleep deprivation.1 Primary outcomes for hypothesis testing included well-validated behav-ioral, subjective, and physiological measures of alertness. The behavioral measure was the number of lapses of attention (RT ≥ 500ms) on the PVT; the subjective measure was sleepiness on the KSS; and the physiological measure was latency to the first microsleep on the modified MWT. Secondary neurobehavioral
outcomes addressed additional functional domains that were less well validated for sensitivity to chronic sleep restriction. These included psychomotor speed as measured by the mean of the PVT fastest 10% RTs (PVTf10), cognitive speed (number correct) measured by the DSST, and subjective fatigue from the POMS (POMSf).
Sleep PhysiologyPSG recordings (EEG derivations C3-A2, Fz-A1, O2-A1;
EOG LOC/ROC; submental EMG) were conducted with the Sandman Suzanne portable digital recording system (128-Hz sampling) on B1, B2, SR1, SR5, and REC. The EEG from the C3-A2 derivation was scored according to the criteria of Re-chtschaffen and Kales39 by trained technicians. Sleep onset was conservatively defined by the occurrence of ≥ 3 consecutive 30-s epochs of stage 2-4 or REM sleep. Total sleep time, sleep efficiency (TST percentage of TIB), REM sleep, stage 2 sleep, and slow wave sleep (SWS; stages 3+4) were determined for each recorded night. Subjects with missing or artifact-ridden PSG data on the final baseline night or the recovery night were not included in the PSG analyses, which yielded a total of N = 118 sleep-restricted subjects and N = 17 control subjects for PSG analyses.
Slow wave energy (SWE) was calculated as integrated pow-er in the delta band (0.5-4.5 Hz) totaled over all 30-s epochs of NREM sleep (stages 2-4). The NREM sleep EEG was analyzed in 5-s bins using fast Fourier transform, after visually deter-mined EEG artifacts were removed. Only data from the C3-A2 derivation are presented here. Total SWE for each night was expressed as percentage of the B2 night for each subject. In n = 16 subjects the EEG quality prevented reliable SWE analysis, and in n = 23 subjects B2 data were missing, leaving a total of N = 104 sleep-restricted subjects and N = 16 control condition subjects for SWE analyses.
Statistical MethodsData analyses were performed using the intent-to-treat
framework40 in order to retain the bias-reducing benefits of randomization and to maximize relevance of the experiment to the practical question of recovery sleep scheduling. Before proceeding with linear and non-linear dose-response analyses of recovery sleep duration, the effects of the 5-day sleep re-striction protocol were characterized by estimation of relevant parameters including standardized effect sizes. Mixed model repeated measures (MMR) analyses were used to demonstrate the effects of restricting sleep-induced changes on neurobehav-ioral outcomes as compared to the control condition. To avoid making any assumptions concerning the shape of changes across days, time was considered a categorical variable.
Analyses of recovery involved formal testing of the existence of a dose response relationship (for the 0 h to 10 h TIB recov-ery sleep doses) for 3 primary neurobehavioral outcomes (PVT lapses, KSS score, and modified MWT sleep latency) followed by: (a) assessment of non-linearity of dose responsiveness; (b) prediction of minimum recovery sleep duration necessary to reach pre-sleep restriction baseline; and (c) prediction of mini-mum recovery sleep duration necessary to reach performance levels exhibited by sleep-satiated controls treated similarly in the laboratory but with no sleep restriction. The study design

SLEEP, Vol. 33, No. 8, 2010 1016 Neurobehavioral Recovery Dynamics from Sleep Restriction—Banks et al
potheses incorporated recovery sleep dose (0 h, 2 h, 4 h, 6 h, 8 h, 10 h) as a single degree-of-freedom continuous variable.
Shapes of the recovery sleep dose-response curves were deter-mined in subsequent analyses. Four candidate models were com-pared for each parameter including linear (model 1), exponential (models 2 and 3), and sigmoidal (model 4) functional forms. Exponential forms were specified with (model 3) and without (model 2) restricting the asymptote to be equal to baseline (a difference of one parameter). Maximum likelihood estimation (MLE, SAS Proc NLMIXED) was used to evaluate parameters for each dose response functional form. Akaike’s information criterion41 (AIC) was used to select the best-fitting functional form for each outcome variable. AIC penalizes the better fit of more complex models (i.e., those with more parameters) by a factor proportional to the number of additional parameters. AIC is scaled such that the model with the minimum AIC is identi-fied as the one that most adequately fits the data. The functional forms of the models and summaries of the AIC model compari-sons are provided in the Supplement Tables (supplementary ma-terial is available online only at www.journalsleep.org).
Analyses were performed to determine the duration of re-covery sleep necessary for predicted performance to return to pre-deprivation levels (i.e., baseline) levels. Separate analyses that included controls were performed to determine the dura-tion of recovery sleep necessary for those who underwent 4 h TIB for 5 days to reach a predicted performance level equal to that of control subjects (10 h TIB per night) in the same exper-imental context on the same day of the protocol. Models in-volving comparisons to controls did not include the covariate for the subject-specific cumulative effects of prior sleep loss since controls did not undergo experimental sleep restriction. The same analyses were performed on secondary neurobehav-ioral outcomes (DSST, PVTf10, POMSf). Analyses were also performed for all 6 neurobehavioral outcomes by replacing TIB with TST as the primary independent variable. There was a statistically significant correlation between TIB and TST on all nights of the study (all r > 0.95, all P < 0.001), and no new findings were observed using TST that were not found
was optimized to test the primary research hypothesis that fol-lowing sleep restriction to 4 h TIB for 5 nights, recovery of neurobehavioral function would increase monotonically in relation to the duration of time allowed for recovery sleep. A linear dose-response was assumed for the purpose of testing the overall experiment-wise primary hypothesis. This approach was selected for its generally good statistical power under a va-riety of underlying monotonic shapes. For the purpose of type I error control, the primary null and alternative hypotheses were formulated in terms of absence versus presence of a significant linear recovery-sleep dose-response relationship. Subsequent analyses assessed theory-driven hypotheses relative to whether the shape of the predicted recovery dose-response relationships could be better characterized through the use of exponential and sigmoidal models.
The primary hypothesis implied that a significant percentage of variance in each of the primary neurobehavioral outcomes (PVT lapses, KSS score, and modified MWT sleep latency) would be explainable by a linear association with duration of recovery sleep. For each of these outcomes, least squares esti-mation was used to determine parameters of an analysis of co-variance (ANCOVA) regression model that included a fixed set of a priori chosen covariates. Appropriate model modifications were made for the MWT data, which were acquired only at B2 and SR5. Covariates included the pre-sleep restriction baseline value of the outcome variable, a factor reflecting the cumula-tive effects of the sleep restriction protocol (determined as the area under the curve of changes from baseline during the sleep restriction days—i.e., subjects’ individual rates of accumulat-ing sleepiness during 5 days of sleep restriction), age and sex. One set of a priori covariates was chosen for all analyses in order to maximize generalizability. Continuous covariates were centered on their grand means, and sex was centered on male so as to make model intercepts interpretable as the predicted value for a representative enrolled male. Since three primary outcomes were tested, overall experiment-wise significance re-quired P < 0.05/3 = 0.0167 for at least one of the 3 primary endpoints. The ANCOVA models used to test the primary hy-
Table 1—Demographic and subject characteristics by group and sleep dose.
AllSubjectsn = 159
Control10h TIBn = 17
SleepRestricted
n = 142
Recovery Sleep Dose0h TIBn = 13
2h TIBn = 27
4h TIBn = 29
6h TIBn = 25
8h TIBn = 21
10h TIBn = 27
Age (y)1 30.4 ± 7.0 29.8 ± 6.8 30.6 ± 7.0 31.3 ± 7.1 32.1 ± 8.2 31.9 ± 6.9 30.0 ± 6.7 29.5 ± 5.9 28.7 ± 6.7Females (%) 49.1 52.9 48.6 61.5 40.7 48.3 48.0 52.4 48.1BMI 25.1 ± 3.5 25.5 ± 3.3 24.7 ± 3.6 25.0 ± 4.2 24.9 ± 3.8 24.1 ± 2.8 24.5 ± 3.6 24.4 ± 4.3 25.3 ± 3.5Caucasian (%) 36.5 17.6 38.7 53.8 40.7 41.4 36.0 38.1 29.6AA2 (%) 57.2 64.7 56.3 23.1 55.6 55.2 64.0 61.9 63.0Hispanic (%) 3.8 5.9 3.5 15.4 3.7 3.4 0 0 3.7Asian (%) 2.5 11.8 1.4 7.7 0 0 0 0 3.7Pre-lab TST (h)1 7.9 ± 0.6 7.8 ± 0.4 8.1 ± 0.7 8.3 ± 0.6 8.0 ± 0.4 8.0 ± 1.0 8.2 ± 0.5 8.1 ± 0.6 8.0 ± 0.7MEQc1 38.9 ± 5.6 38.2 ± 5.6 39.7 ± 5.6 39.2 ± 6.7 40.5 ± 5.7 40.4 ± 5.3 38.2 ± 6.5 38.7 ± 5.4 40.9 ± 4.9
1Mean ± SD. 2African American. BMI, body mass index; Pre-lab TST, actigraph + sleep diary estimated mean nightly sleep duration during the week prior to the laboratory study. MEQc, Morningness-Eveningness Composite Score (all means are intermediate between evening and morning types).26

SLEEP, Vol. 33, No. 8, 2010 1017 Neurobehavioral Recovery Dynamics from Sleep Restriction—Banks et al
increase from 84.6% at baseline to 93.0% on the first restric-tion night (ES = 0.88, P < 0.0001), and increased further from SR1 to SR5 by 3.8%, (ES = 0.52, P < 0.0001). REM sleep time (Figure 1D) significantly decreased from 117.3 min at baseline to 51.0 min on SR1, then increased from SR1 to SR5 by 7.3 min (ES = 0.41, P < 0.0001).
SWS (Figure 1E) showed a pattern unlike other sleep vari-ables. Although it decreased from a mean of 69.0 min at base-line to 59.5 min at SR1 (ES = −0.41, P < 0.0001), and increased to 64.9 min at SR5 (ES = 0.32, P < 0.0006), the mean change from baseline to SR5 was not significantly different from zero (ES = −0.14, P = 0.14), due to an increase in SWS from SR1 to SR5 (ES = 0.32, P < 0.0006).
SWE (Figure 1F) was by definition 100% at baseline. It de-creased to a mean of 64.8% on SR1 (ES = −2.15, P < 0.0001),
using TIB. Therefore, this report emphasizes primarily TIB-based analyses and results. TST results are reported for some analyses to present the amount of physiologi-cal sleep acquired during recovery TIB following sleep restriction.
Adjusted linear dose-response ANCOVA models, in which covari-ates included baseline sleep, age, and gender, were used to evaluate sleep parameters across recovery nights. Categorical sleep duration was used to avoid making linear-ity assumptions when testing these models. Shapes of the recovery sleep-dose response curves were determined in subsequent analy-ses, as described above, across the 2 h-10 h TIB recovery conditions.
RESULTSSubjects were 30.4 y ± 7.0 y
(mean ± SD) of age (median = 29 y). They had a BMI of 25.1 ± 3.5, and pre-laboratory nocturnal sleep durations of 7.9 h ± 0.6 h; 49% were female; and 63% were from racial/ethnic minorities. Table 1 shows the demographics of subjects randomized to the control and sleep restriction conditions, and among the latter, of subjects randomized to each of the recovery sleep dos-es. There were no statistically sig-nificant differences in age, BMI, pre-laboratory sleep duration, or Morningness-Eveningness scores among the randomized subgroups.
Effect of Sleep Restriction on Sleep Physiology
Figure 1 displays the sleep re-sponses at baseline (B2; 10 h TIB) and on the first (SR1) and fifth (SR5) nights for N = 118 sub-jects in the sleep restriction condition (solid line), and N = 17 control subjects (10 h TIB on all nights) on equivalent protocol nights. The effect size analyses for the sleep parameters illus-trated in Figure 1 are summarized in Table S1 of the Supple-ment. Figure 1A shows the expected reduction in TST from 8.47 h at baseline to 3.72 h on SR1 and 3.85 h on SR5. The mean changes from baseline to first and fifth restriction nights were 4.73 h and 4.64 h, respectively, corresponding to standard-ized effect sizes (ES) of −4.57 and −4.31, respectively (both P < 0.0001; see Supplement Table S1). The mean increase in TST from SR1 to SR5 was 7.51 minutes (ES = 0.46, P < 0.0001). The pattern for stage 2 sleep (Figure 1B) was similar to that of TST except that there was no significant change in stage 2 time from SR1 to SR5. Sleep efficiency (Figure 1C) had a mean
Figure 1—Mean ± SEM for sleep variables at baseline (B2 = 10 h TIB) and on the first (SR1) and fifth (SR5) nights of sleep restriction to 4 h TIB (04:00-08:00) for N = 118 sleep-restricted subjects (solid line), and N = 17 control subjects (dashed line) who received 10 h TIB (22:00-08:00) on all protocol nights. The effect sizes for the sleep parameters illustrated in Figure 1 are summarized in Supplement Table S1. As expected, sleep restriction decreased TST (graph A, P < 0.0001), stage 2 sleep (B, P < 0.0001), REM sleep (D, P < 0.0001), SWS (E, P < 0.0001), SWE (F, P < 0.0006), and increased sleep efficiency (C, P < 0.0001). There were small but reliable increases from SR1 to SR5 in TST (A, P < 0.0001), sleep efficiency (C, P < 0.0001), REM sleep (D, P < 0.0001), SWE (F, P < 0.0006), and SWS (E, P < 0.0006) but not stage 2 sleep (B, P > 0.05). The control group did not differ from the sleep restriction group on any of the sleep variables at baseline (all P > 0.2). Subjects in the control condition had a reduction in mean TST from 8.74 h on B2 to 7.95 h (P = 0.02) on the seventh night of 10 h TIB (equivalent night to SR5), and thus an 8% decrease in sleep efficiency across these nights, P = 0.02. No one specific aspect of sleep physiology accounted for the decreased TST across protocol nights (stage 2 sleep, P = 0.26; REM sleep, P = 0.85; SWS, P = 0.38; and SWE, P = 0.96).
REM
Slee
p (m
in)
Stag
e 2 sl
eep
(min
)%
Bas
eline
SW
E in
NRE
M
Slee
p Ef
ficien
cy (%
)To
tal S
leep
Tim
e (ho
ur)
Slow
Wav
e Slee
p (m
in)
Protocol Night
B2 SR1 SR5B2 SR1 SR5
3
4
5
6
7
8
9 A
80
130
180
230
280B
75
80
85
90
95
100 C
40
60
80
100
120D
40
50
60
70
80 E
50
65
80
95
110
125 F

SLEEP, Vol. 33, No. 8, 2010 1018 Neurobehavioral Recovery Dynamics from Sleep Restriction—Banks et al
change from baseline to the eighth night in the control group (stage 2 sleep, P = 0.26; REM sleep, P = 0.85; SWS, P = 0.38; and SWE, P = 0.96).
Effect of Sleep Restriction on Neurobehavioral Functions
Figure 2 displays the cumula-tive effects on neurobehavioral outcomes of 5 nights of sleep re-stricted to 4 h TIB relative to the control condition (i.e., 10 h TIB each night). Sleep restriction ef-fects were evident in the inter-action between condition (sleep restriction vs. control) and time (across protocol days). These in-teractions were statistically signifi-cant for all primary and secondary neurobehavioral outcomes shown in Figure 2 (PVT number of laps-es, F5,785 = 12.6, P < 0.0001; KSS sleepiness score, F5,785 = 10.3, P < 0.0001; MWT sleep latency, F1,295 = 4.8, P < 0.0001; DSST num-ber correct, F5,785 = 4.8, P < 0.0001; PVT fastest 10%, F5,785 = 14.4, P < 0.0001; POMS fatigue score, F5,784 = 2.9, P = 0.01). The main effect of time was also significant (P < 0.0001) for all outcomes in Fig-ure 2, except for DSST number cor-rect (P = 0.052). This was the result of learning countering the effects of sleep restriction on DSST per-formance across days. The control group displayed this performance improvement due to learning over time (F5,80 = 5.5, P = 0.002; Figure 2D). Changes across days were not
significant in control subjects for any other variables except the MWT, which displayed a significant increase in sleep latency from B2 to SR5 (P = 0.02) in response to the extended (10 h) TIB provided to controls each day (Figure 2C).
Neurobehavioral Outcomes as a Function of Recovery Sleep Dose
Figure 3 displays the 0 h-10 h recovery sleep dose ef-fects on neurobehavioral responses. For comparison, the mean baseline values for the sleep restriction group and the mean values for the control group (on the day equivalent to REC) are shown as horizontal lines. Controlling for base-line performance, cumulative deficit during sleep restriction, age, and sex, the estimated linear slope (standard error over sleep doses) for PVT lapses was −1.38 (0.10), shown in Fig-ure 3A (t115 = −8.89, P < 0.0001, R2 = 74.98%). KSS ratings had an adjusted slope of −0.32 (0.04), shown in Figure 3B (t115 = −8.41, P < 0.0001, R2 = 67.89%). MWT latencies had
then increased to 77.8% on SR5 (ES = 0.50, P < 0.0001). Un-like SWS, SWE remained significantly below baseline levels at SR5 (ES = −0.91, P < 0.0001), although there was an increase in SWE from SR1 to SR5 (ES = 0.50, P < 0.0001)—see Supple-ment Table S1.
The control group did not differ from the sleep restriction group on any of the sleep variables at baseline (all P > 0.2). TST, stage 2 sleep, REM sleep, and SWE were significantly greater in the control group relative to the sleep restriction group on both nights SR1 and SR5 (all P < 0.001). Sleep efficiency was higher in the sleep restriction group than in the control group on both SR1 and SR5 nights (P < 0.001). SWS did not differ significantly between the 2 groups on any night (P > 0.05).
Subjects in the control condition slept a mean of 8.74 h of the 10 h TIB on baseline night B2, but by the eighth night of 10 h TIB (equivalent to SR5 in the sleep-restricted condition), they slept on average 7.95 h, a mean decrease of 46 min (P = 0.02). No other control group sleep variable exhibited a significant
Figure 2—Daily means (± SEM) of 6 neurobehavioral assessments in the sleep restriction group (N = 142, 4 h TIB for 5 nights [SR1-SR5], solid line), and the control group (N = 17, 10 h TIB on all nights, dashed line). All subjects had 10 h TIB (22:00-08:00) on baseline day 2 (B2). Sleep restriction on SR1 to SR5 was from 04:00 to 08:00. Data are plotted to show deficits in neurobehavioral functions increasing (upward) on the ordinate. Relative to the control condition, sleep restriction degraded all neurobehavioral functions over days (graph A, increased PVT lapses, P < 0.0001; B, increased KSS scores, P < 0.0001; C, decreased MWT sleep latency [assessed on B2 and SR5], P < 0.0001; D, decreased DSST number correct, P < 0.0001; E, increased PVT fastest RTs, P < 0.0001; F, increased POMS fatigue, P = 0.01). Control group performance on the DSST improved significantly (P = 0.002) across days due to learning (D), while MWT sleep latency increased significantly (P = 0.02) across days due to the extended (10h) TIB provided to control subjects each day (C).
KSS
MWT
(min
)
POMS
fDS
ST
PVTf
10 (m
s)PV
T La
pses
Protocol DayB2 SR1 SR2 SR3 SR4 SR5B2 SR1 SR2 SR3 SR4 SR5
0
10
20
30
190
200
210
220
230
0
2
4
6
8
10
12 A
53
55
57
59
61
63
1
2
3
4
5
6
7
0
2
4
6
8
B
C D
E F

SLEEP, Vol. 33, No. 8, 2010 1019 Neurobehavioral Recovery Dynamics from Sleep Restriction—Banks et al
The corresponding squared partial correlation for model 3 was computed as (0.703-0.587)/(1-0.587) = 0.281, which indicates that exponential model 3 accounted for 28.1% of the unexplained variance in PVT lapses relative to the null hypothesis model. Figure 3A presents the predicted values from model 3 as a smooth line plotted over the least squares estimates (means ± SEM) from an unrestricted categorical dose response relationship. Although the best fitting model was the exponential dose response with asymptote set to pre-sleep-restriction baseline, the squared partial correlation for the linear model 1 accounted for 41.1% of the unexplained variance in the recovery dose-response function. Thus, while the pattern of unrestricted least square means as well as the AIC analyses suggest an exponential recovery dose response,
an adjusted slope of 1.47 (0.21), shown in Figure 3C (t115 = 6.99, P < 0.0001, R2 = 34.33%). Thus, for the primary outcome vari-ables, a significant linear recovery sleep dose response was found beyond chance (i.e., a Bonfer-roni corrected type 2 threshold of P < 0.0167). The same results were obtained for the second-ary neurobehavioral outcomes. DSST number correct had an ad-justed slope (SE) of 1.34 (0.12), shown in Figure 3D (t115 = 11.20, P < 0.0001, R2 = 89.79%). PVT fastest 10% RTs had an adjusted slope of −2.67 (0.38), shown in Figure 3E (t115 = −7.04, P < 0.0001, R2 = 81.86%). POMS fatigue had an adjusted slope of −0.60 (0.10), shown in Figure 3F (t115 = −6.05, P < 0.0001, R2 = 64.59%).
Analyses of Non-Linearity of Dose Response Curves
To determine the functional shape of how recovery sleep dose affected the response curves for each of the neurobehavioral out-comes, four models that included the recovery sleep dose condition were estimated—linear dose re-sponse (model 1), exponential dose response (model 2), exponential dose response restricting the as-ymptote to baseline (model 3) and sigmoidal dose response (model 4). The model that best approximated the reality of the functional recov-ery of each neurobehavioral out-come was identified as the one with the smallest value for Akaike’s information criterion41 (AIC). The functional forms of the four mod-els, and the null model (no recovery condition effect included), which was estimated for comparison purposes, are provided in Supplement Table S2, and AIC com-parisons are provided for the primary (Tables S3 to S5) and secondary outcomes (Tables S6 to S7).
Models fit to PVT lapses revealed that the exponential dose response function with asymptote set to baseline (i.e., model 3) had the lowest (most adequate) AIC = 750.4 (R2 = 70.3%; Supplement Table S3). The R2 value for the null model that included only covariates for the mean recovery and change from baseline was 57.8% (model 0; Supplement Table S3). The difference between the R2 values of models 0 and 3 re-flects the incremental predictive capacity of the exponential dose response function with asymptote set to baseline (i.e., model 3) when accounting for the recovery dose response.
Figure 3—Neurobehavioral outcomes as a function of increasing TIB dose (0 h-10 h) following the acute recovery (REC) night. N = 142 sleep restricted subjects were randomized to either 0 h TIB (n = 13), 2 h TIB (n = 27), 4 h TIB (n = 29), 6 h TIB (n = 25), 8 h TIB (n = 21), or 10 h TIB (n = 27). Least squares means (± SEM) are shown as diamonds for each REC sleep dose subgroup, controlling for covariates (i.e., baseline, cumulative deficits during sleep restriction, age, and sex). For comparison, horizontal dotted lines show baseline night (B2, 10 h TIB) values, and horizontal dashed lines show control group (N = 17) means on day 8 (10 h TIB), which is the day equivalent to REC. All neurobehavioral outcomes showed improvement as recovery sleep doses increased (graph A, PVT lapses decreased, P < 0.0001; B, KSS sleepiness decreased, P < 0.0001; C, MWT latencies increased, P < 0.0001; D, DSST number correct increased, P < 0.0001; E, PVT fastest RTs shortened, P < 0.0001; F, POMS fatigue decreased, P < 0.0001). Best-fitting recovery sleep dose-response functions (from AIC) are shown as the solid lines in each graph (see Supplement Tables S2 to S8). These functions are exponential with asymptote set to baseline (graphs A, B, E), linear (graphs C, D) and sigmoidal (graph F). Least squares means (diamonds) represent the overall covariate-controlled group means; best-fitting functions are shown for males with the other covariates set to the sample means.
KSS
MWT
(min
)
POMS
f
PVTf
10 (m
s)PV
T La
pses
0h 2h 4h 6h 8h 10h
Recovery Time in Bed Sleep Dose Following 5 Nights of Sleep Restriction to 4h TIBDS
ST
0
5
10
15
20
25 A
38
43
48
53
58
63
0
5
10
15
20
25
C
195
205
215
225
235
245
255
0
2
4
6
8
10
12
1
2
3
4
5
6
7
8
9
0h 2h 4h 6h 8h 10h
B
D
E F

SLEEP, Vol. 33, No. 8, 2010 1020 Neurobehavioral Recovery Dynamics from Sleep Restriction—Banks et al
DSST performance by linear model 1 over null model 0 was 52.1%. The additional variance explained in PVT fastest 10% RTs by exponential model 3 over null model 0 was 20.6%. The additional variance explained in POMS fatigue scores by sigmoidal model 4 over null model 0 was 31.9%. As with all 3 primary outcomes, for DSST and PVT fastest 10% the proportion of total variance explained by linear model 1 was larger than or only slightly smaller than the optimal model selected by AIC (see Supplement Tables S6, S7, S8).
Analyses of Neurobehavioral Recovery to Baseline and Control Levels
The extent of recovery from the chronic sleep restriction conditions was assessed in two ways: (1) by comparing the neurobehavioral outcomes after each recovery sleep dose to the pre-sleep-restriction baseline values (within-subjects com-parisons), and (2) by projecting the linear sleep-dose recovery model to determine an intersection of each neurobehavioral outcome with the control group’s data after the same number of days in the laboratory. Linear models (rather than exponential models) were used to ensure intersection values could be ex-trapolated for neurobehavioral dose-response functions (except POMS fatigue), because intersection with control group values was not guaranteed with exponential models.
Post Recovery Neurobehavioral Outcomes Relative to BaselineTable 2 displays the results of pairwise comparisons be-
tween each recovery (REC) sleep dose subgroup (condition) and the subjects’ respective baseline values (B2). These com-parisons revealed that among the 10 h TIB recovery group, PVT lapses and KSS ratings remained elevated above base-line (P = 0.008 and P = 0.007, respectively). This was also the case for the secondary outcomes of PVT fastest 10%
on an individual basis, the assumption of linear dose response appears to perform at least as well for PVT lapses.
The model with the lowest AIC value for KSS scores was also the exponential function with asymptote set to baseline (model 3, Supplement Table S4). The R2 for exponential model 3 was 67.6%, and the R2 for linear model 1 was 67.9%. The R2 for null hypothesis model 0 was 48.2%. Thus, after accounting for baseline KSS, age, gender, and the subjects’ individual rates of accumulating sleepiness during 5 days of sleep restriction (4h/day), the duration of recovery sleep modeled exponentially with asymptote to baseline, explain-ing 37.6% (squared partial correlation) of the unexplained variance in KSS scores. As for PVT lapses, the squared par-tial correlation for the KSS linear model 1 also explained a comparable portion of the residual variance (i.e., 37.9%) in the recovery sleep dose-response function. Figure 3B dis-plays the predicted values from model 3 as a smooth line plotted over the least squares estimates (means ± SEM) from an unrestricted categorical sleep dose-response relationship.
The linear model had the lowest AIC for MWT sleep la-tency (model 1; Supplement Table S5). The R2 for this model was 34.3%. The R2 for null hypothesis model 0 was 10.7%. The squared partial correlation revealed the additional vari-ance explained by the linear model over the null model was 26.4%. Figure 3C displays the predicted values from model 1 relative to the least squares estimates (means ± SEM) from an unrestricted categorical sleep dose-response relationship.
The models with the lowest AIC values for the secondary outcomes of DSST number correct (Figure 3D), PVT fastest 10% (Figure 3E), and POMS fatigue (Figure 3F) were linear (model 1), exponential with asymptote set to baseline (model 3), and sigmoidal (model 4), respectively (see Supplement Tables S6, S7, S8). The additional variance explained in
Table 2—Pairwise comparison of each recovery sleep dose (REC) subgroup condition to their baseline (B2) values on each neurobehavioral outcome.
REC TIB = 0h 2h 4h 6h 8h 10hM1 SD2 P3 M SD P M SD P M SD P M SD P M SD P
PVT lapses4
B2 2.2 2.7< 0.001
1.8 1.9< 0.001
2.8 3.0< 0.001
1.7 1.6< 0.001
3.4 6.20.004
3.1 3.50.008
REC 21.3 11.0 15.2 13.2 13.0 9.6 6.9 6.3 7.6 8.1 5.6 7.2
KSS4B2 4.42 1.61
< 0.0013.5 1.1
< 0.0013.1 1.5
< 0.0013.0 1.1
< 0.0013.3 1.3
< 0.0013.0 1.5
0.007REC 7.68 1.33 7.1 1.8 5.5 2.1 4.5 1.9 4.3 1.7 3.8 1.6
MWT4 B2 20.4 10.1
< 0.00122.1 10.7
< 0.00119.3 10.3
< 0.00118.5 9.6
0.00916.9 10.4
0.07218.8 9.9
0.558REC 1.7 1.1 5.8 4.6 8.8 8.9 11.5 9.8 12.8 9.2 17.3 10.9
DSST5 B2 60.3 13.8
< 0.00155.6 8.8
0.01354.8 8.4
< 0.03755.3 11.0
0.22556.7 14.2
0.0266 56.0 8.5< 0.0016
REC 42.3 10.07 51.5 10.4 52.0 11.8 57.0 11.6 60.8 13.2 60.0 9.3
PVTf105B2 198 15.9
< 0.001199 19.3
< 0.001207 24.9
< 0.001200 17.4
< 0.001196 16.4
< 0.001197 20.9
0.005REC 245 24.0 234 34.1 230 33.3 220 25.8 215 23.5 207 27.9
POMSf5B2 2.1 1.6
< 0.0031.1 1.4
< 0.0011.6 2.4
< 0.0010.7 1.5
0.0021.4 1.6
0.0060.9 1.2
0.021REC 7.5 5.98 9.2 6.0 7.2 6.5 3.7 3.8 3.5 3.5 2.2 2.9
1Mean, 2Standard Deviation, 3P value from pairwise t-test between B2 and REC. 4Primary outcome. 5Secondary outcome. 6REC > B2. PVT lapses, Psychomotor Vigilance Test number of lapses; KSS, Karolinska Sleepiness Scale scores; MWT, Maintenance of wakefulness test sleep latency; DSST, Digit Symbol Substitution Task number correct, PVTf10, Psychomotor Vigilance Test fastest 10% of reaction times; POMSf, Profile of Mood States fatigue subscale. Pairwise comparisons were made between baseline and each recovery dose condition (0 h n = 13, 2 h n = 27, 4 h n = 29, 6 h n = 25, 8 h n = 21, 10 h n = 27).
SLEEP, Vol. 33, No. 8, 2010 1021 Neurobehavioral Recovery Dynamics from Sleep Restriction—Banks et al
10-h TIB group. Raw mean sleep efficiencies were 96.4% (2 h group), 95.9% (4 h group), 95.7% (6 h group), 93.9% (8 h group), and 89.6% (10 h group), which were above the mean sleep efficiencies of sleep-restricted subjects at baseline (B2 = 84.6%), and above the control group’s mean sleep efficiency on the day equivalent to REC (protocol day 8 = 77.2%) (Fig-ure 4C). (Note that the values listed above are the raw means, while those shown in Figure 4 are the adjusted means from the ANCOVA.)
Sleep-restricted subjects randomized to 10 h TIB on REC had a mean (± SEM) of 51.5 min (12.3 min) more TST than on their 10 h baseline night B2 (t25 = 4.17, P < 0.001) and 7.2% (1.86%) higher sleep efficiency than at B2 (t25 = 3.87, P = 0.001). They also had an average of 31.2 min (10.2 min) more stage 2 sleep (t25 = 3.05, P = 0.005) than at baseline, but not more REM sleep (mean difference = 12.5 min [7.1 min], t25 = 1.76, P = 0.091). They did not average significantly more SWS relative to base-line (7.4 min [5.5 min], t25 = 1.46, P = 0.16), but they averaged 29.6% (11.3%) more SWE than at B2 (t23 = 2.60, P = 0.016).
As expected, increasing recovery sleep dose had an ef-fect on all sleep parameters (see Supplement Table S9). The TIB condition effect in the ANCOVA models was signifi-cant for TST, stage 2 sleep, SWS, REM sleep, and SWE (all P < 0.0001). Decreasing sleep efficiency with increasing sleep dose was significant at P = 0.0039. Although the effects of age and gender were generally small and not significant (ex-cept for sleep efficiency, which decreased with age), baseline sleep contributed significantly to recovery sleep architecture for all sleep variables (Supplement Table S9)—the exception was SWE for which the covariate was irrelevant since SWE was already normalized to baseline (i.e., set to 100% on B2).
The best-fitting functions to the recovery dose response curves (from 2 h to 10 h TIB) for each of the physiological sleep variables shown in Figure 4 were established for 3 mod-els used to evaluate the shape of the neurobehavioral recovery sleep dose functions (linear; exponential; and exponential re-stricting the asymptote to baseline; see Supplement Table S2).
RTs (P = 0.005) and POMS fatigue scores (P = 0.021). MWT sleep latency was the third pri-mary outcome, but as revealed in Table 2, unlike PVT lapses and KSS scores, it was not signifi-cantly different from baseline at the 8 h and 10 h TIB recovery conditions. The final (secondary) outcome—DSST number correct—showed ap-parent recovery to baseline at 6 h TIB, but the recovery function on this outcome was affected by substantial learning over days, making the comparisons to baseline uninterpretable.
Post recovery neurobehavioral outcomes relative to the control condition.
Linear functions fit to the recovery sleep dose-adjusted means from the ANCOVA analy-ses (which controlled for baseline performance, cumulative deficit during sleep restriction, age, and sex) yielded estimated slopes that were ex-trapolated to find the point of intersection with the levels of neurobehavioral functioning ob-served in the non-sleep-restricted control group (10 h TIB/night) on the equivalent day in the laboratory.
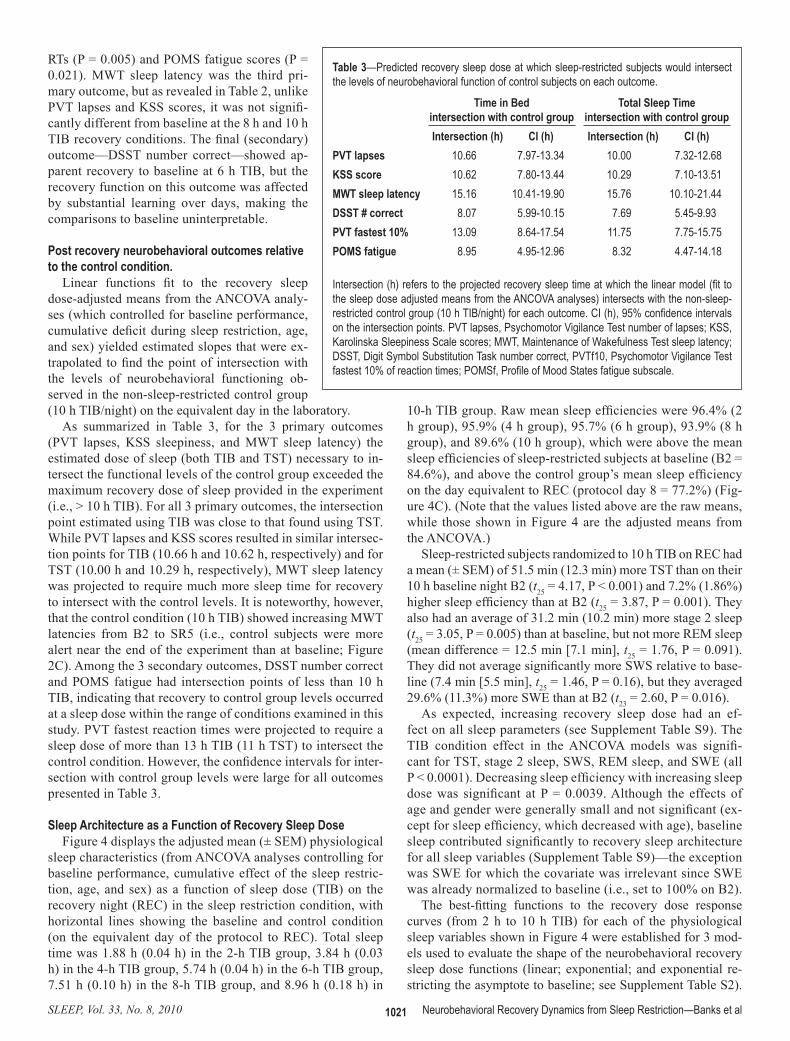
As summarized in Table 3, for the 3 primary outcomes (PVT lapses, KSS sleepiness, and MWT sleep latency) the estimated dose of sleep (both TIB and TST) necessary to in-tersect the functional levels of the control group exceeded the maximum recovery dose of sleep provided in the experiment (i.e., > 10 h TIB). For all 3 primary outcomes, the intersection point estimated using TIB was close to that found using TST. While PVT lapses and KSS scores resulted in similar intersec-tion points for TIB (10.66 h and 10.62 h, respectively) and for TST (10.00 h and 10.29 h, respectively), MWT sleep latency was projected to require much more sleep time for recovery to intersect with the control levels. It is noteworthy, however, that the control condition (10 h TIB) showed increasing MWT latencies from B2 to SR5 (i.e., control subjects were more alert near the end of the experiment than at baseline; Figure 2C). Among the 3 secondary outcomes, DSST number correct and POMS fatigue had intersection points of less than 10 h TIB, indicating that recovery to control group levels occurred at a sleep dose within the range of conditions examined in this study. PVT fastest reaction times were projected to require a sleep dose of more than 13 h TIB (11 h TST) to intersect the control condition. However, the confidence intervals for inter-section with control group levels were large for all outcomes presented in Table 3.
Sleep Architecture as a Function of Recovery Sleep DoseFigure 4 displays the adjusted mean (± SEM) physiological
sleep characteristics (from ANCOVA analyses controlling for baseline performance, cumulative effect of the sleep restric-tion, age, and sex) as a function of sleep dose (TIB) on the recovery night (REC) in the sleep restriction condition, with horizontal lines showing the baseline and control condition (on the equivalent day of the protocol to REC). Total sleep time was 1.88 h (0.04 h) in the 2-h TIB group, 3.84 h (0.03 h) in the 4-h TIB group, 5.74 h (0.04 h) in the 6-h TIB group, 7.51 h (0.10 h) in the 8-h TIB group, and 8.96 h (0.18 h) in
Table 3—Predicted recovery sleep dose at which sleep-restricted subjects would intersect the levels of neurobehavioral function of control subjects on each outcome.
Time in Bedintersection with control group
Total Sleep Timeintersection with control group
Intersection (h) CI (h) Intersection (h) CI (h)PVT lapses 10.66 7.97-13.34 10.00 7.32-12.68KSS score 10.62 7.80-13.44 10.29 7.10-13.51MWT sleep latency 15.16 10.41-19.90 15.76 10.10-21.44DSST # correct 8.07 5.99-10.15 7.69 5.45-9.93PVT fastest 10% 13.09 8.64-17.54 11.75 7.75-15.75POMS fatigue 8.95 4.95-12.96 8.32 4.47-14.18
Intersection (h) refers to the projected recovery sleep time at which the linear model (fit to the sleep dose adjusted means from the ANCOVA analyses) intersects with the non-sleep-restricted control group (10 h TIB/night) for each outcome. CI (h), 95% confidence intervals on the intersection points. PVT lapses, Psychomotor Vigilance Test number of lapses; KSS, Karolinska Sleepiness Scale scores; MWT, Maintenance of Wakefulness Test sleep latency; DSST, Digit Symbol Substitution Task number correct, PVTf10, Psychomotor Vigilance Test fastest 10% of reaction times; POMSf, Profile of Mood States fatigue subscale.

SLEEP, Vol. 33, No. 8, 2010 1022 Neurobehavioral Recovery Dynamics from Sleep Restriction—Banks et al
DISCUSSIONThis was the first experiment to
systematically examine the relation-ship of the duration of sleep dose to the recovery of neurobehavioral deficits from sustained sleep re-striction. It offers original data, in a large cohort of healthy adult sleep-ers, aged 22-45 y, on the dynamics of functional recovery relative to sleep duration. Our hypothesis that the degree of recovery of neurobe-havioral functions would increase monotonically in relation to the du-ration of time allowed for recovery sleep, as tested on primary outcome measures of alertness and sleepiness (i.e., PVT lapses, KSS, MWT), was supported by the results of linear and exponential recovery functions for 5 of 6 neurobehavioral outcomes (all but POMS fatigue). However, for the level of sleep restriction used in this experiment (5 days at 4 h TIB), re-covery to either subjects’ own base-line values, or to values recorded for the sleep-satiated control group, was not achieved at the maximum recovery sleep dose examined (i.e., 10 h TIB, ~9 h TST) for measures of behavioral alertness (PVT lapses and fastest 10% RTs) and for subjec-tive measures of sleepiness (KSS). We deliberately used both within-subject (comparison to baseline) and between-subject (comparison to con-trol condition) to evaluate at what sleep dose recovery was achieved, in order to determine if there was agree-ment between these two approaches on the sleep dose needed to achieve recovery. We reduced the sleep debt subjects may have had coming into
the laboratory by providing 10 h TIB on the 2 baseline nights, and evaluated the effects of the laboratory procedures without sleep debt by sleep-satiating the control group via 10 h TIB per night and comparing them on the same day in the labora-tory. Despite these differences, the two comparison standards resulted in remarkably similar results.
Our findings that the recovery functions for PVT and KSS outcomes were statistically projected to intersect with baseline and control group values when TST was 10 h or longer would suggest that the sleep period would have to be > 10 h TIB to achieve recovery, although it is uncertain whether circadian con-straints on sleep duration would permit enough sleep to achieve recovery within 1 night. If this were not possible, we speculate that the residual neurobehavioral deficits still present after a single recovery sleep could potentiate the effects of a subse-quent sleep restriction period. Some support for this speculation
The smallest AIC was the linear model 1 for TST (Figure 4A), stage 2 sleep (Figure 4B), sleep efficiency (Figure 4C), REM sleep (Figure 4D), and SWE (Figure 4F). Exponential model 2 best fit SWS (Figure 4E)—AIC values are shown in Supple-ment Table S10.
Across recovery sleep-dose conditions, TST, stage 2, REM sleep, and SWE were intercorrelated (r ≥ 0.59, P < 0.001), but these parameters had lower correlations with SWS (r = 0.02 to r = 0.36, P < 0.001)—see Supplement Table S11. Partial cor-relations among the sleep variables were calculated, controlling for recovery (REC) night categorical sleep dose (i.e., 2 h-10 h). Colinearity among sleep parameters decreased but remained statistically significant for TST and REM sleep (r = 0.36, P < 0.001), TST and SWS (r = 0.32, P = 0.002), SWS and stage 2 sleep (r = −0.68, P < 0.001), and SWS and SWE (r = 0.22, P = 0.027)—see Supplement Table S12.
Figure 4—Recovery night (REC) sleep variables as a function of increasing TIB dose from 2 h to 10 h. Least squares means (± SEM; data from N = 118 subjects with complete PSG data) are shown as diamonds for each REC sleep dose subgroup, controlling for covariates (i.e., baseline, age and sex). For comparison, horizontal dotted lines show baseline night (B2, 10 h TIB) data, and horizontal dashed lines show the control group (N = 17) means on day 8 (10 h TIB), which is the day equivalent to REC. Increasing REC TIB dose increased TST (graph A, P < 0.0001), stage 2 sleep (B, P < 0.0001), REM sleep (D, P < 0.0001), SWS (E, P < 0.0001), and SWE (F, P < 0.0001). Sleep efficiency decreased with increasing TIB (C, P = 0.039). Best-fitting recovery sleep dose-response functions (from AIC) are shown as the solid lines in each graph (see Supplement Table S10). These were linear for TST, stage 2, sleep efficiency, REM sleep, and SWE (graphs A, B, C, D, F, respectively) and exponential for SWS (graph E). Least squares means (diamonds) represent the overall covariate-controlled group means; best-fitting functions are shown for males with the other covariates set to the sample means.
0h 2h 4h 6h 8h 10h 0h 2h 4h 6h 8h 10h
Recovery Time in Bed Sleep Dose Following 5 Nights of Sleep Restriction to 4h TIC
Tota
l Slee
p Ti
me (
hour
)Sl
eep
Effic
iency
(%)
Slow
Wav
e Slee
p (m
in)
Stag
e 2 sl
eep
(min
)RE
M Sl
eep
(min
)%
Bas
eline
SW
E in
NRE
M
10
8
6
4
2
0
100
95
90
85
80
75
100
80
60
40
20
0
350
300
250
200
150100
50
0140
120
10080
60
4020
0
140120
100
80
60
4020
0
A B
C D
E F

SLEEP, Vol. 33, No. 8, 2010 1023 Neurobehavioral Recovery Dynamics from Sleep Restriction—Banks et al
captured the recovery of MWT and DSST outcomes (Supple-ment Tables S5, S6). AIC parsimoniously models the functional form of the recovery data by penalizing the better fit of more complex models (i.e., those with more parameters) by a factor proportional to the number of additional parameters. Although for all primary and secondary neurobehavioral outcomes, the proportion of total variance explained by a linear model was modestly larger than the optimal model selected by AIC, the exponential models with asymptote set to baseline provided a more parsimonious fit to the results for PVT and KSS out-comes. It is noteworthy that the PVT and KSS outcomes had significant advantages over the other neurobehavioral mea-sures. In addition to reflecting functional alertness and subjec-tive sleepiness, both measures are uncontaminated by aptitude and learning, and the values of these measures were virtually identical between baseline in the sleep-restricted group and the control group, despite increased sleep time in the latter. Based on the PVT and KSS outcomes, we conclude that recovery was incomplete at 10 h TIB in this experiment.
In contrast to exponential models selected by AIC for three of the six neurobehavioral variables, linear models selected by AIC best described the following four recovery sleep variables as increasing relative to increasing recovery sleep duration from 2 h to 10 h TIB: TST, stage 2 sleep, REM sleep, and NREM SWE as a percentage of baseline. When considered relative to the neurobehavioral outcomes, this suggests that the more time one has available for sleep following sleep restriction, the greater the likelihood of recovery, and that additional time for sleep beyond habitual sleep duration has significant recovery benefits. The increases in TST, stage 2, REM sleep time, and SWE that we observed as recovery dose was increased from 2 h to to 10 h TIB are consistent with recovery sleep findings from experiments in chronically sleep-restricted rats.10,11 We observed a high degree of co-linearity among these sleep pa-rameters across recovery sleep doses, although this was mark-edly reduced when we controlled for categorical sleep dose. Importantly, the 10 h TIB recovery condition had significantly more TST, stage 2 sleep, and percentage of SWE on the re-covery night (post chronic sleep restriction) than at the 10 h TIB baseline night (pre chronic sleep restriction). These find-ings suggest caution in assuming that sleep intensity (measured by NREM EEG slow wave dynamics) and sleep duration are only “marginally related,” and in generalizing the observation that “sleep loss is primarily recovered by increasing sleep inten-sity and not necessarily by sleep duration.”45 Our data suggest that sleep intensity and sleep duration are intimately related in recovery sleep following chronic sleep restriction, and that sleep intensity from the prior sleep restriction may be reflected in both variables. This is similar to recovery sleep after total sleep deprivation, which results in increases in multiple sleep variables including TST, NREM and REM sleep time, sleep ef-ficiency and SWE relative to baseline.46,47
Since we were interested in the cumulative integrated pow-er in the delta band as a function of different recovery sleep durations, we focused our data analyses on SWE rather than SWA. Using SWA could give a skewed perspective on the recovery process when nights of different TIB/TST are com-pared (i.e., the longer the night, the less the marginal increase in delta power with increasing time of NREM sleep, and thus
comes from a report on chronic sleep loss in a 42.85-h forced desynchrony protocol, which found that being awake during the circadian night exposed the cumulative detrimental effects of prior chronic sleep loss on PVT performance that were not ap-parent during the first several hours of wakefulness.42
Results for the third primary outcome—the modified MWT measure of physiological sleepiness—indicated recovery to baseline was nearly complete by 8 h TIB (~7.5 h TST) and defi-nitely complete by 10 h TIB. However, relative to the control group, recovery was projected to require a much longer sleep period (~15.7 h TIB). This large discrepancy in MWT recovery dynamics relative to baseline versus controls, not seen for other outcomes, was due to the sensitivity of the MWT to repeated 10 h TIB sleep periods in the control condition, which produced increased latencies to the occurrence of the first microsleep. It is noteworthy that the MSLT—another measure of physiological sleepiness—also has been reported to be sensitive to extend-ing TIB in normal subjects (from 6.5 h to 10 h per night).43 This suggests that physiological measures based on the latency to microsleep or sleep onset may have sensitivity to variations within what is widely regarded as the normal range of behav-ioral alertness.
Historically, it has not been clear what scientific or clinical significance should be given to sleep restriction within what is considered to be a normal range of behavioral alertness. How-ever, a recent experiment found that the extent to which sleep restriction generated (and recovery sleep reversed) deficits in behavioral alertness (PVT lapses) and physiological sleepiness (modified MWT) was influenced by the amount of nightly sleep in the range from 7 h to 10 h TIB obtained prior to the sleep restriction period.44 Consequently, 10 h TIB periods not only resulted in more TST than 7 h-8 h TIB periods, but these lon-ger sleep opportunities further reduced physiological sleepiness and improved behavioral alertness during subsequent sleep re-striction (whether or not subjects experienced the benefits sub-jectively).44
In our experiment, cognitive throughput performance, as measured by DSST number correct, showed dynamic improve-ments in the control condition, but these were due to learning. Relative to control group performance, DSST performance in the sleep-restricted group was comparable by the 8 h TIB recovery condition (~7.7 h TST). Thus cognitive throughput, which is primarily a measure of neurocognitive speed in healthy adults, recovered more quickly than did measures of behavioral alertness (PVT) and sleepiness (KSS, MWT). This finding also suggests that DSST learning was occurring during sleep restric-tion, and that the DSST deficit was one of slowed cognitive pro-cessing (more so than a learning deficit), which was improved by increasing sleep duration to 8 h TIB, and which normalized at a lower recovery sleep dose than other neurobehavioral out-comes.
A key goal of this experiment was to statistically model the most parsimonious shape of the relationship between recovery sleep dose and neurobehavioral functions. Akaike’s informa-tion criterion indicated exponential models with asymptote set to baseline best characterized recovery sleep dose-response profiles for the primary outcomes of PVT lapses and KSS scores, and for the secondary outcome of PVT fastest 10% RTs (Supplement Tables S3, S4, S7), while a linear relationship best

SLEEP, Vol. 33, No. 8, 2010 1024 Neurobehavioral Recovery Dynamics from Sleep Restriction—Banks et al
perspective suggests that when modeling sleep regulation it should not be assumed that recovery of waking neurobehav-ioral functions is complete when the exponential function for the dissipation of homeostatic pressure approaches zero.
Our results indicate that a period of recovery sleep time greater than 10 h TIB would be needed for full recovery after 5 nights of sleep restriction to 4 h TIB per night. This finding is consistent with the conclusion of Belenky and colleagues,12 who provided 3 recovery nights of 8 h TIB to subjects who had their sleep chronically restricted for a week to between 3 h and 7 h TIB. Other recent experiments have also found that following 5-7 nights of sleep restriction to 3 h-6 h TIB, aspects of performance similar to the PVT were not normalized when recovery sleep TIB was less than 9 h TIB.8,23,44 This is in agree-ment with predictions from a new model of the homeostatic effects of sleep loss on neurobehavioral performance27 based on the findings of our earlier study of chronic sleep restriction.15
It is worth noting that our study involved restricting the sleep of the largest number of subjects (N = 142) in a single laborato-ry-based experiment conducted to date, and that the effects of 5 nights at 4 h TIB per night on neurobehavioral functions mea-sured between 08:00 and 20:00 were consistent with what we reported in the past on smaller sample sizes.14,15 Thus, increases of PVT lapses and decreases on fastest RTs were cumulative and exhibited near-linear profiles across days, while increases in KSS sleepiness and POMS fatigue were cumulative but dis-played nonlinear (saturating) profiles. The robustness of this in-consistency between objective and subjective outcomes during chronic sleep restriction suggests the need to find ways to help people identify their behavioral vulnerability to chronic sleep restriction,15,32 as their self-evaluation of sleepiness and fatigue during chronic sleep restriction may not reflect the continuing development of deficits in neurobehavioral functions.
At a theoretical level, our results provide some support for the idea that the effects of chronic sleep loss and the effects of recovery sleep on waking neurobehavioral functions should be interpreted in the context of shifts in physiologic balance that occur over much longer periods than a day or two.27 This per-spective encompasses both the idea of sleep debt and the theory of homeostatic recovery responses to sleep loss, but emphasizes that equilibrium between these dynamics is what determines integrity of waking neurobehavioral functions.27
Finally, some limitations of this experiment need to be rec-ognized. Our conclusions are based on one type of sleep re-striction (i.e., 4 h TIB for 5 nights). There is ample evidence in healthy adults that more severe sleep restriction (i.e., less sleep time and/or more nights of restriction at 4 h TIB) would result in greater waking deficits.12,15 Under such circumstances, we speculate that the same dynamic range of recovery sleep doses would yield a monotonic relationship between TST and neurobehavioral improvements, but make acute recovery even less likely in a single night. Similarly, less severe sleep restric-tion would be expected to yield a monotonic relationship but make acute recovery more likely in a single night.
We averaged waking neurobehavioral measures of alertness between 08:00 and 20:00, but did not report data for specific times of day. Assessments made for individual hours of the day, as well as at other times of day, may yield additional insights into the recovery of neurobehavioral functions following sleep
the smaller SWA). SWA could therefore lead one to conclude that the longer the TIB, the less sleep homeostatic recovery occurs as judged by delta power. In contrast, SWE reflects the actual delta power cumulatively across each sleep dose, reveal-ing the continued presence of slow wave activity in the longer recovery sleeps. Similarly, the 0h condition was not included in the recovery sleep physiology data analyses (i.e., Figure 4) because no sleep was allowed in that condition. To include it would produce a nonvariant (artificial) anchor point on the dose response functions for sleep variables, which would dis-tort model fit and potentially the theoretical interpretation of the modeled function.
The two-process model of sleep regulation posits that the time constant for the elevation of homeostatic pressure for sleep during deprivation is much longer than the decline in homeo-static pressure during recovery sleep, due to the rapid inten-sification and exponential decay rate of sleep homeostasis as expressed in slow wave activity.20,48 The model predicts only an initial modest (~10%-20%) elevation in slow wave activity (SWA) over the first few days of sleep restricted to 4 h TIB per night, which we found in SWE in this study, and others have also observed.15,21 Following chronic sleep restriction to 4 h TIB, during which SWE was in deficit on SR5 (mean = −22.2% relative to baseline), delta power accumulated linearly as recov-ery sleep duration increased, ultimately reaching 29.6% above baseline when recovery sleep duration was extended to 10 h TIB. We speculate that this SWE increase may also serve to prolong sleep20 for 1 or more hours past habitual sleep dura-tion, depending on the severity of the prior deprivation (e.g., recovery sleep can extend to 14 h TST under extreme condi-tions of deprivation).20,48 Therefore the prolongation of sleep duration by 1 h-2 h following chronic sleep restriction should be considered part of the sleep homeostatic response, which is further supported by the fact that a few hours of additional sleep contributed substantially to increasing normalization of wak-ing neurobehavioral functions, at least for the diurnal portion of the day after the recovery sleep. We believe this conceptu-alization is consistent with the original two-process model of sleep regulation.20 Thus SWE may not only serve to protect the continuity and intensity of the first 4 h-6 h of sleep, but also to extend the continuity (duration and efficiency) of sleep beyond the habitual (basal) sleep duration following chronic partial sleep deprivation. This conclusion does not abrogate the possi-bility that REM sleep homeostasis—evident in linear increases in REM sleep time as a function of recovery sleep dose—may also have a role in recovery of neurobehavioral capability fol-lowing chronic sleep restriction.
It is noteworthy that the maximum extended recovery sleep period we studied (10 h TIB) could not fully normalize behav-ioral alertness and subjective sleepiness. Either a longer recov-ery sleep period, or one or more additional night(s) of recovery sleep would be needed to fully recover neurobehavioral func-tioning. This suggests that any model of sleep recovery based on the intensity and temporal dynamics of NREM EEG slow waves19,20,50 needs to also include extended sleep duration (and possibly repeated sleep periods) for recovery from chronic sleep restriction. An exclusive focus on sleep intensity without regard for sleep duration would miss the critical role of sleep homeo-static processes in extending sleep duration. Furthermore, this

SLEEP, Vol. 33, No. 8, 2010 1025 Neurobehavioral Recovery Dynamics from Sleep Restriction—Banks et al
DISCLOSURE STATEMENT This was not an industry supported study. Dr. Dinges has re-
ceived research support and consulted for Cephalon and Merck & Co. and consulted for Actelion, Cephalon, Eli Lilly, Mars Inc., Merck & Co, Sanofi-Aventis, and Somaxon; he is compen-sated by the Associated Professional Sleep Societies for serving as Editor in Chief of SLEEP. Dr. Van Dongen has received sup-port from The Boeing Company and Continental Airlines; he has participated in a speaking engagement for Clayton Sleep Institute, Saint Louis, MO; and he has consulted for FedEx Cor-poration. Dr. Banks has no financial conflicts of interest. Mr. Maislin directs a statistical consulting firm that contracts with industry and academia.
REFERENCES 1. Banks S, Dinges DF. Behavioral and physiological consequences of sleep
restriction. J Clin Sleep Med 2007;3:519-28. 2. Basner M, Fomberstein KM, Razavi FM, et al. American time use survey:
sleep time and its relationship to waking activities. Sleep 2007;30:1085-95.
3. Dinges DF, Maislin G, Brewster RM, et al. Pilot test of fatigue man-agement technologies. Journal of the Transportation Research Board 2005;No. 1922, Transportation Research Board of the National Acad-emies, Washington, DC:175-182.
4. Roenneberg T, Wirz-Justice A, Merrow M. Life between clocks: Daily temporal patterns of human chronotypes. J Biol Rhythms 2003;18:80-90.
5. Dijk D-J, Hayes B, Czeisler CA. Dynamics of electroencephalographic sleep spindles and slow wave activity in men: effect of sleep deprivation. Brain Res 1993;626:190-9.
6. Franken P, Dijk D-J, Tobler I, Borbély AA. Sleep deprivation in rats: ef-fects on EEG power spectra, vigilance states, and cortical temperature. Am J Physiol 1991;261:R198-R208.
7. Jenni OG, Achermann P, Carskadon MA. Homeostatic sleep regulation in adolescents. Sleep 2005;28:1446-54.
8. Lamond N, Jay SM, Dorrian J, et al. The dynamics of neurobehavioural recovery following sleep loss. J Sleep Res 2007;16:33-41.
9. Mander BA, Reid KJ, Baron KG, et al. EEG measures index neural and cognitive recovery from sleep deprivation. J Neurosci 2010;30:2686-93.
10. KimY, Laposky AD, Bergmann BM, Turek FW. Repeated sleep restric-tion in rats leads to homeostatic and allostatic responses during recovery sleep. Proc Natl Acad Sci U S A 2007;104:10697-702.
11. Rechtschaffen A, Bergmann BM, Gilliland MA, Bauer K. Effects of method, duration, and sleep stage on rebounds from sleep deprivation in the rat. Sleep 1999;22:11-31.
12. Belenky G, Wesensten NJ, Thorne DR, et al. Patterns of performance deg-radation and restoration during sleep restriction and subsequent recovery: a sleep dose-response study. J Sleep Res 2003;12:1-12.
13. Carskadon MA, Dement WC. Cumulative effects of sleep restriction on daytime sleepiness. Psychophysiology 1981;18:107-13.
14. Dinges DF, Pack F, Williams K, et al. Cumulative sleepiness, mood dis-turbance, and psychomotor vigilance performance decrements during a week of sleep restricted to 4-5 hours per night. Sleep 1997;20:267-77.
15. Van Dongen HPA, Maislin G, Mullington JM, Dinges DF. The cumulative cost of additional wakefulness: Dose-response effects on neurobehavioral functions and sleep physiology from chronic sleep restriction and total sleep deprivation. Sleep 2003;26:117-26.
16. Cote KA, Milner CE, Smith BA, et al. CNS arousal and neurobehavior-al performance in a short-term sleep restriction paradigm. J Sleep Res 2009;18:291-303.
17. Hairston IS, Little MTM, Scanlon MD, et al. Sleep restriction suppresses neurogenesis induced by hippocampus-dependent learning. J Neurophyi-ol 2005;94:4224-33.
18. Kleitman N. Sleep and wakefulness. Chicago: University of Chicago Press 1963.
19. Achermann P, Borbély AA. Simulation of daytime vigilance by the ad-ditive interaction of a homeostatic and a circadian process. Biol Cybern 1994;71:115-21.
20. Borbély AA. A two process model of sleep regulation. Hum Neurobiol 1982;1:195-204.
restriction.51 Moreover, our study design resulted in subjects randomized to the longer duration recovery sleep doses going to bed earlier during the recovery night than during the sleep restriction nights, so that all neurobehavioral assessments could be kept at the same times each day. Subjects may have been somewhat phase delayed by the chronic sleep restriction pro-tocol since it was conducted in dim light.52 However, this did not noticeably affect sleep onset for those randomized to an ex-tended recovery sleep dose.
Our data generalize to healthy adults aged 22 y-45 y who habitually sleep from 6.5 h to 8.5 h per night. It is not known whether our findings generalizable to those who need less than 6.5 h or more than 8.5 h habitual sleep, to younger (< 22 y) or older (> 45 y) subjects, or to those suffering from insom-nia or other sleep disorders. Our recovery responses may have been influenced by the degree of sleep debt prior to restriction.44 While control group decreases in TST across days of 10 h TIB suggest that some sleep pressure was present even after 2 base-line nights of 10 h TIB, the degree of this debt was small and it was not evident in waking neurobehavioral outcomes during baseline. Lastly, this experiment did not reveal whether subjects could have slept longer than they did in the 10 h TIB recovery condition if we had permitted even more TIB, and whether any additional sleep would have led to further recovery—although the recovery dose-response functions we found predict this might be possible.
In conclusion, in healthy adults between 22 y and 45 y of age, objective and subjective neurobehavioral functions fol-lowing 5 nights of sleep restricted to 4 h TIB (04:00-08:00) improved monotonically as sleep duration, sleep stages, and sleep intensity (SWE) increased across recovery sleep doses from 2 h to 10 h TIB. However, behavioral alertness and sub-jective sleepiness did not fully recover even with an extended night of sleep (10 h TIB resulting in ~9 h TST). It appears, therefore, that a simulated workweek with 5 nights of chronic partial sleep loss can continue to adversely affect waking neu-robehavioral functions even after a night of extended duration recovery sleep. This suggests the presence of residual sleep pressure that may potentiate neurobehavioral deficits if ex-posed to a subsequent period of sleep restriction. It highlights the importance of ensuring recovery sleep periods are suffi-cient in occupations and lifestyles where chronic partial sleep loss is frequent or cyclic.
ACKNOWLEDGMENTSWe thank Michele Carlin, Adrian Ecker, Olivera Crenshaw,
Claire Fox, Deepa Avinash, Chris Jones, Eric Hyder, Julieanne Muto, Adrian DiAntonio, Robert Hachadoorian, and Christos Ballas for their contributions to this study, and Mathias Basner and Namni Goel for review of the manuscript. Supported pri-marily by NIH grants NR04281 and CTRC UL1 RR0241340, and in part by the National Space Biomedical Research Institute through NASA NCC 9-58 (DFD). SB was supported in part by Women in Science Fellowship from University of South Aus-tralia. HVD was supported by AFOSR grants FA9550-05-1-0086, FA9550-06-1-0055 and FA9550-09-1-0136.
Work performed at Division of Sleep and Chronobiology, Unit for Experimental Psychiatry, Department of Psychiatry, Univer-sity of Pennsylvania School of Medicine, Philadelphia, PA.

SLEEP, Vol. 33, No. 8, 2010 1026 Neurobehavioral Recovery Dynamics from Sleep Restriction—Banks et al
21. Brunner DP, Dijk DJ, Borbély AA. Repeated partial sleep deprivation progressively changes in EEG during sleep and wakefulness. Sleep 1993;16:100-13.
22. Åkerstedt T, Kecklund G, Ingre M, et al. Sleep homeostasis during re-peated sleep restriction and recovery: support from EEG dynamics. Sleep 2009;32:217-22.
23. Axelsson J, Kecklund G, Åkerstedt T, et al. Sleepiness and performance in response to repeated sleep restriction and subsequent recovery during semi-laboratory conditions. Chronobiol Int 2008;25:297-308.
24. Åkerstedt T, Kecklund G, Gillberg M, et al. Sleepiness and days of recov-ery. Transp Res Part F Traffic Psychol Behav 2000;251-61.
25. Modirrousta M, Mainville L, Jones BE. Dynamic changes in GABAA receptors on basal forebrain cholinergic neurons following sleep depriva-tion and recovery. BMC Neurosci 2007;8:15.
26. Dinges DF. Sleep debt and scientific evidence. Sleep 2004;27:1-3. 27. McCauley P, Kalachev LV, Smith AD, et al. A new mathematical model
for the homeostatic effects of sleep loss on neurobehavioral performance. J Theor Biol 2009;256:227-39.
28. Åkerstedt T, Ingre M, Kecklund G, et al. Accounting for partial sleep de-privation and cumulative sleepiness in the Three-Process Model of alert-ness regulation. Chronobiol Int 2008;25:309-19.
29. Smith CS, Reilly C, Midkiff K. Evaluation of three circadian rhythm questionnaires with suggestions for an improved measure of morning-ness. J Appl Psychol 1989;74:728-38.
30. Doran SM, Van Dongen HPA, Dinges DF. Sustained attention perfor-mance during sleep deprivation: evidence of state instability. Arch Ital Biol 2001;139:253-67.
31. Dorrian J, Rogers NL, Dinges DF. Psychomotor vigilance performance: A neurocognitive assay sensitive to sleep loss. In: Kushida C, ed. Sleep deprivation: Clinical issues, pharmacology and sleep loss effects. New York: Marcel Dekker, 2005: 39-70.
32. Lim J, Dinges DF. Sleep deprivation and vigilant attention. Ann N Y Acad Sci 2008;1129:305-22.
33. Wechsler Adult Intelligence Scale 3 - Technical Manual. San Antonio: Hardcourt Brace and Company, 1997.
34. Åkerstedt, T. and Gillberg, M., Subjective and objective sleepiness in the active individual. Int J Neurosci 1990;52:29-37.
35. McNair DM, Lorr M, Drupplemann LF. EITS manual for the profile of mood states. San Diego: Educational and Industrial Test Services 1971.
36. Banks S, Barnes M, Tarquinio N, et al, The maintenance of wakefulness test in normal healthy subjects. Sleep 2004;27:799-802.
37. Doghramji K, Mitler MM, Sangal RB, et al. A normative study of the maintenance of wakefulness test (MWT). Electroencephalogr Clin Neu-rophysiol 1997;103:554-62.
38. Mitler MM, Gujavarty KS, Browman CP. Maintenance of wakefulness test: a polysomnographic technique for evaluation treatment efficacy in patients with excessive somnolence. Electroencephalogr Clin Neuro-physiol 1982;53:658-61.
39. Rechtschaffen A, Kales A. A manual of standardized terminology, tech-niques and scoring system for sleep stages of human subjects. Washing-ton, D.C: Public Health Service. U.S. Government Printing Office 1968.
40. Knickerbocker RK. Intention-to-treat analyses. In: Chow, SC, ed. Ency-clopedia of biopharmaceutical statistics. New York:Marcel Dekker, 2000: 271-275.
41. Akaike H. A new look at the statistical model identification, IEEE Trans Automat Contr 1974;716-23.
42. Cohen D, Wang W, Wyatt JK, et al. Uncovering residual effects of chronic sleep loss on human performance. Sci Transl Med 2010;2:14ra3.
43. Roehrs T, Shore E, Papineau K, et al. A two-week sleep extension in sleepy normals. Sleep 1996;19:576-82.
44. Rupp TL, Wesensten NJ, Bliese PD, Balkin TJ. Banking sleep: realiza-tion of benefits during subsequent sleep restriction and recovery. Sleep 2009;32:311-21.
45. Hor H, Tafti M. How much sleep do we need? Science 2009;325:825-6. 46. Borbély AA, Baumann F, Brandeis D, et al. Sleep deprivation: effect on
sleep stages and EEG power density in man. Electroencephalogr Clin Neurophysiol 1981;51:483-95.
47. Tucker AM, Dinges DF, Van Dongen HPA. Trait interindividual dif-ferences in the sleep physiology of healthy young adults. J Sleep Res 2007;16:170-80.
48. Borbély AA, Achermann P. Concepts and models of sleep regulation: an overview. J Sleep Res 1992;1:63-79.
49. Gulevich G, Dement W, Johnson L. Psychiatric and EEG observations on a case of prolonged (264 hours) wakefulness. Arch Gen Psychiatry 1966;15:29-35.
50. Daan S. Beersma DGM, Borbély AA. Timing of human sleep: recovery process gated by a circadian pacemaker. Am J Physiol 1984;246:R161-R178.
51. Mollicone DJ, Van Dongen H., Rogers NL, et al. Time of day modulates the effects of chronic sleep restriction on neurobehavioral performance. Aviat, Space & Environ Med (in press).
52. Goel N. Late-night presentation of an auditory stimulus phase delays human circadian rhythms. Am J Physiol Regul Integr Comp Physiol 2005;289:R209-16.

SLEEP, Vol. 33, No. 8, 2010 S1 Neurobehavioral Recovery Dynamics from Sleep Restriction—Banks et al
SUPPLEMENTAL MATERIAL
Effect of Sleep Restriction Protocol on Sleep ArchitectureFigure 1 in the published paper displays the sleep responses
at baseline and on the first and fifth sleep restriction nights for N = 118 sleep-restricted subjects (solid line) and N = 17 control subjects (dashed line). Tables S1 displays the effect sizes (ES) for the effect of 5 nights of sleep restriction to 4 h TIB, relative to the control group with 10 h TIB nightly, for the sleep param-eters illustrated in Figure 1.
Neurobehavioral Outcomes as a Function of Recovery Sleep Dose
To determine the best-fitting function to the recovery sleep dose-response curves for each of the neurobehavioral outcomes shown in Figure 3 in the published paper, 4 models were eval-uated. Table S2 provides details of functional forms of the 4 models (1-4) and of the null (0) model estimated for compari-son purposes. Models evaluated included linear (model 1), ex-ponential (models 2 and 3), and sigmoidal (model 4) functional forms. Exponential forms were specified with (model 2) and without (model 3) restricting the asymptote to be equal to base-line (thereby reducing the number of parameter estimates by 1 for model 2 relative to model 3).
Maximum likelihood estimation (MLE, SAS Proc NL-MIXED) was used to estimate the parameters of each dose re-sponse functional form. Akaike’s information criterion1 (AIC) was used to select the most adequately fitting functional form for each outcome variable. AIC is scaled such that the model with the minimum AIC is identified as “best-fitting.” Tables S3–S8 summarize the AIC model comparisons for each neu-robehavioral outcome examined in the published paper.
Table S1—Standardized effect sizes (ES) for chronic sleep restriction changes in physiological sleep parameters
BL to SR1 BL to SR5 SR1 to SR5TST -4.57** -4.31** +0.46**Stage 2 -3.83** -3.44** -0.10Sleep Efficiency +0.88** +1.18** +0.52**REM (minutes) -2.38** -2.01** +0.41**SWS (minutes) -0.41** -0.14 +0.32*SWE -2.15* -0.91* +0.50*
BL, baseline sleep (10 h time in bed [TIB]); SR1, sleep restriction (4 h TIB) night 1; SR5, sleep restriction (4 h TIB) night 5; TST, total sleep time; SWE, slow wave energy during NREM sleep. *paired t-test P < 0.0006; **paired t-test P < 0.0001.
Table S2—Summary of the four models considered to describe the recovery sleep dose-response curves, and the null model estimated for comparison purposes.
Model Model description* df0 Null model, constant (mean) plus 4 covariates 1 + 4 = 51 Linear dose response 2 + 4 = 62 Exponential dose response 3 + 4 = 73 Exponential dose response with asymptote set
to baseline2 + 4 = 6
4 Sigmoidal dose response 4 + 4 = 8
*The following 4 covariates were used: Baseline level, cumulative changes in the prior days of sleep restriction (neurobehavioral responses only, except MWT), age, and sex.
Table S3—Akaike’s information criterion (AIC) for the Models in Table S2 fit to Psychomotor Vigilance Test (PVT) lapses across recovery sleep doses (smallest AIC values are shown first as they indicate the most adequately fitting models).
Model AIC Estimate R R2
3 750.4 25.743 0.8387 0.70342 752.1 25.687 0.8737 0.76354 753.1 25.458 0.8750 0.76561 756.9 27.167 0.8659 0.74980 818.1 45.804 0.7604 0.5783
Table S4—Akaike’s information criterion (AIC) for the Models in Table S2 fit to Karolinska Sleepiness Scale (KSS) scores across recovery sleep doses (smallest AIC values are shown first as they indicate the most adequately fitting models).
Model AIC Estimate R R2
3 406.4 1.502 0.8224 0.67642 408.5 1.501 0.8283 0.68621 409.3 1.536 0.8239 0.67894 410.8 1.504 0.8279 0.68550 465.3 2.480 0.6939 0.4815
Table S5—Akaike’s information criterion (AIC) for the Models in Table S2 fit to Maintenance of Wakefulness (MWT) sleep latency scores across recovery sleep doses (smallest AIC values are shown first as they indicate the most adequately fitting models).
Model AIC Estimate R R2
1 998.2 59.937 0.5860 0.34333 999.2 60.343 0.5642 0.31842 1001.1 60.718 0.5823 0.33910 1039.8 81.479 0.3277 0.1074
*Model 4 was not estimable.
Table S6—Akaike’s information criterion (AIC) for the Models in Table S2 fit to Digit Symbol Substitution Test (DSST) number correct across recovery sleep doses (smallest AIC values are shown first as they indicate the most adequately fitting models).
Model AIC Estimate R R2
1 692.6 15.967 0.9476 0.89793 696.7 16.519 0.9171 0.84110 779.9 33.381 0.8869 0.7867
*Models 2 and 4 were not estimable.

SLEEP, Vol. 33, No. 8, 2010 S2 Neurobehavioral Recovery Dynamics from Sleep Restriction—Banks et al
Sleep Architecture as a Function of Recovery Sleep Dose
Figure 4 in the published paper displays the physiological sleep characteristics as a function of TIB sleep dose on the recovery night (REC) in the sleep restriction condition. Adjusted lin-ear dose-response ANCOVA models, in which covariates included baseline sleep, age and gen-der, were used to evaluate each of the 6 sleep parameters considered. Significance levels are reported for the categorical sleep duration model to avoid the necessity of making as-sumptions about functional relationships when testing these models. Table S9 reveals that, as expected, increasing recovery sleep dose (TIB) significantly increased all 6 physiological sleep parameters.
Best-fitting functions to the recovery sleep dose-response curves for each of the physio-logical sleep variables shown in Figure 4 in the published paper were established for 4 models that included linear and the 2 exponential mod-els—the sigmoidal model did not fit any recov-ery sleep parameter (see Table S2). The “best fitting” model was identified as the one with the smallest AIC. Tables S10 summarizes the results of these analyses, which revealed that a linear model best fit TST, sleep efficiency, stage
Table S7—Akaike’s information criterion (AIC) for the Models in Table S2 fit to Psychomotor Vigilance Test (PVT) fastest 10% RTs across recovery sleep doses (smallest AIC values are shown first as they indicate the most adequately fitting models).
Model AIC Estimate R R2
3 972.5 161.30 0.8910 0.79391 975.9 166.02 0.9047 0.81862 977.0 163.48 0.9055 0.81990 1017.3 237.55 0.8604 0.7404
*Model 4 was not estimable.
Table S8—Akaike’s information criterion (AIC) for the Models in Table S2 fit to Profile of Mood States (POMS) fatigue subscale scores across recovery sleep doses (smallest AIC values are shown first as they indicate the most adequately fitting models).Model AIC Estimate R R2
4 642.6 10.214 0.8257 0.68191 651.5 11.369 0.8037 0.64593 654.0 11.602 0.7900 0.62420 683.0 14.993 0.7301 0.5330
*Model 2 was not estimable.
Table S9—ANCOVA results for time in bed (TIB) dose response effect on sleep parameters across the recovery night (REC).
Variable F ratio (df)1 P R2
Effect of TIB
CovariatesBaseline Age Sex
P P P PTST 98.36 (7, 106) < 0.0001 0.867 < 0.0001 0.018 0.066 0.246SE 8.44 (7, 106) < 0.0001 0.358 0.0039 < 0.001 0.022 0.079S2 124.68 (7, 106) < 0.0001 0.892 < 0.0001 < 0.001 0.130 0.054SWS 27.93 (7, 106) < 0.0001 0.648 < 0.0001 < 0.001 0.055 0.060REM 46.38 (7, 106) < 0.0001 0.754 < 0.0001 0.006 0.435 0.117SWE 12.17 (7, 106) < 0.0001 0.429 < 0.0001 —* 0.094 0.822
*SWE was normalized to baseline (i.e., set to 100% on B2).
Table S10—Akaike’s information criterion (AIC) for Models 1-3 in Table S2 fit to sleep physiology outcomes across REC recovery sleep doses (lowest AIC = best-fitting model).*
TST SE S2 SWS REM SWEAIC model AIC model AIC model AIC model AIC model AIC model
1267.5 17 730.3 1 1136.4 1 1079.9 28 1029.1 1 1044.5 11270.5 2 730.9 39 1136.8 2 1084.0 1 1034.4 2 1046.8 21583.5 3 734.8 2 1149.3 3 1086.9 3 1145.7 3 1069.6 3
*See Table S2 for model definitions. Results based on only those subjects with complete polysomnographic data on protocol nights B2, SR1, SR5, and REC: REC = 2 h (n = 25), REC = 4 h (n = 23), REC = 6 h (n = 21), REC = 8 h (n = 16), REC = 10 h (n = 23).
Table S12—Partial correlations among physiological sleep variables, controlling for recovery night (REC) categorical sleep dose (TIB), for N = 93 subjects randomized to between 2 h and 10 h TIB following chronic sleep restriction.
Stage 2 REM SWS SWEr (P) r (P) r (P) r (P)
TST 0.089 (0.39) 0.369 (0.0003) 0.320 (0.002) 0.144 (0.16)Stage 2 -0.087 (0.40) -0.688 (< 0.0001) 0.039 (0.70)REM sleep 0.027 (0.79) 0.113 (0.27)SWS 0.226 (0.027)
Table S11—Pearson correlations among physiological sleep variables on the recovery night (REC) for N=100 to 120* subjects randomized to between 2 h and 10 h TIB following chronic sleep restriction.
Stage 2 REM SWS SWEr (P) r (P) r (P) r (P)
TST 0.921(< 0.0001) 0.866 (< 0.0001) 0.346 (< 0.0001) 0.651 (< 0.0001)Stage 2 0.765 (< 0.0001) 0.021 (0.819) 0.608 (< 0.0001)REM sleep 0.278 (< 0.002) 0.593 (< 0.0001)SWS 0.362 (< 0.0001)
*Correlations between SWE and all other variables based on N = 100; correlations among TST, stage 2, REM sleep, and SWS based on N = 120. The sample size difference was due an inability to extract reliable SWE data from N = 20 records, for technical reasons.

SLEEP, Vol. 33, No. 8, 2010 S3 Neurobehavioral Recovery Dynamics from Sleep Restriction—Banks et al
2 sleep, REM sleep, and SWE as percent of B2. An exponential model best fit SWS time.
Table S11 shows the results of Pearson correlations among physiological sleep variables on the recovery night (REC) for N = 100 to 120 subjects randomized to between 2 h and 10 h TIB following chronic sleep restriction. Table S12 displays the results
of partial correlations among the sleep variables, controlling for recovery (REC) night categorical sleep dose (i.e., 2 h-10 h).
REFERENCES 1. Akaike H. A new look at the statistical model identification. In: Childers
DG, ed. Modern spectrum analysis. New York: IEEE Press, 1978:234-41.