
NEURAL NETWORK AND REGRESSION MODELING OF EXTRUSION PROCESSING PARAMETERS AND PROPERTIES OF...
14
Transactions of the ASABE Vol. 50(5): 1765-1778 E 2007 American Society of Agricultural and Biological Engineers ISSN 0001-2351 1765 NEURAL NETWORK AND REGRESSION MODELING OF EXTRUSION PROCESSING P ARAMETERS AND PROPERTIES OF EXTRUDATES CONTAINING DDGS N. Chevanan, K. Muthukumarappan, K. A. Rosentrater ABSTRACT. Two sets of experiments using a single‐screw extruder were conducted with an ingredient blend containing 40% DDGS (distillers dried grains with solubles), along with soy flour, corn flour, fish meal, vitamin mix, and mineral mix, with the net protein content adjusted to 28%. The variables controlled in the first experiment included seven levels of die size, three levels of moisture content, three levels of temperature gradient in the barrel, and one screw speed. The variables altered in the second experiment included three levels of moisture content, three levels of temperature gradient in the barrel, five levels of screw speed, and one die size. Regression models and neural network (NN) models were then developed using the data pooled from the two experiments to predict extrudate properties and extrusion processing parameters. In general, both regression and NN models predicted the extrusion processing parameters with better accuracy than the extrudate properties. Similarly, lower R 2 values for the regression results corresponded to lower R 2 values in the NN modeling. The regression models predicted the extrusion processing parameters using three and six input variables with R 2 values of 0.56 to 0.97 and 0.75 to 0.97, respectively. The NN models predicted the extrusion processing parameters using three, five, and six input variables with R 2 values (between measured and predicted values) of 0.819 to 0.984, 0.860 to 0.988, and 0.901 to 0.991, respectively. With the regression modeling, even though increasing the number of input variables from three to six resulted in better R 2 values, there was no decrease in the coefficient of variation (CV) between the measured and predicted variables. On the other hand, the NN models developed with six input variables resulted in more accurate predictions with reduced CV and standard error. Because of its ability to produce accurate result with reduced variation and standard error, NN modeling has greater potential for developing robust models for extrusion processing. Keywords. Extrudate, Extrusion, Modeling, Neural network, Processing parameters, Properties, Regression. xtrusion processing is very widely used in the food and feed industries due to its versatility in obtaining the desired final product. Even with technological advances, the process of extrusion is still considered to be an art as much as a science, and the desired final characteristics of various products are often decided upon by trial and error methods to determine which conditions produce optimal results. Extrusion processing is a very complex process, involving numerous interdependent input parameters (both process and system variables) and output parameters. Process parameters are the operating conditions that can be controlled and manipulated directly, Submitted for review in January 2007 as manuscript number FPE 6827; approved for publication by the Food & Process Engineering Institute Division of ASABE in August 2007. Mention of a trade name, propriety product or specific equipment does not constitute a guarantee or warranty by the USDA and does not imply approval of a product to the exclusion of others that may be suitable. The authors are Nehru Chevanan, ASABE Member Engineer, Post‐Doctoral Research Associate, Department of Biosystems Engineering and Soil Science, University of Tennessee, Knoxville, Tennessee; Kasiviswanathan Muthukumarappan, ASABE Member Engineer, Professor, Department of Agricultural and Biosystems Engineering, South Dakota State University, Brookings, South Dakota; and Kurt A. Rosentrater, ASABE Member Engineer, Agricultural and Bioprocess Engineer, USDA‐ARS North Central Agricultural Research Laboratory, Brookings, South Dakota. Corresponding author: Kurt A. Rosentrater, USDA‐ARS, 2923 Medary Ave., Brookings, SD 57006; phone: 605‐693‐3241; fax: 605‐693‐5240; e‐mail: [email protected]. such as raw material characteristics, moisture content, screw speed, screw configuration, barrel temperature, etc. System parameters are influenced by the process parameters and subsequently affect the output parameters, and include residence time, specific mechanical energy, pressure buildup, viscosity of the melt, etc. Output parameters include extrudate expansion, bulk density, mechanical and chemical properties such as breaking strength, pellet durability index, water solubility index, water absorption index, nutrient content, extent of gelatinization, etc. Various models have been developed to understand the extrusion process in order to quantify and predict product characteristics. Two approaches are generally followed in extrusion processing. In the first, models have been developed to predict the system parameters applying well understood engineering and scientific principles, and then the output parameters can be predicted based on the system parameters. In the second approach, the output parameters are predicted directly from the process parameters without considering the physical/ chemical phenomena occurring inside the extruder (Ganjyal et al., 2006). Numerous modeling studies have been carried out by applying engineering fundamentals, such as flow modeling, thermal modeling, and product transformation modeling, to understand the biochemical and thermomechanical changes occurring inside the barrel and their influences on resulting final product properties (Barres et al., 1991; Bruin et al., 1978; Della Valle et al., 1993; Frazier et al., 1982; Jager et al., E
-
Upload
independent -
Category
Documents
-
view
0 -
download
0
Transcript of NEURAL NETWORK AND REGRESSION MODELING OF EXTRUSION PROCESSING PARAMETERS AND PROPERTIES OF...
Transactions of the ASABE
Vol. 50(5): 1765-1778 � 2007 American Society of Agricultural and Biological Engineers ISSN 0001-2351 1765
NEURAL NETWORK AND REGRESSION MODELING
OF EXTRUSION PROCESSING PARAMETERS AND
PROPERTIES OF EXTRUDATES CONTAINING DDGS
N. Chevanan, K. Muthukumarappan, K. A. Rosentrater
ABSTRACT. Two sets of experiments using a single‐screw extruder were conducted with an ingredient blend containing 40%DDGS (distillers dried grains with solubles), along with soy flour, corn flour, fish meal, vitamin mix, and mineral mix, withthe net protein content adjusted to 28%. The variables controlled in the first experiment included seven levels of die size, threelevels of moisture content, three levels of temperature gradient in the barrel, and one screw speed. The variables altered inthe second experiment included three levels of moisture content, three levels of temperature gradient in the barrel, five levelsof screw speed, and one die size. Regression models and neural network (NN) models were then developed using the datapooled from the two experiments to predict extrudate properties and extrusion processing parameters. In general, bothregression and NN models predicted the extrusion processing parameters with better accuracy than the extrudate properties.Similarly, lower R2 values for the regression results corresponded to lower R2 values in the NN modeling. The regressionmodels predicted the extrusion processing parameters using three and six input variables with R2 values of 0.56 to 0.97 and0.75 to 0.97, respectively. The NN models predicted the extrusion processing parameters using three, five, and six inputvariables with R2 values (between measured and predicted values) of 0.819 to 0.984, 0.860 to 0.988, and 0.901 to 0.991,respectively. With the regression modeling, even though increasing the number of input variables from three to six resultedin better R2 values, there was no decrease in the coefficient of variation (CV) between the measured and predicted variables.On the other hand, the NN models developed with six input variables resulted in more accurate predictions with reduced CVand standard error. Because of its ability to produce accurate result with reduced variation and standard error, NN modelinghas greater potential for developing robust models for extrusion processing.
Keywords. Extrudate, Extrusion, Modeling, Neural network, Processing parameters, Properties, Regression.
xtrusion processing is very widely used in the foodand feed industries due to its versatility in obtainingthe desired final product. Even with technologicaladvances, the process of extrusion is still
considered to be an art as much as a science, and the desiredfinal characteristics of various products are often decidedupon by trial and error methods to determine whichconditions produce optimal results. Extrusion processing isa very complex process, involving numerous interdependentinput parameters (both process and system variables) andoutput parameters. Process parameters are the operatingconditions that can be controlled and manipulated directly,
Submitted for review in January 2007 as manuscript number FPE 6827;approved for publication by the Food & Process Engineering InstituteDivision of ASABE in August 2007.
Mention of a trade name, propriety product or specific equipment doesnot constitute a guarantee or warranty by the USDA and does not implyapproval of a product to the exclusion of others that may be suitable.
The authors are Nehru Chevanan, ASABE Member Engineer,Post‐Doctoral Research Associate, Department of Biosystems Engineeringand Soil Science, University of Tennessee, Knoxville, Tennessee;Kasiviswanathan Muthukumarappan, ASABE Member Engineer,Professor, Department of Agricultural and Biosystems Engineering, SouthDakota State University, Brookings, South Dakota; and Kurt A.Rosentrater, ASABE Member Engineer, Agricultural and BioprocessEngineer, USDA‐ARS North Central Agricultural Research Laboratory,Brookings, South Dakota. Corresponding author: Kurt A. Rosentrater,USDA‐ARS, 2923 Medary Ave., Brookings, SD 57006; phone:605‐693‐3241; fax: 605‐693‐5240; e‐mail: [email protected].
such as raw material characteristics, moisture content, screwspeed, screw configuration, barrel temperature, etc. Systemparameters are influenced by the process parameters andsubsequently affect the output parameters, and includeresidence time, specific mechanical energy, pressurebuildup, viscosity of the melt, etc. Output parameters includeextrudate expansion, bulk density, mechanical and chemicalproperties such as breaking strength, pellet durability index,water solubility index, water absorption index, nutrientcontent, extent of gelatinization, etc. Various models havebeen developed to understand the extrusion process in orderto quantify and predict product characteristics. Twoapproaches are generally followed in extrusion processing. Inthe first, models have been developed to predict the systemparameters applying well understood engineering andscientific principles, and then the output parameters can bepredicted based on the system parameters. In the secondapproach, the output parameters are predicted directly fromthe process parameters without considering the physical/chemical phenomena occurring inside the extruder (Ganjyalet al., 2006).
Numerous modeling studies have been carried out byapplying engineering fundamentals, such as flow modeling,thermal modeling, and product transformation modeling, tounderstand the biochemical and thermomechanical changesoccurring inside the barrel and their influences on resultingfinal product properties (Barres et al., 1991; Bruin et al.,1978; Della Valle et al., 1993; Frazier et al., 1982; Jager et al.,
E
1766 TRANSACTIONS OF THE ASABE
1991; Levine and Rockwood, 1985; Levine et al., 1987; Liand Hsieh, 1994; Li et al., 1997; Mohamed et al., 1990;Moysey and Thompson, 2005; Olkku et al., 1982;Vainionpaa, 1991, 1995; Vergnes et al., 1992; Zuilichem etal., 1990). Most models predict the various systemparameters from the processing parameters. There are onlya few modeling studies published on prediction of outputparameters based on system parameters (Yacu, 1985; Tayebet al., 1989; Kirby et al., 1988; Mueser and Van, 1987).
Mostly regression modeling and response surfacemodeling have been employed for predicting outputparameters from process parameters (Sokhey et al., 1997,Ganjayal et al., 2006, Chevanan et al., 2006, Chevanan et al.,2007). Response surface modeling is an empirical modelbuilding technique where the physical relationships are notknown (Box and Norman, 1987), and it is used to determineoptimum conditions for obtaining the maximum or minimumresponse within the operating conditions. Regressionmodeling is also widely used to determine the relationshipsbetween the input and output variables in extrusionprocessing, which are often nonlinear in nature. Hence, thenonlinear regression equations will generally contain manycross‐product terms and higher‐order terms. Even thoughincreasing the number of terms in the regression modelsincreases the accuracy of prediction, it also requires verylarge and complex experimental design procedures fordetermining the coefficient of the different interaction terms.Higher‐order regression analysis without the properexperimental design will lead to the possibility of increasingthe error with the application of models in a changedenvironment. Due to complex relationships between theinput and output variables for various regression models,such as exponential decay, fractional power models aregenerally not preferred in extrusion processing (Eerikainenand Linko, 1989).
Neural network (NN) modeling, on the other hand, is analternative modeling tool that can be used successfully forextrusion processing (Batchelor et al., 1997; Ganjyal et al.,2006) to overcome some of these problems. NN is a type ofmathematical algorithm that has the capability of relating theinput and output parameters and learning from example datathrough iteration, without requiring prior knowledge of thespecific relationships between the parameters (Torrecilla etal., 2005). NN models are specified by their topology, nodecharacteristics, and learning rules. The topology of a neuralnetwork contains one input layer, one output layer, and oneor more hidden layers. Each layer contains many processingneurons known as nodes. A model containing many hiddenlayers with many processing units may predict the outputvariable with negligible error, but it may result in very largeerror outside the testing region. On the other hand, a modelcontaining few neurons with one hidden layer may predict theoutput variables with slightly higher error, but it may performbetter during testing in an outside region. Optimum trainingis also necessary for minimizing the error. Hence, NNmodeling involves selection of a more generalized modelwith proper error strategy that has practical utility outside thetesting region (Mehrotra et al., 1997). NN modeling has beeneffectively used in food processing for many applications(Torrecilla et al., 2004; Goncalves et al., 2006; Bochereau etal., 1991; Boillereaux et al., 2003). In extrusion processing,Linko et al. (1992) used NN for control of specificmechanical energy on the basis of screw speed in flat bread
production. Eerikainen and Linko (1989) used NN formodeling torque, specific mechanical energy, and pressureusing two independently trained feed‐forward NN. Ganjyalet al. (2006) used NN and reported that it performed betterthan the regression model for predicting the extrudateproperties. These studies have shown that NN has greaterpotential to be used in extrusion processing for modeling bothsystem parameters and output parameters than eitherresponse surface or regression modeling.
In extrusion processing, to develop a robust model, it maynot be possible to vary many variables in an experiment tostudy the entire process. Usually two to three variables arevaried in a given experiment, while all other variables arekept constant; many such experiments are then conducted tounderstand the effect of all the parameters. Since NN modelsare developed through learning by iteration and training, it ispossible to obtain a robust prediction model with many inputvariables from data collected from different experiments.Hence, the objectives of this study were to (1) developregression models to predict system and output parameters,(2) develop NN models to predict system and outputparameters, and (3) study the effectiveness of these modelsto predict system and output parameters using the dataobtained from two different experiments conducted fordeveloping aquaculture feed containing distillers driedgrains with solubles (DDGS).
MATERIALS AND METHODSSAMPLE PREPARATION
An ingredient blend containing 40% DDGS, along withappropriate quantities of soy flour, corn flour, Menhaden fishmeal, whey, vitamin mix, and mineral mix, with the netprotein adjusted to 28%, was prepared following Chevananet al. (2005a, 2005b). DDGS was provided by DakotaEthanol, LLC (Wentworth, S.D.), and was ground to aparticle size of approximately 100 μm using a laboratorygrinder (S500 disc mill, Genmills, Inc., Clifton, N.J.). Cornflour was provided by Cargill Dry Ingredients (Paris, Ill.),and soy flour was provided by Cargill Soy Protein Solutions(Cedar Rapids, Iowa). The ingredients were mixed in alaboratory‐scale mixer (N50 mixer, Hobart Corp., Troy,Ohio) for 10 min, and then stored overnight at refrigeratedconditions (10°C ±1°C) for moisture stabilization. Themoisture content of the ingredient mix was adjusted byadding required quantities of water during mixing.
EXPERIMENTAL DESIGNThe extrusion studies were carried out using a single‐
screw extruder (model PL 2000, Brabender Plasti‐Corder,South Hackensack, N.J.), which had a barrel length of317.5�mm and a length‐to‐diameter ratio of 20:1. The dieassembly had an internal conical section and a length of101.6�mm. A screw with a uniform pitch of 9.05 mm wasused in the experiments. The screw had variable flute depth,with the depth of 9.05 mm at the feed portion and 3.81 mmnear the die. The compression ratio achieved inside the barrelwas 3:1. The speed of the screw and the temperature insidethe barrel were controlled by a computer control system. Theextruder barrel's band heaters allowed the temperature of thefeed zone, the transition zone in the barrel, and the die sectionto be controlled. Compressed air cooling was provided in the
1767Vol. 50(5): 1765-1778
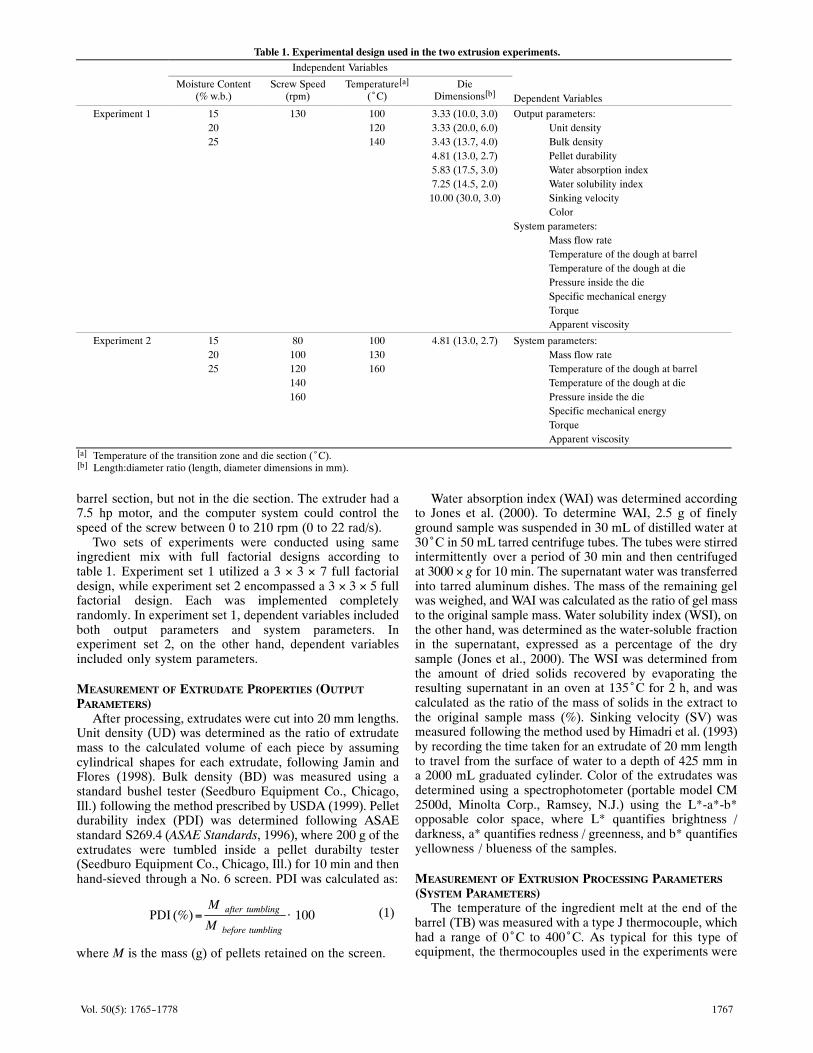
Table 1. Experimental design used in the two extrusion experiments.Independent Variables
Dependent VariablesMoisture Content
(% w.b.)Screw Speed
(rpm)Temperature[a]
(°C)Die
Dimensions[b]
Experiment 1 15 130 100 3.33 (10.0, 3.0) Output parameters:20 120 3.33 (20.0, 6.0) Unit density25 140 3.43 (13.7, 4.0) Bulk density
4.81 (13.0, 2.7) Pellet durability5.83 (17.5, 3.0) Water absorption index7.25 (14.5, 2.0) Water solubility index10.00 (30.0, 3.0) Sinking velocity
ColorSystem parameters:
Mass flow rateTemperature of the dough at barrelTemperature of the dough at diePressure inside the dieSpecific mechanical energyTorqueApparent viscosity
Experiment 2 15 80 100 4.81 (13.0, 2.7) System parameters:20 100 130 Mass flow rate25 120 160 Temperature of the dough at barrel
140 Temperature of the dough at die160 Pressure inside the die
Specific mechanical energyTorqueApparent viscosity
[a] Temperature of the transition zone and die section (°C).[b] Length:diameter ratio (length, diameter dimensions in mm).
barrel section, but not in the die section. The extruder had a7.5 hp motor, and the computer system could control thespeed of the screw between 0 to 210 rpm (0 to 22 rad/s).
Two sets of experiments were conducted using sameingredient mix with full factorial designs according totable�1. Experiment set 1 utilized a 3 × 3 × 7 full factorialdesign, while experiment set 2 encompassed a 3 × 3 × 5 fullfactorial design. Each was implemented completelyrandomly. In experiment set 1, dependent variables includedboth output parameters and system parameters. Inexperiment set 2, on the other hand, dependent variablesincluded only system parameters.
MEASUREMENT OF EXTRUDATE PROPERTIES (OUTPUT
PARAMETERS)After processing, extrudates were cut into 20 mm lengths.
Unit density (UD) was determined as the ratio of extrudatemass to the calculated volume of each piece by assumingcylindrical shapes for each extrudate, following Jamin andFlores (1998). Bulk density (BD) was measured using astandard bushel tester (Seedburo Equipment Co., Chicago,Ill.) following the method prescribed by USDA (1999). Pelletdurability index (PDI) was determined following ASAEstandard S269.4 (ASAE Standards, 1996), where 200 g of theextrudates were tumbled inside a pellet durabilty tester(Seedburo Equipment Co., Chicago, Ill.) for 10 min and thenhand‐sieved through a No. 6 screen. PDI was calculated as:
100)(%PDI ⋅=tumblingbefore
tumblingafter
M
M (1)
where M is the mass (g) of pellets retained on the screen.
Water absorption index (WAI) was determined accordingto Jones et al. (2000). To determine WAI, 2.5 g of finelyground sample was suspended in 30 mL of distilled water at30°C in 50 mL tarred centrifuge tubes. The tubes were stirredintermittently over a period of 30 min and then centrifugedat 3000 × g for 10 min. The supernatant water was transferredinto tarred aluminum dishes. The mass of the remaining gelwas weighed, and WAI was calculated as the ratio of gel massto the original sample mass. Water solubility index (WSI), onthe other hand, was determined as the water‐soluble fractionin the supernatant, expressed as a percentage of the drysample (Jones et al., 2000). The WSI was determined fromthe amount of dried solids recovered by evaporating theresulting supernatant in an oven at 135°C for 2 h, and wascalculated as the ratio of the mass of solids in the extract tothe original sample mass (%). Sinking velocity (SV) wasmeasured following the method used by Himadri et al. (1993)by recording the time taken for an extrudate of 20 mm lengthto travel from the surface of water to a depth of 425 mm ina 2000 mL graduated cylinder. Color of the extrudates wasdetermined using a spectrophotometer (portable model CM2500d, Minolta Corp., Ramsey, N.J.) using the L*‐a*‐b*opposable color space, where L* quantifies brightness /darkness, a* quantifies redness / greenness, and b* quantifiesyellowness / blueness of the samples.
MEASUREMENT OF EXTRUSION PROCESSING PARAMETERS
(SYSTEM PARAMETERS)The temperature of the ingredient melt at the end of the
barrel (TB) was measured with a type J thermocouple, whichhad a range of 0°C to 400°C. As typical for this type ofequipment, the thermocouples used in the experiments were
1768 TRANSACTIONS OF THE ASABE
not self‐wiping and did not directly contact the ingredientmelt inside the barrel. The absolute pressure (P) inside the diewas recorded with a pressure transducer, which had a rangeof 0 to 68.9 MP. The temperature of the melt in the die section(TD) was recorded with a thermocouple that was combinedwith the pressure transducer. The net torque (Ω) wasmeasured with a torque transducer, which had a range of 0 to390 N‐m. During experimentation, extrudate samples werecollected for 30 s intervals, and the mass flow rate (MFR) wasthen calculated (g/min).
Based on the torque and the mass flow rate data, otherprocessing variables were then determined. Specificmechanical energy (SME, J/g) was calculated according toHarper (1981) and Martelli (1983) as:
feedm
60**SME
��= (2)
where Ω is the net torque exerted on the extruder drive (N‐m),ω is the angular velocity of the screw (rad/s), and mfeed is themass flow rate (g/min). Since we did not account for themoisture loss at the die when determining mass flow rate, theSME calculated was an apparent value, not an exact value.Apparent viscosity (η) of the melt in the extruder (Pa‐s) wascalculated by approximating the barrel and screw as aconcentric cylinder viscometer arrangement, and thenincorporating corrections for the tapered screw geometryfollowing Konkoly (1997), Lam and Flores (2003), Lo andMoreira (1996), Rogers (1970), and Rosentrater et al. ( 2005).The apparent viscosity was determined as the ratio of shearstress (τs) at the screw surface (N/m2) to the shear rate (γs) atthe screw (1/s) and was calculated using:
�=�
�=� ss
scorrs C
Lr *)(**2 2 (3)
�=−
�=� sr
corrb
bs C
rr
r22
2**2 (4)
where rcorr is the radius correction (m) due to the frustumgeometry:
3/)( 2221
21 effeffeffeffcorr rrrrr ++= (5)
and reff is the effective radius including the screw root radiusand half of the flight height (m), L is the screw length in theaxial direction (m), Css is a correction factor for shear stress(5675.4 for the specific screw used in this study), γs is theshear rate at the screw (1/s), rb is the barrel radius (m), andCsr is the correction factor for shear rate (6.31 for the specificscrew used in this study). This has been explained in greaterdetail elsewhere (Rosentrater et al., 2005).
REGRESSION MODELINGIn order to develop a robust model, only linear terms,
square terms, and cross‐product terms were considered.Multiple polynomial regression models were developedusing SAS v.8 (SAS Institute, Inc., Cary, N.C.) software. Themodels were developed using a stepwise selection method(with inclusion and exclusion p values of 0.1 and 0.01), andonly statistically significant terms were included in the
model (Neter et al., 1990). Die dimensions, temperature profilein the barrel, and moisture content of the ingredient mix wereinput variables for the models. During analysis, it wasdetermined that L/D predicted extrudate properties andextrusion processing parameters with higher R2 valuescompared to L or D alone as primary geometric parameters.Thus, regression models were developed to examine theextrusion processing parameters and extrudate properties usingL/D ratio as the primary geometric parameter along withmoisture content and temperature for the data collected fromexperiment set 1. Regression models were also developed forthe extrusion processing parameters only, using six inputvariables (L, D, L/D ratio of die nozzle, moisture content,temperature, and screw speed) using the data obtained fromboth experiment sets 1 and 2 together. Thus, the criteria used forselection of a particular regression model were: (1) include onlystatistically significant (p < 0.01) parameters in the model, (2)maximize the R2 value, and (3) minimize the coefficient ofvariation (CV), defined as the ratio of the root mean square error(RMSE) and the mean of the predicted value and standard error(SE), which is defined as the RMSE between the measured andpredicted values.
NN MODELING
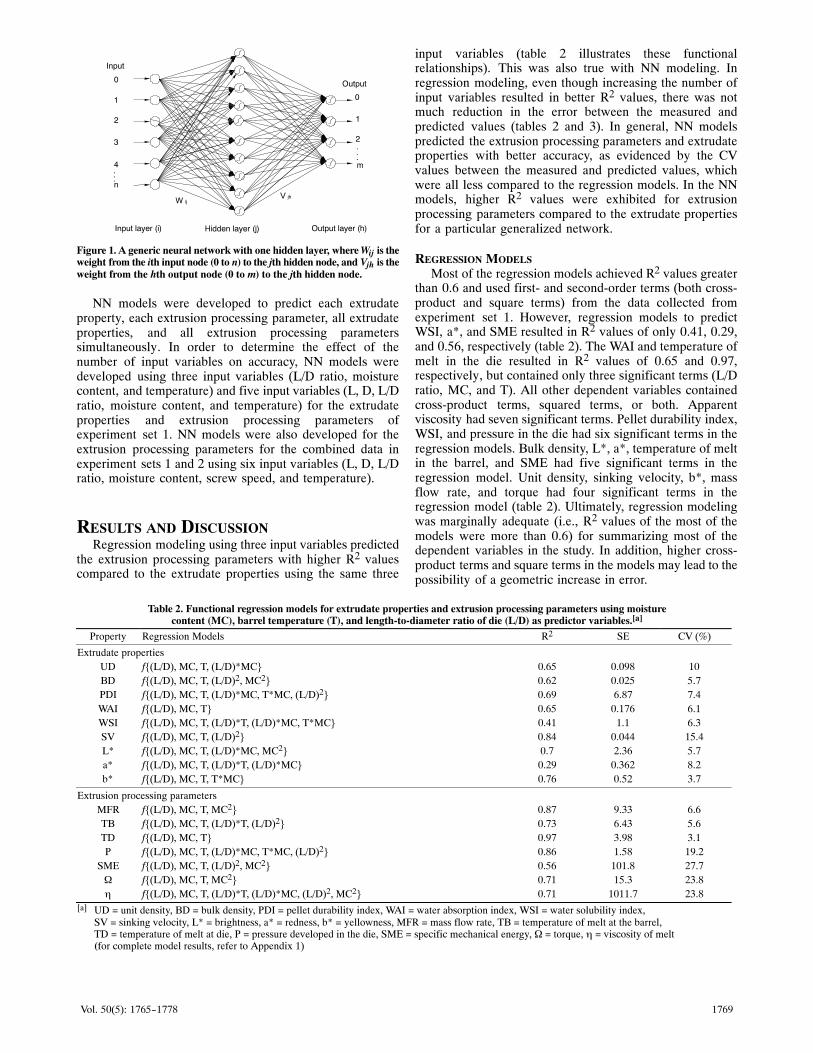
NN models were developed using commercially availablesoftware (Neurosolutions V.4, Neurodimensions, Inc.,Gainesville, Fla.). Networks were built using the NeuralBuilder for Excel subprogram in the software. A generalizedfeed‐forward model using an error back‐propagation throughtime algorithm with a sigmoid transfer function was used fordevelopment of robust models, as it resulted in better R2
values along with required data convergence compared toother models available in the software. Back‐propagation inneural networks tends to improve the data convergence andresults in accurate prediction of parameters with smallertopology of the network. The back‐propagation adjusts thenetworks weights and thresholds so as to minimize the errorand results in accurate prediction of parameters. One hiddenlayer with varying number of neurons resulted in sufficientdata convergence with minimized RMSE. Hence, all the NNmodels were developed with one hidden layer (fig. 1) only inorder to avoid development of an over‐specified modelhaving no utility outside the data range (Mehrotra et al.,1997). A typical NN model with one hidden layer can begraphically represented as shown in figure 1. The totalexperimental data sets were combined, and the order of rowscontaining input and output data was randomized. The first70% of the data set was used for training, and the remaining30% was used for performance testing. The variables thatwere systematically altered in the program includedmomentum rate (0.2 to 0.7), initial step size (0.1 to 0.3), andthe default decay weight of 0.01 to obtain proper dataconvergence with minimum RMSE. During modeldevelopment, the recent best model was saved, replacing thelast saved best model. The software could be used to developNN models to predict each output variable using multipleinput variables individually or using MIMO (multiple inputand multiple output) simultaneously. The number of trainingsteps (1000 epochs for three times) was decided on achievingRMSE of <0.01% for the training data set. The highest R2
values and the minimum CV and SE between the measuredand predicted values of the testing data set were used forcomparison between the regression and NN models.
1769Vol. 50(5): 1765-1778
V jhW ij
Input layer (i) Hidden layer (j) Output layer (h)
Input
Output0
1
2
3
...
n
4
0
1
2
..
.
m
Figure 1. A generic neural network with one hidden layer, where Wij is theweight from the ith input node (0 to n) to the jth hidden node, and Vjh is theweight from the hth output node (0 to m) to the jth hidden node.
NN models were developed to predict each extrudateproperty, each extrusion processing parameter, all extrudateproperties, and all extrusion processing parameterssimultaneously. In order to determine the effect of thenumber of input variables on accuracy, NN models weredeveloped using three input variables (L/D ratio, moisturecontent, and temperature) and five input variables (L, D, L/Dratio, moisture content, and temperature) for the extrudateproperties and extrusion processing parameters ofexperiment set 1. NN models were also developed for theextrusion processing parameters for the combined data inexperiment sets 1 and 2 using six input variables (L, D, L/Dratio, moisture content, screw speed, and temperature).
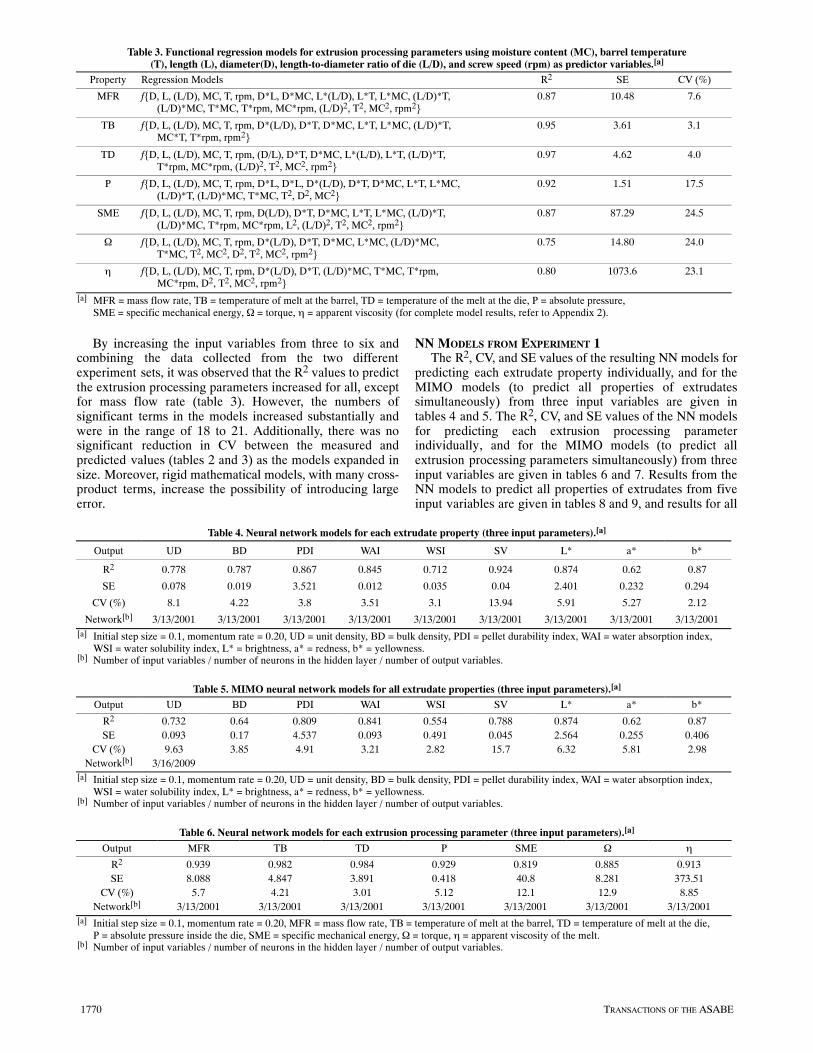
RESULTS AND DISCUSSIONRegression modeling using three input variables predicted
the extrusion processing parameters with higher R2 valuescompared to the extrudate properties using the same three
input variables (table 2 illustrates these functionalrelationships). This was also true with NN modeling. Inregression modeling, even though increasing the number ofinput variables resulted in better R2 values, there was notmuch reduction in the error between the measured andpredicted values (tables 2 and 3). In general, NN modelspredicted the extrusion processing parameters and extrudateproperties with better accuracy, as evidenced by the CVvalues between the measured and predicted values, whichwere all less compared to the regression models. In the NNmodels, higher R2 values were exhibited for extrusionprocessing parameters compared to the extrudate propertiesfor a particular generalized network.
REGRESSION MODELS
Most of the regression models achieved R2 values greaterthan 0.6 and used first‐ and second‐order terms (both cross‐product and square terms) from the data collected fromexperiment set 1. However, regression models to predictWSI, a*, and SME resulted in R2 values of only 0.41, 0.29,and 0.56, respectively (table 2). The WAI and temperature ofmelt in the die resulted in R2 values of 0.65 and 0.97,respectively, but contained only three significant terms (L/Dratio, MC, and T). All other dependent variables containedcross‐product terms, squared terms, or both. Apparentviscosity had seven significant terms. Pellet durability index,WSI, and pressure in the die had six significant terms in theregression models. Bulk density, L*, a*, temperature of meltin the barrel, and SME had five significant terms in theregression model. Unit density, sinking velocity, b*, massflow rate, and torque had four significant terms in theregression model (table 2). Ultimately, regression modelingwas marginally adequate (i.e., R2 values of the most of themodels were more than 0.6) for summarizing most of thedependent variables in the study. In addition, higher cross‐product terms and square terms in the models may lead to thepossibility of a geometric increase in error.
Table 2. Functional regression models for extrudate properties and extrusion processing parameters using moisturecontent (MC), barrel temperature (T), and length‐to‐diameter ratio of die (L/D) as predictor variables.[a]
Property Regression Models R2 SE CV (%)
Extrudate propertiesUD f{(L/D), MC, T, (L/D)*MC} 0.65 0.098 10BD f{(L/D), MC, T, (L/D)2, MC2} 0.62 0.025 5.7PDI f{(L/D), MC, T, (L/D)*MC, T*MC, (L/D)2} 0.69 6.87 7.4WAI f{(L/D), MC, T} 0.65 0.176 6.1WSI f{(L/D), MC, T, (L/D)*T, (L/D)*MC, T*MC} 0.41 1.1 6.3SV f{(L/D), MC, T, (L/D)2} 0.84 0.044 15.4L* f{(L/D), MC, T, (L/D)*MC, MC2} 0.7 2.36 5.7a* f{(L/D), MC, T, (L/D)*T, (L/D)*MC} 0.29 0.362 8.2b* f{(L/D), MC, T, T*MC} 0.76 0.52 3.7
Extrusion processing parametersMFR f{(L/D), MC, T, MC2} 0.87 9.33 6.6TB f{(L/D), MC, T, (L/D)*T, (L/D)2} 0.73 6.43 5.6TD f{(L/D), MC, T} 0.97 3.98 3.1P f{(L/D), MC, T, (L/D)*MC, T*MC, (L/D)2} 0.86 1.58 19.2
SME f{(L/D), MC, T, (L/D)2, MC2} 0.56 101.8 27.7Ω f{(L/D), MC, T, MC2} 0.71 15.3 23.8η f{(L/D), MC, T, (L/D)*T, (L/D)*MC, (L/D)2, MC2} 0.71 1011.7 23.8
[a] UD = unit density, BD = bulk density, PDI = pellet durability index, WAI = water absorption index, WSI = water solubility index, SV = sinking velocity, L* = brightness, a* = redness, b* = yellowness, MFR = mass flow rate, TB = temperature of melt at the barrel, TD = temperature of melt at die, P = pressure developed in the die, SME = specific mechanical energy, Ω = torque, η = viscosity of melt (for complete model results, refer to Appendix 1)
1770 TRANSACTIONS OF THE ASABE
Table 3. Functional regression models for extrusion processing parameters using moisture content (MC), barrel temperature(T), length (L), diameter(D), length‐to‐diameter ratio of die (L/D), and screw speed (rpm) as predictor variables.[a]
Property Regression Models R2 SE CV (%)
MFR f{D, L, (L/D), MC, T, rpm, D*L, D*MC, L*(L/D), L*T, L*MC, (L/D)*T, (L/D)*MC, T*MC, T*rpm, MC*rpm, (L/D)2, T2, MC2, rpm2}
0.87 10.48 7.6
TB f{D, L, (L/D), MC, T, rpm, D*(L/D), D*T, D*MC, L*T, L*MC, (L/D)*T, MC*T, T*rpm, rpm2}
0.95 3.61 3.1
TD f{D, L, (L/D), MC, T, rpm, (D/L), D*T, D*MC, L*(L/D), L*T, (L/D)*T, T*rpm, MC*rpm, (L/D)2, T2, MC2, rpm2}
0.97 4.62 4.0
P f{D, L, (L/D), MC, T, rpm, D*L, D*L, D*(L/D), D*T, D*MC, L*T, L*MC, (L/D)*T, (L/D)*MC, T*MC, T2, D2, MC2}
0.92 1.51 17.5
SME f{D, L, (L/D), MC, T, rpm, D(L/D), D*T, D*MC, L*T, L*MC, (L/D)*T, (L/D)*MC, T*rpm, MC*rpm, L2, (L/D)2, T2, MC2, rpm2}
0.87 87.29 24.5
Ω f{D, L, (L/D), MC, T, rpm, D*(L/D), D*T, D*MC, L*MC, (L/D)*MC, T*MC, T2, MC2, D2, T2, MC2, rpm2}
0.75 14.80 24.0
η f{D, L, (L/D), MC, T, rpm, D*(L/D), D*T, (L/D)*MC, T*MC, T*rpm, MC*rpm, D2, T2, MC2, rpm2}
0.80 1073.6 23.1
[a] MFR = mass flow rate, TB = temperature of melt at the barrel, TD = temperature of the melt at the die, P = absolute pressure, SME = specific mechanical energy, Ω = torque, η = apparent viscosity (for complete model results, refer to Appendix 2).
By increasing the input variables from three to six andcombining the data collected from the two differentexperiment sets, it was observed that the R2 values to predictthe extrusion processing parameters increased for all, exceptfor mass flow rate (table 3). However, the numbers ofsignificant terms in the models increased substantially andwere in the range of 18 to 21. Additionally, there was nosignificant reduction in CV between the measured andpredicted values (tables 2 and 3) as the models expanded insize. Moreover, rigid mathematical models, with many cross‐product terms, increase the possibility of introducing largeerror.
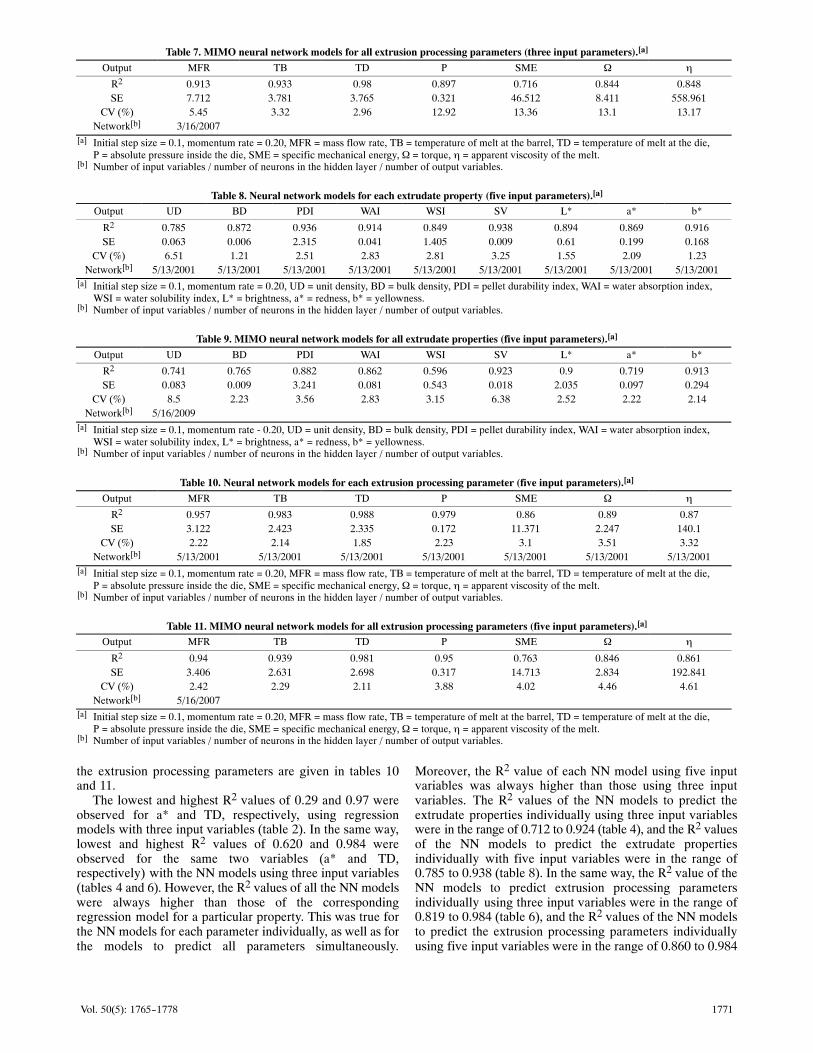
NN MODELS FROM EXPERIMENT 1The R2, CV, and SE values of the resulting NN models for
predicting each extrudate property individually, and for theMIMO models (to predict all properties of extrudatessimultaneously) from three input variables are given intables�4 and 5. The R2, CV, and SE values of the NN modelsfor predicting each extrusion processing parameterindividually, and for the MIMO models (to predict allextrusion processing parameters simultaneously) from threeinput variables are given in tables 6 and 7. Results from theNN models to predict all properties of extrudates from fiveinput variables are given in tables 8 and 9, and results for all
Table 4. Neural network models for each extrudate property (three input parameters).[a]
Output UD BD PDI WAI WSI SV L* a* b*
R2 0.778 0.787 0.867 0.845 0.712 0.924 0.874 0.62 0.87
SE 0.078 0.019 3.521 0.012 0.035 0.04 2.401 0.232 0.294
CV (%) 8.1 4.22 3.8 3.51 3.1 13.94 5.91 5.27 2.12
Network[b] 3/13/2001 3/13/2001 3/13/2001 3/13/2001 3/13/2001 3/13/2001 3/13/2001 3/13/2001 3/13/2001[a] Initial step size = 0.1, momentum rate = 0.20, UD = unit density, BD = bulk density, PDI = pellet durability index, WAI = water absorption index,
WSI = water solubility index, L* = brightness, a* = redness, b* = yellowness.[b] Number of input variables / number of neurons in the hidden layer / number of output variables.
Table 5. MIMO neural network models for all extrudate properties (three input parameters).[a]
Output UD BD PDI WAI WSI SV L* a* b*
R2 0.732 0.64 0.809 0.841 0.554 0.788 0.874 0.62 0.87SE 0.093 0.17 4.537 0.093 0.491 0.045 2.564 0.255 0.406
CV (%) 9.63 3.85 4.91 3.21 2.82 15.7 6.32 5.81 2.98Network[b] 3/16/2009
[a] Initial step size = 0.1, momentum rate = 0.20, UD = unit density, BD = bulk density, PDI = pellet durability index, WAI = water absorption index, WSI = water solubility index, L* = brightness, a* = redness, b* = yellowness.
[b] Number of input variables / number of neurons in the hidden layer / number of output variables.
Table 6. Neural network models for each extrusion processing parameter (three input parameters).[a]
Output MFR TB TD P SME Ω η
R2 0.939 0.982 0.984 0.929 0.819 0.885 0.913SE 8.088 4.847 3.891 0.418 40.8 8.281 373.51
CV (%) 5.7 4.21 3.01 5.12 12.1 12.9 8.85Network[b] 3/13/2001 3/13/2001 3/13/2001 3/13/2001 3/13/2001 3/13/2001 3/13/2001
[a] Initial step size = 0.1, momentum rate = 0.20, MFR = mass flow rate, TB = temperature of melt at the barrel, TD = temperature of melt at the die, P = absolute pressure inside the die, SME = specific mechanical energy, Ω = torque, η = apparent viscosity of the melt.
[b] Number of input variables / number of neurons in the hidden layer / number of output variables.
1771Vol. 50(5): 1765-1778
Table 7. MIMO neural network models for all extrusion processing parameters (three input parameters).[a]
Output MFR TB TD P SME Ω η
R2 0.913 0.933 0.98 0.897 0.716 0.844 0.848SE 7.712 3.781 3.765 0.321 46.512 8.411 558.961
CV (%) 5.45 3.32 2.96 12.92 13.36 13.1 13.17Network[b] 3/16/2007
[a] Initial step size = 0.1, momentum rate = 0.20, MFR = mass flow rate, TB = temperature of melt at the barrel, TD = temperature of melt at the die, P = absolute pressure inside the die, SME = specific mechanical energy, Ω = torque, η = apparent viscosity of the melt.
[b] Number of input variables / number of neurons in the hidden layer / number of output variables.
Table 8. Neural network models for each extrudate property (five input parameters).[a]
Output UD BD PDI WAI WSI SV L* a* b*
R2 0.785 0.872 0.936 0.914 0.849 0.938 0.894 0.869 0.916SE 0.063 0.006 2.315 0.041 1.405 0.009 0.61 0.199 0.168
CV (%) 6.51 1.21 2.51 2.83 2.81 3.25 1.55 2.09 1.23Network[b] 5/13/2001 5/13/2001 5/13/2001 5/13/2001 5/13/2001 5/13/2001 5/13/2001 5/13/2001 5/13/2001
[a] Initial step size = 0.1, momentum rate = 0.20, UD = unit density, BD = bulk density, PDI = pellet durability index, WAI = water absorption index, WSI = water solubility index, L* = brightness, a* = redness, b* = yellowness.
[b] Number of input variables / number of neurons in the hidden layer / number of output variables.
Table 9. MIMO neural network models for all extrudate properties (five input parameters).[a]
Output UD BD PDI WAI WSI SV L* a* b*
R2 0.741 0.765 0.882 0.862 0.596 0.923 0.9 0.719 0.913SE 0.083 0.009 3.241 0.081 0.543 0.018 2.035 0.097 0.294
CV (%) 8.5 2.23 3.56 2.83 3.15 6.38 2.52 2.22 2.14Network[b] 5/16/2009
[a] Initial step size = 0.1, momentum rate ‐ 0.20, UD = unit density, BD = bulk density, PDI = pellet durability index, WAI = water absorption index, WSI = water solubility index, L* = brightness, a* = redness, b* = yellowness.
[b] Number of input variables / number of neurons in the hidden layer / number of output variables.
Table 10. Neural network models for each extrusion processing parameter (five input parameters).[a]
Output MFR TB TD P SME Ω η
R2 0.957 0.983 0.988 0.979 0.86 0.89 0.87SE 3.122 2.423 2.335 0.172 11.371 2.247 140.1
CV (%) 2.22 2.14 1.85 2.23 3.1 3.51 3.32Network[b] 5/13/2001 5/13/2001 5/13/2001 5/13/2001 5/13/2001 5/13/2001 5/13/2001
[a] Initial step size = 0.1, momentum rate = 0.20, MFR = mass flow rate, TB = temperature of melt at the barrel, TD = temperature of melt at the die, P = absolute pressure inside the die, SME = specific mechanical energy, Ω = torque, η = apparent viscosity of the melt.
[b] Number of input variables / number of neurons in the hidden layer / number of output variables.
Table 11. MIMO neural network models for all extrusion processing parameters (five input parameters).[a]
Output MFR TB TD P SME Ω η
R2 0.94 0.939 0.981 0.95 0.763 0.846 0.861SE 3.406 2.631 2.698 0.317 14.713 2.834 192.841
CV (%) 2.42 2.29 2.11 3.88 4.02 4.46 4.61Network[b] 5/16/2007
[a] Initial step size = 0.1, momentum rate = 0.20, MFR = mass flow rate, TB = temperature of melt at the barrel, TD = temperature of melt at the die, P = absolute pressure inside the die, SME = specific mechanical energy, Ω = torque, η = apparent viscosity of the melt.
[b] Number of input variables / number of neurons in the hidden layer / number of output variables.
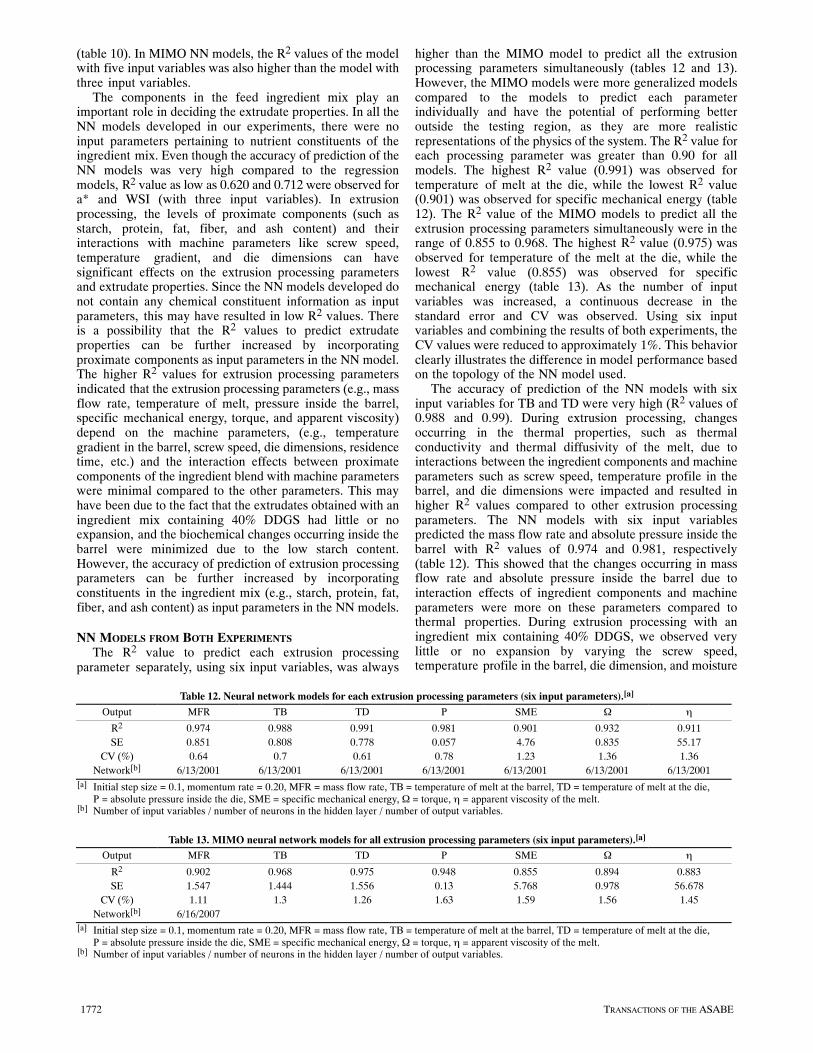
the extrusion processing parameters are given in tables 10and 11.
The lowest and highest R2 values of 0.29 and 0.97 wereobserved for a* and TD, respectively, using regressionmodels with three input variables (table 2). In the same way,lowest and highest R2 values of 0.620 and 0.984 wereobserved for the same two variables (a* and TD,respectively) with the NN models using three input variables(tables 4 and 6). However, the R2 values of all the NN modelswere always higher than those of the correspondingregression model for a particular property. This was true forthe NN models for each parameter individually, as well as forthe models to predict all parameters simultaneously.
Moreover, the R2 value of each NN model using five inputvariables was always higher than those using three inputvariables. The R2 values of the NN models to predict theextrudate properties individually using three input variableswere in the range of 0.712 to 0.924 (table 4), and the R2 valuesof the NN models to predict the extrudate propertiesindividually with five input variables were in the range of0.785 to 0.938 (table 8). In the same way, the R2 value of theNN models to predict extrusion processing parametersindividually using three input variables were in the range of0.819 to 0.984 (table 6), and the R2 values of the NN modelsto predict the extrusion processing parameters individuallyusing five input variables were in the range of 0.860 to 0.984
1772 TRANSACTIONS OF THE ASABE
(table 10). In MIMO NN models, the R2 values of the modelwith five input variables was also higher than the model withthree input variables.
The components in the feed ingredient mix play animportant role in deciding the extrudate properties. In all theNN models developed in our experiments, there were noinput parameters pertaining to nutrient constituents of theingredient mix. Even though the accuracy of prediction of theNN models was very high compared to the regressionmodels, R2 value as low as 0.620 and 0.712 were observed fora* and WSI (with three input variables). In extrusionprocessing, the levels of proximate components (such asstarch, protein, fat, fiber, and ash content) and theirinteractions with machine parameters like screw speed,temperature gradient, and die dimensions can havesignificant effects on the extrusion processing parametersand extrudate properties. Since the NN models developed donot contain any chemical constituent information as inputparameters, this may have resulted in low R2 values. Thereis a possibility that the R2 values to predict extrudateproperties can be further increased by incorporatingproximate components as input parameters in the NN model.The higher R2 values for extrusion processing parametersindicated that the extrusion processing parameters (e.g., massflow rate, temperature of melt, pressure inside the barrel,specific mechanical energy, torque, and apparent viscosity)depend on the machine parameters, (e.g., temperaturegradient in the barrel, screw speed, die dimensions, residencetime, etc.) and the interaction effects between proximatecomponents of the ingredient blend with machine parameterswere minimal compared to the other parameters. This mayhave been due to the fact that the extrudates obtained with aningredient mix containing 40% DDGS had little or noexpansion, and the biochemical changes occurring inside thebarrel were minimized due to the low starch content.However, the accuracy of prediction of extrusion processingparameters can be further increased by incorporatingconstituents in the ingredient mix (e.g., starch, protein, fat,fiber, and ash content) as input parameters in the NN models.
NN MODELS FROM BOTH EXPERIMENTS
The R2 value to predict each extrusion processingparameter separately, using six input variables, was always
higher than the MIMO model to predict all the extrusionprocessing parameters simultaneously (tables 12 and 13).However, the MIMO models were more generalized modelscompared to the models to predict each parameterindividually and have the potential of performing betteroutside the testing region, as they are more realisticrepresentations of the physics of the system. The R2 value foreach processing parameter was greater than 0.90 for allmodels. The highest R2 value (0.991) was observed fortemperature of melt at the die, while the lowest R2 value(0.901) was observed for specific mechanical energy (table12). The R2 value of the MIMO models to predict all theextrusion processing parameters simultaneously were in therange of 0.855 to 0.968. The highest R2 value (0.975) wasobserved for temperature of the melt at the die, while thelowest R2 value (0.855) was observed for specificmechanical energy (table 13). As the number of inputvariables was increased, a continuous decrease in thestandard error and CV was observed. Using six inputvariables and combining the results of both experiments, theCV values were reduced to approximately 1%. This behaviorclearly illustrates the difference in model performance basedon the topology of the NN model used.
The accuracy of prediction of the NN models with sixinput variables for TB and TD were very high (R2 values of0.988 and 0.99). During extrusion processing, changesoccurring in the thermal properties, such as thermalconductivity and thermal diffusivity of the melt, due tointeractions between the ingredient components and machineparameters such as screw speed, temperature profile in thebarrel, and die dimensions were impacted and resulted inhigher R2 values compared to other extrusion processingparameters. The NN models with six input variablespredicted the mass flow rate and absolute pressure inside thebarrel with R2 values of 0.974 and 0.981, respectively(table�12). This showed that the changes occurring in massflow rate and absolute pressure inside the barrel due tointeraction effects of ingredient components and machineparameters were more on these parameters compared tothermal properties. During extrusion processing with aningredient mix containing 40% DDGS, we observed verylittle or no expansion by varying the screw speed,temperature profile in the barrel, die dimension, and moisture
Table 12. Neural network models for each extrusion processing parameters (six input parameters).[a]
Output MFR TB TD P SME Ω η
R2 0.974 0.988 0.991 0.981 0.901 0.932 0.911SE 0.851 0.808 0.778 0.057 4.76 0.835 55.17
CV (%) 0.64 0.7 0.61 0.78 1.23 1.36 1.36Network[b] 6/13/2001 6/13/2001 6/13/2001 6/13/2001 6/13/2001 6/13/2001 6/13/2001
[a] Initial step size = 0.1, momentum rate = 0.20, MFR = mass flow rate, TB = temperature of melt at the barrel, TD = temperature of melt at the die, P = absolute pressure inside the die, SME = specific mechanical energy, Ω = torque, η = apparent viscosity of the melt.
[b] Number of input variables / number of neurons in the hidden layer / number of output variables.
Table 13. MIMO neural network models for all extrusion processing parameters (six input parameters).[a]
Output MFR TB TD P SME Ω η
R2 0.902 0.968 0.975 0.948 0.855 0.894 0.883SE 1.547 1.444 1.556 0.13 5.768 0.978 56.678
CV (%) 1.11 1.3 1.26 1.63 1.59 1.56 1.45Network[b] 6/16/2007
[a] Initial step size = 0.1, momentum rate = 0.20, MFR = mass flow rate, TB = temperature of melt at the barrel, TD = temperature of melt at the die, P = absolute pressure inside the die, SME = specific mechanical energy, Ω = torque, η = apparent viscosity of the melt.
[b] Number of input variables / number of neurons in the hidden layer / number of output variables.
1773Vol. 50(5): 1765-1778
content of the ingredient mix due to its low starch content.This might have resulted in lesser interaction effect onpressure developed inside the barrel and mass flow ratecompared to specific mechanical energy, torque, andapparent viscosity. R2 values of 0.901, 0.932, and 0.911 wereobserved for specific mechanical energy, torque, andapparent viscosity, respectively. This showed that thechanges occurring due to the interaction effects betweeningredient components and machine parameters weremaximum for specific mechanical energy consumption,torque, and apparent viscosity of melt inside the barrel.Specific mechanical energy was a derived quantity fromtorque and mass flow rate, and apparent viscosity was aderived quantity from torque and screw speed. Hence, theminimum R2 values for these two extrusion processingparameters were expected.
COMPARISON BETWEEN REGRESSION AND NN MODELS
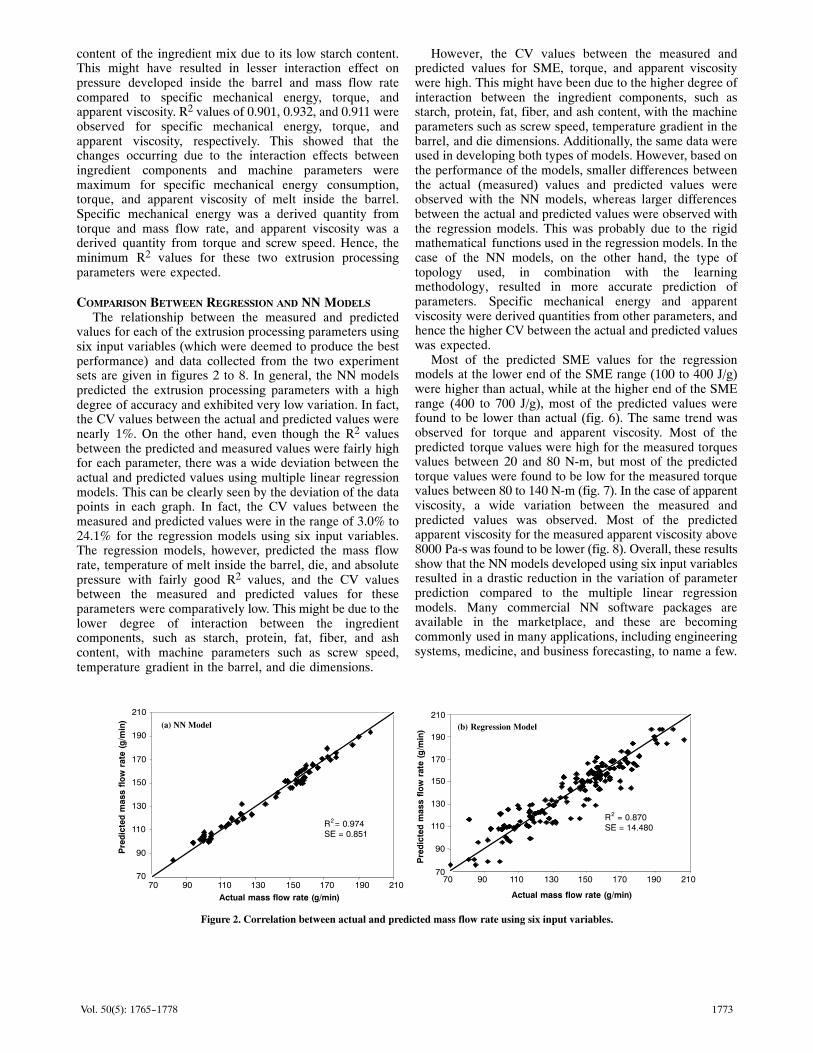
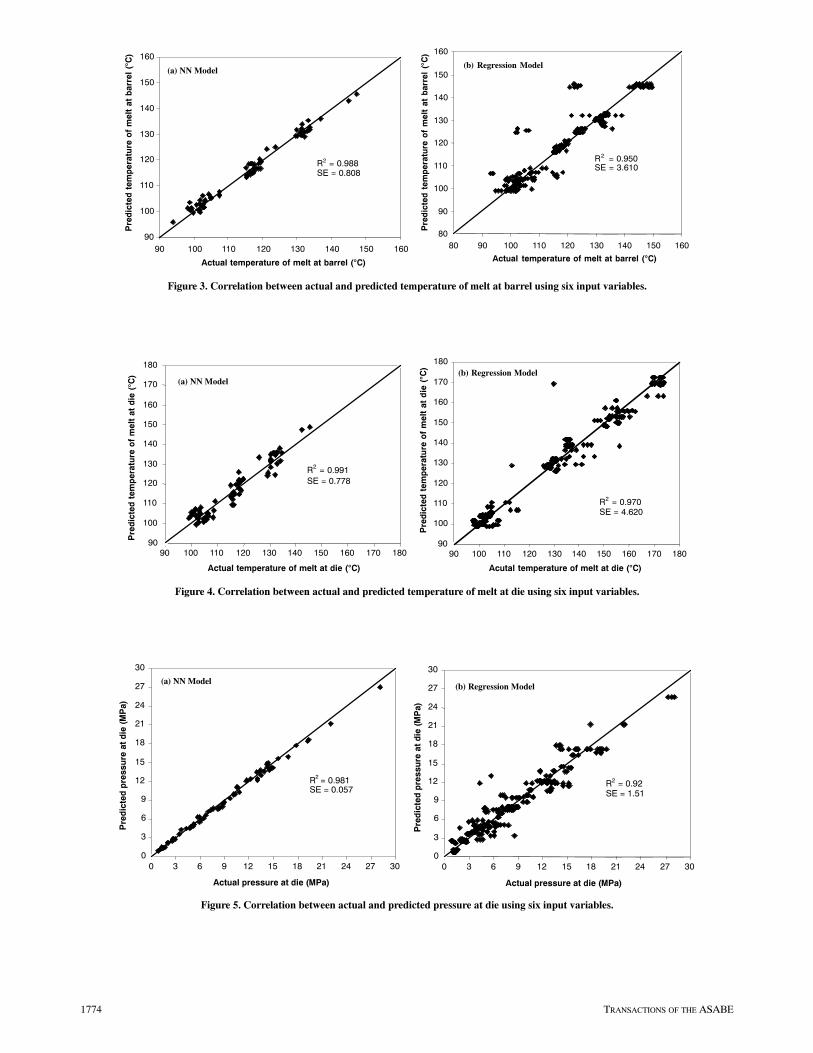
The relationship between the measured and predictedvalues for each of the extrusion processing parameters usingsix input variables (which were deemed to produce the bestperformance) and data collected from the two experimentsets are given in figures 2 to 8. In general, the NN modelspredicted the extrusion processing parameters with a highdegree of accuracy and exhibited very low variation. In fact,the CV values between the actual and predicted values werenearly 1%. On the other hand, even though the R2 valuesbetween the predicted and measured values were fairly highfor each parameter, there was a wide deviation between theactual and predicted values using multiple linear regressionmodels. This can be clearly seen by the deviation of the datapoints in each graph. In fact, the CV values between themeasured and predicted values were in the range of 3.0% to24.1% for the regression models using six input variables.The regression models, however, predicted the mass flowrate, temperature of melt inside the barrel, die, and absolutepressure with fairly good R2 values, and the CV valuesbetween the measured and predicted values for theseparameters were comparatively low. This might be due to thelower degree of interaction between the ingredientcomponents, such as starch, protein, fat, fiber, and ashcontent, with machine parameters such as screw speed,temperature gradient in the barrel, and die dimensions.
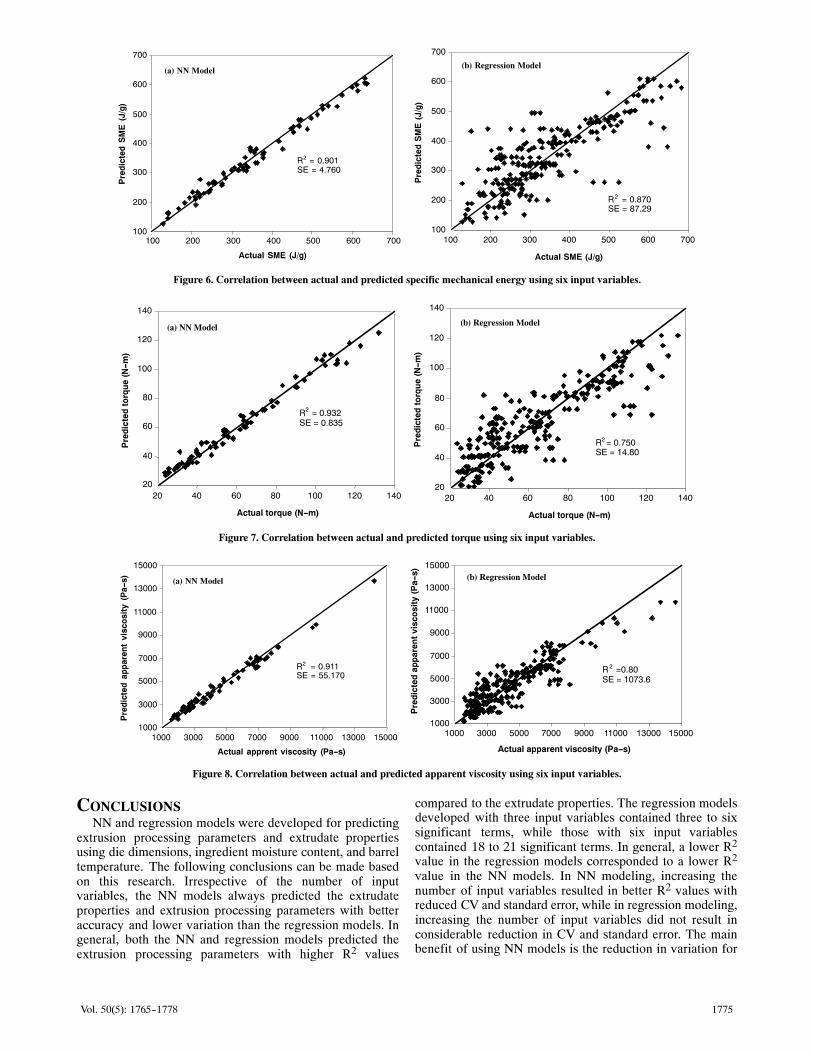
However, the CV values between the measured andpredicted values for SME, torque, and apparent viscositywere high. This might have been due to the higher degree ofinteraction between the ingredient components, such asstarch, protein, fat, fiber, and ash content, with the machineparameters such as screw speed, temperature gradient in thebarrel, and die dimensions. Additionally, the same data wereused in developing both types of models. However, based onthe performance of the models, smaller differences betweenthe actual (measured) values and predicted values wereobserved with the NN models, whereas larger differencesbetween the actual and predicted values were observed withthe regression models. This was probably due to the rigidmathematical functions used in the regression models. In thecase of the NN models, on the other hand, the type oftopology used, in combination with the learningmethodology, resulted in more accurate prediction ofparameters. Specific mechanical energy and apparentviscosity were derived quantities from other parameters, andhence the higher CV between the actual and predicted valueswas expected.
Most of the predicted SME values for the regressionmodels at the lower end of the SME range (100 to 400 J/g)were higher than actual, while at the higher end of the SMErange (400 to 700 J/g), most of the predicted values werefound to be lower than actual (fig. 6). The same trend wasobserved for torque and apparent viscosity. Most of thepredicted torque values were high for the measured torquesvalues between 20 and 80 N‐m, but most of the predictedtorque values were found to be low for the measured torquevalues between 80 to 140 N‐m (fig. 7). In the case of apparentviscosity, a wide variation between the measured andpredicted values was observed. Most of the predictedapparent viscosity for the measured apparent viscosity above8000 Pa‐s was found to be lower (fig. 8). Overall, these resultsshow that the NN models developed using six input variablesresulted in a drastic reduction in the variation of parameterprediction compared to the multiple linear regressionmodels. Many commercial NN software packages areavailable in the marketplace, and these are becomingcommonly used in many applications, including engineeringsystems, medicine, and business forecasting, to name a few.
(a) NN Model
70
90
110
130
150
170
190
210
70 90 110 130 150 170 190 210Actual mass flow rate (g/min)
Pre
dict
ed m
ass
flow
rat
e (g
/min
)
R2= 0.974SE = 0.851
(b) Regression Model
70
90
110
130
150
170
190
210
70 90 110 130 150 170 190 210
Actual mass flow rate (g/min)
Pre
dict
ed m
ass
flow
rat
e (g
/min
)
R2 = 0.870SE = 14.480
Figure 2. Correlation between actual and predicted mass flow rate using six input variables.
1774 TRANSACTIONS OF THE ASABE
(a) NN Model
90
100
110
120
130
140
150
160
90 100 110 120 130 140 150 160
Actual temperature of melt at barrel (�C)
Pre
dict
ed t
empe
ratu
re o
f m
elt
at b
arre
l (�
C)
R2 = 0.988SE = 0.808
(b) Regression Model
80
90
100
110
120
130
140
150
160
80 90 100 110 120 130 140 150 160
Actual temperature of melt at barrel (�C)
Pre
dict
ed t
empe
ratu
re o
f m
elt
at b
arre
l (�
C)
R = 0.9502
SE = 3.610
Figure 3. Correlation between actual and predicted temperature of melt at barrel using six input variables.
(a) NN Model
90
100
110
120
130
140
150
160
170
180
90 100 110 120 130 140 150 160 170 180
Actual temperature of melt at die (�C)
Pre
dict
ed t
empe
ratu
re o
f m
elt
at d
ie (�C
)
R2 = 0.991SE = 0.778
(b) Regression Model
90
100
110
120
130
140
150
160
170
180
90 100 110 120 130 140 150 160 170 180
Acutal temperature of melt at die (�C)
Pre
dict
ed t
empe
ratu
re o
f m
elt
at d
ie (�C
)
R2 = 0.970SE = 4.620
Figure 4. Correlation between actual and predicted temperature of melt at die using six input variables.
(a) NN Model
0
3
6
9
12
15
18
21
24
27
30
0 3 6 9 12 15 18 21 24 27 30
Actual pressure at die (MPa)
Pre
dict
ed p
ress
ure
at d
ie (
MP
a)
R2 = 0.981SE = 0.057
(b) Regression Model
0
3
6
9
12
15
18
21
24
27
30
0 3 6 9 12 15 18 21 24 27 30
Actual pressure at die (MPa)
Pre
dict
ed p
ress
ure
at d
ie (
MP
a)
R2 = 0.92SE = 1.51
Figure 5. Correlation between actual and predicted pressure at die using six input variables.
1775Vol. 50(5): 1765-1778
(a) NN Model
100
200
300
400
500
600
700
100 200 300 400 500 600 700
Actual SME (J/g)
Pre
dict
ed S
ME
(J/
g)
R2 = 0.901SE = 4.760
(b) Regression Model
100
200
300
400
500
600
700
100 200 300 400 500 600 700
Actual SME (J/g)
Pre
dict
ed S
ME
(J/
g)
R = 0.8702
SE = 87.29
Figure 6. Correlation between actual and predicted specific mechanical energy using six input variables.
(a) NN Model
20
40
60
80
100
120
140
20 40 60 80 100 120 140
Actual torque (N-m)
Pre
dict
ed t
orqu
e (N
-m)
R2 = 0.932SE = 0.835
(b) Regression Model
20
40
60
80
100
120
140
20 40 60 80 100 120 140
Actual torque (N-m)
Pre
dict
ed t
orqu
e (N
-m)
R2 = 0.750SE = 14.80
Figure 7. Correlation between actual and predicted torque using six input variables.
(a) NN Model
1000
3000
5000
7000
9000
11000
13000
15000
1000 3000 5000 7000 9000 11000 13000 15000
Actual apprent viscosity (Pa-s)
Pre
dict
ed a
ppar
ent
visc
osit
y (P
a-s)
R = 0.9112
SE = 55.170
(b) Regression Model
1000
3000
5000
7000
9000
11000
13000
15000
1000 3000 5000 7000 9000 11000 13000 15000
Actual apparent viscosity (Pa-s)
Pre
dict
ed a
ppar
ent
visc
osit
y (P
a-s)
R =0.802
SE = 1073.6
Figure 8. Correlation between actual and predicted apparent viscosity using six input variables.
CONCLUSIONSNN and regression models were developed for predicting
extrusion processing parameters and extrudate propertiesusing die dimensions, ingredient moisture content, and barreltemperature. The following conclusions can be made basedon this research. Irrespective of the number of inputvariables, the NN models always predicted the extrudateproperties and extrusion processing parameters with betteraccuracy and lower variation than the regression models. Ingeneral, both the NN and regression models predicted theextrusion processing parameters with higher R2 values
compared to the extrudate properties. The regression modelsdeveloped with three input variables contained three to sixsignificant terms, while those with six input variablescontained 18 to 21 significant terms. In general, a lower R2
value in the regression models corresponded to a lower R2
value in the NN models. In NN modeling, increasing thenumber of input variables resulted in better R2 values withreduced CV and standard error, while in regression modeling,increasing the number of input variables did not result inconsiderable reduction in CV and standard error. The mainbenefit of using NN models is the reduction in variation for
1776 TRANSACTIONS OF THE ASABE
parameter prediction. The advantage of reducing variationby increasing the number of data points, by combining theresults of two independent experiments, and the ease ofdeveloping NN models illustrates the potential for this typeof modeling in extrusion processing.
ACKNOWLEDGEMENTSWe gratefully acknowledge the financial support provided
by the South Dakota State University AgriculturalExperiment Station and the USDA‐ARS North CentralAgricultural Research Laboratory, Brookings, South Dakota.
REFERENCESASAE. 1996. ASAE Standards, Engineering Practices, and Data.
St. Joseph, Mich.: ASAE.Barres, C., B. Vergnes, and J. Tayeb. 1991. An improved thermal
model for the solid conveying section of a twin‐screw extrusioncooker. J. Food Eng. 15(3): 167‐185.
Batchelor, W. D., X. B. Yang, and A. T. Tschanz. 1997.Development of a neural network for soybean rust epidemics.Trans. ASAE 40(1): 247‐252.
Bochereau, L., P. Bourgine, and B. Palagos. 1991. A model forprediction by combining data analysis and neural networks:Applications to prediction of apple quality using near‐infraredspectra. J. Agric. Eng. Res. 51(3): 207‐216.
Boillereaux, L., C. Cadet, and A. L. Bail. 2003. Thermal propertiesestimation during thawing via real‐time neural network learning.J. Food Eng. 57(1): 17‐23.
Box, G. E. P., and R. D. Norman. 1987. Empirical Model Buildingand Response Surfaces. New York, N.Y.: John Wiley and Sons.
Bruin, S., D. J. V. Zuilichem, and W. Stolp. 1987. A review offundamental and engineering aspects of extrusion ofbiopolymers in a single‐screw extruder. J. Food Process Eng.2(1): 1‐37.
Chevanan, N., K. A. Rosentrater, and K. Muthukumarappan. 2005a.Physical properties of extruded tilapia feed with distillers driedgrains with solubles. ASABE Paper No. 056169. St. Joseph.,Mich.: ASABE.
Chevanan, N., K. A. Rosentrater, and K. Muthukumarappan.2005b. Effect of whey protein as a binder during extrusion offish feed. ASABE Paper No. SD05100. St. Joseph., Mich.:ASABE.
Chevanan, N., K. A. Rosentrater, and K. Muthukumarappan. 2006.Modeling extrusion processing of aquaculture feedincorporating distillers grains. ASABE Paper No. 066129. St.Joseph., Mich.: ASABE.
Chevanan, N., K. Muthukumarappan, K. A. Rosentrater, and J. L.Julson. 2007. Effect of die dimensions on extrusion processingparameters and properties of DDGS‐based aquaculture feed.Cereal Chem. (in press).
Della Valle, G., C. Barres, J. Plewa, J. Tayeb, and B. Vergnes. 1993.Computer simulation of starchy products transformation bytwin‐screw extrusion. J. Food Eng. 19(1): 1‐13.
Eerikainen, T., and P. Linko. 1989. Extrusion cooking modeling,control, and optimization. In Extrusion Cooking, 157‐204. C.Mercier, P. Linko, and J. M. Harper, eds. St. Paul, Minn.:AACC.
Frazier, P. J., A. Crawshaw, N. W. R. Daniels, and P. W. R. Eggitt.1982. Optimization of processing variables in extrusioncooking. In Proc. 7th World Cereal and Bread Congress,885‐889. Amsterdam, The Netherlands: Elsevier.
Ganjyal, G., M. A. Hanna, P. Supprung, A. Noomhorm, and D.Jones. 2006. Modeling selected properties of extruded rice flourand rice starch by neural network and statistics. Cereal Chem.83(3): 223‐227.
Goncalves, E. C., L. A. Minim, J. S. D. Coimbra, and V. P. R.Minim. 2006. Thermal process calculation using artificial neuralnetworks and other traditional methods. J. Food Process Eng.29(2): 162‐173.
Harper, J. M. 1981. Extrusion of Foods (vol. 1 and 2). Boca Raton,Fla.: CRC Press.
Himadri, K. D., M. H. Tapani, O. M. Myllymaki, and Y. Malkki.1993. Effects of formulation and processing variables on dryfish feed pellets containing fish waste. J. Sci. Food Agric. 61(2):181‐187.
Jager, T., D. J. V. Zuilichem, J. G. D. Swart, and K. V. Riet. 1991.Residence time distributions in extrusion‐cooking: Part 7.Modeling of a co‐rotating, twin‐screw extruder fed with maizegirts. J. Food Eng. 14(3): 203‐239.
Jamin, F. F., and R. A. Flores. 1998. Effect of separation andgrinding of corn dry‐milled streams on physical properties ofsingle‐screw low‐speed extruded products. Cereal Chem. 75(6):775‐779.
Jones, D., R. Chinnaswamy, Y. Tan, and M. A. Hanna. 2000.Physiochemcial properties of ready‐to‐eat breakfast cereals.Cereal Foods World 45(4): 164‐168.
Kirby, A. R., A. L. Ollett, R. Parker, and A. C. Smith. 1988. Anexperimental study of screw configuration effects in thetwin‐screw extrusion cooking of maize grits. J. Food Eng. 8(4):247‐252.
Konkoly, A. M. 1997. Rheological characterization of commerciallyavailable cream cheese and physical properties of corn andpeanut composite flour extrudates. MS thesis. Ames, Iowa: IowaState University.
Lam, C. D., and R. A. Flores. 2003. Effect of particle size and moisturecontent on viscosity of fish feed. Cereal Chem. 80(1): 20‐24.
Levine, L., and J. Rockwood. 1985. Simplified models forestimating isothermal operating characteristics of food extruders.Biotech. Progress 1(3): 189‐199.
Levine, L., S. Symes, and J. Weimer. 1987. A simulation of theeffects of formula variations on the transient output ofsingle‐screw food extruders. Biotech. Progress 3(4): 212‐219.
Li, Y., and F. Hsieh. 1994. New melt conveying models for asingle‐screw extruder. J. Food Process Eng. 17(3): 299‐324.
Li, Y., H. E. Huff, and F. Hsieh. 1997. Flow modeling of a powerlaw fluid in a fully wiped, co‐rotating twin‐screw extruder. J.Food Process Eng. 20(2): 141‐163.
Linko, P., Y. H. Zhu, and S. Linko. 1992. Application of neuralnetwork modeling in fuzzy extrusion control. Trans. IChemE C:Food and Bioproducts Processing 70(3): 131‐137.
Lo, T. L., and R. G. Moreira. 1996. Product quality modeling oftwin‐screw extrusion process. Paper No. 80A‐21. Chicago, Ill.:Institute of Food Technologists.
Martelli, F. G. 1983. Twin‐screw Extruders: A Basic Understanding.New York, N.Y.: Van Nostrand Reinhold.
Mehrotra, K., C. K. Mohan., and S. Ranka. 1997. Elements ofArtificial Neural Networks. Cambridge, Mass.: MIT Press.
Mueser, F., and L. B. Van. 1987. System and analytical model forthe extrusion of starches. In Thermal Processing and Quality ofFoods, 175‐179. P. Zeuthen, J. C. Cheftel, C. Ericson, M. Jul, H.Leniger, P. Linko, G. Varela, and G. Vos, eds. New York, N.Y.:Elsevier Applied Science.
Mohamed, I. O., R. Y. Ofoli, and R. G. Morgan. 1990. Modelingthe average shear rate in a co‐rotating twin‐screw extruder. J.Food Process Eng. 12(3): 227‐246.
Moysey, P. A., and M. R. Thompson. 2005. Modelling the solidsinflow and solids conveying of single‐screw extruders using thediscrete element method. Powder Tech. 153(2): 95‐107.
Neter, J., W. Wasserman, and M. H. Kutner. 1990. Applied LinearStatistical Models. Burr Ridge, Ill.: Irwin.
Olkku, J., A. Hagqvist, and P. Linko. 1982. Response surfacemethodology in steady‐state modeling of HTST extrusioncooking. In Proc. 7th World Cereal and Bread Congress,879‐884. Amsterdam, The Netherlands: Elsevier.
1777Vol. 50(5): 1765-1778
Rogers, M. G. 1970. Rheological interpretation of BrabenderPlati‐Corder (extruder head) data. Ind. Eng. Chem. ProcessDesign Devel. 9(1): 49‐52.
Rosentrater, K. A., T. L. Richard, C. J. Bern, and R. A. Flores. 2005.Small‐scale extrusion of corn masa byproducts. Cereal Chem.82(4): 436‐446.
Sokhey, A. S., Y. Ali, and M. Y. Hanne. 1997. Effect of die dimensionson extruder performance. J. Food Eng. 31(2): 251‐261.
Tayeb, J., B. Vergnes, and G. Dallevalle. 1989. A basic model for atwin‐screw extruder. J. Food Sci. 54(4): 1047‐1056.
Torrecilla, J. S., L. Otero, and P. D. Sanz. 2004. A neural networkapproach for thermal/pressure food processing. J. Food. Eng.62(1): 89‐95.
Torrecilla, J. S., L. Otero, and P. D. Sanz. 2005. Artificial neuralnetworks: A promising tool to design and optimizehigh‐pressure food processes. J. Food. Eng. 69(3): 299‐306.
USDA. 1999. Practical procedures for grain handlers: Inspectinggrain. Washington, D.C.: USDA Grain Inspection, Packers, and
Stockyards Administration. Available at: http://151.121.3.117/pubs/primer.pdf. Accessed 1 December 2006.
Vainionpaa, J. 1991. Modeling of extrusion cooking of cerealsusing response surface methodology. J. Food Eng. 13(1): 1‐26.
Vainionpaa, J. 1995. Numerical solution of response surfaceequations for extrusion cooked cereals. J. Food Eng. 24(2):181‐196.
Vergnes, B., C. Barres, and J. Tayeb. 1992. Computation ofresidence time and energy distributions in the reverse screwelements of a twin‐screw extruder cooker. J. Food Eng. 16(3):215‐237.
Yacu, M. A. 1985. Modeling a twin‐screw co‐rotating extruder. J.Food Process Eng. 8(1): 1‐21.
Zuilichem, D. J. V., G. J. V. Rockrel, W. Stolp, and K. V. Riet. 1990.Modeling of the enzymatic conversion of cracked corn bytwin‐screw extrusion cooking. J. Food Eng. 12(1): 13‐28.
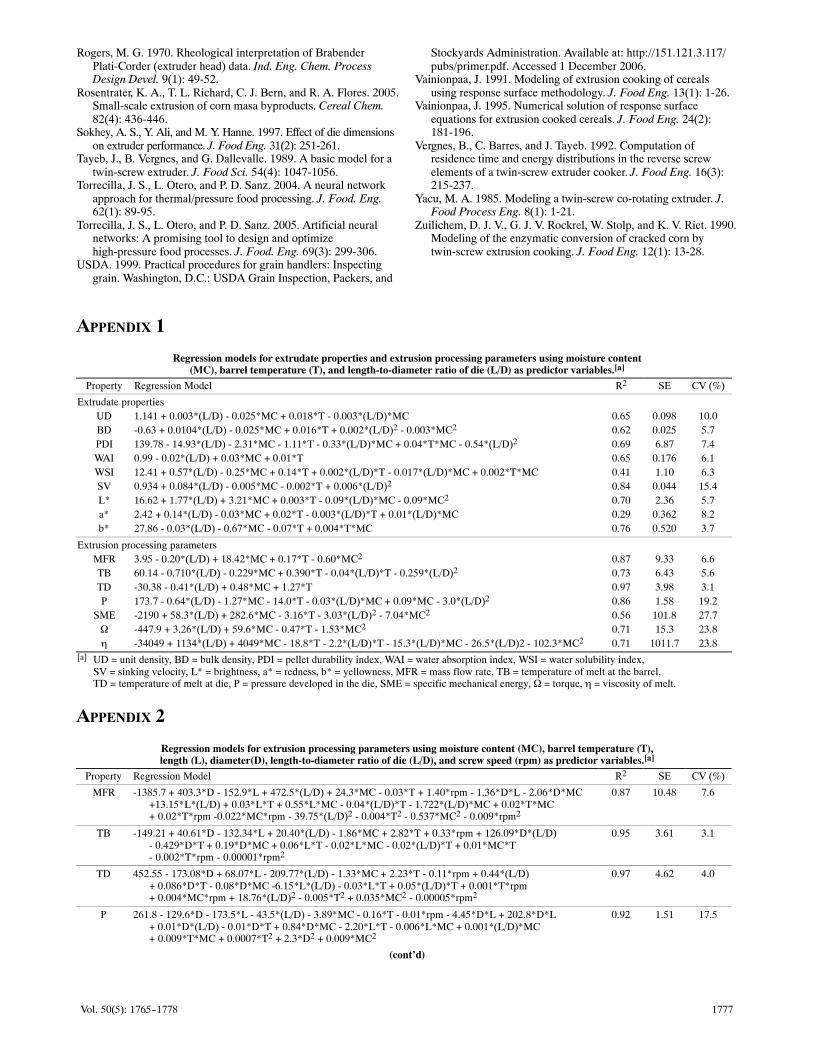
APPENDIX 1
Regression models for extrudate properties and extrusion processing parameters using moisture content(MC), barrel temperature (T), and length‐to‐diameter ratio of die (L/D) as predictor variables.[a]
Property Regression Model R2 SE CV (%)
Extrudate propertiesUD 1.141 + 0.003*(L/D) ‐ 0.025*MC + 0.018*T ‐ 0.003*(L/D)*MC 0.65 0.098 10.0BD ‐0.63 + 0.0104*(L/D) ‐ 0.025*MC + 0.016*T + 0.002*(L/D)2 ‐ 0.003*MC2 0.62 0.025 5.7PDI 139.78 ‐ 14.93*(L/D) ‐ 2.31*MC ‐ 1.11*T ‐ 0.33*(L/D)*MC + 0.04*T*MC ‐ 0.54*(L/D)2 0.69 6.87 7.4WAI 0.99 ‐ 0.02*(L/D) + 0.03*MC + 0.01*T 0.65 0.176 6.1WSI 12.41 + 0.57*(L/D) ‐ 0.25*MC + 0.14*T + 0.002*(L/D)*T ‐ 0.017*(L/D)*MC + 0.002*T*MC 0.41 1.10 6.3SV 0.934 + 0.084*(L/D) ‐ 0.005*MC ‐ 0.002*T + 0.006*(L/D)2 0.84 0.044 15.4L* 16.62 + 1.77*(L/D) + 3.21*MC + 0.003*T ‐ 0.09*(L/D)*MC ‐ 0.09*MC2 0.70 2.36 5.7a* 2.42 + 0.14*(L/D) ‐ 0.03*MC + 0.02*T ‐ 0.003*(L/D)*T + 0.01*(L/D)*MC 0.29 0.362 8.2b* 27.86 ‐ 0.03*(L/D) ‐ 0.67*MC ‐ 0.07*T + 0.004*T*MC 0.76 0.520 3.7
Extrusion processing parametersMFR 3.95 ‐ 0.20*(L/D) + 18.42*MC + 0.17*T ‐ 0.60*MC2 0.87 9.33 6.6TB 60.14 ‐ 0.710*(L/D) ‐ 0.229*MC + 0.390*T ‐ 0.04*(L/D)*T ‐ 0.259*(L/D)2 0.73 6.43 5.6TD ‐30.38 ‐ 0.41*(L/D) + 0.48*MC + 1.27*T 0.97 3.98 3.1P 173.7 ‐ 0.64*(L/D) ‐ 1.27*MC ‐ 14.0*T ‐ 0.03*(L/D)*MC + 0.09*MC ‐ 3.0*(L/D)2 0.86 1.58 19.2
SME ‐2190 + 58.3*(L/D) + 282.6*MC ‐ 3.16*T ‐ 3.03*(L/D)2 ‐ 7.04*MC2 0.56 101.8 27.7Ω ‐447.9 + 3.26*(L/D) + 59.6*MC ‐ 0.47*T ‐ 1.53*MC2 0.71 15.3 23.8η ‐34049 + 1134*(L/D) + 4049*MC ‐ 18.8*T ‐ 2.2*(L/D)*T ‐ 15.3*(L/D)*MC ‐ 26.5*(L/D)2 ‐ 102.3*MC2 0.71 1011.7 23.8
[a] UD = unit density, BD = bulk density, PDI = pellet durability index, WAI = water absorption index, WSI = water solubility index, SV = sinking velocity, L* = brightness, a* = redness, b* = yellowness, MFR = mass flow rate, TB = temperature of melt at the barrel, TD = temperature of melt at die, P = pressure developed in the die, SME = specific mechanical energy, Ω = torque, η = viscosity of melt.
APPENDIX 2
Regression models for extrusion processing parameters using moisture content (MC), barrel temperature (T),length (L), diameter(D), length‐to‐diameter ratio of die (L/D), and screw speed (rpm) as predictor variables.[a]
Property Regression Model R2 SE CV (%)
MFR ‐1385.7 + 403.3*D ‐ 152.9*L + 472.5*(L/D) + 24.3*MC ‐ 0.03*T + 1.40*rpm ‐ 1.36*D*L ‐ 2.06*D*MC +13.15*L*(L/D) + 0.03*L*T + 0.55*L*MC ‐ 0.04*(L/D)*T ‐ 1.722*(L/D)*MC + 0.02*T*MC + 0.02*T*rpm ‐0.022*MC*rpm ‐ 39.75*(L/D)2 ‐ 0.004*T2 ‐ 0.537*MC2 ‐ 0.009*rpm2
0.87 10.48 7.6
TB ‐149.21 + 40.61*D ‐ 132.34*L + 20.40*(L/D) ‐ 1.86*MC + 2.82*T + 0.33*rpm + 126.09*D*(L/D) ‐ 0.429*D*T + 0.19*D*MC + 0.06*L*T ‐ 0.02*L*MC ‐ 0.02*(L/D)*T + 0.01*MC*T ‐ 0.002*T*rpm ‐ 0.00001*rpm2
0.95 3.61 3.1
TD 452.55 ‐ 173.08*D + 68.07*L ‐ 209.77*(L/D) ‐ 1.33*MC + 2.23*T ‐ 0.11*rpm + 0.44*(L/D) + 0.086*D*T ‐ 0.08*D*MC ‐6.15*L*(L/D) ‐ 0.03*L*T + 0.05*(L/D)*T + 0.001*T*rpm + 0.004*MC*rpm + 18.76*(L/D)2 ‐ 0.005*T2 + 0.035*MC2 ‐ 0.00005*rpm2
0.97 4.62 4.0
P 261.8 ‐ 129.6*D ‐ 173.5*L ‐ 43.5*(L/D) ‐ 3.89*MC ‐ 0.16*T ‐ 0.01*rpm ‐ 4.45*D*L + 202.8*D*L + 0.01*D*(L/D) ‐ 0.01*D*T + 0.84*D*MC ‐ 2.20*L*T ‐ 0.006*L*MC + 0.001*(L/D)*MC + 0.009*T*MC + 0.0007*T2 + 2.3*D2 + 0.009*MC2
0.92 1.51 17.5
(cont'd)

1778 TRANSACTIONS OF THE ASABE
(cont'd) Regression models for extrusion processing parameters using moisture content (MC), barrel temperature (T),length (L), diameter(D), length‐to‐diameter ratio of die (L/D), and screw speed (rpm) as predictor variables.[a]
Property Regression Model R2 SE CV (%)
SME ‐2880.3 + 323.7*D ‐ 4452.5*L + 903.1*(L/D) + 223.2*MC + 10.66*T ‐ 6.40*rpm + 4162.5*D*(L/D) ‐ 2.63*D*T + 17.17*D*MC + 0.78*L*T ‐ 5.23*L*MC ‐ 2.51*(L/D)*T + 13.73*(L/D)*MC + 0.01*T*rpm + 0.17*MC*rpm + 6.59*L2 ‐ 56.67*(L/D)2 ‐ 0.03*T2 ‐ 7.15*MC2 + 0.004*rpm2
0.87 87.29 24.5
Ω 912.99 ‐ 514.34*D ‐ 2316.8*L ‐ 130.6*(L/D) + 56.61*MC ‐ 0.75*T ‐ 1.63*rpm + 2363.0*D*(L/D) + 0.08*D*T + 1.20*D*MC ‐ 0.41*L*MC + 0.78*(L/D)*MC + 0.01*T2 + 0.036*MC2 + 40.14*D2 ‐ 0.005*T2 ‐ 1.55*MC2 + 0.0001*rpm2
0.75 14.80 24.0
η 102733 ‐ 44731*D ‐ 202332*L ‐ 11419*(L/D) + 34521*MC ‐ 146.3*T ‐ 286.6*rpm + 206425*D*(L/D) + 6.0*D*T + 56.05*(L/D)*MC + 2.01*T*MC + 1.01*T*rpm + 3.08*MC*rpm + 3479.2*D2 ‐ 0.346*T2 ‐ 107.39*MC2 + 0.08*rpm2
0.80 1073.6 23.1
[a] MFR = mass flow rate, TB = temperature of melt at the barrel, TD = temperature of the melt at the die, P = absolute pressure, SME = specific mechanical energy, Ω = torque, η = apparent viscosity.