Neighbourhood analysis in the savanna palm Borassus aethiopum: interplay of intraspecific...
10
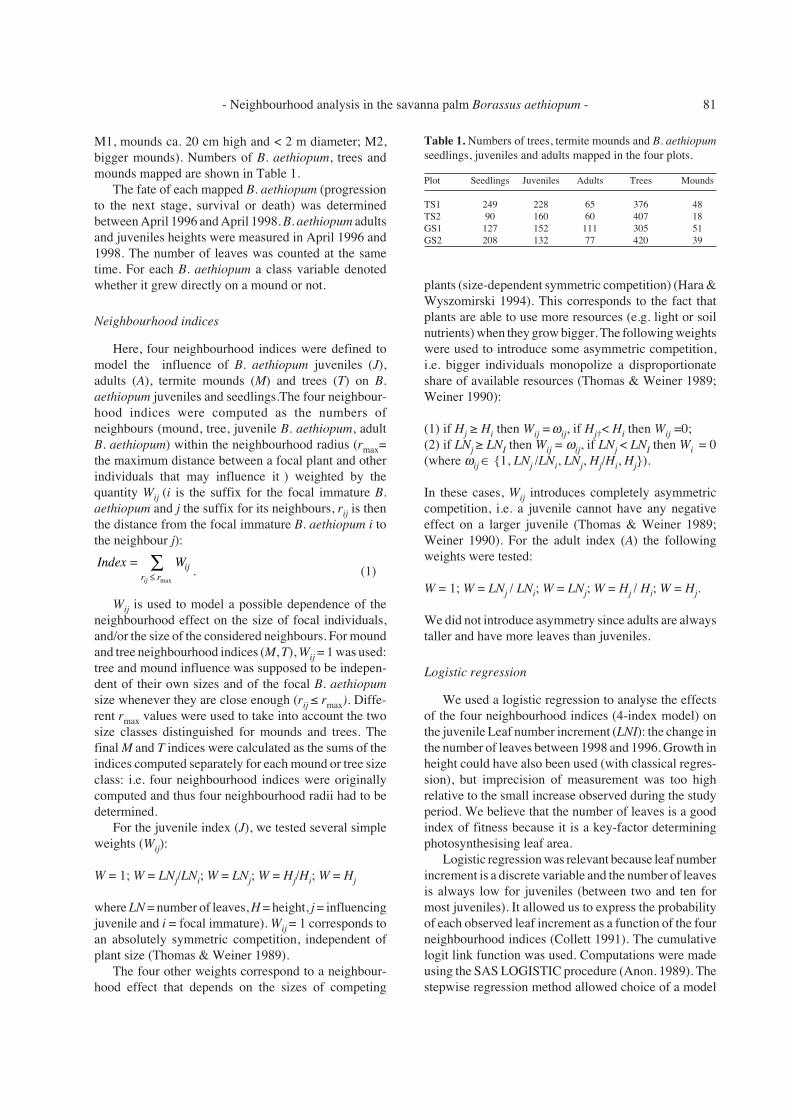
79 Abstract. A previous study of the spatial patterns of Borassus aethiopum (a humid savanna palm tree) led to the following predictions: H1. Trees and termite mounds positively influence all developmental stages; H2. There is intense competition between B. aethiopum juveniles; H3. Juvenile and seedling survival and growth rates are higher away from mother plants; H4. Mound positive effect overwhelms the effect of intra- specific competition for very young B. aethiopum individuals, the reverse applies to older, non-reproductive individuals. To test for these hypotheses the potential positive and negative neighbourhood effects were analysed. Progression of seedlings into the juvenile stage and juvenile growth were analysed through logistic regression models including the effects of four neighbourhood indices designed to model the respective influence of B. aethiopum juveniles and adults, trees and termite mounds. Statistical results explain the observed spatial pattern and reveal two main neighbourhood effects that influence both B. aethiopum juveniles and seedlings: a positive effect of mounds due to the fact that they constitute nutrient- rich soil patches, and a negative effect of juveniles due to intraspecific competition. Seedlings would be mostly affected by the mound positive effect, whereas juveniles would be mostly affected by competition. Keywords: Facilitation; Leaf number increment; Neigh- bourhood effect; Progression; Seedling; Spatial pattern; Soil heterogeneity; West Africa. Abbreviations: EL-seedling = Entire-leafed seedling; H = Height. LN = Leaf number, LNI = leaf number increment, PFI = Practical fit index; SL-seedling = Slit-leafed seedling Neighbourhood analysis in the savanna palm Borassus aethiopum: interplay of intraspecific competition and soil patchiness Barot, Sébastien 1* & Gignoux, Jacques 2 1 Present address: LEST, IRD, 32 Avenue de Varagnat, 93143 Bondy Cedex, France; 2 Fonctionnement et Evolution des Systèmes Ecologiques, ENS, 46 rue d’Ulm, 75230 PARIS Cedex 05, France; * Corresponding author; E-mail [email protected] Introduction The sessile nature of terrestrial plants ensures that interactions between plants and between plants and their environment are local (Pacala & Silander 1985; Tilman 1994; Lehman & Tilman 1997). Therefore, the place where a seed germinates is of paramount importance for its probability of surviving and becoming adult. The neighbourhood of an individual plant greatly influences its growth (Firbank & Watkinson 1987; Thomas & Weiner 1989), survival (Aguilera & Lauenroth 1993; Condit et al. 1994) and reproduction (Weiner 1982; Silander & Stephen 1985). Neighbourhood suitability is determined by intrinsic soil quality (e.g. nutrients and water-holding capacity) and is further modified by other plants that may have negative effects (competition for light, water and soil nutrients) or positive effects (soil quality improvement through litter incorporation, micro- climate improvement) (Holmgren et al. 1996). Therefore, the neighbourhood of a plant must be described by quantitative assessment of both positive and negative neighbourhood effects and our main goal is to disentangle such effects in a particular field case. A relatively easy way to detect neighbourhood effects is to analyse plant spatial patterns: if a spatial distribu- tion deviates from a purely random distribution, a neighbourhood effect can be hypothesized. A previous comprehensive study of the spatial distribution of Boras- sus aethiopum (a savanna palm tree) detected several deviations from spatial randomness (Barot et al. 1999a): 1. Seedlings, juveniles and adults are associated with termite mounds and tree clumps; 2. Seedlings and juveniles are aggregated whereas adults are randomly distributed; 3. Seedlings are strongly associated with female B. aethiopum (the species is dioecious) but this is not the case for juveniles; 4. There is a discrepancy between the locations of non-reproductive individuals (seedlings and juveniles) and adults, i.e. seedlings and juveniles grow directly on mounds, while adults generally grow off mounds but remain spatially associated to them. Journal of Vegetation Science 14: 79-88, 2003 © IAVS; Opulus Press Uppsala.
-
Upload
independent -
Category
Documents
-
view
2 -
download
0
Transcript of Neighbourhood analysis in the savanna palm Borassus aethiopum: interplay of intraspecific...
- Neighbourhood analysis in the savanna palm Borassus aethiopum - 79
Abstract. A previous study of the spatial patterns of Borassusaethiopum (a humid savanna palm tree) led to the followingpredictions: H1. Trees and termite mounds positively influenceall developmental stages; H2. There is intense competitionbetween B. aethiopum juveniles; H3. Juvenile and seedlingsurvival and growth rates are higher away from mother plants;H4. Mound positive effect overwhelms the effect of intra-specific competition for very young B. aethiopum individuals,the reverse applies to older, non-reproductive individuals. Totest for these hypotheses the potential positive and negativeneighbourhood effects were analysed. Progression of seedlingsinto the juvenile stage and juvenile growth were analysedthrough logistic regression models including the effects offour neighbourhood indices designed to model the respectiveinfluence of B. aethiopum juveniles and adults, trees andtermite mounds. Statistical results explain the observed spatialpattern and reveal two main neighbourhood effects thatinfluence both B. aethiopum juveniles and seedlings: a positiveeffect of mounds due to the fact that they constitute nutrient-rich soil patches, and a negative effect of juveniles due tointraspecific competition. Seedlings would be mostly affectedby the mound positive effect, whereas juveniles would bemostly affected by competition.
Keywords: Facilitation; Leaf number increment; Neigh-bourhood effect; Progression; Seedling; Spatial pattern; Soilheterogeneity; West Africa.
Abbreviations: EL-seedling = Entire-leafed seedling; H =Height. LN = Leaf number, LNI = leaf number increment, PFI= Practical fit index; SL-seedling = Slit-leafed seedling
Neighbourhood analysis in the savanna palm Borassus aethiopum:interplay of intraspecific competition and soil patchiness
Barot, Sébastien1* & Gignoux, Jacques2
1Present address: LEST, IRD, 32 Avenue de Varagnat, 93143 Bondy Cedex, France;2Fonctionnement et Evolution des Systèmes Ecologiques, ENS, 46 rue d’Ulm, 75230 PARIS Cedex 05, France;
*Corresponding author; E-mail [email protected]
Introduction
The sessile nature of terrestrial plants ensures thatinteractions between plants and between plants and theirenvironment are local (Pacala & Silander 1985; Tilman1994; Lehman & Tilman 1997). Therefore, the placewhere a seed germinates is of paramount importance forits probability of surviving and becoming adult. Theneighbourhood of an individual plant greatly influencesits growth (Firbank & Watkinson 1987; Thomas &Weiner 1989), survival (Aguilera & Lauenroth 1993;Condit et al. 1994) and reproduction (Weiner 1982;Silander & Stephen 1985). Neighbourhood suitability isdetermined by intrinsic soil quality (e.g. nutrients andwater-holding capacity) and is further modified by otherplants that may have negative effects (competition forlight, water and soil nutrients) or positive effects (soilquality improvement through litter incorporation, micro-climate improvement) (Holmgren et al. 1996). Therefore,the neighbourhood of a plant must be described byquantitative assessment of both positive and negativeneighbourhood effects and our main goal is to disentanglesuch effects in a particular field case.
A relatively easy way to detect neighbourhood effectsis to analyse plant spatial patterns: if a spatial distribu-tion deviates from a purely random distribution, aneighbourhood effect can be hypothesized. A previouscomprehensive study of the spatial distribution of Boras-sus aethiopum (a savanna palm tree) detected severaldeviations from spatial randomness (Barot et al. 1999a):1. Seedlings, juveniles and adults are associated withtermite mounds and tree clumps; 2. Seedlings and juvenilesare aggregated whereas adults are randomly distributed;3. Seedlings are strongly associated with female B.aethiopum (the species is dioecious) but this is not the casefor juveniles; 4. There is a discrepancy between the locationsof non-reproductive individuals (seedlings and juveniles)and adults, i.e. seedlings and juveniles grow directly onmounds, while adults generally grow off mounds but remainspatially associated to them.
Journal of Vegetation Science 14: 79-88, 2003© IAVS; Opulus Press Uppsala.

80 Barot, S. & Gignoux, J.
These results suggested a parsimonious set ofhypotheses about the neighbourhood effects driving B.aethiopum demography (Barot et al. 1999a). To buildthese hypotheses we used traditional assumptions:competition leads to regular spatial distributions (Pielou1962), and positive interactions lead to positive spatialassociations (Mott & McComb 1974). We also used theresults of independent studies which show that treeclumps and termite mounds constitute nutrient-rich soilpatches (Abbadie et al. 1992; Mordelet et al. 1993,1996). The set of hypotheses can be summarized asfollows: H1. Tree clumps and termite mounds positivelyinfluence all B. aethiopum stages, enhancing growthand survival rates as they are nutrient-rich patches: H2.There is intense competition between B. aethiopumjuveniles; H3. Seedling survival and growth rates are higheraway from their mother plants, probably due to competitionbetween juveniles and their mother (Barot et al. 1999b);H4. At a certain stage, the positive effects of mounds on B.aethiopum juveniles growing on them is outweighed by thenegative effect of intraspecific competition between thesehighly aggregated individuals.
We aim to test these hypotheses using growth anddemographic data. This is the only way to test hypothesesderived from purely static data. This is crucial becausemore studies detect deviations from spatial randomnessin natural plant communities (Sterner et al. 1986; Skarpe1991; Frelich & Graumlich 1994; Haase et al. 1997;Dovciak et al. 2001; Pélissier & Goreau 2001) than testfor underlying neighbourhood processes at the scale ofnatural stands (Condit et al. 1994; Stoll et al. 1994).Note that these two lists are not exhaustive but reflectthe real proportion of the two types of study. Moreover,many experimental studies directly prove the existenceof neighbourhood effects (Goldberg 1987; Aarsen &Epp 1990; Benjamin 1993; Bergelson 1993), either atthe individual scale or at the scale of experimentalstands, but few of them allow spatial patterns observedin natural plant communities to be linked to underlyingdynamic processes. This is mainly due to the fact thatalthough these experiments provide differences inneighbourhood quality, it is usually not known whetherindividuals in natural stands really experience differencesof such magnitudes.
We want to disentangle the effects of four features ofthe neighbourhood of immature B. aethiopum: otherimmature plants, adults, trees and termite mounds. Asfar as we know, this is the first time the neighbourhoodapproach has been applied to such a complex situation.It is also the first time this approach has been used todetect positive and negative effects simultaneously. Forthese reasons we used sophisticated statistical methods:1. We determine the neighbourhood radius of the fourneighbourhood indices at the same time; 2. We use a
multivariate approach, path analysis, to disentangle theeffects of the different neighbourhood indices and todetermine the relative direct and indirect effects of thesize of B. aethiopum individuals; 3. We use a randomi-zation approach for all statistical tests to avoid spuriousresults that might arise due to spatial auto-correlationand the interdependence of individuals belonging to thesame stand.
Material and Methods
Study site and study species
The study was conducted at the Lamto researchstation, Ivory Coast (6°13' N, 5°02' W) at the edge of therain forest domain (Menaut & César 1979). Savannavegetation is composed of grasses and small dicotyle-donous trees. Adult B. aethiopum form a third stratumabove the other two. Two main savanna types have beendefined, corresponding to two different soil types and todifferences in the dominant grass species (Menaut &César 1979): tree savanna on ferruginous soils and grasssavanna on hydromorphic soils. The soil is consideredto be particularly nutrient-poor but trees (which aregenerally aggregated in clumps) and low weatheredtermite mounds both constitute nutrient-rich patches(Abbadie et al. 1992; Mordelet et al. 1993). Thesemounds are present in every savanna type (between 8and 12 mound.ha–1) but represent a maximum of 9 % ofthe savanna surface (Abbadie et al. 1992). There is someevidence that these patches (mounds and tree clumps)are long-lived relative to B. aethiopum (Barot et al.1999a). B. aethiopum is a dioecious, tall, solitary palm.Four developmental stages were defined using leafmorphology and the onset of reproduction (Barot et al.2000): Entire-Leafed seedlings (EL-seedlings), Slit-Leafed seedlings (SL-seedlings), juveniles and adults.
Data collection
Four plots were mapped: 150 m ¥ 250 m (GS1) and250 m ¥ 200 m (GS2) in grass savanna, 200 m ¥ 200 m(TS1) and 128 m ¥ 250 m (TS2) in a tree savanna. Basicdata about B. aethiopum life history have been collectedin the same plots (Barot et al. 2000) and B. aethiopumspatial patterns were comprehensively analysed in thefour plots (Barot et al. 1999a). All B. aethiopum exceptEL-seedlings, all trees with woody parts > 1 yr old(recognizable by the presence of fire scars) and allmound tops were mapped within 50 m ¥ 50 m quadratswith an ultrasonic telemeter and a sighting compass.Trees and termite mounds were classified into two sizeclasses (T1, ca. 1 m tall, shrub-like trees; T2, trees > 1 m;
- Neighbourhood analysis in the savanna palm Borassus aethiopum - 81
M1, mounds ca. 20 cm high and < 2 m diameter; M2,bigger mounds). Numbers of B. aethiopum, trees andmounds mapped are shown in Table 1.
The fate of each mapped B. aethiopum (progressionto the next stage, survival or death) was determinedbetween April 1996 and April 1998. B. aethiopum adultsand juveniles heights were measured in April 1996 and1998. The number of leaves was counted at the sametime. For each B. aethiopum a class variable denotedwhether it grew directly on a mound or not.
Neighbourhood indices
Here, four neighbourhood indices were defined tomodel the influence of B. aethiopum juveniles (J),adults (A), termite mounds (M) and trees (T) on B.aethiopum juveniles and seedlings.The four neighbour-hood indices were computed as the numbers ofneighbours (mound, tree, juvenile B. aethiopum, adultB. aethiopum) within the neighbourhood radius (rmax=the maximum distance between a focal plant and otherindividuals that may influence it ) weighted by thequantity Wij (i is the suffix for the focal immature B.aethiopum and j the suffix for its neighbours, rij is thenthe distance from the focal immature B. aethiopum i tothe neighbour j):
Index Wijr rij
=£Â
max. (1)
Wij is used to model a possible dependence of theneighbourhood effect on the size of focal individuals,and/or the size of the considered neighbours. For moundand tree neighbourhood indices (M, T), Wij = 1 was used:tree and mound influence was supposed to be indepen-dent of their own sizes and of the focal B. aethiopumsize whenever they are close enough (rij ≤ rmax). Diffe-rent rmax values were used to take into account the twosize classes distinguished for mounds and trees. Thefinal M and T indices were calculated as the sums of theindices computed separately for each mound or tree sizeclass: i.e. four neighbourhood indices were originallycomputed and thus four neighbourhood radii had to bedetermined.
For the juvenile index (J), we tested several simpleweights (Wij):
W = 1; W = LNj/LNi; W = LNj; W = Hj/Hi; W = Hj
where LN = number of leaves, H = height, j = influencingjuvenile and i = focal immature). Wij = 1 corresponds toan absolutely symmetric competition, independent ofplant size (Thomas & Weiner 1989).
The four other weights correspond to a neighbour-hood effect that depends on the sizes of competing
plants (size-dependent symmetric competition) (Hara &Wyszomirski 1994). This corresponds to the fact thatplants are able to use more resources (e.g. light or soilnutrients) when they grow bigger. The following weightswere used to introduce some asymmetric competition,i.e. bigger individuals monopolize a disproportionateshare of available resources (Thomas & Weiner 1989;Weiner 1990):
(1) if Hj ≥ Hi then Wij = wij, if Hj†< Hi then Wij =0;(2) if LNj ≥ LNI then Wij = wij, if LNj < LNI then Wi = 0(where wij Œ {1, LNj /LNi, LNj, Hj/Hi, Hj}).
In these cases, Wij introduces completely asymmetriccompetition, i.e. a juvenile cannot have any negativeeffect on a larger juvenile (Thomas & Weiner 1989;Weiner 1990). For the adult index (A) the followingweights were tested:
W = 1; W = LNj / LNi; W = LNj; W = Hj / Hi; W = Hj.
We did not introduce asymmetry since adults are alwaystaller and have more leaves than juveniles.
Logistic regression
We used a logistic regression to analyse the effectsof the four neighbourhood indices (4-index model) onthe juvenile Leaf number increment (LNI): the change inthe number of leaves between 1998 and 1996. Growth inheight could have also been used (with classical regres-sion), but imprecision of measurement was too highrelative to the small increase observed during the studyperiod. We believe that the number of leaves is a goodindex of fitness because it is a key-factor determiningphotosynthesising leaf area.
Logistic regression was relevant because leaf numberincrement is a discrete variable and the number of leavesis always low for juveniles (between two and ten formost juveniles). It allowed us to express the probabilityof each observed leaf increment as a function of the fourneighbourhood indices (Collett 1991). The cumulativelogit link function was used. Computations were madeusing the SAS LOGISTIC procedure (Anon. 1989). Thestepwise regression method allowed choice of a model
Table 1. Numbers of trees, termite mounds and B. aethiopumseedlings, juveniles and adults mapped in the four plots.
Plot Seedlings Juveniles Adults Trees Mounds
TS1 249 228 65 376 48TS2 90 160 60 407 18GS1 127 152 111 305 51GS2 208 132 77 420 39

82 Barot, S. & Gignoux, J.
incorporating variables selected among the number ofleaves (LN), height (H) and the four neighbourhoodindices. It is obviously important to allow for an effectof height or the number of leaves since plant performancegenerally depends on their size (Stoll et al. 1994; Dun-can 1995). For each variable the raw variable, its squareand its logarithm were incorporated in the stepwiseprocess.
The neighbourhood radii rmax could not be determineda priori. For J and A indices, all integer values betweenone and 12 were tested. Preliminary results showed thatthese were the optimum values. For M and T wedetermined an rmax value for each size class (T1, T2 fortrees; M1, M2 for mounds). Consequently, 169 combi-nations were tested for each index
(rmax Π{0, 1, 2, ... , 11, 12}).
Thus 169 ¥ 169 ¥ 12 ¥ 12 combinations of neighbourhoodradii were tested. Values of rmax that yielded the small-est deviances were retained following earlier authorswho retained the neighbourhood radius that minimizesthe residual sum of square (Silander & Stephen 1985).Focal juveniles were chosen only in central parts of theplots, excluding those in a 12 m wide area around theplots to correct for any boundary effect (juveniles locatedin this area have neighbours that have not been mapped).To reduce the amount of computation the effect of eachindex was first analysed separately (1-index models).These preliminary analyses allowed for the selection ofthe best weight for each index, i.e. the ones that minimizedthe deviance. These weights were retained for the 4-index model.
Each juvenile was considered both as a focalindividual and as a neighbour of other juveniles. Spatialautocorrelation due to unmeasured sources of environ-mental heterogeneity (particularly soil heterogeneity) islikely (Legendre 1993). For these reasons observationscould not be considered as independent so that usual c2
tests were not reliable (Meagher & Burdick 1980; Tho-mas & Weiner 1989; Mitchell 1992). Therefore, arandomization approach was used (Manly 1991). Thenull hypothesis was that LNI are independent from thefour neighbourhood indices. For each randomization, andfor each neighbourhood index, each juvenile retained itsreal H, LN and LNI values, but was attributed the fourneighbourhood index values of another juvenile, as iftheir spatial locations were permuted. The statistic usedwas deviance (D); the probability (P) for the testsignificance was calculated as the proportion ofrandomizations resulting in a lower deviance than thedeviance calculated with the same model for the real data,1000 randomizations were always used.
The same method was used to study the progression
of SL-seedlings into the juvenile stage. The model didnot include the height (always 0) of SL-seedlings ortheir leaf number. After selection of the best model(determination of rmax values), randomization was usedto test the null hypothesis of the absence of influence ofSL-seedling neighbourhood on their progression to thejuvenile stage. Survival rates of juveniles and SL-seedlings were so high, and progression rate of juvenilesinto the adult stage so low, that there was no value intesting for a neighbourhood effect (unpubl.). Bothselection of the parameters and randomization wereimplemented using SAS.
A practical fit index (PFI) was used to comparequalitatively (without any test) models which may ormay not have the same degrees of freedom. It is computedas the difference between the deviances of the twocompared models divided by the deviance of the nullmodel (no effect tested). It allowed us to select amongdifferent models. Preliminary analyses involved logisticregressions where the effects of the four neighbourhoodindices were analysed separately (1-index model). ThePFI enabled us in particular to assess the improvementin the model goodness-of-fit resulting from the inclusionof the four neighbourhood indices in the same regres-sion (4-index model) or from the inclusion of moresophisticated weights (Wij). This selection process is notdetailed here, only the results of the finally selectedmodels are presented.
Path analysis: indirect effects of neighbourhoodindices on juvenile LNI
Following Stoll et al. (Stoll et al. 1994) a multivariateapproach, path analysis (Mitchell 1992), was used fortwo reasons: first, neighbourhood indices are correlated(results not presented) due to the spatial patterns of trees,seedling, juvenile and adult B. aethiopum that are spatiallyassociated (at various distances) to mounds (Barot et al.1999a), second, this approach takes into account a possibleindirect effect of the neighbourhood of a juvenile on itsLNI, by testing for the direct influence of theneighbourhood indices on H and LN. All calculationswere made using SAS CALIS procedure (Anon. 1989).
The path diagram (Fig. 1) is based on previousstudies of B. aethiopum and simple biological hypotheses.We did not analyse the direct causal links between theindices (double-headed arrows in Fig. 1) becauseavailable data were not sufficient to derive stronglyfounded hypotheses about these links. We tested for thedirect effect of the four neighbourhood indices, H, andLN on juvenile LNI (single-headed arrows in Fig. 2). Wealso incorporated indirect effects of the indices on LNIand direct effect of the indices on H and LN into themodel. Only the juvenile index had significant indirect

- Neighbourhood analysis in the savanna palm Borassus aethiopum - 83
effects in preliminary analyses and was kept in thepresented analysis. H should have had an effect on LN,and not the reverse as the two variables are stronglycorrelated. Height will determine the expected numberof leaves although the actual number is expected to varyconsiderably.
Indices were calculated with the set of rmax valuesthat minimized the deviance in the four neighbourhoodindices models (previous section). When an index hadno effect in a plot, we retained the neighbourhood radiiselected in another plot and that led to a significanteffect of the corresponding index.
Observations on juveniles are not independent. Weused a randomization approach to build a statistical test,as was done in a path analysis context by Mitchell-Olds(1987). Significant paths (V1ÆV2) (as indicated by t-tests) were re-tested through randomization tests. Thenull hypothesis was that the influencing variable (V1) ofthe considered path had no effect on the other (V2), sothat V1 values were randomly permuted among juveniles.A path was considered to be significant when less than 5% of the 1000 permutations led to higher t-values thanthe t-value calculated for the real data (one-tailed test).
Results
Occurrence of Borassus aethiopum on mounds
Percentage of non-reproductive B. aethiopum growingon termite mounds, classified according to their demo-graphic status, were compared through log likelihoodratio tests (Sokal & Rohlf 1981; Table 2). The four plotsdisplayed the same pattern: higher proportions of juveniles(A) than SL-seedlings (C) growing on mounds; higherproportions of newly recruited juveniles (B) than SL-seedlings (C) on mounds, higher proportions of SL-seedlings (C) than newly recruited SL-seedlings (D) onmounds. The (A/B) proportion difference was neversignificant. The (A/C), (B/C) and (C/D) proportiondifferences were significant in three, two and four plotsrespectively (Table 2). The significance of the (B/C)comparison is questionable because of the low numbersof new juveniles. However, the comparison is significantwhen individuals of the four plots are pooled.
Difference (C/D) suggests that SL-seedling survivalis higher on than off mounds. Differences (A/C) and (B/C) suggest that SL-seedlings are more likely to recruit tothe juvenile stage when they grow on mounds. Yet,juveniles are not more likely to survive when they growon mounds (no clear difference between the proportionof new juveniles and other juveniles that grow on mounds(A/B)).
SL-seedlings progression
The use of weights (Wij) introducing asymmetriccompetition did not improve the statistical models foreither J or A. We retained Wij =1 as weight (preliminaryanalyses using PFI). In the four plots, more than oneneighbourhood index had a significant effect in the 4-index model (Table 3). All significant effects on SL-seedlings progression were positive except for the effectof T in the tree savanna plots. J and M had a positive
Table 2. Percentages of non-reproductive Borassus aethiopum plants growing on termite mounds and classified according to theircurrent and former stage (2 years earlier). Absolute numbers of B. aethiopum are displayed in parentheses. The last columndisplays the pooled results for the individuals of the four plots. The differences in the proportions of individuals growing on andoff mounds were tested between the following pairs of lines: A/B, B/C, C/D and A/C. Results of these tests are displayed in thelower part of the table. * = P < 0.05, log likelihood ratio (G) statistic (Sokal & Rohlf 1981).
TS1 TS2 GS1 GS2 All plots
Juveniles (A) 59.2 (223) 77.9 (154) 88.2 (144) 49.5 (105) 68.8 (626)New Juveniles (B) 50.0 (22) 94.1 (17) 77.8 (9) 40.0 (15) 60.3 (63)SL-seedlings (C) 46.5(230) 68.1 (69) 32.4 (139) 26.1 (176) 39.9 (614)New SL-seedlings (D) 15.4 (104) 35.0 (20) 11.8 (17) 8.1 (37) 15.7 (178)
A/C * ns * * *A/B ns ns ns ns nsB/C ns * * ns *C/D * * * * *
Fig. 1 Path diagram for juvenile leaf number increment(LNI). Single-headed arrows reflect causal relationship.Double-headed arrows represent unanalysed correlations(correlations without causation). U1, U2, and U3 are errorvariables that measure the variability due to unmeasuredfactors of variability.
84 Barot, S. & Gignoux, J.
effect in four and two plots respectively. Indices with asignificant effect in 1-index models had also a significanteffect in the 4-index models, and vice versa (only twoexceptions). Incorporating the four indices in the samemodel little improved the explanation of SL-seedlingprogression. This is linked to the fact that the fourindices are correlated (results not shown).
Juvenile leaf increment
The 1-index model for juvenile LNI was slightlyimproved (preliminary analyses using PFI) when Wijexpressed asymmetry in the competition betweenjuveniles: for J we retained Wij =1 if Hj ≥ Hi and Wij = 0otherwise. For A, we kept Wij =1. These weights werealso used in the 4-index models. In the four plots morethan one neighbourhood index had a significant effect inthe 4-index models (Table 4). All neighbourhood effectson juvenile LNI were negative. A and M had a significant
negative effect in two plots each, J and T in three plotseach. Most neighbourhood effects pointed out in 1-index models were also significant in 4-index models.Yet, in two plots, a neighbourhood index had a significanteffect in the 1-index model that was no longer significantin the 4-index model: the four indices contain some ofthe same information about juvenile LNI and arecorrelated (correlation analysis not shown). LN had anegative effect on juvenile LNI in the four plots and Hhad a positive effect in three plots (Table 4).
Path analysis
Although standardized path coefficients for errorvariables were high (> 0.90 for U1, 0.33 - 0.75 for U2 and0.75 - 0.86 for U3), path models globally fitted the data.This is indicated by the goodness of fit indices whichwere > 0.95 in the four plots and by c2 tests for which P< 0.05 in all plots. In all cases, the randomization test
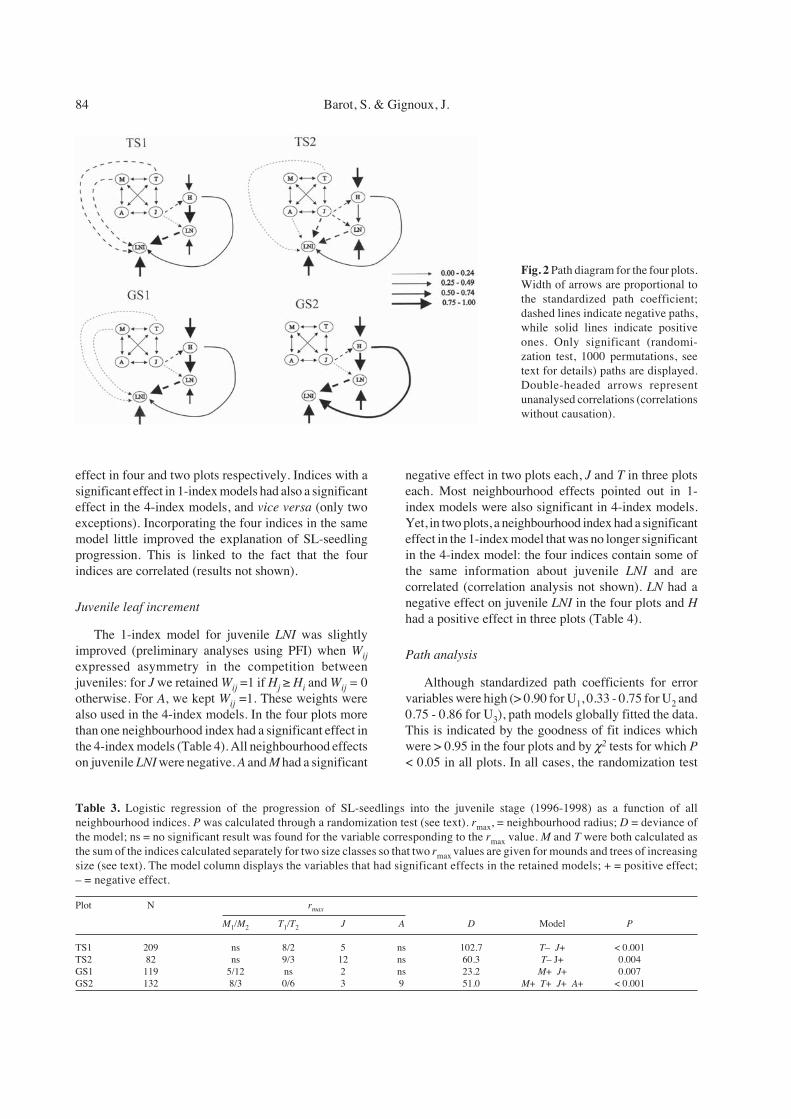
Fig. 2 Path diagram for the four plots.Width of arrows are proportional tothe standardized path coefficient;dashed lines indicate negative paths,while solid lines indicate positiveones. Only significant (randomi-zation test, 1000 permutations, seetext for details) paths are displayed.Double-headed arrows representunanalysed correlations (correlationswithout causation).
Table 3. Logistic regression of the progression of SL-seedlings into the juvenile stage (1996-1998) as a function of allneighbourhood indices. P was calculated through a randomization test (see text). rmax, = neighbourhood radius; D = deviance ofthe model; ns = no significant result was found for the variable corresponding to the rmax value. M and T were both calculated asthe sum of the indices calculated separately for two size classes so that two rmax values are given for mounds and trees of increasingsize (see text). The model column displays the variables that had significant effects in the retained models; + = positive effect;– = negative effect.
Plot N rmax
M1/M2 T1/T2 J A D Model P
TS1 209 ns 8/2 5 ns 102.7 T– J+ < 0.001TS2 82 ns 9/3 12 ns 60.3 T– J+ 0.004GS1 119 5/12 ns 2 ns 23.2 M+ J+ 0.007GS2 132 8/3 0/6 3 9 51.0 M+ T+ J+ A+ < 0.001
- Neighbourhood analysis in the savanna palm Borassus aethiopum - 85
supported the results of the raw path analyses, i.e. thesame paths were found to be significant.
In the four plots (Fig. 2) J had a significant negativeeffect on both H and LN; H had a positive effect on LNI,while LN had a negative effect on LNI; H had a positiveeffect on LN. Direct effects of neighbourhood indiceson LNI displayed a less consistent pattern across thefour plots: negative effects of T and M in TS1 and GS1,negative effects of T, A and J in TS2, and no directeffect of the indices in GS2 (Fig. 2). This pattern is thesame as that found through the logistic regression modelsincluding the four indices except for GS2 in which asignificant effect of A and J was found only throughlogistic regression. The only other difference betweenpath analysis and logistic regression results was that nosignificant effect of H on LNI was found through logisticregression in the TS2 plot.
Overall, path coefficients between H-LN and LNIare higher than paths reflecting direct relationshipsbetween the neighbourhood indices and LNI. Standard-ized path coefficient for the relationship between J andH ranged between 0.25 and 0.50 in the four plots, whilethe coefficients between J and LN only exceeded 0.25in the TS2 plot.
Discussion
Detecting neighbourhood effects
Our goal was to detect the positive and negativeneighbourhood effects that could explain previouslyidentified spatial patterns (Barot et al. 1999a). Thisgoal has been achieved. Specifically, the positive effectof mounds and juveniles on seedlings explains theaggregation of juveniles on mounds, while the negativeeffect of juveniles and mounds on juveniles explainswhy adults have a random pattern and grow furtherfrom mounds than juveniles. The negative effect ofadult B. aethiopum on juvenile LNI (detected in one
plot) explains potentially why seedlings are spatiallyassociated to females, but not juveniles. The interpre-tation of the spatial association between mounds andjuvenile/adults is warranted because mound dynamicsare slower than B. aethiopum dynamics (cf. study siteand study species).
However, statistical analyses reveal some problems:1. The introduction of juvenile height and number ofleaves improves the models much more than theintroduction of neighbourhood indices; 2. The intro-duction of the four indices in the same logistic regres-sion improves the models (in seven cases out of eight)only faintly relative to the 1-index models (preliminaryanalyses using the PFI, and path analyses); 3. The useof particular weights (Wij) to take into account juvenileand adult size (H or LN) improves the modelinconsistently across plots (except for J in the juvenileLNI model), and only slightly (preliminary analysesusing PFI); 4. The neighbourhood indices which havea significant effect and the neighbourhood radii are notconsistent across the plots. These points frequentlylead to poor predictive power of neighbourhood models(Firbank & Watkinson 1987; Bergelson 1993; Bonan1993), whereas size by itself is a good predictor ofplant growth since it reflects the capacity of a plant toabsorb resources.
The poor predictive power of neighbourhood modelsarises fundamentally from a time-scale problem (Bonan1993): the spatial distributions and associations to beexplained result from decades of B. aethiopumdynamics, while our study only encompasses a 2-yrinterval. This problem should not discourage investi-gation of neighbourhood effects in natural communitiesbecause such studies are an indispensable complementto models that show that the accumulation in time ofshort-term neighbourhood interactions may haveimportant consequences for the long-term dynamics ofplant communities (Bonan 1988; Law & Dieckmann2000) and ecosystem functioning (Pacala & Deutsch-man 1995).
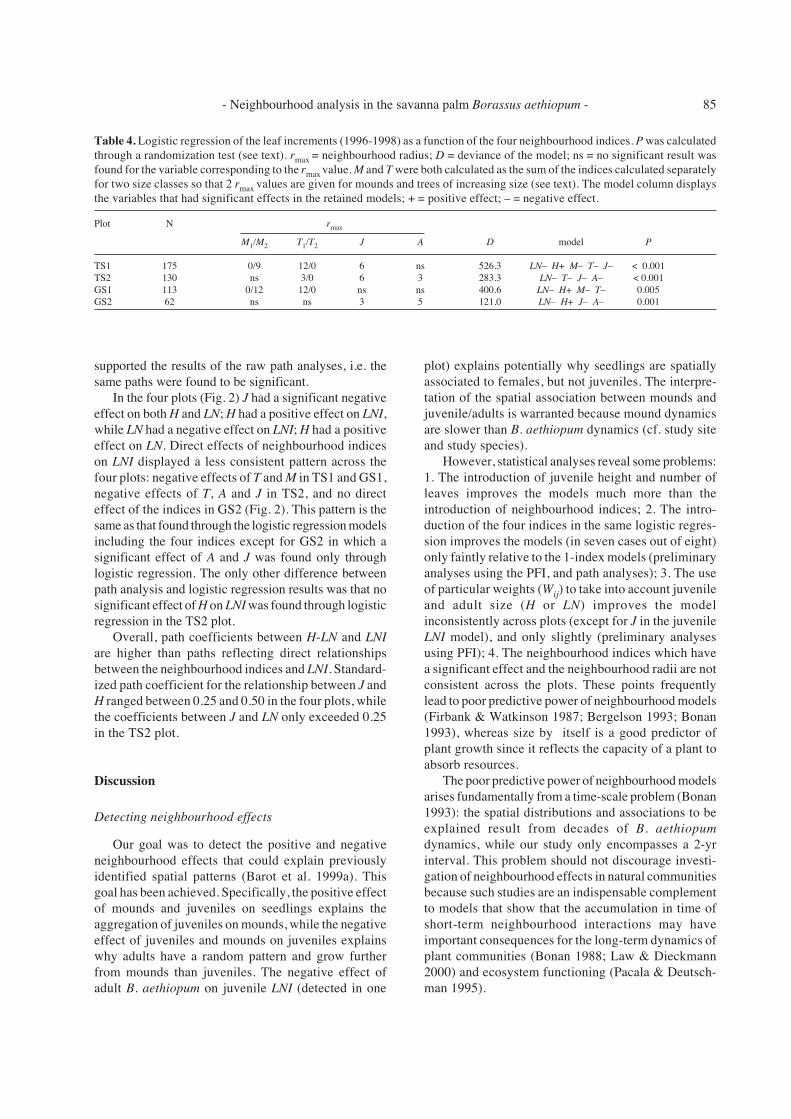
Table 4. Logistic regression of the leaf increments (1996-1998) as a function of the four neighbourhood indices. P was calculatedthrough a randomization test (see text). rmax = neighbourhood radius; D = deviance of the model; ns = no significant result wasfound for the variable corresponding to the rmax value. M and T were both calculated as the sum of the indices calculated separatelyfor two size classes so that 2 rmax values are given for mounds and trees of increasing size (see text). The model column displaysthe variables that had significant effects in the retained models; + = positive effect; – = negative effect.
Plot N rmax
M1/M2 T1/T2 J A D model P
TS1 175 0/9 12/0 6 ns 526.3 LN– H+ M– T– J– < 0.001TS2 130 ns 3/0 6 3 283.3 LN– T– J– A– < 0.001GS1 113 0/12 12/0 ns ns 400.6 LN– H+ M– T– 0.005GS2 62 ns ns 3 5 121.0 LN– H+ J– A– 0.001

86 Barot, S. & Gignoux, J.
Inferring biological processes from the neighbourhoodeffects
Logistic regressions using neighbourhood indicessuggest that SL-seedlings are mostly positivelyinfluenced by the presence of mounds and juveniles,while juveniles are mostly negatively influenced by thepresence of mounds and other juveniles. The analysis ofthe percentages of individuals growing directly onmounds supports these results. Yet, the logistic regres-sion models did not enable us to distinguish clearlybetween the effects of juveniles and mounds. Do juvenilesand mounds both really have a positive effect on seedlingsand a negative effect on juveniles?
J and M are positively correlated (analyses not shown)since juveniles and mounds are spatially associated inall plots (Barot et al. 1999a). Consequently, it is notpossible to determine a priori which of the neighbour-hood features (juveniles, mounds or both) influencesseedling progression and juvenile LNI.
In the path analyses, the local density of juveniles (J)always negatively affected both juvenile height andnumber of leaves whereas the direct effect of thisneighbourhood index on LNI was only found in oneplot. This is due to the time scale issue mentioned in thepreceding section: juvenile height and number of leavesat one time is due to the growth in height and LNI thataccumulated during many years, whereas our studytakes into account the LNI of a 2-yr period. Thus, J hasto be considered as the main factor influencing juvenileLNI, even if this influence is mainly exerted through theheight and the number of leaves. It shows that in the fourplots there is some intraspecific competition betweenclosely clumped juveniles. The fact that the index selectedto model the interaction between juveniles introducedsome height based asymmetry supports this interpreta-tion and suggests that competition between juveniles ismainly for light, since such competition is asymmetric(Weiner 1990).
As already emphasized, both J and M have positiveeffects on seedling progression and a negative effect onjuvenile LNI. However, according to the parsimonyprinciple, (1) mounds are responsible for the positiveeffect (H1) since they have been proved to be nutrient-rich patches (see hypotheses in the Introduction) andsince B. aethiopum has been shown to be sensitive tothese nutrient-rich patches (Mordelet et al. 1996),whereas (2) juveniles cause the negative effect (H2) dueto some intraspecific competition for light, as suggestedby the path analysis (see previous paragraph). Juvenilescould have their own positive effect on seedlings(facilitation by improvement of microclimatic or edaphicconditions) and mounds could have their own negativeeffect on juveniles, yet invoking such new mechanisms
is not parsimonious. Mounds are likely to have a positiveeffect both on juveniles and seedlings, while juvenilesare likely to have a negative effect both on seedlings andjuveniles. For seedlings, the effect of competition withconspecific immature individuals is overwhelmed bymound positive effect, while for juveniles, moundpositive effect is overwhelmed by the negative effect ofthe presence of nearby juveniles (H4 in the Introduction).
T has a negative effect on juvenile LNI and seedlingprogression in five out of six significant cases in the 4-index models. Since T is the only neighbourhood indexwith a negative effect on seedlings, trees are likely tonegatively affect seedling recruitment to the juvenilestage. This partially contradicts hypothesis H1. Treescompete with young B. aethiopum for light, as well asbeing nutrient-rich patches. Adults tend to have a negativeeffect on juveniles as predicted in hypothesis H3. Thissupports the results showing that seedling survival andprogression increase with the distance to their motherplants (Barot et al. 1999b).
Interpretation of the causes of seedling and juveniledifferent spatial distributions
So far it has been deduced from the neighbourhoodanalysis that seedlings are most sensitive to the presenceof termite mounds which are nutrient-rich patches whilejuveniles are mostly affected by other juveniles that arecompetitors, probably for light. These differences inseedling and juvenile responses to environmental factorsare probably due to differences in the factor that limitstheir growth and survival. Seedlings are most likely tobe nutrient limited while juveniles are most likely to belight limited because the relative size of their root andaerial systems are very different. All SL-seedlings haveeither one or two leaves, which represents approximatelythe same photosynthetic surface. Their capacity to recruitmust depend on their capacity to take up nutrients andthus on the development of their root systems which areinitially extremely reduced (Barot pers. obs.). Juvenileshave probably already developed an effective root sys-tem, but they have to increase the number of leaves (i.e.photosynthetic surface) to become adult, and to growtaller to avoid shading by their neighbours. In fact, somejuveniles (on mounds) are so densely clumped that theyseem to compete for the very space required to developleaves (Barot pers. obs.). Thus, the relative size of theabove and below-ground systems is likely to determinethe succession of constraints that limit growth capacityand survival throughout the life cycle.
Although the interplay between competition andfacilitation has already been widely discussed (Aguiaret al. 1992; Holmgren et al. 1996; Callaway & Walker1997) this is, as far as we know, the first time that the

- Neighbourhood analysis in the savanna palm Borassus aethiopum - 87
neighbourhood index approach has been used to test forboth positive and negative interactions simultaneously,while it was originally meant to distinguish competition.This approach might be very useful both to analyse fieldstudies and to implement positive interactions inindividual based spatially-explicit models.
The outcome of this interplay depends on the stageconsidered, such phenomena have already been identified(Grubb 1977; Grace 1985; Callaway & Walker 1997).Here, the younger (and smaller) B. aethiopum stage, SL-seedling, is more sensitive to ecosystem heterogeneity,while the next stage, juvenile, is more sensitive tocompetition. This competition arises, at least partly,because the sensitivity of the first stage to ecosystemheterogeneity leads to a concentration of individuals inthe favourable patches (Barot et al. 1999a). The samepattern was found by Stoll (1994) in a temperate Pinusforest. This probably constitutes a very general trend inplant demography: first, survival and growth of youngindividuals depend only on the quality of their immediatephysical environment (foraging phase), because their rootand aerial systems are very poorly developed. Second,older individuals have better developed root and aerialsystems and become increasingly independent of theirimmediate physical environment but increasinglydependent on the local density of competitors (compe-tition phase).
Acknowledgements. We express our gratitude to the UniversitéNationale de Côte d’Ivoire. We thank R. Vuattoux, director ofthe station, for the material facilities we were given. Our workwould not have been possible without Lamto technicians, theirpractical assistance and their knowledge of the field. The workwas supported by grants from the CNRS (SALT/GCTE CoreResearch Program).
References
Anon. 1989. SAS/STAT User’s guide, ver. 6, 4th ed. SASInstitute, Cary, NC.
Aarsen, L.W. & Epp, G.A. 1990. Neighbour manipulations innatural vegetation: a review. J. Veg. Sci. 1: 13-30.
Abbadie, L., Lepage, M. & Le Roux, X. 1992. Soil fauna at theforest-savanna boundary: role of the termite mounds innutrient cycling. In: Furley, P.A., Proctor, J. & Ratter, J.A.(eds.) Nature and dynamics of forest-savanna boundaries,pp. 473-484. Chapman & Hall, London, UK.
Aguiar, M.R., Soriano, A. & Sala, O.E. 1992. Competition andfacilitation in the recruitment of seedlings in a Patagoniansteppe. Funct. Ecol. 6: 66-70.
Aguilera, M.O. & Lauenroth, W.K. 1993. Seedling establish-ment in adult neighbourhoods – intraspecific constraintsin the regeneration of the bunchgrass Bouteloua gracilis.J. Ecol. 81: 253-261.
Barot, S., Gignoux, J. & Menaut, J.-C. 1999a. Demography ofa savanna palm tree: predictions from comprehensivespatial pattern analyses. Ecology 80: 1987-2005.
Barot, S., Gignoux, J. & Menaut, J.-C. 1999b. Seed shadows,survival and recruitment: how simple mechanisms lead todynamics of population recruitment curves. Oikos 86:320-330.
Barot, S., Gignoux, J., Legendre, S. & Vuattoux, R. 2000.Demography of a savanna palm tree in Ivory Coast (Lamto):population persistence, and life history. J. Trop. Ecol. 16:637-655.
Benjamin, L.R. 1993. Experimental discrimination betweencontrasting models of neighbourhood competition. J. Ecol.81: 417-423.
Bergelson, J. 1993. Details of local dispersion improve the fitof neighborhood competition models. Oecologia 95: 299-302.
Bonan, G.B. 1988. The size structure of theoretical plantpopulations: spatial patterns and neighborhood effects.Ecology 69: 1721-1730.
Bonan, G.B. 1993. Analysis of neighborhood competitionamong annual plants: implications of a plant growth model.Ecol. Model. 65: 123-136.
Callaway, R.M. & Walker, L.R. 1997. Competition andfacilitation: a synthetic approach to interactions in plantcommunities. Ecology 78: 1958-1965.
Collett, D. 1991. Modelling binary data. Chapman & Hall,London, UK.
Condit, R., Hubbell, S.P. & Foster, R.B. 1994. Densitydependence in two understory tree species in a neotropicalforest. Ecology 75: 671-680.
Dovciak, M., Frelich, L.E. & Reich, P.B. 2001. Discordance inspatial patterns of white pine (Pinus strobus) size-classesin a patchy near-boreal forest. J. Ecol. 89: 280-291.
Duncan, R.P. 1995. A correction for including competitiveasymmetry in measures of local interference in plantpopulations. Oecologia 103: 393-396.
Firbank, L.G. & Watkinson, A.R. 1987. On the analysis ofcompetition at the level of the individual plant. Oecologia71: 308-317.
Frelich, L.E. & Graumlich, L.G. 1994. Age-class distributionand spatial patterns in an old-growth hemlock-hardwoodforest. Can. J. For. Res. 24: 1939-1947.
Goldberg, D.E. 1987. Neighborhood competition in an old-field plant community. Ecology 68: 1211-1223.
Grace, J.B. 1985. Juvenile vs. adult competitive abilities inplants: size-dependence in Cattails (Typha). Ecology 66:1630-1638.
Grubb, P.J. 1977. The maintenance of species-richness inplant communities: the importance of the regenerationniche. Biol. Rev. 52: 107-145.
Haase, P., Pugnaire, F.I., Clark, S.C. & Incoll, L.D. 1997.Spatial pattern in Anthyllis cytisoides shrubland onabandoned land in southeastern Spain. J. Veg. Sci. 8: 627-634.
Hara, T. & Wyszomirski, T. 1994. Competitive asymmetryreduces spatial effects on size-structure dynamics in plantpopulations. Ann. Bot. 73: 285-297.
Holmgren, M., Scheffer, M. & Huston, M.A. 1996. The
88 Barot, S. & Gignoux, J.
interplay of facilitation and competition in plantcommunities. Ecology 78: 1966-1975.
Law, R. & Dieckmann, U. 2000. A dynamical system forneighborhoods in plant communities. Ecology 81: 2137-2148.
Legendre, P. 1993. Spatial autocorrelation: trouble or newparadigm? Ecology 74: 1659-1673.
Lehman, C.L. & Tilman, D. 1997. Competition in spatialhabitats. In: Tilman, D. & Kareiva, P. (eds.) Spatial ecology,pp. 185-203. Princeton University Press, Princeton, NJ.
Manly, F.J. 1991. Randomization, bootstrap and Monte Carlomethods in biology. Chapman & Hall, London, UK.
Meagher, T.R. & Burdick, D.S. 1980. The use of nearestneighbor frequently analyses in studies of association.Ecology 61: 1253-1255.
Menaut, J.-C. & César, J. 1979. Structure and primaryproductivity of Lamto savannas, Ivory Coast. Ecology 60:1197-1210.
Mitchell, R.J. 1992. Testing evolutionary and ecologicalhypotheses using path analysis and structural equationmodelling. Funct. Ecol. 6: 123-129.
Mitchell-Olds, T. 1987. Analysis of local variation in plantsize. Ecology 68: 82-87.
Mordelet, P., Abbadie, L. & Menaut, J.-C. 1993. Effects oftree clumps on soil characteristics in a humid savanna ofWest Africa (Lamto, Côte d’Ivoire). Plant Soil 153: 103-111.
Mordelet, P., Barot, S. & Abbadie, L. 1996. Root foragingstrategies and soil patchiness in a humid savanna. PlantSoil 182: 171-176.
Mott, J.J. & McComb, A.J. 1974. Patterns in annual vegeta-tion and soil microrelief in an arid region of WesternAustralia. J. Ecol. 62: 115-125.
Pacala, S.W. & Deutschman, D.H. 1995. Details that matter:the spatial distribution of individual trees maintains forestecosystem function. Oikos 74: 357-365.
Pacala, S.W. & Silander, J. 1985. Neighborhood models ofplant population dynamics. 1. Single-species models ofannuals. Am. Nat. 125: 385-411.
Pélissier, R. & Goreau, F. 2001. A practical approach to thestudy of spatial structure in simple cases of heterogeneousvegetation. J. Veg. Sci. 12: 99-108.
Pielou, E.C. 1962. The use of plant-to-plant distances for thedetection of competition. J. Ecol. 50: 357-367.
Silander, J.A.J. & Stephen, W.P. 1985. Neighborhoodpredictors of plant performance. Oecologia 66: 256-263.
Skarpe, C. 1991. Spatial patterns and dynamics of woodyvegetation in an arid savanna. J. Veg. Sci. 2: 565-572.
Sokal, R.R. & Rohlf, F.J. 1981. Biometry. Freeman, NewYork, NY.
Sterner, R.W., Ribic, C.A. & Schatz, G.E. 1986. Testing forlife historical changes in spatial patterns of four tropicaltree species. J. Ecol. 74: 621-633.
Stoll, P., Weiner, J. & Schmid, B. 1994. Growth variation in anaturally established population of Pinus sylvestris.Ecology 75: 660-670.
Thomas, S.C. & Weiner, J. 1989. Including competitiveasymmetry in measures of local interference in plantpopulations. Oecologia 80: 349-355.
Tilman, D. 1994. Competition and biodiversity in spatiallystructured habitats. Ecology 75: 2-16.
Weiner, J. 1982. A neighborhood model of annual-plantinterference. Ecology 63: 1237-1241.
Weiner, J. 1990. Asymmetric competition in plant populations.Trends Ecol. Evol. 5: 360-364.
Received 28 November 2001;Revision received 30 August 2002;
Accepted 3 October 2002;Coordinating Editor: P. Harcombe.