Enteric pathogens associated with diarrhea in children in Fayoum, Egypt

Hindawi Publishing CorporationJournal of Environmental and Public HealthVolume 2011, Article ID 484010, 10 pagesdoi:10.1155/2011/484010
Research Article
Neighborhood Urban Environmental Quality Conditions AreLikely to Drive Malaria and Diarrhea Mortality in Accra, Ghana
Julius N. Fobil,1, 2, 3 Alexander Kraemer,2 Christian G. Meyer,4 and Juergen May1
1 Infectious Disease Epidemiology Group, Bernhard Nocht Institute for Tropical Medicine, Bernhard Nocht Str. 74,20359 Hamburg, Germany
2 Department of Public Health Medicine, School of Public Health, University of Bielefeld, P.O. Box 100131,33501 Bielefeld, Germany
3 Department of Biological, Environmental & Occupational Health Sciences, School of Public Health,University of Ghana, P.O. Box LG13, Legon, Ghana
4 Department Molecular Medicine, Bernhard Nocht Institute for Tropical Medicine, Bernhard Nocht Str. 74,20359 Hamburg, Germany
Correspondence should be addressed to Julius N. Fobil, [email protected]
Received 27 September 2010; Revised 28 February 2011; Accepted 11 April 2011
Academic Editor: Issam Al-Khatib
Copyright © 2011 Julius N. Fobil et al. This is an open access article distributed under the Creative Commons Attribution License,which permits unrestricted use, distribution, and reproduction in any medium, provided the original work is properly cited.
Background. Urbanization is a process which alters the structure and function of urban environments. The alteration in thequality of urban environmental conditions has significant implications for health. This applies both to the ecology of insectvectors that may transmit diseases and the burden of disease. Study Objectives. To investigate the relationship between malariaand infectious diarrhea mortality and spatially varied neighborhood environmental quality conditions in a low-income economy.Design. A one time point spatial analysis of cluster-level environmental conditions and mortality data using principal componentanalysis (PCA), one-way analysis of variance (ANOVA) and generalized linear models (GLMs). Methods. Environmental variableswere extracted from the Ghana Census 2000 database while mortality data were obtained from the Ghana Births and DeathsRegistry in Accra over the period 1998–2002. Results. Whereas there was a strong evidence of a difference in relative mortality ofmalaria across urban environmental zones of differing neighborhood environmental conditions, no such evidence of mortalitydifferentials was observed for diarrhea. In addition, whereas bivariate analyses showed a weak to strong evidence of associationbetween the environmental variables and malaria mortality, no evidence of association was found between diarrhea mortalityand environmental variables. Conclusion. We conclude that environmental management initiatives intended for infectious diseasecontrol might substantially reduce the risk of urban malaria mortality and to a less extent that for urban diarrhea mortality inrapidly urbanizing areas in a low-income setting.
1. Background
Life within urban spaces has become a characteristic featureof modern human ecology as the global number of citieshas increased exponentially and expanded rapidly over thepast two centuries following industrialization and sustainedeconomic growth [1–4]. While cities are seen as sources ofcreativity and technology, often conceived as the engines foreconomic growth, they are also in many cases; especiallyin low-income economies centers, of pervasive poverty,economic inequality, and health hazards from harmfulenvironmental agents [1, 3, 4]. Rapid urbanization has been
widely reported to alter the structure of urban subsystems, aprocess which has considerable implication for health [1, 3–7]. Ample evidence exists to show that uncontrolled andunplanned expansion, including sheer increase in urbanpopulation numbers, combine to accelerate the deteriorationof urban environmental quality conditions such as wastedeposition, outdoor air pollution, and water pollution [1, 3,8–12]. Figure 1 shows a typical scenario in an urban slumin Accra, Ghana, displaying distinct environmental qualityconditions.
The mere lack of sanitation, poor infrastructure, anddeplorable urban living conditions are believed to increase

2 Journal of Environmental and Public Health
(a)
(b)
(c)
Tamale
Kumasi Accra
Ghana
Waste deposition map ofN
Lagoon0.008–0.0490.050–0.098
0.099–0.1730.174–0.2850.266–0.786
Accra
02.
756.
5 11
16.5 22
(kilometers)
Figure 1: Map of the study area, Accra, Ghana. (a) is the mapof Ghana showing the geographic position of Accra. (b) showsthe 70 census clusters which were used as the units of analysis.(c) shows the amplification of the neighbourhood environmentalconditions (i.e., uncontrolled solid waste incineration, choked opendrain, stagnant water in an open drain, and dilapidated housingconditions) as pertain in the census clusters.
the risk of infectious diarrhea [1–3, 9–11, 13]. The effec-tiveness of a city-wide sanitation intervention on diarrheain urban centers in low-income countries has recently beendemonstrated [2, 10, 13]. However, the influence of neigh-borhood environmental conditions on infectious diarrheamortality is not completely understood [5, 14–17]. In thecase of malaria, the most important vector-borne disease, itnot only still remains, despite deployment of better controlstrategies, a leading cause of morbidity and mortality, butit also exacerbates socioeconomic conditions, particularlyin poor communities [18–22]. Unprecedented urbanization,along with declining environmental conditions, might haveprofound implications for the epidemiology and control ofmalaria, as the relative disease burden increases among urbandwellers [3, 4, 6, 7]. A recent review and modeling studydemonstrated that entomologic inoculation rates (EIR) incities in urbanizing areas were rising and ranged up to54 per year, depending on the degree of urbanization, thespatial location within a city, and the overall living conditions[10]. Although the epidemiology of urban malaria is nowfairly understood, there is still wide disagreement aboutits transmission dynamics [10, 18, 19, 21–23]. While it isgenerally accepted that rapid urbanization creates environ-mental conditions that favor insect vector breeding, othersargue that urban pollution tends to inhibit the growthand development of mosquito larvae [10, 18, 21, 22].
Understanding how the risk to human health may change as aresult of variations in environmental conditions will be a keypriority in the context of climate change and urban health,especially in lower-income countries with fragile structuresthat are most sensitive to climate events and extreme weatherconditions [3, 24–28].
Therefore, the main goal of this study was not onlyto investigate the relationship between spatially variedneighborhood urban environmental quality and malariaand diarrhea mortality, but also to find out if the fractionof deaths due to malaria and diarrhea differed acrossenvironmental zones in an urbanizing area in a low-incomeeconomy.
2. Methodology and Analytic Approach
The data on neighbourhood urban environmental qualityconditions were obtained from the 2000 Census databasewhile health data, totalling 24,716 deaths and coded accord-ing to ICD-9, were obtained from the Ghanaian VitalRegistration System (VRS) that routinely reported all-causedeaths for years 1998 to 2002. Different data handlingprocedures were applied to the two datasets because themeasures of mortality and environmental quality differedsignificantly.
In this analysis, four broad categories of environmentalvariables were obtained from the census database, namely(1) “population and waste generation”, (2) “water supply andsanitation”, (3) “hygiene conditions”, and (4) “built structure,form, construction material type and living arrangements”.In all, a total of 65 single environmental variables wereextracted from the census database under the four distinctsubcategories together and summary measures (e.g., theproportions of cluster-level conditions) appropriately com-puted. In order to find out whether differences in malaria anddiarrhea mortalities existed across different environmentalzones, we first explored the large number of environmentalvariables under each subcategory for determination of thedirection of their eigenvectors using principal componentanalysis (PCA). In a data reduction strategy, we again usedPCA to decompose the variables under each subcategory intoa manageable unidirectional variable which was employedto develop an ordinal scale of urban environmental zona-tions at differing levels of environmental quality conditions[5]. The resulting environmental zones were nominallydefined as “extremely deteriorated zone”, “moderately dete-riorated zone”, and “least deteriorated zone” representingworst, somewhat worse, and good environmental conditions,respectively. We then compared the differences in malariaand diarrhea mortality levels in the different environmentalzones using a one-way analysis of variance (ANOVA). In asubsequent step, we assessed the linear association betweenthe environmental variables on the one hand and malariaand diarrhea mortalities on the other hand using generalizedlinear models (GLMs). In order to deal with multicollinearityin the linear association analysis, we conducted correlationsusing (STATA version 9, College Station, Tex, USA) andexamined the correlation matrix as well as the varianceinflation factor (VIF) of the exploratory variables. Variables

Journal of Environmental and Public Health 3
Table 1: Malaria mortality in different urban environmental zones.
Urban environmental variable Zonation RM Mean fraction P-value 95% CI
Total waste generation in relation tocluster population
Extremely deteriorated 1.755 0.050 .061 0.031 0.070
Moderately deteriorated 1.769 0.051 .018 0.041 0.059
Least deteriorated 1.000 0.029 — 0.011 0.045
Water supply and sanitation facilitiesExtremely deteriorated 2.220 0.054 .007 0.035 0.072
Moderately deteriorated 2.041 0.049 .004 0.040 0.058
Least deteriorated 1.000 0.024 — 0.012 0.036
Hygiene facilitiesExtremely deteriorated 0.470 0.024 .012 0.011 0.038
Moderately deteriorated 0.931 0.048 0.690 0.039 0.058
Least deteriorated 1.000 0.052 — 0.040 0.062
Housing structure & form, constructionmaterial type, and arrangement
Extreme slum 2.349 0.066 .004 0.052 0.080
Moderate slum 1.794 0.050 .112 0.040 0.061
Non slum (Well built) 1.000 0.028 — 0.019 0.037
Zonations: represent the different environmental ecotypes with discretely distinct environmental quality conditions. RM: represents relative mortalitycomputed as the ratio of the mean of the fraction of cluster-level deaths due to a specific cause to that of the baseline situation, that is, the fraction of cluster-level deaths due to the specific cause in the least deteriorated zone. Mean fraction: represents the mean of the fraction of cluster-level deaths due to a specificcause. 95% CI: represents 95-percent confidence intervals of the means.
with VIF greater than 4 were either modified or excludedcompletely from the analysis if modification did not makesense. Overall, a total of 60 variables were maintained for usein the ANOVA and linear regression analyses after dealingwith multicollinearity.
For the health data, we allocated all death records to the70 census clusters for which urban environmental variableswere available according to the place of residence prior todeath and computed surrogate proportional mortality ratios(PMRs) as fractions of cluster-level deaths due to malariaand diarrhoea. Overall, 24,716 all-cause deaths events wererecorded for urban Accra for the period from 1998 to 2002,and out of which 1,292 and 1,001 were deaths attributed tomalaria and diarrhea, respectively. The standard definitionof a PMR is the observed proportion of deaths due tospecific-cause mortality in an exposed population, dividedby the expected proportion of deaths due to the specificcause (i.e., the expected proportion being the number ofdeaths due to the specific cause over all-cause mortality ina standard or reference population). To obtain cluster-levelfraction of deaths due to malaria or diarrhea, we workedbackwards, multiplying cluster level PMRs by the expectedproportion, that is, the proportion of malaria or diarrhea ina reference population. We also computed relative mortality(RM), that is, the relative risk of mortality in the differentzones as a ratio of the mean of the fraction of deaths dueto malaria/diarrhea in each environmental zone to the meanof the fraction of deaths due to malaria/diarrhea in theleast deteriorated zone. The effects of the neighbourhoodurban environmental quality conditions on mortality wereassessed by comparing the means of the fraction of deathsdue to malaria and diarrhea whereas the relative mortalitiesacross the different environmental zones, and the associationbetween environmental quality and malaria and diarrheamortality were investigated using bivariate and multiplelinear regression analyses.
3. Results
In an analysis to assess the influence of neighbourhoodurban environmental quality on the fraction of deathsdue to malaria and diarrhea, we present the means ofthe fraction of deaths (mean fraction) and their respectiverelative mortalities (RMs) in scenarios of differing urbanenvironmental quality conditions in a rapidly urbanizingarea in a low-income economy (Tables 1 and 2).
Table 1 compares the fraction of cluster-level deaths dueto malaria across environmental zones defined on the basis offour subcomponents of environmental quality, namely, (a)total waste generated in relation to population (per capitageneration), (b) water supply and sanitation, (c) hygienefacilities/conditions, and (d) housing structure, form, andconstruction material type. On the basis of the “populationand waste generation” sub-component, there was strongevidence of a difference (P = .018) in the risk of urbanmalaria mortality between the least deteriorated zone (meanfraction = 0.029, 95% CI: 0.011–0.045) and the moderatelydeteriorated zone (mean fraction = 0.051, 95% CI: 0.04–0.059) with a relative mortality [RM] = 1.77 between thetwo zones. However, there was no evidence of a difference(P = .061) in the risk of malaria mortality betweenthe reference zone (least deteriorated zone) and extremelydeteriorated (mean fraction = 0.50, 95% CI: 0.031–0.070)zone. Regarding “water supply and sanitation”, a strongevidence of a difference in the risk of malaria mortality wasobserved both between the least deteriorated zone (P =.004; mean fraction = 0.024; 95% CI: 0.012–0.036) and themoderately deteriorated zone (mean fraction = 0.049, 95%CI: 0.040–0.058) on the one hand and between the extremelydeteriorated zone (mean fraction = 0.054, P = .007, 95%CI: 0.035–0.072) and the least deteriorated zone on theother hand. The relative risks of death due to malaria inthe moderately deteriorated (RM = 2.041) and extremely
4 Journal of Environmental and Public Health
Table 2: Diarrhea mortality in different urban environmental zones.
Urban environmental variable Zonation RM Mean fraction P-value 95% CI
Population, water, housing, and wastegeneration
Extremely deteriorated 1.258 0.036 .411 0.024 0.049
Moderately deteriorated 1.728 0.050 .160 0.033 0.066
Least deteriorated 1.000 0.029 — 0.016 0.036
Water supply and sanitation facilitiesExtremely deteriorated 1.010 0.040 .986 0.029 0.052
Moderately deteriorated 1.100 0.044 .799 0.028 0.060
Least deteriorated 1.000 0.040 — 0.013 0.067
Hygiene facilitiesExtremely deteriorated 1.740 0.067 .036 0.016 0.119
Moderately deteriorated 0.917 0.035 .618 0.029 0.042
Least deteriorated 1.000 0.039 — 0.029 0.048
Housing construction material type andarrangement
Extreme slum 1.349 0.060 .035 0.027 0.094
Moderate slum 0.700 0.031 .035 0.024 0.039
Least slum (Well built) 1.000 0.045 — 0.038 0.052
Zonations: represent the different environmental ecotypes with discretely distinct environmental quality conditions. RM: represents relative mortalitycomputed as the ratio of the mean of the fraction of cluster-level deaths due to a specific cause to that of the baseline situation that is the fraction of cluster-level deaths due to the specific cause in the least deteriorated zone. Mean fraction: represents the mean of the fraction of cluster-level deaths due to a specificcause. 95% CI: represents 95-percent confidence intervals of the means.
deteriorated (RM = 2.221) zones were approximately thesame. Whereas a strong evidence of a difference (P = .012)in malaria mortality was observed between the extremelydeteriorated (mean fraction = 0.024, 95% CI: 0.011–0.038)and the reference zones for “hygiene facilities/conditions”, noevidence of a difference (P = .690) was observed betweenthe moderately deteriorated and the reference zones (meanfraction = 0.052, 95% CI: 0.040–0.062). The relative risk ofdeath due to malaria in the zone of moderately deterioratedhygiene conditions (RM = 0.931) and in the zone ofextremely deteriorated hygiene conditions (RM = 0.470) wasremarkably different although the fraction of deaths due tomalaria in the two zones was lower than that in the leastdeteriorated hygiene conditions. The “housing structureand form, construction materials, and living arrangement”component of urban environment was classified into threecategories, namely, (1) “extreme-slum”, (2) “moderate-slum”and (3) “non-slum” conditions. While we observed a strongevidence of malaria mortality (P = .004) between the zone ofmoderate slum conditions (mean fraction = 0.050, 95% CI:0.040–0.061) and the zone of least slum conditions (meanfraction = 0.028, 95% CI: 0.019–0.037), no evidence ofmortality difference (P = .112) was observed between thereference slum conditions and the zone of moderate slumconditions (Table 1).
Table 2 summarizes urban diarrhea mortality burdenin the different zones. In contrast to the mortality patternobserved for malaria, the evidence of diarrhea mortality dif-ference across the different spatially distinct environmentalzones was not as striking. While there was moderate evidenceof diarrhea mortality difference (P = .035) across the 3slum grades, there was no evidence of diarrhea mortalitydifferential in the other components of environmentalquality except for a moderate evidence of difference (P =.036) between moderately deteriorated (mean fraction =0.035, 95% CI: 0.029–0.042) and least deteriorated zoneswith respect to hygiene conditions.
As the analyses not only assessed whether or not therewere differences in the urban mortalities across the differentenvironmental zones, we evaluated the relationship betweenmalaria- and diarrhea-specific mortalities on the one handand the neighbourhood environmental quality conditions onthe other as an additional interest using bivariate regressionanalyses.
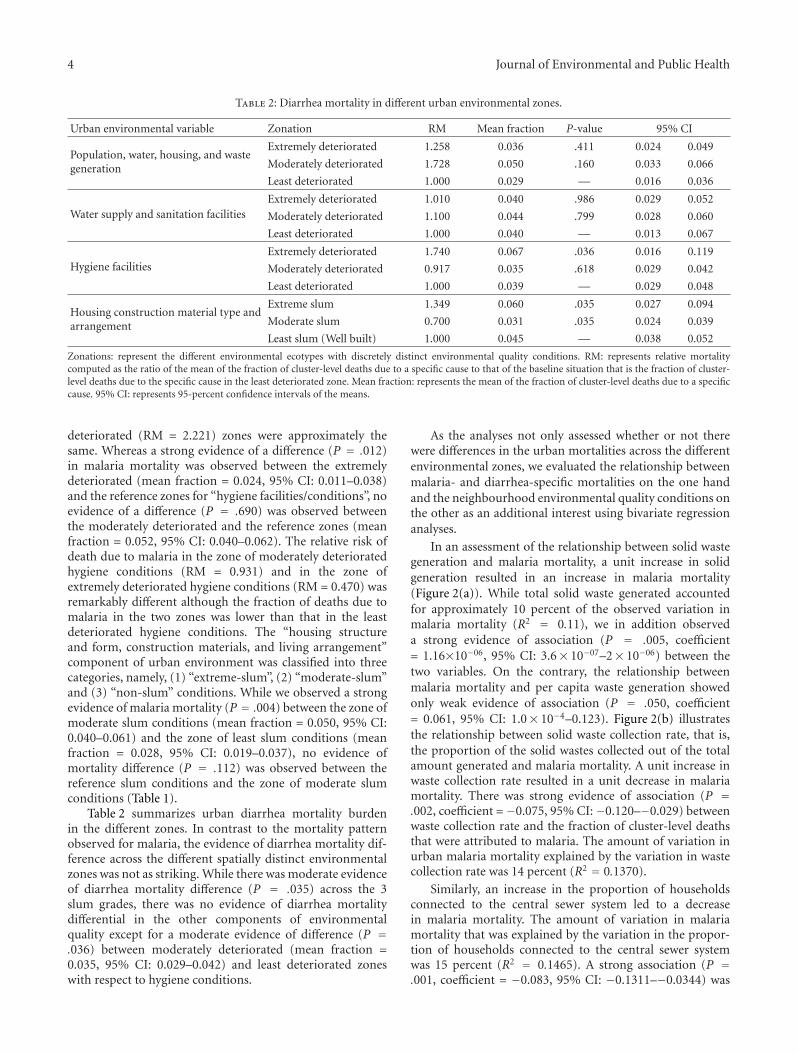
In an assessment of the relationship between solid wastegeneration and malaria mortality, a unit increase in solidgeneration resulted in an increase in malaria mortality(Figure 2(a)). While total solid waste generated accountedfor approximately 10 percent of the observed variation inmalaria mortality (R2 = 0.11), we in addition observeda strong evidence of association (P = .005, coefficient= 1.16×10−06, 95% CI: 3.6× 10−07–2× 10−06) between thetwo variables. On the contrary, the relationship betweenmalaria mortality and per capita waste generation showedonly weak evidence of association (P = .050, coefficient= 0.061, 95% CI: 1.0× 10⁻⁴–0.123). Figure 2(b) illustratesthe relationship between solid waste collection rate, that is,the proportion of the solid wastes collected out of the totalamount generated and malaria mortality. A unit increase inwaste collection rate resulted in a unit decrease in malariamortality. There was strong evidence of association (P =.002, coefficient =−0.075, 95% CI:−0.120–−0.029) betweenwaste collection rate and the fraction of cluster-level deathsthat were attributed to malaria. The amount of variation inurban malaria mortality explained by the variation in wastecollection rate was 14 percent (R2 = 0.1370).
Similarly, an increase in the proportion of householdsconnected to the central sewer system led to a decreasein malaria mortality. The amount of variation in malariamortality that was explained by the variation in the propor-tion of households connected to the central sewer systemwas 15 percent (R2 = 0.1465). A strong association (P =.001, coefficient = −0.083, 95% CI: −0.1311–−0.0344) was

Journal of Environmental and Public Health 5
0
0.05
0.1
0.15
Frac
tion
ofde
ath
sdu
eto
mal
aria
0 10000 20000 30000 40000
Total waste generation (kg)
(a)
0
0.05
0.1
0.15
Frac
tion
ofde
ath
sdu
eto
mal
aria
0 0.2 0.4 0.6
Proportion of solid waste collected
(b)
Figure 2: The nature of the bivariate associations between malaria mortality and solid waste generation. The points represent the fractionof deaths due to malaria and the metric of solid wastes. The solid lines represent the regression line of best fit, and the grey area representstheir confident intervals (CIs). (a) Shows the total amount of solid waste generated as a function of the fraction of cluster-level deaths dueto malaria. (b) Shows wastes collection rate as a function of the fraction of cluster-level deaths due to malaria.
observed between the proportion of households connectedto the sewer system and malaria mortality.
Figure 3(a) shows the association between number ofresidential water supply sources per neighbourhood andmalaria mortality, while Figure 3(b) depicts the relationshipbetween the proportion of households connected to thewater closet (WC) and malaria mortality. Although malariamortality was strongly associated with both the number ofresidential water supply sources per household (P = .008,coefficient = 0.007, 95% CI: 0.002–0.013) and the proportionof households connected to WC (P < .001, coefficient =−0.087, 95% CI: −0.129–−0.044), the amount of evidenceof association for the proportion of household connected toWC was stronger compared to solid waste collection rate.An increase in the proportion of households connected tothe WC resulted in a decrease in malaria mortality, andthe amount of variation in the mortality explained by thevariation in the proportion of households connected tothe WC was approximately 20 percent (R2 = 0.1966).Figure 3(c) gives the relationship between the proportionof households using public toilets and malaria mortality.Although the use of public toilets has not been previouslyreported to influence malaria transmission, it was observedthat an increase in the proportion of households usingpublic toilets resulted in an increase in malaria mortality.The amount of variation in malaria mortality explained bya unit increase in the proportion of households dependingon public toilets as hygiene facilities was approximately 15percent (R2 = 0.1498). Strong evidence of association wasobserved between the proportion of urban households usingpublic toilets and malaria mortality (P = .001, coefficient =0.099, 95% CI: 0.042–0.157).
We further assessed the influence of hygiene facilitiessuch as shared bath facility, own bath facility, public bath,and shared cubicle, whether or not hygiene facility wasinside the household in malaria mortality. An assessment
of the relationship between the proportion of householdswithout hygiene facilities was observed to show a positiveassociation with malaria mortality. The amount of variationin urban malaria mortality explained by the proportion ofhouseholds without hygiene facilities was roughly 8 percent(R2 = 0.0817), with a strong evidence of association (P =.016, coefficient =−0.193, 95% CI:−0.350–−0.037) betweenthe variables. In both bivariate and multi-variate analyses,the response of malaria mortality to the different hygienevariables varied widely in direction, strength, degree, andlevels of association. For example, while a unit increase inthe proportion of households with own-bath facilities andthose with shared-bath facilities resulted in a decrease inmalaria mortality, the degree of variability explained wasapproximately 13 percent (R2 = 0.1249) for householdswith own-bath facilities and 7 percent (R2 = 0.0701) forhouseholds with shared-bath facilities. Moreover, while thestrength of the evidence of association between malariamortality and the proportion of households with own-bathfacilities was very strong (P = .003, coefficient =−0.049, 95%CI: −0.081–−0.018), only moderate evidence of association(P = .027, coefficient = −0.070, 95% CI: −0.133–−0.008)was observed between urban malaria mortality and theproportion of households with shared-bath facilities.
Figure 4 compares the differences in the levels andstrengths of association between malaria mortality and theproportion of households using public bath facilities on theone hand and the association between the proportion ofhouseholds using shared-cubicle baths and malaria mortalityon the other hand.
In both instances, a unit increase in the explanatoryvariable (i.e., the proportion of households using publicbaths: Figure 4(a) and the proportion of households usingshared cubicle-baths: Figure 4(b)) resulted in a correspond-ing increase in malaria mortality. However, while the amountof variation in malaria mortality explained by the proportion

6 Journal of Environmental and Public Health
0
0.05
0.1
0.15Fr
acti
onof
deat
hs
due
tom
alar
ia
0 2 4 6 8
Residential water supply
(a)
0.02
0.04
0.06
0.08
0.1
0.12
Frac
tion
ofde
ath
sdu
eto
mal
aria
0 0.1 0.2 0.3 0.4
Proportion of households connected to WC
Fitted values 95% CIFitted values Malaria mortality
(b)
0
0.05
0.1
0.15
Frac
tion
ofde
ath
sdu
eto
mal
aria
0 0.1 0.2 0.3 0.4Proportion of households using public toilets
Fitted values 95% CIFitted values Malaria mortality
(c)
Figure 3: The nature of the bivariate associations between malaria mortality and urban water supply and sanitation. The points representthe fraction of deaths due to malaria and the metric of urban water supply and sanitation. The solid lines represent the regression line of bestfit, and the grey area represents their confident intervals (CIs). (a) Shows the number of residential water supply sources as a function of thefraction of cluster-level deaths due to malaria. (b) Shows the proportion of households with WCs as a function of the fraction of cluster-leveldeaths due to malaria. (c) Shows the proportion of households using public toilets as a function of the fraction of cluster-level deaths due tomalaria.
of households using public bath facilities was 8 percent(R2 = 0.0817), the amount of variability in malaria mortalityexplained by the proportion of households using shared-cubicle baths was 12 percent ( R2 = 0.1200). There wasa strong evidence of association (P = .003, coefficient =0.163, 95% CI: 0.056–0.269) between malaria mortality andthe proportion of households using shared-cubicle baths.Furthermore, although the association between malariamortality and the proportion of households using publicbaths was strong (P = .016, coefficient = 0.173, 95%CI: 0.033–0.314), it was slightly weaker than that betweenmalaria mortality and the proportion of households usingshared-cubicle baths (Figure 4(b)).
Another aspect of neighbourhood environmental qualitythat was assessed to determine its influence on malariamortality was housing structure, housing characteristics, andliving arrangements. The city of Accra is poorly planned,
composed largely of light-density buildings in a sprawlinglandscape. The form and structure of built-up areas representa diversity of environmental archetypes of different outlookand varying levels of neighbourhood environmental qualityconditions. It is not very clear how the different buildingand structure types influence infectious disease transmissionand in particular, malaria and diarrhea mortalities in rapidlyurbanizing areas in a low-income economy. In this analysis;therefore, our interest did not only focus on how the specificneighbourhood environmental quality condition influencedinfectious disease mortalities, but also how the differentstructural designs and types were linked to urban mortalities.Classified broadly under the heading “housing constructionmaterial type and living arrangements”, both bivariate andmultiple linear regression procedures were conducted onseveral variables related to the structure and form ofbuildings, construction material type, living arrangements,

Journal of Environmental and Public Health 7
0
0.05
0.1
0.15
Frac
tion
ofde
ath
sdu
eto
mal
aria
0 0.02 0.04 0.06 0.08 0.1
Proportion of households using public baths
Fitted values 95% CIFitted values Malaria mortality
(a)
0
0.05
0.1
0.15
Frac
tion
ofde
ath
sdu
eto
mal
aria
0 0.1 0.2 0.3Proportion of households using shared-cubicle baths
Fitted values 95% CIFitted values Malaria mortality
(b)
Figure 4: The nature of the bivariate associations between malaria mortality and neighbourhood hygiene conditions. The points representthe fraction of deaths due to malaria and the metric of solid wastes. The solid lines represent the regression line of best fit, and the grey arearepresents their confident intervals (CIs). (a) Shows the proportion of households using public baths as a function of the fraction of clusterlevel deaths due to malaria. (b) Shows the proportion of households using shared-cubicle baths as a function of the fraction of cluster leveldeaths due to malaria.
that is, number of persons per unit, and so forth. Under thiscomponent of the physical environment, of a total of 15 vari-ables (e.g., proportion of standalone structures, proportionof semidetached structures, proportion, and flats/apartmentstructures, proportion of compound structures, proportionof huts, proportion of mud-brick structures, proportionconcrete-brick structures, proportion of bamboo structures,etc.) considered for both bivariate and multiple regressionanalyses, only 3 showed significant association with urbanmalaria mortality. The 3 variables were: (1) the proportion ofstandalone structures, (2) the proportion of flats/apartmentbuildings and (3) the proportion of compound structureswhich housed multiple households.
Figure 5(a) displays the relation between the proportionof standalone structures and urban malaria mortality. Here,it was observed that a unit increase in the proportion ofstandalone structures led to a large decline in urban malariamortality with the amount of variation in urban mortalitythat was explained by a unit increase in the proportion ofstandalone structures being as large as 21 percent (R2 =0.2051). There was a strong evidence of association betweenthe proportion of standalone building structures and urbanmalaria mortality (P < .001, coefficient = −0.118, 95% CI:−0.174–−0.062).
In a penultimate assessment, a unit increase in the pro-portion of flats/apartment structures resulted in a decreasein malaria mortality. Approximately 7 percent (R2 = 0.0730)of the variation in malaria mortality was explained by aunit increase in the proportion of flats/apartment buildingstructures. Nonetheless, there was a moderate evidence ofassociation (P = .024, coefficient = −0.098, 95% CI:−0.183–−0.014) between the proportion of flats/apartmentstructures and malaria mortality compared to the strongevidence of association observed between malaria mortalityand the proportion of standalone building structures.
In a more or less final assessment, the relationshipbetween the proportion of compound structures and urbanmalaria mortality was evaluated. Figure 5(b) shows therelationship between the proportion of compound buildingstructures and urban malaria mortality. A unit increase in theproportion of compound structures resulted in an increasein malaria mortality. Twenty-one percent (R2 = 0.2126) ofthe variation in malaria mortality was explained by a unitincrease in the proportion of compound building structures.The observed evidence of association between the proportionof compound building structures and malaria mortality wasvery strong (P < .001, coefficient = 0.071, 95% CI: 0.0380.105).
4. Discussions
Considerable evidence which demonstrates the effects ofthe physical environment on human health exists [5, 8,10, 29]. However, no consensus exists on the standarddefinition of environmental quality classifications that allowsfor across-study comparisons. In literature, different studieshave different environmental classifications, thus, makingcomparison of study outcomes between and among differentstudies hard to undertake.
Both solid and liquid wastes are known to constituteconducive breeding media for insect vectors including theopportunity to create stagnant pools of water for mosquitolarval growth. As a consequence, increased waste collectiondecreases habitat space and capacity for the larvae of Anophe-les mosquitoes, which are the vectors of malaria parasites.This might lead to a decrease in malaria transmissionand, therefore, a reduction in its mortality. In addition, anincrease in residential water supply sources would potentiallylead to expansion of residential habitat space for mosquitolarval growth and survival and was likely the reason for

8 Journal of Environmental and Public Health
0
0.05
0.1
0.15
Frac
tion
ofde
ath
sdu
eto
mal
aria
0 0.1 0.2 0.3 0.4 0.5
Proportion of standalone households
Fitted values 95% CIFitted values Malaria mortality
(a)
0
0.05
0.1
0.15
Frac
tion
ofde
ath
sdu
eto
mal
aria
0 0.2 0.4 0.6 0.8
Proportion of compound households
Fitted values 95% CIFitted values Malaria mortality
(b)
Figure 5: The nature of the bivariate associations between malaria mortality and housing and living arrangements. The points represent thefraction of deaths due to malaria and the metric of solid wastes. The solid lines represent the regression line of best fit, and the grey arearepresents their confident intervals (CIs). (a) Shows the proportion of standalone households as a function of the fraction of cluster leveldeaths due to malaria. (b) Shows the proportion of compound households as a function of the fraction of cluster level deaths due to malaria.
the observed positive association between urban malariamortality and the number of residential water supplysources. Furthermore, nonremoval of liquid waste may createpoodles and standing water conditions favoring breedingof mosquitoes in open drain systems. As a consequence,residential areas with a low sewer connection rate may benoted for high mosquito breeding and thus, be associatedwith increased malaria transmission. This was probably theexplanation for the observed reduction in urban malariamortality with an increase in the proportion of householdsthat were connected to the sewer system. Our observationare consistent with the findings reported in a number ofprevious studies on the association between mosquito vectorbreeding and waste material deposition [7, 21, 30–32].Like both solid waste collection rate and the proportion ofhouseholds connected to the sewer system, the higher theproportion of households connected to the WC, the smallerthe chance of liquid wastes left to collect as standing pools ofwater. This has a potential to reduce the size of habitats formosquito breeding and thus, lowering malaria transmissionand perhaps accounted for the decrease in malaria mortalityassociated with the increase in the proportion of householdsconnected to the WC.
The observed lower malaria mortality rate in the mod-erately deteriorated zone compared to the least deterioratedzone for hygiene facilities was a striking anomaly which wasprobably due to behavioral and lifestyle factors rather thanenvironmental factors. Lifestyle and behavioral factors canupset an otherwise uniform natural association between ahealth outcome and environmental conditions. For instance,strict observance of malaria control measures by residentsin the moderately deteriorated environmental zone couldaccount for the observed difference.
Although several studies have reported increased malariatransmission with deteriorating environmental quality
[8, 18, 27, 33–37], no reports of such a relationship betweenenvironmental conditions and malaria mortality have beendocumented. In a study to investigate the risk factors formalaria, children living in houses with mud roofs hadsignificantly higher risk of acquiring malaria compared tothose living in iron-sheet-roofed houses (OR 2.6, 95% CI:1.4–4.7) [22].
The lack of evidence of association between the fractionof cluster-level deaths due to diarrhea and environmentalconditions was likely a confirmation that the urban envi-ronmental initiatives for the control of diarrhoeal diseases(CDD) have been effective and the observed diarrhoealdeaths were not related to the environmental conditions. Itis well known that there is a strong association of diarrheamorbidity and areas with poor hygiene and sanitation[2, 9, 10, 13, 16]. In a study to explore how a citywidesanitation intervention altered the magnitude of the relativeand attributable risks of diarrhea determinants and thepathways by which those factors affected diarrhea risk, theauthors observed that the intervention reduced diarrheaand also changed attributable and relative risks of diarrheadeterminants by altering the pathways of mediation [10]. Inaddition, socioeconomic status was a major distal diarrheadeterminant with an attributable risk of 24%. Whereas90% of risk was mediated by other factors, mostly by poorinfrastructure (53%) and lack of sanitation which accountedfor 13% of the risk, the remaining 42% mediated by otherfactors including 18% by lack of sanitation and poor infras-tructure [10]. This study observed very weak to very strongassociations between neighbourhood urban environmentalquality conditions and urban malaria/diarrhea mortalities.As expected, although the study could not establish causalrelationships, several instances of strong associations wereobserved among the environmental, socioeconomic, andhealth variables.

Journal of Environmental and Public Health 9
5. Conclusion
We conclude that the numerous instances of strong asso-ciations between the urban environmental variables andmalaria mortality are indications that malaria control pro-grams with a strong focus on urban environmental man-agement initiatives would probably lower urban mortalitiesattributable to malaria in rapidly urbanization areas inresource-poor settings. However, we recommend that thepresent study be repeated in a longitudinal study designusing the Ghana Census 2010 data in order to confirm theseassociations and to evaluate how much of malaria deaths areattributed to deterioration in urban environmental condi-tions over time. In addition, we recommend that case-controlstudies at individual levels be conducted on the variablesthat were observed to exhibit strong associations in order toestablish the causal chain of events linking, socioeconomicconditions, neighbourhood urban environmental qualityconditions, and infectious disease mortality.
6. Limitations of the study
A key limitation in ecological designs is the chance ofecological fallacy, but with the large mortality data availablethere was no any other design possible. In addition, thePMRfds were computed using all-cause mortality as thedenominator, and so if the risk of mortality for one of thecomponents of all-cause mortality varied by cluster, thenthis could affect the summary/outcome measure PMRfd and,therefore, bias the final results of analysis. A way to dealwith this problem will be to exclude such components,but unfortunately, we did not have the liberty of tellingapriori if any of the components of all-cause mortalityexhibited differential mortality risk by cluster and, therefore,this bias could not be controlled for. Another way to dealwith this bias will be to use a specific cause of deathknown to have a uniform risk level across all clusters asthe denominator for both the observed proportion andthe expected proportion. But, then again, this also requiresknowledge of risk distribution by cause in the study area andwhich unfortunately was not available for the study area.
References
[1] J. N. Fobil, N. A. Armah, J. N. Hogarh, and D. Carboo,“The influence of institutions and organizations on urbanwaste collection systems: an analysis of waste collection systemin Accra, Ghana (1985–2000),” Journal of EnvironmentalManagement, vol. 86, no. 1, pp. 262–271, 2008.
[2] T. Clasen, W. P. Schmidt, T. Rabie, I. Roberts, and S. Cairn-cross, “Interventions to improve water quality for preventingdiarrhoea: systematic review and meta-analysis,” BMJ, vol.334, no. 7597, p. 782, 2007.
[3] J. Keiser, J. Utzinger, M. Caldas de Castro, T. A. Smith, M.Tanner, and B. H. Singer, “Urbanization in sub-saharan Africaand implication for malaria control,” American Journal ofTropical Medicine and Hygiene, vol. 71, supplement 2, pp. 118–127, 2004.
[4] A. J. McMichael, “The urban environment and health ina world of increasing globalization: issues for developing
countries,” Bulletin of the World Health Organization, vol. 78,no. 9, pp. 1117–1126, 2000.
[5] J. Fobil, J. May, and A. Kraemer, “Assessing the relationshipbetween socioeconomic conditions and urban environmentalquality in Accra, Ghana,” International Journal of Environmen-tal Research and Public Health, vol. 7, no. 1, pp. 125–145, 2010.
[6] A. Caprara, J. W. Lima, A. C. P. Marinho, P. G. Calvasina,L. P. Landim, and J. Sommerfeld, “Irregular water supply,household usage and dengue: a bio-social study in theBrazilian Northeast,” Cadernos de Saude Publica, vol. 25,supplement 1, pp. S125–S136, 2009.
[7] J. Mouchet and P. Carnevale, “Impact of changes in theenvironment on vector-transmitted diseases,” Sante, vol. 7, no.4, pp. 263–269, 1997.
[8] R. R. Hemme, J. L. Tank, D. D. Chadee, and D. W. Severson,“Environmental conditions in water storage drums and influ-ences on Aedes aegypti in Trinidad, West Indies,” Acta Tropica,vol. 112, no. 1, pp. 59–66, 2009.
[9] B. Genser, A. Strina, L. A. dos Santos et al., “Impact of acity-wide sanitation intervention in a large urban centre onsocial, environmental and behavioural determinants of child-hood diarrhoea: analysis of two cohort studies,” InternationalJournal of Epidemiology, vol. 37, no. 4, pp. 831–840, 2008.
[10] M. L. Barreto, B. Genser, A. Strina et al., “Effect of city-wide sanitation programme on reduction in rate of childhooddiarrhoea in northeast Brazil: assessment by two cohortstudies,” The Lancet, vol. 370, no. 9599, pp. 1622–1628, 2007.
[11] R. Khosla, A. Bhanot, and S. Karishma, “Sanitation: a call onresources for promoting urban child health,” Indian Pediatrics,vol. 42, no. 12, pp. 1199–1206, 2005.
[12] P. T. Baker and R. M. Garruto, “Health transition: examplesfrom the western Pacific,” Human Biology, vol. 64, no. 6, pp.785–789, 1992.
[13] T. Clasen, L. Haller, D. Walker, J. Bartram, and S. Cairn-cross, “Cost-effectiveness of water quality interventions forpreventing diarrhoeal disease in developing countries,” Journalof Water and Health, vol. 5, no. 4, pp. 599–608, 2007.
[14] W. P. Schmidt, S. Cairncross, M. I. Barreto, T. Clasen, and B.Genser, “Recent diarrhoeal illness and risk of lower respiratoryinfections in children under the age of 5 years,” InternationalJournal of Epidemiology, vol. 38, no. 3, pp. 766–772, 2009.
[15] W. P. Schmidt and S. Cairncross, “Household water treatmentin poor populations: is there enough evidence for scaling upnow?” Environmental Science and Technology, vol. 43, no. 4,pp. 986–992, 2009.
[16] W.-P. Schmidt, S. Boisson, B. Genser et al., “Weight-for-agez-score as a proxy marker for diarrhea in epidemiologicalstudies,” Journal of Epidemiology & Community Health, vol. 64,no. 12, pp. 1074–1079, 2009.
[17] R. Few, I. Lake, P. R. Hunter, P. G. Tran, and V. T. Thien,“Seasonal hazards and health risks in lower-income countries:field testing a multi-disciplinary approach,” EnvironmentalHealth, vol. 8, supplement 1, p. S16, 2009.
[18] A. Bomblies, J. B. Duchemin, and E. A. B. Eltahir, “Amechanistic approach for accurate simulation of village scalemalaria transmission,” Malaria Journal, vol. 8, p. 223, 2009.
[19] M. O. Ndiath, C. Brengues, L. Konate et al., “Dynamicsof transmission of Plasmodium falciparum by Anophelesarabiensis and the molecular forms M and S of Anophelesgambiae in Dielmo, Senegal,” Malaria Journal, vol. 7, p. 136,2008.

10 Journal of Environmental and Public Health
[20] C. J. M. Koenraadt and L. C. Harrington, “Flushing effectof rain on container-inhabiting mosquitoes Aedes aegyptiand Culex pipiens (Diptera: Culicidae),” Journal of MedicalEntomology, vol. 45, no. 1, pp. 28–35, 2008.
[21] J. H. J. Ensink, M. Mukhtar, W. van der Hoek, and F.Konradsen, “Simple intervention to reduce mosquito breedingin waste stabilisation ponds,” Transactions of the Royal Societyof Tropical Medicine and Hygiene, vol. 101, no. 11, pp. 1143–1146, 2007.
[22] Y. Ye, M. Hoshen, V. Louis, S. Seraphin, I. Traore, and R.Sauerborn, “Housing conditions and Plasmodium falciparuminfection: protective effect of iron-sheet roofed houses,”Malaria Journal, vol. 5, p. 8, 2006.
[23] K. P. Paaijmans, M. O. Wandago, A. K. Githeko, and W.Takken, “Unexpected high losses of Anopheles gambiae larvaedue to rainfall,” PLoS One, vol. 2, no. 11, Article ID e1146,2007.
[24] L. S. Kalkstein and K. E. Smoyer, “The impact of climatechange on human health: some international implications,”Experientia, vol. 49, no. 11, pp. 969–979, 1993.
[25] U. S. Murty, M. S. Rao, and N. Arunachalam, “The effects ofclimatic factors on the distribution and abundance of Japaneseencephalitis vectors in Kurnool district of Andhra Pradesh,India,” Journal of Vector Borne Diseases, vol. 47, no. 1, pp. 26–32, 2010.
[26] A. Bomblies and E. A. B. Eltahir, “Assessment of the impactof climate shifts on malaria transmission in the Sahel,”EcoHealth, vol. 6, no. 3, pp. 426–437, 2010.
[27] C. Linard, N. Poncon, D. Fontenille, and E. F. Lambin, “Riskof malaria reemergence in southern France: testing scenarioswith a multiagent simulation model,” EcoHealth, vol. 6, no. 1,pp. 135–147, 2009.
[28] F. Severini, M. Di Luca, L. Toma, and R. Romi, “Aedesalbopictus in Rome: results and perspectives after 10 yearsof monitoring,” Parassitologia, vol. 50, no. 1-2, pp. 121–123,2008.
[29] S. R. Ferrer, A. Strina, S. R. Jesus et al., “A hierarchicalmodel for studying risk factors for childhood diarrhoea: acase-control study in a middle-income country,” InternationalJournal of Epidemiology, vol. 37, no. 4, pp. 805–815, 2008.
[30] J. B. Gingrich, R. D. Anderson, G. M. Williams, L. O’Connor,and K. Harkins, “Stormwater ponds, constructed wetlands,and other best management practices as potential breedingsites for West Nile virus vectors in Delaware during 2004,”Journal of the American Mosquito Control Association, vol. 22,no. 2, pp. 282–291, 2006.
[31] Y. R. Chen, J. S. Hwang, and Y. J. Guo, “Ecology and control ofdengue vector mosquitoes in Taiwan,” Gaoxiong Yi Xue Ke XueZa Zhi, vol. 10, pp. S78–S87, 1994.
[32] J. S. Hwang and G. D. Roam, “Recovery and disposal ofdiscarded tires in the Taiwan area,” Kaohsiung Journal ofMedical Sciences, vol. 10, pp. S52–S55, 1994.
[33] W. M. Guelbeogo, N. Sagnon, O. Grushko et al., “Seasonaldistribution of anopheles funestus chromosomal forms fromBurkina Faso,” Malaria Journal, vol. 8, p. 239, 2009.
[34] C. J. Vitek and A. Livdahl, “Hatch plasticity in response tovaried inundation frequency in Aedes albopictus,” Journal ofMedical Entomology, vol. 46, no. 4, pp. 766–771, 2009.
[35] V. K. Dua, A. C. Pandey, K. Raghavendra, A. Gupta, T. Sharma,and A. P. Dash, “Larvicidal activity of neem oil (Azadirachtaindica) formulation against mosquitoes,” Malaria Journal, vol.8, p. 124, 2009.
[36] A. P. Albicocco and D. Vezzani, “Further study on Ascogrega-rina culicis in temperate Argentina: prevalence and intensityin Aedes aegypti larvae and pupae,” Journal of InvertebratePathology, vol. 101, no. 3, pp. 210–214, 2009.
[37] H. T. Nguyen, P. I. Whelan, M. S. Shortus, and S. P. Jacups,“Evaluation of bifenthrin applications in tires to prevent Aedesmosquito breeding,” Journal of the American Mosquito ControlAssociation, vol. 25, no. 1, pp. 74–82, 2009.
Copyright © 2022 FDOKUMEN