
negotia - STUDIA UNIVERSITATIS Babes-Bolyai
178
NEGOTIA 1/2010
-
Upload
khangminh22 -
Category
Documents
-
view
3 -
download
0
Transcript of negotia - STUDIA UNIVERSITATIS Babes-Bolyai

NEGOTIA1/2010
The current issue of Studia Negotia is dedicated to the papers presented at
THE INTERNATIONAL CONFERENCE
SMALL AND MEDIUM SIZED
ENTERPRISES
IN EUROPEAN ECONOMIES
AND ALL OVER THE WORLD
4th edition
2009 September 24 - 25 Cluj-Napoca, România
Organized by the Faculty of Business

ANUL LV 2010
S T U D I A
UNIVERSITATIS BABE Ş–BOLYAI
NEGOTIA
1
Desktop Editing Office: 51ST B.P. Haşdeu, Cluj-Napoca, Romania, phone + 40 264-40.53.52
SUMAR - SOMMAIRE - CONTENTS - INHALT PALOMA LOPEZ-GARCIA, SERGIO PUENTE, What Makes a High-Growth Firm
in Spain? A Probit Analysis Using Firm-Level Data ......................................................5
NIKOLA KNEGO, Importance of Crafts in Distributive Trade of the Republic of Croatia...........................................................................................................................33
HANA ŠTVERKOVÁ, SIMONA HOFROVÁ, Competitiveness of SMEs and Trends on the Market ................................................................................................................49
MEDET YOLAL, FATMAGUL CETINEL, Business Goals of Family-Operated Accommodation Enterprises: the Case of Mugla, Turkey ............................................61
ATTILA KURUCZ, Strategy Competences and Performance Measurement in the Hungarian SMEs Sector................................................................................................73
MARIANA DRAGUSIN, ALINA BALALIA, Cooperation Between SMEs and Higher Education Institutions - Effective Tool for Entrepreneurial Education.........................87
ION STANCU, SANDA TREANTA, IONUT DUMITRU, Financing Tools for Supporting SMEs in Romania .........................................................................................................99
MONICA BIOLAN, ILIE GAVRILA , The State of SME’s Economic and Social Rationality...................................................................................................................117

ANCA MARIA STĂNCULESCU, LILIANA GRIGORE, ANDREEA MIHAELA GAGEA, BOGDAN GEORGESCU, The Born Global Model for Romanian Small and Medium Enterprises Internationalization .............................................................129
ALINA FLORENTINA AVRIGEANU, FLAVIA GABRIELA ANGHEL, ELENA RADU, Pluses and Minuses of Being in a Global Value Chain – the Case of Romanian Apparel SMEs.............................................................................................................143
ANA-MARIA GRIGORE, CĂTĂLINA RADU, Reengineering the Management System in Small and Medium Enterprises’ from Romania......................................................159
VALENTINA DIANA IGN ĂTESCU, Measures to Support SMEs in the European Union...........................................................................................................................167
CRISTINA CURUłIU, Will the Romanian SMEs be Listed on the Bucharest Stock Exchange? ...................................................................................................................175

STUDIA UNIVERSITATIS BABEŞ-BOLYAI, NEGOTIA, LV, 1, 2010
WHAT MAKES A HIGH-GROWTH FIRM IN SPAIN? A PROBIT ANALYSIS USING FIRM-LEVEL DATA
PALOMA LOPEZ-GARCIA1, SERGIO PUENTE2
ABSTRACT. Many studies have established that a small number of firms, known as fast-growth firms or Gazelles, create most of the new jobs. In spite of the importance of this topic from a policy-point of view, most of those studies are descriptive and limited to a comparison of the characteristics of the high-growth group with respect to a control group of firms. This paper, on the other hand, performs a multivariate analysis of the determinants of the fast growth of Spanish firms controlling for the possible endogeneity of some variables. We use for that purpose a firm-level database with information for about 200,000 Spanish firms per year between 1996 and 2003. We find that being a start-up increases the probability of fast growth by more than 30pp, conditioned on having survived over the period. Firms with initial higher relative wages and debt ratio, up to a certain point, also experience higher chances of fast growth. Hence, as it was established elsewhere, better access to finance and to human capital are key to increase the number and growth of Gazelles. We also find that high-growth firm sustain their expansion with relatively more debt and fixed-term contracts than the rest of the firms in the sample.
Key words: High-growth firms; Gazelles; Probit analysis; Firm-level data
JEL Classification: L25; J23
Introduction
Over decades there has been much debate about whether small or large firms contribute the most to net employment creation (Birch 1981 and Davis et al 1996). There is, however, broad consensus about the fact that relatively few firms, be them small or large, known as high-growth firms or Gazelles3, are responsible for the majority of jobs created. Birch and Medoff (1994), for example, estimate for the USA that during the 1988-1992 period, 4% of ongoing firms created about 60%
1 Bank of Spain, Research Department, [email protected] 2 Bank of Spain, Research Department, [email protected] 3 Birch named the group of high-growth firms “Gazelles” in opposition to the group of small slow growers,
”mice” and the group of large slow growers, “elephants” (see Henrekson and Johansson 2008 for a literature review). Later, the OECD (Ahmad 2006) proposed to use the term Gazelle exclusively to mark young high-growth firms, usually defined as having less than 5 years of operations. In this work we will use indistinctly the terms high-growth firms or Gazelles, independently on the age of the firms.

PALOMA LOPEZ-GARCIA, SERGIO PUENTE
6
of the jobs. Similarly, Storey (1994) reviews several studies for diverse countries and estimates than, in average, 4% of firms get to create about half of new jobs over a decade. Schreyer (2000) reviews the results from 6 OECD countries4 and concludes that, in spite of the diverse data sources and methodologies, high-growth firms account for a disproportionately large part of net job creation in all countries analysed. Not only that, as Figure 1 below shows there is a strong correlation between the prevalence rate of Gazelles in different OECD countries and their corresponding aggregate employment variation rates.5 Of course a simple bivariate scatterplot as the one shown in Figure 1 does not necessarily capture any causal relationship between gazelles and aggregate employment creation rates, but taken together with the reported evidence on the important net job creation of high-growth firms, it constitutes a wake-up call for policy-makers.
But what do we know about Gazelles? What do they look like? Where are they? What can governments do so there are more of them? In spite of different criteria used in the literature to classify a firm as a Gazelle, different data sources, time periods or methodologies, a number of results turn out to be quite robust. First, although high-growth firms can be of all sizes, small firms seem to be overrepresented. Moreover, among high-growth firms, small firms’ job creation rates exceed those of large ones. 4 Germany, Netherlands, Italy, Spain, Sweden and the region of Quebec, in Canada. 5 The prevalence rates have been estimated by Hoffman and Junge (2006). They correspond to 17 OECD
countries and 3 different two-year periods: 1999-2001, 2000-2002 and 2001-2003. The Figure shows the pooled rates against the corresponding two-year employment variation rates obtained from the OECD STAN database. The sectors considered are industry and services.
GAZELLES VERSUS EMPLOYMENT VARIATION FOR SOME OECD COUNTRIES: 99-01; 00-02; 01-03
Sources: Bank of Spain Firm Demography Database and OECD STAN Database.
-2 0 2 4 6 8
10
0 1 2 3 4 5 6 7 8
%
PREVALENCE RATES OF GAZELLES
EMPLOYMENT VARIATION RATES
%
R2 = 0,3567
Figure 1

WHAT MAKES A HIGH-GROWTH FIRM IN SPAIN? A PROBIT ANALYSIS USING FIRM-LEVEL DATA
7
Although there are large firms classified as well as Gazelles, their employment growth is mostly “acquired”, that is, due to some kind of restructuring such as mergers or acquisitions. Second, high-growth firms tend to be younger than average. Overall it seems that newness is a more important factor for this group of firms than smallness. And third, there are high-growth firms in all industries not only, as it could be believed, in high-technology industries. If anything, there seems to be some overrepresentation in market services.6
Apart from size, sector and age, variables included in almost every single study on this topic, other dimensions of interest are analysed as well by a number of papers. For example, there is some consensus about the fact that high-growth firms are more technology intensive than average firms. EIM (2006) estimates that in the Netherlands about 40% of high-growth firms spend 10% of turnover or more in R&D whereas only 30% of slow growers devote such an effort to those activities. Schreyer (2000) finds a similar result in his review of the phenomenon in 6 OECD countries. In Spain, for example, he estimates that whereas about 50% of manufacturing firms undertake some R&D activity, the percentage increases to 70% when it comes to high-growth firms.7
The fact that Gazelles tend to be, to a certain extent, technology intensive young small firms explains the frequency with which they report having difficulties accessing to external financing. Indeed, there are at least four specific characteristics of R&D investment which might explain the existence of credit restrictions (see Hall 2002): First, the investment outcome is highly uncertain and, therefore, risky. Second, information asymmetries might be very important –and insurmountable– due to the secrecy around this type of activities to protect intellectual property. Third, the output of this investment is, broadly speaking, knowledge, an intangible asset which is very difficult to collateralize. And fourth, there is a long gap of time between the time of investment and the time of reaping the rewards from it. Hence, innovative firms might have a cash-flow shortage problem that could difficult even further their access to finance. Add to this equation the reported difficulties of young small firms to access finance –due to lack of track record or collateral8—and you have a probable case of underinvestment which might be reducing the number of high-growth firms.
Additionally, high-growth firms seem to spend more time and money in staff training and to hire more qualified workers than the average firm. EIM (2006), for example, estimates that Gazelles spend 70% more of time in staff training than slow growers. The information we have about this phenomenon stemming from interviews with entrepreneurs point in the same direction: Europe’s 5009, for example, shows that the key for success of the European most dynamic entrepreneurs during the 80s was human capital.
6 See for example the literature review of Henreksson and Johansson (2008). 7 The Spanish case study of Schreyer (2000) is based on the “Encuesta sobre Estrategias Empresariales”, a
representative sample of manufacturing firms with more than 10 employees. 8 See Coluzzi et al (2008). 9 Europe’s 500 focus on the 500 most dynamic European entrepreneurs between 1979 and 1984.

PALOMA LOPEZ-GARCIA, SERGIO PUENTE
8
Finally, in Schreyer (2000) some country studies distinguish between independent firms and those that are partly or wholly owned by another firm. All of them conclude that dependent firms play a more than proportional part in the group of high-growth firms. They attribute this finding to three possible factors, also associated to reported constraints to growth: 1) dependent firms have easier access to finance; 2) dependent firms have better access to human capital whenever recruitment, training and mobility involve fixed costs and/or a minimum size; 3) dependent firms have easier access to information about markets, products and technologies.
In spite of the importance of this topic from a policy-point of view, most of the studies of Gazelles are descriptive and limited to a comparison of the characteristics of the high-growth group with respect to a control group of firms. However, a multivariate analysis of the determinants of the fast growth of firms would be required to disentangle the effect of the different variables reported to be important. That is precisely the first aim of this paper. Using firm-level data for Spanish firms, operating in all sectors of the economy, we run a probit regression to estimate the partial effect of each of the possible determinants of high-growth suggested by the literature reviewed above. Among those determinants we include sector of activity, age and region but also the capital structure of the firm and the relative qualification of the workforce at the beginning of the period. Given the fact that we have several years of information we are able to control for the fact that a firm marked as a gazelle in a certain period was also a high-growth firm in the previous period. Apart from controlling for possible endogeneity problems this procedure will allow us to study the growth inertia of this group of firms.
The second contribution of the paper is the analysis of the characteristics and determinants of Gazelles for the specific case of Spain. To the best of our knowledge, the only other paper addressing the phenomenon in Spain is Schreyer (2000), who summarises the results from 6 OECD country studies using a homogeneous methodology and treatment of the data so as to be as comparable as possible.10 The Spanish study is based on the Encuesta sobre Estrategias Empresariales (ESEE) database, including firm-level information for about 1200 manufacturing established firms for the period 1990 to 1994. The dataset includes a representative sample of firms with more than 10 but less than 200 employees and virtually all firms with more than 200 employees. Given the results elsewhere about the newness of high-growth firms as well as their overrepresentation in the service sector, the exclusion of entries and the focus of the Spanish study in the manufacturing sector could be affecting the results. Moreover, the study excludes all firms with less than 10 employees which, given the reduced average size of firms in Spain, could also be leaving out of the analysis a large number of potential fast growers.
10 Hoffman and Junge (2006) count the number of high-growth firms in Spain, in order to compare it with
that in other countries, but they do not perform any further analysis about Gazelles´ characteristics or determinants.

WHAT MAKES A HIGH-GROWTH FIRM IN SPAIN? A PROBIT ANALYSIS USING FIRM-LEVEL DATA
9
The database used in this paper has been constructed at the Bank of Spain to overcome these problems. It contains firm-level information from the provincial firm registries and the National Institute of Statistics (INE) and offers at least four advantages with respect to other databases. First, there is little undersampling of small and young firms. Second, it includes all entries and exits. Third, it covers the whole market economy (but the financial sector). Fourth and last characteristic of our dataset is that the relatively long time span allows us to study different waves of high-growth firms so as to check the consistency of our findings as well as to control for possible endogeneity.
The next section describes briefly the database and goes over the definition of high-growth firms used in this paper. Section 3 performs a descriptive analysis of Gazelles which includes an account of their importance in terms of employment in Spain. Section four performs a probit analysis in order to study the main determinants of fast employment growth. Section five looks at the growth process of this group of firms. The purpose is to learn what type of employees and finance use Gazelles in Spain to sustain their impressive growth. Finally, section six concludes.
1. Data and definitions
1.1 The database
The Bank of Spain Firm Demography Database (BSFDD) contains information on sector of activity (at 4 digits), region, legal form, employment and some entries from the balance sheet at firm-level for about 90,000-200,000 Spanish Limited Liability Societies and Corporations operating in all sectors of the market economy (but the financial one) each year between 1996 and 2003. Data come from two sources: the “Directorio Central de Empresas” (DIRCE)11, with information stemming from tax and social security records, and the “Central de Balances del Banco de España” (CB), which processes data from the provincial firm registries.
For a detailed account of the construction of the dataset, please refer to Lopez-Garcia and Puente (2007). However, three important points of the construction process are worth stressing and repeating here. First of all, although all companies (not self-employed) are obliged by law to deposit every year their financial accounts in the provincial firm registries, they often choose not to. Moreover, reporting employment data is not compulsory but voluntary. The result is that amongst the firms that present coherent financial statements and employment figures at least one year, many disappear from the registry to appear year/s later. That means that we are unable to deduct the date of entry and exit of the firms solely from the presence or absence of data in the registry, as it is done in other countries. For that reason we had to resort to a second data source, DIRCE, to get information on all entries and exits within the period of analysis.12 Information for all the rest of active firms every year comes from the firm registries.
11 Managed by the National Institute of Statistics (INE). 12 DIRCE has provided as well the employment, region and the sector of activity at entry or exit.

PALOMA LOPEZ-GARCIA, SERGIO PUENTE
10
Secondly, the unit of production considered is the firm. We only have data on Limited Liability Companies and Corporations, not on self-employed workers.13 There are no employment thresholds, that is, we also have firms with no employees (only when they are constituted as Limited Liabilities Companies or Corporations). Thirdly, as it was mentioned before, the number of firms, as well as their employment and sector of activity, which enter or exit the market every year is provided by DIRCE. DIRCE records an entry whenever a new fiscal identification number is given to a firm. An exit is recorded when a fiscal identification number disappears. That means that any restructuring of firms (M&A) resulting in a new identification number will be recorded as an entry by DIRCE. Using information from large firms collaborating with the Bank of Spain we have estimated that around 5% of entries of firms with less than 20 employees and most of the entries recorded by DIRCE of firms with more than 100 employees could be the result of some kind of restructuring process or “false” entries. Moreover, we have no way to know whether observed employment growth of already established firms responds to an internal process of growth or, on the contrary, it is “acquired” growth stemming from M&A.14 Please keep these caveats in mind when interpreting the results of the paper.
Firms in this literature are classified as fast growers on the basis of their employment or turnover growth over a period of several years. Given the fact that we have information for a relatively longer time span, from 1996 to 2003, we construct five different 3-year datasets15 and study the characteristics of high-growth firms in each of them. This procedure makes it possible to check the robustness of our results given that fast growers are not always the same across windows. Moreover, it allows us to look into the immediate past and future of the fast growers in a certain window to study their growth volatility as well as to control for possible endogeneity in the empirical analysis.
1.2 Definition of high-growth firms
There are several criteria to classify a firm as a Gazelle which combine in one manner or the other employment size and growth rate. Birch et al. (1995), for example, required a positive turnover growth every year and a doubling of turnover in a five-year window. Firms had to have a minimum initial turnover of $100,000. Hoffman and Junge (2006) require a two-year growth of at least 60% with a minimum of 20% growth per year. There is as well a requirement on initial employment of 15 employees. Schreyer (2000) proposes in his OECD study a combined measure of relative and absolute firm employment growth following earlier work of Birch (1987). The idea is that a growth measure meant to reflect successful management, innovation
13 Which are about 60% of all Spanish firms. 14 This is important given that Davidsson and Delmar (2003) find that small firms grow organically to
a larger extent while larger firms do so through M&A. 15 The datasets are: 1996-1999; 1997-2000; 1998-2001; 1999-2002; 2000-2003.

WHAT MAKES A HIGH-GROWTH FIRM IN SPAIN? A PROBIT ANALYSIS USING FIRM-LEVEL DATA
11
strategies etc. should not a priori favour any firm size class. The proportional rate of change of employment, a relative measure, would introduce a clear bias towards small firms. On the other hand, absolute employment growth, measured in employees, would introduce a bias towards large firms. The combined indicator proposed, which will be called the “Schreyer indicator” and is shown in (1) below, has been proven to give rise to the smallest bias towards any size class.
( )t
ttt X
XXXS 33
++ −= (1)
where Xt+3 and Xt denote employment at the end and at the beginning of the period respectively. High-growth firms will be then chosen as the 10% with the highest value of the indicator.
The OECD proposes a second indicator to classify firms as high-growth similar to that of Birch (1995) and of Hoffman and Junge (2006). It is based on average annualised employment growth –it should be greater than 20% per year in a 3-year window—but with a minimum initial employment size of 10 employees requirement in order to minimise the bias towards small firms.16
Turnover measures of growth can give rise to comparability problems given the lack of consensus on how to deflate turnover as well as different criteria to measure service sector turnover. For that reason we prefer the employment growth criteria to classify firms as Gazelles,17 although an indicator based on value added growth will eventually be used to check the robustness of the results. Unless otherwise specified, we will use the two OECD employment based high-growth indicators: the combined indicator labelled as Schreyer indicator and an annualised growth of 20% over a period of 3 years with a minimum initial size of 10 employees, which will be called the OECD indicator. Given that the average size of firms in Spain is much smaller than that in other OECD countries18, we consider, however, the Schreyer indicator most appropriate for the Spanish analysis.
The selection of firms to be analysed in each of the 3-year windows was as follows: Firstly we selected all established and new firms in t, initial year of the period of analysis; those are the active firms in t, around 300,000 in average, as Table 1 shows. Then we chose among the active firms with one or more employee those that survived till the end of the period, t+3, and had complete employment data (both in t and t+3). That left us with about 100,000 firms in average every period. Lastly, according to the criteria provided in the next section, we marked the group of firms with high employment growth.
16 See Ahman (2006). 17 In any case, Hoffman and Junge (2006) find a very high correlation (0,89) between the employment
and turnover based prevalence rate of Gazelles. 18 Pagano and Schivardi (2003), for example, calculate that the average firm size in Spain is about
60% that in other European Union countries.

PALOMA LOPEZ-GARCIA, SERGIO PUENTE
12
3. Some descriptive analysis
Are there more or less Gazelles in Spain than in other developed economies? Although cross-country studies are rare due to data comparability problems, Hoffman and Junge (2006) show prevalence rates of Gazelles for a number of OECD countries, including Spain. They use the Bureau van Dijk firm-level data to estimate the percentage of high-growth firms in the population of continuing firms with 15-200 employees. Gazelles are defined as firms (sole proprietors are not included) with an employment growth rate higher than 60% over two years (from t to t+2) with a minimum annual growth of 20%. Table 2 below shows the prevalence rates across OECD countries for the three 2-year windows analysed. Spain (1) refers to the percentage of high-growth firms in Spain estimated by Hoffman and Junge (2006) and Spain (2) to the prevalence rate estimated using our data but the selection criteria of Hoffman and Junge (2006). The purpose of the comparison is to check the general validity of our data, although the cross-country comparison should be done with the Hoffman and Junge data for internal consistency reasons.
Table 2 shows that, averaging over the three periods, the share of high-growth firms in the USA doubles that found in EU countries. Secondly, Spain’s share of high-growth firms, according to the Bureau van Dijk data, is average within the European context, where Austria and Germany are at the bottom and UK and Portugal at the top of the ranking (considering all three periods).19 Although the evolution of the prevalence rate of Gazelles in Spain using both the Bureau van Dijk and our data is very similar, the percentage of high-growth firms in our database is larger. The reason could be that our sample includes only firms which have voluntarily deposited their accounts and employment information in the firm registries during the period of analysis. That is, there is a probable under-representation of firms going through difficulties. This possible self-selection problem should not affect, however, the results of the probit analysis since we study the relative characteristics of 19 Italy shows high prevalence rates of Gazelles when employment growth is used as defining criterion and
low prevalence rates when turnover is used instead. Hoffman and Junge (2006) attribute this fact to the poor quality of employment data of Italian firms in the Bureau van Dijk dataset.
1996-1999 1997-2000 1998-2001 1999-2002 2000-2003 ACTIVE FIRMS IN t 283,463 310,856 338,798 364,620 388,054 Of which survive to t+3 260,982 283,073 307,652 329,522 352,793 Of which have employment data at t and e t >=1 133,091 148,625 166,251 173,558 193,633 Of which have employment data at t and t+3 77,436 86,689 108,568 123,550 136,093 High-Growth Firms (Schreyer) 7,633 8,666 10,151 12,354 13,608 High-Growth Firms (OECD) 1,496 1,791 1,833 1,691 1,628
Source: Bank of Spain Firm Demography Database.
NUMBER OF FIRMS IN SAMPLE Table 1

WHAT MAKES A HIGH-GROWTH FIRM IN SPAIN? A PROBIT ANALYSIS USING FIRM-LEVEL DATA
13
high-growth firms when compared to the characteristics of the slow growers in the group. Furthermore, the fact that we count with a large number of firms in our sample ensures that those relative results are quite reliable.
We turn now to the importance in terms of employment of Gazelles in Spain. Figure 2 below shows the share of fast growers in the total number of firms, 10% by construction when the Schreyer indicator is used to classify firms as fast or slow growers, and 1.5% when the OECD criterion is used instead. We show it for the total sample of surviving firms as well as for the sample of small firms, those with less than 20 employees at the beginning of the period. In all cases, the employment share of Gazelles the first year of analysis (we show the average of the different windows studied) exceeds their share in the number of firms. That is, the average size of fast-growers is larger than that of the rest of surviving firms.20 The third bar in the Figure gives an idea of how much faster Gazelles grow when compared with the rest of surviving firms. Indeed, at the end of the period, surviving firms expanded in average their personnel in 2 employees over a 3-year period, vis-à-vis an expansion of 36 employees of Schreyer high-growth firms and more than 80 in OECD high-growth firms. Overall the 10% (1.5%) of firms classified as fast growers according to the Schreyer indicator (OECD indicator) were responsible for the creation of more than 500,000 (250,000) net jobs, in average, over a period of only three years. That is, high-growth firms are a non-trivial source of employment in Spain. 20 The average size of active firms in t which survive up to t+3 and provide data is, in average, 13 employees
versus 50 and 52 employees for Schreyer and OECD high-growth firms respectively.
Country 1999-2001 2000-2002 2001-2003 Austria 0.1 0.1 0.5 Belgium 2.2 1.4 1.0 Denmark 2.1 1.5 1.4 Finland 2.9 1.5 1.4 France 1.9 1.2 1.0 Germany 0.6 0.4 0.4 Italy 3.9 2.3 2.0 Japan 0.4 0.4 0.6 Korea 7.2 4.6 4.9 Netherlands 1.5 1.4 0.8 Norway 1.3 1.3 0.9 Portugal 4.7 1.4 1.4 Spain (1) 2.4 2.1 1.9 Spain (2) 3.7 2.9 2.9 Sweden 2.9 2.0 1.6 Switzerland 3.8 1.7 1.2 UK 3.9 3.0 2.7 USA 4.0 3.0 2.5 EU 2.4 1.5 1.3
Source: Hoffman and Junge (2006) and Bank of Spain Firm Demography Database.
Table 2 HIGH-GROWTH FIRMS IN SPAIN AND OTHER OECD COUNTRIES
%

PALOMA LOPEZ-GARCIA, SERGIO PUENTE
14
If we restrict the sample to small firms it seems that the average initial size of fast growers is only slightly larger than that of non-growers. But three years later, the average size of small fast growers is 18 employees whereas that of the sample of small surviving firms is 6. The result is that 7.7% of firms marked as fast-growers in the group of small firms account for about 80% of net employment creation over a three-year period of all firms classified as small.
Gazelles are therefore important job creators. What else do we know about
them? We proceed first to do a descriptive analysis similar to that in other studies on this same topic. We compare the distribution of firms according to size, sector, status and region in the high-growth group with the distribution in the control group (active firms in t that survived to t+3, present data in both years and are not classified as fast growers). Other studies (Birch and Medoff 1994, for example) show only the characteristics of the Gazelles, without comparing them with any control group, which, in our modest opinion, can be misleading. We show results for the group of high-growth firms according to the Schreyer definition. Results are very similar if we used the OECD criterion instead to classify firms as Gazelles.
Almost 70% of Gazelles start from small bases (less than 20 employees in the first year of the period of analysis). Hence, as it has been established in other studies, a majority of Gazelles are small. However, if we compare with the control group, small firms are actually underrepresented. Instead, medium-sized firms and large firms play a more than proportional part in the group of Gazelles.21 Similarly, although
21 Recall, however, that we cannot disentangle internal from acquired growth.
Figure 2
Source: Bank of Spain Firm Demography Database.
0 10 20 30 40 50 60
HIGH-GROWTH FIRMS (SCHREYER) SMALL HIGH-GROWTH FIRMS (SCHREYER) HIGH-GROWTH FIRMS (OECD)
PERCENTAGE OF FIRMS
PERCENTAGE OF EMPLOYMENT: STARTING YEAR
PERCENTAGE OF EMPLOYMENT: FINAL YEAR%
HIGH-GROWTH FIRMS AND EMPLOYMENT

WHAT MAKES A HIGH-GROWTH FIRM IN SPAIN? A PROBIT ANALYSIS USING FIRM-LEVEL DATA
15
there are high-growth firms across all sectors they tend to be concentrated in the market service sector, although to a lesser extent than slow growers. Hence, manufacturing and, above all, construction firms are overrepresented in the Gazelle group.22 If we grouped industries according to their technology intensity, as in van Ark et al (2003), we could see that Gazelles are more concentrated in all manufacturing industries, independently on their technology degree, when compared to slow growers. There are differences, however, across service industries of different technology intensity.
22 According to the Spanish National Accounts, employment in construction increased by 50% between
1996 and 2003, which can help explaining the high prevalence of fast-growth firms in that sector over the period of analysis.
Average Gazelles Rest BY SIZE Small (<20) 68.5 91.5Medium (20-250) 27.5 8.2Large >250 4.0 0.4BY SECTOR Manufacturing 27.4 22.3Construction 20.2 14.3Market services 52.4 63.4ICT-producing manufacturing 0.6 0.3ICT-producing services 2.5 1.1ICT-using manufacturing 8.2 7.5ICT-using services 26.3 35.1non-ICT manufacturing 19.1 15.0non-ICT services 22.0 25.8non-ICT others 21.2 15.1BORN AT t 24.5 13.5BY REGION Andalucía 12.4 11.7Aragón 4.5 5.4Asturias 2.0 2.1Baleares 1.5 1.3Canarias 1.8 1.2Cantabria 0.4 0.2Castilla la Mancha 3.3 4.0Castilla y León 4.2 5.3Cataluña 24.4 25.2Comunidad Valenciana 17.1 18.6Extremadura 1.1 1.3Galicia 2.8 2.5La Rioja 0.6 0.8Madrid 15.6 12.8Murcia 1.6 1.1Navarra 1.5 1.4País Vasco 4.5 4.4Ceuta y Melilla 0.1 0.1
Source: Bank of Spain Firm Demography Database.
Table 3 CHARACTERISTICS OF GAZELLES IN SPAIN
%
PALOMA LOPEZ-GARCIA, SERGIO PUENTE
16
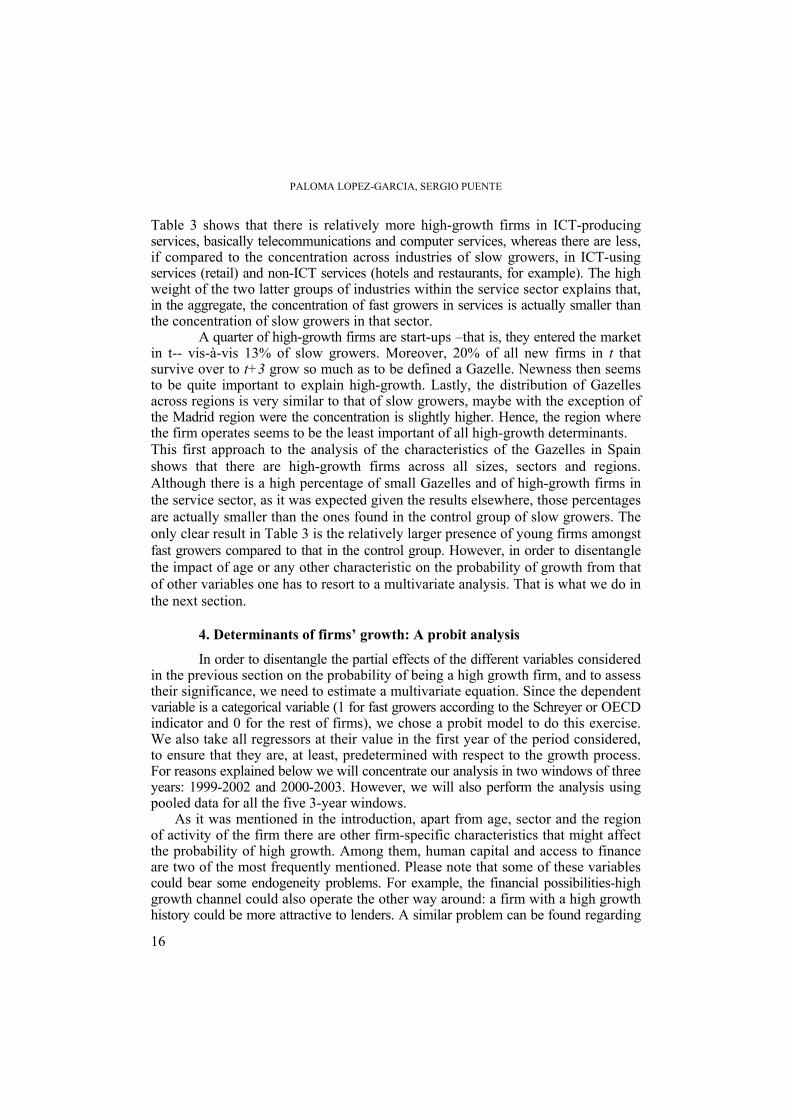
Table 3 shows that there is relatively more high-growth firms in ICT-producing services, basically telecommunications and computer services, whereas there are less, if compared to the concentration across industries of slow growers, in ICT-using services (retail) and non-ICT services (hotels and restaurants, for example). The high weight of the two latter groups of industries within the service sector explains that, in the aggregate, the concentration of fast growers in services is actually smaller than the concentration of slow growers in that sector.
A quarter of high-growth firms are start-ups –that is, they entered the market in t-- vis-à-vis 13% of slow growers. Moreover, 20% of all new firms in t that survive over to t+3 grow so much as to be defined a Gazelle. Newness then seems to be quite important to explain high-growth. Lastly, the distribution of Gazelles across regions is very similar to that of slow growers, maybe with the exception of the Madrid region were the concentration is slightly higher. Hence, the region where the firm operates seems to be the least important of all high-growth determinants. This first approach to the analysis of the characteristics of the Gazelles in Spain shows that there are high-growth firms across all sizes, sectors and regions. Although there is a high percentage of small Gazelles and of high-growth firms in the service sector, as it was expected given the results elsewhere, those percentages are actually smaller than the ones found in the control group of slow growers. The only clear result in Table 3 is the relatively larger presence of young firms amongst fast growers compared to that in the control group. However, in order to disentangle the impact of age or any other characteristic on the probability of growth from that of other variables one has to resort to a multivariate analysis. That is what we do in the next section.
4. Determinants of firms’ growth: A probit analysis
In order to disentangle the partial effects of the different variables considered in the previous section on the probability of being a high growth firm, and to assess their significance, we need to estimate a multivariate equation. Since the dependent variable is a categorical variable (1 for fast growers according to the Schreyer or OECD indicator and 0 for the rest of firms), we chose a probit model to do this exercise. We also take all regressors at their value in the first year of the period considered, to ensure that they are, at least, predetermined with respect to the growth process. For reasons explained below we will concentrate our analysis in two windows of three years: 1999-2002 and 2000-2003. However, we will also perform the analysis using pooled data for all the five 3-year windows.
As it was mentioned in the introduction, apart from age, sector and the region of activity of the firm there are other firm-specific characteristics that might affect the probability of high growth. Among them, human capital and access to finance are two of the most frequently mentioned. Please note that some of these variables could bear some endogeneity problems. For example, the financial possibilities-high growth channel could also operate the other way around: a firm with a high growth history could be more attractive to lenders. A similar problem can be found regarding

WHAT MAKES A HIGH-GROWTH FIRM IN SPAIN? A PROBIT ANALYSIS USING FIRM-LEVEL DATA
17
the effect of average human capital. Our strategy to tackle this potential endogeneity problem is twofold. First, given that we have data from 1996 to 2003 we are in a position to control for the fact that firms marked as Gazelles in one period experienced also fast growth in the previous period.23 We can do this exercise for two 3-year windows, namely, 1999-2002 and 2000-2003. Controlling for past growth, not only reduces the importance of endogeneity issues, but also allows us to estimate the growth inertia, if any. The second strategy to tackle a possible endogeneity problem is to instrument for the two possible endogenous regressors, financial structure and human capital, using as instruments the lagged values of the variables.24
4.1. Explanatory variables
What follows is a short description of the explanatory variables and controls included in the analysis.
Capital structure of the firm Firms’ expansion requires financing. If due to information asymmetries, moral
hazard, lack of tangible collateral or cash-flow problems some firms face financing constraints that hamper their growth, their financial structure will affect the probability of growth. In order to estimate this effect, we include as a regressor the share of total debt (long and short term) over total liabilities of a firm (we also try using only the share of long-term debt over total liabilities). The reasoning behind the use of this variable is that all the problems stated before should have a stronger effect on debt than on equity.25 If this is the case, a higher debt ratio could be a proxy for lower financing constraints. However, a very high gearing could increase the risk of a firm to find financing difficulties, or reflect past profitability or solvency problems. In order to capture possible non monotonic effects of the variable we included also among the explanatory variables a quadratic debt term.
Human capital Gazelles have been reported to spend more time and resources in staff training
and to employ, in average, more qualified staff than slow growers. To estimate the quantitative impact of a firm’s human capital upon its growth probability we include as a regressor two possible proxies for human capital: average salary and the salary
23 More concretely, we analyse high-growth firms in the period 1999-2002 controlling for past growth
in the adjacent period 1996-1999. Similarly, we analyse Gazelles in 2000-2003 controlling for the fact that they were, or not, Gazelles in 1997-2000.
24 Given that the maximum likelihood estimation does not lead to convergence we use the Newey’s two-step estimator which allows fitting a probit model with multiple endogenous regressors. However, this methodology tests whether the estimated coefficient of the endogenous regressor is significantly different from zero, but it cannot be used for postestimation analyses such as calculating marginal effects. Hence the probit results will be shown as a robustness check but the marginal effect of the variables will be computed for the model controlling for past growth of firms (our first strategy to tackle the endogeneity problem).
25 Hall (2002) reviews a number of papers testing the existence of financing restrictions to innovative firms and concludes that debt is a disfavoured source of finance for R&D investment.

PALOMA LOPEZ-GARCIA, SERGIO PUENTE
18
premium paid by the firm. The first human capital proxy, the average wage, is computed simply as the ratio of total wage bill over total employment. The second proxy, the wage premium, is calculated as the ratio of the average wage paid in the firm to that paid in other firms of the same 2-digit sector.
Age The estimation of the effect of age deserves special attention. Ideally, one
should estimate the effect of each possible age on the probability of high growth. Unfortunately, our dataset does not have this information; we know the birth year of a firm only if it was created between 1996 and 2003. Moreover, the fact that we control for past growth of the firms marked as Gazelles in a given period implies that those high-growth firms had to be active over the previous period. For these two reasons we can only control for the fact that firms entered the market, or were already operating in it, at t-3. That is, when we analyse for example the determinants of firms marked as Gazelles during the period 1999-2002 we control for the fact that they were, or not, fast growers over the previous period, 1996-1999. That means that we can only mark firms that entered the market in 1996, the first year of the previous period. Consequently, our analysis of the effect of firm’s age is limited to a dummy variable indicating if the firm is relatively younger (has three years of operations) than the rest.
If we did not control for past growth, that is, if there was no requirement for the firm to be active over the previous 3-year period, then we could control for the fact that the firm is a start-up. We do so in the pooled estimation of a probit model, where information on Gazelles in every 3-year window (five in total) is included.
Controls Given the results of table 2 and of other studies we include as controls the
region and sector of activity of the firm. In the case of sector of activity, we try with five sector dummies grouping manufacturing and service industries according to their technology intensity, with 9 dummies for lower level sector aggregations as well as with 45 2-digit sector dummies.26As it has already been explained, we also include as a control a dummy capturing whether the firm was classified as a Gazelle in the previous adjacent period. Finally, in all the pooled data estimations we include a time dummy to control for the business cycle.
It is worth noting that size is not among the explanatory variables. The reason is that both definitions of high growth presented above combine in some way two elements: growth rate and size.27 Hence size cannot be one of the regressors.
26 The 5 sectors differing in technology intensity are: ICT producing and using manufacturing which are
grouped under ICT manufacturing, non-ICT manufacturing, ICT services, non-ICT services and non-ICT others (basically, construction, utilities and mining). For a detailed account of these sectors, please refer to Annex 2. The 9 lower level sector aggregations are: Mining, manufacturing, utilities, construction, retail, hotels and restaurants, transports, telecommunications and other services.
27 This is obvious for the OECD definition. Regarding the Schreyer indicator, simple algebra reveals that it is the product of a quadratic growth term and a size term.

WHAT MAKES A HIGH-GROWTH FIRM IN SPAIN? A PROBIT ANALYSIS USING FIRM-LEVEL DATA
19
Table 4 below provides the basic descriptive statistics and definitions of the explanatory variables for the group of Gazelles (according to the Schreyer indicator) and for the rest of firms.
4.2. Results
Table 5 shows the result for six different models. Since we are estimating a probit model, the quantitative effect of the determinants on the probability of being a Gazelle vary with the value of the rest of covariates. Hence those effects will be reported separately in table 6.28 Models 1 to 4 show the estimation of the probit model for windows 1999-2002 and 2000-2003, being 1996-1999 and 1997-2000 the two respective adjacent previous windows used to control for the past growth of firms. Models 5 and 6 show the results of the pooled data estimations. Model 1 includes all the variables presented above, including the dummy for the past growth of firms and it is our benchmark model. Model 2 shows the interaction of the dummy for past growth with eight sector dummies. Model 3 is like model 1, but excluding the dummy capturing the growth inertia.29 Model 4 uses as instruments for the debt and wage their lagged values. The purpose of model 3 and 4 is to check whether the
28 Marginal effects will be calculated for Model 1, our benchmark model, where past growth is controlled
for and human capital is proxied by the relative wage paid in the firm. 29 Both estimations have been done using the same set of observations.
Average High growth firms Rest DEBT RATIO
Mean 0.6 0.6 Median 0.7 0.6 Standard dev. 0.2 0.2
LONG- TERM DEBT RATIO Mean 0.1 0.1 Median 0.0 0.0 Standard dev. 0.1 0.2
AVERAGE WAGE (Annual thousands of euros per employee)
Mean 22.1 17.0 Median 18.9 15.0 Standard dev. 15.2 9.2
WAGE PREMIUM Mean 1.1 0.9 Median 0.9 0.8 Standard dev. 0.7 0.5
% BORN AT t 24.5 13.5 % GAZELLES IN PREVIOUS PERIOD (a) 35.0 7.8
TOTAL DEBT OVER LIABILITIES AT t
LONG-TERM DEBT OVER LIABILITIES AT t
TOTAL WAGE PAYMENT DIVIDED BY TOTAL EMPLOYMENT AT t
AVERAGE WAGE AT THE FIRM OVER AVERAGE WAGE PAID IN THE 2-DIGIT SECTOR AT t
Source: Bank of Spain Firm Demography Database.a. Average refers to periods 1999-2002 and 2000-2003.
Table 4 EXPLANATORY VARIABLES

PALOMA LOPEZ-GARCIA, SERGIO PUENTE
20
possible endogeneity of some determinants is actually distorting their impact upon firm growth. If that was not the case we could exclude the past growth dummy and use the observations of the five windows in our sample. In that case we could replace the age variable by a dummy reflecting the fact that a firm is a real start-up, i.e. it entered the market exactly at the beginning of the window. This is done in models 5 and 6. Since the age dummy is now closer to a real start-up, we include in model 5 the interaction of the new firm dummy with the financial variables. The purpose is to see if financial constraints have a stronger effect for new firms. Please note that we cannot include fixed effects in the pooled data estimations due to the lack of degrees of freedom given that we only have between one and five observations for
DEPENDENT VARIABLE: MODEL 5 MODEL 6 PROBABILITY OF BEING A GAZELLE Debt
interactions With 45 sector
dummies 1999-2002 2000-2003 1999-2002 2000-2003 1999-2002 2000-2003 1999-2002 2000-2003 Pooled data Pooled data
HGF in previous period (t-3/t) 0.828*** 0.822*** 0.367*** 0.413***
(0.042) (0.042) (0.122) (0.125)
HGF(-1)*mining -0.356 0.51
HGF(-1)*manufacturing 0.318*** 0.366***
HGF(-1)*utilities 0.919*** 0.304
HGF(-1)*retail 0.793*** 0.559***
HGF(-1)*hotels 0.215 0.033
HGF(-1)*transport 0.777*** 0.63***
HGF(-1)*telecomm 0.89 -0.075
HGF(-1)*other services 0.696*** 0.619***
Born in t 0.815*** 0.584*** (0.260) (0.066)
Born in t-3 -0.068 0.153 -0.070 0.123 0.183* 0.310*** 0.285 0.166
(0.113) (0.113) (0.112) (0.111) (0.109) (0.110) (0.247) (0.225)
Debt 1.620*** 1.467*** 1.616*** 1.443*** 2.169*** 2.026*** 4.860** 3.051*** 1.999*** 1.850*** (0.401) (0.419) (0.402) (0.419) (0.389) (0.404) (1.984) (1.106) (0.151) (0.153)
Debt^2 -1.239*** -1.060*** -1.218*** -1.018*** -1.505*** -1.351*** -4.179** -2.409** -1.278*** -1.162*** (0.364) (0.378) (0.365) (0.378) (0.354) (0.366) (1.965) (1.087) (0.135) (0.135)
log(wage premium) 0.293*** 0.256*** 0,336*** 0.294*** 0.231*** 0.227*** 0.284*** 0.237*** 0.226*** 0.234*** (0.051) (0.051) (0.049) (0.051) (0.047) (0.048) (0.067) (0.068) (0.018) (0.019)
ICT manufacturing -0.192** -0.288*** -0.266*** -0.330*** -0.319*** -0.357*** -0.223*** (0.079) (0.082) (0.077) (0.080) (0.093) (0.091) (0.030)
ICT services -0.115* -0.112 -0.210*** -0.205*** -0.274*** -0.320 -0.259*** (0.069) (0.070) (0.067) (0.068) (0.078) (0.077) (0.026)
Non-ICT manufacturing -0.082 -0.078 -0.164** -0.142** -0.208** -0.172** -0.165*** (0.069) (0.071) (0.066) (0.068) (0.086) (0.079) (0.026)
Non-ICT services -0.015 -0.088 -0.066 -0.118* -0.140* -0.148* -0.169*** (0.072) (0.073) (0.070) (0.071) (0.080) (0.081) (0.027)
Debt*Born -1.159 (1.013)
Debt^2*Born 1.023 (0.883)
Region dummies included included included included included included included included included included 9 sector dummies included included
45 2-digit sector dummies included Period dummies included included
MODEL 3 MODEL 4
Instrumental variablesWithout past growth
MODEL 1
Benchmark
MODEL 2
Sector interactions
Table 5
Source: Bank of Spain Firm Demography Database.
PROBIT COEFFICIENTS

WHAT MAKES A HIGH-GROWTH FIRM IN SPAIN? A PROBIT ANALYSIS USING FIRM-LEVEL DATA
21
each firm (three in average). Hence we cannot control for heterogeneity at a firm level. Nevertheless, what we can do is to control for differences between sectors at a very low aggregation level. This is done in model 6, where we replaced the previous five sectors by 45 two-digit sectors hoping to capture in this way some of the firm-level idiosyncrasies that could also be affecting the probability of growth of the firm.
The past growth of Gazelles is a highly significant predictor for current growth. In spite of the fact that there seems to be a large inertia effect on firms’ growth, the exclusion of a control for past growth (model 3) and the use of instrumental variables (model 4) do not seem to affect the estimated impact of other variables, hence endogeneity does not appear to be distorting the results. This is important because it allows us to pool all the observations, from the five 3-year windows, and re-run the probit with alternative controls and specifications.
The observed growth inertia could be capturing the fact that the period of analysis, 1996 to 2003, is characterised by sustained and, in some sectors like construction, explosive employment growth. To check this possibility we take advantage of the fact that not all sectors grew during the overall period of analysis, especially during the dotcom crisis of the earlier 2000s. If past growth in those laggard sectors did not increase the probability of being a Gazelle then we could conclude that the observed growth inertia is solely a result of the expansive moment of the cycle. Model 2 includes in the regression interaction terms between the past growth dummy and 8 sector dummies, being construction our omitted sector.30 The past growth dummy is positive and significant in all sectors. Hence firms’ growth inertia seems to be a more structural than cyclical phenomenon in Spain.
Even controlling for past growth, which as it has been mentioned is positive and very significant, other variables seem to be important for growth. The effect of the debt ratio of the firm has an inverted U-shape. That is, it is positive up to a certain point; beyond that point further increments of debt will reduce the probability of growth. The fact that the capital structure of a firm has a significant effect upon its probability of growth could reflect the presence of market failures. Our results seem to point in the same direction as the rest of the literature: those firms with better access to credit, a higher debt ratio, have higher chances to grow fast. The fact that the impact of debt is non-linear is consistent with the theory of optimal capital structure of the firm (Jensen 1986) which states that there is a mix of debt-equity which maximises the value of a firm. According to our estimations the maximum probability of growth is achieved when the debt ratio is almost 70%.31 This is also consistent with Lopez-Garcia and Puente (2007) where it was found that the effect of debt on the probability of survival of a firm was also non-linear, with a maximum probability of survival between 50 and 75% debt ratio. We provide in the annex 1 (model A1) an estimation replacing total debt by long term debt as a robustness check. The results are very similar although the estimation of the debt effect loses some accuracy.
30 The eight sectors are mining, manufacturing, utilities, retail, hotels and restaurants, telecommunications,
transport and other services. 31 The estimation uses the coefficients of Model 1. In the first window the maximum is achieved at
65% and in the second window at 69%.

PALOMA LOPEZ-GARCIA, SERGIO PUENTE
22
The effect of wages paid in the firm relative to the average wage in the 2-digit sector of activity --a proxy for the firm’s human capital--, is extremely robust, positive and significant. In Annex 1 (model A2) we show the coefficients of the regression when the firm’s average wage instead of the relative wage is included as a proxy of human capital. Results are almost identical. We have also included a quadratic term of the firm’s average wage to study possible non-monotonicities, finding that the effect of the variable is always positive but marginally decreasing. The estimation using the log of the relative wage has this property and provides a better fit, hence it is the one shown in Table 5.
The variable used to proxy human capital, relative wages, could be capturing the effect on growth of other related factors such as firm size or the existence of a firm-level collective agreement. To rule out the possibility that the impact of wages on growth is reflecting a pure size effect, we have included size dummies in a pooled data regression shown in Annex 1 (model A4).32 The only purpose of the exercise is to check whether, after controlling for firm size, the results for the rest of the variables change or not dramatically. We go no further due to the fact that firm size is part of the definition of the dependent variable, as it was explained previously. But even so, the results are very similar to those in models 5 and 6 of Table 5, the only difference being that the magnitude of the relative wage coefficient is somehow smaller. On the other hand, firms subject to a firm-level collective agreement are in a better position to adjust to short-term market conditions. This fact alone could be increasing their probability of growth when compared to that of other similar firms in terms of size etc., but subject to sector collective agreements. To control for this possibility model A3 in Annex 1 includes a dummy variable that takes the value 1 if the firm had a firm-level collective agreement at the beginning of the period and 0 otherwise. Apart from a slight reduction in the quantitative effect of the relative wage on growth, results do not change much.
The regression includes a dummy capturing the age of the firm. However, for reasons explained previously, in models 1 and 2 we only can control for the fact that a firm marked as a Gazelle entered the market three years before the beginning of the period of analysis or, alternatively, was already an established firm at that time. We find that, when controlling for past growth, those relatively younger firms do not have a significantly higher probability of being Gazelles than the rest of the firms in the sample. Also in models 3 and 4, where past growth of the Gazelles is not controlled for, we find a very weak effect of the age dummy. This suggests that having entered the market several years before has little impact on the probability of high growth. But the story changes if one controls for the fact that the firm is a real start-up, that is, it has entered the market right at the beginning of the period of analysis. That is clearly revealed in models 5 and 6, which use pooled data and show
32 Dummies are defined for firms with less than 20 employees, between 20 and 250 employees and more
than 250 employees. The reference is small firms (less than 20 employees).

WHAT MAKES A HIGH-GROWTH FIRM IN SPAIN? A PROBIT ANALYSIS USING FIRM-LEVEL DATA
23
that actual start-ups (firms born in t) have a significantly higher probability of becoming Gazelles between t and t+3. The marginal effect at the mean is large: New firms have 32 percentage points more probability of being Gazelles.
The pooled estimations are also useful to study whether the effect of debt is different for new firms. To do so, we have also included in model 5 the interaction between the two debt variables and the start-up dummy. It seems however that this differential effect of debt is not significative. The reason is that the standard errors of those interactions are very large given the fact that the variance of debt is not enough for this particular group of firms.
Among the sector dummies we find that, ceteris paribus, firms operating in construction, services and non-ICT manufacturing have a higher probability of experiencing fast growth when compared to firms operating in ICT-manufacturing. The difference is significative at 5% confidence level in both windows. The result with respect to the service sector -- it is the same for ICT and non-ICT services-- is not surprising given the results found elsewhere in the literature. Maybe it seems a bit more surprising the fact that firms operating in the construction sector have higher chances of fast growth. This could be explained, however, by the construction boom experienced by the Spanish economy precisely during this period.
Finally, model 6 substitutes those aggregate sector dummies by 45 2-digit sector dummies. The purpose is to control as far as the dataset allows us for other firm-level characteristics that might be affecting the probability of growth, like sector riskiness, sector concentration etc. Results, however, do not change. Hence they seem to be quite robust.
To further check the robustness of the results, we have tried to run the regression using alternative measures of growth. Model A6 in Annex 1 shows the probit results using the OECD indicator defined above to mark high-growth firms. The accuracy of the estimators is lower, because the number of high growth firms is now smaller. Nevertheless, most of the estimators still have a significant effect, with the exception of the quadratic debt term, which is now not significative. We have also tried to define Gazelles on the basis of value added growth (model A4 in Annex 1), instead of employment growth. For this alternative definition, the results concerning debt are less strong, and the ranking of sectors changes: all service sectors now have less probability of high growth, compared to the other three. This result is not surprising, since services have traditionally lower productivity and higher employment growth rates, compared to manufacturing.
Note that so far we have studied the impact of several variables on the probability of being a Gazelle versus the probability of not being a Gazelle. That latter possibility includes being a firm with negative employment growth during the period of analysis as well as being a firm with positive but low employment growth. However, the transitions from negative growth to slow growth and from slow growth to fast growth, or gazelle, do not necessarily have to respond to the same factors. Hence, one final robustness check, interesting in itself, is to study

PALOMA LOPEZ-GARCIA, SERGIO PUENTE
24
whether the variables analysed so far affect in the same way these two margins. To do so we have run a multinomial logit33 in which the dependent variable takes a different value for each of the groups of firms mentioned previously: firms with negative employment growth over the period of analysis, firms with positive but slow growth and firms with fast employment growth. The result of the exercise is that the explanatory variables analysed affect the two transitions, from negative to slow growth and from slow to fast growth, in a similar way. The only difference is that the significance of all variables is somehow larger for the second transition.
We proceed now to show the quantitative impact on the probability of growth of the group of variables found to be significant for the Model 1 of Table 5. Table 6 below reports the effects of a change in one explanatory variable for a hypothetical firm which has all other variables equal to their means.34
The determinants of growth are past growth, human capital, sector of activity and access to finance. Indeed, the probability of growth increases by almost 30 percentage points if a firm has had fast growth in the previous period. That is, it seems that there is large growth inertia among Spanish firms. As explained before, when we remove this variable we are able to estimate the effect of newness on the probability of growth pooling all five windows. We find a large marginal effect: A start-up who survives up to t+3 has a probability of fast growth 32 percentage points (pp) higher than an established (surviving) firm.
Even after controlling for past growth, that is, ruling out a possible endogeneity problem, we find that increasing the relative salary paid the first year of the first period of analysis (results for the period 2000-2003 are very similar) in the firm from 0.78 to 1.03 times the average wage paid in the 2-digit sector (from the 25th percentile to the 50th) increases the probability of being a Gazelle 2.6pp.
33 Results of the multinomial logit are available from the authors at request. 34 In the case of debt, we compute first the mean debt ratio, and then set the quadratic variable equal
to this mean squared.
Change in Probability 1999-2002 2000-2003 From non-HGF to HGF in previous period 0.298 0.285 From 25th percentile debt ratio to 50th percentile 0.022 0.022 From 50th percentile debt ratio to 75th percentile -0.007 -0.002 From 25th percentile relative wage to 50th percentile 0.026 0.021 From 50th percentile. relative wage to 75th percentile 0.027 0.024 From ICT manufacturing to non-ICT others 0.065 0.092
Source: Bank of Spain Firm Demography Database.
Table 6 EFFECT ON THE PROBABILITY OF HIGH GROWTH FOR DIFFERENT CHANGES IN THE COVARIATES

WHAT MAKES A HIGH-GROWTH FIRM IN SPAIN? A PROBIT ANALYSIS USING FIRM-LEVEL DATA
25
Increasing the salary further to 1.34 times the average salary of the sector (to the 75th percentile) augments that probability an additional 2.7 pp. Hence, as it was shown in Table 5, the relative salary, our proxy for firm’s human capital, has an important and positive effect on the probability of fast growth, although that effect is marginally decreasing. Similarly, increasing the initial debt ratio from 42% to 62% (from the 25th percentile to the 50th) increases the probability of fast growth in 2.2 pp. However, and this is different from the average wage effect, further increases of the initial debt ratio reduces the probability of growth. Lastly, the probability of fast growth of a firm operating in the ICT manufacturing sector is more than 6 pp. lower than that of a firm operating in the construction sector (construction is the main element of the sector labelled as “other non-ICT sectors”).
5. The growth process of Gazelles
Do Gazelles finance their fast growth with debt or equity? Is the debt structure of the firm changing after three years of fast growth? Is the expansion of this type of firms based on temporary or indefinite contracts? Is the mix between employees with indefinite and fixed-term contracts changing along the expansion path? The first purpose of this section aims to answer these relevant questions to better understand the growth process of firms in Spain. We do so by comparing the employment and capital structure at the beginning and at the end of the period of analysis of Gazelles with those of slow growers on the one hand and with the value of the variables of those firms that decreased employment over the period on the other hand. Considering the possibility that firms operating in sectors with different technology intensity could grow differently, we perform the analysis separately for producing and using ICT industries and for non-ICT industries. Another dimension worth analysing, above all in the Spanish case, is whether the growth of Gazelles is a quality-based growth, that is, whether it is based on high productivity and/or high wages. The comparison of the quality of growth of Gazelles with that of other types of firms is the second purpose of this section.
Table 7 shows the results of this exercise. The first column corresponds to Gazelles, the second one to firms that increased their size over the period, but not enough to be considered a fast-growth firm (slow growers), and the third one to firms that decreased their employment over the period. The value of the variables at t is the average value of the corresponding variable at the beginning of each window of analysis (five in total). The value at t+3 is the average at the end of the period of analysis. The five variables analyzed are the share of employees with a permanent contract over total employment, the share of long and short term debt over total liabilities, labour productivity of the firm over average productivity of all firms operating in the same 2-digit sector, and average wage, also as a fraction of the average wage in the sector.

PALOMA LOPEZ-GARCIA, SERGIO PUENTE
26
We start analyzing changes in the employment composition of ICT firms. The first thing to notice is that the share of employees with permanent contracts increases in firms which are reducing employment over the period. This is the result of the fact that these firms are dismissing many more employees with temporary contracts than workers with permanent contracts (-29% versus -4% respectively). This is the consequence of the difference in firing costs between temporary and indefinite contracts in Spain, which pushes firms to adjust their personnel through changes in the amount of temporary employees. The share of permanent contracts also increases in the case of slow growers, but to a lesser extent. These firms are increasing both types of employment, but fixed-term contracts grow at a slightly lower rate. Gazelles, on the other hand, have a very stable mix of both types of jobs. As a consequence, their share of permanent contracts, which is similar to the other two types of firms at the beginning of the period, ends up several percentage points below the other firms. This result reflects that: 1) Gazelles use evenly both types of jobs when growing; 2) Gazelles resort more to fixed-term contracts compared to other firms.
Although results are very similar for non-ICT firms, there are some differences worth stressing. First, non-ICT firms have more fixed-term employees, compared with ICT firms. Second, this is especially the case for non-ICT fast-growth firms. And third, Gazelles increase fixed-term jobs slightly more than permanent jobs, which results in a small decrease in the share of permanent jobs at the end of the period.
Regarding the changes in liabilities composition, ICT firms with slow or negative growth have a very stable long-term debt ratio, but a decreasing short-term debt ratio. This means that their liabilities composition is changing towards equity. On the contrary, Gazelles increase both types of debt, especially the long-term one. This happens in spite of the fact that they already had a higher debt ratio at the beginning of the three year period. Again, results are similar for non-ICT firms. Although all firms have more long term debt and less short term debt than in ICT
Variable: t t+3 t t+3 t t+3 FIRMS IN ICT INDUSTRIES: Share of permanent contracts 62.5 62.9 64.4 68.3 62.7 71.6 Long term debt ratio 9.5 10.7 8.5 8.7 8.7 9.0 Short term debt ratio 52.8 53.1 51.1 49.4 50.2 46.5 Productivity 134.5 100.9 101.9 95.7 85.4 109.6 Average wage 124.5 99.3 100.4 95.3 91.7 111.2 FIRMS IN NON-ICT INDUSTRIES: Share of permanent contracts 54.0 52.0 59.1 61.8 56.4 64.4 Long term debt ratio 12.1 12.7 13.3 13.7 11.9 11.9 Short term debt ratio 49.4 50.0 41.6 40.0 43.4 40.2 Productivity 136.7 102.9 103.1 96.8 84.9 110.2 Average wage 127.7 101.4 101.2 96.0 91.4 111.8
High growth Slow growth Negative growth
Source: Bank of Spain Firm Demography Database.
Table 7 GROWTH PATTERNS OF DIFFERENT TYPES OF FIRMS
%

WHAT MAKES A HIGH-GROWTH FIRM IN SPAIN? A PROBIT ANALYSIS USING FIRM-LEVEL DATA
27
sectors, maybe due to the fact that the construction sector is non-ICT, the pattern of increasing debt in Gazelles and increasing equity in other firms remain. In summary, Gazelles use more fixed-term contracts and more debt to support their growth, compared to other firms.
Now we start the second purpose of the section by looking at productivity and wages of Gazelles at the beginning and at the end of the period of analysis, compared to the other two types of firms. The first thing to notice is that at the beginning of each window, Gazelles have productivity levels well above other firms –more than 30% higher than the average in the sector- whereas the contrary happens to negative growth firms. This happens both in ICT and non-ICT industries. However, the productivity of Gazelles decreases after three years of fast employment growth. Note that, despite this fall, their productivity level is still above the average level of the sector of activity at the end of the period. Likewise fast-growth firms’ wages at the beginning of the period are about 25% higher than average wages in the sector. After three years of fast growth their average wage, computed as wage payments over total employment in the firm, has been reduced although it is still over the economy average.
6. Conclusions and some policy implications
A number of studies have stressed the enormous impact of a small group of enterprises, known as Gazelles, in aggregate net job creation. In spite of the importance of this topic from a policy-point of view, most of the studies of Gazelles are descriptive and limited to a comparison of the characteristics of high-growth firms with respect to a control group of firms. This paper aims at filling this gap from two different points of view. First, we develop a multivariate analysis of the determinants of the fast growth of firms in order to disentangle the effect of the different variables reported to be important in the literature. And second, we analyze how Gazelles’ important variables change along their strong growth path, compared to other firms.
We find a number of variables that are related to a higher probability of being a Gazelle. The most important one is precisely having been a Gazelle in the previous period, and this is true even at a lower level of sector aggregation. Hence, at least during the period of time analysed in this paper, there is strong growth inertia. However, even controlling for past growth, there are other variables that are also significantly related to the probability of fast growth. First of all, new firms (that survive over the period) have about 30pp more of probability than established firms to be a Gazelle. Hence, the removal of entry barriers seems to be crucial to enhance the number of fast-growth firms and, therefore, employment creation. Secondly, a higher level of human capital, proxied by relative wages, increases the probability of fast-growth monotonically. The need to invest in education to improve the skill pool, to improve the connection between the university and the enterprises, to facilitate training on the job etc. has been established since a long time. However our analysis highlights the importance of all those policies from another perspective, namely, to foster firm growth.
PALOMA LOPEZ-GARCIA, SERGIO PUENTE
28
We find as well that an initial higher debt ratio increases the probability of fast growth only up to some point. Beyond, further debt increases impact negatively on that probability. Hence better access to finance is indeed, as shown in other papers, facilitating the expansion of firms. Or put in another way: The existence of credit restrictions is decreasing the number of fast-growth firms, and therefore, employment creation.
Regarding the growth pattern of Gazelles, we find that they resort more to fixed term employment and debt –especially long term debt- to sustain their growth, compared to other firms. They also start with a productivity level 30% higher than other firms, and in spite of their intense process of employment growth, they end up with a higher productivity level than other firms.
REFERENCES 1. AHMAD, N. (2006): “A proposed framework for Business Demographic Statistics.”
OECD Statistics Working Paper Series, STD/DOC(2006)3. 2. BIRCH, D. L. (1981). “Who Creates the Jobs?”, The Public Interest, 65, pp. 3-14. 3. BIRCH, D. L. (1987). “Job creation in America.” New York, NY.: Free Press. 4. BIRCH, D. and J. MEDOFF (1994). “Gazelles.” In Lewis, Solmon and Levenson (eds).,
Labor Markets, Employment Policy and Job Creation: Westview Press, pp. 159-167. 5. BIRCH, D., HAGGERTY, A. and P. WILLLIAMS (1995). “Who is creating jobs?.”
Boston, MA: Cognetics Inc. 6. COLUZZI, C., FERRANDO, A. and C. MARTINEZ-CARRASCAL (2008). “Financing
obstacles and growth: An analysis for euro area non-financial corporations.” Bank of Spain Working Paper 0836.
7. DAVIDSSON, P. and F. DELMAR (2003). “Hunting for New employment: The role of high-growth firms”, In Kirby and Watson (Eds.) Small Firms and Economic Development in Developed and transition Economies: A reader, Hampshire, UK.: Ashgate Publishing, pp: 7-19.
8. DAVIS, S. J., J. C. HALTINWANGER and S. SCHUH (1996). “Small Business and Job Creation: Dissecting the Myth and reassessing the facts”, Small Business Economics, 8 (4), pp. 297-315.
9. EIM (2006). “Entrepreneurship in the Netherlands. High-growth enterprises; running fast but still keeping control.” EIM Business and Policy research.
10. EUROPE’S 500 (2001). “Not just peanuts.” http://www.europes500.eu/studies.html. 11. HALL, B. R. (2002). “The financing of Research and Development.” NBER Working
Paper 8773. 12. HENREKSON, M. and D. JOHANSSON (2008). “Gazelles as job creators –A survey and
interpretation of the evidence.” Small Business Economics, forthcoming.

WHAT MAKES A HIGH-GROWTH FIRM IN SPAIN? A PROBIT ANALYSIS USING FIRM-LEVEL DATA
29
13. HOFFMAN, A. N. and M. JUNGE (2006). “Documenting data on high-growth firms and entrepreneurs across 17 countries.” Mimeo.
14. JENSEN, M.C. (1986): “Agency costs of free cash flow, corporate finance and takeovers”, American Economic Review 76: 323-329.
15. LÓPEZ-GARCÍA, P., and S. PUENTE (2007). “A Comparison of the Determinants of Survival of Spanish Firms across Economic Sectors”, in J. M. Arauzo-Carod and M. C. Manjon-Antolin (Eds.), Entrepreneurship, Industrial Location and Economic Growth: Edward Elgar Publishing Limited, UK, pp: 161-183.
16. PAGANO, P. and F. SCHIVARDI (2003). “Firm size distribution and growth.” Scandinavian Journal of Economics, vol. 105(2), pp 255-274.
17. SCHREYER, P. (2000). “High-growth firms and employment.” OECD Science, Technology and Industry Working papers, 2000/3.
18. STOREY, D. J. (1994). Understanding the Small Business Sector, London: Routledge. 19. VAN ARK, B., R. INKLAAR and R. H. MCGUCKIN (2003). "The Contribution of ICT-
Producing and ICT-Using Industries to Productivity Growth: A Comparison of Canada, Europe and the United States", International Productivity Monitor, Centre for the Study of Living Standards, Vol. 6, pp. 56-63.

PALOMA LOPEZ-GARCIA, SERGIO PUENTE
30
Annex 1:
DEPENDENT VARIABLE: MODEL A5 MODEL A6 PROBABILITY OF BEING A GAZELLE
Size dummies OECD
1999-2002 2000-2003 1999-20022000-2003 1999-20022000-2003 1999-20022000-2003 Pooled data Pooled data HGF in previous period (t-3/t) 0.847*** 0.846*** 0.827*** 0.823*** 0.767*** 0.782*** 0.532*** 0.512***
(0.041) (0.041) (0.042) (0.042) (0.039) (0.040) (0.041) (0.041)Born in t 0.697*** 0.7211***
(0.071) (0.085) Born in t-3 -0.054 0.114*** -0.066 0.144 -0.07 0.04 -0.24 0.35
(0.110) (0.112) (0.112) (0.113) (0.111) (0.110) (0.230) (0.268)Debt 0.976*** 0.717** 1.600*** 1.447*** 2,910*** 2.708*** 1,039*** 0.19 1.115*** 0,917***
(0.338) (0.337) (0.401) (0.418) (0.392) (0.410) (0.408) (0.402) (0.160) (0.243) Debt^2 -2.103*** -1.109* -1.192*** -1.018*** -2,372 -2.243*** -0,468 0.17 -0.441*** -0.096
(0.647) (0.623) (0.364) (0.378) (0.354) (0.369) (0.374) (0.368) (0.142) (-0.209) log(wage premium) 0.293*** 0.286*** 0.308*** 0.291*** 0,197*** 0,149*** 0,209*** 0,238*** 0.140*** 0,174***
(0.048) (0.048) (0.049) (0.049) (0.047) (0.047) (0.052) (0.052) (0.020) (-0.027) ICT manufacturing -0.218*** -0.316*** -0.216*** -0.312*** -0,554*** -0,751*** -0.08 -0.07 -0.236*** -0,366***
(0.078) (0.081) (0.079) (0.082) (0.071) (0.074) (0.078) (0.078) (0.031) (0.046) ICT services -0.127* -0.105 -0.124* -0.110 -0,410*** -0,481*** -0,249*** -0,218*** -0.114*** -0,139***
(0.069) (0.069) (0.068) (0.070) (0.061) (0.062) (0.069) (0.070) (0.027) (0.036) Non-ICT manufacturing -0.141** -0.132* -0.122* -0.112 -0,471*** -0,498*** -0.09 -0.08 -0.201*** -0,368***
(0.066) (0.068) (0.068) (0.070) (0.059) (0.060) (0.069) (0.069) (0.027) (0.039) Non-ICT services -0.016 -0.098 0.010 -0.057 -0,235*** -0,347*** -0,243*** -0,152*** -0.069** -0,201***
(0.071) (0.072) (0.072) (0.074) (0.063) (0.064) (0.075) (0.075) (0.029) (-0.038) Medium size 0.702***
(0.020) Large size 1.296***
(0.030) Region dummies included included included included included included included included included included Period dummies included included Collective agreementdummies included included
MODEL A1
Long-term debt
MODEL A2
Average wage
MODEL A3 MODEL A4
Value addedCollective agreements

WHAT MAKES A HIGH-GROWTH FIRM IN SPAIN? A PROBIT ANALYSIS USING FIRM-LEVEL DATA
31
Annex 2: Industries by technology intensity (van Ark et al 2003) ICT-Producing Manufacturing
30 Office, accounting and computing machinery 313 Insulated wire and cable 321 Semiconductors and other electronic components 322 Communication and broadcasting equipment 323 Radio and TV receivers 331 Medical and measuring equipment and industrial process control ICT-Producing Services
64 Post and Telecommunications 72 Computer and related services ICT-Using Manufacturing
18 Wearing apparel, dressing and dying fur 22 Printing and Publishing 29 Machinery and equipment 31 (not 313) Electrical machinery and apparatus 33 (not 331) Precision and optical instruments 351 Building and repairing of ships and boats 353 Aircraft and spacecraft 352+359 Railroad equipment and transport equipment 36-37 Miscellaneous ICT-Using Services
51 Wholesale trade 52 Retail trade 71 Renting of machinery and equipment 73 Research and Development 741-743 Professional business services Less-intensive ICT Manufacturing
15-16 Food products, beverages and tobacco 17 Textiles 19 Leather and footwear 20 Wood and cork 21 Pulp and paper

PALOMA LOPEZ-GARCIA, SERGIO PUENTE
32
23 Coke, refined petroleum and nuclear fuel 24 Chemicals 25 Plastic and rubber products 26 Non-metallic mineral products 27 Basic metals 28 Fabricated metal products 34 Motor vehicles, trailers and semi-trailers Less-intensive ICT Services
50 Repairs 55 Hotels and restaurants 60-63 Transport and storage 70 Real state activities 745-749 Other business services Less-intensive ICT Other
10-14 Mining and quarrying 40-41 Electricity, gas and water supply 45 Construction

STUDIA UNIVERSITATIS BABEŞ-BOLYAI, NEGOTIA, LV, 1, 2010
IMPORTANCE OF CRAFTS IN DISTRIBUTIVE TRADE OF THE REPUBLIC OF CROATIA
NIKOLA KNEGO1
ABSTRACT. Distributive trade of the Republic of Croatia is an important segment of the Croatian economy. This can be confirmed by the share of distributive trade in the creation of GDP, by the share of employed persons, by the share of the number of registered enterprises and by the share of the number of active enterprises. Crafts are a manifestation of the Croatian distributive trade which, to a certain extent, contributes to the overall increase in its importance, as shown by the mentioned indicators. Crafts form part of small enterprises. Their business position is extremely unfavorable. What makes the position of crafts in the segment of distributive trade even harder is the intensified process of its expansion and concentration, with one consequence being the increased importance of a limited, small number of biggest enterprises. Tradesmen in the segment of distributive trade are mainly small independent merchants who, as a rule, own one business unit such as a shop or a repair shop. The inadequate size of such a business unit prevents the introduction of a basic sales technology on which all contemporary sales formats from supermarkets to electronic sales are based. This basic sales technology includes self-selection and self-service which contribute to the rationalization of business costs, primarily by lowering operating costs and by increasing efficiency through the possibility of increase in permeability of shops. The economic status of merchants is significantly determined by the technological basis of sales. The fragmentation of sales capacities and their technological backwardness are important factors that determine the economic strength of small independent merchants as a whole, as well as the segment of tradesmen. As a rule, tradesmen operate small shops and do not have a diversified sales structure as regards shop formats. This paper looks into the importance of crafts in the distributive trade of the Republic of Croatia.
Key words: craft, tradesmen, distributive trade, the Republic of Croatia.
JEL classification: L81
1. INTRODUCTION
Distributive trade of the Republic of Croatia is an important segment of the Croatian economy. This can be confirmed by the share of distributive trade in the creation of GDP (on the second place right behind the manufacturing industry), by the share of employed persons (on the second place right behind the manufacturing
1 Nikola Knego, Ph. D., Full Professor, University of Zagreb, Faculty of Economics & Business, J.F.Kennedy
6, 10 000 Zagreb, Croatia, E-mail: [email protected]; [email protected]

NIKOLA KNEGO
34
industry), by the share of the number of registered enterprises (first place) and by the share of the number of active enterprises (first place). Crafts are a manifestation of the Croatian distributive trade which, to a certain extent, contributes to the overall increase in its importance, as shown by the mentioned indicators. Crafts form part of small enterprises. Their business position is extremely unfavorable. What makes the position of crafts in the segment of distributive trade even harder is the intensified process of its expansion and concentration, with one consequence being the increased importance of a limited, small number of biggest enterprises. Tradesman in the segment of distributive trade, are mainly small independent merchant who, as a rule, own one business unit such as a shop or a repair shop. The inadequate size of such a business unit prevents the introduction of a basic sales technology on which all contemporary sales formats from supermarkets to electronic sales are based. This basic sales technology includes self-selection and self-service which contribute to the rationalization of business costs, primarily by lowering operating costs and by increasing efficiency through the possibility of increase in permeability of shops. This results in ability to serve more people in the same unit of time. Attempts of implementation already mentioned sales technology in small stores, as a consequence has significantly lower assortment capacity. The economic status of merchants is significantly determined by the technological basis of sales. This can be confirmed with findings that formats of sale such as supermarkets, hypermarkets and hard discounts enlarge market share and cause greater scale of sales in the markets of European countries. The fragmentation of sales capacities and their technological backwardness are important factors that determine the economic strength of small independent merchants as a whole, as well as the segment of tradesmen. Research done on the subject of share value with different formats of stores in turnover, show that on the Croatian market, share of small independent tradesmen is continuously decreasing. Their share has decreased from 53% in 2001 to 35% in 2007. As a rule, tradesmen operate small shops and do not have a diversified sales structure as regards shop formats.
2. TRADESMEN IN CROATIAN DISTRIBUTIVE TRADE
Trades in Croatia represent significant part of Croatian distributive trade. This can be confirmed with the share of tradesmen in parameters such as; share of total trades in the total number of business subjects (55.7%), share of trades and crafts in the total number of business units such as outlets (48.2%) and the number of employed people in distributive trade compared to the total workforce which is one fifth or 20.9%. There is significant divergence between stated shares and achieved revenue of the mentioned tradesmen and total sales business revenue. In fact the share of tradesmen in the total turnover of Croatian distributive trade was only 5.8% in 2006. Look at the table 1 and graphs 1, 2, and 3.

IMPORTANCE OF CRAFTS IN DISTRIBUTIVE TRADE OF THE REPUBLIC OF CROATIA
35
Table 1: Importance of tradesmen in Croatian distributive trade in 2006
Republic of Croatia Total Outlets Employedpersons
Turnover including VAT in thousands EUR
Tradesmen 19 091 20 727 45 349 1 926 893 Companies 15 173 22 284 171 333 31 535 968
Total: 34 264 43 011 216 682 33 462 861 Percentage share of tradesmen in total
number
55,7
48,2
20,9
5,8
Per craft - 1,09 2,40 101 Per company - 1,47 11,30 2 078
Total (crafts and companies):
- 1,26 6,32 977
Source: Statistical Yearbook of the Republic of Croatia - 2007, p. 409 and p. 691. Note: Personal computation.
Graph 1: Share of crafts in Croatian distributive trade in 2006
55,7%
44,3%
Crafts Companies
Graph 2: Share of crafts in outlets in Croatian distributive trade in 2006
48,2% 51,8%
Crafts Companies

NIKOLA KNEGO
36
Crafts sale has very low level of labor productivity per employee. This is why turnover per employee in outlets was 5.6 times greater than in outlets of craftsmen. The profit margin is also lower per employee. Low turnover per worker and low profit margin per worker represent key elements of weak economic position of average craftsmen and tradesmen. It also shows limited possibilities of improvement of business trough investment in sale surface, modernization and implementation of new sale technology.
Everything above outlines position of crafts trade in Croatian sale structure, in which around 44.4% of all towns (around 3000) is without any type of outlet, with no possibility of supplying people in their close proximity. This is mostly in the towns with very low and old population, with limited needs compared to assortment of goods, which is also conditioned with their buying power. Example from Switzerland a country with higher standard suggests that people have a need to consume assortment of trading goods for daily and weekly use in approximately five minutes walking radius from their house.
Tradesmen and craftsmen with 48.2% share in total number of outlets contributed significantly to width and thickness of Croatian retail structure. With that they contributed to the increased quality of living to those who could use their services, this was especially important in the places where big supermarkets don’t show interest. It would be logical to assume that more detailed investigations would confirm the significance of tradesmen share in the total working surface is lower than the significance of the number of outlets they have. This is acknowledged when we talk about quality of two main factors of development of retail structure in a certain location. First factor which is based on idea that shops are business units which are linked with population obscure the real picture of development. Store as a business unit assumes that consumer can buy only what is in the inventory of the store. However there is a great difference between kiosks and supermarkets. Second factor of development of retail structure is shown by the size of the sale surface per person. This factor takes into account the type of outlets and their size. Indicator
Graph 3: Contribution of crafts to employment in Croatian distributive trade in 2006
20,9%
79,1%
Crafts Companies

IMPORTANCE OF CRAFTS IN DISTRIBUTIVE TRADE OF THE REPUBLIC OF CROATIA
37
such as sale surface per person is clearer in comparison with the indicator of outlet per person. Both mentioned indicators of development of retail structure are used in commercial urbanism.
3. PRIME ACTIVITY OF CRAFTSMEN IN DISTRIBUTIVE TRADE
Information about outlets do not give answers on the questions about prime activity of crafts in distributive trade through territorial constitution. Detailed research on this subject among other factors, could give an answer on everything that affects the size of turnover per different crafts and how certain craft affect turnover. Divergences in turnovers among different crafts are significant; this is visible by the contents of paragraph 4 in this paper.
Table 2: Crafts in distributive trade through prime activity in 2006
Business entities Outlets Employees Prime activity of crafts
in distributive trade Number % Number % Number %
Total 19 091 100,0 20 727 100,0 45 349 100,0
G-50 2 837 14,9 2 909 14,0 6 404 14,1
G-51 894 4,7 957 4,6 2 336 5,2 G-52 15 360 80,4 16 861 81,4 36 609 80,7
Note: G 50 Sale, maintenance and repair of motor vehicles and motorcycles; retail sale of automotive fuel G 51 Wholesale trade and commission trade, except of motor vehicles and motorcycles G 52 Retail trade, except of motor vehicles and motorcycles; repair of personal and household goods
Source: Statistical Yearbook of the Republic of Croatia - 2007, p. 409. Note: Personal computation
4. REALIZED TURNOVER PER TRADESMAN
Tradesmen on average realized turnover of EUR 101,0 thousands in 2006. There are significant oscillations of their average turnover depending where they are located. Ranges of tradesmen per outlet were 1:3.18. The lowest turnover average was in County of Meñimurje, and the highest turnover average was in County of Istria. Tradesmen located in other counties are situated in different ranges. The first five counties by tradesmen turnover follow as County of Istria, County of Zadar, County of Vukovar-Sirmium, County of Virovitica-Podravina and County of Dubrovnik-Neretva. Detailed picture about turnover can be seen by deviation of realized turnover per trade compared to counties average in Republic of Croatia; this can be seen in table 3. It is necessary to do more detailed research in order to discover what causes the deviation of turnover. How did the sales capacities of large supermarket chains affect, the growth of inhabitants (tourism), differences in buying power of population or something else?

NIKOLA KNEGO
38
Table 3: Realized average turnover per trade and index deviation of realized turnover per trade compared to the Croatian average.
Counties
Turnover including VAT in thousands EUR
Index deviation of realized turnover per trade compared to the Croatian average
County of Zagreb 91,3 90,4 County of Krapina-Zagorje 80,5 79,8 County of Sisak-Moslavina 105,7 104,7 County of Karlovac 104,4 103,5 County of Varaždin 108,9 107,8 County of Koprivnica-Križevci 83,5 82,7 County of Bjelovar-Bilogora 107,7 106,6 County of Primorje-Gorski kotar 95,2 94,3 County of Lika-Senj 88,0 87,2 County of Virovitica-Podravina 113,7 112,6 County of Požega-Slavonia 55,1 54,6 County of Sl. Brod- Posavina 115,7 114,7 County of Zadar 124,0 122,9 County of Osijek-Baranja 110,8 109,8 County of Šibenik-Knin 92,8 91,9 County of Vukovar-Sirmium 120,5 119,4 County of Split-Dalmatia 102,7 101,7 County of Istria 156,0 154,6 County of Dubrovnik-Neretva 111,1 110,0 County of Meñimurje 49,0 48,6 City of Zagreb 74,7 76,8 The Republic of Croatia 101,0 100,0
Note: Personal computation data from Statistical Yearbook of the Republic of Croatia - 2007, p. 409 and p. 691.
Graph 4 is showing index deviation per trade compared to Croatian average. Counties are marked with roman numerals in order from the table 2.
Graph 4: Index deviation of realised turnover per craft per county compared to Croatian averaged realised turnover per craft in 2006
0
50
100
150
200
I. II. III.
IV.
V.
VI.
VII.
VIII
.
IX.
X.
XI.
XII.
XII
I.
XIV
.
XV
.
XV
I.
XV
II.
XV
III.
XIX
.
XX
.
XX
I.
County
Inde
x

IMPORTANCE OF CRAFTS IN DISTRIBUTIVE TRADE OF THE REPUBLIC OF CROATIA
39
5. OUTLINING THE POSIBLE ECONOMIC STRENGTH OF TRADES IN DISTRIBUTIVE TRADE
Prime activity per trade in distributive trade is retail trade in section G-52. Here are some projections of possible strengths in economy of trades.
Main presumptions: a) Croatian average turnover per trade is taken from table 3; b) Subtraction of VAT (22%) gives turnover without VAT. Croatia has 0
percent VAT on products such as bread, milk and lower VAT on products such as newspapers. It would be necessary to investigate detailed turnover structure from the aspect of sale shares compared to the differentiated rates of VAT;
c) The supply value of goods traded is used from the research of shares of values in selling structure of purchased goods, in Croatian distributive trade as a whole, in 2000 and 2004. Small tradesmen do not have advantages of using concentrated supply because of small sale capacity; this is why it would be logical to assume that they achieve less efficient economies of scale compared to big supermarket chains. The purchase price will range from 77-81.3% of the final price of goods;
d) The gross margin is based on yearly level; e) The gross margin divided by 12 gives the monthly level; f) The last step is divided by the average number of workers per one
trade(store) in order to receive average gross margin per employee; g) Look at the elements of budget in table 4.
Table 4: Budget of average economic strength of trade showed with realized
turnover in distributive trade in Croatia in 2006.
Elements EUR Turnover with VAT 100 956 - VAT (22%) 22 210 =Turnover without VAT 78 746 -Purchase price of goods (81,3%) or 77% 64 020 (77%= 60 634) =Gross Margin 14 726 (18 112)
Note: Based on the data from Statistical Yearbook of the Republic of Croatia – 2007 reflecting on period 31 December 2006
Gross margin (some indicators)
a) Total annual level: EUR 14 726 (EUR 18 112) b) Average monthly gross margin: EUR 1 227 (EUR 1 509) c) Average monthly gross margin per employee (2,4 employees): EUR 511
(EUR 628) EUR 511 (EUR 628)

NIKOLA KNEGO
40
d) Gross margin serves in covering costs (material, amortizations, cost of labor, others) and for realizing profit which could serve in improvement of business
Open questions:
a) What level of costs of labor can be endured by average gross margin per employee?
b) Taking in consideration statement a) and adding other elements covered by of gross margin what is the possible level of profit in our example?
6. INDICATIONS OF POSSIBLE BUDGET OF ECONOMIC STRENGTH OF LEGAL ENTITIES IN DISTRIBUTIVE TRADE
Main assumptions are same as the ones in point five of this paper, but applied on data from legal entities (corporations) in distributive trade in the Republic of Croatia in 2006.
Table 5: Budget of average economic strength of legal entities achieved by their turnover in distributive trade in the Republic of Croatia in 2006
Elements EUR Turnover with VAT 2 078 415 - VAT (22%) 457 251 =Turnover without VAT 1 621 164 -Purchase price of goods (81,3%) or 77% 1 318 006 (77%=1 248 296) =Gross margin 303 158 (372 868)
Note: Based on the data from Statistical Yearbook of the Republic of Croatia – 2007 reflecting on period 31 December 2006
Gross margin (some indicators)
a) Total annual level: EUR 303 158 (EUR 372 868) b) Average monthly gross margin: EUR 25 263 (EUR 31 072) c) Average monthly gross margin per employee (11,3 employees): EUR 2
236 (EUR 2 750)
EUR 2 236 (EUR 2 750)
Budget of turnover per craft outlet in 2006 in EUR
Annually Monthly Turnover with VAT per outlet: 92 965 7 747 VAT per outlet: 20 508 1 709 Turnover without VAT per outlet: 72 457 6 038

IMPORTANCE OF CRAFTS IN DISTRIBUTIVE TRADE OF THE REPUBLIC OF CROATIA
41
Budget of turnover per employee in craft outlet in 2006 in EUR
Turnover with VAT per employee: 42 490 3 540 VAT per employee: 9 348 779 Turnover without VAT per employee: 3 142 2 761
Note: Some indications of turnover per employee in craft outlets in comparison with turnover in company outlets Turnover per employee in companies: EUR 184 062 (annually) or EUR 15 339 monthly.
Note: Productivity of labor is significant problem in crafts in Croatian distributive trade. Turnover per employee in outlets of companies was 5,6 times greater than in capacities of craft outlets
7. LEVEL OF PRICES: KEY OF MARKET UNCOMPETIVENESS FOR SMALL MERCHANTS
7.1. Level of Prices
Research confirms that five key factors affect consumer decisions where to buy and what to buy. The key five factors are: price, quality, service, location and assortment. Price exhibits leading influence on consumer’s decisions, where and what to buy, in societies which are far more developed than Croatian society: considering only the level of GDP per capita.
In the next step we will try to examine the accustomed price by collecting the price data of ten articles which are frequently bought in the six big supermarket chains (Konzum, Ipercoop, Getro, Billa, Lidl, Mercator) and the price-data of the same articles in three convenience stores from which two are located close to supermarkets and one is located somewhat further.
Table 6: Price of the ten articles
Stores Article
Kon-zum
Iper-coop
Getro Billa Lidl Mer-cator
M1 M2 M3
1. Dukat milk, 3,2% PET 5,69 5,68 4.75 5,79 5,69 5,67 6,2 5,8 7,0 2. Coca Cola 2l 12,49 12,49 12,49 11,99 12,49 12,49 13,0 13,0 15,5 3. Sugar, 1kg 5,65 5,99 5,76-
5,97 5,59 5,59 5,77 6,5 6,5 7,0
4. Table salt 3,59 3,99 4,00 3,69 3,69 3,67 3,50 4,0 4,0 5. Hard flour, T-400 5,15 5,99 4,99 4,99 4,89 5,97 7,0 6,0 6,3 6. Soft Flour, T-550 4,09 4,99 4,12 3,99 3,89 3,67 6,5 7,0 5,5 7. Vegeta(spice mix), 250 g. 12,69 12,69 12,69 12,99 12,69 12,69 12,0 12,0 15,5 8. Sunflower Oil,
Zvijezda, 1l. 12,99 12,99 12,99 12,99 12,99 14,79 14,0 13,5 14,9
9. Rice, 1kg, long grain, nylon pack
5,29 8,99 9,46 5,19 4,99 4,97 5,50 7,0 5,7

NIKOLA KNEGO
42
Stores Article Kon-zum
Iper-coop
Getro Billa Lidl Mer-cator
M1 M2 M3
10. Franck coffee, jubilarna Vacuumed, 250 g. 15,99 15,99 15,99 15,99 15,99 15,99 17,0 17,0 19,9
Total: 83,62 89,79 87,24 83,31 82,90 86,09 91,2 91,8 101,3 Index Price deviation compared to the most affordable
100,9
108,3
105,2
100,5 100,00
103,8
110,0
110,7
122,2
Order of the most affordable 3 6 5 2 1 4 7 8 9 Average Index Price deviation
compared to the most affordable
100,9
108,3
105,2
100,5
100,00
103,8 114,4
Notice: a) data collection was done on 20 April 2008.; b) M1, M2 and M3 are small convenience shops picked at random; c) bold italic= lowest price d) bold underline=highest price.
Table 7: Index Price deviation compared to the most affordable by products
Stores Article Konzum Ipercoop Getro Billa Lidl Mercator M1 M2 M3
130,5 122,1 147,4 1. Dukat milk, 3,2% PET
119,8 119,6 100,00 121,9 119,8 119,4 133,3
108,4 108,4 129,3 2. Coca Cola 2l 104,2
104,2
104,2
100,00 104,2 104,2 115,4
116,3 116,3 125,2 3. Sugar, 1kg 101,1 107,2 103,0 100,00
100,00 103,2 119,3
100,00 114,3 114,3 4. Table salt 102,6 114,0 114,3
105,4
105,4 104,9 109,5
143,1 122,7 128,8 5. Hard flour, T-400
105,3 122,5 102,0 102,0 100,00
122,1 131,6
177,1 190,7 150,0 6. Soft Flour, T-550
111,4
136,0 112,3 108,7 106,0
100,00 172,6
100,0 100,0 129,7 7. Vegeta(spice mix), 250 g.
105,8 105,8
105,8 108,3 105,8 105,8 109,7
107,8 103,9 114,7 8. Sunflower Oil, Zvijezda, 1l.
100,0
100,0
100,0
100,0
100,0
113,9 108,8
110,7 140,8 114,7 9. Rice, 1kg,
long grain, nylon pack
106,4
180,1
190,3
104,4
100,4
100,0
122,1
106,3 106,3 124,4 10. Franck coffee,
jubilarna Vacuumed, 250 g.
100,0
100,0
100,0
100,0
100,0
100,0
112,4 Index Price deviation compared to the most affordable
103,3
108,3
106,4
100,5
100,00
103,8
110,0
110,7
122,2
Note: Personal computation of data from table 6

IMPORTANCE OF CRAFTS IN DISTRIBUTIVE TRADE OF THE REPUBLIC OF CROATIA
43
Products such as sugar, rice and flour in packing of one kilo, are also produced by market chains such as Getro, Konzum and Billa. This causes that their generic brands can be bought cheaper than established market brands. Here, in order to compare generic and market brands we compared products from the same distributor. This was possible with products as sugar in packing of one kilo. With flour we compared packing T-400 and T-550. With rice, due to many different choices, we decided to compare long grain rice in nylon packing with most affordable price. Other six products (Dukat milk 3,2% PET, Coca-Cola 2l, Table salt-Pag, Vegeta (spice mix) 250 g, Sunflower Oil Zvijezda 1l, Franck coffee jubilarna Vacuumed 250 g) are products delivered by similar distributors.
All of the six big supermarket chains had the same selling price for already mentioned coffee, but only on the shelves of Mercator there was a sign “Permanently Low Price”.
7.2. Supply: The Key Reason of increased Price in Convenient Stores
Small tradesmen (our example) had a drastically higher price in the total product mix, compared to other supermarket chains. Their product mix was 14.4% more expensive from the most affordable product mix. The small tradesmen or the convenient stores generated higher prices which ranged from 10% to 22.2% from the most affordable, for a detailed examination look at table 1.
More detailed analysis of price deviation, per single article, is given in table 2. Index deviations of prices per article are enormous. They range from 9.7% to 90.3%. Our little research was in function to confirm or reject hypothesis that small tradesmen and independent tradesmen can handle price differences with respect to prices of same articles sold in big super-market chains. The difference of selling prices is the key reason why people go to buy groceries in convenient stores only when they have to. High prices of the same articles in inventory capacities of the small tradesmen are mostly due to ineffectiveness in supply of the goods. The hypothesis is that merchants which win the supply “war” have a chance of long-term success. With continuous improvements, reduced costs and rationalization of supply of goods helps the success in the long-term. Note that, share of purchase price in the structure of final price (without VAT) in Croatian distributive trade is 4/5 (81.3 %) Small tradesmen did not use their possibility to interconnect, in order to create parameters for more affordable purchase price of goods from the producers. Few explanations hold why this does not happen: a) late timing; b) if they don’t interconnect significant number of small tradesmen to constitute significant buying power; c) bad understanding of what small tradesmen get if they interconnect.
The example of world leading corporation (Wal-Mart) which rationalizes supply, which in turn has consequences of continuous decrease in percentage purchase price in the sale of goods. The percentage decrease was 0.97% in the interval 2004-2007; Wal-Mart approximately saved 3.4 $ billion dollars.

NIKOLA KNEGO
44
Rationalization of supply is one of the key segments in the merchandise politics (required price and assortment politics of goods). Rationalization of supply is the long-run outcome of merchandise politics. This can be seen from analysis of data from longer time intervals. For example the share of purchase price in the final price was lowered by 1.41% in the six year interval from 2002-2007. If we apply this number to Wal-Mart net sales in 2007 we can conclude saving around $4.9 billion.
7.3. The influence of change in level of prices on business results on tradesmen
Big supermarket chains tend to practice already known selling systems to achieve advantage in the distribution and supply of goods, or to slow down the increase in costs of goods sold. These systems function on principles of: reducing complexity of services, depersonalization of sales with use of the cutting edge technology and with concentrated and wise use of economies of scale.
In Table 3 of singular prices of products in METRO, Cash & Carry, Zagreb, prices of oil and coffee are similar to other six supermarket chains. However, overall level of ten examined products is 5.5% lower in Metro, than the next first supermarket.
Source: Krafft, M. & Mantrala, M.K. (editors), Retailing in the 21st Century-Current and Future Trends,
Springer, Berlin, 2006, p. 271
Next first supermarket had overall level of prices 5.5% higher than the level of prices in Metro. Level of prices with small tradesmen was in percentages higher respectively: 16% (M1), 16.8% (M2) and 28.9% (M3). The already mentioned level of prices is possible only if consumer accepts commercial packing of flour T-400 and T-550 of total ten kilograms (1kg x 10).
0 10 20 30 40 50 60 70 Increse in profit in %
Aldi Wal-Mart
Tesco Carrefour Albertson
Costco Metro
Kroger
Com
pany
Graph 5: Influence of 1% increse in prices on increase in profit of selected retail trade companies

IMPORTANCE OF CRAFTS IN DISTRIBUTIVE TRADE OF THE REPUBLIC OF CROATIA
45
The mentioned sales system is originally whole sale which serves small tradesmen, where they get membership cards, where without them they couldn’t buy in bulks. Great deal of buying is done by physical people, because membership cards are easy to get.
Some buyers are ready to accept and pay the products at a higher rate, with condition of down payments. In Metro this is not possible because they stopped accepting credit cards.
Small tradesmen do not have possibilities of using the advantages of already sales systems. Research also confirms that it is getting harder and harder to cut costs in the already existing sales systems. However; investments in the cutting edge sales technology create presumptions of the future cost cutting.
Table 8: Prices of chosen products in METRO, Cash & Carry, Zagreb
Product
METRO Cash & Carry
1. Dukat milk, 3,2% PET 5,69
2. Coca Cola 2l 11,94
3. Sugar, 1kg 5,48
4. Table salt 3,32
5. Hard flour, T-400 2,87
6. Soft Flour, T-550 2,35
7. Vegeta(spice mix), 250 g. 12,36
8. Sunflower Oil,Zvijezda, 1l. 12,99
9. Rice, 1kg, long grain, nylon pack 5,60
10. Franck coffee, jubilarna Vacuumed, 250 g. 15,99
Total: 78,59
Note: Data collection was done on 10 April 2008.
7.4. Processes in the retail sale which endanger the position of small tradesmen
Processes in present European retail sale can be summarized2:
a) Slower growth, more segmentation; b) Less national tradesmen, more international tradesmen; c) Less stores, more selling surface; d) Less supplies, more consumer services; e) Less independent, more filial tradesmen; f) Lower revenue per square meter of sale surface, higher profit margins.
2 Group of authors (1995): International Retailing – Trends and Strategies, Pitman Publishing, London, p. 45
NIKOLA KNEGO
46
All of this is present in Croatian retail market; however with a lesser intensity. Processes b, c, and f significantly endanger market position of small independent tradesmen. Process c can be represented graphically as shown in Graph 6.
Graph 6: Influence of economic development on number of stores and retail companies
7.5. What to do and what’s perspective of small tradesmen?
It is necessary to unite small independent tradesmen into alliances or organizations, while at the same time preserving economic independence and achieving advantages in business functions, firstly supply.
We think in organizing economic alliances or unions of small tradesmen, where tradesmen can enter or leave them freely, and where membership of one union doesn’t exclude membership in second or third union.
Having in mind already mentioned processes and extreme disconnection of small tradesmen in Croatia, perspective of most of them is quite worrying. This can be confirmed by experiences of developed European countries where in certain time intervals tens of thousands of small stores vanished, however; at the same time the selling surface and quality of retail service increased. Such an intensive process of somewhat purging Croatian retail scene just remains to occur, where the hardest hit will be taken by small tradesmen which offer mixed assortment of goods.
8. CONCLUSION
Everything that was mentioned leads to a conclusion that there is significant divergence of physical data and the significance of crafts trade and its financial contribution to results of Croatian distributive trade. Weak financial strength disables possibilities of modernization and technological innovations of crafts shops and its sales formats.

IMPORTANCE OF CRAFTS IN DISTRIBUTIVE TRADE OF THE REPUBLIC OF CROATIA
47
It can be stated that there are oscillations in the number of tradesmen in the number of available business units that are types of outlets, with the mutual low increase in average number of employees per store or shop. Tradesmen sale per unit of turnover employs significantly higher number of labor than the trading corporations. This is the consequences of lower technological development of smaller stores in the segment of tradesmen sale, this at the same time it gives less ability of substituting human labor with cutting edge technology used in most modern formats of supermarkets. Physical strength of the segments of distributive trade such as tradesmen sale, which comes out their number, is not recognized, primarily from the side of the tradesmen themselves. They could use this fact as an argument for starting the process of their interconnection. It is necessary in every process of concentrated trade which manifests itself in decreasing the number of tradesmen and increasing their market shares in segments of trade using the advantages of economies of scale.
No recognition of the need for business integration primarily comes from the less educated tradesmen in the activities in the segment of crafts trade. This is no exception compared to the total Croatian retail economy. There is a need of continuous work on the education of how we could anticipate market trends.
REFERENCES: 1. Group of authors (1995): International Retailing – Trends and Strategies, Pitman Publishing,
London, p. 45;
2. Knego, N. (2007): Produktivnost u trgovini na malo, Suvremena trgovina, Vol. 32, No. 3, p. 20 – 25;
3. Knego, N. (2008): Razina cijena – ključ tržišne nekonkuretnosti malih trgovaca, Suvremena trgovina, Vol. 33, No. 3, p. 26 – 29;
4. Knego, N. & Bračko, K. (2008): Značaj distributivne trgovine i njezini trendovi u Republici Hrvatskoj, Revija za pravo i ekonomiju – Review for Law & Economics, Mostar, p. 47 – 72;
5. Krafft, M. & Mantrala, M.K. (editors) (2006), Retailing in the 21st Century-Current and Future Trends, Springer, Berlin, p. 271
6. Central Bureau of Statistics: Statistical Yearbook of the Republic of Croatia – 2007, p. 409 and p. 691

STUDIA UNIVERSITATIS BABEŞ-BOLYAI, NEGOTIA, LV, 1, 2010
COMPETITIVENESS OF SMEs AND TRENDS ON THE MARKET
HANA ŠTVERKOVÁ 1, SIMONA HOFROVÁ 2
ABSTRACT. A new economy is a global economy and it means worldwide trading with services, goods, capital, production and information. Small and middle enterprises play importance role of nationality economies functioning. So there is need to evaluate the potential of small and medium enterprises with the meaning of European integration.
Small and middle companies have pivotal position in national economics in light of formation healthy entrepreneurial environment. Existences of small and middle companies stabilize society because each marked political insecurity and radical currents situation could be for them recourses diversification. Small and middle companies forms healthy entrepreneurial environment. Integration process of the Czech Republic into European union brigs the changes of parameters of business environment which needs to be monitoring and evaluated.
The aim of this paper is engaged in the competitiveness of small and middle companies in light of trends on market and using soft factors as are identity, integrity and majesty of company in The Czech Republic.
Key words: Small and medium – sized Enterprises, competitiveness, support for SMEs
JEL classification: M, M1
Introduction
The remarkable importance for economic development, regions, individual cities and municipalities are small and medium-sized enterprises (SMEs). Together a healthy business environment and increase market dynamics. SME development is generally considered a major factor in economic development, and regardless of the economic maturity of the country. The Member States of the European Union (EU), but also the EU itself is trying to create an effective support for the creation and development of SMEs. This seeks to ensure not only enhance the competitiveness of SMEs in the EU, but especially in global markets, seeks to ensure that they maintain a viable and currently overcome their current economic crisis, which has the right to SME catastrophic consequences.
1 Ing. VŠB- Technical University of Ostrava, Faculty of Economics, Czech Republic, [email protected] 2 Ing. VŠB- Technical University of Ostrava, Faculty of Economics, Czech Republic, [email protected]

HANA ŠTVERKOVÁ, SIMONA HOFROVÁ
50
Theoretical background
To approach the theoretical background on the competitiveness of SMEs and market trends it is necessary to define basic concepts which will be the reader in the face. This theory is descriptive and is based primarily on the definitions laid down in EU documents, literature and authors which are dedicated to this subject.
Small and Medium Enterprises
Types of businesses are diverse and can be seen on this issue from different perspectives. One important criteria is the size of the enterprise, which is possible to quantify the number of employees, production volume or size of sales3.
According to the European Commission's recommendation of 6 May 2003 concerning the definition of micro, small and medium-sized enterprises (2003/361/EC) SMEs are defined as follows4:
Small and medium sized enterprises are characterized by
• Have fewer than 250 employees • Have an annual turnover of less than 50 million EUR or annual balance
sheet total does not exceed 43 million EUR • Are independent.
Table 1: Definition small and medium enterprises according to EU
Categories of company Number of employees ANNUAL TURNOVER
ANNUAL BALANCE SHEET TOTAL
Medium < 250 ≤ 50 million € ≤ 43 million € Small < 50 ≤ 10 million € ≤ 10 million € Micro enterprise < 10 ≤ 2 million € ≤ 2 million €
Source: European Commission [online]. Recommendation 2003/361/EC.
SMEs are one of the important aspects of the EU economy. Their prosperity is a key factor for achieving more growth, better jobs in the EU. Dynamic entrepreneurs are very good options to use the opportunities offered by globalization and accelerating technological change. SMEs are the main engine of employment growth especially in sectors such as construction, transport, communications and tourism. Within the definition of the Lisbon Strategy in 2000 set the objective to increase competitiveness. In 2005, the Lisbon strategy and evaluated in relation to non-performance objectives, revisions were made. SME policy has become a key element of the Lisbon partnership for growth and employment.
3Synek, M.: Podniková ekonomika, 2000. 4 Small and Medium Enterprises Definition [online], [cit. 2009-05-11]. Available at www:
<http://ec.europa.eu/enterprise/enterprise_policy/sme_definition/index_en.htm>.

COMPETITIVENESS OF SMEs AND TRENDS ON THE MARKET
51
Competitiveness
According to materials of the EU competition is defined as "the market situation, the seller of goods or services independently of each other trying to gain the favor of buyers, in order to achieve a specific business objective such as profit size of sales and (or) the market share. Competitive competition between firms takes place on the basis of price, quality, ancillary services or combinations of these and other factors which positively evaluates customer. Non distorted and fair competition is a key pillar of the market economy.5 "
Microeconomic competitiveness is defined as the ability of a firm to maintain its market share respectively this proportion of individual commodities increase further. According to the Baláž the ability to win and maintain the best conditions of production and sales in the competition between producers or exporters of goods6. In essence it is the activation of various aspects of production efficiency, which are reflected on the cost (so-called price competition), quality (the quality of competition) and the ability to get a unique place in the market (the so-called market forces and gain a dominant position). For the three aspects lies a shared condition and the flexibility to reallocate resources to those activities, products and industries, that offer greater returns on capital. Ability to adapt quickly to market research, development and acceptance of know-how enterprises are considered to be the basis of competitiveness7.
New concept of competitiveness
Way to succeed in the market is to look for competitive advantages and using them to get a fixed position on the market. Competitive advantage must be based on long-term differentiation from other companies to build their own strong identity. This is particularly important in terms of competition in the sector. Finding a position in the market is hampered by competition under the influence of the so-called cross-competition, this is due to lines of, competitive products and services and competitive production and trade.
Do not just search for the competitiveness of firms in the financial health, manufacturing, marketing, management etc. It is necessary to examine the competitiveness in terms of new dimensions which may manifest in different forms from the design company through its corporate climate, communication and other features. It was found that there is a need to deal with the soft factors of competitiveness, which in small and medium-sized enterprises constitute the four-leaf clover expressions in business, and to the identity, integrity, sovereignty and the mobility of firms.
The process begins with shaping the competitiveness of transformations starting external potentials (resources) company which is further developed into other consecutive layers on the competitive potential. This process captures the pattern of competitiveness IDINMOSU.
5 PORTER, M.E.: 1990. 6 BALÁŽ, P.:1996. 7 BENÁČEK, KUDRNA, SEDLÁČEK, 2000.

HANA ŠTVERKOVÁ, SIMONA HOFROVÁ
52
Picture 1: The Scheme of Competitiveness – IDINMOSU
Corporate Identity presents its own personality find a company in the world beyond. It also includes finding and understanding the mission, role and self-image. It is viewed as a set of internal and external characters, which identify the real environment. Gradually the identity becomes the key factor in the competitiveness of firms. You can define different characters but these five are the:
1. Idea - the idea of the carrier which represents the essence of the firm penetrating vision as a company matures into business plans,
2. representational space (totem) - location, place, object that embodies the idea to the spatial form,
3. design - aesthetic audiovisual image ideas developed of totem and other features of identity,
4. ritual - the behavior, communication and processes derived from the ideas and implements its contents,
5. innovation - the process of transition of totem’s ideas design and development into new ritual forms.
It is irrelevant how many factors of identity are defined but the essential fact is that a competitive firm is characterized by maturing identity and integrity of a structured identity.
Identity
Sovereignty
Integrity Mobility
Vision, company strategy
Finance, financial partners
Customers, business partners
Internal processes, technology
Knowledge, innovation,
people
NATURE
SPACE TIME
SOCIETY

COMPETITIVENESS OF SMEs AND TRENDS ON THE MARKET
53
Integrity of the company is given its cohesion and involves himself in two terms. On the one hand its flexibility and dynamism given the fact that workers have their own identity. On the other hand combine this with a total of individualized identity it means company. If there is one or the other character, the company gets into trouble and not just economic. The aim is to find the integrity and the development potential of the company without disrupting its coherence with the aim of strengthening the overall position of the organization.
Mobility is a potential business in the form of capabilities and capacities to respond to changes inside and outside the company. There is a movement in time and space companies, such as the movement of material and immaterial elements, relationships and business activities. It is the ability and the possibility of firms to adapt and evolve with regard to its internal and external stimuli.
Sovereignty characterizes the position of the company in the business environment. Sovereignty is reflected by the fact that the organization has a genuine opportunity to decide efficiently and effectively for its development and at the same time the real possibility to implement those decisions effectively.
Modern European Small and Medium Enterprises policy
The main objective of modern SME policy is the integration of SMEs into the guidelines of national policies and Community policy the application of the principle of "think small first".
To make this policy effective the European Commission guided by commitments which are identified in five main areas:
1. Cutting bureaucracy 2. Improving SMEs' access to markets 3. Promoting entrepreneurship and skills 4. Improving the growth potential of SMEs 5. Strengthening dialogue and consultation with stakeholders on the small
and medium sized enterprises
These five areas are achieved by integration of SMEs in Community policies such as competitive policies, research, cohesion, rural development and also in the field of innovation and industrial policy. This results in the possibility of funding to support SMEs.
The focus of modern SME policy in addition adding the European Council in its conclusions of spring 2006 which called on Member States to release the entrepreneurial potential of the EU adopting the five priority actions:
1. establish a system of one-stop-shop that will allow the company quickly and easily and reduce the average time of setting up a business for one week,

HANA ŠTVERKOVÁ, SIMONA HOFROVÁ
54
2. encourage entrepreneurship, including through entrepreneurship education and training,
3. hiring the first employee should be dealt in a single administrative authority
4. make the principle of "think small first" fundamental principle of all relevant legislation and applying it systematically,
5. facilitate access of SMEs to public procurement.
These priority actions help to achieve better results and increase the competitiveness of SMEs in the EU. In particular it should enhance the potential of SMEs in the newly acceded countries. The European Council set out in the field of SME targets ambitious but not unrealistic.
Trends on the market of small and medium-sized enterprises The so-called modern SME policy, which was launched in 2005 and is
based on the principles of unity, openness and proactive approach, begins to have success not only wide but also by the Member States and their regions. Not only the European Commission, Member States but also achieve significant progress in implementing the steps to creating a better business climate, the inclusion of issues relating to small and medium sized enterprises in the main areas of their policies and incentives more people to become entrepreneurs8.
At the EU level in recent years held several conferences on the topic of SMEs and entrepreneurship and at these conferences are the EU leaders had inspired the development of initiatives both legislative and administrative proposals and recommendations to improve the situation of small and medium-sized enterprises.
In the current period of the Lisbon cycle 2008 - 2010 the European Commission aims to release the full potential of SMEs to growth and employment and full use of their innovative capacity. In the period is going to focus on the diversity of the small and medium-sized enterprises: companies craft, social enterprises and household businesses that have the potential motive to strengthen European growth, innovation, local development and employment. This is an initiative created to assist the European Commission in 2008 called the Small Business Act for Europe.
Small Business Act for Europe
In the EU a total of 23 million SMEs which accounted for two-thirds of employment and this share have even increased. Constitute 99% of all enterprises. According to the latest communication from the European Commission is making the share of SMEs to new jobs have 80%. Just as these companies grow and innovate are overridden by the EU citizens tend to entrepreneurship. SMEs contribute greatly to 8 Communication from the Commission to the Council, the European Parliament, the European Economic and
Social Committee and the Committee of the Regions: Small and medium-sized enterprises - Key for delivering more growth and jobs. - A mid-term review of Modern SME policy. COM (2007) 592, p.12.

COMPETITIVENESS OF SMEs AND TRENDS ON THE MARKET
55
the enhanced environmentally friendly products. The European Commission wanted in June 2008 to strengthen their position long-term initiative forthcoming Small Business Act for Europe. The initiative includes a lot of support measures to improve the relationship of workers from the EU to self-employment, that the EU prefers 45% of citizens while in the U.S. it is 61%. The main priorities and objectives of Small Business Act for Europe9 include:
• reduce the administrative burden by 25%. It is noted that while a large firm has an average cost of the administrative procedures prescribed by law: 1 EURO per employee these costs reach for small businesses up to 10 EUR,
• an Initiative JEREMIE support competitiveness, simplify the system of block exemptions. According to the survey 21% of SMEs in the EU have poor access to finance thereby increasing the proportion of the supply of credit in particular risk. Member States may also businesses operating locally in the provision of services to reduce the VAT.
• It should be shortened period for payments to small and medium enterprises within 30 days. At present this period varies from 20 - 100 days and therefore ending decline to 15 % of SMEs.
• It has accelerated and simplified the process for start-ups. The goal is to complete formalities at one place. The fee for setting up a business it is assumed a maximum of 100 000.
• It is proposed to the European private company statute. • A need for more SMEs to integrate into the science and research, education
and enable them to achieve the results of research and development funded from public sources.
• And more.
SMEs have a major impact on business in the area of economic growth and social and regional cohesion. They represent almost 70% of the total employment in Europe and provide the majority of the net number of jobs. In addition to small and medium sized enterprises and entrepreneurship increasingly important for economic growth in the context of a knowledge-based global economy. Despite of significant progress has been achieved thanks to the comprehensive policy for small and medium-sized enterprises shows that the European SMEs do not use their potential fully. In particular the productivity growth in SMEs in the EU is often less, innovate less and the period following the launch of their growth is slower than their counterparts in the U.S.. Although the current EU policy for SMEs is making good progress and many of these problems have included among its objectives, shows the lower performance in comparison with the U.S. that there is room for improvement.
9 Green SME - Small Business Act for Europe. COM (2008) 394 final.

HANA ŠTVERKOVÁ, SIMONA HOFROVÁ
56
The "Small Business Act", adopted on 25 June 2008, is a package of measures as legal and non which should lead to the elimination of problems that limit the performance of SMEs. For persistent problems identified can be considered two groups:
• Issues relating to coordination or implementation of existing policies. • The continuing gap in the market or in the legislation which are not
sufficiently addressed by existing policies.
The first group can include problems relating to the impact of legislation on SMEs, difficult access to domestic SMEs but also international markets, poor access to public procurement and that the issue of entrepreneurship is still reflected in the policies of education and training. The second group will include problems from the lack of female employment, problems of SMEs access to standards and their subsequent use, lack of access to finance, micro-credit and venture capital fragmentation.
Given the problems identified above in the initiative, "Small Business Act" established a number of objectives. The main objective is to release the full potential of European SMEs to employment growth and fully exploit their innovation capacity so as to contribute to the objectives of the Lisbon partnership for growth and employment renewed in 2005. To achieve the main objectives have been established two specific goals:
1. improve the implementation of the “Green SME” and coordination of existing policies
2. address the persistent gaps in legislation and in the market the SMEs in the EU is facing
EU through the European Commission also determines in its communication to propose solutions and tools to meet the objectives. These included strengthening the partnership with Member States for better implementation and coordination of policies and the entrenchment of the "Green SME" in the policies implemented at both EU and national levels. The tools for meeting specific objectives of the second coming itself considered business support through the promotion of entrepreneurship and business image or encouraging new entrepreneurs especially among women. In addition you can achieve the objective of further development of SME access to finance and especially micro-credit, increasing the awareness of SMEs on opportunities related to sustainable products and processes through the development and improvement of energy consultancy SME to international markets particularly the rapidly growing markets of China and India.
At the same time the objectives have been developed in accordance to variations of the policies. The first option includes the existing EU policy for SMEs which is based on the exchange of best practices and targeted EU support programs. The second option consists in the development of existing policies to support SMEs in

COMPETITIVENESS OF SMEs AND TRENDS ON THE MARKET
57
the EU through political partnership approach with the Member States to improve conditions for SMEs and entrepreneurship and includes targeted policies to address remaining gaps in the market and legislation. These two variants of complement also a third option proposed by many stakeholders. This option could be based on developing and implementing a fully-fledged approach to policy for SMEs, including legally binding objectives and principles, which would be implemented at EU and national level, and large-scale programs to address persistent gaps in legislation and on the EU market, which SMEs face. There must be but that the principle of subsidiarity10, as a large number of areas related to SME growth potential is predominantly in the Member States. Determination of legal liability would be clearly contrary to this principle therefore took this option is selected for further analysis.
Support for business competitiveness
EU provides support for SMEs. Support is available in various forms such as grants, loans and in some cases the warranty and may be direct or through programs managed at national or regional level for example through the EU Structural Funds. SMEs can also benefit from a range of non-financial support measures in the form of programs and support services business. The EU aid to SMEs is divided into four categories:
1. Thematic funding options
This type of funding is mostly thematic with specific objectives - environment, research, education - is formed and implemented by different departments of the Commission. SMEs and other organizations can usually apply directly to programs usually on condition that they submit to sustainable, multi-national projects with added value. Depending on the program, the applicant may include industrial groups, business associations, business support providers, or advisors. The general rule is co-financing: promoting the European Union usually consists of grants, which cover only part of the cost of the project.
2. Structural Funds
Structural Funds: European Regional Development Fund (ERDF) and European Social Fund (ESF) are most extensive EU instruments of funding support for SMEs through a variety of thematic programs and initiatives undertaken at regional level. The beneficiaries of structural funds receive a direct contribution to the financing of their projects. The selection of projects proceeded at national or regional level.
10 "In areas which do not fall within its exclusive competence, developed in accordance with the principle of
subsidiarity, Community action only if and insofar as the objectives can be achieved by the Member States, and therefore, by reason of their scale and effects, not be better achieved at Community level". Art. 5 of the Treaty on European.

HANA ŠTVERKOVÁ, SIMONA HOFROVÁ
58
3. Financial instruments
Most financial instruments are available only indirectly through national financial intermediaries. Most of them are managed by the European Investment Fund.
4. Support for international action SME
Generally consists of assistance to medium-sized organizations or public authorities in the field of internationalization in order to help SMEs with access to markets outside the EU.
The European Commission has increased its focus on SMEs in the main expenditure programs for the period 2007 -2013. The most important financial instrument is one of the Structural Funds to support SMEs make 16 - 18% of the total budget of cohesion policy. Other support tools include:
• European Agricultural Fund for Rural Development
This fund is in the current programming period to spend 10 billion EUR to support the creation and development of non-agricultural enterprises in rural areas, SMEs in agriculture, food industry and the summer farm.
• Seventh Framework Program for Research and Technological Development11
This is the ES Community program whose total budget is EUR 50 521 million and includes a number of incentives for the participation of SMEs in various programs such as Cooperation, Ideas, People and Capacities such as increasing the top rate of reimbursement of the costs of activities in scientific and technology areas from 50 % to 70 %.
• The Competitiveness and Innovation Framework Programme
The Competitiveness and Innovation Framework Programme (CIP) aims to encourage the competitiveness of European enterprises. With small and medium-sized enterprises (SMEs) as its main target, the programme will support innovation activities (including eco-innovation) provide better access to finance and deliver business support services in the regions. It will encourage a better take-up and use of information and communications technologies (ICT) and help to develop the information society. It will also promote the increased use of renewable energies and energy efficiency. The CIP has a total budget of over € 3.6 billion for the period 2007-2013.
11 European Parliament and Council Decision No 1982/2006/EC of 18 December 2006 concerning the
Seventh Framework Program of the European Community for research, technological development and demonstration activities (2007 to 2013).

COMPETITIVENESS OF SMEs AND TRENDS ON THE MARKET
59
Conclusion
They may be European SMEs competitive in world markets? They can, why not, but not of course. It is therefore important to create viable and promising small and medium sized enterprises such conditions for their operation to be the real driving force behind the development of the economy. It is therefore necessary to create a legislative and economic environment that, for reasons of unsatisfactory and inappropriate tools may not have formed gradually wear off.
For the future prosperity of the EU it is therefore a crucial ability of growth and innovative potential of SMEs which may be a stronger Europe and capable of coping with uncertainty which today globalized world brings. An important factor in creating a competitive business for SMEs at EU level is EU wide co-operation of institutions (European Commission, European Parliament) and national and regional authorities in implementing measures to increase the potential of these businesses. With a regular dialogue with European institutions, Member States of the SME policy of national measures and EU measures complement each other better. The European Commission supports this process by facilitating mutual learning and exchange of best practices.
In the context of the so-called "financial crisis" are the negative effects of this crisis is disastrous to the SME. They are not as competitive as large firms and therefore it is desirable that the EU help in maintaining viability. Currently in the so-called "financial crisis" the EU leading debate on "Guarantee Fund for SMEs". The Seventh Framework Program which was mentioned in the text should have rich benefits for SMEs in many areas whether on transport, health, biotechnology, security and others. With 7th Framework Programme of SMEs are actively encouraged to participate in all research projects especially those that will be implemented within the themes of cooperation. Whenever such action deemed appropriate will support the involvement of SMEs in the Joint Technology Initiatives. A key element of the seventh implementation plan is to simplify rules and procedures. The proposed measures will cover the entire funding cycle including the various elements of funding schemes, administrative and financial rules, procedures, user-friendliness and clarity of documentation.
International Cooperation under the Seventh Framework Program will lead to further integration of the EU into the world economy, and help to develop research and technology in countries that build their own knowledge capacity. This on the one hand contribute to enriching European research on knowledge generated elsewhere in the world, while on the other hand, increase the awareness and competence of companies and firms in developing countries in science and technology.

HANA ŠTVERKOVÁ, SIMONA HOFROVÁ
60
REFERENCES
1. BALAŽ, P.: Rast konkurečnej výkonnosti, cesta rozvoja slovenskej ekonomiky. 1.vyd. Bratislava, 1996. ISBN: 80-88848-03-2.
2. BENÁČEK, V., KUDRNA, Z., SEDLÁČEK, T.: Konkurenční schopnost České ekonomik. Podklad pro referát na konferenci: institucionalizace (ne)odpovědnosti: globální svět, evropská integrace a české zájmy, 2000. Dostupné na WWW: http://veda.fsv.cuni.cz/konf_sem/globalni_svet/GS_prispevky/gs_ek_benacek.htm
3. MIKOLÁŠ, Z.: Nová dimenze konkurenceschopnosti firem v podmínkách globalizace a evropské integrace v kontextu formování znalostní společnosti. In Sborník mezinárodní konference „ Firma a konkurenční prostředí 2004“. Brno: MZLU Brno, 2004.
4. MIKOLÁŠ, Z.: Jak zvýšit konkurence schopnost podniku. 1. vyd. Praha: Grada Publishing, a. s., 2005. 200 s. ISBN 80-247-1277-6. s. 85.
5. PELTÁM, A. a kol.: Evropská integrace a Česká republika. Praha, 2009. Tiskárny Havlíčkův Brod, a.s..144 s. ISBN 978-80-247-2849-0.
6. PORTER, M. E.: Konkurenční výhoda: (jak vytvořita udržet si nadprůměrný výkon). Praha: Victoria Publishing, 1998. 626 s. ISBN 80-856-05-12-0.
7. European Parliament and Council Decision No 1982/2006/EC of 18 December 2006 concerning the Seventh Framework Program of the European Community for research, technological development and demonstration activities (2007 to 2013).
8. Green SME - Small Business Act for Europe. COM (2008) 394 final. Available at WWW: http://eur-lex.europa.eu/Result.do?T1=V5&T2=2008&T3=394&RechType=RECH_naturel&Submit=Hledat
9. Communication from the Commission to the Council, the European Parliament, the European Economic and Social Committee and the Committee of the Regions: Small and medium-sized enterprises - Key for delivering more growth and jobs. - A mid-term review of Modern SME policy. COM (2007) 592. Available at WWW: http://eur-lex.europa.eu/Result.do?T1=V5&T2=2007&T3=592&RechType=RECH_naturel&Submit=Hledat

STUDIA UNIVERSITATIS BABEŞ-BOLYAI, NEGOTIA, LV, 1, 2010
BUSINESS GOALS OF FAMILY-OPERATED ACCOMMODATION ENTERPRISES:
THE CASE OF MUGLA, TURKEY
MEDET YOLAL 1, FATMAGÜL ÇET ĐNEL 2
ABSTRACT. Middleton (2001) noted that in Europe 95 percent of tourism businesses, generating perhaps one-third of total tourism revenue, are micro-business and most of these are family businesses (Getz, Carlsen and Morrison, 2004). Contrary to their importance in the economic well-being of the country, they suffer a wide range of strategic disadvantages and weaknesses preventing them from a sustainable development and yielding desired outcomes (Yolal and Emeksiz, 2007). At the most basic level a family business can be defined as “... an enterprise which, in practice, is controlled by members of a single family” (Barry, 1975). The dominance of small and medium sized enterprises in the tourism industry calls for extensive research on the businesses and it is important to expand the knowledge family businesses and the entrepreneurial business goals of these firms. The paper aims at examining business goals of family operated accommodation enterprises. The sampling frame for the survey is the family-operated accommodation enterprises employing 1 to 10 employees. A total of 105 questionnaires were collected in February and March 2009. The results of the study showed that almost two third of the entrepreneurs were first generation in the family business. The results revealed that the business goals of the family businesses in the study are growth, retirement and slow down. The results also indicated that the entrepreneurs ar mostly lifestyle entrepreneurs. The study concludes with discussions based on the findings.
Keywords: family business, accommodation, business goals, Turkey.
JEL Classification: M10
1. INTRODUCTION
Tourism offers many opportunities for family business, often embodying direct host-guest interactions in a more formal environment like family home or property. They are often vital to customer experiences and satisfaction, and to destination and community development (Getz and Carlsen 2005). Tourism and hospitality as an
1 Assistant Professor, PhD, Anadolu University, School of Tourism and Hotel Management, 26470,
Eskisehir, Turkey, [email protected] 2 Assistant Professor, PhD, Anadolu University, School of Tourism and Hotel Management, 26470,
Eskisehir, Turkey, [email protected]

MEDET YOLAL, FATMAGÜL ÇETĐNEL
62
industry is dominated by small and medium sized firms, many of which are family and owner operated businesses. They are predominantly started or purchased for lifestyle and autonomy reasons (Andersson, Carlsen and Getz, 2002). Contrary to their importance in the economic well-being of the country, they suffer a wide range of strategic disadvantages and weaknesses preventing them from a sustainable development and yielding desired outcomes (Yolal and Emeksiz, 2007). However, interest in and research on family business has been increasing rapidly due to their scale and importance in most countries. Middleton (2001) noted that in Europe 95 percent of tourism businesses, generating perhaps one-third of total tourism revenue, are micro-business and most of these are family businesses (Getz, Carlsen and Morrison, 2004). In Turkey, the total number of accommodation operations certified by the Ministry as small and medium sized hotels (SMHEs) is 1,730 including one, two, and three star-rated hotels, motels, pensions, camping, chalets and hostels, which results in 74.5 percent of total number of all the enterprises. When the municipality certified hotels and family businesses are included, the figure rises to 95 percent (Ministry of Culture and Tourism, 2005).
In Turkey, however, studies on the family businesses in tourism are very limited compared to their dominance in the tourism and hospitality sector of the country and their contribution to both the development of tourism industry and the economy. As it is suggested by Getz and Carlsen (2000), it is important to business development and destination planning programs to understand what motivates entrepreneurs and investors, and what their values are in starting a business. Thus, the main objective of this paper is to examine characteristics and business goals of family operated accommodation enterprises using data from Mugla, Turkey.
2. LITERATURE REVIEW
At the heart of any discourse is the notion of definition. In this regard, family business definitions focus around variables such as ownership participation or risk assumption. Broader definitions also include social aspects of entrepreneurial life. Wherever family systems strongly interact with the entrepreneurial level of the enterprise system, the enterprise shows a family business character. This implies that the development of a family business depends on three factors, namely: the entrepreneurs’ family, ownership, and enterprise system (Gersick, Davis, Hampton, and Lansberg, 1997). Family ties and values are often said to create a strong business identity and a high level of internal ‘closeness’, which may lead to better performance of the firm in terms of internal trust and control (Leenders and Waarts, 2003). While defining family businesses Westhead, Cowling and Howorth (1998) refers to a discussion in Chua, Christman and Sharma (1999) noting that ‘previous studies have tried to define the family business by its ownership and management but companies with the same level of family involvement in ownership and management may or may not consider themselves family businesses and, more importantly, may or may not

BUSINESS GOALS OF FAMILY-OPERATED ACCOMMODATION ENTERPRISES
63
behave as family businesses’, and Cowling and associates (1998:370) regarded a family business if more than 50 percent of ordinary voting shares are owned by members of the largest single family group related by blood or marriage, and if the company is perceived by the chief executive/managing director/chairman to be a family business. Evidently, the owner/manager’s determination of what his or her business is more important than how others define it. In the same vein, Birley, Ng and Godfrey (1999:598) list the characteristics of a family business is as follows:
• family owners consider the business to be a source of income for all members, whether or not they work in the business,
• children usually start at the top, don’t know what they are doing, and so manage badly,
• parents apply pressure to their children under the assumption that they will automatically join the business,
• parents never know when to retire and never give their children any responsibility,
• owner-managers can’t separate family and business affairs, and • most children regret joining the family business.
Family dynamics is a crucial factor in the family business. This is true even for sole proprietors, because their business activities frequently involve other family members, and they often have to balance business and family interests (Getz and Carlsen, 2005). To many, the main advantages of the family business seem to be related to trust, control, and employee motivation. Family ties and values are often said to create a strong business identity and a high level of internal ‘closeness’, which may lead to better performance of the firm in terms of internal trust and control (Leenders and Waarts, 2003: 689). However, family businesses are different from other businesses because ownership and control of the business overlaps with family membership and, as such, are “the most complex form of business organization”. As a result, conflicts and contradictions can occur as the business and the family strives for different objectives (Birley et al., 1999). The interaction between family dynamics and business operations are important, including such topics as gender roles, dealing with family issues, ownership, family involvement, and evolution of the business within the family lifecycle (Getz and Carlsen, 2000)
In general, having a good corporate atmosphere is considered an important advantage for a company (Hudson, 2001; Schulz, 2001). The mental environment of a firm reflects the attitudes of the managers and choices of the firm (Leenders and Waarts, 2003: 689). It is often assumed that for family business, profits may be sub-optimal because keeping a happy family sometimes outweighs creating more value and profits. This can create a good corporate atmosphere if the dominance of the family emphasis is generally accepted in the firm (Kets de Vries, 1993). By contrast, if members of the organization know that actions are strictly evaluated on financial criteria, the atmosphere can also be good (Leenders and Waarts, 2003: 690).

MEDET YOLAL, FATMAGÜL ÇETĐNEL
64
A regularly mentioned issue regarding family businesses concerns conflict resolution when conflicts between organizational members occur. If conflicts occur between organizational members, they may be more difficult to handle if the family orientation is strong (Morris, Williams, Allen and Avila 1997; Holland and Boulton, 1984). A strong business orientation may be more beneficial for conflict resolution because it can provide some objective criteria to solve possible problems and to evaluate solutions (Leenders and Waarts, 2003: 689).
A number of researchers have determined that entry barriers in tourism are usually low, and many owners lack pertinent experience or training (Morrison, Rimmington, and Williams, 1999). Consequently, lack of professionalism is a frequent complaint leveled at family businesses in tourism and hospitality (McKercher and Robbins, 1998; Szivas, 2001). Shaw and Williams (1990 cf. Getz and Carlsen, 2005) observed that noneconomic reasons existed for many tourism/hospitality owners entering business in UK coastal resorts. For example, they wanted to be self-employed, hated their previous occupation, sought a better lifestyle, had personal reasons for making a change, or preferred the location (often after vacationing there). Semi-retirement was also a big motive, and in some cases owners had been made redundant from their previous jobs and were forced to seek a new source of income (Getz and Carlsen, 2005: 243).
Family businesses display a relatively low growth rate, compared to non-family firms. They often face typical management and growth problems that call for specific training areas such as succession or conflict management issues (Ibrahim, Soufani and Lam 2003). Furthermore family firms have particular priorities and structures like family concerns that often reflect the lifestyle that the family wants to follow, rather than rational business principles (Peters and Buhalis, 2004).
Seasonality has been an inescapable aspect of tourism and the fluctuations in demand are more acute due to perishability of the product, and the effects of seasonality are more drastic for the small or family businesses in the industry limiting tourism business creation, profitability and growth. A study of seasonality revealed some of the pressures that are generated on family businesses. They found that owners relied heavily on summer student workers to meet peak demand, and often worked themselves 100 hours a week over a 16-20 week season. Some took another job in the off-season, while others had to sustain the business (repairs, marketing, etc.) (Getz and Carlsen, 2005: 241). Getz and Nilsson (2004) detected a number of strategies used by family businesses to either counter cyclical demand or adapt to it, and all of the options have impacts on family life.
The National Survey of Small Tourism and Hospitality Firms in the UK (Thomas, Friel, Jameson and Parsons, 1997) questioned owners on their motives. Fully 90 percent of owners gave non-economic reasons for being in business. Few were motivated by the anticipation of greater financial rewards than could be expected from paid employment. The most common reasons given for business ownership were to do what they enjoyed (45%) and the desire for independence (30%). Only 4

BUSINESS GOALS OF FAMILY-OPERATED ACCOMMODATION ENTERPRISES
65
percent considered ownership of their small business to be a form of semi-retirement, while 10 percent believed they had been driven to self-employment (Getz and Nilsson, 2004). Sharma and associates (1996) observed that family business goals “are likely to be quite different from the firm-value maximization goal assumed for the publicly traded and professionally managed firms”. In a study of small tourism businesses in Victoria, Australia, Bransgrove and King (1996) found that the top goals of owners/ managers were challenge/stimulus, business opportunity, lifestyle, and long-term financial gain (accounting for 18-24 % each). But lifestyle goals were twice as frequent in rural areas. Other rural tourism researchers have pointed to the goals or rewards of improved social lives (Pearce, 1990), and social standing (Pearce, 1990). In the same manner, the paper examines characteristics and business goals of family operated accommodation enterprises using data from Mugla, Turkey.
3. METHODS
The aim of the study is to examine business goals of family operated accommodation enterprises. The sampling frame for the survey was the family-operated accommodation enterprises employing 1 to 10 employees. A questionnaire is an efficient data-collection mechanism when the researcher knows exactly what is required and how to measure the variables of interest (Sekaran, 1992). The questionnaire used in the study was developed on the basis of Getz and Carlsen’s (2000) and Gunver’s (2002) previous studies, considering the specific conditions of Turkey and the tourism businesses. The questionnaires were administered personally in the districts of Bodrum, Fethiye and Marmaris of Mugla province during January and February, 2009. Almost 127 businesses were conducted but 22 of them refused to respond. The response rate was 82.6 percent.
The questionnaire has three parts. The first part includes demographic questions about the owner-managers of the family firms. The second part questions about the characteristics of the family firms. And finally third section includes questions about the business goals.
4. RESULTS
All 105 respondents indicated that they had a family-owned business, and at least a member of the family was employed in the business. The ownership among the respondents proves the domination of males in the business life. Females merely accounted for 20 percent in the respondents. However, this is larger than expected, since the female entrepreneurs accounted for only 13.8 percent in Turkey according to 2007 figures (www.koniks.com).
67.6 percent of respondents were married and 58.1 percent have at least one child (the ages of the children were not questioned). Of the 69 respondents who had children, 21.7 percent had one child followed by 43.5 percent having two children, 21.7 have three children 10.1 percent have four children and finally 2.9 percent have five children.

MEDET YOLAL, FATMAGÜL ÇETĐNEL
66
In terms of education, the largest group (35.2 %) of the respondents had a university degree, 24.8 percent had high school qualifications, 15.2 had a college diploma, 14.3 percent primary school and 7.6 percent had secondary school diploma. Merely 2.9 percent had advanced degrees.
The dominant age category of respondent was 31-40 (32.4 %), followed by 41-50 (23.8 %). The 21-30 age category accounted for 18.1 percent and the 51-60 category was 15.2 percent. Only 8 respondents were between 61-70 (7.6 %) and only 3 (2.9 %) were over 71.
As an entrepreneurial characteristic, 68.6 percent of the respondents indicated that they were the first generation in the family business, while 30.5 percent were the second generation. These findings can be interpreted in several ways. First, it is seen that the respondent 67 percent of the firms were open for 2 to 15 years, and most of the businesses are being operated by their founders. Secondly, the analysis of age groups of the respondents revealed that 50.5 percent of them were between 21-40 age groups, and this age group is not suitable to transfer the business to the second generation. Finally, 70.3 percent of the firms were founded after 1990s, and they can be regarded as new in the business life.
The founder of the surveyed businesses has a limited variety. 55.2 percent of the respondents stated that they were the founder of the business themselves. 33.4 percent explained that the founder of the family business was their parents, and they had inherited the business. In 32.4 percent of the businesses only a member of the family was the owner of the business. Seventy percent noted that ownership of the business was a form of partnership among the family members.
The ownership of the real estate in which the business operates defines the managerial style. The study findings showed that the building belonged to the family (the respondent himself/herself, spouse, children, and parents) in 85.7 percent of the respondents. On the other hand 13.3 percent of the businesses were being operated in a rented building. Only one respondent stated that the building belonged to a relative. These buildings could also be used as a place of residence for the family. And it was also found that 23.8 percent of the respondents were living in the family business building.
It is known that small businesses, especially family businesses offer limited service. In this vein, it is surprising to find out that 70.5 percent of the respondent businesses offer restaurant facilities, and they serve both lunch and dinner. Besides, 24.8 percent of the respondents operate bed and breakfast. Finally, 4.8 percent did not offer any food and beverage facilities.
As mentioned above at least a member of the family was employed in the business. The number of family members employed in the businesses varies one to six. The largest group (30.5 %) of the respondents indicated that two family members were employed in the business, followed by 27.6 percent employed three and 25.7 percent employed just one family member. 10.5 percent had four members and 4.8 percent had five members. Merely one respondent business had six family members employed in the business.

BUSINESS GOALS OF FAMILY-OPERATED ACCOMMODATION ENTERPRISES
67
Another important finding of the study is that 59 percent of the respondents did not rely on solely their accommodation business. They also had other sources of income except the accommodation business. In this regard, 61.9 percent of the respondents evaluated their income level as good, and 25.7 percent very well. The rest of the respondents (11.4 %) evaluated their income levels as moderate. Although satisfaction from the income levels is relative, it is understood that all the respondents were earning satisfactory in their businesses. However, this does not guarantee the future well-being of the family businesses.
The future of such firms was also questioned. The respondents were asked to indicate whether they prepare someone for the future transfer of the business. Forty percent of the respondents stated that they trained some family members for future transfer of the business. Although this rate seems to be low, when it is compared with the age groups of the respondents, this is not surprising and exceptional since more than half of the respondents are between 21-40 age groups. Similarly, they were asked about the transfer of the businesses. 25.7 percent of the respondents stated that they would transfer the business to their sons, while only 4.8 percent would transfer to their daughters. The parents were inclined to transfer their businesses to their sons rather than their daughters. However, 13.3 percent of the respondents indicated that they were planning to transfer the business the one who was talented. This finding is also important for the sustainability of the business and safer generation shift.
Table 1 shows the details of degrees of importance with each one of the eleven statements provided in the third part of the questionnaire. For simplicity, attributed agreement levels were summarised in group percentages as “strongly agree or agree” and “strongly disagree and disagree”. The overall mean value was 2.36 out of 5, which means the agreement level of the respondents towards business goals, in general, was neither favourable nor unfavourable.
As can be seen in Table 1, 80.0 percent of the respondents agreed with the goal “prefer a quite life far from the crowd of the city” with a mean value of 3.65, while 51.4 percent of the respondents agreed with the goal “to increase the number of employees”. However the mean value of “to increase the number of employees” was found to be 3.32, which is in the undecided area. The respondents are also neither agree nor disagree with the goals of “meeting new people rather than making lots of money”, “to grow business”, “to increase the number of rooms” and “pass on the responsibility to children”. These findings can be read as that the respondents in the survey are lifestyle entrepreneurs.
On the other hand, it seems that the respondents disagree with the goals of “enjoying the property by not accepting customers in a near future”, “transfer the management to other people”, and “sell the business when a reasonable price occurs”. Besides they strongly disagree with “go on service by diminishing the number of rooms”, and “close this business and open a new one”. These findings reveal that the respondents like to work in the tourism industry but they do not intend to grow their family businesses.

MEDET YOLAL, FATMAGÜL ÇETĐNEL
68
Table 1. Business Goals of Family Operated Accommodation Enterprises
Str
ongl
y di
sagr
ee/
disa
gree
Nei
ther
agr
ee
nor
disa
gree
Str
ongl
y ag
ree
/ ag
ree
GOALS
% % %
Mean St. D.
prefer a quite life far from the crowd of the city in a small business.
19.0 1.0 80.0 3.65 .96
to increase the number of employees. 23.1 25.0 51.4 3.32 .93
meeting new people rather than making lots of money.
46.7 22.9 30.5 2.85 .90
to grow business. 44.8 31.4 23.8 2.80 1.02
to increase the number of rooms. 46.7 29.5 23.8 2.79 1.06
pass on the responsibility to children. 51.4 19.0 29.6 2.69 1.25
enjoying the property by not accepting customers in a near future.
75.2 3.8 21.0 1.95 1.36
transfer the management to other people. 85.7 2.8 11.5 1.67 1.01
sell the business when a reasonable price occurs.
76.2 19.0 4.8 1.66 1.03
go on service by diminishing the number of rooms.
95.2 2.9 1.9 1.34 .63
close this business and open a new one. 96.2 1.8 1.0 1.26 .63
The eleven perceptional items were factor analyzed with varimax rotation to delineate the underlying dimensions of business goals of the family businesses. Each dimension had an Eigenvalue at least one or higher and explained more than 3 percent of the variance. The total variance explained was 60.3 percent. One item, ‘meeting new people rather than making lots of money’, which was removed from further analysis, had a loading of less than 0.45. The total Cronbach’s alpha value indicated that the model was internally reliable (α=0.770). The appropriateness of factor analysis for business goals was determined by Barlett’s test of sphericity=467,623 p<0.001 and the test KMO = 0.625, Sig 0.000. The factor analysis of these items resulted in three factor groupings. The three dimensions were than labeled according to the variables that carried higher factor loadings within each particular factor (Table 2). The reliability coefficients for three factors were as 0.893 for growth, 0.716 for retirement, and 0.706 for slow down.

BUSINESS GOALS OF FAMILY-OPERATED ACCOMMODATION ENTERPRISES
69
Table 2. Factor Analysis Results of Business Goals
Subscales
Eig
enva
lues
Rel
iabi
lity
Coe
ffici
ent
Var
ianc
e E
xpla
ined
Fac
tor
Load
ing
Growth 2.854 .893 25.958
- to grow business. .955 - to increase the number of rooms. .955 - to increase the number of employees. .790
Retirement 2.725 .716 18.701
- to enjoy the property by not accepting customers in a near future. .851
- pass on the responsibility to children .772 - prefer a quite life far from the crowd of the city in a small business. .539
- transfer the management to other people .523
Slow Down 1.725 .706 15.680
- sell the business when a reasonable price occurs. .806 - close this business and open a new one. .787 - go on service by diminishing the number of rooms. .677
5. CONCLUSION
The study reports on a field survey on the family-operated accommodation businesses in Mugla. The analysis reveals that the family-operated accommodation enterprises in the region are relatively new, most of which are in the business life between 2 to15 years. And most of them are being operated by their first generation founders in the age group of 30-40. This can be explained by the rapid development of tourism industry in Turkey as a result of Tourism Encouragement Law of 1982. An elaborate incentive system, using Ministry of Culture and Tourism and the Tourism Bank as main instruments, was introduced backed by sufficient resources at least until the end of 80 (Goymen, 2000).
Female entrepreneurship is also found to be as low as 20 percent. In their study, Cetinel, Yolal and Emeksiz (2009) found a similar ownership pattern in small and medium sized hotel enterprises that merely 10.5 percent of the businesses are owned by females. This is the result of male dominance in the business life in Turkey. In a similar manner, transfer plans of the owners are also problematic. They mostly plan to transfer their businesses in the future to their sons. However, it is expected them to transfer the businesses to the talented children. At this point it may

MEDET YOLAL, FATMAGÜL ÇETĐNEL
70
be argued that it is too early for the owner managers of the family businesses to plan for a transfer due to their younger ages and mostly their being the founder of the family businesses. On the other hand, the owner-managers of the family-operated accommodation businesses are found to be well educated. Though, it is expected that these people would follow a more professional approach in the management of their family firms, and contribute to the sustainability of their businesses.
The property of the firm belongs to over 85 percent of the families. This is important for the financial well-being of the businesses. On the other hand more than half of the families did not rely solely on their accommodation businesses and this diminishes over-dependence of the families on the family accommodation business. This also helps families to overcome problems caused by seasonality of demand. Contrary to expectations, most of the businesses offer restaurant facilities.
When the business goals are examined, it is seen that 80 percent of the respondents prefer a quite life far from the crowd of the city in a small business. They also place emphasis on increasing the number of employees. They may wish to create employment for the family members. The results of the study also indicated that the respondents planning to continue their family business without any intention to transfer or sell or grow their business. It is understood that the owner managers of the surveyed family businesses are mainly lifestyle entrepreneurs. Three factors dominate their business goals: growth, retirement and slow down. These three dimensions of business goals demonstrate that a kind of retirement with limited service and limited guest, enjoying the property or passing on the responsibility to children and slowing down the business are important goals for the family businesses. These findings can also be read as the proofs for lifestyle entrepreneurship.
The study is limited to only one destination in Turkey, and the study areas should be diversified in order to evaluate the country as a whole. Further studies would also contribute greatly to the understanding of the family firms and present insights on the characteristics and strategic orientations of family firms.
REFERENCES 1. Andersson, T., Carlsen, J., and Getz, D. (2002). Family business goals in the tourism
and hospitality sector: Case studies and cross-case analysis from Australia, Canada, and Sweden. Family Business Review, 15(2): 89-106.
2. Barry, B. (1975). The development of organization structure in the family firm. Journal of General Management, 42-60.
3. Birley, S., Ng, D. and Godfrey, A. (1999). The family and the business. Long Range Planning, 32(6): 598-608.
4. Bransgrove, C. and King, B. (1996). Strategic marketing practice amongst small tourism and hospitality businesses. In Thomas, R. (ed.) Spring Symposium Proceedings of International Association of Hotel Management Schools, (pp. 29-38). Leeds Metropolitan University.

BUSINESS GOALS OF FAMILY-OPERATED ACCOMMODATION ENTERPRISES
71
5. Cetinel, F., Yolal, M. and Emeksiz, M. (2009). Human resource management in small and medium sized hotels in Turkey. Journal of Human Resources Management in Hospitality and Tourism Management, 8 (1): 43-63.
6. Chua, J., Chrisman, J. and Sharma, P. (1999). Defining the family business by behaviour. Entrepreneurship Theory and Practice, 23(4): 19-37.
7. Gersick, K.E., Davis, J.A. Hampton, M.M. and Lansberg, I. (1997). Generation to Generation: Life Cycles of the Family Business. Boston: Haword Business Press.
8. Getz, D. and Carlsen, J. (2000). Caharcteristics and goals of family and owner-operated businesses in the rural tourism and hospitality sectors. Tourism Management, 21(6): 547-560.
9. Getz, D. and Carlsen, J. (2005). Family business in tourism-state of the art. Annals of Tourism Research, 32(1): 237-258.
10. Getz, D., Carlsen, J. and Morrison, A (2004). The Family Business in Tourism and Hospitality. Cambridge: CABI Publishing.
11. Getz, D. and Nilsson, P.A. (2004). Responses of family businesses to extreme seasonality in demand: The case of Bornholm, Denmark. Tourism Management, 25(1): 17-30.
12. Goymen, K. (2000). Tourism and governance in Turkey. Annals of Tourism Research, 27(4): 1025-1048.
13. Gunver, B.A. (2002). Aile Isletmelerinin Yapisi ve Gelecegi (Characteristics and Future of Family Businesses). Istanbul: Istanbul Kultur Universitesi Yayinlari.
14. Holland, P. G. and Boulton, W. R. (1984). Balancing the family and the business in family business. Business Horizons, 27(2): 16-21.
15. Hudson, K. M. (2001). Transforming a conservative company-one laugh at a time. Harvard Business Review, 79(7): 45-53.
16. Ibrahim, A.B., Soufani, K. and Lam, J. (2003). Family business training: A Canadian perspective. Education&Training, 45(8/9): 474-482.
17. Kets de Vries, M. F. R. (1993). The dynamics of family controlled firms. Organizational Dynamics, 21(3): 59-71.
18. Leenders, M. and Waarts, E. (2003). Competitiveness and evolution of family businesses: The role of family and business orientation. European Management Journal, 21(6): 686-697.
19. McKercher, B., and Robbins, B. (1998). Business development issues affecting nature-based tourism operators in Australia. Journal of Sustainable Tourism, 6(2): 173-188.
20. Middleton, V. (2001). The importance of micro-businesses in European tourism. In Roberts, L. and Hall, D. (eds.) Rural Tourism and Recreation: Principles to Practice. Wallingford: CABI International.
21. Ministry of Culture and Tourism (MCT) (2005). Konaklama Tesislerine Ait Istatistikler (Accommodation Statistics) Retrieved December 2005 from www.turizm.gov.tr/TR/BlegeGoster.
22. Morris, M.H., Williams, R.O., Allen, J.A. and Avila, R.A. (1997). Correlates of success in family business transitions. Journal of Business Venturing, 12(5): 341-422.

MEDET YOLAL, FATMAGÜL ÇETĐNEL
72
23. Morrison, A., Rimmington, M., and Williams, C. (1999). Entrepreneurship in the Hospitality, Tourism and Leisure Industries. Oxford: Butterworth Heinemann.
24. Pearce, P. (1990). Farm tourism in New Zealand: A social situation analysis. Annals of Tourism Research, 17(3): 117-125.
25. Peters, M. and Buhalis, D. (2004). Family hotel businesses: Strategic planning and the need for education and training. Education&Training, 46(8/9): 406-415.
26. Schulz, J. W. (2001). Tapping the best that is within: Why corporate culture matters. Management Quarterly, 42(1): 29-36.
27. Sekaran, U. (1992). Research Methods for Business: A Skill Building Approach (2nd Ed.). New York: John Wiley & Sons, Inc.
28. Szivas, E. (2001). Entrance into tourism entrepreneurship: A UK case study. Tourism and Hospitality Research, 3(2): 163-172.
29. Sharma, P., Chrisman, J. and Chua, J. (1996). A Review and Annotated Bibliography of Family Business Studies. Boston: Kluwer.
30. Thomas, R., Friel, M., Jameson, S. and Parsons, D. (1997). The national survey of small tourism and hospitality firms: Annual report 1996-97. Leeds: Leeds Metropolitan University.
31. Westhead, P., Cowling, M. and Howorth, C. (2001). The development of family companies: Management and ownership imperatives. Family Business Review, 14(4): 369-385.
32. Yolal, M. and Emeksiz, M. (2007). A cooperative marketing model proposal for SMHEs in Turkey. World Journal of Tourism Small Business Management, 1(2):57-68.
33. www.koniks.com Retrieved April, 2009.

STUDIA UNIVERSITATIS BABEŞ-BOLYAI, NEGOTIA, LV, 1, 2010
STRATEGY COMPETENCES AND PERFORMANCE MEASUREMENT IN THE HUNGARIAN SMES SECTOR
ATTILA KURUCZ1
ABSTRACT. Small and medium-sized enterprises (SME) are potentially the most dynamic sector of the economy. SME represent 99% of all companies in the EU. They are the biggest sector of the EU economy, with 23 million enterprises employing around 75 million people. These small organizations are responsible for the creation of one in every two new jobs. SME produce considerably more than half the EU's GDP. Their growth is key for the overall economic well-being. The European countries have several programs and measures in place to promote SME growth. But how do they think about their potential and their future?
This paper focuses on factors affecting the growth and performance of small and medium enterprises (SMEs). The aim was to identify strategic factors differentiating young and long-lived growth SMEs and find out the coherency with performance. A comparison of the two fields shows an interesting picture in the Hungarian SMEs sector. The results suggest that the organization structure and the applied leadership methods exercise an influence on SME growth strategies. The results increase our understanding of the factors affecting SME growth and performance in two different contexts.
This paper draws on survey and interview material, from research with entrepreneurs in small and medium-sized enterprises (SMEs) to examine the process of entrepreneurship and entrepreneurial competences in SMEs. Underlining two main business fields: cost management and performance management. This paper reviews the contribution of cost accounting and strategy thinking, which, it is argued, have been developed for large firms rather than SMEs. More appropriate theories are examined from fields that accepted the impact of uncertainty and dynamics in decision-making, such as performance prism to learning and development. Case study evidence is presented on the nature of entrepreneurial behaviour in growth SMEs and compared with theories in the literature.
Keywords: Entrepreneurship; firm performance; firm strategy; small and medium enterprises
JEL Classification: L25, L26, M21
Introduction
During the adjustment process to the flexible business environment the members of the SMEs sector face many difficult tasks. Enterprises must monitor their business by aligning performance measures with the critical success factors they have identified. Again, the process view allows them to establish metrics for 1 PhD student, University of West-Hungary, Faculty of Economics, [email protected]

ATTILA KURUCZ
74
measuring and monitoring the important elements of performance. Sometimes it will be almost impossible, if the stakeholders do not defined, or there is no vision and a strategic concept. In the interviews I try to make it clear, that the versatility of the entrepreneur or the financial rates play bigger role at the success of these firms. They need to create a new management information system, in which the cost information must support the strategy. Whether the company’s strategic focus is quality, close-to-the-customer, time-based competition, or something else, the leaders need good information to back their decisions. Lacking good information, they cannot reach the strategic goals. Acquiring good cost information is the fundamental power that Total Cost Management provides.
Recent research has shown that clear links between an organisation’s approach to strategic planning and its business performance exist in small as well as in large organisations (Ernst & Young 2000, Davig et al. 2004).
Improved strategic management processes may also facilitate the development of the more complex management structures that are needed as small firms grow (Miller 1959, Atkins & Lowe 1997).
A popular tool used to support strategic management activity in large firms is the Balanced Scorecard. To date, reported activity to deploy management systems that are based around use of Balanced Scorecards has focused on large, multi-national, multi-divisional firms (e.g. Mobil, Cigna, AT&T, Motorola).
This paper discusses, from a practitioner point of view, the potential merits and feasibility of deploying vision and strategy thinking methods and Performance Prism as a performance management system in SMEs as well as the way in which use and value may differ between its application between large and small enterprises.
Neither comprehensive literature nor empirical research exists on the topic of Balanced Scorecard or Performance Prism in SMEs. Therefore, the arguments presented in this paper are based on a combination of general literature research on Performance prism, SMEs, strategic management and corporate planning combined with the authors’ broad practical experience of facilitating performance measurement systems and implementation projects in large and some smaller organisations.
The first part of the study treats of the basic relations of the model of the research, such as: the growing strategy of the enterprises, the relationship of the management and the owners, the hesitancy of the decision-making and defining the competences. The most significant model of the research is the performance-prism model, so it is introduced more explicit.
In the end, besides the introduction of the most important results of the research, I attach importance to conceive a few suggestions for SMEs leaders on the score of practical aspects and applying the knowledge from the personal interviews.
1 The nature of small business
The small and medium-sized enterprises (SMEs) have special characteristics from several approaches. Basically these kinds of organizations are not well-structured, in most cases the skill and the management tasks are not separated clearly. Most of
STRATEGY COMPETENCES AND PERFORMANCE MEASUREMENT IN THE HUNGARIAN SMES SECTOR
75
the SMEs couldn’t be price-leaders that mean the cost management can be the only way of growing competitiveness. Moreover, the value-processes of the production, flexibility to the markets, and driving and control mechanism are also different from the bigger companies’ practice.
Much work has been done to identify ways in which management practice in small and medium-sized enterprises (SMEs) differ from larger ones. Two linked areas of comparison have been differences in organisational structure, and differences in management processes. SMEs (particularly small ones) have been characterised as being typically “simple structures” or “simple systems” in which the leader (often the entrepreneur or owner-manager) directs the work of a small number of operators with the help of few or no other managers. At around 100 staff, this type of approach begins to become inefficient, and by the time the enterprise has about 500 employees some sort of hierarchical structure has been introduced – most commonly introducing a layer of managers each tasked with management of a functional area of activity. As the organisation grows, further structure changes occur driven by the increasing problems of communication and co-ordination. It has been observed that the points of transition between organisational forms present or represent particularly risky periods for the enterprise, during which enterprise failure is not uncommon (Mintzberg 1981). Coordination in small organisations mainly happens through direct instruction and supervision, minimising the need for formal management (i.e. planning and control) processes. Many see this as a key strength of the smaller enterprise, since by avoiding extensive standardisation and coordination, and the associated need for support staff and line-management; small firms maintain their flexibility, responsiveness and low cost structure (Miller 1959, Mintzberg 1981)
The main question is how to safeguard the benefits of the Simple Structure. Flexible, responsive and low-cost structure often seen as a key competitive advantage for SMEs.
Simple Structures characterised by:
• Workforce often being directly managed by entrepreneur or owner-manager • Few or no other managers • Management through direct instruction and supervision
Strategic focus and communication ought to be easy in the Simple Structure
• Yet lack of management attention to strategic issues is seen as typical route cause to SME failure or poor performance
In Porter’s classification the big firms used to follow-up the cost leadership strategy because of economic of scales. In case of small companies we can meet with differentiation and focus strategy more often. “From the middle of ’80s something must be changed.” According to a survey, made by Datamonitor the cost-cutting is the most important for the SMEs all over the Europe [Bodnár, 2004].

ATTILA KURUCZ
76
This multi-country research included 19 country from Europe and middle east. The result shows, that the most of the answerers signed the cost-cutting to achieve better competitiveness (53%), and far behind tie for the second place: unify the informatics environment (34%) and improving the internal cooperation (34%). The fourth was the increasing the managers information attendance (24%), and the rest of priorities can be found the improvement of external cooperation (18%), increasing the sales and market share (17%), and follow up the industrial standards and law (13%).
After the serious recession is so hard to be recover themselves the SMEs. Many of them can only survive this period with tighten the purse-strings on the field of basic activities, informatics and number of employees. Some of them confess they save money the detriment of quality and customer services. Summarized the SME sector try to take advantage of cost-cutting activities rather than follow a differential strategy.
2 Concept of Performance measurement and strategy thinking
First of all let see the key points of our model:
Alignment of strategies, processes and capabilities: Strategies, processes and capabilities need to be linked to each other in order to understand how they fit together towards satisfying stakeholders and organisation’s wants and needs. It is critical to ensure that they are aligned and integrated with one another if the organisation is to be best positioned to deliver real value to all of its stakeholders
Measures: Key message is that we need to question constantly what is measured. Keep asking these questions: Do we need it? Why do we need it? We need to evaluate constantly whether or not the measures we have are the right ones for the organisation. And if not we need to find a way to get rid of them so that we do not waste time and effort capturing data that no one is using. In short, we need to practice ‘metricide’ (i.e. do not let any measure persist beyond its natural and useful life!).
In this research a “quasi” Performance Prism model was tested: strategy, the process and cost management tools, and the main point of stakeholders contributions and satisfactions. Of course, there are many of indicators could not be interpreted in this sector, but the main principles and some of the basic indexes can.
What is performance prism? There are five interrelated perspectives in the Performance Prism framework. [Neely, 2002]
− First perspective: Stakeholder Satisfaction:
Organisations exist to deliver ‘value’ to their key stakeholders. Stakeholders will include, for instance, investors, customers, employees, suppliers, regulators, pressure groups et al.

STRATEGY COMPETENCES AND PERFORMANCE MEASUREMENT IN THE HUNGARIAN SMES SECTOR
77
1st Figure: The Performance Prism
‘Value’ will be defined by and be different for different stakeholder groups
e.g customers typically will want rapid and reliable delivery of high quality products and services that offer good value for money whereas employees will want such things as competitive compensation packages, training and development, and promotion prospects whilst shareholders will be more concerned with return on their investment and the profitable growth prospects of the organisation relative to its competitors.
In effect, organisations and their stakeholders have to recognise that their relationships are reciprocal
− Second perspective: Stakeholder Contribution
It must also be remembered that for every stakeholder there is a quid pro quo: what the organisation wants and needs from stakeholders as well as what the stakeholder wants and needs from the organisation.
There is a dynamic and subtle tension between the two sets of wants and needs. For example, whilst customers require ease of availability, speed of delivery, competitive price and quality, the organisation would like them to be loyal and profitable. Similarly employees would like to have jobs that give them purpose, good compensation, promotion prospects and training whilst employers are looking for loyalty, flexibility, productivity, and creativity.

ATTILA KURUCZ
78
− Third perspective: Strategies
Having first decided what respective stakeholders’ wants and needs are, executives must then decide whether and to what extent they will prioritise their satisfaction in the strategies which the organisation develops to deliver the requisite stakeholder ‘value’ (whilst also ensuring that its own requirements are satisfied too). Delivery of long term stakeholder value can be viewed as the ‘destination’ whilst strategy can be viewed as the chosen route to achieve that destination.
− Fourth perspective: Processes
The chosen strategy must be underpinned by processes aligned and designed to facilitate its successful achievement. Processes are what make the organisation work (or not, as the case may be). They are essentially cross-functional and represent the blueprints for what work is done where and when, and how it will be executed. Many organisations consider their highest level business processes in four separate categories: development of products and services, generation of demand for them, fulfilment of demand for them and overall planning and management of the enterprise with each category underpinned by a variety of sub-processes.
− Fifth perspective: Capabilities
Processes cannot function on their own. They need people with certain skills, some policies and procedures about the way things are done, some physical infrastructure for it to happen and some technology to enable or enhance it. These are capabilities which can be defined as the combination of an organisation’s practices, technology and infrastructure that collectively represents that organisation’s ability to create value for its stakeholders through its process operations.
The message of the Performance Prism is that in order to survive and prosper in an increasingly complex and connected world, executives have to:
� Understand both what their various stakeholders want and need from the organisation and also what the organisation needs from them.
� Link and align their strategies, processes and capabilities to satisfying those diverse sets of wants and needs so that they can deliver value to their stakeholders.
‘Success Mapping’ is posited as a useful technique that helps to facilitate the alignment of strategies, processes and capabilities with the delivery of stakeholder satisfaction and contribution. The objective of a success map is to identify the critical links between the prioritised stakeholder’s and the organisation's wants and needs with the strategies, processes and capabilities that must be in place in order to satisfy them. A ‘Failure Mode Map’ can be used which can check whether all the critical aspects of performance measurement have been properly addressed – in effect a reverse approach to success mapping by identifying particular scenarios that describe the opposite of success i.e. failure.

STRATEGY COMPETENCES AND PERFORMANCE MEASUREMENT IN THE HUNGARIAN SMES SECTOR
79
2.1 The research theme
Present research focuses on measuring and estimating performance which combines accounting and management science. Defining the corporate performance is a very complex task and used in several sciences in many ways. It is important to emphasize that I was studying only organisational performance, but disregarded individual performance.
In the course of empirical exploration the existence of different cause and effect contextures were analyzed in relation to contingency factors, like strategy management and cost control, that define performance and its determinants. Moreover the other question is if there are manager methods used in big enterprises which can be adapted to smaller ones.
The research proposed a trial goal: on the one part it resumes the relevant literature in connection with measuring and estimating efficiency and performance so as the international writers and even the history of the Hungarian researches. On the other part it tests the developed performance-measuring model empirically. In the course of the empirical research I used both qualitative and quantitative methods. Thirdly, along resuming the results I phrased recommendations for SMEs managers that can facilitate a more efficient operating, reaching the performance-goals easier and building up a performance-management. (Cooper, 1993, Davidsson 1991)
Questions of the research
The fundamental questions of the research were motivated by the recognition of the connection and the interaction between the strategy, the cost-management and the performance.
1. Which are the general characteristics of the process of the SMEs’ strategy-creation? Which are the critical success factors? How the competences of their enterprises are esteemed by the managers? And how can they translate these competences into the strategic goals?
2. How are the cost-accounting systems built up? How the elements of the cost-management change owing to the expected and the attained results? Do the external or the internal context elements have remarkable former effect on these systems?
3. How are the decisions of the management influenced by the performance and the attained results? How are the internal business practices influenced by the process of estimating performance and planning? How does the attained performance bear upon the strategy of the firm?
Important assumption that the determined strategic goals, the cost-management goals and the expected performances are well-definable, measurable and appraisable exactly. In turn it is very important, that the connection between the performances and the strategy is bilateral and not a merely cause or effect.

ATTILA KURUCZ
80
This present paper attends to the estimation of the competences, the definition of the performance and the connection between them.
Methodology of the research
As I feel interest towards enterprise-economy and working as an economic-consultant it was essential that the research would contain practical elements besides the theoretical contextures and models. However it is stateable that in science philosophical regard the research is objectivist and reckons among normative researches, it was plain that the dissertation cannot be only descriptive but it has to contain and analyse desirable solutions. First the literature has given answers to the questions. On the one hand the aim was to turn out how the theories approach to the theme of the research, on the other hand to ascertain if there were former researches and if yes what kind of results they had conduced. Along with exploring the literature I also used my experience as a business consultant to frame the theoretical general-model and make up the hypothesises can be accounted for. The next period was the investigation and the induction of the data. I also tried to answer the questions of the research as an outsider, describing and explaining that in practice what, how and why things happen. To achieve the goal I used three methods: first I did a survey method with 600 pieces of samples, then I used single- and multivariate mathematical and statistical analysis on the received answers. According to the results the next step was the estimation of the hypothesises. Accessorily to the survey method I made personal interviews with SMEs’ managers to disclose the non-numerical data’s. This interview made an opportunity to a deeper reconsidering of some hypothesises. On the third period I re-weighted the results, by my acquired knowledge as a consultant, to give better and useable proposals and to get further research projects.
As a starting-point I take such an approach of the strategy management which partly or fully can be adapted to SMEs. Besides the foreign literatures several Hungarian writings about performance measuring and estimating established this research. Within the frame of this article I am not in the position to introduce all the remarkable authors and their theories, but the following authors’ works affected the research: Robert N. Anthony, Robert S. Kaplan, Robert Simons, Davit T. Otley and Andy Neely and last but not least the Hungarian colleagues: Anna Francsovics, Viktória Bodnár, Ágnes Wimmer and László Lázár. These authors’ thoughts formed the basic model which helped discovering the practice of the SMEs’ strategy, cost management and performance measuring or rather studying such methods which are used as a routine at larger companies.
Beyond the performance management the research touchs upon the everyday practice of the cost management with the above mentioned aim if there is a possibility for the SMEs to use these methods also at a smaller enterprise. However I cannot treat this subject fully in this paper, but knowing the results I can assert more established statements about the connection between the strategy and the performance.

STRATEGY COMPETENCES AND PERFORMANCE MEASUREMENT IN THE HUNGARIAN SMES SECTOR
81
3 Competences and vision in growing SMEs (results)
Man and Chan [2002] separated six entrepreneur competences, in which they observed typical attitudes.
− Opportunity competencies: the ability to react quickly to new business opportunities. The small firms can reorganized themselves easily or make a new organization.
− Relationship competencies: it means the interaction of people or groups founded on cooperation, communication and trustfulness. The intensity of communication is possible not only in the internal channels but to the external stakeholders (supplier, customers) as well. The face to face relationships are one of the biggest advantageous of small organizations.
− Conceptual competencies: based on innovation capabilities. Now we think about knowledge elements like decisions making systems, information technology, risk taking behaviour. The SMEs can overtake the bigger competitors because of faster adaptation, flexible company management and more efficient internal communication.
− Organisational competencies: The small companies basically not artificially chop, and their legal entities also support the flexible management. Often the manager, and the owner is the same person, they have no impression from shareholders.
− Strategic competencies: SMEs are not infected with classic and bureaucratic methods of strategy making. They focus on market gaps, knowledge potential and innovation opportunities. If they be able to use leverage they become strong middle size enterprise
− Commitment competencies: let the SMEs to bring their capabilities to perfection and learn new. The written strategy can not be the only way of success, sometimes must leave the started path because of lack of resources, the unachievable aims or the change of environment.
When we asked the Hungarian SMEs about these competencies we got the following result in Likert-scales: (1 means that is not important – 5 means I totally agree, it is very important competence) (table 1.)
The specified competences did not show significant differences in point of the micro- and small and the middle enterprises. The average deviation was smaller than 0.5 in any case.
The relationship competence stands first on the list, and the external communication was emphasised from this group. According to the interviewed managers the key to success is the marketing communication, namely the way they speak to costumers. Furthermore sharing the price-information and describing well the extra services can gain more satisfied costumers.

ATTILA KURUCZ
82
1st table: Competencies at Hungarian SMEs
Competence Average Deviation Coefficient of variation Modus
Relationship 4,71 0,701 14,90% 5
Conceptual 4,19 0,926 22,11% 5
Commitment 4,09 0,942 23,05% 5
Strategy 3,86 1,067 27,63% 5
Organization 3,31 1,327 40,09% 3
Opportunity 2,78 1,093 39,37% 3
Scource: Own research and calculation The internal communication is another important factor, but not the satisfaction
of the employees, but the payment level and the incitation for qualitative work was emphasized by the managers. Motivation is not easy, and the payment is just one side of it, but in many cases serious leadership techniques are needed.
It can be mentioned that the first 4 competences mostly gave a rate 5, that is to say that the managers agree the importance of these competences, however the conceptual competence’s high estate is remarkable. Not because we would dispute the importance of the aptitude for innovation, but other results of the research show widely contradictory conclusions. We could not find the propensity for growth, the motivation for investment and the receptivity towards novelties among the results of the research.
We can see in the first table that the opportunity competence is not typical, the most enterprises are disinclined to do changes or reorganization in favour of exploit new business possibilities. This attitude can be explained by a risk averse behaviour but it is out of accord with the frequently mentioned adaptability and great risk-taker behaviour.
The organizational competence is deemed less important by the managers. Starting an enterprise and subsisting the status quo were eternal topics in the course of the interviews. The most of the asked managers felt that he was highly innovative and he had made many changes in the organization, but after precising it it turned out that most changes had not had considerable affect on the business processes. Although the managers realized the above mentioned they were not confident in defining exactly the steps and discovering documenting and analysing the business processes.
According to our performance model building up the processes precisely is a very important task. By the right of the performance prism’s logic it should be joined to the strategy and to the competences by the following way:
� Define the strategy, the way the enterprise should go on � Define and form the required processes which can help to reach the goal
and achieve the strategy � Acquire those capabilities which operate our processes

STRATEGY COMPETENCES AND PERFORMANCE MEASUREMENT IN THE HUNGARIAN SMES SECTOR
83
Therefore we need a vision for an accurate performance management system, that directs the enterprise on the right way, and evolved business processes according to our vision. Thirdly we can define those capabilities which needed to manage the processes effectively. One part of these are commanded, and we have to purchase the other part of them. If we see deficiency of capabilities, it is important to emphasize the learning and training at the organization. Moreover we rethink our investments.
We asked the SMEs’ managers how they would take in order the performance-factors mentioned before, we got the following result (2nd table).
2nd table:The key perspectives need to be define
vision or strategy processes capabilities
Micro and small
size
Medium size
SMEs total
Micro and small
size
Medium size
SMEs total
Micro and small
size
Medium size
SMEs total
Rank 1st 46,9% 57,1% 47,6% 18,8% 14,3% 19,0% 34,4% 28,6% 33,3%
Rank 2nd 31,3% 28,6% 31,0% 43,8% 14,3% 40,5% 25,0% 57,1% 28,6%
Rank 3rd 21,9% 14,3% 21,4% 37,5% 71,4% 40,5% 40,6% 14,3% 38,1%
Total 100,0% 100,0% 100,0% 100,0% 100,0% 100,0% 100,0% 100,0% 100,0%
The strategy got the primary rank, after all it was signed at first place
independently of the enterprise. The medium sized enterprises typically signed it at the 1st and 2nd place that refers to a conscious vision. The logical place and accentuated role of the processes are not traceable such an easy way.
One sees that the enterprises signed the 2nd and 3rd place equally for defining the processes. Surprisingly we can find determined logic mainly in the thinking of the smaller enterprises, while the medium sized ones ranked this mostly to the last place.
The SMEs will be able in difficult situation if they have no strategy or vision, and they also could be made wastage if they do not take care of their processes. The bad business processes and old-style solution with many of redundant functions will lead a capital deficiency. The third part is capability, which is important to improving continuously especially the knowledge elements. If we see the international experiences only few of SMEs manage the Human Resources consciously. The question of learning, trainings and developing the abilities of employees is strategy questions. But in the practise of Hungarian SMEs this field has dropped into the daily routine. It can be a wasting point too.
The well-built performance management system can help to manage the main strategic functions and it give the SMEs rope to be on the right track.

ATTILA KURUCZ
84
4 Conclusion
Finally we can lay down, the enterprises must monitor their business by aligning performance measures with the critical success factors they have identified. Again, the process view allows them to establish metrics for measuring and monitoring the important elements of performance.
Despite the lack of comprehensive literature focused on Balanced Scorecard and Performance Prism or any other 2nd or 3rd generation performance measurement frameworks implementation in SMEs, I believe performance prism (as the main target) and its associated management processes can prove equally beneficial to SMEs as to large organisations.
However, the potential benefits are likely to differ between the two. In large / complex organisations much of the utility of Performance Prism comes from the communications elements: the two-way provision of concise and relevant summary information about ‘what is going on’ in the organisation.
In smaller firms, a greater proportion of the value of Balanced Scorecard comes from two other elements: the description of strategic destination and associated strategic objectives and priorities in a way that builds consensus; and impetus given to the development and application of more effective strategic management processes. In case of Performance Prism the SMEs can gain lots of advantages from the flexibility of perspectives, and the iteration between strategy and business process.
More and more, companies need to get visibility about their clients, consumers, partners, competitors, and collaborate with them to create joint competitive advantage. This new business context requires companies to build new collaborative management and operational models. To achieve this purpose, enterprises need to be able to measure, broadcast and monitor better performance, both internally and externally (with their partners in the Collaborative Network (CN) and in the networks to which they belong), and Virtual Organisations (VO) need to manage their performance in a global way (like a single enterprise) and benchmark with other VOs.
Companies have traditionally measured their performance in terms of Finance, Customers, Internal Business Processes and Learning and Growth (Kaplan, 1996), but the new business scenario reveals the need to create new performance management views, that can take into account new business paradigms such us Innovation and Agility (Beamon, 2003), Environmental Care and Green Operations (WBCSD, 2004), Ethics and Corporate Social Responsibility (GRI, 2002), subjects that can be considered as new business assets (Neely, 2001).
As we see, the required management tools are available. Now the pilot-project experience also can be analysed and evaluated. The consultancy is ready to help the SME sector, if they prepare to receive these methods.

STRATEGY COMPETENCES AND PERFORMANCE MEASUREMENT IN THE HUNGARIAN SMES SECTOR
85
REFERENCES
1. Alfaro JJ; Ortiz A; Poler R; Franco R. Performance Measurement for e-Business
Enterprises. International Journal of Business Performance Management 2002; Vol. 4, Nº 2, 3, 4.
2. Atkins M H and Lowe J F: ‘Sizing up the small firm: UK and Australian experience’, International Small Business Journal, 1997.15 (3): 42-55.
3. Beamon BM. Supply chain design and analysis: Models and methods. International Journal of Production Economics 2003; Vol. 55, Nº 3, pp. 281-294. Global Reporting Initiative (GRI). Sustainability Reporting Guidelines. 2002.
4. Bodnár, Ádám: Az európai kis- és középvállalatok számára továbbra is a költségek csökkentése a legfontosabb. 2004 HWSW Informatikai Hírmagazin, www.hwsw.hu
5. Cooper, A. (1993). Challenges in predicting new firm performance. Journal of Business Venturing 8 (3), 241-253.
6. Davidsson, P. (1991). Continued entrepreneurship: ability, need, and opportunity as determinants of small firm growth. Journal of Business Venturing 6 (6), 405-429.
7. Davig W, Elbert N, and Brown S,.: ‘Implementing a Strategic Planning Model for Small Manufacturing Firms: An Adaptation of the Balanced Scorecard’, SAM Advanced Management Journal, 2004 Vol. 69 Issue 1, p18-24.
8. Ernst & Young:. Research shows 35% of investors’ decisions are driven by non-financial performance, News Room 2000, (downloaded 28.1.2009) http://www.ey.com/global/gcr.nsf/UK/press_release_-_measures_that_matter
9. Gavin Lawrie, Henrik Andersen, Ian Cobbold: Balanced Scorecard Implementation in SMEs 2GC Working Paper 2006.
10. Hatten J K, Rosenthal B S: ‘Managing the Process-centred Enterprise’, International Journal of Strategic Planning 1999 (Long Range Planning) 32 (3): 293-310.
11. Hausman WH. Supply chain performance metrics; The practice of supply chain management: Where theory and application converge. Kluwer Academic Publishers, 2003.
12. Kaplan R S, Norton D P.: ‘The strategy focused organization’, Harvard Business School Press 2000, US.
13. Kaplan R S, Norton D P.: ‘Using the balanced scorecard as a strategic management system’, Harvard Business Review 1996, Jan/Feb: 75-85.
14. Kaplan R, Norton D.: ‘Balanced Scorecard – measures that drive performance’, Harvard Business Review 1992, January – February: 71-79.
15. Miller E J.: ‘Technology, territory and time’, Human Relations, 1959XII (3): 243-72.
16. Mintzberg H.: ‘Organization design: fashion or fit?’, Harvard Business Review 1981, January- February: 103–116.
17. Neely A; Adams C. Perspectives on Performance. The Performance Prism. Web Site of Neely A. www.som.cranfield.ac.uk/som/cbp/adn.htm, 2001.

ATTILA KURUCZ
86
18. Olve N, Roy J, Wetter M.: ‘Performance Drivers: A practical guide to using the Balanced Scorecard’, 1999 Wiley, UK.
19. Ostrenga, M. R. – Ozan, T. R. – McIlhattan, R. D. – Harwood, M. D.: Guide to Total Cost Management. Ernst & Young, CO-NEX Könyvkiadó Kft., Budapest, 1999.
20. Schneiderman A M. ‘Why Balanced Scorecards fail’, Journal of Strategic Performance Measurement 1999, January Special Edition: 6.
21. World Business Council for Sustainable Development (WBCSD). WBCSD Annual Review 2004 – A decade of action and learning. Web site of the WMCSD: www.wbcsd.ch, 2004.

STUDIA UNIVERSITATIS BABEŞ-BOLYAI, NEGOTIA, LV, 1, 2010
COOPERATION BETWEEN SMEs AND HIGHER EDUCATION INSTITUTIONS - EFFECTIVE TOOL
FOR ENTREPRENEURIAL EDUCATION
MARIANA DRAGUSIN1, ALINA ELENA BALALIA2 ABSTRACT. All over the world, large corporations are forced to resize their structures, to redesign their strategies in order to face accelerated competition and to survive in a highly unstable environment. In the same time, the rapid changes become important sources of opportunities leading to an increase of start-up companies, strengthening SMSs’ image of main job creator in the economy.
In this dynamic context, entrepreneurial education and training has a major role in achieving desired behavioural outcomes, especially in terms of reinforcing ability to respond to different situations, based on creativity, innovation, autonomy, self-direction and self-expression. As stated in the Final Report regarding promotion of SMEs competitiveness: “at higher education level, the primary purpose of entrepreneurship education should be to develop entrepreneurial capacities and mindsets” (European Commission, 2008, p.7). As pointed out by specialists: “today’s graduate value is in the ability to manage and apply knowledge in action and in an entrepreneurial context, and not only in the ability to acquire and assimilate knowledge” (Collins & all, 2004, p.454).
This paper advocates the role and importance of cooperation between higher education institutions (HEI) and SMSs sector, its potential to stimulate entrepreneurial mindsets among students. It is an empirical contribution that seeks to link entrepreneurial education within HEI with the SMEs sector, to analyze the reciprocal benefits of cooperation between both parties. A comprehensive literature review and a structured evaluation of current knowledge on this topic are carried out. Appropriate forms of cooperation and their effectiveness are also pointed out. Main challenges for the Romanian higher education system and ways to incorporate appropriate forms of cooperation with SMSs are highlighted, in order to transform entrepreneurial education into a major source of graduates that are job creators not job “hunters”, as an indispensable condition to strengthen SMSs sector and Romania’s market based economy.
Keywords: entrepreneurial education, Higher Education Institutions, SMEs, cooperation forms.
JEL classification: I21
1 Ph D Professor, The Bucharest Academy of Economic Studies/ Romania, [email protected] 2 Graduate Assistant, PhD. Candidate, The Bucharest Academy of Economic Studies/ Romania,

MARIANA DRAGUSIN, ALINA ELENA BALALIA
88
INTRODUCTION. DIMENSIONS OF ENTREPRENEURSHIP EDUCATION
The fundamental role of education in promoting and developing more entrepreneurial attitudes and behaviours is now widely recognised. As clearly stated by the European Commission (European Commission, 2008, p.7) there is an intense need “to stimulate the entrepreneurial mindsets of young people, encourage innovative business start-ups, and foster a culture that is friendlier to entrepreneurship and to the growth of small and medium sized enterprises (SMEs)”. Higher Education Institutions (HEI) are playing a major role in the process of achieving these challenging targets.
The complex globalization process is generating major economic changes and a highly unstable environment. Large corporations are generally employing less personal and are quickly transforming the notion of “for life” jobs in history. This means that for twenty-first century graduates, “hunting” a job in a big organization becomes more and more difficult.
In the same time, the rapid changes at all levels and in all fields are important sources of opportunities leading to an increase of start-up companies, strengthening small business sector’s image of main job creator in the economy.
In this dynamic context, employers’ expectations are changing too and the demand for graduates displaying entrepreneurial behaviours and attitudes is increasing. As pointed out by specialists: “today’s graduate currency or “value” is in the ability to manage and apply knowledge in action and in an entrepreneurial context, and not only in the ability to acquire and assimilate knowledge” (Collins, Hannon, Smith, 2004).
There is evidence that all over the world, student interest in choosing entrepreneurship as a career option is growing while interest in traditional jobs in big companies is gradually declining (Kolvereid, 1997). Students’ and young graduates’ behaviours and orientations are highly influenced by a number of personal and environmental factors (Luthje, Franke, 2003). Among them entrepreneurship education can be a powerful incentive to follow the entrepreneurial path, according to several empirical research.
A vast literature revealed that an adequate education, work experience, role models impact etc. are essential factors to succeed but unrelated to genetics. However, it is no doubt that entrepreneurial education and training has a major role in achieving desired behavioural outcomes, especially in terms of reinforcing ability to respond to different situations, creativity, innovation, autonomy, self-direction and self-expression.
Entrepreneurship education is, as defined by the Centre for Entrepreneurial Leadership Clearinghouse on Entrepreneurship Education (refer to www.celcee.edu), the process of providing individuals with the concepts and skills to recognize opportunities that other have overlooked, and to have the insight, self-esteem and knowledge to act where others have hesitated. Students exposed to Entrepreneurship education develop an attitude of self-reliance and have a higher likelihood of entrepreneurial action in the future.

COOPERATION BETWEEN SMEs AND HIGHER EDUCATION INSTITUTIONS …
89
Traditionally, Entrepreneurship education was designed to teach students how to start a venture, create a business plan etc. However, according to a relative recent approach it has been recognised that technical knowledge “is essential but not sufficient to make a successful entrepreneur” (Rae, 1997). In fact, Entrepreneurship education should target all three main characteristics of entrepreneurs and innovators, considered to be: knowledge, skills and attitudes. In the present, each is being addressed differently during the educational process. While knowledge benefits from the highest attention during formal education, skills formation is less approached and attitudes are most of the time ignored, despite their determinant role in enhancing entrepreneurial behaviour. For being successful an entrepreneur must also exhibit different attributes, skills and behaviours, as those related to communication, creativity and problem-solving, all essential as well as business knowledge (Cheung C. K., 2008). Therefore, if Entrepreneurship education is focused on students’ personal attributes development, then it can highly impact their professional careers, whether or not they intend to become entrepreneurs.
Entrepreneurship education exhibit a wide variety of teaching approaches: workshops, simulations, business-plans design; learning through competition and case–studies; mentoring; project learning method; experiential learning (to set up own business). According to Tan, S., Frank Ng, C. K. (2006) an effective pedagogical approach in entrepreneurship education can be problem-based learning (PBL). Their findings support the idea that PBL can contribute to enhancing students’ appreciation and capacity for entrepreneurship. The movement to the practice oriented methods, which are proving to be more effective, is increasing. Students who can see the practical side of the subjects they learn will have more incentive to study. In its Final Report, European Commission (2008) is pointing out the need for Europe’s HEIs, (around 4,000 with over 19 million students and 1.5 million staff 3) to implement more appropriate and effective teaching methods aiming at developing entrepreneurial thinking. In that sense, involving real entrepreneurs, working with alumni are among recommended practices. In order to incorporate them HEIs can support the building of complex contacts and networks with SMEs. Such cooperation between SMEs and HEIs can become an effective tool for students’ entrepreneurial education, as this paper is trying to outline. Structured in five parts, this paper advocates the role and importance of cooperation between higher education institutions (HEI) and SMSs sector, its potential to stimulate entrepreneurial mindsets among students, entrepreneurial education and the challenges for romanian HEIs, good practices in the case of The Bucharest Academy of Economic Studies and conclusions. It is an empirical contribution that seeks to link entrepreneurial education within HEI with the SMEs sector, to analyze the reciprocal benefits of cooperation between both parties. A comprehensive literature
3 European Commission, 21 April 2009

MARIANA DRAGUSIN, ALINA ELENA BALALIA
90
review and a structured evaluation of current knowledge on this topic are carried out. Appropriate forms of cooperation and their effectiveness are also pointed out. Main challenges for the Romanian higher education system and ways to incorporate appropriate forms of cooperation with SMSs are highlighted, in order to transform entrepreneurial education into a major source of graduates that are job creators not job “hunters”, as an indispensable condition to strengthen SMSs sector and Romania’s market based economy.
SMEs AND HEIs: POTENTIAL FORMS OF COOPERATION
The main purpose of the entrepreneurship education in HEIs should be the creation of an appropriate framework for the development and exploitation of business ideas among students, with different backgrounds, by the interaction between the business environment and the educational system. More and more research findings are revealing and outlining the benefits of HEIs’ collaboration with SMEs and local community groups (Pittaway L., Hannon P., 2008). This collaboration can take many forms and consists of numerous ways of actions, which can bring added value to both the learning process and the SMEs involved. Some major forms of collaboration between the SMEs and HEIs, are pointed out below.
Role Models can strongly influence behaviours, especially those of young persons like the students. Their high potential impact can be used as an important variable in entrepreneurial education. Inviting real entrepreneurs, as representatives of SMEs, can generate a high impact among students, as already proved by researchers. Academic studies have recently demonstrated that differences in entrepreneurship levels are in-part explained by the different entrepreneurial Role Models’ impact across territories. A recent OECD (2003) complex study regarded the influence of entrepreneurship over local economic development involving 30 countries. The study concludes that informal institutional factors, such as the lack of positive entrepreneurial examples (role models) and limited networks are some of the most important barriers that restrain, especially in the rural areas, entrepreneurship (Lafuente, E., Vaillant, Y., Rialp J., 2007). In the absence of entrepreneurial role models, economic agents, including students are not as propelled to take the different decisions needed to become an entrepreneur. The results of the study specifically highlight the importance of entrepreneurial role-models in an individual’s personal social circle as a positive stimulus explaining uneven entrepreneurial activity levels across different geographical areas. This would tend to imply that entrepreneurship support policy should lay the grounds for a greater social interaction on the part of existing entrepreneurs, promoting networking possibilities with potential entrepreneurs, glorifying the role of the entrepreneur in the community, as well as socially celebrating the entrepreneurial successes of existing entrepreneurs. The local administrations must magnify the visibility of positive entrepreneurial examples within their communities. A student with entrepreneurial ambitions can gain the necessary confidence in his own entrepreneurial skills by being in contact with entrepreneurs who have themselves

COOPERATION BETWEEN SMEs AND HIGHER EDUCATION INSTITUTIONS …
91
successfully established their own businesses. Entrepreneurs can be invited to share their experience by offering short presentations to students. Their role models are important “slices” of business reality that, if made visible, can bring into the classroom the breath of life and can instil greater meaning into the lessons of Entrepreneurship. Students need to see role models, because it is easier for them to make the connection between their subject and the business environment. Successful entrepreneurs provide strong role models raising confidence among students that becoming own “boss”, achieving high status and financial wealth are all possible. Their stories can fascinate and enhance enthusiasm, creativity, self-confidence and can stimulate entrepreneurial mindsets of young people. It can help in building the basis for a shift in attitudes among students by “introducing and promoting the dynamic, innovative and ambitious face of entrepreneurship” (European Commission, 2008, p.12). Invited entrepreneurs can also contribute in raising awareness among students that entrepreneurship can be a career option. It is a proven reality that students coming from families running a business, for example, will tend to follow the same path. They are also bringing in their educational environment valuable prior experiences that can be shared with the others.
An important “pull” of entrepreneurs can be found among the alumni of HEIs. By keeping in touch with own graduates HEIs can build fruitful links with successful persons, active in the SMEs sector, which can offer on one hand, knowledge and on the other hand, funds for the HEIs, as the American experience has proved already. For SMEs representatives these connections can be useful for future recruitment activities.
Engagement of entrepreneurial practitioners in designing appropriate curricula content in order to meet desired outcomes should also be an important form of cooperation between HEIs and SMEs, with mutual benefits. The inclusion of business representatives in formulating the curricula can also set the basis for collecting data to design useful case studies for seminars.
SMEs involvement, through entrepreneurs and business leaders can take the form of mentoring and advisory in order to build student incubators and work at different projects. Nevertheless by organizing of student business plan competitions and providing support and funding for putting into practice the winning ideas can also provide a solid platform for close cooperation.
HEIs in cooperation with SMEs can support the development of internship programmes, where students enter into direct contact with the business environment.
Also, the mobility of teachers and researchers between HEIs and SMEs is encouraged to obtain experience in commercial activities. The teachers should maintain personal links with the business sector to be informed about the entrepreneurial initiatives. For their support it can be created an academic incubator, where they are involved in business projects. The cooperation between the SMEs and HEIs turns to be effective when there is a win -win situation for both parties and long-term oriented. Students and teachers have a contribution to SMEs, based on theoretical knowledge, and SMEs

MARIANA DRAGUSIN, ALINA ELENA BALALIA
92
contribute to HEIs with practical knowledge. SMEs obtain some advantages that consist in expertise and advice from a professor, testing potential students for later recruitment, getting publicity and collecting innovative ideas, suggestions from the students. The main advantage for the SMEs is referring to the linkage with research activities, new developments. The effort of the SMEs, which are dedicated to the educational system should be recognized and properly rewarded by giving them public recognition and awards. The HEIs’ advantages are represented by the contact with the practical approach of the market, the support for capital knowledge and funding. In order to measure the rate of success of entrepreneurial education, generated by the collaboration between the SMEs and HEIs, the experts (European Commission, 2008, p. 55) suggested some possible indicators such as: number of start-ups created by students who have attended entrepreneurship courses; number of jobs created by the new start-ups; number of new patents issued as an outcome of entrepreneurial courses; level and quality of employment of students who have taken entrepreneurship courses; number of new companies founded by the overall population of university graduates; progress in entrepreneurial attitudes, perceptions and intentions of students taking entrepreneurship courses (before and after the programme, and compared to other target groups of students), the general population of higher education students. Foreign experiences in building cooperation with a SMEs sector in order to improve the effectiveness of the entrepreneurship education are valuable source of knowledge that can provide viable solutions for Romania’s education system too and its specific features. Steps made in this direction are outlined in the section below.
ENTREPRENEURIAL EDUCATION AND THE CHALLENGES FOR ROMANIAN HEIs
Small business sector, considered the driving engine toward prosperity, had to be practically recreated in Romania after decades of centralized economy. A positive view of the entrepreneurs’ role in our society started to emerge only after mid ’90. An entrepreneurial culture is still developing. Success of small business sector in our economy highly depends on the quality of education and its effectiveness in cultivating among students suitable entrepreneurial skills and spirit. Romania needs entrepreneurs for supporting economic development but is the educational system in general and higher education institutions in particular prepared to teach students in that direction?
At the beginning of the ’90, as a response to the small business sector’s boom, major changes in economic study programmes were made in order to meet the new requirements. To fill in the gap between school and labour market needs all of the disciplines were revised and new ones replaced obsolete disciplines in the curricula, like for example “Management of SMEs”. Teachers had no or limited knowledge about what and how it should be taught. The accumulated experience has to help now in switching toward Entrepreneurship. Small business management course

COOPERATION BETWEEN SMEs AND HIGHER EDUCATION INSTITUTIONS …
93
is almost extinct in business schools all over the world, parts of it (like: innovation, ownership, exploiting opportunities, growth and exit strategies etc.) being covered by the new discipline labelled “entrepreneurship”. The literature outlines important similarities but also differences between small business management and entrepreneurship, considered both unique domain of activity (Solomon, 2006). In Romania too, this change is raising major challenges regarding, on one hand the education process (what to teach and how?), related to objectives, content, and appropriate methods to teach Entrepreneurship and on the other hand, that of teachers (with whom to teach the discipline?). All that should be judged and answered in a significant different context that doesn’t match the one present in developed countries, which generated the needed shift toward entrepreneurship education.
An analysis of the present situation reveals important weaknesses of the entrepreneurship education system in higher education institutions. The main weaknesses, empirically identified, are listed below:
• initial limited knowledge about the discipline’s content; content of the syllabus heavily translated/ inspired from American and/or West European countries, in general without adjustments; when the content and methods of entrepreneurial education are not internalised expected outcomes can be compromised;
• content of the curricula with still low relevance for students’ skills and competencies development; students’ entrepreneurship education is basically in more technical areas, like marketing, accounting, budgeting, law, personal etc.; this education dimension is necessary but not sufficient condition to enhance entrepreneurial spirit;
• education based, in general, on traditional pedagogical styles that do not always meet students’ learning needs and have limited effect; teaching process are based mostly on empirical methods;
• faculty members involved in entrepreneurship education are frequently neither schooled in the field, nor interested in Entrepreneurship per se;
• teachers don’t know enough about aim and content of entrepreneurship education, appropriate teaching methods; they have, in general, insufficient knowledge and low experience in promoting and diffusing entrepreneurial spirit among students; as a consequence, present courses have low capacity of enhancing student individual characteristics;
• no relevant feed-back from students is collected by means of statistics and evaluations in order to improve curricula and pedagogies;
• persistent gap between existing entrepreneurial education and real Romanian business world requirements, with negative consequences for both sides;
• low or no cooperation with the SMEs sector.

MARIANA DRAGUSIN, ALINA ELENA BALALIA
94
Most of the outlined weaknesses have historical roots too at social, economic and educational levels. Practically, entrepreneurship learning processes grew along with the small business sector formation and with the major shifts in social perception’s on entrepreneurs. Also, Romanian education system is still emphasising mainly on analysis and understanding of large amounts of information coming from rather authoritative sources, critical judgement, assumptions about behaviours in order to develop models, finding the right answers and with evaluation by written assessments. Another reality that should influence entrepreneurship education is that Romanian students are usually coming directly from high schools and most of them are completely lacking work experience.
Courses of action, consistent with European Commission’s (2008) recommendations too, should emphasise:
� To clearly define: objectives in the curricula, content of entrepreneurship course and correlate them with desired outcomes;
� To research and define students’ expectations and adjust accordingly the teaching methods and techniques to meet or surpass them, in order to stimulate preparation for an entrepreneurial career at the point of exit; specific studies should explore student’s entrepreneurial needs in comparison with entrepreneurship education offerings within Romanian higher education institutions;
� Pedagogically, entrepreneurship educators must agree upon the knowledge that must be disseminated and the appropriate evaluation criteria in the classroom in order to be consistent with the entrepreneurial phenomenon; in fact, it is necessary to build a measurement tool of entrepreneurship education at higher education institution level aggregated with whose at other levels (ministry, business environment, sector of activity);
� To set-up training programs for educators in the field of Entrepreneurship, with the purpose to create a common understanding of this new topic.
In Romania, there is formal support for entrepreneurial education, which is considered a priority within governmental strategies. Following the EU recommendations to assimilate entrepreneurship in the curricula at all educational system’s levels, Romania, through the Ministry of Education, Research and Innovation (responsible for education policy implementation) acted in that direction and made important steps in introducing forms of entrepreneurship education. The discipline is assimilated in several higher education institutions, mainly business faculties and the amplitude of that process is growing fast. Some aspects related to The Bucharest Academy of Economic Studies’ experience in the field of entrepreneurial education are presented in the following chapter.

COOPERATION BETWEEN SMEs AND HIGHER EDUCATION INSTITUTIONS …
95
GOOD PRACTICES: THE CASE OF THE BUCHAREST ACADEMY OF ECONOMIC STUDIES
The Bucharest Academy of Economic Studies has introduced Entrepreneurship within the curricula in 2005. It is a compulsory discipline for only two faculties, out of ten (Commerce and Business Administration, where it is labelled as “Entrepreneurial Culture) and optional for the Faculty of Cybernetics. This is reflecting the starting phase the institution is in. Learning objectives mentioned in the syllabus are very ambitious and are aiming: to understand entrepreneurship’s role for economic development; to develop students’ abilities to identify business opportunities and to build a successful business plan; to enhance students’ entrepreneurial spirit; to stimulate students’ creative and innovative thinking. To achieve them modern teaching methods were implemented case-studies; business-plan; active learning; multi-solution approach. In the institution, cooperation with SMEs is considered a valuable source of entrepreneurial effectiveness’ improvement. Steps in that sense have been made. In 2008 a new vice rector position, in charge with the business environment relationship development, was established. Also, several projects were conducted to raise awareness among students on entrepreneurship as a major career option. One of them, carried out with a group of students, consisted of the design of a “Catalogue of student entrepreneurs in the Faculty of Commerce”, in 2008. Two targets were achieved:
- on one hand, that of providing “living proofs” that starting own business can become reality, even as a student, because there is no age barrier; student-entrepreneurs are powerful examples for their fellow colleagues, who can add another strong argument to the idea that entrepreneurship can be considered as an early career option;
- on the other hand, to offer an evidence that student-entrepreneurs’ rare attributes like courage, self-determination, entrepreneurial attitude are recognized, valued and promoted in the academic environment too.
The existence of a project promoting student-entrepreneurs in the Faculty of Commerce, on a continuous yearly basis, was mentioned during lectures delivering process. Their stories were a valuable source of examples, reinforcing theoretical aspects presented during lectures. Relevant images from the Catalogue have been drawn to increase the impact.
Inviting, successful or only young entrepreneurs, is an experience responding to the need to shift to more interactive learning approaches, where the teacher becomes more a moderator than a lecturer. Invited entrepreneurs’ presence in the classroom is not only important because it imparts knowledge but also because it provides an example which can be followed by students.

MARIANA DRAGUSIN, ALINA ELENA BALALIA
96
Due to this method’s high impact, in the Faculty of Commerce entrepreneurs are invited each year during the course referring to the entrepreneur’s characteristics and typology (at the Entrepreneurship discipline). Based on the “Student Entrepreneurs’ Catalogue of the Faculty of Commerce” (2008), two young women entrepreneurs were invited last year (former students in the faculty). The previous collaboration in setting-up the Catalogue was extremely valuable at least in the sense that it shortened the time needed to find and convince them to participate in the course. The meeting was organised to be an experience to remember for the students. It was a fruitful and special experience for both parties: for students according to the already underlined reasons and also for the two entrepreneurs because, as they stated, they had the chance to share their entrepreneurial experience, which was a source of satisfaction. They both felt that their efforts are praised and recognized. They also expressed the desire to come again as guests and even to cooperate in other forms with their former faculty’s teachers and students. The development of a more coherent methodology to record the impact of entrepreneurship course in general and of the use of invited entrepreneurs in particular, is needed. It should measure, for example: the number of students attending the meeting (is it higher than for the other lectures or not?); meetings’ influence on students’ decision to take the Entrepreneurship course (when this is optional, why they chose it?); perception of students of their own self-confidence, future intentions etc. This could provide the basis for improving the use of this powerful tool in order to turn it into a stimulus for students to engage in entrepreneurial activities.
CONCLUSIONS
One of the main conclusions of this paper’s is that, in the context of corporations’ downsizing trend, higher employers’ expectations parallel with abundance of opportunities, generated by a fast changing environment, raising students’ awareness about self-employment and entrepreneurship as a possible career option is essential. Another conclusion is that entrepreneurship education can become a more effective tool if cooperation between HEIs and SMEs are developed. This can stimulate the entrepreneurial mindsets of young people, encourage innovative business start-ups, growth of small and medium sized businesses and foster a friendlier to entrepreneurship culture. Main forms of cooperation were outlined.
The analysis of the Romanian higher education system led to interesting conclusions regarding its evolution, merits and limits. For the challenges it has to face, major adjustments are needed. Inviting, successful or only young entrepreneurs, is an experience responding to the need to shift to more interactive learning approaches, where the teacher becomes more a moderator than a lecturer. Invited student entrepreneurs’ was a valuable experience not only because they imparted knowledge but also because they provided an example which can enhance entrepreneurial spirit and students’ self-employment intention.

COOPERATION BETWEEN SMEs AND HIGHER EDUCATION INSTITUTIONS …
97
The findings of this paper can not be generalized due to the empirical methods used and the small sample size. However, replicating the study in all faculties in The Bucharest Academy of Economic Studies or other universities could have major and long lasting advantages. Despite some limits, the study fills a gap in the Romanian entrepreneurial literature regarding entrepreneurial education and the use of Cooperation with SMEs as an effective tool in Entrepreneurship Education. This paper also signals to entrepreneurship researchers and educators that more emphasis could possibly be placed on identifying and developing innovative forms of cooperation with the SMEs sector.
Further, researches are needed in this practically under-researched field in Romania. Studies to track and measure the impact on students’ entrepreneurial development as a result of HEIs cooperation with SMEs would be useful in order to determine its effectiveness. Also, a methodology should be designed in order to capture in a longitudinal way student variation in attitudes and intentions toward entrepreneurship.
REFERENCES
1. Cheung C. K. (2008), Entrepreneurship education in Hong Kong’s secondary curriculum;
Possibilities and limitations; Education + Training; Vol. 50, No. 6/9; ABI/INFORM Global, pg. 500-515, at www.emeraldinsight.com/0040-0912.htm
2. Collins, L., Hannon, P. D., Smith, A. (2004), Enacting entrepreneurial intent: the gaps between student needs and higher education capability, Education + Training; Vol. 46, No. 8/9; pg. 454-463, at www.emeraldinsight.com/0040-0912.htm
3. Consortium for Entrepreneurship Education (2001), Entrepreneurship Everywhere: A Guide to Resources and Models for Entrepreneurship Education, Consortium for Entrepreneurship Education, Columbus, Ohio at www.celcee.edu
4. (The) European Commission, Best procedure project: “Entrepreneurship in higher education, especially in non-business studies”- Final report of the Expert Group, March 2008
5. Kolvereid, L., Moen, O. (1997), Entrepreneurship among business graduates: does a major in entrepreneurship make a difference?, Journal of Industrial Training, Vol. 21, No. 4, pg.154
6. Lafuente, E., Vaillant, Y., Rialp J. (2007), Regional differences in the influence of Role-Models: Comparing the Entrepreneurial Process of Rural Catalonia. Regional Studies, 41 (6): 779 – 795 at www.kfacts/index.php?=regional-differences
7. Pittaway l., Harron P., Institutional strategies for developing enterprise education. A review of some concepts and models, Journal of Small Business and Enterprise Development, Vol. 15 No. 1, 2008, pp. 202-226, at www.emeraldinsight.com/0040-0912.htm

MARIANA DRAGUSIN, ALINA ELENA BALALIA
98
8. Rae, D.M. (1995), Teaching entrepreneurship in Asia: impact of a pedagogical innovation, Entrepreneurship, Innovation and Change, Vol. 6, No.3, pg. 193-227
9. Solomon, G. T. (2006), Are We Teaching Small Business Management to Entrepreneurs And Entrepreneurship to Small Business Managers?, USASBE White Paper Series, pg. 44
10. Tan, S., Frank Ng, C. K. (2006), A problem-based learning approach to entrepreneurship education, Education + Training; Vol. 48, No. 6; ABI/INFORM Global, pg. 416-428, at www.emeraldinsight.com/0040-0912.htm.

STUDIA UNIVERSITATIS BABEŞ-BOLYAI, NEGOTIA, LV, 1, 2010
FINANCING TOOLS FOR SUPPORTING SMEs IN ROMANIA
ION STANCU1, SANDA TREANTA 2, IONUT DUMITRU 3
ABSTRACT. One of the most important ways for the development of SMEs’ businesses is the credits from commercial banks and non financial institutions. The SMEs’ financing through credits depending mostly by its possibility to mortgage and in this way a major role for supporting SMEs is given by Guarantee Funds. In Romania the existence of the Guarantee Funds is the expression of the State assistance for small and medium businesses or for sensitive fields (e.g. agriculture).
Also, in the current context of global crisis, the Romanian government is planning to capitalize the two State banks (Eximbank and CEC bank) to offer new credit and guarantee instruments for SMEs.
Other ways to finance the businesses available for the SMEs in Romania are the European non-reimbursable funds for the development of micro-enterprises, the SMEs’ growth through: productive investments, access to financing and consultancy services, access to international markets, implementation of international quality standards, access to the results of research and development activities, facilitating cross-border co-operation, etc.
The accessing these finance instruments requires the own contribution of the beneficiaries, so the credits from banks or other financial institutions and the guaranteeing these credits are needed, too.
Key Words: credit, guarantee fund, SMEs, development, finance
JEL Classification: O12
1. Introduction
Micro, small and medium enterprises (SMEs) play an essential role within European economy. They represent a source of entrepreneurial abilities, innovation and creation of jobs.
But, frequently, they have to fight with market imperfections. SMEs have difficulties in obtaining capital or credits, especially during start-up phases. Their limited resources can also affect their access to new technologies or innovation.
Therefore, supporting SMEs represents a main priority for European Commission for economic development, for social and economical cohesion. 1 Faculty of Economy and Business Administration, University of Craiova, Romania [email protected] 2 Faculty of Economy and Business Administration, University of Craiova, Romania, [email protected] 3 Faculty of Economy and Business Administration, University of Craiova, Romania, [email protected]

ION STANCU, SANDA TREANTA, IONUT DUMITRU
100
In other words, the access to capital represents a permanent problem which SMEs have to deal with, especially because they can not offer the guarantees which are traditionally required by creditors.
2. Material and method
We used data especially from Internet, like official websites of banks or guarantee funds, European Union portals, news from national and international mass-media and documents like Guides for European Union programmes or Applicant Guides.
For current study we would like to delimitate the financing tools which SMEs can use into the following groups:
a) banking and non-banking sources of financing (commercial credits, leasing, business angels etc);
b) guarantee funds, as a main player or partner for SMEs to attract easier and better funds from all sources of financing;
c) financing programs and facilities from Romanian state banks; d) European Funds and other European financing instruments.
Regarding Romanian banking system, we analized the credit products offered to SMEs by some of the most prestigious banks like: Raiffeisen Bank, BCR, BRD- Societe Generale, Transilvania Bank, ING Bank, Bancpost, Volksbank and Credit Europe Bank. We included also an analysis of Romanian state owned banks: CEC and Eximbank to emphasize their increased role in supporting SMEs through funds or guarantees.
We do not make cost analysis of credits within mentioned banks, but we focus only on aspects related to credit's quality framework like: flexibility in credit management, conditions and restrictions related with financial indicators or documentation, credit period and methods of reimbursements, other benefits, maximum funds limits and the required guarantees.
For guarantee funds and structural funds we had an overall perspective by mentioning only key aspects that nowadays can help Romanian SMEs to obtain easier and cheaper funds for developing their business to current European standards.
3. Results and discussions
A. Banking and non-banking sources of financing
Commercial banks A traditional source of financing for SMEs is represented by credits obtained
from commercial banks. Nowadays, all banks have credit products especially designed for SMEs, but some particularities still exists, which we will highlight bellow.
Generally, bank credits are divided into short term credits (less than 1 year) and credits for medium and long term (more than one year).

FINANCING TOOLS FOR SUPPORTING SMEs IN ROMANIA
101
They can cover a large range of needs like financing day to day activities for working capital, payments of suppliers, performing investments by acquisition of terrain, equipments, machines, buildings etc. up to more sophisticated or specific ones like financing construction, extension, modernization of current headquarter or offices (loans on mortgage), credits to acquire real estate properties for own activities (real estate credits), credits for start-up companies, as well as non-cash financing services like issuance of guarantee letters or letters of credit.
In order to understand these specific designed banking products and also to determine the general environment into which SMEs are managing their activities, we would like to remember the latest SMEs definition as per Article 2 of Appendix of European Commission Recommendation no. 361/2003/CE:
“micro, small and medium enterprises category (SME) is formed up by enterprises that employ less than 250 persons and have a net annual turnover up to 50 million euros and /or have total assets up to 43 million euros '' (see Table 1)
Table 1. Classification of SMEs according to European Union
Enterprise category
Average number of employees
Turnover Total Assets
Medium < 250 < 50 million euro < 43 million euro Small < 50 < 10 million euro < 43 million euro Micro < 10 < 2 million euro < 2 million euro
Source: Own creation based on Commission Recommendation no. 361/2003/CE
In Romania, the classification is made according to the new Law of SMEs no.346/2004 as:
• micro-enterprises: up to 9 employees and net turnover/total assets up to 2 million euro;
• small enterprises: between 10 and 49 employees and net turnover up/ total assets up 10 million euro;
• medium enterprises: between 50 and 249 employees and net turnover up to 50 million / total assets up 43 million euro.
As initial remark, some banks have a different approach or limits to define SMEs, like Raiffeisen Bank, for example, which establishes two categories of companies:
- Micro SME Clients, companies with a turnover on last year of activity less than 1,000,000 Euro, (equivalent in Lei), irrespective to the number of employees;
- Medium SME Clients, companies with a turnover on last year of activity within 1,000,000 to 5.000.000 Euro range, (equivalent in Lei), irrespective to the number of employees; (Source: www.raiffeisen.ro)

ION STANCU, SANDA TREANTA, IONUT DUMITRU
102
Same situation we can observe at ING Bank, where SMEs are divided into:
- companies with a turnover < 2 million Euro; - companies with a turnover > 2 million Euro.
For Credit Europe Bank, SMEs represent companies with Romanian legal personality with annual turnover (per company or group of companies) which does not exceed 7,500,000 RON. (Source: www.crediteurope.ro)
So, initially, the SMEs which are interested to contract a credit must find out if their company financial and economic dimension fits into banks categories and offers.
Afterwards they have to establish on the amount of money needed, its currency, the period on which they can refund or use the credit, they have to decide on what method of reimbursement they prefer and to accept or not to provide a justification for credit usage. All these aspects refer to the degree of financial and economic independency which SMEs can accept in relation with bank requirements and with company internal needs.
For example there are banks which are offering credits only in RON for some products, like Transilvania Bank (all short term credits), Raiffeisen Bank (Credit Capital Negarantat) etc. Or there are banks which to some products do not offer credits in USD, like Volksbank (Invest Max and Capital Max), Raiffeisen Bank (Flexi IMM) etc.
Companies should focus to contract credits into the currency corresponding to their incomings or to have their prices indexed to such currency in order to achieve an efficient management of money and to minimize the level of currency risk.
Regarding the amount to be contracted, there are also some specific limits related to client turnover. In the case of Suport IMM (Credit Europe Bank) there is a maximum amount of credit at 25% from last year turnover; or in the case of Overdraft IMM (Raiffeisen Bank) it is maximum 30% from last year turnover.
For Ideal Activ BCR (BCR), there is a maximum limit of 150,000 RON, but this limit amount must not overpass 3 times of client’s monthly average turnover; and for commerce companies, this limit can not overpass the volume of incomings from sales of goods over last 12 months or the forecasted volume of incomings for the next 12 months, as the case (see Table 2).
As we can see, there are also products which have no limits for contracted amount: Credit Capital and Credit Imobiliar from Raiffeisen Bank; Transport IMM from Credit Europe Bank etc.
We should highlight also that there is an indirect relation between the character of limited or unlimited credit and the request to provide relevant documents for money used from credit. For Credit Europe Bank product - Total IMM, there is a maximum credit limit established at 350,000 RON, up to which clients don't have to provide relevant documents. It is similar also for Overdraft IMM from Raiffeisen Bank, but for other of their products like Credit Capital, Credit Invest and Credit Imobiliar, even there is no limit, each withdrawal is controlled and depends on bank approval and relevant documents.

FINANCING TOOLS FOR SUPPORTING SMEs IN ROMANIA
103
Table 2. Credit limits within various banks products for specific needs
Need Bank Working capital Acquisition of equipments, machines for production,
increase of car park
Acquisition, innovation, extension or reconstruction of buildings
used in company's main activity 30 000 RON
35 000 RON
100 000 RON 100 000 RON
Transilvania Creditul 1 ora capital de lucru
Credit Dobanda
0%
Investitii fara aport
Credite cu analiza
simplificata
Investitii fara aport
Credite cu analiza simplificata
100 000 RON
25% CA 100% project value n.d.a. Credit Europe Bank Prompt IMM Suport IMM
Transport IMM
Invest IMM Construct IMM
30% CA no limit no limit Raiffeisen Overdraft IMM Credit Invest Credit Imobiliar 150 000 RON
(max. 3 x CA monthly) 75% project value 75% project value
BCR Ideal Activ Ideal Curent Ideal Invest Ideal Invest
75 000 RON (max. 1,5 x
CA monthly)
400 000 RON
75 000 RON 400 000 RON
75 000 RON
150 000 EUR
250 000 EUR
BRD-GSG Master Linie
de credit
Simplis Credit
Credit de dezvoltare
Master Credit de investitii
Simplis Credit
Credit de investitii
Master Credit pentru
dezvoltare
Master Credit
imobiliar Investissimo
Simplis Credit Credit
imobiliar Investissimo
200 000 EUR
20% CA yearly
200 000 EUR (90% project value
including VAT) 100% project value
Bancpost Linia de credit
revolving
Linie de credit pentru
companii medii si mari
Creditul pentru echipamente
Creditul pentru achizitionarea de imobile
50 000 EUR (15% CA yearly)
80 000 EUR 100 000 EUR Alpha Bank
Linie de credit cu sau fara garantii
Credite pentru achizitie echipamente
Credit pentru achizitie / constructie / amenajare
Source: Own creation based on Banks data (n.d.a= no data available) But the amount of requested credit and the client financial indicators have a
direct relation on the value and type of requested guarantees. For example, in the case of Total IMM (Credit Europe Bank) the SMEs can benefit of a credit in amount of 100,000 RON without any material guarantee.
The most common types of guarantee are the mortgage and gage on the financed objects (buildings, equipments, machines, vehicles etc). In this case the financial risk of the SMEs is reduced, but the operational risk increases, due to a

ION STANCU, SANDA TREANTA, IONUT DUMITRU
104
possibility of a blockage within company activity because the financed object enters immediately into the productive circle while the full ownership is still pending until credit is reimbursed.
But banks are accepting also other types of guarantees like promissory notes, cash collateral (deposits), guarantee letter, shares, business plans, brands or guarantees through FNGCIMM. Each one of them involves a different supplementary cost and specific requirements. For example, for promissory notes there are banks (eg. BCR bank) which request blank promissory notes mentioning the provision “without protest”, issued by company with surety from significant shareholders (min. 10% of shares) and from administrator.
Nowadays an increased role is played by the guarantees assured through FNGCIMM, a special designed national fund which supports the SMEs need for guarantees. But generally, banks prefer a mix of such guarantees in order to split their own financial risk, as well as client’s risk, and to assure flexibility to credits in order to attract more clients.
But banks start to design also specialized products dedicated to a specific category of clients or needs.
At Transilvania Bank exists a credit for companies which operate into rural environment (Credite pentru firme din mediul rural) that can be used to acquire equipments, to renew or build a headquarters or to finance current activities. The maximum loan amount is 250,000 Euro, with terms of 12 months (working capital) or 60 months (investments) and can be offered in Euro or RON. The eligible companies must operate and be register in a locality with less than 30,000 habitants.
Also, at Transilvania Bank we can find two credit products designed for new established companies (Start Up and Start Up Plus) to finance their needs for investments or working capital. Credit term is up to 60 months for a maximum amount of 35,000 RON (Start Up) or 85,000 RON (Start Up Plus). The client must finance 25% from investment value and has to provide as minimum guarantee: 2 endorsers and mortgage or gage on the goods purchased from credit money.
So, commercial banks are starting to focus more and more on this key category, which SMEs represents to any economy, and they start to offer better conditions, options and various extra benefits. We can find also packages dedicated to SMEs (Pachetul Master- BRD, Pachet Ideal BCR – BCR) combining credits with cards, payment and cash management services, issuance of guarantee letters (L/G) without blockage of own funds, all of this at reduced costs.
SMEs continue to represent an important category of clients for most of banks and vice-versa, but nowadays there are many other options for financing SMEs which we will continue to present next.
Operational and financial leasing Besides the credits used to purchase vehicles and equipments, the operational
leasing represents a new real opportunity to finance and a solution for SMEs to

FINANCING TOOLS FOR SUPPORTING SMEs IN ROMANIA
105
become more competitive and to have access on the European market by acquisition of equipments with high performances and more economical.
This type of leasing was introduced in Romania by Immoconsult Leasinggesellschaft m.b.H. by financing the construction of a production unit for the german group Eckerle Group at Cluj- Napoca. Instead to contract a credit from a bank, Eckerle Group decided to implement the 2,6 million Euro project under a operational leasing scheme.
There are some advantages for the operational leasing like: it involves monthly installments composed only by amortization and benefit; the goods which are the object of the leasing contract are registered as fixed assets by the leasing company; down-payment is not obligatorily and at end of contract the user is obliged to return the good.
Operational leasing is recommended for companies which involve a large fleet of equipments, because it takes away many risks and uncertainties related with their management. Also it offers a larger flexibility, the possibility to management to focus more on the company main activities, to know the exact cash-flow and degree of financial performance (due to the fixed and pre-established monthly installments).
In Romania, the main actors within the operational leasing and management of fleets market are Sixt New Kopel, ALD Automotive, Arval România, Hertz Lease, Dirent and LeasePlan.
Another source of financing for SMEs investments, a more traditional one, is represented by the financial leasing. The majority of clients are small companies which don't have or don't need a large fleet of equipments or vehicles. In Romania, this type of leasing is very popular, because the clients have the opportunity to purchase the good at end of contract by paying a residuary value.
Business angels
A new trend in financing SMEs activity, especially on start-up phases, is represented by the business angels. The business angels are persons or groups of persons with a regular activity for investments with capital risk, which are financing the needs of unlisted businesses. They are businessmen which invest money, idea and experience for developing businesses in initial or growing phases. These kinds of investments are providing them a higher profit than traditional financial investments.
We can find business angels especially in USA, but for the past decade we encountered some also in Romania, like: Radu Tudorache (Newarch Investments fund), Marius Ghenea (PCFun), Dragos Anastasiu (Eurolines) and more.
But nowadays, on a financial crisis, the businesses angels are very reticent to invest into start-up companies, due to the high risk of failure, so they focus only on continuing the existing projects.

ION STANCU, SANDA TREANTA, IONUT DUMITRU
106
Current situation
Due to international financial crisis, this trend of reticence exists also within entire Romanian and European economy. If initially, some banks have stopped to offer any kind of credits, nowadays all major banks and financing institutions are focusing especially on providing anti-crisis measures like restructuring or time grading of portfolio for current clients as well as a reduction of various commissions, fees and taxes applied to new clients. They try also to attract the savings of individuals by providing better conditions and interest for deposits.
But the main role in unblocking current situation has to be played by state institutions, especially by guarantee funds or state banks.
As we mentioned above, a major obstacle for SMEs to obtain the necessary funds from credit institution is represented by the required guarantees, mostly mortgage and gage on existing or future patrimony. Assuring this kind of guarantees can provide higher financial and operational risks to SMEs.
Nowadays, on a economical and financial crisis background, when most of partnership relations are damaged, orders and incomings are decreasing, there is a climate of uncertainty and change which can easily harm companies which are not flexible enough to reorganize their activity. So, providing guarantees from their own patrimony represent more than a risk for SMEs, it is a real challenge to company existence.
So, an important financial support for SMEs in assuring such guarantees and assuming part of such risks is provided by the Romanian Guarantee Funds like: F.G.C.R. and F.N.G.C.I.M.M..
B. Guarantee Funds
In order to help and develop the business area, the Romanian government authorities have created two special funds:
- FNGCIMM, which is designed to support SMEs in obtaining the funds required to their activity by providing guarantees letters which can cover maximum 80% of credits value;
- FGCR to provide guarantees for credits which have the objective to finance investments in private agro-alimentary sector and in works for developing of rural infrastructure.
FNGCIMM (Fondul NaŃional de Garantare a Creditelor pentru IMM-uri), the National Fund to Guarantee Credits for SMEs, can offer three types of guarantees:
a. guarantees from own funds; b. guarantees from funds into administration; guarantees from funds provided
by The Ministry of Agriculture, Forests and Rural Development in order to absorb SAPARD funds.

FINANCING TOOLS FOR SUPPORTING SMEs IN ROMANIA
107
c. guarantees given to beneficiaries of financing within European Union funds, for financing of banking and non-banking institutions at payment of consulting fee or implementation of projects on a field of activity potential beneficiary of European funds;
To benefit of such guarantees, SMEs must pay a yearly commission fee to FNGCIMM as a percentage applied on the guaranteed amount. It can be paid gradually within one year, or in some cases, only in a single initial payment. The value of commission varies and is determined by credit length, currency of credit and method of guarantee payment as per bank's demand (see Table 3).
Table 3. Financial description of FNGCIMM guarantees
Guarantee type
Item Own funds Funds in administration For beneficiaries of EU
funds
Max. % of guarantee from credit value
80,00% 70,00% 80,00%
Maximum amount of guarantee
800 000 euro Not defined Not defined
Comission fee for short term credits
(% from credit value) 1% / year 1,5% / year 1% / year
Comission fee for long term credits
(% from credit value) 1,5 – 2% / year 2% / year 1% / year
Source: Own creation based on FNGCIMM website data.
Also, if the conditions to access EU funds request applicant to provide evidence about existence of own sources for financing the project, in this case, the Fund can issue, at financing institution request, a document called Guarantee Promise by which the Fund expresses its intention to guarantee for the SME financing.
Nowadays the Fund cooperates with 20 of the most important romanian commercial banks like: Alpha Bank, Banca Comercială Română, Banca Comercială Carpatica, Banc Post, Banca Română pentru Dezvoltare-GSG, Banca Românească, Banca Transilvania, CEC, Banca Leumi Romania, Eximbank, Credit Europe Bank, ING Bank, Libra Bank, Romanian International Bank, Romexterra Bank, Unicredit łiriac Bank,
The Fund does not require real estate guarantees or gage. For the given guarantee the Fund requests the issuance by the company of blank promissory notes in “amount” and “term” without protest, which must have surety from administrators/ associates/ shareholders with address in Romania. These promissory notes will be filled by the Fund with the corresponding amounts requested by bank, only in the

ION STANCU, SANDA TREANTA, IONUT DUMITRU
108
case when the bank requests payment of guarantee. This item keeps solicitants of guarantee in a controlled position, by appealing to their common sense to not abuse of such facility or to intent to trick banks or fund.
So, these guarantee funds are covering more the logistical and bureaucracy aspects of financing, rather than economical ones, by giving an easier access to SMEs to obtain the required funds from banks or other financing institutions.
C. Financing programs and facilities from Romanian state banks
CEC Bank and Eximbank are two Romanian state companies which are playing a major role within the domestic financial market. Even they cover a broader range of clients from individuals up to state institutions like public local authorities, financing SMEs activity represents a key part within their portfolio. They can provide also sources of financing like credits, leasing schemes as well as guarantees for contracting credits from other banks.
Their offer for SMEs has two main components:
- the new state capitalization, which determines the volume of credits that can be offered
- the guarantee component, by supporting SMEs in attracting funds from other banks or European institutions.
To overpass the current financial crisis, the Romanian government considers to “transform” CEC and Eximbank into two institutions dedicated for supporting SMEs by offering better credit conditions, easier access and the opportunity to attract more funds. Senators have decided recently not to privatize CEC Bank for the next 5 years and to capitalize it with 900 million lei. Such money will be directed especially to respond to SMEs needs for finance.
Within CEC Bank and Eximbank portfolio of products and services we can find common types of credits like credit for investments, mortgage credit, credit line (overdraft), guarantee letters, credit for inventory, credit for leasing, all with same particularities as commercial banks and leasing institutions.
But CEC Bank can provide also specific designed credits for SMEs, with BERD and EU funds, which are covering two main destinations:
- to finance investments projects on improvement of energetic performance (Energy Efficiency Finance Facility);
- to finance working capital and new projects for modernization or extension of existing businesses within rural companies (Rural Finance Facility).
Beside these specific designed credits, CEC Bank can help SMEs to obtain funds through European Union financing programmes, by providing consulting services, as well as financing and re-financing opportunities. CEC Bank can pre-finance partially or entirely the grant, to co-finance eligible expenses or to finance non-eligible expenses of the project.
It can cover maximum 100% from project value, for a period up to 6 months

FINANCING TOOLS FOR SUPPORTING SMEs IN ROMANIA
109
(Creditul Punte) or up to 10 years (Creditul pentru investitii or Creditul Punte), in Lei or Euro. The credit line is offered in installments, is revolving for max. 3 years and it can establish fixed terms for reimbursement. The credit for investments is provided in one payment and clients can benefit of a maximum 3-12 months period of grace. These credits can finance projects for: rural and fishery development; modernization or extension of telecommunications; development of start-up's, productions systems, micro-enterprises and R&D infrastructure within companies, as well as research partnerships between universities/ R&D institutes and enterprises.
The credits contracted by SMEs from commercial banks in order to develop or modernize their own activity can be guaranteed also by Eximbank. The value of guarantee is up to 80% from the value of credit or banking guarantee letter. It can be offered in the same currency and period of the contracted credit or guarantee letter.
Such guarantees from CEC or Eximbank facilitate the access of SMEs to financing, by covering the need of guarantees required by banks. Since it is an irrevocable and unconditioned guarantee, direct and express, payable at first written demand of beneficiary (commercial bank), the risk of non-reimbursement of credit or execution of banking guarantee letter is covered. So such guarantees help also banks to increase their portfolio of clients.
D. European Funds and other European financing instruments
Regarding the European Funds, as latest solutions provided by European Institutions to finance SMEs, need we will focus on three components:
a. Structural Funds and Common Agricultural Policy Funds b. JEREMIE - a new opportunity for financing SMEs. c. The latest EU financing instrument - Progress
a. Structural Funds and Common Agricultural Policy Funds
The European Union provides support to European small and medium-sized enterprises (SMEs). This is available in different forms such as grants, loans and, in some cases, guarantees. Support is available either directly or through programmes managed at national or regional level, such as the European Union’s Structural Funds. SMEs can also benefit from a series of non-financial assistance measures in the form of programmes and business support services.
The Structural Funds (European Regional Development Fund - ERDF and European Social Fund - ESF) are the largest Community funding instruments benefiting SMEs, through the different thematic programmes and community initiatives implemented in the regions. The beneficiaries of structural funds receive a direct contribution to finance their projects.

ION STANCU, SANDA TREANTA, IONUT DUMITRU
110
Areas of application
The Structural Funds are financial instruments through which the European Union tries to eliminate the economic and social disparities between regions in order to achieve economic and social cohesion. Romania’s Structural Funds will account for 28-30 billion Euro for the period 2007-2013. The EU’s Structural Funds are managed by the European Commission and they are used to promote less developed regions, restructuring of regions affected by industrial decline, fight against long-term unemployment, and professional inclusion of the young people or the promotion of rural development. (Source: Euractiv.ro)
The Cohesion Policy of the European Union is financed through the structural instruments which represent 2% of the EU’s policies budget. These instruments are:
1. European Regional Development Fund (ERDF) The fund will support and finance investments in: sites and facilities for
industry and business, help for SMEs, and support for research and development and capital works associated with vocational training. These are all designed to encourage permanent jobs in regions with high unemployment; infrastructure projects which aid the regions’ economic development; local initiatives to promote regional economic development; tourism and cultural projects; environmental protection and improvement measures which are linked to regional economic development.
2. European Social Fund (ESF) The priorities of EFS are: developing active policies to combat unemployment,
preventing long-term unemployment and providing support for those entering or re-entering the job market; promoting social inclusion and equal opportunities for all; developing education and training as part of a policy for lifelong learning; promoting a skilled and adaptable workforce, fostering innovation in work organization, supporting entrepreneurship and job creation, and boosting human potential in research, science and technology; improving the participation of women in the labor market.
In Romania, the investments from the Structural Funds will be complemented by the Common Agricultural Policy funds. These are:
3. European Agriculture Fund for Rural Development (EAFRD) The main objectives are: improving the competitiveness of agriculture and
forestry by means of support for restructuring; improving the environment and the countryside by means of support for land management; improving the quality of life in rural areas and encouraging diversification of economic activity.
4. European Fisheries Fund (EFF) The priorities are: measures to adjust the Community's fishing fleet; aquaculture,
processing and marketing; collective action; sustainable development of coastal fishing areas.

FINANCING TOOLS FOR SUPPORTING SMEs IN ROMANIA
111
The Ministry of Public Finance from Romania is the authority responsible for the coordination of the national authorities in charge of the administration of the structural funds. The main operational programmes available for funding the SMEs in Romania are:
- Sectoral Operational Programme for Increase of Economic Competitiveness (POS CCE)
- Sectoral Operational Programme Transport (POS T) - Sectoral Operational Programme Environment (POS M) - Sectoral Operational Programme Human Resources Development
(POS DRU) - Regional Operational Programme (POR) - Operational Programmes Cross Border Cooperation (Romania –
Bulgaria, Romania – Hungary, Romania – Serbia, etc.) - National Plan Rural Development (PNDR)
Stages in getting and implementing the European projects
Grant application forms and project assessment criteria should include a number of items which test whether the project applicant has taken the necessary steps to develop a good project proposal. The most important steps in developing the SMEs project proposal are:
√ Project applicants should examine all key options and report the conclusions in the application form. This is the stage when they should include the question of technical feasibility;
√ A well-developed financial analysis is required; this will describe the anticipated cash-flow situation and calculate the grant required. Also, some financial indicators are needed to be calculating in order to measure the rates of return;
√ The result of an economic appraisal should be outlined with the best estimates of all economic benefits and costs, or estimates of created jobs or value-added.
√ The impact of the project in terms of “horizontal criteria”, such as the promotion of equal opportunities, or innovative or sustainable models of development, has to be taken into consideration;
√ Finally, detailed arrangements for monitoring and impact assessment will be described, with clear indicators of how progress and success will be measured.
For getting the financing, the SMEs pass through a long process of submission, appraisal, selection and contracting the finance. The Applicant has to elaborate the project using the specific Application Form and Annexes. Also, for submitting Application form, some supporting documents are required. Some of the most relevant documents in submitting process to Management Authority are Business Plan and/or Feasibility Study.

ION STANCU, SANDA TREANTA, IONUT DUMITRU
112
The mechanism of implementing the European project is based on reimbursement of the expenditures made in advance by Beneficiary. So, Beneficiary has to forecast some amounts for certain periods of time for making expenditures according to the graphic activities. With documents of payments and other justification documents, the Applicant can submit a Reimbursement Request. Afterwards the Management Authority verifies all the documents and the eligibility of activities and expenditures.
The eligibility of Applicants, activities and expenditures; non-eligible
expenditures (VAT)
Co-financing from the EU through these grants is between 50% and 95%, one of the key requirements being the monitoring of the spending for the amounts received, in accordance with contracts signed with management authorities, which means observing the financing conditions established by the authorities.
Such funding grants may be obtained by all companies with registered office in Romania. There are no conditions regarding the nationality of shareholders or main headquarters. Some Applicant Guides may impose conditions like: minimum 1 year of company existence, positive results in previous fiscal year etc.
It is very important to follow the instructions established in the Applicant Guide regarding to what kind of activities and expenditures you can make in the proposed project (the eligibility of activities and expenditures must be strictly verified). Otherwise, some amounts included in the project budget can not be reimbursed by the Management Authority to the Beneficiary.
Also, the Beneficiary has to take into consideration some non-eligible costs which can not be reimbursed by Management Authority, but are necessary for the project implementing. The most important non-eligible cost is VAT, which has to be sustained by Beneficiary from his own money.
Pre-financing the projects
Starting from 2009, the SMEs can receive pre-financing for implementing their European projects. Up to 35% of non-reimbursement value of the project can be required by Beneficiary as pre-financing. Usually, the granting of pre-financing is determined by the existence of a Guarantee Letter.
Public procurement
Although, SMEs are private companies, all expenditures made in a project have to conform to national and European legislation in public procurement field (Emergency Ordinance no. 34/2006 updated). It must be followed stages of procedures in public procurement field or, in some cases, the simplified procedures of Management Authority.

FINANCING TOOLS FOR SUPPORTING SMEs IN ROMANIA
113
Critical points for implementing projects
All following aspects should be taken into consideration in any kind of project:
* assurance the contribution of Applicant
The Applicant has to co-finance the project with own contribution (between 5% and 50%); when the project proposal is developed, the Applicant should take into account the sources of this contribution. The bank credit, the capitalization of company, the use of company return or other sources can be the solution for co-financing the European project. An optimal forecasting of the budget costs will help the Applicant to avoid the problems in co-financing at the time of project implementation.
* applicant expenditures in advance and terms of reimbursement
Beside the amount needed for co-financing the project, the Applicant should provide the money flows until the Management Authority will reimburse the expenditures made in the project. The terms of reimbursement can vary between 45 and 90 days, so the Applicant should forecast a precisely cash-flow to avoid blocking the project implementation.
* exchange rate
In forecasting the project budget, the Applicant must take into account also, the terms for appraisal of projects; according to 2008 experience, these terms varied between 3 and 9 months. The estimated cost of some imported equipments (with prices in Euros) could register a significant increase at the moment of project implementation, so the Applicant takes into account the increase of the budget costs.
b. JEREMIE - a new opportunity for financing SMEs
What is JEREMIE?
JEREMIE stands for “Joint European Resources for Small and Medium-sized Enterprises” and is an initiative which was developed by the European Commission (EC) and the European Investment Fund (EIF), which is part of the European Investment Bank (EIB) Group, in the context of the EU Structural Funds allocation 2007-2013 for the EU Member States and regions.
The initiative offers EU Member States, through their national or regional Managing Authorities, the opportunity to use part of their European Union (EU) Structural Funds to finance small and medium-sized enterprises (SMEs) by means of equity, loans or guarantees, through a revolving Holding Fund acting as an umbrella fund.

ION STANCU, SANDA TREANTA, IONUT DUMITRU
114
The Holding Funds can be set up either as a “ringfenced block of finance” or bank account managed by the Holding Fund manager on behalf and in the name of the Managing Authority, or as an independent legal entity (Special Purpose Vehicle – SPV). The choice of the legal structure depends very much on the level of sophistication of the JEREMIE Holding Fund and on the respective national legal framework.
Acting as an umbrella fund, the Holding Fund will partner a wide spectrum of local SME financial institutions such as SME finance operators, venture capital funds, loan funds, technology transfer vehicles, microfinance providers, banks and guarantee funds. The funds made available to these financial institutions by the Holding Fund will be used to finance the creation and development of SMEs.
Who is eligible? As an umbrella fund, JEREMIE will target financial intermediaries, not
SMEs directly. The selected JEREMIE financial intermediaries will provide SME-focused
financial instruments including guarantees, co-guarantees and counter-guarantees, equity guarantees, (micro) loans, securitisation, venture capital, Business Angel Matching Funds, and investments in Technology Transfer funds. SMEs are the final beneficiaries and may be allocated revolving resources directly from the partner financial institutions.
With the JEREMIE initiative, regions and Member States can benefit from a flexible, efficient, “visible” and revolving financial platform for SMEs, through a long-term partnership with their local financial institutions.
JEREMIE in Romania
On February 18, 2008, the Romanian Government - represented by Public Finances Ministry - and European Investment Fund signed a Financing Agreement and a letter of costs on the basis of which the government authorized the Fund to use 100 million euro from the pre-financing money received from the European Commission by contribution of the Structural and Cohesion Funds to the operational programs, with a view to providing access to financing for small and medium sized enterprises.
By the JEREMIE program, the SMEs will be offered improved access to financing, which will contribute significantly to stimulating entrepreneurship, the increase in enterprises' competitiveness and a dynamic business environment4.
c. Latest EU financing instrument - Progress
On July 2nd 2009, the European Commission has recommended to launch a financing micro-instrument called “Progress” in order to support people who have recently lost jobs and wish to start a micro-enterprise. This instrument is a micro- 4 (Issuer: Government of Romania – Press office, Date: 14.05.2008, www.gov.ro)

FINANCING TOOLS FOR SUPPORTING SMEs IN ROMANIA
115
credit designed for micro-enterprises with less than 10 employees or for jobless or inactive persons that wish to start an independent business, and it can provide financing up to 25,000 Euro, a low level of interest rate, as well as consulting services, professional training and assistance in elaboration of business plans.
Its initial budget will be of 100 million euro, but it will attract a total amount of 500 million euro with participation of other international financing institutions like the Group of European Investments Bank. If it is approved by Ministerial Council and European Parliament, it can be operational in 2010.
4. Conclusions
Nowadays, for the Romania based SMEs, there are a various solutions available for obtaining their necessary funds.
Commercial banks are more open to SMEs needs by offering diverse and specific products or services and by accepting a broader type of guarantees. New solutions are provided also by non-banking institution and the state plays a more active role, through its banks and guarantee funds. We can observe that there is a good cooperation between all this sources of financing which provides an adequate financial climate for business.
But still, due to current international crisis, there is an unstable and reticent climate which could damage business relations and could affect economic activity deeply, if all above mentioned sources of financing do not cooperate actively.
So, commercial banks have launched anti-crisis measures or programmes by analizing each client, by offering new solutions for their current clients in restructurating or time grading existing credits, as well as focusing on specialized type of clients within defined European programmes. Eximbank has re-acted also to such situation by decreasing comissions and by reducing the fees for guarantees, financing and insurances with 50%. Also, the guarantee funds have redefined their conditions and increased the coverage level of credits to 80%, with state financial help.
Therefore, between Romanian financial market main actors and national or EU institutions there is a very cooperant relation, with coordinated actions and measures, which are responding to market changes but also to SMEs financing needs.
REFERENCES
1. Article in EIPASCOPE: „Good Practice for Implementing Structural Funds Programmes and Projects”, by Robin Smail – European Institute of Public Administration
2. SME portal: http://ec.europa.eu/enterprise/sme
3. “European Union Support Programmes for SMEs - overview of the main funding opportunities available to European SMEs”, November 2008, European Commission – Enterprise and Industry Directorate General

ION STANCU, SANDA TREANTA, IONUT DUMITRU
116
4. „A new way of using EU Structural Funds to promote SME access to finance via Holding Funds”, 02.10.2008, European Investment Fund, www.eif.europa.eu )
5. The Applicant Guides – The intermediate Body for POS CCE – SMEs priority axe: http://www.mimmctpl.ro/fonduri_structurale/domeniul_imm/domeniul_imm.html
6. The Applicant Guides – The management Authority for POR – www.inforegio.ro
7. The Applicant Guides – The Payments Agency for Rural Development and Fhising – www.apdrp.ro
8. Banks official websites
9. www.fngcimm.ro/index.php
10. http://www.leasing.ro/portal/index.php
11.http://www.newschannel.ro/stiri/eximbank-si-cec-incheie-parteneriate-pentru-sustinerea-imm-urilor
12. www.ziare.com/Statul_pompeaza_in_CEC_si_EximBank_cate_100_milioane_euro-640131.html

STUDIA UNIVERSITATIS BABEŞ-BOLYAI, NEGOTIA, LV, 1, 2010
THE STATE OF SME’s ECONOMIC AND SOCIAL RATIONALITY
MONICA BIOLAN 1, ILIE GAVRILA 2
ABSTRACT. The paper analyse the economic rationality of SMEs (Small and medium size enterprises) trough some pertinent indicators that revels the importance of SME for the employment market and for the entire economy. Despite their adaptability these entities have faced always different problems and the most noticeable has been the need of capital infusion. The paper proposes a new type of capital infusion in Romania: the private equity investment. We explore the venture investment mechanism and its implications at economic level for the SME. To identify the economic impact of venture capital, European preliminary figures provided by EVCA (European Venture Capital Association) will be analysed to determine if private equity capital represents a solution for capital infusion in SMEs.
Key words: economic rationality, social rationality, venture capital, SME;
JEL Classification: D29 1. Introduction
We are facing a financial crisis, which has extended itself at all economic levels during the last year.
The crisis took place when a loss of confidence by investors in the value of securitized mortgages in the US resulted in a liquidity crisis that prompted a substantial injection of capital into financial markets by the United States Federal Reserve, Bank of England and the European Central Bank.
At the time, an indicator of perceived credit risk in the general economy, the TED spread (difference between the interest rates on interbank loans and short-term U.S. government debt) has attained around 150-200 bps. In September 2008 the crisis determined a series of stock markets crash and a considerable number of banks, mortgage lenders and insurance companies failed.
On November 3rd, 2008, the EU commission at Brussels predicted for 2009 an extremely weak growth of the BIP, by 0.1 percent, for the countries of the Euro zone and a negative number for the UK (-1.0 percent), Ireland and Spain. The
1 The Bucharest Academy of Economic Studies, Faculty of Economics, Romania,
[email protected], 2 The Bucharest Academy of Economic Studies, Faculty of Economics, Romania, [email protected]

MONICA BIOLAN, ILIE GAVRILA
118
Bank of England and the Central Bank for the Euro zone, respectively, reduced their interest rates from 4.5 percent down to 3 percent, and from 3.75 percent down to 3.25 percent. Regarding the economic situation of the production sector, all industries seem to be involved. As a consequence, starting from November 2008, several countries launched programs of rescue for their economies.
In these times the SMEs are the most affected organisations. Nevertheless in January 2009 in Romania, were being created no more then 5000 new firms which had an average asset value around 22 000 RON which classifies them like SMEs (classification based on asset level). The trend of creating new-start-ups is decreasing but if we observe also the “self-employed persons”, we can see that the total number of start-ups is the same only the organisation form have been change. [chart no. 1]
Chart 1 : The evolution of start-up in January 2003-2009 [Source of the data: Trade Register]
51855586
7483
6275
8615
7682
5465
1515
5698
2609 2520 2361 2155
4115
0
1000
2000
3000
4000
5000
6000
7000
8000
9000
10000
2003 2004 2005 2006 2007 2008 2009
Companies Self-employed Persons
The phenomenon can be explained by the high level of adaptability of
SMEs at the environment. To build a complete image of the Romanian SMEs Sector for a better understanding regarding its specific characteristics (like their adaptability) we will analyze the economic and social rationality of these entities and the difficulties that this sector is facing. The solution proposed by the authors to the most present difficulties encountered at SMEs level, the lack of capital, will be presented in the “Private Equity” Section of this paper. Having a complete picture of this sector trough a series of quantitative and quality indicators we will be able to suggest a pertinent solution for Romanian SMEs lack of capital.

THE STATE OF SME’s ECONOMIC AND SOCIAL RATIONALITY
119
2. Economic and social rationality of SMEs in Romania: general considerations
The SMEs problematic has to be realised in relation with their appearance in Romania at the beginning of 90’s, in a specific context of economic transition to a capital market. In all CEE (Central and Eastern Europe) countries this entities have been developed a series of specific characteristics [Nicolescu, 2001, p.127]. Because the economy has faced a complex situation determined by privatisation, reorganisation and the development of SME sector, the genesis of these companies had two origins: privatisation of Stat companies and the foundation of new ones. The first option was believed to be more efficient but in time the new formed companies have been proved a better efficiency because were based on true entrepreneurs and intrinsic private property [During, 1998]. The specific conditions of emergent economies and the speed and amplitude of SMEs creation correlated with the speed and amplitude of privatisation and reorganisation, define a very important characteristic of SMEs: the absorption of manpower available. This characteristic of manpower absorption it’s still manifest itself [Table 1] which can be a very important factor in crisis time.
Table 1: Weight of staff in SMEs in total staff by activity of national economy at level of CANE Section [Source: Romanian Statistical Yearbook 2008]
percentage
Activity (CANE Rev. 1 sections) 2002 2003 2004 2005 2006 2007 Weight of staff in active small and medium enterprises - total 50.7 54.4 58.2 60.7 63.2 64.9
Mining and quarrying 4.8 5.7 6.5 7.2 10.1 13.6 Manufacturing 41.0 43.9 47.8 49.7 52.3 53.8 Electric and thermal energy, gas and water 10.8 11.9 12.0 12.7 14.6 16.1 Construction 63.2 66.6 68.8 71.5 74.2 75.7 Wholesale and retail, repair and maintenance of motor-vehicles and motorcycles and of individual and household appliances
91.7 91.0 90.3 89.5 87.7 86.3
Hotels and restaurants 84.2 86.0 85.1 85.6 86.2 87.2 Transport, storage and communications 28.7 32.2 38.7 42.5 44.7 46.8 Real estate transactions, rentings and service activities mainly rendered to enterprises
68.5 73.3 74.9 75.4 74.0 74.0
Education 100.0 100.0 100.0 100.0 100.0 96.8 Health and social assistance 97.6 97.9 96.8 95.4 95.2 94.2 Other activities of collective, social and personal services
59.3 61.5 66.5 64.9 64.6 61.9
We can observe from table 1 that in five years the SMEs had a very important
proportion in education sector (100% for the time period in question) and wholesale and retail sector (almost 90% for the time period in question). The amplitude of SMEs sector can be appreciated also by the weight of turnover achieved by SMEs in total enterprises by activity sector at economic national level [Table 2].

MONICA BIOLAN, ILIE GAVRILA
120
Tabel 2: Weight of turnover achieved by SMEs by activity of national economy [Source: Romanian Statistical Yearbook 2008]
percentage
Activity (CANE Rev. 1 sections) 2002 2003 2004 2005 2006 2007 Weight of turnover achieved by active small and medium enterprises - total
55.9 57.4 57.5 57.6 58.7 60.8
Mining and quarrying 3.8 4.1 5.4 5.1 5.6 8.7 Manufacturing 38.5 40.1 39.5 39.0 39.9 40.4 Electric and thermal energy, gas and water 1.7 2.4 3.4 7.7 15.4 25.0 Construction 66.0 69.0 70.2 71.3 73.7 72.0 Wholesale and retail, repair and maintenance of motor-vehicles and motorcycles and of individual and household appliances
86.6 84.5 82.3 79.6 77.4 76.5
Hotels and restaurants 76.1 79.1 77.8 78.8 81.1 81.6 Transport, storage and communications 37.2 40.1 41.9 43.8 46.9 49.3 Real estate transactions, rentings and service activities mainly rendered to enterprises
87.5 89.5 88.8 89.5 88.8 88.2
Education 100.0 100.0 100.0 100.0 100.0 97.1 Health and social assistance 93.2 93.8 92.6 92.1 92.6 90.3 Other activities of collective, social and personal services 54.8 44.9 52.1 53.3 49.8 51.8
We can observe an ascendant trend for the weight of turnover achieved by
SMEs in the total turnover made by Romanian companies, from 55.9% in 2002 to over 60% in 2007. Given the figures observed in Table 1 and Table 2, the increasing in importance of SMEs role is highlighted thought manpower absorption and the weight of turnover at all activity sector level.
Taking into account the density of SMEs (number of entities per 1000 residents) and the average size of the firms (resources and reserves per firm), we can appreciate the importance of this sector [Gavrila, 2008]. An essential influence factor is the economic development level of the country of the region in question [Papillon, 2003]. We analyzed some selective data [Gavrila, 2008], which are given in the diagrams 1 and 2. These representations give us tow trends regarding the SME sector: a positive correlation between the level of economic development (GBP per capita) and the average size of SME and a negative correlation with the level of development and the density of SMEs. Regarding the situation of Romanian SMEs correlation with the economic level of development and the density of this type of firms, we have a reverse situation that doesn’t mach the density trend that we have in diagram 1. So in Romania a region with a high level of development is correlated with a higher density of SMEs. [Tabel 3] This correlation can be used for the implementation of regional development policy.

THE STATE OF SME’s ECONOMIC AND SOCIAL RATIONALITY
121
Diagram 1: The correlation between the SME density and the economic level of development
0
10
20
30
40
50
60
70
US EU Japon Pol of highdevelopment
in EU
Pol of lowdevelopment
in EU
Density
Linear (Density)
Diagram 2: The correlation between the SME average size and the economic level of development
0
5
10
15
20
25
US EU Japon Pol highdev. EU
Pol low dev.EU
Size of the firms
Linear (Size of the firms)
Table 3: The correlation between the regional development and SMEs
[Source: Statistic Yearbook of Romania 2008, p.84, p.512]
Region Density SME 2005 GBP per capita 2006 GBP per capita TOTAL 23 13,328 15,896 Bucuresti - Ilfov 54 29,332 34,903 North - West 26 12,526 14,892 Centre 25 13,136 15,969 West 25 14,848 18,272 South - East 21 11,534 13,520 South - West Oltenia 16 10,263 12,266 South - Muntenia 16 10,906 13,109 North - East 15 9,053 10,459

MONICA BIOLAN, ILIE GAVRILA
122
2.1. The dynamic of economic rationality for SMEs
An indicator of efficiency which can highlight the economic efficiency of SMEs sector is labour productivity. We analyzed the level of productivity which have been calculated in two ways: the ratio between weight of the SME sector in the total turnover (Table 4) and the weight of staff at SMEs level and the ratio between gross value added and the weight of staff at SMEs level (Table 5). If the result is equal 1 then the productivity of SMEs is equal with the productivity of the economy. A SMEs productivity higher then the economy productivity is registered when the indicator is more the 1. This means that when the indicator is less then 1, the SMEs productivity is les then the economy productivity. Table 4: Labour productivity in SMEs depending on turnover (The source of the data that were used for the calculation of the indicator: Statistic Yearbook of Romania 2008, p. 685) 2006 2007 Economy 0.9317 0.7334 Industry 0.6314 0.6621 Construction 0.9945 0.9516 SALE, maintenance and repair of motor vehicles and motorcycles, Retail Trade 0.7950 0.8688 Retail Trade, repairs of personal and household articles 0.9023 0.8179 Wholesale 1.7823 1.6960 Services for population 0.9745 0.9833 Services for enterprises 0.9858 1.0669
The figures demonstrate a lower productivity in the case of SMEs then for
the entire economy. Only for the wholesale the indicator shows us a higher productivity of the SMEs then the economy. For a more constructive conclusion we calculated also the productivity indicator depending of the gross value added. (Table 5)
Table 5: Labour productivity in SMEs depending on gross added value (The source of the data that were used for the calculation of the indicator:
Statistic Yearbook of Romania 2008, p. 685) 2006 2007 Economy 0.7794 0.7914 Industry 0.5440 0.5682 Construction 1.0738 0.9814 SALE, maintenance and repair of motor vehicles and motorcycles, Retail Trade
0.8560 0.8970
Retail Trade, repairs of personal and household articles 0.9491 0.8451 Wholesale 1.8111 1.7022 Services for population 0.7194 0.6442 Services for enterprises 0.7689 0.8573

THE STATE OF SME’s ECONOMIC AND SOCIAL RATIONALITY
123
Once again the productivity of the SMEs is lower then the economy’s, the exception remains the wholesale sector. Even if these enterprises creates less gross added value, their profitability can be seen in earning before interest and taxes (EBIT) which represents 60% from EBIT. We have seen many special features of the SMEs and many survival characteristics but we have to be aware that these companies encounter many difficulties regarding both the production, products and services supply. The statistics show us that the greatest difficulty of SMEs which is the lake of capital which is very important in creating productivity. The difficult situation on the credit market which is one of the most important sources of capital for SMEs is not very approachable in financial crisis time, so the alternative solution that this paper proposes is the private equity industry. The industry is not very popular in Romania where these sorts of investments had been made in general only in big companies and exceptional in SMEs. The need of capital of the SMEs can encounter the private equity fund and the paper will analyze this industry and its implication at economic level [Berger, 1998]. All the consideration empirical and theoretical will be made on European data since the national activity of the industry is not notable.
3. General considerations regarding private equity industry
The concept of private equity is developing over the past decade but the basic principle has remained constant: a group of investors buy out a company and sells it after its value increases [Wright, 1998]. Nevertheless the implications of the investor-portfolio company relationship became an essential element in defined the private equity concept. The investor is not a passive actor regarding the development and the evolution of his portfolio company. His involvement in the portfolio-company is very active and has extended itself at various levels inside the company: management, production, and human resources. The main purpose of the investor is to rise company value and this is a result of a very sustain effort of the investor. The potential of the portfolio-company is also playing an important role of this process, but the portfolio-company evaluation is the start element only, the raison that animate the investor to make the investment decision. The future evolution of the company depends less or more about the involvement of the investor which directly depends of the investment type. The nature of the investment type will be detailed in the section dedicated to this special topic.
3.1. Private equity investment typology and its implication at portfolio- company level
Private equity investments can be divided in two big categories venture investments and buyout investments. These two categories distinguish itself one from another through the capital flow process and the private equity fund implication in the portfolio-company activity.
MONICA BIOLAN, ILIE GAVRILA
124
3.1.1. Venture Capital
The capital flow in a venture capital transaction is a direct infusion of capital in the company which will be used for a precise objective of the company. There are two distinguish types of venture investments that correspond to the company stage development: early stage investments and expansion investments. The early stage investments can be a seed investment or a start-up investment. The seed investment is a financing provided to research, assess and develop an initial concept before a business has reached the start-up phase. The start-up investment is a financing provided to companies for product development and initial marketing. Companies may be in the process of being set up or may have been in business for a short time, but have not sold their product commercially. The implication of the private equity fund at this development level of the portfolio-company has a partnership nature. The portfolio-company is not owned by the private equity fund but it needs its implication and management experience. Regarding the expansion investment (later stage venture) which is a financing provided for development of a company, one may say it is a follow on of an early stage investment. The later stage capital investment may be used to: finance increased production capacity; market or product development; provide additional working capital. The private equity fund implication on this level may be less present because the portfolio-company is mature enough at this point to manage its development process. Even if we observe a certain pattern regarding the private equity implications at certain investments stage levels, there are no rules or requirements regarding these implications. Each investment has its particularities and presents new challenges for the private equity fund.
SMEs are in general the object of this kind of private equity investment.
3.1.2. Buyout Capital
A buyout is a transaction financed by a mix of debt and equity, in which a business, a business unit or a company is acquired with the help of a financial investor from the current shareholders. In this case the capital flow will be absorbed by the vendor and not the company itself. There are many types of buyout transactions: management buyout (MBO), management buyin (MBI), institutional buyout (IBO), leveraged buyout (LBO). The management buyout and the management buyin transaction are buyouts in which a management team acquires an existing product line or business from the vendor with the support of private equity investors. The differences between the two transactions reside in the fact that in the case of MBO the management team is from inside the portfolio-company. The MBI transaction is a buyout in which external managers take over the company. Financing is provided to enable a manager or group of managers from outside the target company to buy into the company with the support of private equity investors. The IBO transaction is a buyout made by outside financial investors (for example a private equity house) with a minimum of management implication. Alternatively, the investor may install its own management.
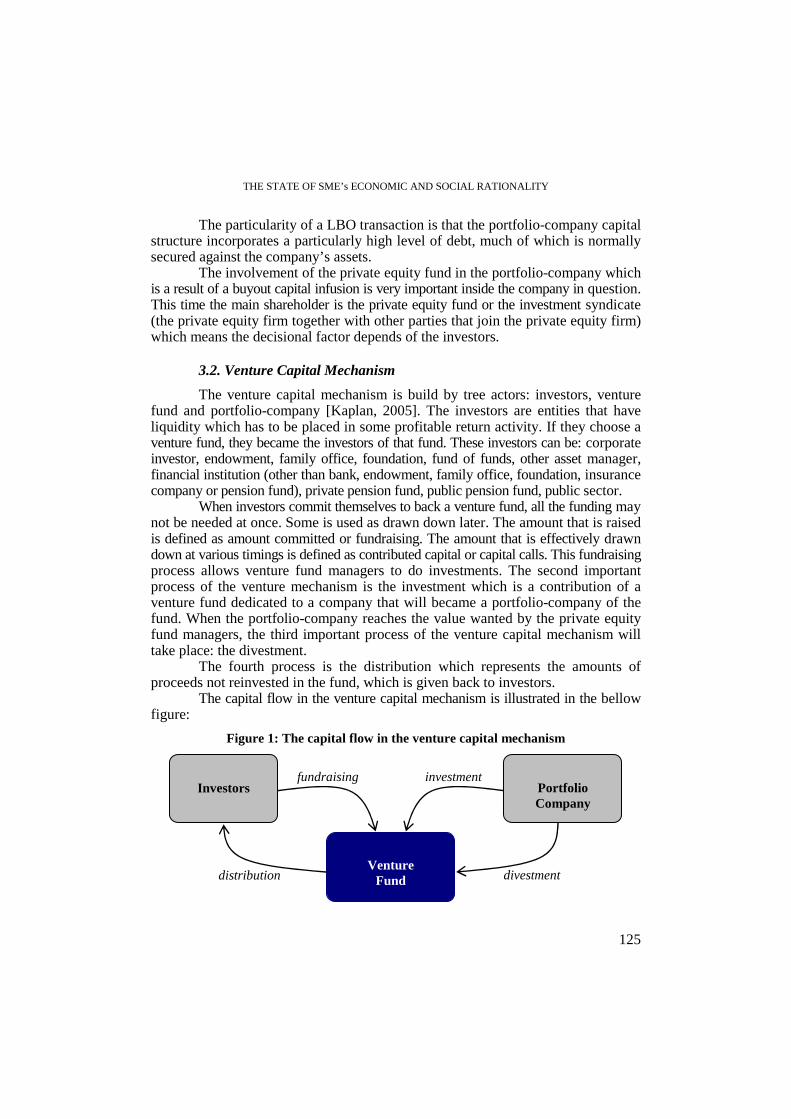
THE STATE OF SME’s ECONOMIC AND SOCIAL RATIONALITY
125
The particularity of a LBO transaction is that the portfolio-company capital structure incorporates a particularly high level of debt, much of which is normally secured against the company’s assets. The involvement of the private equity fund in the portfolio-company which is a result of a buyout capital infusion is very important inside the company in question. This time the main shareholder is the private equity fund or the investment syndicate (the private equity firm together with other parties that join the private equity firm) which means the decisional factor depends of the investors.
3.2. Venture Capital Mechanism
The venture capital mechanism is build by tree actors: investors, venture fund and portfolio-company [Kaplan, 2005]. The investors are entities that have liquidity which has to be placed in some profitable return activity. If they choose a venture fund, they became the investors of that fund. These investors can be: corporate investor, endowment, family office, foundation, fund of funds, other asset manager, financial institution (other than bank, endowment, family office, foundation, insurance company or pension fund), private pension fund, public pension fund, public sector. When investors commit themselves to back a venture fund, all the funding may not be needed at once. Some is used as drawn down later. The amount that is raised is defined as amount committed or fundraising. The amount that is effectively drawn down at various timings is defined as contributed capital or capital calls. This fundraising process allows venture fund managers to do investments. The second important process of the venture mechanism is the investment which is a contribution of a venture fund dedicated to a company that will became a portfolio-company of the fund. When the portfolio-company reaches the value wanted by the private equity fund managers, the third important process of the venture capital mechanism will take place: the divestment.
The fourth process is the distribution which represents the amounts of proceeds not reinvested in the fund, which is given back to investors.
The capital flow in the venture capital mechanism is illustrated in the bellow figure:
Figure 1: The capital flow in the venture capital mechanism
fundraising investment
divestment distribution
Venture
Fund
Portfolio Company
Investors

MONICA BIOLAN, ILIE GAVRILA
126
3.3. Economic impact of private equity industry
The involvement of private equity capital is a long-term support, which goes to those companies, which have at all times, the potential of success and sustainability. There are in Europe, a high number of very promising European companies with great technology and enthusiastic and capable management. Private equity is there for them, to help them build businesses and grow faster than they otherwise would. The influence of this capital infusion of the private equity fund in all activity sector has shown the need of the private equity funds now more then ever, when the liquidity represents a challenge for many companies in crisis time.
The private equity industry’s contribution to employment, growth and innovation in Europe has grown. The industry’s role in rejuvenating and restructuring existing companies, as well as its support in financing highpotential and often innovative enterprises [Becheikh, 2006] has become widely recognised. This has been reflected in several previous studies analysing the economic and social impact of private equity and venture capital at both European and national levels [AFIC 2004, BVCA 2004] Even if these studies are realised once at several years because of the time needed by the capital to create true sustainable value, the most resent study at European level show us the positive evolution of job creation by private equity industry.[EVCA, 2005]
Even if the industry is still young, its economic impact is notable, protecting and creating jobs, stimulating technology and being close to life sciences sector. The purpose of these funds is to guide the companies in their achievements regarding theirs development, growth trough strategically advising.
4. Conclusions
After a complete view of the SMEs economic reality which passes through the weight of turnover achieved by SMEs by activity of national economy or the weight of staff in SMEs in total staff by activity of national economy at level of CANE Section, we have been identified the importance of SMEs and their important need of capital. This paper has shown one of the capital resources that still are active on the investment market and its circulation doesn’t have to be conditioned by the borders. This is travelling capital that will implant itself when it will find potential of development. The private equity industry and its particular part of venture investments, represents the alternative of capital infusion, especially for SMEs that encounter difficulties regarding financing. The industry is not very notable in Romania, like in other European countries where the venture funds have a special treatment, like in France, the country that supports the funds that made investments in innovative business and SME having also a reduce tax payment.

THE STATE OF SME’s ECONOMIC AND SOCIAL RATIONALITY
127
These actions are the result of the positive impact of portfolio-companies SMEs. This influence is more important with the density of SMEs which represents a source of innovation and job creator, an important element in economic development. Willing to construct a viable economy, Romania has to reconsider many aspects of its vision regarding many economic aspects, one of them is SMEs, which has to be seen from different angles, not only the traditional ones.
REFERENCES
1. AFIC paper, 2004, Association Française des Investisseurs en Capital: “Le poids économique et social du capital investissement en France“;
2. BECHEIKH N., 2008, “Learning and novelty of innovation in established manufacturing SMEs “ , Technovation, Volume 28, Issue 7, Pages 450-463;
3. BERGER A.N., 1998, “The Economics of Small Business Finance: The Roles of Private Equity and Debt Markets in the Financial Growth Cycle”, Journal of Banking and Finance Volume 22;
4. BVCA paper, 2004, British Venture Capital Association, “The Economic Impact of Private Equity in the UK 2004”
5. DURING W., LAGERMAN B., 1998, “The risk of small and medium sized business and the development of industrial SME’s in the Reform State of Eastern and Central Europe”, SME’s Conference, Baden;
6. EVCA paper, 2005, European Private Equity and Venture Capital Association: “EVCA study of Employment contribution of Private Equity and Venture Capital in Europe”, Available from: <http://www.evca.eu/UploadedFiles/c2_evca_exec_employment_contribution_pe_2005_english.pdf>
7. GAVRILA, 2008, “Competente in mediu concurential”, Editura Economica;
8. KAPLAN, S.N., SCHOAR, A., 2005, “Private Equity Performance: Returns, Persistence, and Capital Flows”, The Journal of Finance 60 (4), 1791–1823;
9. MILLS,D.E. and SCHUMANN, L., 1985, “Industry Structure with Fluctuating Demand”, American Economic Review, 75 pp. 758-767;
10. NICOLESCU, 2002, “Managementul intreprinderilor mici si mijlocii”, Editura Economica;
11. PAPILLON Jean-Paul, 2003, “La tailles des enterprises, atouts et handicaps”, dans Economie et Société, Serie Economie de l’entreprise, nr.13;
12. WRIGHT,M., ROBBIE, K.,1998, “Venture Capital and Private Equity: A Review and Synthesis” , Journal of Business Finance & Accounting 25 (5&6), 521–570.

STUDIA UNIVERSITATIS BABEŞ-BOLYAI, NEGOTIA, LV, 1, 2010
THE BORN GLOBAL MODEL FOR ROMANIAN SMALL AND MEDIUM ENTERPRISES INTERNATIONALIZATION
ANCA MARIA STĂNCULESCU1, LILIANA GRIGORE2, ANDREEA MIHAELA GAGEA3, BOGDAN GEORGESCU4
ABSTRACT. The article analyses the possibilities for Romanian small and medium enterprises to internationalize as Born Globals. Small and medium enterprises in European economies and all over the world are more and more exposed to global pressures induced by globalization and market integration processes, which amplifies the need to be competitive and confront international markets through internationalization. Small and medium enterprises internationalization is an amplifying phenomenon, which has been the topic of wide spread research efforts in the last decades. The most recent trend in this field is the Born Global model, which points out to small and medium enterprises that show very rapid and intensive international growth right from or close to inception.
In order to investigate the small and medium enterprises internationalization possibilities as Born Globals, several major underlying factors of the emergence of Born Globals are considered, representing both internal and external push and pull forces to internationalization. The applicability of the Born Global model of internationalization for Romanian small and medium enterprises is outlined by the examination of each factor’s triggering role in the current Romanian context. Based on this analysis, consequent policy recommendations for stimulating the Romanian small and medium enterprises internationalization as Born Globals are proposed.
Key words: Born Global, Internationalization, Internationalization Policy, Small and Medium Enterprises
JEL Classification: F23
1. Introduction
In recent years there has been growing interest among European and world-wide researchers in the subject of small and medium enterprises internationalization, as there is large recognition for the new amplified role they have aquired in a national 1 PhD. Researcher, Academy of Economic Studies, Bucharest, Faculty of International Business and
Economics, [email protected] 2 PhD. Associate Professor., Academy of Economic Studies, Bucharest, Faculty of International Business
and Economics, [email protected] 3 PhD. Researcher, Academy of Economic Studies, Bucharest, Faculty of Economic Cybernetics,
Statistics and Informatics, [email protected] 4 PhD. Assistent, Academy of Economic Studies, Bucharest, Faculty of Marketing,

ANCA MARIA STĂNCULESCU, LILIANA GRIGORE, ANDREEA MIHAELA GAGEA, BOGDAN GEORGESCU
130
and international context, as a basis of the economic development, which can be explained mainly by the changes in the economy at the beginning of the XXIst century. The evolution to a knowledge-based economy, with all its implications, implies new oportunities and motivations for the small and medium enterprises internationalization in the European Union and world-wide.
The amplification of small and medium enterprises internationalization has challenged the existing theories on firms’ mechanisms of internationalization, as these cannot totally explain their behaviour or cannot satisfactorily predict their evolution. Well-known traditional theories on the internationalization process include: product’s life cycle theory, stage theories, transaction costs theory, John Dunning’s eclectic paradigm, the network approach, etc. Last decade research points out that some firms, especially small and medium enterprises, show very rapid and intensive international growth right from their birth or after a very short time, a phenomenon which cannot be totally explained by traditional theories. Consequently, a new set of theories trying to explain the internationalization process and centered on small and medium enterprises has been developed – the Born Global model of internationalization - and currently is in a consolidation stage.
2. The Born Global model of internationalization
Beginning especially with the 1990’s, it has been noted that some companies no longer follow a gradual, following several stages; they begin to have international activities right from or close to inception, they internationalise on markets at large geographical and psychological distances, penetrate several countries simultaneously, form strategic alliances and joint ventures without the benefit of previous experience, etc. Accordingly, a new approach has been developed, trying to explain such mechanisms of internationalization, currently in process of consolidation. This approach assigned concepts such as "Born Globals", "Born Internationals," or "International New Ventures".
The Born Global model has certainly revived researchers’ interest on the phenomenon of internationalization, particularly in relation to the study of entrepreneurship. However, most studies so far have been mostly focused on the description of new types of companies or have tried to evaluat the extent and economic impact of this phenomenon. Some studies and explores the implications of the internationalization theory.
In the field of entrepreneurship, Born Global phenomenon has challenged the traditional predominantly national orientation, and international entrepreneurship actually has its origins in the studies of this phenomenon. The Born Global enterprises have been identified as new forms of organizations, which requires an adaptation and revaluation of the assigned theories in the international business literature5.
5 Mitja Ruzzier, Robert D. Hisrich, Bostjan Antoncic (2006) SME internationalization research: past,
present, and future, in Journal of Small Business and Enterprise Development, vol. 13, nr. 4, p. 134.

THE BORN GLOBAL MODEL FOR ROMANIAN SMALL AND MEDIUM ENTERPRISES …
131
The phenomenon and its implications has not been in any case sufficiently explored, still providing further field for research. If the interest and attention in this area is indisputable, many issues, even fundamental, remain insufficiently explored, one of them being related to the strategies adopted by these firms, underlying factors, content, factors of influence, etc. A large part of their studies, particularly among the first ones, have primarily focused on explaining the emergence of such firms, while aspects such as their strategies being mostly considered as given. Currently, the interest tends to move in this direction6.
The conceptualization of the phenomenon has received many forms in the literature, synthesized as shown in the table below, but remained devoted to the term Born Global.
Table 1. The Born Global conceptualization in literature
AAuutthhoorrss BBaacckkggrroouunndd CCoonncclluussiioonnss // rreessuullttss
HHeeddlluunndd,, KKvveerrnneellaanndd ((11998855))
« Leapfrogging » - Firms that jump over stages in the traditional models - More and more homogeneous export-markets - Internationalisation as a part of the firm’s strategy
GGaannii ttsskkyy ((11998899)) « Innate exporters »
- Adaptation to a high degree of the firm’s strategy to the foreign markets - Lack of resources and/or experience
JJooll llyy ((11999922)) « High Technology Start-Ups »
- Global niche markets pointed from the start - Founder with an international experience
MMccKKiinnsseeyy ((11999933)) « Born Global » - Intensive export within the first years after foundation
- Most sales obtained from exports
CCaavvuussggii ll ((11999944)) « Born Global » (Interpretation of McKinsey, 1993)
- Small is beautiful - Gradual internationalisation is dead
OOvviiaatttt,, MMccDDoouuggaall ll ((11999944))
« International New Ventures »
- A strategy from the birth directed towards the international markets - The stage models are not usable any longer
JJoonneess ((11999999))
« International Entrepreneurs »
- Internationalization of the firms often starts with networks, which does not have anything to do with sales - Many different roads to the internationalization of these firms
Source: Erik S. Rasmussen, Tage Koed Madsen (2002) The Born Global Concept, Proceedings of the 28th Annual conference of European International Business Academy (EIBA), Athens, 8 – 10 December, p. 13.
6 Arild Aspelund, Tage Koed Madsen, Øystein Moen (2007) A review of the foundation, international
marketing strategies, and performance of international new ventures, in European Journal of Marketing, vol. 41, nr. 11/12, p. 1423 – 1448.

ANCA MARIA STĂNCULESCU, LILIANA GRIGORE, ANDREEA MIHAELA GAGEA, BOGDAN GEORGESCU
132
Among the factors which determine the development of Born Global enterprises may be mentioned7:
- The growing importance of niche markets - Increasing demands of consumers in developed economies, as a significant trend of the beginning of the third millennium, has determined an increasing demand for customized products and services. In the context of globalization of markets and increased competition from large multinational firms, many SMEs may specialize on products and services that cover a narrow niche market at a global level.
- Progress in production processes and technologies - advanced technology and production processes allow for economic small scale production and, moreover, easy realization of complex non-standard parts and components. Small and medium enterprises are thus given the possibility to compete with large firms in the production and marketing of sophisticated, globally competitive products. This leads to increased specialization in most sectors of activity, as products and services are tailored to meet increasingly diversified consumers’ preferences.
- The flexibility of small and medium enterprises - The advantages of small and medium - low reaction time, flexibility, adaptability – allow for an increased capacity to rise to the requirements of preferences and standards at an international level.
- Global networks - trade relations at an international and global level are increasingly facilitated through partnerships abroad, with distributors, trading houses, subcontractors, traditional buyers and sellers. Succeeding in international business may considerably depend on the participation in mutually beneficial long-term alliances with foreign partners.
- Progress in information technology - recent amplifying advances in information technology and communication have accelerated the speed of information flows. The era of the large firms with high organizational structures and slow, expensive information flows is ended. Increased access to the Internet and other technologies and means of telecommunications such as Electronic Data Interchange - EDI, allows, for small and medium enterprises as well, the ease of conducting business across national borders. Globalization of technology, through international research and development platforms, international transfers of technology, study abroad, allow for small and medium enterprises’ easier access to new, of date approaches to production, innovation, methods and techniques.
3. Definitions for the Born Global enterprises
Many definitions for the Born Global enterprises have been proposed in the literature. If there is a consensus in principle on the nature of the phenomenon, namely, enterprises which internationalize their activities right from their establishment or shortly
7 Svend Hollensen (2007) Global marketing, Pearson Education, Prentice Hall, Upper Saddle River,
New Jersey, p. 80.

THE BORN GLOBAL MODEL FOR ROMANIAN SMALL AND MEDIUM ENTERPRISES …
133
after, in order to distinguish the Born Global model of internationalization it is necessary to establish some quantitative demarcations refering to the period of time from the establishment until the beginning of internationalization, and the internationalization scale, usually commensurated as the percentage of sales abroad in total sales.
Table 2. summarizes some definitions according to studies from different countries and continents. Many of the first studies which aimed to highlight the Born Global phenomenon reflect the American perspective, taking roots in the U.S., which represents a large market with a relatively low export rate, and thus many of the first definitions specify a percentage of sales abroad of 25%, in a period of 2 or 3 years from the establishment – e.g.: Knight, Cavusgil (1996). This definition has been largely adopted and features in an appreciable extent in the literature. From the European perspective, the thresholds in this definition are not considered sufficient8, because almost any new enterprise in a smaller country offering a specialized product to a niche market can meet these criteria, and especially in the European single market; in this respect there have been proposed higher thresholds and / or the market of reference outside the continent of origin – e.g. Luostarinen, Gabrielsson (2006); Servais, Madsen, Rasmussen
Table 2. Quantitative definitions of Born Global enterprises
DDiimmeennssiioonn// aauutthhoorr
VViissiioonn TTiimmee bbeeffoorree ssttaarrttiinngg eexxppoorrtt
EExxppoorrtt vveerrssuuss gglloobbaall ggrroowwtthh//aaggee
OOvviiaatttt,, MMccDDoouuggaallll ((11999944))
A business organization that, from inception, seeks to derive significant competitive advantage from the use of resources and the sale of outputs in multiple countries.
- -
MMccKKiinnsseeyy ((11999933)),, RReennnniiee ((11999933))
Management views the world as their market place from the outset.
Began exporting, on average, only 2 years after foundation.
Achieved 76% of their total sales through exports at an average age of 14 years.
KKnniigghhtt,, CCaavvuussggiill ((11999966))
Management views the world as its marketplace from the outset.
Begin exporting one or several products within 2 years of establishment.
Tend to export at least a quarter of total production.
CChheettttyy,, CCaammppbbeellll--HHuunntt ((22000044))
- Within 2 years of inception.
80% of sales outside New Zealand; markets are worldwide.
LLuuoossttaarriinneenn,, GGaabbrriieellssssoonn ((22000066))
Global vision and/or at a global growth path.
Entered global markets at the outset.
Make over 50% of their sales outside home continent. Established after 1985.
SSeerrvvaaiiss,, MMaaddsseenn,, RRaassmmuusssseenn ((22000077))
- Within 3 years of establishment.
More than 25% of foreign sales or sourcing outside home continent.
Source: Mika Gabrielsson, V.H. Manek Kirpalani, Pavlos Dimitratos, Carl Arthur Solberg, Antonella Zucchella (2008) Born globals: Propositions to help advance the theory, in International Business Review, vol. 17, nr. 4, p. 387.
8 Per Servais, Tage Koed Madsen, Erik S. Rasmussen (2007) Small manufacturing firms’ involvement
in international e-business activities, in Advances in International Marketing, vol. 17, p. 297 – 317.

ANCA MARIA STĂNCULESCU, LILIANA GRIGORE, ANDREEA MIHAELA GAGEA, BOGDAN GEORGESCU
134
(2007). Studies originating in Australia and New Zealand, which have highlighted for the first time the phenomenon in the literature, and have provided numerous studies and analyses, markets with a large international openess, proposed even higher thresholds – e.g.: McKinsey (1993) Rennie (1993); Chetty, Campbell-Hunt (2004).
We can notice at a first view the high diversity of the approaches, with high differences between the quantitative elements of the definitions. Beyond its utility for isolating the Born Global enterprises in order to highlight them as a distinct phenomena, one can say that the attempt to define the Born Global phenomenon by quantitative criteria, and, moreover, the attempt to establish a uniform quantitative definition is not recommended and even irrelevant. There are a variety of elements that make their imprint on the Born Global-type internationalization and thus, it may not be framed within quantitative criteria; it should be understood as a vision, as a model, as an internationalization strategy. The share of the international activities of firms, as well as the geographical area of these activities, will always be influenced by the size of the home country and its economy, the markets neighboring the country of origin and other factors, such as the nature of activity. Then, there are numerous small and medium enterprises which "revolve" around large multinationals, for example arising from the general trend of outsourcing of activities, that meet the quantitative criteria and can be considered Born Globals, but they are not independent and do not face the risks normally associated with business start-ups.
4. The Born Global model analysis framework
As argumented before, the characterization of Born Global enterprises should be based on qualitative demarcations in order to capture the essence of the phenomenon, and in this respect, as a synthesis of the approaches that extensively deal with the theme in the literature, we propose a model of analysis as shown by Figure 1., which emphasizes the major underlying factors of the emergence of Born Globals, representing both internal and external push and pull forces to internationalization:
1. Entrepreneur’s experience, characteristics and network: the importance of entrepreneur on small and medium enterprises behaviour has been widely analyzed in literature, and there is wide consensus on the correlation between the international development and the entrepreneur’s attitude, motivation, experience and network related to internationalization. Entrepreneur’s experience, characteristics and network are important resources for a firm and at the same time, motives or factors that facilitate internationalization9. International experience can be defined as the understanding and realistic perception of foreign operations, risks and benefits of internationalization10.
9 Svante Andersson (2006) Entrepreneurs’ Influence on Firms’ International Behaviour, in Riad A.
Ajami, Marca Marie Bear, The global enterprise: entrepreneurship and value creation, Haworth Press, p. 109 – 136.
10 Masaaki Kotabe, Preet S. Aulakh (2002) Emerging issues in international business research, Edward Elgar Publishing, Cheltenham, p. 184.

THE BORN GLOBAL MODEL FOR ROMANIAN SMALL AND MEDIUM ENTERPRISES …
135
Figure 1. Model of qualitative analysis of Born Global enterprises
It is recognized that the factors related to managers’ skills, international orientation and vision shall constitute key factors of internationalization. Concerning the entrepreneur’s skills in the context of internationalization, it was proposed to distinguish between entrepreneurs’s technical, marketing, and structural orientation11, being suggested that entrepreneurs with predominant marketing orientation are most proactive in terms of internationalization, while entrepreneurs with technical and structural orientation focus more on technological and organizational aspects, and are less active related to internationalization. International entrepreneur orientation significantly influences the formation of networks on foreign markets, considered essential to the development of a Born Global12, which further influences the direction of international expansion
11 Svante Andersson (2006), op. cit., p. 109. 12 Susan Freeman, Ron Edwards, Bill Schroder (2006) How Smaller Born-Global Firms Use Networks and
Alliances to Overcome Constraints to Rapid Internationalization, in Journal of International Marketing, vol. 14, nr. 3, p. 33 – 63.
NNaattuurree ooff iinndduussttrryy // sseeccttoorr ooff aaccttiivvii ttyy
PPrroodduucctt
cchhaarraacctteerriissttiiccss
IInntteerrnnaattiioonnaall iizzaattiioonn
ssccaallee
EEnnttrreepprreenneeuurr’’ ss eexxppeerriieennccee,,
cchhaarraacctteerriissttiiccss aanndd nneettwwoorrkk
BBoorrnn GGlloobbaall

ANCA MARIA STĂNCULESCU, LILIANA GRIGORE, ANDREEA MIHAELA GAGEA, BOGDAN GEORGESCU
136
and the internationalization strategy. The literature devoted to the Born Global phenomenon recognizes from the very first studies the importance of entrepreneur for the Born Global internationalization model, stressing that the overall vision at the firm’s establishment is probably the most important characteristic associated to the phenomenon13. For the Born Global-type entrepreneurs, the rapid internationalization of business is the entreprenorial element which gives them the status of entrepreneurs.
2. Nature of industry / sector of activity: It is generally acknowledged in
the literature that the nature of industry or sector of activity constitutes a determinant of the entrepreneurial and Born Global phenomenon, concerning both their triggering and subsequent behavior14. Increasing globalization in many industries or sectors of activity as a determinant of firms’ internationalization practically meets consensus in literature, in that the trend of integration of markets and competition contributes to simplifying and reducing the duration of firms’ internationalization. The influence of the technological intensity of the industry on internationalization is that firms in high technology sectors may be required to internationalize wear faster due to rapid technologies’ moral hazard and high imitation risk. Two flows of opinions have been outlined in the literature concerning the types of industries where the Born Global phenomenon arises: on the one hand, most researchers consider that the Born Global enterprises can be found in sectors of high technology and high degree of globalization, and on the other hand, it has been argued that Born Global enterprises may be also incurred in traditional sectors, especially in small economies, highly open outwards15. Industry structure may also favor the Born Global-type internationalization especially if it is characterized by: the positioning in a growth stage, medium level of concentration, knowledge intensiveness, a high degree of internationalization at the local level, strong integration at a global level, capital attractiveness16. Then, distinguishing between the services and the production sectors, services’ characteristics – intangibility, heterogeneity, simultaneity of production and consumption, perishability, appropriateness impossibility - determine increased risks in the internationalization of firms in the services sectors, and issues related to human resources, quality and control increase the costs and requirements of internationalization. In this respect, as shown by empirical research, the Born Global model of internationalization will be mostly found in the production sector17.
13 Benjamin M. Oviatt, Patricia Phillips McDougall (1994), Toward a theory of international new
ventures, in Journal of International Business Studies, vol. 25, nr. 1, p. 45 – 64. 14 Stephanie A. Fernhaber, Patricia P. McDougall, Benjamin M. Oviatt (2007) Exploring the Role of
Industry Structure in New Venture Internationalization, in Entrepreneurship Theory and Practice, vol. 31, nr. 4, p. 517 – 542.
15 John Knight, Jim Bell, Rod McNaughton (2001) “Born Globals”: Old Wine in New Bottles?, ANZMAC – Conference of the Australian & New Zealand Marketing Academy, Auckland, NZ.
16 Stephanie A. Fernhaber, Patricia P. McDougall, Benjamin M. Oviatt (2007), op. cit., p. 517 – 542. 17 Anders Blomstermo, Dharma Deo Sharma (2003) op. cit., p. 261.

THE BORN GLOBAL MODEL FOR ROMANIAN SMALL AND MEDIUM ENTERPRISES …
137
3. Product characteristics: The characteristics of the product which makes the offer of Born Global-type enterprises are closely related to the globalization of industry. It has been argued that the product strategy of globalizing small and medium enterprises is based on the development of innovative products in response to certain changes in the industry or sector of activity at a global level. The development of a unique product, which incorporates a source of significant competitive advantage, the identification and filling of a global niche market, are frequently associated with the development of Born Global-type enterprises. The increasing speed of new technologies development has led to reducing products’ life cycle and increasing innovation intensity, which further led to increased competition globally. Reducing products’ life cycle imposes the need to amplify the efforts on research and development, with increased consequent costs; at the same time, the reduced products’ life cycle involves a reduction of the investment recovery duration. Consequently, it can be argued that especially in the case of small and medium enterprises operating on small, local markets, a high volume of sales at global level is required, in order to divide costs and increase profitability. Also, reduction of the products’ life cycle requires innovation in order to launch new versions of products to offset the decline of the previous, therefore, small and medium enterprises are called upon to use their featured innovative potential.
4. Internationalization scale: From a qualitative point of view, internationalization scale may be analyzed through two key elements of the internationalization strategy: foreign market selection and methods of operation determination18. Regarding foreign markets selection, Born Global-type enterprises start their international activities on several markets simultaneously or after short periods of time, and not necessarily on the closed markets. Internationalization and growth strategies on foreign markets of Born Global-type enterprises involve more direct and faster operation methods as compared to those proposed by traditional theories concerning internationalization as a slow, gradual process. Avoiding quantitative demarcations, such as the time from establishment until the onset of internationalization or the share of sales abroad in total sales, seeks to surprise the substance of Born Global-type enterprises, which is the approach they adopt with regard to internationalization; internationalization scale can be thus regarded as a specific mechanism of internationalization and subsequent strategy.
5. The Born Global model for Romanian small and medium enterprises
The applicability of the Born Global model of internationalization for Romanian small and medium enterprises is outlined by the examination of each factor’s triggering role in the current Romanian context, according to the general framework of qualitative analysis presented before.
18 Thomas Borghoff (2005) Evolutionary Theory of the Globalisation of Firms, Gabler Verlag, Wiesbaden,
p. 66.

ANCA MARIA STĂNCULESCU, LILIANA GRIGORE, ANDREEA MIHAELA GAGEA, BOGDAN GEORGESCU
138
It should be mentioned, however, that Romanian small and medium enterprises internationalization issues are currently only tangentially approached, by both researchers and policy makers, and until present there are no studies regarding the internationalization status of Romanian small and medium enterprises. Consequently, it is difficult to appreciate an estimative level concerning Romanian entrepreneurs’ international experience, characteristics and networks. An international orientation by strategic decision makers is seen as a necessary, though not sufficient, condition for small and medium enterprises even beginning to respond positively to governmental initiatives seeking to foster a greater degree of international activity. Only after the willingness of strategic decision makers is established in terms of international orientation can attention move towards the second and subsequent phases of policy, namely the provision of functionally directed business support services. In this respect, the importance of entrepreneurship education, which should also include international entrepreneurship, becomes obvious.
The Romanian Government introduced entrepreneurship education in its “Strategy for the development of human resources, increase of employment and fight of social exclusion”, as part of the “National Development Plan for 2007-2013”19. In this document, it is recognized that education has a significant contribution in fostering entrepreneurial skills and attitudes in the Romanian society. Overall, it can be stated that there is an impressive development of initiatives and a large variety of curricular and extra-curricular activities, which allow for an increased number of good practices in Romanian universities aiming at the entrepreneurship education. Still, for higher education, an integrated approach is necessary at the university level, as well as a clear policy support from the Ministry of Education, in a way to allow upgrading the role and value of entrepreneurship education.
In what concerns the nature of industry or sector of activity as a triggering factor for the Born Global internationalization model, several aspects should be noted related to the Romanian economy. Increasing globalisation is an undisputable trend that has also affected our country’s economy; moreover, the adhesion to the European Union and The Single European Market has provided major opportunities – but also risks, like that of a more intense competition – for Romanian small and medium enterprises internationalization. At the same time, technological intensity is relatively low among Romanian industries and industries’ structures generally do not favor a Born Global-type internationalization. Romania owns comparative advantages as compared to the European Union mostly for traditional industries, like in the production of clothing, whose sustainability is questionable. It is unquestionable, however, the rise of some high technology sectors, especially in the IT industry.
A potential advantage that Romania owns for the adoption of the Born Global-type internationalization among Romanian small and medium sized enterprises is the innovative spirit, the ability to develop innovative products that may fill global
19 Romanian Government (2005) Planul NaŃional de dezvoltare 2007-2013, Bucharest, Chapter II.

THE BORN GLOBAL MODEL FOR ROMANIAN SMALL AND MEDIUM ENTERPRISES …
139
niche markets. This can be illustrated by the international recognition received at various events in this respect, like for example The International Exhibition of Inventions of Geneva, where Romania has constantly obtained numerous medals and prizes.
Lastly, concerning the internationalization scale, the stimulation of small and medium enterprises internationalization is required, by more direct and faster operation methods, like the Internet, direct export, etc, and on several foreign markets simultaneously or after short periods of time, and not necessarily on the closed markets in terms of physical or psychological distance. However, this implies clear and strong policy incentives, firstly oriented to the more generic issue of small and medium enterprises internationalization. There is a large variety of policy incentives that can be adopted, supporting small and medium enterprises internationalization in general, and also an internationalization according to the Born Global model, among which we can mention: the identification of the barriers that impede or restrain the internationalisation of SMEs and the drivers that move companies to internationalise, a set of policies adressing the identified barriers and drivers, a fluid, integrative and consultative process between all the stakeholders (Government, support agencies and SMEs) at a sectoral, local and regional level, ensuring access to the knowledge necessary for internationalization according to the Born Global model.
6. Conclusions
The Born Global model of internationalization is an incontestable reality as applied by small and medium enterprises from around the world, beginning with the last decade, and has determined the development of a new set of theories trying to explain the internationalization process and centered on small and medium enterprises, that challenge the traditional ones, though still providing further field for scientific research.
Consensus regarding the conceptualization or definition of the phenomenon has not been reached. Most studies have proposed quantitative demarcations, refering especially to the period of time from the establishment until the beginning of internationalization, and the internationalization scale. There is a high diversity of the approaches, with high differences between the quantitative elements of the definitions. We have argued such an attempt to establish a uniform quantitative definition is not recommended and even irrelevant, since the Born Global model of internationalization cannot be framed within quantitative criteria and should be understood as a vision, as a model, as an internationalization strategy. Consequently, we have proposed a set of qualitative demarcations in order to capture the essence of the phenomenon, emphasizing the major underlying factors of the emergence of Born Globals, which includes: entrepreneur’s experience, characteristics and network, nature of industry / sector of activity, product characteristics and internationalization scale.

ANCA MARIA STĂNCULESCU, LILIANA GRIGORE, ANDREEA MIHAELA GAGEA, BOGDAN GEORGESCU
140
According to this framework, we have examined the possibilities for for Romanian small and medium enterprises to internationalize as Born Globals, by examining each factor’s triggering role in the current Romanian context. We can conclude that Romania holds a potential for applying this model of internationalization, but there is strong need for clear and strong policy incentives for stimulating small and medium enterprises internationalization. Unfortunately, Romanian small and medium enterprises internationalization issues are currently only tangentially approached, by both researchers and policy makers.
REFERENCES 1. AJAMI Riad A., COOL Karel, GODDARD G. Jason, KHAMBATA Dara (2006)
International Business: Theory and Practice, 2nd Edition, M.E. Sharpe, London.
2. ASPELUND Arild, MADSEN Tage Koed, MOEN Øystein, A review of the foundation, international marketing strategies, and performance of international new ventures, in European Journal of Marketing, vol. 41, nr. 11/12.
3. BLOMSTERMO Anders, SHARMA Dharma Deo (2003) Learning in the Internationalisation Process of Firms, Edward Elgar Publishing, Cheltenham.
4. BORGHOFF Thomas (2005) Evolutionary Theory of the Globalisation of Firms, Gabler Verlag, Wiesbaden.
5. CHETTY Sylvie, CAMPBELL–HUNT Colin (2004) A strategic approach to internationalization: A traditional versus a “Born-Global” approach, in Journal of International Marketing, vol. 12, nr. 1.
6. CHRISTOFOR Julia (2008) Antecedents of Venture Firms’ Internationalization: A Conjoint Analysis of International Entrepreneurship in the Net Economy, Gabler, Wiesbaden.
7. FERNHABER Stephanie A., MCDOUGALL Patricia P., OVIATT Benjamin M. (2007) Exploring the Role of Industry Structure in New Venture Internationalization, in Entrepreneurship Theory and Practice, vol. 31, nr. 4.
8. FREEMAN Susan, REID Imogen (2006) Constraints facing small western firms in transitional markets, in European Business Review, vol. 18, nr. 3.
9. GABRIELSSON Mika, KIRPALANI V.H. Manek, DIMITRATOS Pavlos, SOLBERG Carl Arthur, ZUCCHELLA Antonella (2008) Born globals: Propositions to help advance the theory, in International Business Review, vol. 17, nr. 4.
10. GAGEA Andreea Mihaela, GRIGORE. Liliana, STĂNCULESCU Anca Maria, GEORGESCU Bogdan (2009) The comparative advantage in Romania`s intra-communitary commercial relation”, 5th International Economic Conference “European Integration - New Challenges for the Romanian Economy”, Oradea.
11. GAGEA Andreea Mihaela, STĂNCULESCU Anca Maria, NICULAE Sabin (2009) Methods of assessment of diversification and concentration on types of products on the foreign trade of Romania with the European Union, in 16th International Economic Conference “Industrial Revolutions, from the globalization and post-globalization perspective” Volume, Lucian Blaga University Publishing House, Sibiu.

THE BORN GLOBAL MODEL FOR ROMANIAN SMALL AND MEDIUM ENTERPRISES …
141
12. GASSMANN Oliver, KEUPP Marcus Matthias (2007) The competitive advantage of early and rapidly internationalising SMEs in the biotechnology industry: A knowledge-based view, in Journal of World Business, vol. 42, nr. 3.
13. GLEASON Kimberly C., WIGGENHORN Joan (2007) Born globals, the choice of globalization strategy, and the market’s perception of performance, in Journal of World Business, vol. 42, nr. 3.
14. HOLLENSEN Svend (2007) Global marketing, Pearson Education, Prentice Hall, Upper Saddle River, New Jersey.
15. JANTUNEN Ari, NUMMELA Niina, PUUMALAINEN Kaisu, Saarenketo Sami (2008) Strategic orientations of born globals—Do they really matter?, in Journal of World Business, vol. 43, nr. 2.
16. JONES Marian, DIMITRATOS Pavlos (2004) Emerging paradigms in international entrepreneurship, Edward Elgar Publishing, Cheltenham.
17. KNIGHT John, BELL Jim, MCNAUGHTON Rod (2001) “Born Globals”: Old Wine in New Bottles?, ANZMAC – Conference of the Australian & New Zealand Marketing Academy, Auckland, NZ.
18. LOANE Sharon, BELL Jim D., MCNAUGHTON Rob B. (2007) A cross-national study on the impact of management teams on the rapid internationalization of small firms, in Journal of World Business, vol. 42, nr. 4.
19. MCDOUGALL Patricia Phillips, SHANE Scott, OVIATT Benjamin M. (1994) Explaining the formation of international new ventures: The limits of theories from international business research, in Journal of Business Venturing, vol. 9, nr. 6.
20. MITGWE Bruce (2006) Theoretical Milestones in International Business: The Journey to International Entrepreneurship Theory, in Journal of International Entrepreneurship, vol. 4, nr. 1.
21. MORT Gillian Sullivan, WEERAWARDENA Jay (2006) Networking capability and international entrepreneurship: How networks function in Australian born global firms, in International Marketing Review, vol. 23, nr. 5.
22. OVIATT Benjamin M., MCDOUGALL Patricia P. (1994), Toward a theory of international new ventures, in Journal of International Business Studies, vol. 25, nr. 1.
23. OVIATT Benjamin M., MCDOUGALL Patricia P. (2005) Defining International Entrepreneurship and Modeling the Speed of Internationalization, in Entrepreneurship Theory & Practice, vol. 29, nr. 5.
24. ØYSTEIN Moen (2002) The born globals: a new generation of small European exporters, in International Marketing Review, vol. 19, nr. 2.
25. RASMUSSEN Erik S., MADSEN Tage Koed (2002) The Born Global Concept, Proceedings of the 28th Annual conference of European International Business Academy (EIBA), Athens, 8–10 December.
26. RUZZIER Mitja, HISRICH Robert D., ANTONCIC Bostjan (2006) SME internationalization research: past, present, and future, in Journal of Small Business and Enterprise Development, vol. 13, nr. 4.

ANCA MARIA STĂNCULESCU, LILIANA GRIGORE, ANDREEA MIHAELA GAGEA, BOGDAN GEORGESCU
142
27. SHARMA D. Deo, BLOMSTERMO Anders (2003) The internationalization process of Born Globals: a network view, in International Business Review, vol. 12, nr. 6.
28. WEERAWARDENA Jay, MORT Gillian Sullivan, LIESCH Peter W., KNIGHT Gary (2007) Conceptualizing accelerated internationalization in the born global firm: A dynamic capabilities perspective, in Journal of World Business, vol. 42, nr. 3.
29. WINCH Graham W., BIANCHI Carmine (2006) Drivers and dynamic processes for SMEs going global, in Journal of Small Business and Enterprise Development, vol. 13, nr. 1.
30. ZHANG Marina Y., DODGSON Mark (2007) ‘‘A roasted duck can still fly away’’: A case study of technology, nationality, culture and the rapid and early internationalization of the firm, in Journal of World Business, vol. 42, nr. 3.
31. *** ROMANIAN GOVERNMENT (2005) Planul NaŃional de dezvoltare 2007-2013, Bucharest, Chapter II.

STUDIA UNIVERSITATIS BABEŞ-BOLYAI, NEGOTIA, LV, 1, 2010
PLUSES AND MINUSES OF BEING IN A GLOBAL VALUE CHAIN – THE CASE OF ROMANIAN APPAREL SMEs
ALINA FLORENTINA AVRIGEANU 1, FLAVIA GABRIELA ANGHEL 2, ELENA RADU 3
ABSTRACT. In order to survive in the face of continuing global competition, in the long run, developing countries SMEs will have to be inserted into global value chains (GVCs). For the Romanian apparel SMEs, the insertion in a GVC is having far-reaching effects on competitiveness, cross-national transfer of new technology, innovation, skills, knowledge and learning, and potentially offers greater opportunities for reaching welfare gains. But it also brings the challenge of being locked into a race to the bottom, “the low road” of competitiveness, based on cutting wages, disregarding labour and environment regulations and avoiding taxation. In this paper we examine the pluses and the minuses of being in the GVC for the Romanian apparel SMEs in order to point up several strategies needed for the “high road” of competitiveness, based on the use of new technologies, efficiency in production and trade, diversified products of better quality. Thus SMEs from the Romanian apparel industry will be able to support higher wages and enhance the national income.
Key words: SMEs, GVC, competitiveness, apparel industry
JEL classification: L25, F23
I. Introduction
Nowadays, the technological advancements and trade and investment liberalization increasingly make fragmenting of activities in all stages of a production value chain possible. Some of these segmented activities can be performed in various locations across the globe and reintegrated again through production systems of global value chains (GVCs) and global production networks (GPNs).
The clothing industry is a traditional sector of the Romanian manufacturing industry, which played a key role in our country’s industrialization and development According to Romanian Statistical Yearbook, over 95% of Romanian apparel producers are SMEs.
It is very difficult, even for larger enterprises, let alone SMEs, to stay competitive over time, as domestic economic and global product-market conditions change. Therefore, these companies are likely to suffer to a greater extent the economic
1 Romanian – American University, [email protected] 2 Romanian – American University, e-mail: [email protected] 3 Romanian – American University, e-mail: [email protected]

ALINA FLORENTINA AVRIGEANU, FLAVIA GABRIELA ANGHEL, ELENA RADU
144
recession shock and will have to put in more efforts to stand its ground after 2009. In this context, Romanian apparel SMEs need, more than ever, to insert successfully into global value chains.
II. Material and methods
To realize this paper we used information from the literature on global value chains. In order to a closely identification for some problems and the specific ways to solve those it is been used exploratory research. To obtain information about situation already existing on the market it is been used descriptive research.
III. Results and Discussion
III.1. The global value chain framework of analysis
The value chain describes the full range of value added activities which are required to bring a product or service from its conception, to its end use and beyond. The activities comprised in a value chain are: design, sourcing raw materials and intermediate inputs, production, marketing, distribution, and support to the final consumer. These activities can be contained within a single enterprise (within a single geographical location or spread over wider areas) or can be divided among multiple firms and spread across wide swats of geographical space. As can be seen in Figure 1, the value chain is characterized by ranges of activities within each link of the chain and intra-chain linkages (most often of a two-way nature):
Figure 1- A simple value chain4
4 Kaplinski, R., Morris, M. – A handbook for value chain research, IDRC, 2002

PLUSES AND MINUSES OF BEING IN A GLOBAL VALUE CHAIN – THE CASE OF ROMANIAN APPAREL SMEs
145
A more comprehensive and complex picture of a generic value chain in Figure 2 illustrates the links between the value chains for all products and services in an economy and the supporting activities and institutions (such as educational institutions for training and infrastructure services for logistics):
Figure 2 – Generic value chain and supporting inputs5
The global value chain (GVC) consists into the entire range of activities associated with a given product or service geographically dispersed across borders in multiple countries. Nowadays the proportion of goods and services produced and consumed entirely within one country is rapidly shrinking. In the global economy, value chains can span enterprises of a local economy, a sub-national regional economy, the entire domestic economy, a supra-national regional economy, and the global economy, their component activities being geographically dispersed across borders to multiple country locations.
5 Sturgeon, T.J. - How Do We Define Value Chains and Production Networks, Special Working Paper
Series, MIT IPC Globalization Working Paper 00-010, Industrial Performance Centre, Massachusetts Institute of Technology, April 2001

ALINA FLORENTINA AVRIGEANU, FLAVIA GABRIELA ANGHEL, ELENA RADU
146
There are two prevalent types of GVCs: buyer-driven and producer-driven value chains. In the buyer-driven value chains, key actors are the large buyers with core competencies in branding and marketing are the driving actors in setting up these value chains. They increasingly organize, coordinate and control the research, design, production, sales, marketing activities and financial services, acting as strategic brokers in linking overseas factories and traders with product niches in their main consumer markets. These chains are typical for labor-intensive industries and are highly relevant to developing countries (for instance, agro-food industries, textiles, garments, footwear, toys, furniture, and the like). In the producer-driven value chains, key actors are producers in the chain that control vital technologies, which are of crucial importance for positioning in the final product market. They coordinate these value chains and take responsibility for helping the efficiency efforts of their suppliers and their customers. These chains are typical for medium- and high-tech industries, like automobiles, electronics, telecommunications, and the like. The third type of GVCs, less prevalent that the above mentioned two types, is the multi-polar chain characterized by multiple power centers in different parts of the value chain. The key characteristic of this type of GVCs is that there is no overall dominant "lead firm" with power to determine the ultimate shape of final products and therefore exert control over key activities throughout the chain.
A production network consist into the entire range of linkages within or among a group of firms in a particular global value chain for producing specific products, with an emphasize on the organizational particularities of the networks of subsidiaries, affiliates and suppliers that lead firms use to produce a given product. The lead firms of a production network control access to key resources and activities such as product design, international brands and access to final consumers - that generally gives them leverage over the other enterprises - suppliers - in the production network.
Global production networks (GPNs) consist into the distribution and coordination of geographically dispersed activities within and/or among firms takes place across borders in multiple countries). Production networks become "global" when the distribution and coordination of geographically dispersed activities within and/or among enterprises takes place across borders in multiple countries. There are two types of global production networks: intra-firm and inter-firm. Intra-firm global production network is the classic multinational, vertically integrated enterprise, where production and related activities are relocated "offshore", but remains essentially within the coordination and control of the firm. Inter-firm production network involve non-equity linkages, in which formally independent enterprises - suppliers, producers and retailers - linked through a variety of relationships such as subcontracting, licensing, common technical standards, marketing contracts and shared network product - and process- related standards. This involves both the relocation and reorganization of production activities offshore and outside the boundaries of the firm. In an increasing number of industries, producers sell into final markets through

PLUSES AND MINUSES OF BEING IN A GLOBAL VALUE CHAIN – THE CASE OF ROMANIAN APPAREL SMEs
147
such non-equity-based production networks; usually coordinated by lead firms which set the standards for supplier participation6.
There are several key characteristics of GVCs and GPNs, as folows:
A. Governance - strategies of the lead firms concerning the suppliers that determine how financial, material, and human resources are allocated and flow within a chain
Generally, lead firms are making the "rules of the game" in a chain/ network that govern regarding the potential suppliers, the outputs of suppliers in the network, the methods of production, how much is to be produced by each supplier and when, which activities or functions will the suppliers be allowed to undertake in the network and in which of these areas will suppliers be allowed to upgrade. The lead firms try to retain and guard value chain activities with the highest returns and value added. The operational control of the lead firms is exerted through increasingly ICT/e-commerce-based management and logistics systems that integrate supplier activities within the network.
The GVC framework specifies three types of network governance (modular, relational, and captive) along with the two traditional modes of economic governance (markets and hierarchies). There are five different GVC governance patterns that tend to vary in specific industries and places: markets, modular value chains, relational value chains, captive value chains and hierarchy.
The GVCs literature emphasizes three important variables to look for when studying GVCs in a particular firm, industry, or place. Furthermore, if one of these three variables changes, then value chain governance patterns tend to change in predictable ways. These variables are:
1. The complexity of transactions - complex transactions will likely to be associated with one of the three network governance patterns (modular, relational, or captive) or integrated within a single firm (hierarchy).
2. The codifiability of transactions - if suppliers have the competence to receive and act upon codified information, and if the codification schemes are widely known and widely used, then we would expect to see modular value chains emerge; if not, then lead firms might either keep the function in - house, leading to more vertical integration (hierarchy) or outsource it to a supplier that they tightly control and monitor (the captive network type) or have a dense, idiosyncratic relationship with suppliers (the relational governance type).
3. The competence of suppliers - needed for the transfer of complex but codified information to be achieved (as in modular networks) or intense interaction be worthwhile (as in relational networks). In case competent suppliers do not exist, lead firms either must internalize the function (hierarchy) or outsource it to suppliers that they tightly monitor and control (captive suppliers).
6 Abonyi, G. - Linking Greater Mekong Subregion Enterprises to International Markets: The Role of Global
Value Chains, International Production Networks and Enterprise Clusters, ESCAP, 2007

ALINA FLORENTINA AVRIGEANU, FLAVIA GABRIELA ANGHEL, ELENA RADU
148
B. Upgrading improving a firm’s competitive position within a given network or value chain and creating additional value through innovation
According to GVC literature, upgrading is decisively related to innovation defined not only as a breakthrough into a product or a process that is new to the world but rather as a matter of marginal, evolutionary improvements of products and processes, that are new to the firm, and that allow it to keep up with an international (moving) standard. This involves a shifting to activities, products, sectors which sustain higher value added and enforce higher entry barriers. For enterprises working within a value chain, four types of upgrading are singled out: (i) Process upgrading is transforming inputs into outputs more efficiently by re-organizing the production system or introducing superior technology; (ii) Product upgrading is moving into more sophisticated product lines in terms of increased unit values; (iii) Functional upgrading is acquiring new, superior functions in the chain, such as design or marketing or abandoning existing low-value added functions to focus on higher value added activities; (iv) Chain upgrading is applying the competence acquired in a particular function to move into a new sector. Thus, upgrading within a value chain implies going up on the value ladder, moving away from activities in which competition is of the “low road” type and entry barriers are low.
C. Role of global buyers - setting up standard requirements internationally agreed
Nowadays, global buyers increasingly want more information and control with respect to their suppliers, increasingly further back in the value chain. Therefore, in industries as diverse as electronics, computers, apparel and fresh vegetables the trend is away from "arms length" market-based transactions to some form of linkages or alliance among firms along the value chain: thus production networks are established.
D. Role of global suppliers - global investors, influencing on the fortunes and export competitiveness of their host countries enterprises
Aiming to spread the risks and lowers the costs of doing business, leading firms are becoming increasingly reliant on global suppliers, often based close to home, but supported by subcontractors globally. In turn, global suppliers are reorganizing networks within value chains, redefining the role and relationships of lower-level suppliers/producers, further back in the chain, looking for firms that already have the requisite production capabilities. This reorganization of networks is becoming a factor in an increasingly wider range of industries, enhancing the influence of global suppliers on the export competitiveness of host countries and on the fortunes of their enterprises.
I.2. The apparel GVC
The apparel industry is one of the most global ones, apparel manufacturing being a classic starter industry for export oriented industrialization. Traditionally, apparel manufacturers are located in developing countries, often under outward processing

PLUSES AND MINUSES OF BEING IN A GLOBAL VALUE CHAIN – THE CASE OF ROMANIAN APPAREL SMEs
149
agreements with major importers. Production of apparel is a low value - added labour – intensive industry, often using unskilled workforce and sewing techniques basically similar to those that were used a century ago.
The value chain in the apparel industry embraces several different sets of activity, roles and occupations presented in Figure 3:
Figure 3 – Steps in the value chain in the apparel industry 7
1. Development and planning of the entire collection involves several skilled activities including knowledge of market trends (in apparel demand is growing relatively slow and is unpredictable and the share of apparel in household budgets is in decline8) and of fabric availability, the integration of both into development of product lines (the range of products is limited and products are subject to rapid obsolescence and to strong fashion related influences), and the costing of the planned collection.
2. Design and prototyping of new models requires both creativity and technical aptitude in addition to understanding market demand and cost structures.
3. Production design and sample-making concerns the most cost-efficient means of producing the item, bearing in mind quality standards and fit. Decisions on manufacturing location are also brought into consideration.
4. The actual manufacture and assembly of garments, or CMT (cut-make-trim), involves mainly semi-skilled sewing and assembly operations, using simple machines and requiring elementary skills.
5. Marketing seeks to match retail outlets to the quality and character of the clothes, and to achieve the broadest possible market access in a given segment.
6. Distribution entails an increasingly sophisticated logistics operation often based on computerized order tracking and inventory control systems.
7. Finally, the garments reach consumers through various retail channels.
7 Faust, M. – Reorganization and relocation in the German fashion industry, Gottingen, 2005 8 Dunford, M. – The changing profile and map of the EU textile and clothing industry, in Faust,
Michael, Voskamp, Ulrich and Wittke, Volker (eds) European industrial restructuring in a global economy: fragmentation and relocation of value chains, Goettingen

ALINA FLORENTINA AVRIGEANU, FLAVIA GABRIELA ANGHEL, ELENA RADU
150
The higher value added segments of the value chain are all in the services category: gathering of market data, product design and fashion, marketing, retailing and logistics.
In principle these seven steps can be separated from each other and performed in different locations, since they involve clearly identified costs as well as different sets of capabilities and occupations. The apparel GVC includes the entire range of production related activities from raw material inputs to sales, independent and particular firms involved, as it can be seen in Figure 4. The apparel GVC is organized around five main components (Figure 4): raw material supply, including natural and synthetic fibers; provision of components, such as the yarns and fabrics manufactured by textile companies; production networks made up of garment factories, including their domestic and overseas subcontractors; export channels established by trade intermediaries; and marketing networks at the retail level. Entry barriers are low for most apparel factories, and they increase with movement up the GVC.
Figure 4 – Apparel global value chain9
As far as apparel production networks are concerned, lead firms (diverse global "buyer channels", including cost-driven discount chains, upscale brand marketers, apparel specialty stores and private labels of mass merchandisers) control access to
9 Gereffi, G. Memedovic, O. - The Global Apparel Value Chain: What Prospects for Upgrading by
Developing Countries, Vienna, UNIDO, 2003

PLUSES AND MINUSES OF BEING IN A GLOBAL VALUE CHAIN – THE CASE OF ROMANIAN APPAREL SMEs
151
key resources and activities (such as product design, international brands and access to final customer), activities that often generate the most profitable returns. This generally gives them leverage over the other enterprises (suppliers) in the production network through their ability to shape mass consumer markets via strong brand names and local sourcing strategies. The apparel industry comprises both intra-firm GPNs (for example Inditex and H&M) and inter-firm GPNs, usually coordinated by lead firms, the last mentioned being the most prevalent ones.
The apparel GVCs and GPNs are typical buyer-driven value chains/networks, with highly competitive and dispersed global industry structure, including regional and local competitors, large retailers and brands playing the lead role in sourcing from decentralized networks of independent suppliers, defining products, specifications and standards.
As the intensity of global competition is growing the products life cycles shortens and the entry barriers are lowering. As a consequence, enterprises need to upgrade and they may achieve this in various ways, as for example by entering higher unit value market niches, by entering new sectors, or by undertaking new productive (or service) functions, and always deepening technological capabilities10. There is a hierarchy of upgrading which suggests that firms engaging on an upgrading path are advised to proceed along a well-trodden path (Figure 5). The literature suggests also a pattern of process upgrading in the apparel industry, (as the enterprises from buyer-driven GVCs have room to upgrade their processes) presented in Figure 6.
Figure 5 – The hierarchy of upgrading11
10 Pietrobelli, C., Saliola, F. - Power relationships along the value chain: multinational firms, global
buyers, and local suppliers’ performance, CREI working paper no. 2/2007 11 Kaplinski, R., Morris, M. – op.cit.

ALINA FLORENTINA AVRIGEANU, FLAVIA GABRIELA ANGHEL, ELENA RADU
152
Figure 6 - A pattern of process upgrading in the apparel industry12
The apparel GVC is dominated by three types of buyers: retailers, branded marketers and branded manufacturers, all of which source globally. Producers wishing to participate into apparel GVC have to meet stringent requirements of a growing multiplicity of standards imposed by the global buyers internationally agreed on quality, environment, labour, etc. Frequently, large apparel retailers shift from being primarily buyers from garment manufacturers to developing strong linkages with global suppliers. Through active engagement at different points in GVC, e.g., product design, fabric selection and procurement and overseeing production of manufacturers dispersed around the globe these retailers transform themselves from passive buyers into private-label or store-brand lines producers.
Global retailers are supported by increasingly powerful and smaller number of preferred first-tier global suppliers that organize production-related activities on their behalf, as seen in Figure 7. Using their logistics capabilities and management coordination, these independent companies match domestic manufacturers and foreign/ global buyers.
The apparel GVC is also characterized by the presence of prominent marketers with well-known brands, manufacturers without factories focusing on design, branding and marketing. Their role is to provide information/knowledge and market access to allow suppliers to upgrade, as they increasingly devolve functions and key parts of the value chain to their suppliers. For example, they increasingly outsource support functions (e.g., pattern grading and sample making), and are "devolving" external
12 Yoruk, D. E. – Patterns of industrial upgrading in the clothing industry in Poland and Romania,
Centre for the study of economic & social change in Europe, London, 2001

PLUSES AND MINUSES OF BEING IN A GLOBAL VALUE CHAIN – THE CASE OF ROMANIAN APPAREL SMEs
153
sourcing of many activities and inputs to selected first-tier global suppliers. Also they are shrinking their supply chains, using fewer preferred manufacturers and are adopting increasingly stringent standards.
Figure 7 – The central role of global suppliers in governing the production networks within the apparel GVC13
Branded manufacturers are the third key group of buyers dominating the apparel GVC. Leading apparel manufacturers in developed countries have been under increasing pressure from lower priced off-shore producers providing products of similar quality, quantity and service. As a consequence, they have been shifting from production to marketing, building on their retail outlets and brand names.
13 United Nations Industrial Development Organization, Integrating SMEs in Global Value Chains,
Vienna, UNIDO, 2001

ALINA FLORENTINA AVRIGEANU, FLAVIA GABRIELA ANGHEL, ELENA RADU
154
III.3. Requirements for apparel SMEs successful insertion into global value chains
Nowadays, the ideal is for an enterprise to access international markets directly by selling final products with pricing power and brand presence to customers globally. Significant capabilities are needed, such as:
� the capability to design, produce, market, distribute and service the product on global markets;
� the capacity to respond effectively to changing market conditions, including evolving tastes and new competitors.
The global competition in products markets is forcing prices down, while driving up the requirements for production, technological and management capabilities.
Because of their size and isolation, individual SMEs are constraint from:
� achieving economies of scale in the purchase of such inputs as equipment, raw materials, finance, consulting services;
� their inability to identify potential markets; � their incapacity to take advantage of market opportunities that require
large volumes, high quality, stringent standards and regular supply; � accessing business services such as training, market intelligence, logistics; � achieving key inputs that require specialized knowledge such as technology.
These constraints make it difficult for the apparel SMEs to access global markets and also limit their performances in a more and more competitive and open domestic market.
Unfortunately, the constraints mentioned above are common to Romanian apparel SMEs. As the specialized studies and research projects show14, Romanian apparel SMEs act individually, clusters being insufficiently represented (there are only a few potential apparel clusters, often spatial agglomerations of companies as such, not quite the “research system networks” - the most advanced form of clustering employing strong institutional and informal linkages between companies, universities, vocational schools and research centers, and public institutions).
III.4. Pluses and minuses of being in a global value chain
As can be seen in Figure 8, through GVCs and GPNs, SMEs can link up to global buyers. It is essential that a SME should enter the chain as a higher tier supplier or as a lower-tier supplier but with the opportunity to upgrade. By linking to the leaders, SMEs have the opportunity to use all the resources they can acquire from the advanced world (such as knowledge) in return for providing such services as low cost manufacturing.
14 Pislaru D., Aristide O., “To cluster, or not to cluster? The potential for competitive economic
growth through cluster development in Romania”, 2004

PLUSES AND MINUSES OF BEING IN A GLOBAL VALUE CHAIN – THE CASE OF ROMANIAN APPAREL SMEs
155
Figure 8 – Linking local producers with global buyers15
SMEs that interact with buyers looking for large volumes of standardized products and insert themselves into GVCs have several advantages presented below:
� The considerable investment and risk in entering export markets is reduced by the buyers that are responsible for product definition (study of the market, development of the models, work out of the product specifications, the choice of technology, the organization of production, inspection of quality on site) and logistics (set up of transport and payment arrangements);
15 Kaplinsky, R., Readman, J. (2000), Globalisation and Upgrading: What Can (and Cannot) be
Learnt From International Trade Statistics in the Wood Furniture Sector?, Center for Research in Innovation Management (CENTRIM), University of Brighton, Brighton
ALINA FLORENTINA AVRIGEANU, FLAVIA GABRIELA ANGHEL, ELENA RADU
156
� The processes standards and product quality raises, as the SMEs concentrate on production and the organization of their own local supply chains; thus, they are able to:
� raise quality; � reduce batch size and increase speed; � increase the sophistication of their products.
Therefore, the size of the factory increases rapidly and SMEs can switch to a new way of producing.
However, there are some disadvantages for the SMEs that enter into global value chains:
� moving further up the chain can lead to conflicts with existing customers; � some enterprises even had their capabilities downgraded as a result of
their integration in global value chain; � the activities performed by SMEs under outward processing arrangements
(e.g. mere assembly of imported inputs) have low value added; � the rivalry among apparel producers from developing countries to offer
transnational companies the lowest production costs leads to: � a race for the lowest wages (because the apparel industry is labour-
intensive, with labour accounting for 60% of production costs), which also lowers the local standards of living while doing nothing to improve productivity;
� a perverse “competitive devaluation”, where currency depreciations are seen to increase international competitiveness; enterprises that rely only on devaluating exchange rates cannot survive;
� illegal practices such as: disregarding labour and environment regulations, avoiding taxation.
IV. Conclusions
In their struggle to compete, Romanian apparel SMEs can use the “second best” opportunities provided by global value chains and associated production networks. Within the global value chain framework, these enterprises can specialize in a limited set of activities and outputs and reach larger (regional and global) and more stable markets. In order to do that, these enterprises are required to work in a more formal manner and upgrade not only their production methods but also their management practices.
It is important for managers to better understand how GVCs function and to explore how Romanian clothing SMEs may participate in global markets in a way that provides for sustainable growth avoiding the peril of competing by lowering wages and profit margins rather than by improving productivity, wages and profits. The key difference between the high and the low road to competitiveness is often explained by the different capabilities of firms to “upgrade”.

PLUSES AND MINUSES OF BEING IN A GLOBAL VALUE CHAIN – THE CASE OF ROMANIAN APPAREL SMEs
157
Also, managers and entrepreneurs must understand that, although it is easier to enter into a chain as a lower-tier supplier this is likely to be un unstable position – therefore a SME needs to enter the chain as a higher tier supplier or as a lower-tier supplier but with the opportunity to upgrade.
REFERENCES 1. Abonyi, G. - Linking Greater Mekong Subregion Enterprises to International Markets: The
Role of Global Value Chains, International Production Networks and Enterprise Clusters, ESCAP, 2007
2. Dunford, M. – The changing profile and map of the EU textile and clothing industry, in Faust, Michael, Voskamp, Ulrich and Wittke, Volker (eds) European industrial restructuring in a global economy: fragmentation and relocation of value chains, Goettingen
3. Gereffi, G., Humphrey, J. and Sturgeon, T. - The governance of global value chains, Review of International Political Economy, vol. 12, no. 1, 2005
4. Gereffi, G., Memedovic, O. - The Global Apparel Value Chain: What Prospects for Upgrading by Developing Countries, Vienna, UNIDO, 2003
5. Giuliani, E., Pietrobelli, C., Rabellotti, R. - Upgrading in global value chains:lessons from latin american clusters, Dipartimento di Scienze Economiche e Metodi Quantitativi Università del Piemonte Orientale Quaderno n°72, Novara, 2004
6. Kaplinski, R., Morris, M. – A handbook for value chain research, IDRC, 2002
7. Kaplinsky, R., Readman, J. (2000) - Globalisation and Upgrading: What Can (and Cannot) be Learnt From International Trade Statistics in the Wood Furniture Sector?, Center for Research in Innovation Management (CENTRIM), University of Brighton, Brighton
8. Pietrobelli, C., Saliola, F. - Power relationships along the value chain: multinational firms, global buyers, and local suppliers’ performance, CREI working paper no. 2/2007
9. Pislaru D., Aristide O. - To cluster, or not to cluster? The potential for competitive economic growth through cluster development in Romania, 2004
10. Sturgeon, T.J. - How Do We Define Value Chains and Production Networks, Special Working Paper Series, MIT IPC Globalization Working Paper 00-010, Industrial Performance Centre, Massachusetts Institute of Technology, April 2001
11. Yoruk, D. E. – Patterns of industrial upgrading in the clothing industry in Poland and Romania, Centre for the study of economic & social change in Europe, London, 2001
12. *** United Nations Industrial Development Organization, Integrating SMEs in Global Value Chains, Vienna, UNIDO, 2001

STUDIA UNIVERSITATIS BABEŞ-BOLYAI, NEGOTIA, LV, 1, 2010
REENGINEERING THE MANAGEMENT SYSTEM IN SMALL AND MEDIUM ENTERPRISES’ FROM ROMANIA
ANA-MARIA GRIGORE 1, CĂTĂLINA RADU 2
ABSTRACT. In Romania almost 99% of the companies are SMEs. For now the only certainty for Romanian economy is the fact that the ability to “invent” new products and services for clients, the capability to offer quick and creative responses to the complex problems which appear in the organization and the capability to find always new ways to improve key-relationship between stakeholders, are becoming the key-factors for differencing and creating the competitive advantage for today and tomorrows success.
If we take into consideration the present evolutions which state that the SMEs are the new knowledge-based firms, it’s necessary that in order to be globally competitive, Romanian companies have to support and enhance individual creativity and to use employees knowledge as a way to increase firms profitability.
For Romanian SMEs the necessity of change is becoming more and more urgent. This is why reengineering is becoming fundamental for all organizations. The companies which had the biggest success in persuading the employees about change were the ones who had the clearest messages about the necessity of reengineering.
The paper analyses the role of managerial systems reengineering inside SMEs from Romania. This research intends to demonstrate that reengineering the management system is one of the main conditions to ensure the economical and managerial success of an organization on a period of three to five years. It became compulsory that management system reengineering should follow a special methodology which respects a logical succession of different phases. Based on SMEs development from Romania the paper will present each phase of the reengineering process and in the end will draw some conclusions about future improvements for management system reengineering.
KEY WORDS: Small and Medium Enterprise, Reengineering, SMEs, Management Systems, Reengineering Methodology
JEL Classification: M10, L25, D80, O15 1. INTRODUCTION
Most business models, tools and techniques originate in the theory and practice associated with large private sector organizations. Thus, it is contended that Small and Medium Enterprises (SMEs) often apply business improvement approaches that are fundamentally flawed in an SME context, as they do not start by addressing the key features and constraints of SMEs.
1 PhD Candidate, Academy of Economic Studies Bucharest, [email protected] 2 Junior Lecturer, PhD Student, Academy of Economic Studies Bucharest, [email protected]

ANA-MARIA GRIGORE, CĂTĂLINA RADU
160
The reengineering process is a common term used by large consulting firms round the globe in helping their client to restructure business and improve operation. It is usually presented to various kinds of audience as though it is an advanced tool or method that if without engaging consultant the organization would not strive better in this modern business environment.
The main purpose of the article is to answer a series of questions regarding the reengineering process in SMEs. Some of these questions are: Is it possible that critical success factors for reengineering process in large enterprises and SMEs are the same? Is it possible to apply reengineering successfully in SMEs? Can methodologies regarding reengineering, developed in large organizations, be applied in SMEs with minor adjustments?
The first part of the paper describes the existing literature and the methods used for research. The second part of the paper describes the results of the research and the third part draws the final conclusions.
In particular, the approach of SMEs to reengineering definition and methodology are examined. The reengineering process was developed from a background in large enterprises and applied in SMEs. Existing methodologies mainly assume a large organization setting with large-scale resources dedicated to bringing about the large-scale reengineering changes.
2. LITERATURE REVIEW AND METHODS USED
The research was based mainly on an exploratory literature review of different approaches regarding business reengineering in large companies and in small and medium enterprises. Different case studies on SMEs, where reengineering had been applied, were analyzed using a qualitative research methodology. The analysis indicates that the taxonomy and nomenclature of reengineering, as defined by large organization-based studies, has translated into SMEs, but these who use much more general terminology.
2.1 Defining Reengineering for SMEs
In seeking to define reengineering the ongoing development in the field must be considered. The early definitions (late 1980s, early 1990s) are typified by that of Hammer (1990): "Reengineering is the fundamental rethinking and radical redesign of business processes to achieve dramatic improvements in cost, quality, service and speed."
The reengineering literature is often associated with large-scale innovation and high-risk change. Such views on reengineering are similar to those of Hammer and Champy's (1993), whose views on reengineering have been supported, or disagreed with, by a number of researchers; Hammer and Champy (1993) identify seven key activities associated with reengineering. The four most fundamental are:

REENGINEERING THE MANAGEMENT SYSTEM IN SMALL AND MEDIUM ENTERPRISES’ FROM ROMANIA
161
• Business process design; • Dramatic improvement in business processes; • A process orientation, (as opposed to a functional orientation); • A radical change in business processes.
Reengineering is dependent on the successful identification and streamlining of processes that add value to the products or services being provided. As such, successful reengineering efforts must focus on the cost and the revenue sides of a business. The fifth of Hammer and Champy's (1993) critical activities is a `starting over approach'. This involves a mindset that focuses on the total reconstruction of a process and not simply a modification of existing practices.
Strong leadership is the seventh of Hammer and Champy's key activities. Gaining firm support and commitment from top management can easily mean the difference between the success and failure of a reengineering project.
Depending on the nature of the arising problems inside the companies, the following premises regarding the reengineering process had to be taken into consideration:
• Forming a diagnostic team, meaning naming specialists or management consultants who are familiarized with SWOT analyze as a managerial method, but also with the main activity of the company.
• Defining accurately the tasks, competences and responsibilities for each member of the reengineering team in order to avoid parallelism.
• Specifying clearly the objectives of the diagnostic and establishing the necessities and opportunities of such a step in the context of managerial changes. • The evolution of the knowledge-based economy has determined a lot of changes inside large organizations, but also inside SMEs. In order to determine the increasing of organizational performances, it is necessary to integrate and implement managerial changes through rigorous processes of planning.
• The top management has to establish as clearly as possible the objectives of the “change program”.
• Managerial modernization inside SMEs is a necessity, which should ensure superior qualitative parameters for managerial systems.
In order to lunch the reengineering process a series of factors which could influence the process, but also its implementation, should be taken into consideration. Among these factors are:
• The internal and international political situation. • The existence and context of juridical terms. • The existence of conflicts between stakeholders. • The nature of the relations between managers, public institutions,

ANA-MARIA GRIGORE, CĂTĂLINA RADU
162
banks and other organizations. • Organizational culture. • The nature of the relations between managers, shareholders and employees. • The existence of general and specific objectives. • The market structure. • Etc.
2.2 Process Reengineering for small and medium enterprises
The reengineering process is an extremely good concept and tool for small and medium size enterprise (“SME”) business, and specially for those businesses either in very deep trouble or expanding too fast to the extent that they could not cope with their operation. The concept of reengineering process says that an organization must have a strategy, then set business objective to achieve the strategy. However, in order to achieve the objective effectively, organization can apply the reengineering concept to put the right processes in place. The well-done or world-class process must support with right people, technology and an appropriate organization structure. In order to sum up, it could be much easier with illustration of the following chart:
Figure 1: The reengineering process in large companies3
3 JC Management Consulting Co., Ltd, http://www.jcvietnam.com/BPRSmallBusiness.doc
Processes
People, Technology
Objective
Strategy

REENGINEERING THE MANAGEMENT SYSTEM IN SMALL AND MEDIUM ENTERPRISES’ FROM ROMANIA
163
However, how many small or medium size business people could really understand about strategy? Most of them manage their business based solely on hard work, and usually the owner is the leader, manager and worker by their own self. Most of successful SME people are hands on person, and most likely they do not even bother about the word of “strategy”, especially in under developing countries business environment. What they usually believe in business success is to be hands on, always in control and hard work, and they expect their staff or worker to be the same.
How should then BPR applicable to SME? By turning the above chart upside down with further modification we can obtain a possible solution for the reengineering process inside SMEs.
Figure 2: The reengineering process in SMEs 4
3. RESULTS AND DISCUSSIONS
After analyzing a series of case studies on SMEs we have developed the following methodology regarding the reengineering process in SMEs. The main phases are:
4 JC Management Consulting Co., Ltd, http://www.jcvietnam.com/BPRSmallBusiness.doc
People, Technology
Processes
Objectives
Strategy
SME business people work closely with their people and believe or skeptical about the application of technology.
SME business people improving their process by hands on, they change more quickly and more flexibly of processes to adopt in order to survive. They are doing this unconsciously without proper methodology.
SME usually only looking for short-term objective or without any objective at all, either they are doing well enough do not even need to think about the objective or without concept of planning.
What strategy is all about? My strategy is making more money as fast as possible.

ANA-MARIA GRIGORE, CĂTĂLINA RADU
164
1. The diagnostic of the company containing: a) General diagnostic of the firm, which takes into consideration the
general indicators of the company. b) Diagnostic of the main activities of the firm: production activities,
commercial activities, quality activities, human resources activities, research & development activities, legislation foresight etc.
c) Utilization of the diagnostic methodology to underline the main strong and weak points of the firm, their causes and effects, and also for giving recommendations.
2. The elaboration of the knowledge-based strategy. a) The knowledge-based strategy has to take into consideration that
knowledge is the main resource for all its components: mission, objectives, strategic options, deadlines, resources, competitive advantage.
b) Choosing the strategy which is the best for the company. c) Defining the global strategy of the company. d) Elaborating the strategy for the main activities of the company.
3. The reengineering process inside the company’s’ management system. 3.1 Specify the economical, technical and computerized coordinates of
the reengineering process and establish the specialists’ team. a) Choosing the members of the specialist team who will undertake
the reengineering process. b) Defining the main changes which will take in the firm after
discussions with the managers. c) Learning and understanding the reengineering methodology by
the team members. d) Elaborating the reengineering program of the company.
3.2 Reengineering the methodological system. a) Choosing the managerial systems which should be used by the
company (Examples: objective-based management, project-based management, knowledge-based management etc).
b) Introducing new management methods (SWOT, brainstorming, balance scorecard etc).
c) Improving the utilization of classical management methods like delegation and meetings.
3.3 Reengineering the decisional system a) Introducing new decisional lists for each manager. b) Harmonizing decisions inside the company with the objectives
of the company. 3.4 Reengineering the informational system
a) In order to reengineer the informational system the reengineering team should indicate and identify the hard and soft which should be used in the company and also the documents needed.

REENGINEERING THE MANAGEMENT SYSTEM IN SMALL AND MEDIUM ENTERPRISES’ FROM ROMANIA
165
b) Global reengineering of the informational system. 3.5 Reengineering the organizing system
a) Global reengineering of the organizing system by establishing the maximal number of employees, the type of organizational structure etc.
b) Redesigning the posts, tasks and organizing documents. 3.6 Reengineering the HRM system
a) Introducing new systems, methods used by the knowledge-based HRM system.
b) Developing a career plan for employees.
4. Implementing the new system which resulted after the reengineering process.
5. Evaluating the functionalities, efficiency and efficacy of the system.
Even tough the management system is not so developed and complex inside the SMEs as in the large organizations, we consider that the last five phases should be applied for implementation of reengineering inside a SME.
4. CONCLUSIONS
The shape of the twenty-first-century company is becoming clear. It will be organized around process rather than functions. Managers will coach and design rather than supervise and control. Employees will be process performers rather than task workers, with broad understanding of their process and their company. The company itself will be a dynamic, flexible organization filled with entrepreneurial zeal and focused sharply on customer needs. In SMEs every employee is important and people are treated as assets, not as expenses. Change will be expected not feared. Only such companies will be able to provide the extraordinary service, innovation, and low cost essential for success in the new global economy.
The importance of the Small and Medium Enterprise sector has increased presently as the predominant source of employment. In periods of economic recession, process reengineering is critical to business survival. The manager/owner of the SME will need to balance the degree against a willingness to take risks. In order to success-or even to survive- in today’s global economy, SMEs must reform and reorganize themselves around their core processes.
Reengineering represents one of the main conditions to ensure economical and managerial success of the organization on a period of three to five years. It has become imperative that reengineering should be based on adequate methodologies, which will follow certain logic for management system components succession. Redesigning the methodological, the decisional, the informational, organization and the human resources subsystems are part of reengineering the management system.
Reengineering the managerial system creates an organizational climate where the hierarchies are reduced, the workers are better prepared, and the structures are more flexible.

ANA-MARIA GRIGORE, CĂTĂLINA RADU
166
The economical recession or a slower comeback intensifies the pressure on companies, to deal with the arising problems, and the fact that economical situation improvement lifts a weight from the companies back, doesn’t mean that the processes have improved themselves. Also when the difficult periods appear the problems will surely reappear and the lateness will make the reengineering harder.
After managerial reengineering the new processes will have to be managed so that they will achieve the maximum of performance level.
The purpose of the paper was to present a methodology for managerial system reengineering in SMEs, and which will intensify on the next period. This article can become a starting base for future research which should focus on finding new elements regarding process reengineering in small and medium enterprises.
REFERENCES 1. Champy, J. Nohria, N. (1996), Fast Forward: The best Ideas on Managing Business
Change, New York, USA, ed. Harvard Business School Press, p. 141-157
2. Chaston, I. Mangles, T. (2002), Small business marketing management, New York, ed. Palgrave, p. 130-140.
3. Hammer, M. Champy, J. (1993), Reengineering the Corporation, USA, ed. Harper Business
4. Nicolescu, O. Verboncu, I. (2008). Managerial Methodologies, Translation of: Metodologii Manageriale, Bucharest, Romania, ed. Universitara, p.87-93, 180-184, 233-244, 263, 304-314.
5. Nicolescu, O. Nicolescu, L (2005), Knowledge Economy, Firm and Management, Translation of: Economia, firma şi managementul bazate pe cunoştinŃe, Bucharest, Romania, ed. Economică, p. 203-222
6. Petrescu, I. (2003), Management based on performance centers, Translation of: Management pe baza centrelor de performanŃă, Bucharest, Romania, ed. Expert, p. 12-15.
7. Wilson, P. Bates, S. (2004), The essential guide to managing small business growth, Sussex, England, ed. Wiley, p. 153-168.
8. http://www.jcvietnam.com/BPRSmallBusiness.doc

STUDIA UNIVERSITATIS BABEŞ-BOLYAI, NEGOTIA, LV, 1, 2010
MEASURES TO SUPPORT SMEs IN THE EUROPEAN UNION
VALENTINA DIANA IGNĂTESCU1
ABSTRACT. This paper aims to identify and analyze the principal measures by which European Union supports the establishment and development of small and medium enterprises. SMEs taken individually have a very small power but if we analyze all SMEs in a country we find that they have a very important role in the economy because they provide jobs and their performance may influence the degree of development of an economy. Thus, the European Union focuses its efforts to support SMEs in various fields; these efforts are geared towards both easier accesses to financing and in the direction of regulations, competition, stimulating entrepreneurship. Through this paper we analyze all these measures taken by the European Union and their implementation results. And finally, we will conclude if these measures are effective or not. Key words: structural funds, the internationalization of SMEs, entrepreneurship JEL classification: D92, F36, G32
Introduction Small and medium enterprises (SMEs) are those enterprises which have a
maximum of 250 employees, a turnover of up to 50 million Euros and / or have assets of up to 43 million Euros. But the vast majority of SMEs in Europe are much lower than the limits set, which hampers their access to resources (financial resources, know-how or resources). The large companies have departments that deal entire with monitoring technological developments, the study of competition, to attract capital and new employees. But in the case of SMEs these responsibilities does often not exist and other times are made by people whose job involves other responsibilities.
However small and medium enterprises play a very important role in the economy because they generate a significant part from the products and services necessary to the population; they create value; they provide jobs and their performance may influence the state and the degree of development of the economy2. Moreover they predominate the landscape of private companies from all European countries. In the EU-27 are approximately 20 million small and medium
1 „Alexandru Ioan Cuza” University, Iasi, Romania, [email protected] 2 Carta albă a I.M.M.-urilor din România, 2006, pag. 22

VALENTINA DIANA IGN ĂTESCU
168
enterprises which constitute 99% of the total number of economic enterprises3. Taken individually, they have small and very small power, but together they form the main contributor to the Lisbon Strategy for jobs and growth in Europe.
Difficulties faced by SMEs
The Observatory of European SMEs through the Flash Eurobarometer no. 196 survey stressed the fact that small and medium enterprises in the European Union consider four factors as important barriers to the innovation of their work: limited access to finance, lack of skilled labour, lack of market demand and human resources cost too high4. Thus as an enterprise is bigger the more likely is to report problems in finding the necessary human resources and less likely to report difficulty in obtaining necessary business resources.
Finding and hiring the appropriate workforce is a challenge for many SMEs in the EU. Especially in the new Member States where a significant number of jobs remain empty.
Figure no. 1. The main difficulties faced by SMEs in EU
Source: Flash EuroBarometer, nr. 196, Observatory of European SMEs, Summary, pag. 8
As can be seen from the figure presented the main problem faced by SMEs
in the European Union is the lack of market demand (46% of SMEs that took part to the study consider it the main difficulty that they encounter when they wish to extend their activity). More than one third of SMEs in the EU 27 have faced difficulties due to strict administrative rules (36%) or lack of employment (35%), or labour too expensive (33%). Around 20% of SMEs that took part to the study have encountered
3 Audretsch, David, First section of the annual report on EU Small and Medium-sized Enterprises, 2009, pag. 12 4 Flash EuroBarometer, nr. 196, Observatory of European SMEs, Summary

MEASURES TO SUPPORT SMEs IN THE EUROPEAN UNION
169
problems because of the infrastructure (namely 23%) or limited access to financing (21%). Implementation of new technologies is seen as an obstacle in the way of business expansion for 17% of the study subject while 16% of enterprises consider that the implementation of new forms of organization appears as a difficulty. Lack of quality management is considered a problem only 11% of companies interviewed.
If we have identified the main problems that SMEs face in the European Union member states when seeking to extend their activity, we will continue with the main support measures offered by the European Union. As I said SMEs play an important role in the European Union so that it has adopted a series of measures to support the SMEs activities.
Measures to support SMEs
To help small and medium-sized enterprises the European Commission has appointed a representative for SMEs, which has the role of an interface with the business environment for SMEs and intervenes to defend their interests in the legislative process. He communicates to the Commission the impact that legislative proposals may have on small and medium enterprises, and thus permit the development of EU policies more favorable to SMEs.
In addition to appoint this representative the European Commission has put in place a series of policies for information and specific support to help SMEs in Europe. These policies aimed at creating conditions in which SMEs can be more easily created and can develop their activity.
The Small Business Act for Europe reflects the Commission's policy to recognize the central role of SMEs in the EU economy and for the first time lays the foundations for a comprehensive policy for the EU and its Member States relating to small and medium enterprises.
It aims to improve the overall approach to entrepreneurship, to promote the "Think small first" principle, starting from the development of policies governing the public service and promoting the growth of SMEs by helping them to approach the problems which make harder their development.
The Small Business Act for Europe, apply to all companies that are independent and have less than 250 employees, and take into account several aspects such as:
1. Less and better regulations
The cost of the administrative procedures for a small company can be up to ten times higher than that borne by a large company which makes this burden disproportionately heavy for small businesses. That is why the European Commission has set two goals: to reduce the administrative burden on enterprises by 25% before 2012 and to ensure new legislation friendly to SMEs. To achieve this, the Commission has sought to simplify and improve European legislation, and encouraging national and regional authorities to do the same.

VALENTINA DIANA IGN ĂTESCU
170
However, this can be achieved only if national, regional and local authorities act together with the European Commission. Until now, 18 Member States have set national targets for reducing administrative burdens.
An example of a measure already put in place by the European Commission is that it has simplified the legislation on SMEs in the pharmaceutical sector, by reducing taxes for micro-enterprises, granting permission to defer payment of fees or offering administrative assistance in case they applied to the European Medicines Agency.
Referring to the implementation of better regulations we can remember the measures adopted by the European Union to protect SMEs from late payments. To achieve this purpose the Commission has considered the review of Directive 2000 to simplify and clarify some issues relating to payment of interest. This should discourage late payments and to ensure that SMEs are paid on time for all commercial transactions.
It is also important that SMEs are aware of international and European standards and to integrate the product specifications so that their products are competitive on international markets. To ensure this thing there are taken into account the needs of SMEs when are developed the standards and more than this the European Commission doubles its financial assistance to promote the interests of SMEs. There are also prepared measures to guide and support SMEs throughout all the standardization process.
2. Improving access to finance
Given that the financial markets fail to provide to SMEs the financing they need, the European Commission has developed and financed a number of financial instruments such as guarantees to facilitate access of SMEs to loans granted by banks. The European Commission also facilitated the investment of venture capital in SMEs.
During 1998-2006 over 744 million euro were granted to approximately 360.000 SMEs. This amount increased to more than one billion Euros in the framework of the Competitiveness and Innovation (CIP) for 2007-20135. The new funds should allow financial institutions to provide approximately 30 billion Euros to 475.000 SMEs in Europe.
Financial instruments cover different needs of SMEs whether they are new established or there are companies that already have experience:
- The facility to increase and develop the SMEs provides venture capital for innovative SMEs in the early stages and expansion phase.
- The guarantee facility for SMEs provides loan guarantees to encourage banks to offer more ways of funding available for SMEs, including micro-credits by reducing the risk exposure of banks.
5 European Commission, Europe is good for SMEs, SMEs are good for Europe, 2008, pag. 11

MEASURES TO SUPPORT SMEs IN THE EUROPEAN UNION
171
Also, the European Commission sought to increase SMEs' access to micro-loans (loans that are less than 25.000 euro) through financial instruments, and encourages Member States to increase and facilitate the provision of micro credits for small businesses.
European Investment Bank (EIB) extends the way in which supports SMEs by simplifying its funding mechanisms, making them more transparent and targeted to individual needs of small businesses in Europe.
Many SMEs are not aware of the financial instruments available to them or how to access them. Therefore throughout 2008-2009 the Commission is organizing “EU Finance Days for SMEs” in the Member States. These events bring together SMEs and national financial intermediaries to raise awareness about the different sources of finance and share good practices in helping innovative SMEs get easier access to finance.
3. Helping SMEs to do business abroad
One of the biggest successes of the EU was to make cross-border trade easier by creating a single market with 500 million consumers. This offers to enterprises the opportunity to sell a product throughout the EU without the need for adaptation at the national level. The single market of SMEs offers huge opportunities for growth, and the expansion that have occurred have multiplied the opportunities for business for SMEs.
But now, 63% of SMEs are active only in the home country and only 8% of SMEs in Europe export. Part of the problem of SMEs is the lack of information; they should know what opportunities are out there and what the rules for business transactions are. Many SMEs also face a lack of capital required for exit abroad. Therefore, SMEs need support and advice to benefit fully from the Single Market.
Thus, a vast network of business support was established by the European Commission to advise and assist European SMEs to overcome the difficulties they face.
Also, the European Commission helps companies to have access to markets outside the European Union, by businesses support center which are established in China and India. These centers are designed to help SMEs in the EU who wish to establish their units and to sell products in those countries.
SMEs can also benefit from programs like Gateway to Japan, LA invest (Latin America), Pro-Invest (ACP country) and ETP Japan and Korea as well as new training program in China for young managers.
4. Ensuring fair competition
A single market open and competitive offers the best guarantee for European SMEs which aim to increase their efficiency and their potential for innovation. So, the EU has established a strong competition policy that protects SMEs against unfair practices charged by other companies.
VALENTINA DIANA IGN ĂTESCU
172
A particular area in which the European Commission focuses is to prevent the situations in which dominant firms’ abuse by their power on the market and stifle smaller competitors. This type of anti-competitive practice is prohibited under EU law. The European Commission will pay particular attention to complaints made by smaller businesses in this area.
In addition, EU policy on state aid deals favorable the SMEs, recognizing the specific difficulties that they face due to their size. SMEs are allowed to receive a larger proportion of state aid than larger firms in many areas. They may benefit from certain types of support aimed at addressing their specific needs (consultancy services, or their first participation in fairs for example).
Also Member States may grant aid for SMEs, without the need for notification the European Commission. The Commission’s new State Aid Action Plan reinforces this approach. 5. Education and skills for Entrepreneurship
Here we can remember the European Union program aimed at education and skills for entrepreneurs. Entrepreneurs will play a crucial role in creating jobs and stimulating economic growth and competitiveness of the European economy in the coming years. One of the priorities of the European Union is to stimulate people into a strong desire to become entrepreneurs; so, the European Commission is working closely with the governments of EU member countries to achieve this goal.
Europe needs more entrepreneurs. The European Commission considers that it is necessary to create a favorable attitude towards entrepreneurs by promoting them as models, through the celebration of their success and by seeking to reduce the fear of failure.
To achieve this, on the one hand, the Commission is working with national governments to make business education an integral part of the curriculum at all levels of education.
On the other hand, the European Commission is launching a new mobility recently established that will support entrepreneurs in cross-border activities. This mobility implies that entrepreneurs can spend some time in an SME from another country, which will give them the experience and the capacity of understanding and will enable them to upgrade their skills. It will also stimulate new businesses opening in the EU and will contribute to the creation of networks of SMEs. Also, to improve the image of entrepreneurs in society, the European Union has organized the first European Week for SMEs in the period 6-14 May 2009 and it has proposed to inform SMEs about the support system for small businesses at European and national level and also encourage more people to become entrepreneurs. This took the form of an information campaign with a series of events that took place throughout all the Europe.

MEASURES TO SUPPORT SMEs IN THE EUROPEAN UNION
173
6. Facing environmental challenges together
Demand for environmentally friendly products and services is increasing, opening the way for new business opportunities. But environmental legislation is becoming more complex, and the costs of non-compliance higher. So, the lack of information, insufficient expertise, and scarcity of resources make it difficult for SMEs to comply with environmental legislation.
To help them the EU is training environmental experts in business support organizations such as business associations and chambers of commerce. The European Commission is funding environmental experts within the new Enterprise Europe Network who can help small businesses through on-site visits, information and expertise.
Also, the EU is providing focused financial assistance:
- The EU’s Research and Development Framework Programme for 2007-2013 provides funding for research projects in the environmental field. SMEs do not necessarily need their own research capacity to participate in the programme.
- Eco-innovation activities also benefit from a budget of 430 million euro under the Competitiveness and Innovation Programme (CIP) for 2007-2013. Half of these funds are in the form of financial instruments managed by the European Investment Fund, while the other half will be used to co-finance projects concerned with the first application or market replication of promising innovative eco-technologies.
- A further 730 million euro from the Competitiveness and Innovation Programme has been earmarked for projects in the field of energy efficiency and renewable energy. These funds are managed by the Executive Agency for Competitiveness and Innovation.
- The European Commission requires Member States to reserve part of their Structural Funds expenditure (2007-2013) for assistance to SMEs in the promotion of environmentally friendly products and production processes, such as effective environmental management systems, pollution-prevention technologies, and the integration of clean technologies into production processes.
Conclusions
As we could see the European Union is aware of the primordial role that all SMEs play in the economy, but also is aware of the problems they face even from their setting up and to when they want to expand.
It is known that the local business environment has a significant effect on small businesses, wherever they are located. Thus the EU is implementing policies to support and enhance economic competitiveness; policies are increasingly determined and implemented both locally and regionally.

VALENTINA DIANA IGN ĂTESCU
174
The European Union has developed several tools to encourage development of regional initiatives to support regional players, and to promote networking between different regions of the Union. These tools encourage entrepreneurs, support new businesses and make SMEs more competitive.
Spending focuses on measures to help SMEs develop, such as innovation, financing and business support. All regions are eligible for funding from the Structural Funds. In the less economically developed regions, SMEs can receive direct support, under certain conditions, whereas in the rest of the EU, support is mainly available to business associations, support agencies, local administrations and other intermediary structures. In all regions, the Structural Funds focus on measures such as the co-financing of business incubators, advisory, training and financing schemes for SMEs, technology transfer, and SME clustering and networking.
In conclusion we can say that all these instruments used by EU grants to small and medium enterprises notable advantages, finding the best answer to most of the problems that the small entrepreneurs face throughout the business. Many of the difficulties mentioned in the paper could be resolved by these measures, only that they have to be promoted more for the entrepreneurs from all Member States to be aware of all benefits that are granted, and even to have the courage to use them for their business grow.
REFERENCES 1. European Commission, Europe is good for SMEs, SMEs are good for Europe, 2008
2. Carta albă a I.M.M.-urilor din România, 2006
3. Flash Eurobarometer, no. 196, Observatory of European SMEs, Summary
4. Audretsch, David, et. al., First section of the annual report on EU Small and Medium-sized Enterprises, 2009
5. *** http://ec.europa.eu/enterprise/index_ro.htm

STUDIA UNIVERSITATIS BABEŞ-BOLYAI, NEGOTIA, LV, 1, 2010
WILL THE ROMANIAN SMEs BE LISTED ON THE BUCHAREST STOCK EXCHANGE?
CRISTINA CURUłIU1
ABSTRACT. The research provides a selective overview of the existing information regarding the SMEs’ trading on the Bucharest Stock Exchange. Due to the fact that the Romanian SMEs’ needed a different type of financing among the ones that already existed, the discussions regarding their trading started in 2005, but with no concrete result until now. Following, a review of the facts that occurred related to this subject will be presented. The last part of the article will present the conclusions that can be drawn and the SMEs’ present situation related to the Bucharest Stock Exchange.
Key words: SMEs’, Bucharest Stock Exchange, capital market, SMEs’ financing
JEL classification: M21, G10, G32
Introduction
Even if the Romanian SMEs’ benefit from a series of financing programs, in 2005 it was announced that the SMEs’ will be listed on the Bucharest Stock Exchange in order to obtain more financing. From that moment on different measurements were taken so that this thing could happen, but until now there can be observed no result. A new sector was supposed to be created for this type of societies, called “new market”. The idea was taken from the others stock exchanges in the region, for example the Greek Stock Exchange, where this model has already been implemented. But, as I said before, none of thing facts happened. In present, the Romanian SMEs’ are not traded on Bucharest Stock Exchange, and the “new sector” does not exist, thus this societies have to already existing financing programs.
Material and methods
The research, in the first part, provides a selective overview of the existing information regarding the SMEs’ trading on the Bucharest Stock Exchange. The second part refers to the discussions and to the actions that were taken into considerations regarding this topic and also presents a review of the facts that occurred since 2005 (when the discussions about the SMEs’ trading started). The last part will present the conclusions that can be drawn and the SMEs present situation related to the Bucharest Stock Exchange and their trading. 1 Teaching Assistant, PhD Student, Faculty of Business, Babeş-Bolyai University of Cluj-Napoca,

CRISTINA CURUłIU
176
Discussions
In 2005, the general manager of BVB, Stere Farmache announced that "the SMEs will be listed on the Bucharest Stock Exchange on a special market". The Bucharest Stock Exchange has met the assignees of the small and medium sized enterprises and discussed the listing of these companies on the stock market. Stere Farmache says that there will be created a special market for the SMEs, where the terms will be less restrictive than those on the regulated market, in the matter of the social capital and periodical reports that those companies must present.
The Bucharest Stock Exchange will launch, in the context of the securities sector issued by the Romanian legal entities, a new category for the small and medium sized enterprises. The new category, called “New Market”, is under construction and will function in the context of the Romanian securities sector. Stere Farmache showed that the new segment will be addressed to small and medium companies that do not have a history, but represent dynamic areas of economy, with growth perspectives and credible and viable business plans.
He also added that the implementation of this category corresponds to the necessities of Romanian companies that need financing. The Bucharest Stock Exchange represents an important vehicle by which these companies can assure their financing, so that subsequently they would be able to find their place on the capital market.
In building the "New Market", a model applied on other stock markets in the area will be followed. Therefore, a memorandum with the Greek Stock Exchange (where a similar model was implemented) was concluded. "We are working on this project and it will be finalized after we will reorganize the entire stock exchange annuity that is after the merger between Bucharest Stock Exchange and Rasdaq. We have already started consulting with potential issuers", Farmache concluded.
Nowadays, the Bucharest Stock Exchange annuity is structured in three sectors, such as equities, debt securities and collective investment undertakings.
It was also said that through the agreement signed between the SMEs’ ministry and Bucharest Stock Exchange, they are going to try to start a programme that will support the small and medium sized enterprises that are eligible and want to be listed on the Bucharest Stock Exchange.
Stere Farmache said that the companies listed at this category must have minimum one year of activity, and the capital limit will be established by the development level. The financial demands can’t be as detailed as those for a company listed on the 1st category.
In 2007, 1500 SMEs had financial benefits from the ministry and the year 2008 brought the launch of a new programme called “Increasing of the Economic Competitiveness”.
For 2008 small entrepreneurs had about 100 million lei at their disposal from the SMEs ministry funds. The development of the commerce for products and services receives the largest amount, namely 30 million lei, while supporting the foundation of SMEs receives 25.4 million lei. Also, the support through funds resulted from the reinvestment of the profit will benefit from a budget of 20 million lei.

WILL THE ROMANIAN SMEs BE LISTED ON THE BUCHAREST STOCK EXCHANGE?
177
Most of the money came from the European Union. For 2008, the SMEs’ ministry announced that over 800 million euros were available through the “Increasing of Economic Competitiveness” programme. A great part of this amount came from non-refundable funds. For the region Bucharest – Ilfov, the amount of the non-refundable financial allowance came up to 60% of the investment value for the small enterprises, while in the other regions the percentage was of 70%. For the medium sized enterprises the allowance decreased by 10%, respectively 50% for Bucharest – Ilfov and 60% for the others. The expenses related to the development strategies, to the financial analysis, to the feasibility studies and to the development plans could be also settled through this programme. It is very important the fact that, once a project was approved, the money had to be used according to the investment plans assumed; otherwise EU does not reimburse the investments. The rule, after which these funds are given, is that first the investments are made from their own funds and than the European money get discounted. The own funds that are necessary can be obtained from bank loans, which are guaranteed from the National Loan Guarantee Fund for Small and Medium-Sized Enterprises.
In 2007, more than 1.500 small and medium sized enterprises received financial support through financing programs of 75 million lei. “The programs of financial support developed by the ministry aimed the entrepreneurial spirit development, the investments in modernization and technological upgrade, the export support and quality implementation system, as well as to facilitate the access of the small and medium sized enterprises to the training and consultancy services”, as stipulated in an official statement of the Ministry for Small and Medium Sized Enterprises, Commerce, Tourism and Liberal Professions. Most of the money was used for the investments program of the new created companies and for modernization. This program received 43.6 million lei. In order to achieve this, the ministry had concluded cooperation agreements with nine banks that will ensure the financing, and nearly 2.200 companies handed projects in order to obtain the non refundable financial allowances. Moreover, the ministry assigned other 9.6 million lei for the payment of some amounts regarding the reinvested profit. The development of the activities of commerce with products on the market has beneficiated of funds of 6 million lei, while for the support of the SMEs in developing their exports; 8 millions lei have been assigned.
An important step for the SMEs was the announcement made by Ovidiu Silaghi, the SMEs minister, according to whom five such companies want to be listed on the Bucharest Stock Exchange in 2008. “I believe that the listing on the stock exchange for the first Romanian SMEs will be possible at the end of January or early February 2008. I think that because the Stock Exchange has no restrains, they were interested in this process. The only ones who put obstacles are the entrepreneurs who do not understand that they can also get capitalization from the stock market or that the association is beneficial”, recently told Silaghi. For this step, a team from the ministry went to Poland in order to learn from their experience related to

CRISTINA CURUłIU
178
small companies. The conditions to be listed are the following: at least three years of economic activity, a relevant business background that they must be a joint stock company, and they must have in their instruments a segment according to the NACE code. From the failures of the year 2007, may be mentioned the Sectored Operational Programme “Increasing of Economic Competitiveness”, with funds from the European Union. This programme should have been launched in 2007, but the decisions from the European Commission arrived only in 2008.
On the other hand, there can be some obstacles too. For example, listing on the stock market of the first Romanian SMEs it was said that it would be possible at the end of January or early February 2008, but this didn’t happen even if the Bucharest Stock Exchange didn’t have restrains. The only ones who put obstacles are the entrepreneurs who do not understand that they can also get capitalization from the stock market or that association is beneficial.
Five medium-sized enterprises have registered for listing on the stock exchange. The ministry for small and medium sized enterprises, commerce, tourism and liberal professions, Ovidiu Silaghi, declared that so far five Romanian SMEs want to be listed on the Stock Exchange. The process is complicated, but there is permanent contact with the Stock Exchange, in order to achieve this process. The fields of activity for the five companies are textile, mineral water and IT.
The SMEs minister stated that at the beginning of October 2008, a national tour should have began in order to conclude an agreement with Bucharest Stock Exchange and to encourage the small and medium enterprises to be listed on the stock exchange.
For this to happen Bucharest Stock Exchange said that would reduce the listing costs.
The privatization of the companies from the different ministers’ portfolio should be transparent, so that any doubt regarding the operations correctitude shall be eliminated. The minister of Small and Medium Enterprises, Commerce and Business Environment, Constantin NiŃă, sustains that it was a mistake the fact that the privatization and the public acquisitions weren’t done through the Bucharest Stock Exchange. In order to support the listing of the new companies, but also the development of some little enterprises that have potential, NiŃă specified that the Ministry wants to elaborate a law project through which the SMES will be supported in listing at Bucharest Stock Exchange. There is a project talking about this at the Business Environment Direction. It would be very good if the SMEs could be listed on Bucharest stock Exchange. A similar project was proposed in 2007 by the minister at that time, Ovidiu Silaghi, but without any finalization.
Two third of the Romanian IMM have problems with their financing, but neither the governmental measures nor the financing sources available on the market don’t seem to encourage the entrepreneurs to steady their business with money. While the Government asks the banks to ease the access to loans, the banking institutions affirm that the enterprising don’t submit investment plans and projects in order to

WILL THE ROMANIAN SMEs BE LISTED ON THE BUCHAREST STOCK EXCHANGE?
179
get the necessary financing. So, there is a vicious circle, where the SMEs passively assist at the ping-pong game between Government and banks, choosing not to touch the leasing, bank loans or European funds. Ion Glisca, the vice-president of the National Assembly of the Small and Medium Enterprises from Romania declared that “In order to survive, we have to make it on our own account and our own forces, because we have been waiting for 6 months so that the Government would take some measurements to diminish the crisis effects, but we were disappointed because nothing happened. Also, we were expecting some support from the banks where we deposed our projects more than 2 months ago, but we didn’t receive any answer”. He specified that they will like to appeal to some European founds as a last hope of salvation, but even here there are problems concerning the financing. Glisca also added that “In this period of crises the financial resources must be conserved, the investments tend to decrease and one can’t afford to extend their investment due to the lack of a cheaper lending At his turn, Florin Jianu, the president of the Young Entrepreneurs Patronage, declared that a big part of the entrepreneurs don’t want to hear about banks or banks’ loans. They rather preferred to appeal at European funds in order to avoid the bank loans and to encourage the young entrepreneurs to access European money because these are the cheapest financing sources, and they also offer the necessary money for this period of crises. The SMEs minister, Constantin NiŃă considers that it will be great if we could impulse the SMEs activity on stock exchange. The privatizations and the public acquisitions should be done through the Bucharest Stock Exchange because any suspicion regarding the operations correctitude shall be eliminated. They should use Bucharest Stock Exchange for these operations because this is one of the most transparent institutions and there will always be people claiming the correctness of the privatizations and public acquisitions. On the other hand, the law project through which the SMEs shall be sustained to be listed on Bucharest Stock Exchange is a working one since 2005 and until now nothing concrete has been done. Regarding the SMEs impulsion, NiŃă announced that a second anti-crises plan will be operational in the second semester of the year 2009, and will include both the CEC and Eximbank’s capitalization, the development of a Loan Guarantee Fund for the SMEs and of a risk investment fund. The plan isn’t finished yet and the government is thinking of a new way of supporting the SMEs. Only a few of the Romanian SMEs can be listed on the Bucharest Stock Exchange, even if the Ministry of SMEs, Commerce, Tourism and Liberal Profession discussed the adoption of some measurements which could facilitate the annuity of these enterprises at the Bucharest Stock Exchange. “The attempt of SMEs ministry to facilitate the listing of the small and medium enterprises at the Bucharest Stock Exchange is a good one, but, a small number of enterprises will succeed to be listed. They have to fulfill the performances demanded by Bucharest Stock Exchange. They also have to want to be listed, as

CRISTINA CURUłIU
180
they have to adopt a special behavior, to report any change that might occur and to offer reports regarding the financial results and the decisions taken in the society. The SMEs ministry proposed to the assignees of Bucharest Stock Exchange to reduce the 1 million euro limit regarding the registered capital needed for the companies that are listed. “By this proposal, we try to create an exercise market for the small and medium enterprises, in which the costs are more reduced. The capitalization that can be obtained on the Bucharest Stock Exchange represents an important source for the development of the SMEs area”, said Ovidiu Silaghi. Once the SMEs will be listed they have to become joint stock companies.
Conclusions
Even if in 2005 it was announced that the SMEs will be listed on the Bucharest Stock Exchange on a special market and that a new category, called “New market”, for the small and medium sized enterprises will be launched, until now none of these things happened. For the Romanian SMEs, their listing on the Bucharest Stock exchange can be seen as an alternative financing programme, among the bank loans or the European funds. In order to be listed the SMEs have to fulfil Bucharest Stock Exchange requests: to adopt a special behavior, to report any change that might occur and to offer reports regarding the financial results and the decisions taken in the society and to become joint stock companies. Another reason for which the SMEs listing didn’t happen could be the financial crises. Thus, for the second semester of the year 2009, an anti-crisis project is in a working stage. In conclusion, nowadays, the Romanian SMEs can obtain better financing from the European funds than from their listing on the Bucharest Stock Exchange, due to the fact that the investors in this crises period are watching more carefully every step that is made on the capital market and, especially, the companies in which they invest.
REFERENCES 1. Budurca, D., 2005, “O nouă categorie de listare la Bursa de Valori Bucureşti pentru
IMM-uri”, http://www.wall-street.ro/articol/Finante-Banci/2947/O-noua-categorie-de-listare-la-Bursa-de-Valori-Bucuresti-pentru-IMM-uri.html;
2. Cioltei, D., 2007, “IMM, încurajate să se listeze”, http://www.infonews.ro/art_82380_-IMM_%C3%AEncurajate_s%C4%83_se_listeze.html;
3. Iana, F., 2005, “BVB va lansa o categorie de listare pentru IMM”, http://www.9am.ro/stiri-revista-presei/2005-05-11/bvb-va-lansa-o-categorie-de-listare-pentru-imm.html;
4. Orjanu, R., 2009, “Imm-urile sprijinite pentru listarea la BVB”, PiaŃa de capital, http://www.sfin.ro/articol_16335/imm-urile_sprijinite_pentru_listarea_la_bvb.html;

WILL THE ROMANIAN SMEs BE LISTED ON THE BUCHAREST STOCK EXCHANGE?
181
5. Rompress, “AOAR: PuŃine IMM-uri se vor putea lista la BVB”, http://stiri.portal.ro/home/citeste_stire/49734/aoar-putine-imm-uri-se-vor-putea-lista-la-bvb.htm;
6. ***, 2009, “Ni Ńă: Privatizările şi achiziŃiile publice ar trebui făcute pe bursă, pentru eliminarea suspiciunilor”, http://www.zf.ro/zf-24/nita-privatizarile-si-achizitiile-publice-ar-trebui-facute-pe-bursa-pentru-eliminarea-suspiciunilor-4414988;
7. ***, 2007, “BVB aşteaptă listarea IMM-urilor”, Business Standard, http://www.hotnews.ro/stiri-arhiva-1021570-bvb-asteapta-listarea-imm-urilor.htm;
8. ***, 2009, “Privatizările şi achiziŃiile public ear trebui făcute pe bursă”, http://www.mediafax.ro/economic/privatizarile-si-achizitiile-publice-ar-trebui-facute-pe-bursa.html?1686;4414835;
9. ***, 2009, “FinanŃarea IMM, un ping-pong între bănci şi Guvern care îi lasă reci pe antreprenori”, newschannel.ro, http://www.newz.ro/stire/88624/finantarea-imm-un-ping-pong-intre-banci-si-guvern-care-ii-lasa-reci-pe-antreprenori.html;