HIV1 Nef disrupts MHC-I trafficking by recruiting AP1 to the MHC-I cytoplasmic tail
Upload
khangminh22Category
view
1download
0
as at 31/12/17
Fonds Commun de Placement
Database Publishing System: CO-Reporter® by CO-Link, Belgium.
Audited annual report
NEF
R.C.S. Luxembourg K1098
NEF
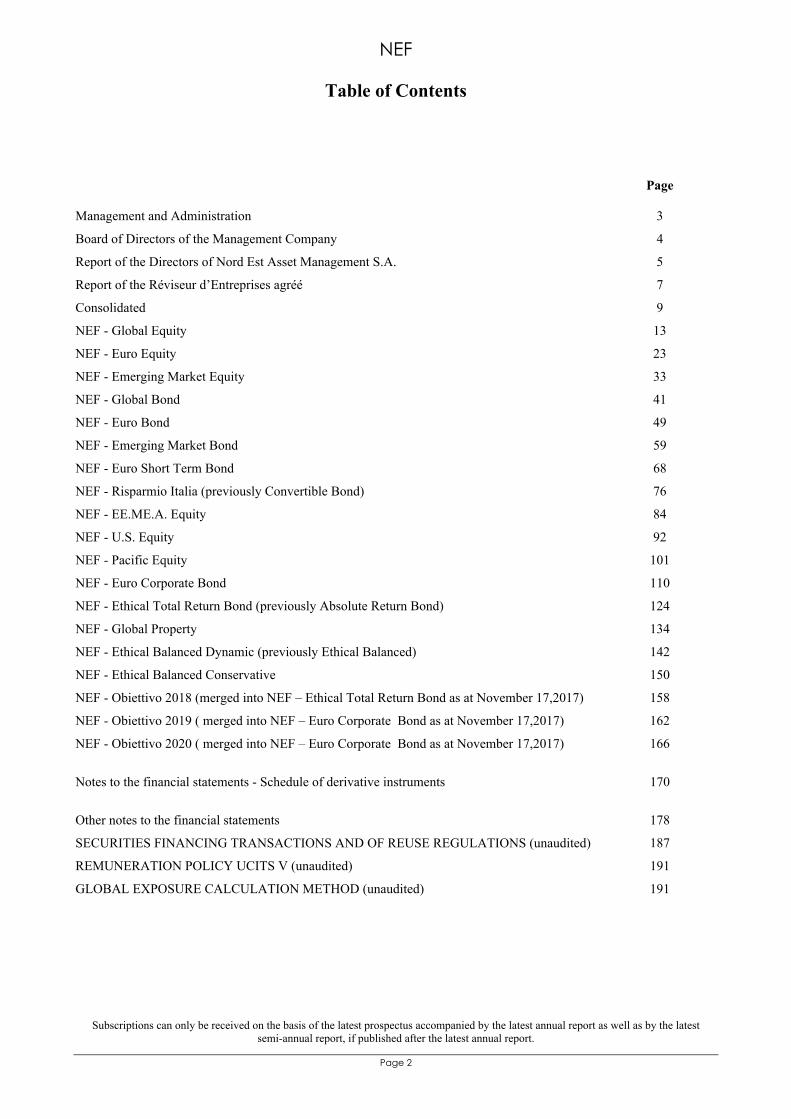
Table of Contents
Page 2
Page
Management and Administration 3
Board of Directors of the Management Company 4
Report of the Directors of Nord Est Asset Management S.A. 5
Report of the Réviseur d’Entreprises agréé 7
Consolidated 9
NEF - Global Equity 13
NEF - Euro Equity 23
NEF - Emerging Market Equity 33
NEF - Global Bond 41
NEF - Euro Bond 49
NEF - Emerging Market Bond 59
NEF - Euro Short Term Bond 68
NEF - Risparmio Italia (previously Convertible Bond) 76
NEF - EE.ME.A. Equity 84
NEF - U.S. Equity 92
NEF - Pacific Equity 101
NEF - Euro Corporate Bond 110
NEF - Ethical Total Return Bond (previously Absolute Return Bond) 124
NEF - Global Property 134
NEF - Ethical Balanced Dynamic (previously Ethical Balanced) 142
NEF - Ethical Balanced Conservative 150
NEF - Obiettivo 2018 (merged into NEF – Ethical Total Return Bond as at November 17,2017) 158
NEF - Obiettivo 2019 ( merged into NEF – Euro Corporate Bond as at November 17,2017) 162
NEF - Obiettivo 2020 ( merged into NEF – Euro Corporate Bond as at November 17,2017) 166
Notes to the financial statements - Schedule of derivative instruments 170
Other notes to the financial statements 178
SECURITIES FINANCING TRANSACTIONS AND OF REUSE REGULATIONS (unaudited) 187
REMUNERATION POLICY UCITS V (unaudited) 191
GLOBAL EXPOSURE CALCULATION METHOD (unaudited) 191
Subscriptions can only be received on the basis of the latest prospectus accompanied by the latest annual report as well as by the latest semi-annual report, if published after the latest annual report.

NEF
Management and Administration
Page 3
REGISTERED OFFICE Nord Est Asset Management 5, Allée Scheffer L-2520 Luxembourg MANAGEMENT COMPANY Nord Est Asset Management S.A. 5, Allée Scheffer L-2520 Luxembourg INVESTMENT MANAGERS Vontobel Asset Management AG (until August 2017) Gotthardstrasse 43, CH-8022 Zürich, Switzerland Amundi (until August 2017) 90, Boulevard Pasteur F-75015 Paris, France Amundi - London Branch 41 Lothbury EC2R London, United Kingdom Raiffeisen Kapitalanlage-Gesellschaft m.b.H Mooslackengasse 12, A-1190 Wien, Austria Union Investment Luxembourg S.A. 308, Route d’Esch, L-1471 Luxembourg Franklin Advisers, Inc (until August 2017) One Franklin Parkway San Mateo, California 94403, United States BlackRock Investment Management (UK) Limited 33 King William Street, London EC4R 9AS, United Kingdom Vontobel Asset Management Inc. 1540 Broadway, 38th Floor New York, NY 10036, United States BNP Paribas Asset Management France. 14, Rue Bergère, F-75009 Paris, France Schroder Investment Management Limited 31 Gresham Street, London EC2V 7QA, United Kingdom Deutsche Asset Management Investment GmbH. Mainzer Landstraße 178-190, 60327 Frankfurt am Main, Germany
FIL Pensions Management Oakhill House 130 Tonbridge Road Hildenborough Tonbridge, Kent TN11 9DZ, United Kingdom BNP Paribas Asset Management UK Limited 5 Aldermanbury Square London EC2V 7BP, United Kingdom Amundi SGR S.p.A Piazza Cavour Conte Camillo Benso, 2 IT-20121 Milano, Italy Eurizon Capital SGR S.p.A.(since August 2017) Piazzetta Giordano Dell'amore, 3 20121 Milan, Italy MFS International (U.K.) Limited (since August 2017) One Carter Lane, London, EC4V 5ER, United Kingdom AUDITOR KPMG Luxembourg, Société cooperative 39, Avenue John F. Kennedy L-1855 Luxembourg DISTRIBUTORS Cassa Centrale Banca - Credito Cooperativo del Nord Est S.p.A. Via Segantini, 5 IT-38100 Trento, Italy ALLFUNDS BANK S.A. Calle Estafeta 6, 28109, Albcobendas, Madrid, Spain ALLFUNDS INTERNATIONAL S.A. 30, Boulevard Royal L-2449 Luxembourg Attrax S.A. 308, route d’Esch L-1417 Luxembourg SUB-INVESTMENT MANAGERS FIL Investment Management (Hong Kong) Ltd 17th Floor, One International Finance Centre 1Harbour View Street, Central Hong Kong FIL Investments International Oakhill House 130 Tonbridge Road Hildenborough Tonbridge, Kent TN11 9DZ, United Kingdom

NEF
Management and Administration
Page 4
SUB-INVESTMENT MANAGER MFS Institutional Advisors Inc.(since August 2017) 111 Huntington Avenue Boston, MA 02199-7632, United States DEPOSITARY AND CENTRAL ADMINISTRATION AGENT CACEIS Bank, Luxembourg Branch 5, Allée Scheffer L-2520 Luxembourg
Board of Directors of the Management Company CHAIRMAN OF THE BOARD Mr Paolo Crozzoli, Independent Director VICE - CHAIRMAN OF THE BOARD Mr Mario Sartori, General Manager Cassa Centrale Banca - Credito Cooperativo del Nord Est Via Segantini, 5 IT-38100 Trento, Italy DIRECTORS Mr Vincent Linari-Pierron Independent Director 252 avenue Gaston Diderich, L-1420 Luxembourg Mr Fabio Colombera, General Manager (until April 4, 2017) Federazione Veneta Banche Di Credito Cooperativo Via Longhin, 1 IT-35129 Padova, Italy Mr Antoine Gilson De Rouvreux (until May 10, 2017) Independent Director Mrs Josée Lynda Denis (starting from May 10, 2017) Independent Director Mr Tiziano Cenedese (starting from November 21, 2017) Federazione Veneta Banche Di Credito Cooperativo Via Longhin, 1 IT-35129 Padova, Italy

Registered Office: 5 Allée Scheffer, L-2520 Luxembourg, fax 00352.47.67.48.94 RCSL n°B 69.705 VAT number LU 21817233
Page 5
Report of the Directors of Nord Est Asset Management S.A. The Board of Directors of Nord Est Asset Management S.A. (NEAM) is pleased to present the Annual Report of NEF fund for the year ended 31 December 2017. Financial Market Trend In 2017, the financial and macroeconomic events which mainly influenced the financial market trend were the gradual, accelerated and synchronized global growth; the improvement of the global trade as a result of the emerging economies recovery; the better trend of raw material prices, especially the oil’s; the Central Banks’ expansive monetary policies. On the other hand, 2017 was destabilized because of some political events: the U.S. presidential elections, under justice investigations, and with the threat of the Russian interference; the difficult management of the Brexit; the Syrian war which caused the worsening of the U.S.A.-Russia relations; the verbal exchanges between the U.S.A. and North Korea; Mr. Macron’s victory in France and the “non-victory” of Mrs. Merkel in Germany; the anti-European movements, culminating in the referendum vote in Catalonia and finally the several terroristic attacks.
Monetary Policy After having increased interest rates in December 2015 and then again in December 2016, the Federal Reserve increased them of 25 basis points for three times (in March, June and December) in 2017. As from 13 December, federal funds rate has amounted to between 1,25% and 1,50%, showing trend acceleration compared to the past two years. It reflects the FED certainty that economy is well on the way to achieve the full employment and inflation control goals. In December, Mrs. Yellen recognized that inflation was lower than expected and more time could be necessary to reach 2% inflation objective. Nevertheless, the FED has reaffirmed its intention to continue to increase its key rates, considering three increases for 2018. The European Central Bank has not modified its monetary policy approach, characterized by 0% interest rate for the most important refinancing operations, the marginal lending facility at 0,25% and deposits at - 0,40%. The ECB means to keep these levels very low for a long period, well beyond the threshold set by the Quantitative Easing (QE) program for net acquisitions. In the period April 2016 – March 2017, those acquisitions amounted to EUR 80 billion per month. They were reduced to EUR 60 billion in April and October 2017, and the ECB has announced a new reduction to EUR 30 billion per month, starting from January 2018. The current QE, into force as from March 2015, will last until September 2018 at least, and it won’t be stopped suddenly; if at all, it will be changed depending on the eventual pro tempore needs. The Bank of Japan has been adopting a monetary expansion policy as well, despite of the problems at operational level, due to the quantity and quality of securities which could be purchased. Compared to the FED, ECB and BOJ decisions, the Bank of England has been facing the opposite situation, because of the pound weakness influencing inflation rate, increased up to 3,1%, thus above the threshold of 3%. For this reason, during the meeting of 2 November, it was decided to increase interest rates of one-quarter percentage point. Equity markets An upward trend, as a result of Mr. Trump election, continued in the first part of 2017. In three months, global equities increased by 5,85% (MSCI World USD) and emerging market equities by 11,15% (MSCI EM USD). Then, this positive trend slowed down until the victory of Mr. Macron, seen as a pro-European candidate, in France. During the summer, the geopolitical situation affected equity securities: investors were concerned by the verbal escalation between Pyongyang and Washington, after North Korea new nuclear and missile tests. Nevertheless, market hesitations did not last long and volatility, although present, did not increase much, making a final rush possible at the end of the year, when it was clear that tax cuts, promised by Mr. Trump’s administration, would have been implemented. In twelve months, in the emerging markets, international equity securities increased by 21,6% and 34,4%, after several year of underperformance. In particular, Asian markets outperformed significantly. The main developed market variations were: + 19,4% for the S & P 500, which established new historical records; + 19,1% for the Nikkei 225, with the highest level from the beginning of December 1992 and + 6,5% (only) for the EuroStoxx 50, being affected by the EUR appreciation (+ 13,7% compared to the US dollar).

Registered Office: 5 Allée Scheffer, L-2520 Luxembourg, fax 00352.47.67.48.94 RCSL n°B 69.705 VAT number LU 21817233
Page 6
Bond Markets In 2017, certain volatility affected bond markets, due to both negative and positive occurrences, even though no particular upheavals closed the year. The U.S.A. ten-year interest rate remained fairly stable, fluctuating from minimum 2,30% to maximum 2,65% until the end of March. A rather calm period followed, and then, from September, interest rate gradually decreased up to 2,41% in the end of the year, when Mr. Trump’s tax reform was implemented. On the contrary, volatility in European bond markets was caused by Eurosceptic movements and the expectation of an inflation closer to the level fixed during the summer. The ECB was able to calm the market, limiting possible damages, by handling communications just fine. Thanks to it, at the end of 2017, Germany ten-year interest rate was about 10 cents higher than the previous year. The other country ten-year rates acted in the same way, also being characterized by the different spreads connected to the underling risk. Currency At the beginning of January, as consequence of the strong US dollar appreciation following Mr. Trump election, EUR/USD exchange rate was lower than 1,04 (such a threshold was not seen since the beginning of 2013). Subsequently, it improved until the summer months, when exchange rate increased up to nearly 1,20, due to the mounting of geopolitical tensions between the U.S.A./Korea-Russia. Also the claims about its own monetary policy by ECB have contributed to this raise. Rather irregular changes of EUR/USD exchange rate characterized the last quarter of 2017, as consequence of conflicting monetary policies adopted by the FED and ECB (and the related reactions to them). At the end of the year, it exceed 1,20 USD. In twelve months, compared to the US dollar, the euro increased by 13,7%: it was the strongest increase among the G10 currencies. NEF Assets NEF assets increased by 6.44 % to € 2,758,164,417, while shares reached 195,098,132, increasing by 0.67%. AUM increased by € 166,789,201, as a result of the net collection amounting to € 55,087,069 with a contribution by the market of € 111,702,132. On behalf of the Board of Directors of Nord Est Asset Management S.A.

Page 7
KPMG Luxembourg, Société coopérative 39, Avenue John F. Kennedy L-1855 Luxembourg
Tel.: +352 22 51 51 1 Fax: +352 22 51 71 E-mail: [email protected] Internet: www.kpmg.lu
KPMG Luxembourg, Société coopérative, a Luxembourg entity and a T.V.A. LU 27351518 member firm of the KPMG network of independent member firms R.C.S. Luxembourg B 149133 affiliated with KPMG International Cooperative (“KPMG International”),
To the Unitholders of NEF 5, Allée Scheffer L-2520 Luxembourg
REPORT OF THE REVISEUR D’ENTREPRISES AGREE
Report on the audit of the financial statements
Opinion
We have audited the accompanying financial statements of NEF (“the Fund”) and each of its sub-funds, which comprise the statement of net assets and the securities portfolio as at December 31, 2017 and the statement of operations and changes in net assets for the year then ended, and notes to the financial statements, including a summary of significant accounting policies.
In our opinion, the accompanying financial statements give a true and fair view of the financial position of NEF and each of its sub-funds as at December 31, 2017, and of the results of their operations and changes in their net assets for the year then ended in accordance with Luxembourg legal and regulatory requirements relating to the preparation of the financial statements.
Basis for opinion
We conducted our audit in accordance with the Law of 23 July 2016 on the audit profession (“Law of 23 July 2016”) and with International Standards on Auditing (“ISAs”) as adopted for Luxembourg by the “Commission de Surveillance du Secteur Financier” (“CSSF”). Our responsibilities under the law of 23 July 2016 and ISAs and standards are further described in the « Responsibilities of “Réviseur d’Entreprises agréé” for the Audit of the Financial Statements » section of our report. We are also independent of the Fund in accordance with the International Ethics Standards Board for Accountants’ Code of Ethics for Professional Accountants (“IESBA Code”) as adopted for Luxembourg by the CSSF together with the ethical requirements that are relevant to our audit of the financial statements, and have fulfilled our other ethical responsibilities under those ethical requirements. We believe that the audit evidence we have obtained is sufficient and appropriate to provide a basis for our opinion.
Other information
The Board of Directors of the Management Company is responsible for the other information. The other information comprises the information included in the annual report but does not include the financial statements and our report of Réviseur d’Entreprises agréé thereon.
Our opinion on the financial statements does not cover the other information and we do not express any form of assurance conclusion thereon.
In connection with our audit of the financial statements, our responsibility is to read the other information and, in doing so, consider whether the other information is materially inconsistent with the financial statements or our knowledge obtained in the audit or otherwise appears to be materially misstated. If, based on the work we have performed, we conclude that there is a material misstatement of this other information, we are required to report this fact. We have nothing to report in this regard.
Responsibilities of Board of Directors of the Management Company for the financial statements
The Board of Directors of the Management Company is responsible for the preparation and fair presentation of these financial statements in accordance with Luxembourg legal and regulatory requirements relating to the preparation and presentation of the financial statements, and for such internal control as the Board of Directors of the Management Company determines is necessary to enable the preparation of financial statements that are free from material misstatement, whether due to fraud or error.

In preparing the financ ial statements. the Board of Directors of the Management Company is responsible for assess ing the Fund's ability to continue as a going concern. disclosing. as applicable, mailers rclnted to going concern and using the going concern bnsis of accouming unless the Board of Directors of the Management Company either intends to liquidate the Fund or to cease operations. or has no realistic alternative but to do so.
Responsibilities of the R1h•ise11r d 'Entreprises agree ji,r tlte audit of tlte fimmcial statemellls
The objectives of our aud it arc to obtain reasonable assurance about whether the financ ial statements as :i whole :ire free from material misstatement, whether due to fraud or error. and 10 issue a report of " Rc\'iseur d'Entreprises agree" that includes our opinion. Reasonable assurance is n high level of assurance, but is not a guarantee that an audi t conducted in accordance with the Law of 23 July 2016 and with ISAs as adopted for Luxembourg by the CSSF will always detect a materinl misstatement when it ex ists. tvlisstntcmems cnn arise fro m fra ud or error and nre considered material if. indi\' idua lly or in the aggregate. they could n.:asonably be expected 10 innuence the economic decisions of users tnkcn on the basis of these fin ancial statements.
As part of an audi t in nccordnnce with the Law of 23 July 2016 and wi th ISAs as adopted for Luxembourg by the CSSF. we exercise prolcssional judgmcnt nnd 111nintnin professional skepticism throughout the audit. We also:
• ldemify and assess the risks of material misswtement of the fi n:lncial statemcllls. whether due to fraud or error. design and perform audit procedures responsive lo those risks, nnd obtain :llldil evidence that is suffic ient and approprinte to provide a basis for our opinion. The risk of not detecting a material misstnletllcnt resulti ng from fraud is higher than fo r one resulting from error. as fraud may invol\'c coll usion. forge1y . intentional otll issions. misrepresenta tions. or the override of internal comrol.
• Obtnin an understand ing of internal control relevnnt to the audit in order to design audit procedures 1ha1 arc appropriate in the circumstances. but 1101 for the purpose of c.~pressing an opinion on the effectiveness of the Fund's internal control.
• Eva luate the appropriateness of necounting pol icies used and the reasonableness of accouming estimates nnd related disclosures made by the Board of Directors of the Management Company.
• Conclude on the appropri:iteness of 13oard of Directors of the Management Company's use of the going conccm basis of accounting nnd, bnsed on the audit C\' idencc obtained. whether n materinl uncertainty exists related to events or condi tions that may cast signi fi cant doubt on the Fund's abil ity to continue as a going concern. lf we conclude that a materia l uncc11ainty exists. we arc required to draw allemion in our report of "Rcviseur d'Emreprises agree" to the related disclosures in the fin ancial Slatcmcms or. if such disclosures arc inJdcquatc. lo modify our opinion. Our conclusions arc based on the nudi t evidence obtained up to the date of our report of " Rcviseur d' Emreprises agree". I lowcvcr. future events or condit ions may cause the Fund to cease to continue as a going concern.
• Evaluate the overall prcscntn Lion. structure aud content of the fina ncial statements, including the disclosures, nnd whether the li n:mcial s tatements represent the underlying transac tions and c,·cnLs in a manner that achieves fo ir presentation.
We communicate with those charged with govcnrnnce regarding. among other matters. the planned scope and timing of the audit and signi fi cant audi t fi ndings. including any signilicrml defi ciencies in internal control that we identify during our audit.
Luxembourg. April 19. 20 18
Pa ge8

9Page
NEFConsolidated

The accompanying notes form an integral part of these financial statements
10Page
2,792,068,414.58Assets2,662,114,028.99Securities portfolio at market value 2Note2,538,875,151.93Cost price
123,238,877.06Unrealised profit on the securities portfolio47,128.01Options purchased at market value 2Note
170,844.30Options purchased at cost90,107,606.17Cash at banks and liquidities13,806,304.53Interest receivable2,751,842.99Brokers receivable3,405,347.44Subscribers receivable
898,764.07Dividends receivable5,323,098.48Unrealised net appreciation on forward foreign exchange contracts 2Note
763,923.82Unrealised net appreciation on financial futures 2Note12,674,897.95Receivable on spot exchange
175,472.13Other assets
33,903,997.64Liabilities26,582.28Options sold at market value 2Note92,647.48Options sold at cost
7,122,590.44Bank overdrafts3,599,020.71Brokers payable
322,456.41Taxe d'abonnement payable 4Note4,883,364.63Redemption payable1,282,642.43Unrealised net depreciation on forward foreign exchange contracts 2Note
187,930.17Unrealised net depreciation on financial futures 2Note181,213.23Unrealised net depreciation on swaps 2,6Note
2,925,889.64Accrued management & advisory fees 5Note89,990.30Accrued depositary & sub-depositary fees 7Note71,355.12Accrued administrative expenses6,243.89Accrued professional fees
12,664,558.05Payable on spot exchange540,160.34Other liabilities
2,758,164,416.94Net asset value
NEF
Financial Statements as at 31/12/17
Expressed in EUR
Statement of Net Assets as at 31/12/17
Consolidated

The accompanying notes form an integral part of these financial statements
11Page
69,011,585.63Income19,005,286.18Net dividends 2Note48,265,132.00Net interest on bonds 2Note
89,723.74Bank interest on cash account 2Note35.85Bank interest on time deposits 2Note
1,131,967.98Securities lending income 2,8Note13,158.81Income on repurchase agreements 2Note
318,435.81Interest on swaps28,695.90Other financial income
159,149.36Antidilution levy fees 11Note
46,627,814.04Expenses33,212,847.88Management & advisory fees 5Note1,010,111.53Depositary & sub-depositary fees 7Note1,252,921.08Taxe d'abonnement 4Note
837,510.58Administrative expenses29,508.64Professional fees
404,930.84Bank interest on overdrafts138,210.47Legal fees
2,470,828.80Transaction fees 2Note23,453.16Publication & printing fees60,878.88Bank charges
5,295,870.79Correspondent bank fees 2Note661,193.61Interest on swaps
1,229,547.78Other expenses
22,383,771.59Net income from investments
Net realised profit / loss on:96,580,347.50- sales of investment securities 2Note
-385,046.16- options 2Note12,266,585.77- forward foreign exchange contracts 2Note-6,433,920.94- financial futures 2Note1,088,381.07- swaps 2Note
-18,464,109.68- foreign exchange 2Note
107,036,009.15Net realised profit
Movement in net unrealised appreciation /(depreciation) on:-18,063,162.56- investments 2Note
47,893.44- options 2Note24,352,260.17- forward foreign exchange contracts 2Note2,821,510.89- financial futures 2Note-774,625.87- swaps
115,419,885.22Increase in net assets as a result of operations
-3,717,753.44Dividends paid 9Note1,175,089,150.71Subscription capitalisation units
362,408,074.12Subscription distribution units-976,205,089.70Redemption capitalisation units-506,205,065.71Redemption distribution units
166,789,201.20Increase in net assets
EUR
Statement of Operations and Changes in Net Assets from 01/01/17 to 31/12/17
NEFConsolidated
Expressed in

The accompanying notes form an integral part of these financial statements
12Page
2,591,375,215.74Net assets at the beginning of the year
2,758,164,416.94Net assets at the end of the year
EUR
Statement of Operations and Changes in Net Assets from 01/01/17 to 31/12/17
NEFConsolidated
Expressed in

13Page
NEF- Global Equity

NEF - Global Equity
Manager’s Report
Page 14
Equity Markets In 2017, global equity markets continued their upward trend and delivered returns of slightly above 7% for the EUR based investor. While the year experienced some volatility due to political events, overall the environment remained constructive for global equities with reasonable economic expansion and improving corporate earnings. From a macroeconomic perspective, global GDP growth was supportive with about 3.7% expansion. The US contributed positively with an acceleration to about 2.2%, while the Eurozone also improved towards 2.3% growth. The UK slowed down to roughly 1.5% as uncertainty around the framework to leave the European Union created a drag on economic activity. Japan experienced slightly improving growth of about 1.5%. Global growth was driven by Emerging Markets, which expanded more than 5% with above average growth in China of rather steady 6.7% and a decent expansion in India of about 6.8%. The new administration in the US created some uncertainty with the early failure of a major health care reform, that increased doubts about the ability to deliver on other policy initiatives. In addition, threats to global trade agreements and conflicts e.g. with North Korea led to short-term volatility. Towards the end of the year, there was a positive surprise with the significant tax reform resulting in a reduction of the US federal corporate tax rate from 35% to 21%. While global central banks continued their supportive policies to increase economic growth and inflation, the Federal Reserve in the US continued a policy of gradual rate hikes and a reduction of its balance sheet size. In contrast, both the ECB in Europe and the BoJ in Japan continued aggressive quantitative easing programs and extremely low interest rate policies. The ECB additionally provided long-term financing operations to European banks at extremely favourable conditions with the goal to boost lending. Despite the change of US monetary policy, long-term bond yields in the US barely moved, leading to a flattening of the curve. Also in Japan and Europe, bond yields were remarkably stable at historically low rates. Despite a relatively high interest rate differential between the EUR and the USD, the American currency depreciated significantly after gains in previous years. The Euro strength was partly driven by improving economic momentum as well as lower concerns regarding the overall stability of the Eurozone. For European exporters, the strength of the EUR created some headwinds compared to the favourable environment of the past that was characterized by currency tailwinds. In terms of volatility, the CBOE VIX Index, which is a measure for expected market movements, remained at a low level with a slight downward trend despite some temporary spikes, which were mainly caused by political events. For example, tensions between the US and North Korea, which included testing of ballistic missiles by the North Korean regime, led to short-term increases of volatility. U.S. equities, measured by the S&P500 Index, had a local currency total return of +21.8% in 2017, which translated into +6.9% in EUR as the USD depreciated about 14% vs. the EUR. The MSCI Europe index outpaced global benchmarks with a return of 10.2% in EUR as the strong local currency performance of other regions was offset by the strengthening of the EUR. U.K. equities showed a decent performance in local currency (+11.7%), but this reduced to +7.4% in EUR terms. Japanese stocks achieved strong returns with the Nikkei Index rising about +21.3% in local currency and still +10.3% translated into EUR. Emerging Markets outperformed global equities driven by strong local returns and mostly stronger currencies compared to the USD. On a global sector basis, there was a strong divergence of performance. The information technology sector was by far the best performer as the sector continued to deliver strong earnings growth and innovations that increased investors’ confidence in the future outlook of the industry. The cyclical materials and industrials sectors also outperformed the global averages as improving economic momentum supported the environment for companies in these areas. In contrast, defensive and interest rate sensitive sectors such as telecoms, utilities, consumer staples and real estate underperformed in this context. The energy sector was the worst performer in 2017 as the recovery of oil prices remained below expectations even though crude oil prices in USD improved by 14% for WTI and 25% for Brent. After targeting market share gains in the past, OPEC agreed to cut oil production until 2018 to balance supply and demand and to achieve better pricing. Performance review In 2017, NEF Global Equity was up +6.50%, which was broadly in-line with the performance of the MSCI World (Total Return, in EUR). Overall, the contribution from the sector and regional allocation was positive, while stock selection was also beneficial for the portfolio performance.

NEF - Global Equity
Manager’s Report (continued)
Page 15
In particular, the underweights in energy, real estate and telecoms contributed positively. Furthermore, the overweight in technology had a positive impact. In contrast, the overweight in consumer staples was a negative factor for active returns. On a regional basis, the contribution from the allocation effect was slightly positive. While the modest underweight in the US contributed negatively, an overweight in Emerging Markets and an underweight in the UK had a positive impact on the portfolio performance. Outlook Global equity markets have experienced an unusually long upward trend over the last years, which has resulted in higher valuation levels compared to long-term averages. While higher valuations typically indicate lower equity market returns, the current upswing is likely to remain supported by a robust macroeconomic environment. Global GDP growth is expected to slightly accelerate to a level of about 3.8% with reasonable expansion in the developed world and strong growth in Emerging Markets, resulting in a synchronized global recovery. U.S. GDP is forecasted to grow by roughly 2.4% as the significant corporate tax reform supports economic expansion. The Eurozone appears to remain on a recovery path with expected growth of about 2.0%, while the UK might slow down towards 1.3% due to uncertainty caused by the exit from the European Union. In addition, national elections in Europe could emerge as a risk factor. Growth in Japan is forecasted to remain stable at around 1.5%, while Emerging Markets should drive global expansion with more than 5% growth, particularly driven by India and China. The monetary policy is likely to tighten from highly supportive levels. The Fed has initiated its policy normalization with several rate hikes and a gradual reduction of its balance sheet size. In 2018, the new Fed Chairman is expected to continue this path at a measured pace. The ECB is likely to reduce or phase out its quantitative easing program, which would result in a slightly less accommodative monetary in the Eurozone. Finally, Japan might eventually follow this global trend of reducing monetary stimulus even as the Bank of Japan has not yet indicated any major changes to its policy. The geopolitical situation needs to be monitored closely, i.e. conflicts in Syria, North Korea, and the rising threat of terrorism. Key risk factors for equities include an unexpected weakening of macroeconomic conditions, protectionism and potential trade wars, and the impact of rising interest rates on economic expansion as well as equity market valuations. Against this backdrop, investors should expect modest global equity market returns as favourable earnings growth is somewhat offset by high valuation levels. Compared to still low risk free rates as measured by developed market government bond yields, equities are expected to generate attractive returns.

The accompanying notes form an integral part of these financial statements
16Page
113,735,147.76Assets111,827,189.86Securities portfolio at market value 2Note92,357,923.93Cost price19,469,265.93Unrealised profit on the securities portfolio1,661,151.76Cash at banks and liquidities
86,589.79Subscribers receivable82,214.54Dividends receivable73,320.00Receivable on spot exchange4,681.81Other assets
464,816.81Liabilities12,502.93Taxe d'abonnement payable 4Note
167,937.31Redemption payable165,006.60Accrued management & advisory fees 5Note
6,249.99Accrued depositary & sub-depositary fees 7Note2,853.88Accrued administrative expenses
72,964.82Payable on spot exchange37,301.28Other liabilities
113,270,330.95Net asset value
Financial Statements as at 31/12/17
Expressed in EUR
Statement of Net Assets as at 31/12/17
NEF - Global Equity
Global Equity - Category RCapitalisation units 9,127,750.418 3,588,683.162 2,362,909.899 10,353,523.681
Global Equity - Category ICapitalisation units 161,862.052 1,436,453.616 136,406.149 1,461,909.519
Changes in number of units outstanding from 01/01/17 to 31/12/17
Units issued Units redeemed Units outstandingas at 31/12/17
Units outstandingas at 01/01/17

The accompanying notes form an integral part of these financial statements
17Page
Key figures relating to the last 3 years
NEF - Global Equity
Global Equity - Category R
Capitalisation units
9.3410,353,523.681 9,127,750.418
8.778,379,937.852
8.47Number of unitsNet asset value per unit
EUR EUR EUR
Global Equity - Category I
Capitalisation units
11.331,461,909.519 161,862.052
10.51149,984.017
10.03Number of unitsNet asset value per unit
EUR EUR EUR
Total Net Assets 113,270,330.95 81,747,919.97 72,446,666.89
31/12/1531/12/1631/12/17Year ended on :
EUR

The accompanying notes form an integral part of these financial statements
18Page
ANZ BANKING GROUP LTD14,000 261,149.37 0.23%AUD
Transferable securities admitted to an official stock exchange listing and/or dealt inon another regulated market 111,827,189.86 98.73%
Shares 111,827,189.86 98.73%
Australia 452,122.84 0.40%
SCENTRE GRP - STAPLED SECURITY70,000 190,973.47 0.17%AUD
ALIMENTATION COUCHE - TARD INC SUB VTG B14,000 610,585.81 0.54%CADCanada 5,303,689.08 4.68%
BANK OF NOVA SCOTIA16,000 863,036.11 0.76%CADCANADIAN IMPERIAL BANK OF COMMERCE17,000 1,385,185.19 1.23%CADCANADIAN NATIONAL RAILWAY5,000 344,604.03 0.30%CADGILDAN ACTIVEWEAR17,800 480,655.63 0.42%CADINTACT FINANCIAL CORP5,000 349,059.11 0.31%CADMETRO -A- SUB VTG9,000 240,873.73 0.21%CADSUNCOR ENERGY INC16,000 490,990.09 0.43%CADTORONTO DOMINION BANK11,000 538,699.38 0.48%CAD
ALIBABA GR ADR4,700 675,745.02 0.60%USDCayman Islands 675,745.02 0.60%
SCHLUMBERGER LTD8,000 449,528.89 0.40%USDCuraçao 449,528.89 0.40%
ISS A/S6,000 193,662.78 0.17%DKKDenmark 1,330,346.96 1.17%
NOVO NORDISK20,000 898,601.73 0.79%DKKNOVOZYMES -B-5,000 238,082.45 0.21%DKK
SAMPO OYJ -A-11,700 535,860.00 0.47%EURFinland 535,860.00 0.47%
BIC(SOCIETE) - ACT PORTEUR/NOM2,800 256,648.00 0.23%EURFrance 1,051,016.00 0.93%
LEGRAND SA3,200 205,408.00 0.18%EURLVMH2,400 588,960.00 0.52%EUR
ALLIANZ SE REG SHS8,600 1,646,900.00 1.44%EURGermany 5,621,645.00 4.96%
BASF - NAMEN AKT7,000 642,180.00 0.57%EURBEIERSDORF AG3,600 352,440.00 0.31%EURCONTINENTAL AG1,900 427,595.00 0.38%EURDEUTSCHE BOERSE AG REG SHS3,000 290,400.00 0.26%EURDEUTSCHE POST AG REG SHS18,000 715,500.00 0.63%EURFRESENIUS MEDICAL CARE AG & CO KGAA5,500 482,790.00 0.43%EURMTU AERO ENGINES HOLDING AG3,700 552,780.00 0.49%EURSIEMENS AG REG4,400 511,060.00 0.45%EUR
AMDOCS LTD10,800 589,663.97 0.52%USDGuernsey 589,663.97 0.52%
AIA GROUP LTD82,000 593,783.12 0.52%HKDHong Kong 1,042,066.73 0.92%
TECHTRONIC INDUSTRIES CO LTD80,000 448,283.61 0.40%HKD
ALLEGION PLC WI7,000 464,370.88 0.41%USDIreland 1,850,340.10 1.63%
JOHNSON CONTROLS INTERNATIONAL PLC6,000 190,661.22 0.17%USDMEDTRONIC HLD10,600 713,708.00 0.62%USDRYANAIR HLDGS32,000 481,600.00 0.43%EUR
CHECK POINT SOFTWARE TECHNOLOGIES5,000 432,002.00 0.38%USDIsrael 432,002.00 0.38%
ASICS CORP KOBE26,000 346,743.89 0.31%JPYJapan 9,874,111.53 8.73%
BANDAI NAMCO HOLDINGS INC7,000 191,542.29 0.17%JPYBRIDGESTONE CORP15,000 583,426.15 0.52%JPYDAITO TRUST CONSTRUCTION CO LTD1,300 221,782.88 0.20%JPYFANUC CORP SHS1,150 231,075.96 0.20%JPYFUJI HEAVY INDUSTRIES LTD8,000 212,846.22 0.19%JPYHOYA CORP11,000 459,701.49 0.41%JPYJAPAN TOBACCO32,200 868,182.97 0.77%JPYKAO CORP5,000 282,876.66 0.25%JPYKDDI CORP23,000 478,974.53 0.42%JPYKOSE CORP2,100 274,292.72 0.24%JPY
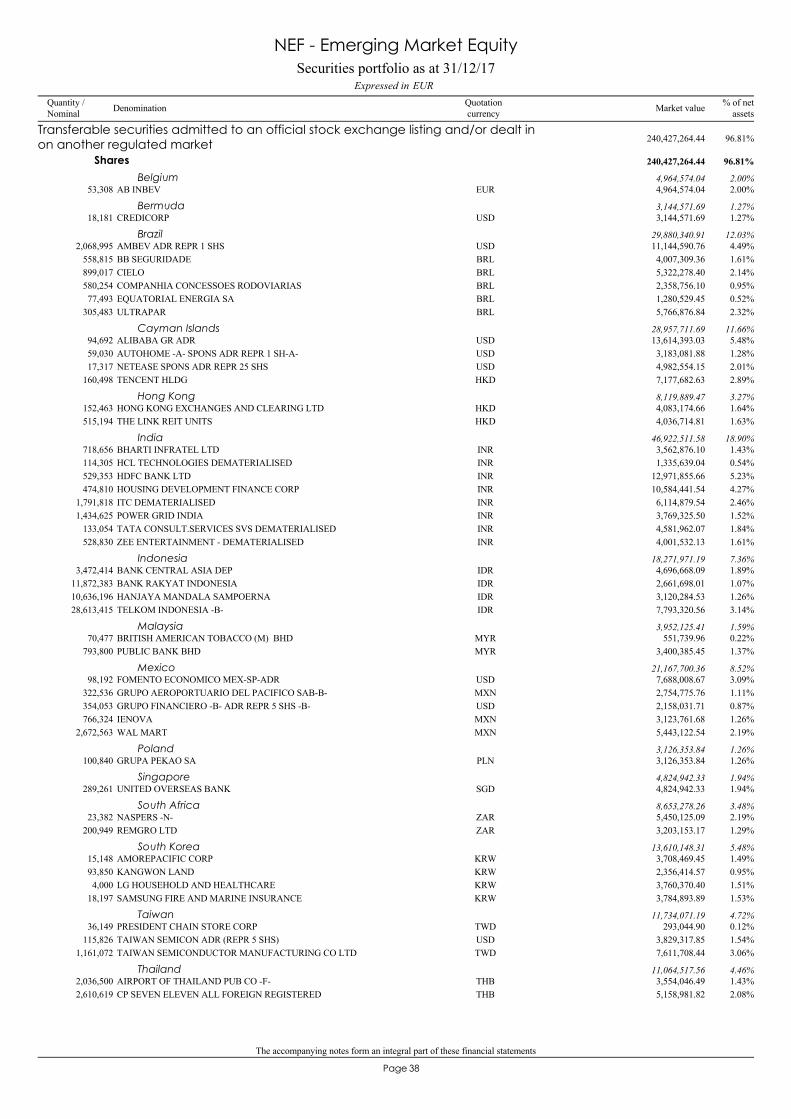
Securities portfolio as at 31/12/17EURExpressed in
NEF - Global Equity
Quantity /Nominal Denomination Quotation
currency% of net
assetsMarket value

The accompanying notes form an integral part of these financial statements
19Page
MAKITA CORP15,000 527,400.31 0.47%JPYMISUMI GROUP15,000 365,337.49 0.32%JPYMURATA MANUFACTURING CO LTD5,200 583,827.13 0.52%JPYNIDEC CORP2,400 281,755.40 0.25%JPYNIPPON TELEGRAPH AND TELEPHONE CORP25,000 984,072.18 0.86%JPYNITORI1,600 190,866.56 0.17%JPYPARK24 CO11,000 220,294.05 0.19%JPYSEVEN & I HOLDINGS CO LTD8,800 306,010.25 0.27%JPYSMC CORP2,000 688,794.83 0.61%JPYTOKIO MARINE HOLDINGS INC23,000 878,020.35 0.78%JPYTOYOTA MOTOR CORP13,000 696,287.22 0.61%JPY
SAMSONITE INTERNATIONAL SA80,000 318,122.95 0.28%HKDLuxembourg 318,122.95 0.28%
DNB25,000 386,421.15 0.34%NOKNorway 386,421.15 0.34%
DBS GROUP HOLDINGS20,000 315,690.57 0.28%SGDSingapore 315,690.57 0.28%
SAMSUNG ELECTRONICS CO LTD1,005 2,008,472.58 1.77%KRWSouth Korea 2,008,472.58 1.77%
ASSA ABLOY -B- NEW I26,000 450,070.09 0.40%SEKSweden 1,052,248.11 0.93%
ATLAS COPCO AB -A-6,100 219,490.44 0.19%SEKNORDEA BANK20,000 201,751.36 0.18%SEKSWEDBANK -A-9,000 180,936.22 0.16%SEK
CHUBB - NAMEN AKT4,000 487,384.31 0.43%USDSwitzerland 6,731,800.43 5.94%
GIVAUDAN SA REG.SHS300 577,337.21 0.51%CHFJULIUS BAER GROUP NAMEN AKT4,000 203,725.86 0.18%CHFNESTLE SA REG SHS33,600 2,406,152.79 2.12%CHFNOVARTIS AG REG SHS9,000 633,737.82 0.56%CHFROCHE HOLDING AG GENUSSSCHEIN10,000 2,106,477.53 1.86%CHFTE CONNECTIVITY LTD REG SHS4,000 316,984.91 0.28%USD
TAIWAN SEMICONDUCTOR MANUFACTURING CO LTD180,000 1,180,036.66 1.04%TWDTaiwan 1,180,036.66 1.04%
HEINEKEN NV7,100 617,203.00 0.54%EURThe Netherlands 5,856,672.41 5.17%
ING GROEP75,000 1,149,375.00 1.02%EURKONINKLIJKE AHOLD NV54,000 990,090.00 0.88%EURLYONDELLBASELL -A-8,500 781,889.44 0.69%USDRELX NV38,000 728,270.00 0.64%EURROYAL DUTCH SHELL PLC30,000 838,564.97 0.74%GBPUNILEVER NV16,000 751,280.00 0.66%EUR
AON6,300 703,910.61 0.62%USDUnited Kingdom 4,798,756.37 4.24%
COMPASS GROUP39,000 703,312.56 0.62%GBPCRODA INTERNATIONAL PLC5,500 274,246.81 0.24%GBPIMPERIAL BRANDS - REGISTERED31,000 1,106,206.96 0.98%GBPOLD MUTUAL PLC170,000 443,954.78 0.39%GBPRECKITT BENCKISER GROUP PLC16,000 1,247,748.61 1.11%GBPSMITH AND NEPHEW PLC22,000 319,376.04 0.28%GBP
ABBOTT LABORATORIES LTD7,700 366,412.91 0.32%USDUnited States of America 59,970,830.51 52.95%
AETNA INC12,800 1,925,283.08 1.70%USDAFFILIATED MANAGERS GROUP3,700 633,223.55 0.56%USDALPHABET INC5,100 4,479,563.08 3.95%USDAMERIPRISE FINANCIAL INC4,300 607,621.95 0.54%USDAMGEN INC7,500 1,087,509.38 0.96%USDAPPLE INC18,200 2,568,153.09 2.27%USDAPPLIED MATERIALS INC12,600 537,073.29 0.47%USDAUTOZONE INC2,200 1,304,939.55 1.15%USDBANK OF AMERICA CORP30,000 738,430.75 0.65%USDBANK OF NEW YORK MELLON CORP6,000 269,457.18 0.24%USDBERKSHIRE HATHAWAY -B-3,200 528,895.19 0.47%USDBIOGEN IDEC INC3,700 982,830.82 0.87%USDBROADRIDGE FINANCIAL SOL -W/I6,300 475,822.56 0.42%USD
Securities portfolio as at 31/12/17EURExpressed in
NEF - Global Equity
Quantity /Nominal Denomination Quotation
currency% of net
assetsMarket value

The accompanying notes form an integral part of these financial statements
20Page
CADENCE DESIGN SYSTEMS INC9,200 320,807.14 0.28%USDCARDINAL HEALTH INC6,000 306,528.81 0.27%USDCELGENE CORP16,000 1,392,278.83 1.23%USDCENTENE7,800 656,102.73 0.58%USDCISCO SYSTEMS INC28,000 894,188.28 0.79%USDCOGNIZANT TECHNOLOGY SOLUTIONS -A-10,000 592,178.77 0.52%USDCOLGATE-PALMOLIVE CO16,000 1,006,587.18 0.89%USDCOPART INC7,000 252,088.72 0.22%USDCOSTCO WHOLESALE CORP1,500 232,785.79 0.21%USDDISCOVER FINANCIAL SERVICES - SHS WI10,000 641,374.13 0.57%USDDOLLAR GENERAL6,200 480,832.15 0.42%USDEBAY20,500 645,101.31 0.57%USDESTEE LAUDER COMPANIES INC -A-2,200 233,409.49 0.21%USDEXPEDITORS INTERNATIONAL OF WASHINGTON4,000 215,759.19 0.19%USDEXPRESS SCRIPTS4,000 248,945.22 0.22%USDFACEBOOK -A-8,000 1,177,086.63 1.04%USDFAIR ISAAC CORP2,500 319,352.96 0.28%USDFIRST AMERICAN FINANCIAL CORP ISSUE9,000 420,545.32 0.37%USDFISERV INC4,500 492,024.51 0.43%USDGILEAD SCIENCES INC16,000 955,757.53 0.84%USDHARTFORD FINANCIAL SERVICES GROUP INC16,000 750,837.99 0.66%USDHENRY SCHEIN INC8,000 466,138.58 0.41%USDHOME DEPOT INC10,000 1,580,338.53 1.40%USDHONEYWELL INTERNATIONAL INC10,000 1,278,745.94 1.13%USDHP WHEN ISSUED26,000 455,482.36 0.40%USDHUMANA INC1,700 351,637.62 0.31%USDILLINOIS TOOL WORKS2,600 361,719.34 0.32%USDINTERPUBLIC GROUP OF COMPANIES INC16,000 268,956.89 0.24%USDIPG PHOTONICS CORP1,400 249,964.15 0.22%USDJOHNSON & JOHNSON9,400 1,095,112.15 0.97%USDJPMORGAN CHASE CO13,000 1,159,192.86 1.02%USDKIMBERLY CLARK4,200 422,556.49 0.37%USDLKQ CORP8,000 271,291.59 0.24%USDMARSH MC-LENNAN COS. INC.9,000 610,781.29 0.54%USDMCKESSON CORP4,600 598,157.26 0.53%USDMICROSOFT CORP14,800 1,055,609.11 0.93%USDMOLINA HEALTHCARE4,700 300,505.29 0.27%USDMOODY S CORP10,000 1,230,801.30 1.09%USDNASDAQ6,000 384,374.22 0.34%USDNEXTERA ENERGY2,000 260,468.61 0.23%USDNIKE INC9,100 474,614.36 0.42%USDNVIDIA CORP1,600 258,150.59 0.23%USDORACLE CORP6,300 248,364.88 0.22%USDPEPSICO INC6,900 689,942.47 0.61%USDPHILLIPS 666,000 506,045.19 0.45%USDPNC FINANCIAL SERVICES GROUP INC2,300 276,717.25 0.24%USDPPG INDUSTRIES INC3,600 350,664.55 0.31%USDPRICELINE GROUP1,250 1,811,202.37 1.60%USDPROGRESSIVE CORP6,200 291,156.51 0.26%USDPRUDENTIAL FINANCIAL INC7,000 671,108.15 0.59%USDPUBLIC STORAGE INC1,800 313,682.98 0.28%USDROCKWELL AUTOMATION2,000 327,441.01 0.29%USDSKYWORKS SOLUTIONS INC4,000 316,684.73 0.28%USDS&P GLOBAL5,000 706,245.31 0.62%USDSTARBUCKS CORP6,000 287,317.60 0.25%USDSYNCHRONY FINANCIAL21,000 676,069.37 0.60%USDTEXAS INSTRUMENTS INC5,700 496,379.55 0.44%USDTIME WARNER11,000 838,964.40 0.74%USDTJX COS INC23,000 1,466,338.70 1.29%USDTRACTOR SUPPLY CO4,000 249,312.10 0.22%USDUNION PACIFIC CORP10,500 1,174,059.87 1.04%USDUNITED TECHNOLOGIES CORP8,500 904,148.25 0.80%USDVERISK ANALYTICS INC3,000 240,140.08 0.21%USDVISA INC -A-18,500 1,758,834.32 1.55%USDWALT DISNEY CO14,000 1,255,015.43 1.11%USDWATERS2,000 322,171.27 0.28%USDWELLS FARGO AND CO29,000 1,467,047.44 1.30%USD
Securities portfolio as at 31/12/17EURExpressed in
NEF - Global Equity
Quantity /Nominal Denomination Quotation
currency% of net
assetsMarket value

The accompanying notes form an integral part of these financial statements
21Page
3M CO2,300 451,389.14 0.40%USD
Total securities portfolio 111,827,189.86 98.73%
Securities portfolio as at 31/12/17EURExpressed in
NEF - Global Equity
Quantity /Nominal Denomination Quotation
currency% of net
assetsMarket value

The accompanying notes form an integral part of these financial statements
22Page
Statement of Operations and Changes in Net Assets from 01/01/17 to 31/12/17Expressed in EUR
NEF - Global Equity
1,443,495.12Income1,409,120.36Net dividends 2Note
5,231.82Bank interest on cash account 2Note29,142.94Securities lending income 2,8Note
2,187,520.67Expenses1,744,637.22Management & advisory fees 5Note
63,246.07Depositary & sub-depositary fees 7Note45,952.56Taxe d'abonnement 4Note30,879.53Administrative expenses1,029.02Professional fees1,373.51Bank interest on overdrafts4,071.28Legal fees
66,968.85Transaction fees 2Note1,190.58Publication & printing fees
181,115.17Correspondent bank fees 2Note47,056.88Other expenses
-744,025.55Net loss from investmentsNet realised profit / loss on:
2,710,445.18- sales of investment securities 2Note89,559.86- foreign exchange 2Note
2,055,979.49Net realised profitMovement in net unrealised appreciation /(depreciation) on:
3,986,086.71- investments 2Note
6,042,066.20Increase in net assets as a result of operations48,549,632.13Subscription capitalisation units
-23,069,287.35Redemption capitalisation units
31,522,410.98Increase in net assets
81,747,919.97Net assets at the beginning of the year
113,270,330.95Net assets at the end of the year

23Page
NEF- Euro Equity

NEF – Euro Equity
Manager’s Report
Page 24
2017 Annual Commentary Market review: Multiple political events including the Dutch and French elections as well as the German and Austrian elections dominated the headlines over the past year. However, despite a degree of uncertainty around a number of these events, Eurozone equity markets gained during this period, mainly due to strong European earnings seasons in 2017 where we saw many companies beat their earnings estimates and European EPS (earnings per share) growth expectations were revised upwards. Economic growth across the region strengthened over the period with European Purchasing Manager Indices, a reliable gauge of economic activity, rising to their highest rate in six years. Job creation in the euro area also improved as firms looked to expand capacity in response to rising demand. Outside of Europe, economic momentum also improved, in particular in the emerging markets. As a result, the global economy is now growing in a coordinated way and thus providing a boost to both business confidence and earnings delivery within Europe. This fundamental improvement has helped sentiment towards Europe as a region, as has a material reduction in perceived political risk, most notably following the election of Emmanuel Macron as the President of France. Performance Attribution During 2017, the portfolio again delivered alpha via several means, although we would highlight the positive contribution of stock specifics during the year. This was especially rewarding given the work we had done in the latter half of 2016, re-emphasising stock specifics within the portfolio. In the aftermath of the Brexit referendum, the sharp moves in the market had squeezed stock specific risk down to 30% of portfolio risk at the end of June 2016. We took steps to address this and we entered 2017 with c. 66% of portfolio risk in stock specifics, a positioning that worked well during the year. In addition, we would highlight the positive contribution from our dynamic management of style exposures within the fund, both in 2017 and over the longer term. This is not a static factor fund, and we manage these exposures dynamically. In 2017, style accounted for 34% of total portfolio alpha and we continue to monitor the fund style exposures with a keen eye. In more detail, during the year, country and sector allocation and stock specifics were all positive for alpha generation. In country terms the underweight to Spain benefited the portfolio, as did the overweight to the Netherlands and to Italy. Overweight Ireland and underweight Austria detracted. Sector In sector terms, the overweight to Industrials was the strongest contributor to relative returns over 2017, and also demonstrated a strong contribution from stock specifics (notably within the Machinery sub-sector). The overweight to Consumer Discretionary also benefited the portfolio, although this was offset by negative stock specifics. The strongest stock selection came within Financials. While the underweight to the sector was positive in aggregate, the underweight to Insurance detracted and also saw a negative stock specific impact. However, Banks saw very strong stock selection ((notably Finecobank), as did Capital Markets. Detractors at the sector level included the overweight to Telecoms, although this was offset by positive stock selection. The positive contribution from Telefonica in particular underlined the importance of a disciplined approach with regard to target prices and valuation. Underweight Materials and Information Technology also detracted, although the latter was more than offset by positive stock selection (notably from ST Microelectronics).

NEF – Euro Equity
Manager’s Report (continued)
Page 25
Stocks Top 3: Finecobank, Kering, Eiffage Bottom 3: Steinhoff, Tenaris, CRH In terms of stock specifics, our 5 top contributing positions in 2017 serve as strong examples of the criteria we seek to identify in our investments. Finecobank: we invested in off-benchmark Finecobank during October 2016. Our original investment thesis was grounded on Fineco’s market leading and differentiated online presence and prospects for raising assets as the Eurozone recovery gathered pace. During 2017, Fineco grew its total AUM 17%, with a positive shift in its asset margin mix as it moved clients to higher fee arrangements. Fineco appreciated over 66% during 2017 and was the top contributor to fund performance. We continue to hold Fineco in the portfolio. We believe it to be a strong example of an innovative disruptor with a differentiated client proposition. Kering: we added Kering to the portfolio in March 2017. This was based on early signs that after 3 years of underperformance the turnaround orchestrated by the new management at the Gucci brand was starting to bear fruit and was validated by various signals on social media and by our channel checks with various industry players. During the first 9 months of 2017 Gucci grew its revenues by 46%, and Kering Group by +27%. We continue to hold Kering in the portfolio. We see further scope for the Gucci brand to improve its sales densities and believe it is one of the best placed across the luxury space to increase prices over 2018. Eiffage: off-benchmark Eiffage has been a long-term holding in the portfolio, being held for over 3 years Eiffage’s shares continued to outperform the market in 2017, as an improving French economy led to further growth in traffic on its APRR toll road and an improvement in its contracting order book. Profitability on the toll-road has reached record levels, as the company has maintained a tight control on expenses whilst revenues have been growing, latterly helped by particularly strong recovery in heavy vehicle traffic. In the contracting division, after several years of flat revenue, the recent increase in orders bodes well for both sales and profitability. We continue to hold Eiffage, where we feel there remain attractive prospects for earnings and cash flow growth. ST Microelectronics: we invested in February 2017. STM had been a poor performer for years, disappointing on revenue growth, ebit margin development, poor capital allocation and ineffective management actions. However, we felt they could turn around earnings momentum based on customers in fast-growing segments such as autos, microcontrollers and smartphone, including the iPhone 10. After we invested, management raised revenue guidance at their capital markets day in May 2017, with confident communications on profitability also driving the stock. We believe earnings growth could continue this year as a result of its previous R&D investment, and we continue to hold ST Microelectronics in the portfolio. Total: not owning Total was a strong contributor to the performance of BGF Euro-Markets during 2017. We believed the emergence of the vast and low cost US shale oil plays was likely to squeeze out higher cost reserves such as deepwater projects which looked relatively uneconomic. After years of unsuccessful exploration, we believe Total (and many of its european peers) will have to address its portfolio via acquisitions which will put pressure on its balance sheet and ability to grow shareholder distributions. Detractors at the stock level included Steinhoff (which we sold before its sharp price drop but which still detracted), Tenaris (Energy) and CRH. Changes Over the course of the year, we focused on stock specific risk. We added to pro-cyclical businesses as the world continued to recover, but maintained a disciplined approach to valuation. At the start of the year, we saw a world where global growth was improving, some Emerging Markets were rebounding, and yet other sectors remained at the extremes of valuation. We continued to work on maintaining a high level of stock specific risk within the portfolio (especially after the buffeting by style factors during 2016). At the end of the quarter, stock specific risk stood at 65% or portfolio risk contribution.

NEF – Euro Equity
Manager’s Report (continued)
Page 26
Over the quarter, we sharply reduced the exposure to Health Care, moving from a small overweight to a significant underweight. We reduced Merck and also exited our position in Bayer. While both firms do more than just pure Health Care, the ongoing uncertainty in the key US market was not welcome. We also reduced our exposure to Materials, where we sold nutrition business DSM following good performance. We also reduced our holding in Acerinox following news on Chinese authority concerns about steel and iron ore prices and subsequently invested in ArcelorMittal on weakness which offered an attractive valuation. As the global economy improved, we added to Industrials, increasing exposure to both Capital Goods and Transportation (although we sold RELX, technically categorised with Commercial and Business Services). Within Capital Goods, we made new investments in elevator business Kone and French-listed electrical company Schneider Electric. We also took advantage of weakness during the quarter to top up existing holdings in Vinci and Eiffage. We sold Safran. Within Transportation, we sold our remaining position in Eurotunnel, but increased exposure to Deutsche Post, where we see good momentum in the parcels business, increased focus on free cash flow generation and potential for dividend growth. We also increased exposure to Financials, but maintained our caution on valuation, given how strongly some stocks within the space have run recently. We sold BBVA following strong performance, but made new investments in Banco Santander and Caixabank, and increased Finecobank. Within Insurance, we trimmed Axa but made a new investment in Munich Re. Within Real Estate, we made a new investment in REIT Unibail-Rodamco, which had underperformed. As we moved in Q2, we maintained a balanced portfolio in Q2, with an emphasis on stock specific risk. As stock pair correlations fell, we felt positive about the ability of our fundamental investment process to deliver alpha and kept stock specific risk high. Over the quarter, a major move was from underweight to a significant overweight in Consumer Discretionary, driven by additions in Media and in Consumer Durables and Apparel. Within the former, we trimmed luxury clothing company Moncler on valuation and made a new investment in Adidas where we see good operational progress from the (relatively) new management. We also increased our existing holding in Kering. Within Media, we made a new investment in Vivendi. We also increased Health Care, sharply reducing the underweight. We remained cautious on big pharma given the pricing pressures within the key US end market; however, the choice of health care companies in the Eurozone is more constrained than in a pan-European world and our holdings reflect this. During Q2, we made a new investment in dialysis company Fresenius Medical Care. We added to Consumer Staples during the quarter. We continued to build our position in Heineken (but trimmed Pernod Ricard) and also added to Unilever. We stayed underweight the sector, with some company valuations in the space looking rather full. We significantly reduced Telecoms during Q2. We maintained target price discipline and sold Telefonica on valuation midway through the period. The stock subsequently fell on concerns around political stability in Brazil, where it operates a market-leading fiber network. We also trimmed Dutch telecom KPN but added to Iliad. We refined our positioning within Financials, increasing our underweight. Within Banks, we sold ABN AMRO, Banco BPM, Banco Santander and Caixabank over the quarter. However later in the period we made new investments in KBC, Unicredit and also in Erste Bank. Within Insurance, we sold both Axa and NN Group on valuation but added to our existing positions in Munich Re and ASR Nederland. During Q3, we continued to build our exposure to companies within Consumer Discretionary, increasing our overweight. We exited clothing manufacturer Moncler but increased our position in Adidas, a company with strong operational momentum, and one which actually benefits from the stronger Euro. We also made a new investment in Spanish-listed global retailer Inditex. Within Media, we added to Vivendi and in the Autos space we trimmed Renault following strong performance but added to Continental.

NEF – Euro Equity
Manager’s Report (continued)
Page 27
As macro data improved further, we added to companies within capital goods in Industrials. We sold Kone following strong performance, but made new investments in Kingspan, Volker Wessels and Safran. We also increased Wartsila, which has performed strongly this year. We continued investing in Health Care, moving from an underweight to an overweight position, via a new position in French-listed Sanofi. We also increased exposure to Information Technology, adding to ST Microelectronics. We sharply reduced exposure to Consumer Staples moving to a significant underweight position. We sold positions in Remy Cointreau and Pernod Ricard and also trimmed Heineken. Within HPC, we also reduced Unilever. Within Telecoms, we sold KPN on valuation but we added to Iliad, our one remaining holding in the portfolio. We again sharply refined the positioning within Financials. We exited both our remaining Insurance holdings on valuation, ASR Nederland and Munich Re. We added to Banks, making new investments in ABN AMRO and Banco Santander and also adding to our existing stake in BNP Paribas. This now brings us from an underweight to overweight stance in Banks. We also trimmed Deutsche Boerse within Capital Markets. During Q4, we maintained our focus on stock specifics within the portfolio. At the end of the quarter, stock specific risk stood at 62% of overall portfolio risk. Given the limited scope for further re-rating by the market, we therefore look for outperformance to be based on business model and management execution at the company level. During the quarter, we increased our exposure to companies within Consumer Staples, reducing the underweight to the sector. We added to our existing positions in Unilever, Remy Cointreau and Heineken. We also increased exposure to Telecoms. We had previously sold Spanish-listed Telefonica during Q3 on valuation, following strong performance. The shares subsequently fell after political uncertainty in Brazil, an important end market. We reinvested in Q4 at the attractive valuation which took our positioning from a small underweight to overweight the sector. We refined our positioning within Financials. While positive on the European economic trajectory, we reduced our overall exposure to Banks during the quarter, where we sold our holding in Unicredit, and trimmed BNP Paribas. The bank sector is one where we remain acutely aware of valuation following strong performance. Within Insurance, we made a new investment in Allianz. We reduced our exposure to Information Technology where we took partial profits in semiconductor company ASML. While the company is of undoubted quality, the shares have performed strongly and we feel we have better opportunities to find upside elsewhere. We made a significant reduction in our exposure to Consumer Discretionary over the quarter, reducing the overweight. The largest shift came within the Consumer Durables & Apparel sub-sector: we sold our remaining small position in Steinhoff prior to the sharp share price fall, and also trimmed Kering and Adidas, two companies which had performed strongly for us recently. Within Autos, we reduced Renault following strong performance but continued to add to Michelin. At the end of December, the portfolio was overweight Industrials, Telecoms, Consumer Discretionary and Health Care, and underweight Information Technology, Materials, Financials, Consumer Staples, Real Estate, Utilities and Energy. Outlook As we enter 2018, we remain positive on prospects for Eurozone equities, although we are conscious of market valuation. Given the limited scope for further re-rating by the market, we therefore look for outperformance to be based on business model and management execution at the company level.

NEF – Euro Equity
Manager’s Report (continued)
Page 28
From the perspective of political risk, we note the quieter calendar in the Eurozone which could bode well for interest in the region. From a governmental perspective, we also continue to see positive focus from European leaders on reducing unemployment and encouraging investment. We continue to see positive macro-economic momentum, not just in the Eurozone but more broadly. As always it is worth mentioning that many Eurozone-listed companies are well placed to benefit from recovering Emerging Markets and we are confident in the prospects for positive earnings growth from here. Within this positive outlook, we have several areas of conviction within our portfolio. Our investment themes include R&D-led growth where we have identified companies employing capital in areas of high and sustainable growth. We have also identified companies who are likely to benefit from French reform and regulatory change. Capital investment opportunities are also well-represented within the portfolio. Finally, our bottom-up analysis has identified several companies with strong innovation, including those positioning for an ever more digitalised marketplace. .

The accompanying notes form an integral part of these financial statements
29Page
320,859,857.13Assets314,167,592.30Securities portfolio at market value 2Note294,725,255.90Cost price19,442,336.40Unrealised profit on the securities portfolio6,398,711.52Cash at banks and liquidities
214,567.81Subscribers receivable78,985.50Other assets
1,929,365.28Liabilities15,717.47Bank overdrafts
712,139.02Brokers payable37,628.21Taxe d'abonnement payable 4Note
658,263.74Redemption payable438,521.68Accrued management & advisory fees 5Note
9,644.69Accrued depositary & sub-depositary fees 7Note8,104.78Accrued administrative expenses
49,345.69Other liabilities
318,930,491.85Net asset value
Financial Statements as at 31/12/17
Expressed in EUR
Statement of Net Assets as at 31/12/17
NEF - Euro Equity
Euro Equity - Category RCapitalisation units 17,016,574.279 5,467,761.053 4,953,635.930 17,530,699.402
Euro Equity - Category ICapitalisation units 2,425,096.701 1,500,155.436 2,816,971.446 1,108,280.691
Changes in number of units outstanding from 01/01/17 to 31/12/17
Units issued Units redeemed Units outstandingas at 31/12/17
Units outstandingas at 01/01/17

The accompanying notes form an integral part of these financial statements
30Page
Key figures relating to the last 3 years
NEF - Euro Equity
Euro Equity - Category R
Capitalisation units
16.9117,530,699.402 17,016,574.279
14.9915,462,789.042
15.27Number of unitsNet asset value per unit
EUR EUR EUR
Euro Equity - Category I
Capitalisation units
20.211,108,280.691 2,425,096.701
17.721,317,748.912
17.85Number of unitsNet asset value per unit
EUR EUR EUR
Total Net Assets 318,930,491.85 298,058,558.23 259,584,387.37
31/12/1531/12/1631/12/17Year ended on :
EUR

The accompanying notes form an integral part of these financial statements
31Page
ERSTE GROUP BANK AG98,281 3,548,435.51 1.11%EUR
Transferable securities admitted to an official stock exchange listing and/or dealt inon another regulated market 314,167,592.30 98.51%
Shares 314,167,592.30 98.51%
Austria 3,548,435.51 1.11%
KBC GROUPE SA140,868 10,017,123.48 3.14%EURBelgium 22,385,546.04 7.02%
SOLVAY70,066 8,120,649.40 2.55%EURTELENET GROUP HOLDING NV73,124 4,247,773.16 1.33%EUR
KONECRANES OYJ155,766 5,947,145.88 1.86%EURFinland 12,232,214.68 3.84%
WARTSILA CORPORATION -B-119,488 6,285,068.80 1.98%EUR
ARKEMA SA59,861 6,078,884.55 1.91%EURFrance 80,814,349.98 25.35%
BNP PARIBAS SA87,485 5,445,941.25 1.71%EUREIFFAGE94,137 8,598,473.58 2.70%EURILIAD SA61,491 12,282,827.25 3.85%EURKERING14,106 5,543,658.00 1.74%EURMICHELIN SA REG SHS52,785 6,310,446.75 1.98%EURREMY COINTREAU23,686 2,735,733.00 0.86%EURRENAULT SA53,716 4,507,309.56 1.41%EURSAFRAN99,492 8,547,357.72 2.68%EURSANOFI153,973 11,062,960.05 3.47%EURSMCP SAS152,451 2,934,681.75 0.92%EURTHALES75,279 6,766,076.52 2.12%EUR
ADIDAS NAMEN AKT48,295 8,072,509.25 2.53%EURGermany 72,474,997.69 22.72%
ALLIANZ SE REG SHS58,439 11,191,068.50 3.51%EURCONTINENTAL AG44,123 9,929,881.15 3.11%EURDEUTSCHE BOERSE AG REG SHS62,253 6,026,090.40 1.89%EURDEUTSCHE POST AG REG SHS340,089 13,518,537.75 4.24%EURFRESENIUS AG89,695 5,836,453.65 1.83%EURFRESENIUS MEDICAL CARE AG & CO KGAA131,123 11,509,976.94 3.61%EUROSRAM LICHT27,745 2,078,932.85 0.65%EURSCOUT24126,624 4,311,547.20 1.35%EUR
KERRY GROUP -A-54,405 5,086,867.50 1.59%EURIreland 7,815,567.87 2.45%
KINGSPAN GROUP74,954 2,728,700.37 0.86%EUR
ATLANTIA SPA229,431 6,038,623.92 1.89%EURItaly 37,353,683.51 11.71%
BUZZI UNICEM SPA253,841 5,711,422.50 1.79%EURENEL SPA2,553,355 13,098,711.15 4.11%EURFINECOBANK989,098 8,441,951.43 2.65%EURPRYSMIAN SPA149,429 4,062,974.51 1.27%EUR
TENARIS SA - REG.SHS777,182 10,227,715.12 3.21%EURLuxembourg 10,227,715.12 3.21%
GALP ENERGIA SA REG SHS -B-235,474 3,608,639.05 1.13%EURPortugal 3,608,639.05 1.13%
BANCO SANTANDER SA REG SHS1,220,018 6,684,478.62 2.10%EURSpain 22,580,588.25 7.08%
INDITEX SHARE FROM SPLIT298,950 8,683,002.75 2.72%EURTELEFONICA S A887,767 7,213,106.88 2.26%EUR
ABN AMRO GROUP DEP RECEIPT222,317 5,980,327.30 1.88%EURThe Netherlands 41,125,854.60 12.89%
ASML HLDG20,618 2,992,702.70 0.94%EURHEINEKEN NV81,401 7,076,188.93 2.22%EURIMCD61,028 3,199,698.04 1.00%EURSTMICROELECTRONICS NV369,275 6,720,805.00 2.11%EURUNILEVER NV223,721 10,504,819.56 3.28%EURVOLKERWESS - REGISTERED195,886 4,651,313.07 1.46%EUR
Total securities portfolio 314,167,592.30 98.51%
Securities portfolio as at 31/12/17EURExpressed in
NEF - Euro Equity
Quantity /Nominal Denomination Quotation
currency% of net
assetsMarket value

The accompanying notes form an integral part of these financial statements
32Page
Statement of Operations and Changes in Net Assets from 01/01/17 to 31/12/17Expressed in EUR
NEF - Euro Equity
6,447,317.92Income6,096,527.45Net dividends 2Note
350,790.47Securities lending income 2,8Note
7,084,324.36Expenses4,916,272.62Management & advisory fees 5Note
109,158.23Depositary & sub-depositary fees 7Note142,787.08Taxe d'abonnement 4Note93,729.66Administrative expenses3,690.74Professional fees
14,460.42Bank interest on overdrafts12,919.51Legal fees
984,638.49Transaction fees 2Note1,839.28Publication & printing fees
694,079.32Correspondent bank fees 2Note110,749.01Other expenses
-637,006.44Net loss from investmentsNet realised profit / loss on:
37,003,389.40- sales of investment securities 2Note-663.84- foreign exchange 2Note
36,365,719.12Net realised profitMovement in net unrealised appreciation /(depreciation) on:
-372,433.52- investments 2Note
35,993,285.60Increase in net assets as a result of operations118,977,061.93Subscription capitalisation units
-134,098,413.91Redemption capitalisation units
20,871,933.62Increase in net assets
298,058,558.23Net assets at the beginning of the year
318,930,491.85Net assets at the end of the year

33Page
NEF- Emerging Market Equity

NEF - Emerging Market Equity
Manager’s Report
Page 34
Stocks that Helped Absolute Performance Alibaba reported strong results for FYQ1 that exceeded both top line and bottom line expectations. The key drivers continue to be better data-driven personalization providing more relevant and engaging ads, and improving conversion rates for merchants on their core e-commerce business. Alibaba is the leading e-commerce platform operator in China with a dominant market share in terms of overall gross merchandise volume (GMV). It is multiples larger in GMV than the second biggest player in China, JD.com. Alibaba's key advantage versus competitors is that it has the largest number of vendors, which in turn attracts a massive pool of buyers. Other markets like Japan and the U.S. have shown that it is difficult to displace a player who has a significant supplier/merchant advantage. This allows buyers to have access to the widest base of vendors and available inventory at the most competitive prices in almost any category. Further, by segmenting the market to lower-priced merchants (Taobao) and more established/trustworthy merchants in Tmall, it can cater to a wider base of consumers. There is also the tailwind from e-commerce penetration in China still being in relatively early stages. Given the fast take-up of smartphone penetration, there is the potential for this to increase significantly, and Alibaba is in prime position to benefit from this trend. Tencent Holding’s results in the fourth quarter were strong with revenue growth over 60%. Tencent is a major Internet platform in China with a strong presence in online gaming, instant messaging, and is one of the country's largest web portals. The company has been successful in providing popular services to attract new users and creating a network effect to maintain existing users. There is growing expectation that the company will be able to successfully monetize its OTT application, WeChat, through advertising revenue. Online gaming is the largest contributor to revenue, but Tencent also generates sales through fee-based social networks, advertising and e-commerce. The gaming revenues benefit from operating the dominant social networking platform by directing traffic to the gaming platform. This has translated into strong sales, as well as earnings growth. Stocks that Hurt Absolute Performance While the main reason for the recent weakness in PT Matahari’s numbers was macro related, we felt that the competitive dynamics in Indonesia were changing faster than expected with global fashion brands taking market share. From a longer-term perspective, we exited our position in Matahari since we didn’t feel that the company was well positioned in e-commerce and, hence, the thesis has materially changed. Korea Aerospace Industries, Ltd. (KAI) detracted from portfolio performance. We exited our position in KAI as it is under investigation for accounting fraud, which we believe could lower the firm’s earnings visibility, create a risk of provisioning, potentially cause production delays or temporary supply stoppages. Additionally, the risk of reputational damage to its overseas business and an unconfirmed management team could create a share overhang on KAI at least in the near to midterm. Market Review Emerging market equities consistently performed well throughout 2017 with the MSCI EM Index outperforming the broader MSCI ACWI in all four quarters. Emerging market equities posted double-digit returns for the first quarter. There were a number of areas of strength: Technology, Chinese e-commerce and a recovery in sentiment in India, as the demonetization impact on corporate earnings has been less severe than feared and recovering. On the back of investment funds returning, EM currencies rallied alongside the markets, lifting returns in U.S. dollar terms. In the second quarter, emerging market equities continued to perform well. Asian equities continued their bull run, with China and Korea as top contributors for the benchmark. Third quarter performance was driven by high performing Chinese e-commerce companies and Brazilian banks. Emerging markets benefited from a weaker U.S. dollar, positive sentiment and continued inflows. Rising corporate earnings and growth across major economies also helped sustain emerging market equities. Fourth quarter returns were driven by ongoing growth and stable outlooks for major emerging market economies, such as China and India. Asian Information Technology companies in particular were major contributors to emerging markets performance.

NEF - Emerging Market Equity
Manager’s Report (continued)
Page 35
Outlook With the backdrop of central banks pulling back from an ultra-loose monetary stance, global capital markets will continue to go through significant changes. From the bond markets to the currency markets, financial conditions are expected to tighten. Many markets could get a jolt as the macro market conditions transition, and the heavy usage of ETFs by investors could cause a broader equity market shake out over the tightening period. However, we are comfortable with the large emerging markets we are invested in because they have solid fundamentals and should remain destinations of capital inflows over the long term. For instance, India has seen significant improvement in its current account since the “Taper Tantrum” in 2013. Brazil has seen a change of government and endured some difficult reforms, particularly the cap on government spending that required a constitutional change. More reforms are needed, but it is our belief that the country is headed in the right direction. China still has many imbalances in its economy, including high corporate leverage, but we think the country has the wherewithal to deal with the challenges. Importantly, we don’t see any emerging market becoming a domino that sets off implosions and contagions akin to what we have seen in past decades. Nonetheless, we stay selectively away from countries where weak fundamentals could lead to debt issues down the road, or will weigh on their currency performance over time.

The accompanying notes form an integral part of these financial statements
36Page
251,500,473.46Assets240,427,264.47Securities portfolio at market value 2Note183,951,078.24Cost price56,476,186.23Unrealised profit on the securities portfolio7,599,802.49Cash at banks and liquidities2,691,498.44Brokers receivable
172,676.78Subscribers receivable299,399.97Dividends receivable305,821.66Receivable on spot exchange
4,009.65Other assets
3,149,538.68Liabilities1,943,068.93Brokers payable
30,879.46Taxe d'abonnement payable 4Note381,189.84Redemption payable432,686.90Accrued management & advisory fees 5Note15,689.75Accrued depositary & sub-depositary fees 7Note6,217.87Accrued administrative expenses
305,386.71Payable on spot exchange34,419.22Other liabilities
248,350,934.78Net asset value
Financial Statements as at 31/12/17
Expressed in EUR
Statement of Net Assets as at 31/12/17
NEF - Emerging Market Equity
Emerging Market Equity - Category RCapitalisation units 4,506,474.172 1,502,278.474 1,261,515.777 4,747,236.869
Emerging Market Equity - Category ICapitalisation units 197,446.984 95,859.603 267,276.054 26,030.533
Changes in number of units outstanding from 01/01/17 to 31/12/17
Units issued Units redeemed Units outstandingas at 31/12/17
Units outstandingas at 01/01/17

The accompanying notes form an integral part of these financial statements
37Page
Key figures relating to the last 3 years
NEF - Emerging Market Equity
Emerging Market Equity - Category R
Capitalisation units
51.964,747,236.869 4,506,474.172
44.414,431,072.895
42.79Number of unitsNet asset value per unit
EUR EUR EUR
Emerging Market Equity - Category I
Capitalisation units
63.9326,030.533 197,446.984
53.93253,634.515
51.30Number of unitsNet asset value per unit
EUR EUR EUR
Total Net Assets 248,350,934.78 210,769,437.85 202,630,195.29
31/12/1531/12/1631/12/17Year ended on :
EUR
The accompanying notes form an integral part of these financial statements
38Page
AB INBEV53,308 4,964,574.04 2.00%EUR
Transferable securities admitted to an official stock exchange listing and/or dealt inon another regulated market 240,427,264.44 96.81%
Shares 240,427,264.44 96.81%
Belgium 4,964,574.04 2.00%
CREDICORP18,181 3,144,571.69 1.27%USDBermuda 3,144,571.69 1.27%
AMBEV ADR REPR 1 SHS2,068,995 11,144,590.76 4.49%USDBrazil 29,880,340.91 12.03%
BB SEGURIDADE558,815 4,007,309.36 1.61%BRLCIELO899,017 5,322,278.40 2.14%BRLCOMPANHIA CONCESSOES RODOVIARIAS580,254 2,358,756.10 0.95%BRLEQUATORIAL ENERGIA SA77,493 1,280,529.45 0.52%BRLULTRAPAR305,483 5,766,876.84 2.32%BRL
ALIBABA GR ADR94,692 13,614,393.03 5.48%USDCayman Islands 28,957,711.69 11.66%
AUTOHOME -A- SPONS ADR REPR 1 SH-A-59,030 3,183,081.88 1.28%USDNETEASE SPONS ADR REPR 25 SHS17,317 4,982,554.15 2.01%USDTENCENT HLDG160,498 7,177,682.63 2.89%HKD
HONG KONG EXCHANGES AND CLEARING LTD152,463 4,083,174.66 1.64%HKDHong Kong 8,119,889.47 3.27%
THE LINK REIT UNITS515,194 4,036,714.81 1.63%HKD
BHARTI INFRATEL LTD718,656 3,562,876.10 1.43%INRIndia 46,922,511.58 18.90%
HCL TECHNOLOGIES DEMATERIALISED114,305 1,335,639.04 0.54%INRHDFC BANK LTD529,353 12,971,855.66 5.23%INRHOUSING DEVELOPMENT FINANCE CORP474,810 10,584,441.54 4.27%INRITC DEMATERIALISED1,791,818 6,114,879.54 2.46%INRPOWER GRID INDIA1,434,625 3,769,325.50 1.52%INRTATA CONSULT.SERVICES SVS DEMATERIALISED133,054 4,581,962.07 1.84%INRZEE ENTERTAINMENT - DEMATERIALISED528,830 4,001,532.13 1.61%INR
BANK CENTRAL ASIA DEP3,472,414 4,696,668.09 1.89%IDRIndonesia 18,271,971.19 7.36%
BANK RAKYAT INDONESIA11,872,383 2,661,698.01 1.07%IDRHANJAYA MANDALA SAMPOERNA10,636,196 3,120,284.53 1.26%IDRTELKOM INDONESIA -B-28,613,415 7,793,320.56 3.14%IDR
BRITISH AMERICAN TOBACCO (M) BHD70,477 551,739.96 0.22%MYRMalaysia 3,952,125.41 1.59%
PUBLIC BANK BHD793,800 3,400,385.45 1.37%MYR
FOMENTO ECONOMICO MEX-SP-ADR98,192 7,688,008.67 3.09%USDMexico 21,167,700.36 8.52%
GRUPO AEROPORTUARIO DEL PACIFICO SAB-B-322,536 2,754,775.76 1.11%MXNGRUPO FINANCIERO -B- ADR REPR 5 SHS -B-354,053 2,158,031.71 0.87%USDIENOVA766,324 3,123,761.68 1.26%MXNWAL MART2,672,563 5,443,122.54 2.19%MXN
GRUPA PEKAO SA100,840 3,126,353.84 1.26%PLNPoland 3,126,353.84 1.26%
UNITED OVERSEAS BANK289,261 4,824,942.33 1.94%SGDSingapore 4,824,942.33 1.94%
NASPERS -N-23,382 5,450,125.09 2.19%ZARSouth Africa 8,653,278.26 3.48%
REMGRO LTD200,949 3,203,153.17 1.29%ZAR
AMOREPACIFIC CORP15,148 3,708,469.45 1.49%KRWSouth Korea 13,610,148.31 5.48%
KANGWON LAND93,850 2,356,414.57 0.95%KRWLG HOUSEHOLD AND HEALTHCARE4,000 3,760,370.40 1.51%KRWSAMSUNG FIRE AND MARINE INSURANCE18,197 3,784,893.89 1.53%KRW
PRESIDENT CHAIN STORE CORP36,149 293,044.90 0.12%TWDTaiwan 11,734,071.19 4.72%
TAIWAN SEMICON ADR (REPR 5 SHS)115,826 3,829,317.85 1.54%USDTAIWAN SEMICONDUCTOR MANUFACTURING CO LTD1,161,072 7,611,708.44 3.06%TWD
AIRPORT OF THAILAND PUB CO -F-2,036,500 3,554,046.49 1.43%THBThailand 11,064,517.56 4.46%
CP SEVEN ELEVEN ALL FOREIGN REGISTERED2,610,619 5,158,981.82 2.08%THB
Securities portfolio as at 31/12/17EURExpressed in
NEF - Emerging Market Equity
Quantity /Nominal Denomination Quotation
currency% of net
assetsMarket value

The accompanying notes form an integral part of these financial statements
39Page
THAI BEVERAGE PUBLIC CO LTD4,102,899 2,351,489.25 0.95%SGD
HEINEKEN NV87,703 7,624,021.79 3.07%EURThe Netherlands 14,910,170.01 6.00%
UNILEVER NV155,173 7,286,148.22 2.93%EUR
BRITISH AMERICAN TOBACCO PLC45,306 2,538,352.70 1.02%ZARUnited Kingdom 2,538,352.70 1.02%
LAS VEGAS SANDS CORP79,114 4,584,033.90 1.85%USDUnited States of America 4,584,033.90 1.85%
PEACE MARK (HOLDING)311,100 0.03 0.00%HKD
Other transferable securities 0.03 0.00%
Convertible bonds 0.03 0.00%
Bermuda 0.03 0.00%
Total securities portfolio 240,427,264.47 96.81%
Securities portfolio as at 31/12/17EURExpressed in
NEF - Emerging Market Equity
Quantity /Nominal Denomination Quotation
currency% of net
assetsMarket value

The accompanying notes form an integral part of these financial statements
40Page
Statement of Operations and Changes in Net Assets from 01/01/17 to 31/12/17Expressed in EUR
NEF - Emerging Market Equity
4,619,382.04Income4,561,883.45Net dividends 2Note
53,988.12Securities lending income 2,8Note3,510.47Other financial income
6,368,408.12Expenses4,901,408.33Management & advisory fees 5Note
180,998.57Depositary & sub-depositary fees 7Note117,173.67Taxe d'abonnement 4Note73,724.50Administrative expenses1,882.54Professional fees
31,117.67Bank interest on overdrafts10,392.19Legal fees
365,993.71Transaction fees 2Note1,613.33Publication & printing fees
557,366.80Correspondent bank fees 2Note126,736.81Other expenses
-1,749,026.08Net loss from investmentsNet realised profit / loss on:
28,188,934.78- sales of investment securities 2Note686.54- forward foreign exchange contracts 2Note
-2,464,907.83- foreign exchange 2Note
23,975,687.41Net realised profitMovement in net unrealised appreciation /(depreciation) on:
13,025,684.79- investments 2Note
37,001,372.20Increase in net assets as a result of operations79,846,057.78Subscription capitalisation units
-79,265,933.05Redemption capitalisation units
37,581,496.93Increase in net assets
210,769,437.85Net assets at the beginning of the year
248,350,934.78Net assets at the end of the year

41Page
NEF- Global Bond
NEF - Global Bond Manager’s Report
Page 42
Annual Comment - 2017 Market review The year started with the inauguration of Donald Trump as the president of the United States. Global economic data continued to hold up well which in turn helped to support a positive backdrop for most risk assets. In the UK, Article 50 was triggered in March and in May Emmanuel Macron won the French elections. The ensuing relief saw European risk assets enjoy a strong run that lasted all the way into the year end. In the US, the May FOMC meeting concluded that slightly weak US growth in the first quarter would be short lived and that the rate hiking cycle was likely to continue, and indeed in June the Fed did hike rates by another 25 bps, taking US rates to between 1% and 1.25%. The second half of the year saw the theme of central bank tightening become more pronounced with the Bank of Canada going first with a rate rise. In September S&P ratings agency upgraded Portugal’s debt to BBB- from below investment grade, helping the sovereign bonds perform strongly into the year end. The ECB outlined plans to halve the value of bonds bought from €60 bn to €30 bn per month, starting from January 2018 and bond buying would continue to at least the end of 2018, which markets took to be dovish. In response, German bunds outperformed other developed markets bonds, especially US treasuries, although some of this performance was given up by the end of the year. The Bank of England (BoE) raised rates for the first time since the financial crisis with a base rate increase from 25 bps to 50 bps. A new head of the Federal Reserve was appointed and as widely expected, it was Jerome Powell, who is already on the board of governors for the bank, so the news had little market impact, as policy continuity is widely expected. Towards the end of the year, the price of crude oil edged up to around the $60 per barrel mark, as supply tightened following a producer agreement to limit oil output into 2018. In December, the US Federal Reserve raised the Fed funds rate by another 25 bps, to 1.25% to 1.5%, citing continuing improvements in the labour market and a general recovery to economic activities following the disruption caused by hurricanes. In late December, president Trump signed the “Tax Cuts and Jobs Act” into law. The new tax bill cuts corporate taxes and provides individuals with temporary tax relief, although questions have been raised around the bill’s impact on the government’s deficits and reduced tax revenue. Performance commentary Through 2017, the fund considerably outperformed the benchmark, with the fund returning -2.58% net of fees compared to a benchmark return of -6.16%. This marked an outperformance of 3.58% net of fees. G10 Sovereign bond positions were negative contributors in 2017:
-Duration: despite the hawkish tone emanating from some central banks, long dated yields across many developed markets yield curves fell, causing our underweight duration positioning to detract from relative returns -Country allocation: this was a positive contributor as a relatively larger underweight allocation to US treasuries compared to other developed markets bonds helped, after treasury yields rose considerably through the year
-Yield curve: flattening positions on the German and US treasury yield curves added positively as the long end of developed markets yield market curves outperformed short dated yields on an improved inflation outlook
-Bond selection: overweight allocations to peripheral European government bonds especially off-benchmark allocations to Portuguese government bonds helped strongly and added 1.27% through the year

NEF - Global Bond
Manager’s Report (continued)
Page 43
Credit positions made a strongly positive contribution to relative performance in 2017:
Credit: Overweight positioning within corporate bonds, particularly high quality European financial issuers, added was the strongest contributor to relative returns Emerging markets: Overweight exposure to emerging markets bonds were positive contributors. Emerging markets bonds, especially hard currency bonds, saw positive risk adjusted returns as yield spreads fell.
FX positions were positive contributors to relative performance in 2017:
USD exposure: overweight exposure to the USD was a negative contributor as the currency weakened against a basket of developed markets currencies in 2017
Inter-bloc (EUR, CAD, JPY) allocation: was a significant contributor as the EUR and CAD both appreciated significantly against the JPY Intra bloc currency allocations: these were positive contributors to annual returns. We gained on our EUR-bloc allocation through a short position in the CHF versus overweight allocations to the EUR although there was some detract from a relative preference for the JPY vs. KRW. Emerging markets currencies: long emerging markets currency exposures were modestly positive as they generally benefitted from a weaker against the USD and stronger growth in emerging markets
Outlook
Growth across the US, Europe and Emerging Markets is currently the strongest since the financial crisis, which we believe will be a catalyst for more rate rises to come from the US Fed in 2018. Additionally, the Fed will be reducing their balance sheet through less re-investment of maturing bonds and coupon proceeds, potentially leading to higher treasury yields. The ECB has taken similar actions and will from January, halve the rate of bond buying. The Bank of England may also join this band of tightening central banks as already demonstrated by their November rate hike, with more expected if inflation, as expected, rises to around 3%. Global central bank policies nonetheless remain varied and the flexibility to diversify risk into as many economic cycles as possible will remain important. We believe that lower duration positioning will remain key to protecting against central bank tightening actions. To this end, allocations to corporate bonds, emerging markets assets and currencies not only provide hedges against rising rates, they can enhance portfolio yield, and increase the overall potential to generate alpha. High levels of liquidity and a higher yield pick-up remains very important, and we continue to seek out opportunities to add high quality corporate bonds and higher yielding currencies to the portfolio to achieve this. With growth at current levels we expect support for corporate and emerging market bonds, but also currencies, thanks to the prospect of rate hikes.

The accompanying notes form an integral part of these financial statements
44Page
210,211,382.31Assets187,192,699.64Securities portfolio at market value 2Note188,532,088.76Cost price
-1,339,389.12Unrealised loss on the securities portfolio44,818.01Options purchased at market value 2Note
170,844.30Options purchased at cost7,891,843.48Cash at banks and liquidities1,600,314.27Interest receivable1,050,670.38Subscribers receivable
418,354.57Unrealised net appreciation on financial futures 2Note12,006,280.62Receivable on spot exchange
6,401.34Other assets
17,346,289.26Liabilities26,582.28Options sold at market value 2Note92,647.48Options sold at cost
3,300,053.28Bank overdrafts19,489.45Taxe d'abonnement payable 4Note
362,522.42Redemption payable1,282,585.78Unrealised net depreciation on forward foreign exchange contracts 2Note
136,679.96Unrealised net depreciation on swaps 2,6Note173,911.65Accrued management & advisory fees 5Note
4,193.12Accrued depositary & sub-depositary fees 7Note4,894.70Accrued administrative expenses
11,996,858.93Payable on spot exchange38,517.69Other liabilities
192,865,093.05Net asset value
Financial Statements as at 31/12/17
Expressed in EUR
Statement of Net Assets as at 31/12/17
NEF - Global Bond
Global Bond - Category RCapitalisation units 10,038,487.353 3,117,240.235 2,733,436.204 10,422,291.384
Global Bond - Category ICapitalisation units 3,307,172.176 616,362.427 1,954,961.506 1,968,573.097
Changes in number of units outstanding from 01/01/17 to 31/12/17
Units issued Units redeemed Units outstandingas at 31/12/17
Units outstandingas at 01/01/17

The accompanying notes form an integral part of these financial statements
45Page
Key figures relating to the last 3 years
NEF - Global Bond
Global Bond - Category R
Capitalisation units
15.1610,422,291.384 10,038,487.353
15.698,687,840.049
15.42Number of unitsNet asset value per unit
EUR EUR EUR
Global Bond - Category I
Capitalisation units
17.721,968,573.097 3,307,172.176
18.195,374,928.023
17.74Number of unitsNet asset value per unit
EUR EUR EUR
Total Net Assets 192,865,093.05 217,600,292.36 229,368,037.57
31/12/1531/12/1631/12/17Year ended on :
EUR

The accompanying notes form an integral part of these financial statements
46Page
AUSTRALIA -137- 2.75 12-24 21/04S2,500,000 1,655,951.80 0.86%AUD
Transferable securities admitted to an official stock exchange listing and/or dealt inon another regulated market 168,565,967.96 87.40%
Bonds 140,390,655.99 72.79%
Australia 3,487,151.93 1.81%
AUSTRALIAN GOVT 4.25 13-26 21/04S2,500,000 1,831,200.13 0.95%AUD
BRAZIL -DY- 10.00 10-21 01/01S15,000 4,058,940.05 2.11%BRLBrazil 6,067,705.04 3.15%
BRAZIL REPUBLIC 2.625 12-23 05/01S2,500,000 2,008,764.99 1.04%USD
ALIBABA GROUP 4.0 17-37 06/12S1,000,000 860,168.23 0.45%USDCayman Islands 860,168.23 0.45%
REPUBLIC OF CHILE 1.875 15-30 27/05A2,000,000 2,086,900.00 1.08%EURChile 2,086,900.00 1.08%
BNP PARIBAS CARDIF 1.00 17-24 29/11A700,000 688,828.00 0.36%EURFrance 10,206,063.00 5.29%
FRANCE 1.00 16-27 25/05A3,000,000 3,100,650.00 1.61%EURFRANCE OAT 3.25 12-45 25/05A4,750,000 6,416,585.00 3.32%EUR
GERMANY 2.50 14-46 15/08A1,600,000 2,102,768.00 1.09%EURGermany 2,102,768.00 1.09%
HUNGARY 1.75 17-27 10/10A650,000 674,024.00 0.35%EURHungary 674,024.00 0.35%
INTESA SANPAOLO SUB 2.855 15-25 23/04A900,000 929,025.00 0.48%EURItaly 26,778,411.52 13.88%
ITALIA LONG TERM TB 2.80 16-67 01/03S1,000,000 863,190.00 0.45%EURITALIE 1.50 15-25 01/06S7,000,000 6,971,090.00 3.60%EURITALY 1.85 17-24 15/05S4,500,000 4,655,700.00 2.41%EURITALY BTP 1.60 16-26 01/06S2,500,000 2,465,425.00 1.28%EURITALY BTP 3.25 14-46 01/09S1,000,000 1,017,660.00 0.53%EURITALY BTP 4.75 13-44 01/09S750,000 960,255.00 0.50%EURITALY BTP 5.50 12-22 01/09S3,000,000 3,659,220.00 1.90%EURITALY INFL. INDEX 2.35 14-24 15/09S1,000,000 1,172,286.52 0.61%EURITALY TREASURY BONDS 2.20 17-27 01/06S4,000,000 4,084,560.00 2.12%EUR
JAPAN 49 1.40 15-45 20/12S700,000,000 6,000,683.08 3.11%JPYJapan 6,000,683.08 3.11%
MEXICAN BONOS 6.50 11-21 10/06S2,000,000 8,236,653.65 4.28%MXNMexico 15,096,597.65 7.83%
MEXIQUE 1.375 16-25 15/01A2,000,000 2,032,560.00 1.05%EURPEMEX 2.75 15-27 21/04A3,600,000 3,461,292.00 1.79%EURPETROLEOS MEXICANO 2.50 17-21 21/08A1,300,000 1,366,092.00 0.71%EUR
POLAND DS0726 2.50 15-26 25/07A24,000,000 5,450,372.68 2.83%PLNPoland 5,450,372.68 2.83%
PORTUGAL 2.875 16-26 21/07A3,000,000 3,273,930.00 1.70%EURPortugal 10,178,237.00 5.28%
PORTUGAL 4.10 15-45 15/02A2,200,000 2,576,882.00 1.34%EURPORTUGAL 5.65 13-24 15/02A3,000,000 3,817,800.00 1.98%EURREDE FERROVIARIA 4.25 06-21 13/12A450,000 509,625.00 0.26%EUR
SPAIN 2.90 16-46 31/10A1,000,000 1,012,100.00 0.52%EURSpain 4,582,910.00 2.38%
SPAIN 3.80 14-24 30/04A3,000,000 3,570,810.00 1.86%EUR
PETROBRAS GLB REG 5.999 17-28 27/01S1,600,000 1,338,960.69 0.69%USDThe Netherlands 2,220,712.65 1.15%
PETROBRAS GLOBAL F 6.125 17-22 17/01S996,000 881,751.96 0.46%USD
UK TREASURY 2.75 14-24 07/09S350,000 440,964.91 0.23%GBPUnited Kingdom 10,686,247.40 5.54%
UK TSY 3.25 12-44 22/01S5,500,000 8,072,263.84 4.18%GBPUNITED KINGDOM 4.25 06-27 07/12S1,500,000 2,173,018.65 1.13%GBP
AT AND T INC 5.150 17-50 14/02S1,250,000 1,054,775.98 0.55%USDUnited States of America 33,911,703.81 17.57%
GOLDMAN SACHS GROUP 1.375 17-24 15/05A2,000,000 2,044,140.00 1.06%EURUS TREASURY INDEXEE FL.R 15-20 15/04S8,000,000 7,004,986.67 3.63%USDUS TREASURY INDEXEE 1.375 10-20 15/01S2,600,000 2,535,483.57 1.31%USDUS TREASURY N/B 2.00 17-24 30/06S2,400,000 1,960,411.82 1.02%USDUS TREASURY NB 2.00 17-22 31/10S5,000,000 4,128,595.27 2.14%USDUS TREASURY NOTE 2.25 17-27 15/11S1,000,000 821,392.52 0.43%USD
Securities portfolio as at 31/12/17EURExpressed in
NEF - Global Bond
Quantity /Nominal Denomination Quotation
currency% of net
assetsMarket value

The accompanying notes form an integral part of these financial statements
47Page
USA T NOTES 2.25 16-46 15/08S1,500,000 1,127,178.24 0.58%USDUSA TREASURY NTS INDX 1.75 08-28 15/01S12,000,000 13,234,739.74 6.85%USD
ERSTE GROUP BK SUB FL.R 17-XX 15/04S1,000,000 1,162,270.00 0.60%EUR
Floating rate bonds 28,175,311.97 14.61%
Austria 1,162,270.00 0.60%
BANCOLOMBIA SA FL.R 17-27 18/10S1,200,000 991,179.22 0.51%USDColombia 991,179.22 0.51%
CREDIT AGRICOLE ASSU FL.R 16-48 27/09A500,000 595,510.00 0.31%EURFrance 6,100,232.25 3.17%
CREDIT AGRICOLE REGS FL.R 14-XX 23/01Q1,000,000 944,453.70 0.49%USDORANGE SA FL.R 14-XX 07/02A1,000,000 1,263,538.55 0.66%GBPTOTAL SA FL.R 16-XX 06/10A3,000,000 3,296,730.00 1.71%EUR
ASSICURAZIONI GENERAL FL.R 16-48 08/06A500,000 578,590.00 0.30%EURItaly 2,988,032.36 1.55%
ENEL SUB FL.R 14-76 15/09A1,000,000 1,298,552.36 0.67%GBPINTESA SAN PAOLO FL.R 14-XX 17/12A1,000,000 1,110,890.00 0.58%EUR
BANCO SANT REGS SUB FL.R 14-XX 11/09Q1,400,000 1,537,494.00 0.80%EURSpain 3,157,449.00 1.64%
BANKIA SUB FL.R 17-XX 18/07Q1,000,000 1,050,010.00 0.54%EURMAPFRE SUB FL.R 17-47 31/03A500,000 569,945.00 0.30%EUR
CS GROUP REGS FL.R 13-XX 11/12S1,500,000 1,429,109.76 0.74%USDSwitzerland 2,336,987.84 1.21%
UBS GROUP AG SUB FL.R 16-XX 10/08A1,000,000 907,878.08 0.47%USD
ABN AMRO FL.R 15-XX 22/03S700,000 765,443.00 0.40%EURThe Netherlands 4,248,320.00 2.20%
RABOBANK NEDERLAND FL.R 15-XX 31/12S1,000,000 1,086,080.00 0.56%EURTELEFONICA EUROPA SUB FL.R 16-XX 15/09A1,000,000 1,055,080.00 0.55%EURVW INTL FINANCE REGS FL.R 17-XX 14/12A1,300,000 1,341,717.00 0.69%EUR
BARCLAYS FL.R 17-28 07/02A2,000,000 1,993,080.00 1.03%EURUnited Kingdom 3,726,141.30 1.93%
HSBC HLDGS FL.R 15-XX 30/03S1,000,000 897,684.88 0.47%USDROYAL BK OF SCOTLAND FL.R 17-23 15/05S1,000,000 835,376.42 0.43%USD
BANK OF AMERICA CO FL.R 17-27 04/05A1,400,000 1,462,720.00 0.76%EURUnited States of America 3,464,700.00 1.80%
MORGAN STANLEY FL.R 17-26 23/10A2,000,000 2,001,980.00 1.04%EUR
UNITED MEXICAN STATES 4.15 17-27 28/03S600,000 519,178.88 0.27%USD
Other transferable securities 8,038,756.99 4.17%
Bonds 2,205,721.99 1.14%
Mexico 519,178.88 0.27%
GENERAL MOTORS 2.25 17-24 06/09A1,500,000 1,686,543.11 0.87%GBPUnited States of America 1,686,543.11 0.87%
INTESA SAN PAOLO FL.R 17-XX 16/05S1,500,000 1,633,485.00 0.85%EUR
Floating rate bonds 5,833,035.00 3.03%
Italy 3,265,710.00 1.70%
UNICREDIT SPA FL.R 17-49 03/12S1,500,000 1,632,225.00 0.85%EUR
CAIXABANK SA FL.R 17-27 15/02A1,500,000 1,590,945.00 0.82%EURSpain 1,590,945.00 0.82%
FERROVIAL NL BV 2.124 17-XX 14/11A1,000,000 976,380.00 0.51%EURThe Netherlands 976,380.00 0.51%
AMUNDI FD BD GLO CORP OHE CAP7,422 7,933,774.69 4.11%EUR
Shares/Units of UCITS/UCIS 10,587,974.69 5.49%
Shares/Units in investment funds 10,587,974.69 5.49%
Luxembourg 10,587,974.69 5.49%
AMUNDI FD BD GLO EMG COR OHE CAP2,500 2,654,200.00 1.38%EUR
Total securities portfolio 187,192,699.64 97.06%
Securities portfolio as at 31/12/17EURExpressed in
NEF - Global Bond
Quantity /Nominal Denomination Quotation
currency% of net
assetsMarket value

The accompanying notes form an integral part of these financial statements
48Page
Statement of Operations and Changes in Net Assets from 01/01/17 to 31/12/17Expressed in EUR
NEF - Global Bond
5,863,485.35Income5,780,601.48Net interest on bonds 2Note
4,631.36Bank interest on cash account 2Note35.85Bank interest on time deposits 2Note
25,369.66Securities lending income 2,8Note13,158.81Income on repurchase agreements 2Note38,652.78Interest on swaps1,035.41Other financial income
3,420,084.71Expenses2,141,297.52Management & advisory fees 5Note
53,247.90Depositary & sub-depositary fees 7Note77,763.54Taxe d'abonnement 4Note64,157.23Administrative expenses2,597.76Professional fees
32,307.08Bank interest on overdrafts9,100.50Legal fees
131,982.06Transaction fees 2Note1,417.49Publication & printing fees
19,980.00Bank charges530,274.96Correspondent bank fees 2Note254,972.21Interest on swaps100,986.46Other expenses
2,443,400.64Net income from investmentsNet realised profit / loss on:
4,875,761.90- sales of investment securities 2Note-205,724.41- options 2Note
-3,561,949.64- forward foreign exchange contracts 2Note-2,536,328.93- financial futures 2Note
66,258.56- swaps 2Note-4,719,345.58- foreign exchange 2Note
-3,637,927.46Net realised lossMovement in net unrealised appreciation /(depreciation) on:
-3,446,505.29- investments 2Note-20,476.93- options 2Note
-1,464,919.25- forward foreign exchange contracts 2Note1,820,843.96- financial futures 2Note
26,655.02- swaps
-6,722,329.95Decrease in net assets as a result of operations59,322,953.47Subscription capitalisation units
-77,335,822.83Redemption capitalisation units
-24,735,199.31Decrease in net assets
217,600,292.36Net assets at the beginning of the year
192,865,093.05Net assets at the end of the year

49Page
NEF- Euro Bond

NEF - Euro Bond
Manager’s Report
Page 50
MONETARY POLICY
After raising key rates in December 2015 and then in December 2016, the US Federal Reserve (Fed) undertook three 25bp hikes in 2017, in March, June and December. Since 13 December, the fed funds target rate has ranged between 1.25% and 1.50%. This faster pace compared to the two previous years reflects the Fed’s conviction that the economy is in the process of meeting its dual objectives of full employment and price stability. The steady decline in the unemployment rate (from 4.8% in January to 4.1% in November, a low since end-2000) and GDP growth, which came in at 3% on an annualised pace after a disappointing first quarter, fully endorse an optimistic scenario on economic activity. Things are less clear on inflation, given modest wage growth and fluctuating consumer prices. In December, Fed chair Janet Yellen acknowledged that “inflation has run lower than we expected” and that a longer period of job market solidity may be required until the inflation target is met. However, the Fed reiterated its intention to stick with its key rate hikes, including three in 2018, even though inflation (1.5% in November for the PCE deflator, ex-food and ex-energy) remains moderate and is not expected to meet the 2% target until 2020. The Fed announced in September that in October it would begin shrinking its balance sheet. The Fed had begun to flag this new phase of normalisation in monetary policy during the spring, and operations consisting of no longer reinvesting all proceeds from maturing securities (T-notes and MBS) are proceeding normally. When her term expires in February, Janet Yellen will be replaced as Fed chairman by Jay Powell, who appears to be the choice of continuity. During the vetting process, Donald Trump sent out mixed signals, even hinting that he could reappoint Yellen while mentioning candidates more likely to worry observers.
Since March 2016, the European Central Bank (ECB) has kept its key rates on hold (0% for the main refinancing rate, 0.25% for the marginal lending facility, and -0.40% for the deposit facility). The ECB intends to keep rates very low for an extended period of time and well beyond the deadline for ending quantitative easing (QE). From April 2016 to March 2017, QE amounted to EUR 80 billion per month. It was lowered to EUR 60 billion in April and, in October 2017, the ECB announced a new reduction to EUR 30 billion a month beginning in January 2018. QE, which has been in place since March 2015, will continue until at least September 2018 and will not stop suddenly. The ECB’s 26 October monetary policy meeting was highly awaited by investors who feared a more hawkish tone, similar to the late June speech in Sintra, Portugal, given that the Eurozone economy, which was already doing well in June, had improved considerably since then. The ‘recalibration’ (the expression used during the press conference) was quite modest and came with highly accommodative language. For example, the ECB reserved the option of “increasing the size of the programme in terms of size and/or duration”. In the following weeks, several governors more or less explicitly expressed their disagreement, with some even calling for a clear end date for QE. The debate within the ECB is between those who believe that growth is very solid and reasonably shock-resistant and those who argue that inflation is still modest (0.9% for core inflation in October and November). Despite 0.6% GDP expansion in the third quarter, surveys pointing to growth at least as strong in the fourth quarter, and with upgraded forecasts for 2018 and 2019, Mario Draghi is clearly in the latter camp. He acknowledges that the risks of deflation have vanished and that there is less probability of inflation returning to 0.5% to 0.6% but concluded that it is difficult “to go much beyond that”.
BOND MARKETS
The 10-year T-note yield, which came to 2.44% at the end of 2016, ended 2017 at 2.41%. This slight difference in 12 months, after a steep rise in yields in late 2016, reflects the lack of strong convictions or a wilful ignorance of certain signals. The 10-year yield ranged between 2.30% and 2.65% until the end of March and then moved a little lower but still directionless, until September, and once again around 2.40% until year- end. The yield peaked on the day before the 14-15 FOMC meeting. The key rate hike had already been priced in, but observers feared a hawkish tone from the Fed, which ultimately did not happen. Until the summer, dips (to about 2.10%) came mainly in response to political concerns in the broadest sense (US airstrikes in Syria, tensions with North Korea, a presidential election in France, and talk of impeaching the US president). A low for the year was hit in September, at less than 2.05% in the midst of a flight to safety after North Korea’s announcement of a new nuclear test. Some reassurance was provided by the prompt international reaction, with the UN Security Council voting unanimously in favour of sanctions. The 10-year T-note yield then turned up, a trend amplified by hopes that the Trump administration’s tax reform would be passed. It moved above 2.45% in October when it seemed that Congress could approve tax cuts by year-end. It then traded directionless as trading thinned in the run-up to year-end, returning to 2.50% in December before pulling back before Christmas. The 2-year T-note yield reacted to the key rate hike, causing a significant flattening in the curve, with a 52bp spread vs. the 10-year yield, a low since October 2007.

NEF - Euro Bond
Manager’s Report (continued)
Page 51
After a rough ride, tracking economic news, shifts in US long bond yields, questions on the ECB’s intentions, and political considerations, the 10-year Bund ended the year at 0.43%, 22bp higher than at the end of 2016. Political considerations played a major role until the first round of the French presidential elections, based on polls that had non-resident investors worried. The 10-year Bund yield hit a low on the year, at 0.16% on 18 April in a flight to safety as pre-election polls suggested that Eurosceptic parties were picking up votes, while French yields exceeded 1.10%. Investors cheered the outcome of the first round and Emmanuel Macron’s 7 May victory. The most decisive moment came at the very end of the first half, with a shift in the ECB’s tone. On 27 June, Mario Draghi reiterated his confidence in the European economy and said that the return of inflation to the target was more likely than a few years previously. His words triggered steep declines on the German market from clearly overvalued levels, given that the 10-year Bund had fallen below 0.25% in mid-June. It hit 0.60% on 13 July, a high on the year. Mario Draghi then managed to provide reassurance. In October, the recalibration of quantitative easing left the ECB’s monetary policy highly accommodative, which pushed long bond yields down further. Until year-end, yields were erratic, tracking long US yields. Note, however, that the pre-Christmas US pullback did not spill over into the Eurozone, which may be the sign that investors believe the ECB has spent its last QE ammunition. FOREX MARKETS In early January, following the spike in the US dollar after the surprise election of Donald Trump in November, the EUR/USD fell below 1.04, a level not seen since early 2003. It then consolidated, ranging between 1.05 and 1.09 until April, as it tracked expectations of Fed and ECB monetary policy, before beginning an upward phase that continued until September. After stalling at about 1.18, it crossed the 1.20 threshold against a backdrop of geopolitical risks. At first, the dollar had been weakened by the vicissitudes within the Trump administration and its difficult relations with Congress during the first months of the new president’s term. The euro began to strengthen in late June, tracking a change in the ECB’s tone. During a colloquium in Sintra, Portugal, Mario Draghi said that deflationary pressures had vanished, which was interpreted as flagging an imminent shift in monetary policy. During the rest of the year, the ECB chairman returned to a more accommodative tone but other Governing Council members sounded more hawkish. Against this backdrop, the EUR/USD was rather erratic in the fourth quarter, as fickle market participants put a different spin on events from week to week. For example, there were divergent reactions to Fed and ECB monetary policy decisions. In late October, Draghi’s accommodative tone triggered a drop in the euro to USD 1.16, while the dollar did not derive much support from greater expectations of Fed key rate hikes and the actual announcement on 13 December. The EUR/USD returned to above USD 1.20 at the very end of the year. In 12 months the euro gained 13.7% vs. the dollar, the biggest gain among G10 currencies.
As was the case for the EUR/USD, the USD/JPY in early 2017 reflected a pause for breath after the wide swings following Donald Trump’s election in November 2016. From 117 at the start of the year, the USD/JPY turned back down, while managing to hold at thresholds that are less unfavourable for Japanese exporters at between 108 and 115 beginning in March and for almost the rest of the year. In September, the yen temporarily recovered its normal role as a safe haven, as geopolitical tensions ramped-up with North Korean nuclear tests, sending the exchange rate briefly below 108, a low on the year. In late October and early November, Shinzo Abe’s victory in 22 October legislative elections weakened the yen, with the prime minister still in favour of the Bank of Japan’s highly accommodative monetary policy, which Governor Kuroda intends to stick to. The USD/JPY ended the year at 112.65, meaning the yen rose by 3.6%, with the reference point being a low in the Japanese currency. CREDIT MARKET
The credit market, in terms of absolute performance, was the best asset class in the Investment Grade universe.
The credit market as a whole posted a performance of 2.41%. What is surprising is that it was not the asset sub-class purchased by the ECB that performed the best.
According to Bloomberg indices, Industrials posted 1.78%, Utilities 2.22% and Financial 3.23% (driven by both insurance and banks subordinated securities). The ECB’s asset purchase programme gave a positive sign on the more risky assets. This was clear on the primary market. This year has been a very good year in terms of new issues, in particular those of industrial issuers.
Over 2017, the latter issued €398 billion (vs €352 billion in 2016, i.e. an increase of 13%); whereas financial institution issuers (in the broadest sense) “only” issued €314 billion (vs €320 billion in 2016, i.e. a 2% yoy decrease).
Over the year, the ECB purchased around €80 billion, the equivalent of almost one fifth of the primary market.

NEF - Euro Bond
Manager’s Report (continued)
Page 52
INVESTMENT POLICY:
At the beginning of 2017, the portfolio was underexposed to interest rates compared to its benchmark index. This under exposure was increased up until May, reaching -1.20 compared with the benchmark index. The underweight position was then reduced to reach -0.40 at the end of July. Over the final part of the year, this underweight position was increased again to end 2017 at -1.20.
This was achieved through limited exposure to Austria, the Netherlands and Belgium.
Italy and Spain were favoured throughout the year. At the beginning of the year, the fund was overexposed the most to Spain, whereas as the end of the year this was shifted to Italy (political issues in Spain was one of the reasons for this trend reversal in addition to the fact that Spanish yields are much lower than those offered by Italy).
In terms of maturities, we favoured the three- to 10-year range until December, when we shifted to a neutral exposure by selling the seven- to 10-year range due to low rates and possible changes by the central banks. We stayed away from maturities of longer than 15 years throughout the year.
In terms of credit, despite the fact the ECB is not purchasing Financials, this sub-sector was again favoured; subordinated loans remained the most attractive and therefore the most overweighted. Senior debt exposure was steadily increased throughout the year.
The underexposure to the Industrial sub-sector at the beginning of 2017 was increased, firstly in order to avoid investing in long bonds where the lack of visibility appeared too great compared with the low yields achieved and, secondly, as securities with the shortest maturities were sold as they offered very weak or even negative yields.
OUTLOOK
As 2018 begins, the environment still looks promising for equities. In reaction to the solid prospects for the global economy and proactive economic policies, analysts have revised their earnings forecasts upwards, while government bond yields are likely to remain low. This combination should push equities up further despite valuations that are stretched in absolute terms, particularly in the US. Even so, investors may be troubled by doubts on both the economic scenario and monetary policies. Any sudden pick-up in inflation would likely make them wonder why central banks are being so cautious about phasing out non-conventional policies. This, in turn, would hit both the bond and equity markets, which have been driven in recent years by inflows of liquidity. While everything suggests that the new Fed chairman should stick to the current line, he could emerge as a source of uncertainty, at least in the initial months of his term. And while everything looks quiet for the moment on the political front, nervousness could re-emerge in reaction to geopolitical events (e.g. the US’s attitude vis-à-vis North Korea and the Middle East) or if issues currently hanging in the balance in Europe (Brexit negotiations, the formation of a governing coalition in Germany, developments in Catalonia, and legislative elections in Italy) appear to be dragging on for too long. This could re-stoke volatility, but, even so, the outlook is bright, given solid macroeconomic fundamentals and a pro-business environment in the US in the wake of the corporate tax cut.
Annual net performance stood at -0.31%.

The accompanying notes form an integral part of these financial statements
53Page
160,133,757.69Assets154,489,517.11Securities portfolio at market value 2Note153,118,674.55Cost price
1,370,842.56Unrealised profit on the securities portfolio2,310.00Options purchased at market value 2Note
4,388,790.15Cash at banks and liquidities1,202,488.08Interest receivable
34,581.18Subscribers receivable8,722.54Unrealised net appreciation on financial futures 2Note7,348.63Other assets
564,213.72Liabilities10,805.18Bank overdrafts19,896.59Taxe d'abonnement payable 4Note
367,941.10Redemption payable127,461.47Accrued management & advisory fees 5Note
3,455.00Accrued depositary & sub-depositary fees 7Note4,033.08Accrued administrative expenses
30,621.30Other liabilities
159,569,543.97Net asset value
Financial Statements as at 31/12/17
Expressed in EUR
Statement of Net Assets as at 31/12/17
NEF - Euro Bond
Euro Bond - Category RCapitalisation units 9,209,830.973 2,018,405.489 2,697,462.990 8,530,773.472
Euro Bond - Category ICapitalisation units 84,947.854 64,705.439 123,673.672 25,979.621
Changes in number of units outstanding from 01/01/17 to 31/12/17
Units issued Units redeemed Units outstandingas at 31/12/17
Units outstandingas at 01/01/17

The accompanying notes form an integral part of these financial statements
54Page
Key figures relating to the last 3 years
NEF - Euro Bond
Euro Bond - Category R
Capitalisation units
18.658,530,773.472 9,209,830.973
18.717,880,749.185
18.38Number of unitsNet asset value per unit
EUR EUR EUR
Euro Bond - Category I
Capitalisation units
19.3325,979.621 84,947.854
19.2738,228.576
18.81Number of unitsNet asset value per unit
EUR EUR EUR
Total Net Assets 159,569,543.97 173,932,424.46 145,591,130.59
31/12/1531/12/1631/12/17Year ended on :
EUR
The accompanying notes form an integral part of these financial statements
55Page
AUSTRIA 3.50 05-21 15/09A600,000 686,178.00 0.43%EUR
Transferable securities admitted to an official stock exchange listing and/or dealt inon another regulated market 144,896,320.96 90.81%
Bonds 139,827,810.56 87.63%
Austria 2,319,404.00 1.45%
AUSTRIA REP OF 3.65 11-22 20/04A1,400,000 1,633,226.00 1.02%EUR
ANHEUSER-BUSCH INB 1.50 16-25 17/03A950,000 998,725.50 0.63%EURBelgium 6,123,233.50 3.84%
BELFIUS BANQUE 1 0.625 14-21 14/10A400,000 409,988.00 0.26%EURBELGIQUE REGS 72 2.60 14-24 22/06A1,400,000 1,623,160.00 1.02%EURBELGIUM KINGDOM 4.25 12-22 28/09A650,000 786,253.00 0.49%EURBELGIUM KINGDOM REGS 3.00 14-34 22/06A1,400,000 1,786,582.00 1.12%EURKBC BANK 1.25 13-20 28/05A500,000 518,525.00 0.32%EUR
TOTAL CAPITAL 1.125 14-22 18/03A300,000 311,466.00 0.20%EURCanada 311,466.00 0.20%
FINLAND 1.50 13-23 15/04A900,000 973,287.00 0.61%EURFinland 1,687,917.00 1.06%
POHJOLA BANK 0.75 15-22 03/03A700,000 714,630.00 0.45%EUR
AIR LIQUIDE FIN 0.75 16-24 13/06A300,000 303,861.00 0.19%EURFrance 36,353,608.71 22.77%
ARRFP 1.125 14-21 15/01A600,000 617,028.00 0.39%EURAXA BANK EUROPE SCF 0.125 17-22 14/03A500,000 502,160.00 0.31%EURBANQUE FED CRED MU 2.375 16-26 24/03A900,000 962,514.00 0.60%EURBNP PARIBAS 2.75 15-26 27/01A175,000 191,861.25 0.12%EURBNP PARIBAS REGS 0.75 16-22 11/11A720,000 733,413.60 0.46%EURBPCE 0.375 16-23 05/10A800,000 793,208.00 0.50%EURBPCE 2.375 13-23 29/11A200,000 224,946.00 0.14%EURBPCE 2.875 16-26 22/04A400,000 443,480.00 0.28%EURBPCE SA 2.125 14-21 17/03A200,000 213,030.00 0.13%EURBPCE SFH 0.375 16-23 10/02A600,000 607,296.00 0.38%EURCADES 0.05 16-20 25/11A500,000 504,520.00 0.32%EURCAISSE FRANCAISE FIN 0.375 14-19 16/09A500,000 506,695.00 0.32%EURCIE DE FIN.FONCIER 0.375 15-20 29/10A600,000 610,716.00 0.38%EURCIE DE FIN.FONCIER 4.00 10-25 24/10A600,000 759,306.00 0.48%EURCIE FIN ET IND AUTO0.375 16-25 07/02A700,000 679,819.00 0.43%EURCM CIC CB EMTN 1.125 14-19 06/02A800,000 813,856.00 0.51%EURCREDIT MUTUEL ARKEA 3.25 16-26 01/06A900,000 1,003,428.00 0.63%EURFIN FONCIER 0.375 14-19 17/09A300,000 304,026.00 0.19%EURFRANCE GOVT 2.75 12-27 25/10A500,000 599,140.00 0.38%EURFRANCE (GOVT OF) 1.25 16-36 25/05A3,150,000 3,097,804.50 1.93%EURFRANCE (GOVT OF) 1.75 17-39 25/06A500,000 527,540.00 0.33%EURFRANCE OAT 0.25 14-20 25/11A3,500,000 3,564,890.00 2.22%EURFRANCE OAT 0.50 15-25 25/05A2,000,000 2,032,680.00 1.27%EURFRANCE OAT 0.50 15-26 25/05A5,550,000 5,578,471.50 3.49%EURFRANCE OAT 1.75 13-24 25/11A600,000 663,870.00 0.42%EURFRANCE OAT 2.50 13-30 25/05A2,000,000 2,364,400.00 1.48%EURFRANCE OAT 3.25 10-21 25/10A1,400,000 1,589,798.00 1.00%EURFRANCE OAT 4.25 06-23 25/10A680,184 848,060.21 0.53%EURFRANCE OAT 3.50 10-26 25/04A1,200,000 1,507,896.00 0.94%EURFRANCE OAT INDEX 2.10 08-23 25/07A850,000 1,132,458.41 0.71%EURFRANCE OAT INDEXE 1.10 10-22 25/07A700,000 870,578.72 0.55%EURLA BQUE POSTALE 1.875 13-20 11/09A400,000 423,252.00 0.27%EURRENAULT 1.00 17-25 28/11A786,000 777,605.52 0.49%EUR
ALLEMAGNE 0.25 17-27 15/02A750,000 743,100.00 0.47%EURGermany 20,454,375.50 12.82%
ALLEMAGNE 3.25 11-21 04/07A1,500,000 1,695,540.00 1.06%EURBRD 0.00 16-26 15/08U2,800,000 2,733,416.00 1.71%EURBRD 0.50 15-25 15/02A200,000 205,768.00 0.13%EURBRD 0.50 16-26 15/02A2,500,000 2,559,600.00 1.60%EURBRD 2.00 11-22 04/01A800,000 876,000.00 0.55%EURBRD 3.25 10-42 04/07A500,000 729,505.00 0.46%EURBUNDESREPUB DEUTS. 1.50 13-23 15/02A4,000,000 4,343,120.00 2.73%EURDAIMLER EMTN 0.25 16-20 11/05A1,000,000 1,006,030.00 0.63%EURGERMANY -301- 4.75 03-34 04/07A550,000 881,094.50 0.55%EURKFW 0.375 15-30 23/04A700,000 661,122.00 0.41%EUR
Securities portfolio as at 31/12/17EURExpressed in
NEF - Euro Bond
Quantity /Nominal Denomination Quotation
currency% of net
assetsMarket value
The accompanying notes form an integral part of these financial statements
56Page
KFW 0.125 15-20 01/06A1,500,000 1,520,955.00 0.95%EURKFW 0.125 17-24 15/01A2,500,000 2,499,125.00 1.57%EUR
IRELAND 3.90 13-23 20/03A1,600,000 1,919,040.00 1.20%EURIreland 4,936,360.00 3.09%
IRISH TSY 3.40 14-24 18/03A400,000 478,068.00 0.30%EURIRISH TSY REGS 0.80 15-22 15/03A2,000,000 2,078,060.00 1.30%EURIRLANDE 2.40 14-30 15/05A400,000 461,192.00 0.29%EUR
ATLANTIA 3.625 12-18 30/11A750,000 775,905.00 0.49%EURItaly 32,434,086.94 20.32%
ENI SPA 2.625 13-21 22/11A600,000 656,640.00 0.41%EURINTESA SAN PAOLO 2.00 14-21 18/06A400,000 422,892.00 0.27%EURINTESA SAN PAOLO 3.625 12-22 05/12A500,000 583,595.00 0.37%EURINTESA SANPAOLO EMTN 5.00 09-19 23/09A350,000 377,205.50 0.24%EURITALIE 0.45 16-21 01/06S700,000 703,787.00 0.44%EURITALIE 1.50 15-25 01/06S1,100,000 1,095,457.00 0.69%EURITALY 0.35 16-21 01/11S2,000,000 1,995,120.00 1.25%EURITALY BOT 1.05 14-19 01/12S1,300,000 1,328,418.00 0.83%EURITALY BOT 1.65 15-32 01/03S2,700,000 2,441,853.00 1.52%EURITALY BTP 1.35 15-22 15/04S2,000,000 2,060,640.00 1.29%EURITALY BTP 1.45 15-22 15/09S6,600,000 6,812,784.00 4.26%EURITALY BTP 1.50 14-19 01/08S2,000,000 2,054,200.00 1.29%EURITALY BTP 1.60 16-26 01/06S400,000 394,468.00 0.25%EURITALY BTP 4.00 05-37 01/02S1,600,000 1,876,608.00 1.18%EURITALY BTP 4.50 04-20 01/02S1,400,000 1,532,706.00 0.96%EURITALY BTP 4.50 13-24 01/03S680,000 811,294.40 0.51%EURITALY BTP 5.00 09-40 01/09S700,000 914,158.00 0.57%EURITALY BTP 6.50 97-27 01/11S250,000 350,727.50 0.22%EURITALY BTPS 3.75 10-21 01/03S2,200,000 2,441,626.00 1.53%EURITALY BTPS 4.50 10-26 01/03S400,000 485,416.00 0.30%EURITALY INFL. INDEX 1.65 14-20 23/04S800,000 844,647.54 0.53%EURITALY TREASURY BONDS 2.20 17-27 01/06S600,000 612,684.00 0.38%EURUNION DI BANCHE ITAL 0.375 16-26 14/09A900,000 861,255.00 0.54%EUR
EIB 1.50 13-20 15/07A1,000,000 1,049,770.00 0.66%EURLuxembourg 7,811,329.36 4.90%
EURO STABILITY MEC 0.10 15-20 03/11A534,584 542,383.43 0.34%EUREUROP INVEST BK 2.00 13-23 14/04A600,000 667,134.00 0.42%EUREUROPEAN FIN STABI 0.50 15-23 20/01A300,000 307,995.00 0.19%EUREUROPEAN UNION 0.625 15-23 04/11S758,000 781,755.72 0.49%EUREUROPEAN UNION 2.75 12-22 04/04A1,500,000 1,688,355.00 1.06%EUREUROP.INVEST.BK 0.375 16-26 14/04A823,000 819,107.21 0.51%EUREUROP.INVEST.BK 2.75 11-21 15/09A1,100,000 1,225,268.00 0.77%EURMICHELIN LUX 2.75 12-19 20/06A700,000 729,561.00 0.46%EUR
PORTUGAL 2.875 15-25 15/10A500,000 551,305.00 0.35%EURPortugal 3,457,130.00 2.17%
PORTUGAL 3.875 14-30 15/02A2,500,000 2,905,825.00 1.82%EUR
BBVA - SER A- 4.00 05-25 25/02A300,000 373,239.00 0.23%EURSpain 11,245,320.20 7.05%
SPAIN 1.15 15-20 30/07A1,800,000 1,860,588.00 1.17%EURSPAIN 1.40 14-20 31/01A2,100,000 2,172,702.00 1.36%EURSPAIN 1.60 15-25 30/04A350,000 366,079.00 0.23%EURSPAIN 4.40 13-23 31/10A1,090,000 1,326,944.20 0.83%EURSPAIN 4.70 09-41 30/07A1,300,000 1,780,376.00 1.12%EURSPAIN 4.85 10-20 31/10A1,800,000 2,051,892.00 1.29%EURSPAIN GOVT 1.95 15-30 30/07A750,000 752,220.00 0.47%EURTELEFONICA EMISIONES 3.961 13-21 26/03A500,000 561,280.00 0.35%EUR
SEB REGS 1.625 13-20 04/11A1,500,000 1,576,875.00 0.99%EURSweden 2,292,702.00 1.44%
SKANDINAVISKA ENSK 0.75 16-21 24/08A700,000 715,827.00 0.45%EUR
ING BANK NV 0.75 16-21 22/02A500,000 510,540.00 0.32%EURThe Netherlands 4,679,531.55 2.93%
NEDERLAND 2.25 12-22 15/07A1,600,000 1,780,768.00 1.12%EURNETHERLANDS 1.75 13-23 15/07A800,000 879,864.00 0.55%EURSHELL INT FIN 0.375 16-25 15/02A250,000 246,055.00 0.15%EURUNILEVER NV 00 16-20 29/04A635,000 636,606.55 0.40%EURVONOVIA FINANCE BV 1.625 15-20 15/12A600,000 625,698.00 0.39%EUR
Securities portfolio as at 31/12/17EURExpressed in
NEF - Euro Bond
Quantity /Nominal Denomination Quotation
currency% of net
assetsMarket value
The accompanying notes form an integral part of these financial statements
57Page
CREDIT AGRICOLE 0.875 15-22 19/01A500,000 512,510.00 0.32%EURUnited Kingdom 2,997,895.80 1.88%
CREDIT AGRICOLE LDN 2.375 14-24 20/05A500,000 553,240.00 0.35%EURCREDIT SUISSE AG 0.375 16-19 11/04A1,470,000 1,480,201.80 0.93%EURHSBC HLDGS 0.875 16-24 06/09A450,000 451,944.00 0.28%EUR
APPLE INC 1.00 14-22 10/11A200,000 207,562.00 0.13%EURUnited States of America 2,723,450.00 1.71%
BANK OF AMERICA CORP 1.375 15-25 26/03A1,000,000 1,027,580.00 0.65%EURJPMORGAN CHASE 1.50 15-22 26/10A300,000 315,456.00 0.20%EURMC DONALD S 0.50 16-21 15/01A400,000 403,776.00 0.25%EURPROLOGIS 3.00 13-22 18/01A700,000 769,076.00 0.48%EUR
AXA FL.R 10-40 16/04A300,000 332,871.00 0.21%EUR
Floating rate bonds 5,068,510.40 3.18%
France 1,878,303.80 1.19%
BNP PAR FL.R 15-20 15/01Q480,000 483,748.80 0.30%EURCREDIT MUTUEL ARKEA FL.R 17-29 25/10A200,000 201,164.00 0.13%EURLA BANQUE POSTALE FL.R 15-27 19/11A800,000 860,520.00 0.55%EUR
MUNICH RE EMTN FL.R 11-41 26/05A600,000 709,038.00 0.44%EURGermany 709,038.00 0.44%
MAPFRE SUB FL.R 17-47 31/03A300,000 341,967.00 0.21%EURSpain 341,967.00 0.21%
SCANIA CV AB FL.R 17-18 24/10Q470,000 471,024.60 0.30%EURSweden 471,024.60 0.30%
ALLIANZ FINANCE FL.R 11-41 08/07A300,000 352,101.00 0.22%EURThe Netherlands 352,101.00 0.22%
HSBC HLDGS FL.R 13-24 10/01A100,000 103,332.00 0.06%EURUnited Kingdom 1,316,076.00 0.82%
VODAFONE GROUP FL.R 16-19 25/02Q1,200,000 1,212,744.00 0.76%EUR
CARLSBERG BREW 0.50 17-23 06/09A524,000 518,125.96 0.32%EUR
Other transferable securities 9,593,196.15 6.01%
Bonds 8,552,161.15 5.36%
Denmark 518,125.96 0.32%
FINLAND 0.00 16-23 15/09U1,237,000 1,235,602.19 0.77%EURFinland 1,235,602.19 0.77%
ARKEA 0.625 15-22 30/09A600,000 614,898.00 0.39%EURFrance 2,232,970.00 1.40%
BPCE SA 1.125 17-23 18/01A400,000 410,332.00 0.26%EURCIE FINANCEMENT FO 0.20 17-22 16/09A1,200,000 1,207,740.00 0.75%EUR
BON Y OBL DEL ESTADO 1.30 16-26 31/10A1,700,000 1,696,821.00 1.06%EURLuxembourg 1,696,821.00 1.06%
BANCO SANTANDER TOTTA 1.25 17-27 26/09A200,000 202,540.00 0.13%EURPortugal 202,540.00 0.13%
SPAIN 1.95 16-26 30/04A1,100,000 1,160,357.00 0.73%EURSpain 2,666,102.00 1.68%
SPAIN STRIP 0.45 17-22 31/10A1,500,000 1,505,745.00 0.95%EUR
BPCE SA SUB FL.R 15-27 30/11A500,000 540,825.00 0.34%EUR
Floating rate bonds 1,041,035.00 0.65%
France 1,041,035.00 0.65%
CREDIT LOGEMENT FL.R 17-29 28/11A500,000 500,210.00 0.31%EUR
Total securities portfolio 154,489,517.11 96.82%
Securities portfolio as at 31/12/17EURExpressed in
NEF - Euro Bond
Quantity /Nominal Denomination Quotation
currency% of net
assetsMarket value

The accompanying notes form an integral part of these financial statements
58Page
Statement of Operations and Changes in Net Assets from 01/01/17 to 31/12/17Expressed in EUR
NEF - Euro Bond
2,875,755.12Income2,824,774.28Net interest on bonds 2Note
139.67Bank interest on cash account 2Note50,841.17Securities lending income 2,8Note
2,234,654.69Expenses1,565,022.91Management & advisory fees 5Note
42,499.38Depositary & sub-depositary fees 7Note80,841.28Taxe d'abonnement 4Note51,610.20Administrative expenses2,265.65Professional fees
14,803.83Bank interest on overdrafts7,349.46Legal fees5,267.09Transaction fees 2Note1,336.93Publication & printing fees
30.00Bank charges398,237.89Correspondent bank fees 2Note65,390.07Other expenses
641,100.43Net income from investmentsNet realised profit / loss on:
-16,198.82- sales of investment securities 2Note-28,903.79- options 2Note-17,737.46- financial futures 2Note-17,169.49- foreign exchange 2Note
561,090.87Net realised profitMovement in net unrealised appreciation /(depreciation) on:
-1,235,501.57- investments 2Note2,700.00- options 2Note8,722.54- financial futures 2Note
-662,988.16Decrease in net assets as a result of operations38,808,294.44Subscription capitalisation units
-52,508,186.77Redemption capitalisation units
-14,362,880.49Decrease in net assets
173,932,424.46Net assets at the beginning of the year
159,569,543.97Net assets at the end of the year

59Page
NEF- Emerging Market Bond

NEF - Emerging Market Bond
Manager’s Report
Page 60
2017 OVERVIEW
Overall, 2017 provided the right environment for Emerging Markets Hard Currency fixed income to generate strong returns; the representative index (the JP Morgan EMBI Global Diversified) gained an impressive 10.26% over the year, the strongest return since 2012. Sovereign bonds outperformed quasi-sovereign issues and amongst the credit rating sectors, high yield outperformed their investment grade counterparts. At country level, it was frontier markets that finished the year at the top of the performance table with Belize, Angola and Mongolia generating the strongest returns. At the other end of the scale, Belarus, Venezuela and Tajikistan were the weakest performers in the index.
The global macroeconomic environment has been supportive for EM bonds. Global growth has been revised up during the year (although the most recent revisions were downward) and leading indicators point to continued strong momentum. Meanwhile, inflation has been surprising on the downside. Trade volumes and prices have also risen this year, which historically have a multiplier effect on EM growth and a positive impact on their currencies through the terms of trade channel. Furthermore, rich valuations in other asset classes have attracted flows into EM fixed income. According to JP Morgan, cumulative inflows to Emerging Market fixed income were $113 billion over the year; and the inflow momentum has continued into the start of 2018. The 2017 flows surpassed the record of $103bn in 2012. Flows are driven by both traditional Emerging Market debt investors as well as cross-over investors.
FUND PERFORMANCE
The management team continued its active management style focused on concentrated alpha and limited drawdowns. The fund finished 2017 on a strong note, generating 5.82% in returns over the year (net of fees). Allocation across sovereign, quasi sovereign and corporate bonds all contributed positively on aggregate to the portfolio’s outperformance over the year. Relative positioning in Venezuela, Egypt and Costa Rica were the countries that generated the strongest positive contributions to performance over the period.
OUTLOOK FOR 2018
As we enter the start of 2018, our view for the year continues to be that the environment should remain supportive for Emerging Markets Fixed Income and we expect to see another year of strong investor returns. We maintain our core view from 2017 that local currency markets will continue to outperform their hard currency counterparts. Many EM central banks can continue cutting rates and some new ones will join the lower rate theme, generating double digit returns in local bonds. In contrast, with spread compression exhausted and rising US rates, we expect negative returns to duration in hard currency bonds, restraining overall returns relative to 2017.
For 2018 even more than in 2017, we expect that alpha generation and country-level dispersion will likely prove dominant and will present more alpha opportunities in local currency debt. Most of the countries cutting interest rates are at the tail end of their cycles but further cuts are still expected in Brazil and Russia (possibly even following its recent action). South Africa has only just begun cutting rates. Mexico and Turkey are the only countries which will have sharply declining inflation next year but the extent of easing will depend on geopolitics and inflation. In addition, some countries could be hiking next year, like the Czech Republic and Romania, but these are small in the index and monetary policy tightening is already expected. The bottom line from this approach is that the strong tailwinds which drove EM yields markedly lower in 2017 are less pronounced going forward, although yields could continue to grind lower. Therefore EM yields will likely become more sensitive to idiosyncratic factors.

The accompanying notes form an integral part of these financial statements
61Page
206,275,465.45Assets190,964,139.20Securities portfolio at market value 2Note195,657,337.06Cost price
-4,693,197.86Unrealised loss on the securities portfolio10,179,338.01Cash at banks and liquidities2,615,589.42Interest receivable
202,424.01Subscribers receivable2,244,639.88Unrealised net appreciation on forward foreign exchange contracts 2Note
56,000.00Unrealised net appreciation on financial futures 2Note13,334.93Other assets
2,870,224.58Liabilities2,416,747.53Bank overdrafts
21,937.22Taxe d'abonnement payable 4Note147,660.47Redemption payable234,125.65Accrued management & advisory fees 5Note
7,774.35Accrued depositary & sub-depositary fees 7Note5,103.51Accrued administrative expenses
36,875.85Other liabilities
203,405,240.87Net asset value
Financial Statements as at 31/12/17
Expressed in EUR
Statement of Net Assets as at 31/12/17
NEF - Emerging Market Bond
Emerging Market Bond - Category RCapitalisation units 5,105,754.905 2,154,115.859 1,042,746.025 6,217,124.739
Emerging Market Bond - Category ICapitalisation units 421,593.674 1,094,933.405 444,553.958 1,071,973.121
Changes in number of units outstanding from 01/01/17 to 31/12/17
Units issued Units redeemed Units outstandingas at 31/12/17
Units outstandingas at 01/01/17
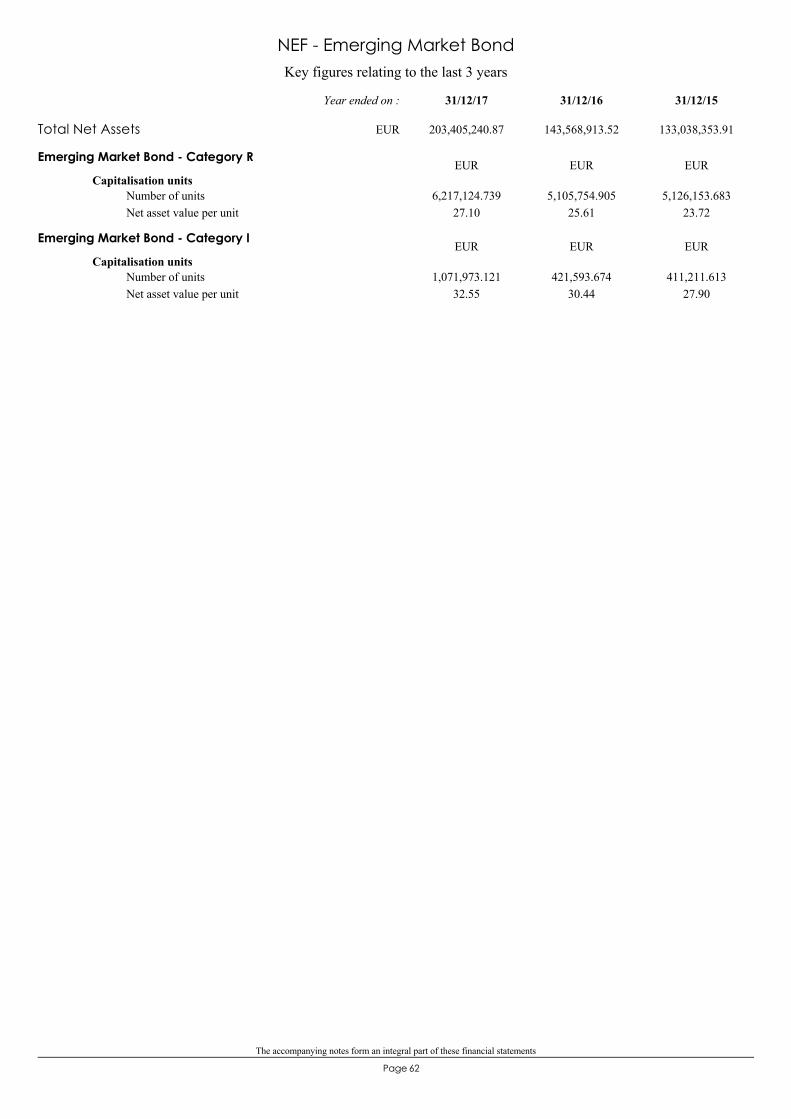
The accompanying notes form an integral part of these financial statements
62Page
Key figures relating to the last 3 years
NEF - Emerging Market Bond
Emerging Market Bond - Category R
Capitalisation units
27.106,217,124.739 5,105,754.905
25.615,126,153.683
23.72Number of unitsNet asset value per unit
EUR EUR EUR
Emerging Market Bond - Category I
Capitalisation units
32.551,071,973.121 421,593.674
30.44411,211.613
27.90Number of unitsNet asset value per unit
EUR EUR EUR
Total Net Assets 203,405,240.87 143,568,913.52 133,038,353.91
31/12/1531/12/1631/12/17Year ended on :
EUR
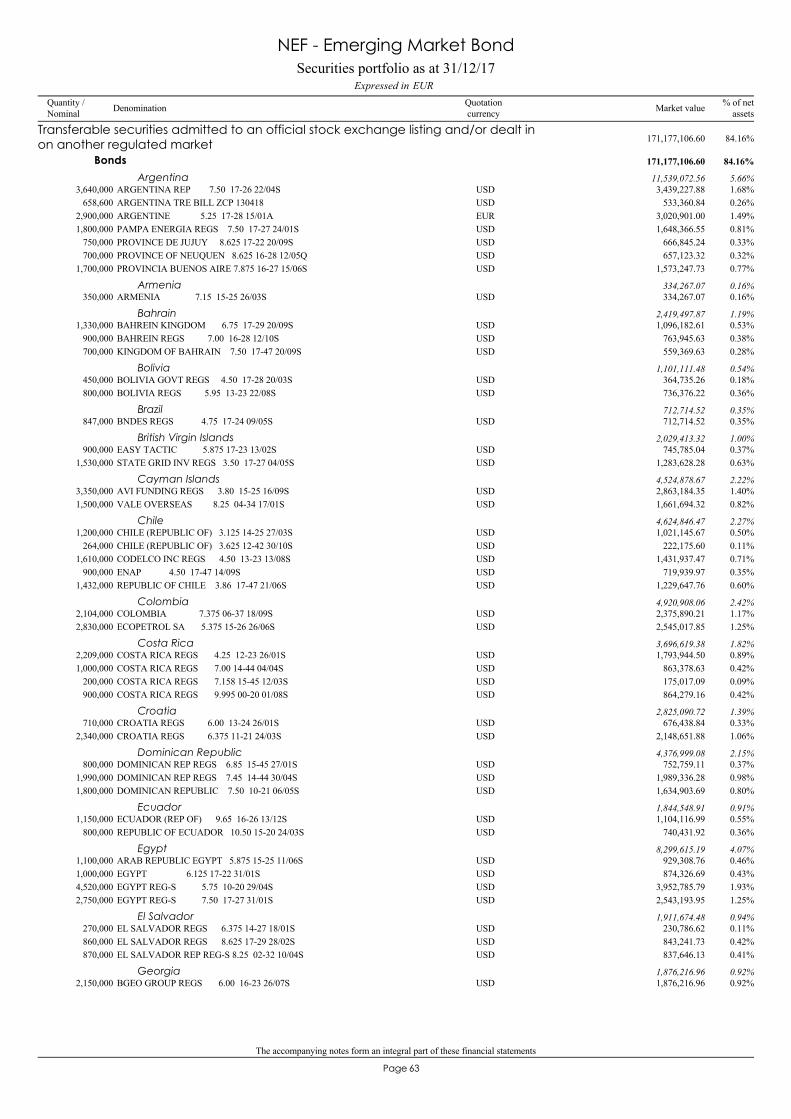
The accompanying notes form an integral part of these financial statements
63Page
ARGENTINA REP 7.50 17-26 22/04S3,640,000 3,439,227.88 1.68%USD
Transferable securities admitted to an official stock exchange listing and/or dealt inon another regulated market 171,177,106.60 84.16%
Bonds 171,177,106.60 84.16%
Argentina 11,539,072.56 5.66%
ARGENTINA TRE BILL ZCP 130418658,600 533,360.84 0.26%USDARGENTINE 5.25 17-28 15/01A2,900,000 3,020,901.00 1.49%EURPAMPA ENERGIA REGS 7.50 17-27 24/01S1,800,000 1,648,366.55 0.81%USDPROVINCE DE JUJUY 8.625 17-22 20/09S750,000 666,845.24 0.33%USDPROVINCE OF NEUQUEN 8.625 16-28 12/05Q700,000 657,123.32 0.32%USDPROVINCIA BUENOS AIRE 7.875 16-27 15/06S1,700,000 1,573,247.73 0.77%USD
ARMENIA 7.15 15-25 26/03S350,000 334,267.07 0.16%USDArmenia 334,267.07 0.16%
BAHREIN KINGDOM 6.75 17-29 20/09S1,330,000 1,096,182.61 0.53%USDBahrain 2,419,497.87 1.19%
BAHREIN REGS 7.00 16-28 12/10S900,000 763,945.63 0.38%USDKINGDOM OF BAHRAIN 7.50 17-47 20/09S700,000 559,369.63 0.28%USD
BOLIVIA GOVT REGS 4.50 17-28 20/03S450,000 364,735.26 0.18%USDBolivia 1,101,111.48 0.54%
BOLIVIA REGS 5.95 13-23 22/08S800,000 736,376.22 0.36%USD
BNDES REGS 4.75 17-24 09/05S847,000 712,714.52 0.35%USDBrazil 712,714.52 0.35%
EASY TACTIC 5.875 17-23 13/02S900,000 745,785.04 0.37%USDBritish Virgin Islands 2,029,413.32 1.00%
STATE GRID INV REGS 3.50 17-27 04/05S1,530,000 1,283,628.28 0.63%USD
AVI FUNDING REGS 3.80 15-25 16/09S3,350,000 2,863,184.35 1.40%USDCayman Islands 4,524,878.67 2.22%
VALE OVERSEAS 8.25 04-34 17/01S1,500,000 1,661,694.32 0.82%USD
CHILE (REPUBLIC OF) 3.125 14-25 27/03S1,200,000 1,021,145.67 0.50%USDChile 4,624,846.47 2.27%
CHILE (REPUBLIC OF) 3.625 12-42 30/10S264,000 222,175.60 0.11%USDCODELCO INC REGS 4.50 13-23 13/08S1,610,000 1,431,937.47 0.71%USDENAP 4.50 17-47 14/09S900,000 719,939.97 0.35%USDREPUBLIC OF CHILE 3.86 17-47 21/06S1,432,000 1,229,647.76 0.60%USD
COLOMBIA 7.375 06-37 18/09S2,104,000 2,375,890.21 1.17%USDColombia 4,920,908.06 2.42%
ECOPETROL SA 5.375 15-26 26/06S2,830,000 2,545,017.85 1.25%USD
COSTA RICA REGS 4.25 12-23 26/01S2,209,000 1,793,944.50 0.89%USDCosta Rica 3,696,619.38 1.82%
COSTA RICA REGS 7.00 14-44 04/04S1,000,000 863,378.63 0.42%USDCOSTA RICA REGS 7.158 15-45 12/03S200,000 175,017.09 0.09%USDCOSTA RICA REGS 9.995 00-20 01/08S900,000 864,279.16 0.42%USD
CROATIA REGS 6.00 13-24 26/01S710,000 676,438.84 0.33%USDCroatia 2,825,090.72 1.39%
CROATIA REGS 6.375 11-21 24/03S2,340,000 2,148,651.88 1.06%USD
DOMINICAN REP REGS 6.85 15-45 27/01S800,000 752,759.11 0.37%USDDominican Republic 4,376,999.08 2.15%
DOMINICAN REP REGS 7.45 14-44 30/04S1,990,000 1,989,336.28 0.98%USDDOMINICAN REPUBLIC 7.50 10-21 06/05S1,800,000 1,634,903.69 0.80%USD
ECUADOR (REP OF) 9.65 16-26 13/12S1,150,000 1,104,116.99 0.55%USDEcuador 1,844,548.91 0.91%
REPUBLIC OF ECUADOR 10.50 15-20 24/03S800,000 740,431.92 0.36%USD
ARAB REPUBLIC EGYPT 5.875 15-25 11/06S1,100,000 929,308.76 0.46%USDEgypt 8,299,615.19 4.07%
EGYPT 6.125 17-22 31/01S1,000,000 874,326.69 0.43%USDEGYPT REG-S 5.75 10-20 29/04S4,520,000 3,952,785.79 1.93%USDEGYPT REG-S 7.50 17-27 31/01S2,750,000 2,543,193.95 1.25%USD
EL SALVADOR REGS 6.375 14-27 18/01S270,000 230,786.62 0.11%USDEl Salvador 1,911,674.48 0.94%
EL SALVADOR REGS 8.625 17-29 28/02S860,000 843,241.73 0.42%USDEL SALVADOR REP REG-S 8.25 02-32 10/04S870,000 837,646.13 0.41%USD
BGEO GROUP REGS 6.00 16-23 26/07S2,150,000 1,876,216.96 0.92%USDGeorgia 1,876,216.96 0.92%
Securities portfolio as at 31/12/17EURExpressed in
NEF - Emerging Market Bond
Quantity /Nominal Denomination Quotation
currency% of net
assetsMarket value
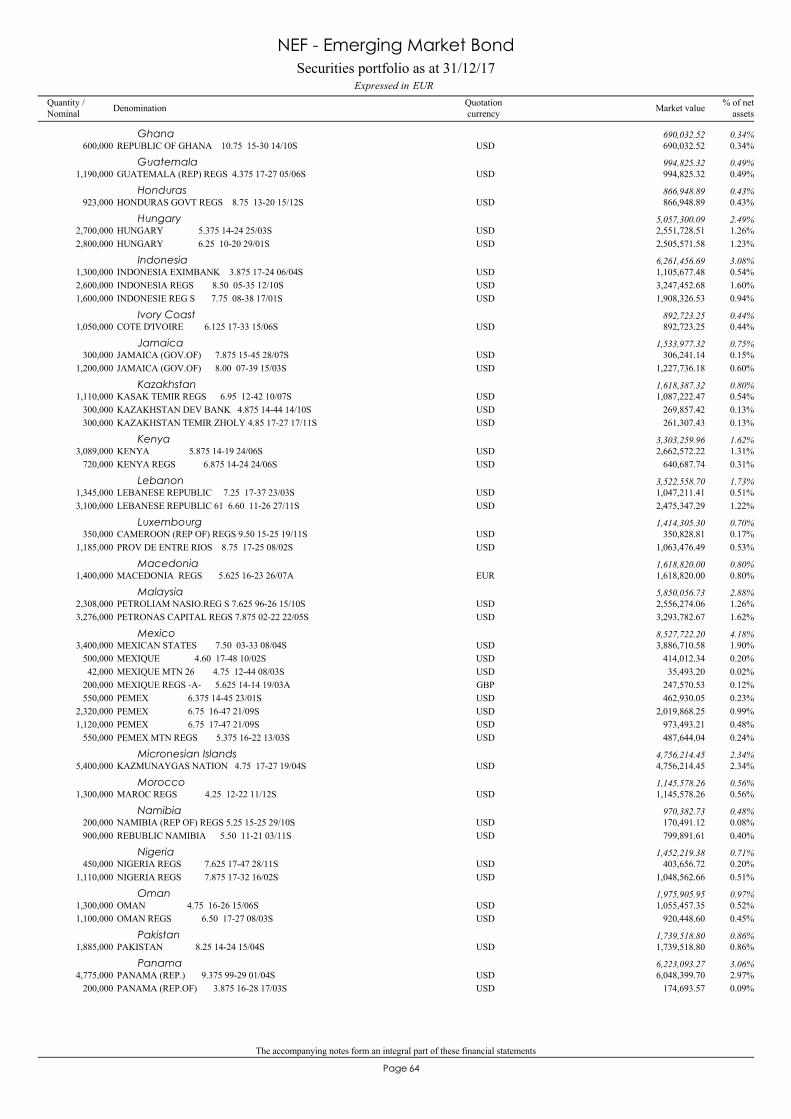
The accompanying notes form an integral part of these financial statements
64Page
REPUBLIC OF GHANA 10.75 15-30 14/10S600,000 690,032.52 0.34%USDGhana 690,032.52 0.34%
GUATEMALA (REP) REGS 4.375 17-27 05/06S1,190,000 994,825.32 0.49%USDGuatemala 994,825.32 0.49%
HONDURAS GOVT REGS 8.75 13-20 15/12S923,000 866,948.89 0.43%USDHonduras 866,948.89 0.43%
HUNGARY 5.375 14-24 25/03S2,700,000 2,551,728.51 1.26%USDHungary 5,057,300.09 2.49%
HUNGARY 6.25 10-20 29/01S2,800,000 2,505,571.58 1.23%USD
INDONESIA EXIMBANK 3.875 17-24 06/04S1,300,000 1,105,677.48 0.54%USDIndonesia 6,261,456.69 3.08%
INDONESIA REGS 8.50 05-35 12/10S2,600,000 3,247,452.68 1.60%USDINDONESIE REG S 7.75 08-38 17/01S1,600,000 1,908,326.53 0.94%USD
COTE D'IVOIRE 6.125 17-33 15/06S1,050,000 892,723.25 0.44%USDIvory Coast 892,723.25 0.44%
JAMAICA (GOV.OF) 7.875 15-45 28/07S300,000 306,241.14 0.15%USDJamaica 1,533,977.32 0.75%
JAMAICA (GOV.OF) 8.00 07-39 15/03S1,200,000 1,227,736.18 0.60%USD
KASAK TEMIR REGS 6.95 12-42 10/07S1,110,000 1,087,222.47 0.54%USDKazakhstan 1,618,387.32 0.80%
KAZAKHSTAN DEV BANK 4.875 14-44 14/10S300,000 269,857.42 0.13%USDKAZAKHSTAN TEMIR ZHOLY 4.85 17-27 17/11S300,000 261,307.43 0.13%USD
KENYA 5.875 14-19 24/06S3,089,000 2,662,572.22 1.31%USDKenya 3,303,259.96 1.62%
KENYA REGS 6.875 14-24 24/06S720,000 640,687.74 0.31%USD
LEBANESE REPUBLIC 7.25 17-37 23/03S1,345,000 1,047,211.41 0.51%USDLebanon 3,522,558.70 1.73%
LEBANESE REPUBLIC 61 6.60 11-26 27/11S3,100,000 2,475,347.29 1.22%USD
CAMEROON (REP OF) REGS 9.50 15-25 19/11S350,000 350,828.81 0.17%USDLuxembourg 1,414,305.30 0.70%
PROV DE ENTRE RIOS 8.75 17-25 08/02S1,185,000 1,063,476.49 0.53%USD
MACEDONIA REGS 5.625 16-23 26/07A1,400,000 1,618,820.00 0.80%EURMacedonia 1,618,820.00 0.80%
PETROLIAM NASIO.REG S 7.625 96-26 15/10S2,308,000 2,556,274.06 1.26%USDMalaysia 5,850,056.73 2.88%
PETRONAS CAPITAL REGS 7.875 02-22 22/05S3,276,000 3,293,782.67 1.62%USD
MEXICAN STATES 7.50 03-33 08/04S3,400,000 3,886,710.58 1.90%USDMexico 8,527,722.20 4.18%
MEXIQUE 4.60 17-48 10/02S500,000 414,012.34 0.20%USDMEXIQUE MTN 26 4.75 12-44 08/03S42,000 35,493.20 0.02%USDMEXIQUE REGS -A- 5.625 14-14 19/03A200,000 247,570.53 0.12%GBPPEMEX 6.375 14-45 23/01S550,000 462,930.05 0.23%USDPEMEX 6.75 16-47 21/09S2,320,000 2,019,868.25 0.99%USDPEMEX 6.75 17-47 21/09S1,120,000 973,493.21 0.48%USDPEMEX MTN REGS 5.375 16-22 13/03S550,000 487,644.04 0.24%USD
KAZMUNAYGAS NATION 4.75 17-27 19/04S5,400,000 4,756,214.45 2.34%USDMicronesian Islands 4,756,214.45 2.34%
MAROC REGS 4.25 12-22 11/12S1,300,000 1,145,578.26 0.56%USDMorocco 1,145,578.26 0.56%
NAMIBIA (REP OF) REGS 5.25 15-25 29/10S200,000 170,491.12 0.08%USDNamibia 970,382.73 0.48%
REBUBLIC NAMIBIA 5.50 11-21 03/11S900,000 799,891.61 0.40%USD
NIGERIA REGS 7.625 17-47 28/11S450,000 403,656.72 0.20%USDNigeria 1,452,219.38 0.71%
NIGERIA REGS 7.875 17-32 16/02S1,110,000 1,048,562.66 0.51%USD
OMAN 4.75 16-26 15/06S1,300,000 1,055,457.35 0.52%USDOman 1,975,905.95 0.97%
OMAN REGS 6.50 17-27 08/03S1,100,000 920,448.60 0.45%USD
PAKISTAN 8.25 14-24 15/04S1,885,000 1,739,518.80 0.86%USDPakistan 1,739,518.80 0.86%
PANAMA (REP.) 9.375 99-29 01/04S4,775,000 6,048,399.70 2.97%USDPanama 6,223,093.27 3.06%
PANAMA (REP.OF) 3.875 16-28 17/03S200,000 174,693.57 0.09%USD
Securities portfolio as at 31/12/17EURExpressed in
NEF - Emerging Market Bond
Quantity /Nominal Denomination Quotation
currency% of net
assetsMarket value

The accompanying notes form an integral part of these financial statements
65Page
PARAGUAY 5.00 16-26 15/04S1,000,000 897,381.81 0.44%USDParaguay 897,381.81 0.44%
PERU 8.75 03-33 21/11S3,600,000 4,753,873.09 2.34%USDPeru 5,148,370.71 2.53%
PETROEOS DEL PERU 5.625 17-47 19/06S450,000 394,497.62 0.19%USD
PHILIPPINES 9.50 05-30 02/02S2,150,000 2,836,124.82 1.39%USDPhilippines 2,836,124.82 1.39%
POLAND 3.25 16-26 06/04S1,380,000 1,177,976.66 0.58%USDPoland 4,241,348.33 2.09%
POLAND 6.375 09-19 15/07S5,000 4,421.67 0.00%USDPOLOGNE 0.50 16-21 20/12A3,000,000 3,058,950.00 1.51%EUR
QATAR DIAR FIN REG S 5.00 10-20 21/07S2,100,000 1,838,625.03 0.91%USDQatar 2,715,920.12 1.34%
QATAR STATE OF 5.25 09-20 20/01S1,000,000 877,295.09 0.43%USD
ROMANIA 3.875 15-35 29/10A1,100,000 1,212,750.00 0.60%EURRomania 3,124,281.73 1.54%
ROMANIA 6.75 12-22 07/02S2,000,000 1,911,531.73 0.94%USD
RUSSIAN FEDERAT REGS 5.25 17-47 23/06S2,400,000 2,095,682.48 1.03%USDRussia 2,095,682.48 1.03%
SENEGAL REGS 6.25 14-24 30/07S425,000 384,137.21 0.19%USDSenegal 1,637,927.75 0.81%
SENEGAL (REP OF) 8.75 11-21 13/06S1,300,000 1,253,790.54 0.62%USD
INDIKA ENERGY III 5.875 17-24 09/11S1,720,000 1,440,523.30 0.71%USDSingapore 1,440,523.30 0.71%
AFRIQUE DU SUD 5.875 07-31 30/05A5,000,000 4,563,703.83 2.24%USDSouth Africa 9,652,860.00 4.74%
SOUTH AFRICA 4.30 16-28 12/10S1,200,000 968,074.71 0.48%USDSOUTH AFRICA 4.665 12-24 17/01A3,650,000 3,119,588.93 1.53%USDSOUTH AFRICA (REP OF) 5.875 13-25 16/09S1,100,000 1,001,492.53 0.49%USD
PETROBRAS GLB FIN 6.85 15-15 05/06S800,000 644,302.51 0.32%USDThe Netherlands 4,017,803.08 1.98%
PETROBRAS GLOBAL FIN 8.75 16-26 23/05S3,387,000 3,373,500.57 1.66%USD
TRINITAD TOBAGO REGS 4.375 13-24 16/01S700,000 600,903.86 0.30%USDTrinidad & Tobago 600,903.86 0.30%
BANQUE CENT TUNISIE 5.75 15-25 30/01S461,000 384,525.44 0.19%USDTunesia 384,525.44 0.19%
TURKEY 6.625 14-45 17/02S2,061,000 1,861,825.57 0.91%USDTurkey 5,910,858.56 2.91%
TURKEY 11.875 00-30 15/01S550,000 722,663.22 0.36%USDTURKEY (REP OF) 4.25 15-26 14/04S520,000 414,296.00 0.20%USDTURKEY(REP.OF) 8.00 04-34 14/02S1,350,000 1,393,731.77 0.69%USDTURQUIE (REPU OF ) 4.125 14-23 11/04A1,400,000 1,518,342.00 0.75%EUR
VEDENTA RESOURCES 6.125 17-24 09/08S4,300,000 3,666,096.89 1.80%USDUnited Kingdom 3,666,096.89 1.80%
URUGUAY 5.10 14-50 18/06S1,050,000 979,547.65 0.48%USDUruguay 4,202,415.16 2.07%
URUGUAY (REP.ORIEN.OF)7.625 06-36 21/03S2,700,000 3,222,867.51 1.59%USD
REPUBLIC OF ZAMBIA 8.97 15-27 30/07S395,000 370,930.46 0.18%USDZambia 1,151,320.69 0.57%
ZAMBIA 8.50 14-24 14/04S845,000 780,390.23 0.39%USD
CD BUENOS AIRES REGS 7.50 16-27 01/06S1,500,000 1,392,662.39 0.68%USD
Other transferable securities 19,787,032.60 9.73%
Bonds 19,787,032.60 9.73%
Argentina 1,392,662.39 0.68%
EMIRATES REIT SUKUK 5.125 17-22 12/12S3,340,000 2,792,644.38 1.38%USDCayman Islands 2,792,644.38 1.38%
ECUADOR 9.625 17-27 02/06S470,000 449,370.63 0.22%USDEcuador 3,328,121.57 1.65%
ECUADOR REGS 10.75 16-22 28/03S1,480,000 1,449,568.25 0.72%USDEQUATEUR 8.875 17-27 23/10S1,560,000 1,429,182.69 0.71%USD
INDONESIA REP 4.75 15-26 08/01S1,400,000 1,269,560.58 0.62%USDIndonesia 1,269,560.58 0.62%
Securities portfolio as at 31/12/17EURExpressed in
NEF - Emerging Market Bond
Quantity /Nominal Denomination Quotation
currency% of net
assetsMarket value

The accompanying notes form an integral part of these financial statements
66Page
KINGDOM OF JORDAN 7.375 17-47 10/10S870,000 760,316.01 0.37%USDJordan 760,316.01 0.37%
SURINAME, REPUBLIC 9.25 16-26 26/10S2,900,000 2,585,770.86 1.28%USDLuxembourg 2,746,159.42 1.36%
TAJIKISTAN INT BOND 7.125 17-27 14/09S200,000 160,388.56 0.08%USD
UNITED MEXICAN STATES 4.15 17-27 28/03S1,600,000 1,386,208.62 0.68%USDMexico 1,386,208.62 0.68%
PHILIPPINES 3.70 17-42 02/02S1,600,000 1,328,214.79 0.65%USDPhilippines 1,328,214.79 0.65%
SAUDI INTERNATIONA 2.875 17-23 04/03S900,000 739,353.79 0.36%USDSaudi Arabia 739,353.79 0.36%
SENEGAL REGS 6.25 17-33 23/05S1,280,000 1,127,559.08 0.55%USDSenegal 1,127,559.08 0.55%
SRI LANKA 6.20 17-27 11/05S300,000 264,689.40 0.13%USDSri Lanka 2,056,322.02 1.01%
SRI LANKA REGS 6.825 16-26 18/07S1,950,000 1,791,632.62 0.88%USD
ABU DHABI OIL 4.60 17-47 02/11S1,000,000 859,909.95 0.42%USDUnited Arab Emirates 859,909.95 0.42%
Total securities portfolio 190,964,139.20 93.88%
Securities portfolio as at 31/12/17EURExpressed in
NEF - Emerging Market Bond
Quantity /Nominal Denomination Quotation
currency% of net
assetsMarket value

The accompanying notes form an integral part of these financial statements
67Page
Statement of Operations and Changes in Net Assets from 01/01/17 to 31/12/17Expressed in EUR
NEF - Emerging Market Bond
9,142,892.83Income8,915,215.07Net interest on bonds 2Note
39,744.60Bank interest on cash account 2Note24,072.80Securities lending income 2,8Note
143,317.35Interest on swaps20,543.01Other financial income
3,540,513.78Expenses2,478,650.82Management & advisory fees 5Note
79,818.98Depositary & sub-depositary fees 7Note80,300.36Taxe d'abonnement 4Note54,392.15Administrative expenses1,375.96Professional fees8,139.31Bank interest on overdrafts7,285.71Legal fees
10,857.76Transaction fees 2Note1,473.02Publication & printing fees
10,362.00Bank charges393,133.99Correspondent bank fees 2Note338,808.36Interest on swaps75,915.36Other expenses
5,602,379.05Net income from investmentsNet realised profit / loss on:
2,501,149.69- sales of investment securities 2Note7,135,490.54- forward foreign exchange contracts 2Note
79,898.12- financial futures 2Note366,771.62- swaps 2Note
-3,901,584.25- foreign exchange 2Note
11,784,104.77Net realised profitMovement in net unrealised appreciation /(depreciation) on:
-11,384,255.36- investments 2Note9,356,120.34- forward foreign exchange contracts 2Note
56,000.00- financial futures 2Note-139,403.95- swaps
9,672,565.80Increase in net assets as a result of operations92,140,245.45Subscription capitalisation units
-41,976,483.90Redemption capitalisation units
59,836,327.35Increase in net assets
143,568,913.52Net assets at the beginning of the year
203,405,240.87Net assets at the end of the year

68Page
NEF- Euro Short Term Bond

NEF - Euro Short Term Bond
Manager’s Report
Page 69
Annual report 01/01/17 – 12/31/17 In 2017, European bond markets were predominantly influenced by economic data and inflation, the latter being still way below the European Central Bank's (ECB) target of around two percent. The ECB, in contrast to the US Federal Reserve (Fed) maintained its expansionary monetary policy and will continue the monthly bond purchases - albeit cut by half since January 2018 - until at least September 2018. Interest rate hikes are unlikely until 2019 at the earliest. Uncertainty from the various elections in the euro area lasted only for a short period of time. Most recently, the economic situation throughout the euro area has improved significantly, benefiting especially peripheral markets. Significant declines in yields were observed in Portugal and Greece. In Germany, by contrast, the entire yield curve moved upwards by up to 30 basis points over the course of the year. Bunds with a maturity of two years traded volatile in the first half of 2017 and marked a new all-time-low at minus 0.95 percent. 10 year Bunds jumped to around plus 0.60 percent after the Sintra speech of ECB's chairman Draghi, but fell back to around plus 0.45 percent at the end of the year. At index level (iBoxx Euro Sovereign Index), the European government bond market as a whole ended the year almost unchanged at plus 0.1 percent. However, this was significantly better than the forecasts by most market participants twelve months ago.. Covered bonds from the euro area traded fairly stable. After slight losses in the first half of the year, they gained momentum from July onwards. In total, European covered bonds generated a total return of 0.6 percent (iBoxx Euro Covered). There was a high demand for European corporates and emerging market bonds. Risk premia (spreads) narrowed considerably. US bond markets gained 2.5 percent on index level (JP Morgan Global Bond US-Index). A tightening of the monetary policy of the Federal Reserve, the uncertainties regarding the conflict of the US with North Korea and the long-lasting discussions around the republican tax reform were the key drivers for the development. US Inflation remained comparatively weak and noted mostly below the two percent threshold of the Fed. The fund management of the NEF - Euro Short Term Bond was well positioned for the spread tightening in government bonds from the euro periphery, e.g. Spain, Portugal and to some extend Italy. Forward-looking, we intend to maintain our overweight until mid-February with Italian election risk rising (final election day: March 4, 2018). Out trades in corporate bonds showed similar patterns: The spreads marked new record-low levels (e.g. short-dated investment grade corporate bond spreads went down from 45 to approximately 15 basis points) which matched our overweight positioning. Emerging Market bonds benefited from sound global macro-economic environment, a weak US dollar as well as large inflows into the asset class. Spreads for government bonds in US dollar and euro tightened by almost 50 basis points. We remained overweight for emerging markets bonds e.g. through increasing our share in bonds from Mexican telecommunication company América Móvil. Even though we are long higher yielding bonds, we limited the duration to the one to five year range to keep up the defensive characteristic of the fund. For 2018, we expect a stable economic environment, supported by still low yields. Nevertheless, the Fed will continue its hiking path and a potential and lasting de-coupling of the euro are is hard to imagine. Therefore, we expect a gradual increase in yields in the euro area, too. Main risks are political events like US' conflict with North Korea or the Italian election

The accompanying notes form an integral part of these financial statements
70Page
301,982,543.63Assets298,162,749.50Securities portfolio at market value 2Note298,251,321.89Cost price
-88,572.39Unrealised loss on the securities portfolio1,362,987.18Cash at banks and liquidities1,945,161.83Interest receivable
508,448.60Subscribers receivable3,196.52Other assets
1,058,086.58Liabilities34,957.25Taxe d'abonnement payable 4Note
812,044.41Redemption payable141,102.65Accrued management & advisory fees 5Note
6,492.42Accrued depositary & sub-depositary fees 7Note7,578.68Accrued administrative expenses
55,911.17Other liabilities
300,924,457.05Net asset value
Financial Statements as at 31/12/17
Expressed in EUR
Statement of Net Assets as at 31/12/17
NEF - Euro Short Term Bond
Euro Short Term Bond - Category RCapitalisation units 19,115,797.095 7,512,988.618 7,751,595.412 18,877,190.301
Euro Short Term Bond - Category ICapitalisation units 1,249,037.753 10,351,121.486 9,794,611.466 1,805,547.773
Euro Short Term Bond - Category DDistribution units 295,248.165 929,298.835 209,709.064 1,014,837.936
Euro Short Term Bond - Category CCapitalisation units 0.000 72,579.510 0.000 72,579.510
Changes in number of units outstanding from 01/01/17 to 31/12/17
Units issued Units redeemed Units outstandingas at 31/12/17
Units outstandingas at 01/01/17

The accompanying notes form an integral part of these financial statements
71Page
Key figures relating to the last 3 years
NEF - Euro Short Term Bond
Euro Short Term Bond - Category R
Capitalisation units
13.7418,877,190.301 19,115,797.095
13.8114,971,887.561
13.80Number of unitsNet asset value per unit
EUR EUR EUR
Euro Short Term Bond - Category I
Capitalisation units
14.731,805,547.773 1,249,037.753
14.7411,358.279
14.68Number of unitsNet asset value per unit
EUR EUR EUR
Euro Short Term Bond - Category D
Distribution units
13.740.03
1,014,837.936 295,248.16513.810.00
0.0000.000.00
Number of unitsNet asset value per unitDividend per unit
EUR EUR EUR
Euro Short Term Bond - Category C
Capitalisation units
13.7572,579.510 0.000
0.000.0000.00
Number of unitsNet asset value per unit
EUR EUR EUR
Total Net Assets 300,924,457.05 286,489,979.43 206,841,567.08
31/12/1531/12/1631/12/17Year ended on :
EUR

The accompanying notes form an integral part of these financial statements
72Page
CNOOC CURTIS 2.75 13-20 03/10A2,000,000 2,130,300.00 0.71%EUR
Transferable securities admitted to an official stock exchange listing and/or dealt inon another regulated market 278,927,071.50 92.69%
Bonds 248,338,733.50 82.53%
Australia 5,256,479.00 1.75%
TRANSURBAN FINANCE 2.50 13-20 08/10A500,000 529,845.00 0.18%EURWESTPAC BANKING 0.25 16-22 17/01A2,600,000 2,596,334.00 0.86%EUR
ANHEUSER-BUSCH INB 0.625 16-20 17/03A2,200,000 2,231,988.00 0.74%EURBelgium 2,555,397.00 0.85%
BRUSSELS AIR REGS 3.25 13-20 01/07A300,000 323,409.00 0.11%EUR
EASTERN CREATION II 1.50 15-19 29/07A1,000,000 1,019,230.00 0.34%EURBritish Virgin Islands 3,208,801.00 1.07%
SINOPEC GR OVER REGS 2.625 13-20 17/10A1,100,000 1,169,861.00 0.39%EURTALENT YIELD REGS 1.435 15-20 07/05A1,000,000 1,019,710.00 0.34%EUR
CIBC 0.10 15-18 14/02A1,800,000 1,809,000.00 0.60%EURCanada 5,359,810.00 1.78%
CIBC 0.25 15-20 28/01A1,500,000 1,515,930.00 0.50%EURTORONTO DOMINION BK 0.50 15-20 15/06A2,000,000 2,034,880.00 0.68%EUR
CHINA DEV BANK 0.125 17-20 24/01A600,000 598,086.00 0.20%EURChina 598,086.00 0.20%
CROATIA 5.875 11-18 09/07A3,300,000 3,404,709.00 1.13%EURCroatia 3,404,709.00 1.13%
NORDEA MORTGAGE BANK 0.025 17-22 24/01A2,500,000 2,501,000.00 0.83%EURFinland 2,501,000.00 0.83%
BFCM EMTN 0.25 16-19 14/06A1,000,000 1,005,910.00 0.33%EURFrance 6,568,897.00 2.18%
DANONE SA 0.167 16-20 03/11A1,000,000 1,004,820.00 0.33%EUREUTELSAT 1.125 16-21 23/06A1,500,000 1,542,450.00 0.52%EURRCI BANQUE SA 0.625 16-22 01/121,400,000 1,410,556.00 0.47%EURSANOFI 0.00 16-19 05/04U700,000 702,317.00 0.23%EURSANOFI AVENTIS EMTN 0.00 16-20 13/01A900,000 902,844.00 0.30%EUR
AAREAL BANK 4.25 14-26 18/03A1,000,000 1,103,520.00 0.37%EURGermany 14,236,809.00 4.73%
COMMERZBANK AG 7.75 11-21 16/03A800,000 975,560.00 0.32%EURCRH FINANCE GERMANY 1.75 14-21 16/07A1,100,000 1,153,768.00 0.38%EURDAIMLER 0.625 15-20 05/03A900,000 912,789.00 0.30%EURDAIMLER EMTN 0.25 16-20 11/05A1,400,000 1,408,442.00 0.47%EURDEUT PFANDBRIEFBANK 0.05 17-21 09/08A1,500,000 1,506,765.00 0.50%EURDEUTSCHE BANK 5.00 10-20 24/06A1,000,000 1,103,400.00 0.37%EURDEUTSCHE BANK AG 1.00 16-19 18/03A2,400,000 2,428,824.00 0.80%EURDEUTSCHE GEN HYPBK 0.025 15-18 10/09A1,100,000 1,103,366.00 0.37%EURDEUTSCHE PFANDBRIEF 0.875 17-21 29/01A1,500,000 1,527,015.00 0.51%EURMERCK FIN SERVICES 0.75 15-19 02/09A1,000,000 1,013,360.00 0.34%EUR
INDENOSIA (REP OF) 2.875 14-21 08/07A2,700,000 2,939,139.00 0.98%EURIndonesia 2,939,139.00 0.98%
BANK OF IRELAND MTGE 0.50 15-20 20/01A4,000,000 4,065,840.00 1.35%EURIreland 8,546,853.00 2.84%
FCA CAPITAL 1.25 16-21 21/01A1,100,000 1,132,263.00 0.38%EURIRISH GOVT TREASURY 4.50 04-20 18/04A3,000,000 3,348,750.00 1.11%EUR
ITALIE 0.45 16-21 01/06S17,800,000 17,896,298.00 5.96%EURItaly 71,070,328.00 23.63%
ITALIE BTP 0.65 15-20 01/11S7,700,000 7,811,419.00 2.60%EURITALY 3.50 13-18 01/12S7,700,000 7,971,656.00 2.65%EURITALY BOT 1.05 14-19 01/12S5,500,000 5,620,230.00 1.87%EURITALY BTP 1.20 17-22 01/04S7,500,000 7,681,275.00 2.55%EURITALY BTP 1.50 14-19 01/08S7,700,000 7,908,670.00 2.63%EURITALY BTP 2.15 14-21 15/12S7,700,000 8,198,036.00 2.72%EURITALY BTP 2.50 14-19 01/05S7,700,000 7,982,744.00 2.65%EUR
KAZAKHGOLD NATL MGMT 3.255 14-19 22/05A500,000 510,790.00 0.17%EURKazakhstan 510,790.00 0.17%
GAZPROM REGS 3.70 13-18 25/07A1,500,000 1,526,565.00 0.51%EURLuxembourg 2,916,651.00 0.97%
HEIDELBERGCEMENT FIN 3.25 13-20 21/10S1,000,000 1,087,290.00 0.36%EURJOHN DEERE BANK 1.50 13-18 16/07A300,000 302,796.00 0.10%EUR
Securities portfolio as at 31/12/17EURExpressed in
NEF - Euro Short Term Bond
Quantity /Nominal Denomination Quotation
currency% of net
assetsMarket value
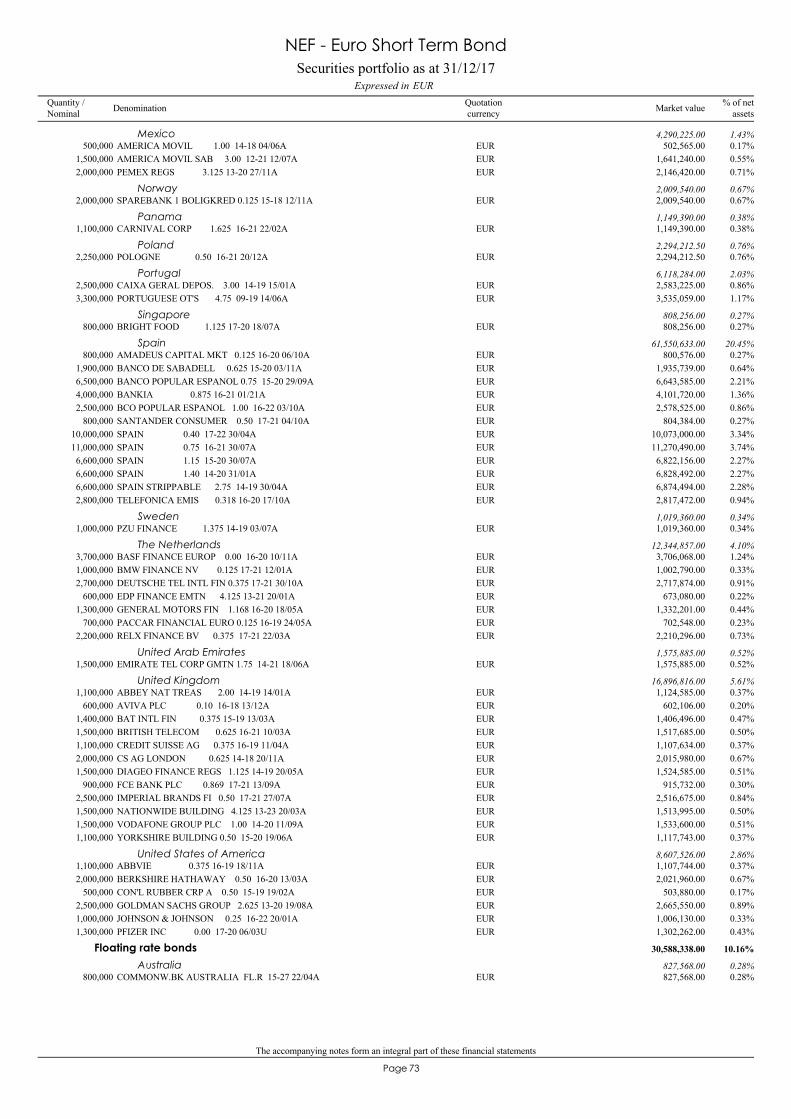
The accompanying notes form an integral part of these financial statements
73Page
AMERICA MOVIL 1.00 14-18 04/06A500,000 502,565.00 0.17%EURMexico 4,290,225.00 1.43%
AMERICA MOVIL SAB 3.00 12-21 12/07A1,500,000 1,641,240.00 0.55%EURPEMEX REGS 3.125 13-20 27/11A2,000,000 2,146,420.00 0.71%EUR
SPAREBANK 1 BOLIGKRED 0.125 15-18 12/11A2,000,000 2,009,540.00 0.67%EURNorway 2,009,540.00 0.67%
CARNIVAL CORP 1.625 16-21 22/02A1,100,000 1,149,390.00 0.38%EURPanama 1,149,390.00 0.38%
POLOGNE 0.50 16-21 20/12A2,250,000 2,294,212.50 0.76%EURPoland 2,294,212.50 0.76%
CAIXA GERAL DEPOS. 3.00 14-19 15/01A2,500,000 2,583,225.00 0.86%EURPortugal 6,118,284.00 2.03%
PORTUGUESE OT'S 4.75 09-19 14/06A3,300,000 3,535,059.00 1.17%EUR
BRIGHT FOOD 1.125 17-20 18/07A800,000 808,256.00 0.27%EURSingapore 808,256.00 0.27%
AMADEUS CAPITAL MKT 0.125 16-20 06/10A800,000 800,576.00 0.27%EURSpain 61,550,633.00 20.45%
BANCO DE SABADELL 0.625 15-20 03/11A1,900,000 1,935,739.00 0.64%EURBANCO POPULAR ESPANOL 0.75 15-20 29/09A6,500,000 6,643,585.00 2.21%EURBANKIA 0.875 16-21 01/21A4,000,000 4,101,720.00 1.36%EURBCO POPULAR ESPANOL 1.00 16-22 03/10A2,500,000 2,578,525.00 0.86%EURSANTANDER CONSUMER 0.50 17-21 04/10A800,000 804,384.00 0.27%EURSPAIN 0.40 17-22 30/04A10,000,000 10,073,000.00 3.34%EURSPAIN 0.75 16-21 30/07A11,000,000 11,270,490.00 3.74%EURSPAIN 1.15 15-20 30/07A6,600,000 6,822,156.00 2.27%EURSPAIN 1.40 14-20 31/01A6,600,000 6,828,492.00 2.27%EURSPAIN STRIPPABLE 2.75 14-19 30/04A6,600,000 6,874,494.00 2.28%EURTELEFONICA EMIS 0.318 16-20 17/10A2,800,000 2,817,472.00 0.94%EUR
PZU FINANCE 1.375 14-19 03/07A1,000,000 1,019,360.00 0.34%EURSweden 1,019,360.00 0.34%
BASF FINANCE EUROP 0.00 16-20 10/11A3,700,000 3,706,068.00 1.24%EURThe Netherlands 12,344,857.00 4.10%
BMW FINANCE NV 0.125 17-21 12/01A1,000,000 1,002,790.00 0.33%EURDEUTSCHE TEL INTL FIN 0.375 17-21 30/10A2,700,000 2,717,874.00 0.91%EUREDP FINANCE EMTN 4.125 13-21 20/01A600,000 673,080.00 0.22%EURGENERAL MOTORS FIN 1.168 16-20 18/05A1,300,000 1,332,201.00 0.44%EURPACCAR FINANCIAL EURO 0.125 16-19 24/05A700,000 702,548.00 0.23%EURRELX FINANCE BV 0.375 17-21 22/03A2,200,000 2,210,296.00 0.73%EUR
EMIRATE TEL CORP GMTN 1.75 14-21 18/06A1,500,000 1,575,885.00 0.52%EURUnited Arab Emirates 1,575,885.00 0.52%
ABBEY NAT TREAS 2.00 14-19 14/01A1,100,000 1,124,585.00 0.37%EURUnited Kingdom 16,896,816.00 5.61%
AVIVA PLC 0.10 16-18 13/12A600,000 602,106.00 0.20%EURBAT INTL FIN 0.375 15-19 13/03A1,400,000 1,406,496.00 0.47%EURBRITISH TELECOM 0.625 16-21 10/03A1,500,000 1,517,685.00 0.50%EURCREDIT SUISSE AG 0.375 16-19 11/04A1,100,000 1,107,634.00 0.37%EURCS AG LONDON 0.625 14-18 20/11A2,000,000 2,015,980.00 0.67%EURDIAGEO FINANCE REGS 1.125 14-19 20/05A1,500,000 1,524,585.00 0.51%EURFCE BANK PLC 0.869 17-21 13/09A900,000 915,732.00 0.30%EURIMPERIAL BRANDS FI 0.50 17-21 27/07A2,500,000 2,516,675.00 0.84%EURNATIONWIDE BUILDING 4.125 13-23 20/03A1,500,000 1,513,995.00 0.50%EURVODAFONE GROUP PLC 1.00 14-20 11/09A1,500,000 1,533,600.00 0.51%EURYORKSHIRE BUILDING 0.50 15-20 19/06A1,100,000 1,117,743.00 0.37%EUR
ABBVIE 0.375 16-19 18/11A1,100,000 1,107,744.00 0.37%EURUnited States of America 8,607,526.00 2.86%
BERKSHIRE HATHAWAY 0.50 16-20 13/03A2,000,000 2,021,960.00 0.67%EURCON'L RUBBER CRP A 0.50 15-19 19/02A500,000 503,880.00 0.17%EURGOLDMAN SACHS GROUP 2.625 13-20 19/08A2,500,000 2,665,550.00 0.89%EURJOHNSON & JOHNSON 0.25 16-22 20/01A1,000,000 1,006,130.00 0.33%EURPFIZER INC 0.00 17-20 06/03U1,300,000 1,302,262.00 0.43%EUR
COMMONW.BK AUSTRALIA FL.R 15-27 22/04A800,000 827,568.00 0.28%EUR
Floating rate bonds 30,588,338.00 10.16%
Australia 827,568.00 0.28%
Securities portfolio as at 31/12/17EURExpressed in
NEF - Euro Short Term Bond
Quantity /Nominal Denomination Quotation
currency% of net
assetsMarket value
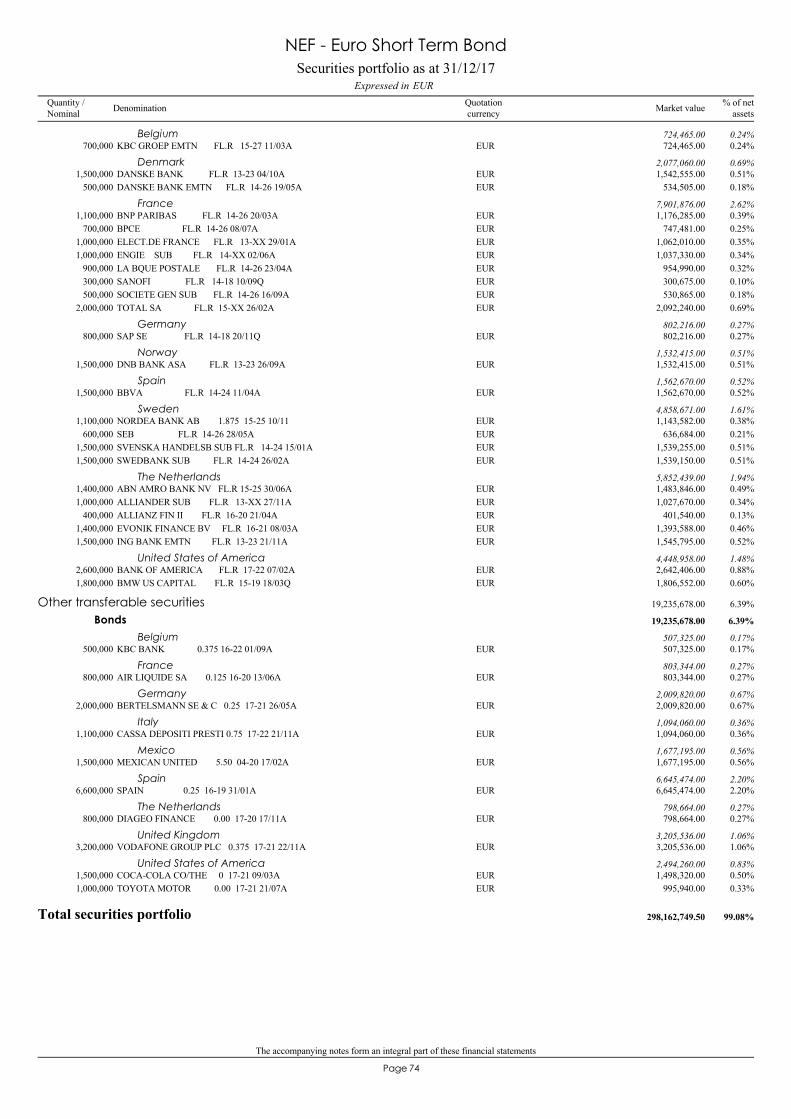
The accompanying notes form an integral part of these financial statements
74Page
KBC GROEP EMTN FL.R 15-27 11/03A700,000 724,465.00 0.24%EURBelgium 724,465.00 0.24%
DANSKE BANK FL.R 13-23 04/10A1,500,000 1,542,555.00 0.51%EURDenmark 2,077,060.00 0.69%
DANSKE BANK EMTN FL.R 14-26 19/05A500,000 534,505.00 0.18%EUR
BNP PARIBAS FL.R 14-26 20/03A1,100,000 1,176,285.00 0.39%EURFrance 7,901,876.00 2.62%
BPCE FL.R 14-26 08/07A700,000 747,481.00 0.25%EURELECT.DE FRANCE FL.R 13-XX 29/01A1,000,000 1,062,010.00 0.35%EURENGIE SUB FL.R 14-XX 02/06A1,000,000 1,037,330.00 0.34%EURLA BQUE POSTALE FL.R 14-26 23/04A900,000 954,990.00 0.32%EURSANOFI FL.R 14-18 10/09Q300,000 300,675.00 0.10%EURSOCIETE GEN SUB FL.R 14-26 16/09A500,000 530,865.00 0.18%EURTOTAL SA FL.R 15-XX 26/02A2,000,000 2,092,240.00 0.69%EUR
SAP SE FL.R 14-18 20/11Q800,000 802,216.00 0.27%EURGermany 802,216.00 0.27%
DNB BANK ASA FL.R 13-23 26/09A1,500,000 1,532,415.00 0.51%EURNorway 1,532,415.00 0.51%
BBVA FL.R 14-24 11/04A1,500,000 1,562,670.00 0.52%EURSpain 1,562,670.00 0.52%
NORDEA BANK AB 1.875 15-25 10/111,100,000 1,143,582.00 0.38%EURSweden 4,858,671.00 1.61%
SEB FL.R 14-26 28/05A600,000 636,684.00 0.21%EURSVENSKA HANDELSB SUB FL.R 14-24 15/01A1,500,000 1,539,255.00 0.51%EURSWEDBANK SUB FL.R 14-24 26/02A1,500,000 1,539,150.00 0.51%EUR
ABN AMRO BANK NV FL.R 15-25 30/06A1,400,000 1,483,846.00 0.49%EURThe Netherlands 5,852,439.00 1.94%
ALLIANDER SUB FL.R 13-XX 27/11A1,000,000 1,027,670.00 0.34%EURALLIANZ FIN II FL.R 16-20 21/04A400,000 401,540.00 0.13%EUREVONIK FINANCE BV FL.R 16-21 08/03A1,400,000 1,393,588.00 0.46%EURING BANK EMTN FL.R 13-23 21/11A1,500,000 1,545,795.00 0.52%EUR
BANK OF AMERICA FL.R 17-22 07/02A2,600,000 2,642,406.00 0.88%EURUnited States of America 4,448,958.00 1.48%
BMW US CAPITAL FL.R 15-19 18/03Q1,800,000 1,806,552.00 0.60%EUR
KBC BANK 0.375 16-22 01/09A500,000 507,325.00 0.17%EUR
Other transferable securities 19,235,678.00 6.39%
Bonds 19,235,678.00 6.39%
Belgium 507,325.00 0.17%
AIR LIQUIDE SA 0.125 16-20 13/06A800,000 803,344.00 0.27%EURFrance 803,344.00 0.27%
BERTELSMANN SE & C 0.25 17-21 26/05A2,000,000 2,009,820.00 0.67%EURGermany 2,009,820.00 0.67%
CASSA DEPOSITI PRESTI 0.75 17-22 21/11A1,100,000 1,094,060.00 0.36%EURItaly 1,094,060.00 0.36%
MEXICAN UNITED 5.50 04-20 17/02A1,500,000 1,677,195.00 0.56%EURMexico 1,677,195.00 0.56%
SPAIN 0.25 16-19 31/01A6,600,000 6,645,474.00 2.20%EURSpain 6,645,474.00 2.20%
DIAGEO FINANCE 0.00 17-20 17/11A800,000 798,664.00 0.27%EURThe Netherlands 798,664.00 0.27%
VODAFONE GROUP PLC 0.375 17-21 22/11A3,200,000 3,205,536.00 1.06%EURUnited Kingdom 3,205,536.00 1.06%
COCA-COLA CO/THE 0 17-21 09/03A1,500,000 1,498,320.00 0.50%EURUnited States of America 2,494,260.00 0.83%
TOYOTA MOTOR 0.00 17-21 21/07A1,000,000 995,940.00 0.33%EUR
Total securities portfolio 298,162,749.50 99.08%
Securities portfolio as at 31/12/17EURExpressed in
NEF - Euro Short Term Bond
Quantity /Nominal Denomination Quotation
currency% of net
assetsMarket value

The accompanying notes form an integral part of these financial statements
75Page
Statement of Operations and Changes in Net Assets from 01/01/17 to 31/12/17Expressed in EUR
NEF - Euro Short Term Bond
4,959,556.42Income4,894,503.82Net interest on bonds 2Note
65,052.60Securities lending income 2,8Note
2,935,697.87Expenses1,741,391.87Management & advisory fees 5Note
82,083.73Depositary & sub-depositary fees 7Note141,664.24Taxe d'abonnement 4Note99,785.96Administrative expenses4,608.57Professional fees
38,045.27Bank interest on overdrafts14,180.22Legal fees14,657.15Transaction fees 2Note1,904.04Publication & printing fees
686,956.21Correspondent bank fees 2Note110,420.61Other expenses
2,023,858.55Net income from investmentsNet realised profit / loss on:
-2,088,329.02- sales of investment securities 2Note-23,955.00- options 2Note
-1,088,485.00- financial futures 2Note-28.37- foreign exchange 2Note
-1,176,938.84Net realised lossMovement in net unrealised appreciation /(depreciation) on:
-353,092.83- investments 2Note242,880.00- financial futures 2Note
-1,287,151.67Decrease in net assets as a result of operations-9,090.98Dividends paid 9Note
256,740,093.55Subscription capitalisation units12,783,152.07Subscription distribution units
-250,908,288.85Redemption capitalisation units-2,884,236.50Redemption distribution units
14,434,477.62Increase in net assets
286,489,979.43Net assets at the beginning of the year
300,924,457.05Net assets at the end of the year

76Page
NEF- Risparmio Italia (previously Convertible Bond)

NEF – Risparmio Italia (previously Convertible Bond)
Manager’s Report
Page 77
In September, US equity indices reached new record highs, while Europe and Japan also achieved positive returns as well, thanks to JPY weakness. Government bonds yield slightly higher in USA, while unchanged in Europe. Emerging Markets assets (both equity and fixed income) had negative performance, as investors rebalanced their portfolios in favor of Europe and Japan. The equity allocation of the portfolio has been slightly underweight vs benchmark, especially in the US region. Allocation to Italian equities has been kept neutral, while we had an overweight on Europe. The fixed income portfolio had been slightly overweight duration on the 3-5 years bucket, overweight financials (mainly large cap Italian banks), while keeping and underweight in industrials. Government bonds duration has been underweight benchmark, with a focus on the long-end of the curve and an overweight in the belly of the curve. During October and November, data flow confirmed a global economy in global and non-inflationary recovery scenario, while global central banks kept an accommodative monetary stance. The equity allocation to Italy has been slightly overweight vs benchmark, increasing the allocation to more cyclical sectors. Across broader regions, Europe has been overweight vis-à-vis USA. In December, the FED increased the Fed Fund Rate, as widely expected, by 25 bps to 1.25%-1.50% range. Short term Treasury yield increased significantly, causing a flattening of the yield curve. Equities in the US reached new highs and Europe and Japan have followed accordingly. Portfolio allocation to Italian equities has been kept at benchmark weight, while government bonds duration has been underweight relative to benchmark

The accompanying notes form an integral part of these financial statements
78Page
84,990,313.72Assets77,883,191.11Securities portfolio at market value 2Note78,004,984.76Cost price
-121,793.65Unrealised loss on the securities portfolio6,030,343.95Cash at banks and liquidities
922,347.21Interest receivable2,784.36Brokers receivable
133,044.24Subscribers receivable2,597.87Unrealised net appreciation on forward foreign exchange contracts 2Note
16,004.98Other assets
243,583.60Liabilities29,800.12Brokers payable9,915.67Taxe d'abonnement payable 4Note
22,453.62Redemption payable77,760.02Unrealised net depreciation on financial futures 2Note85,741.52Accrued management & advisory fees 5Note1,785.17Accrued depositary & sub-depositary fees 7Note2,083.84Accrued administrative expenses
14,043.64Other liabilities
84,746,730.12Net asset value
Financial Statements as at 31/12/17
Expressed in EUR
Statement of Net Assets as at 31/12/17
NEF - Risparmio Italia (previously Convertible Bond)
Risparmio Italia (previously ConvertibleBond) - Category RCapitalisation units 3,052,476.344 2,158,682.826 834,644.914 4,376,514.256
Risparmio Italia (previously ConvertibleBond) - Category ICapitalisation units 272,783.492 490,736.894 326,737.674 436,782.712
Risparmio Italia (previously ConvertibleBond) - Category PIRCapitalisation units 0.000 1,628,922.578 6,173.521 1,622,749.057
Changes in number of units outstanding from 01/01/17 to 31/12/17
Units issued Units redeemed Units outstandingas at 31/12/17
Units outstandingas at 01/01/17

The accompanying notes form an integral part of these financial statements
79Page
Key figures relating to the last 3 years
NEF - Risparmio Italia (previously Convertible Bond)
Risparmio Italia (previously Convertible Bond) - Category R
Capitalisation units
13.004,376,514.256 3,052,476.344
12.543,089,243.334
12.84Number of unitsNet asset value per unit
EUR EUR EUR
Risparmio Italia (previously Convertible Bond) - Category I
Capitalisation units
15.52436,782.712 272,783.492
14.841,212,576.992
15.04Number of unitsNet asset value per unit
EUR EUR EUR
Risparmio Italia (previously Convertible Bond) - Category PIR
Capitalisation units
12.991,622,749.057 0.000
0.000.0000.00
Number of unitsNet asset value per unit
EUR EUR EUR
Total Net Assets 84,746,730.12 42,322,345.70 57,904,085.61
31/12/1531/12/1631/12/17Year ended on :
EUR

The accompanying notes form an integral part of these financial statements
80Page
ACEA SPA15,798 243,289.20 0.29%EUR
Transferable securities admitted to an official stock exchange listing and/or dealt inon another regulated market 77,681,338.61 91.66%
Shares 17,064,363.48 20.14%
Italy 17,032,122.48 20.10%
AEROPORTO GUGLIELMO MARCONI DI BOLOGNA2,360 37,854.40 0.04%EURAMPLIFON SPA41,594 534,066.96 0.63%EURANIMA HOLDING76,904 458,347.84 0.54%EURANSALDO STS SPA31,668 380,016.00 0.45%EURARNOLDO MONDADORI EDITORE SPA43,190 89,921.58 0.11%EURASCOPIAVE24,984 88,593.26 0.10%EURASTM11,960 289,790.80 0.34%EURAUTOGRILL SPA45,459 522,778.50 0.62%EURBANCA IFIS SPA7,313 298,151.01 0.35%EURBANCA MEDIOLANUM88,015 635,028.23 0.75%EURBANCA POPOLARE DI SONDRIO151,484 461,117.30 0.54%EURBENI STABILI SPA355,515 274,102.07 0.32%EURBIESSE4,633 195,975.90 0.23%EURBRUNELLO CUCINELLI9,981 269,586.81 0.32%EURCAIRO COMMUNICATION-AZ.POST FRAZIONAMENT19,339 71,747.69 0.08%EURCEMENTIR HOLDING16,803 126,862.65 0.15%EURCERVED INFORMATION SOLUTIONS S.P.A66,532 705,239.20 0.83%EURCIR (ORDINARY SHARES)92,899 108,227.34 0.13%EURCREDITO EMILIANO SPA26,310 186,143.25 0.22%EURDANIELI (ORD)2,544 50,396.64 0.06%EURDATALOGIC- AZ. POST FRAZIONAMENTO7,161 220,702.02 0.26%EURDE LONGHI SPA19,760 498,544.80 0.59%EURDIASORIN8,126 601,324.00 0.71%EURDOBANK S.P.A.13,045 176,759.75 0.21%EUREI TOWERS5,551 296,978.50 0.35%EUREL.EN.SPA3,868 100,684.04 0.12%EURENAV SPA90,412 407,758.12 0.48%EUREPS EQUITA PEP SPAC SPA3,700 37,888.00 0.04%EURERG SPA16,838 259,305.20 0.31%EURFAMAFACTORING29,677 189,932.80 0.22%EURFILA SPA6,640 130,675.20 0.15%EURFINCANTIERI170,516 213,486.03 0.25%EURGEOX SPA28,090 81,236.28 0.10%EURGIMA TT11,530 191,513.30 0.23%EURGRUPPO MUTUIONLINE -AZ.6,982 92,581.32 0.11%EURHERA SPA280,685 816,793.35 0.96%EURIGD-IMMOBILIARE GRANDE DISTRIBUZIONE SPA136,604 131,686.26 0.16%EURIMA (INDUSTRIA MACCHINE AUTOMATICHE)6,092 413,037.60 0.49%EURINFRASTRUTTURE WIRELESS ITALIANE SPA84,312 522,734.40 0.62%EURINTERPUMP GROUP29,617 776,557.74 0.92%EURIREN S.P.A.176,627 441,567.50 0.52%EURISI 33,500 34,300.00 0.04%EURITALMOBILIARE - REGISTERED3,875 92,418.75 0.11%EURJUVENTUS FOOTBALL CLUB SPA96,310 73,629.00 0.09%EURMAIRE TECNIMONT46,310 199,966.58 0.24%EURMARR SPA11,167 240,313.84 0.28%EUROPENJOBMETIS AZ2,147 27,653.36 0.03%EUROVS46,776 259,840.68 0.31%EURPANARIAGROUP INDUSTRIE CERAMICHE SPA3,200 18,560.00 0.02%EURPARMALAT SPA54,201 168,023.10 0.20%EURPIAGGIO AND C SPA58,201 133,862.30 0.16%EURRAI WAY SPA33,310 169,048.25 0.20%EURRCS MEDIAGROUP26,598 32,502.76 0.04%EURREPLY SPA7,102 327,899.34 0.39%EURSAES GETTERS684 16,313.40 0.02%EURSAFILO - AZ. POST RAGGRUPPAMENTO1,741 8,297.61 0.01%EURSALINI IMPREGILO POST RAGGRUPPAMENTO56,051 180,372.12 0.21%EURSARAS RAFFINERIE SARDE SPA157,220 315,068.88 0.37%EURSIAS SPA23,892 370,803.84 0.44%EURSOCIETA CATTOLICA DI ASSICURAZIONI SCARL52,630 476,301.50 0.56%EURSOL2,164 23,003.32 0.03%EUR
Securities portfolio as at 31/12/17EURExpressed in
NEF - Risparmio Italia (previously Convertible Bond)
Quantity /Nominal Denomination Quotation
currency% of net
assetsMarket value

The accompanying notes form an integral part of these financial statements
81Page
SPACE4 - REGISTERED SHS25,000 247,000.00 0.29%EURSPACTIV SPA2,800 27,860.00 0.03%EURTAMBURI INVESTMENT PARTNERS SPA39,600 219,978.00 0.26%EURTECHNOGYM SPA (ITA)35,156 283,884.70 0.33%EURTECNOINVESTIMENTI SPA2,327 13,938.73 0.02%EURTOD'S SPA4,444 270,639.60 0.32%EURVITTORIA ASSICURAZIONI SPA8,380 99,889.60 0.12%EURZIGNAGO VETRO SPA8,817 71,770.38 0.08%EUR
CAPITAL FOR PROGRESS 2 S.P.A.3,300 32,241.00 0.04%EURLuxembourg 32,241.00 0.04%
AUSTRALIA 5.50 10-18 21/01S950,000 621,104.00 0.73%AUD
Bonds 52,720,966.83 62.20%
Australia 682,099.34 0.80%
AUSTRALIAN GOVERNM 3.00 16-47 21/03S100,000 60,995.34 0.07%AUD
CANADA 3.50 11-45 01/12S50,000 41,563.61 0.05%CADCanada 41,563.61 0.05%
FRANCE GOVT 0.25 15-26 25/11A450,000 438,795.00 0.52%EURFrance 573,881.00 0.68%
FRANCE OAT 3.25 12-45 25/05A100,000 135,086.00 0.16%EUR
BRD 3.25 10-42 04/07A100,000 145,901.00 0.17%EURGermany 145,901.00 0.17%
AEROPORTI DI ROMA SPA 3.25 13-21 20/02A800,000 877,632.00 1.04%EURItaly 42,083,996.11 49.65%
ASSICURAZIONI GENERAL 2.875 14-20 14/01A950,000 1,006,050.00 1.19%EURAUTOSTRADA BRESCIA VE 2.375 15-20 20/03A650,000 682,207.50 0.80%EURAUTOSTRADE PER L'I 1.125 15-21 04/11A1,700,000 1,759,789.00 2.08%EURAZIMUT HOLDING 2.00 17-22 28/03A100,000 104,029.00 0.12%EURA2A EMTN REGS 4 3.625 13-22 13/01A550,000 622,176.50 0.73%EURA2A SPA 1.25 17-24 16/03A200,000 201,852.00 0.24%EURA2A SPA 4.375 13-21 10/01A700,000 791,357.00 0.93%EURBANCO POPOLARE 2.625 15-18 21/09A100,000 101,572.00 0.12%EURBANCO POPOLARE 3.50 14-19 14/03A800,000 826,408.00 0.98%EURBANCO POPOLARE REGS 2.75 15-20 27/07A1,400,000 1,460,606.00 1.72%EURBANCO POPOLARE SC 6.00 10-20 05/11A700,000 752,794.00 0.89%EURBUZZI UNICEM 2.125 16-23 28/04A450,000 475,042.50 0.56%EURCDP RETI SRL 1.875 15-22 29/05A500,000 520,980.00 0.61%EURENI SPA 0.75 16-22 17/05A1,000,000 1,021,270.00 1.21%EURENI SPA 2.625 13-21 22/11A1,450,000 1,586,880.00 1.87%EURENI SPA 4.00 10-20 29/06A700,000 769,181.00 0.91%EURFERROVIE STATO 3.50 13-21 13/12A650,000 729,514.50 0.86%EURFERROVIE STATO EMTN 4.00 13-20 22/07A250,000 274,730.00 0.32%EURFINMEC FINANCE 4.50 13-21 19/01A1,050,000 1,176,798.00 1.39%EURHERA SPA 2.375 14-24 04/07A200,000 220,452.00 0.26%EURHERA SPA 3.25 13-21 04/10A350,000 390,474.00 0.46%EURICCREA BANCA 1.50 17-22 11/10A100,000 100,201.00 0.12%EURICCREA BCA SPA EMTN 1.875 14-19 25/11A450,000 459,963.00 0.54%EURINTESA SAN PAOLO 2.00 14-21 18/06A1,100,000 1,162,953.00 1.37%EURINTESA SAN PAOLO 3.50 14-22 17/01A1,200,000 1,343,304.00 1.59%EURINTESA SAN PAOLO 5.15 10-20 16/07A1,100,000 1,221,946.00 1.44%EURIREN 2.75 15-22 02/11A100,000 111,187.00 0.13%EURITAL BUON ORDI DEL ZCP 31-01-182,600,000 2,603,618.87 3.07%EURITALGAS SPA 0.50 17-22 19/01A900,000 907,407.00 1.07%EURITALY BTP 3.25 14-46 01/09S110,000 111,942.60 0.13%EURITALY BTP 3.75 14-24 01/09S550,000 633,825.50 0.75%EURITALY BTP 3.45 17-48 01/03S70,000 72,559.90 0.09%EURITALY INFL. INDEX 1.65 14-20 23/04S400,000 422,323.77 0.50%EURITALY INFL. INDEX 2.35 08-19 15/09S100,000 120,081.17 0.14%EURITALY TREASURY BONDS 0.90 17-22 01/08S230,000 231,766.40 0.27%EURMEDIOBANCA 0.625 17-22 27/09A550,000 545,924.50 0.64%EURMEDIOBANCA 1.625 16-21 19/01A1,200,000 1,249,992.00 1.47%EURMEDIOBANCA 2.25 14-19 18/03A400,000 410,836.00 0.48%EURMEDIOBANCA 5.00 10-20 15/11A750,000 840,345.00 0.99%EURMONTE PASCHI SIENA 3.625 14-19 01/04A270,000 278,267.40 0.33%EURPOSTE VITA SUB 2.875 14-19 30/05A550,000 571,802.00 0.67%EURRADIOTELEVISIONE ITA 1.50 15-20 28/05A350,000 361,553.50 0.43%EURSALINI 3.75 16-21 24/06A950,000 1,012,234.50 1.19%EUR
Securities portfolio as at 31/12/17EURExpressed in
NEF - Risparmio Italia (previously Convertible Bond)
Quantity /Nominal Denomination Quotation
currency% of net
assetsMarket value

The accompanying notes form an integral part of these financial statements
82Page
SIAS EMTN 4.50 10-20 26/10A150,000 168,742.50 0.20%EURSNAI SPA REGS 6.375 16-21 07/11S500,000 538,195.00 0.64%EURSNAM 0.00 16-20 25/10A550,000 549,620.50 0.65%EURSNAM 3.375 13-21 29/01A200,000 220,380.00 0.26%EURSNAM SPA 1.50 14-23 21/04A800,000 843,640.00 1.00%EURSOCIETA INIZ AUTO 3.375 14-24 13/02A200,000 229,496.00 0.27%EURTELECOM ITALIA CAP 4.50 14-21 25/01A1,600,000 1,796,768.00 2.12%EURTELECOM ITALIA EMTN 5.25 10-22 10/02A800,000 942,760.00 1.11%EURTELECOM ITALIA SPA 4.875 13-20 25/09A850,000 953,827.50 1.13%EURTERNA SPA 0.875 15-22 02/02A700,000 717,507.00 0.85%EURTERNA SPA 4.75 11-21 15/03A700,000 803,621.00 0.95%EURUBI BANCA 2.875 14-19 18/02A200,000 206,548.00 0.24%EURUNICREDIT 3.25 14-21 14/01A1,350,000 1,473,066.00 1.74%EURUNICREDIT SPA REGS 6.95 12-22 31/10A100,000 123,179.00 0.15%EURUNIONE DI BANCHE ITA 0.750 17-22 17/10A500,000 498,765.00 0.59%EURUNIPOL GRUPPO FI 4.375 14-21 05/03A400,000 440,116.00 0.52%EURWIND TRE SPA 2.625 17-23 20/01S200,000 196,048.00 0.23%EUR2I RETE GAS SPA 1.125 14-20 02/01A250,000 255,887.50 0.30%EUR
JAPAN 045 JGB 2.40 00-20 20/03S42,550,000 333,556.36 0.39%JPYJapan 1,515,765.61 1.79%
JAPAN 061 JGB 1.00 03-23 20/03S18,700,000 146,845.06 0.17%JPYJAPAN 074 JGB 2.10 04-24 20/12S17,650,000 150,793.68 0.18%JPYJAPAN 157 0.20 16-36 20/06S89,550,000 631,252.03 0.75%JPYJAPAN -8- 1.40 15-55 20/03S29,650,000 253,318.48 0.30%JPY
SPAIN 2.15 15-25 31/10A450,000 484,344.00 0.57%EURSpain 484,344.00 0.57%
UK TREASURY 2.75 14-24 07/09S250,000 315,124.04 0.38%GBPUnited Kingdom 810,305.79 0.96%
UK TSY 3.25 12-44 22/01S150,000 220,256.87 0.26%GBPUNITED KINGDOM 4.25 00-32 07/06S180,000 274,924.88 0.32%GBP
US TREASURY N/B 2.00 15-25 15/02S600,000 489,191.61 0.58%USDUnited States of America 6,383,110.37 7.53%
US TREASURY NOTES 2.125 11-21 15/08S1,500,000 1,252,830.42 1.48%USDUSA T NOTES 1.625 16-23 31/05S1,250,000 1,009,825.72 1.19%USDUSA T NOTES B 2.25 17-27 15/02S500,000 411,665.92 0.49%USDUSA TREASURY INDEXED 0.125 13-18 15/04S860,000 764,372.82 0.90%USDUSA TREASURY NOTES 1.00 15-18 15/02S2,240,000 1,867,172.52 2.20%USDUSA TREASURY NOTES 2.75 12-42 15/08S700,000 588,051.36 0.69%USD
ASSICURAZ GENERALI FL.R 12-42 10/07A500,000 691,515.00 0.82%EUR
Floating rate bonds 7,886,797.50 9.31%
Italy 7,886,797.50 9.31%
BANCO BPM FL.R 17-27 21/09A450,000 453,406.50 0.54%EURBPER BANCA FL.R 17-27 31/05A350,000 360,517.50 0.43%EURENEL FL.R 14-75 15/01A1,150,000 1,250,395.00 1.48%EURENEL SPA FL.R 13-74 10/01A1,050,000 1,117,158.00 1.32%EURMEDIOBANCA FL.R 17-22 18/05Q700,000 713,244.00 0.84%EURMERCEDES BENZ FIN FL.R 17-20 22/06Q100,000 100,189.00 0.12%EURUBI BANCA FL.R 16-26 05/05A650,000 671,560.50 0.79%EURUBI BANCA SUB FL.R 17-27 15/09A450,000 469,669.50 0.55%EURUNICREDIT SPA EMTN FL.R 13-25 28/10A1,850,000 2,059,142.50 2.42%EUR
ISI 3 (SHS) 24.10.22 WAR1,600 2,300.80 0.00%EUR
Warrants, Rights 9,210.80 0.01%
Italy 9,210.80 0.01%
SPACE4 S.P.A.(SPACE4) 31.12.19 WAR5,000 6,250.00 0.01%EURSPACTIV SPA 30.12.18 WAR500 660.00 0.00%EUR
ESSELUNGA SPA 0.875 17-23 25/10A100,000 100,338.00 0.12%EUR
Other transferable securities 201,852.50 0.24%
Bonds 201,852.50 0.24%
Italy 201,852.50 0.24%
INVITALIA 1.375 17-22 20/07A100,000 101,514.50 0.12%EUR
Total securities portfolio 77,883,191.11 91.90%
Securities portfolio as at 31/12/17EURExpressed in
NEF - Risparmio Italia (previously Convertible Bond)
Quantity /Nominal Denomination Quotation
currency% of net
assetsMarket value

The accompanying notes form an integral part of these financial statements
83Page
Statement of Operations and Changes in Net Assets from 01/01/17 to 31/12/17Expressed in EUR
NEF - Risparmio Italia (previously Convertible Bond)
782,033.56Income24,321.99Net dividends 2Note
723,066.33Net interest on bonds 2Note1,093.42Bank interest on cash account 2Note
33,040.80Securities lending income 2,8Note511.02Other financial income
1,059,546.40Expenses667,746.22Management & advisory fees 5Note13,335.49Depositary & sub-depositary fees 7Note26,157.85Taxe d'abonnement 4Note19,532.44Administrative expenses
429.12Professional fees12,442.34Bank interest on overdrafts2,337.80Legal fees
109,835.50Transaction fees 2Note893.73Publication & printing fees
4,410.78Bank charges128,399.42Correspondent bank fees 2Note74,025.71Other expenses
-277,512.84Net loss from investmentsNet realised profit / loss on:
2,899,531.24- sales of investment securities 2Note79,336.60- options 2Note
1,708,123.82- forward foreign exchange contracts 2Note277,727.33- financial futures 2Note
233.93- swaps 2Note-1,039,912.70- foreign exchange 2Note
3,647,527.38Net realised profitMovement in net unrealised appreciation /(depreciation) on:
-2,785,235.74- investments 2Note33,243.94- options 2Note
695,957.16- forward foreign exchange contracts 2Note-45,380.02- financial futures 2Note
1,546,112.72Increase in net assets as a result of operations56,807,274.02Subscription capitalisation units
-15,929,002.32Redemption capitalisation units
42,424,384.42Increase in net assets
42,322,345.70Net assets at the beginning of the year
84,746,730.12Net assets at the end of the year

84Page
NEF- EE.ME.A. Equity

NEF - EE.ME.A. Equity
Manager’s Report
Page 85
Annual report 01/01/2017 – 12/31/2017
After being among the world's best performing markets in 2016, the Eastern European stock markets rose moderately in 2017. Measured by the MSCI EM Eastern European Index, the region’s major stock exchanges gained 2.9 percent in local currency over the year 2017. In US dollar, the increase was in fact 12.9 percent. In comparison: The MSCI World Index grew 20.1 percent in US dollar in 2017.After the strong increase in the two previous years, Russian MICEX Index lost 5.5 percent in local currency on a yearly basis. The gain in US dollar, measured by RTS Index, was 0.2 percent. This difference is caused by the appreciation of the Russian rouble (+4.4 percent against US dollar). Among others, a high demand for commodities led to the strengthening of the Russian currency. This appreciation burdened Russian export companies. Equity markets were supported by the recovery of the Russian economy. After two years of recession, the country is back on a growth path. The International Monetary Fund (IMF) forecasts that Russia’s gross domestic product (GDP) will grow by 1.8 percent in 2017, mainly due to the 20.9 percent recovery of oil price. This is a result of OPEC's production cuts, which Russia is also participating in. The brightening economic situation combined with low inflation, enabled the Russian central bank to cut interest rates six times in 2017, recently in December to a level of 7.75 percent. November’s inflation rate of 2.5 percent year over year was as low as in 1992. The fact that the United States (US) imposed new sanctions on Russia in the middle of the year weighed on the equity markets. In Turkey, BIST National 100 Index topped 100,000 points mark in June for the first time. The Turkish stock markets gained 47.6 percent on a yearly basis. Among other things, this rally was caused by the ongoing depreciation of the currency: The Turkish Lira lost 7.8 percent against the US dollar in 2017, reaching record lows in November. The trigger was a statement by President Recep Tayyip Erdoğan on future interest rate development in Turkey. He had spoken out against higher interest rates, suggesting a hesitant central bank approach. The combination of robust growth and high inflation would, from an economic point of view, rather speak for a raise in interest rates. The Turkish central bank finally raised in December for the first time in eight months its key interest rate on short-term central bank loans by 50 basis points to 12.75 percent. But experts had expected an increase of one percentage point. Nevertheless, the currency could stabilize a bit thereafter. Overall, Turkey’s growth figures surprised in 2017: The International Monetary Fund (IMF) more than doubled its forecast for Turkish economic growth in 2017 from 2.5 percent to 5.1 percent. Another investors’ focus in the last year was the constitutional referendum on April 16, giving Erdoğan more power. The election result supported both the stock market and the currency, as uncertainty waved from the market. But politically, there was more and more tension: especially the conflict with the EU escalated with the consequence that German Foreign Minister Sigmar Gabriel had called for restraint in travel and investments. This sharpened the situation in the tourism sector, which was already under pressure - even though the number of vacationers had increased in comparison to the previous year. Moreover visa dispute between Turkey and the US caused uncertainty, but could be settled towards the end of the year. The stock markets in Poland (Warsaw General Index: +23.2 percent), Hungary (BUX Index: +23,0 percent) and the Czech Republic (Czech PX 50 Index: +17.0 percent) registered strong profits in 2017. In particular the strong economic environment drove the markets. Especially the recovered oil price supported the equity markets in Saudi Arabia. While OPEC's prolonged tapering activity weighed on the short-term income situation of the kingdom, it will lead to more stable oil prices in the longer term. This should support the country and its reform plan. The new Crown prince wants to modernize Saudi Arabia and to make the country more independent from oil export. He also pursues a different strategy in foreign policy. At the beginning of June, the pending conflict in the Middle East escalated. This burdened the stock markets. The Tadawul All Share Index in local currency closed the year with a slight loss (-0.2 percent).
In the first quarter of 2017, the South African stock markets were burdened by the resignation of the Finance Minister Pravin Ghordan. He was considered as a guarantor of economic stability by international investors. As a result, South Africa was downgraded to "junk-level" by a rating agency, followed by another downgrade in November. In general, the strongly challenged mining sector, in particular platinum producers, burdened economic environment. Besides, the country is politically unstable. Another motion of no confidence introduced by the opposition against Jacob Zuma failed mid-year. It showed that the ruling party ANC is deeply divided. The dominant topic at the end of the year was the election of the new chairman of the ANC. Deputy president Cyril Ramaphosa won the election and therefore could replace the current president in 2019. The result led to a recovery rally at the South African Rand. In 2017, it gained 9.5 percent against the US dollar. Also South African equity markets increased strongly last year (JSE All Share Index, in local currency: + 17.5 percent).

NEF - EE.ME.A. Equity(continued)
Manager’s Report (continued)
Page 86
In 2017, the fund management of NEF - EE.ME.A. Equity actively managed its portfolio over various countries and sectors.
Fund management participated in several initial public offerings (IPO): In February, we participated in the IPO of the Russian retailer Detski Mir. In addition, we participated in the IPO of Polyus Gold, the largest Russian gold producer, in June, and one month later in the IPO of Play Communications. Play is one of four cellphone providers in Poland. The company has captured a large market share within a few years. Due to high network quality and reasonable prices, the provider should acquire more customers. Because of weak figures, we gradually reduced our holdings in the Russian food retailer Magnit. In the middle of the year, stocks of the Russian oil company Lukoil were reduced and the position in the Russian natural gas producer Gazprom was completely divested – due to the temporarily weaker oil outlook. In addition, capital expenditures and dividends were not convincing. Moreover, shares of the Polish copper producer KGHM Polska Miedź were sold in May due to the expectation of a price correction.In order to take profits, we have completely divested our holdings in the Hungarian telecom company Magyar Telekom, in the Turkish steel producer Eregli Demir Ve Celik Fabrik and in the Russian gold mine Polymetal International.After the rating downgrade in South Africa in April, some quotations came under pressure. Due to this price decline fund management increased its positions in the textile company Foschini Group and in the consumer goods manufacturer AVI. We have also increased the following positions: Due to a favorable valuation, we bought stocks of the Turkish Garanti Bank at the beginning of the year. The South African bank Capitec was added to the portfolio in March. The financial institution showed good growth and gained market shares. Especially due to its modern IT infrastructure, the bank operates very profitably. In the mid of 2017, we bought further shares of the South African media group Naspers, as it is well positioned with its stake in the Chinese gaming and social media giant Tencent and the Russian Internet group Mail.Ru. We also increased our holdings in the leading Nigerian cement producer Dangote Cement due to the expectation of a good reporting season. The following shares have been added to the portfolio, among others: In Poland, we bought stocks of the shoe manufacturer CCC in April. In September, we also participated in the capital increase, which was intended to finance the company's growth plans. In November, we added the Russian fertilizer manufacturer Phosagro to the portfolio after the US manufacturer Mosaic closed production capacities in the US. We also bought shares of the packaging paper producer Mondi with its headquarters in London and Johannesburg.

The accompanying notes form an integral part of these financial statements
87Page
65,732,617.80Assets64,393,721.82Securities portfolio at market value 2Note54,941,744.06Cost price9,451,977.76Unrealised profit on the securities portfolio
971,329.26Cash at banks and liquidities16,546.48Subscribers receivable
132,058.30Dividends receivable210,930.95Receivable on spot exchange
8,030.99Other assets
808,166.74Liabilities349,928.29Brokers payable
7,049.38Taxe d'abonnement payable 4Note122,696.30Redemption payable99,743.97Accrued management & advisory fees 5Note4,073.22Accrued depositary & sub-depositary fees 7Note1,614.23Accrued administrative expenses
211,124.60Payable on spot exchange11,936.75Other liabilities
64,924,451.06Net asset value
Financial Statements as at 31/12/17
Expressed in EUR
Statement of Net Assets as at 31/12/17
NEF - EE.ME.A. Equity
EE.ME.A. Equity - Category RCapitalisation units 2,396,657.398 576,812.304 646,327.066 2,327,142.636
EE.ME.A. Equity - Category ICapitalisation units 322,015.466 593,713.974 551,960.346 363,769.094
Changes in number of units outstanding from 01/01/17 to 31/12/17
Units issued Units redeemed Units outstandingas at 31/12/17
Units outstandingas at 01/01/17

The accompanying notes form an integral part of these financial statements
88Page
Key figures relating to the last 3 years
NEF - EE.ME.A. Equity
EE.ME.A. Equity - Category R
Capitalisation units
23.322,327,142.636 2,396,657.398
22.032,270,174.999
18.36Number of unitsNet asset value per unit
EUR EUR EUR
EE.ME.A. Equity - Category I
Capitalisation units
29.32363,769.094 322,015.466
27.29402,773.266
22.41Number of unitsNet asset value per unit
EUR EUR EUR
Total Net Assets 64,924,451.06 61,579,531.30 50,698,190.73
31/12/1531/12/1631/12/17Year ended on :
EUR

The accompanying notes form an integral part of these financial statements
89Page
CEZ AS48,000 933,307.23 1.44%CZK
Transferable securities admitted to an official stock exchange listing and/or dealt inon another regulated market 60,893,004.92 93.79%
Shares 59,557,875.05 91.73%
Czech Republic 1,649,970.63 2.54%
KOMERCNI BANKA AS20,000 716,663.40 1.10%CZK
COMMERCIAL INTERNATIONAL BANK1,200,000 4,358,594.29 6.72%EGPEgypt 6,674,780.38 10.28%
EASTERN COMPANY58,000 1,194,133.12 1.84%EGPEGYPTIAN INTL PHARMACEUTICAL IND35,000 229,718.89 0.35%EGPGLOBAL TELECOM2,000,000 695,769.75 1.07%EGPORIENTAL WEAVERS CARPET250,000 196,564.33 0.30%EGP
RICHTER GEDEON40,000 873,908.42 1.35%HUFHungary 873,908.42 1.35%
PLAY COMMUNICATIONS72,000 582,791.48 0.90%PLNLuxembourg 582,791.48 0.90%
BRAIT141 396.75 0.00%ZARMalta 396.75 0.00%
ACCESS BANK NIGERIA15,000,000 363,069.52 0.56%NGNNigeria 2,913,706.99 4.49%
DANGOTE CEMENT600,000 319,640.15 0.49%NGNFBN HOLDINGS PLC5,500,000 112,105.68 0.17%NGNGUARANTY TRUST BANK PLC9,000,000 849,478.44 1.32%NGNGUINNESS (NIGERIA) PLC145,455 31,669.32 0.05%NGNNESTLE FOOD NIGERIA150,000 540,605.30 0.83%NGNNIGERIAN BREWERIES444,770 138,972.76 0.21%NGNUNILEVER NIGERIA PLC1,500,000 142,448.33 0.22%NGNZENITH BANK PLC7,000,000 415,717.49 0.64%NGN
ALIOR BANK14,000 266,459.18 0.41%PLNPoland 8,200,131.67 12.62%
BANK ZACHODNI WBK7,000 664,053.15 1.02%PLNCCC SA9,000 614,077.09 0.95%PLNCYFROWY POLSAT SA50,000 297,582.00 0.46%PLNGRUPA PEKAO SA48,000 1,488,149.39 2.29%PLNKGHM POLSKA MIEDZ SA (PLN)24,000 638,927.46 0.98%PLNLPP150 319,966.48 0.49%PLNMBANK S.A.2,000 222,647.83 0.34%PLNPKO BANK POLSKI SA140,000 1,485,132.87 2.29%PLNPOLSKI KONCERN NAFTOWY ORLEN SA20,000 507,541.30 0.78%PLNPOWSZECHNY ZAKLAD UBEZPIECZEN100,000 1,009,336.84 1.55%PLNZML KETY7,000 686,258.08 1.06%PLN
AK SBEREGATELNY BK SBERBANK150,000 408,548.54 0.63%RUBRussia 25,771,917.20 39.69%
ALROSA CJSC1,200,000 1,298,017.06 2.00%RUBAO TATNEFT130,000 896,991.01 1.38%RUBAO TATNEFT70,000 485,421.14 0.75%USDDETSKY MIR PJSC477,000 659,559.46 1.02%RUBGROUP LSR OJSC -GDR- REPR SHS REG -S150,000 343,325.27 0.53%USDLUKOIL ADR REP 1 SH38,000 1,813,024.26 2.79%USDLUKOIL HOLDING52,000 2,498,760.66 3.85%RUBMAGNIT JSC12,932 1,181,532.17 1.82%RUBMAGNITOGORSK IRON SPONSORED GDR REPR1380,000 649,712.33 1.00%USDMMC NORILSK NIC8,200 1,282,136.27 1.97%RUBMMC NORILSK NICADR REPR SHS50,000 781,289.09 1.20%USDMOBILE TELESYSTEMS170,000 676,158.64 1.04%RUBMOBILE TELESYSTEMS ADR REPR.2 SHS55,000 467,314.27 0.72%USDMOSCOW EXCHANGE700,000 1,099,247.75 1.69%RUBNOVATEK GDR REPR 1/100 SHS REG-S12,000 1,202,701.58 1.85%USDNOVOLIPETSK STEEL80,000 169,725.62 0.26%RUBPHOSAGRO GDR REPR SHS REG S40,000 511,965.31 0.79%USDPOLYUS GOLD CO ZAO9,200 609,205.67 0.94%RUBSBERBANK1,570,000 5,120,761.90 7.89%USDSURGUTNEFTEGAZ3,500,000 1,419,580.07 2.19%RUBSYNERGY OJSC10,000 92,950.20 0.14%RUBTATNEFT PREF.SHS400,000 2,103,988.93 3.24%RUB
Securities portfolio as at 31/12/17EURExpressed in
NEF - EE.ME.A. Equity
Quantity /Nominal Denomination Quotation
currency% of net
assetsMarket value

The accompanying notes form an integral part of these financial statements
90Page
ANGLOVAAL INDUSTRIES LTD50,000 373,377.28 0.58%ZARSouth Africa 7,411,655.42 11.42%
CAPITEC BANK HOLDINGS LTD10,000 741,594.28 1.14%ZARCORONATION FUND MANAGERS LTD60,000 299,485.32 0.46%ZARMONDI LTD17,000 366,595.30 0.56%ZARNASPERS -N-18,000 4,195,631.32 6.47%ZARNOVUS HOLDINGS LIMITED6,226 2,481.08 0.00%ZARSANLAM LTD70,000 411,336.40 0.63%ZARTELKOM77,000 250,262.74 0.39%ZARTHE FOSCHINI GROUP LTD32,000 426,503.84 0.66%ZARVODACOM GROUP35,000 344,387.86 0.53%ZAR
AKBANK219,500 475,557.58 0.73%TRYTurkey 5,478,616.11 8.44%
ARCELIK150,000 710,012.32 1.09%TRYCOCA COLA ICECEK SANAYI A.S40,000 301,073.38 0.46%TRYKOC HOLDING AS -B-260,000 1,056,836.18 1.64%TRYTUPRAS TURKIYE PETROL RAFINELERI35,000 935,355.45 1.44%TRYTURK SISE CAM439,023 453,855.38 0.70%TRYTURK TRAKTOR VE ZIR13,000 217,314.80 0.33%TRYTURKCELL ILETISIM HIZMET94,000 320,059.83 0.49%TRYTURKIYE GARANTI BANKASI AS (NAMEN-AKT)230,000 542,319.20 0.84%TRYTURKIYE SINAI KALK1,471,998 466,231.99 0.72%TRY
MERILL LYNCH INT 12.02.20 WAR200,000 1,035,604.10 1.60%USD
Warrants, Rights 1,335,129.87 2.06%
Curaçao 1,335,129.87 2.06%
MERILL LYNCH INT 12.02.20 WAR24,998 299,525.77 0.46%USD
MERRILL LYNCH (ADV PETRO) 14.03.19 WAR30,000 305,678.31 0.47%USD
Other transferable securities 3,500,716.90 5.39%
Warrants, Rights 3,500,716.90 5.39%
Curaçao 1,243,472.67 1.92%
MERRILL LYNCH (HALWANI) 14.03.19 WAR21,442 242,972.38 0.37%USDMERRILL LYNCH (SAUDI INTL) 10.10.19 WAR20,000 77,878.76 0.12%USDML INTL 21.03.18 WAR15,000 311,931.96 0.49%USDML (SAUDI TEL UNI) 12.02.20 WAR20,000 305,011.26 0.47%USD
DEUTSCHE BANK AG LDN 06.08.20 WAR55,000 1,247,293.42 1.92%USDUnited Kingdom 2,257,244.23 3.47%
DEUTSCHE BANK AG LDN 06.08.20 WAR50,000 436,329.53 0.67%USDDEUTSCHE BANK AG LDN 07.08.20 WAR40,000 573,621.28 0.88%USD
Total securities portfolio 64,393,721.82 99.18%
Securities portfolio as at 31/12/17EURExpressed in
NEF - EE.ME.A. Equity
Quantity /Nominal Denomination Quotation
currency% of net
assetsMarket value
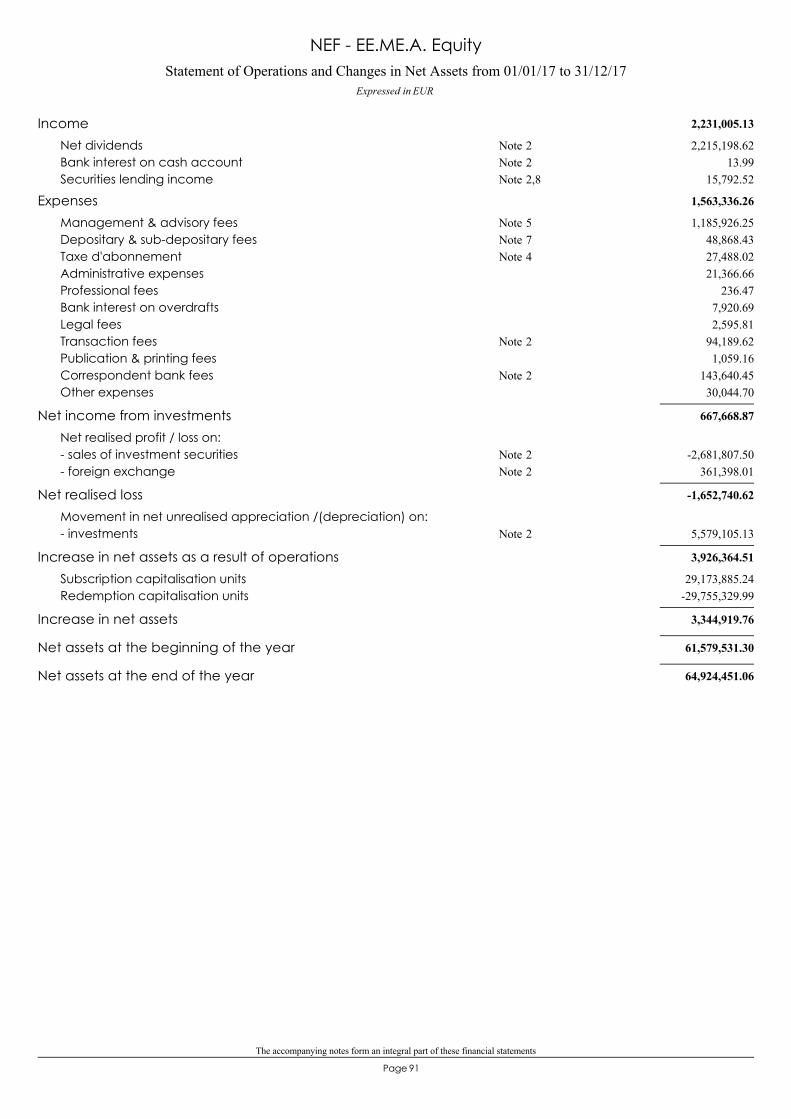
The accompanying notes form an integral part of these financial statements
91Page
Statement of Operations and Changes in Net Assets from 01/01/17 to 31/12/17Expressed in EUR
NEF - EE.ME.A. Equity
2,231,005.13Income2,215,198.62Net dividends 2Note
13.99Bank interest on cash account 2Note15,792.52Securities lending income 2,8Note
1,563,336.26Expenses1,185,926.25Management & advisory fees 5Note
48,868.43Depositary & sub-depositary fees 7Note27,488.02Taxe d'abonnement 4Note21,366.66Administrative expenses
236.47Professional fees7,920.69Bank interest on overdrafts2,595.81Legal fees
94,189.62Transaction fees 2Note1,059.16Publication & printing fees
143,640.45Correspondent bank fees 2Note30,044.70Other expenses
667,668.87Net income from investmentsNet realised profit / loss on:
-2,681,807.50- sales of investment securities 2Note361,398.01- foreign exchange 2Note
-1,652,740.62Net realised lossMovement in net unrealised appreciation /(depreciation) on:
5,579,105.13- investments 2Note
3,926,364.51Increase in net assets as a result of operations29,173,885.24Subscription capitalisation units
-29,755,329.99Redemption capitalisation units
3,344,919.76Increase in net assets
61,579,531.30Net assets at the beginning of the year
64,924,451.06Net assets at the end of the year

92Page
NEF- U.S. Equity

NEF – U.S. Equity
Manager’s Report
Page 93
SINCE INCECPTION THROUGH DECEMBER 31, 2017 PERFORMANCE REVIEW
The U.S. Equity portfolio underperformed the S&P 500 during the period.
Detractors • Security selection in technology and financial services • Additional factors: an overweight position in Newell Brands and avoiding AbbVie
Contributors • Security selection in health care and capital goods • Additional factors: Urban Outfitters and Dollar Tree
SIGNIFICANT IMPACTS ON PERFORMANCE — DETRACTORS
• An overweight position in commercial products manufacturer Newell Brands held back relative performance. Disappointing third-quarter earnings results appeared to have weighed on investor sentiment as sales growth faltered across all divisions, missing internal and external expectations, and margins declined. Management lowered its outlook for the remainder of the year but is moving forward with a $1 billion share repurchase program over the next three years.
• Not owning shares of software giant Microsoft hurt relative performance during the quarter. Shares beat the benchmark on the back of strong performance across all divisions, with growth in the cloud services division particularly notable.
• An overweight position in insurance brokerage firm Aon Plc detracted from relative performance. The company reported weaker-than-expected third-quarter organic revenue growth as its commercial segment fell short of projections. Management cited transitory timing issues, tougher comparable sales and weakness it its US Retail and Latin American business as headwinds during the quarter.
• Not holding shares of semiconductor company Intel dampened relative performance. Shares rose as strong third-quarter earnings results appeared to have buoyed investor sentiment. Revenues across all business divisions grew at a healthy pace and effective cost controls helped expand margins. Management revised its full-year guidance upwards based on the robust results.
• Not holding shares of research based biopharmaceutical company AbbVie detracted from relative performance. The stock traded higher throughout the period as the company announced quarterly earnings that beat consensus estimates, driven by strong revenue results in the company's Humira and Imbruvica products.
SIGNIFICANT IMPACTS ON PERFORMANCE — CONTRIBUTORS
• Not holding shares of diversified industrial conglomerate General Electric benefited relative returns. Shares declined after its new management team significantly reduced its expectations for earnings and cash flow and cut its dividend in half. Weakness in the Power and Oil & Gas divisions, along with other impairment charges, weighed on the firm's operating results.
• The portfolio's position in apparel retailer Urban Outfitters contributed to relative performance. The company posted better-than-expected earnings results during the quarter, owing to growth in same-store sales across all divisions.
• Overweighting discount store operator Dollar Tree bolstered relative performance. The company results beat market estimates owing primarily to strong sales trends and better-than-expected margins.
• Not holding shares of US biopharmaceutical firm Celgene buoyed relative returns as the stock price declined during the period. Sales of the company's psoriasis product Otezla were lower than consensus estimates, due to reimbursement challenges. Management adjusted 2017 total revenue guidance to the lower end of prior guidance, and adjusted 2020 guidance downward due to weakness in the company's Inflammation and Immunology segment.

NEF – U.S. Equity
Manager’s Report(continued)
Page 94
• Not holding shares of pharmaceutical company Merck benefited relative returns. The company's disappointing third-quarter earnings, driven by weaker-than-expected sales of Gardasil, Zepatier and Keytruda, appeared to have weighed on investor sentiment. Additionally, Merck announced a delay in the development of KN-189, its non-small cell lung cancer treatment, until February 2019.
PORTFOLIO POSITIONING – DECEMBER 2017
We employ a sector-neutral approach relative to the S&P 500 Index and use our bottom-up fundamental investment approach to identify solid companies, with a bias toward companies generating above-average, sustainable growth and whose stocks trade at reasonable valuations. Our eight sector teams are focused on constructing portfolios that outperform their respective S&P 500 sectors with the flexibility to invest across industries and add value through stock selection.
2017 saw a reversal from leadership trends compare to 2016. In 2016, investor appetite for cyclicals and value led to strong performance in the energy and financial services sectors. In 2017, investor appetite for stability and growth led to strong performance in the technology sector. While 2017 ended up a strong year from both an absolute and relative performance perspective, we did give some relative performance back in the fourth quarter. Weaker stock selection within financial services and technology were largely responsible for the underperformance. Over the long term, our ability to outperform will largely be a function of our ability to identify compelling individual stock opportunities rather than broad sector, factor, market, commodity or economic calls.
As US equities have continued their march higher, valuation has become a bigger hurdle from an investment thesis perspective. In fact, we have found the opportunity set more challenging, largely because of valuation, and the number of positions we hold is near recent historical lows. And looking at the S&P 500's valuation, it certainly is at the high end of its historical range. However, the S&P 500's constitution has dramatically changed over the last several decades, and as a result, today's higher-than-average market multiple may be more reasonable than it appears. According to data from Cornerstone Macro, nearly 70% of the S&P 500 is now in sectors (technology, health care, consumer staples, discretionary, utilities) that provide growth, stability and income, compared to closer to 50% 10 years ago. And in general, these sectors tend to trade at higher multiples when compared to more cyclical-oriented sectors such as financials, industrials, materials and energy. For example, the weight of the energy sector, which tends to trade at a below-average multiple, has been cut by more than half relative to 10 years ago. So while it would be hard to argue that the market is cheap, the current valuation may be partly reflecting the changed composition of the market.
Another factor that may be influencing valuations is tax reform. There has been a lot of focus on taxes as tax reform became a reality. As a result, investors have been bombarded with articles and research pieces that rank stocks by their tax rates in an attempt to drive trading. We view this analysis as overly simplistic; it does not address the more important questions of how likely it is that these tax cuts will flow to the bottom line and what multiple should be applied to tax savings. For many companies, banks and retailers for example, the benefit of lower taxes will likely be competed away. And while the corporate tax rate is being lowered today, the political process allows for the possibility that a different administration could alter this in the future, which needs to be considered when determining what valuation to pay for earnings derived from tax savings. So while we are aware of the impact of lower taxes, we have tried to make realistic assumptions about the impact on earnings and valuations for the companies we invest in.
Looking forward, we believe it is extremely difficult to make equity investment decisions based on predictions around economic growth, interest rates, commodity prices or currency movements. As always, we will remain disciplined and build the portfolio stock by stock, and we will continue to seek out investment opportunities that can drive strong performance over the long term. With broad market valuations at the high end of their historical range, investors may shift their focus toward companies with more durable and stable earnings and cash flow growth and reward higher-quality companies with sufficient operating cushion, strong balance sheets and pricing power — all of which aligns with how we invest.

The accompanying notes form an integral part of these financial statements
95Page
102,299,472.44Assets100,947,020.56Securities portfolio at market value 2Note94,962,642.14Cost price5,984,378.42Unrealised profit on the securities portfolio1,162,343.61Cash at banks and liquidities
99,476.96Subscribers receivable74,075.16Dividends receivable12,534.31Receivable on spot exchange4,021.84Other assets
391,325.02Liabilities25.32Bank overdrafts
9,764.72Taxe d'abonnement payable 4Note197,134.12Redemption payable
56.65Unrealised net depreciation on forward foreign exchange contracts 2Note144,708.79Accrued management & advisory fees 5Note
5,689.26Accrued depositary & sub-depositary fees 7Note2,597.84Accrued administrative expenses
12,493.44Payable on spot exchange18,854.88Other liabilities
101,908,147.42Net asset value
Financial Statements as at 31/12/17
Expressed in EUR
Statement of Net Assets as at 31/12/17
NEF - U.S. Equity
U.S. Equity - Category RCapitalisation units 7,213,572.328 2,634,681.520 2,434,149.959 7,414,103.889
U.S. Equity - Category ICapitalisation units 853,165.133 2,371,877.021 809,173.892 2,415,868.262
Changes in number of units outstanding from 01/01/17 to 31/12/17
Units issued Units redeemed Units outstandingas at 31/12/17
Units outstandingas at 01/01/17
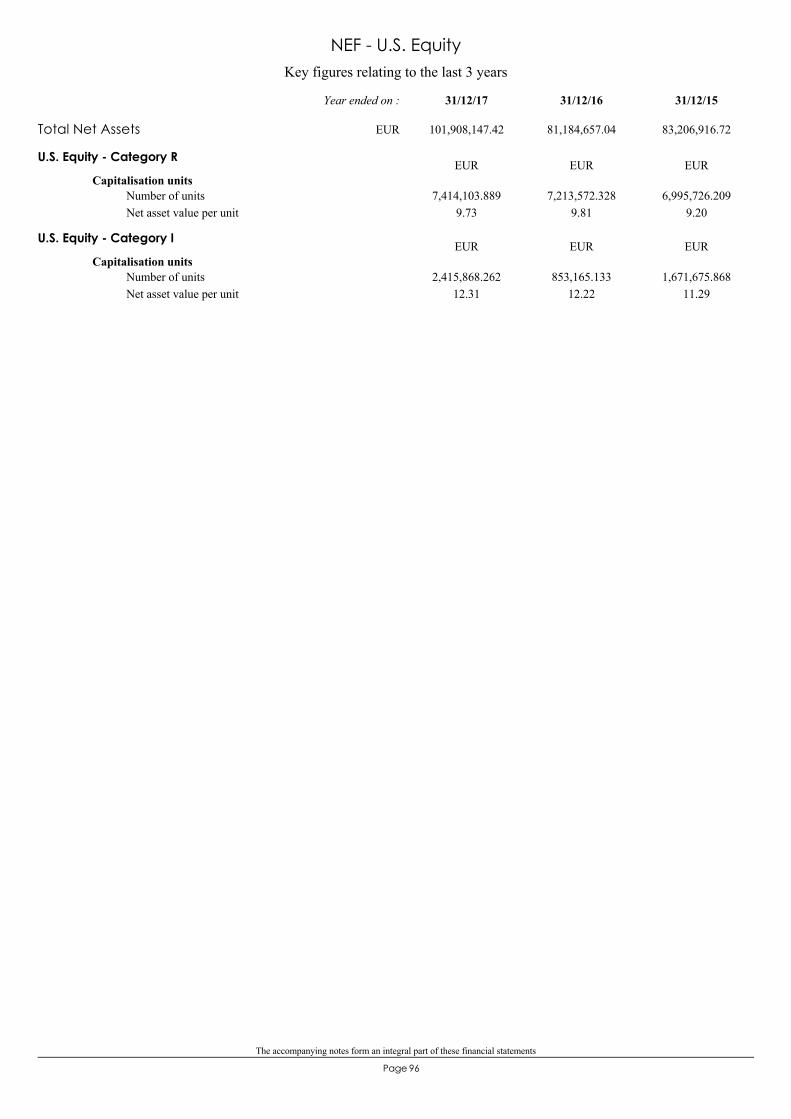
The accompanying notes form an integral part of these financial statements
96Page
Key figures relating to the last 3 years
NEF - U.S. Equity
U.S. Equity - Category R
Capitalisation units
9.737,414,103.889 7,213,572.328
9.816,995,726.209
9.20Number of unitsNet asset value per unit
EUR EUR EUR
U.S. Equity - Category I
Capitalisation units
12.312,415,868.262 853,165.133
12.221,671,675.868
11.29Number of unitsNet asset value per unit
EUR EUR EUR
Total Net Assets 101,908,147.42 81,184,657.04 83,206,916.72
31/12/1531/12/1631/12/17Year ended on :
EUR

The accompanying notes form an integral part of these financial statements
97Page
HONEYWELL INTERNATIONAL INC12,276 1,569,788.51 1.54%USD
Transferable securities admitted to an official stock exchange listing and/or dealt inon another regulated market 100,947,020.56 99.06%
Shares 100,947,020.56 99.06%
Aerospace industry 3,524,911.64 3.46%
NORTHROP GRUMMAN CORP3,771 965,027.61 0.95%USDUNITED TECHNOLOGIES CORP9,308 990,095.52 0.97%USD
DOWDUPONT21,055 1,250,343.62 1.23%USDAgriculture and fishery 1,250,343.62 1.23%
BANK OF AMERICA CORP64,988 1,599,637.92 1.57%USDBanks and credit institutions 8,183,415.67 8.03%
CITIGROUP34,466 2,138,426.63 2.10%USDDISCOVER FINANCIAL SERVICES - SHS WI5,051 323,958.08 0.32%USDNORTHERN TRUST CORP7,210 600,522.72 0.59%USDPNC FINANCIAL SERVICES GROUP INC13,623 1,639,008.31 1.61%USDUS BANCORP33,149 1,480,966.75 1.45%USDWINTRUST FINANCIAL CORP5,837 400,895.26 0.39%USD
BIOGEN IDEC INC3,634 965,299.24 0.95%USDBiotechnology 1,475,531.30 1.45%
INCYTE CORP6,461 510,232.06 0.50%USD
SHERWIN WILLIAMS CO2,627 898,169.83 0.88%USDBuilding materials and trade 898,169.83 0.88%
CELANESE CORP-A-5,968 532,855.37 0.52%USDChemicals 1,678,262.17 1.65%
PPG INDUSTRIES INC11,759 1,145,406.80 1.13%USD
ALTICE USA -A-22,019 389,780.18 0.38%USDCommunications 1,209,526.55 1.19%
VERIZON COMMUNICATIONS INC18,574 819,746.37 0.81%USD
ANALOG DEVICES INC12,005 891,190.82 0.87%USDElectronics and semiconductors 2,142,336.48 2.10%
PERKINELMER13,578 827,835.70 0.81%USDSENSATA TECHNOLOGIES9,933 423,309.96 0.42%USD
BLUE BUFFALO PET PRODUCTS INC17,733 484,837.05 0.48%USDFoods and non alcoholic drinks 3,113,019.53 3.05%
CAL-MAINE FOODS13,457 498,760.65 0.49%USDMONDELEZ INTERNATIONAL INC22,810 814,031.52 0.80%USDPEPSICO INC13,155 1,315,390.31 1.28%USD
COMCAST CORP41,721 1,393,251.10 1.36%USDGraphic art and publishing 2,447,439.66 2.40%
TIME WARNER7,706 587,732.69 0.58%USD21ST CENTURY -A- WHEN ISSUED16,201 466,455.87 0.46%USD
CIGNA CORP5,446 922,228.08 0.91%USDHealthcare and social services 1,455,685.03 1.43%
UNITEDHEALTH GROUP INC2,902 533,456.95 0.52%USD
ARAMARK HOLDING CORP15,983 569,593.45 0.56%USDHolding and finance companies 9,433,893.29 9.26%
BERRY GLOBAL GRP RG REGISTERED SHS12,703 621,433.34 0.61%USDBLACKSTONE GROUP PARTNERSHIP UNITS32,399 865,017.91 0.85%USDCF INDUSTRIES HOLDINGS INC17,163 608,783.47 0.60%USDCHUBB - NAMEN AKT7,996 974,281.23 0.96%USDDUKE ENERGY CORP6,731 472,062.38 0.46%USDENTREPRISE PRODUCTS PARTNERSHIP25,970 574,055.45 0.56%USDEQUIFAX INC4,469 439,410.06 0.43%USDLEIDOS HOLDINGS WI10,287 553,849.40 0.54%USDMORGAN STANLEY34,311 1,501,124.13 1.47%USDNASDAQ10,838 694,307.96 0.68%USDSS C TECHNOLOGIERS HOLDINGS15,554 524,994.51 0.52%USDTE CONNECTIVITY LTD REG SHS8,816 698,634.74 0.69%USDTMX GR LTD7,181 336,345.26 0.33%CAD
SIX FLAGS7,796 432,735.53 0.42%USDHotels and restaurants 1,796,057.55 1.76%
STARBUCKS CORP28,470 1,363,322.02 1.34%USD
AON10,932 1,221,452.51 1.20%USDInsurance 1,221,452.51 1.20%
Securities portfolio as at 31/12/17EURExpressed in
NEF - U.S. Equity
Quantity /Nominal Denomination Quotation
currency% of net
assetsMarket value

The accompanying notes form an integral part of these financial statements
98Page
ADOBE SYSTEMS INC8,640 1,262,464.44 1.24%USDInternet and Internet services 16,123,881.12 15.81%
ALPHABET -C-1,062 926,604.52 0.91%USDALPHABET INC2,910 2,555,985.99 2.51%USDCOGNIZANT TECHNOLOGY SOLUTIONS -A-14,171 839,176.54 0.82%USDCONSTELLATION SOFTWARE1,155 585,233.79 0.57%CADDXC TECHNOLOGY WI13,423 1,062,155.17 1.04%USDELECTRONIC ARTS - REGISTERED9,371 820,909.91 0.81%USDFACEBOOK -A-18,557 2,730,399.58 2.67%USDFIDELITY NATIONAL11,430 896,730.34 0.88%USDFISERV INC5,803 634,492.95 0.62%USDGLOBAL PAYMENTS WHEN ISSUED10,381 867,665.67 0.85%USDLOGMELN INC6,380 609,113.65 0.60%USDPRICELINE GROUP764 1,107,006.89 1.09%USDSALESFORCE COM.INC14,382 1,225,941.68 1.20%USD
DANAHER CORP14,776 1,143,590.69 1.13%USDMachine and apparatus construction 2,675,179.74 2.63%
ROPER TECHNOLOGIES5,112 1,103,983.99 1.08%USDSPX FLOW WHEN ISSUED10,785 427,605.06 0.42%USD
JOHNSON CONTROLS INTERNATIONAL PLC27,649 878,598.67 0.87%USDMiscellaneous consumer goods 1,401,912.19 1.38%
NEWELL BRANDS20,311 523,313.52 0.51%USD
ACCENTURE - SHS CLASS A7,716 984,943.25 0.97%USDMiscellaneous services 4,216,534.38 4.14%
ALIBABA GR ADR3,986 573,089.29 0.56%USDVISA INC -A-27,963 2,658,501.84 2.61%USD
APPLE INC13,530 1,909,181.94 1.87%USDOffice supplies and computing 4,201,902.36 4.12%
BROADCOM LTD4,197 899,032.19 0.88%USDCISCO SYSTEMS INC43,641 1,393,688.23 1.37%USD
BP P.L.C.ADR REPR.6SHS30,665 1,074,668.51 1.05%USDPetroleum 4,440,428.04 4.36%
CHENIERE ENERGY INC14,802 664,504.03 0.65%USDEOG RESOURCES INC14,196 1,277,320.40 1.26%USDHALLIBURTON14,702 599,088.42 0.59%USDNOBLE ENERGY INC14,117 343,007.90 0.34%USDSCHLUMBERGER LTD8,575 481,838.78 0.47%USD
BRISTOL-MYERS SQUIBB CO17,362 887,136.96 0.87%USDPharmaceuticals and cosmetics 10,058,343.44 9.86%
COTY INC -A-30,889 512,284.01 0.50%USDHENRY SCHEIN INC8,199 477,733.78 0.47%USDICON PLC5,160 482,526.47 0.47%USDJOHNSON & JOHNSON23,001 2,679,646.23 2.62%USDMCKESSON CORP4,688 609,600.27 0.60%USDMEDTRONIC HLD21,326 1,435,899.69 1.41%USDPFIZER INC52,278 1,578,845.29 1.55%USDSTERIS PLC6,658 485,595.98 0.48%USDZOETIS INC -A-15,134 909,074.76 0.89%USD
AMERICAN TOWER CORP8,322 989,993.95 0.97%USDReal estate companies 3,186,238.29 3.13%
PUBLIC STORAGE INC3,743 652,286.33 0.64%USDSBA COMMUNICATIONS -A3,122 425,256.33 0.42%USDSTORE CAPITAL CORP51,523 1,118,701.68 1.10%USD
AMAZON.COM INC2,583 2,518,753.45 2.47%USDRetail trade, department stores 5,607,964.75 5.50%
COSTCO WHOLESALE CORP6,981 1,083,385.07 1.06%USDTJX COS INC14,189 904,603.47 0.89%USDTRACTOR SUPPLY CO10,250 638,862.25 0.63%USDURBAN OUTFITTERS INC15,816 462,360.51 0.45%USD
HANESBRANDS20,461 356,741.02 0.35%USDTextiles and garments 1,861,372.85 1.83%
NIKE INC28,849 1,504,631.83 1.48%USD
CONSTELLATION BRANDS INC -A-3,929 748,813.08 0.73%USDTobacco and alcoholic drinks 2,477,503.23 2.43%
MOLSON COORS BREWING CO -B- NON VOTING5,845 399,982.61 0.39%USD
Securities portfolio as at 31/12/17EURExpressed in
NEF - U.S. Equity
Quantity /Nominal Denomination Quotation
currency% of net
assetsMarket value

The accompanying notes form an integral part of these financial statements
99Page
PHILIP MORRIS INTERNATIONAL INC15,083 1,328,707.54 1.31%USD
CANADIAN PACIFIC RAILWAY4,167 635,004.52 0.62%USDTransportation 1,434,558.88 1.41%
KANSAS CITY SOUTHERN INDUSTRIES INC4,617 405,070.24 0.40%USDUNION PACIFIC CORP3,528 394,484.12 0.39%USD
AMERICAN ELECTRIC POWER CO INC8,868 543,999.63 0.53%USDUtilities 3,431,156.46 3.37%
CMS ENERGY CORP18,650 735,549.90 0.73%USDEQT10,825 513,765.53 0.50%USDNEXTERA ENERGY5,317 692,455.79 0.68%USDSEMPRA ENERGY6,384 569,146.40 0.56%USDXCEL ENERGY INC9,379 376,239.21 0.37%USD
Total securities portfolio 100,947,020.56 99.06%
Securities portfolio as at 31/12/17EURExpressed in
NEF - U.S. Equity
Quantity /Nominal Denomination Quotation
currency% of net
assetsMarket value

The accompanying notes form an integral part of these financial statements
100Page
Statement of Operations and Changes in Net Assets from 01/01/17 to 31/12/17Expressed in EUR
NEF - U.S. Equity
885,157.10Income856,768.06Net dividends 2Note
5,451.32Bank interest on cash account 2Note22,456.35Securities lending income 2,8Note
481.37Other financial income
2,060,649.22Expenses1,598,986.64Management & advisory fees 5Note
58,385.86Depositary & sub-depositary fees 7Note37,033.29Taxe d'abonnement 4Note28,654.81Administrative expenses
886.27Professional fees798.53Bank interest on overdrafts
3,939.78Legal fees67,264.43Transaction fees 2Note
924.48Publication & printing fees212,451.46Correspondent bank fees 2Note51,323.67Other expenses
-1,175,492.12Net loss from investmentsNet realised profit / loss on:
13,836,622.46- sales of investment securities 2Note-809,102.91- foreign exchange 2Note
11,852,027.43Net realised profitMovement in net unrealised appreciation /(depreciation) on:
-11,116,023.27- investments 2Note-56.65- forward foreign exchange contracts 2Note
735,947.51Increase in net assets as a result of operations53,674,276.47Subscription capitalisation units
-33,686,733.60Redemption capitalisation units
20,723,490.38Increase in net assets
81,184,657.04Net assets at the beginning of the year
101,908,147.42Net assets at the end of the year

101Page
NEF- Pacific Equity

NEF - Pacific Equity
Manager’s Report
Page 102
NORD EST ASSET MANAGEMENT - NEF PACIFIC EQUITY Dale Nicholls Review Period: 2017 The portfolio generated robust absolute returns over 2017 and outperformed its index. The key contributors to performance during this period included a diverse range of companies across information technology (IT), health care and consumption-led stocks in the region. For instance, a conviction position in Hutchison China Meditech bolstered returns. It reported positive trial results for its oncology drug, which endorsed the competitiveness of its product development platform. and raised equity capital to fund its robust oncology drug pipeline. The company also has a strong traditional Chinese medicine business generating strong cash flows for the company to support its R&D efforts. Selected IT names that underpinned returns included WiseTech Global, Koh Young Technology, 58.com and E-Ink Holdings. Healthy earnings and growth visibility was a common factor across these contributors. WiseTech, which is an Australian logistics’ software expert, continued to gain market share in a fragmented industry. Its earnings’ guidance also reflected a strong growth momentum. South Korean optical inspection specialist Koh Young Technology’s results exceeded estimates, while contribution from its new products improved its future earnings’ visibility. Taiwanese electronic display manufacturer E Ink Holdings reported healthy earnings and issued a positive outlook for revenue and margins, driven by strong demand. Chinese online classifieds provider 58.com results highlighted operational efficiencies and resilience in property segment ads. Among consumption-driven holdings, A2 Milk advanced due to better-than-expected earnings growth and it registered its infant formula for sale in the domestic Chinese market. Yihai, which produces condiments for hot pot, a popular style of cuisine in China, added value given a strong market position in the mid to high end segment. It is the main supplier to the Haidilao hot pot restaurant chain, one of China’s fastest growing restaurant chains, so it also benefits from the expansion of this business. Yihai is using its brand recognition at Haidilao to develop a retail business that enables customers to enjoy the same experience at home. A position in the hotel chain operator Shangri-La also aided returns in light of good Chinese demand combined with tightening supply. However, stock specific issues held back some small cap positions during the year. ResApp Health declined as data quality issues impacted clinical trial results for respiratory diseases’ diagnosis. Slower than expected contract wins impacted patient care technology provider OneView Healthcare’s half-year results. The portfolio has exposure to companies that are well-positioned to benefit from a strong outlook for consumption; an increase in their e-commerce footprint, particularly in China; and rising demand for financial services. I also prefer companies with a strong competitive edge that are focused on large growth markets. As an aggregate of bottom-up security selection, China and India were the key overweights at a country level, while consumer discretionary was the largest sector exposure. Outlook Asia offers attractive growth opportunities, supported by structural changes in consumption, technological clearly pro-reform and technology penetration continues to drive structural growth opportunities. The gradual opening up of Chinese financial markets to international investors is one example of such reforms. The transition to a domestic consumption led economy in China and the rise of the middle class is creating opportunities for increasing penetration and premiumisation of products and services. Meanwhile, there are signs of improvement in domestic demand in Japan. Businesses are adopting a shareholder friendly approach and there is a clear emphasis on improving corporate governance. Japan has a number of companies at the forefront of technological leadership spanning a number sectors such as semiconductor materials and industrial automation. Favourable demographics and an emphasis on structural reforms supports smaller regional markets such as Indonesia and India.

The accompanying notes form an integral part of these financial statements
103Page
89,559,373.47Assets87,576,030.26Securities portfolio at market value 2Note77,063,116.83Cost price10,512,913.43Unrealised profit on the securities portfolio1,639,859.96Cash at banks and liquidities
57,560.19Brokers receivable170,224.24Subscribers receivable35,841.03Dividends receivable1,357.04Unrealised net appreciation on forward foreign exchange contracts 2Note
66,010.41Receivable on spot exchange12,490.34Other assets
797,523.34Liabilities2,306.68Bank overdrafts
436,234.78Brokers payable7,709.49Taxe d'abonnement payable 4Note
148,835.97Redemption payable113,541.33Accrued management & advisory fees 5Note
4,766.25Accrued depositary & sub-depositary fees 7Note4,156.58Accrued administrative expenses
65,729.55Payable on spot exchange14,242.71Other liabilities
88,761,850.13Net asset value
Financial Statements as at 31/12/17
Expressed in EUR
Statement of Net Assets as at 31/12/17
NEF - Pacific Equity
Pacific Equity - Category RCapitalisation units 4,030,884.820 2,293,689.298 1,278,471.075 5,046,103.043
Pacific Equity - Category ICapitalisation units 1,027,372.552 2,662,628.719 1,225,638.583 2,464,362.688
Changes in number of units outstanding from 01/01/17 to 31/12/17
Units issued Units redeemed Units outstandingas at 31/12/17
Units outstandingas at 01/01/17

The accompanying notes form an integral part of these financial statements
104Page
Key figures relating to the last 3 years
NEF - Pacific Equity
Pacific Equity - Category R
Capitalisation units
10.885,046,103.043 4,030,884.820
9.363,774,956.778
8.81Number of unitsNet asset value per unit
EUR EUR EUR
Pacific Equity - Category I
Capitalisation units
13.742,464,362.688 1,027,372.552
11.66882,275.170
10.81Number of unitsNet asset value per unit
EUR EUR EUR
Total Net Assets 88,761,850.13 49,718,567.08 42,779,904.99
31/12/1531/12/1631/12/17Year ended on :
EUR

The accompanying notes form an integral part of these financial statements
105Page
ADHERIUM LTD371,950 25,490.16 0.03%AUD
Transferable securities admitted to an official stock exchange listing and/or dealt inon another regulated market 86,590,552.82 97.55%
Shares 86,582,862.74 97.54%
Australia 11,239,820.02 12.66%
AMAYSIM AUSTRAL LTD284,853 371,834.35 0.42%AUDARDENT LEISURE STAPLED SECURITY188,483 243,576.90 0.27%AUDAUSTAL LIMITED463,550 552,151.39 0.62%AUDBERKLEY RESOURCES LTD663,988 455,038.61 0.51%AUDBOART LONGYEAR LTD1,702,529 12,223.23 0.01%AUDBRAVURA SOLUT REGISTERED SHS373,202 420,176.52 0.47%AUDCLINUVEL PHARMACEUTICALS120,052 618,222.94 0.70%AUDCOGSTATE LTD391,347 223,495.50 0.25%AUDCOOPER ENERGY LTD1,616,068 348,074.56 0.39%AUDCORPORATE TRAVEL MANAGEMENT LTD42,971 584,202.55 0.66%AUDCOVATA LTD2,034,612 50,461.94 0.06%AUDDOMAIN HOLDINGS AUSTRALIA PTY LTD32,871 74,445.96 0.08%AUDDONACO INTERNATIONAL LTD1,952,053 445,921.45 0.50%AUDFACTOR THERAPEUTICS - REGISTERED2,711,782 90,265.89 0.10%AUDFAIRFAX MEDIA328,716 167,345.55 0.19%AUDFAR6,976,578 359,723.04 0.41%AUDFASTBRICK ROBOTICS LTD3,008,438 402,525.73 0.45%AUDGETSWIFT LTD276,623 660,797.04 0.74%AUDIMPEDIMED707,818 478,146.15 0.54%AUDLIVEFHIRE - REGISTERED491,604 412,303.72 0.46%AUDLOVISA HOLDINGS LTD20,218 91,183.23 0.10%AUDMEDIBIO LTD649,520 144,135.23 0.16%AUDNETWEALTH GROUP LTD26,488 119,115.18 0.13%AUDORIGIN ENERGY LTD58,302 359,214.75 0.40%AUDRESAPP HEALTH LTD1,861,488 99,626.03 0.11%AUDSINO GAS AND ENERGY HOLDINGS LTD2,084,235 210,851.70 0.24%AUDSOMNOMED LTD110,458 266,745.81 0.30%AUDSTARPHARMA HOLDINGS LTD890,706 796,441.09 0.91%AUDSYRAH RESSOURCES LTD217,625 669,003.52 0.76%AUDTELIX PHARMA707,924 300,329.99 0.34%AUDVOCUS GROUP LTD135,934 273,260.92 0.31%AUDWISE TECH GLOBAL93,517 865,496.89 0.99%AUDYOWIE GROUP350,151 47,992.50 0.05%AUD
COSCO SHIP INTL REGISTERED644,000 211,626.69 0.24%HKDBermuda 1,492,711.04 1.68%
DUKANG DISTILLERS HOLDINGS LTD95,300 15,520.20 0.02%SGDLUKS GROUP (VIETNAM HOLDINGS) CO LTD956,000 259,918.86 0.29%HKDPARADISE ENTERTAINMENT LTD1,076,000 69,105.04 0.08%HKDSHANGRI - LA ASIA LTD448,000 841,111.93 0.94%HKDSUMMIT ASCENT674,000 63,487.58 0.07%HKDTHE 13932,500 31,940.74 0.04%HKD
ALIBABA GR ADR14,950 2,149,444.26 2.41%USDCayman Islands 19,667,919.16 22.16%
AMVIG HOLDINGS -SHS-918,000 206,351.75 0.23%HKDBEST PACIFIC INTERNATIONAL HOLDINGS LTD494,000 258,043.52 0.29%HKDBITAUTO -ADR - REP 1SH19,277 511,138.66 0.58%USDCHAILEASE GDR REPR 5 SHS15,849 192,875.98 0.22%USDCHAILEASE HOLDING COMPANY LTD96,424 238,171.22 0.27%TWDCHAOWEI POWER859,000 417,441.10 0.47%HKDCHINA BIOLOGIC PRODUCTS HOLDING INC4,329 284,328.63 0.32%USDCHINA DISTANCE EDUCATION HLDG LTD ADR30,705 237,334.57 0.27%USDCHINA LODGING ADR REP.4SHS2,623 315,884.17 0.36%USDCHINA ONLINE ADR REPR 15 SHS8,663 90,292.25 0.10%USDCHINA SILVER GROUP1,584,000 406,923.35 0.46%HKDCHINA STATE CONSTRUCTION INTL HLDG LTD180,000 220,031.47 0.25%HKDCT ENVIRONMENTAL GROUP LTD1,766,000 272,207.06 0.31%HKDCTRIP.COM INTL ADR REPR 1/4TH SH16,814 618,275.16 0.70%USDEVA PRECISION INDUSTRIAL HOLDINGS LTD2,098,000 269,483.96 0.30%HKDFANHUA SPONS ADR REPR 20 SHS28,523 514,189.33 0.58%USDFAR EAST CONSORTIUM INTERNATIONAL LTD535,000 266,861.48 0.30%HKDGOODBABY INTL892,000 419,155.88 0.47%HKD
Securities portfolio as at 31/12/17EURExpressed in
NEF - Pacific Equity
Quantity /Nominal Denomination Quotation
currency% of net
assetsMarket value
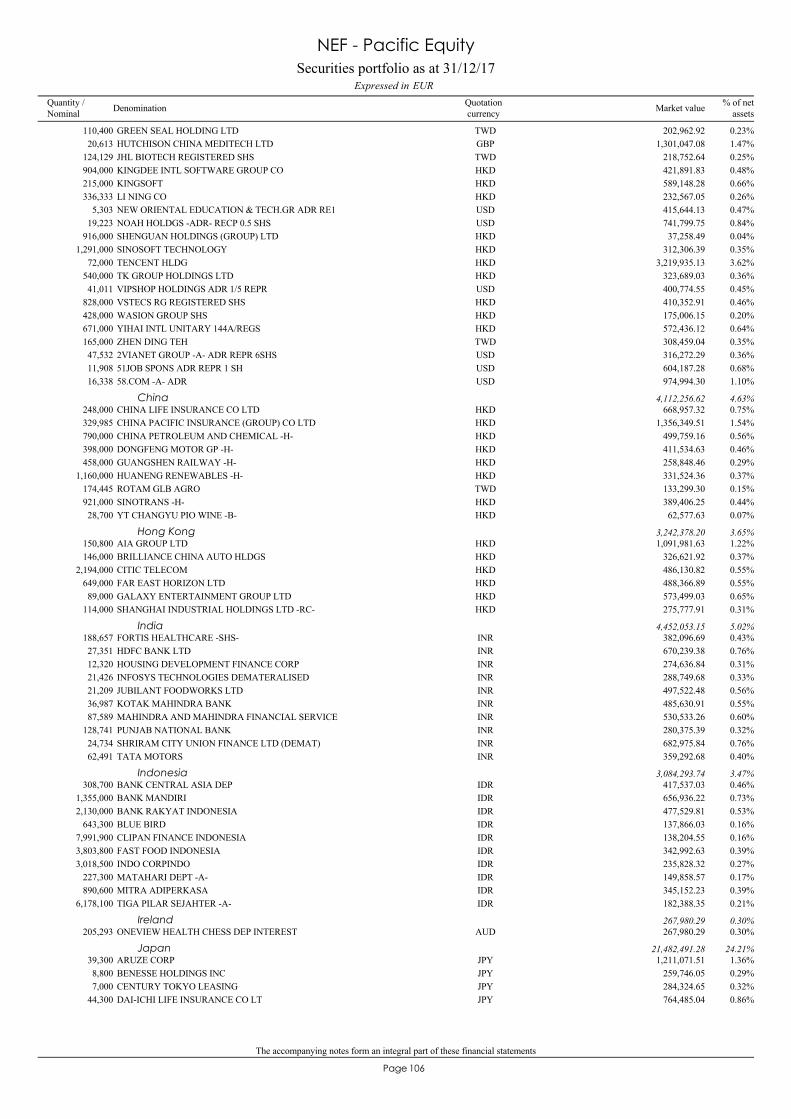
The accompanying notes form an integral part of these financial statements
106Page
GREEN SEAL HOLDING LTD110,400 202,962.92 0.23%TWDHUTCHISON CHINA MEDITECH LTD20,613 1,301,047.08 1.47%GBPJHL BIOTECH REGISTERED SHS124,129 218,752.64 0.25%TWDKINGDEE INTL SOFTWARE GROUP CO904,000 421,891.83 0.48%HKDKINGSOFT215,000 589,148.28 0.66%HKDLI NING CO336,333 232,567.05 0.26%HKDNEW ORIENTAL EDUCATION & TECH.GR ADR RE15,303 415,644.13 0.47%USDNOAH HOLDGS -ADR- RECP 0.5 SHS19,223 741,799.75 0.84%USDSHENGUAN HOLDINGS (GROUP) LTD916,000 37,258.49 0.04%HKDSINOSOFT TECHNOLOGY1,291,000 312,306.39 0.35%HKDTENCENT HLDG72,000 3,219,935.13 3.62%HKDTK GROUP HOLDINGS LTD540,000 323,689.03 0.36%HKDVIPSHOP HOLDINGS ADR 1/5 REPR41,011 400,774.55 0.45%USDVSTECS RG REGISTERED SHS828,000 410,352.91 0.46%HKDWASION GROUP SHS428,000 175,006.15 0.20%HKDYIHAI INTL UNITARY 144A/REGS671,000 572,436.12 0.64%HKDZHEN DING TEH165,000 308,459.04 0.35%TWD2VIANET GROUP -A- ADR REPR 6SHS47,532 316,272.29 0.36%USD51JOB SPONS ADR REPR 1 SH11,908 604,187.28 0.68%USD58.COM -A- ADR16,338 974,994.30 1.10%USD
CHINA LIFE INSURANCE CO LTD248,000 668,957.32 0.75%HKDChina 4,112,256.62 4.63%
CHINA PACIFIC INSURANCE (GROUP) CO LTD329,985 1,356,349.51 1.54%HKDCHINA PETROLEUM AND CHEMICAL -H-790,000 499,759.16 0.56%HKDDONGFENG MOTOR GP -H-398,000 411,534.63 0.46%HKDGUANGSHEN RAILWAY -H-458,000 258,848.46 0.29%HKDHUANENG RENEWABLES -H-1,160,000 331,524.36 0.37%HKDROTAM GLB AGRO174,445 133,299.30 0.15%TWDSINOTRANS -H-921,000 389,406.25 0.44%HKDYT CHANGYU PIO WINE -B-28,700 62,577.63 0.07%HKD
AIA GROUP LTD150,800 1,091,981.63 1.22%HKDHong Kong 3,242,378.20 3.65%
BRILLIANCE CHINA AUTO HLDGS146,000 326,621.92 0.37%HKDCITIC TELECOM2,194,000 486,130.82 0.55%HKDFAR EAST HORIZON LTD649,000 488,366.89 0.55%HKDGALAXY ENTERTAINMENT GROUP LTD89,000 573,499.03 0.65%HKDSHANGHAI INDUSTRIAL HOLDINGS LTD -RC-114,000 275,777.91 0.31%HKD
FORTIS HEALTHCARE -SHS-188,657 382,096.69 0.43%INRIndia 4,452,053.15 5.02%
HDFC BANK LTD27,351 670,239.38 0.76%INRHOUSING DEVELOPMENT FINANCE CORP12,320 274,636.84 0.31%INRINFOSYS TECHNOLOGIES DEMATERALISED21,426 288,749.68 0.33%INRJUBILANT FOODWORKS LTD21,209 497,522.48 0.56%INRKOTAK MAHINDRA BANK36,987 485,630.91 0.55%INRMAHINDRA AND MAHINDRA FINANCIAL SERVICE87,589 530,533.26 0.60%INRPUNJAB NATIONAL BANK128,741 280,375.39 0.32%INRSHRIRAM CITY UNION FINANCE LTD (DEMAT)24,734 682,975.84 0.76%INRTATA MOTORS62,491 359,292.68 0.40%INR
BANK CENTRAL ASIA DEP308,700 417,537.03 0.46%IDRIndonesia 3,084,293.74 3.47%
BANK MANDIRI1,355,000 656,936.22 0.73%IDRBANK RAKYAT INDONESIA2,130,000 477,529.81 0.53%IDRBLUE BIRD643,300 137,866.03 0.16%IDRCLIPAN FINANCE INDONESIA7,991,900 138,204.55 0.16%IDRFAST FOOD INDONESIA3,803,800 342,992.63 0.39%IDRINDO CORPINDO3,018,500 235,828.32 0.27%IDRMATAHARI DEPT -A-227,300 149,858.57 0.17%IDRMITRA ADIPERKASA890,600 345,152.23 0.39%IDRTIGA PILAR SEJAHTER -A-6,178,100 182,388.35 0.21%IDR
ONEVIEW HEALTH CHESS DEP INTEREST205,293 267,980.29 0.30%AUDIreland 267,980.29 0.30%
ARUZE CORP39,300 1,211,071.51 1.36%JPYJapan 21,482,491.28 24.21%
BENESSE HOLDINGS INC8,800 259,746.05 0.29%JPYCENTURY TOKYO LEASING7,000 284,324.65 0.32%JPYDAI-ICHI LIFE INSURANCE CO LT44,300 764,485.04 0.86%JPY
Securities portfolio as at 31/12/17EURExpressed in
NEF - Pacific Equity
Quantity /Nominal Denomination Quotation
currency% of net
assetsMarket value

The accompanying notes form an integral part of these financial statements
107Page
DESCENTE21,500 310,837.60 0.35%JPYDIGITAL ARTS INC9,300 311,104.92 0.35%JPYDIGITAL GARAGE INC15,500 342,756.37 0.39%JPYFINANCIAL PRODUCTS GROUP CO LTD57,200 581,471.75 0.66%JPYFUJIBO16,900 467,457.49 0.53%JPYFUJIMI INC25,900 456,380.04 0.51%JPYGMO INTERNET INC48,500 690,387.61 0.78%JPYHIRATA CORP2,200 190,317.07 0.21%JPYHONEYS HLDGS19,100 167,499.07 0.19%JPYH.S SECURITIES CO LTD76,900 649,255.96 0.73%JPYINVESTOR CLOUD67,500 839,051.01 0.95%JPYJIN10,300 454,310.54 0.51%JPYJUSTSYSTEM13,700 218,312.91 0.25%JPYKURA CORP5,500 269,547.78 0.30%JPYMAEDA CORP36,500 421,185.12 0.47%JPYMANDOM CORP17,200 471,923.96 0.53%JPYNINTENDO CO LTD1,300 397,616.40 0.45%JPYNIPPON CERAMIC CO LTD13,100 281,805.15 0.32%JPYNIPPON SEIKI CO LTD24,300 436,486.97 0.49%JPYNIPPON SHINYKU CO LTD6,400 399,673.28 0.45%JPYNITTA CORP9,800 315,823.87 0.36%JPYOPEN DOOR INC4,600 263,013.29 0.30%JPYOPEN HOUSE CO LTD8,500 382,490.53 0.43%JPYORIX CORP107,600 1,521,676.69 1.72%JPYPEPTIDREAM INC10,800 309,556.69 0.35%JPYPIOLAX INC19,700 490,049.75 0.55%JPYSAIZERIYA CO LTD12,400 347,130.02 0.39%JPYSBI HOLDING17,500 306,155.79 0.34%JPYSMS13,300 350,597.76 0.39%JPYSOFTBANK GROUP30,300 2,006,950.32 2.27%JPYSQUARE ENIX HDLGS10,200 405,970.15 0.46%JPYSUZUKI MOTOR CORP10,900 528,852.75 0.60%JPYTOEI ANIMATION CO LTD3,400 277,715.90 0.31%JPYTOKYO ENERGY & SYSTEMS INC26,800 260,895.52 0.29%JPYTORIDOLL CORP8,200 255,736.24 0.29%JPYTOSHIBA CORP167,000 393,101.66 0.44%JPYTREND MICRO INC8,100 384,339.50 0.43%JPYUNION TOOL CO1,100 33,815.99 0.04%JPYWACOM CO LTD50,500 228,744.34 0.26%JPYWEBDOJAPAN CO LTD12,100 222,826.17 0.25%JPYYAHOO JAPAN CORP60,900 233,795.95 0.26%JPYZENKOKU HOSHO11,900 428,124.30 0.48%JPYZOJRUSHI CORP22,500 191,802.18 0.22%JPYZUKEN33,000 466,317.67 0.53%JPY
CIMB GROUP HOLDINGS BHD338,574 454,105.40 0.52%MYRMalaysia 1,029,519.84 1.16%
LAFARGE MALAYAN BHD107,600 136,767.43 0.15%MYRMUHIBBAH ENGINEERING BHD745,900 438,647.01 0.49%MYR
CEBU AIR179,120 299,948.09 0.34%PHPPhilippines 1,997,776.82 2.25%
INTERNATIONAL CONTAINER TERMINAL SERVICE153,880 271,854.58 0.31%PHPLT GROUP INC2,256,000 707,963.23 0.79%PHPMETROBANK AND TRUST247,170 419,696.87 0.47%PHPWILCON DEPOT INC2,151,500 298,314.05 0.34%PHP
BREADTALK GROUP44,200 46,511.74 0.05%SGDSingapore 1,237,060.28 1.39%
CORDLIFE GROUP LTD617,200 305,410.59 0.35%SGDDELFI LTD123,500 109,846.54 0.12%SGDFIRST RESSOURCES295,500 349,824.62 0.40%SGDHALCYON AGRI CORP198,900 71,636.39 0.08%SGDSINO GRANDNESS FOOD INDUSTRY GRP LTD893,981 110,872.68 0.12%SGDYOMA STRATEGIC HOLDINGS LTD718,300 242,957.72 0.27%SGD
ABLE C AND C3,699 50,712.12 0.06%KRWSouth Korea 7,011,828.59 7.90%
CELL BIOTECH CO LTD8,427 263,411.83 0.30%KRWCJ CORP2,091 289,126.65 0.33%KRW
Securities portfolio as at 31/12/17EURExpressed in
NEF - Pacific Equity
Quantity /Nominal Denomination Quotation
currency% of net
assetsMarket value

The accompanying notes form an integral part of these financial statements
108Page
CJ E&M8,351 628,711.29 0.71%KRWCOSMAX INC4,472 425,664.53 0.48%KRWDAOU TECHNOLOGY36,925 565,531.31 0.64%KRWFILA KOREA CO LTD9,155 597,437.86 0.67%KRWHANSOL CHEMICAL CO LTD4,005 222,766.69 0.25%KRWHYUNDAI FIRE MARINE INSURANCE CO LTD15,029 552,783.50 0.62%KRWHYUNDAI MOTOR CO LTD6,197 487,906.88 0.55%KRWINBODY CO LTD11,742 368,872.12 0.42%KRWKCC CORP697 208,586.18 0.23%KRWKOH YOUNG TECHNOLOGY INC15,040 961,451.50 1.08%KRWKOLON INDUSTRIES INC5,479 373,430.63 0.42%KRWKOREA ELECTRIC POWER CORP7,207 213,137.99 0.24%KRWNUTRIBIOTECH CO.LTD25,054 445,545.76 0.50%KRWT.K. CORP37,023 356,751.75 0.40%KRW
CEYLON COLD - REGISTERED34,359 178,012.80 0.20%LKRSri Lanka 764,820.15 0.86%
JOHN KEELLS717,327 586,807.35 0.66%LKR
ADVANCED SEMICONDUCTOR ENGENEERING INC626,993 677,113.55 0.76%TWDTaiwan 3,866,551.10 4.36%
CHC HEALTHCARE233,001 234,873.42 0.26%TWDCHINA METAL PRODUCTS CO LTD262,200 209,967.01 0.24%TWDCLEANAWAY CO35,000 173,692.37 0.20%TWDEGIS TECHNOLOGY INC48,000 313,999.72 0.35%TWDKING SLIDE WORKS CO LTD42,000 476,075.00 0.54%TWDKMC (KUEI MENG) INTERNATIONAL INC88,000 327,534.19 0.37%TWDLUNGYEN LIFE SERVICE CO LTD95,000 185,365.85 0.21%TWDPRIME VIEW INTERNATIONAL CO LTD423,000 543,286.34 0.61%TWDTAIDOC TECHNO70,787 201,592.75 0.23%TWDTONG HSING ELECTRONICS INDUSTRIES LTD140,000 523,050.90 0.59%TWD
KASIKORNBANK UNITS NVDR105,000 625,182.86 0.70%THBThailand 1,166,892.51 1.31%
PTT PUBLIC COMPANY LTD -F-36,000 406,522.84 0.46%THBTTCL - UNITS NON-VOTING DEP RECEIPT306,250 135,186.81 0.15%THB
SEVEN STARS CLOUD - REGISTERED21,541 82,801.64 0.09%USDUnited States of America 466,509.95 0.53%
UPDATER CHESS DEP INT REPR 0.04430,695 383,708.31 0.44%AUD
BOART LONGYEAR (SHS) 13.09.24 WAR2,356,469 7,690.08 0.01%AUD
Warrants, Rights 7,690.08 0.01%
Australia 7,690.08 0.01%
ENSOGO LTD92,493 0.00 0.00%AUD
Other transferable securities 985,477.44 1.11%
Shares 328,029.10 0.37%
Australia 104,810.53 0.12%
PALADIN ENERGY2,702,223 82,892.98 0.10%AUDSURFSTITCH GROUP LTD493,838 21,917.55 0.02%AUD
CHINA ANIMAL HEALTHCARE404,000 0.00 0.00%HKDBermuda 0.00 0.00%
CHINACACHE ADR REPR 16 SHS31,592 44,518.04 0.05%USDCayman Islands 44,518.04 0.05%
EZION HOLDINGS LTD1,448,200 178,700.53 0.20%SGDSingapore 178,700.53 0.20%
CITIGROUP GM (VINCOM RET) 20.01.15 WAR142,020 244,559.08 0.28%USD
Warrants, Rights 657,448.34 0.74%
Germany 244,559.08 0.28%
HSBC BANK PLC (FPT CORP) 01.04.21 WAR21,549 45,200.98 0.05%USDUnited Kingdom 45,200.98 0.05%
CITIGROUP GLOBAL MARKETS (SHANGHAI INTERNATIONAL AIRPORT) 12.02.16WAR
64,487 367,688.28 0.41%USDUnited States of America 367,688.28 0.41%
Total securities portfolio 87,576,030.26 98.66%
Securities portfolio as at 31/12/17EURExpressed in
NEF - Pacific Equity
Quantity /Nominal Denomination Quotation
currency% of net
assetsMarket value

The accompanying notes form an integral part of these financial statements
109Page
Statement of Operations and Changes in Net Assets from 01/01/17 to 31/12/17Expressed in EUR
NEF - Pacific Equity
1,139,920.60Income1,025,111.21Net dividends 2Note
3,766.71Bank interest on cash account 2Note110,426.56Securities lending income 2,8Note
616.12Other financial income
1,823,232.38Expenses1,171,450.84Management & advisory fees 5Note
49,314.54Depositary & sub-depositary fees 7Note27,181.61Taxe d'abonnement 4Note24,324.90Administrative expenses
606.75Professional fees925.26Bank interest on overdrafts
3,136.10Legal fees324,416.34Transaction fees 2Note
1,153.49Publication & printing fees161.10Bank charges
167,200.84Correspondent bank fees 2Note53,360.61Other expenses
-683,311.78Net loss from investmentsNet realised profit / loss on:
5,057,247.07- sales of investment securities 2Note-27,997.43- forward foreign exchange contracts 2Note
2.39- financial futures 2Note-576,021.87- foreign exchange 2Note
3,769,918.38Net realised profitMovement in net unrealised appreciation /(depreciation) on:
7,444,547.77- investments 2Note1,357.04- forward foreign exchange contracts 2Note
11,215,823.19Increase in net assets as a result of operations56,399,389.97Subscription capitalisation units
-28,571,930.11Redemption capitalisation units
39,043,283.05Increase in net assets
49,718,567.08Net assets at the beginning of the year
88,761,850.13Net assets at the end of the year
110Page
NEF- Euro Corporate Bond

NEF - Euro Corporate Bond
Manager’s Report
Page 111
Performance 2017
103,00
102,50
102,00
101,50
101,00
100,50
100,00
99,50
99,00
98,50
Source: Raiffeisen KAG, own calculations, 30 December 2016 – 29 December 2017, indexed total return net
The performance is calculated by Raiffeisen KAG on the basis of published fund prices, using the
method developed by OeKB (Österreichische Kontrollbank AG). Past results do not permit any reliable
inferences as to the future performance of the fund.
Performance 2017
2017 was another very good year for the fund, especially dominated by the strong performance of
corporate bonds. Underlying yields were slightly higher as markets reflected the good economic
outlook and the start of ECB tapering. The environment for corporate bonds is still very positive as
strong earnings and economic growth are coupled with further inflows into the asset class and ongoing
monthly purchases by the ECB. Corporate leverage and M&A is slightly ticking up, but is still too low
to worry credit markets. The fund enjoyed a decent absolute performance and an outperformance of
more than 120 basis points against the market. The good relative performance was a result of a couple
of positive strategies. Single issuer selection was very positive as well as adding about 15% of
financials in the fund. Selective buying of BB-rated names also added to the good performance versus
the market. A more defensive duration allocation was also positive in an environment of slightly rising
yields.
Consumer, Non-cyclic 17,01% 24,30% -7,29%
Financial 15,53% 0,60% 14,93%
Communications 13,66% 15,72% -2,05%
Consumer, Cyclical 12,05% 13,08% -1,03%
Utilities 11,99% 18,84% -6,85%
Industrial 10,66% 9,41% 1,25%
Basic Materials 8,08% 5,54% 2,55%
Energy 7,70% 8,85% -1,16%
Cash 4,09% 0,00% 4,09%
Technology 1,04% 3,21% -2,17%
Diversified 0,45% 0,44% 0,01%
Government -2,27% 0,00% -2,27%
Total 100,00% 100,00% 0,00%
Bloomberg Sectors, data incl derivatives,
Source: Raiffeisen KAG, internal calcuations, data as of 29 December 2017
NEF - Euro Corporate Bond 1,49 % p.a.
market 1,80 % p.a.
Dec 16
Feb 17
Ap
r 17
May 17
Jul 17
Sep 17
Oct 17
Dec 17

NEF - Euro Corporate Bond
Manager’s Report (continued)
Page 112
Top 10 Holdings
name country sector % in fund
BUNDESREPUB. DEUTSCHLAND DBR 0 1/2 08/15/27 Germany Government 1,76%
DEUTSCHE TELEKOM INT FIN DT 0 5/8 12/13/24 Netherlands Communications 1,15%
VODAFONE GROUP PLC VOD 1 7/8 11/20/29 United Kingdom Communications 0,89%
GOLDMAN SACHS GROUP INC GS 1 3/8 05/15/24 United States Financial 0,80%
DAIMLER AG DAIGR 0.85 02/28/25 Germany Consumer, Cyclical 0,71%
ENGIE SA ENGIFP 0 7/8 03/27/24 France Utilities 0,67%
PIRELLI INTERNATIONAL PCIM 1 3/4 11/18/19 United Kingdom Consumer, Cyclical 0,66%
GENERAL ELECTRIC CO GE 0 7/8 05/17/25 United States Industrial 0,66%
VOESTALPINE AG VOEAV 1 3/8 09/27/24 Austria Basic Materials 0,65%
AT&T INC T 1.8 09/04/26 United States Communications 0,63%
excl derivatives
Source: Raiffeisen KAG, internal calcuations, data as of 29 December 2017
Economic situation: review & outlook
The first half of 2017 was characterized by high political risk in Europe. Spreads were wide in
anticipation of French presidential elections. After the clear victory of President Macron especially
peripheral government bonds profited from strong spread tightening which also extended to corporate
issuers. Also as a result of lower political risk and an stable global environment growth in Europe got
stronger and stronger and finally ended with an annual rate of 2,5%. Inflation on the other hand was
still subdued, but deflation risk are definitely no topic and for this reason the ECB decided to decrease
its monthly purchases from € 60 bn to 30 bn at the beginning of 2018.
With strong economic momentum and declining central bank stimulus we expect a rise in global yields.
On the other hand monetary policy is still expansionary in Europe and in Japan, but it is quite clear that
the ECB will reduce or end its purchasing program at the end of the year. Inflationary pressure is still
low and we don’t expect the inflation to come close to the 2% target of the ECB. Credits will continue
from nearly unchanged ECB purchases and good technical but valuations look already a bit stretched.

The accompanying notes form an integral part of these financial statements
113Page
261,646,978.83Assets256,359,370.70Securities portfolio at market value 2Note255,402,101.54Cost price
957,269.16Unrealised profit on the securities portfolio2,697,921.64Cash at banks and liquidities2,192,765.30Interest receivable
306,253.78Subscribers receivable88,000.00Unrealised net appreciation on financial futures 2Note2,667.41Other assets
886,501.70Liabilities85,500.00Bank overdrafts32,481.82Taxe d'abonnement payable 4Note
457,470.76Redemption payable239,519.92Accrued management & advisory fees 5Note
5,612.51Accrued depositary & sub-depositary fees 7Note6,551.54Accrued administrative expenses
59,365.15Other liabilities
260,760,477.13Net asset value
Financial Statements as at 31/12/17
Expressed in EUR
Statement of Net Assets as at 31/12/17
NEF - Euro Corporate Bond
Euro Corporate Bond - Category RCapitalisation units 7,628,033.170 2,786,638.118 1,916,498.218 8,498,173.070
Euro Corporate Bond - Category ICapitalisation units 591,509.687 273,821.714 803,280.270 62,051.131
Euro Corporate Bond - Category DDistribution units 0.000 7,897,022.771 222,185.747 7,674,837.024
Changes in number of units outstanding from 01/01/17 to 31/12/17
Units issued Units redeemed Units outstandingas at 31/12/17
Units outstandingas at 01/01/17
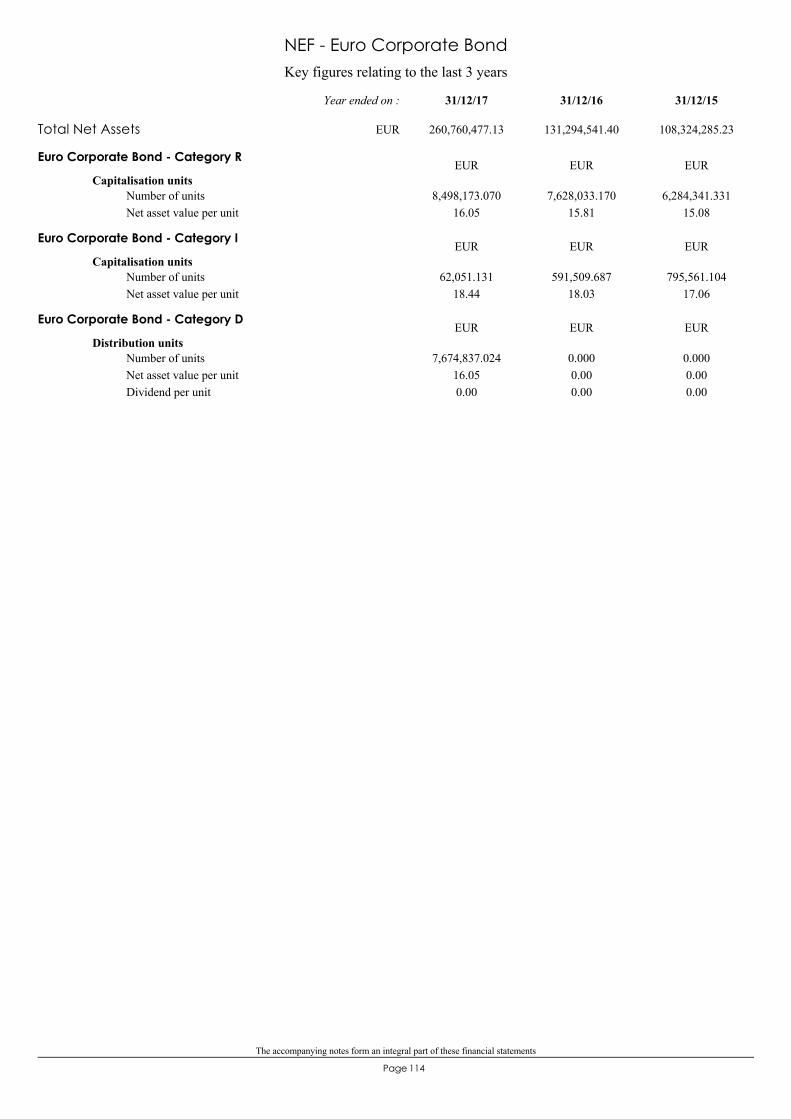
The accompanying notes form an integral part of these financial statements
114Page
Key figures relating to the last 3 years
NEF - Euro Corporate Bond
Euro Corporate Bond - Category R
Capitalisation units
16.058,498,173.070 7,628,033.170
15.816,284,341.331
15.08Number of unitsNet asset value per unit
EUR EUR EUR
Euro Corporate Bond - Category I
Capitalisation units
18.4462,051.131 591,509.687
18.03795,561.104
17.06Number of unitsNet asset value per unit
EUR EUR EUR
Euro Corporate Bond - Category D
Distribution units
16.050.00
7,674,837.024 0.0000.000.00
0.0000.000.00
Number of unitsNet asset value per unitDividend per unit
EUR EUR EUR
Total Net Assets 260,760,477.13 131,294,541.40 108,324,285.23
31/12/1531/12/1631/12/17Year ended on :
EUR
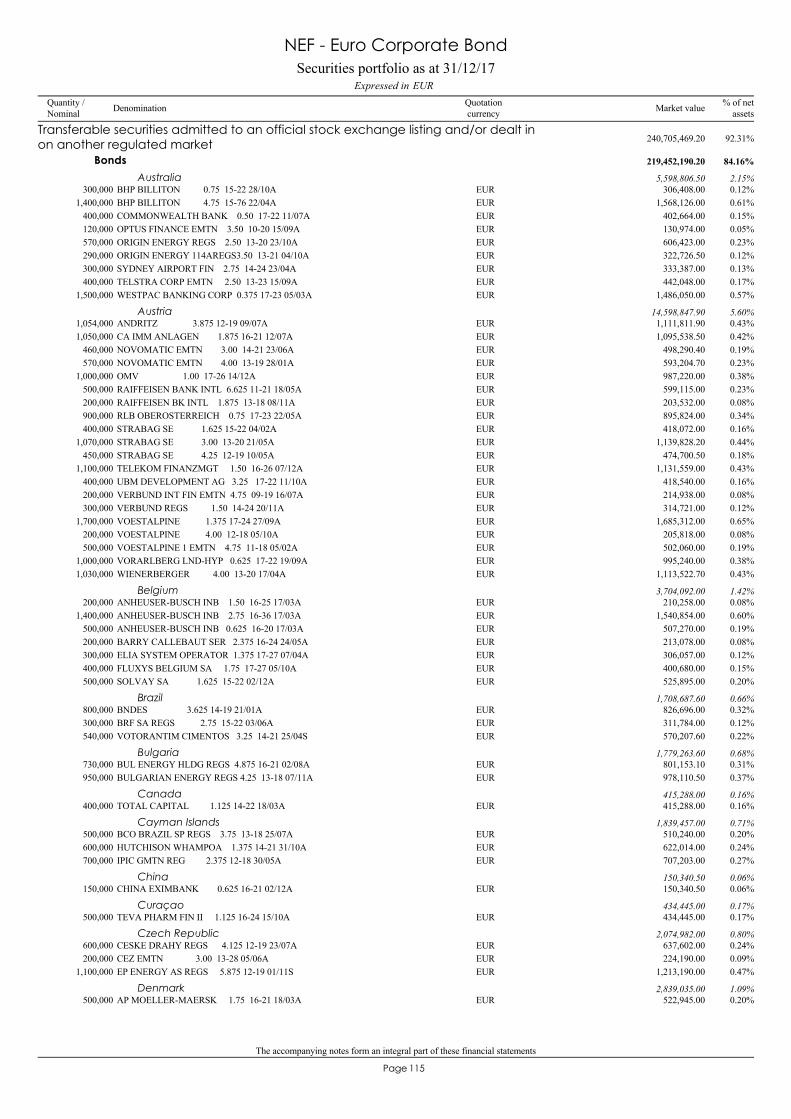
The accompanying notes form an integral part of these financial statements
115Page
BHP BILLITON 0.75 15-22 28/10A300,000 306,408.00 0.12%EUR
Transferable securities admitted to an official stock exchange listing and/or dealt inon another regulated market 240,705,469.20 92.31%
Bonds 219,452,190.20 84.16%
Australia 5,598,806.50 2.15%
BHP BILLITON 4.75 15-76 22/04A1,400,000 1,568,126.00 0.61%EURCOMMONWEALTH BANK 0.50 17-22 11/07A400,000 402,664.00 0.15%EUROPTUS FINANCE EMTN 3.50 10-20 15/09A120,000 130,974.00 0.05%EURORIGIN ENERGY REGS 2.50 13-20 23/10A570,000 606,423.00 0.23%EURORIGIN ENERGY 114AREGS3.50 13-21 04/10A290,000 322,726.50 0.12%EURSYDNEY AIRPORT FIN 2.75 14-24 23/04A300,000 333,387.00 0.13%EURTELSTRA CORP EMTN 2.50 13-23 15/09A400,000 442,048.00 0.17%EURWESTPAC BANKING CORP 0.375 17-23 05/03A1,500,000 1,486,050.00 0.57%EUR
ANDRITZ 3.875 12-19 09/07A1,054,000 1,111,811.90 0.43%EURAustria 14,598,847.90 5.60%
CA IMM ANLAGEN 1.875 16-21 12/07A1,050,000 1,095,538.50 0.42%EURNOVOMATIC EMTN 3.00 14-21 23/06A460,000 498,290.40 0.19%EURNOVOMATIC EMTN 4.00 13-19 28/01A570,000 593,204.70 0.23%EUROMV 1.00 17-26 14/12A1,000,000 987,220.00 0.38%EURRAIFFEISEN BANK INTL 6.625 11-21 18/05A500,000 599,115.00 0.23%EURRAIFFEISEN BK INTL 1.875 13-18 08/11A200,000 203,532.00 0.08%EURRLB OBEROSTERREICH 0.75 17-23 22/05A900,000 895,824.00 0.34%EURSTRABAG SE 1.625 15-22 04/02A400,000 418,072.00 0.16%EURSTRABAG SE 3.00 13-20 21/05A1,070,000 1,139,828.20 0.44%EURSTRABAG SE 4.25 12-19 10/05A450,000 474,700.50 0.18%EURTELEKOM FINANZMGT 1.50 16-26 07/12A1,100,000 1,131,559.00 0.43%EURUBM DEVELOPMENT AG 3.25 17-22 11/10A400,000 418,540.00 0.16%EURVERBUND INT FIN EMTN 4.75 09-19 16/07A200,000 214,938.00 0.08%EURVERBUND REGS 1.50 14-24 20/11A300,000 314,721.00 0.12%EURVOESTALPINE 1.375 17-24 27/09A1,700,000 1,685,312.00 0.65%EURVOESTALPINE 4.00 12-18 05/10A200,000 205,818.00 0.08%EURVOESTALPINE 1 EMTN 4.75 11-18 05/02A500,000 502,060.00 0.19%EURVORARLBERG LND-HYP 0.625 17-22 19/09A1,000,000 995,240.00 0.38%EURWIENERBERGER 4.00 13-20 17/04A1,030,000 1,113,522.70 0.43%EUR
ANHEUSER-BUSCH INB 1.50 16-25 17/03A200,000 210,258.00 0.08%EURBelgium 3,704,092.00 1.42%
ANHEUSER-BUSCH INB 2.75 16-36 17/03A1,400,000 1,540,854.00 0.60%EURANHEUSER-BUSCH INB 0.625 16-20 17/03A500,000 507,270.00 0.19%EURBARRY CALLEBAUT SER 2.375 16-24 24/05A200,000 213,078.00 0.08%EURELIA SYSTEM OPERATOR 1.375 17-27 07/04A300,000 306,057.00 0.12%EURFLUXYS BELGIUM SA 1.75 17-27 05/10A400,000 400,680.00 0.15%EURSOLVAY SA 1.625 15-22 02/12A500,000 525,895.00 0.20%EUR
BNDES 3.625 14-19 21/01A800,000 826,696.00 0.32%EURBrazil 1,708,687.60 0.66%
BRF SA REGS 2.75 15-22 03/06A300,000 311,784.00 0.12%EURVOTORANTIM CIMENTOS 3.25 14-21 25/04S540,000 570,207.60 0.22%EUR
BUL ENERGY HLDG REGS 4.875 16-21 02/08A730,000 801,153.10 0.31%EURBulgaria 1,779,263.60 0.68%
BULGARIAN ENERGY REGS 4.25 13-18 07/11A950,000 978,110.50 0.37%EUR
TOTAL CAPITAL 1.125 14-22 18/03A400,000 415,288.00 0.16%EURCanada 415,288.00 0.16%
BCO BRAZIL SP REGS 3.75 13-18 25/07A500,000 510,240.00 0.20%EURCayman Islands 1,839,457.00 0.71%
HUTCHISON WHAMPOA 1.375 14-21 31/10A600,000 622,014.00 0.24%EURIPIC GMTN REG 2.375 12-18 30/05A700,000 707,203.00 0.27%EUR
CHINA EXIMBANK 0.625 16-21 02/12A150,000 150,340.50 0.06%EURChina 150,340.50 0.06%
TEVA PHARM FIN II 1.125 16-24 15/10A500,000 434,445.00 0.17%EURCuraçao 434,445.00 0.17%
CESKE DRAHY REGS 4.125 12-19 23/07A600,000 637,602.00 0.24%EURCzech Republic 2,074,982.00 0.80%
CEZ EMTN 3.00 13-28 05/06A200,000 224,190.00 0.09%EUREP ENERGY AS REGS 5.875 12-19 01/11S1,100,000 1,213,190.00 0.47%EUR
AP MOELLER-MAERSK 1.75 16-21 18/03A500,000 522,945.00 0.20%EURDenmark 2,839,035.00 1.09%
Securities portfolio as at 31/12/17EURExpressed in
NEF - Euro Corporate Bond
Quantity /Nominal Denomination Quotation
currency% of net
assetsMarket value

The accompanying notes form an integral part of these financial statements
116Page
ISS GLOBAL 1.125 15-21 07/01A900,000 921,258.00 0.35%EURNYKREDIT REALKREDIT 0.75 16-21 14/07A300,000 304,110.00 0.12%EURTDC 3.75 12-22 02/03A400,000 450,612.00 0.17%EURVESTAS WIND SYSTEMS 2.75 15-22 11/03A600,000 640,110.00 0.25%EUR
EESTI ENERGIA AS 4.25 12-18 02/10A100,000 103,241.00 0.04%EUREstonia 596,076.20 0.23%
EESTI ENERGIA AS 4.50 05-20 18/11A440,000 492,835.20 0.19%EUR
CARGOTEC 3.375 14-20 31/03A500,000 533,930.00 0.20%EURFinland 2,189,144.90 0.84%
CRH FINLAND SERVICES 2.75 13-20 15/10A250,000 266,722.50 0.10%EURNESTE OYJ 1.50 17-24 07/06A700,000 708,701.00 0.28%EURNOKIA OYJ 1 17-21 15/03A260,000 261,479.40 0.10%EURTVO POWER CO 2.50 14-21 17/03A400,000 418,312.00 0.16%EUR
ACCOR SA 2.625 14-21 05/02A300,000 321,453.00 0.12%EURFrance 27,278,721.20 10.45%
ARKEMA SA 1.50 17-27 20/04A400,000 409,860.00 0.16%EURAUTOROUTES DU SUD FRA 1.125 17-26 20/04A700,000 711,788.00 0.27%EURAUTOROUTES DU SUD FRA 4.125 10-20 13/04A250,000 273,610.00 0.10%EURBFCM 1.625 17-27 15/11A1,200,000 1,189,380.00 0.46%EURBNP PARIBAS SA 1.00 17-24 27/06A1,000,000 1,009,350.00 0.39%EURBOUYGUES 3.641 10-19 29/10A450,000 480,483.00 0.18%EURCARREFOUR 1.75 13-19 22/05A200,000 205,234.00 0.08%EURCARREFOUR 1.75 14-22 15/07A500,000 529,035.00 0.20%EURCASINO GUICHARD 3.58 14-25 07/02A600,000 632,400.00 0.24%EURCIE DE SAINT GOBAIN 1.375 17-27 14/06A400,000 404,372.00 0.16%EURCOMPAGNIE PLASTIC- 1.25 17-24 26/06A200,000 198,828.00 0.08%EURCROWN EURO HOLDINGS 2.625 16-24 30/09S300,000 308,595.00 0.12%EURCTE CO TRANSP ELEC 1.50 17-28 29/07A500,000 504,985.00 0.19%EURDANONE SA 0.167 16-20 03/11A700,000 703,374.00 0.27%EURDANONE SA 0.424 16-22 03/11A1,000,000 1,003,460.00 0.38%EUREDF 1.00 16-26 13/10A1,000,000 982,170.00 0.38%EUREDF 1.875 16-36 13/10A700,000 646,219.00 0.25%EUREDF 2.25 13-21 27/04A300,000 320,967.00 0.12%EURELECT.DE FRANCE 1.625 14-24 08/10A300,000 318,330.00 0.12%EURENGIE 1.375 17-29 28/02A800,000 808,528.00 0.31%EURENGIE SA 0.875 17-24 27/03A1,700,000 1,724,701.00 0.66%EUREUROFINS SCIENTIFIC 2.125 17-24 25/07A200,000 204,696.00 0.08%EUREUTELSAT 1.125 16-21 23/06A200,000 205,660.00 0.08%EURFRANCE TELECOM 1.875 13-19 02/10A300,000 310,710.00 0.12%EURGDF SUEZ 0.50 15-22 13/03A300,000 303,633.00 0.12%EURIMERYS SA 1.50 17-27 15/01A300,000 304,674.00 0.12%EURITALCEMENTI FINANCE 5.375 10-20 19/03A1,060,000 1,182,663.20 0.45%EURLAFARGE EMTN 5.50 09-19 16/12A500,000 553,510.00 0.21%EURLEGRAND SA 0.75 17-24 06/07A200,000 201,460.00 0.08%EURLVMH 0.375 17-22 26/05A1,500,000 1,507,665.00 0.58%EURLVMH 0.75 17-24 26/05A1,000,000 1,012,850.00 0.39%EURORANGE 1.00 16-25 12/05A300,000 304,083.00 0.12%EURORANGE 3.875 10-20 09/04A400,000 435,424.00 0.17%EURRCI BANQUE EMTN 0.625 15-20 04/03A500,000 505,850.00 0.19%EURRCI BANQUE SA 0.75 17-22 26/09A800,000 806,528.00 0.31%EURRTE RESEAU DE TRANSP 1.00 16-26 19/10A600,000 601,254.00 0.23%EURSANOFI 0.50 16-27 13/01A200,000 194,206.00 0.07%EURSANOFI AVENTIS 1.125 14-22 10/03A300,000 311,091.00 0.12%EURSCHNEIDER ELECTRIC 0.875 17-26 13/12A500,000 492,460.00 0.19%EURSOCIETE GENERALE 1.375 17-28 13/01A1,000,000 995,410.00 0.38%EURTELEPERFORMANCE SE 1.50 17-24 03/04A500,000 506,465.00 0.19%EURTEREOS FINANCE GROUP 4.25 13-20 04/03A600,000 625,812.00 0.24%EURTOTAL CAPITAL 1.375 17-29 04/10A400,000 408,356.00 0.16%EURTOTAL CAPITAL INTL 0.625 17-24 04/10A500,000 500,420.00 0.19%EURVALEO SA 0.375 17-22 12/09A600,000 598,338.00 0.23%EURVIVENDI 0.875 17-24 18/09A300,000 298,833.00 0.11%EURWENDEL 3.75 14-21 21/01A200,000 219,548.00 0.08%EUR
ADLER REAL ESTATE 1.50 17-21 06/12A620,000 616,199.40 0.24%EURGermany 23,451,338.00 8.98%
BASF 0.875 17-27 15/11A1,600,000 1,580,112.00 0.61%EURBASF SE 1.625 17-37 15/11A100,000 98,122.00 0.04%EUR
Securities portfolio as at 31/12/17EURExpressed in
NEF - Euro Corporate Bond
Quantity /Nominal Denomination Quotation
currency% of net
assetsMarket value

The accompanying notes form an integral part of these financial statements
117Page
BILFINGER BERGER SE 2.375 12-19 07/12A1,050,000 1,086,235.50 0.42%EURBSH BOSCH SIEMENS 1.875 13-20 13/11A200,000 210,428.00 0.08%EURCOMMERZBANK AG 1.125 17-25 19/09A500,000 501,590.00 0.19%EURDAIMLER AG 1.00 17-27 15/11A1,000,000 986,180.00 0.38%EURDAIMLER AG 0.85 17-25 28/02A1,800,000 1,808,640.00 0.68%EURDEUTSCHE BAHN FIN 0.00 16-21 19/07U500,000 499,530.00 0.19%EURDEUTSCHE PFANDBRIEF 0.875 17-21 29/01A400,000 407,204.00 0.16%EURDEUTSCHE POST AG 1.00 17-27 13/12A1,000,000 987,060.00 0.38%EURE ON SE 1.625 17-29 22/05A200,000 203,978.00 0.08%EURE.ON SE 0.375 17-21 23/08A1,000,000 1,007,840.00 0.39%EURFRAPORT AG 5.25 09-19 10/09A100,000 108,890.00 0.04%EURFRESENIUS FINANCE BV 2.875 13-20 15/07S200,000 213,904.00 0.08%EURFRESENIUS REGS 3.00 14-21 01/02S250,000 270,907.50 0.10%EURGERMANY 0.50 17-27 15/08A4,500,000 4,532,400.00 1.73%EURHENKEL KGAA 0.00 16-21 13/09A300,000 299,928.00 0.12%EURHOCHTIEF 3.875 13-20 20/03A500,000 538,870.00 0.21%EURHORNBACH BAUMARKT REGS3.875 13-20 15/02A820,000 877,154.00 0.34%EURK S REGS 3.125 13-18 06/12A360,000 370,044.00 0.14%EURLB BADEN-WUERTTEMBER 0.50 17-22 07/06900,000 903,276.00 0.35%EURLBK BADEN-WUERTT 0.20 17-21 13/12A900,000 895,905.00 0.34%EURMAHLE GMBH 2.50 14-21 14/05A280,000 296,685.20 0.11%EURPROSIEBEN MEDIA AG 2.625 14-21 15/04A580,000 611,830.40 0.23%EURSIXT LEASING SE 1.125 17-21 03/02A500,000 503,095.00 0.19%EURTHYSSENKRUPP 1.375 17-22 03/03A500,000 508,140.00 0.19%EURUNITYMEDIA HESSEN REGS4.00 14-25 15/01S300,000 317,706.00 0.12%EURVOLKSWAGEN BANK 1.25 17-25 15/12A700,000 697,109.00 0.27%EURVOLKSWAGEN LEASING 1.125 17-24 04/04A1,500,000 1,512,375.00 0.58%EUR
CNRC CAPITAL 1.871 16-21 07/12A800,000 817,544.00 0.31%EURHong Kong 817,544.00 0.31%
MOL HUNGARIAN OIL 2.625 16-23 28/04A700,000 759,451.00 0.29%EURHungary 759,451.00 0.29%
FCA CAPITAL IRELAND P 1.25 16-20 23/09A1,200,000 1,235,892.00 0.47%EURIreland 5,468,466.60 2.10%
FRESENIUS FIN IRL 1.50 17-24 30/01A1,000,000 1,034,910.00 0.40%EURGE CAP EURO FDG 0.80 15-22 21/01A400,000 407,652.00 0.16%EURLUNAR FDG V LOAN PART 1.875 14-21 08/09A1,000,000 1,061,300.00 0.41%EURROADSTER FINANCE 2.375 17-27 08/12A600,000 596,286.00 0.23%EURRYANAIR LTD 1.875 14-21 17 06A200,000 210,698.00 0.08%EURSMURFIT KAPPA ACQ 2.375 17-24 01/02S320,000 336,924.80 0.13%EURSMURFIT KAPPA ACQ 3.25 14-21 01/06S540,000 584,803.80 0.22%EUR
AMPLIFON 4.875 13-18 16/07A760,000 779,250.80 0.30%EURItaly 9,036,455.80 3.47%
ATLANTIA SPA 1.625 17-25 03/02A400,000 410,332.00 0.16%EURATLANTIA SPA 1.875 17-27 13/07A200,000 204,314.00 0.08%EURAUTOSTRADE 1.875 17-29 26/09A200,000 204,754.00 0.08%EURBUZZI UNICEM 6.25 12-18 28/09A650,000 680,056.00 0.26%EURENI SPA 1.125 16-28 19/09A1,500,000 1,435,485.00 0.54%EURESSELUNGA SPA 1.875 17-27 25/10A350,000 357,224.00 0.14%EURITALGAS SPA 1.625 17-29 18/01A200,000 201,190.00 0.08%EURMEDIOBANCA EMTN 0.75 17-20 17/02A800,000 810,912.00 0.31%EURPRADA 2.75 13-18 01/08A1,210,000 1,224,278.00 0.47%EURSALINI 6.125 13-18 01/08A400,000 413,428.00 0.16%EURSNAM SPA 1.25 17-25 25/01A800,000 818,656.00 0.31%EURTELECOM ITALIA SPA 2.375 17-27 12/10A300,000 300,408.00 0.12%EURTERNA SPA 1.375 17-27 26/07A800,000 804,072.00 0.31%EURWIND TRE SPA 2.625 17-23 20/01S400,000 392,096.00 0.15%EUR
ASAHI GROUP HD 0.321 17-21 19/09A800,000 799,504.00 0.31%EURJapan 1,590,528.00 0.61%
SOFTBANK GROUP CORP 3.125 17-25 19/09S800,000 791,024.00 0.30%EUR
GLENCORE FINANCE EURO 1.25 15-21 17/03A950,000 973,845.00 0.37%EURJersey Island 2,494,920.00 0.96%
GLENCORE FINANCE EURO 1.75 15-25 17/03A1,500,000 1,521,075.00 0.59%EUR
LIETUVOS ENERGIJA UAB 2.00 17-27 14/04A400,000 414,202.00 0.16%EURLithuania 414,202.00 0.16%
ALLERGAN FUNDING 0.50 17-21 01/06A600,000 601,248.00 0.23%EURLuxembourg 9,067,683.60 3.48%
Securities portfolio as at 31/12/17EURExpressed in
NEF - Euro Corporate Bond
Quantity /Nominal Denomination Quotation
currency% of net
assetsMarket value
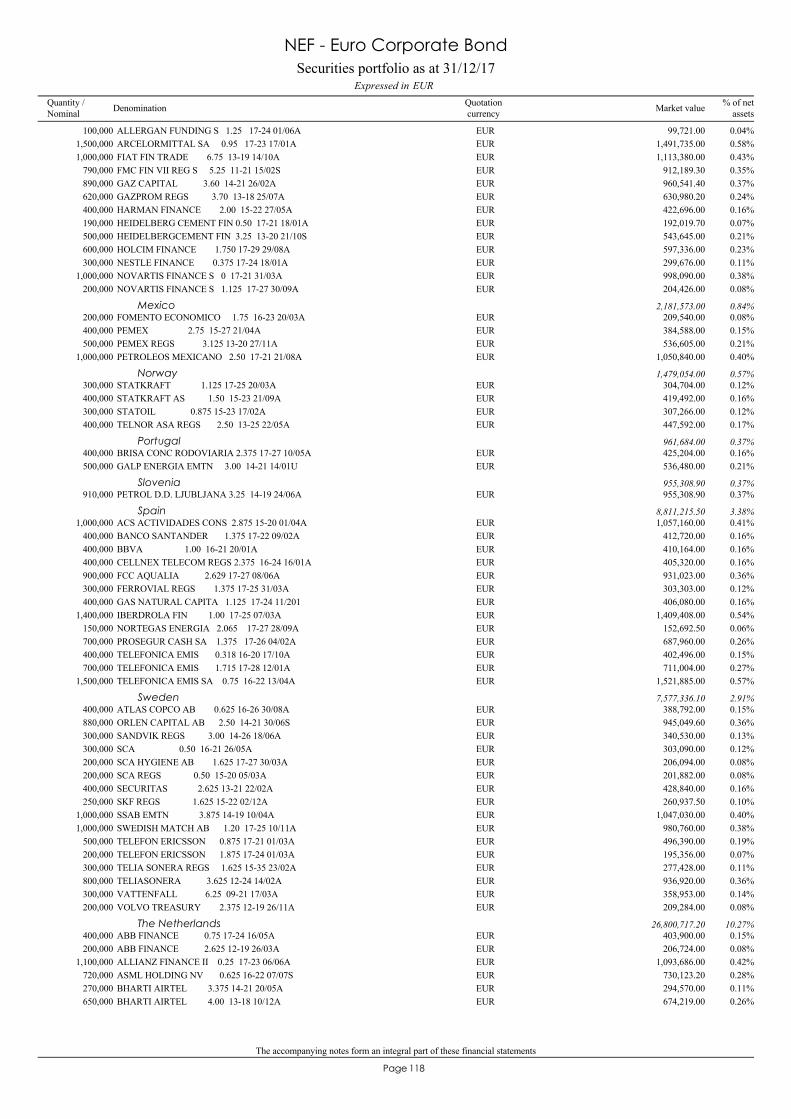
The accompanying notes form an integral part of these financial statements
118Page
ALLERGAN FUNDING S 1.25 17-24 01/06A100,000 99,721.00 0.04%EURARCELORMITTAL SA 0.95 17-23 17/01A1,500,000 1,491,735.00 0.58%EURFIAT FIN TRADE 6.75 13-19 14/10A1,000,000 1,113,380.00 0.43%EURFMC FIN VII REG S 5.25 11-21 15/02S790,000 912,189.30 0.35%EURGAZ CAPITAL 3.60 14-21 26/02A890,000 960,541.40 0.37%EURGAZPROM REGS 3.70 13-18 25/07A620,000 630,980.20 0.24%EURHARMAN FINANCE 2.00 15-22 27/05A400,000 422,696.00 0.16%EURHEIDELBERG CEMENT FIN 0.50 17-21 18/01A190,000 192,019.70 0.07%EURHEIDELBERGCEMENT FIN 3.25 13-20 21/10S500,000 543,645.00 0.21%EURHOLCIM FINANCE 1.750 17-29 29/08A600,000 597,336.00 0.23%EURNESTLE FINANCE 0.375 17-24 18/01A300,000 299,676.00 0.11%EURNOVARTIS FINANCE S 0 17-21 31/03A1,000,000 998,090.00 0.38%EURNOVARTIS FINANCE S 1.125 17-27 30/09A200,000 204,426.00 0.08%EUR
FOMENTO ECONOMICO 1.75 16-23 20/03A200,000 209,540.00 0.08%EURMexico 2,181,573.00 0.84%
PEMEX 2.75 15-27 21/04A400,000 384,588.00 0.15%EURPEMEX REGS 3.125 13-20 27/11A500,000 536,605.00 0.21%EURPETROLEOS MEXICANO 2.50 17-21 21/08A1,000,000 1,050,840.00 0.40%EUR
STATKRAFT 1.125 17-25 20/03A300,000 304,704.00 0.12%EURNorway 1,479,054.00 0.57%
STATKRAFT AS 1.50 15-23 21/09A400,000 419,492.00 0.16%EURSTATOIL 0.875 15-23 17/02A300,000 307,266.00 0.12%EURTELNOR ASA REGS 2.50 13-25 22/05A400,000 447,592.00 0.17%EUR
BRISA CONC RODOVIARIA 2.375 17-27 10/05A400,000 425,204.00 0.16%EURPortugal 961,684.00 0.37%
GALP ENERGIA EMTN 3.00 14-21 14/01U500,000 536,480.00 0.21%EUR
PETROL D.D. LJUBLJANA 3.25 14-19 24/06A910,000 955,308.90 0.37%EURSlovenia 955,308.90 0.37%
ACS ACTIVIDADES CONS 2.875 15-20 01/04A1,000,000 1,057,160.00 0.41%EURSpain 8,811,215.50 3.38%
BANCO SANTANDER 1.375 17-22 09/02A400,000 412,720.00 0.16%EURBBVA 1.00 16-21 20/01A400,000 410,164.00 0.16%EURCELLNEX TELECOM REGS 2.375 16-24 16/01A400,000 405,320.00 0.16%EURFCC AQUALIA 2.629 17-27 08/06A900,000 931,023.00 0.36%EURFERROVIAL REGS 1.375 17-25 31/03A300,000 303,303.00 0.12%EURGAS NATURAL CAPITA 1.125 17-24 11/201400,000 406,080.00 0.16%EURIBERDROLA FIN 1.00 17-25 07/03A1,400,000 1,409,408.00 0.54%EURNORTEGAS ENERGIA 2.065 17-27 28/09A150,000 152,692.50 0.06%EURPROSEGUR CASH SA 1.375 17-26 04/02A700,000 687,960.00 0.26%EURTELEFONICA EMIS 0.318 16-20 17/10A400,000 402,496.00 0.15%EURTELEFONICA EMIS 1.715 17-28 12/01A700,000 711,004.00 0.27%EURTELEFONICA EMIS SA 0.75 16-22 13/04A1,500,000 1,521,885.00 0.57%EUR
ATLAS COPCO AB 0.625 16-26 30/08A400,000 388,792.00 0.15%EURSweden 7,577,336.10 2.91%
ORLEN CAPITAL AB 2.50 14-21 30/06S880,000 945,049.60 0.36%EURSANDVIK REGS 3.00 14-26 18/06A300,000 340,530.00 0.13%EURSCA 0.50 16-21 26/05A300,000 303,090.00 0.12%EURSCA HYGIENE AB 1.625 17-27 30/03A200,000 206,094.00 0.08%EURSCA REGS 0.50 15-20 05/03A200,000 201,882.00 0.08%EURSECURITAS 2.625 13-21 22/02A400,000 428,840.00 0.16%EURSKF REGS 1.625 15-22 02/12A250,000 260,937.50 0.10%EURSSAB EMTN 3.875 14-19 10/04A1,000,000 1,047,030.00 0.40%EURSWEDISH MATCH AB 1.20 17-25 10/11A1,000,000 980,760.00 0.38%EURTELEFON ERICSSON 0.875 17-21 01/03A500,000 496,390.00 0.19%EURTELEFON ERICSSON 1.875 17-24 01/03A200,000 195,356.00 0.07%EURTELIA SONERA REGS 1.625 15-35 23/02A300,000 277,428.00 0.11%EURTELIASONERA 3.625 12-24 14/02A800,000 936,920.00 0.36%EURVATTENFALL 6.25 09-21 17/03A300,000 358,953.00 0.14%EURVOLVO TREASURY 2.375 12-19 26/11A200,000 209,284.00 0.08%EUR
ABB FINANCE 0.75 17-24 16/05A400,000 403,900.00 0.15%EURThe Netherlands 26,800,717.20 10.27%
ABB FINANCE 2.625 12-19 26/03A200,000 206,724.00 0.08%EURALLIANZ FINANCE II 0.25 17-23 06/06A1,100,000 1,093,686.00 0.42%EURASML HOLDING NV 0.625 16-22 07/07S720,000 730,123.20 0.28%EURBHARTI AIRTEL 3.375 14-21 20/05A270,000 294,570.00 0.11%EURBHARTI AIRTEL 4.00 13-18 10/12A650,000 674,219.00 0.26%EUR
Securities portfolio as at 31/12/17EURExpressed in
NEF - Euro Corporate Bond
Quantity /Nominal Denomination Quotation
currency% of net
assetsMarket value

The accompanying notes form an integral part of these financial statements
119Page
BMW FINANCE 0.875 15-20 17/11A700,000 717,528.00 0.28%EURCOMPASS GROUP INTL 0.625 17-24 03/07A200,000 198,784.00 0.08%EURDEUTSCHE TELEKOM 0.25 16-21 19/04A700,000 703,633.00 0.27%EURDEUTSCHE TELEKOM 0.625 17-24 13/12A3,000,000 2,971,500.00 1.13%EURDUFRY ONE BV 2.50 17-24 15/10S250,000 255,235.00 0.10%EUREDP FINANCE 1.50 17-27 22/11A600,000 596,340.00 0.23%EUREDP FINANCE 2.375 16-23 23/03A1,000,000 1,088,800.00 0.42%EURENEL FIN INTL 1.00 17-24 16/09A700,000 711,158.00 0.27%EUREVONIK FINANCE BV 0.75 16-28 07/09A300,000 281,229.00 0.11%EURHEINEKEN 1.50 17-29 03/10A500,000 502,220.00 0.19%EURHEINEKEN NV 1.25 15-21 10/09A400,000 415,180.00 0.16%EURIBERDROLA INTL 2.875 13-20 11/11A300,000 324,255.00 0.12%EURING GROEP 1.375 17-28 11/01A600,000 597,492.00 0.23%EURING GROUP NV 0.75 17-22 09/03A200,000 202,946.00 0.08%EURINNOGY FINANCE 1.00 17-25 13/04A700,000 707,378.00 0.27%EURKPN 0.625 16-25 09/04A200,000 195,270.00 0.07%EURLYB INTL FIN 1.875 16-22 02/03A600,000 630,252.00 0.24%EURMYLAN 1.25 16-20 23/11A300,000 307,395.00 0.12%EURMYLAN NV 3.125 16-28 22/11800,000 844,792.00 0.32%EURPETROBRAS GLB FIN 3.75 14-21 14/01A1,200,000 1,285,920.00 0.49%EURPETROBRAS INTL FIN 3.25 12-19 01/04A500,000 519,305.00 0.20%EURPHOENIX PIB DUTCH 3.625 14-21 30/07A550,000 606,683.00 0.23%EURPHOENIX PIB DUTCH EMTN3.125 13-20 27/05A600,000 638,010.00 0.24%EURRELX FINANCE BV 1.00 17-24 22/03A200,000 202,902.00 0.08%EURROCHE FINANCE REGS 0.50 16-23 27/02A450,000 455,197.50 0.17%EURSAIPEM FIN INTL BV 2.75 17-22 05/04A600,000 617,244.00 0.24%EURSCAHEFFLER FIN REGS 3.25 15-25 15/05S800,000 862,232.00 0.33%EURSHELL INT FIN 0.375 16-25 15/02A1,000,000 984,220.00 0.38%EURSHELL INT FIN 1.00 14-22 06/04A500,000 518,595.00 0.20%EURSPP INFRA INT FIN 2.625 15-25 12/02A150,000 160,750.50 0.06%EURSTEDIN HOLDING NV 0.875 17-25 24/10A300,000 301,056.00 0.12%EURSYNGENTA FINANCE EMTN 1.875 14-21 02/11A300,000 306,960.00 0.12%EURTENNET HLD 2.125 13-20 01/11A400,000 424,164.00 0.16%EURTENNET HOLDING BV 1.375 17-29 26/06A200,000 202,910.00 0.08%EURUNILEVER NV 0.50 16-24 29/04A700,000 697,613.00 0.27%EURVOLKSWAGEN INTL FI 1.875 17-27 30/03A1,100,000 1,137,818.00 0.44%EURVONOVIA FINANCE 0.875 16-22 10/06A800,000 813,168.00 0.31%EURWOLTERS KLUWER 1.50 17-27 22/03A200,000 204,376.00 0.08%EURZIGGO FIN REGS 3.75 15-25 15/01S200,000 206,984.00 0.08%EUR
ARCELIK 3.875 14-21 16/09A580,000 618,158.20 0.24%EURTurkey 618,158.20 0.24%
ANGLO AMERICAN CAP 1.625 17-25 18/09A1,100,000 1,105,181.00 0.42%EURUnited Kingdom 22,276,467.50 8.53%
ASTRAZENECA 0.875 14-21 24/11A200,000 204,954.00 0.08%EURASTRAZENECA PLC 0.75 16-24 12/05A400,000 399,780.00 0.15%EURBARCLAYS PLC 1.875 16-21 23/03A300,000 314,463.00 0.12%EURBAT INTERNATIONAL FIN 1.25 15-27 13/03A1,000,000 980,330.00 0.38%EURBAT INTL FINANCE P 1.00 15-22 23/05A700,000 716,128.00 0.27%EURBP CAPITAL MARKETS 1.12 16-24 25/01A1,100,000 1,132,670.00 0.43%EURBRITISH SKY BROADCAST 1.50 14-21 15/09A1,000,000 1,045,410.00 0.40%EURBRITISH TELECOM 0.625 16-21 10/03A900,000 910,611.00 0.35%EURBRITISH TELECOM 1.00 17-24 21/11A1,400,000 1,391,390.00 0.53%EURCOCA-COLA EUROP PTNR 0.750 16-22 24/02A400,000 406,788.00 0.16%EURDIAGEO FINANCE 0.50 17-24 19/06A700,000 691,096.00 0.27%EURDS SMITH 1.375 17-24 26/07A300,000 301,644.00 0.12%EUREVERYTHING EVERYWHERE 3.25 12-18 03/08A300,000 305,952.00 0.12%EURFCE BANK PLC 0.869 17-21 13/09A700,000 712,236.00 0.27%EURGLAXOSMITHKLINE CAP 1.000 17-26 12/09A800,000 804,000.00 0.31%EURIMPERIAL BRANDS FI 0.50 17-21 27/07A600,000 604,002.00 0.23%EURIMPERIAL BRANDS FIN 1.375 17-25 27/01A700,000 709,891.00 0.27%EURINTER GANE TECH REGS 4.125 15-20 15/02S670,000 713,509.80 0.27%EURLLOYDS BANK 1.50 17-27 12/09A300,000 301,545.00 0.12%EURMERLIN ENTERTAINMENTS 2.75 15-22 15/03S540,000 565,984.80 0.22%EURMONDI FINANCE EMTN 3.375 12-20 28/09A760,000 825,527.20 0.32%EURPIRELLI INTL REGS 1.75 14-19 18/11A1,670,000 1,708,961.10 0.65%EURRBS 5.50 09-19 20/04S320,000 342,454.40 0.13%EUR
Securities portfolio as at 31/12/17EURExpressed in
NEF - Euro Corporate Bond
Quantity /Nominal Denomination Quotation
currency% of net
assetsMarket value

The accompanying notes form an integral part of these financial statements
120Page
STATE GRID -A- 1.50 15-22 26/01A200,000 206,278.00 0.08%EURTESCO CORP 1.375 14-19 01/07A800,000 815,240.00 0.31%EURTESCO EMTN 2.125 13-20 12/11A580,000 608,472.20 0.23%EURTITAN GLB FINANCE 4.25 14-19 10/07S1,100,000 1,165,010.00 0.45%EURVODAFONE GROUP PLC 1.875 17-29 20/11A2,300,000 2,286,959.00 0.87%EUR
ABBVIE 1.375 16-24 17/05A1,000,000 1,022,230.00 0.39%EURUnited States of America 29,482,899.40 11.30%
AMGEN 1.25 16-22 25/02A600,000 621,156.00 0.24%EURAPPLE 0.875 17-25 24/05U600,000 610,476.00 0.23%EURAT T 2.45 15-35 15/03S1,100,000 1,054,251.00 0.40%EURAT&T INC 1.45 14-22 01/06A400,000 416,216.00 0.16%EURAT&T INC 1.80 17-26 04/09A1,600,000 1,619,936.00 0.62%EURBANK OF AMERICA 0.75 16-23 26/07A600,000 603,108.00 0.23%EURBAXTER INTL 1.30 17-25 30/05A400,000 405,768.00 0.16%EURBERKSHIRE HATHAWAY 0.625 17-23 17/01A300,000 302,346.00 0.12%EURCELANESE CORP 3.25 14-19 15/10S800,000 845,328.00 0.32%EURCELANESE US 1.25 17-25 11/025600,000 595,248.00 0.23%EURCITIGROUP 0.75 16-23 26/10A500,000 501,595.00 0.19%EURCOCA COLA 0.75 16-23 09/03A500,000 508,360.00 0.19%EURENEXIS HOLDING NV 1.875 12-20 13/11A200,000 210,958.00 0.08%EURFEDEX CORP 1.00 16-23 11/01A500,000 509,665.00 0.20%EURGENERAL ELECTRIC 0.875 17-25 17/05A1,700,000 1,697,212.00 0.65%EURGENERAL ELECTRIC CO 2.125 17-37 17/05A300,000 298,431.00 0.11%EURGENERAL MOTORS 0.955 16-23 07/09A600,000 599,892.00 0.23%EURGOLDMAN SACHS GROUP 1.375 17-24 15/05A2,000,000 2,044,140.00 0.78%EURIBM 0.5 16-21 07/09A400,000 405,244.00 0.16%EURJOHNSON JOHNSON 0.65 16-24 20/05A800,000 806,296.00 0.31%EURJPMORGAN CHASE 1.50 15-22 26/10A300,000 315,456.00 0.12%EURMC DONALD S 0.50 16-21 15/01A300,000 302,832.00 0.12%EURMERCK & CO 1.125 14-21 15/10A100,000 103,562.00 0.04%EURMICROSOFT 2.125 13-21 06/12S100,000 107,549.00 0.04%EURMORGAN STANLEY 1.875 17-27 27/04A400,000 414,860.00 0.16%EURNATL GRID 0.75 15-22 11/02A500,000 508,095.00 0.19%EURNESTLE HOLDING 0.875 17-25 18/07A1,000,000 1,013,240.00 0.39%EURNEWELL BRANDS REGS 3.75 16-21 01/10S560,000 624,590.40 0.24%EURPFIZER 0.25 17-22 06/03A700,000 700,959.00 0.27%EURPHILIP MORRIS 1.75 13-20 19/03A200,000 207,442.00 0.08%EURPHILIP MORRIS INTL 0.625 17-24 08/11A1,000,000 984,670.00 0.38%EURPHILIP MORRIS INTL 1.875 17-37 06/11A400,000 389,188.00 0.15%EURPRAXAIR 1.50 14-20 11/03A100,000 103,326.00 0.04%EURPROCTER & GAMBLE C 1.125 15-23 02/11300,000 311,535.00 0.12%EURTHE PRICELINE GROUP 0.80 17-22 10/03A400,000 405,288.00 0.16%EURUNITED PARCEL SERVICE 0.375 17-23 15/11A1,000,000 988,740.00 0.38%EURUNITED TECH 1.125 16-21 15/12A300,000 309,984.00 0.12%EURVERIZON COMMUNICATIO 1.875 17-29 26/10A400,000 399,404.00 0.15%EURVERIZON COMMUNICATION 0.875 16-25 02/04A500,000 492,145.00 0.19%EURVERIZON COMMUNICATION 1.375 17-26 27/10A1,500,000 1,493,820.00 0.57%EURVERIZON COMMUNICATION 2.875 17-38 15/01A1,200,000 1,218,252.00 0.47%EURWALGREENS BOOTS 2.125 14-26 20/11A300,000 310,377.00 0.12%EURWELLS FARGO CO 1.50 15-22 12/09A400,000 419,520.00 0.16%EURZF NA CAPITAL 2.75 15-23 27/04A500,000 546,890.00 0.21%EURZF NA CAPITAL 2.25 15-19 26/04A1,100,000 1,133,319.00 0.43%EUR
RAIFFEISEN BANK SUB FL.R 17-XX 15/12S600,000 650,562.00 0.25%EUR
Floating rate bonds 21,253,279.00 8.15%
Austria 1,446,738.00 0.55%
VOLKSBANK WIEN FL.R 17-27 06/10A800,000 796,176.00 0.30%EUR
HUTCHISON WHAMPOA FL.R 13-XX 10/05A300,000 303,927.00 0.12%EURCayman Islands 303,927.00 0.12%
DANONE SA EMTN FL.R 17-XX 23/06A900,000 905,175.00 0.35%EURFrance 6,820,924.00 2.63%
EDF SA FL.R 14-XX 22/01A500,000 535,105.00 0.21%EURELECT.DE FRANCE SUB FL.R 14-XX 22/01A200,000 222,420.00 0.09%EURENGIE FL.R 13-18 10/07A1,000,000 1,020,090.00 0.39%EURENGIE SUB FL.R 14-XX 02/06A1,000,000 1,037,330.00 0.40%EURORANGE EMTN FL.R 14-XX 01/10A600,000 664,752.00 0.25%EURORANGE EMTN SUB REGS FL.R 14-XX 01/10A800,000 950,368.00 0.36%EUR
Securities portfolio as at 31/12/17EURExpressed in
NEF - Euro Corporate Bond
Quantity /Nominal Denomination Quotation
currency% of net
assetsMarket value

The accompanying notes form an integral part of these financial statements
121Page
TOTAL SA FL.R 15-XX 26/02A1,000,000 1,046,120.00 0.41%EURTOTAL SA FL.R 16-XX 06/10A400,000 439,564.00 0.17%EUR
ALLIANZ SE FL.R 15-45 07/07A1,400,000 1,459,920.00 0.57%EURGermany 4,181,969.00 1.60%
BAYER SUB FL.R 14-74 01/07A700,000 768,222.00 0.29%EURENBW ENERGIE FL.R 14-76 02/04A300,000 323,388.00 0.12%EURLB BADEN WUERTT FL.R 14-26 27/05A500,000 524,730.00 0.20%EURMERCK KGAA SUB FL.R 14-74 12/12A300,000 318,141.00 0.12%EURTALANX AG FL.R 17-47 05/12A800,000 787,568.00 0.30%EUR
NORDEA BANK SUB FL.R 17-XX 12/03A600,000 603,360.00 0.23%EURSweden 603,360.00 0.23%
CREDIT SUISSE GROU FL.R 17-25 17/07A600,000 606,354.00 0.23%EURSwitzerland 606,354.00 0.23%
EVONIK FINANCE BV FL.R 16-21 08/03A800,000 796,336.00 0.31%EURThe Netherlands 3,425,655.00 1.31%
RABOBANK EMTN FL.R 14-26 26/05A200,000 212,034.00 0.08%EURREPSOL INTL FINANCE FL.R 15-49 29/12A500,000 538,675.00 0.21%EURVW INTL FINANCE FL.R 17-XX 14/06A800,000 846,520.00 0.32%EURVW INTL FINANCE REGS FL.R 17-XX 14/12A1,000,000 1,032,090.00 0.39%EUR
BARCLAYS FL.R 17-28 07/02A800,000 797,232.00 0.31%EURUnited Kingdom 1,638,448.00 0.63%
RBS SCOTLAND FL.R 17-23 08/03A800,000 841,216.00 0.32%EUR
BANK OF AMERICA FL.R 17-22 07/02A1,000,000 1,016,310.00 0.38%EURUnited States of America 2,225,904.00 0.85%
JPMORGAN CHASE FL.R 17-28 18/05A300,000 308,703.00 0.12%EURMORGAN STANLEY FL.R 17-26 23/10A900,000 900,891.00 0.35%EUR
NOVOMATIC AG 1.625 16-23 20/09200,000 206,746.00 0.08%EUR
Other transferable securities 15,653,901.50 6.00%
Bonds 15,186,610.00 5.82%
Austria 206,746.00 0.08%
PROXIMUS SA 0.50 17-22 22/03A200,000 202,028.00 0.08%EURBelgium 202,028.00 0.08%
CHEUNG KONG FIN 1.00 17-24 12/12A500,000 495,605.00 0.19%EURCayman Islands 891,857.00 0.34%
CK HUTCHISON FINANCE 0.875 16-24 03/10A400,000 396,252.00 0.15%EUR
CARLSBERG BREW 0.50 17-23 06/09A1,000,000 988,790.00 0.38%EURDenmark 988,790.00 0.38%
CARGOTEC 1.75 17-22 28/03A600,000 613,746.00 0.24%EURFinland 613,746.00 0.24%
AIR LIQUIDE SA 0.125 16-20 13/06A700,000 702,926.00 0.26%EURFrance 2,802,527.00 1.06%
AUCHAN FRANCE 0.625 17-22 07/02A200,000 202,052.00 0.08%EURAUTOR.PARIS RHIN RHONE 1.50 17-33 17/01A200,000 195,686.00 0.08%EURCOENTR DE TR D'ELEC 0.875 17-24 29/09A600,000 603,846.00 0.22%EURCOFIROUTE 1.125 17-27 13/10A300,000 301,296.00 0.11%EURDANONE SA 0.709 16-24 03/11300,000 300,495.00 0.12%EURRTE EDF TRANSPORT SA 1.875 17-37 23/10A200,000 201,350.00 0.08%EURVEOLIA ENVIRONN. 0.314 16-23 04/10A300,000 294,876.00 0.11%EUR
CHINA CONSTRUCTION 0.625 17-20 17/02A400,000 401,844.00 0.15%EURHong Kong 401,844.00 0.15%
FCA BANK SPA IRL 0.25 17-20 12/10A1,000,000 1,001,160.00 0.38%EURIreland 1,001,160.00 0.38%
ENI SPA 1.00 17-25 14/03A400,000 401,808.00 0.15%EURItaly 1,507,636.00 0.58%
INTESA SANPAOLO SPA 0.875 17-22 27/06A800,000 810,544.00 0.32%EURIREN SPA 1.50 17-27 24/10A300,000 295,284.00 0.11%EUR
CETIN FINANCE BV 1.423 16-21 06/12A1,200,000 1,240,296.00 0.48%EURLuxembourg 1,240,296.00 0.48%
IBERDROLA FINANZAS 1.621 17-29 29/11A700,000 700,945.00 0.27%EURSpain 901,367.00 0.35%
SANTANDER CONSUMER 0.75 17-22 17/10A200,000 200,422.00 0.08%EUR
JAB HOLDINGS 1.25 17-24 22/05A400,000 407,252.00 0.15%EURThe Netherlands 708,161.00 0.27%
Securities portfolio as at 31/12/17EURExpressed in
NEF - Euro Corporate Bond
Quantity /Nominal Denomination Quotation
currency% of net
assetsMarket value

The accompanying notes form an integral part of these financial statements
122Page
KONINKLIJKE PHILIPS 0.50 17-23 06/09A300,000 300,909.00 0.12%EUR
CREDIT AGRICOLE LO 1.375 17-27 03/05A300,000 309,096.00 0.12%EURUnited Kingdom 1,812,526.00 0.70%
G4S INTL FINANCE PLC 1.50 17-24 02/06A300,000 303,699.00 0.12%EURUBS AG LONDON 0.125 17-21 05/11A500,000 498,520.00 0.19%EURVODAFONE GROUP PLC 0.375 17-21 22/11A700,000 701,211.00 0.27%EUR
APPLE INC 1.375 17-29 24/05A300,000 307,332.00 0.12%EURUnited States of America 1,907,926.00 0.73%
THERMO FISHER SCIEN 1.95 17-29 24/07A200,000 201,462.00 0.08%EURTOYOTA MOTOR 0.00 17-21 21/07A1,000,000 995,940.00 0.38%EUR3M 0.375 16-22 15/02A400,000 403,192.00 0.15%EUR
VIENNA INSUR SUB FL.R 17-47 13/04A200,000 213,704.00 0.08%EUR
Floating rate bonds 467,291.50 0.18%
Austria 213,704.00 0.08%
NATIONWIDE BUILDING FL.R 17-29 25/07A250,000 253,587.50 0.10%EURUnited Kingdom 253,587.50 0.10%
Total securities portfolio 256,359,370.70 98.31%
Securities portfolio as at 31/12/17EURExpressed in
NEF - Euro Corporate Bond
Quantity /Nominal Denomination Quotation
currency% of net
assetsMarket value

The accompanying notes form an integral part of these financial statements
123Page
Statement of Operations and Changes in Net Assets from 01/01/17 to 31/12/17Expressed in EUR
NEF - Euro Corporate Bond
2,442,523.92Income4,133.68Net dividends 2Note
2,406,447.62Net interest on bonds 2Note42.65Bank interest on cash account 2Note
30,649.97Securities lending income 2,8Note1,250.00Other financial income
2,247,275.27Expenses1,639,998.99Management & advisory fees 5Note
42,458.15Depositary & sub-depositary fees 7Note74,039.83Taxe d'abonnement 4Note48,698.32Administrative expenses
666.65Professional fees25,867.87Bank interest on overdrafts6,739.96Legal fees
42,199.31Transaction fees 2Note1,233.48Publication & printing fees
302,842.16Correspondent bank fees 2Note62,530.55Other expenses
195,248.65Net income from investmentsNet realised profit / loss on:
1,677,205.98- sales of investment securities 2Note40,795.47- forward foreign exchange contracts 2Note
-163,950.00- financial futures 2Note-43,416.19- foreign exchange 2Note
1,705,883.91Net realised profitMovement in net unrealised appreciation /(depreciation) on:
-91,435.38- investments 2Note187,850.00- financial futures 2Note
1,802,298.53Increase in net assets as a result of operations49,357,716.36Subscription capitalisation units
127,221,002.95Subscription distribution units-45,332,834.80Redemption capitalisation units-3,582,247.31Redemption distribution units
129,465,935.73Increase in net assets
131,294,541.40Net assets at the beginning of the year
260,760,477.13Net assets at the end of the year

124Page
NEF- Ethical Total Return Bond (previously Absolute
Return Bond)

NEF – ETHICAL TOTAL RETURN BOND (previously Absolute Return Bond )
Manager’s Report
Page 125
Market developments We witnessed a quite astonishing spectrum of political and economic events from the start of the year through to July 2017. The largest disruption came from Washington DC where President Trump was inaugurated in January. The “Trump trade” which had kicked off at the time of his election victory in November 2016 though soon started to fade. Infrastructure spending plans and tax reforms were shelved as the new President appeared unable to push legislation through the legislature. The sense of turmoil was increased with a whole series of resignations, firings and enquiry startups. Trade issues came to the for the with the start of the NATFA renegotiation, exit from TPP and elevated geo political tension with a twitter intermediated slanging match with Pyongyang. On the other hand, European political risk faded with more consensus candidates prevailing in Austria, Netherlands and arguably more importantly in France where Emmanuel Macron flourished from political rookie to president in 18 short months. In the UK, the worst decision of the year belonged to Theresa May who called a general election in June in order to gain a stronger majority in Brexit negotiations but somehow managed to end up with a minority government propped up by right wing Ulster unionists. On the economic front, the US went through its seasonal weakness in Q1 before bouncing back strongly in Q2. Europe moved from strength to strength, emboldened by the positive political results. China continued to surprise on the upside and the long awaited hard landing failed to materialize. Japan showed signs of revival whilst the emerging complex continued to accelerate with even Russia and Brazil, which had been hard hit by the 2014-2016 commodity induced recession, rebounding. However, the inflation genie remained in the bottle which reassured markets. So despite rate hikes in the US and Canada and progressively more hawkish discourse from central banks, probably epitomized best by Mario Draghi at the ECB shindig in Sintra in June, markets stayed overall extremely calm and carried on. In terms of financial markets, volatility collapsed on the back of low inflation, strong and improving macro data, etc. The lack of inflation meant that the long end of the yield curves remained anchored and we observed significantly flatter curves over the period. This supported all forms of risky assets, as equities, credit, EMD rallied hard and financial conditions remained loose. On the FX side, the US dollar tanked across the board and disconnected from all traditional valuation measures. Euro was a big winner with reduced political risk, a more hawkish ECB and scintillating improvements in fundamentals. Commodity and emerging currencies also remained bid as global growth bounced and oil prices took off. Portfolio review
After the transfer of the portfolio to the fixed income team in Autumn 2016, the portfolio continued to be aligned to the other portfolios in the absolute return suite of funds. Specifically, negative yielding and highly liquid sovereign paper was replaced by high quality, short maturity corporate paper but with a positive yield. Consequently, the yield to maturity of the portfolio increased significantly over the first quarter specifically. This credit book was added to when interesting opportunities appeared in the primary market. The CDS which had until this point generated the exposure to credit markets were little by little retired, preferring the aforementioned book of cash credit bonds. In the rates market, duration remained below one year on the back of the renewed tightening cycle by central banks. The portfolio was specifically net short in US treasuries, typically through put options in order to benefit from convexity in the event in the acceleration of a selloff in bond markets. The portfolio also went short French treasury futures in advance of the French election when the outcome appeared less clear. A small long in Australian treasury government bonds was retired in spring. On the currency side, the portfolio was positioned for a rising US dollar on the back the expected Trump fiscal relaunch. The long US dollar was financed by being short EUR which we expected to weaken on political noise and a widening rate differentials in favor of the US Dollar.
Performance analysis
For the period 30th December 2016 to 17th July 2017, date of liquidation, the portfolio delivered a positive net return of +0.20%, which compares to negative yielding money markets over the same period (for illustration purposes Eonia OIS delivered -0.20% over the same period). Credit was a positive contributor to excess return through both spread tightening and positive carry. Rates strategies were overall slightly negative as the US curve steepened and French futures outperformed after the more favorable election result. The corollary of the flattening US Treasury curve as well as the unorthodox management style of President Trump meant that US Dollar weakened and consequently the currency book in the portfolio lagged marginally too.

The accompanying notes form an integral part of these financial statements
126Page
265,789,734.77Assets254,995,275.27Securities portfolio at market value 2Note256,238,459.06Cost price
-1,243,183.79Unrealised loss on the securities portfolio7,250,781.32Cash at banks and liquidities2,236,689.95Interest receivable
23,452.35Subscribers receivable1,277,062.87Unrealised net appreciation on forward foreign exchange contracts 2Note
6,473.01Other assets
1,465,148.29Liabilities351,434.98Bank overdrafts31,114.39Taxe d'abonnement payable 4Note
665,267.69Redemption payable110,170.15Unrealised net depreciation on financial futures 2Note44,533.27Unrealised net depreciation on swaps 2,6Note
171,795.31Accrued management & advisory fees 5Note5,719.54Accrued depositary & sub-depositary fees 7Note6,676.51Accrued administrative expenses
78,436.45Other liabilities
264,324,586.48Net asset value
Financial Statements as at 31/12/17
Expressed in EUR
Statement of Net Assets as at 31/12/17
NEF - Ethical Total Return Bond (previously Absolute Return Bond)
Ethical Total Return Bond (previouslyAbsolute Return Bond) - Category RCapitalisation units 3,355,339.318 907,181.835 1,126,917.870 3,135,603.283
Ethical Total Return Bond (previouslyAbsolute Return Bond) - Category ICapitalisation units 479,387.580 1,901,816.097 421,410.520 1,959,793.157
Ethical Total Return Bond (previouslyAbsolute Return Bond) - Category DDistribution units 3,993,198.888 24,190,676.724 2,757,576.495 25,426,299.117
Ethical Total Return Bond (previouslyAbsolute Return Bond) - Category CCapitalisation units 0.000 5,257.623 0.000 5,257.623
Changes in number of units outstanding from 01/01/17 to 31/12/17
Units issued Units redeemed Units outstandingas at 31/12/17
Units outstandingas at 01/01/17

The accompanying notes form an integral part of these financial statements
127Page
Key figures relating to the last 3 years
NEF - Ethical Total Return Bond (previously Absolute Return Bond)
Ethical Total Return Bond (previously Absolute Return Bond) -Category R
Capitalisation units
9.513,135,603.283 3,355,339.318
9.523,482,983.860
9.69Number of unitsNet asset value per unit
EUR EUR EUR
Ethical Total Return Bond (previously Absolute Return Bond) -Category I
Capitalisation units
9.831,959,793.157 479,387.580
9.80443,495.920
9.93Number of unitsNet asset value per unit
EUR EUR EUR
Ethical Total Return Bond (previously Absolute Return Bond) -Category D
Distribution units
8.460.04
25,426,299.117 3,993,198.8888.510.11
3,864,941.4988.770.15
Number of unitsNet asset value per unitDividend per unit
EUR EUR EUR
Ethical Total Return Bond (previously Absolute Return Bond) -Category C
Capitalisation units
9.525,257.623 0.000
0.000.0000.00
Number of unitsNet asset value per unit
EUR EUR EUR
Total Net Assets 264,324,586.48 70,601,440.71 72,055,359.85
31/12/1531/12/1631/12/17Year ended on :
EUR

The accompanying notes form an integral part of these financial statements
128Page
ARGENTINA 6.875 17-27 26/01S300,000 273,677.15 0.10%USD
Transferable securities admitted to an official stock exchange listing and/or dealt inon another regulated market 238,033,973.71 90.05%
Bonds 214,464,777.25 81.13%
Argentina 273,677.15 0.10%
NAT.AUST.BK 1.375 17-22 27/06A3,000,000 3,378,503.88 1.28%GBPAustralia 4,175,855.19 1.58%
WESTFIELD REGS 2.625 17-29 30/03A700,000 797,351.31 0.30%GBP
KINGDOM OF BAHRAIN 7.50 17-47 20/09S1,000,000 799,099.48 0.30%USDBahrain 799,099.48 0.30%
KBC GROUP NV 0.75 17-22 01/03M300,000 303,615.00 0.11%EURBelgium 303,615.00 0.11%
SINO OCEAN 6.00 14-24 30/07S200,000 184,651.05 0.07%USDBritish Virgin Islands 184,651.05 0.07%
CANADA GOVT BONDS 3.75 08-19 01/06S20,000,000 13,689,341.05 5.17%CADCanada 14,154,456.12 5.35%
STONEWAY CPTL REGS 10.00 17-27 01/03S525,000 465,115.07 0.18%USD
INKIA ENERGY REGS 5.875 17-27 09/11S750,000 628,379.06 0.24%USDCayman Islands 2,599,378.93 0.98%
PGH CAPITAL PLC 4.125 17-22 20/07A1,000,000 1,204,377.67 0.45%GBPSPARC EM SPC PANAMA 0.00 17-22 05/12U1,000,000 766,622.20 0.29%USD
ENAP 4.50 17-47 14/09S900,000 719,939.97 0.27%USDChile 719,939.97 0.27%
BPCE SUB 4.625 14-25 11/07S500,000 439,437.59 0.17%USDFrance 5,551,795.10 2.10%
BPCE 144A SUB 4.625 14-24 11/07S200,000 175,727.51 0.07%USDEDF 1.00 16-26 13/10A800,000 785,736.00 0.30%EURFONCIERE DES REGIO 1.50 17-27 21/06A1,300,000 1,295,645.00 0.49%EURFRANCE OAT 2.25 11-22 25/10A1,200,000 1,336,788.00 0.50%EURICADE 1.50 17-27 13/09A1,300,000 1,309,503.00 0.49%EURSFR GROUP SA REGS 5.625 14-24 15/05S200,000 208,958.00 0.08%EUR
ADLER REAL ESTATE 2.125 17-24 06/02A1,950,000 1,936,174.50 0.73%EURGermany 12,173,083.53 4.61%
ALLEMAGNE 176 0.00 17-22 07/10U5,200,000 5,251,428.00 1.99%EURDEUTSCHE BAHN FIN. 1.375 17-25 07/07A700,000 784,207.03 0.30%GBPDEUTSCHLAND REP 1.75 14-24 15/02A2,200,000 2,439,756.00 0.92%EURNIDDA HEALTHCARE 3.50 17-24 30/09S800,000 808,400.00 0.31%EURUNITYMEDIA HESSEN REGS4.00 14-25 15/01S900,000 953,118.00 0.36%EUR
CGNPC INTL 1.625 17-24 11/12A1,500,000 1,505,520.00 0.57%EURHong Kong 1,505,520.00 0.57%
BHARTI AIRTEL REG 4.375 15-25 10/06S1,000,000 848,211.46 0.32%USDIndia 848,211.46 0.32%
ROADSTER FINANCE 2.375 17-27 08/12A400,000 397,524.00 0.15%EURIreland 2,310,005.80 0.87%
ROADSTER FINANCE DAC 1.625 17-24 09/12A400,000 398,016.00 0.15%EURSMURFIT KAP ACQ REGS 2.75 15-25 01/02S750,000 796,665.00 0.30%EURVIRGIN MEDIA RECEI 5.50 16-24 15/09S630,000 717,800.80 0.27%GBP
ENI SPA 1.50 17-27 17/01A800,000 811,904.00 0.31%EURItaly 16,512,522.00 6.26%
ITALY BTP 1.35 15-22 15/04S6,200,000 6,387,984.00 2.42%EURITALY BTP 4.50 04-20 01/02S2,000,000 2,189,580.00 0.83%EURLEONARDO 1.50 17-24 07/06A700,000 702,758.00 0.27%EURTELECOM ITALIA SPA 2.375 17-27 12/10A1,500,000 1,502,040.00 0.57%EURUNICREDIT 4.375 16-27 03/01A1,000,000 1,084,920.00 0.41%EURUNICREDIT SPA REGS 6.95 12-22 31/10A200,000 246,358.00 0.09%EURUNIPOL GRUPPO FI 3.50 17-27 29/11A1,500,000 1,511,790.00 0.57%EURWIND TRE SPA 3.125 17-25 20/01S1,000,000 974,330.00 0.37%EUR2I RETE DAG SPA 1.608 17-27 31/10A1,100,000 1,100,858.00 0.42%EUR
MITSUBISHI UFJ 0.872 17-24 07/09A800,000 796,848.00 0.30%EURJapan 1,804,025.52 0.68%
SUMITOMO MITSUI FINL 3.446 17-27 11/01S1,200,000 1,007,177.52 0.38%USD
MERCURY BONDCO 8.25 15-21 30/05S1,000,000 1,042,290.00 0.39%EURJersey Island 1,042,290.00 0.39%
Securities portfolio as at 31/12/17EURExpressed in
NEF - Ethical Total Return Bond (previously Absolute Return Bond)
Quantity /Nominal Denomination Quotation
currency% of net
assetsMarket value

The accompanying notes form an integral part of these financial statements
129Page
ARENA LUX FIN SARL 2.875 17-24 01/11S710,000 731,001.80 0.28%EURLuxembourg 7,924,175.48 3.00%
AROUNDTOWN SA 1.00 17-25 07/01A900,000 877,392.00 0.33%EURATF NETHERLANDS BV 2.125 16-23 13/03A300,000 317,028.00 0.12%EURHEIDELBERGCEMENT F 1.5 17-27 14/06A1,300,000 1,304,953.00 0.49%EURHOLCIM FINANCE 1.750 17-29 29/08A1,200,000 1,194,672.00 0.45%EURMHP REGS 8.25 13-20 02/04S1,200,000 1,089,315.43 0.41%USDMILLICOM INTL CEL 6.00 15-25 10/03S800,000 713,009.25 0.27%USDTELENET INT FIN REGS 3.50 17-28 01/03S1,700,000 1,696,804.00 0.65%EUR
CEMEX SAB DE CV 2.75 17-24 05/12S1,200,000 1,208,892.00 0.46%EURMexico 4,438,095.70 1.68%
GACM REGS 5.50 17-47 31/07S1,000,000 825,097.98 0.31%USDGRUPO BIMBO REGS 4.70 17-47 10/11S1,300,000 1,097,493.53 0.42%USDINFRA ENERGITICA REGS 4.875 17-48 14/01S1,625,000 1,306,612.19 0.49%USD
NEW ZEALAND INDEXED 2.50 14-35 20/09Q650,000 433,481.65 0.16%NZDNew Zealand 3,970,884.63 1.50%
NEW ZEALAND 427 4.50 14-27 15/04S5,200,000 3,537,402.98 1.34%NZD
POLAND GOV BOND 2.50 16-27 25/07A20,050,000 4,493,129.63 1.70%PLNPoland 4,493,129.63 1.70%
RWANDESE REP REGS 6.625 13-23 02/05S1,000,000 875,569.08 0.33%USDRwanda 875,569.08 0.33%
SOUTH AFRICA (REP OF) 8.75 12-48 28/02S46,500,000 2,846,740.71 1.08%ZARSouth Africa 2,846,740.71 1.08%
BANCO DE SABADELL SA 0.875 17-23 05/03A1,200,000 1,189,692.00 0.45%EURSpain 6,485,250.99 2.45%
INMOB COLONIAL 2.50 17-29 28/11A2,500,000 2,482,250.00 0.93%EURSPAIN 0.40 17-22 30/04A1,200,000 1,208,760.00 0.46%EURTELEFONICA EMISIONES 5.597 12-20 12/03A1,300,000 1,604,548.99 0.61%GBP
INTRUM JUSTITIA AB 2.75 17-22 15/07S1,000,000 1,007,980.00 0.38%EURSweden 1,978,751.20 0.75%
VOLVO CAR AB 2.00 17-25 24/01A960,000 970,771.20 0.37%EUR
ALLIANZ FINANCE 0.875 17-27 06/12A1,500,000 1,478,565.00 0.57%EURThe Netherlands 8,790,353.50 3.33%
BRENNTAG FINANCE 1.125 17-25 27/09A1,400,000 1,391,782.00 0.53%EURENEL FINANCE INTL 3.50 17-28 06/04S1,500,000 1,224,977.07 0.46%USDGREENKO DUTCH BV 5.25 17-24 24/07S200,000 169,420.50 0.06%USDIBERDROLA SA 2.50 14-22 24/10A300,000 330,354.00 0.12%EURING GROEP 1.375 17-28 11/01A1,200,000 1,194,984.00 0.45%EURMARFRIG HOLDINGS REGS 6.875 14-19 24/06S1,200,000 1,031,331.61 0.39%USDPETROBRAS GLOBAL F 6.125 17-22 17/01S800,000 709,120.32 0.27%USDRABOBANK EMTN 6.875 10-20 19/03A1,000,000 1,152,040.00 0.44%EURSCAHEFFLER FIN REGS 3.25 15-25 15/05S100,000 107,779.00 0.04%EUR
COCA COLA ICE 4.215 17-24 19/09S1,000,000 847,586.09 0.32%USDTurkey 1,593,851.42 0.60%
TURKIYE SINAI KALK 4.875 16-21 18/05S900,000 746,265.33 0.28%USD
MIN FIN UKRAINE REGS 7.75 15-23 01/09S500,000 444,029.85 0.17%USDUkraine 690,133.41 0.26%
UKRAINE GOVT 7.375 17-32 25/09S300,000 246,103.56 0.09%USD
BARCLAYS BANK SUB 6.625 11-22 30/03A1,000,000 1,228,630.00 0.46%EURUnited Kingdom 12,350,143.12 4.67%
BP CAPITAL MARKETS 1.768 17-19 19/03S600,000 497,335.11 0.19%USDCASA LO REGS S19 4.125 17-27 10/01S1,000,000 867,314.26 0.33%USDCREDIT AGRICOLE LDN 4.125 17-27 10/01S300,000 260,126.74 0.10%USDDS SMITH 1.375 17-24 26/07A700,000 703,836.00 0.27%EURDS SMITH 2.875 17-29 26/07A700,000 787,749.51 0.30%GBPHSBC HLDGS 0.875 16-24 06/09A800,000 803,456.00 0.30%EURHSBC HLDGS 3.60 16-23 25/05S300,000 257,785.38 0.10%USDINEOS FINANCE 2.125 17-25 15/11S1,320,000 1,313,254.80 0.49%EURLLOYDS BANKING GROUP 2.25 17-24 16/10A450,000 512,877.16 0.19%GBPNAT GRID GAS FIN 0.625 16-24 22/09A1,300,000 1,274,078.00 0.48%EURNATIONWIDE BUILDING 4.125 13-23 20/03A200,000 201,866.00 0.08%EURNATL WESTMINSTER BANK 6.50 98-21 07/09A1,000,000 1,312,511.98 0.50%GBPROYAL BK OF SCOTL. 7.648 00-XX 31/12S100,000 109,036.11 0.04%USDTESCO PROPERTY FIN 2 6.0517 09-39 13/10Q176,149 240,457.57 0.09%GBPTESCO PTY REGS 7.622 09-39 13/07Q541,122 838,704.39 0.32%GBP
Securities portfolio as at 31/12/17EURExpressed in
NEF - Ethical Total Return Bond (previously Absolute Return Bond)
Quantity /Nominal Denomination Quotation
currency% of net
assetsMarket value

The accompanying notes form an integral part of these financial statements
130Page
TITAN GLOBAL FINANCE 2.375 17-24 16/11S670,000 670,067.00 0.25%EURVIRGIN MEDIA FIN 5.125 15-25 15/01S400,000 471,057.11 0.18%GBP
ABBOTT LABORATORIE 3.75 16-26 30/03M1,500,000 1,286,150.25 0.49%USDUnited States of America 93,069,572.08 35.22%
AES CORP 5.125 17-27 01/09S800,000 703,176.85 0.27%USDAMC ENTERT HLDG 6.125 17-27 15/05S850,000 704,742.35 0.27%USDAMERICAN INTL GROUP 3 5.00 06-23 26/04A1,200,000 1,561,583.80 0.59%GBPAMERICAN TOWER 3.50 13-23 31/03S1,300,000 1,108,929.38 0.42%USDANDEAVOR 3.8 17-28 01/04S650,000 543,223.97 0.21%USDANDEAVOR LOGIS LP 4.25 17-27 01/12S1,000,000 845,284.75 0.32%USDAPPLE 3.00 17-2713/11S2,000,000 1,662,903.36 0.63%USDAT T 2.35 17-29 04/09A400,000 404,852.00 0.15%EURAT&T INC 3.8 17-24 01/03S1,200,000 1,025,788.38 0.39%USDAT&T INC 3.90 17-27 14/08S1,000,000 840,306.85 0.32%USDAVANGRID INC 3.15 17-24 01/12S900,000 748,268.99 0.28%USDBAKER HUGHES 144A 3.337 17-27 15/12S1,000,000 834,261.66 0.32%USDBANK OF AMERICA 3.30 13-23 11/01A1,300,000 1,110,696.24 0.42%USDBEACON ROOFING SUPP 4.875 17-25 01/11S910,000 765,415.24 0.29%USDBECTON DICKINSON CO 3.70 17-37 06/06S1,600,000 1,345,838.41 0.51%USDBLUE CUBE SPINCO 9.75 16-23 15/10S1,200,000 1,189,984.15 0.45%USDCELGENE 3.45 17-27 15/11S1,200,000 1,001,844.41 0.38%USDCHARTER COM OPER 4.20 17-28 15/03S1,000,000 831,476.70 0.31%USDCITIGROUP 4.50 11-22 14/01S300,000 266,460.43 0.10%USDCITIGROUP EMTN 2.375 14-24 22/05A1,200,000 1,316,364.00 0.50%EURCOMCAST 3.15 16-26 01/03S1,400,000 1,177,153.34 0.45%USDCONCHO RESOURCES 4.375 16-25 15/01S200,000 173,799.71 0.07%USDCONCHO RESOURCES INC 3.75 17-27 01/10S700,000 592,423.08 0.22%USDCS NY MTN SUB TR.6 4.375 10-20 05/08S300,000 262,087.89 0.10%USDCSVC ACQUISITION CORP 7.75 17-25 15/06S850,000 692,799.97 0.26%USDDIAMONBACK ENG 5.375 17-25 31/05S500,000 430,592.84 0.16%USDDIAMONDBACK ENERGY 4.75 17-24 01/11S200,000 168,605.02 0.06%USDDISCOVERY COMM 3.95 17-28 20/03S1,075,000 891,291.80 0.34%USDDISCOVERY COMM. 2.50 17-24 20/09A625,000 698,860.50 0.26%GBPENLINK MIDSTREAM PART 4.85 16-26 15/07S1,450,000 1,267,036.19 0.48%USDEQUINIX 5.375 13-23 01/04S250,000 215,788.38 0.08%USDEQUINIX INC 2.875 17-22 01/10S750,000 758,625.00 0.29%EURFXI HOLDINGS INC 7.875 17-24 01/11S840,000 698,657.55 0.26%USDGOLDMAN SACHS GROUP 4.75 06-21 12/10A1,200,000 1,380,456.00 0.52%EURHESS 4.30 16-27 01/04S1,000,000 838,439.09 0.32%USDIMS HEALTH REGS 3.25 17-25 15/03S900,000 931,041.00 0.35%EURJPMORGAN CHASE 4.35 11-21 15/08S1,400,000 1,239,349.62 0.47%USDKRAFT HEINZ FOODS 3.00 16-26 01/06S1,000,000 803,427.00 0.30%USDMETLIFE INC 3.00 15-25 01/03S300,000 250,771.29 0.09%USDMETROPOLITAN LIFE 144A3.00 12 23 10/01S300,000 252,229.64 0.10%USDMORGAN STANLEY 1.00 16-22 02/12A1,200,000 1,225,872.00 0.46%EURMOSAIC 4.05 17-27 15/11S1,400,000 1,173,277.75 0.44%USDPROLOGIS 2.25 17-29 30/06A1,000,000 1,105,677.22 0.42%GBPQEP RESOURCES 5.625 17-26 01/03S800,000 677,121.66 0.26%USDROCHE HOLDING 144A 3.35 14-24 30/09S1,300,000 1,120,787.96 0.42%USDTERRAFORM GLOBAL 9.75 15-22 15/08S700,000 648,607.52 0.25%USDTHE BRINKS CO 4.625 17-27 15/10S870,000 715,448.60 0.27%USDTSY INFL IX N/B 0.375 17-27 15/07S11,900,000 9,958,115.34 3.78%USDTYSON FOODS 2.25 17-21 23/08S1,225,000 1,009,417.16 0.38%USDUBS AG STAMFORD CT 2.375 14-19 14/08S300,000 250,491.12 0.09%USDUS T NOTE 1.50 16-23 28/02S21,000,000 16,900,092.77 6.40%USDUSA T NOTES 2.25 14-24 15/11S11,500,000 9,540,982.24 3.61%USDUSA TREASURY BONDS 1.75 16-21 30/11S11,000,000 9,046,618.39 3.42%USDUSA TREASURY NOTES 3.875 08-18 15/05S4,000,000 3,365,504.88 1.27%USDVANTIV LLC/ISS CORP 4.375 17-25 15/11S450,000 379,909.11 0.14%USDVERIZON COMMUNICATION 2.875 17-38 15/01A1,400,000 1,421,294.00 0.54%EURWESTERN GAS PARTNERS 3.95 15-25 01/06S850,000 709,367.28 0.27%USD
KBC GROUP SUB FL.R 14-24 25/11A1,200,000 1,247,496.00 0.47%EUR
Floating rate bonds 23,569,196.46 8.92%
Belgium 1,247,496.00 0.47%
HUANENG HONG KONG FL.R 17-XX 30.10S875,000 715,430.88 0.27%USDBritish Virgin Islands 1,310,253.70 0.50%
Securities portfolio as at 31/12/17EURExpressed in
NEF - Ethical Total Return Bond (previously Absolute Return Bond)
Quantity /Nominal Denomination Quotation
currency% of net
assetsMarket value

The accompanying notes form an integral part of these financial statements
131Page
SINO-OCEAN LAND TR III FL.R 17-XX XX/XXS725,000 594,822.82 0.23%USD
BANK OF NOVA SCOTIA FL.R 17-XX 12/04S750,000 622,131.66 0.24%USDCanada 622,131.66 0.24%
SMFG PREF REGS SUB FL.R 08-XX 25/01A930,000 1,686,783.93 0.64%GBPCayman Islands 1,686,783.93 0.64%
ORSTED FL.R 13-XX 26/06A200,000 244,406.00 0.09%EURDenmark 753,476.00 0.29%
ORSTED FL.R 17-29 26/11A500,000 509,070.00 0.20%EUR
AXA SUB FL.R 14-XX 08/10A900,000 1,022,166.00 0.39%EURFrance 5,700,997.39 2.16%
CREDIT AGRICOLE SUB. FL.R 15-XX 13/01A600,000 672,576.00 0.25%EURDANONE SA EMTN FL.R 17-XX 23/06A800,000 804,600.00 0.30%EURELECT.DE FRANCE FL.R 13-XX 29/01S1,000,000 1,207,691.35 0.46%GBPEUROFINS SCIENTIFIC FL.R 17-XX XX/XXA725,000 730,314.25 0.28%EURORANGE EMTN SUB FL.R 14-XX 01/10A800,000 1,010,822.45 0.38%GBPORANGE SA FL.R 14-XX 07/02A200,000 252,827.34 0.10%GBP
ASSICURAZ GENERALI FL.R 15-47 27/10A700,000 841,841.00 0.31%EURItaly 1,334,016.00 0.50%
WIND TRE SPA FL.R 17-24 20/01Q500,000 492,175.00 0.19%EUR
HSBC BK REG S SUB FL.R 03-XX 05/11A200,000 297,945.29 0.11%GBPJersey Island 297,945.29 0.11%
BANCO DE SABADELL FL.R 17-XX XX.XXQ600,000 614,850.00 0.23%EURSpain 614,850.00 0.23%
ABN AMRO BANK FL.R 17-28 27/03S1,400,000 1,202,823.31 0.46%USDThe Netherlands 5,286,222.44 2.00%
AT SECURITIES BV FL.R 17-XX XX/XXA500,000 423,188.53 0.16%USDING BANK EMTN FL.R 08-23 29/05A200,000 205,082.00 0.08%EURKPN FL.R 13-73 14/03A900,000 1,115,457.10 0.42%GBPRABOBANK EMTN FL.R 14-26 26/05A1,300,000 1,378,221.00 0.52%EURTELEFONICA EUROPA SUB FL.R 13-XX 26/11A600,000 750,434.50 0.28%GBPTELEFONICA EUROPA SUB FL.R 16-XX 15/09A200,000 211,016.00 0.08%EUR
AVIVA PLC SUB FL.R 03-XX 29/09A200,000 259,646.31 0.10%GBPUnited Kingdom 4,715,024.05 1.78%
BARCLAYS FL.R 17-28 07/02A700,000 697,578.00 0.26%EURBARCLAYS PLC FL.R 15-25 11/11U200,000 207,962.00 0.08%EURCYBG PLC FL.R 16-26 08/02S700,000 840,397.64 0.32%GBPLLOYDS TSB BANK EMTN FL.R 04-25 09/07A300,000 371,108.95 0.14%GBPSANTANDER UK GRP HDG FL.R 17-28 03/11S1,000,000 836,704.74 0.32%USDTSB BKG GROUP PLC FL.R 14-26 06/05S1,200,000 1,501,626.41 0.56%GBP
AUTOR.PARIS RHIN RHONE 1.50 17-33 17/01A1,600,000 1,565,488.00 0.59%EUR
Other transferable securities 16,961,301.56 6.42%
Bonds 13,805,012.25 5.22%
France 1,565,488.00 0.59%
INDIAN RAILWAY FINAN 3.835 17-27 13/12S1,700,000 1,427,104.14 0.54%USDIndia 1,427,104.14 0.54%
INTESA SANPAOLO SPA 0.875 17-22 27/06A300,000 303,954.00 0.11%EURItaly 303,954.00 0.11%
IBERDROLA FINANZAS 1.25 17-27 13/09A1,000,000 997,710.00 0.38%EURSpain 997,710.00 0.38%
GAS NAT FENOSA 0.875 17-25 15/05A1,600,000 1,581,376.00 0.60%EURThe Netherlands 1,581,376.00 0.60%
ABU DHABI OIL 4.60 17-47 02/11S1,325,000 1,139,380.68 0.43%USDUnited Arab Emirates 1,139,380.68 0.43%
HOUSING AND CARE TWY 3.288 17-49 08/11S1,000,000 1,179,615.20 0.45%GBPUnited Kingdom 2,568,684.55 0.97%
LIBERTY LIVING FINAN 3.375 17-29 28/11A1,200,000 1,389,069.35 0.52%GBP
EQUINIX 2.875 17-26 01/02S750,000 750,210.00 0.28%EURUnited States of America 4,221,314.88 1.60%
IRON MOUNTAIN 3.875 17-25 15/11S680,000 751,814.53 0.28%GBPNESTLE HOLDINGS 1.00 17-21 11/06A2,250,000 2,544,605.12 0.97%GBPTRONOX FINANCE LLC 7.5 15-22 15/03S200,000 174,685.23 0.07%USD
Securities portfolio as at 31/12/17EURExpressed in
NEF - Ethical Total Return Bond (previously Absolute Return Bond)
Quantity /Nominal Denomination Quotation
currency% of net
assetsMarket value

The accompanying notes form an integral part of these financial statements
132Page
NN GROUP NV FL.R 17-48 13/01A600,000 700,362.00 0.27%EUR
Floating rate bonds 2,368,506.77 0.90%
The Netherlands 1,397,772.00 0.53%
TELEFONICA EUROPE BV FL.R 17-XX XX/XXM700,000 697,410.00 0.26%EUR
HSBC HLDGS FL.R 17-26 13/11A600,000 679,711.02 0.26%GBPUnited Kingdom 970,734.77 0.37%
INVESTEC PLC FL.R 17-XX 05/12Q250,000 291,023.75 0.11%GBP
MOSAIC SOLAR LOANS 2.00 17-42 20/09M1,000,000 787,782.54 0.30%USD
Mortgage and asset backed securities 787,782.54 0.30%
United States of America 787,782.54 0.30%
Total securities portfolio 254,995,275.27 96.47%
Securities portfolio as at 31/12/17EURExpressed in
NEF - Ethical Total Return Bond (previously Absolute Return Bond)
Quantity /Nominal Denomination Quotation
currency% of net
assetsMarket value

The accompanying notes form an integral part of these financial statements
133Page
Statement of Operations and Changes in Net Assets from 01/01/17 to 31/12/17Expressed in EUR
NEF - Ethical Total Return Bond (previously Absolute Return Bond)
2,521,661.74Income2,397,480.38Net interest on bonds 2Note
8,763.56Bank interest on cash account 2Note3,912.72Securities lending income 2,8Note
111,505.08Interest on swaps
1,216,247.54Expenses702,510.22Management & advisory fees 5Note23,806.22Depositary & sub-depositary fees 7Note40,775.32Taxe d'abonnement 4Note32,289.32Administrative expenses
120.94Professional fees56,107.15Bank interest on overdrafts10,858.14Legal fees28,836.37Transaction fees 2Note1,147.74Publication & printing fees
10,101.00Bank charges163,866.79Correspondent bank fees 2Note67,413.04Interest on swaps78,415.29Other expenses
1,305,414.20Net income from investmentsNet realised profit / loss on:
-66,327.34- sales of investment securities 2Note-74,299.56- options 2Note
-417,969.99- forward foreign exchange contracts 2Note-836,151.65- financial futures 2Note628,369.41- swaps 2Note536,414.86- foreign exchange 2Note
1,075,449.93Net realised profitMovement in net unrealised appreciation /(depreciation) on:
-2,753,900.45- investments 2Note32,426.43- options 2Note
2,069,319.69- forward foreign exchange contracts 2Note107,001.43- financial futures 2Note
-613,496.64- swaps
-83,199.61Decrease in net assets as a result of operations-142,476.47Dividends paid 9Note
27,338,346.60Subscription capitalisation units204,822,021.32Subscription distribution units-14,847,435.13Redemption capitalisation units-23,364,110.94Redemption distribution units
193,723,145.77Increase in net assets
70,601,440.71Net assets at the beginning of the year
264,324,586.48Net assets at the end of the year

134Page
NEF- Global Property

NEF - Global Property
Manager’s Report
Page 135
Market update
2017 ushered in the slowing or ending of Central Banks’ quantitative easing programmes and the tightening of
monetary policy. Equity markets broadly performed well with limited volatility as consecutive record highs were posted
for the S&P 500, Dow Jones as well as the FTSE 100.
In 2017, the US raised interest rates three times as the Federal Reserve (Fed) increased interest rates to contain inflation
and ensure a sustainable rate of economic growth. It is expected that the there will be a further three interest rate rises in
2018 under the new Fed chairman Jerome Powell. The UK modestly raised interest rates in November 2017 although
the Bank of England is not expected to raise rates in 2018. The Bank of Japan continued its asset purchasing programme
including the purchase of J REITs. The Bank of Japan continues to fall short of its aim to increase inflation to its 2%
target and is therefore still operating an accommodative monetary policy.
Over 2017, the FTSE/EPRA NAREIT Developed Index rose 11% in US dollar terms. Over the year, Singapore
delivered the highest returns in US dollar terms, Japan the lowest in US dollar terms.
Over 2017, the US REIT market rose 4% in US dollar terms. Retail focused REITs were the worst performers over the
year. The trend of increasing e-commerce led to many retailers lowering their physical store presence. Over the year
industrial REITs were the strongest performers. Demand for US data centres increased and the sector has benefitted
from structural changes such as ‘last-mile delivery’. The UK REIT market rose 23% in US dollar terms.
UK office REITs were buoyed by the sale of trophy assets in central London and self-storage REITs rose owing to
increased demand from millennials and other structural drivers.
Investment strategy
We remain wedded to investing in companies that own high quality real estate in ‘Global Cities’. Our strategy does not
turn on comments or policy decisions from central banks, nor on employment numbers, GDP or PMI releases.
The investment case for a company is not swayed by macroeconomic data.
We focus on investing for the long-term in a small universe of companies which we believe display three fundamental
characteristics: skilled and aligned management teams; strong balance sheets with low gearing, and;located in areas
with structural growth drivers – demographics, technology and quality real estate. We believe companies with these
fundamentals can maintain pricing power and are able to generate capital growth.
There were a number of instances where market volatility provided a clear entry or exit point into a select few
companies over the year. One investment case, Deutsche Wohnen, is set out below.
Deutsche Wohnen
We opened a position in Deutsche Wohnen (DW) in late December 2016. DW is a German residential property
company with over 160,000 units across the most economically vibrant areas of Germany. The company mainly holds
assets in Berlin, the Rhineland and Dresden providing a link to the underlying residential real estate markets.
We purchased DW on valuation grounds as it offered an attractive yield.
More people rent their home in Germany than any other European country, and the density of renters is especially high
in cities. DW’s exposure to Germany’s major cities gives it pricing power through limited supply, strength of product,
as well as benefitting from regular rental value increases.
DW’s value-enhancing strategy is based on high levels of investment within its portfolio. DW aims to reduce
obsolescence through actively managing its units as well as focusing on community aspects around its buildings.
Its management team is highly experienced and they employ specialist real estate operators to manage its assets.
Its portfolio contains highly sought after, early 20th century buildings, where tenant retention is high. These buildings
are managed in accordance with tenant demands, commensurate with neighbourliness as well as a sense of community.
This has created very high levels of tenant demand for these assets.
Annual Review – 2017
The overweight position on average of around 1.75% relative to the FTSE/EPRA NAREIT Developed index
contributed positively to portfolio returns in 2017.
Performance Attribution
The main positive contributors to performance within the portfolio relative to the FTSE EPRA NAREIT Developed
Index were stocks held in the US, Europe (ex-UK) and the UK. The biggest detractors from the portfolio’s performance
were stocks held in Japan.

NEF - Global Property
Manager’s Report (continued)
Page 136
Top performers:
- In the US, the best performing sector was Industrial REITs. The portfolio’s biggest contributor to performance in this
sector was an overweight position to Rexford Industrial Realty. The portfolio held an average of 2.4% overweight
position throughout the year.
- In the UK, the best performing sector was Self-Storage REITs. The portfolio’s biggest contributor to performance in
this sector was an overweight position to Big Yellow Group. The portfolio held an average of 1.5% overweight position
throughout the year.
- The portfolio holds a handful of stocks in Spain, Sweden and Norway. Overweight positions to all these markets
positively contributed to performance in US dollar terms.
Bottom performers:
- Japanese REITs were the worst performers over 2017, falling 2.0%.Overweight positions in Nomura and Mitsubishi
detracted from the portfolio’s performance
Outlook
The outlook for 2018 signals the possible return of political risk as well as reflation. We see the low inflation-strong
growth environment being replaced by a more conventional reflation environment coupled with rising interest rates.
Growth is expected to continue, but central banks are likely to be more watchful.
Quantitative easing is expected to be curtailed as central banks maintain or reduce the size of their balance sheets. The
Bank of Japan however may still continue with their asset purchasing programme to stimulate economic growth.
We see reasons for optimism for the markets in which the portfolio invests. Global cities have all the ingredients to
sustain growth: a broad economy; low supply; good infrastructure; and excellent higher education.

The accompanying notes form an integral part of these financial statements
137Page
70,226,756.43Assets66,806,935.78Securities portfolio at market value 2Note65,514,954.54Cost price1,291,981.24Unrealised profit on the securities portfolio2,541,789.32Cash at banks and liquidities
18,020.86Subscribers receivable230,001.94Dividends receivable624,403.33Unrealised net appreciation on forward foreign exchange contracts 2Note
5,605.20Other assets
1,208,047.65Liabilities940,000.00Bank overdrafts127,849.57Brokers payable
5,949.72Taxe d'abonnement payable 4Note29,526.76Redemption payable88,073.61Accrued management & advisory fees 5Note2,059.70Accrued depositary & sub-depositary fees 7Note1,730.83Accrued administrative expenses
12,857.46Other liabilities
69,018,708.78Net asset value
Financial Statements as at 31/12/17
Expressed in EUR
Statement of Net Assets as at 31/12/17
NEF - Global Property
Global Property - Category RCapitalisation units 5,232,602.864 1,295,110.902 1,289,283.680 5,238,430.086
Global Property - Category ICapitalisation units 3,283,171.581 1,678,506.665 1,901,021.915 3,060,656.331
Changes in number of units outstanding from 01/01/17 to 31/12/17
Units issued Units redeemed Units outstandingas at 31/12/17
Units outstandingas at 01/01/17
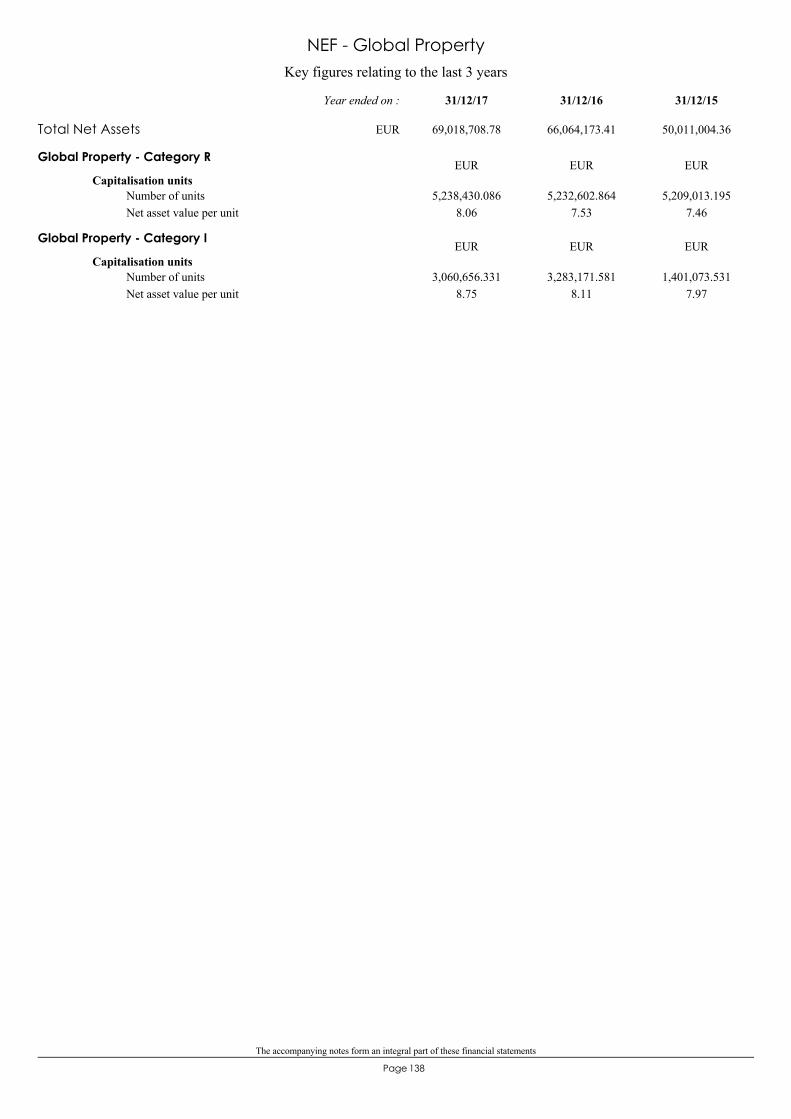
The accompanying notes form an integral part of these financial statements
138Page
Key figures relating to the last 3 years
NEF - Global Property
Global Property - Category R
Capitalisation units
8.065,238,430.086 5,232,602.864
7.535,209,013.195
7.46Number of unitsNet asset value per unit
EUR EUR EUR
Global Property - Category I
Capitalisation units
8.753,060,656.331 3,283,171.581
8.111,401,073.531
7.97Number of unitsNet asset value per unit
EUR EUR EUR
Total Net Assets 69,018,708.78 66,064,173.41 50,011,004.36
31/12/1531/12/1631/12/17Year ended on :
EUR

The accompanying notes form an integral part of these financial statements
139Page
GOODMAN GROUP - STAPLED SECURITY258,459 1,423,747.00 2.06%AUD
Transferable securities admitted to an official stock exchange listing and/or dealt inon another regulated market 66,806,935.78 96.80%
Shares 66,806,935.78 96.80%
Australia 3,393,539.86 4.92%
MIRVAC GROUP STAPLED SECURITIES1,052,305 1,614,017.39 2.34%AUDTRANSURBAN GROUP43,889 355,775.47 0.52%AUD
ALLIED PROPERTIES REAL ESTATE28,695 802,902.85 1.16%CADCanada 2,141,115.62 3.10%
IBI GROUP INC56,442 305,872.93 0.44%CADRIOCAN REIT (UNITS)63,733 1,032,339.84 1.50%CAD
GDS HOLDINGS -A- ADR REP 8 SHS-A-26,073 489,806.30 0.71%USDCayman Islands 489,806.30 0.71%
GECINA SA REG SHS10,700 1,646,730.00 2.38%EURFrance 2,831,970.00 4.10%
UNIBAIL-RODAMCO SE5,644 1,185,240.00 1.72%EUR
DEUTSCHE WOHNEN AG34,461 1,256,448.06 1.82%EURGermany 1,256,448.06 1.82%
SUN HUNG KAI PROPERTIES LTD170,268 2,398,474.55 3.47%HKDHong Kong 5,816,983.91 8.43%
SWIRE PROPERTIES LTD500,400 1,357,817.67 1.97%HKDTHE LINK REIT UNITS263,000 2,060,691.69 2.99%HKD
GLP J-REIT414 374,742.70 0.54%JPYJapan 5,834,019.46 8.45%
JP REAL ESTATE INVESTMENT169 671,381.90 0.97%JPYMITSUBISHI ESTATE94,000 1,368,084.95 1.99%JPYMITSUI FUDOSAN CO LTD71,400 1,338,716.86 1.94%JPYNOMURA REAL ESTATE MASTER FUND641 665,893.67 0.96%JPYPROLOGIS REIT427 755,581.05 1.09%JPYUNITED URBAN INVESTMENT CORP548 659,618.33 0.96%JPY
BANAMEX256,219 331,465.17 0.48%MXNMexico 331,465.17 0.48%
ENTRA (UNITARY 144A REGS)65,841 816,296.45 1.18%NOKNorway 816,296.45 1.18%
INMOBILIARIA COLONIAL SA105,749 875,918.97 1.27%EURSpain 875,918.97 1.27%
FABEGE AB58,040 1,029,458.54 1.49%SEKSweden 1,029,458.54 1.49%
INTERXION43,096 2,117,608.00 3.07%USDThe Netherlands 2,117,608.00 3.07%
BIG YELLOW GROUP PLC116,175 1,138,534.12 1.65%GBPUnited Kingdom 4,369,824.39 6.33%
GREAT PORT EST REIT REG223,332 1,733,080.28 2.51%GBPUNITE GROUP PLC75,611 686,032.43 0.99%GBPWORKSPACE GROUP PLC R.E.I.T.71,915 812,177.56 1.18%GBP
ALEXANDRIA REAL ESTATE18,710 2,037,304.18 2.94%USDUnited States of America 35,502,481.05 51.45%
CAMDEN PROPERTY SBI14,494 1,112,580.37 1.61%USDCUBESMART62,084 1,497,097.71 2.17%USDDIAMONDROCK HOSPITALITY72,937 686,616.13 0.99%USDDUKE REALTY76,220 1,729,297.26 2.51%USDEMPIRE STATE REALTY TRUST INC97,376 1,666,913.43 2.42%USDEQUITY LIFESTYLE7,686 570,505.90 0.83%USDEXTRA SPACE STORAGE INC8,604 627,382.47 0.91%USDFED RLTY INV TR / SHS.OF BENEF.INTEREST15,768 1,746,141.98 2.53%USDHCP74,782 1,626,210.76 2.36%USDHEALTHCARE REALTY TRUST80,069 2,144,431.15 3.10%USDHOWARD HUGHES17,816 1,950,059.47 2.83%USDHUDSON PACIFIC PROPERTIES INC50,660 1,446,764.78 2.10%USDINVITATION HOMS REGISTERED53,967 1,060,620.52 1.54%USDPEBBLEBROOK - SHS OF BENEFIT INTEREST27,674 857,702.48 1.24%USDQTS REALTY -A-44,618 2,014,934.45 2.92%USDRETAIL OPPORTUNITY INVESTMENT CORP94,588 1,573,443.34 2.28%USDREXFORD INDUSTRIAL REALTY TRUST UNITS74,096 1,801,583.72 2.61%USD
Securities portfolio as at 31/12/17EURExpressed in
NEF - Global Property
Quantity /Nominal Denomination Quotation
currency% of net
assetsMarket value

The accompanying notes form an integral part of these financial statements
140Page
SIMON PROPERTY GROUP - REGISTERED1,914 274,085.18 0.40%USDSUN COMMUNITIES18,615 1,440,089.80 2.09%USDSUNSTONE HOTEL INVESTORS INC73,877 1,018,249.65 1.48%USDTERRENO REALTY44,218 1,292,656.62 1.87%USDTIER REIT39,075 664,336.90 0.96%USDUDR39,991 1,284,460.37 1.86%USDURBAN EDGE PROP WI72,024 1,530,802.77 2.22%USDVORNADO REALTY TRUST SHS OF BENEF.INT17,045 1,111,129.91 1.61%USDWELLTOWER INC13,862 737,079.75 1.07%USD
Total securities portfolio 66,806,935.78 96.80%
Securities portfolio as at 31/12/17EURExpressed in
NEF - Global Property
Quantity /Nominal Denomination Quotation
currency% of net
assetsMarket value

The accompanying notes form an integral part of these financial statements
141Page
Statement of Operations and Changes in Net Assets from 01/01/17 to 31/12/17Expressed in EUR
NEF - Global Property
1,729,296.75Income1,716,017.84Net dividends 2Note
1,208.80Bank interest on cash account 2Note12,070.11Securities lending income 2,8Note
1,414,378.59Expenses1,021,438.90Management & advisory fees 5Note
23,969.20Depositary & sub-depositary fees 7Note22,811.21Taxe d'abonnement 4Note22,136.72Administrative expenses
650.50Professional fees6,600.08Bank interest on overdrafts2,947.51Legal fees
120,370.21Transaction fees 2Note1,085.43Publication & printing fees3,798.00Bank charges
147,935.97Correspondent bank fees 2Note40,634.86Other expenses
314,918.16Net income from investmentsNet realised profit / loss on:
2,147,804.56- sales of investment securities 2Note4,157,571.75- forward foreign exchange contracts 2Note-537,361.98- foreign exchange 2Note
6,082,932.49Net realised profitMovement in net unrealised appreciation /(depreciation) on:
-2,578,977.32- investments 2Note1,324,297.89- forward foreign exchange contracts 2Note
4,828,253.06Increase in net assets as a result of operations24,028,830.15Subscription capitalisation units
-25,902,547.84Redemption capitalisation units
2,954,535.37Increase in net assets
66,064,173.41Net assets at the beginning of the year
69,018,708.78Net assets at the end of the year

142Page
NEF- Ethical Balanced Dynamic (previously Ethical
Balanced)

NEF – Ethical Balanced Dynamic (previously Ethical Balanced )
Manager’s Report
Page 143
Annual Comment - 2017
Market Review Politics and central bank policy greatly impacted asset performance in 2017 in a backdrop of robust global economic growth and low inflation. Geopolitical tensions between US and North Korea dominated the global scene, while Europe was stuck with Brexit negotiations, political elections in France and Germany and Catalonia independence aspirations. The U.S. Federal Reserve released 3 rate hikes during the year, as widely expected, and the $1.5 trillion tax bill to cut corporate and personal taxes was eventually approved by the U.S. Senate in late December, providing a further boost to domestic equity markets. The MSCI World euro hedged index rose +16.80% in 2017, with the S&P index climbing +19.42% and the EuroStoxx 50 index gaining +6.49%. The J.P. Morgan GBI Global Bond index unhedged in euro posted a negative annual performance (-6.16%). Portfolio Activity During the year the fund implemented a balanced strategy, consisting of an equity strategy (swinging between 28% and 35% exposure during the year), a fixed income strategy (with a duration risk between 2 and 3 years) and a forex overlay (with an overall exposure moving between 20% and 30%). The fund started the year with a 35% equity weight, an overall duration around 3 years and a forex exposure of around 30%, mainly made by US dollar (21%), Japanese Yen (3%), Swiss Franc (2%) and British Pound (1.5%). The exposure to US dollar has been decreased in the first months of the year and brought to around 11%. Exposure to British Pound has been kept low and eventually decreased to 0.5%, while exposure to Japanese Yen has been slightly increased to 5.5% during the year, mainly for risk hedging purposes. The management of the equity component was mainly driven by a bottom-up approach aiming at picking investment opportunities, above all in the Euro Area and US markets, benefiting at the same time of the rally of global equity markets. As far as the bond component is concerned, the fund started the year with a short position on French Government bonds, in order to hedge the risks coming from political elections in France. The position was gradually closed in the first months of the year as risks vanished. On the contrary a short position on German Government bonds has been maintained for the whole year, to protect the portfolio from risk of rate increase. The exposure to peripheral bonds (Spain and above all Italy) was positive along the whole year, with a swinging exposure depending on the risks perceived by the market around Catalonia independence aims and Italy political uncertainty. Exposure to corporate and financial bonds was increased during the year, mainly through purchases in the primary market in order to benefit of the wider spread that new issues usually offer. Outlook 2018 A backdrop of consolidating global growth, subdued inflation and gradually normalizing central bank monetary policies should, in our view, drive a smooth transition from a reflationary phase into a late phase of the market cycle. An anticipated revival in reflationary fiscal policies, global trade and capex activity can also provide further support to markets, particularly equities, in 2018. On the other hand, cross-asset valuations appear stretched and investor complacency remains high despite of persistent geopolitical risks. An unexpected pick-up in inflationary pressures prompting aggressive policy action from central banks can cause volatility to spike suddenly, especially in rates markets.The fund’s equity strategy will continue to look for investment opportunities on a global perspective, with a particular focus on the Euro Area and US. The fixed income strategy will keep on searching for yield by investing mainly in international Investment Grade corporate and financial bonds and in peripheral euro countries, while implementing at the same time strategies to protect the portfolio from rate increase risk.

The accompanying notes form an integral part of these financial statements
144Page
206,409,465.45Assets180,707,123.22Securities portfolio at market value 2Note174,458,841.13Cost price
6,248,282.09Unrealised profit on the securities portfolio23,245,158.85Cash at banks and liquidities
803,913.04Interest receivable243,850.51Subscribers receivable43,535.63Dividends receivable
1,173,037.49Unrealised net appreciation on forward foreign exchange contracts 2Note192,846.71Unrealised net appreciation on financial futures 2Note
600,464.74Liabilities31,611.53Taxe d'abonnement payable 4Note
283,045.72Redemption payable227,849.37Accrued management & advisory fees 5Note
4,450.72Accrued depositary & sub-depositary fees 7Note5,195.39Accrued administrative expenses2,031.89Accrued professional fees
46,280.12Other liabilities
205,809,000.71Net asset value
Financial Statements as at 31/12/17
Expressed in EUR
Statement of Net Assets as at 31/12/17
NEF - Ethical Balanced Dynamic (previously Ethical Balanced)
Ethical Balanced Dynamic (previouslyEthical Balanced) - Category RCapitalisation units 14,668,877.030 7,003,070.497 3,247,724.381 18,424,223.146
Ethical Balanced Dynamic (previouslyEthical Balanced) - Category ICapitalisation units 5,804,503.221 1,017,370.043 6,075,754.793 746,118.471
Ethical Balanced Dynamic (previouslyEthical Balanced) - Category DDistribution units 0.000 1,106,909.924 71,268.048 1,035,641.876
Ethical Balanced Dynamic( previouslyEthical Balanced) - Category CCapitalisation units 0.000 24,423.793 9,737.098 14,686.695
Changes in number of units outstanding from 01/01/17 to 31/12/17
Units issued Units redeemed Units outstandingas at 31/12/17
Units outstandingas at 01/01/17
The accompanying notes form an integral part of these financial statements
145Page
Key figures relating to the last 3 years
NEF - Ethical Balanced Dynamic (previously Ethical Balanced)
Ethical Balanced Dynamic (previously Ethical Balanced) -Category R
Capitalisation units
10.1718,424,223.146 14,668,877.030
10.064,143,350.159
9.98Number of unitsNet asset value per unit
EUR EUR EUR
Ethical Balanced Dynamic (previously Ethical Balanced) -Category I
Capitalisation units
10.40746,118.471 5,804,503.221
10.202,762,703.556
10.02Number of unitsNet asset value per unit
EUR EUR EUR
Ethical Balanced Dynamic (previously Ethical Balanced) -Category D
Distribution units
10.170.00
1,035,641.876 0.0000.000.00
0.0000.000.00
Number of unitsNet asset value per unitDividend per unit
EUR EUR EUR
Ethical Balanced Dynamic( previously Ethical Balanced) -Category C
Capitalisation units
10.2114,686.695 0.000
0.000.0000.00
Number of unitsNet asset value per unit
EUR EUR EUR
Total Net Assets 205,809,000.71 206,758,713.70 69,037,136.05
31/12/1531/12/1631/12/17Year ended on :
EUR

The accompanying notes form an integral part of these financial statements
146Page
KBC GROUPE SA35,098 2,495,818.78 1.21%EUR
Transferable securities admitted to an official stock exchange listing and/or dealt inon another regulated market 155,462,560.69 75.54%
Shares 59,423,012.83 28.87%
Belgium 2,495,818.78 1.21%
SCHLUMBERGER LTD36,000 2,020,353.10 0.98%USDCuraçao 2,020,353.10 0.98%
DANONE34,592 2,419,710.40 1.18%EURFrance 7,420,911.03 3.61%
KERING6,108 2,400,444.00 1.17%EURNATIXIS SA394,293 2,600,756.63 1.26%EUR
ADIDAS NAMEN AKT14,346 2,397,933.90 1.17%EURGermany 12,048,619.04 5.85%
ALLIANZ SE REG SHS13,291 2,545,226.50 1.23%EURBASF - NAMEN AKT23,946 2,196,806.04 1.07%EURBEIERSDORF AG25,936 2,539,134.40 1.23%EURSAP AG25,356 2,369,518.20 1.15%EUR
KERRY GROUP -A-31,458 2,941,323.00 1.43%EURIreland 2,941,323.00 1.43%
INTESA SANPAOLO SPA688,857 1,908,133.89 0.93%EURItaly 1,908,133.89 0.93%
INDITEX SHARE FROM SPLIT65,287 1,896,260.92 0.92%EURSpain 1,896,260.92 0.92%
ING GROEP155,275 2,379,589.38 1.16%EURThe Netherlands 2,379,589.38 1.16%
REED ELSEVIER PLC124,786 2,444,689.39 1.19%GBPUnited Kingdom 2,444,689.39 1.19%
ALPHABET -C-2,700 2,352,831.45 1.14%USDUnited States of America 23,867,314.30 11.59%
AMERCIAN WATER WORKS CO INC29,300 2,232,392.57 1.08%USDBIOMARIN PHARMACEUTICAL INC25,700 1,908,451.87 0.93%USDCARDINAL HEALTH INC37,200 1,898,104.60 0.92%USDECOLAB INC18,100 2,022,533.31 0.98%USDMASTERCARD INC -A-14,500 1,827,714.86 0.89%USDMONDELEZ INTERNATIONAL INC49,200 1,753,630.91 0.85%USDOCCIDENTAL PETROLEUM CORP39,900 2,447,563.29 1.19%USDPRICELINE GROUP1,600 2,315,443.04 1.13%USDROCKWELL AUTOMATION15,500 2,534,497.83 1.23%USDWATERS16,000 2,574,150.57 1.25%USD
ANZ BANKING GROUP 0.75 16-26 29/06A1,300,000 1,284,244.00 0.62%EUR
Bonds 84,327,834.65 40.98%
Australia 1,284,244.00 0.62%
KBC GROUP NV 0.75 17-22 01/03M1,700,000 1,720,485.00 0.84%EURBelgium 1,720,485.00 0.84%
MAGNA INTL 1.500 17-27 25/09A500,000 513,650.00 0.25%EURCanada 513,650.00 0.25%
AIR LIQUIDE REGS 2.50 16-26 27/09S1,300,000 1,035,945.62 0.50%USDFrance 8,611,688.62 4.18%
CAPGEMINI SE 0.50 16-21 09/11A200,000 201,794.00 0.10%EURCIE DE SAINT GOBAIN 1.375 17-27 14/06A1,300,000 1,314,209.00 0.64%EUREDF 1.00 16-26 13/10A800,000 785,736.00 0.38%EURORANGE EMTN 8.125 03-33 28/01A1,000,000 1,872,280.00 0.92%EURRCI BANQUE SA 0.75 17-22 12/01A1,250,000 1,261,750.00 0.61%EURRCI BANQUE SA 0.625 16-22 01/12500,000 503,770.00 0.24%EURSNCF 1.00 16-31 09/11A600,000 580,614.00 0.28%EURSNCF 2.25 17-47 20/12A1,000,000 1,055,590.00 0.51%EUR
CRH FINANCE GERMANY 1.75 14-21 16/07A500,000 524,440.00 0.25%EURGermany 524,440.00 0.25%
CRH FINANCE 1.375 16-28 18/10A400,000 394,200.00 0.20%EURIreland 900,339.00 0.44%
EATON CAPITAL UNLI 0.75 16-24 20/09A300,000 295,881.00 0.14%EURIRLANDE REGS 2.00 15-45 18/02A200,000 210,258.00 0.10%EUR
CASSA DEPOSITI PRESTI 1.50 15-25 09/04A300,000 294,906.00 0.14%EURItaly 35,292,732.21 17.16%
Securities portfolio as at 31/12/17EURExpressed in
NEF - Ethical Balanced Dynamic (previously Ethical Balanced)
Quantity /Nominal Denomination Quotation
currency% of net
assetsMarket value

The accompanying notes form an integral part of these financial statements
147Page
FERROVIE DELLO STATO 0.875 17-23 07/12A3,000,000 2,989,890.00 1.45%EURINTESA SANPAOLO SP 1.375 17-24 18/01A3,600,000 3,693,276.00 1.79%EURITALY BTP 3.75 14-24 01/09S7,000,000 8,066,870.00 3.93%EURITALY BTP 4.75 13-44 01/09S900,000 1,152,306.00 0.56%EURITALY BTP 5.00 09-25 01/03S1,000,000 1,239,570.00 0.60%EURITALY BTP 5.50 12-22 01/11S150,000 183,618.00 0.09%EURITALY BTP 5.75 02-33 01/02S1,000,000 1,393,890.00 0.68%EURITALY BTPS 4.50 10-26 01/03S1,500,000 1,820,310.00 0.88%EURITALY INFL INDEX 3.10 11-26 15/09S2,220,000 2,915,825.87 1.42%EURITALY INFL. INDEX 1.25 15-32 15/09S1,000,000 1,036,405.34 0.50%EURITALY TREASURY BONDS 2.20 17-27 01/06S5,000,000 5,105,700.00 2.49%EURITALY TREASURY BONDS 2.45 16-33 01/09S2,000,000 1,959,160.00 0.95%EURSNAM SPA 1.25 17-25 25/01A1,300,000 1,330,316.00 0.65%EURTERNA SPA 1.375 17-27 26/07A2,100,000 2,110,689.00 1.03%EUR
DELPHI AUTOMOTIVE PLC 1.50 15-25 10/03A300,000 308,631.00 0.15%EURJersey Island 308,631.00 0.15%
HEIDELBERGCEMENT F 1.5 17-27 14/06A750,000 752,857.50 0.37%EURLuxembourg 2,191,429.50 1.06%
HEIDELBERGCEMENT LUX 1.625 17-26 07/04A1,000,000 1,031,260.00 0.49%EURWHIRLPOOL FINANCE 1.25 06-16 15/06A400,000 407,312.00 0.20%EUR
ASIAN DEVELOPMENT 1.75 16-26 14/08S1,000,000 782,911.39 0.38%USDPhilippines 782,911.39 0.38%
IBERDROLA FIN 1.00 17-25 07/03A1,300,000 1,308,736.00 0.64%EURSpain 9,343,678.00 4.54%
IBERDROLA FINANZAS 1.00 16-24 07/03A600,000 610,914.00 0.30%EURSPANISH GOV'T 5.90 11-26 30/07A5,400,000 7,424,028.00 3.60%EUR
ASML HOLDING NV 1.625 16-27 28/05A500,000 519,495.00 0.25%EURThe Netherlands 5,944,997.20 2.89%
ASML HOLDING NV 3.375 13-23 19/09A300,000 348,186.00 0.17%EURENEL FIN INTL 1.00 17-24 16/09A1,200,000 1,219,128.00 0.59%EURIBERDROLA 0.375 16-25 15/09A900,000 860,013.00 0.42%EURINNOGY FINANCE 1.25 17-27 19/10A950,000 952,736.00 0.46%EURNEDER WATERSCHAPSB 2.375 16-26 24/03S1,000,000 813,699.20 0.40%USDNN GROUP NV 1.625 17-27 01/06A1,200,000 1,231,740.00 0.60%EUR
BARCLAYS PLC 0.625 17-23 14/11A1,720,000 1,705,397.20 0.83%EURUnited Kingdom 3,250,147.23 1.58%
RECKITT REGS 3.00 17-27 26/06S400,000 325,401.40 0.16%USDSTANDARD CHARTERED 2.10 16-19 19/08S1,000,000 827,048.63 0.40%USDVODAFONE GRP 0.50 16-24 30/01A400,000 392,300.00 0.19%EUR
AMGEN 2.25 16-23 19/08S1,000,000 808,702.53 0.39%USDUnited States of America 13,658,461.50 6.64%
AVERY DENNISON CORP 1.25 17-25 03/03A1,400,000 1,408,834.00 0.68%EURCRH AMERICA 5.75 10-21 15/01S500,000 451,886.25 0.22%USDKELLOGG 3.40 17-27 15/11S2,000,000 1,661,942.04 0.81%USDROCHE HOLDING INC 2.375 16-27 28/011,000,000 791,913.72 0.38%USDUS BANCORP 2.375 16-26 22/07S1,200,000 945,329.78 0.46%USDUS BANCORP 0.85 17-24 07/06A900,000 906,309.00 0.44%EURUSA INDEX 0.75 15-45 15/02S300,000 260,921.67 0.13%USDUSA T BOND 2.875 15-16 15/08S1,000,000 854,443.40 0.42%USDUSA T NOTES 2.50 16-46 15/05S1,500,000 1,188,855.87 0.58%USDUSA TREASURY NOTES 1.625 16-26 15/05S3,000,000 2,354,289.85 1.15%USDUSA TREASURY NOTES 2.00 15-25 15/08S2,000,000 1,623,917.39 0.79%USDVF CORP 0.625 16-23 20/09A400,000 401,116.00 0.19%EUR
AXA SUB FL.R 14-XX 08/10A200,000 227,148.00 0.12%EUR
Floating rate bonds 11,711,713.21 5.69%
France 339,760.00 0.17%
CNP ASSURANCES FL.R 14-XX 18/11A100,000 112,612.00 0.05%EUR
CCTS EU FL.R 14-22 15/06S1,000,000 1,009,490.00 0.49%EURItaly 7,447,527.50 3.61%
CCTS EU FL.R 16-24 15/02S2,000,000 2,013,860.00 0.98%EURINTESA SANPAOLO FL.R 15-20 15/06Q350,000 357,017.50 0.17%EURITALIE CCT FL.R 15-22 15/12S1,000,000 1,013,830.00 0.49%EURITALY FL.R. 16-23 15/07S1,000,000 1,008,730.00 0.49%EURITALY BTP FL.R 17-24 15/10S2,000,000 2,044,600.00 0.99%EUR
Securities portfolio as at 31/12/17EURExpressed in
NEF - Ethical Balanced Dynamic (previously Ethical Balanced)
Quantity /Nominal Denomination Quotation
currency% of net
assetsMarket value

The accompanying notes form an integral part of these financial statements
148Page
MONDELEZ INTL REGS FL.R 16-19 28/10Q1,000,000 836,255.00 0.41%USDThe Netherlands 836,255.00 0.41%
STANDARD CHARTERED FL.R 17-27 03/10A810,000 820,805.40 0.40%EURUnited Kingdom 820,805.40 0.40%
FORD MOTOR CREDIT FL.R 17-20 09/01Q1,200,000 1,008,967.36 0.49%USDUnited States of America 2,267,365.31 1.10%
KRAFT FOODS INC FL.R 17-22 10/08Q1,500,000 1,258,397.95 0.61%USD
ALIMENTATION COUCHE 3.55 17-27 26/07S400,000 333,091.27 0.16%USD
Other transferable securities 13,263,559.77 6.44%
Bonds 13,263,559.77 6.44%
Canada 333,091.27 0.16%
DANONE 144A 2.589 16-23 02/11S1,000,000 810,251.50 0.39%USDFrance 810,251.50 0.39%
CASSA DEPOSITI PRESTI 0.75 17-22 21/11A1,600,000 1,591,360.00 0.77%EURItaly 4,207,052.00 2.04%
INTESA SANPAOLO SPA 0.875 17-22 27/06A800,000 810,544.00 0.39%EURSNAM SPA 1.375 17-27 25/10A1,800,000 1,805,148.00 0.88%EUR
WHIRLPOOL FINANCE 1.10 17-27 09/11A3,000,000 2,939,910.00 1.43%EURLuxembourg 2,939,910.00 1.43%
ENAGAS FINANCIACIO 0.75 16-26 27/10S500,000 488,405.00 0.24%EURSpain 488,405.00 0.24%
GAS NAT FENOSA 0.875 17-25 15/05A2,000,000 1,976,720.00 0.96%EURThe Netherlands 1,976,720.00 0.96%
VODAFONE GROUP 1.50 17-27 24/07A2,000,000 2,002,440.00 0.97%EURUnited Kingdom 2,002,440.00 0.97%
KELLOGG CO 0.80 17-22 17/11A500,000 505,690.00 0.25%EURUnited States of America 505,690.00 0.25%
A ETF WL CARB -EUR-33,200 7,459,708.00 3.62%EUR
Shares/Units of UCITS/UCIS 11,981,002.76 5.82%
Shares/Units in investment funds 11,981,002.76 5.82%
France 7,459,708.00 3.62%
AMUNDI IND EQ GLO LOW CARBON-XE CAP78 4,521,294.76 2.20%EURLuxembourg 4,521,294.76 2.20%
Total securities portfolio 180,707,123.22 87.80%
Securities portfolio as at 31/12/17EURExpressed in
NEF - Ethical Balanced Dynamic (previously Ethical Balanced)
Quantity /Nominal Denomination Quotation
currency% of net
assetsMarket value

The accompanying notes form an integral part of these financial statements
149Page
Statement of Operations and Changes in Net Assets from 01/01/17 to 31/12/17Expressed in EUR
NEF - Ethical Balanced Dynamic (previously Ethical Balanced)
3,408,328.90Income932,804.83Net dividends 2Note
2,396,025.48Net interest on bonds 2Note13,239.90Bank interest on cash account 2Note66,144.46Securities lending income 2,8Note
114.23Other financial income
3,505,528.48Expenses2,542,202.88Management & advisory fees 5Note
53,249.20Depositary & sub-depositary fees 7Note89,876.16Taxe d'abonnement 4Note67,491.91Administrative expenses4,131.16Professional fees
84,938.49Bank interest on overdrafts20,661.94Legal fees61,869.56Transaction fees 2Note1,481.15Publication & printing fees1,026.00Bank charges
469,627.16Correspondent bank fees 2Note108,972.87Other expenses
-97,199.58Net loss from investmentsNet realised profit / loss on:
2,187,914.78- sales of investment securities 2Note-131,500.00- options 2Note364,481.43- forward foreign exchange contracts 2Note
-2,148,895.74- financial futures 2Note-3,056,816.47- foreign exchange 2Note
-2,882,015.58Net realised lossMovement in net unrealised appreciation /(depreciation) on:
2,817,041.69- investments 2Note2,406,564.38- forward foreign exchange contracts 2Note
443,592.98- financial futures 2Note
2,785,183.47Increase in net assets as a result of operations82,036,289.62Subscription capitalisation units11,224,962.34Subscription distribution units
-96,268,836.25Redemption capitalisation units-727,312.17Redemption distribution units
-949,712.99Decrease in net assets
206,758,713.70Net assets at the beginning of the year
205,809,000.71Net assets at the end of the year

150Page
NEF- Ethical Balanced Conservative

NEF - Ethical Balanced Conservative
Manager’s Report
Page 151
Anticipated growth in yields on bond markets failed to materialize US government bonds were buoyant during 2017. The Trump administration, the North Korea conflict and the Fed’s tightening of US monetary policy were key influential factors. The spotlight was primarily on the US government and its tax policy, which wasn’t implemented until the end of the year. At index level (JP Morgan Global Bond US index), the market as a whole rose by 2.5%. In the eurozone, too, economic data and extremely low inflation dictated events. In contrast to the Fed, however, the ECB retained its expansive monetary policy and will continue with its monthly bond purchases (albeit reduced by half) until September 2018. Elections in the eurozone had an unsettling effect for a short period. The economic situation improved considerably towards the end of the year. At index level (iBoxx Euro Sovereign Index), European government bonds ended the year 0.1% up. European corporate stocks and bonds from emerging markets were very much in demand. Risk premiums (spreads) narrowed considerably. Very good equity year The global equity markets posted significant price gains throughout 2017. Bolstered by the robust economy in all key economic regions, the MSCI World Index gained 16.3% in local currency. In the United States, the broad-based S&P 500 index rose 19.4%. The infrastructure measures and tax cuts announced by President Trump fired investors’ imaginations. Despite growing doubts, the stock markets thrived, largely on the back of positive business performances. The eurozone posted gains, but had to repeatedly accept setbacks. The strength of the euro, as well as turbulence in the European automotive sector and the North Korea conflict, temporarily weighed down on prices. Despite fluctuations, the EURO STOXX 50 index improved by 6.5% in total. In Japan, the NIKKEI 225 index increased by 19.1%, despite heavy price fluctuations in local currency. Stock markets in emerging currencies delivered a rock-solid performance, and the MSCI Emerging Markets index climbed by 27.8% in local currency. .

The accompanying notes form an integral part of these financial statements
152Page
80,715,074.24Assets75,214,208.19Securities portfolio at market value75,694,627.54Cost price
-480,419.35Unrealised loss on the securities portfolio5,085,453.67Cash at banks and liquidities
287,035.43Interest receivable124,519.47Subscribers receivable
1,637.50Dividends receivable2,219.98Other assets
120,701.65Liabilities9,568.58Taxe d'abonnement payable
59,374.40Redemption payable42,099.22Accrued management & advisory fees2,334.61Accrued depositary & sub-depositary fees 7Note1,961.86Accrued administrative expenses4,212.00Accrued professional fees1,150.98Other liabilities
80,594,372.59Net asset value
Financial Statements as at 31/12/17
Expressed in EUR
Statement of Net Assets as at 31/12/17
NEF - Ethical Balanced Conservative
Ethical Balanced Conservative RCapitalisation units 0.000 1,880,419.165 141,368.384 1,739,050.781
Ethical Balanced Conservative ICapitalisation units 0.000 8,015,217.177 2,507,914.534 5,507,302.643
Ethical Balanced Conservative DDistribution units 0.000 636,247.428 39,851.413 596,396.015
Ethical Balanced Conservative CCapitalisation units 0.000 282,788.500 11,124.270 271,664.230
Changes in number of units outstanding from 10/04/17 to 31/12/17
Units issued Units redeemed Units outstandingas at 31/12/17
Units outstandingas at 10/04/17

The accompanying notes form an integral part of these financial statements
153Page
Key figures relating to the last 3 years
NEF - Ethical Balanced Conservative
The sub-fund started its operations on 10 April 2017.
Ethical Balanced Conservative R
Capitalisation units
9.891,739,050.781 0.000
0.000.0000.00
Number of unitsNet asset value per unit
EUR EUR EUR
Ethical Balanced Conservative I
Capitalisation units
9.955,507,302.643 0.000
0.000.0000.00
Number of unitsNet asset value per unit
EUR EUR EUR
Ethical Balanced Conservative D
Distribution units
9.890.00
596,396.015 0.0000.000.00
0.0000.000.00
Number of unitsNet asset value per unitDividend per unit
EUR EUR EUR
Ethical Balanced Conservative C
Capitalisation units
9.93271,664.230 0.000
0.000.0000.00
Number of unitsNet asset value per unit
EUR EUR EUR
Total Net Assets 80,594,372.59 0.00 0.00
31/12/1531/12/1631/12/17Period/year ending as at:
EUR

The accompanying notes form an integral part of these financial statements
154Page
OPEN TEXT3,000 89,115.59 0.11%USD
Transferable securities admitted to an official stock exchange listing and/or dealt inon another regulated market 64,518,456.74 80.05%
Shares 16,030,948.59 19.89%
Canada 173,777.60 0.22%
SUNCOR ENERGY INC2,760 84,662.01 0.11%CAD
COLOPLAST -B-800 53,026.03 0.07%DKKDenmark 271,708.44 0.34%
NOVO NORDISK3,060 137,476.83 0.17%DKKVESTAS WIND SYSTEMS AS1,410 81,205.58 0.10%DKK
AXA SA44,880 1,110,106.80 1.38%EURFrance 1,694,831.70 2.10%
CIE DE SAINT-GOBAIN6,000 275,880.00 0.34%EURSUEZ ACT.21,060 308,844.90 0.38%EUR
ADIDAS NAMEN AKT2,610 436,261.50 0.54%EURGermany 4,281,089.40 5.31%
ALLIANZ SE REG SHS4,310 825,365.00 1.02%EURHENKEL AG & CO KGAA3,720 410,502.00 0.51%EURMERCK KGAA8,610 772,747.50 0.96%EUROSRAM LICHT8,330 624,166.90 0.77%EURSAP AG12,970 1,212,046.50 1.51%EUR
INTESA SANPAOLO SPA80,000 221,600.00 0.27%EURItaly 510,108.64 0.63%
TERNA SPA59,560 288,508.64 0.36%EUR
CENTRAL JAPAN RAILWAY CO820 122,330.06 0.16%JPYJapan 399,325.90 0.50%
EISAI1,320 62,608.96 0.08%JPYKUBOTA CORP4,530 73,992.96 0.09%JPYKURITA WATER INDUSTRIES LTD2,700 73,053.84 0.09%JPYNITTO DENKO CORP910 67,340.08 0.08%JPY
APTIV - REGISTERED1,700 120,095.77 0.15%USDJersey Island 120,095.77 0.15%
NORSK HYDRO ASA31,820 201,998.32 0.25%NOKNorway 476,307.99 0.59%
STATOIL ASA10,890 194,255.40 0.24%NOKTELENOR AS4,470 80,054.27 0.10%NOK
REPSOL SA26,930 397,082.85 0.49%EURSpain 397,082.85 0.49%
ESSITY REGISTERED -B-4,230 100,248.18 0.12%SEKSweden 308,510.50 0.38%
TELIA COMPANY AB56,020 208,262.32 0.26%SEK
LAFARGEHOLCIM N NAMEN-AKT.1,670 78,422.85 0.10%CHFSwitzerland 259,587.66 0.32%
ROCHE HOLDING AG GENUSSSCHEIN860 181,164.81 0.22%CHF
ASML HLDG4,150 602,372.50 0.75%EURThe Netherlands 2,317,666.00 2.88%
ING GROEP38,200 585,415.00 0.73%EURQIAGEN REGD EUR24,460 640,607.40 0.79%EURUNILEVER NV10,420 489,271.10 0.61%EUR
MONDI PLC3,760 81,795.30 0.10%GBPUnited Kingdom 186,790.85 0.23%
PRUDENTIAL PLC1,260 27,048.16 0.03%GBPRECKITT BENCKISER GROUP PLC1,000 77,947.39 0.10%GBP
ALPHABET -C-680 592,564.96 0.74%USDUnited States of America 4,634,065.29 5.75%
APPLIED MATERIALS INC11,400 485,316.46 0.60%USDBIOGEN IDEC INC1,700 451,006.83 0.56%USDBORG WARNER8,450 359,519.07 0.45%USDHESS CORP5,690 224,936.96 0.28%USDHUMANA INC1,580 326,407.89 0.41%USDINTEL CORP4,000 153,764.16 0.19%USDINTERNATIONAL PAPER CO2,500 120,627.91 0.15%USDLAM RESEARCH CORP2,700 413,881.58 0.51%USDLOWE'S COMPANIES INC1,400 108,357.76 0.13%USD
Securities portfolio as at 31/12/17EURExpressed in
NEF - Ethical Balanced Conservative
Quantity /Nominal Denomination Quotation
currency% of net
assetsMarket value

The accompanying notes form an integral part of these financial statements
155Page
MICROSOFT CORP8,760 624,025.98 0.78%USDNATIONAL OILWELL VARCO INC2,000 59,993.34 0.07%USDORACLE CORP6,220 244,904.73 0.30%USDROCKWELL AUTOMATION1,000 163,515.99 0.20%USDT ROWE PRICE GROUP INC1,000 87,383.41 0.11%USDTIME WARNER2,860 217,858.26 0.27%USD
NATIONAL AUSTRALIA BK 0.625 17-24 18/09A1,000,000 989,170.00 1.23%EUR
Bonds 44,446,036.41 55.15%
Australia 2,297,199.00 2.85%
WESTPAC BANKING 0.50 17-24 17/05A500,000 501,405.00 0.62%EURWESTPAC BANKING 1.125 17-27 05/09A800,000 806,624.00 1.00%EUR
OMV 1.00 17-26 14/12A500,000 493,610.00 0.61%EURAustria 493,610.00 0.61%
BANK OF MONTREAL 0.20 17-23 26/01A1,200,000 1,196,640.00 1.48%EURCanada 1,196,640.00 1.48%
REPUBLIC OF CHILE 1.875 15-30 27/05A300,000 313,035.00 0.39%EURChile 313,035.00 0.39%
CHINA DEV BK 2.75 17-22 16/11S600,000 495,199.87 0.61%USDChina 992,159.87 1.23%
CHINA DEVELOP.BK 0.375 17-21 16/11A500,000 496,960.00 0.62%EUR
KOMMUNEKREDIT 0.75 17-27 18/05A500,000 500,675.00 0.62%EURDenmark 500,675.00 0.62%
REGIE AUTONOME TRANS 0.875 17-27 25/05A500,000 502,190.00 0.62%EURFrance 1,023,840.00 1.27%
REGION ILE DE FRANCE 1.375 17-29 14/03A500,000 521,650.00 0.65%EUR
ALLEMAGNE 3.50 09-19 04/07A7,000,000 7,450,170.00 9.24%EURGermany 12,130,076.00 15.06%
BASF 0.875 17-27 15/11A300,000 296,271.00 0.37%EURBERLIN HYP 0.125 17-23 23/10A500,000 497,690.00 0.62%EURBERLIN HYP 1.125 17-27 25/10A500,000 496,390.00 0.62%EURCOMMERZBANK REGS 0.625 17-27 24/08A900,000 896,400.00 1.11%EURDEUTSCHE KREDITBK 0.75 17-24 26/09A500,000 498,235.00 0.62%EURKFW 0.25 17-25 30/06A1,000,000 999,470.00 1.24%EURLBK BADEN-WUERTT 0.20 17-21 13/12A1,000,000 995,450.00 1.24%EUR
ITALIE 0.45 16-21 01/06S4,500,000 4,524,345.00 5.61%EURItaly 4,524,345.00 5.61%
MIZUHO FINANCIAL G 0.956 17-24 16/10A700,000 700,945.00 0.87%EURJapan 700,945.00 0.87%
ADIF ALTA VELOCIDAD 0.80 17-23 05/07A1,000,000 1,004,200.00 1.25%EURSpain 6,947,186.00 8.62%
BCO BILBAO VIZCAYA 0.75 17-22 11/09A400,000 400,916.00 0.50%EURCAJA RURAL NAVARRA 0.625 16-23 01/12A500,000 500,625.00 0.62%EURCOMUNIDAD MADRID 0.747 17-22 30/04A500,000 508,595.00 0.63%EURSPAIN 0.40 17-22 30/04A4,500,000 4,532,850.00 5.62%EUR
KOMMUNINVEST I SVE 1.875 17-21 01/06S900,000 740,603.77 0.92%USDSweden 2,043,284.77 2.54%
NORDEA BANK AB 0.30 17-22 30/06A600,000 601,092.00 0.75%EURSWEDBANK MORTGAGE AB 0.40 17-24 08/05A700,000 701,589.00 0.87%EUR
INNOGY FINANCE 1.25 17-27 19/10A400,000 401,152.00 0.50%EURThe Netherlands 2,324,801.12 2.88%
JAIN INTL TRADING BV 7.125 17-22 01/02S500,000 416,314.12 0.52%USDNEDER FINANCIERINGS 0.125 17-23 01/06A500,000 500,230.00 0.62%EURREPSOL INTL FINANC 0.50 17-22 23/05A500,000 502,825.00 0.62%EURUNILEVER NV 0.875 17-25 31/07A500,000 504,280.00 0.62%EUR
ANZ BANKING GROUP 2.125 17-20 19/08S250,000 206,499.84 0.26%USDUnited States of America 8,958,239.65 11.12%
ECOLAB 2.375 17-22 10/08S1,000,000 823,384.41 1.02%USDPVR CORP 3.125 17-27 15/12S600,000 607,188.00 0.75%EURUS TREAS N/B V-2018 0.75 13-18 28/02S3,200,000 2,662,599.94 3.31%USDUSA T NOTES 1.625 12-22 15/08S2,500,000 2,033,963.04 2.52%USDWI TREASURY SEC. 1.375 15-20 30/09S3,200,000 2,624,604.42 3.26%USD
AXA SA FL.R 16-47 06/07A500,000 555,145.00 0.69%EUR
Floating rate bonds 4,031,265.27 5.00%
France 555,145.00 0.69%
Securities portfolio as at 31/12/17EURExpressed in
NEF - Ethical Balanced Conservative
Quantity /Nominal Denomination Quotation
currency% of net
assetsMarket value

The accompanying notes form an integral part of these financial statements
156Page
EVONIK INDUSTRIES F.LR 17-77 07/07A300,000 308,061.00 0.38%EURGermany 308,061.00 0.38%
ASSICURAZ GENERALI FL.R 15-47 27/10A500,000 601,315.00 0.75%EURItaly 601,315.00 0.75%
IND & COMM BK CHINA/ FL.R 17-20 12/10Q900,000 749,875.08 0.93%USDLuxembourg 749,875.08 0.93%
EXPORT IMP BK KOREA FL.R 17-22 01/11Q1,500,000 1,253,714.19 1.55%USDSouth Korea 1,253,714.19 1.55%
AEGON FL.R 14-44 25/04A500,000 563,155.00 0.70%EURThe Netherlands 563,155.00 0.70%
REPSOL (SHS) 01.05.18 RIGHT26,930 10,206.47 0.01%EUR
Warrants, Rights 10,206.47 0.01%
Spain 10,206.47 0.01%
INTESA SANPAOLO SPA 0.875 17-22 27/06A300,000 303,954.00 0.38%EUR
Other transferable securities 6,648,151.45 8.25%
Bonds 1,301,844.00 1.62%
Italy 303,954.00 0.38%
NATIONAL AUSTRALIA 0.35 17-22 07/09A1,000,000 997,890.00 1.24%EURUnited States of America 997,890.00 1.24%
COMMONWEALTH BANK AUST FL.R 17-29 03/10A1,300,000 1,306,422.00 1.61%EUR
Floating rate bonds 2,845,307.45 3.53%
Australia 1,306,422.00 1.61%
ICBC FL.R 17-20 12/10Q600,000 601,734.00 0.75%EURLuxembourg 601,734.00 0.75%
KOREA DEV.BANK FL.R 17-22 06/07Q500,000 415,331.45 0.52%USDSouth Korea 415,331.45 0.52%
TENNET HOLDING BV FL.R 17-49 12/04A500,000 521,820.00 0.65%EURThe Netherlands 521,820.00 0.65%
UNIINSTITUTIONAL GREEN BONDS25,000 2,501,000.00 3.10%EUR
Shares/Units in investment funds 2,501,000.00 3.10%
Germany 2,501,000.00 3.10%
UNIINSTITUTIONAL GLO CORP BD SUS-S-DIS40,000 4,047,600.00 5.02%EUR
Shares/Units of UCITS/UCIS 4,047,600.00 5.02%
Shares/Units in investment funds 4,047,600.00 5.02%
Luxembourg 4,047,600.00 5.02%
Total securities portfolio 75,214,208.19 93.32%
Securities portfolio as at 31/12/17EURExpressed in
NEF - Ethical Balanced Conservative
Quantity /Nominal Denomination Quotation
currency% of net
assetsMarket value

The accompanying notes form an integral part of these financial statements
157Page
Statement of Operations and Changes in Net Assets from 10/04/17 to 31/12/17Expressed in EUR
NEF - Ethical Balanced Conservative
557,588.94Income163,398.69Net dividends383,689.58Net interest on bonds
227.79Bank interest on cash account9,638.61Securities lending income 2,8Note
634.27Other financial income
471,553.25Expenses263,283.10Management & advisory fees15,693.10Depositary & sub-depositary fees 7Note25,774.31Taxe d'abonnement18,670.83Administrative expenses4,212.00Professional fees
18,012.18Bank interest on overdrafts5,111.48Legal fees
28,669.10Transaction fees351.83Publication & printing fees
50,731.79Correspondent bank fees41,043.53Other expenses
86,035.69Net income from investmentsNet realised profit / loss on:
-115,960.39- sales of investment securities11,902.26- forward foreign exchange contracts
-10,294.37- foreign exchange
-28,316.81Net realised lossMovement in net unrealised appreciation /(depreciation) on:
-480,419.35- investments
-508,736.16Decrease in net assets as a result of operations101,888,803.53Subscription capitalisation units
6,356,935.44Subscription distribution units-26,748,023.00Redemption capitalisation units
-394,607.22Redemption distribution units
80,594,372.59Increase in net assets
0.00Net assets at the beginning of the period
80,594,372.59Net assets at the end of the period

158Page
NEF- Obiettivo 2018
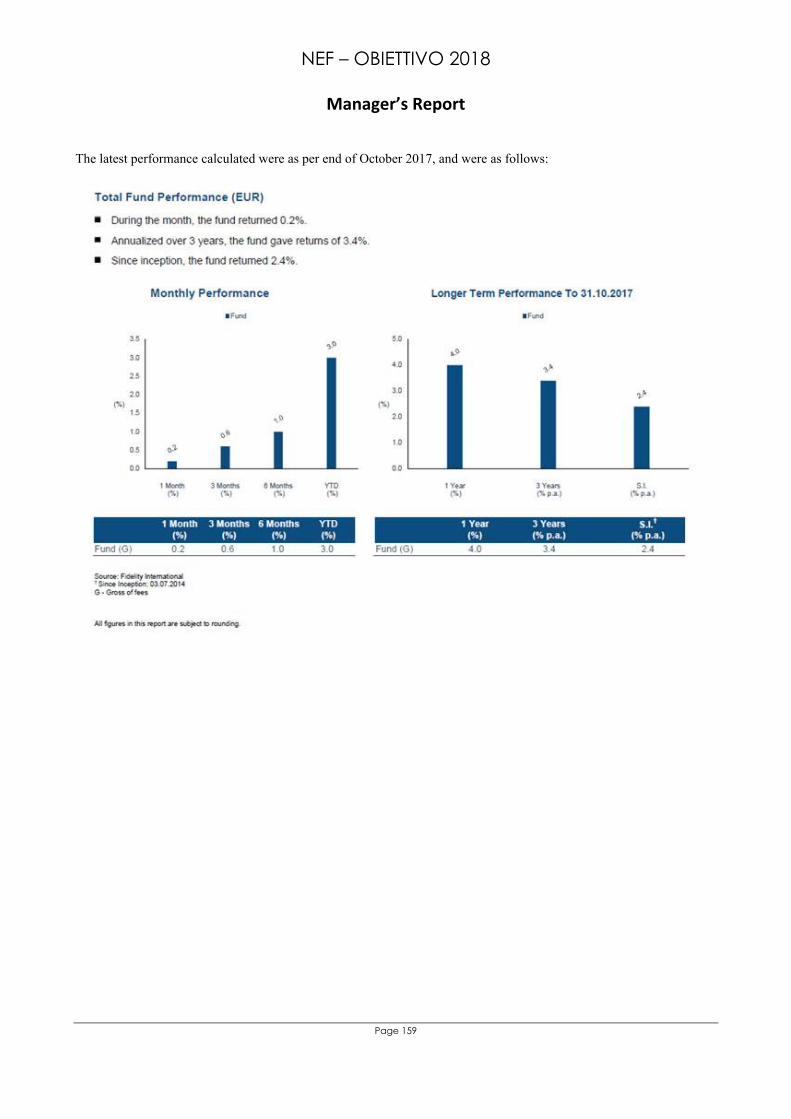
NEF – OBIETTIVO 2018
Manager’s Report
Page 159
The latest performance calculated were as per end of October 2017, and were as follows:

The accompanying notes form an integral part of these financial statements
160Page
Obiettivo 2018 - Category DDistribution units 31,069,801.715 0.000 31,069,801.715 0.000
Changes in number of units outstanding from 01/01/17 to 17/11/17
Units issued Units redeemed Units outstandingas at 17/11/17
Units outstandingas at 01/01/17
NEF - Obiettivo 2018
Key figures relating to the last 3 years
Obiettivo 2018 - Category D
Distribution units
0.000.05
0.000 31,069,801.7159.780.10
31,919,581.4748.940.23
Number of unitsNet asset value per unitDividend per unit
EUR EUR EUR
Total Net Assets 0.00 303,818,561.04 285,225,258.49
31/12/1531/12/1617/11/17Period/year ending as at:
EUR

The accompanying notes form an integral part of these financial statements
161Page
Statement of Operations and Changes in Net Assets from 01/01/17 to 17/11/17Expressed in EUR
NEF - Obiettivo 2018
12,375,089.78Income12,142,822.26Net interest on bonds 2Note
3,587.56Bank interest on cash account 2Note108,568.87Securities lending income 2,8Note24,960.60Interest on swaps95,150.49Antidilution levy fees 11Note
1,927,866.25Expenses1,627,755.04Management & advisory fees 5Note
33,466.60Depositary & sub-depositary fees 7Note126,030.52Taxe d'abonnement 4Note39,943.89Administrative expenses38,803.32Bank interest on overdrafts10,071.76Legal fees9,016.53Transaction fees 2Note1,709.21Publication & printing fees8,982.00Bank charges
0.01Correspondent bank fees 2Note32,087.37Other expenses
10,447,223.53Net income from investmentsNet realised profit / loss on:
-2,241,142.06- sales of investment securities 2Note4,257,537.85- forward foreign exchange contracts 2Note
26,747.55- swaps 2Note-3,877,533.24- foreign exchange 2Note
8,612,833.63Net realised profitMovement in net unrealised appreciation /(depreciation) on:
-11,704,042.03- investments 2Note9,532,066.22- forward foreign exchange contracts 2Note
-48,380.30- swaps
6,392,477.52Increase in net assets as a result of operations-1,526,298.08Dividends paid 9Note
-308,684,740.48Redemption distribution units
-303,818,561.04Decrease in net assets
303,818,561.04Net assets at the beginning of the period
0.00Net assets at the end of the period

162Page
NEF- Obiettivo 2019
NEF – Obiettivo 2019
Manager’s Report
Page 163
The sub-fund Obiettivo 2019 was up +1,01% during the period until 17 November 2017

The accompanying notes form an integral part of these financial statements
164Page
Obiettivo 2019 - Category DDistribution units 7,500,958.137 0.000 7,500,958.137 0.000
Changes in number of units outstanding from 01/01/17 to 17/11/17
Units issued Units redeemed Units outstandingas at 17/11/17
Units outstandingas at 01/01/17
NEF - Obiettivo 2019
Key figures relating to the last 3 years
Obiettivo 2019 - Category D
Distribution units
0.000.10
0.000 7,500,958.13710.010.20
7,687,281.6769.760.10
Number of unitsNet asset value per unitDividend per unit
EUR EUR EUR
Total Net Assets 0.00 75,086,796.48 75,044,078.61
31/12/1531/12/1617/11/17Period/year ending as at:
EUR

The accompanying notes form an integral part of these financial statements
165Page
Statement of Operations and Changes in Net Assets from 01/01/17 to 17/11/17Expressed in EUR
NEF - Obiettivo 2019
2,317,696.43Income2,254,174.21Net interest on bonds 2Note
2,028.28Bank interest on cash account 2Note35,701.90Securities lending income 2,8Note25,792.04Antidilution levy fees 11Note
756,423.47Expenses637,170.53Management & advisory fees 5Note16,384.38Depositary & sub-depositary fees 7Note31,001.60Taxe d'abonnement 4Note20,870.73Administrative expenses6,124.94Bank interest on overdrafts1,977.07Legal fees1,387.23Transaction fees 2Note
818.65Publication & printing fees1,110.00Bank charges
31,208.09Correspondent bank fees 2Note8,370.25Other expenses
1,561,272.96Net income from investmentsNet realised profit / loss on:
-1,073,518.09- sales of investment securities 2Note-570,567.74- forward foreign exchange contracts 2Note956,962.67- foreign exchange 2Note
874,149.80Net realised profitMovement in net unrealised appreciation /(depreciation) on:
-553,098.16- investments 2Note206,080.25- forward foreign exchange contracts 2Note
527,131.89Increase in net assets as a result of operations-738,553.08Dividends paid 9Note
-74,875,375.29Redemption distribution units
-75,086,796.48Decrease in net assets
75,086,796.48Net assets at the beginning of the period
0.00Net assets at the end of the period

166Page
NEF- Obiettivo 2020

NEF – Obiettivo 2020
Manager’s Report
Page 167
The sub-fund Obiettivo 2020 was up +2,78% during the period until 17 November 2017

The accompanying notes form an integral part of these financial statements
168Page
Obiettivo 2020 - Category DDistribution units 8,761,269.364 0.000 8,761,269.364 0.000
Changes in number of units outstanding from 01/01/17 to 17/11/17
Units issued Units redeemed Units outstandingas at 17/11/17
Units outstandingas at 01/01/17
NEF - Obiettivo 2020
Key figures relating to the last 3 years
Obiettivo 2020 - Category D
Distribution units
0.000.15
0.000 8,761,269.36410.360.21
8,927,817.9869.850.00
Number of unitsNet asset value per unitDividend per unit
EUR EUR EUR
Total Net Assets 0.00 90,778,362.06 87,934,120.16
31/12/1531/12/1617/11/17Period/year ending as at:
EUR

The accompanying notes form an integral part of these financial statements
169Page
Statement of Operations and Changes in Net Assets from 01/01/17 to 17/11/17Expressed in EUR
NEF - Obiettivo 2020
3,269,397.98Income3,146,331.49Net interest on bonds 2Note
552.31Bank interest on cash account 2Note84,307.35Securities lending income 2,8Note38,206.83Antidilution levy fees 11Note
810,572.73Expenses665,696.98Management & advisory fees 5Note20,127.50Depositary & sub-depositary fees 7Note38,268.63Taxe d'abonnement 4Note25,250.82Administrative expenses
118.54Professional fees6,142.90Bank interest on overdrafts2,534.25Legal fees2,409.49Transaction fees 2Note
820.14Publication & printing fees918.00Bank charges
36,802.31Correspondent bank fees 2Note11,483.17Other expenses
2,458,825.25Net income from investmentsNet realised profit / loss on:
1,777,623.68- sales of investment securities 2Note-831,519.09- forward foreign exchange contracts 2Note645,714.01- foreign exchange 2Note
4,050,643.85Net realised profitMovement in net unrealised appreciation /(depreciation) on:
-2,060,708.38- investments 2Note225,473.10- forward foreign exchange contracts 2Note
2,215,408.57Increase in net assets as a result of operations-1,301,334.83Dividends paid 9Note
-91,692,435.80Redemption distribution units
-90,778,362.06Decrease in net assets
90,778,362.06Net assets at the beginning of the period
0.00Net assets at the end of the period

170Page
Notes to the financial statements - Schedule of derivativeinstruments
NEF

171Page
OPTIONS
As at 31/12/17, the following option contracts were outstanding :
15,000,000.00 AUD(P)/USD(C)OTC MAR 0.730 01.03.18 PUT AUD 7,132,388.86 3,340.99 -36,740.84Options on currency
OTC options
Purchase
Quantity DenominationCommitment
CurrencyMarket value
(in EUR)(in absolute value)Unrealised
(in EUR)
NEF - Global Bond
10,000,000.00 USD(P)/MXN(C)OTC JAN 18.50 15.01.18 PUT USD 154,063,957.36 2,440.54 -72,756.96
5,781.53 -109,497.80Total Purchase
10,000,000.00 USD(C)/MXN(P)OTC JAN 20.50 15.01.18 CALL USD 170,719,520.32 -10,967.69 60,512.18Options on currency
OTC options
Sale
-10,967.69 60,512.18Total Sale
200.00 US 10 YEAR NOTE FEB 123.50 26.01.18 PUT USD 20,569,620.25 39,036.48 -16,528.49Options on futures
Listed options
Purchase of options
39,036.48 -16,528.49Total Purchase of options
400.00 US 10 YEAR NOTE FEB 122.00 26.01.18 PUT USD 40,639,573.62 -15,614.59 5,553.02Options on futures
Listed options
Sale of options
-15,614.59 5,553.02Total Sale of options
46.00 EURX EURO BUND FEB 160.50 29.01.18 PUT EUR 7,383,000.00 -2,300.00 -2,300.00Options on futures
Listed options
Purchase of options
Quantity DenominationCommitment
CurrencyMarket value
(in EUR)(in absolute value)Unrealised
(in EUR)
NEF - Euro Bond
47.00 EURX EURO BUND FEB 161.00 29.01.18 PUT EUR 7,567,000.00 4,610.00 4,610.00
2,310.00 2,310.00Total Purchase of options
NEF

172Page
USD 952,539.20 EUR 800,000.00 05/01/18 -6,888.93 UBS Ltd London
NEF - Global Bond
Currencypurchased
Maturitydate
Unrealised(in EUR) Counterparty
Quantitypurchased
Currencysale
Quantitysale
USD 9,391,800.20 KRW 10,726,844,600.00 12/02/18 -535,995.48 BNP ParibasJPY 1,070,900,000.00 EUR 8,006,657.14 18/01/18 -91,299.77 Natixis
USD 55,700,000.00 EUR 46,965,378.84 05/01/18 -588,017.09 Merryl Lynch InternationalEUR 86,040.85 CZK 2,200,000.00 05/01/18 -135.80 Citigroup Global MarketsBRL 9,736,000.00 USD 2,929,970.81 02/02/18 -5,071.66 Standard Chartered BankUSD 3,800,000.00 EUR 3,253,988.53 05/01/18 -90,012.25 JP Morgan SecuritiesUSD 500,000.00 EUR 427,886.20 05/01/18 -11,573.49 Merryl Lynch InternationalUSD 1,751,629.35 EUR 1,500,000.00 05/01/18 -41,549.03 HSBC Bank InternationalUSD 349,288.95 EUR 300,000.00 05/01/18 -9,173.34 HSBC Bank InternationalEUR 11,855,141.02 GBP 10,500,000.00 12/01/18 29,393.12 Citigroup Global MarketsEUR 601,311.55 USD 700,000.00 05/01/18 18,474.15 Merryl Lynch InternationalUSD 100,000.00 EUR 85,904.00 05/01/18 -2,641.52 Goldman Sachs International FinanceUSD 26,261.28 GBP 20,000.00 12/01/18 -668.63 Citigroup Global MarketsJPY 19,500,000.00 USD 172,521.35 18/01/18 591.78 Citigroup Global MarketsJPY 453,500,000.00 USD 4,012,823.34 18/01/18 13,266.67 CACIB London
EUR 15,890.31 JPY 2,100,000.00 18/01/18 368.58 Nomura Securities, LondonUSD 9,300,000.00 EUR 7,958,491.93 05/01/18 -215,075.36 JP Morgan SecuritiesEUR 14,255.14 JPY 1,900,000.00 18/01/18 211.65 Nomura Securities, LondonEUR 113,593.08 NOK 1,092,908.01 07/02/18 2,445.59 Citigroup Global MarketsEUR 758,312.81 USD 900,000.00 05/01/18 8,947.80 Morgan Stanley And CoEUR 2,494,947.26 JPY 333,500,000.00 18/01/18 29,944.55 Morgan Stanley And CoUSD 4,595,404.60 TWD 138,000,000.00 26/01/18 -61,897.28 UBS Ltd LondonUSD 1,000,000.00 EUR 841,570.91 05/01/18 -8,942.94 Goldman Sachs International FinanceEUR 4,209,337.42 USD 5,000,000.00 05/01/18 46,197.84 Citigroup Global MarketsGBP 4,000,000.00 EUR 4,465,337.26 12/01/18 39,723.47 HSBC Bank InternationalEUR 84,916.17 USD 100,000.00 05/01/18 1,653.51 Morgan Stanley And CoGBP 620,576.25 EUR 700,000.00 05/01/18 -934.78 Nomura Securities, LondonJPY 549,200,000.00 EUR 4,164,947.70 18/01/18 -105,648.71 UBS Ltd London
EUR 2,444,731.16 USD 2,900,000.00 05/01/18 30,110.80 HSBC Bank InternationalEUR 2,019,869.91 GBP 1,800,000.00 12/01/18 -7,404.56 Standard Chartered BankEUR 2,523,634.47 USD 3,000,000.00 05/01/18 25,750.38 Société GénéraleUSD 418,597.90 EUR 350,000.00 05/01/18 -1,463.28 BNP ParibasEUR 2,123,326.85 GBP 1,900,000.00 12/01/18 -16,576.37 Standard Chartered BankEUR 7,631,551.01 NZD 13,300,000.00 27/02/18 -214,455.77 UBS Ltd LondonEUR 226,232.69 AUD 356,200.00 27/02/18 -5,001.85 JP Morgan SecuritiesUSD 6,534,275.63 MXN 122,600,000.00 27/02/18 281,932.93 Royal Bank, ScotlandEUR 8,874,971.74 USD 10,600,000.00 05/01/18 49,107.13 Royal Bank, ScotlandEUR 83,719.48 USD 100,000.00 05/01/18 456.61 Société GénéraleEUR 9,052.73 JPY 1,200,000.00 18/01/18 183.17 Goldman Sachs International FinanceEUR 4,204,100.68 USD 5,000,000.00 05/01/18 40,960.18 Royal Bank, ScotlandEUR 1,092,846.47 USD 1,300,000.00 05/01/18 10,429.90 Royal Bank, ScotlandGBP 4,000,000.00 EUR 4,541,702.48 12/01/18 -36,662.61 Merryl Lynch InternationalSEK 6,600,000.00 EUR 665,517.99 07/02/18 5,832.87 JP Morgan SecuritiesEUR 8,317,872.46 JPY 1,104,100,000.00 18/01/18 157,134.47 Goldman Sachs International FinanceUSD 474,363.68 EUR 400,000.00 05/01/18 -5,031.67 Nomura Securities, LondonEUR 13,433.85 JPY 1,800,000.00 18/01/18 129.48 UBS Ltd LondonUSD 358,487.10 EUR 300,000.00 05/01/18 -1,513.32 Merryl Lynch InternationalEUR 63,315.94 AUD 100,000.00 27/02/18 -1,601.79 Merryl Lynch InternationalGBP 3,600,000.00 EUR 4,069,622.19 12/01/18 -15,081.41 BNP ParibasUSD 5,234,334.60 EUR 4,400,000.00 05/01/18 -41,745.72 JP Morgan SecuritiesEUR 112,014.72 GBP 100,000.00 12/12/18 547.41 HSBC Bank InternationalHUF 400,600,000.00 EUR 1,276,653.24 02/03/18 14,164.85 CACIB LondonEUR 5,339,845.79 PLN 22,570,300.00 02/03/18 -51,498.00 NatixisRUB 416,851,079.98 USD 7,015,569.02 02/02/18 161,615.81 Merryl Lynch InternationalGBP 1,700,000.00 EUR 1,921,016.61 12/01/18 -6,372.15 HSBC Bank InternationalEUR 757,230.86 USD 900,000.00 05/01/18 7,865.66 Royal Bank, ScotlandJPY 119,000,000.00 EUR 897,443.82 18/01/18 -17,878.89 Goldman Sachs International Finance
USD 7,000,000.00 EUR 5,909,177.13 05/01/18 -80,784.60 BNP ParibasEUR 792,935.80 GBP 700,000.00 12/01/18 4,553.31 HSBC Bank InternationalTRY 25,300,000.00 EUR 5,401,953.37 22/02/18 55,239.99 BNP ParibasEUR 4,844,479.46 USD 5,700,000.00 05/01/18 98,508.53 Goldman Sachs International FinanceEUR 5,139,914.40 CAD 7,800,000.00 09/02/18 -35,487.45 Barclays Bank PLC
NEF
As at 31/12/17, the following forward contracts were outstanding :
FORWARD FOREIGN EXCHANGE CONTRACTS

173Page
USD 9,100,000.00 EUR 7,701,466.12 05/01/18 -124,559.31 BNP Paribas
NEF - Global Bond
Currencypurchased
Maturitydate
Unrealised(in EUR) Counterparty
Quantitypurchased
Currencysale
Quantitysale
JPY 1,201,700,000.00 EUR 8,987,337.85 18/01/18 -105,197.18 Morgan Stanley And CoEUR 7,231,163.16 CHF 8,415,700.00 05/03/18 33,904.56 Crédit Suisse
MXN 6,600,000.00 USD 339,399.85 27/02/18 -4,770.26 Goldman Sachs International FinanceEUR 755.71 JPY 100,000.00 18/01/18 16.58 CACIB LondonBRL 7,602,880.00 USD 2,300,000.00 02/02/18 -13,970.66 HSBC Bank InternationalRUB 134,884,017.50 USD 2,287,722.34 02/02/18 37,544.06 Standard Chartered BankNZD 3,400,000.00 CAD 3,058,691.00 27/02/18 -22,271.18 Nomura Securities, LondonNOK 20,900,000.00 USD 2,500,786.13 18/01/18 46,269.83 Merryl Lynch InternationalSEK 21,200,000.00 USD 2,526,089.02 07/02/18 57,115.05 Goldman Sachs International FinanceUSD 77,135.03 AUD 100,000.00 18/01/18 -898.28 Citigroup Global MarketsZAR 2,965,303.94 USD 239,135.24 22/02/18 -1,289.43 JP Morgan SecuritiesEUR 4,498,915.31 GBP 4,000,000.00 12/01/18 -6,136.25 HSBC Bank International
-1,282,585.78
EUR 230,673.19 GBP 205,000.00 18/01/18 -282.17 Goldman Sachs International Finance
NEF - Emerging Market Bond
Currencypurchased
Maturitydate
Unrealised(in EUR) Counterparty
Quantitypurchased
Currencysale
Quantitysale
EUR 149,100,000.00 USD 176,265,736.71 18/01/18 2,264,304.72 Goldman Sachs International FinanceEUR 1,017,000.00 USD 1,197,915.45 18/01/18 19,096.80 Goldman Sachs International FinanceEUR 955,000.00 USD 1,128,909.22 18/01/18 14,578.10 Goldman Sachs International FinanceEUR 641,634.96 USD 749,000.00 18/01/18 17,698.50 Goldman Sachs International FinanceEUR 307,600.00 USD 365,370.05 18/01/18 3,232.26 UBS Ltd LondonEUR 472,000.00 USD 552,546.47 18/01/18 11,713.20 Goldman Sachs International FinanceEUR 1,850,000.00 USD 2,165,043.90 18/01/18 46,457.85 UBS Ltd LondonUSD 3,616,888.80 EUR 3,115,000.00 18/01/18 -102,053.06 UBS Ltd LondonUSD 1,170,000.00 EUR 1,000,904.24 18/01/18 -26,262.58 Goldman Sachs International FinanceUSD 2,636,000.00 EUR 2,249,755.27 18/01/18 -53,891.06 Citigroup Global MarketsUSD 641,869.38 EUR 540,000.00 18/01/18 -5,297.00 UBS Ltd LondonEUR 1,708,000.00 USD 2,017,643.49 18/01/18 27,231.65 Citigroup Global MarketsEUR 735,000.00 USD 870,095.28 18/01/18 10,178.43 Citigroup Global MarketsEUR 685,000.00 USD 807,514.58 18/01/18 12,313.12 Goldman Sachs International FinanceUSD 784,316.28 EUR 660,000.00 18/01/18 -6,633.15 Goldman Sachs International FinanceEUR 976,314.71 USD 1,162,475.47 18/01/18 7,924.36 UBS Ltd LondonUSD 1,050,000.00 EUR 880,675.07 18/01/18 -5,980.38 Citigroup Global MarketsUSD 736,537.99 EUR 620,000.00 18/01/18 -6,434.57 Citigroup Global MarketsEUR 1,445,000.00 USD 1,717,926.11 18/01/18 13,898.23 Goldman Sachs International FinanceEUR 1,445,000.00 USD 1,719,754.61 18/01/18 12,373.59 Goldman Sachs International FinanceUSD 135,496.71 EUR 115,000.00 18/01/18 -2,126.72 Citigroup Global MarketsUSD 442,891.50 EUR 375,000.00 18/01/18 -6,055.80 UBS Ltd LondonUSD 592,904.50 EUR 500,000.00 18/01/18 -6,087.82 UBS Ltd LondonEUR 600,000.00 USD 710,541.54 18/01/18 8,092.40 Goldman Sachs International FinanceUSD 898,308.97 EUR 755,000.00 18/01/18 -6,665.33 Goldman Sachs International FinanceEUR 345,000.00 USD 410,164.63 18/01/18 3,316.31 UBS Ltd London
2,244,639.88
EUR 482,371.97 AUD 750,000.00 19/03/18 -4,814.90 Goldman Sachs International Finance
NEF - Risparmio Italia (previously Convertible Bond)
Currencypurchased
Maturitydate
Unrealised(in EUR) Counterparty
Quantitypurchased
Currencysale
Quantitysale
USD 142,846.69 CHF 140,000.00 19/03/18 -1,179.52 Goldman Sachs International FinanceEUR 119,928.12 CHF 140,000.00 19/03/18 182.15 Goldman Sachs International FinanceNOK 2,500,000.00 EUR 255,672.16 19/03/18 -2,243.65 Goldman Sachs International FinanceEUR 1,259,400.37 USD 1,500,000.00 19/03/18 14,441.99 CACIB LondonJPY 68,500,000.00 EUR 513,050.78 19/03/18 -4,767.20 Goldman Sachs International FinanceSEK 1,500,000.00 EUR 151,198.01 19/03/18 1,189.64 BNP Paribas
DKK 250,000.00 EUR 33,602.28 19/03/18 -13.80 BNP ParibasJPY 5,000,000.00 EUR 37,545.13 19/03/18 -444.22 Goldman Sachs International Finance
NEFFORWARD FOREIGN EXCHANGE CONTRACTS

174Page
JPY 36,500,000.00 EUR 270,591.85 19/03/18 247.38 Merryl Lynch International2,597.87
NEF - Risparmio Italia (previously Convertible Bond)
Currencypurchased
Maturitydate
Unrealised(in EUR) Counterparty
Quantitypurchased
Currencysale
Quantitysale
EUR 23,683.83 USD 28,473.65 03/01/18 -56.65 STATE STREET BANK ANDTRUST CO BOSTON
-56.65
NEF - U.S. Equity
Currencypurchased
Maturitydate
Unrealised(in EUR) Counterparty
Quantitypurchased
Currencysale
Quantitysale
JPY 21,558,354.00 USD 190,847.09 04/01/18 967.73 JP Morgan Securities
NEF - Pacific Equity
Currencypurchased
Maturitydate
Unrealised(in EUR) Counterparty
Quantitypurchased
Currencysale
Quantitysale
JPY 4,110,010.00 USD 36,443.69 05/01/18 136.50 NATIONAL AUSTRALIA BANKLIMITED
USD 39,236.00 EUR 32,843.64 02/01/18 -127.89 Citibank, LondonSGD 7,176.46 USD 5,369.33 04/01/18 18.25 BROWN BROTHERS HARRIMANJPY 17,241,923.00 USD 153,164.87 09/01/18 366.54 JP Morgan Securities
EUR 1,714.24 USD 2,060.91 03/01/18 -4.09 JP Morgan Securities1,357.04
EUR 34,293,325.31 USD 40,114,000.00 14/02/18 930,161.15 State Street Bank
NEF - Ethical Total Return Bond (previously Absolute Return Bond)
Currencypurchased
Maturitydate
Unrealised(in EUR) Counterparty
Quantitypurchased
Currencysale
Quantitysale
EUR 1,265,617.16 NZD 2,127,000.00 14/02/18 5,604.36 STATE STREET BANK TRUSTCOMPANY
EUR 1,077,988.95 PLN 4,586,000.00 14/02/18 -17,223.20 State Street BankEUR 616,527.15 ZAR 10,340,000.00 14/02/18 -76,016.33 State Street BankEUR 10,785,514.22 GBP 9,592,000.00 14/02/18 -12,950.03 State Street BankCLP 111,699,000.00 USD 176,677.42 14/02/18 4,071.78 Morgan Stanley And CoBRL 559,000.00 USD 170,265.91 14/02/18 -1,987.91 Morgan Stanley And CoCOP 519,981,000.00 USD 171,192.80 14/02/18 1,882.33 Citibank, LondonIDR 2,349,543,000.00 USD 172,052.07 14/02/18 1,034.04 HSBC Bank International
USD 2,069,000.00 EUR 1,772,973.68 14/02/18 -52,178.66 HSBC Bank InternationalEUR 1,204,426.72 USD 1,411,000.00 14/02/18 30,881.17 Morgan Stanley And CoUSD 2,555,000.00 EUR 2,176,388.86 14/02/18 -51,353.60 HSBC Bank InternationalUSD 235,000.00 EUR 197,471.81 14/02/18 -2,011.79 Morgan Stanley And CoEUR 970,846.10 GBP 868,000.00 14/02/18 -6,335.44 Morgan Stanley And CoEUR 1,187,785.11 USD 1,408,000.00 14/02/18 16,699.92 Morgan Stanley And CoEUR 1,197,017.75 GBP 1,074,000.00 14/02/18 -12,080.52 Morgan Stanley And CoEUR 10,001,402.17 GBP 8,916,000.00 14/02/18 -36,064.31 Morgan Stanley And CoEUR 3,057,397.40 PLN 13,005,000.00 14/02/18 -48,409.18 Morgan Stanley And CoEUR 2,264,450.82 ZAR 38,206,000.00 14/02/18 -294,606.28 Citibank, LondonEUR 40,383,619.48 USD 47,841,000.00 14/02/18 592,569.03 Morgan Stanley And CoEUR 2,029,148.61 GBP 1,803,000.00 14/02/18 -627.31 State Street BankEUR 4,940,591.97 USD 5,822,000.00 14/02/18 98,293.30 Morgan Stanley And CoEUR 6,691,512.60 GBP 5,943,000.00 14/02/18 1,023.57 Morgan Stanley And CoEUR 2,806,735.49 USD 3,317,000.00 14/02/18 47,886.12 Morgan Stanley And CoIDR 6,500,000,000.00 USD 478,821.36 14/02/18 494.98 NATIONAL AUSTRALIA BANK
LIMITEDEUR 2,490,456.33 NZD 4,309,000.00 14/02/18 -62,384.58 CIBC TORONTOEUR 337,807.54 GBP 301,000.00 14/02/18 -1,052.45 Morgan Stanley And CoEUR 21,049,095.24 USD 25,062,000.00 14/02/18 203,881.69 Morgan Stanley And CoCOP 1,500,000,000.00 USD 500,575.66 14/02/18 -207.08 BNP ParibasCLP 320,000,000.00 USD 504,723.90 14/02/18 12,856.96 BNP Paribas
NEFFORWARD FOREIGN EXCHANGE CONTRACTS

175Page
BRL 1,600,000.00 USD 489,536.16 14/02/18 -7,526.79 BNP Paribas
NEF - Ethical Total Return Bond (previously Absolute Return Bond)
Currencypurchased
Maturitydate
Unrealised(in EUR) Counterparty
Quantitypurchased
Currencysale
Quantitysale
EUR 252,050.22 USD 300,000.00 14/02/18 2,526.69 HSBC Bank InternationalZAR 4,000,000.00 EUR 239,195.27 14/02/18 28,706.65 HSBC Bank InternationalEUR 280,204.10 PLN 1,186,000.00 14/02/18 -3,028.62 HSBC Bank InternationalEUR 1,964,189.61 USD 2,358,000.00 14/02/18 2,892.86 Morgan Stanley And CoEUR 529,338.57 USD 633,000.00 14/02/18 2,837.78 CIBC TORONTOGBP 248,000.00 EUR 276,297.85 14/02/18 2,898.16 Morgan Stanley And CoEUR 587,939.70 USD 702,000.00 14/02/18 4,050.05 BNP ParibasEUR 2,878,435.00 GBP 2,544,000.00 14/02/18 14,476.42 Morgan Stanley And CoGBP 268,000.00 EUR 303,554.28 14/02/18 -1,848.32 Morgan Stanley And CoUSD 1,266,000.00 EUR 1,061,865.76 14/02/18 -8,872.05 Morgan Stanley And CoUSD 1,343,000.00 EUR 1,122,116.90 14/02/18 -5,067.85 HSBC Bank InternationalGBP 868,000.00 EUR 980,826.43 14/02/18 -3,656.66 Morgan Stanley And CoEUR 1,654,751.78 USD 1,961,000.00 14/02/18 23,717.37 Morgan Stanley And CoEUR 1,375,917.56 USD 1,630,000.00 14/02/18 20,188.95 BNP ParibasEUR 1,278,158.29 USD 1,511,000.00 14/02/18 21,412.83 Morgan Stanley And CoEUR 496,669.87 ZAR 8,081,000.00 14/02/18 -44,431.50 Citibank, LondonUSD 600,000.00 EUR 508,183.88 14/02/18 -9,146.90 Citibank, LondonUSD 646,660.07 IDR 8,849,543,000.00 14/02/18 -5,061.71 BNP ParibasGBP 344,000.00 EUR 390,574.48 14/02/18 -3,311.24 Morgan Stanley And CoEUR 13,500,154.20 CAD 20,443,000.00 14/02/18 -66,213.88 Morgan Stanley And CoEUR 2,070,051.53 USD 2,441,000.00 14/02/18 39,809.14 Morgan Stanley And CoUSD 649,518.65 BRL 2,159,000.00 14/02/18 896.70 Citibank, LondonUSD 665,397.68 COP 2,019,981,000.00 14/02/18 -7,009.64 Citibank, LondonUSD 664,510.12 CLP 431,699,000.00 14/02/18 -31,017.83 Citibank, LondonUSD 591,000.00 EUR 496,553.28 14/02/18 -4,991.96 Morgan Stanley And CoEUR 645,028.88 USD 765,000.00 14/02/18 8,749.56 Morgan Stanley And CoEUR 1,007,606.53 GBP 892,000.00 14/02/18 3,417.84 Morgan Stanley And CoEUR 460,050.24 USD 546,000.00 14/02/18 5,920.67 Morgan Stanley And CoEUR 177,131.08 NZD 300,000.00 14/02/18 -590.20 Royal Bank, CanadaEUR 229,264.50 ZAR 3,500,000.00 14/02/18 -4,960.19 HSBC Bank InternationalUSD 434,000.00 EUR 364,882.99 14/02/18 -3,906.23 Morgan Stanley And CoEUR 4,082,834.97 USD 4,865,000.00 14/02/18 36,383.72 Morgan Stanley And CoGBP 409,000.00 EUR 460,836.19 14/02/18 -393.50 Morgan Stanley And CoZAR 14,707,000.00 EUR 986,914.51 14/02/18 -2,890.24 Citibank, LondonEUR 309,667.34 USD 372,000.00 14/02/18 251.06 Morgan Stanley And Co
1,277,062.87
EUR 6,130,190.71 JPY 812,360,000.00 10/01/18 98,332.56 BNP Paribas
NEF - Global Property
Currencypurchased
Maturitydate
Unrealised(in EUR) Counterparty
Quantitypurchased
Currencysale
Quantitysale
EUR 1,039,560.69 SEK 9,963,000.00 10/01/18 27,443.15 BNP ParibasEUR 5,832,022.80 HKD 54,032,000.00 10/01/18 50,179.30 BNP ParibasEUR 4,076,698.00 GBP 3,635,000.00 10/01/18 -19,426.72 BNP ParibasEUR 3,677,403.41 AUD 5,551,000.00 10/01/18 56,036.11 BNP ParibasEUR 38,313,734.95 USD 45,573,000.00 10/01/18 332,211.58 BNP ParibasEUR 774,767.39 NOK 7,251,000.00 10/01/18 38,064.88 BNP ParibasEUR 335,725.52 MXN 7,654,000.00 10/01/18 12,913.04 BNP ParibasEUR 1,840,617.74 CAD 2,731,000.00 10/01/18 25,286.52 BNP ParibasAUD 711,000.00 EUR 460,484.74 10/01/18 3,362.91 BNP Paribas
624,403.33
EUR 36,084,954.29 USD 42,000,000.00 08/02/18 1,184,772.74 Nomura Securities, London
NEF - Ethical Balanced Dynamic (previously Ethical Balanced)
Currencypurchased
Maturitydate
Unrealised(in EUR) Counterparty
Quantitypurchased
Currencysale
Quantitysale
EUR 2,239,140.17 GBP 2,000,000.00 08/02/18 -11,735.25 Nomura Securities, London1,173,037.49
NEFFORWARD FOREIGN EXCHANGE CONTRACTS

176Page
AUSTR 10YR BOND 03/18 -23,421.4038 AUD 3,146,029.86 CACEIS Bank, ParisFutures on interest rates
(purchase/(sale)) DenominationQuantity
Currency(in EUR)
Broker(in absolute value)
Commitment
(in EUR)Unrealised
NEF - Global Bond
CAN 10YR BOND (MSE) 03/18 -19,574.6119 CAD 1,702,107.01 CACEIS Bank, ParisEURO BOBL FUTURE 03/18 218,220.00-254 EUR 33,428,940.00 CACEIS Bank, ParisEURO BUXL FUTURE 03/18 -25,200.0012 EUR 1,966,320.00 CACEIS Bank, ParisEURO SCHATZ FUTURE 03/18 41,035.00-283 EUR 31,688,925.00 CACEIS Bank, ParisJPN 10 YEARS BOND 03/18 -15,524.5014 JPY 15,605,222.44 CACEIS Bank, ParisLONG GILT FUTURE-LIF 03/18 -109,998.31-106 GBP 14,946,161.21 CACEIS Bank, ParisUS TREASURY BOND 03/18 -11,854.0843 USD 5,478,847.44 CACEIS Bank, ParisUS ULTRA BD CBT 30YR 03/18 32,849.1951 USD 7,120,643.53 CACEIS Bank, ParisUS 10YR ULTRA (CBOT) 03/18 18,867.63-58 USD 6,451,220.02 CACEIS Bank, ParisUS 2 YEARS NOTE- CBT 03/18 32,153.05-95 USD 16,939,032.84 CACEIS Bank, Paris
137,551.97
EURO BUND FUTURE 03/18 159,770.00-309 EUR 49,959,120.00 CACEIS Bank, ParisFutures on bonds
US 10 YEARS NOTE 03/18 294,009.73-603 USD 62,292,026.67 CACEIS Bank, ParisUS 5 YEARS NOTE-CBT 03/18 -172,977.13759 USD 73,424,819.65 CACEIS Bank, Paris
280,802.60
US 5 YEARS NOTE-CBT 03/18 8,722.54-15 USD 1,452,898.31 CACEIS Bank, ParisFutures on bonds
8,722.54
(purchase/(sale)) DenominationQuantity
Currency(in EUR)
Broker(in absolute value)
Commitment
(in EUR)Unrealised
NEF - Euro Bond
EURO BUND FUTURE 03/18 56,000.00-70 EUR 11,317,600.00 CACEIS Bank, ParisFutures on bonds
56,000.00
(purchase/(sale)) DenominationQuantity
Currency(in EUR)
Broker(in absolute value)
Commitment
(in EUR)Unrealised
NEF - Emerging Market Bond
EURO BUND FUTURE 03/18 13,900.00-10 EUR 1,616,800.00 Banca IMI SPA MilanoFutures on bonds
13,900.00
(purchase/(sale)) DenominationQuantity
Currency(in EUR)
Broker(in absolute value)
Commitment
(in EUR)Unrealised
NEF - Risparmio Italia (previously Convertible Bond)
MSCI WORLD EUR 03/18 -91,660.02334 EUR 8,455,210.00 Banca IMI SPA MilanoFutures on index
-91,660.02
As at 31/12/17, the following future contracts were outstanding :
NEFFUTURES

177Page
EURO BOBL FUTURE 03/18 27,300.00-35 EUR 4,606,350.00 CACEIS Bank, ParisFutures on interest rates
(purchase/(sale)) DenominationQuantity
Currency(in EUR)
Broker(in absolute value)
Commitment
(in EUR)Unrealised
NEF - Euro Corporate Bond
EURO SCHATZ FUTURE 03/18 6,400.00-40 EUR 4,479,000.00 CACEIS Bank, Paris33,700.00
EURO BUND FUTURE 03/18 54,300.00-30 EUR 4,850,400.00 CACEIS Bank, ParisFutures on bonds
54,300.00
CAN 10YR BOND (MSE) 03/18 8,983.31-7 CAD 627,342.24 UBS LimitedFutures on interest rates
(purchase/(sale)) DenominationQuantity
Currency(in EUR)
Broker(in absolute value)
Commitment
(in EUR)Unrealised
NEF - Ethical Total Return Bond (previously Absolute Return Bond)
EURO BOBL FUTURE 03/18 -12,920.0019 EUR 2,500,590.00 UBS LimitedEURO BUXL FUTURE 03/18 -13,974.1420 EUR 3,277,200.00 UBS LimitedLONG GILT FUTURE-LIF 03/18 -140,891.96-140 GBP 19,741,324.92 UBS LimitedUS TREASURY BOND 03/18 1,439.64-13 USD 1,658,467.44 UBS LimitedUS ULTRA BD CBT 30YR 03/18 -90,570.96-38 USD 5,312,213.37 UBS LimitedUS 10YR ULTRA (CBOT) 03/18 -9,315.33-147 USD 16,350,505.91 UBS Limited
-257,249.44
EURO BUND FUTURE 03/18 249,049.67-175 EUR 28,294,000.00 UBS LimitedFutures on bonds
US 10 YEARS NOTE 03/18 17,775.16-41 USD 4,240,742.00 UBS LimitedUS 5 YEARS NOTE-CBT 03/18 -119,745.54466 USD 45,080,324.05 UBS Limited
147,079.29
EURO BUXL FUTURE 03/18 15,400.00-7 EUR 1,147,020.00 Newedge GroupFutures on interest rates
15,400.00
(purchase/(sale)) DenominationQuantity
Currency(in EUR)
Broker(in absolute value)
Commitment
(in EUR)Unrealised
NEF - Ethical Balanced Dynamic (previously Ethical Balanced)
EURO BTP FUTURE -EUX 03/18 169,740.00-69 EUR 9,393,660.00 Newedge GroupFutures on bonds
EURO BUND FUTURE 03/18 154,100.00-134 EUR 21,665,120.00 Newedge GroupUS 10 YEARS NOTE 03/18 3,220.51-5 USD 516,517.64 Newedge GroupUS 5 YEARS NOTE-CBT 03/18 2,055.92-4 USD 386,955.57 Newedge Group
329,116.43
S&P 500 INDEX (CME) 03/18 -151,669.72-10 USD 5,571,285.81 Newedge GroupFutures on index
-151,669.72
NEFFUTURES

NEF
Page 178
Other notes to the financial statements as at December 31, 2017
1. ORGANISATION NEF (the “Fund”) is a unit trust, qualifying as a “Fonds Commun de Placement” incorporated on October 8, 1999, under Part I of the Law of December 17, 2010 (the “Law”) relating to Undertaking for Collective Investment. The Fund is, as a consequence of the repealing of the EEC Directive 85/611, qualified as an “Undertaking for Collective Investment in Transferable Securities” under the EC Directive 2009/65 of July 13, 2009 and is subject to the Luxembourg law of December 17, 2010 relating to Undertakings for Collective Investment. The Fund is managed by the Management Company, NORD EST ASSET MANAGEMENT S.A., which is registered at the Luxembourg Register of Commerce under the number B 69705 and is established at 5 Allée Scheffer, Luxembourg L-2520. NORD EST ASSET MANAGEMENT S.A. has appointed several international Investment Managers to manage the various sub-funds. The Fund has an umbrella structure. As at December 31, 2017, sixteen sub-funds were available to the investors: Sub-funds Ccy Launch dateNEF - Global Equity EUR October 8,1999NEF - Euro Equity EUR October 8,1999NEF - Emerging Market Equity EUR October 8,1999NEF - Global Bond EUR October 8,1999NEF - Euro Bond EUR October 8,1999NEF - Emerging Market Bond EUR October 8,1999NEF - Euro Short Term Bond EUR October 8,1999NEF - Risparmio Italia (previously NEF - Convertible Bond) EUR January 19,2002NEF - EE.ME.A. Equity EUR April 22,2002NEF - U.S. Equity EUR April 22,2002NEF - Pacific Equity EUR April 22,2002NEF - Euro Corporate Bond EUR January 19,2002NEF - Ethical Total Return Bond (previously NEF - Absolute Return Bond) EUR May 7,2007NEF - Global Property EUR May 7,2007NEF - Ethical Balanced Dynamic EUR July 1,2015NEF - Ethical Balanced Conservative EUR April 10,2017
The Sub-Funds NEF – Obiettivo 2018 merged into NEF - Ethical Total Return bond as at November 17, 2017 with a last NAV/share of EUR 9.93, and NEF – Obiettivo 2019 and NEF – Obiettivo 2020 merged into the Sub-Fund NEF - Euro Corporate Bond as at November 17, 2017 respectively with a last NAV/share of EUR 9.98 and EUR 10.46. Category R, Category D and Category PIR are available for any kind of investors. Category I is available for institutional investors (the “Institutional Investors”). Category C will be available for (i) all legal persons who do not satisfy the definition of Institutional Investors and (ii) all natural persons, subject to fulfilling the minimum initial subscription requirement.For the avoidance of doubt, the minimum initial subscription requirement for Category C units for persons under (i) and (ii) above is EUR 100,000: The investment policy of the Fund is to invest in a diversified range of transferable securities, conforming to the investment policy of each particular sub-fund. The Fund maintains the books and records of each individual sub-fund in its respective currency and prepares combined statements in EUR. The financial statements have been prepared using accounting principles generally accepted for such funds in Luxembourg including the following significant accounting policies:
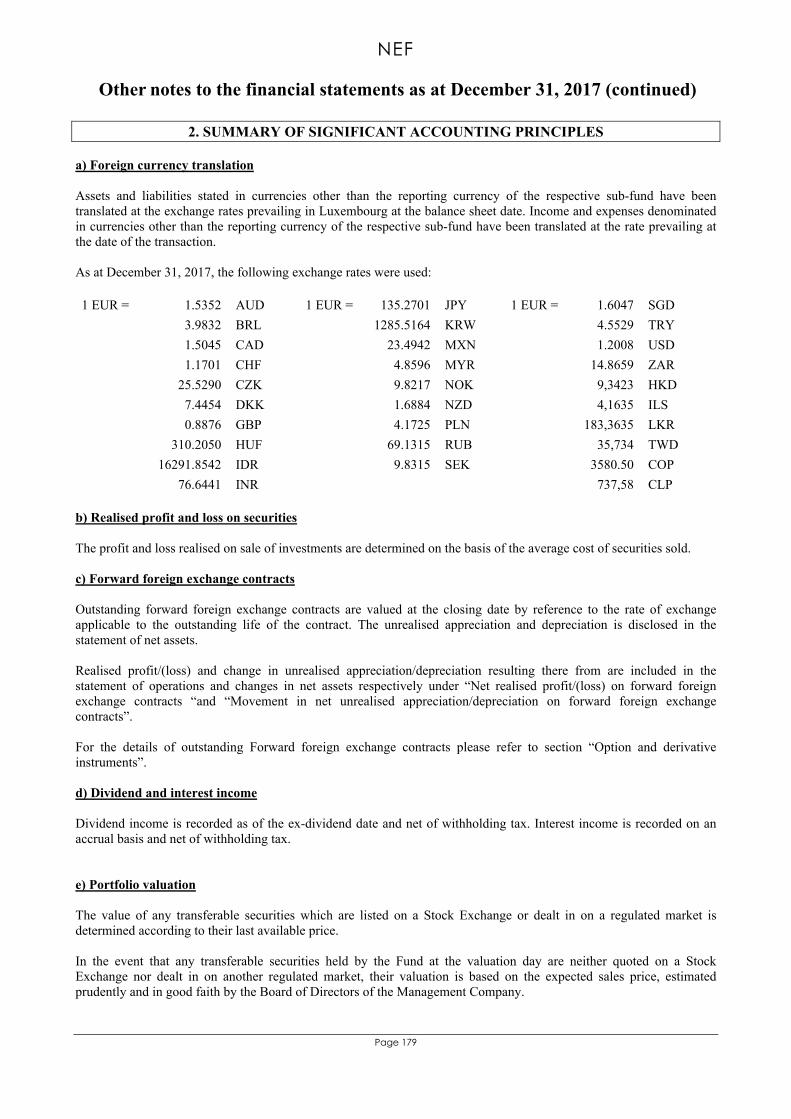
NEF
Page 179
Other notes to the financial statements as at December 31, 2017 (continued)
2. SUMMARY OF SIGNIFICANT ACCOUNTING PRINCIPLES a) Foreign currency translation Assets and liabilities stated in currencies other than the reporting currency of the respective sub-fund have been translated at the exchange rates prevailing in Luxembourg at the balance sheet date. Income and expenses denominated in currencies other than the reporting currency of the respective sub-fund have been translated at the rate prevailing at the date of the transaction. As at December 31, 2017, the following exchange rates were used: 1 EUR = 1.5352 AUD 1 EUR = 135.2701 JPY 1 EUR = 1.6047 SGD 3.9832 BRL 1285.5164 KRW 4.5529 TRY 1.5045 CAD 23.4942 MXN 1.2008 USD 1.1701 CHF 4.8596 MYR 14.8659 ZAR 25.5290 CZK 9.8217 NOK 9,3423 HKD 7.4454 DKK 1.6884 NZD 4,1635 ILS 0.8876 GBP 4.1725 PLN 183,3635 LKR 310.2050 HUF 69.1315 RUB 35,734 TWD 16291.8542 IDR 9.8315 SEK 3580.50 COP 76.6441 INR 737,58 CLP
b) Realised profit and loss on securities The profit and loss realised on sale of investments are determined on the basis of the average cost of securities sold. c) Forward foreign exchange contracts Outstanding forward foreign exchange contracts are valued at the closing date by reference to the rate of exchange applicable to the outstanding life of the contract. The unrealised appreciation and depreciation is disclosed in the statement of net assets. Realised profit/(loss) and change in unrealised appreciation/depreciation resulting there from are included in the statement of operations and changes in net assets respectively under “Net realised profit/(loss) on forward foreign exchange contracts “and “Movement in net unrealised appreciation/depreciation on forward foreign exchange contracts”. For the details of outstanding Forward foreign exchange contracts please refer to section “Option and derivative instruments”. d) Dividend and interest income Dividend income is recorded as of the ex-dividend date and net of withholding tax. Interest income is recorded on an accrual basis and net of withholding tax. e) Portfolio valuation The value of any transferable securities which are listed on a Stock Exchange or dealt in on a regulated market is determined according to their last available price. In the event that any transferable securities held by the Fund at the valuation day are neither quoted on a Stock Exchange nor dealt in on another regulated market, their valuation is based on the expected sales price, estimated prudently and in good faith by the Board of Directors of the Management Company.
NEF
Page 180
Other notes to the financial statements as at December 31, 2017 (continued)
2. SUMMARY OF SIGNIFICANT ACCOUNTING PRINCIPLES (continued)
Money market instruments and fixed interest securities with a maturity of less than 60 days may be valued on the basis of their discounted cost. This method consists of taking into account a fixed daily discount to reach the redemption price at the maturity date. f) Futures contracts Open futures contracts are valued at their last known price on the valuation date or on the closing date. The unrealised appreciation or depreciation on futures contracts is recorded in the statement of net assets. Realised profit/(loss) and change in unrealised appreciation/depreciation resulting there from are included in the statement of operations and changes in net assets respectively under “Net realised profit/(loss) on financial futures” and “Movement in net unrealised appreciation (depreciation) on financial futures”. For the details of outstanding future contracts, please refer to section “Option and derivative instruments”. g) Securities lending income Securities lending income is recognised on a cash basis and recorded in the statement of operations and changes in net assets under the heading “securities lending income”. h) Options Options are valued at their last know price on the valuation date or on the closing date. The market value of options is include in the statement of net assets under the heading “Options purchased /sold at market value”. The realised profit/(loss) and changes in unrealized result on options are disclosed in the statement of operations and changes in net assets respectively under the headings “Net realised profit/(loss) on options” and “Movement in net unrealised appreciation (depreciation) on options”. For the details of outstanding option contracts, please refer to section “Option and derivative instruments”. i) Swaps Interest Rate Swaps (IRS) are valued on the basis of the difference between the discounted value of all future cash flows paid by the Fund to the counterparty on the valuation date at the “zero coupon swap” rate corresponding to the maturity of those cash flows, and the discounted value of all future cash flows paid by the counterparty to the Fund on the valuation date at the “zero coupon swap” rate corresponding to the maturity of those cash flows. The unrealised appreciation and depreciation is disclosed in the statement of net assets. A Credit Default Swap (CDS) is a bilateral agreement in which one counterparty (the protection buyer) pays a periodic fee in return for a contingent payment by the protection seller following a credit event on any reference issuers. When the difference between the loss due to a credit event and the periodic fee is positive, the protection buyer usually receives a cash settlement corresponding to such difference. When such difference is negative, the cash settlement is usually received by the protection seller. The unrealised appreciation and depreciation is disclosed in the statement of net assets. j) Repurchase agreements Repurchase agreements ("Repos") consist of the purchase and sale of securities with a clause reserving the seller the right to repurchase from the acquirer the securities sold at a price and term specified by the two parties in a contractual agreement. Each Sub-Fund can act either as purchaser or seller in Repos transactions. The involvement in such transactions is, in particular, subject to the following regulations:

NEF
Page 181
Other notes to the financial statements as at December 31, 2017 (continued)
2. SUMMARY OF SIGNIFICANT ACCOUNTING PRINCIPLES (continued) (a) The Sub-Fund may enter into these transactions only if the counterparties to these transactions are subject to prudential supervision rules considered by the CSSF as equivalent to those prescribed by Community law; (b) During the duration of a purchase with a repurchase option agreement, the Sub-Fund may not sell the securities which are the subject of the contract, before the counterparty has exercised its option or until the deadline for the repurchase has expired, unless the Sub-Fund has other means of coverage; (c) The Sub-Fund must ensure to maintain the value of the purchase with repurchase option transactions at a level such that it is able, at all times, to meet its redemption obligations towards Unitholders. The interest charged for the Repos transactions is included in the statement of operations and changes in net assets under “Other expenses”. The income generated by the Repos transactions are included in the statement of operations and changes in net assets under “Income on repurchase transactions”. k) Securities portfolio’s presentation The securities portfolios are presented as follows: 1) by transferable securities admitted to an official stock exchange listing, dealt in on another regulated market and other transferable securities 2) by stock exchange place 3) by country or by sector l) Abbreviations used XX: Perpetual Bonds U: Zero Coupon Bond CV: Convertible A: Annual S: Semi-annual Q: Quarterly M: Monthly m) Transaction fees Transaction fees include Investment Management Service fees (“IMS” fees), broker fees, forex fees, stock exchange fees, handling charges, settlement fees and trading fees linked to transactions on portfolio securities, forward foreign exchange contracts and futures contracts. n) Correspondent bank fees Correspondent bank fees include fees and expenses charged by correspondent bank in Italy, as agreed with the Management Company.
3. DETERMINATION OF THE NET ASSET VALUE OF UNITS The Net Asset Value per Unit of each Category of Unit in each sub-fund is determined by dividing the value of the total net assets of that sub-fund properly allocable to such category by the total number of Units of such category outstanding on such valuation day.

NEF
Page 182
Other notes to the financial statements as at December 31, 2017 (continued)
4. TAXATION The Fund is registered in Luxembourg and as a result, is exempt from tax except for the “taxe d'abonnement”. Under current legislation, Category of Units reserved to institutional investors are subject to a tax rate of 0.01%, those reserved to retail investors are subject to a tax rate of 0.05%. The tax is calculated and payable quarterly on the net assets of the Fund at the end of the relevant quarter.
5. MANAGEMENT FEES Under the terms of the prospectus of the Fund, the Management Company has appointed investment managers for each sub-fund. The investment managers are entitled to an annual fee payable monthly or quarterly by the Management Company, based on the monthly average total net assets of each sub-fund and related to each category. As at December 31, 2017, the maximal annual rates were as follows:
Management fees
Sub-funds Category R
Category I
Category D
Category C
Category PIR
NEF - Global Equity 1.90% 0.75% - - -NEF - Euro Equity 1.70% 0.65% - - -NEF - Emerging Market Equity 2.10% 0.85% - - -NEF - Global Bond 1.40% 0.50% - - -NEF - Euro Bond 1.20% 0.40% - - -NEF - Emerging Market Bond 1.80% 0.65% - - -NEF - Euro Short Term Bond 0.70% 0.25% 0.40% 0.30% -NEF - Risparmio Italia (previously NEF - Convertible Bond) 1.30% 0.60% - - 1.30%NEF - EE.ME.A. Equity 2.10% 0.65% - - -NEF - U.S. Equity 2.10% 0.65% - - -NEF - Pacific Equity 2.10% 0.70% - - -NEF - Euro Corporate Bond 1.10% 0.40% 1.10% - -NEF - Ethical Total Return Bond (previously NEF - Absolute Return Bond) 0.80% 0.40% 0.80% - -
NEF - Global Property 1.80% 1.10% - - -NEF - Ethical Balanced Dynamic (previously Ethical Balanced) 1.35% 0.50% 1.35% 0.65% -
NEF - Ethical Balanced Conservative 1.20% 0.45% 1.20% 0.60% -NEF - Obiettivo 2018 (until November 17,2017) - - 1.00% - -NEF - Obiettivo 2019 (until November 17,2017) - - 1.00% - -NEF - Obiettivo 2020 (until November 17,2017) - - 1.00% - -
6. SWAPS
As at December 31, 2017, CREDIT DEFAULT SWAPS were as follows: NEF - Global Bond
Description Protection
Buyer/ Seller
Counterparty Notional Maturity Ccy
Unrealised appreciation/ depreciation
(EUR)
TOTAL CAPITAL Buy BNP PARIBAS LONDON BRANCH GB 4,500,000.00 20/06/2021 EUR
-136,679.96
TOTAL
-136,679.96

NEF
Page 183
Other notes to the financial statements as at December 31, 2017 (continued)
6. SWAPS (continued) As at December 31, 2017, INTEREST RATE SWAPS were as follows: NEF - Ethical Total Return Bond (previously NEF- Absolute Return Bond)
Sub-Fund pays Sub-Fund receives Counterparty Notional Maturity Ccy
Unrealised appreciation/depreciation
(EUR) CHF LIBOR 6 MONTHS 0.21%
CITIGROUP GLOBAL MARKETS LTD LDN 1,540,000.00 18/09/2027 CHF -4,368.32
EUR EURIBOR 6 MONTHS 0.84%
MORGAN STANLEY AND CO INTERN PLC 2,950,000.00 18/09/2027 EUR -5,591.23
2.37% CAD CDOR 3 MONTHS
MORGAN STANLEY AND CO INTERN PLC 1,140,000.00 14/09/2027 CAD 788.58
1.23% SEK STIBOR 3 MONTHS
CITIGROUP GLOBAL MARKETS LTD LDN 2,000,000.00 25/09/2027 SEK -1,211.03
EUR EURIBOR 6 MONTHS 0.90%
CITIGROUP GLOBAL MARKETS LTD LDN 480,000.00 25/09/2027 EUR 1,758.62
1.27% SEK STIBOR 3 MONTHS
CITIGROUP GLOBAL MARKETS LTD LDN 2,400,000.00 16/10/2027 SEK -2,184.47
1.24% SEK STIBOR 3 MONTHS
CITIGROUP GLOBAL MARKETS LTD LDN 2,400,000.00 30/10/2027 SEK -1,450.38
EUR EURIBOR 6 MONTHS 0.92%
JP MORGAN SECURITIES LD 600,000.00 30/10/2027 EUR 2,973.77
NZD BBR 3 MONTHS 3.24%
MORGAN STANLEY AND CO INTERN PLC 900,000.00 30/10/2027 NZD 4,332.66
2.35% CAD CDOR 3 MONTHS
MORGAN STANLEY AND CO INTERN PLC 300,000.00 26/10/2027 CAD 731.17
EUR EURIBOR 6 MONTHS 0.83%
CITIGROUP GLOBAL MARKETS LTD LDN 11,100,000.00 22/11/2027 EUR -44,478.56
NZD BBR 3 MONTHS 3.13%
CITIGROUP GLOBAL MARKETS LTD LDN 2,500,000.00 22/11/2027 NZD -1,767.29
2.26% CAD CDOR 3 MONTHS
MORGAN STANLEY AND CO INTERN PLC 3,900,000.00 20/11/2027 CAD 29,606.68
1.23% GBP LIBOR 6 MONTHS
CITIGROUP GLOBAL MARKETS LTD LDN 1,580,000.00 14/09/2027 GBP 5,517.86
CHF LIBOR 6 MONTHS 0.24%
CITIGROUP GLOBAL MARKETS LTD LDN 1,500,000.00 22/11/2027 CHF -2,078.52
2.21% CAD CDOR 3 MONTHS
MORGAN STANLEY AND CO INTERN PLC 800,000.00 30/11/2027 CAD 8,254.58
1.12% SEK STIBOR 3 MONTHS
MORGAN STANLEY AND CO INTERN PLC 2,700,000.00 22/11/2027 SEK 1,668.66
0.27% JPY LIBOR 6 MONTHS
CITIGROUP GLOBAL MARKETS LTD LDN 117,600,000.00 22/11/2027 JPY 4,334.86
NZD BBR 3 MONTHS 3.10%
CITIGROUP GLOBAL MARKETS LTD LDN 900,000.00 18/12/2027 NZD -2,085.59
2.74%
AUD BANK BILL 6 MONTHS
CITIGROUP GLOBAL MARKETS LTD LDN 2,100,000.00 15/12/2027 AUD 8,233.20
1.36% GBP LIBOR 6 MONTHS
MORGAN STANLEY AND CO INTERN PLC 5,200,000.00 20/11/2027 GBP -49,771.56
0.25% JPY LIBOR 6 MONTHS
MORGAN STANLEY AND CO INTERN PLC 116,300,000.00 19/09/2027 JPY 5,010.87
2.84%
AUD BANK BILL 6 MONTHS
MERRILL LYNCH INTERN LDN 1,460,000.00 22/12/2027 AUD -2,757.83
TOTAL -44,533.27

NEF
Page 184
Other notes to the financial statements as at December 31, 2017 (continued)
7. DEPOSITARY FEES The depositary fees are paid by the Fund on the basis of business practice in Luxembourg. These fees are calculated on the monthly average net assets of the sub-funds and are payable monthly.
8. SECURITIES LENDING As at December 31, 2017, the Fund had entered into fully collateralised securities lending agreements with first-class financial institutions, as follows:
Sub-funds Ccy Counterparty Market Value
(EUR) % of Investments
Collateral Securities
Collateral Cash
NEF - Global Equity EUR CACEIS, Luxembourg Branch 16 492 914.74 14.75% 14 164 462.61 3 541 115.00
NEF - Euro Equity EUR CACEIS, Luxembourg Branch 82 172 033.25 26.16% 69 626 947.43 17 406 737.00
NEF - Emerging Market Equity EUR CACEIS, Luxembourg Branch 23 358 296.59 9.72% 19 567 241.76 4 891 810.00
NEF - Global Bond EUR CACEIS, Luxembourg Branch 28 390 427.78 15.17% 24 212 123.58 6 053 031.00
NEF - Euro Bond EUR CACEIS, Luxembourg Branch 27 206 880.94 17.61% 23 011 884.20 5 752 971.00
NEF - Emerging Market Bond EUR CACEIS, Luxembourg Branch 10 988 270.27 5.77% 9 371 564.90 2 342 891.00
NEF - Euro Short Term Bond EUR CACEIS, Luxembourg Branch 11 566 496.22 3.88% 9 770 147.81 2 442 537.00
NEF - Risparmio Italia (previously NEF - Convertible Bond) EUR
CACEIS, Luxembourg Branch 7 916 592.02 10.52% 6 760 583.08 1 690 146.00
NEF - EE.ME.A. Equity EUR CACEIS, Luxembourg Branch 4 725 751.44 7.34% 3 966 674.97 991 669.00
NEF - U.S. Equity EUR CACEIS, Luxembourg Branch 12 907 892.56 12.79% 10 926 553.67 2 731 638.00
NEF - Pacific Equity EUR CACEIS, Luxembourg Branch 11 596 664.13 13.24% 9 831 434.63 2 457 859.00
NEF - Euro Corporate Bond EUR CACEIS, Luxembourg Branch 14 404 795.19 5.62% 12 186 366.92 3 046 592.00
NEF - Ethical Total Return Bond (previously NEF - Absolute Return Bond) EUR
CACEIS, Luxembourg Branch 35 735 109.68 14.01% 30 260 003.45 7 565 000.00
NEF - Global Property EUR CACEIS, Luxembourg Branch 10 477 681.02 15.68% 8 834 863.34 2 208 716.00
NEF - Ethical Balanced Dynamic (previously Ethical Balanced) EUR
CACEIS, Luxembourg Branch 17 950 514.21 9.93% 15 203 672.51 3 800 918.00
NEF - Ethical Balanced Conservative EUR
CACEIS, Luxembourg Branch 13 013 338.89 17.30% 11 053 626.10 2 763 407.00

NEF
Page 185
Other notes to the financial statements as at December 31, 2017 (continued)
8.SECURITIES LENDING (continued)
Sub-funds Ccy Total gross amount
on SecuritiesLending income
Direct-indirect cost on Securities
Lending income
Total net amounton Securities
Lending income
NEF - Global Equity EUR 41 632.77 12 489.83 29 142.94 NEF - Euro Equity EUR 501 129.24 150 338.77 350 790.47 NEF - Emerging Market Equity EUR 77 125.89 23 137.77 53 988.12 NEF - Global Bond EUR 36 242.37 10 872.71 25 369.66 NEF - Euro Bond EUR 72 630.24 21 789.07 50 841.17 NEF - Emerging Market Bond EUR 34 389.71 10 316.91 24 072.80 NEF - Euro Short Term Bond EUR 92 932.29 27 879.69 65 052.60 NEF - Risparmio Italia (previously NEF - Convertible Bond) EUR 47 201.14 14 160.34 33 040.80 NEF - EE.ME.A. Equity EUR 22 560.74 6 768.22 15 792.52 NEF - U.S. Equity EUR 32 080.50 9 624.15 22 456.35 NEF - Pacific Equity EUR 157 752.23 47 325.67 110 426.56 NEF - Euro Corporate Bond EUR 43 785.67 13 135.70 30 649.97 NEF - Ethical Total Return Bond (previously NEF - Absolute Return Bond) EUR 5 589.60 1 676.88 3 912.72 NEF - Global Property EUR 17 243.01 5 172.90 12 070.11 NEF - Ethical Balanced Dynamic (previously Ethical Balanced) EUR 94 492.09 28 347.63 66 144.46 NEF - Ethical Balanced Conservative EUR 13 769.44 4 130.83 9 638.61 NEF - Obiettivo 2018(until November 17, 2017) EUR 155 098.39 46 529.52 108 568.87 NEF - Obiettivo 2019 (until November 17, 2017) EUR 51 002.71 15 300.81 35 701.90 NEF - Obiettivo 2020 (until November17, 2017) EUR 120 439.07 36 131.72 84 307.35 Total EUR 1 617 097.10 485 129.12 1 131 967.98

NEF
Page 186
Other notes to the financial statements as at December 31, 2017 (continued)
9. DIVIDENDS The Fund has distributed the following dividends during the year under review:
Sub-fund Ccy Payment date Unitary dividend in EUR
NEF - Ethical Total Return Bond (previously NEF - Absolute Return Bond) EUR
19/01/17 20/02/17 20/03/17 21/04/17 18/05/17 20/06/17 20/07/17
0.0060.0060.0060.0060.0060.0060.006
NEF - Obiettivo 2018 EUR 06/06/17 0.050
NEF - Obiettivo 2019 EUR 06/03/17 06/09/17
0.0500.050
NEF - Obiettivo 2020 EUR 06/03/17 06/09/17
0.0750.075
NEF - Euro Short Term Bond
EUR
19/01/17
0.028
10. SOFT COMMISSIONS The Investment Manager of NEF - U.S. Equity has entered into soft commission arrangements with brokers under which certain goods and services used to support the investment decision making and of demonstrable benefits to the sub-fund were received by the Investment Manager. The goods and services are paid for by the brokers out of commission they received and the Investment Manager does not make direct payment for these services. The goods and services utilised for the Fund include market analysis: data and quotation services, performance measurement and computer hardware and software incidental to the above goods and services; clearing and depositary services and investment related publications.
11. ANTIDILUATION LEVY FEES Redemptions/switches during the life of the sub-fund will be subject to an “antidilution levy” of 2% the 2 first years and then of 1% for the remaining term. During the year, these sub-funds were concerned:
- NEF - Obiettivo 2018 (until November 17, 2017) - NEF - Obiettivo 2019 (until November 17, 2017) - NEF - Obiettivo 2020 (until November 17, 2017)
12. CHANGES IN THE PORTFOLIO STATEMENT The report on the changes in the portfolio statement is available upon simple request at the registered office of the Management Company of the Fund and free of charge.

NEF
Additional information (unaudited)
Page 187
SFTR (SECURITIES FINANCING TRANSACTIONS AND OF REUSE REGULATION) :
SECURITIES LENDING TRANSACTIONS
NEF - Global Equity
NEF - Euro Equity
NEF - Emerging Market Equity
NEF - Euro Bond
Assets used In EUR In EUR In EUR In EUR In absolute terms 16,492,914.74 82,172,033.25 23,358,296.59 27,206,880.94
As a % of lendable assets 14.75 % 26.16% 9.72 % 17.61%
As a % of total net asset value 14.56% 25.76% 9.41% 17.05% Transactions classified according to residual maturities
In EUR In EUR In EUR In EUR
Less than 1 day - - - - From 1 day to 1 week - - - -
From 1 week to 1 month - - - 3,667,090.00 From 1 month to 3 months - - - 1,555,730.90
From 3 months to 1 year - - - 1,213,015.32 Above 1 year - - - -
Open maturity 16,492,914.74 82,172,033.25 23,358,296.59 20,771,044.72
Collateral received Type
Cash Bond Total
3,541,115.00 14,164,462.61 17,705,577.61
17,406,737.00 69,626,947.43 87,033,684.43
4,891,810.00 19,567,241.76 24,459,051.76
5,752,971.00 23,011,884.20
28,764,855.20
Quality - Bond collateral issuers rating:
AA
- Bond collateral issuer rating: AA
Currency EUR EUR EUR EUR
Classification according to residual maturities:
Less than 1 day - - - - From 1 day to 1 week - - - -
From 1 week to 1 month - - - - From 1 month to 3 months - - - -
From 3 months to 1 year - 12,672,463.98 - - Above 1 year 14,164,462.61 56,954,483.45 19,567,241.76 23,011,884.20
Open maturity 3,541,115.00 17,406,737.00 4,891,810.00 5,752,971.00
The 10 largest issuers of collateral received
- - -
First name German State Amount EUR
55,081,566.96
Second name Dutch State - Amount EUR
14,545,380.47 -
Revenue and expenditure components In EUR In EUR In EUR In EUR
Revenue component of the fund: In absolute amount 29,142.94 350,790.47 53,988.12 50,841.17
In % of gross revenue 70% 70% 70% 70% Revenue component of the
Management Company
In absolute amount 832.66 10,022.58 1,542.52 1.452.60 In % of gross revenue 2% 2% 2% 2%
Revenue component of third parties In absolute amount 11,657.18 140,316.19 21,595.25 20,336.47
In % of gross revenue 28% 28% 28% 28%

NEF
Additional information (unaudited)
Page 188
SECURITIES LENDING
TRANSACTIONS NEF -
Emerging Market Bond
NEF - Euro Short Term
Bond
NEF - NEF RISPARMIO
ITALIA
NEF – EE.ME.A.
Equity Assets used In EUR In EUR In EUR In EUR
In absolute terms 10,988,270.27 11,566,496.22 7,916,592.02 4,725,751.44 As a % of lendable assets 5.77% 3.88% 10.52% 7.34%
As a % of total net asset value 13.38% 3.84% 9.34% 7.28% Transactions classified according to residual maturities
In EUR In EUR In EUR In EUR
Less than 1 day - - - - From 1 day to 1 week 611,790.00 - - -
From 1 week to 1 month 5,467,906.62 5,680,106.44 - - From 1 month to 3 months - - - -
From 3 months to 1 year - 508,740.00 - - Above 1 year - - -
Open maturity 4,908,573.66 5,377,649.78 7,916,592.02 4,725,751.44 Collateral received Type
Cash Bond
2,342,891.00 9,371,564.90
2,442,537.00 9,770,147.81
1,690,146.00 6,760,583.08
991,669.00 3,966,674.97
Total 11,714,455.90 12,212,684.81 8,450,729.08 4,958,343.97
Currency EUR EUR EUR EUR
Classification according to residual maturities:
Less than 1 day - - - - From 1 day to 1 week - - - -
From 1 week to 1 month - - - - From 1 month to 3 months - - - -
From 3 months to 1 year 5,500,352.49 9,770,147.81 - - Above 1 year 3,871,212.41 - 6,760,583.08 3,966,674.97
Open maturity 2,342,891.00 2,442,537.00 1,690,146.00 991,669.00
Revenue and expenditure components In EUR In EUR In EUR In EUR Revenue component of the fund:
In absolute amount 24,072.80 65,052.60 33,040.80 15,792.52 In % of gross revenue 70% 70% 70% 70%
Revenue component of the Management Company
In absolute amount 687.79 1,858.65 944.02 451.21 In % of gross revenue 2% 2% 2% 2%
Revenue component of third parties In absolute amount 9,629.12 26,021.04 13,216.32 6,317.01
In % of gross revenue 28% 28% 28% 28%

NEF
Additional information (unaudited)
Page 189
SECURITIES LENDING TRANSACTIONS
NEF - U.S. Equity
NEF - Pacific Equity
NEF - Euro Corporate
Bond
NEF - Global Property
Assets used In EUR In EUR In EUR In EURIn absolute terms 12,907,892.56 11,596,664.13 14,404,795.19 10,477,681.02
As a % of lendable assets 12.79% 13.24% 5.62% 15.68% As a % of total net asset value 12.67% 13.06% 5.52% 15.18%
Transactions classified according to residual maturities
In EUR In EUR In EUR In EUR
Less than 1 day - - - - From 1 day to 1 week - - - -
From 1 week to 1 month - - 5,072,769.64 - From 1 month to 3 months - - - -
From 3 months to 1 year - 789,122.52 - - Above 1 year - - - -
Open maturity 12,907,892.56 10,807,541.61 9,332,025.55 10,477,681.02 Collateral received Type
Cash Bond Total
2,731,638.00 10,926,553.67 13,658,191.67
2,457,859.00 9,831,434.63
12,289,293.63
3,046,592.00 12,186,366.92 15,232,958.92
2,208,716.00 8,834,863.34
11,043,579.34 Quality - - - -
Currency EUR EUR EUR EUR Classification according to residual
maturities:
Less than 1 day - - - - From 1 day to 1 week - - - -
From 1 week to 1 month - - - - From 1 month to 3 months - - - -
From 3 months to 1 year - - - - Above 1 year 10,926,553.67 9,831,434.63 12,186,366.92 8,834,863.34
Open maturity 2,731,638.00 2,457,859.00 3,046,592.00 2,208,716.00
Revenue and expenditure components In EUR In EUR In EUR In EUR Revenue component of the fund:
In absolute amount 22,456.35 110,426.56 30,649.97 12,070.11 In % of gross revenue 70% 70% 70% 70%
Revenue component of the Management Company
In absolute amount 641.61 3,155.04 875.71 344.86 In % of gross revenue 2% 2% 2% 2%
Revenue component of third parties In absolute amount 8,982.54 44,170.62 12,259.99 4,828.04
In % of gross revenue 28% 28% 28% 28%

NEF
Additional information (unaudited)
Page 190
SECURITIES LENDING TRANSACTIONS
NEF – Global Bond
NEF – Ethical Balanced
Conservative
NEF - Ethical Balanced Dynamic
NEF –Ethical Total Return
Bond Assets used In EUR In EUR In EUR In EUR
In absolute terms 28,390,427.78 13,013,338.89 17,950,514.21 35,735,109.68 As a % of lendable assets 15.17% 17.30% 9.93% 14.01%
As a % of total net asset value 14.72% 16.15% 8.72% 13.52% Transactions classified according to residual maturities
In EUR In EUR In EUR In EUR
Less than 1 day - - - - From 1 day to 1 week 8,408,030.16 - - 1,204,572.00
From 1 week to 1 month 1,621,332.28 8,720,591.62 5,055,902.20 18,096,543.85 From 1 month to 3 months - - - -
From 3 months to 1 year - - 477,785.00 494,180.00 Above 1 year - - - -
Open maturity 18,361,065.34 4,292,747.27 12,416,827.01 15,939,813.83 Collateral received Type
Cash Bond Total
6,053,031.00 24,212,123.58 30,265,154.58
2,763,407.00 11,053,626.10 13,817,033.10
3,800,918.00 15,203,672.51 19,004,590.51
7,565,000.00 30,260,003.45 37,825,003.45
Quality - - -
-
Currency EUR EUR
EUR
EUR
Classification according to residual maturities:
Less than 1 day - - - - From 1 day to 1 week - - - -
From 1 week to 1 month - - - - From 1 month to 3 months - - - 2,237,413.80
From 3 months to 1 year - - - - Above 1 year 24,212,123.58 3,032,952.80- 15,203,672.51 28,022,589.65
Open maturity 6,053,031.00 10,784,080.30 3,800,918.00 7,565,000.00
Revenue and expenditure components In EUR In EUR In EUR In EUR Revenue component of the fund:
In absolute amount 25,369.66 9,638.61 66,144.46 3,912.72 In % of gross revenue 70% 70% 70% 70%
Revenue component of the Management Company
In absolute amount 724.85 275.39 1,889.84 111.79 In % of gross revenue 2% 2% 2% 2%
Revenue component of third parties In absolute amount 10,147.86 3,855.44 26,457.78 1,565.09
In % of gross revenue 28% 28% 28% 28%
Each sub-fund has CACEIS Bank, Luxembourg Branch as sole counterparty for securities lending positions and as depositary for collateral received. All transactions are bilateral transactions.

NEF
Additional information (unaudited)
Page 191
REMUNERATION POLICY (UCITS V)
Information concerning the remuneration policy: Nord Est Asset Management S.A., the Management Company of the NEF Fund has designed and implemented a remuneration policy (the “Remuneration Policy”) in line with the provisions on remuneration as set out by the European Directive 2009/65/EC (“UCITS Directive”), as amended by Directive 2014/91/EU (“UCITS V Directive”) as implemented into Luxembourg in the Law of 10 May 2016 (the “2016 Law”). The Remuneration Policy validated by the Board Of directors provides that neither fixed or variable remuneration is connected to quantitative indicators on products performance. The fixed remuneration is composed by the remuneration defined in the employment contract, ticket restaurant and by an integrative pension plan. The variable remuneration depends on the achievement of specific professional and technical objectives assigned to employees in a multi-year framework. The variable remuneration payable is capped and it may not exceed 50% of contractual remuneration. The objectives evaluated for the assignment of the variable remuneration are purely qualitative and are set and evaluated annually. EMPLOYEE REMUNERATION DISCLOSURE -------------------------------- The staff costs of the Management Company and the number of Identified Staff (as defined in ESMA’s Guidelines on Sound Remuneration Policies Under the UCITS Directive dated 14 October 2016) of the Management Company are the following: Nord Est Asset Management S.A. Headcount (directors, senior management and staff) : 9 The figures have been prepared taking into consideration point 162 of section 14.1 of the ESMA remuneration guidelines relating to the confidentiality and data protection in presenting the remuneration information. Fixed remuneration: 342 000 EUR Variable remuneration: 16 000 EUR Total remuneration: 358 000 EUR
GLOBAL EXPOSURE CALCULATION METHOD The commitment approach The following sub-funds use the commitment approach in order to monitor and measure the global exposure: Sub-funds NEF - Global Equity NEF - Euro Equity NEF - Emerging Market Equity NEF - Euro Bond NEF - Emerging Market Bond NEF - Euro Short Term Bond NEF - Risparmio Italia (previously NEF - Convertible Bond) NEF - EE.ME.A. Equity NEF - U.S. Equity NEF - Pacific Equity NEF - Euro Corporate Bond NEF - Global Property NEF - Ethical Balanced Dynamic (previously Ethical Balanced) NEF - Ethical Balanced Conservative

NEF
Additional information (unaudited)
Page 192
GLOBAL EXPOSURE CALCULATION METHOD (continued)
The absolute VaR approach The sub-fund NEF - Global Bond uses the absolute Value at Risk (VaR) approach in order to monitor and measure the global exposure. The limit is set at 20%. The VaR and utilisation of the VaR limits (VaR/VaR limit) during the financial year were as follows, respectively :
- Lowest utilisation : 2.09% 10.46% - Highest utilisation : 6.54% 32.72% - Average utilisation : 3.75% 18.76%
The VaR figures have been calculated based on the following input data :
- Model used : Monte Carlo Simulations - Confidence level : 99% - Holding period : 20 days - Length of data history : 1 year
The average sum of notionals of financial derivative instruments used during the financial year was 391.92%.
Leverage levelsMin 273.65%Max 633.29%Average 391.92%
The sub-fund NEF - Ethical Total Return Bond (previously NEF - Absolute Return Bond) uses the absolute Value at Risk (VaR) approach in order to monitor and measure the global exposure. The limit is set at 20%. The VaR and utilisation of the VaR limits during the financial year were as follows, respectively :
- Lowest utilisation : 0.0064% 0.03% - Highest utilisation : 2.61% 13.05% - Average utilisation : 1.16% 5.78%
The VaR figures have been calculated based on the following input data :
- Model used : Historical Simulations - Confidence level : 99 % - Holding period : 20 days - Length of data history : 1 year
The average sum of notionals of financial derivative instruments used during the financial year was 134.87%.
Leverage levelsMin 0.00%Max 294.85%Average 134.87%
Copyright © 2022 FDOKUMEN