Needs Assessment Report on the Village Level - ReliefWeb
78
Needs Assessment Report on the Village Level –Aleppo Province 1 of 78 معلومات وحدة إدارة الInformation Management Unit
-
Upload
khangminh22 -
Category
Documents
-
view
2 -
download
0
Transcript of Needs Assessment Report on the Village Level - ReliefWeb

Needs Assessment Report on the Village Level –Aleppo Province
1 of 78 وحدة إدارة المعلومات
Information Management Unit
Needs Assessment Report on the Village Level –Aleppo Province
2 of 78 وحدة إدارة المعلومات
Information Management Unit
The Information Management Unit (IMU) seeks to build stronger capacities of active parties for decision making in the Syrian crisis. This is done through collecting, analyzing and sharing information on the humanitarian status in Syria. To this end, the Information Management Unit has established a huge network of researchers selected on the basis of specific criteria such as education level, association with information sources and ability to work and communicate under various conditions. IMU collects information that is difficult to be reached by the active international parties, produces different types of outputs such as maps, daily reports, case-specific distress calls, reports on camp monitoring, a monthly food item price index and thematic reports.
-www.acu, you may visit (Information Management UnitFor further information and reception of products of ).010/77/88/99-22-342-90+) or call us on (sy.org-imu@acu() or directly contact us via email sy.org

Needs Assessment Report on the Village Level –Aleppo Province
3 of 78 وحدة إدارة المعلومات
Information Management Unit
Table of Contents Summary .............................................................................................................. Error! Bookmark not defined.
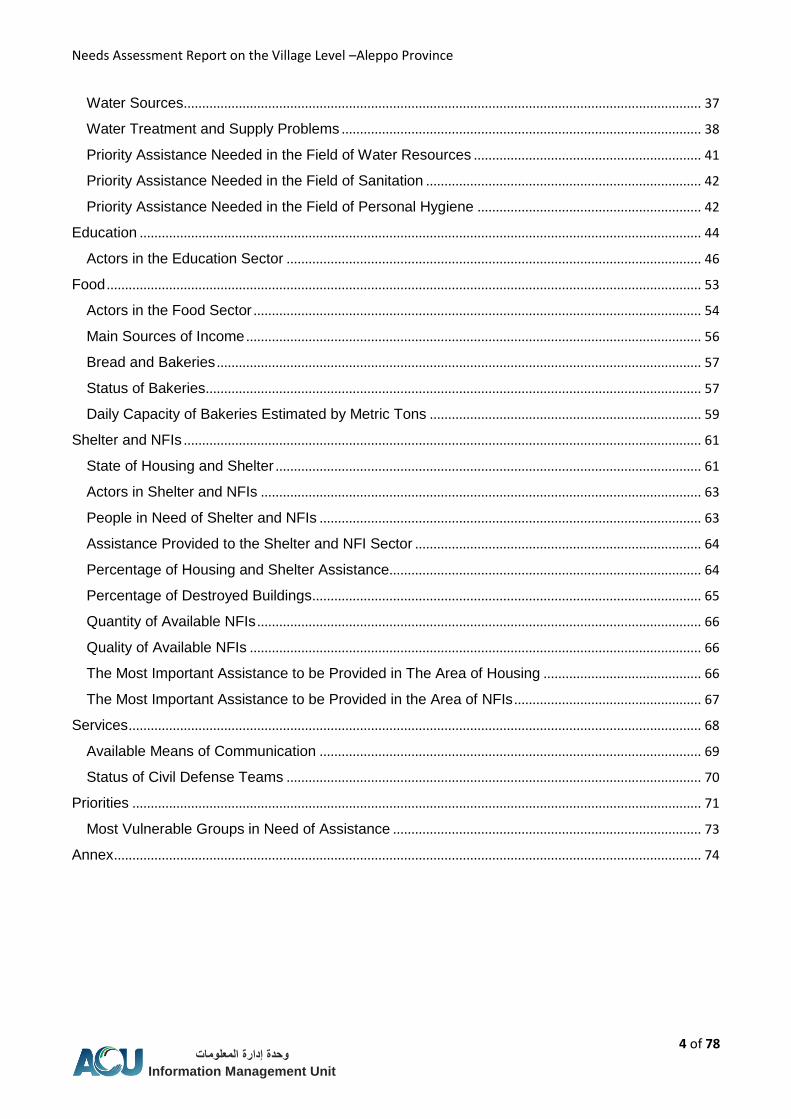
Figures ................................................................................................................................................................. 8
Tables ................................................................................................................................................................... 8
Maps .................................................................................................................................................................... 8
Heat Maps ........................................................................................................................................................... 9
Introduction ...................................................................................................................................................... 11
Methodology ................................................................................................................................................ 12
Secondary Sources of Information Review............................................................................................. 14
Assessment Sample ................................................................................................................................... 14
Assessment Tools ...................................................................................................................................... 14
Data Collection ............................................................................................................................................ 14
Validation and review (Debriefing) ........................................................................................................... 16
Levels of Credibility .................................................................................................................................... 16
Data Management and Analysis .............................................................................................................. 17
Restrictions and Limitations ...................................................................................................................... 17
Demographic Composition ............................................................................................................................ 18
Cases of Displacement .............................................................................................................................. 20
Vulnerable Groups ...................................................................................................................................... 23
Local residents who remained in their villages....................................................................................... 23
Host Families ............................................................................................................................................... 24
IDPs living in Under-Construction Buildings ........................................................................................... 24
IDPs Living in Mass Shelters .................................................................................................................... 25
IDPs Living with Host Families ................................................................................................................. 25
Humanitarian Assistance ............................................................................................................................... 26
Areas of Control .............................................................................................................................................. 27
Health ............................................................................................................................................................... 28
Actors in the Health Sector........................................................................................................................ 30
Types of Provided Health Care Assistance ............................................................................................ 31
Required Humanitarian Assistance Priorities in the Health Sector ..................................................... 32
Cost of Health Services ............................................................................................................................. 32
Number of Mortalities in January and February ..................................................................................... 33
Percentage of Medical Services Provided .............................................................................................. 33
Health Problems Prevalent in the Villages .............................................................................................. 34
WASH ............................................................................................................................................................... 35
Actors in the Water and Sanitation Sector .............................................................................................. 36
Needs Assessment Report on the Village Level –Aleppo Province
4 of 78 وحدة إدارة المعلومات
Information Management Unit
Water Sources ............................................................................................................................................. 37
Water Treatment and Supply Problems .................................................................................................. 38
Priority Assistance Needed in the Field of Water Resources .............................................................. 41
Priority Assistance Needed in the Field of Sanitation ........................................................................... 42
Priority Assistance Needed in the Field of Personal Hygiene ............................................................. 42
Education ......................................................................................................................................................... 44
Actors in the Education Sector ................................................................................................................. 46
Food .................................................................................................................................................................. 53
Actors in the Food Sector .......................................................................................................................... 54
Main Sources of Income ............................................................................................................................ 56
Bread and Bakeries .................................................................................................................................... 57
Status of Bakeries ....................................................................................................................................... 57
Daily Capacity of Bakeries Estimated by Metric Tons .......................................................................... 59
Shelter and NFIs ............................................................................................................................................. 61
State of Housing and Shelter .................................................................................................................... 61
Actors in Shelter and NFIs ........................................................................................................................ 63
People in Need of Shelter and NFIs ........................................................................................................ 63
Assistance Provided to the Shelter and NFI Sector .............................................................................. 64
Percentage of Housing and Shelter Assistance..................................................................................... 64
Percentage of Destroyed Buildings .......................................................................................................... 65
Quantity of Available NFIs ......................................................................................................................... 66
Quality of Available NFIs ........................................................................................................................... 66
The Most Important Assistance to be Provided in The Area of Housing ........................................... 66
The Most Important Assistance to be Provided in the Area of NFIs ................................................... 67
Services ............................................................................................................................................................ 68
Available Means of Communication ........................................................................................................ 69
Status of Civil Defense Teams ................................................................................................................. 70
Priorities ........................................................................................................................................................... 71
Most Vulnerable Groups in Need of Assistance .................................................................................... 73
Annex ................................................................................................................................................................ 74

Needs Assessment Report on the Village Level –Aleppo Province
5 of 78 وحدة إدارة المعلومات
Information Management Unit
Summary
The ongoing conflict taking-place in Syria has instigated one of the most exacting
humanitarian crisis in world history since World War II. According to the evaluation of overall
humanitarian needs issued by United Nations Office for Humanitarian Affairs in 2015,
humanitarian needs have risen ten folds since the onset of the Syrian crisis. The number of
Syrian people in need of humanitarian assistance has reached twelve million and two
hundred thousand people, five million of them are children. The Syrian crisis was responsible
for the displacement of about ten million and eight hundred thousand people, seven million
and six hundred thousand of them are IDPs; making the Syrian crisis one of the biggest
displacement crises in the world.
The Information Management Unit (IMU) of the Assistance Coordination Unit (ACU) has
conducted a comprehensive assessment study in order to assess public needs at the village
level adopting a methodology similar, largely, to that of data collection and analysis
methodology used in periodic monitoring procedures. This report was issued based on a
three-month process of data collection that included Aleppo and its 13 sub-districts.
The main objective of this special assessment is to narrow down the circle of information into
a smaller, more focused one, to understand the situation at hand more clearly. In addition to
identifying areas of problem more specifically; which, in turn, can provide better guidance on
how to direct needs more effectively compared to the regular, wide scale and more general
assessments on the level of region or sub-district.
This report offers detailed information on each of the targeted sectors and includes the
following points:
The number of villages included in the study is 222 villages, distributed over 13 sub-
districts. The largest number of villages is located in Tall Ed-daman which
encompasses 57 villages, leaving Zarbah with only 26. We were able to cover 86% of
the targeted villages.
The current number of population in the targeted villages has reached 0775375,1
people, with Jebel Saman having the highest population density of 429,969 people. In
comparison with the 378,57,,3 people registered in 2011, a clear decrease in
population can be noticed. There has been a decrease by 1,114,143 people as a direct
result of displacement, evacuation and killing due to military actions and bombardment
these villages have witnessed.
The villages were generally accessible in terms of humanitarian assistance. Only five
villages were not accessible in the sub-districts of Suran, Mare’, Haritan and Tall Ed-
daman.
There are basically four villages in Aleppo Province. The strongest power dominating
these villages is ISIL, which controls 52% of the Province, while the Opposition Forces
controls 21%, while the control in the rest of the Province is shared between the regime
and the Kurdish forces.
The health sector is suffering a continuous state of deterioration, which affects the
entire country. According to the Syrian Network for Human Rights, the number of
wounded people has exceeded one million, not to mention the damages that have
affected 64% of the hospitals, 40% of them are out of order, as stated in one of the

Needs Assessment Report on the Village Level –Aleppo Province
6 of 78 وحدة إدارة المعلومات
Information Management Unit
UN statistical studies. Some 46% of the villages in the study were found to suffer from
minor lack of health care while 52% of the villages suffered significant shortages in
that domain. The villages that suffered severe lack of health care causing mortalities
have reached 2%, mostly in Atareb Sub-district, despite their access to humanitarian
aid. In terms of diseases and medical disorders, skin diseases and leishmaniasis were
found to be the most prevalent among the villages covered, 36%, whereas respiratory
complaints came second at 23%, giving chronic diseases the third place at 22%.
Since the beginning of the Syrian uprise, the water and sanitation systems suffered
immensely. 35% of these networks were damaged, leaving 43% of villages without
any access to treated drinking water. The number of people in need of potable water
is 709,199 people, while 164 villages did not receive any form of support in terms of
water and sanitation. In terms of drinking water availability, 88% of the villages under
study believe that the water they have been using is actually potable water. We can
also notice the problem of garbage accumulation in public areas which forms 83% of
all present problems.
The status of education can be considered generally bad in most areas, especially in
the villages of Tall Ed-daman, located to the south of Aleppo city, followed by the
villages of both Suran and Mare’ sub-districts where many students have dropped out
of schools for over a year. However, most villages in each of Tal Rifat, Daret Azza and
Atareb have a low rate of dropouts for over a year. This report also depicts the students
with access to educational facilities who are still prevented by their families from
attending school; for security precautions, or the need to quit school to make a living
and support their families, because of dying resources consumed by the crisis. The
crisis that left the providers of families jobless, or left the families without their providers
for detention, death, or disappearance.
The problem of electricity rationing was present prior to the uprise, but it deteriorated
after the uprise when the regime increased electricity rationing hours to a hefty period
of 19-24 hours per day, especially in areas out of the regime’s grip. The civil defense
status indicates that the mighty efforts exerted by civil defense groups actually play a
huge role in saving civilians’ lives especially in areas where the regime has no control.
It is apparent how civilians in non-regime areas are suffering from daily air strikes and
arbitrary barrel bombs. Civil defense groups, however, are suffering sharp shortages
in facilities, funding and equipment, making it difficult for these teams to handle the
enormous damage hitting these areas. There are 56 villages in the area with no civil
defense groups available, neither in them, or in the nearby villages around them, in
case of emergency.
The food sector has also suffered severe deterioration calling for immediate support
for the Syrian people. During this study, it was determined that 56% of the villages
under study are suffering extreme food shortages. İt is also found that the number of
people in severe need of humanitarian food support has reached 122,465. In terms of
the presence of different active food aid organizations, the study concluded that Tal
Rifat does not have any active organizations and that 55 villages failed to receive any
support in terms of food and nutrition. After checking with the locals, bread came first
as a priority, 51%, taking into consideration that in the southern areas, bread provision
is almost absent (in Hajeb and Tall Ed-daman). The main reason behind the closed
bakeries was shortages in wheat commodity.

Needs Assessment Report on the Village Level –Aleppo Province
7 of 78 وحدة إدارة المعلومات
Information Management Unit
The study demonstrates that 72% of the villages included in the study do not suffer
from significant problems in terms of housing and shelter, whereas 4% of the locals in
the villages do not have any problems to be reported, at all.
The highest priority of the people living in the studied villages was water, which came
at 37% of all other sectors in need of support. This is followed by food at 24% and
education, at 20 %. The categories who needed the most support were the IDPs living
in mass shelters who scored 31% of the overall needs, whereas the percentage of the
rest of the IDPs occupying vacant buildings has reached second level at 25%. In the
third level, 20%, came the IDPs who are living with host families.
The actors working in the sectors included in this study were categorized into five
different categories:
a. UN Organizations
b. International NGOs
c. The Syrian Red Crescent
d. Local organizations and initiatives and charitable organizations
e. Local Relief Committees.
Needs Assessment Report on the Village Level –Aleppo Province
8 of 78 وحدة إدارة المعلومات
Information Management Unit
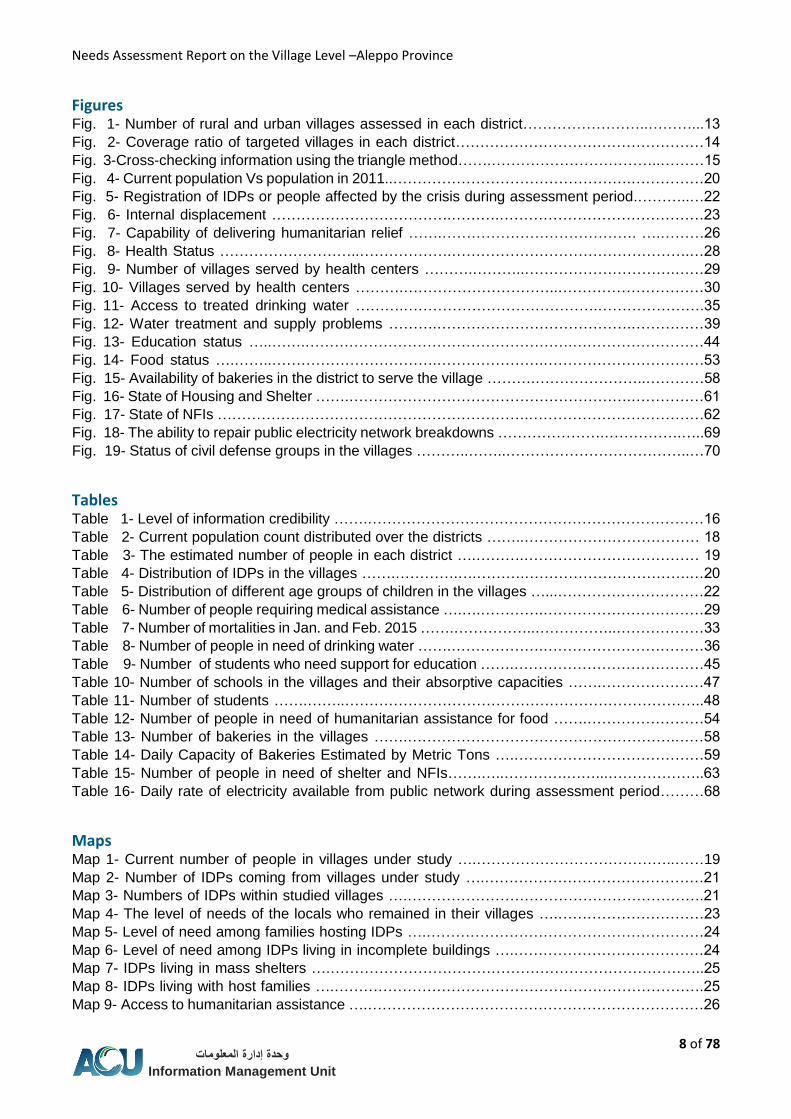
Figures Fig. 1- Number of rural and urban villages assessed in each district……………………..………...13
Fig. 2- Coverage ratio of targeted villages in each district……………………………………………14
Fig. 3-Cross-checking information using the triangle method…….……………………………..………15
Fig. 4- Current population Vs population in 2011..………………………………………….……………20
Fig. 5- Registration of IDPs or people affected by the crisis during assessment period.………..…22
Fig. 6- Internal displacement ……………………………….……….……………………………………23
Fig. 7- Capability of delivering humanitarian relief …….…………………………………. ….………26
Fig. 8- Health Status ………………………..……………….………………………………………….…28
Fig. 9- Number of villages served by health centers ……….………..………………………….……29
Fig. 10- Villages served by health centers ……….…………………………..…………………………30
Fig. 11- Access to treated drinking water ……….………………………………….………………….35
Fig. 12- Water treatment and supply problems ……….………………………………….……………39
Fig. 13- Education status …..…….……………………………………………….………………………44
Fig. 14- Food status ….……..…………………………….………………….……………………………53
Fig. 15- Availability of bakeries in the district to serve the village ……….…………………..…………58
Fig. 16- State of Housing and Shelter …….………………………………………………….……………61
Fig. 17- State of NFIs ……………………………………………………….………………………………62
Fig. 18- The ability to repair public electricity network breakdowns ………………….…………….…..69
Fig. 19- Status of civil defense groups in the villages ………..……..………………………………..…70
Tables Table 1- Level of information credibility …….……………………………………………………………16
Table 2- Current population count distributed over the districts ……..……………………………… 18
Table 3- The estimated number of people in each district ….……….……………………………… 19
Table 4- Distribution of IDPs in the villages …….………….….……….…………………………….…20
Table 5- Distribution of different age groups of children in the villages …...…………………………22
Table 6- Number of people requiring medical assistance ….….………….……………………………29
Table 7- Number of mortalities in Jan. and Feb. 2015 …….……………..……………..………………33
Table 8- Number of people in need of drinking water …….……………….……………………………36
Table 9- Number of students who need support for education …….…………………………………45
Table 10- Number of schools in the villages and their absorptive capacities …….…………………47
Table 11- Number of students …….……..………………………………………………………………..48
Table 12- Number of people in need of humanitarian assistance for food …….……………………54
Table 13- Number of bakeries in the villages …….……………………………………………….……58
Table 14- Daily Capacity of Bakeries Estimated by Metric Tons ….…………………………………59
Table 15- Number of people in need of shelter and NFIs…….…..………….……...………………..63
Table 16- Daily rate of electricity available from public network during assessment period………68
Maps Map 1- Current number of people in villages under study ….…………………………………..……19
Map 2- Number of IDPs coming from villages under study ….………………………………………21
Map 3- Numbers of IDPs within studied villages ….…………………………………………………….21
Map 4- The level of needs of the locals who remained in their villages ….…………………………23
Map 5- Level of need among families hosting IDPs ….…………………………………………………24
Map 6- Level of need among IDPs living in incomplete buildings ….…………………………………24
Map 7- IDPs living in mass shelters ….…………………………………………………………………..25
Map 8- IDPs living with host families ….………………………………………………………………….25
Map 9- Access to humanitarian assistance ….……………………………………………………………26

Needs Assessment Report on the Village Level –Aleppo Province
9 of 78 وحدة إدارة المعلومات
Information Management Unit
Map 10- Area of influence ….……………………………………………………………….……………..27
Map 11- Health Status ….…………………………………………………………………………………28
Map 12- Availability of health centers ….…………………………………………………………………30
Map 13- Actors in the health sector ….……………………………………………………………………31
Map 14- Access to treated drinking water ….………………………….…………………………………35
Map 15- Actors in the water and sanitation sector ….………………..………………………………….36
Map 16- Education status ….………...……………………………………………………………………..44
Map 17- Actor in education sector ………………………………………………………………………….46
Map 18- Food status ….……………………….…………………………….………………………………53
Map 19- Actors in the food sector ….………..…………………………………………….……………….54
Map 20- Number and distribution of bakeries in the villages under study ….…………………………...57
Map 21- Daily Capacity of Bakeries Estimated by Metric Tons ….……………………………………60
Map 22- State of housing and shelter ….………………………………………………………………….61
Map 23- State of NFIs ….………………………………………………….……………………………….62
Map 24- Actors in shelter and NFIs ….……………………………….…………………….……………63
Heat Maps Heat Map 1- Types of Provided Health Care Assistance ……….…….………………………………..31
Heat Map 2- Types of Health Care Assistance …………………………………………………………32
Heat Map 3- Costs of Health Care services ………………………………………………………..……32
Heat Map 4- percentage of medical services provided ………..…………………………….…………34
Heat Map 5- Most recurrent health issues ……………………………………………………………....34
Heat Map 6- Percentage of water and sanitation assistance provided ……………………………37
Heat Map 7- Drinking water sources ………………………………………………………………..…..37
Heat Map 8- Suitability of drinking water in the village ………………………………………………38
Heat Map 9- Causes of water supply problems ………………………………………………………39
Heat Map 10- Water drainage methods …………………………………………………………………40
Heat Map 11- Most recurring problems in water and sanitation sector ……………………………41
Heat Map 12- Priority assistance needed in the field of water resources ….………………………41
Heat Map 13- Priority assistance needed in the field of sanitation …………………………………42
Heat Map 14- Priority assistance needed in the filed of personal hygiene …………………………43
Heat Map 15- Type of educational support provided in assessment period …………………………46
Heat Map 16- Percentage of assistance supporting the education sector …..………………………47
Heat Map 17- Why schools stopped working …………………………….………………………….….49
Heat Map 18- Why schools were not equipped …………………………………………………………49
Heat Map 19- Number of damaged or occupied schools ……...………………………..………………50
Heat Map 20- Why children and youths are prevented from access to education ……..……………51
Heat Map 21- Highest priority assistance required to improve the educational status in the village 52
Heat Map 22- Type of food assistance provided …………………………………………………………55
Heat Map 23- Percentage of assistance provided for food ………..……………………………………55
Heat Map 24- Food assistance required in the villages ……………..………………………………..…56
Heat Map 25- Sources of income in the villages …………………….……………………………………56
Heat Map 26- Current price of bread packets …………………………………………………….……….57
Heat Map 27- Reasons why bakeries stopped operating or operating intermittently ……...…………..59
Heat Map 28- Assistance provided to the shelter and NFI sector ………………………….……………64
Heat Map 29- Percentage of assistance provided for Shelter ………………………………...…………64
Heat Map 30- Percentage of Housing and Shelter Assistance………………………..…………….…...65
Heat Map 31- Percentage of damaged buildings and private residences ……...………………………65
Heat Map 32- Quantity of Available NFIs ………………………………………....…………………….…66
Heat Map 33- Quality of NFIs …………………………………………………..….……………………….65
Needs Assessment Report on the Village Level –Aleppo Province
10 of 78 وحدة إدارة المعلومات
Information Management Unit
Heat Map 34- Most Important Assistance to be Provided in The Area of Housing ……..………….…67
Heat Map 35- The Most Important Assistance to be Provided in the Area of NFIs ……...…………….67
Heat Map 36- Available means of communication ……………………………………………………..…69
Heat Map 37- First Priority Sector …………………………………………………………...……………..71
Heat Map 38- Second Priority Sector ……………………………………………………………………...72
Heat Map 39- Third priority sector …………………….……………………………….…………...………72
Heat Map 40- Most Vulnerable Groups in Need of Assistance ……….…………………………………73

Needs Assessment Report on the Village Level –Aleppo Province
11 of 78 وحدة إدارة المعلومات
Information Management Unit
Introduction
In addition to the significance of accurate information in making practical and strategic
decisions, and in setting priorities; information on the needs of those afflicted by the crisis
and on the areas of presence of humanitarian actors and their capacities, plays an enormous
role in effective coordination. This is where the pivotal role that the IMU of the ACU plays,
appears among the efforts that aim to provide studies and enhance humanitarian response
plans to the suffering of the people afflicted by the crisis. The IMU mainly strives to enhance
the capacities of humanitarian relief actors in making sound response decisions. This could
be achieved by collecting, analyzing and sharing data with these actors in the hope of
improving and strengthening their responsiveness to those afflicted by the Syrian Crisis. The
IMU is committed to achieving its objectives by providing the needed services, producing
credible and neutral information reports, and sharing this information on regular basis with all
humanitarian relief actors taking part in responding to the conflict. One of the main sources
of information reports issued by the IMU is the Dynamo which periodically provides a
comprehensive evaluation of the different sectors needed to serve those affected by the crisis
over the entire country, on the level of the sub-district.
As an exception, the IMU has conducted a special assessment on the village level, using, to
a great extent, a methodology similar to that used for data collection and analysis needed for
the periodic needs’ assessments conducted on the level of the sub-district. This report was
issued based on a three-month long data collection process which encompassed part of
Aleppo city that has 13 different sub-districts.
The objective behind conducting this special assessment is to narrow down the scope of
collected data into a smaller, more in-depth circle of focus for clearer comprehension of the
current status. This will help determine potential problems more accurately and steer
assistance more effectively than simply depending on general assessments based on the
level of the region or sub-district.
The IMU strives to produce intuitive reports that are easy to use. They present all derived
information and conclusions, either as written texts, or as visual forms through numbers,
tables and maps. All the Dynamo sections related to the sector of humanitarian relief are
edited and prepared using the Dynamo’s special survey which aims at providing the
stakeholders with the needed information and reflecting the status on the ground. Following
are the different departments included in this report:
Demographic composition: This section presents rough statistics on the current
population, including the number of IDPs and the areas of their presence, in addition
to information on their original residence.
Delivery of humanitarian aid: This section demonstrates the prospects of delivering
assistance to the beneficiaries.
Health: This section depicts how critical the health status is, based on the number of
casualties and those suffering from certain health complaints, ailments, and health
issues, coupled with the status of health facilities and services.
Food security: This section mainly focuses on the main food indexes, including the
prices of bread and the readiness of the bakeries, in addition to reasons why these
some of these bakeries have stopped operating.

Needs Assessment Report on the Village Level –Aleppo Province
12 of 78 وحدة إدارة المعلومات
Information Management Unit
Shelter and NFIs: This section analyses the extent of private buildings that are
damaged as a result of the conflict. It also provides rough estimations of the number
of vulnerable people in need of shelter and NFIs.
Water, sanitation and hygiene: This section lists water sources, their quality and
availability to those affected by the conflict, including the reasons of water shortages
and the main important infra-structure challenges related to the sewerage system, not
forgetting a glimpse on solid waste management.
Education: This section warns about the degrees of educational problems, indicating
the status of schools, their capacity and readiness and the reasons why some of them
have stopped working, as well as the number of students enrolled in the various levels
of education, classified according to their gender.
Priorities: This section clarifies priority needs that call for humanitarian response
according to the different relief sectors.
Scope
As mentioned above, this report has been prepared on the level of the village, not the sub-
district. It is a special edition of the regular needs’ assessment reports. It addresses the
villages of Aleppo Province only.
This report covers 222 villages out of the 1255 villages on which data has been collected
from all over the different provinces in Syria. The report covers around 20% of the overall
number of the villages administratively affiliated to Aleppo Province. The results presented in
this report provide a comprehensive description of the humanitarian situation in the villages
under study, only. During the data collection process we managed to cover all the accessible
villages. But due to security threats facing some of Aleppo’s sub-districts and a large number
of its villages, we were unable to communicate with a large number of our enumerators during
the debriefing stage. This prevented us from including all the data in the study and focusing
on the data of the indicated 222 villages, only. This report covers a span of three months,
December 2014, and January and February 2015.
Methodology
The data collection process for this study began on 1 December, 2014 and ended around the
end of February 2015. After obtaining the preliminary data, the coordinators of the
enumerator network began the debriefing process at the beginning of April, 2015. This phase
took over four months to accomplish due to the difficulties in communication with the
enumerators, both technically and security wise. The data analyses phase started at the end
of May and the report writing took around one month, making the final version ready for
publishing in July 2015. Figure (1) demonstrates the number of rural and urban village
evaluated under this study.

Needs Assessment Report on the Village Level –Aleppo Province
13 of 78 وحدة إدارة المعلومات
Information Management Unit
Fig. 1- Number of rural and urban villages assessed in each district
In an ideal situation, it would have been better to include all the villages in Aleppo Province.
However, this was not possible for the following reasons:
The assessed geographic areas are limited to those accessible by the IMU’s
enumerators. The enumerators were unable to expand the radius of their research
due to their limited resource, this is why the following areas were excluded from the
study:
o Areas where the enumerator cannot validate information due to the difficulty in
accessing credible information from trusted sources (these are mainly controlled
by the regime or other armed groups).
o Areas from which the enumerators cannot obtain any data for security reasons.
This report uses measuring units for individuals (Number of IDPs), institutions (number of
schools), villages (number of villages that need health care).
Figure (2) demonstrates the percentage of villages covered in the sub-districts of Aleppo
Province only. The overall rate of coverage will reach 86%, due to the above-mentioned
reasons.
2
226
3 82
1 1
6
4 1
3
1
57
1
10 187
19 11
5
11 3
20
Urban Rural

Needs Assessment Report on the Village Level –Aleppo Province
14 of 78 وحدة إدارة المعلومات
Information Management Unit
Fig. 2- Coverage ratio of targeted villages in each sub-district
1111
Secondary Sources of Information Review
The Dynamo utilizes available secondary data hoping to provide a comprehensive overview
on the humanitarian status in the assessed villages. The various secondary sources of
information, like those related to the pre-revolution situation, reports, general assessments,
and other information gathered from local and international actors, have all helped in
supporting the main data and information gathered earlier and during the stages of
debriefing and final report writing.
Assessment Sample
The assessment samples were taken on the village level with the aim to assess all the
villages within the reach of the enumerators. This sample is very small in comparison to
those taken from needs’ assessment studies in general. This report is characterized by
shifting from a general scope of assessment on the level of the province based on studying
the sub-districts, to focusing on the main component in the province, namely, the village.
The reason behind this process was to focus on the villages that have more serious
problems compared to other neighboring villages.
Assessment Tools
The assessment tool followed in this report was a survey form especially designed for the
periodic needs’ assessment (Dynamo), with some minor modifications. The Dynamo
assessments mainly depended in its design on each of the following areas: 1) the joint
speedy assessment of humanitarian needs in the north of Syria, 2), comprehensive
assessment of humanitarian needs in Syria, and 3) Assessment of multi-sectoral
humanitarian needs in Syria. The questionnaire used for the survey is based on a KoBo
form designed by the data analyses team at the IMU where data can be entered using a
smartphone application, or directly through laptops.
Data Collection
The methods used to collect the data needed for this report involved conducting interviews
with the informants and depending on direct observations and recorded evidence.
0
10
20
30
40
50
60
70
80
90
100
الحاضر مركز جبل تل الضمانسمعان
مارع حريتان الزربة دارة عزة صوران الحاجب بنان أتارب مركز اعزاز
تل رفعت اإلجمالي
had
her
Tall
Ed-
dam
an
Jeb
el S
aman
Mare’
Har
itan
Zarb
ah
Dar
et A
zza
Sura
n
Haj
eb
Ban
an
Ata
reb
A’zaz
Tall
Ref
aat
Tota
l
Needs Assessment Report on the Village Level –Aleppo Province
15 of 78 وحدة إدارة المعلومات
Information Management Unit
The questionnaire was distributed to all enumerator, simultaneously, either via Skype or by
email, accompanied with a list of potential information sources. Collected data was filled into
the questionnaires. The entire data collection process lasted for about three months.
Each enumerator was assigned to cover one sub-district.
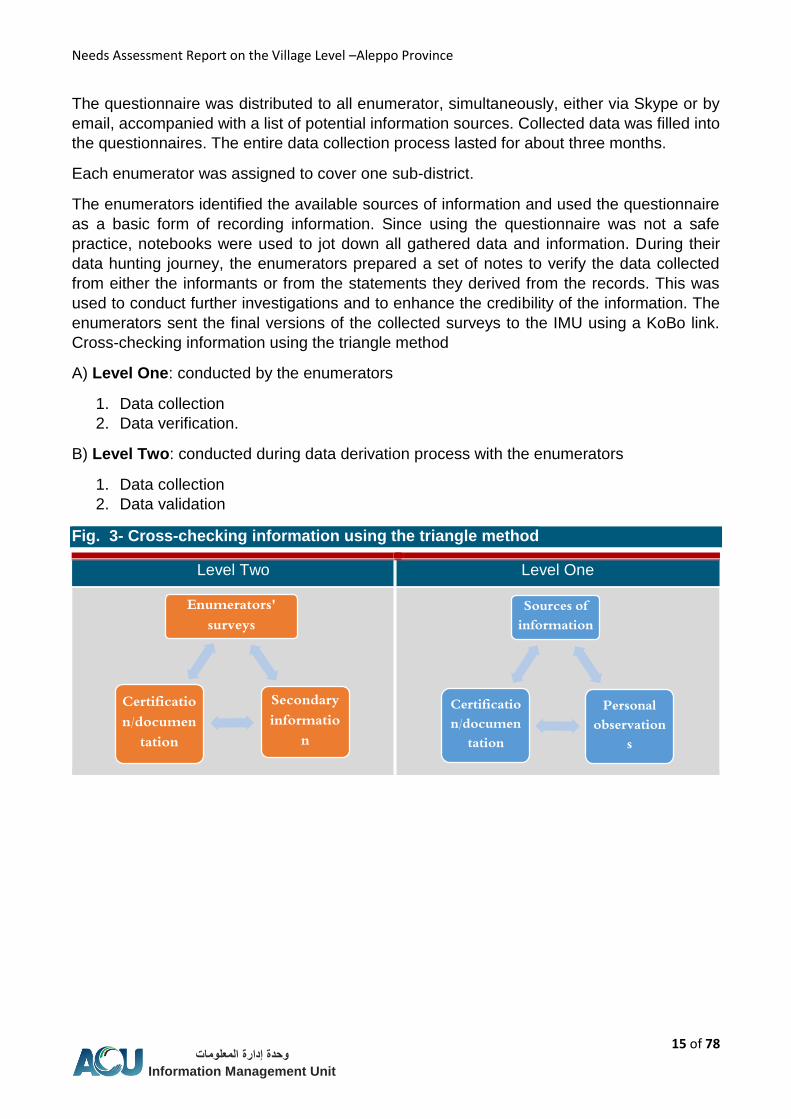
The enumerators identified the available sources of information and used the questionnaire
as a basic form of recording information. Since using the questionnaire was not a safe
practice, notebooks were used to jot down all gathered data and information. During their
data hunting journey, the enumerators prepared a set of notes to verify the data collected
from either the informants or from the statements they derived from the records. This was
used to conduct further investigations and to enhance the credibility of the information. The
enumerators sent the final versions of the collected surveys to the IMU using a KoBo link.
Cross-checking information using the triangle method
A) Level One: conducted by the enumerators
1. Data collection
2. Data verification.
B) Level Two: conducted during data derivation process with the enumerators
1. Data collection
2. Data validation
Fig. 3- Cross-checking information using the triangle method
Level One Level Two
Sources of information
Personal observation
s
Certification/documen
tation
Enumerators' surveys
Secondary informatio
n
Certification/documen
tation
Needs Assessment Report on the Village Level –Aleppo Province
16 of 78 وحدة إدارة المعلومات
Information Management Unit
Validation and review (Debriefing)
After the enumerators sent their questionnaires to the IMU, the following procedures followed:
Data was compared with secondary sources of information, including those already
on the IMU’s database.
Data sources were verified (additional information on the data sources was collected
for verification)
Data was verified using the method of inconsistent data (for example, it is not likely
that a 0 is used to indicate the number of population.)
The enumerators were contacted via Skype to verify all points derived during
debriefing sessions.
The situation was re-assessed with the enumerators when additional clarifications are
required.
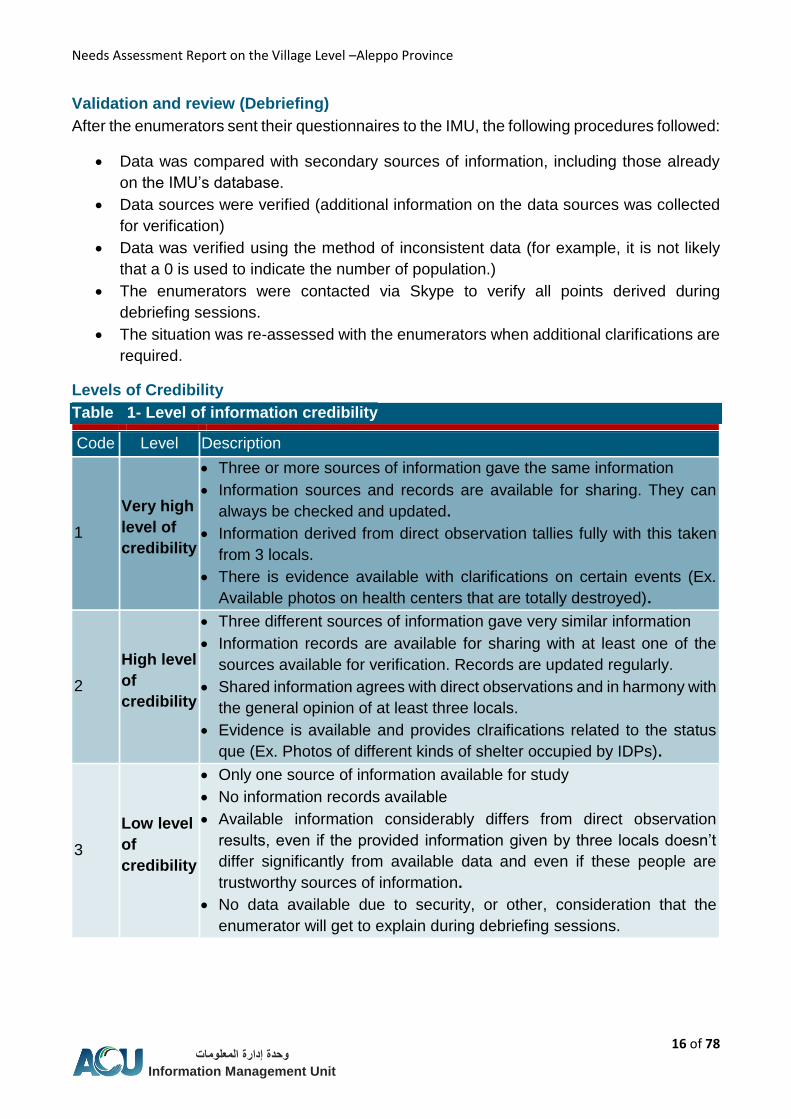
Levels of Credibility
Table 1- Level of information credibility
Code Level Description
1
Very high
level of
credibility
Three or more sources of information gave the same information
Information sources and records are available for sharing. They can
always be checked and updated.
Information derived from direct observation tallies fully with this taken
from 3 locals.
There is evidence available with clarifications on certain events (Ex.
Available photos on health centers that are totally destroyed).
2
High level
of
credibility
Three different sources of information gave very similar information
Information records are available for sharing with at least one of the
sources available for verification. Records are updated regularly.
Shared information agrees with direct observations and in harmony with
the general opinion of at least three locals.
Evidence is available and provides clraifications related to the status
que (Ex. Photos of different kinds of shelter occupied by IDPs).
3
Low level
of
credibility
Only one source of information available for study
No information records available
Available information considerably differs from direct observation
results, even if the provided information given by three locals doesn’t
differ significantly from available data and even if these people are
trustworthy sources of information.
No data available due to security, or other, consideration that the
enumerator will get to explain during debriefing sessions.
Table 1Level of information credibility

Needs Assessment Report on the Village Level –Aleppo Province
17 of 78 وحدة إدارة المعلومات
Information Management Unit
Data Management and Analysis
The collected data is delivered in Excel sheets to the IMU officer who will then edit and verify
data. In order to document this data and information, the data analysis team at the IMU start
to interpret the received information into illustrations, tables and graphs. The GIS specialist
maps the relevant information using ARCGIS. The IMU is willing to share more details with
its partners, when needed.
Data on each aspect of assessment was analyzed as an integrated unit. More in-depth
analysis were conducted on some of the information and values to be used for this report.
The data analysis process comprised the main framework of the report and set in place the
needed intervention priorities in the form of conclusion at the end of the report.
Restrictions and Limitations
The enumerators started by estimating the number of population on the ground. They later
compared their numbers with those in the available records, lists of beneficiaries, local
expertise and secondary sources of information. Therefore, the following restrictions should
be taken into consideration when referring to the number of people cited in this report:
The population supplanting in Syria is characterized by being volatile and highly
changeable, besides the lack of any system that can trace real-time displacement
movements as soon as they occur.
The enumerators were unable to assess some areas due to security reasons although
the situation there may be worse than the areas that have been evaluated.
Due to the need for protecting the enumerators’ safety, all their personal information
is kept quite confidential. Codes are used instead of real information before they are
entered into the databases.
Out of the 18 enumerators covering Aleppo Province, one enumerator only, is a
female. Most sources of information who have been interviewed were also male. This
is due to lack of security which normally prevents women from roaming certain areas
and constricts access to women as potential sources of information.
Needs Assessment Report on the Village Level –Aleppo Province
18 of 78 وحدة إدارة المعلومات
Information Management Unit
Demographic Composition
Aleppo is one of the largest Provinces in Syria and has the highest population density.
Aleppo’s population in 2011 was estimated at 5,754,000 people according to the Syrian
Regime’s statistics. As the war broke off and the airstrikes relentlessly hit the Province, a
variety of changes to the demographic composition, changed. Many were killed, and a huge
displacement movement towards safer abodes, became a trend.
The IMU, with the help of its enumerators distributed over the provinces, was able to collect
data from more than 1,200 villages in non-regime controlled areas. Due to the large number
of villages, only those under opposition control were analyzed (Non-regime controlled areas,
ISIL and Kurdish forces were not analyzed).
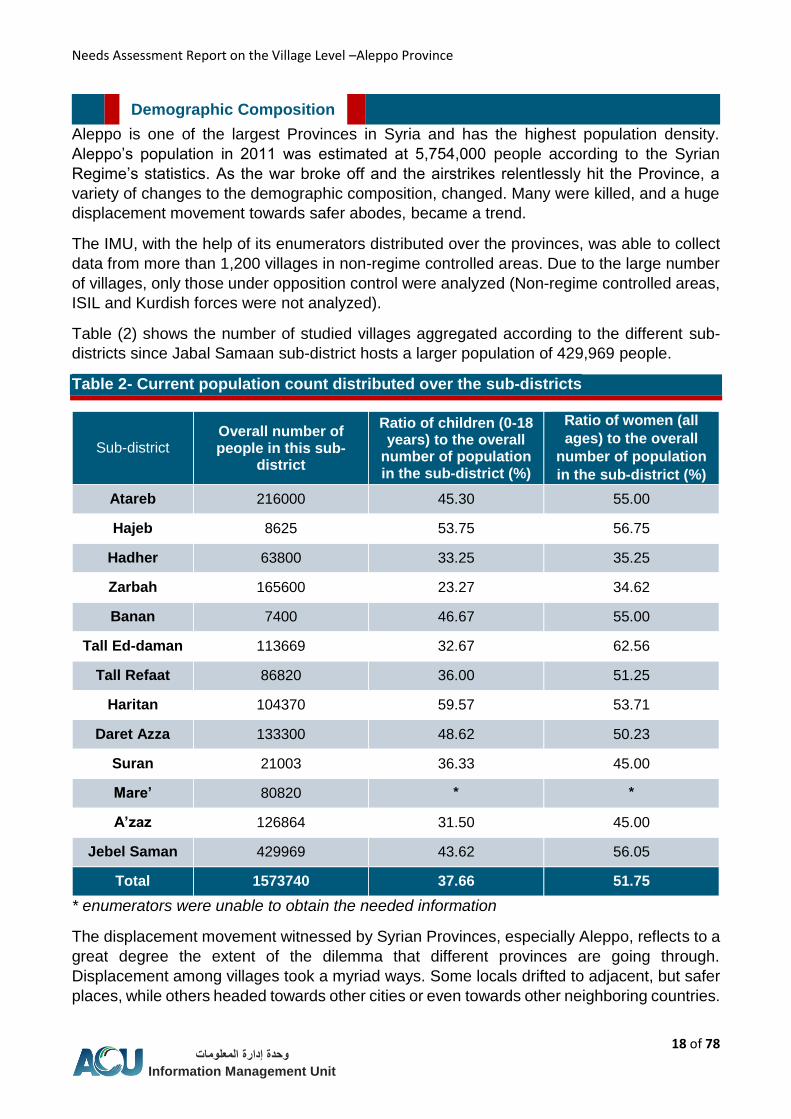
Table (2) shows the number of studied villages aggregated according to the different sub-
districts since Jabal Samaan sub-district hosts a larger population of 429,969 people.
Table 2- Current population count distributed over the sub-districts
زز1
Sub-district Overall number of people in this sub-
district
Ratio of children (0-18 years) to the overall
number of population in the sub-district (%)
Ratio of women (all
ages) to the overall
number of population
in the sub-district (%)
Atareb 216000 45.30 55.00
Hajeb 8625 53.75 56.75
Hadher 63800 33.25 35.25
Zarbah 165600 23.27 34.62
Banan 7400 46.67 55.00
Tall Ed-daman 113669 32.67 62.56
Tall Refaat 86820 36.00 51.25
Haritan 104370 59.57 53.71
Daret Azza 133300 48.62 50.23
Suran 21003 36.33 45.00
Mare’ 80820 * *
A’zaz 126864 31.50 45.00
Jebel Saman 429969 43.62 56.05
Total 1573740 37.66 51.75
* enumerators were unable to obtain the needed information
The displacement movement witnessed by Syrian Provinces, especially Aleppo, reflects to a
great degree the extent of the dilemma that different provinces are going through.
Displacement among villages took a myriad ways. Some locals drifted to adjacent, but safer
places, while others headed towards other cities or even towards other neighboring countries.

Needs Assessment Report on the Village Level –Aleppo Province
19 of 78 وحدة إدارة المعلومات
Information Management Unit
Table (3) illustrates the population count in 2011 with the ratio of IDPs arriving to, and from
the villages. We used the year 2011 as a benchmark to compare the displacement
movements because that year did not witness any cases of displacement.
Table 3- The estimated number of people in each sub-district 1111
Sub-district Estimated population in 2011
Number of IDPs leaving
the sub-district
Ratio of IDPs to the estimated population
Number of IDPs in the sub-district
Ratio of new comers from
estimated population
Atareb 112211 10211 13% 55201 25%
Hajeb 2012 2252 22% 1321 12%
Hadher 02011 3211 2% 11011 12%
Zarbah 22221 2520 2% 23211 02%
Banan 12112 11220 22% 1201 12%
Tall Ed-daman 115201 0231 0% 11223 11%
Tall Refaat 51221 12111 21% 22132 22%
Haritan 52011 22311 22% 00221 22%
Daret Azza 112122 12210 12% 21201 21%
Suran 21322 3320 12% 2121 21%
Mare’ 21201 12221 15% 21221 31%
A’zaz 123222 22211 21% 31222 20%
Jebel Saman 1512215 1323220 22% 0151 1%
Total 38,5,,3 073,131 75% 3058,3 03%
Map (1) illustrates the number of people inhabiting the villages under study.
We notice how Jabal Samaan
encompasses the largest
demographic bloc, followed by
Atareb, Zarbah, Daret Azza, A’zaz
and Haritan. This number
decreases in each of Banan, Hajeb
and Suran
Map 1- Current number of people in villages under study

Needs Assessment Report on the Village Level –Aleppo Province
20 of 78 وحدة إدارة المعلومات
Information Management Unit
Figure (4) provides a comparison between the current population of 2015, and the pre-crisis population of 2011. It is obvious how the population decreased from 2,687,883 in 2011 to reach a meager 1,573,740 people in 2015. The population decrease has reached 1,114,143 people; which is a hefty number that reflects the volume of displacement which took place in the North of Syria in the context of security instability that the country is currently going through.
Cases of Displacement
The dire and rough living conditions that have been facing the citizens forced them into
displacement and resettlement in different areas. Some chose mass shelters and others
found no refuge except in arbitrary camps. The vast majority of IDPs, however, depended on
renting flats for shelter. Table (4) determines the different locations of IDPs.
Table 4- Distribution of IDPs in the villages 1111
Sub-district
Total number of
IDPs in Mass
shelter
Total Number of IDPs living with host families
Total number of IDPs living in vacant buildings
Total number of IDPs living
0n the streets and in arbitrary
camps
Total number of IDPs living in rented housing
Atareb 21101 5201 31211 1 22201
Hajeb 22 020 122 33 222
Hadher 2511 1211 201 1211 2101
Zarbah 0511 2111 2121 2251 12521
Banan 1 201 1121 111 151
Tall Ed-daman 1223 1121 211 1121 5235
Tall Refaat 1 2511 2111 211 12211
Haritan 211 3321 35301 1 12001
Daret Azza 2111 2251 1 1 11121
Suran 221 220 220 201 1031
Mare’ 221 2121 2220 2220 2321
A’zaz 1 2111 3111 1 15111
Jebel Saman 111 2521 2550 021 1121
Total 35071 ,1110 87768 0513, 001133
Fig. 4- Current population Vs population in 2011
2687883
1573740
Total
Estimated number ofvillage inhabitantsbefore 2011
Overall number ofvillage inhabitantscurrently

Needs Assessment Report on the Village Level –Aleppo Province
21 of 78 وحدة إدارة المعلومات
Information Management Unit
Map (2) illustrates the number of
IDPs who fled out of the villages
under study. Jabal Samaan hosted
the largest ratio, followed by Tal
Rifat and Azaz. The number of
IDPs is proportional to the
population in these villages.
Map 1Numbers of IDPs within studied villages
IDPs are those who do not cross
international borders seeking
refuge or safe haven. Rather, they
stay in the country regardless of the
fact that they have the exact same
reason behind others who opt for
leaving their country altogether
(armed conflict, generalized
violence, human rights violations).
Map (3) shows the number of new
arrivals to the villages under this
study, including Haritan, Tal Rifat,
Atareb, Daret Azza, Azaz and the
main centers where IDPs fleeing
from nearby villages, gather.
The main goal of IDPs is to survive shelling and death. They lost their houses and were left
in an immense need of assistance. As a response to this disaster, a number of organizations
started to register these IDPs in the hope of providing them with regular assistance. However,
as the war continues and the number of IDPs plummets, many of these IDPs remained
unregistered. Figure (5) illustrates the status of IDPs and inflicted people in the villages under
study.
Map 3- Numbers of IDPs within studied villages
Map 2- Number of IDPs coming from villages under study

Needs Assessment Report on the Village Level –Aleppo Province
22 of 78 وحدة إدارة المعلومات
Information Management Unit
Fig. 5- Registeration of IDPs or people affected by the crisis during assessment period 1111
Table 5- Distribution of different age groups of children in the villages 1111
Sub-district
No. of children under 6 months
No. of children
from 6-12 months
No. of children from 1-5
years
No. of children
5-12 years
No. of youths 12-18 years
Total number of children
Atareb * * * * * *
Hajeb 122 122 225 300 325 1322
Hadher 1212 2223 2222 2251 2225 21130
Zarbah 3221 0122 2523 12231 5151 21235
Banan 211 250 322 301 511 2121
Tall Ed-daman 3020 2512 5222 12213 2112 32102
Tall Refaat * * * * * *
Haritan 1221 1021 2511 13321 13521 32221
Daret Azza 3111 3521 11221 12021 22501 22221
Suran * * * * * *
Mare’ * * * * * *
A’zaz * * * * * *
Jebel Saman 2221 2522 32322 23525 02233 102221
Total 311,, 3700, ,3733 003335 030108 380,85
* Information could not be obtained by enumerators
The destination of IDPs differed among village dwellers. Some locals tended to drift inside
their own village, while others moved out of their villages into nearby ones. Figure (6) clarifies
this movement showing how 3 villages in Jabal Samaan witnessed internal displacement,
while the displacement of the two remaining villages was never an internal one.
11
5718
12
1
7 2
1
2
6
3 22
4
13 26 9
8 2
19
1
3 4
0%
10%
20%
30%
40%
50%
60%
70%
80%
90%
100%
No. Not registered Not yet, but planned Registration completed Yes. Undergoing registration

Needs Assessment Report on the Village Level –Aleppo Province
23 of 78 وحدة إدارة المعلومات
Information Management Unit
Fig. 6- Internal displacement 1111
Vulnerable Groups
To achieve a better needs assessment, the residents in all villages under study were divided
into 5 categories:
2
1. Local residents who
remained in their villages
2. Locals hosting IDPs
3. IDPs residing in incomplete
buildings
4. IDPs living in mass shelters
(schools and camps)
5. IDPs living with host
families.
Local residents who remained in their villages
These people are suffering from
the siege enforced on some areas
of Aleppo Province in addition to
the difficult living conditions made
worse by the war and constant
shelling. Most of those who stayed put were those incapable of finding better opportunities.
Map (4) represents the difference in the level of needs within the targeted villages. Each of
the dots represents one village and each color expresses the level of need inside the targeted
village.
33
2
22 57
4
13 26 6 15 10 11 15 4 20
0%
10%
20%
30%
40%
50%
60%
70%
80%
90%
100%
IDP movement recorded No IDP movement recorded
Map 4. The level of needs of the locals who remained
in their villages

Needs Assessment Report on the Village Level –Aleppo Province
24 of 78 وحدة إدارة المعلومات
Information Management Unit
We notice how Suran. Azaz and Tal Rifat are in urgent need for assistance, whereas other
areas show medium, or no need at all.
Host Families
These are the families who have
hosted IDP families from other
villages.
Map (5) shows the needs of the
host families for humanitarian
assistance. The very difficult
circumstances that Aleppo is
currently going through make it
very essential that these families
get urgent assistance, not only for
their own benefit, but also to suffice
for the new comers sharing the
same resources.
3
IDPs living in under-construction buildings
These can be considered the most
needy category of all IDPs. They
live in shelters that are
inappropriate for human living like
deserted or incomplete buildings.
Map (6) illustrates the distribution
of this category in the targeted
villages. We notice how they are
spread in Zirbeh, Hader, Atareb,
Tal Daman and Suran, and to a
lesser extent, in other villages.
Map 6- Level of need among IDPs living in under-construction building
Level of need among families hosting IDPs -Map 5

Needs Assessment Report on the Village Level –Aleppo Province
25 of 78 وحدة إدارة المعلومات
Information Management Unit
4
IDPs Living in Mass Shelters
These are IDPs living in camps and
irregular living places.
Map (7) shows the propagation of
this category within the targeted
areas. We see them scattered in
each of Tal Daman, Hader, Zirbeh
and Mare’ whereas this need is
less in Daret Azza, Atareb, Hajeb
and areas of northern suburbs in
Tal Rifat, Azaz and Suran.
5
IDPs Living with Host Families
As the war continues and the crisis
protracted, the suffering of Syrian
IDPs living with host families has
also increased. The burdens were
heavy on both the hosts and their
guests.
From Map (8) we can find how
IDPs in Tal Hajeb, Atareb, and
Daret Azza are in need of
immediate assistance, and also, to
a lesser extent, in Haritan , Mare’
and Suran.
Map 8- IDPs living with host families
Map 7- IDPs living in mass shelters

Needs Assessment Report on the Village Level –Aleppo Province
26 of 78 وحدة إدارة المعلومات
Information Management Unit
Humanitarian Assistance
Under the context of the ongoing war witnessed by Aleppo and its villages, it has become
imperative to deliver humanitarian aid to meet the basic needs for people in affected areas.
Figure (7) illustrates the possibility of delivering assistance to targeted villages. We notice
how most of these village do not have any obstacles in terms of accessibility. In Mare’, for
example, only two villages have access difficulties causing problems in entering humanitarian
aids, while Haritan only has one village that is inaccessible.
Fig. 7- Capability of delivering humanitarian relief 1111
As Map (9) shows, most targeted
villages do not have serious
accessibility issues.
Out of all targeted villages, only 5
suffered from difficulties in
delivering humanitarian aid as
these were located in the Sub-
districts of Suran, Mare’, Haritan
and Tal Daman.
5 23 566
13 26 9 20 12
914 4 20
11 2
1
0%
10%
20%
30%
40%
50%
60%
70%
80%
90%
100%
No problems exist Problems exist
Map 9- Access to humanitarian assistance

Needs Assessment Report on the Village Level –Aleppo Province
27 of 78 وحدة إدارة المعلومات
Information Management Unit
Area of influence
Map (10) shows the areas of control of different forces on Syrian land in February 2015
It can be noticed that the changes affecting Syrian areas can affect heavily activities of actors
working in humanitarian aid and consequently affects delivery of assistance to the targeted
area in need.
Aleppo extends to almost 19, 833 Km2. We can see from the map that ISIL is in control of
the majority of the Province, spreading its hegemony on an area of (11220 Km2) which equals
%52 of the entire Province.
The Opposition forces control 21% of the Province with 4200 Km2.
The regime is in control of 14% of Aleppo Province, governing 2840 Km2.
Kurdish forces dominate 13% of Aleppo Province, controlling 2586 Km2.
Map 10- Area of influence
Needs Assessment Report on the Village Level –Aleppo Province
28 of 78 وحدة إدارة المعلومات
Information Management Unit
Health
With the advent of the 5th year of the Syrian Crisis, the humanitarian status in Syria is still
suffering steep declines. The health sector is thought to be suffering the worst damages with
over 1 million wounded people, as
stated by the Syrian Network for
Human Rights. Moreover, 64% of
the hospitals are destroyed and
40% of them are completely
disrupted, according to the UN
statistical studies.
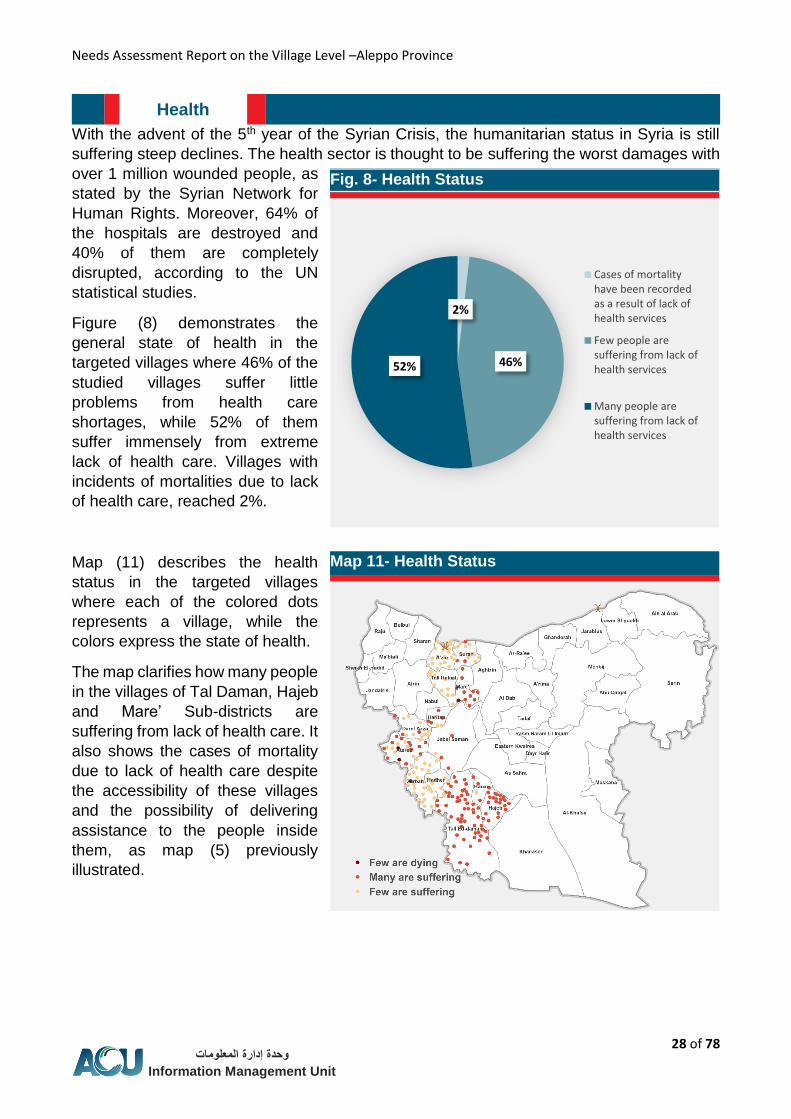
Figure (8) demonstrates the
general state of health in the
targeted villages where 46% of the
studied villages suffer little
problems from health care
shortages, while 52% of them
suffer immensely from extreme
lack of health care. Villages with
incidents of mortalities due to lack
of health care, reached 2%.
Map (11) describes the health
status in the targeted villages
where each of the colored dots
represents a village, while the
colors express the state of health.
The map clarifies how many people
in the villages of Tal Daman, Hajeb
and Mare’ Sub-districts are
suffering from lack of health care. It
also shows the cases of mortality
due to lack of health care despite
the accessibility of these villages
and the possibility of delivering
assistance to the people inside
them, as map (5) previously
illustrated.
Fig. 8- Health Status
Map 11- Health Status
2%
46%52%
Cases of mortalityhave been recordedas a result of lack ofhealth services
Few people aresuffering from lack ofhealth services
Many people aresuffering from lack ofhealth services

Needs Assessment Report on the Village Level –Aleppo Province
29 of 78 وحدة إدارة المعلومات
Information Management Unit
The number of people requiring medical attention is shown in table (6) where the number of
people in need of medical help reach about 159, 571 people with 142, 973 who are suffering
from non-life threatening conditions, in addition to 16,598 people who need immediate and
urgent assistance.
Table 6- Number of people requiring medical assistance 1111
Sub-district
# of people requiring medical services
(present threat though non-life -threatening)
# of people requiring urgent and immediate medical services (life threatening condition)
Total
Atareb 22111 3520 22520
Hajeb 2251 1 2251
Hadher 2301 1 2301
Zarbah 2152 111 2253
Banan 250 1 250
Tall Ed-daman 12222 2 12311
Tall Refaat 2322 122 2022
Haritan 12211 2111 15211
Daret Azza 2501 1 2501
Suran 350 212 022
Mare’ 2201 35 2255
A’zaz 2210 121 2022
Jebel Saman 2111 11131 12131
Total 0,3153 0871, 071750
The regime’s campaign was not limited to the civilians, but also affected medical centers - as
per the UN statistics, which stated that 64% of Syrian hospitals are damaged and 40% are
totally inoperative.
Due to the huge crisis the targeted areas are suffering from in terms of health care, having a
medical center in the village has become quite essential. Figure (12) shows the number of
medical centers in the targeted villages to be 34. In Haritan Sub-district, there are 6 villages,
each of which has a medical center. Jebel Saman, however, has two villages that have
medical centers. Hajeb and Banan, on the other hand don’t have any health care centers
which forces the locals to seek medical help in the sub-district of Tal Daman.
Fig. 9- Number of villages served by health centers 1111
2 9
1
6
6
2 1 2 1
4
1
3 14
53
1
7
24 8 18 11
7
14 4 20
0%10%20%30%40%50%60%70%80%90%
100%
Centers available Centers not available

Needs Assessment Report on the Village Level –Aleppo Province
30 of 78 وحدة إدارة المعلومات
Information Management Unit
As the total number of health centers available in the targeted villages shows, it is clear that
most villages do not have a health care center. Figure (13) shows whether the sub-district
has, or doesn’t have a health center that serves the village. It is apparent that three villages
in Jabal Samaan don’t have a health center, one of which does not benefit from the services
of the health center of the sub-district, while the remaining two, do.
Fig. 10- Villages served by health centers (is there a health center in the sub-district
serving the village?) 1111
6
Map (12) shows the dispersion of
health centers in the targeted
villages most of which have no
health centers.
The distribution of health centers
concentrated mainly in Atareb,
Daret Azza, Mare’ and Jabal
Samaan. However, as we move
southwards we become aware that
there is only one available health
center despite the large number of
villages, nearby.
Actors in the Health Sector
Despite the huge needs required
by the health sector, most villages
have not received any health-
related humanitarian assistance. In
Jabal Samaan there were four actors, while Atareb Sub-district had villages with 3 actors. In
general, it is obvious that active Organizations are rare in most targeted villages, which
indicates the bad health state in these villages.
2
13 53 1 7 24 8 17 10 613
4
13
1
1 1 11
7
0%
10%
20%
30%
40%
50%
60%
70%
80%
90%
100%
The district has a medical center to serve the village The district does not have a medical center to serve the village
Map 12- Availability of health centers

Needs Assessment Report on the Village Level –Aleppo Province
31 of 78 وحدة إدارة المعلومات
Information Management Unit
Types of Provided Health Care Assistance
The ongoing battles in Syria
resulted in accumulative needs,
especially in the health sector.
Despite the intervention of
humanitarian actors this sector is
still lacking urgent and essential
requirements. Heat map (1)
illustrates the types of assistance
provided to the villages and it
clarifies that Hajeb, Banan and Tal
Rifat did not receive any medical
assistance. The Heat map shows
that medicine is the most
assistance provided, with 23%,
followed by medical consumables
at 17% and vaccinations at 13%.
Heat Map 1- Types of Provided Health Care Assistance 1111
Sub-district
Ata
reb
Ha
jeb
Ha
dh
er
Zarb
ah
Ba
na
n
Tall E
d-
dam
an
T
al
Rif
at
Ha
rita
n
Da
ret
Azza
Su
ran
Ma
re’
A’z
az
Jab
al
Sa
ma
an
T
ota
l
No assistance received
Rehabilitation of health facilities
Building new health facilities
Incentives for health care workers
Health care staff stipends
Medical equipment
Medical consumables
Health care staff
Health facilities fuel consumption
Recruitment of female health care workers
Medication
Vaccines
Ambulances
Mobile clinic
Other
Map 13- Actors in the health sector

Needs Assessment Report on the Village Level –Aleppo Province
32 of 78 وحدة إدارة المعلومات
Information Management Unit
Required Humanitarian Assistance Priorities in the Health Sector
Procurement of medical equipment for the health centers took precedence at the top of the
list of health care sector priorities (23%), followed by the need for medicine (17%), and finally
came the need for health care worker stipends (15%).
Heat Map 2- Types of Health Care Assistance 1111
Sub-district
Oth
er
Re
ha
bilita
tion
of
hea
lth fa
cilitie
s
Bu
ildin
g n
ew
hea
lth fa
cilitie
s
Me
dic
atio
n
He
alth
care
wo
rker s
tipen
ds
Am
bu
lan
ce
s
Ne
wb
orn
bab
ies’
form
ula
He
alth
care
sta
ff
Va
cc
ine
s
Me
dic
al
eq
uip
me
nt
Atareb
Hadher
Tall Ed-daman
Haritan
Daret Azza
Zarbah
Suran
Mare’
A’zaz
Jabal Samaan
Cost of Health Services
The cost of services provided by the health centers differ from one village to the other.
Villages which considered that health services costs are exorbitant reached 50%, whereas
27% of them believe that the incurred costs are relatively affordable. 18% of all studied
villages, however, believe that the health services provided to them, were free.
Heat Map 3- Costs of Health Care services 1111
Sub-district Free health services Affordable by most locals Very costly
Atareb
Hajeb
Hadher
Zarbah
Banan
Tal Daman
Tal Rifat
Haritan
Daret Azza
Suran
Mare’
A’zaz
Jebel Saman

Needs Assessment Report on the Village Level –Aleppo Province
33 of 78 وحدة إدارة المعلومات
Information Management Unit
Number of Mortalities in January and February
The number of deaths in January and February was 1,070, distributed over the sub-districts
as per the following table:
Table 7- number of mortalities in Jan. and Feb. 2015 111
Sub-district
# o
f me
n w
ho
die
d d
urin
g
the w
ar
# o
f wo
me
n w
ho
die
d
du
ring
the w
ar
# o
f ch
ildre
n u
nd
er 5
wh
o
die
d d
urin
g th
e w
ar
# o
f me
n w
ho
die
d b
eca
us
e
of b
ad
hea
lth c
on
ditio
ns
# o
f wo
me
n w
ho
die
d
becau
se o
f bad
health
co
nd
ition
s ة
# o
f ch
ildre
n u
nd
er 5
wh
o
die
d b
ec
au
se o
f bad
hea
lth
co
nd
ition
s
# o
f me
n w
ho
die
d b
eca
us
e
of c
hro
nic
health
c
on
ditio
ns
that n
ee
ds
me
dic
al fo
llow
-up
# o
f wo
me
n w
ho
die
d
becau
se o
f ch
ron
ic h
ealth
c
on
ditio
ns
that n
ee
ds
me
dic
al fo
llow
-up
# o
f ch
ildre
n u
nd
er 5
wh
o
die
d b
ec
au
se o
f ch
ron
ic
hea
lth c
on
ditio
ns th
at
nee
ds
me
dic
al fo
llow
-up
Atareb 01 2 1 11 5 1 13 0 1
Hajeb 1 1 1 1 1 1 1 1 1
Hadher 10 2 1 1 1 1 2 5 1
Zarbah 21 11 1 1 1 1 15 22 1
Banan 3 2 2 1 1 1 1 1 1
Tal Daman 21 2 3 1 1 1 22 22 1
Tal Rifat 1 1 1 1 1 1 1 1 1
Haritan 25 2 0 3 2 2 5 2 1
Daret Azza 22 1 1 1 1 1 12 1 1
Suran 12 2 2 11 12 11 5 12 11
Mare’ 23 0 12 1 1 1 2 3 1
A’zazs 1 1 1 1 1 1 1 1 1
Jebel Saman 121 31 30 01 22 2 52 03 15
Total ,31 88 83 57 73 3, 0,7 0,0 31
Percentage of Medical Services Provided
All the villages share the need for health care services but they differ in the extent of those
needs. If we compare the villages’ needs of medical assistance and the percentage of
provided health services, we find that 62% of the villages in the study were not covered by
any of the assistance provided; whereas 20% of the villages believe that the provided
assistance covers between 1%-25% of their needs. The villages whose needs were fully met
comprised 1% only. Heat map (4) shows the distribution of the ratios of provided assistance
that covered the needs of the villages in the study.

Needs Assessment Report on the Village Level –Aleppo Province
34 of 78 وحدة إدارة المعلومات
Information Management Unit
Heat Map 4- percentage of medical services provided 111
Sub-district 1 0 - 37% 38 - 71% 70 - 57% 58 - 011%
Atareb
Hajeb
Hadher
Zarbah
Banan
Tal Dman
Tal Rifat
Haritan
Daret Azza
Suran
Mare’
A’zaz
Jebel Saman
Health Problems Prevalent in the Villages
Heat Map 5 illustrates the different types of prevalent diseases wherever they occurred. It
was concluded that skin problems and leishmaniasis were the most prevalent among the
studied villages with a percentage of 36%, while respiratory diseased got the second priority
at 23%, leaving chronic diseases with the least priority of 22%.
Heat Map 5- Most recurrent health issues 111
Sub-district
Ma
tern
ity re
late
d
co
nd
ition
s
Re
sp
irato
ry c
on
ditio
ns
skin
pro
ble
ms a
nd
leis
hm
an
iasis
Ch
ron
ic d
isea
se
s
(Hy
pe
rten
sio
n,
dia
bete
s, T
B a
nd
hea
rt)
Ps
yc
ho
log
ical
dis
ea
se
s
Cu
ts a
nd
wo
un
ds
Dia
rrhe
a a
nd
dig
es
tion
ailm
en
ts
Me
as
les
Atareb
Hajeb
Hadher
Zarbah
Banan
Tal Daman
Tal Rifat
Haritan
Daret Azza
Suran
Mare’
A’zaz
Jebel Saman
# of villages , 73 51 ,, 31 8 3 0

Needs Assessment Report on the Village Level –Aleppo Province
35 of 78 وحدة إدارة المعلومات
Information Management Unit
WASH
The sewerage system is responsible for the drainage of liquid waste generated by buildings
and factories into treatment plants or other liquid reservoirs. These are the basic pillars of
urban infra-structure. The sewerage system in Syria has faced huge destruction since the
break of war. Until now, over 35% of the drainage network is completely destroyed.
In Aleppo, areas that are not under
the regime control are targeted by
continuous air strikes and
explosive barrel bombs. These
alone are capable of destroying the
infra structure, water networks and
disrupt water and electricity
supplies, which ultimately led to
huge decreases in drinking and
household water used for cleaning
and personal hygiene.
Map (14) illustrates the locals’
access to treated drinking water.
The dots in the map symbolize the
different villages under study,
whereas the colors denote
accessibility to drinking water by
the village locals.
The map demonstrates how
residents of Hadher, Zarbah, Tall
Ed-daman and Atareb have no
access to drinking water, whereas
most people in Suran have access
to treated drinking water. Access to
drinking water in Daret Azza, Mare’
Tal Rifat and Hajeb, is thought to
be improving.
Figure (14) illustrates the status of
water and sanitation sector. It
demonstrates that a significant
number of studied villages (43%)
do not have any access to treated
drinking water, whereas half of the
people in 21% of the villages do.
Only a little number of residents in
19% of the villages have little
access, while most residents in 15% of the villages are able to access water. Only 2% of the
villages have no trouble whatsoever, accessing drinking water.
Fig. 11- Access to treated drinking water
0 50 100 150
No treated drinkingwater accessdeficiencies
Many people haveaccess to treateddrinking water
Almost half thepopulation haveaccess to treateddrinking water
Few people haveaccess to treateddrinking water
No access
Map 14- Access to treated drinking water

Needs Assessment Report on the Village Level –Aleppo Province
36 of 78 وحدة إدارة المعلومات
Information Management Unit
Table (8) demonstrates the number of people who need drinking water. 212,122 people do
need drinking water, while 32,222 people are in urgent and immediate need of assistance
since their water shortage is serious and life threatening. However, there are some 222,223
people who need water but their situation is not life threatening. We also notice from the table
that Atareb and Jabal Samaan have the highest number of people in need of drinking water
despite the available, but still limited, water resources that are too inadequate to meet the
needs of such high population in the area.
Table 8- Number of people in need of drinking water 1111
Sub-district People in urgent and immediate
need of drinking water (life threatening shortage)
People in need of drinking water (non-life threatening shortage)
Atareb 12011 22011
Hajeb 1 0101
Hadher 1 22511
Zarbah 010 121211
Banan 1 2201
Tal Daman 2311 110130
Tal Rifat 3210 13551
Haritan 1 31011
Daret Azza 1 5111
Suran 021 1125
Mare’ 1 12511
Azaz 200 23221
Jabal Samaan 12111 112221
Total 33358 858133
Actors in the Water and Sanitation Sector
Most villages in Atareb Sub-district
had two actors. Daret Azza Sub-
district had a village with 3 different
actors but most villages in this
study did not have any
organizations that are active in the
water and sanitation area. If we
take a look at Map (15) we see that
there is only one village in the Sub-
district of Mare’ that has two active
organizations, leaving Tal Rifat,
Azaz and Suran without any
assistance in the field of water and
sanitation. The same applies to
villages in the northern side, like
Banan, Hajeb and most of the other
villages in Tal Daman.
Map 15- Actors in the water and sanitation sector

Needs Assessment Report on the Village Level –Aleppo Province
37 of 78 وحدة إدارة المعلومات
Information Management Unit
Heat map (6) explains that there are 164 villages which have not received any assistance in
terms of water and sanitation, 43 villages received 1- 25% of their needs, 3 villages received
26-50% of the needed assistance, and 9 villages received 51-75 of the assistance they need.
Heat Map 6- Percentage of water and sanitation assistance provided 1111
Sub-district 1 0 - 37% 38 - 71% 70 - 57% 58 - 011%
Atareb
Hajeb
Hadher
Zarbah
Banan
Tall Ed-daman
Tal Rifat
Haritan
Daret Azza
Suran
Mare’
A’zaz
Jebel Saman
# of villages 08, ,3 3 1 0
Water Sources
Untreated subterranean water comprises 44% of all drinking water sources in the studied
villages and the most important sources of drinking water for all of them. The locals mainly
depend on trucks and water tankers to receive 40% of their drinking water, followed by water
pumping points and stations which constitute 11%. Heat map (7) identifies the distribution of
water sources in the sub-districts, with untreated subterranean water and water tankers,
being the main sources of water for Tal Daman.
Heat Map 7- Drinking water sources 1111
Sub-district Public water
network
Water pumping
stations and points
Untreated surface
water (lake, river, spring)
Water tankers
Untreated subterranea
n water
Atareb
Hajeb
Hadher
Zarbah
Banan
Tall Ed-daman
Tal Rifat
Haritan
Daret Azza
Suran
Mare’
A’zaz
Jebel Saman
# of villages 0, ,, 3 083 0,3
1TT
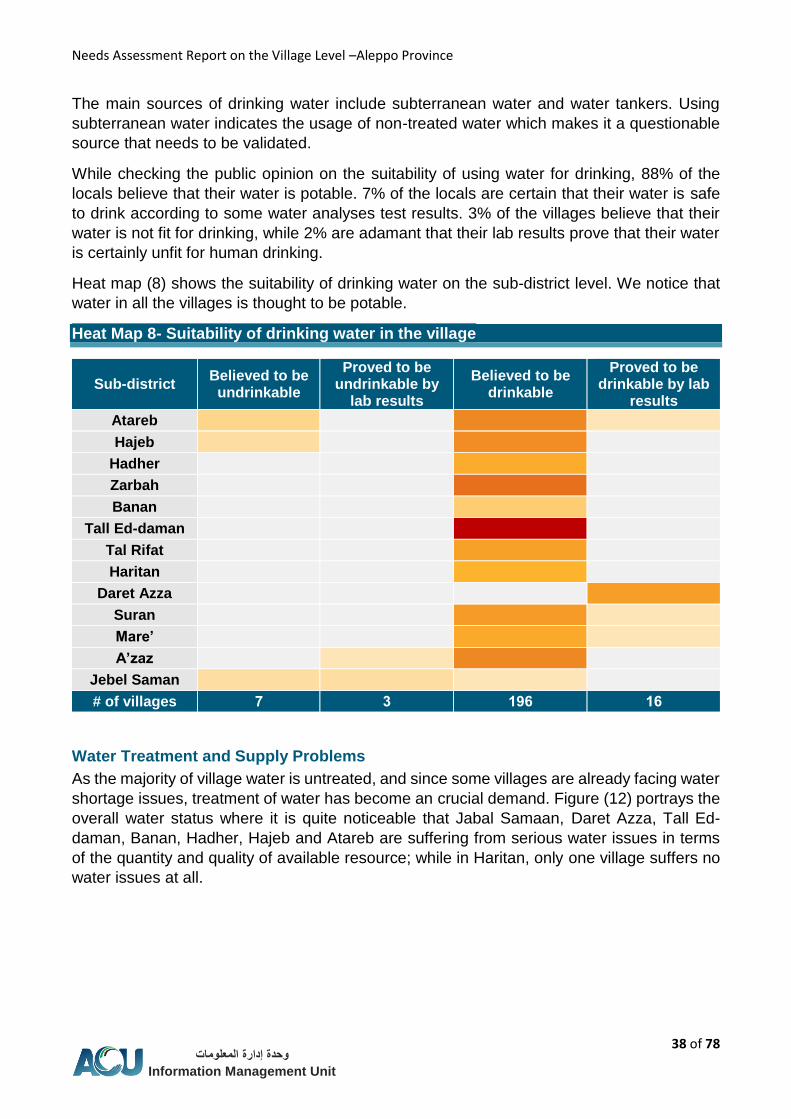
Needs Assessment Report on the Village Level –Aleppo Province
38 of 78 وحدة إدارة المعلومات
Information Management Unit
The main sources of drinking water include subterranean water and water tankers. Using
subterranean water indicates the usage of non-treated water which makes it a questionable
source that needs to be validated.
While checking the public opinion on the suitability of using water for drinking, 88% of the
locals believe that their water is potable. 7% of the locals are certain that their water is safe
to drink according to some water analyses test results. 3% of the villages believe that their
water is not fit for drinking, while 2% are adamant that their lab results prove that their water
is certainly unfit for human drinking.
Heat map (8) shows the suitability of drinking water on the sub-district level. We notice that
water in all the villages is thought to be potable.
Heat Map 8- Suitability of drinking water in the village 1111
Sub-district Believed to be undrinkable
Proved to be undrinkable by
lab results
Believed to be drinkable
Proved to be drinkable by lab
results
Atareb
Hajeb
Hadher
Zarbah
Banan
Tall Ed-daman
Tal Rifat
Haritan
Daret Azza
Suran
Mare’
A’zaz
Jebel Saman
# of villages 5 3 018 08
Water Treatment and Supply Problems
As the majority of village water is untreated, and since some villages are already facing water
shortage issues, treatment of water has become an crucial demand. Figure (12) portrays the
overall water status where it is quite noticeable that Jabal Samaan, Daret Azza, Tall Ed-
daman, Banan, Hadher, Hajeb and Atareb are suffering from serious water issues in terms
of the quantity and quality of available resource; while in Haritan, only one village suffers no
water issues at all.

Needs Assessment Report on the Village Level –Aleppo Province
39 of 78 وحدة إدارة المعلومات
Information Management Unit
Fig. 12- Water treatment and supply problems 1111
As the previous figure pointed out, we conclude that water supply is a general issue from
which most villages under study seem to suffer. It is a serious enough problem to call for
close scrutiny in order to be able to find the root causes which must be addressed, hoping to
alleviate the suffering of the people in these villages. Heat map (9) indicates the potential
reasons behind this problem. After analyzing these reasons it became clear that lack of
energy sources (Fuel and electricity) was a direct cause of water scarcity. Fuel is an essential
element since it is the directly needed for operating water pumps to water tanks. Solving fuel
shortages can directly solve 32% of water problems. The second main reason behind water
shortages comes the lack of water bladders. This problem constitutes about 20% of the
reasons behind water problems, while technical problems affecting the water network
account for the third main cause of water shortage, by 13%.
Heat Map 9- Causes of water supply problems 1111
Sub-district
Ata
reb
Ha
jeb
Ha
dh
er
Zarb
ah
Ba
na
n
Tal
Da
ma
n
Tal
Rif
at
Ha
rita
n
Da
ret
Azza
Su
ran
Ma
re’
A’z
az
Jeb
el
Sa
ma
n
To
tal
Technical problems
Complete lack of water
Lack of water bladders
Lack of energy (fuel, electricity)
Drought
Lack of chemicals needed for treatment
5 23 576
13
2
9
1510 10
1
4 20
1
24
52 1
14
0%
10%
20%
30%
40%
50%
60%
70%
80%
90%
100%
Problems exist No problems exist
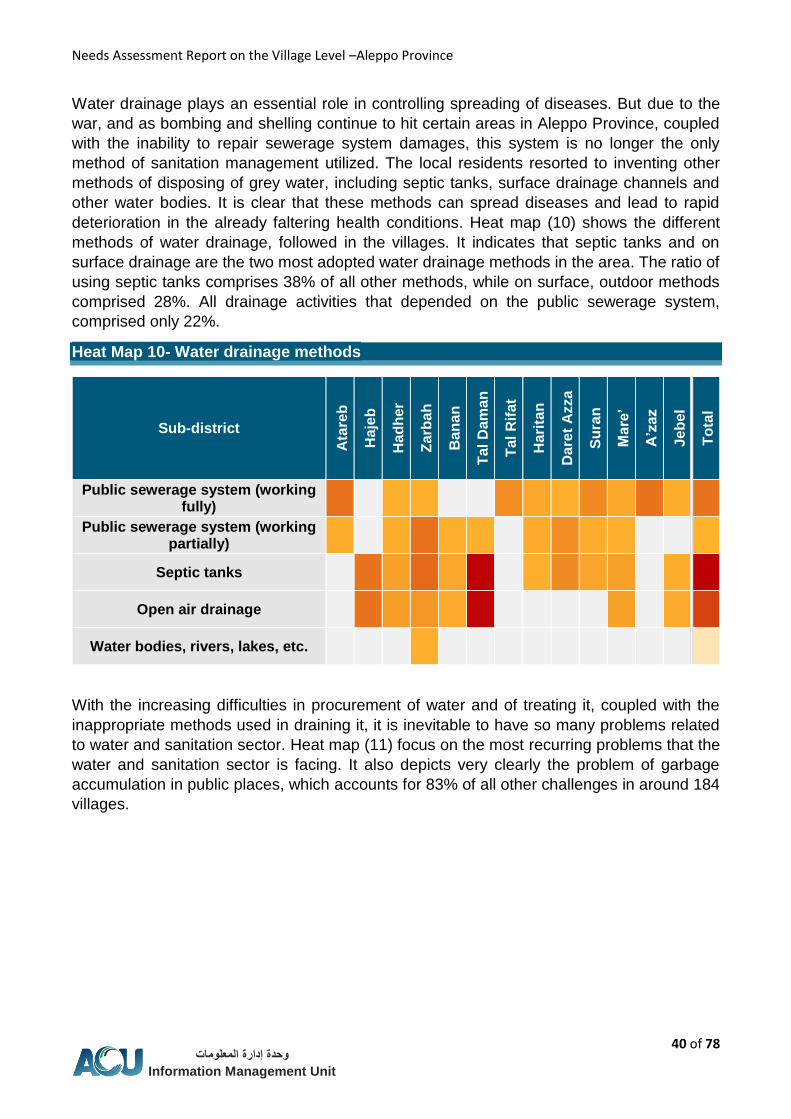
Needs Assessment Report on the Village Level –Aleppo Province
40 of 78 وحدة إدارة المعلومات
Information Management Unit
Water drainage plays an essential role in controlling spreading of diseases. But due to the
war, and as bombing and shelling continue to hit certain areas in Aleppo Province, coupled
with the inability to repair sewerage system damages, this system is no longer the only
method of sanitation management utilized. The local residents resorted to inventing other
methods of disposing of grey water, including septic tanks, surface drainage channels and
other water bodies. It is clear that these methods can spread diseases and lead to rapid
deterioration in the already faltering health conditions. Heat map (10) shows the different
methods of water drainage, followed in the villages. It indicates that septic tanks and on
surface drainage are the two most adopted water drainage methods in the area. The ratio of
using septic tanks comprises 38% of all other methods, while on surface, outdoor methods
comprised 28%. All drainage activities that depended on the public sewerage system,
comprised only 22%.
Heat Map 10- Water drainage methods 1111
Sub-district
Ata
reb
Ha
jeb
Ha
dh
er
Zarb
ah
Ba
na
n
Tal
Da
ma
n
Tal
Rif
at
Ha
rita
n
Da
ret
Azza
Su
ran
Ma
re’
A’z
az
Jeb
el
Sa
ma
n
To
tal
Public sewerage system (working fully)
Public sewerage system (working partially)
Septic tanks
Open air drainage
Water bodies, rivers, lakes, etc.
With the increasing difficulties in procurement of water and of treating it, coupled with the
inappropriate methods used in draining it, it is inevitable to have so many problems related
to water and sanitation sector. Heat map (11) focus on the most recurring problems that the
water and sanitation sector is facing. It also depicts very clearly the problem of garbage
accumulation in public places, which accounts for 83% of all other challenges in around 184
villages.

Needs Assessment Report on the Village Level –Aleppo Province
41 of 78 وحدة إدارة المعلومات
Information Management Unit
Heat Map 11 – Most recurring problems in water and sanitation sector 1111
Sub-district Defecating
in the open air
Offensive smells
Drains are causing
air pollution
Accumulation of
garbage in public areas.
Fly and mosquito infestation
Increase in number of rodents (like mice)
Atareb
Hajeb
Hadher
Zarbah
Banan
Tall Ed-daman
Tal Rifat
Haritan
Daret Azza
Suran
Mare’
A’zaz
Jebel Saman
# of villages 0 03 , 0,, 0, 5
Priority Assistance Needed in the Field of Water Resources
In view of the substantial significance of water sources and their immediate reflection on the
quality of life, supporting these water sources should be on the top of the list of priority needs.
The locals in the studied villages are suffering significantly from lack of drinking water. Heat
map (12) shows the most urgent needs to be met in the field of water resources. Above all
the requests required by the locals, digging water wells and treating available water supplies
came first by a good 52% given to digging water wells and 24% to water treatment.
Heat Map 12- Priority assistance needed in the field of water resources 1111
Sub-district
Ata
reb
Ha
jeb
Ha
dh
er
Zarb
ah
Ba
na
n
Tal
Da
ma
n
Tal
Rif
at
Ha
rita
n
Da
ret
Azza
Su
ran
Ma
re’
A’z
az
Jeb
el
Sa
ma
n
To
tal
Water network repair
Generators
Water storage
Digging wells
Supporting water system with technical assistance and spare pats
Water pumps
Water treatment
Generator fuel
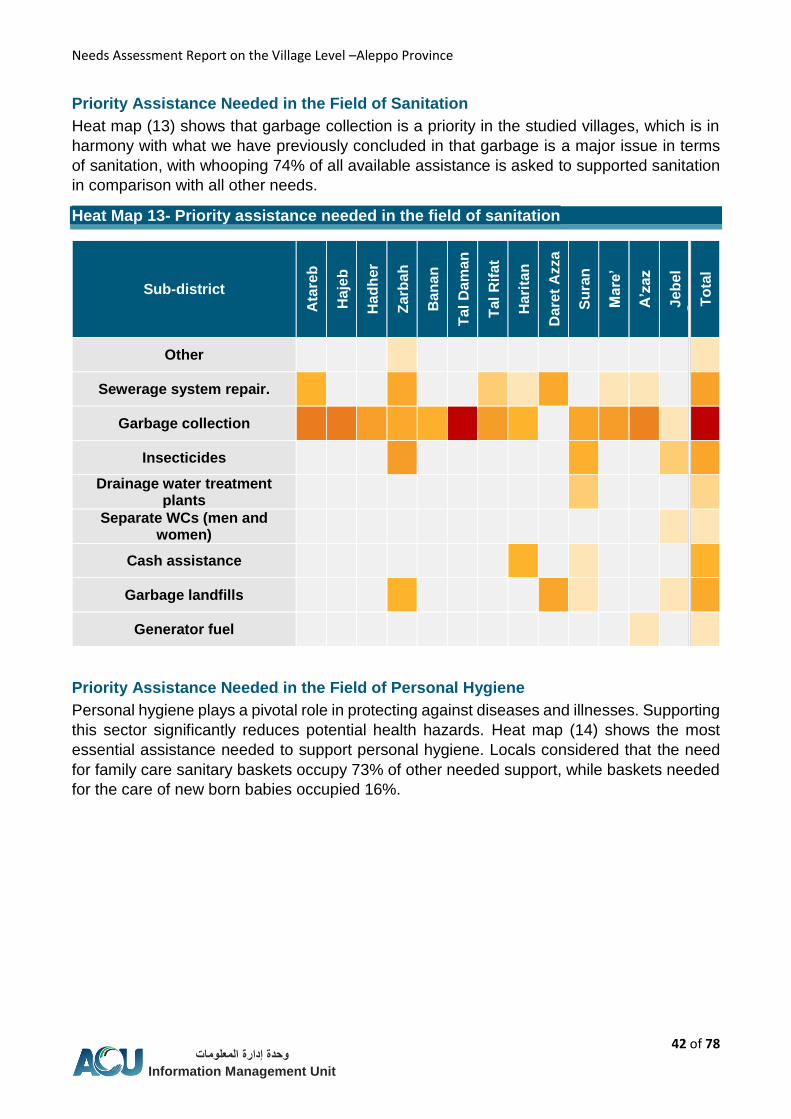
Needs Assessment Report on the Village Level –Aleppo Province
42 of 78 وحدة إدارة المعلومات
Information Management Unit
Priority Assistance Needed in the Field of Sanitation
Heat map (13) shows that garbage collection is a priority in the studied villages, which is in
harmony with what we have previously concluded in that garbage is a major issue in terms
of sanitation, with whooping 74% of all available assistance is asked to supported sanitation
in comparison with all other needs.
Heat Map 13- Priority assistance needed in the field of sanitation 1111
Sub-district
Ata
reb
Ha
jeb
Ha
dh
er
Zarb
ah
Ba
na
n
Tal
Da
ma
n
Tal
Rif
at
Ha
rita
n
Da
ret
Azza
Su
ran
Ma
re’
A’z
az
Jeb
el
Sa
ma
n
To
tal
Other
Sewerage system repair.
Garbage collection
Insecticides
Drainage water treatment plants
Separate WCs (men and women)
Cash assistance
Garbage landfills
Generator fuel
2
Priority Assistance Needed in the Field of Personal Hygiene
Personal hygiene plays a pivotal role in protecting against diseases and illnesses. Supporting
this sector significantly reduces potential health hazards. Heat map (14) shows the most
essential assistance needed to support personal hygiene. Locals considered that the need
for family care sanitary baskets occupy 73% of other needed support, while baskets needed
for the care of new born babies occupied 16%.

Needs Assessment Report on the Village Level –Aleppo Province
43 of 78 وحدة إدارة المعلومات
Information Management Unit
Heat Map 14- Priority assistance needed in the filed of personal hygiene 1111
Sub-district
Raising awareness on
the importance of good health
Health basket for the newly born
Health basket for women
Health basket for family care
Atareb
Hajeb
Hadher
Zarbah
Banan
Tall Ed-daman
Tal Rifat
Haritan
Daret Azza
Suran
Mare’
A’zaz
Jebel Saman
# of villages 33 37 0 083
3

Needs Assessment Report on the Village Level –Aleppo Province
44 of 78 وحدة إدارة المعلومات
Information Management Unit
The most badly affected sector during the Syrian Conflict is the sector of education. A vast
number of students from all academic stages lost their right to education due to a variety of
reasons, including the different injuries that affected many of them as a result of the war that
lasted around 5 years so far.
In addition, a large number of
Syrian schools have stopped
operating for a number of
considerations including sever
demolition of schools because of
relentless shelling or as a result of
the parents’ fear for the lives of
their kids. Curtailed donor
assistance and teacher stipends,
coupled with the engagement of
students from this age group in the
job market in hope of finding a
decent source of living for the
sustenance of the entire family
after the bread-winner was lost,
were among the reasons beyond
the deterioration of the education
sector.
This study focused on a number of
aspects of the education sector,
which will be presented
consecutively in this section. Map
(16) helps to give a general
overview of the status of education
in Aleppo Province as it describes
the educational status in the
villages under evaluation. It is no
secret that the situation is not at all
promising in most areas of Tal
Daman in the south of the
Province, followed by some
villages in the sub-districts of Suran
and Mare’ since many students in
the abovementioned areas have
not been to school for over a year.
Again, in Tal Rifat, Daret Azza and
Atareb, there is a big number of students who have flunked schools for a year, in addition to
the new trend of parents’ refusal to send their children to schools over security precautions.
Some students are forced to drop out of school to support their families after most families
Education
Map 16- Education status
34%
30%
19%
17%
Many students haven’t attended school for over a year
Few students arefacing trouble gettingeducation
Many students arefacing trouble gettingeducation
Few students haven’t attended school for over a year
Fig. 13- Education status

Needs Assessment Report on the Village Level –Aleppo Province
45 of 78 وحدة إدارة المعلومات
Information Management Unit
have consumed their reserves or lost the main breadwinner to military action, detention or
disappearance.
In figures and numbers, the study tells us that the students in 34% of the 222 villages under
evaluation, have not been to school for over a year. This seems the case for most cases,
followed by the 30% of villages where there are small numbers of school dropouts who
haven’t been to school for over a year.
This, in fact, is a dangerous indicator because extended periods of no education will result in
losing interest altogether in learning and education. The result, in this case, is an inevitable
generation who is illiterate and unable to build for itself a decent life with a sound future;
which, in turn, is bound to affect the entire society in a very negative way. In addition to the
above, this phenomenon will create severe psychological and physical impacts caused by
child labor, which subjects school children to all sorts of stresses and strains. On top of these
strains comes the responsibility of having to ensure regular livelihoods for them and their
families at a time when they, themselves, are in utmost need for others to take care of them,
not to mention the state of bullying which children in such situations are subjected to have.
The assessment study elucidated that over 32000 students in most villages under study are
in urgent and critical need of education since they rarely go to school anymore; and that there
are 53000 who need medium assistance in this domain. Table (9) clearly shows the numbers
of students in all sub-districts who need urgent or medium level of assistance in terms of
education.
Table 9- Number of students who need support for education 1111
Sub-district
Estimated number of students in urgent need for educational
support (# of students who skip school at least 4 days a week)
Estimated number of students who have a medium need for
educational support (occasional absenteeism)
Atareb 0211 5201
Hajeb 1221 520
Hadher 1201 3511
Zarbah 1220 2101
Banan 320 001
Tall Ed-daman 222 2111
Tal Rifat 1051 3020
Haritan 2201 2221
Daret Azza 1311 1521
Suran 221 351
Mare’ 3211 2111
A’zaz 2310 2510
Jebel Saman 2302 11321
Total 3351, 73358
During the first three months of assessment, most villages found that the provided support
for education was inadequate and they were still short of many needed demands. None of
the villages in the sub-districts of Hajeb, Banan, Tal Daman, Tal Rifat, and A’zaz has received
any assistance during that period. Most assistance provided to the villages found its way into

Needs Assessment Report on the Village Level –Aleppo Province
46 of 78 وحدة إدارة المعلومات
Information Management Unit
heating educational institutions, followed by buying school requirements. Heat map (15)
details the assistance used on the level of the sub-district.
Heat Map 15- Type of educational support provided in assessment period
1111
Sub-district
Ata
reb
Ha
jeb
Ha
dh
er
Zarb
ah
Ba
na
n
Tal
Da
ma
n
Tal
Rif
at
Ha
rita
n
Da
ret
Azza
Su
ran
Ma
re’
A’z
az
Jab
al
Sa
ma
an
T
ota
l
No assistance offered
Cash for students
Feeding the students project
Heating fuel
Heaters
Teacher stipends
Constructing schools
School repair
Psychological Support
Other
Actors in the Education Sector
Map (17) illustrates the different
actors providing assistance for the
sector of education. These actors
are divided according to their
number in each of the villages. We
notice that the largest number of
actors in the academic field is
concentrated in the western side of
Aleppo Province, in Hadher,
Zarbah, Atareb and Daret Azza,
while the northern and southern
sides, they have almost no
existence at all. In Hajeb and
Banan, the two adjacent sub-
districts, no organizations can be
traced in terms of educational
support, and this also applies to Tal
Rifat and Azaz.
Despite the attention of a good number of donor organizations pouring into the sector of
education, their support, in most cases, does not cover the real needs except in very rare
cases. Heat map (16) shows the percentage of needs covered by the provided assistance,
in comparison to the actual needs in the area.
Map 17- Actor in education sector
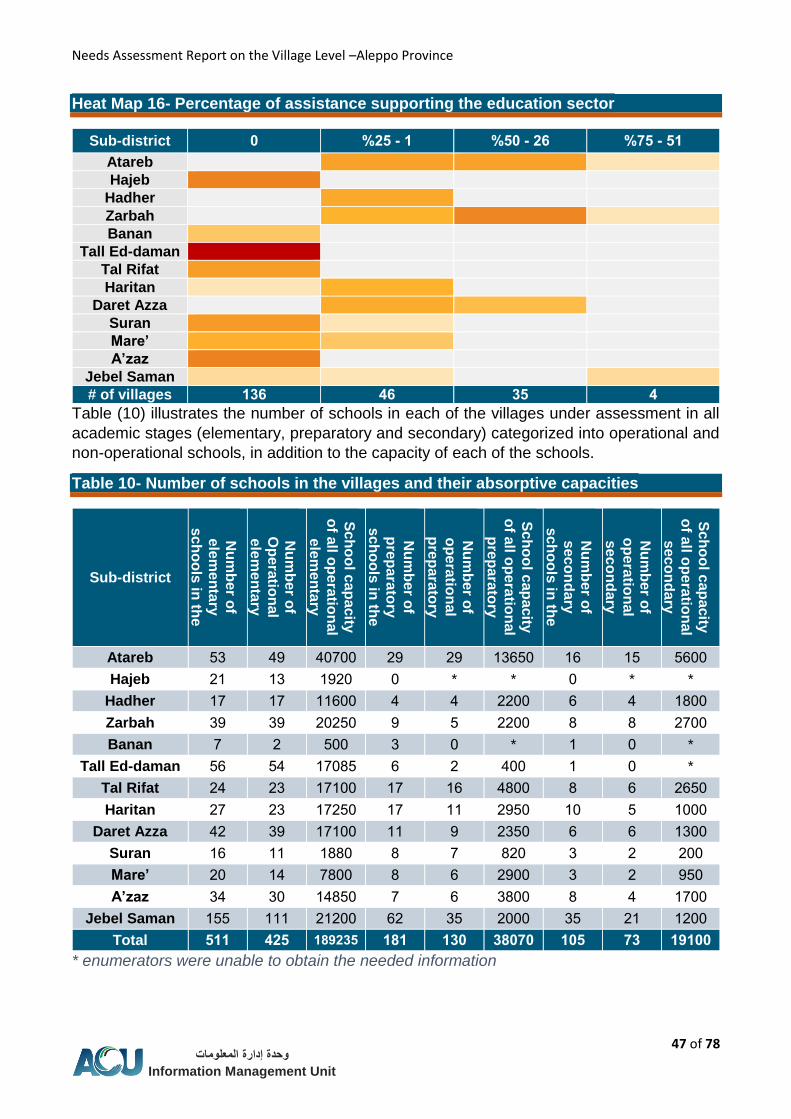
Needs Assessment Report on the Village Level –Aleppo Province
47 of 78 وحدة إدارة المعلومات
Information Management Unit
Heat Map 16- Percentage of assistance supporting the education sector 1111
Sub-district 1 0 - 37% 38 - 71% 70 - 57%
Atareb
Hajeb
Hadher
Zarbah
Banan
Tall Ed-daman
Tal Rifat
Haritan
Daret Azza
Suran
Mare’
A’zaz
Jebel Saman
# of villages 038 ,8 37 ,
Table (10) illustrates the number of schools in each of the villages under assessment in all
academic stages (elementary, preparatory and secondary) categorized into operational and
non-operational schools, in addition to the capacity of each of the schools.
Table 10- Number of schools in the villages and their absorptive capacities 1111
Sub-district
Nu
mb
er o
f e
lem
en
tary
sch
oo
ls in
the
su
b-d
istric
t
Nu
mb
er o
f O
pera
tion
al
ele
me
nta
ry
sch
oo
ls
Sc
ho
ol c
ap
acity
of a
ll op
era
tion
al
ele
me
nta
ry
sch
oo
ls
Nu
mb
er o
f
pre
pa
rato
ry
sch
oo
ls in
the
su
b-d
istric
t
Nu
mb
er o
f
op
era
tion
al
pre
pa
rato
ry
sch
oo
ls
Sc
ho
ol c
ap
acity
of a
ll op
era
tion
al
pre
pa
rato
ry
sch
oo
ls
Nu
mb
er o
f seco
nd
ary
sch
oo
ls in
the
su
b-d
istric
t
Nu
mb
er o
f o
pe
ratio
nal
seco
nd
ary
sch
oo
ls
Sc
ho
ol c
ap
acity
of a
ll op
era
tion
al
seco
nd
ary
sch
oo
ls
Atareb 03 22 21211 22 22 13201 12 10 0211
Hajeb 21 13 1221 1 * * 1 * *
Hadher 12 12 11211 2 2 2211 2 2 1511
Zarbah 32 32 21201 2 0 2211 5 5 2211
Banan 2 2 011 3 1 * 1 1 *
Tall Ed-daman 02 02 12150 2 2 211 1 1 *
Tal Rifat 22 23 12111 12 12 2511 5 2 2201
Haritan 22 23 12201 12 11 2201 11 0 1111
Daret Azza 22 32 12111 11 2 2301 2 2 1311
Suran 12 11 1551 5 2 521 3 2 211
Mare’ 21 12 2511 5 2 2211 3 2 201
A’zaz 32 31 12501 2 2 3511 5 2 1211
Jebel Saman 100 111 21211 22 30 2111 30 21 1211
Total 700 ,37 0,1337 0,0 031 3,151 017 53 01011
* enumerators were unable to obtain the needed information

Needs Assessment Report on the Village Level –Aleppo Province
48 of 78 وحدة إدارة المعلومات
Information Management Unit
While assessing the number of students, enrolled and non-enrolled in all academic stages, it
was concluded that the number of non-enrolled students in the secondary stage (normally
aged between 15-18)in Daret Azza, exceeded the number of those enrolled there. In general,
the percentage of school dropouts from all stages has exceeded 25%, (over 57,000 students)
in most assessed villages. These numbers are detailed in table (11).
Table 11- Number of students
1111
Sub-district
No
. of e
lem
en
tary
stu
den
ts e
nro
lled
No
. of e
lem
en
tary
stu
den
ts n
on
-
en
rolle
d
No
. of p
rep
ara
tory
stu
den
ts e
nro
lled
No
. of p
rep
ara
tory
s
tud
en
ts n
on
-
en
rolle
d
No
. of s
eco
nd
ary
s
tud
en
ts e
nro
lled
No
. of s
eco
nd
ary
s
tud
en
ts n
on
-
en
rolle
d
No
. of c
olle
ge
stu
den
ts e
nro
lled
No
. of c
olle
ge
stu
den
ts n
on
-
en
rolle
d
Atareb 21211 3201 2501 2111 2521 2100 220 551
Hajeb 222 1510 1 1 1 1 1 1
Hadher 2101 2111 1121 211 221 211 1 1
Zarbah 13550 2221 523 321 1510 250 1 1
Banan 311 201 01 200 0 30 1 1
Tall Ed-daman 5252 1122 21 301 1 10 1 1
Tal Rifat 5213 3120 2355 1311 1122 020 1 1
Haritan 11230 2010 1210 220 051 250 31 1
Daret Azza 12233 221 2122 211 510 120 201 31
Suran 1201 221 221 321 121 121 0 11
Mare’ 2220 2220 1101 2101 320 520 112 1
A’zaz 5001 2220 2101 1201 221 1211 1 1
Jabal Samaan 22322 2515 2211 2220 212 1321 1 21
Total 030533 31,71 30,31 07018 013,, 01831 0353 1,1
Lack of funding was one of the most prominent reasons why schools have stopped operating.
This is followed by security considerations and also by lack of teaching staff. Heat map (17)
provides more details.

Needs Assessment Report on the Village Level –Aleppo Province
49 of 78 وحدة إدارة المعلومات
Information Management Unit
Heat Map 17- Why schools stopped working 1111
Sub-district
Se
cu
rity re
as
on
s
Bu
ildin
g u
ne
qu
ipp
ed
(d
es
troy
ed
by
pre
vio
us
s
he
lling
)
Sh
orta
ge
in te
ac
hin
g
sta
ff
Lac
k o
f fun
din
g
Bu
ildin
g d
es
troy
ed
or
dam
ag
ed
by s
he
lling
De
sk
s
Ele
ctric
ity
Wa
ter
Re
mo
ten
es
s fro
m
res
iden
tial g
ath
erin
gs
Us
ed
for s
he
lter
Atareb
Hajeb
Hadher
Zarbah
Banan
Tall Ed-daman
Tal Rifat
Haritan
Daret Azza
Suran
Mare’
A’zaz
Jabal Samaan
Total 37 07 37 33 08 , , 7 0 00
Heat Map 18- Why schools were not equipped 1111
Sub-district
Lac
k o
f sch
oo
l s
up
plie
s
(bo
oks
,
sta
tion
ery
,
etc
.)
Bu
ildin
g n
ot
su
itab
le
(dam
ag
ed
)
Sh
orta
ge
in
teac
hin
g s
taff
Lac
k o
f
fun
din
g
Wa
ter
sh
orta
ge
He
atin
g
eq
uip
me
nt
un
ava
ilab
le
Sh
orta
ge
in
desks
Atareb
Hajeb
Hadher
Zarbah
Banan
Tall Ed-daman
Tal Rifat
Haritan
Daret Azza
Suran
Mare’
A’zaz
Jabal Samaan
No. of schools 03, 33 10 31, 80 33 33

Needs Assessment Report on the Village Level –Aleppo Province
50 of 78 وحدة إدارة المعلومات
Information Management Unit
Heat map (19) below, shows the status of the schools within the assessed villages, whether
damaged or used for other purposes.
Heat Map 19- Number of damaged or ocuppied schools 1111
Sub-district
No damages. School is
fit for teaching
Minor damages that can be fixed (doors,
windows)
Medium damages less than
30% (ceiling)
burns that can be fixed
Grave damages
to the ceiling
over 31% Severe
burn that can be fixed
Total destruction. School is levelled
to the ground
and cannot be
fixed
School is occupied and in no condition to be used
Atareb
Hajeb
Hadher
Zarbah
Banan
Tall Ed-daman
Tal Rifat
Haritan
Daret Azza
Suran
Mare’
A’zaz
Jabal Samaan
We notice that one of the main obstacles facing school operations is that the teachers are
not getting their salaries from the academic institutions. This is followed by school dropouts
who opted for quitting their education in order to fend for their families. Finally, we find that
the teaching process is also hindered by extreme shortages in school supplies including
books, stationery and whiteboards. All is detailed in Heat map (20) on the sub-district level.

Needs Assessment Report on the Village Level –Aleppo Province
51 of 78 وحدة إدارة المعلومات
Information Management Unit
Heat Map 20- Why children and youths are prevented from access to education 1111
Sub-district
Ata
reb
Ha
jeb
Ha
dh
er
Zarb
ah
Ba
na
n
Tal D
am
an
Tal R
ifat
Ha
ritan
Da
ret A
zza
Su
ran
Ma
re’
A’z
az
Jab
al S
am
aa
n
To
tal
Shortage in school supplies (books, stationery, etc.)
Lack of suitable teaching space (occupied by IDPs, or other groups, damaged by
shelling, etc.)
Bad conditions at schools or teaching facilities (no toilets, electricity, water, etc.)
Lack of teachers
No salaries paid to teachers
No certificates given to successful students after exams, or inability to testify
these certificates
Difficulty reaching school due to security threats, remote distances or high costs
incurred
Seeing school as potential threat
Lack of financial resources
Child’s duty to support the family (child labor)
Illness preventing children from going to school
Child recruitment (by armed groups)
Early marriage
Lack of infra-structure or facilities for students with special needs
Other
2
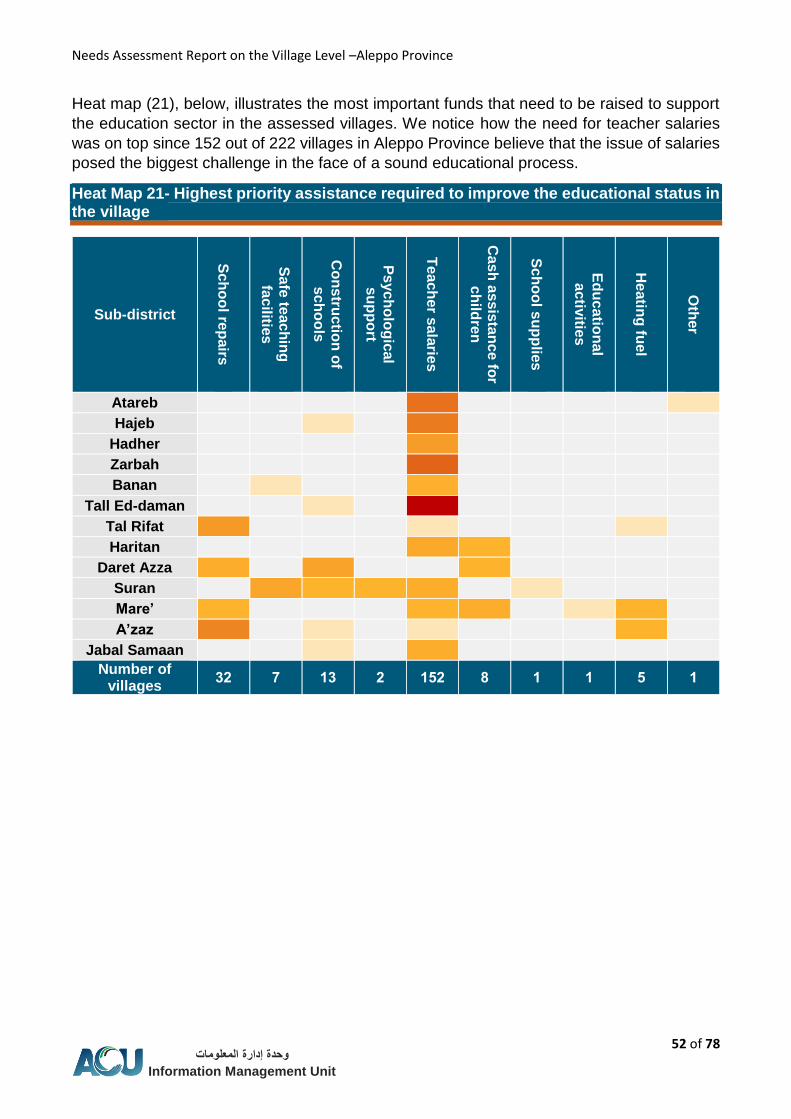
Needs Assessment Report on the Village Level –Aleppo Province
52 of 78 وحدة إدارة المعلومات
Information Management Unit
Heat map (21), below, illustrates the most important funds that need to be raised to support
the education sector in the assessed villages. We notice how the need for teacher salaries
was on top since 152 out of 222 villages in Aleppo Province believe that the issue of salaries
posed the biggest challenge in the face of a sound educational process.
Heat Map 21- Highest priority assistance required to improve the educational status in the village
1111
Sub-district
Sc
ho
ol re
pairs
Sa
fe te
ac
hin
g
facilitie
s
Co
ns
tructio
n o
f
sch
oo
ls
Ps
yc
ho
log
ical
su
pp
ort
Tea
ch
er s
ala
ries
Ca
sh
as
sis
tan
ce fo
r c
hild
ren
Sc
ho
ol s
up
plie
s
Ed
uc
atio
na
l
activ
ities
He
atin
g fu
el
Oth
er
Atareb
Hajeb
Hadher
Zarbah
Banan
Tall Ed-daman
Tal Rifat
Haritan
Daret Azza
Suran
Mare’
A’zaz
Jabal Samaan
Number of villages
33 5 03 3 073 , 0 0 7 0
0

Needs Assessment Report on the Village Level –Aleppo Province
53 of 78 وحدة إدارة المعلومات
Information Management Unit
The food sector has witnessed serious deterioration, which makes supporting this sector a
basic need for the Syrian population. UN statistical reports indicate that the overall number
of people who need support for food and nutrition as a direct result of the ongoing conflict, is
8.3 million people. This comprises
a significant 38% of the entire
population.
The current study aims to illustrate
the food status in the studied
villages by presenting some figures
showing the different cases in the
form of percentages, then by
mapping the studied villages to
determine the location of food
status.
Figure (14) shows the general food
status in the targeted villages
where 43% of the villages were
found not to suffer from any serious
struggle to obtain food, whereas
57% of these villages actually
suffer from very serious food
shortage.
Map (18) shows the food status in
the studied villages.
The current map shows that
number of villages in which large
numbers of people are suffering
from food shortages, is high. It also
shows the villages where there is
only little food shortage.
Hajeb, Hader, Tal Daman and
Mare’ have various villages in
which many locals suffer from food
shortages.
Fig. 14- Food status
Food
Map 18- Food status
57%
43%
Large number ofpeople are sufferingfrom lack of food
Small number ofpeople are sufferingfrom lack of food

Needs Assessment Report on the Village Level –Aleppo Province
54 of 78 وحدة إدارة المعلومات
Information Management Unit
Table (12) shows the number of people who need food relief items. Those in need of food
items -but whose life is not threatened by hunger - is 022,222, whereas those who are in
urgent and immediate need for food because their starvation is life-threatening is 122,456
impoverished people.
Table 12- Number of people in need of humanitarian assistance for food 11111
Sub-district number of people who need food
items (Non- life threatening)
number of people who need urgent and immediate food items ( life
threatening)
Atareb 52011 0211
Hajeb 3220 1
Hadher 2001 1
Zarbah 11201 1211
Banan 2311 1
Tall Ed-daman 11121 1
Tal Rifat 12221 2251
Haritan 02211 011
Daret Azza 12211 1
Suran 1221 001
Mare’ 21522 2121
A’zaz 12120 3320
Jabal Samaan 222211 112211
Number of villages
73818, 033,87
Actors in the Food Sector
Humanitarian relief organizations
had a clear and obvious role from
which most villages have
benefitted.
In Tal Daman, Hader and Haritan,
there were 5 organization active in
the food sector, whereas Hajeb,
Banan, Atareb, Zirbeh and Mare’
have 2-3 ones. The northern area,
especially Tal Rifat, does not have
any organizations at all.
Map 19- Actors in the food sector

Needs Assessment Report on the Village Level –Aleppo Province
55 of 78 وحدة إدارة المعلومات
Information Management Unit
Heat map (22) describes the type of food assistance provided to villages and aggregated
according to sub-districts. The map shows that food baskets are the most provided type of
food assistance, followed by bread and flour. The villages can receive many types of
assistance, but cash payments were the least supported.
Heat Map 22- Type of food assistance provided 11111
Sub-district
N/A
Fo
od
b
as
ke
ts
Ca
sh
ass
ista
nce
Bre
ad
Flo
ur
Fu
el
(Ga
s fo
r c
oo
kin
g
)
Fu
el fo
r
bak
erie
s
Ag
ricu
lt
ura
l
su
pp
ort
Oth
er
Atareb
Hajeb
Hadher
Zarbah
Banan
Tall Ed-daman
Tal Rifat
Haritan
Daret Azza
Suran
Mare’
A’zaz
Jabal Samaan
# of villages 56 163 3 67 61 11 4 7 4
The percentage of assistance provided to the food sector fluctuated from one village to the
other. Heat map (23) shows that 55 villages did not receive any support, while 107 villages
received a percentage of 1-25% of the entire food assistance provided.
Heat Map 23- Percentage of assistance provided for food 11111
Sub-district 0 1 - 25% 26 - 50% 51 - 75% 76 - 100%
Atareb
Hajeb
Hadher
Zarbah
Banan
Tall Ed-daman
Tal Rifat
Haritan
Daret Azza
Suran
Mare’
A’zaz
Jabal Samaan
#of villages 55 107 49 9 1

Needs Assessment Report on the Village Level –Aleppo Province
56 of 78 وحدة إدارة المعلومات
Information Management Unit
While probing for the most essential food assistance required for the villages, bread proved to be the top priority with 51% of the entire needs. This was followed by 27% for flour and 17% for food baskets.
Heat Map 24- Food assistance required in the villages 11111
Sub-district Bread Food
baskets Wheat- flour
Cash payments
Fuel- gas for cooking
Atareb
Hajeb
Hadher
Zarbah
Banan
Tall Ed-daman
Tal Rifat
Haritan
Daret Azza
Suran
Mare’
A’zaz
Jabal Samaan
#of villages 112 38 60 11 1
Main Sources of Income
The protracted war taking place in Syria has taken its toll on the Syrian people’s source of
income. Procurement of food largely depends on the financial status of the faimily; therefore,
to fully understand the food status, the different sources of people’s incomes need to be also
studied. Heat map (25) presents the different ways of income generation that seems to prevail
in the area. Agricultural production is widely dependable on, as a main source of income, at
49%, followed by operating cargo trucks and conducting oil refinement prrocesses, at 26%.
Heat Map 25- Sources of income in the villages
Sources of income
Ata
reb
Ha
jeb
Ha
dh
er
Zarb
ah
Ba
na
n
Ta
ll E
d-d
am
an
Tal
Rif
at
Ha
rita
n
Da
ret
Azza
Su
ran
Ma
re’
A’z
az
Je
be
l S
am
an
Cargo Trucks/Oil refinement
Simple commerce
Humanitarian Aid
Agricultural crops
Handicrafts/apprenticeship
Selling commodities
Selling cattle
Selling animal products
Money transfers from abroad
Any irregular tasks/footman
Fixed employment/salary
# of villages 23 20 9 26 4 57 12 7 13 15 11 20 5

Needs Assessment Report on the Village Level –Aleppo Province
57 of 78 وحدة إدارة المعلومات
Information Management Unit
Bread and Bakeries
Bread is considered the main staple in Syria. Heat map (26) shows that it is the food most
sought after by the locals. Bread is normally sold in 8-loaf bags.
Before the crisis started in Syria, the Government subsidized the prices of bread for both,
public and private bakeries, who, in their turn sold bread at lower prices. However, this
situation no longer applies, and the prices after the siege and battles have become contingent
to the availability of fuel, flour and other essentials.
Heat Map 26- Current price of bread packets
Sub-district Convergent prices in
the village Bread unavailable
Big difference in prices in the village
Atareb
Hajeb
Hadher
Zarbah
Banan
Tall Ed-daman
Tal Rifat
Haritan
Daret Azza
Suran
Mare’
A’zaz
Jabal Samaan
#of villages 200 1 21
Status of Bakeries
The villages under assessment
have two types of bakeries; public
bakeries previously owned by the
Government, which are
characterized by their high
productivity (these are no longer
under the regime control), and
private bakeries owned by
individuals with lower levels of
production capacity than the public
ones.
Map (20) shows the number of
these bakeries and their
distribution over the studied
villages. The map shows that Jebel
Saman has 40 operational
bakeries whereas Atareb has only
15. Bakery distribution is
Map 20- Number and distribution of bakeries in the villages under study
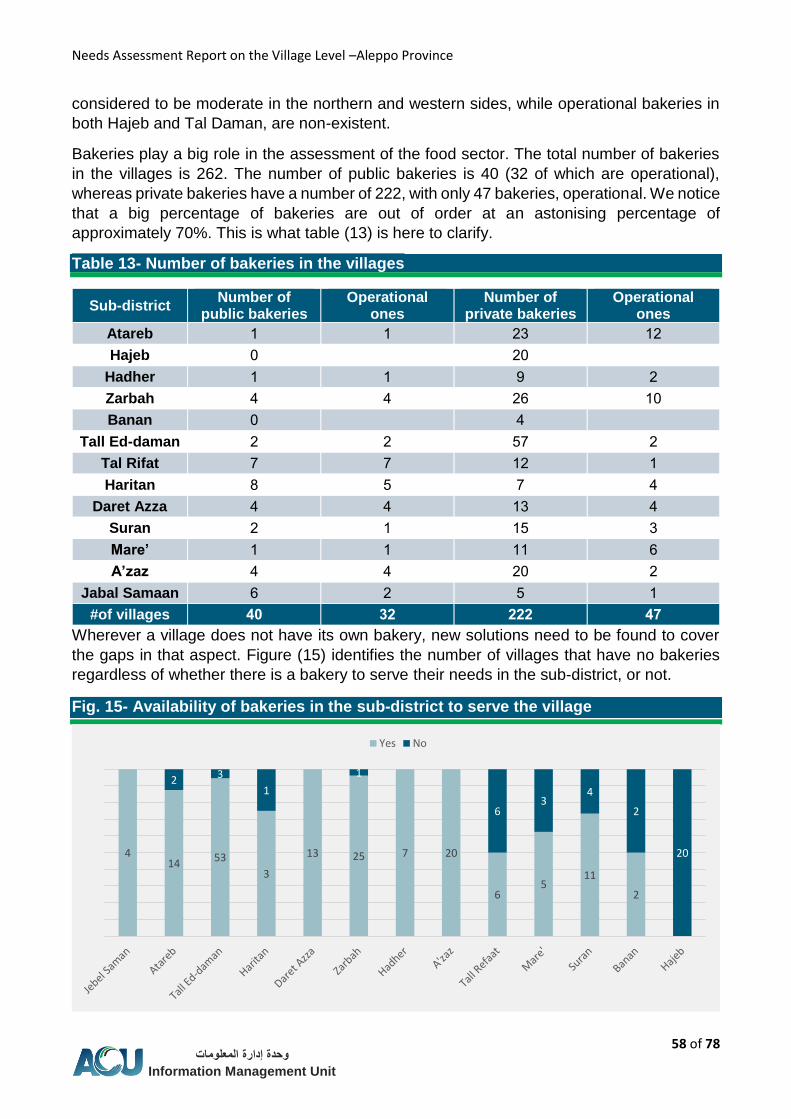
Needs Assessment Report on the Village Level –Aleppo Province
58 of 78 وحدة إدارة المعلومات
Information Management Unit
considered to be moderate in the northern and western sides, while operational bakeries in
both Hajeb and Tal Daman, are non-existent.
Bakeries play a big role in the assessment of the food sector. The total number of bakeries
in the villages is 262. The number of public bakeries is 40 (32 of which are operational),
whereas private bakeries have a number of 222, with only 47 bakeries, operational. We notice
that a big percentage of bakeries are out of order at an astonising percentage of
approximately 70%. This is what table (13) is here to clarify.
Table 13- Number of bakeries in the villages
11
Sub-district Number of
public bakeries Operational
ones Number of
private bakeries Operational
ones
Atareb 1 1 23 12
Hajeb 1 21
Hadher 1 1 2 2
Zarbah 2 2 22 11
Banan 1 2
Tall Ed-daman 2 2 02 2
Tal Rifat 2 2 12 1
Haritan 5 0 2 2
Daret Azza 2 2 13 2
Suran 2 1 10 3
Mare’ 1 1 11 2
A’zaz 2 2 21 2
Jabal Samaan 2 2 0 1
#of villages ,1 33 333 ,5
Wherever a village does not have its own bakery, new solutions need to be found to cover
the gaps in that aspect. Figure (15) identifies the number of villages that have no bakeries
regardless of whether there is a bakery to serve their needs in the sub-district, or not.
Fig. 15- Availability of bakeries in the sub-district to serve the village 1
414 53
3
13 25 7 20
65
11
2
2 3
1
1
63
4
2
20
Yes No

Needs Assessment Report on the Village Level –Aleppo Province
59 of 78 وحدة إدارة المعلومات
Information Management Unit
We notice that a big number of villages have bakeries that are out of order. The reasons why
these bakeries are totally or partially not working, are listed in the Heat map (27) below.
Heat Map 27- Reasons why bakeries stopped operating or operating intermittently
Sub-district
Se
cu
rity
rea
so
ns
Ele
ctric
i
ty
Fu
el
Flo
ur
Wo
rke
rs
Ye
as
t
Wa
ter
De
stru
ct
ion
of
bak
ery
Oth
er
Atareb
Hajeb
Hadher
Zarbah
Banan
Tall Ed-daman
Tal Rifat
Haritan
Daret Azza
Suran
Mare’
A’zaz
Jabal Samaan
# of villages 2 8 9 11 0 7 0 3 2
Daily Capacity of Bakeries Estimated by Metric Tons
The production capacity of bread bakeries is highly dependent on their size, number of
equipment and the time required to finish the bread-making cycle. Some public bakeries
publically list such kind of information which facilitates access to the needed information.
Table 14- Daily Capacity of Bakeries Estimated by Metric Tons مم
Sub-district Amount of flour used by all
operational public bakeries, per day (productivity)
Amount of flour used by all operational private bakeries, per
day (productivity)
Atareb 20 52
Hajeb 1 1
Hadher 12 15
Zarbah 21 22
Banan 1 1
Tall Ed-daman 45 2.0
Tal Rifat 22.0 2
Haritan 11 21
Daret Azza 22 12
Suran 0 2
Mare’ 10 5.0
A’zaz 31 21
Jebel Saman 1 21
Total ,50,.7 31,

Needs Assessment Report on the Village Level –Aleppo Province
60 of 78 وحدة إدارة المعلومات
Information Management Unit
Map (21) describes the daily
production capacity (by metric
tons), of the entire operational
bakeries in the assessed villages.
the daily production capacity of the
operational bakeries in Jabal
Samaan and Azaz alike, has
registered 60 metric tons, whereas
Hajeb area does not have any
production whatsoever, due to the
absence of operational bakeries in
the sub-district.
Map 21- Daily Capacity of Bakeries Estimated by Metric Tons

Needs Assessment Report on the Village Level –Aleppo Province
61 of 78 وحدة إدارة المعلومات
Information Management Unit
Shelter and NFIs
The “Overview of Humanitarian Needs in 2015” report, published by UN-OCHA revealed that
almost half of the Syrian people were forced to evacuate their houses and to drift from one
place to the other, a number of times; which made Syria the mother of the largest
displacement movements in the
world.
State of Housing and Shelter
Map (22) describes the state of
housing and shelter in the
assessed villages. The dots
represent the assessed villages,
while the colors resemble their
state of housing and shelter.
Most locals in the Sub-districts of
Hadher and Zarbah suffer from
lack of shelter. Locals in Tall Ed-
daman, Hajeb, Atareb, Daret Azza,
Mare’, Tal Rifat, Suran and Azaz
suffer from relative shortages in
housing and shelter.
1
A good number of Syrians were
driven out of their homes as a result
of the ongoing Syrian war. The
number of IDPs who left their
houses in the assessed areas in
Aleppo Province, has crossed the
one million mark. Figure (16)
describes the state of housing and
shelter in the assessed villages,
showing that 73% of the locals are
not facing huge shelter issues,
while 23% of the villages have
many of their inhabitants without a
roof over their heads. Only 4% of
the villages don’t seem to have any
issues related to shelter,
whatsoever.
Map 22- State of housing and shelter
Fig. 16- State of Housing and Shelter
72%
24%
4%Few people aresuffering
Many people aresuffering
No housing or shelterdeficiencies

Needs Assessment Report on the Village Level –Aleppo Province
62 of 78 وحدة إدارة المعلومات
Information Management Unit
Map (23) clarifies the state of Non-
Food Items (NFIs) in the targeted
villages. The number of dots
denotes the studied villages, and
their color resembles their state in
term of NFI availability.
In Tall Ed-daman Sub-district in
particular, a big number of people
were found to suffer from lack of
NFIs.
Figure (17) illustrates the state of
NFIs in the assessed areas.
Almost 59% of all villages in the
study do not generally suffer from
lack of NFIs. However, locals in
41% of these villages do, leaving
only one village to enjoy living
without any NFI shortages.
Fig. 17- State of NFIs
58.75%
40.75%
0.50%
Few people aresuffering
Many people aresuffering
No housing or shelterdeficiencies
Map 23- State of NFIs
No NFIs
deficiencies
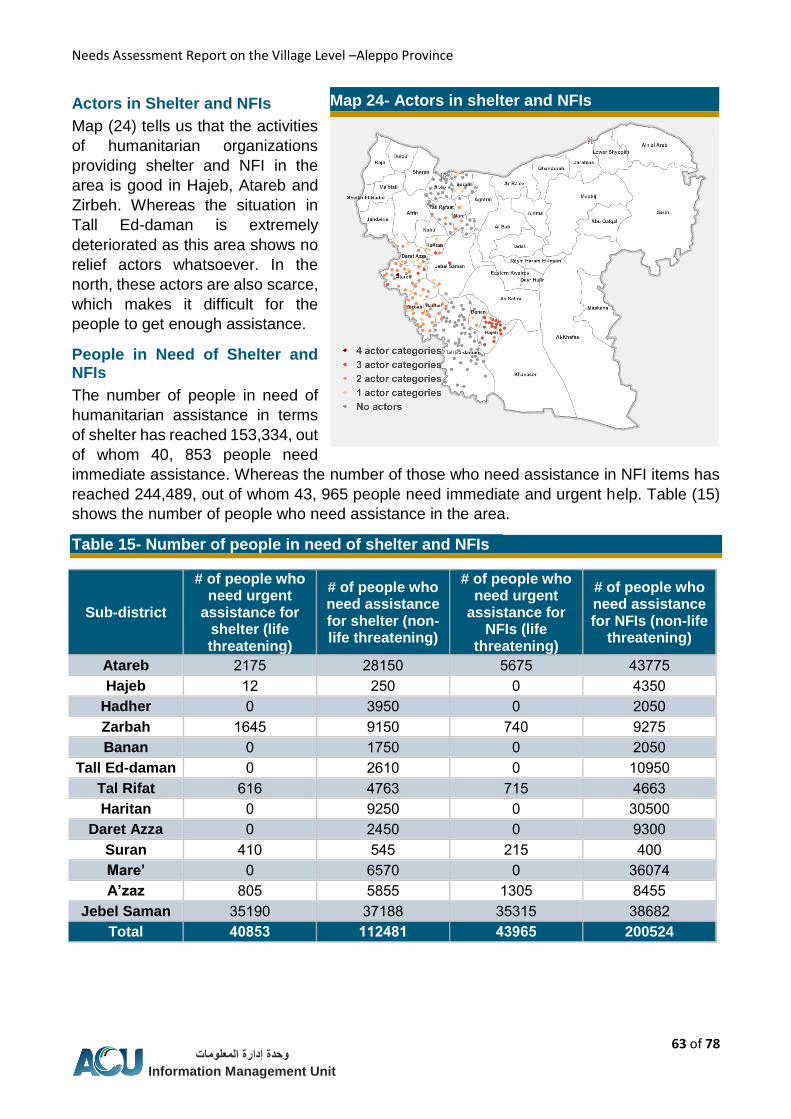
Needs Assessment Report on the Village Level –Aleppo Province
63 of 78 وحدة إدارة المعلومات
Information Management Unit
Actors in Shelter and NFIs
Map (24) tells us that the activities
of humanitarian organizations
providing shelter and NFI in the
area is good in Hajeb, Atareb and
Zirbeh. Whereas the situation in
Tall Ed-daman is extremely
deteriorated as this area shows no
relief actors whatsoever. In the
north, these actors are also scarce,
which makes it difficult for the
people to get enough assistance.
People in Need of Shelter and NFIs
The number of people in need of
humanitarian assistance in terms
of shelter has reached 153,334, out
of whom 40, 853 people need
immediate assistance. Whereas the number of those who need assistance in NFI items has
reached 244,489, out of whom 43, 965 people need immediate and urgent help. Table (15)
shows the number of people who need assistance in the area.
Table 15- Number of people in need of shelter and NFIs مم
Sub-district
# of people who need urgent
assistance for shelter (life threatening)
# of people who need assistance for shelter (non-life threatening)
# of people who need urgent
assistance for NFIs (life
threatening)
# of people who need assistance for NFIs (non-life
threatening)
Atareb 2120 25101 0220 23220
Hajeb 12 201 1 2301
Hadher 1 3201 1 2101
Zarbah 1220 2101 221 2220
Banan 1 1201 1 2101
Tall Ed-daman 1 2211 1 11201
Tal Rifat 212 2223 210 2223
Haritan 1 2201 1 31011
Daret Azza 1 2201 1 2311
Suran 211 020 210 211
Mare’ 1 2021 1 32122
A’zaz 510 0500 1310 5200
Jebel Saman 30121 32155 30310 35252
Total ,1,73 003,,0 ,3187 200524
Map 24- Actors in shelter and NFIs

Needs Assessment Report on the Village Level –Aleppo Province
64 of 78 وحدة إدارة المعلومات
Information Management Unit
Assistance Provided to the Shelter and NFI Sector
Heat map (28) illustrates the assistance provided to support housing and shelter. 152 out of
222 villages did not receive any support. The needs that received the highest support were
temporary shelter and camps.
Heat Map 28- Assistance provided to the shelter and NFI sector مم
Sub-district Fuel and
heating
Cash assistan
ce
Temporary
shelter
Reconstruction/rehabilitation of houses
Electricity and
lighting
Don’t know
No assistan
ce provided
Atareb
Hajeb
Hadher
Zarbah
Banan
Tall Ed-daman
Tal Rifat
Haritan
Daret Azza
Suran
Mare’
A’zaz
Jebel Saman
# of villages ,1 3 7, 1 0, 3 073
Percentage of Housing and Shelter Assistance
Heat map (29) shows the percentage of shelter needs covered by the provided assistance.
Heat Map 29- Percentage of assistance provided for Shelter مم
Sub-district 1 0 - 37% 38 - 71% 58 - 011% Total
Atareb
Hajeb
Hadher
Zarbah
Banan
Tall Ed-daman
Tal Rifat
Haritan
Daret Azza
Suran
Mare’
A’zaz
Jebel Saman
# of Villages 073 01 71 0 333
2
Percentage of Housing and Shelter Assistance

Needs Assessment Report on the Village Level –Aleppo Province
65 of 78 وحدة إدارة المعلومات
Information Management Unit
Map (30) shows the percentage of assistance provided to cover the villages’ needs of NFIs.
Heat Map 30- Percentage of Housing and Shelter Assistance مم
Sub-district 1 0 - 37% 38 - 71% 70 - 57% 58 - 011%
Atareb
Hajeb
Hadher
Zarbah
Banan
Tall Ed-daman
Tal Rifat
Haritan
Daret Azza
Suran
Mare’
A’zaz
Jebel Saman
# of villages 003 8, ,3 3 0
Percentage of Destroyed Buildings
The largest percentage of all villages did not suffer much damage to their buildings, as
clarified by Heat map (31)
Heat Map 31- Percentage of damaged buildings and houses مم
Sub-district
Percentage of buildings and private residence
that did not suffer too
much damage
Percentage of buildings and private residence
that suffered medium damage
Percentage of buildings and private residence
that suffered partial
damage
Percentage of buildings and private residence that are severely damaged
Percentage of buildings and private residence that are
completely destroyed
Atareb
Hajeb
Hadher
Zarbah
Banan
Tall Ed-daman
Tal Rifat
Haritan
Daret Azza
Suran
Mare’
A’zaz
Jebel Saman
Total ,,.,7% ,.,3% 3.75% 0.80% 0.37%

Needs Assessment Report on the Village Level –Aleppo Province
66 of 78 وحدة إدارة المعلومات
Information Management Unit
Quantity of Available NFIs
The assistance provided for around 59% of all villages in term of NFIs was found to be
inadequate. The percentage of villages which received medium quantities of support was
38%, whereas those villages that received abundant amounts of NFIs comprised 3%. Heat
map (32) shows the overall quantities of provided assistance, aggregated according to the
different sub-districts.
Heat Map 32- Quantity of Available NFIs مم
Sub-district Small quantity Medium quantity Large quantity
Atareb
Hajeb
Hadher
Zarbah
Banan
Tall Ed-daman
Tal Rifat
Haritan
Daret Azza
Suran
Mare’
A’zaz
Jebel Saman
Total 033 ,, 8
Quality of Available NFIs
60% of the villages claim to have received low quality NFIs, 39% received medium quality
NFIs, while only 1% of all villages was lucky to received good quality support. Heat map (33)
shows the quality of assistance given to the villages, grouped according to the sub-districts.
Heat Map 33- Quality of NFIs مم
Sub-district Good quality Medium quality Bad quality
Atareb
Hajeb
Hadher
Zarbah
Banan
Tall Ed-daman
Tal Rifat
Haritan
Daret Azza
Suran
Mare’
A’zaz
Jebel Saman
#of villages 0 ,5 03,
The Most Important Assistance to be Provided in The Area of Housing

Needs Assessment Report on the Village Level –Aleppo Province
67 of 78 وحدة إدارة المعلومات
Information Management Unit
Heat map (34) shows the most important funds that need to be raised in the area of shelter.
The most requested financial support reached 34% of the overall amount provided, followed
by requests of construction and rehabilitation of inadequate buildings, at 33%.
Heat Map 34- Most Important Assistance to be Provided in The Area of Housing مم
Sub-district
Reconstruction/rehabilitation of houses
Replacement of house
Electricity and
lighting
Don’t know
Cash assistan
ce
Temporary
housing/shelter
Total
Atareb
Hajeb
Hadher
Zarbah
Banan
Tall Ed-daman
Tal Rifat
Haritan
Daret Azza
Suran
Mare’
A’zaz
Jebel Saman
# of villages 53 00 33 0 58 3, 333
The Most Important Assistance to be Provided in the Area of NFIs
Heat map (35) shows the most important assistance needed to cover the NFI sector. Most
requested items involced Jerry cans (29%), heating fuel (28%), cash support (18%) and
clothing (12%).
Heat Map 35- The Most Important Assistance to be Provided in the Area of NFIs مم
Sub-district
Clo
thin
g
Ma
ttres
s
es
Jerry
can
s
So
lar
en
erg
y
ch
arg
er
s
Ca
sh
Win
teriz
atio
n
item
s
Co
ok
ing
ute
nsils
He
atin
g
fuel
To
tal
Atareb
Hajeb
Hadher
Zarbah
Banan
Tall Ed-daman
Tal Rifat
Haritan
Daret Azza
Suran
Mare’
A’zaz
Jebel Saman
# of villages 35 3 87 3 31 03 00 83 333

Needs Assessment Report on the Village Level –Aleppo Province
68 of 78 وحدة إدارة المعلومات
Information Management Unit
Services
The humanitarian living conditions in any given area are reflected by the status of services
provided to the public. It’s no secret that the state of services has deteriorated immensely
after the break of the revolution and the resulting Syrian war. Repetitive shelling coupled with
the worsened humanitarian and security conditions have added to the deteriorated service
provision capacities in most Syrian areas.
Electricity is one of the most essential services hugely demanded by all areas. Despite the
occasional electricity blackout in pre-war Syria, the hours of electricity rationing have
increased to reach 19-24 hours per day, especially in areas where the regime has lost control.
Mobile phones witnessed huge popularity before the crisis. Despite the high charges per call,
compared to those by landlines, mobiles still managed to be more popular than landlines. At
the onset of the crisis, mobile phone services stopped in most areas of Syria, making the
process of communication a very tricky task in a time when the people are in utmost need to
be connected to others. This is when landlines regained their popularity over the mobile
phones. However, people living near borderlines on Turkish, Iraqi and Jordanian sides, can
depend on the foreign networks of those countries.
The efforts exerted by the civil defense teams, especially in areas out of regime control, have
played a significant role in saving the lives of many. The locals suffer daily shelling, airstrikes,
barrel bombs and arbitrary bombardment, which completely depleted the civil defense teams’
capacities especially in a context of lack of equipment and resources.
Table (16) shows the daily rate of availability of electricity supply in the assessed villages.
Huge variances in the number of hours of electricity supply were noticed. In Suran, for
example, the daily rate of electricity supply available was about half an hour, only. In Hadher,
however, the number of hours has risen to 8 per day. In general, we can safely presume that
electricity supply services in the studied villages are very weak.
Table 16- Daily rate of electricity available from public network during assessment period
1111
Sub-district
Ata
reb
Ha
jeb
Ha
dh
er
Zarb
ah
Ba
na
n
Tall E
d-d
am
an
Tal R
ifat
Ha
ritan
Da
ret A
zza
Su
ran
Ma
re’
A’z
az
Jeb
el S
am
an
To
tal
Daily rate of electricity available
from the public network during
assessment period
0.0
2
2.1
1
5.1
1
5.1
1
3.1
1
3.1
1
2.1
1
2.1
1
5.1
1
1.2
1
1.5
2
3.2
0
3.2
1
2.3
2
2

Needs Assessment Report on the Village Level –Aleppo Province
69 of 78 وحدة إدارة المعلومات
Information Management Unit
The public electricity network has witnessed grave damages caused by battles and warfare.
Repairing these damages will contribute - to a great extent - to the improvement of electricity
supply services in the assessed areas. Figure (18) shows the possibility of repairing these
damages in some of the studied areas. The Figure indicates that the damages and
breakdowns in Jabal Samaan network are repairable, whereas those in 19 villages in Hajeb
Sub-district are beyond repair due to the vast destruction that hit the entire network.
Fig. 18- The ability to repair public electricity network breakdowns 1111
Available Means of Communication
Due to the damages in the communication network on top of the interruption of mobile phone
services, a number of villages resorted to using satellite Internet. Heat map (36) shows the
available means of communication in the studied villages where dependence on local mobile
services accounts for 44% of all other means of communication, whereas the percentage of
satellite Internet usage was 35%.
Heat Map 36- Available means of communication 1111
Sub-district Landline network
Local mobile system
Foreign mobile from
adjacent countries
Local Internet network
Satellite Internet
N/A
Atareb Hajeb
Hadher Zarbah Banan
Tall Ed-daman Tal Rifat Haritan
Daret Azza Suran Mare’ A’zaz
Jebel Saman
4
7
1
19517
55 7 13 26 9 19 11 8
7
3
1
0%10%20%30%40%50%60%70%80%90%
100%
Irreparable Reparable

Needs Assessment Report on the Village Level –Aleppo Province
70 of 78 وحدة إدارة المعلومات
Information Management Unit
Status of Civil Defense Teams
The existence of trained civil defense teams in a context of continuous shelling over Aleppo
is an inevitable requirement. Figure (19) shows the locations of these teams in the targeted
villages. Jabal Samaan is found to have 4 villages with no active civil defense teams in them,
whereas Tal Daman has 56 villages with no civil defense teams to serve them. Moreover,
none of the adjacent villages have any civil defense teams to resort to in cases of emergency.
Fig. 19- Status of civil defense groups in the villages 1111
1 1 1
5
31
21
1
22 8
1 1
10
2
1014 7 1620 25 4 56
12
4
0%
10%20%
30%
40%50%
60%70%
80%
90%100%
No civil defensenever servedthis village
No civil defensein the village butserviced fromanother village
There is a civildefense invillage
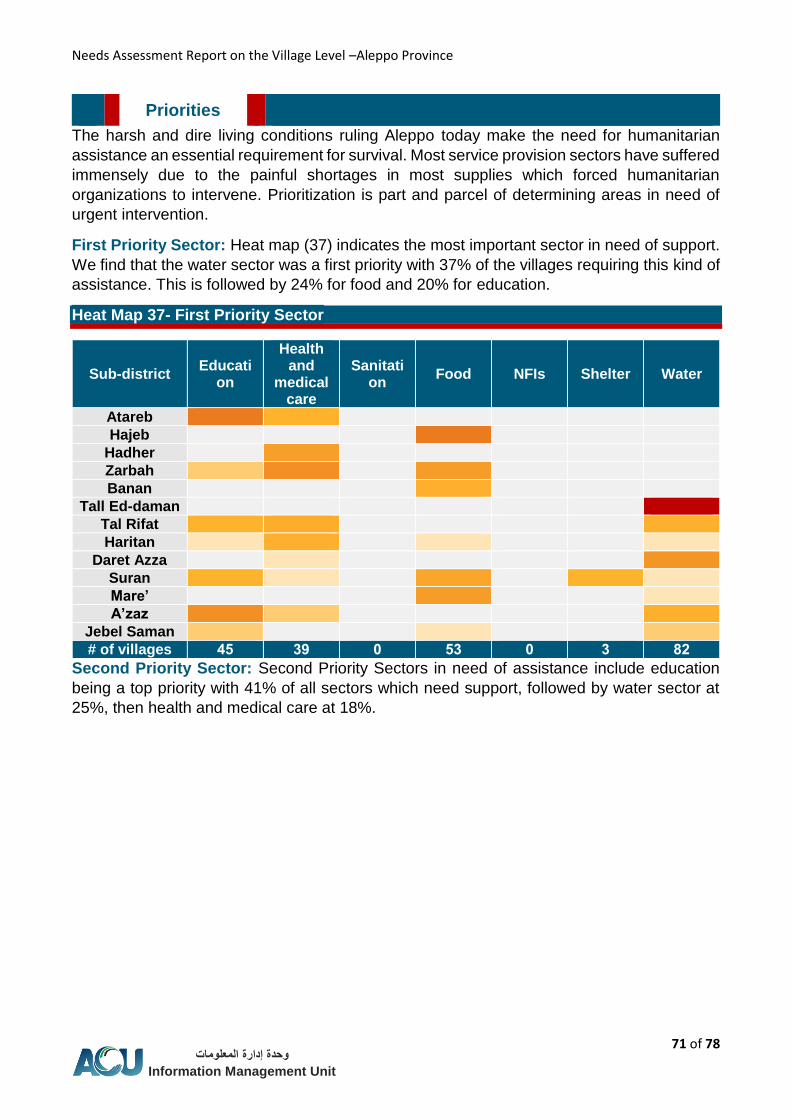
Needs Assessment Report on the Village Level –Aleppo Province
71 of 78 وحدة إدارة المعلومات
Information Management Unit
Priorities
The harsh and dire living conditions ruling Aleppo today make the need for humanitarian
assistance an essential requirement for survival. Most service provision sectors have suffered
immensely due to the painful shortages in most supplies which forced humanitarian
organizations to intervene. Prioritization is part and parcel of determining areas in need of
urgent intervention.
First Priority Sector: Heat map (37) indicates the most important sector in need of support.
We find that the water sector was a first priority with 37% of the villages requiring this kind of
assistance. This is followed by 24% for food and 20% for education.
Heat Map 37- First Priority Sector ز
Sub-district Educati
on
Health and
medical care
Sanitation
Food NFIs Shelter Water
Atareb
Hajeb
Hadher
Zarbah
Banan
Tall Ed-daman
Tal Rifat
Haritan
Daret Azza
Suran
Mare’
A’zaz
Jebel Saman
# of villages ,7 31 1 73 1 3 ,3
Second Priority Sector: Second Priority Sectors in need of assistance include education
being a top priority with 41% of all sectors which need support, followed by water sector at
25%, then health and medical care at 18%.

Needs Assessment Report on the Village Level –Aleppo Province
72 of 78 وحدة إدارة المعلومات
Information Management Unit
Heat Map 38- Second Priority Sector
ز
Sub-district Educatio
n
Health and
Medical care
Sanitation
Food NFIs Shelter Water
Atareb
Hajeb
Hadher
Zarbah
Banan
Tall Ed-daman
Tal Rifat
Haritan
Daret Azza
Suran
Mare’
A’zaz
Jebel Saman
# of villages 11 ,1 3 33 , 3 78
Third Priority Sector: Heat map (39) shows most of the sector that have a third priority in
terms of need for assistance. Health and Medical care came first (47%) of all sectors that
need assistance, followed by 29% for education and 11% for water.
Heat Map 39 - Third priority sector ز
Sub-district Educatio
n
Health and
Medical care
Sanitation
Food NFIs Shelter Water
Atareb Hajeb
Hadher Zarbah Banan
Tall Ed-daman Tal Rifat Haritan
Daret Azza Suran Mare’ A’zaz
Jebel Saman Number of
villages 87 017 3 33 3 3 33
2

Needs Assessment Report on the Village Level –Aleppo Province
73 of 78 وحدة إدارة المعلومات
Information Management Unit
Most Vulnerable Groups in Need of Assistance
Heat map (40) illustrates that the most vulnerable group with the highest need of assistance
are those who occupy mass shelters, (31%- priority 1), whereas those who live in vacant and
incomplete buildings comprise (25%- priority 2) and IDPs who live with host families had
(20%- priority 3).
Heat Map 40- Most Vulnerable Groups in Need of Assistance ز
Sub-district Residing
Locals (not displaced)
Locals hosting IDPs
IDPs living in vacant
buildings
IDPs living in mass
shelters (schools and
camps)
IDPs living with host families
Atareb Hajeb
Hadher Zarbah Banan
Tall Ed-daman Tal Rifat Haritan
Daret Azza Suran Mare’ A’zaz
Jebel Saman Number of
villages ,1 03 77 81 ,7

Needs Assessment Report on the Village Level –Aleppo Province
74 of 78 وحدة إدارة المعلومات
Information Management Unit
Annex
Sub-district Code Sub-district Name Village Code Village Name #
SY060304 Zarbah C3779 Berneh 1
SY060300 Zarbah C3673 Bawabiyeh 2
SY060302 Zarbah C3718 Tal Bajer 3
SY060302 Zarbah C3715 Tal Hadiya 2
SY060300 Zarbah C3674 Tal Alloush 0
SY060300 Zarbah C3676 Tal Mammo 2
SY060300 Zarbah C3669 Jeb Kas 2
SY060300 Zarbah C3672 Jezraya 5
SY060304 Zarbah C3777 Hmeira 2
SY060300 Zarbah C3675 Hweir el Eis 11
SY060302 Zarbah C3719 Rasm el Eis 11
SY060302 Zarbah C3712 Zammar 12
SY060304 Zarbah C3776 Ziyaret Samaan 13
SY060300 Zarbah C3670 Zetan 12
SY060300 Zarbah C3668 Talafeh 10
SY060302 Zarbah C3714 Othmnieh Kbeereh 12
SY060302 Zarbah C3721 Arradeh 12
SY060300 Zarbah C3677 Gammari 15
SY060300 Zarbah C3679 Kseibiyeh 12
SY060300 Zarbah C3678 Kosniya 21
SY110302 Hadher C5981 Hadher 21
SY060304 Hadher C3771 Al Eis 22
SY060304 Hadher C3770 Tal Dadeen 23
SY060304 Hadher C3767 Tleilat 22
SY060304 Hadher C3769 Jmeimeh 20
SY060304 Hadher C3768 Dulama 22
SY060304 Hadher C3775 Mremin Samaan 22
SY060304 Hadher C3772 Marioudeh 25
SY060304 Hadher C3773 Mkahhaleh 22
SY020400 A’zaz C1561 Al Salameh 31
SY020400 A’zaz C1560 Al Ferziyeh 31
SY020400 A’zaz C1565 Al Kroum 32
SY020400 A’zaz C1563 Al Malkiyeh 33
SY020400 A’zaz C1564 Azaz 32
SY020400 A’zaz C1559 Telil Al Sham 30
SY020400 A’zaz C1562 Jarez 32
SY020400 A’zaz C1556 Sejraz 32
SY020400 A’zaz C1557 ShaMare’kh 35
SY020400 A’zaz C1566 ShMare’en 32
SY020400 A’zaz C1558 Tateeyeh 21
SY020400 A’zaz C1567 Kafr Khasher 21
SY020400 A’zaz C1568 Kafr Kalbeen 22
SY020400 A’zaz C1575 Keljebreen 23
SY020400 A’zaz C1570 Maranaz 22
SY020400 A’zaz C1574 Maareen 20

Needs Assessment Report on the Village Level –Aleppo Province
75 of 78 وحدة إدارة المعلومات
Information Management Unit
Sub-district Code Sub-district Name Village Code Village Name #
SY020400 A’zaz C1569 Menneq 22
SY020400 A’zaz C1572 Nidde 22
SY020400 A’zaz C1573 Naiyara 25
SY020400 A’zaz C1571 Yahmoul 22
SY020402 Tal Rifat C1623 Ehres 01
SY020402 Tal Rifat C1624 Sheikh Eesa 01
SY020402 Tal Rifat C1617 Tal Jibbeen 02
SY020402 Tal Rifat C1621 Tal Rifat 03
SY020402 Tal Rifat C1618 Talaajar 02
SY020402 Tal Rifat C1619 Tinneb 00
SY020402 Tal Rifat C1620 Deir Jmal 02
SY020402 Tal Rifat C1622 Tatemrash 02
SY020402 Tal Rifat C1625 Keshtaar 05
SY020402 Tal Rifat C1628 Kafr Naseh Tal Rifat 02
SY020402 Tal Rifat C1626 Kafrnaya 21
SY020402 Tal Rifat C1627 Masqan 21
SY020403 Mare’ C1634 Husniyeh – Hasa JK 22
SY020403 Mare’ C1630 Saed Qolser WJ 23
SY020403 Mare’ C1641 Marata Um Hosh 22
SY020403 Mare’ C1638 Talleqrah 20
SY020403 Mare’ C1635 Tal Madeeq 22
SY020403 Mare’ C1632 Tlaleen 22
SY020403 Mare’ C1631 Herbel 25
SY020403 Mare’ C1640 Fafeen 22
SY020403 Mare’ C1639 Qaramel 21
SY020403 Mare’ C1643 Mare’ 21
SY020403 Mare’ C1644 Wahshiyeh 22
SY020405 Suran C1669 Al Balle 23
SY020405 Suran C1658 Al Zaizafoun_Ekda 22
SY020405 Suran C1666 Al Zahriyeh_Azaz 20
SY020405 Suran C1668 L’ Eddeeiyeh 22
SY020405 Suran C1657 Yarubeiyeh 22
SY020405 Suran C1663 Baragheedeh 25
SY020405 Suran C1661 Hawwar Kelles 22
SY020405 Suran C1659 Dweibeq 51
SY020405 Suran C1665 Raell 51
SY020405 Suran C1660 Shweireen 52
SY020405 Suran C1664 Suran 53
SY020405 Suran C1671 Kafr Barjeh 52
SY020405 Suran C1673 Afrshooush 50
SY020405 Suran C1672 Kafra 52
SY020405 Suran C1670 Mreighel 52
SY110301 Banan C5931 Al Smeireeiyeh 55
SY110301 Banan C5936 Bloozeh 52
SY090201 Banan C5175 Banan 21
SY110301 Banan C5937 Qteitraat 21
SY110301 Hajeb C5952 Abu Jallous 22
SY110301 Hajeb C5949 Abu Abdeh 23
SY110301 Hajeb C5951 Abu Ghitteh 22

Needs Assessment Report on the Village Level –Aleppo Province
76 of 78 وحدة إدارة المعلومات
Information Management Unit
Sub-district Code Sub-district Name Village Code Village Name #
SY110301 Hajeb C5947 Jaramkeeiyeh 20
SY110301 Hajeb C5939 Teebeh Sfeereh 22
SY110302 Hajeb C5957 Madraseh 22
SY110301 Hajeb C5942 Burj el Sama 25
SY110301 Hajeb C5938 Burj Azzawi 22
SY110302 Hajeb C5955 Beesheh 111
SY110301 Hajeb C5941 Tal Anbar 111
SY110301 Hajeb C5953 Jeb Teeneh 112
SY110301 Hajeb C5945 Jeb ANtash Foqani 113
SY110301 Hajeb C5948 Hweir el Hoss 112
SY110302 Hajeb C5954 Rabeet el Hanouteh 110
SY110301 Hajeb C5940 Rasm Ameish 112
SY110301 Hajeb C5944 Sahhour 112
SY110301 Hajeb C5946 Swaiyan 115
SY110302 Hajeb C5958 Kafr Hout 112
SY110302 Hajeb C5959 Mugheirat Shibli 111
SY110302 Hajeb C5956 Maktabeh 111
SY110302 Jebel Saman C5979 Halab (Aleppo) 112
SY030704 Jebel Saman C2452 Khantouman 113
SY030702 Jebel Saman C2444 Abteen 112
SY020000 Jebel Saman C1018 Garrass 110
SY060304 Jebel Saman C3764 Mreiqes 112
SY040401 Atareb C2885 Epzimo 112
SY110302 Atareb C5984 Atareb 115
SY040400 Atareb C2875 Tawwameh 112
SY040401 Atareb C2887 Jeeneh 121
SY040401 Atareb C2877 Sahhara 121
SY040401 Atareb C2886 Sheikh Ali 122
SY040400 Atareb C2874 Qanater 123
SY040401 Atareb C2880 ABen Smaan 122
SY040401 Atareb C2881 Urem Assughra 120
SY040401 Atareb C2884 Urem AlKubra 122
SY040400 Atareb C2876 Babkeh 122
SY040401 Atareb C2879 Batabo 125
SY040401 Atareb C2883 Taddel 122
SY040401 Atareb C2878 Quijel 131
SY040400 Atareb C2866 Kafr Nouran 131
SY040400 Atareb C2862 Kafr Taal 132
SY040400 Atareb C2865 Kafr Joum Ghrbeeiyeh 133
SY040400 Atareb C2864 Jafr Halab 132
SY040401 Atareb C2888 Kafr Ammeh 130
SY040400 Atareb C2860 Kafr Karmeen 132
SY040400 Atareb C2861 Kafr Naseh_Atareb 132
SY040400 Atareb C2859 Kafrnaha 135
SY040400 Atareb C2863 Maara_ Atareb 132
SY060304 Tall Ed-daman C3774 Establaat 121
SY020200 Tall Ed-daman C1194 E’ibed 121
SY060303 Tall Ed-daman C3727 L’Hmeidi 122
SY060303 Tall Ed-daman C3743 Hiyaniyeh 123

Needs Assessment Report on the Village Level –Aleppo Province
77 of 78 وحدة إدارة المعلومات
Information Management Unit
Sub-district Code Sub-district Name Village Code Village Name #
SY060302 Tall Ed-daman C3711 Assiyyah 122
SY060303 Tall Ed-daman C3748 Al Mansoura 120
SY060303 Tall Ed-daman C3723 Al Noumaneeiyeh 122
SY060300 Tall Ed-daman C3671 Abu Rweil 122
SY060303 Tall Ed-daman C3726 Irjel 125
SY060303 Tall Ed-daman C3722 Um EL Amad Qibli 122
SY060303 Tall Ed-daman C3733 Um EL Karameel 101
SY060303 Tall Ed-daman C3737 Um Teenet Samaan 101
SY060303 Tall Ed-daman C3724 Um Tmaakh Samaan 102
SY060301 Tall Ed-daman C3694 Um Ejj 103
SY060301 Tall Ed-daman C3690 Um Ghbaar 102
SY060301 Tall Ed-daman C3709 Um Gharraf 100
SY060301 Tall Ed-daman C3695 Um Wadi 102
SY060303 Tall Ed-daman C3740 Bat-ha 102
SY110302 Tall Ed-daman C5988 Battraneh 105
SY060303 Tall Ed-daman C3744 Blass 102
SY060301 Tall Ed-daman C3699 Bwiedah Sgheereh 121
SY060303 Tall Ed-daman C3751 Bwiedah Kbeereh 121
SY060303 Tall Ed-daman C3734 Tal Ahmar 122
SY060303 Tall Ed-daman C3728 Tal Hattabat Samaan 123
SY060303 Tall Ed-daman C3730 Tal Hawaseed Hanoeh 122
SY060303 Tall Ed-daman C3738 Tal Sabha 120
SY060303 Tall Ed-daman C3739 Tal Aqareb 122
SY060301 Tall Ed-daman C3700 Tal Maseh 122
SY110302 Tall Ed-daman C5991 Jeb el Khafi Samaan 125
SY060303 Tall Ed-daman C3750 Jib Eliess 122
SY060301 Tall Ed-daman C3691 Hilweeiyeh 121
SY060303 Tall Ed-daman C3736 Rajm Umeirat 121
SY060303 Tall Ed-daman C3752 Rasm el Safa 122
SY060301 Tall Ed-daman C3693 Rasm Lemfakker 123
SY060303 Tall Ed-daman C3747 Seibeeiyeh 122
SY060303 Tall Ed-daman C3746 Terfawi 120
SY060301 Tall Ed-daman C3689 Attshane Sharqeeiyeh 122
SY060301 Tall Ed-daman C3692 Atshaneh Gharbeeiyeh 122
SY060303 Tall Ed-daman C3741 Uleiss 125
SY060303 Tall Ed-daman C3735 Oueinat Kbeereh 122
SY060304 Tall Ed-daman C3765 Gheital_gheital 151
SY060304 Tall Ed-daman C3766 Qalet Al Sheikh 151
SY060301 Tall Ed-daman C3706 Kafr Eibesh 152
SY060304 Tall Ed-daman C3758 Kafr Ubeid 153
SY060304 Tall Ed-daman C3762 Koulet L’ebweider 152
SY060304 Tall Ed-daman C3756 Maaseh 150
SY060304 Tall Ed-daman C3757 Madaiyn Lekbeer 152
SY060301 Tall Ed-daman C3705 Marhameeiyeh 152
SY060301 Tall Ed-daman C3707 Mashrafet L’ebweidtein 155
SY060304 Tall Ed-daman C3763 Mashrafet Lemreij 152
SY060304 Tall Ed-daman C3759 Mashrafet Erjol 121
SY060304 Tall Ed-daman C3760 Maktal Lezbeidi 121
SY060301 Tall Ed-daman C3701 Nawwarah 122

Needs Assessment Report on the Village Level –Aleppo Province
78 of 78 وحدة إدارة المعلومات
Information Management Unit
Sub-district Code Sub-district Name Village Code Village Name #
SY060301 Tall Ed-daman C3704 Hazzani 123
SY060304 Tall Ed-daman C3761 Hooper 122
SY060301 Tall Ed-daman C3703 Wadi ddibis 120
SY060301 Tall Ed-daman C3702 Wadi L’Sannou’a 122
SY110302 Haritan C5985 Haritan 122
SY030702 Haritan C2447 Haiyan 125
SY040400 Haritan C2867 Anadan 122
SY030700 Haritan C2434 Kafr Bseen 211
SY030700 Haritan C2433 Kafar Hamra 211
SY030700 Haritan C2435 Maaret Al Arteeq 212
SY030700 Haritan C2431 Yaqed Al Adas 213
SY060300 Daret Azza C3683 Erhab 212
SY060300 Daret Azza C3687 Al Hoteh 210
SY040400 Daret Azza C2870 Bsartoun 212
SY060300 Daret Azza C3686 Beshqateen 212
SY060300 Daret Azza C3682 B’shantara 215
SY060300 Daret Azza C3684 Taqad 212
SY060300 Daret Azza C3681 Hor 211
SY110302 Daret Azza C5983 Daret Azza 211
SY060300 Daret Azza C3680 Zarzareeta 212
SY060300 Daret Azza C3685 EinJara 213
SY040400 Daret Azza C2873 Qobtan Al Jabal 212
SY040400 Daret Azza C2872 Kafranteen 210
SY040401 Daret Azza C2882 Mijbeeneh 212
SY060302 Zarbah C3717 Abaad 212
SY110302 Zarbah C5982 Zarbah 215
SY060304 Zarbah C3780 Sheikh Ahmad 212
SY060302 Zarbah C3716 Um Atabeh 221
SY060302 Zarbah C3720 Banes 221
SY060304 Zarbah C3778 Bargoum 222