Needs Assessment and Costing 2009-2015
254
-
Upload
khangminh22 -
Category
Documents
-
view
0 -
download
0
Transcript of Needs Assessment and Costing 2009-2015

"Support to Monitoring PRS & MDGs in Bangladesh" is being implemented by General EconomicsDivision, Planning Commission, supported by UNDP, which strengthens the capacity of Governmentprofessionals to track and monitor PRS/MDG progress and estimate the costs of achieving MDG targets.
Published byGeneral Economics Division
Planning Commission Government of the People's Republic of Bangladesh
July 2009
General Economics Division, Planning Commission hereby extends special gratitude to UNDPBangladesh for their continuous technical support in finalizing this document through the project titled
"Support to Monitoring PRS & MDGs in Bangladesh".
MILLENNIUM DEVELOPMENT GOALSNEEDS ASSESSMENT & COSTING 2009-2015
BANGLADESH
I am happy to learn that the General Economics Division (GED) of the Planning Commission has
prepared ' Millennium Development Goals: Needs Assessment and Costing 2009-2015 ' with the
technical support from the UNDP.
Bangladesh is committed to achieve the MDGs within stipulated time, i.e. by 2015. MDGs have been
integrated into the successive Bangladesh PRSPs and Annual Development Programmes (ADPs).
Bangladesh has already initiated actions to prepare Sixth Five Year Plan (2010-2015) that focuses on
achieving the MDGs within the stipulated time frame.
Bangladesh has already achieved a commendable niche in attaining the MDGs. The MDGs needs
assessment and costing is a very timely exercise and will contribute in the resources requirement
estimation for the Sixth Five Year Plan.
The Report has come out with a resources requirement of BDT 7,126.76 billion (USD 104.18 billion) to
attain all the MDGs in Bangladesh during 2009-2015. The estimated resource requirement to attain all
the MDGs in Bangladesh is a huge amount that would also require mobilization of resources by the
development partners of Bangladesh. I would urge our development partners to come forward with the
required resources as they pledged in the Millennium Declaration.
I congratulate GED and other Ministries/ Agencies for their cooperation in carrying out this exercise. I
would also like to appreciate UNDP for providing necessary technical support to carry out this exercise.
Air Vice Marshal (Rtd.) A K Khandker
Air Vice Marshal (Rtd.) A. K. Khandker
Minister
Ministry of Planning
Government of People's Republic of Bangladesh
Message

04 MILLENNIUM DEVELOPMENT GOALS NEEDS ASSESSMENT AND COSTING (2009-2015) BANGLADESH

The MDG Needs Assessment and Costing exercise for Bangladesh emanates from a joint effort of theGovernment of People's Republic of Bangladesh and UNDP to estimate the resources needed forachieving MDGs in Bangladesh by 2015. The focal point for the activities has been the GeneralEconomics Division (GED), Planning Commission, through implementing the project titled ' Support toMonitoring PRS and MDGs in Bangladesh' supported by UNDP. The Report has put together the statusand trends in progress of achievement of MDGs in Bangladesh, the challenges ahead, the majorinterventions and targets for MDGs, as well as the resources requirements for attaining MDGs by 2015.
To conduct the MDG Needs Assessment and Costing, five thematic areas were identified based on theUNDP developed templates i.e. poverty and hunger (MDG1), education (MDG2), gender (MDG3),health (MDG 4, 5 and 6) and environment (MDG7). Each thematic area was worked out by a ThematicWorking Group (TWG) led by the respective Ministry with members from different Ministries and UNAgencies. All the five thematic reports are synthesized with technical assistance from UNDP RegionalOffice to prepare the final report Millennium Development Goals: Needs Assessment and Costing2009-2015.
The Report has assessed that BDT 7,126.76 billion (USD 104.18 billion) would be required to attain allthe MDGs in Bangladesh during 2009 - 2015. The per capita resources requirement would be BDT5,115.95 (USD 74.79) in 2009 and BDT 8,289.48 (USD 121.19) in 2015. Thus, according to theestimate, annually about BDT 1,018 billion (USD 14.9 billion) would be required to attain all MDGs inBangladesh by 2015, implying annual per capita cost of about BDT 6,676 (USD 98).
The estimated resource requirement to attain all the MDGs in Bangladesh is a huge amount that wouldrequire mobilization of resources by the development partners of Bangladesh. Rich countries havealready committed in the Millennium Declaration to develop a global partnership with the poor countries(MDG 8) to attain MDG goals by 2015.
Prof. Dr. Shamsul AlamMemberGeneral Economics DivisionPlanning Commission
05MILLENNIUM DEVELOPMENT GOALS NEEDS ASSESSMENT AND COSTING (2009-2015) BANGLADESH
FOREWORD

06 MILLENNIUM DEVELOPMENT GOALS NEEDS ASSESSMENT AND COSTING (2009-2015) BANGLADESH
The ‘Millennium Development Goals (MDGs): Needs Assessment and Costing Report, 2009-2015’ inBangladesh was prepared by the General Economics Division (GED), Planning Commission with thetechnical support of the United Nations Development Programme (UNDP).
The Report has been prepared through a highly participatory and consultative process through FiveThematic Working Groups (TWG). Each of the TWGs was lead by the respective lead Ministry for thethematic area. We would like to acknowledge the leadership and the contributions of the lead Ministriesof the TWGs. They include General Economics Division (GED), Planning Commission, Ministry ofPrimary and Mass Education, Ministry of Women and Children Affairs, Ministry of Health and FamilyWelfare, Ministry of Environment and Forests. Besides, other ministries / agencies and UN bodies aspart of the TWGs contributed through a series of consultations.
The MDGs thematic area reports prepared by Dr. Md. Akteruzzaman, Dr. Sadeka Halim, Dr. HabiburRahman, Ms. Nahid Akter Jahan and Dr. Nepal Chandra Dey formed the backbone of the final report.Coordination of the exercise with consultants and TWGs, and the compilation of the report was doneby Mr. Narendra Mishra, Local Development and MDG Localisation Specialist, Support to monitoringPRS and MDGs in Bangladesh, UNDP Bangladesh.
Dr. Yubaraj Khatiawada Senior Economist, MDGI, UNDP Regional Center Colombo, Ms. MenakaGunwardene, UNDP RCC and Mr. Neil Fernando (formerly UNDP RCC) and other officials of UNDPRegional Center Bangkok and UNDP Regional Center Colombo provided training on use of the costingtools and technical backstopping for the MDG Needs Assessment and Costing exercise.
Dr. M. Golam Sarwar provided the leadership for the ‘MDG Needs Assessment and Costing exercise’as National Project Director ‘Support to Monitoring PRS and MDGs in Bangladesh’ and Mr. Kalyan RajPandey, Project Manager, provided necessary managerial support.
07MILLENNIUM DEVELOPMENT GOALS NEEDS ASSESSMENT AND COSTING (2009-2015) BANGLADESH
ACKNOWLEDGEMENTS

08 MILLENNIUM DEVELOPMENT GOALS NEEDS ASSESSMENT AND COSTING (2009-2015) BANGLADESH
MESSAGE
FOREWORD
ACKNOWLEDGEMENTS 7
LIST OF TABLES 11
LIST OF FIGURES 13
ACRONYMS 15
GLOSSARY 19
EXECUTIVE SUMMARY 21
CHAPTER 1 INTRODUCTION 33
CHAPTER 2 METHODOLOGY 41
CHAPTER 3 POVERTY AND HUNGER 47
MDG GOAL 1 - ERADICATE EXTREME POVERTY AND HUNGER 493.1 OVERVIEW OF DEVELOPMENT PROGRESS 493.2 PROGRESS IN ACHIEVING THE MDG 1 533.3 CHALLENGES AND OPPORTUNITIES IN REDUCING POVERTY AND HUNGER 673.4 MAJOR INTERVENTIONS AND TARGETS FOR MDG1 703.5 RESOURCE NEEDS ESTIMATES FOR MDG1 77
CHAPTER 4: EDUCATION 83
MDG GOAL 2 - ACHIEVE UNIVERSAL PRIMARY EDUCATION 854.1 OVERVIEW OF THE PRIMARY AND ADULT EDUCATION 854.2 PROGRESS IN ACHIEVING MDG2 864.3 THE CHALLENGES AHEAD IN ACHIEVING UNIVERSAL PRIMARY EDUCATION 974.4 MAJOR INTERVENTIONS AND TARGETS FOR MDG2 984.5 RESOURCE NEEDS ESTIMATES FOR MDG2 101
CHAPTER 5 GENDER 113
MDG GOAL 3 - PROMOTE GENDER EQUALITY AND EMPOWER WOMEN 1155.1 OVERVIEW 1155.2 PROGRESS OF ACHIEVING MDG3 1165.3 CHALLENGES IN PROMOTING GENDER EQUALITY AND EMPOWERMENT OF WOMEN 1215.4 MAJOR INTERVENTIONS AND TARGETS FOR ACHIEVING MDG 3 1235.5 COVERAGE AND RESOURCE NEEDS ESTIMATES FOR MDG 3 125
CHAPTER 6 HEALTH 135
MDG GOAL 4 - REDUCE CHILD MORTALITY 1376.1 OVERVIEW OF THE HEALTH, NUTRITION AND POPULATION SECTOR 1376.2 PROGRESS IN ACHIEVING MDG 4 1386.3 THE CHALLENGES AHEAD IN ACHIEVING MDG 4 143
09MILLENNIUM DEVELOPMENT GOALS NEEDS ASSESSMENT AND COSTING (2009-2015) BANGLADESH
TABLE OF CONTENTS
6.4 MAJOR INTERVENTIONS AND TARGETS FOR ATTAINING MDG 4 1446.5 RESOURCE NEEDS ESTIMATES FOR MDG 4 145
MDG GOAL 5 - IMPROVE MATERNAL HEALTH 1486.6 PROGRESS IN ACHIEVING MDG5 1486.7 THE CHALLENGES AHEAD IN ACHIEVING MDG5 1506.8 MAJOR INTERVENTIONS AND TARGETS FOR ATTAINING MDG5 1516.9 RESOURCE NEEDS ESTIMATES FOR MDG 5 153
MDG GOAL 6 - COMBAT HIV/AIDS, MALARIA AND OTHER DISEASES 1556.10 PROGRESS IN ACHIEVING MDG 5 1556.11 CHALLENGES AHEAD IN ACHIEVING MDG6 1606.12 MAJOR INTERVENTIONS AND TARGETS FOR ATTAINING MDG6 1616.13 RESOURCE NEEDS ESTIMATES FOR MDG 6 1646.14 HEALTH SYSTEMS OF BANGLADESH: CURRENT STATUS AND FUTURE NEED 1666.15 THE CHALLENGES AHEAD IN HEALTH SYSTEMS IN BANGLADESH 1696.16 MAJOR INTERVENTIONS FOR HEALTH SYSTEMS 1706.17 RESOURCE NEEDS ESTIMATE FOR HEALTH SYSTEMS 1706.18 TOTAL RESOURCE NEED FOR HEALTH-RELATED MDGS 4, 5 AND 6 173
CHAPTER 7: ENVIRONMENT 175
MDG GOAL 7 - ENSURE ENVIRONMENTAL SUSTAINABILITY 1777.1 OVERVIEW OF STATE OF ENVIRONMENT IN BANGLADESH 1777.2. PROGRESS IN ACHIEVING TARGETS ON ENVIRONMENT 1797.3 MAJOR INTERVENTIONS FOR TARGET 9 ON ENVIRONMENT 1937.4 RESOURCE NEEDS ESTIMATES FOR MEETING TARGETS ON ENVIRONMENTAL ISSUES 2037.5 OVERVIEW OF ENERGY SECTOR IN BANGLADESH 2057.6 CURRENT SITUATION CHALLENGES IN ENERGY 2077.7 MAJOR INTERVENTIONS AND TARGETS FOR ENERGY SECTORS/END-USES 2097.8 RESOURCE NEEDS ESTIMATES FOR ENERGY 2127.9 OVERVIEW OF SAFE DRINKING WATER AND SANITATION 2147.10 CURRENT SITUATION AND ISSUES ON WATER SUPPLY AND SANITATION 2157.11 MAJOR INTERVENTIONS AND TARGETS FOR WATER SUPPLY AND SANITATION 2187.12 RESOURCE NEEDS ESTIMATES FOR WATER SUPPLY AND SANITATION 224
CHAPTER 8 SUMMARY AND CONCLUSION 227
BIBLIOGRAPHY AND REFERENCES 237
ANNEXURE : PARTICIPANTS OF THE MDG NEEDS ASSESSMENT ANDCOSTING EXERCISE 247
10 MILLENNIUM DEVELOPMENT GOALS NEEDS ASSESSMENT AND COSTING (2009-2015) BANGLADESH
TABLE OF CONTENTS
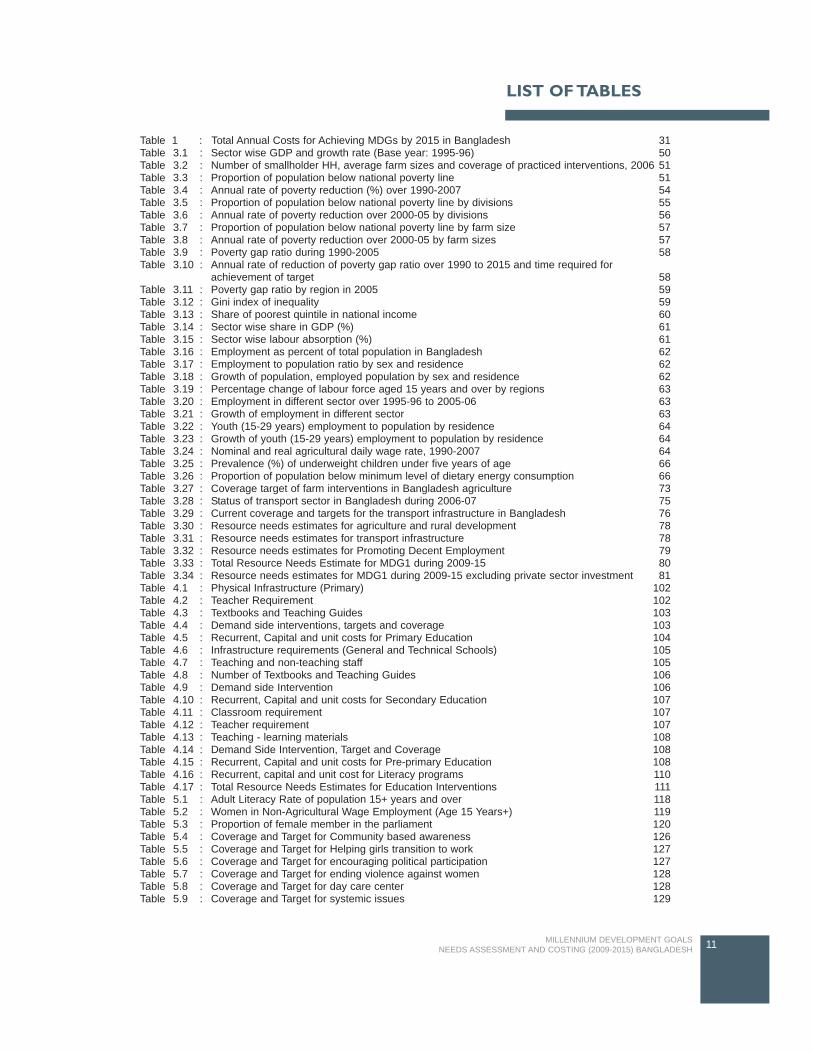
Table 1 : Total Annual Costs for Achieving MDGs by 2015 in Bangladesh 31Table 3.1 : Sector wise GDP and growth rate (Base year: 1995-96) 50Table 3.2 : Number of smallholder HH, average farm sizes and coverage of practiced interventions, 2006 51Table 3.3 : Proportion of population below national poverty line 51Table 3.4 : Annual rate of poverty reduction (%) over 1990-2007 54Table 3.5 : Proportion of population below national poverty line by divisions 55Table 3.6 : Annual rate of poverty reduction over 2000-05 by divisions 56Table 3.7 : Proportion of population below national poverty line by farm size 57Table 3.8 : Annual rate of poverty reduction over 2000-05 by farm sizes 57Table 3.9 : Poverty gap ratio during 1990-2005 58Table 3.10 : Annual rate of reduction of poverty gap ratio over 1990 to 2015 and time required for
achievement of target 58Table 3.11 : Poverty gap ratio by region in 2005 59Table 3.12 : Gini index of inequality 59Table 3.13 : Share of poorest quintile in national income 60Table 3.14 : Sector wise share in GDP (%) 61Table 3.15 : Sector wise labour absorption (%) 61Table 3.16 : Employment as percent of total population in Bangladesh 62Table 3.17 : Employment to population ratio by sex and residence 62Table 3.18 : Growth of population, employed population by sex and residence 62Table 3.19 : Percentage change of labour force aged 15 years and over by regions 63Table 3.20 : Employment in different sector over 1995-96 to 2005-06 63Table 3.21 : Growth of employment in different sector 63Table 3.22 : Youth (15-29 years) employment to population by residence 64Table 3.23 : Growth of youth (15-29 years) employment to population by residence 64Table 3.24 : Nominal and real agricultural daily wage rate, 1990-2007 64Table 3.25 : Prevalence (%) of underweight children under five years of age 66Table 3.26 : Proportion of population below minimum level of dietary energy consumption 66Table 3.27 : Coverage target of farm interventions in Bangladesh agriculture 73Table 3.28 : Status of transport sector in Bangladesh during 2006-07 75Table 3.29 : Current coverage and targets for the transport infrastructure in Bangladesh 76Table 3.30 : Resource needs estimates for agriculture and rural development 78Table 3.31 : Resource needs estimates for transport infrastructure 78Table 3.32 : Resource needs estimates for Promoting Decent Employment 79Table 3.33 : Total Resource Needs Estimate for MDG1 during 2009-15 80Table 3.34 : Resource needs estimates for MDG1 during 2009-15 excluding private sector investment 81Table 4.1 : Physical Infrastructure (Primary) 102Table 4.2 : Teacher Requirement 102Table 4.3 : Textbooks and Teaching Guides 103Table 4.4 : Demand side interventions, targets and coverage 103Table 4.5 : Recurrent, Capital and unit costs for Primary Education 104Table 4.6 : Infrastructure requirements (General and Technical Schools) 105Table 4.7 : Teaching and non-teaching staff 105Table 4.8 : Number of Textbooks and Teaching Guides 106Table 4.9 : Demand side Intervention 106Table 4.10 : Recurrent, Capital and unit costs for Secondary Education 107Table 4.11 : Classroom requirement 107Table 4.12 : Teacher requirement 107Table 4.13 : Teaching - learning materials 108Table 4.14 : Demand Side Intervention, Target and Coverage 108Table 4.15 : Recurrent, Capital and unit costs for Pre-primary Education 108Table 4.16 : Recurrent, capital and unit cost for Literacy programs 110Table 4.17 : Total Resource Needs Estimates for Education Interventions 111Table 5.1 : Adult Literacy Rate of population 15+ years and over 118Table 5.2 : Women in Non-Agricultural Wage Employment (Age 15 Years+) 119Table 5.3 : Proportion of female member in the parliament 120Table 5.4 : Coverage and Target for Community based awareness 126Table 5.5 : Coverage and Target for Helping girls transition to work 127Table 5.6 : Coverage and Target for encouraging political participation 127Table 5.7 : Coverage and Target for ending violence against women 128Table 5.8 : Coverage and Target for day care center 128Table 5.9 : Coverage and Target for systemic issues 129
11MILLENNIUM DEVELOPMENT GOALS NEEDS ASSESSMENT AND COSTING (2009-2015) BANGLADESH
LIST OF TABLES
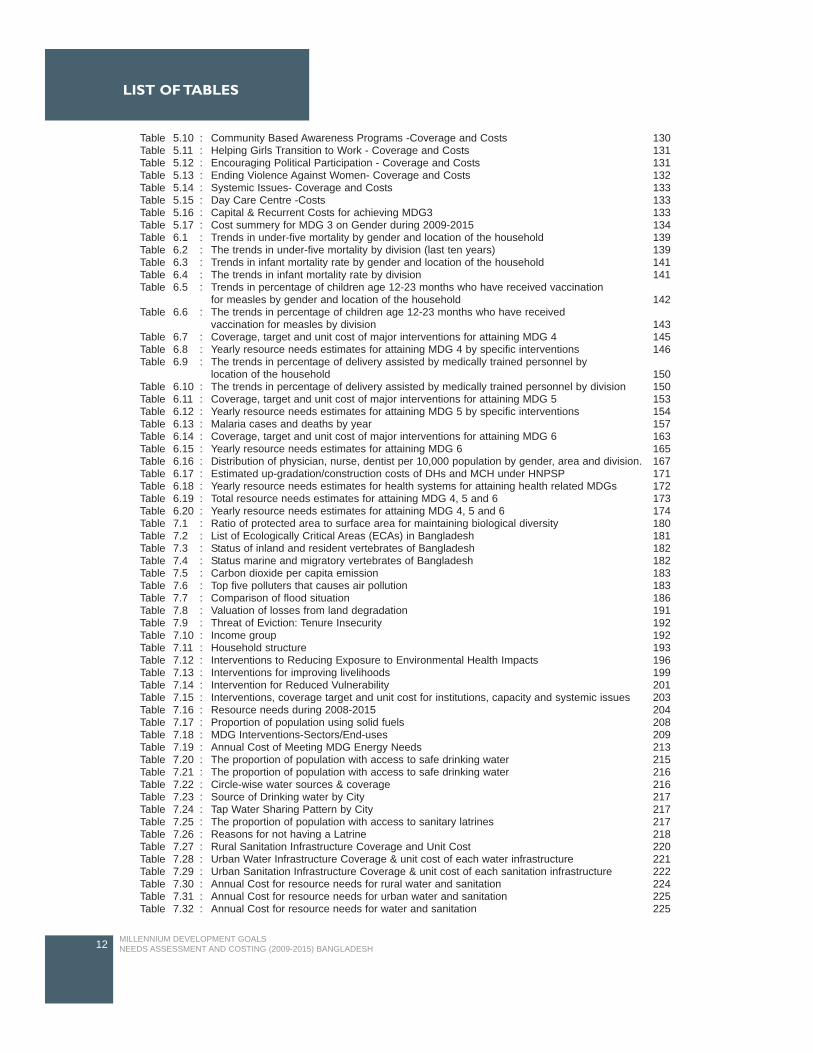
Table 5.10 : Community Based Awareness Programs -Coverage and Costs 130Table 5.11 : Helping Girls Transition to Work - Coverage and Costs 131Table 5.12 : Encouraging Political Participation - Coverage and Costs 131Table 5.13 : Ending Violence Against Women- Coverage and Costs 132Table 5.14 : Systemic Issues- Coverage and Costs 133Table 5.15 : Day Care Centre -Costs 133Table 5.16 : Capital & Recurrent Costs for achieving MDG3 133Table 5.17 : Cost summery for MDG 3 on Gender during 2009-2015 134Table 6.1 : Trends in under-five mortality by gender and location of the household 139Table 6.2 : The trends in under-five mortality by division (last ten years) 139Table 6.3 : Trends in infant mortality rate by gender and location of the household 141Table 6.4 : The trends in infant mortality rate by division 141Table 6.5 : Trends in percentage of children age 12-23 months who have received vaccination
for measles by gender and location of the household 142Table 6.6 : The trends in percentage of children age 12-23 months who have received
vaccination for measles by division 143Table 6.7 : Coverage, target and unit cost of major interventions for attaining MDG 4 145Table 6.8 : Yearly resource needs estimates for attaining MDG 4 by specific interventions 146Table 6.9 : The trends in percentage of delivery assisted by medically trained personnel by
location of the household 150Table 6.10 : The trends in percentage of delivery assisted by medically trained personnel by division 150Table 6.11 : Coverage, target and unit cost of major interventions for attaining MDG 5 153Table 6.12 : Yearly resource needs estimates for attaining MDG 5 by specific interventions 154Table 6.13 : Malaria cases and deaths by year 157Table 6.14 : Coverage, target and unit cost of major interventions for attaining MDG 6 163Table 6.15 : Yearly resource needs estimates for attaining MDG 6 165Table 6.16 : Distribution of physician, nurse, dentist per 10,000 population by gender, area and division. 167Table 6.17 : Estimated up-gradation/construction costs of DHs and MCH under HNPSP 171Table 6.18 : Yearly resource needs estimates for health systems for attaining health related MDGs 172Table 6.19 : Total resource needs estimates for attaining MDG 4, 5 and 6 173Table 6.20 : Yearly resource needs estimates for attaining MDG 4, 5 and 6 174Table 7.1 : Ratio of protected area to surface area for maintaining biological diversity 180Table 7.2 : List of Ecologically Critical Areas (ECAs) in Bangladesh 181Table 7.3 : Status of inland and resident vertebrates of Bangladesh 182Table 7.4 : Status marine and migratory vertebrates of Bangladesh 182Table 7.5 : Carbon dioxide per capita emission 183Table 7.6 : Top five polluters that causes air pollution 183Table 7.7 : Comparison of flood situation 186Table 7.8 : Valuation of losses from land degradation 191Table 7.9 : Threat of Eviction: Tenure Insecurity 192Table 7.10 : Income group 192Table 7.11 : Household structure 193Table 7.12 : Interventions to Reducing Exposure to Environmental Health Impacts 196Table 7.13 : Interventions for improving livelihoods 199Table 7.14 : Intervention for Reduced Vulnerability 201Table 7.15 : Interventions, coverage target and unit cost for institutions, capacity and systemic issues 203Table 7.16 : Resource needs during 2008-2015 204Table 7.17 : Proportion of population using solid fuels 208Table 7.18 : MDG Interventions-Sectors/End-uses 209Table 7.19 : Annual Cost of Meeting MDG Energy Needs 213Table 7.20 : The proportion of population with access to safe drinking water 215Table 7.21 : The proportion of population with access to safe drinking water 216Table 7.22 : Circle-wise water sources & coverage 216Table 7.23 : Source of Drinking water by City 217Table 7.24 : Tap Water Sharing Pattern by City 217Table 7.25 : The proportion of population with access to sanitary latrines 217Table 7.26 : Reasons for not having a Latrine 218Table 7.27 : Rural Sanitation Infrastructure Coverage and Unit Cost 220Table 7.28 : Urban Water Infrastructure Coverage & unit cost of each water infrastructure 221Table 7.29 : Urban Sanitation Infrastructure Coverage & unit cost of each sanitation infrastructure 222Table 7.30 : Annual Cost for resource needs for rural water and sanitation 224Table 7.31 : Annual Cost for resource needs for urban water and sanitation 225Table 7.32 : Annual Cost for resource needs for water and sanitation 225
12 MILLENNIUM DEVELOPMENT GOALS NEEDS ASSESSMENT AND COSTING (2009-2015) BANGLADESH
LIST OF TABLES
Figure 3.1 Growth of poverty gap ratio over 2000-2005 59Figure 3.2 Gini-ratio during 1990-2007 60Figure 3.3 Growth of GDP 61Figure 3.4 Prevalence of underweight children under five years age 65Figure 3.5 Share of cost in roads infrastructure 79Figure 4.1 Primary school enrollment 86Figure 4.2 Trend in Net Enrollment Rate (NER) 88Figure 4.3 Primary School completion rate - current and required trend 90Figure 4.4 Adult Literacy Rate 93Figure 5.1 Trends in primary school enrollment (by gender), 1990-2005 116Figure 5.2 Trends in secondary school education (excluding intermediate) 117Figure 5.3 Proportion of female member in parliament 120Figure 5.4 Share of female member in parliament 120Figure 6.1 Under-five mortality rate 138Figure 6.2 Infant Mortality rate 140Figure 6.3 Child immunization against measles 142Figure 6.4 Maternal mortality rate 148Figure 6.5 Proportion of births attended by skilled health personnel 149Figure 6.6 Condom use rate 156Figure 6.7 Contraceptive prevalence rate 157Figure 6.8 Notified cases of malaria per 100,000 population 158Figure 6.9 Malaria mortality rate per 100,000 population 158Figure 6.10 Tuberculosis detection rate under DOTS 159Figure 6.11 Tuberculosis treatment success rate under DOTS 160Figure 7.1 Proportion of forest coverage 179Figure 7.2 Changes of forest depletion 179Figure 7.3 Yearwise vehicle growth in Dhaka city 184Figure 7.4 Annual average PM10 and PM2.5 in Dhaka 184 Figure 7.5 Consumption of ozone depleting CFCs 185Figure 7.6 Changes in organic matter 190Figure 7.7 Proportion of households with access to secure tenure 191Figure 7.8 Energy use 207Figure 7.9 Primary commercial energy consumption by source 207Figure 7.10 Consumption of biomass fuel 208Figure 7.11 Percentage of households using different sources of fuels in rural areas 208
13MILLENNIUM DEVELOPMENT GOALS NEEDS ASSESSMENT AND COSTING (2009-2015) BANGLADESH
LIST OF FIGURES

14 MILLENNIUM DEVELOPMENT GOALS NEEDS ASSESSMENT AND COSTING (2009-2015) BANGLADESH
ADB Asian Development BankAIDS Acquired Immune Deficiency SyndromeANC Ante Natal CareAQMP Air Quality Monitoring ProjectATP Acceptance Test ProcedureAWG-LCA Ad Hoc Working Group on Long-term Cooperative Action under UNFCCCBANBEIS Bangladesh Bureau of Educational Information and StatisticsBBS Bangladesh Bureau of StatisticsBDHS Bangladesh Demographic and Health SurveyBDT Bangladesh TakaBGMEA Bangladesh Garment Manufacturers and Exporters AssociationBIDS Bangladesh Institute of Development StudiesBNFE Bureau of Non Formal EducationBNWLA Bangladesh National Women's Lawyers AssociationBRTA Bangladesh Road Transport AuthorityBWDB Bangladesh Water Development BoardCAGR Compound annual growth rateCAMPE Campaign for Popular Education CBN Cost of basic needsCC Community ClinicCCA Common Country AssessmentCEDAW Convention on Elimination of All Forms of Discrimination against WomenC-EmOC Comprehensive Emergency Obstetric Care CFC11 TrichlorofluorometeheCGE Computable general equilibriumCMMU Construction and Maintenance Management UnitCNG Compressed natural GasCNS Child Nutrition SurveyCSBA Community Skilled Birth AttendantCSO Civil society organizationCUS Center for Urban StudiesDCC Dhaka City CorporationDFA Dakar Framework of ActionDGFP Directorate General of Family PlanningDGHS Directorate General of Health ServicesDH District HospitalDoE Department of EnvironmentDOF Department of ForestDOTS Directly Observed Treatment - Short CoursesDPE Directorate of Primary EducationDPHE Department of Public HealthDSP Deep Set Pump DSW Department of Social Welfare DWA Development of Women AffairsDWASA Dhaka WASAEFA Education for AllEMIS Education Management Information SystemETP Export Trading PolicyEU European UnionFDI Foreign Direct InvestmentFSSAP Female Secondary School Assistance ProjectFY Fiscal yearFYP Five Year Plans
15MILLENNIUM DEVELOPMENT GOALS NEEDS ASSESSMENT AND COSTING (2009-2015) BANGLADESH
ACRONYMS
GDP Gross domestic productGER Gross Enrolment RatioGNI Gross national incomeGoB Government of BangladeshHCFC-22 ChlorodifluorometheneHIES Household Income and Expenditure SurveyHNPSP Health, Nutrition and Population Sector ProgramHPSP Health and Population Sector ProgramHRD Human resources developmentICT Information Communication TechnologyIDEAL Intensive District Education for AllINFEP Integrated Non Formal Education ProgrammeI-PRSP Interim-PRSPIFI International Financial InstitutesIMF International Monetary FundIMR Infant Mortality RateLDC Least development countriesLGED Local Government Engineering DepartmentLPUPAP Local Partnerships for Urban Poverty Alleviation ProjectMCH Medical College HospitalMDG Millennium Development GoalMICS Multiple Indicator Cluster SurveyMMR Maternal Mortality RatioMoA Ministry of AgricultureMoE Ministry of EducationMoEA Ministry of Economic AffairsMoEF Ministry of Environment and Forests MoHFW Ministry of Health and Family WelfareMoIC Ministry of Information and CommunicationsMOPME Ministry of Primary and Mass EducationMOWCA Ministry of Women and Children AffairsMWTL Multiple Ways of Teaching and LearningNASP National AIDS/STD ProgramNER Net Enrolment RatioNFE Non Formal EducationNFEP Non Formal Education ProjectNGO Non-government OrganizationNHS National Health SurveyNILG National Institute of Local GovernmentNPA National Plan of ActionNRR Net Reproduction RateNSP National Strategic PlanNTP National Tuberculosis control ProgramO3 OzoneOCC One Stop Crisis CentreODA Official Development AssistanceODS Ozone Depleting SubstanceOECD Organization for Economic Cooperation and DevelopmentPEDP Primary Education Development ProgramPG Poverty gapPLCE Post Literacy and Continuing EducationPPP Purchasing Power ParityPRSP Poverty Reduction Strategy PaperPWD Public Works Department
16 MILLENNIUM DEVELOPMENT GOALS NEEDS ASSESSMENT AND COSTING (2009-2015) BANGLADESH
ACRONYMS
ROSC Reaching Out of Schools ChildrenSEQAPE Secondary Education Quality and Access Enhancement Project SME Small & Medium EnterprisesSAM Social accounting matrixSEDA Sustainable Energy Development Agency SEP Sustainable Energy ProgrammeSHD Sustainable human developmentSPG Squared poverty gapSTW Shallow TubewellSVRS Sample Vita Registration SystemSWAp Sector Wide ApproachTLM Total Literacy MovementTWG Thematic Working GroupUHC Upazila Health ComplexUNCT UN country team UNDP United Nations Development ProgrammeUNEP United Nations Environment ProgrammeUNESCO United Nations Education Scientific and Cultural OrganizationUNFPA United Nations Population FundUNICEF United Nations International Children's Education FundUNIDO United Nations Industrial Development OrganizationUPE Universal Primary EducationUSC Union Sub CenterUSD United States DollarVAW Violence Against WomenVGD Vulnerable Group DevelopmentVGF Vulnerable Group FeedingVTI Vocational Training InstituteWASA Water Supply AuthorityWCEFA World Conference on Education for AllWFP World Food ProgrammeWID Women in Development WSC Women Support Centre
17MILLENNIUM DEVELOPMENT GOALS NEEDS ASSESSMENT AND COSTING (2009-2015) BANGLADESH
ACRONYMS

18 MILLENNIUM DEVELOPMENT GOALS NEEDS ASSESSMENT AND COSTING (2009-2015) BANGLADESH
Proportion of population below $1 (PPP) perday: Proportion of population below $1 per day isthe percentage of the population living on less then$1.08 a day at 1993 international prices.Poverty gap ratio (incidence multiplied by depthof poverty): Poverty gap ratio is the mean distanceseparating the population from the poverty line(with the non-poor being given a distance of zero),expressed as a percentage of the poverty line.Share of poorest quintile in nationalconsumption: Share of the poorest quintile innational consumption is the income that accrues tothe poorest fifty of the population.Prevalence of underweight children under fiveyears of age: Prevalence of (moderately orseverely) underweight children is the percentage ofchildren under five years old whose weight for ageis less than minus two standard deviations from themedian for the international reference population,ages 0-59 months.Proportion of population below minimum levelof dietary energy consumption: Proportion of thepopulation below the minimum level of dietaryenergy consumption is the percentage of thepopulation whose food intake falls below theminimum level of dietary energy requirements. Thisis also referred to as the prevalence of under-nourishment, which is the percentage of thepopulation that is undernourished.Unemployment rate of young people aged 15-24years, each sex and total: Unemployment rate ofyoung people aged 15-24 years is the number ofunemployed people ages 15-24, divided by thelabour force of the same age group. Unemployedpeople are all those who are not employed during aspecified reference period but are available forwork and have taken concrete steps to seek paidemployment or self-employment. Total Labour Force and Youth Labour Force:The total labour force covers labour forceparticipants 15 years and over while youth labourforce refers to age group 15-24 years. The labourforce is based on 'extended definition' whichincludes, in addition to persons employed orunemployed, persons who engage themselves insuch household activities as threshing, cleaning,care of livestock and poultry, food processing andsimilar activities.
Decent work: The ILO describes decent work as'opportunities for women and men to obtain decentand productive work in conditions of freedom,equity, security and human dignity'. Decent work isfundamental to promoting sustainable developmentand ensuring poverty reduction in a country likeBangladesh. Decent work can be elaborated interms of the following six dimensions: Opportunities for work: All persons (women andmen) who want work should be able to find work. Inthis respect, the underlying concept of work is abroad one encompassing all forms of economicactivity including self-employment, unpaid familywork and wage employment in both formal andinformal sectors.Work in conditions of freedom: This dimensionrequires that work should be freely chosen and notforced on individuals, along with the condition thatcertain forms of work are not acceptable (e.g.bonded labour, slave labour and child labour). Alsoworkers should have the freedom to join workersorganizations.Productive work: It is essential for workers tohave acceptable livelihoods as well as to ensuresustainable development and competitiveness ofenterprises. Equity in work: There should be fair and equitabletreatment and opportunity in work, absence ofdiscrimination at work and in access to work, andworkers should be able to balance work with familylife.Security at work: The conditions should bemindful of the need to help safeguard health,pensions and livelihoods, and to provide adequatefinancial and other protection in the event of healthand other contingencies. This also recognizes aworker's need to limit insecurity associated with thepossible loss of work and livelihood.Dignity at work: Workers should be treated withrespect at work, and be able to voice concerns andparticipate in decision-making about workingconditions. Workers' freedom to represent theirinterests collectively is also an essential ingredientof ensuring dignity.
The first two dimensions relate to the availabilityand acceptable scope of work, the remaining fourdimensions define the quality of employment.Taken together, these dimensions highlight thecomprehensive nature of the concept of decentwork. In addition, the concept of decent work has
19MILLENNIUM DEVELOPMENT GOALS NEEDS ASSESSMENT AND COSTING (2009-2015) BANGLADESH
GLOSSARY
significant gender implications in Bangladesh sincewomen constitute a vast majority of the labourforce, particularly youth labour in many sectors(e.g. readymade garments industries), and womenare usually the worst victims of failures to ensuredecent work conditions.Proportion of land area covered by forest: Theproportion of land area covered by forest areas asa share of total land area, where land area is totalsurface area excepting water bodies' areas. Forestincludes both natural forest and forest plantation.Ratio of area protected to maintain biologicaldiversity to surface area: The ratio of areaprotected to maintain biological diversity to surfacearea is defined as national protected area as apercentage of total surface area of the country.Energy use (Kg oil equivalent) per $1000 GDP(PPP): The Energy use (Kg oil equivalent) per USD1,000 GDP (PPP) is commercial energy measuredin units of oil equivalent per $1000 of grossdomestic product converted from nationalcurrencies using PPP conversion factor.Carbon dioxide per capita emission: The carbondioxide per capita emission is the total amount ofcarbon dioxide emitted by a country as a consequenceof human activities divided by the population of thecountry.Consumption of ozone depleting CFCs (ODPTons): Consumption of ozone depleting CFCs, isthe sum of the consumption of the weighted tons ofthe individual substances in the group-metric tonsof the individual substance. Proportion of population using solid fuels: Theproportion of population using solid fuels is theproportion of the population that relies on biomass(wood, charcoal, crop residues and dung) as theprimary source of domestic energy for cooking andheating.Proportion of population with sustainableaccess to improved water source: Theproportion of population with sustainable access toimproved water source is the percentage of thepopulation who use any of the following types ofwater supply for drinking: piped water, public tap,borehole or pump, protected well, protected springor rainwater. Improved water sources do notinclude vendor-provided water, bottled water,tanker trucks or unprotected wells and springs.
Proportion of population with sustainableaccess to improved sanitation: The Proportion ofpopulation with sustainable access to improvedsanitation refers to the percentage of the populationwith access to facilities that hygienically separatehuman excreta from human, animal and insectcontact.Proportion of population with access to securetenure: The proportion of population with access tosecure tenure is 1 minus the percentage of urbanpopulation that lives in slums. Lack of security oftenure is defined as the lack of formaldocumentation for the residence or perceived riskof eviction.Jhupri: Jhupri structures are those structuresmade of temporary materials like; jute stalk, sack,leaves of trees etc. Kutcha: Kutcha structures are those structuresmade of bamboo, wood, straw, sun hemp and othersemi-durable materials like CI sheet, etc.Semipucca: Semi-pucca structures are thosestructures where the wall and floor are made ofbrick and cement and the roof is made of CI sheet,tiles etc. Slum: A slum is a contiguous settlement where theinhabitants are characterized as having inadequatehousing and basic services. A slum is often notrecognized and addressed by the public authoritiesas an integral or equal part of the city.Secure tenure is the right of all individuals andgroups to effective protection by the state againstunlawful evictions.A slum household is a group of individuals livingunder the same roof that are lacking in at least oneof the components of access to sanitation, accessto safe water, secure tenure, durability of housingand sufficient living area (UN Habitat, 2003).Pucca: The pucca structures are those structureswhere both walls and roof are made of cement andbrick.
20 MILLENNIUM DEVELOPMENT GOALS NEEDS ASSESSMENT AND COSTING (2009-2015) BANGLADESH
GLOSSARY

Bangladesh's effort towards attainment of theMDGs has thus far been encouraging. It has madegood progress in achieving targets, especiallythose under MDG1 (halving the proportion ofpopulation living below poverty line); MDG2 (Netenrollment rate in primary education); MDG7(sustainable access to safe drinking water andsanitation); and MDG4 (reducing child mortality). Italso already achieved some Targets under MDG3(Gender parity in primary and secondary schooling)by 2005. But Bangladesh faces challenges in manyareas, especially in MDGs 4, 5 and 6 (on health).Although it has shown good progress in some ofthe Targets, sustaining the achievements of therecent past, while giving additional attention tothose Targets lagging behind, is a challenge.
The MDG Needs Assessment and Costing forBangladesh is a joint effort of the UN family andthe Government of People's Republic ofBangladesh to estimate the resources needed forachieving MDGs in Bangladesh by 2015. The focalpoints for the activity are the General EconomicsDivision (GED), Planning Commission,Government of Republic of Bangladesh and UnitedNations Development Programme (UNDP).
Five Thematic Areas were chosen to conduct theMDG Needs Assessment and Costing : Povertyand Hunger (MDG1), Education (MDG2), Gender(MDG3), Health (MDG 4, 5 and 6) and Environment(MDG7). Each thematic area was covered by aThematic Working Group (TWG) to ascertain theprogress achieved in Bangladesh, while assessingthe challenges to achieve the Targets by 2015. A listof interventions was then identified to address thechallenges remaining within each Thematic Area bythe respective TWGs. Costing of interventions wasdone using nine costing models: Agriculture andRural Development, Transport, Education, Gender,Health, HIV/AIDS, Environment, Energy, and WaterSupply and Sanitation. Trainings on use of thesemodels developed by the Millennium campaignwere done for the members of the TWGs by therepresentatives of UNDP and other relevant UNAgencies. The TWG was lead by the respectivethematic area lead Ministry, and consisted of themembers from different ministries and UNagencies.
1. MDG 1 Eradicate Extreme Poverty andHunger
Bangladesh has made significant progress inreducing poverty in recent decades. Estimates fromsources such as the Household IncomeExpenditure Survey (HIES) indicate that thepopulation below the poverty line decreased from58.8 percent in 1991-92 to 48.9 in the year 2000,and further to 40.0 percent by the year 2005. Whilethe present economic upheavals have impacted theratio of population below poverty line, but it isevident that Bangladesh has made good strides inreducing poverty and achieving MDG1.
However, variations exist between rural and urbanareas and evidence also shows that there are verylarge regional disparities in virtually all of the MDG1indicators in Bangladesh. Some of the regionalareas such as Barisal, Khulna and RajshahiDivisions have generally been lagging behind onseveral of the MDG1 indicators as compared toother Divisions and national averages. However, onaverage, the rural areas did better than urban areasin reducing the depth and severity of povertyimplying growth in rural areas has been pro-poor.
An assessment of the poverty situation based onthe farm categories size shows an inverse relationbetween size of farms and the population belowpoverty line when with the decreasing farm size,the population below poverty line tends to increase.Most of the farmers/households with farm sizesless than 0.50 hectares were below the nationalpoverty line. Further, on poverty gap ratio,estimates show that poverty gap ratio decreasedfrom 17.2 in 1990 to 12.9 in the year 2000, and to9.0 in 2005 highlighting an encouraging trend ofreduction in the poverty gap ratio by the year 2015.
Prevalence of underweight children under fiveyears has decreased from 67 percent in 1990 to 51percent in 2000 down further to 39.7 percent in2005. However, evidence suggests that theproportion of underweight children in Bangladesh ishigher than 16 other Asian countries. According toTask Force on Hunger (Millennium Project) 'Povertyis a major cause of hunger'. The prevalence ofunderweight children in Bangladesh is mostlyamongst the poor, yet, about one third of thechildren from the richest quintile are also sufferingfrom malnutrition. This suggests that factors otherthan income play an important role in this
21MILLENNIUM DEVELOPMENT GOALS NEEDS ASSESSMENT AND COSTING (2009-2015) BANGLADESH
EXECUTIVE SUMMARY
phenomenon. In analyses by the Task Force onHunger and other researchers, the following factorsemerged as strongly correlated with high levels ofunderweight pre-school children in developingcountries: poverty, low food production, mothers'lack of education, poor water, sanitation and healthfacilities, and climatic shocks (Task Force onHunger, 2003).
The TWG on Poverty and Hunger chaired by theGED/Planning Commission, based on analysis ofthe current situation in Bangladesh of MDGindicators related to poverty and hunger, identifieda set of challenges and the major interventionsrelated to poverty and food production. In addition,the TWG also discussed interventions for roadsinfrastructure to provide better access, andinterventions for promoting employment.Accordingly the coverage and targets were set bythe TWG in consultation with governmentdocuments and PRS-II. The interventions related tomother's education, health facilities are discussedin section on MDGs 4, 5 and 6 (Health); andinterventions related to water, sanitation and theclimatic shocks are discussed in section on MDG 7(Environment).
In Bangladesh, agricultural performance in the1990s has been relatively better with the growth inagricultural GDP estimated at 3.5 percent per yearcompared to 2.6 percent during 1974-90. Despiteyield gains in agriculture, challenges persist in ruralareas especially areas that are most remote frommarkets or who have poor grain storage capacities,etc. The main challenges identified by the TWGare: reducing hunger and malnutrition, creation ofyouth employment, protecting the vulnerable,promoting pro-poor growth, and expansion of ruralinfrastructure to ensure access to health andmodern facilities, and strengthening the rural-urbanmarket linkages by the poor.
The major interventions identified by the TWG are:increasing agricultural productivity, rural incomesand access to markets, development of roadinfrastructure, and promoting decent employment.
As mentioned above small scale farming familiesrepresent most of the poor/hungry in Bangladesh.Improving their productivity of crops, vegetables,trees and livestock is a major priority to reducehunger, in addition to the infrastructure required forstorages, agro-processing and micro-credit. Theseinterventions areas were considered by the TWG
under agriculture and rural development inwhich increasing agriculture productivity andincreasing rural income and access to marketswere identified as main intervention areas. Toincrease agriculture productivity the interventionsinclude investments to improve soil health, increaseaccess to use of improved seeds and plantprotection, improve and expand small scaleirrigation and water management, establisheffective agricultural research and extensionservices and subsidies in agriculture. Bangladeshalready provides subsidies in agriculture, butmaking agricultural inputs available at affordableprices through subsidies in a right mix of supportprogrammes is essential to ensure full coverage ofneedy farmers.
Properly functioning markets are critical in ensuringthat people are able to earn an income, obtain theinputs they need to raise crop yields, and sell theirproduce at fair prices. To increase rural incomesand market access for the poor the majorinterventions identified by the TWG are: buildingstorage facilities to reduce post-harvest losses,enhance agro-processing activities; improvingaccess to micro credit; and promoting communitymobilization. These interventions in agriculture andrural development are projected to cover alltargeted smallholder households each year, sincethey are important for all smallholder farmers, andare deliverable on a per-farm basis.
The total costs estimated for agriculture and ruraldevelopment interventions using the MillenniumProject's Agriculture and Rural Development costingmodel is estimated to be BDT 1591.07 billion (USD23.26 billion) for the period 2009-15 with an averageper capita cost of BDT 1284.65 (USD 18.78) in theyear 2009 increasing to BDT 1684 (USD 24.62) in year2015.
However, the major contribution of agriculture andrural development will be borne by householdcontribution (private individuals). Governmentexpenditures during 2009-2015 will relate to mainlyto the provision of subsidies costing about BDT415.55 billion (USD 6.07 billion), and in addition,the government will need to incur the costs ofnational interventions and a portion of the farminterventions. It is estimated that the Bangladeshgovernment will need to incur an expenditure ofabout BDT 865.99 billion (USD 12.66 billion) from2009-2015 for agriculture and rural development.
22 MILLENNIUM DEVELOPMENT GOALS NEEDS ASSESSMENT AND COSTING (2009-2015) BANGLADESH
EXECUTIVE SUMMARY
The TWG also identified the promotion of decentemployment as an important priority. Interventionsto promote decent employment include food forwork programs which act as safety nets for food-insecure households; social safety net programs(SSNPs) through employment guarantee schemes;and skill development programmes. It is estimatedthat the total costs for interventions to promotedecent employment are around BDT 385 billion(USD 5.63 billion) for the period 2009-2015 with anaverage per capita cost of BDT 375.09 (USD 5.48)in 2009 decreasing to 349.73 (USD 5.04) in 2015.
In total for agriculture and rural development andfor the promotion of decent employment the totalestimated costs are BDT 1871.07 billion (USD27.52 billion) for the period 2009-2015 at anaverage per capita cost of 1557.46 (USD 22.77) in2009 to BDT 1934.85 (USD 28.29) in the year2015.
It is also generally agreed that markets will notdevelop without public investment in roadinfrastructure. Interventions for development ofroad infrastructure include construction andmaintenance of roads at village, union, upazila,district and national level; and the construction andmaintenance of bridges and culverts on village,union, upazila, district and national roads inaddition to investments in waterways and railways. The total costs estimated for development of roadinfrastructure are BDT 336.19 billion (USD 4.92billion) with an average per capita cost of BDT321.17 (USD 4.7) in 2009 gradually increasing toBDT 307 (USD 4.49) in 2015.
The total costs estimated for achieving MDG 1using the costing model within the three categoriesof agriculture and rural development, developmentof road infrastructure, and the promotion of decentemployment are BDT 2312.26 billion (USD 33.80billion) for 2009-2015 at an average cost of BDT330.32 billion (USD 4.82 billion) per annum. Percapita expenditures are estimated to be BDT1,980.88 (USD 28.96) in 2009, increasing to BDT2,335.87 (USD 34.15) in 2015.
However as mentioned above, the majorcontribution for agriculture and rural developmentwould be borne by households, with governmentexpenditures mainly in subsidies, public investmentin road and other infrastructure, and safety netprogrammes. Considering only the governmentexpenditures, it is estimated that the costs for
interventions related to and rural development,development of road infrastructure, and promotionof decent employment are BDT 1587.18 billion(USD 23.20 billion) for the period 2009-2015 at anaverage cost of BDT 226.74 billion (USD 3.31billion) per annum.
2. MDG2 Achieve Universal PrimaryEducation
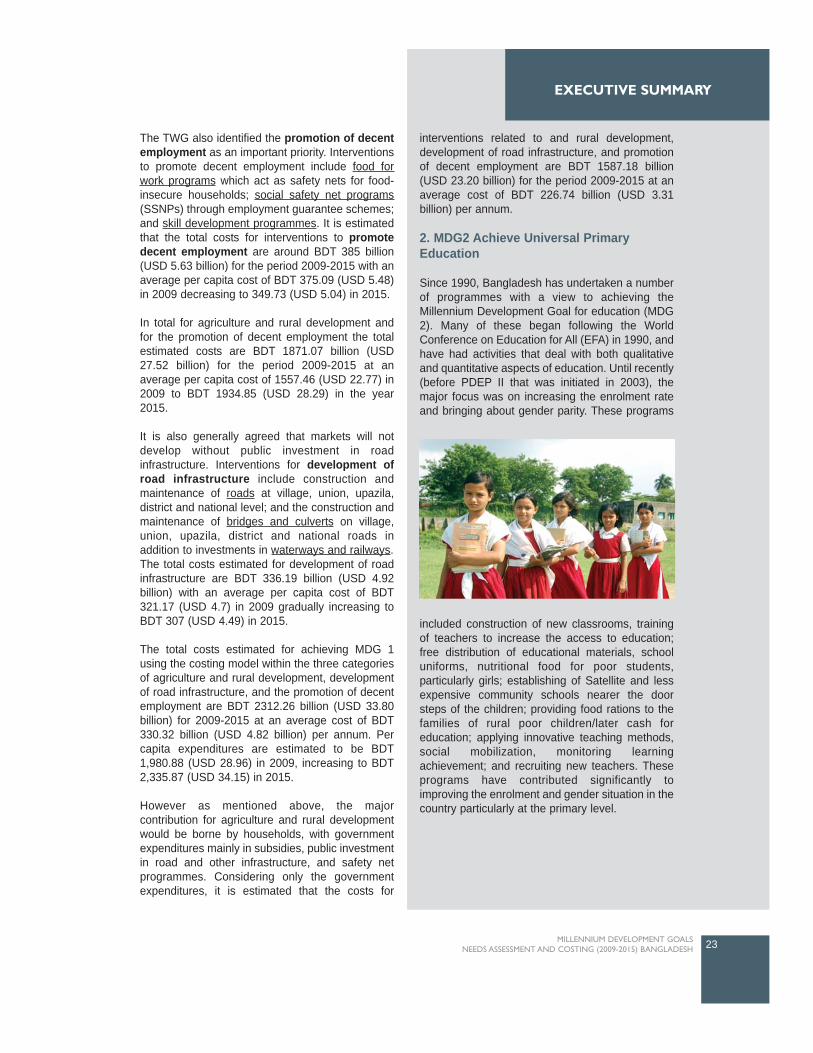
Since 1990, Bangladesh has undertaken a numberof programmes with a view to achieving theMillennium Development Goal for education (MDG2). Many of these began following the WorldConference on Education for All (EFA) in 1990, andhave had activities that deal with both qualitativeand quantitative aspects of education. Until recently(before PDEP II that was initiated in 2003), themajor focus was on increasing the enrolment rateand bringing about gender parity. These programs
included construction of new classrooms, trainingof teachers to increase the access to education;free distribution of educational materials, schooluniforms, nutritional food for poor students,particularly girls; establishing of Satellite and lessexpensive community schools nearer the doorsteps of the children; providing food rations to thefamilies of rural poor children/later cash foreducation; applying innovative teaching methods,social mobilization, monitoring learningachievement; and recruiting new teachers. Theseprograms have contributed significantly toimproving the enrolment and gender situation in thecountry particularly at the primary level.
23MILLENNIUM DEVELOPMENT GOALS NEEDS ASSESSMENT AND COSTING (2009-2015) BANGLADESH
EXECUTIVE SUMMARY
The Primary school Net Enrolment Rate (NER)recorded significant improvement from 60.48percent (1990) to 91.1 percent (2007). Aconsiderable proportion of this improvement maybe attributed to faster progress in girls' enrolment(50.76 percent in 1990 to 94.7 percent in 2007) asopposed to that for the boys' (69.43 percent in 1990to 87.8 percent in 2007). This gives a gender parityindex of 1.08 in 2007, which was 1.37 in 1990.Gross Enrolment Rate (GER) has also improvedsubstantially during the same period: 63.26 percentin 1990 to 98.8 percent in 2007 with significantcontribution from girls' participation (63.26 percentin 1990 to 104.6 percent in 2007). All theseachievements however helped keepingBangladesh well on track in meeting the firstindicator of MDG 2: a 100 percent Net EnrolmentRate and bringing about gender parity particularlyat the primary level.
The TWG on Education chaired by the Ministry ofPrimary and Mass Education identified majorchallenges in achieving MDG2 on Education.Analysis shows that, despite improvements in NERand GER, there is little room for complacency withregard to achieving MDG2 because of thedisappointing growth performance in the other twoindicators: primary cycle completion and adultliteracy rate.
The Primary cycle completion rate or survival rateto grade five has increased by a very low margin:from 40 percent in 1991 to 51.9 percent in 2007.Survival rate is higher for the girls (54.9 percent)than for the boys (48.9 percent). High drop out andrepetition rates in grade one through grade four arealso found in the 2007 primary school survey.These two rates are lower for the girls than for theboys. Progress in adult literacy situation is also notsatisfactory. In 2007 it was recorded at 53.5percent, with 58.7 percent for men and 48 percentfor women. In 1991 this was 35.3 percent, with 44.3and 25.8 percent respectively for males andfemales.
In view of the current situation it appears quitechallenging to attain 100 percent primary cyclecompletion rate and 100 percent adult literacy ratewithin the remaining seven years. The TWG onEducation has however identified certain necessarymeasures, in addition to continuing the existingones, that aim to improve the present educationsituation and achieve the goals under MDG2.
Improving the quality of primary education, creatinga child friendly atmosphere at the primary schools,creating adequate physical infrastructureprovisions, reducing opportunity cost of schoolattendance, providing incentives for the key playersat both demand and supply levels, and buildingmass awareness are the key areas that needparticular attention for achieving the educationMDG targets. These interventions also complymore broadly with the National Plan of Actionprepared for the improvement of the primaryeducation sector, and the recently preparedPoverty Reduction Strategies "Moving Ahead" forBangladesh.
The interventions needed to address the time-bound MDGs targets can broadly be categorized assupply side and demand side interventions. Supplyside interventions deal with provisions forinfrastructure (classrooms, laboratories forsecondary schools, sanitation facilities, etc.),provisions for teaching/learning materials, andhuman resources needs (teachers, trainings,excellence allowance to teachers, etc.). Demandside interventions address the needs of the servicerecipients (i.e., the students enrolled in differenteducation/literacy programs) and include pro-poorsubsidies, school feeding programmes, andstipends.
The interventions considered under MDG2 coverednot only Primary Education, but also three othersectors related to pre-Primary (EarlyChildhood/Pre-Primary Education), post-Primary(Secondary Education), and non-FormalEducation.
Using the costing model, total estimated costs for2009-2015 in Pre-Primary Education are BDT82.2 billion (USD 1.2 billion), at an average perpupil cost of BDT 1739.37 (USD 25.43) in 2009,rising to BDT 3052.8 (USD 44.6) in 2015. The percapita cost would vary from BDT 39.18 (USD 0.57)in 2009 to 123.5 (USD 1.8) in 2015 to achieve theinterventions in Pre-Primary education.
Total estimated costs for 2009-2015 in PrimaryEducation are BDT 859.69 billion (USD 12.56billion), at an average per pupil cost from BDT4,940.68 (USD 72.23) in 2009 to BDT 9,712.8(USD 142) in 2015. The per capita cost would varyfrom BDT 531.84 (USD 7.78) in 2009, to BDT1,123.8 (USD 16.4) in 2015 to achieve theinterventions in Primary education.
24 MILLENNIUM DEVELOPMENT GOALS NEEDS ASSESSMENT AND COSTING (2009-2015) BANGLADESH
EXECUTIVE SUMMARY
Estimated costs for 2009-2015 in SecondaryEducation are BDT 60.44 billion (USD 8.83 billion),at an average per pupil cost from BDT 12,117.39(USD 177.15) in 2009 to BDT 20,143.7 (USD294.5) in 2015. The per capita cost would vary fromBDT 23.08 (USD 0.34) in 2009, to 99.7 (USD 1.4)in 2015 to achieve the interventions in Secondaryeducation.
Estimated costs for 2009-2015 in Non-FormalEducation are 85.68 billion BDT (USD 1.25 billion),at an average per pupil cost from BDT 1,985.6(USD 29.03) in 2009 to BDT 3,327.2 (USD 48.6) in2015. The per capita cost would vary from BDT7.04 (USD 0.1) in 2009, to 252.11 (USD 3.69) in2015 to achieve the interventions in non-formaleducation.
Estimated costs for 2009-2015 in achieving MDG2related interventions in education covering all foursectors (Pre-Primary, Primary, Secondary and Non-Formal Education) are BDT 1,087.97 billion (USD15.90 billion), at an average per pupil cost fromBDT 20,783 (USD 303.85) in 2009, to BDT 36,236(USD 529.78) in 2015. The per capita cost wouldvary from BDT 601.14 (USD 8.79) in 2009, to BDT1,599.31 (USD 23.39) in 2015 to achieve theinterventions in education (for all four sectorsabove). Thus the average cost needed to achieveMDG2 in education, including four sectorsmentioned above, is about BDT 155.42 billion (USD2.27 billion) per annum.
3. MDG3 Gender
Bangladesh has already achieved Gender parity inprimary education. This can largely be attributed tothe first Primary Education DevelopmentProgramme (PEDP I), implemented from 1990 andPEDP II (initiated in 2003). Further, women inBangladesh are becoming increasingly visible ineconomic spheres. Increasing women'sinvolvement in both agricultural work and in non -farm activities has provided them with increasedopportunities for wage work and certain economicindependence.
However, despite the large scale involvement ofwomen in economic activities, there remain manychallenges for gender parity in Bangladesh. Whilethe country remains broadly on track to ensuregender equity in basic education, there are somesignificant challenges that need to be addressed.
There also still exist regional variations, for instanceBarisal Division is yet to achieve gender parity inprimary enrollment. Furthermore, post-primaryeducation opportunities for girls also need to bestrengthened.
The TWG on Gender chaired by Ministry ofWomen and Children Affairs (MOWCA) discussedthe main challenges in achieving and sustaininggender parity. The main challenges identified by theTWG center on: gender parity in education inPrimary Education, in Secondary Education, forAdult Literacy; ending Violence Against Women;providing day-care facilities; increasing the numberand percentage of women in non-agricultural wageemployment and women in Parliament; and finallyon gender sensitizing all institutions involved inimplementing interventions to promote genderequality.
The main interventions identified by the TWGinclude a set of initiatives listed below: Awarenessprogrammes for sustaining gender based equalityin education through community based awarenessand school based awareness programmes; helpinggirls transition to work through vocational training,school to work programs, and income generatingtraining and credit service; encouraging politicalparticipation through training of women candidatesfor election and support to women electedrepresentatives; ending violence against womenthrough community-based awareness campaigns,building one-stop crisis centers, women supportcenters, and safe home and shelters; the provisionof day care facilities; and addressing systemicissues related to gender mainstreaming.
It is estimated that to achieve the goals underMDG3 on promoting gender equality andempowering women approximately BDT 280.90billion (USD 4.11 billion) would be needed from2009-15, at an average per capita cost of aboutBDT 188.81 (USD 2.76 in 2009) to BDT 416.04(USD 6.08) in 2015. Thus the total costs estimatedfor achieving interventions to promote genderequality and women empowerment in Bangladeshare approximately BDT 40.13 billion (USD 0.58billion) per annum, at an average per capita cost ofapproximately BDT 302.38 (USD 4.42) per annum.
25MILLENNIUM DEVELOPMENT GOALS NEEDS ASSESSMENT AND COSTING (2009-2015) BANGLADESH
EXECUTIVE SUMMARY
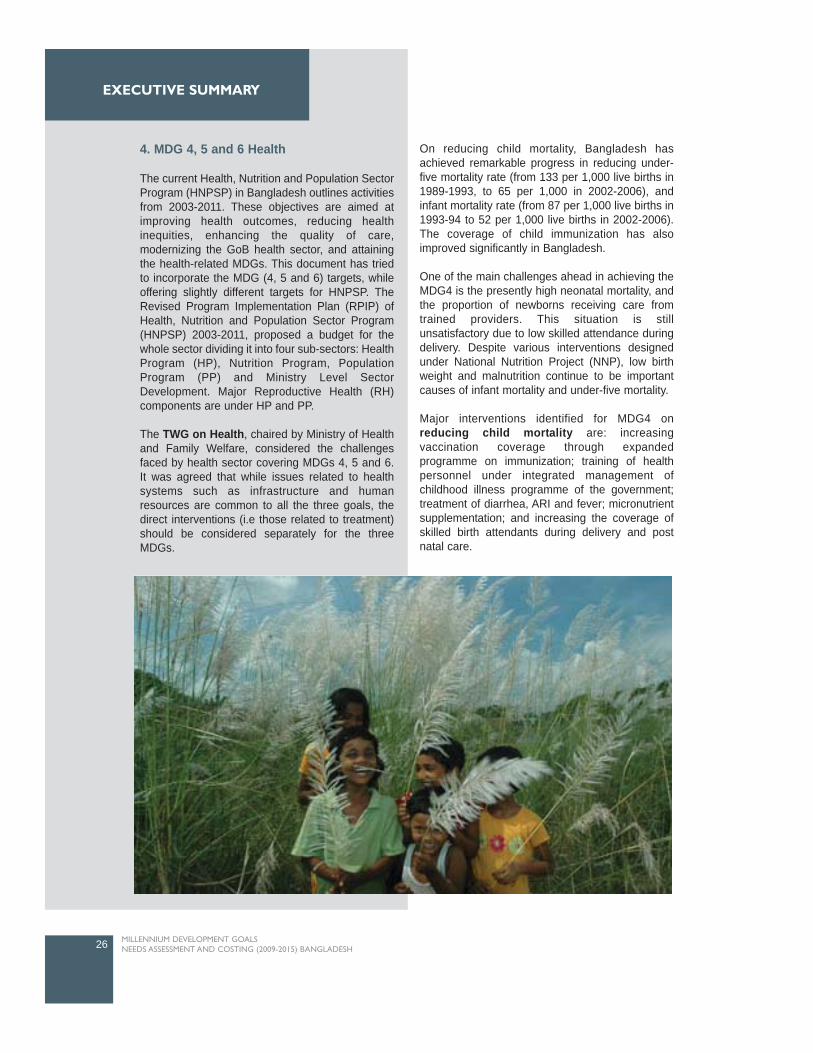
4. MDG 4, 5 and 6 Health
The current Health, Nutrition and Population SectorProgram (HNPSP) in Bangladesh outlines activitiesfrom 2003-2011. These objectives are aimed atimproving health outcomes, reducing healthinequities, enhancing the quality of care,modernizing the GoB health sector, and attainingthe health-related MDGs. This document has triedto incorporate the MDG (4, 5 and 6) targets, whileoffering slightly different targets for HNPSP. TheRevised Program Implementation Plan (RPIP) ofHealth, Nutrition and Population Sector Program(HNPSP) 2003-2011, proposed a budget for thewhole sector dividing it into four sub-sectors: HealthProgram (HP), Nutrition Program, PopulationProgram (PP) and Ministry Level SectorDevelopment. Major Reproductive Health (RH)components are under HP and PP.
The TWG on Health, chaired by Ministry of Healthand Family Welfare, considered the challengesfaced by health sector covering MDGs 4, 5 and 6.It was agreed that while issues related to healthsystems such as infrastructure and humanresources are common to all the three goals, thedirect interventions (i.e those related to treatment)should be considered separately for the threeMDGs.
On reducing child mortality, Bangladesh hasachieved remarkable progress in reducing under-five mortality rate (from 133 per 1,000 live births in1989-1993, to 65 per 1,000 in 2002-2006), andinfant mortality rate (from 87 per 1,000 live births in1993-94 to 52 per 1,000 live births in 2002-2006).The coverage of child immunization has alsoimproved significantly in Bangladesh.
One of the main challenges ahead in achieving theMDG4 is the presently high neonatal mortality, andthe proportion of newborns receiving care fromtrained providers. This situation is stillunsatisfactory due to low skilled attendance duringdelivery. Despite various interventions designedunder National Nutrition Project (NNP), low birthweight and malnutrition continue to be importantcauses of infant mortality and under-five mortality.
Major interventions identified for MDG4 onreducing child mortality are: increasingvaccination coverage through expandedprogramme on immunization; training of healthpersonnel under integrated management ofchildhood illness programme of the government;treatment of diarrhea, ARI and fever; micronutrientsupplementation; and increasing the coverage ofskilled birth attendants during delivery and postnatal care.
26 MILLENNIUM DEVELOPMENT GOALS NEEDS ASSESSMENT AND COSTING (2009-2015) BANGLADESH
EXECUTIVE SUMMARY
It is estimated that around BDT 322.64 billion (USD4.71 billion) would be needed under MDG4 onreducing child mortality between 2009-15, at anaverage per capita cost of about BDT 186.8 (USD2.73) in 2009 rising to BDT 365.3 (USD 5.34) in2015.
It is evident that some of the interventions to reducechild mortality will also impact on the improvementof maternal health (MDG5). The Government ofBangladesh has attached utmost emphasis onrapidly improving maternal health by way ofdrastically increasing the use of modern health careamongst all segments on population. While it hasachieved some progress in reducing maternalmortality from 574 per 100,000 live births in 1991 to320 per 100,000 live births in 2001, challengesremain. Estimates show that around 85 percent ofchildbirth takes place at home in Bangladesh, andthus the need for births attended by trained andqualified skilled health personnel is important.Special attention is needed to improve theseindicators to achieve the MDG target by 2015.
The TWG identified a set of interventions based onthe analysis related to MDG indicators underMDG5. These interventions include: Antenatalcare, skilled birth attendance during delivery, basicand comprehensive emergency obstetric care(EmOC), treatment of other maternalcomplications, family planning, and demand-sidefinancing to increase access to heath care by thepoor population.
It is estimated that around BDT 126.45 billion (USD1.85 billion) would be needed under MDG 5 onimproving maternal health between 2009-15, atan average per capita cost of about BDT 76.3 (USD1.1) in 2009 rising to BDT 154.22 (USD 2.2) in2015.
On combating HIV/AIDS, Malaria and otherdiseases (MDG 6), the limitation of data onHIV/AIDS prevalence is a major obstacle in trackingthese MDG targets under MDG6. Further, the socialstigma and other cultural barriers contribute to lowlevels of participation among the general populationin HIV/AIDS prevention programs in Bangladesh.The National AIDS committee in Bangladesh wasformed in 1985 and the National Policy onHIV/AIDS and STD related issues was adopted in1996, concentrating mainly on surveillance, testingpolicy, management and counseling of patients andsafe blood. Since the year 2000, there have been
a variety of approaches aimed at raising awarenessof HIV/AIDS under a new program. However,gender and regional disparities in awareness andknowledge about prevention of HIV/AIDS amongcitizens still need to be reduced.
While Bangladesh has made good progress inhalting the prevalence, and increasing theprevention of Malaria and Tuberculosis, butchallenges remain, as malaria prevalence althoughdecreased significantly during 2006, increasedagain in 2007.
The TWG with the help of the costing model,estimated that around BDT 231.50 billion (USD3.38 billion) would be needed under MDG6 oncombating HIV/AIDS, Malaria and otherdiseases between 2009-15, at an average percapita cost of about BDT 126.37 (USD 1.85) in2009, and about BDT 327.26 (USD 4.78) in 2015.
The analysis shows that improvement of healthsystems for attaining MDGs 4, 5 and 6 inBangladesh (including infrastructure and humanresources) need urgent attention. Scarcity of skilledhealth personnel is one of the main challenges. Thedensity of qualified providers including doctors,nurses and dentists in the country is around 7.7 per10,000 population, while according to WHO, thethreshold density of doctors, nurses and mid wivesis 22.8 per 10,000 population, below which,coverage of essential interventions to attain theMDGs is not possible (BHW 2007). Further, fromthe total 13,500 community clinics supposed to beconstructed under HPSP, only 11,883 have thus farbeen constructed. As also recommended by theTask Force report on Health (Millennium TaskForce), the highest priority should be given tostrengthening the primary healthcare system, fromcommunity-based interventions, to first referral-level facilities at which emergency obstetric care(EmOC) is available. This implies a focus on thedistrict level interventions. However, the availabilityof comprehensive EmOC services in publicfacilities, especially at district level and below inBangladesh is not yet up to the target level.
The TWG carried out an assessment of theavailability of existing levels of health facilities atthree levels: Primary healthcare (Upazila Healthcomplex, Upazila Health and Family WelfareCenter, USC and Community Clinics), Secondaryhealth care (District Hospitals) and tertiary healthcare (medical college hospitals and super
27MILLENNIUM DEVELOPMENT GOALS NEEDS ASSESSMENT AND COSTING (2009-2015) BANGLADESH
EXECUTIVE SUMMARY
specialized care institutions). Interventionsidentified for these health systems in Bangladeshinvolve scaling up of existing facilities in form of up-gradation, the provision of new equipments, newfacility construction, and pre-service and in-servicetraining for human resources.
It is estimated that BDT 778.57 billion (USD 11.38billion) is needed for health systems from 2009-2015, at an average per capita cost ofapproximately BDT 465.12 (USD 6.8) in 2009, toabout BDT 902.88 (USD 13.2) in 2015.
The Total Estimated costs for interventions inhealth covering three MDG goals - MDG4 onreducing child mortality, MDG5 on improvingmaternal health and MDG6 on combatingHIV/AIDS, malaria and other diseases including thehealth systems during the period 2009-2015 areBDT 1,459.15 billion (USD 21.33 billion), at anaverage per capita costs of about BDT 865.7 (USD12.6) in 2009, and about BDT 1,774.3 (USD 26) in2015
The proportion of resources required for directinterventions to improve child health is 22.1percent, maternal health 8.6 percent, and to reduceburden of HIV/AIDS 12.6 percent, tuberculosis 2.3percent, and malaria one percent. About 37.6percent of the resources should be invested onsalaries, in-service and pre-service training ofhealth personnel, and 6.2 percent on infrastructure.
In Bangladesh, according to estimates, householdexpenditure on health is around 65 percent of thetotal expenditure. Accordingly, costs to be incurredby the government for the period 2009-2015 toachieve the targets under MDGs 4,5 and 6 onhealth would be much lower than the costspresented above.
5. MDG 7 EnvironmentIn Bangladesh at present, actual forest coverage is11.32 percent, which is much less than the targetset by the government. Bangladesh has less than0.02 hectares of forest land per person, one of thelowest forest-man ratios in the world. There are 19Protected Areas in Bangladesh covering an area of2441.75 sq. km which is 12.7 percent of the totalforests areas of the country and about two percentof the country. Government of Bangladesh hasrecently declared eight areas as EcologicallyCritical Area (ECA) under EnvironmentalConservation Act, 1995.
As a least developing country (LDC) Bangladeshdoes not have any commitment to green house gas(GHG or CO2 emissions) reduction.Notwithstanding its favorable position, sustainedefforts are still being made to actively control majorsources of CO2 emissions in order to mitigate thecountry's impact on global climate.
Output of major Ozone Depleting Substancesdropped from 280.68 metric tons in 1995, to 155.14metric tons in 2007. In 2005, the countryprogramme was updated with financial support ofmultilateral fund (MLF), under the MontrealProtocol. A national ODS phase-out plan wasfinalized in 2004 to reduce 85 percent of ODS useby the end of 2007, with the goal of 100 percentreduction by 2010. The National ODS Phase-outPlan is now being implemented by the DOE.
Poor families in urban towns live in slums andsquatters' settlements in un-hygienic andunsustainable environments. Basic services likepure drinking water, sanitation, footpaths, drainageare totally absent in these areas. The populationdensity in the slums is 200 times greater than theusual density of Bangladesh. Despite theseproblems, migrants from rural areas continue tomigrate to the cities. There is currently no land titlefor slum dwellers.
The per capita annual fuel consumption inBangladesh is only 56 litres of oil, one of the lowestin the world. With a predominantly agro-basedpopulation, bio-fuel is the main cooking fuel in therural sector. Rural Bangladesh is characterised byminimal energy supply, and the country as a wholehas the lowest usage of electricity in the world (only95.85 kilowatt hours (kWh) per capita). Biomass(fuel wood, tree leaves, crop residues and animalresidues, mainly in the form of dried cow dungcakes or sticks) is the principal form of energy usedby the people, particularly in rural areas.
The introduction of safe drinking water throughtube-wells, higher sanitation coverage andimproved primary health care has contributed to asignificant drop in mortality rate from diarrhoealdiseases. Water-related diseases however,continue to account for the majority of deaths.Arsenic contamination and bacterial contaminationalso remain a problem in Bangladesh.
28 MILLENNIUM DEVELOPMENT GOALS NEEDS ASSESSMENT AND COSTING (2009-2015) BANGLADESH
EXECUTIVE SUMMARY
Sanitation programmes have also beenimplemented since 1970s, but success in improvingsanitation coverage has been far less compared toother development sectors, primarily due to a lackof awareness among people of the benefits ofimproved sanitation. The sanitary condition ofurban slums is deplorable. Most slum dwellershave literally no latrines, and only a few have pit orsurface latrines. They often defecate on the drains,in open fields, near the roads, or on the riverbanks.The problem is acute for female residents whohave to wait till sunset for defecation or use aneighbor's latrine, where available. Unhygienichanging latrines are still prevalent in urban slums.
The government has targets of safe drinking waterand sanitation for all by 2011 and 2010 respectively.The Ministry of Local Government, Ruraldevelopment and Cooperatives, through the LocalGovernment Division (LGD), and in the associationwith its NGOs and development partners, havetaken the lead to achieve the national sanitationgoal.
Based on the above challenges, the TWG onEnvironment chaired by the Ministry ofEnvironment decided on the interventions in threemajor sub-categories for MDG7: on Environment,on Energy and on Water-supply and sanitation.
The interventions on Environment focused onreducing exposure to environmental healthimpacts; improving Livelihoods (includingecosystem services); reducing vulnerability throughimproved capacity and investments for disastermanagement and climate adaptation; andgovernance, institutional, capacity and systemicissues. To achieve the Environment related goalsunder MDG7, it is estimated that BDT 122.23 billion(USD 1.77 billion) would be required between2009-2015, with a per capita cost of BDT 99.72(USD 1.46) in 2009, rising to BDT 122.96 (USD1.80) in 2015. The average annual costs are BDT17.46 billion (USD 0.26 billion) per annum forinterventions related to environment.
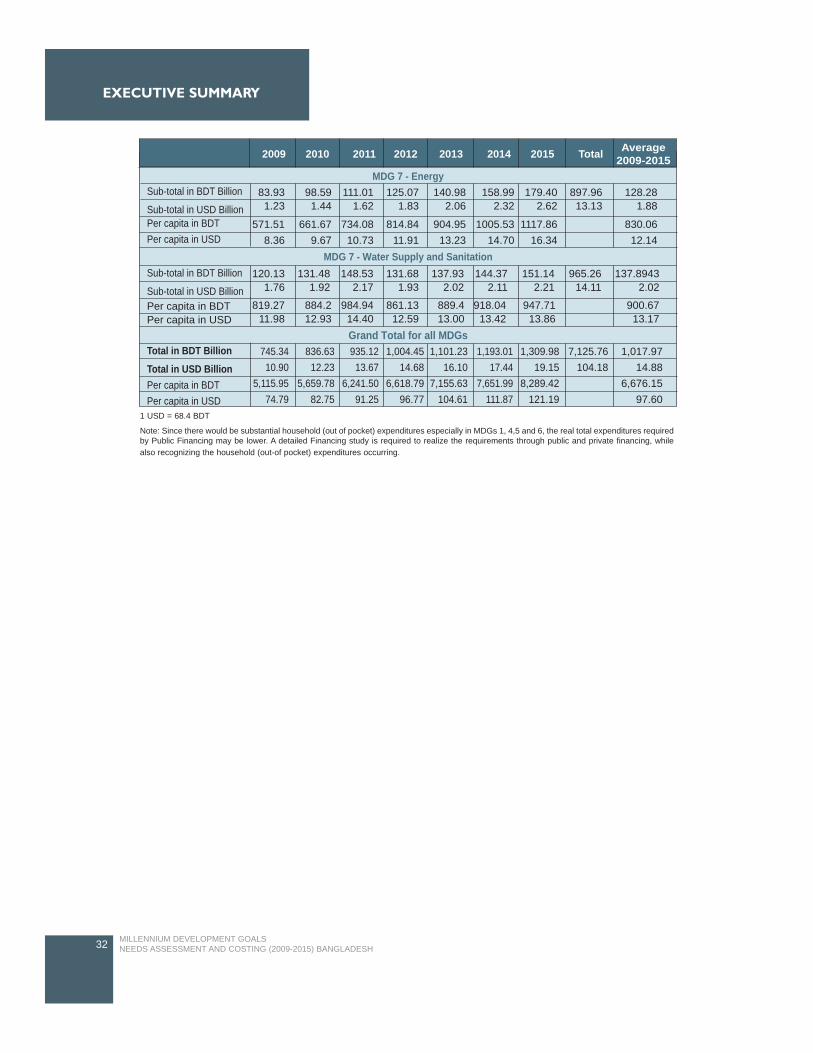
The interventions on Energy under MDG7 focusedon energy costs related to modern fuels forcooking/heating, lighting at household level, and forother institutions including educational institutions,health centers/hospitals, markets, governmentinstitutions, agricultural uses, etc. To achieve theEnergy related goals under MDG7, it is estimatedthat BDT 897.96 billion (USD 13.13 billion) would
be required between 2009-2015, with the per capitacosts of BDT 571.91 (USD 8.36) in 2009 to BDT1117.86 (USD 16.34) in 2015. The annual costs forinterventions related to Energy are about BDT128.28 billion (USD 1.88 billion) per annum.
The interventions under water supply andsanitation were divided into urban and rural areasand costs were thus derived. It is estimated that atotal of BDT 965.26 billion (USD 14.11 billion) willbe required to undertake the interventions on watersupply and sanitation for the period 2009-2015, at aper capita cost of around BDT 819.27 (USD 11.98)in 2009 and BDT 947.71 (USD13.86) in 2015. Theaverage annual estimated costs are BDT 137.89billion (USD 2.01 billion) for water supply andsanitation to meet interventions related to meetingMDG targets.
6. The total costs
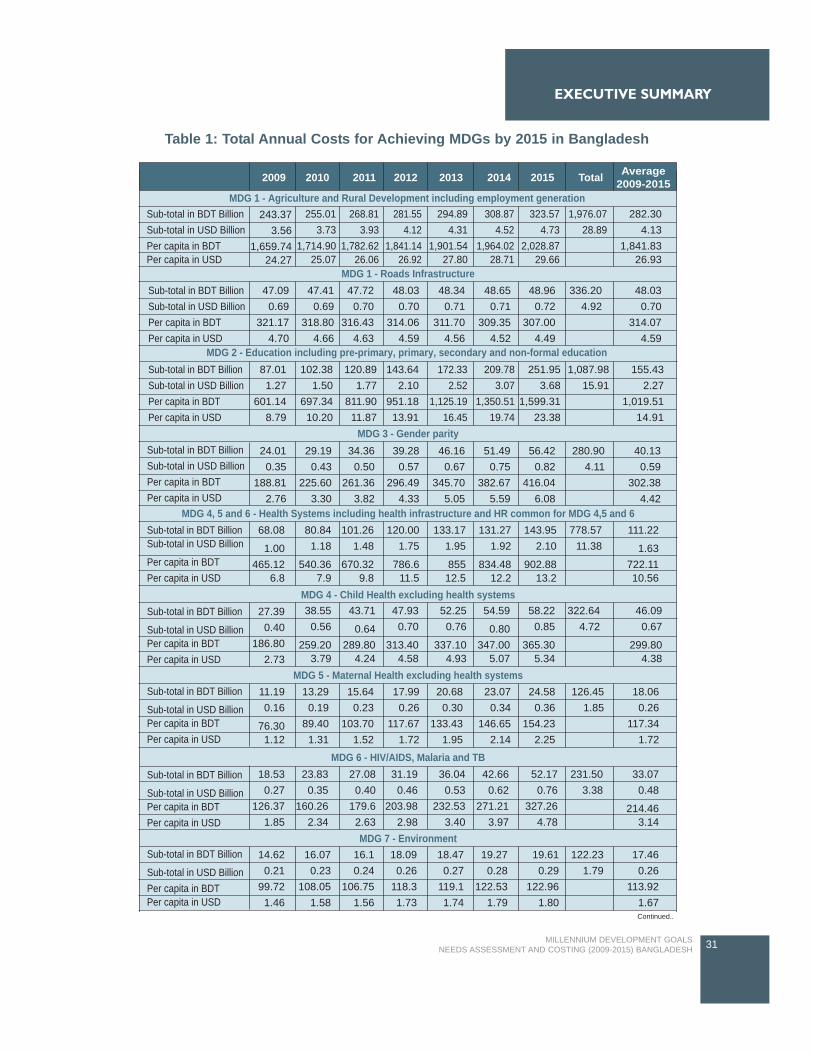
According to the above estimates, a total ofapproximately Total BDT 7,125.76 billion (USD104.18 billion) is needed to be spent to achieve allMDGs in Bangladesh from 2009-2015. Thistranslates to a per capita cost of BDT 5,115.95(USD 74.79) in 2009, and BDT 8,289.48 (USD121.19) in 2015. Annually approximately BDT1,017.97 billion (USD 14.88 billion) will be neededto achieve MDGs in Bangladesh, at an annual percapita costs of about BDT 6,676.15 (USD 97.60)(Refer Table 1).
In 2004, the Millennium Project conducted an MDGNeeds Assessments for Country Case Studies of:Bangladesh, Cambodia, Ghana, Tanzania andUganda (lead by Jeffery Sachs). According to thestudy, in order to meet the MDGs, Bangladeshwould need to spend a total of USD 66 per capita in2005, increasing to USD 102 per capita by 2015.This translated into a total investment need of USD155 billion between 2005 and 2015, equivalent toan average annual per capita need of USD 84.
However the study also notes certain importantobservations that will have impact on the totalcosts. The study notes "When interpreting theseresults, it is important to note the gaps in the currentanalysis……we have so far not been able toinclude a number of interventions for each sector orarea. In the case of Bangladesh, the missinginterventions, which might have the strongestimpact on the overall results, are summarizedbelow."
29MILLENNIUM DEVELOPMENT GOALS NEEDS ASSESSMENT AND COSTING (2009-2015) BANGLADESH
EXECUTIVE SUMMARY
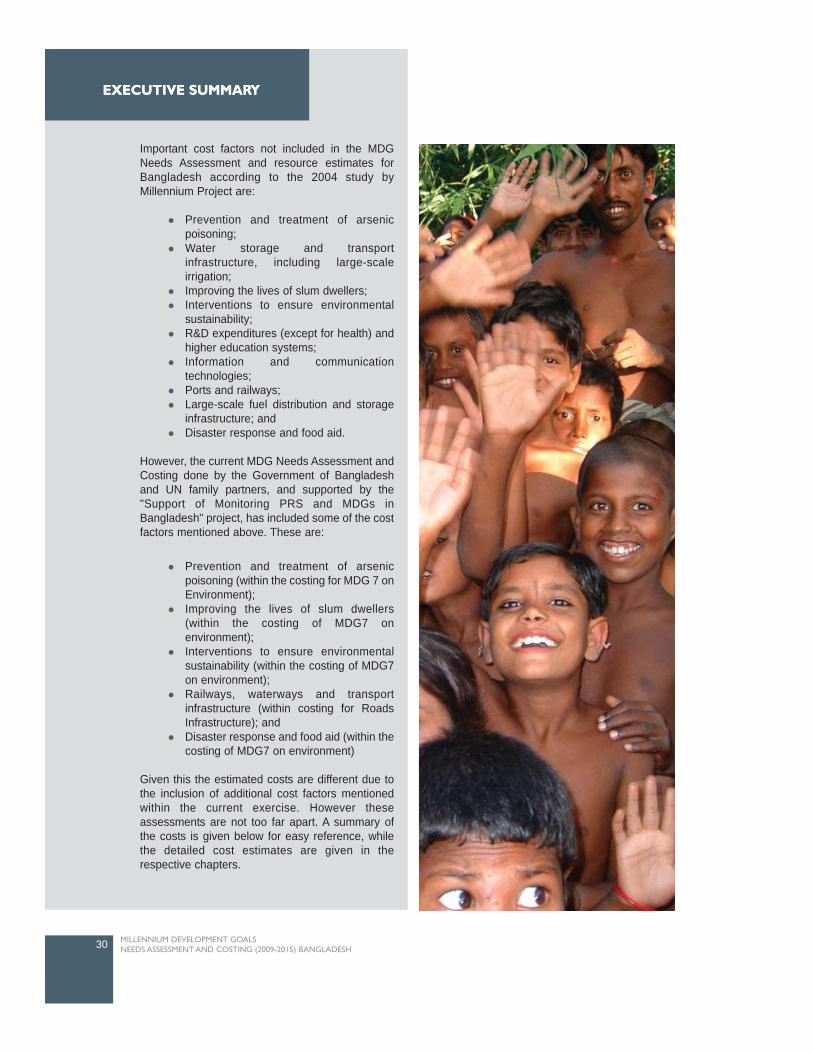
Important cost factors not included in the MDGNeeds Assessment and resource estimates forBangladesh according to the 2004 study byMillennium Project are:
Prevention and treatment of arsenicpoisoning;Water storage and transportinfrastructure, including large-scaleirrigation;Improving the lives of slum dwellers;Interventions to ensure environmentalsustainability;R&D expenditures (except for health) andhigher education systems;Information and communicationtechnologies;Ports and railways;Large-scale fuel distribution and storageinfrastructure; andDisaster response and food aid.
However, the current MDG Needs Assessment andCosting done by the Government of Bangladeshand UN family partners, and supported by the"Support of Monitoring PRS and MDGs inBangladesh" project, has included some of the costfactors mentioned above. These are:
Prevention and treatment of arsenicpoisoning (within the costing for MDG 7 onEnvironment);Improving the lives of slum dwellers(within the costing of MDG7 onenvironment);Interventions to ensure environmentalsustainability (within the costing of MDG7on environment);Railways, waterways and transportinfrastructure (within costing for RoadsInfrastructure); andDisaster response and food aid (within thecosting of MDG7 on environment)
Given this the estimated costs are different due tothe inclusion of additional cost factors mentionedwithin the current exercise. However theseassessments are not too far apart. A summary ofthe costs is given below for easy reference, whilethe detailed cost estimates are given in therespective chapters.
30
EXECUTIVE SUMMARYEXECUTIVE SUMMARY
MILLENNIUM DEVELOPMENT GOALS NEEDS ASSESSMENT AND COSTING (2009-2015) BANGLADESH
31MILLENNIUM DEVELOPMENT GOALS NEEDS ASSESSMENT AND COSTING (2009-2015) BANGLADESH
EXECUTIVE SUMMARY
MDG 1 - Agriculture and Rural Development including employment generation
MDG 1 - Roads Infrastructure
MDG 2 - Education including pre-primary, primary, secondary and non-formal education
MDG 3 - Gender parity
MDG 4, 5 and 6 - Health Systems including health infrastructure and HR common for MDG 4,5 and 6
MDG 4 - Child Health excluding health systems
MDG 5 - Maternal Health excluding health systems
MDG 6 - HIV/AIDS, Malaria and TB
MDG 7 - Environment
2009 2010 2011 2012 2013 2014 2015 Total Average2009-2015
Sub-total in BDT BillionSub-total in USD BillionPer capita in BDTPer capita in USD
Sub-total in BDT BillionSub-total in USD BillionPer capita in BDTPer capita in USD
Sub-total in BDT BillionSub-total in USD BillionPer capita in BDTPer capita in USD
Sub-total in BDT BillionSub-total in USD BillionPer capita in BDTPer capita in USD
Sub-total in BDT BillionSub-total in USD Billion
Per capita in BDTPer capita in USD
Sub-total in BDT Billion
Sub-total in USD BillionPer capita in BDTPer capita in USD
Sub-total in BDT Billion
Sub-total in USD BillionPer capita in BDTPer capita in USD
Sub-total in BDT Billion
Sub-total in USD BillionPer capita in BDTPer capita in USD
Sub-total in BDT Billion
Sub-total in USD BillionPer capita in BDTPer capita in USD
87.011.27
601.148.79
24.010.35
188.812.76
68.08
1.00465.12
6.8
27.390.40
186.802.73
11.190.16
76.301.12
18.530.27
126.371.85
14.620.21
99.721.46
16.070.23
108.051.58
16.10.24
106.751.56
18.090.26
118.31.73
18.470.27
119.11.74
19.270.28
122.531.79
19.610.29
122.961.80
122.231.79
17.460.26
113.921.67
23.830.35
160.262.34
27.080.40
179.62.63
31.190.46
203.982.98
36.040.53
232.533.40
42.660.62
271.213.97
52.170.76
327.264.78
231.503.38
33.070.48
214.463.14
13.290.19
89.401.31
15.640.23
103.701.52
17.990.26
117.671.72
20.680.30
133.431.95
23.070.34
146.652.14
24.580.36
154.232.25
126.451.85
18.060.26
117.341.72
80.841.18
540.367.9
38.550.56
259.203.79
43.71
0.64289.80
4.24
47.930.70
313.404.58
52.250.76
337.104.93
54.59
0.80347.00
5.07
58.220.85
365.305.34
322.644.72
46.090.67
299.804.38
101.261.48
670.329.8
120.001.75
786.611.5
133.171.95
85512.5
131.271.92
834.4812.2
143.952.10
902.8813.2
778.5711.38
111.22
1.63722.1110.56
29.190.43
225.603.30
34.360.50
261.363.82
39.280.57
296.494.33
46.160.67
345.705.05
51.490.75
382.675.59
56.420.82
416.046.08
280.904.11
40.130.59
302.384.42
102.381.50
697.3410.20
120.891.77
811.9011.87
143.642.10
951.1813.91
172.332.52
1,125.1916.45
209.783.07
1,350.5119.74
251.953.68
1,599.3123.38
1,087.9815.91
155.432.27
1,019.5114.91
243.373.56
1,659.7424.27
47.090.69
321.174.70
47.410.69
318.804.66
47.720.70
316.434.63
48.030.70
314.064.59
48.340.71
311.704.56
48.650.71
309.354.52
48.960.72
307.004.49
336.204.92
48.030.70
314.074.59
255.013.73
1,714.9025.07
268.813.93
1,782.6226.06
281.554.12
1,841.1426.92
294.894.31
1,901.5427.80
308.874.52
1,964.0228.71
323.574.73
2,028.8729.66
1,976.0728.89
282.304.13
1,841.8326.93
Table 1: Total Annual Costs for Achieving MDGs by 2015 in Bangladesh
Continued..
32 MILLENNIUM DEVELOPMENT GOALS NEEDS ASSESSMENT AND COSTING (2009-2015) BANGLADESH
Note: Since there would be substantial household (out of pocket) expenditures especially in MDGs 1, 4,5 and 6, the real total expenditures requiredby Public Financing may be lower. A detailed Financing study is required to realize the requirements through public and private financing, whilealso recognizing the household (out-of pocket) expenditures occurring.
1 USD = 68.4 BDT
MDG 7 - Energy
MDG 7 - Water Supply and Sanitation
Grand Total for all MDGs
2009 2010 2011 2012 2013 2014 2015 Total Average2009-2015
Sub-total in BDT Billion
Sub-total in USD BillionPer capita in BDTPer capita in USD
Sub-total in BDT Billion
Sub-total in USD BillionPer capita in BDTPer capita in USD
Total in BDT BillionTotal in USD BillionPer capita in BDTPer capita in USD
83.931.23
571.518.36
120.131.76
819.2711.98
745.3410.90
5,115.9574.79
836.6312.23
5,659.7882.75
935.1213.67
6,241.5091.25
1,004.4514.68
6,618.7996.77
1,101.2316.10
7,155.63104.61
1,193.0117.44
7,651.99111.87
1,309.9819.15
8,289.42121.19
7,125.76104.18
1,017.9714.88
6,676.1597.60
884.212.93
984.9414.40
861.1312.59
889.413.00
918.0413.42
947.7113.86
900.6713.17
131.481.92
148.532.17
131.681.93
137.932.02
144.372.11
151.142.21
965.2614.11
137.89432.02
98.591.44
661.679.67
111.011.62
734.0810.73
125.071.83
814.8411.91
140.982.06
904.9513.23
158.992.32
1005.5314.70
179.402.62
1117.8616.34
897.9613.13
128.281.88
830.0612.14
EXECUTIVE SUMMARY

The Millennium Declaration (GA Resolution A/54/2000) adopted by all 191 member states of the UnitedNations commits them to put in place measures necessary to attain peace, security and development. Thedeclaration was further elaborated in the subsequent UN Secretary General's report entitled "A Road MapTowards the Implementation of the UN Millennium Declaration" (GA Resolution A/56/326). Arising out ofthese two declarations and on the basis of further consultations and agreement reached between the UN,OECD/DAC, World Bank and IMF, eight target-oriented Millennium Development Goals (MDGs) wereformulated as a set of quantifiable and time-bound goals for significantly improving human lives by 2015.This commitment by the international community to improve human lives was re-affirmed at the Conferenceon Financing for Development held in Monterrey, and World Summit on Sustainable Development held inJohannesburg in 2002.
While the Millennium Declaration calls on all development stakeholders to adopt a goal-oriented approachto policy, planning and implementation, it apportions differentiated responsibility to the various parties. It isexpected that developing countries will be committed to the practice of good governance and sound use ofresources for human development, while developed countries will increase their financial assistance todeveloping countries up to at least the 0.7 percent of GNI mark. Developed countries are also expected tosupport a development-friendly international economic system with specific commitments to promote fairtrade, reduce the debt burden and promote technology transfer to developing countries.
As the international community's negotiated set of quantifiable and time-bound targets for reducing poverty,the MDGs offer a unique framework to guide development planning, resource allocation, and higherresource mobilization in low income developing countries like Bangladesh. They enable all actors in thedevelopment process to shift from asking "how well can Bangladesh do with respect to the MDGs with itsgiven constraints?" to asking: "in order to achieve the MDGs, what does Bangladesh need to do?"
This shift will enable Bangladesh to systematically plan its national strategies around the MDGs, especiallythose targets that are lagging behind. In order to do so, however, the first step is to conduct a detailed MDGneeds assessment and costing that attempts to answer the question of what Bangladesh needs in order toachieve the MDGs, in terms of human resources, infrastructure and financial resources?
The MDG goals are being effectively integrated into the national development planning process. Bangladeshmade noteworthy progress in poverty reduction and the attainment of "Millennium Development Goals"during the 1990-2000 period in spite of pitfalls such as instability, inefficiency, leakage, mis-targeting and theerosion of regulatory standards. The observed rate of actual progress achieved by Bangladesh during 1990-2000 is consistent with, or even higher than, the pace of annual progress required for achieving the MDGsby 2015 (set against the benchmark of 1990). A review of the progress at the aggregate level suggests thatthe country is "on track" in relation to a number of targets such as reduction of infant mortality and childmortality, expansion of primary and secondary education, reduction in many aspects of gender disparity,eradication of hunger (proxies by the prevalence of child malnutrition), and environmental sustainability(proxies by expansion of tree cover).
1.1 Macroeconomic Environment for Pro-poor Economic Growth in Bangladesh
According to the second PRSP 2009-11, 'Moving Ahead', a stable macroeconomic environmentcharacterized by increasing growth rate, a comfortable budget and external sector balance and lowemployment rate was maintained in 2006-07. In 2007-08 domestic and international shocks disturbed thisstability, and the economy experienced lower growth and a higher inflation rate.
The economy has improved its growth performance since 2000-01 from 5.27 percent to 6.21 percent in2007-08, peaking in 2005-06 at 6.63 percent. Revenue reforms lead to increased revenue/GDP ratio from9.6 in 2000-01 to 11.2 in 2007-08. However due to an increase in expenditure on SSNPs in 2007-08 tomitigate the impact of Sidr and cushion the poor from increases in price of food grains, the Expenditure/GDP
35MILLENNIUM DEVELOPMENT GOALS NEEDS ASSESSMENT AND COSTING (2009-2015) BANGLADESH
CHAPTER 1INTRODUCTION
ratio peaked at 17.3 percent, and remained close to 15 percent during the period 2003-04 to 2004-05. Therate of inflation rose from 1.94 percent in 2000-01 to 9.94 percent in 2007-08. The second PRSP identifiessustaining revenue growth and raising investment to GDP ratio as key challenges. A rising inflation rate alsothreatens to put back the past gains in poverty reduction. Maintaining export growth also remains achallenge. Furthermore, providing productive employment to the growing labour force, especially among thepoor, remains a challenge.
For accelerating growth for poverty reduction, the second PRSP (2009-11) mentions several approachesincluding promoting growth in the agriculture sector; supporting industry and services focusing on pro-poorsegments/sectors; promotion of rural towns; channeling and increasing the share of government expenditureon social and infrastructural sectors; and direct poverty reducing projects/programmes.
The second PRSP, 'Moving Ahead', as with the first PRSP, 'National Strategy for Accelerated PovertyReduction", maintains pro-poor economic growth as the focus. The impacts of implementation will berelevant for the achievement of MDGs.
As a link to the PRSP, the current joint effort of the Government and the UN family through this report MDGNeeds Assessment and Costing in Bangladesh, will assess the status and trend in progress ofachievement of MDGs through MDG1 to MDG7: the challenges ahead, the major interventions and targetsfor MDGs and finally the resource needs estimates. To assess the costs/resource needs, costing modelswere used covering nine investment clusters. A detailed methodology of the process is explained in the nextchapter. Given below is introduction to the thematic areas covered during the MDG Needs Assessment andCosting exercise.
1.2 Poverty and Hunger
Incidence of income poverty decreased from 59 percent in 1991 to 49.8 percent in 2000, giving an annualrate of decline of 1.5 percent, which is however lower than the required rate of two percent per annum. Agrowth of per capita real income of four to five percent per annum is required to achieve the income povertytarget. An overall real income growth rate of six to seven percent per annum on a sustained basis, along witha population growth of around 1.5 percent is needed to attain the target per capita income growth and hencereduction in income poverty.
Projections based on past historical trends indicate that Bangladesh may be able to attain most of the MDGsat the aggregate level by 2015. Hence, pro-poor but adequate economic growth is needed to help reduceincome-poverty and raise Bangladesh's ability to spend on social needs. Furthermore, this would alsogenerate additional resources for social sector programmes. From this angle, the halving of income-povertywithin a reasonable time frame (perhaps by 2020, if not by 2015) appears to be one of the mainpreconditions for achieving many social goals.
The MDG Mid-Term Progress Report (2007) mentioned that Bangladesh either achieved some MDGs andsome were or on track to be achieved. It is found that MDG1 (halving the proportion of population below thenational poverty line, and minimum level of energy consumption) is on track to be achieved by 2015. Thishas been possible largely due to its steady economic growth of nearly five per cent annually on average inthe 1990s, and nearly six per cent annually on average in the new millennium. The higher growth will notnecessary ensure that the MDG targets are met.
However, the recent dramatic surge in food prices has plunged millions of poor people and many net foodimporting poor countries like Bangladesh into a food crisis (End Poverty, 2015). Consequently, it has alsoput at risk their chances of achieving the Millennium Development Goals by 2015. Whilst the focus has beenon the impact on the MDG1 of reducing poverty and hunger, given the close inter-connectedness betweenall eight MDGs, the impact on these sections of the poor on health, education and livelihoods more broadly,cannot be underestimated.
36 MILLENNIUM DEVELOPMENT GOALS NEEDS ASSESSMENT AND COSTING (2009-2015) BANGLADESH
CHAPTER 1
To improve road infrastructure, PRSP-II consulted on the present coverage and targets with RHD, railwayand water transport, LGED etc, and here both the PRSP-II targets and after 2011 have been considered,calculated on the basis of the rates made by PRSP-II. The Government operates a large number of socialsafety net programmes which generate income and employment, help human resource development, createinfrastructure and directly reduce poverty of the beneficiaries, and these targets were considered forestimation of required resource needs.
1.3 Education
Getting access to basic education is a fundamental human right of every citizen of a country. Thisfundamental right has been denied to a large section of the population living below the poverty line in manydeveloping countries of the world including Bangladesh. Acute poverty in their families may be singled outas the major cause behind such a situation. Recognizing the critical importance of transforming them intoeffective human resources and thereby making them worthy citizens, the Millennium Summit that held inDakar in 2000 declared 'achieving universal primary education' as one of its major agendas. As set out inthe Millennium Declaration this goal, known as MDG2, has the goal of providing access to primary educationto all by the year 2015. Bangladesh, as a signatory to the Dakar declaration, expressed a strong commitmenttowards achieving the goal of universal primary education which has sustainable positive implications forreduction in poverty by significantly large margin.
To fulfill the commitment to the international community, and also to meet the constitutional obligation ofensuring universal and free compulsory primary education to all children, Bangladesh has undertakenseveral initiatives for the development of primary education and achieving the time-bound MDG targets.Although government initiatives in the area of primary education began in 1981, through a couple ofUniversal Primary Education projects, more focused initiatives were made in the 1990s following the WorldConference on Education for All (WCEFA) that held in Jomtien, Thailand, in 1990. The present studyhowever focuses on the progress made since 1990 towards achieving MDG2 with regard to the set target'ensure that, by 2015, children everywhere, boys and girls alike, will be able to complete a full course ofprimary education'. Progress with regard to this MDG target and the future potential for achieving the 2015target has been assessed by analyzing the current status and the trend growth in each of three selectedindicators under this target for education namely: net enrolment ratio in primary education, primary schoolcompletion rate, and adult literacy rate.
1.4 Gender
In terms of MDG3 there are several areas where women are at a disadvantage and gender gaps are quietapparent. Therefore, while the country remains broadly on track to ensure gender equity in basic education,there are some significant challenges that need to be addressed. Bangladesh has enhanced the number oflaws at the national level to protect equality of rights and opportunities for men and women. The Constitutionof Bangladesh grants equal rights to women and men in all spheres of public life (Articles 27, 28(1) 28(2),28(3), 28(4), 29(1), 29(2) and 29(3), and has been supplemented by a number of Acts and Ordinances thatsafeguard women's equal rights such the Dowry Prohibition Act of 1980, the Child Marriage Restraint Act(amended in 1984) and the Family Court Ordinance of 1985. At the international level, Bangladesh hasratified the UN Convention on the Elimination of All Forms of Discrimination Against women (CEDAW)agreeing to the optional Protocol in 2000. However, reservations on articles two and 16 pertaining tomarriage, divorce and inheritance remain in force.
The Ministry of Women's and Children Affairs (MOWCA) established in 1978 has the mandate for protectingwomen's interest and further the rights of children and working in 64 districts of the country. At present itconsists of the Ministry itself and three implementing agencies: the Department of Women Affairs (DWA),Jatiya Mohila Sangstha (National Women's Council), and Shishu (Children's ) Academy. MOWCA ismandated to act as the central motivating agent on issues of women's equality and development and topromote a broader and more consistent response by all government agencies to the needs and priorities of
37MILLENNIUM DEVELOPMENT GOALS NEEDS ASSESSMENT AND COSTING (2009-2015) BANGLADESH
INTRODUCTION
women. WID (Women in Development) focal points have been established in various ministries. The NationalPolicy for the Advancement of Women was adopted in 1997 and amended (2004, 2008) and includescommitments to eliminate discrimination against women in all spheres. A National Action Plan (NAP) forimplementing the policy as well as meeting commitments under the Beijing Platform for Action (PFA) was approvedin 1998. Following the PFA, Gender Focal points were appointed in all central government ministries andcommittees as early as 1990. Bangladesh Poverty Reduction Strategy Paper (PRSP) finalized in October 2005and PRSP 2 in 2008 also provides comprehensive gender analysis with policy guidelines.
1.5 Health
The first Bangladesh PRSP 'National Strategy for Accelerated Poverty Reduction' (NSAPR 2005) considered inparticular the human dimensions of poverty (deprivation of health, education, nutrition, gender gaps), andcommitted the MoHFW to reach the poor and vulnerable, especially women and children. The second PRSP'Moving Ahead' (2008) identifies that Health, Nutrition and Population (HNP) are intimately related andcomplementary to other sectors of the economy.
The current Health, Nutrition and Population Sector Program (HNPSP) outlines activities from 2003-2010, withobjectives to improve health outcomes, reduce health inequities, enhance quality of care, modernize the GoBhealth sector, and attain the health related MDGs. This document has tried to incorporate the MDG (4, 5 and 6)targets, while offering slightly different targets for HNPSP. The Revised Program Implementation Plan (RPIP) ofHealth, Nutrition and Population Sector Program (HNPSP) 2003-2010, proposed budget for the whole sector bydividing it into four sub-sectors: Health Program (HP), Nutrition Program, Population Program (PP) and MinistryLevel Sector Development. Major Reproductive Health (RH) components are under HP and PP.
Although Bangladesh has made significant progress in some health outcomes such as reducing Infant MortalityRate and Maternal Mortality Rate, however challenges remain. The main challenges identified in the health sectorcenter on the fact that the nutritional status of children and women in Bangladesh is very poor, and require specialattention in order to improve the overall health status of the population. Despite various interventions designedunder National Nutrition Project (NNP) low birth weight and malnutrition continue to be important causes of infantand under-five mortality. A significant proportion of pregnant women are also iodine deficient and develop nightblindness during pregnancy.
In Bangladesh, the improvement in births attended by skilled health personnel is not satisfactory. Rapid training ofskilled health personnel, an increase in infrastructure, and cautious monitoring is needed if the country wants toreach the target by 2015.
The availability of comprehensive EmOC services in public facilities, especially at district level and below, are alsonot up to the target level. One important intervention of the Maternal Health Strategy 2001 was to train medicalofficers in obstetrics or anesthesia (one year diploma level or four months EmOC training), and placing them infunctional teams at District and Upazila facilities. So far 206 obstetricians and 118 anesthetists have been trained.Moreover, only 57 percent of obstetrics and 69 percent of the anesthesia are appointed in designated positionswith frequent failure to retain both the obstetric and the anesthesia to perform caesarian sections in a facility dueto variety of reasons (MTR 2008). The Government should take steps to overcome this problem with specialemphasis on reducing absenteeism in rural areas.
Limitation of available data on HIV/AIDS prevalence is also a major obstacle in tracking the MDG targets. Thegender and regional disparities in awareness and knowledge about prevention of HIV/AIDS among citizens shouldbe reduced.
38 MILLENNIUM DEVELOPMENT GOALS NEEDS ASSESSMENT AND COSTING (2009-2015) BANGLADESH
CHAPTER 1
1.6 Environment
Forestry is an important way to sequester carbon, ensure energy security by providing fuel wood; guaranteelivelihood security by employing people in forest plantations; generating income through harvesting and trade inforest products; and protecting soil from erosion and landslides, particularly in hilly areas. Actual forest coveragein Bangladesh is 11.32 percent much less than the target set by the government. Bangladesh has less than 0.02hectares of forest land per person, one of the lowest forest-man ratios in the world. Intensive afforestation andreforestation programme can improve the forest coverage for meeting MDGs target.
Water pollution is a major problem in most parts of Bangladesh. Surface water pollution affects the health of poorpeople. Waterborne diseases are the major cause suffering for the poor people living in rural and urban areas.Surface water scarcity in the dry period, water logging, groundwater pollution by arsenic, water resourcemanagement are also some key challenges.
Air pollution is more acute in urban areas than in rural areas. In urban areas, the main sources of air pollution areemission of harmful gases from vehicles, industrial sectors, construction, and the open dumping of garbage. Inrural areas, the main sources are brick kilns and wood and biomass consumption. Automobiles on the road areoften very old, overloaded and poorly maintained, and emit smoke far exceeding the prescribed limit. Industrialdevelopment is another major source of air pollution. Most industries in Bangladesh are situated in major urbanareas. The food industry emits the greatest amount of pollutants, followed by cement, pulp and paper industry andtextiles. Among the food industry, most of the pollutants come from sugar mills.
Rising use of pesticides has led to fears of adverse health consequences and of water contamination. A majorportion of the urban waste of Bangladesh is composed of organic materials, which produce methane (CH4) as theydecompose. The unit contribution of methane to global warming as well climate change is much higher than thatof carbon dioxide.
Soil salinity, land degradation, improper water resource management, river bank erosion, and vulnerability tonatural disasters threaten the lives of many people in Bangladesh. Polluted soil builds-up persistent toxiccompounds, chemicals, salts, radioactive materials, or disease causing agents in soils that have adverse effectson plant growth and animal health.
Expanded energy services are essential to meet the MDGs for reducing hunger and poverty, improving health careand educational opportunities, and addressing gender equity. In addition, energy is central to all aspects ofsustainable development, including access to water, agricultural and industrial productivity, health care,educational attainment, job creation and climate change impacts. Affordable, accessible and reliable energy supplyis critical for uplifting the poor, as well as for economic growth of a country.
Migration of people to urban cities from rural areas has become a common phenomenon in Bangladesh over thelast several decades. Poor families in urban towns live in slums, squatters' settlements in un-hygienic andunendurable environment. Basic services like pure drinking water, sanitation, footpaths, and drainage are totallyabsent in these areas. The population density in the slums is 200 times greater than the usual density ofBangladesh. Despite the problems, migrants from rural areas continue to migrate to the cities. There is currentlyno land title for slum dwellers.
39MILLENNIUM DEVELOPMENT GOALS NEEDS ASSESSMENT AND COSTING (2009-2015) BANGLADESH
INTRODUCTION
1.7 The MDG Needs Assessment and Costing for Bangladesh
Based on the discussion above it is imperative that a MDG Needs Assessment is done based on a situationanalysis of the national development record in achieving MDGs from 1990 to identify the trends and majorchallenges for achieving the targets by 2015. Finally, selecting major interventions to achieve the Targets, andCosting these interventions for each of the MDGs is a major activity of this report. This report will enableBangladesh to plan MDG-based national strategies and focus especially on those targets that are lagging behind,while sustaining the good achievement in those that are on-track or have been achieved. A detailed methodologyis discussed in Chapter 2.
40 MILLENNIUM DEVELOPMENT GOALS NEEDS ASSESSMENT AND COSTING (2009-2015) BANGLADESH
CHAPTER 1

2.1 The Process
The purpose of the MDG needs assessment and costing in Bangladesh is intended to identify interventionsand assess comprehensively the financial, human and institutional infrastructure resources needed for theattainment of the MDGs in the country. The specific objectives of the MDG Needs Assessment (NA) andCosting are to:
Take stock of the country's development record on each MDG from 1990 to present;Analyze the existing policy frameworks and strategies that contribute to the achievement of MDGs;Identify the major challenges for the government/s to meet the attaining MDGs;Identify a set of integrated interventions that will enable Bangladesh to meet the MDGs by 2015;Identify the necessary infrastructure, human, and financial resources required to support a scale-up of interventions through to 2015.
2.2 Formation and Training of MDG Thematic Working Groups (TWGs)
In order to undertake the Needs Assessment and Costing analysis, Five Thematic Working Group (TWGs)were set-up with participation from relevant sectoral ministries and UN agencies:
1. TWG1 on Poverty and Hunger covering MDG1 was lead by the General Economic Division (GED)under Planning Commission, Ministry of Planning, Government of Bangladesh.
2. TWG2 on Education covering MDG2 was lead by Ministry of Primary and Mass Education(MOPME)
3. TWG3 on Gender covering MDG3 was lead by Ministry of Women and Children Affairs (MOWCA)4. TWG4 on Health covering MDG4, 5 and 6 was lead by Ministry of Health and Family Welfare
(MoHFW)5. TWG5 on Environment covering MDG7 was lead by Ministry of Environment (MoE)
The Task Force works were supported by short-term national experts and by UNDP's MDG/PRS Project'snational and international representatives. The main activities of the TWGs and its members were toundertake the following functions:
reviewing of existing plans, programmes/ projects, data and setting the base line;developing a comprehensive list of interventions;specifying coverage target for each intervention (e.g. percent of population to be targeted by eachintervention);estimating unit costs and resource requirements for each intervention;refining targets, improving cost estimates, accounting for synergies and trade-offs, and addressingcross cutting issues;consulting different stake holders through the NA process;Preparing Thematic (sectoral) Task Force Reports;
Overall Responsibility
The GED of Planning Commission, the executing agency of UNDP MDGs project, undertook the overallresponsibility of liaison with other concerned ministries to form the TWGs. UNDP provided technical supportfor overall coordination and facilitation, including training for the MDG Needs Assessment and Costingexercise. For the composition of the MDG Needs Assessment TWGs (see Annexure).
In order to undertake the needs assessment and costing exercise the MDG Needs Assessment andCosting methodology adopted the UN Millennium Project interventions-based approach, of identifying a
43MILLENNIUM DEVELOPMENT GOALS NEEDS ASSESSMENT AND COSTING (2009-2015) BANGLADESH
CHAPTER 2METHODOLOGY
comprehensive range of relevant interventions (goods, services and infrastructure) that serve as thefundamental basis for estimating the resource needs for MDGs achievement. The Costing exercise wasundertaken with the help of nine costing tools/investment clusters for which training was provided by UNDPRegional Center in Colombo (UNDP RCC).
Training to the TWG Members on Costing Tools
The TWG members, including the NA Consultant, were provided with in-depth training on the methodologyof the NA and costing, developed by the UN Millennium Project and UN agencies in other countries in theregion. The estimations of resource requirement needs were done by using pre-developed spread sheet-based models to project the gradual scaling up of investments and resource requirements. The nine costingtools for the investment clusters that were used for the costing exercise are:
1. Agriculture and Rural Development2. Transport3. Education4. Gender5. Health6. HIV/AIDS7. Environment8. Energy9. Water supply and sanitation
Use of Costing Tools for Needs Estimates and Costing
Based on the situation analysis, the existing data for the base years was entered into the costing tools whilethe targets for interventions were discussed and decided with the TWG members. The Unit costs werederived from existing national planning documents, project budgets, national expenditure reviews and otherplanning documents. In cases where existing unit costs appeared uncharacteristically low (e.g. salaries forcivil servants), a more competitive and realistic figure was used. These costs were applied to the targets toget the total cost of the interventions, per annum. In cases where it was not possible to calculate theresources required for each individual intervention, more aggregate estimates from other studies (e.g PRSPand MTEF cost estimates were used). However, in view of data quality constraints, some unit costs arecrude estimates and will need to be readjusted over time to arrive at more realistic figures.
As such, the NA and costing, and supporting documents and worksheets will require constant updating andfine tuning. For each intervention specific targets were set after assessing the current coverage andprojecting future coverage. In terms of target setting, in keeping with the advice of the Millennium Project,the TWG have been quite ambitious in setting targets. This was then used as the basis for calculating theresources required to meet the MDG after a linear scaling up of interventions and investments over the yearsfrom the baseline year of 2006 up to 2015. As advocated in the Millennium Project approach, costing hereinclude both recurrent and capital expenditures. This is particularly pertinent to Bangladesh, whereextremely high levels of capital investments have invariably high associated recurrent expenditure costs, thatrise exponentially and absorb a large part of future development budgets.
2.3 Estimating the Trend Growth Rates
Growth rate is estimated by a liner equation, r = (P1-P0)/P0 x t, where, P0 is initial value, P1 is final value, t isthe duration (year). For projecting the time-path of the different MD outcomes to 2015, linear and sometimeslogarithmic equations are followed. Missing data are estimated by regression equation based on availabledata collected from different sources. Target values of some indicators are not set and in that case newtarget is set based on projection value from the regression equation.
44 MILLENNIUM DEVELOPMENT GOALS NEEDS ASSESSMENT AND COSTING (2009-2015) BANGLADESH
CHAPTER 2
2.4 Data Sources
Poverty and Hunger
This costing report is based on national documents and surveyed data. Data was collected from severalvisits and reports of the Government of Bangladesh. These include the Yearbook of Statistics, HouseholdIncome and Expenditure Surveys (HIES), Labour Force Survey, Child Nutrition Survey (CNS) conducted bythe Statistical Yearbook of Bangladesh, Bangladesh Bureau of Statistics, Multiple Indicator Cluster Survey(MICS) survey conducted by UNICEF and BBS. Research reports from different research organizations suchas BARI, BRRI, BLRI, BFRI and BAU were also used. The policy documents such as PRSP-I, IPRSP anddraft PRSP-II, different reports published from GED, Planning Commission have been consulted.
Education
The analysis in the current study has been done based on secondary data. Reports and documentspublished by the government, national and international agencies, development journals, have been the keysources of data which includes, among others, MOPME, DPE, BBS, National Plan of Action, BANBEIS,UNESCO, MICS, CAMPE.
Gender
The data for the coverage and costing have been gathered from the following ministries and departments :MOWCA, Ministry of Labour and Employment, Ministry of Primary and Mass Education, Ministry ofEducation, Ministry of Law, Justice and Parliamentary Affairs. Local Government Enginering Department(LGED) and Youth and Employment, National Institute of Local Government (NILG), Department of Primaryand Mass Education, Department of Secondry education and Bangladesh Public Administrastion TrainingCentre (BPTAC).
Health
An intensive literature review was conducted by collecting various reports/articles on performances of healthsector of Bangladesh. The trend analysis of the health related MDGs mainly used the secondary dataavailable from the survey reports of BDHS, SVRS, and MICS. Information was also taken from serologicalsurveillance report/annual report of NASP and NTP. Information from government's plans and strategies, (e.g. HNPSP, PRSP, National Strategic Plan forHIV/AIDS), played a key role in identifying interventions and setting targets. Review of these documentshelped to analyze current programs and future plans for improving maternal and child health, and reducingthe burden of tuberculosis, malaria and HIV/AIDS.Data was collected also using key informant/stakeholder interview for the costing exercise. The data, whichwas not available in the reports, plans, strategies, and, government documents, was collected directly fromservices providers and policy makers. Collected data was cross checked with others and also discussed inthe TWG meeting.
Environment
This analysis report is prepared based on data collected from several survey reports of the Government ofBangladesh as well as primary data collected from expert panel discussions. Data, relevant reports,departmental publications were collected from the Department of Environment, Forest Department,Department of Public Health Engineering (DPHE), Local Government Engineering Department, BangladeshPower Development Board (BPDB), Rural Electrification Board (REB), Bangladesh Demographic and HealthSurvey (BDHS), Bangladesh Bureau of Statistics (BBS), Multiple Indicator Cluster Survey (MICS) conductedby UNICEF and BBS, Bangladesh Water Development Board (BWDB), Chemical Engineering Departmentof BUET. The policy document such as PRSP, different reports published from GED, Planning Commissionhave been reviewed.
45MILLENNIUM DEVELOPMENT GOALS NEEDS ASSESSMENT AND COSTING (2009-2015) BANGLADESH
METHODOLOGY
2.5 Limitations
It is important to note that the results and simulations presented in this report may give an impression ofprecision. They should be treated as indicative of possible broad trends, and could usefully becomplemented with other analyses using different methodological approaches.
Results are no better than data. It is important to note that some of the data were generated fromguesstimates which form a crucial limitation of this report. The guesstimates were taken into considerationin some cases with previous year's data, and some were taken with discussions with relevant stakeholders.By its very nature, such data either over-emphasizes or under-emphasizes, such as households practicingrelevant technologies, level of adoption, and access to infrastructure.
46 MILLENNIUM DEVELOPMENT GOALS NEEDS ASSESSMENT AND COSTING (2009-2015) BANGLADESH
CHAPTER 2
CHAPTER 3

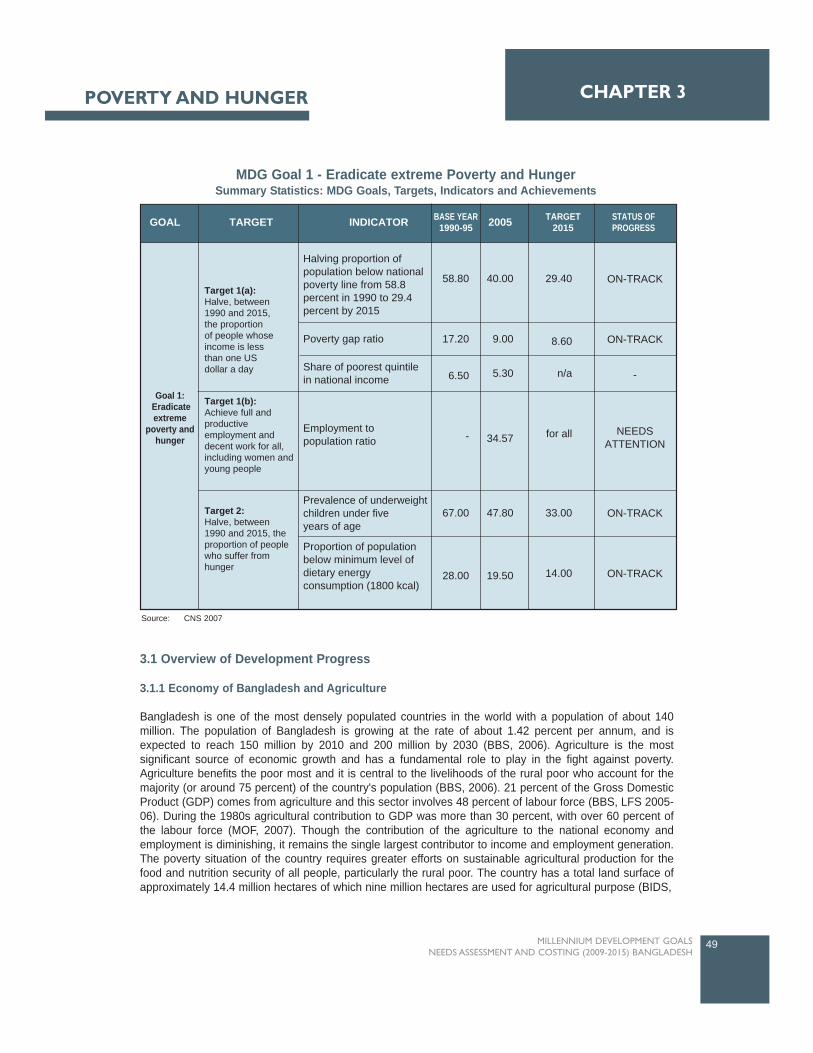
3.1 Overview of Development Progress
3.1.1 Economy of Bangladesh and Agriculture
Bangladesh is one of the most densely populated countries in the world with a population of about 140million. The population of Bangladesh is growing at the rate of about 1.42 percent per annum, and isexpected to reach 150 million by 2010 and 200 million by 2030 (BBS, 2006). Agriculture is the mostsignificant source of economic growth and has a fundamental role to play in the fight against poverty.Agriculture benefits the poor most and it is central to the livelihoods of the rural poor who account for themajority (or around 75 percent) of the country's population (BBS, 2006). 21 percent of the Gross DomesticProduct (GDP) comes from agriculture and this sector involves 48 percent of labour force (BBS, LFS 2005-06). During the 1980s agricultural contribution to GDP was more than 30 percent, with over 60 percent ofthe labour force (MOF, 2007). Though the contribution of the agriculture to the national economy andemployment is diminishing, it remains the single largest contributor to income and employment generation.The poverty situation of the country requires greater efforts on sustainable agricultural production for thefood and nutrition security of all people, particularly the rural poor. The country has a total land surface ofapproximately 14.4 million hectares of which nine million hectares are used for agricultural purpose (BIDS,
49MILLENNIUM DEVELOPMENT GOALS NEEDS ASSESSMENT AND COSTING (2009-2015) BANGLADESH
CHAPTER 3POVERTY AND HUNGER
TARGET INDICATORGOAL BASE YEAR1990-95 2005 TARGET
2015STATUS OFPROGRESS
Goal 1: Eradicateextreme
poverty andhunger
Target 1(a):Halve, between1990 and 2015,the proportionof people whoseincome is lessthan one USdollar a day
Target 1(b):Achieve full and productiveemployment and decent work for all, including women and young people
Target 2:Halve, between1990 and 2015, the proportion of people who suffer fromhunger
Halving proportion ofpopulation below nationalpoverty line from 58.8percent in 1990 to 29.4percent by 2015
Poverty gap ratio
Share of poorest quintilein national income
Employment topopulation ratio
Prevalence of underweightchildren under fiveyears of age
Proportion of populationbelow minimum level ofdietary energyconsumption (1800 kcal)
58.80
17.20
6.50
-
67.00
28.00
40.00
9.00
5.30
34.57
47.80
19.50
29.40
8.60
n/a
for all
33.00
14.00
ON-TRACK
ON-TRACK
-
ON-TRACK
ON-TRACK
NEEDSATTENTION
MDG Goal 1 - Eradicate extreme Poverty and HungerSummary Statistics: MDG Goals, Targets, Indicators and Achievements
Source: CNS 2007
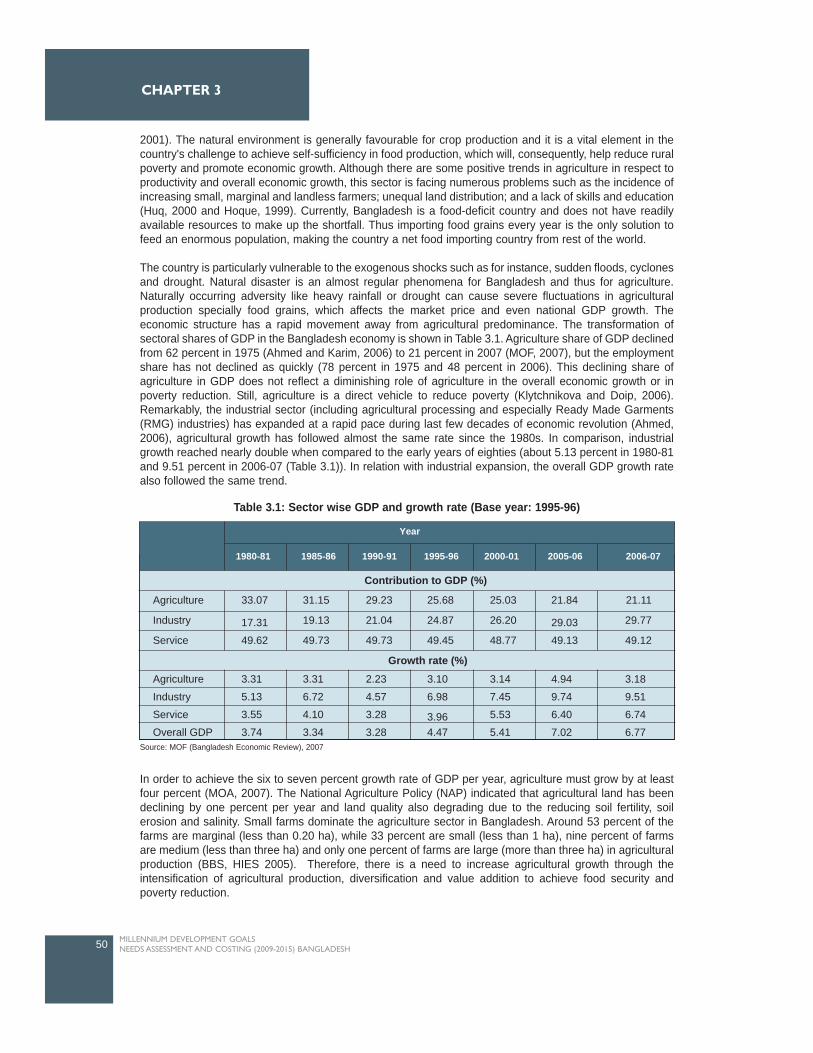
2001). The natural environment is generally favourable for crop production and it is a vital element in thecountry's challenge to achieve self-sufficiency in food production, which will, consequently, help reduce ruralpoverty and promote economic growth. Although there are some positive trends in agriculture in respect toproductivity and overall economic growth, this sector is facing numerous problems such as the incidence ofincreasing small, marginal and landless farmers; unequal land distribution; and a lack of skills and education(Huq, 2000 and Hoque, 1999). Currently, Bangladesh is a food-deficit country and does not have readilyavailable resources to make up the shortfall. Thus importing food grains every year is the only solution tofeed an enormous population, making the country a net food importing country from rest of the world.
The country is particularly vulnerable to the exogenous shocks such as for instance, sudden floods, cyclonesand drought. Natural disaster is an almost regular phenomena for Bangladesh and thus for agriculture.Naturally occurring adversity like heavy rainfall or drought can cause severe fluctuations in agriculturalproduction specially food grains, which affects the market price and even national GDP growth. Theeconomic structure has a rapid movement away from agricultural predominance. The transformation ofsectoral shares of GDP in the Bangladesh economy is shown in Table 3.1. Agriculture share of GDP declinedfrom 62 percent in 1975 (Ahmed and Karim, 2006) to 21 percent in 2007 (MOF, 2007), but the employmentshare has not declined as quickly (78 percent in 1975 and 48 percent in 2006). This declining share ofagriculture in GDP does not reflect a diminishing role of agriculture in the overall economic growth or inpoverty reduction. Still, agriculture is a direct vehicle to reduce poverty (Klytchnikova and Doip, 2006).Remarkably, the industrial sector (including agricultural processing and especially Ready Made Garments(RMG) industries) has expanded at a rapid pace during last few decades of economic revolution (Ahmed,2006), agricultural growth has followed almost the same rate since the 1980s. In comparison, industrialgrowth reached nearly double when compared to the early years of eighties (about 5.13 percent in 1980-81and 9.51 percent in 2006-07 (Table 3.1)). In relation with industrial expansion, the overall GDP growth ratealso followed the same trend.
In order to achieve the six to seven percent growth rate of GDP per year, agriculture must grow by at leastfour percent (MOA, 2007). The National Agriculture Policy (NAP) indicated that agricultural land has beendeclining by one percent per year and land quality also degrading due to the reducing soil fertility, soilerosion and salinity. Small farms dominate the agriculture sector in Bangladesh. Around 53 percent of thefarms are marginal (less than 0.20 ha), while 33 percent are small (less than 1 ha), nine percent of farmsare medium (less than three ha) and only one percent of farms are large (more than three ha) in agriculturalproduction (BBS, HIES 2005). Therefore, there is a need to increase agricultural growth through theintensification of agricultural production, diversification and value addition to achieve food security andpoverty reduction.
50 MILLENNIUM DEVELOPMENT GOALS NEEDS ASSESSMENT AND COSTING (2009-2015) BANGLADESH
CHAPTER 3
Year
1980-81 1985-86 1990-91 1995-96 2000-01 2005-06 2006-07
Contribution to GDP (%)
Growth rate (%)
Agriculture
Industry
Service
33.07
17.31
49.62
31.15
19.13
49.73
29.23
21.04
49.73
25.68
24.87
49.45
25.03
26.20
48.77
21.84
29.03
49.13
21.11
29.77
49.12
Agriculture
Industry
Service
Overall GDP
3.31
5.13
3.55
3.74
3.31
6.72
4.10
3.34
2.23
4.57
3.28
3.28
3.10
6.98
3.964.47
3.14
7.45
5.53
5.41
4.94
9.74
6.40
7.02
3.18
9.51
6.74
6.77
Table 3.1: Sector wise GDP and growth rate (Base year: 1995-96)
Source: MOF (Bangladesh Economic Review), 2007
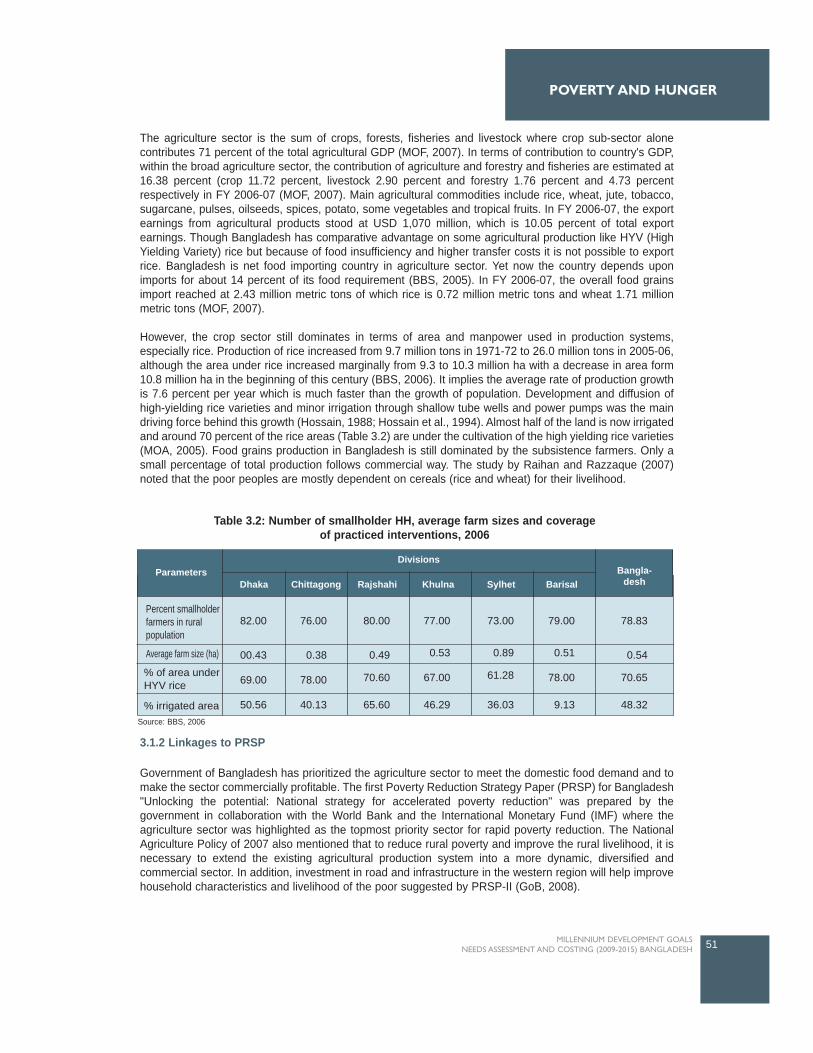
POVERTY AND HUNGER
The agriculture sector is the sum of crops, forests, fisheries and livestock where crop sub-sector alonecontributes 71 percent of the total agricultural GDP (MOF, 2007). In terms of contribution to country's GDP,within the broad agriculture sector, the contribution of agriculture and forestry and fisheries are estimated at16.38 percent (crop 11.72 percent, livestock 2.90 percent and forestry 1.76 percent and 4.73 percentrespectively in FY 2006-07 (MOF, 2007). Main agricultural commodities include rice, wheat, jute, tobacco,sugarcane, pulses, oilseeds, spices, potato, some vegetables and tropical fruits. In FY 2006-07, the exportearnings from agricultural products stood at USD 1,070 million, which is 10.05 percent of total exportearnings. Though Bangladesh has comparative advantage on some agricultural production like HYV (HighYielding Variety) rice but because of food insufficiency and higher transfer costs it is not possible to exportrice. Bangladesh is net food importing country in agriculture sector. Yet now the country depends uponimports for about 14 percent of its food requirement (BBS, 2005). In FY 2006-07, the overall food grainsimport reached at 2.43 million metric tons of which rice is 0.72 million metric tons and wheat 1.71 millionmetric tons (MOF, 2007).
However, the crop sector still dominates in terms of area and manpower used in production systems,especially rice. Production of rice increased from 9.7 million tons in 1971-72 to 26.0 million tons in 2005-06,although the area under rice increased marginally from 9.3 to 10.3 million ha with a decrease in area form10.8 million ha in the beginning of this century (BBS, 2006). It implies the average rate of production growthis 7.6 percent per year which is much faster than the growth of population. Development and diffusion ofhigh-yielding rice varieties and minor irrigation through shallow tube wells and power pumps was the maindriving force behind this growth (Hossain, 1988; Hossain et al., 1994). Almost half of the land is now irrigatedand around 70 percent of the rice areas (Table 3.2) are under the cultivation of the high yielding rice varieties(MOA, 2005). Food grains production in Bangladesh is still dominated by the subsistence farmers. Only asmall percentage of total production follows commercial way. The study by Raihan and Razzaque (2007)noted that the poor peoples are mostly dependent on cereals (rice and wheat) for their livelihood.
3.1.2 Linkages to PRSP
Government of Bangladesh has prioritized the agriculture sector to meet the domestic food demand and tomake the sector commercially profitable. The first Poverty Reduction Strategy Paper (PRSP) for Bangladesh"Unlocking the potential: National strategy for accelerated poverty reduction" was prepared by thegovernment in collaboration with the World Bank and the International Monetary Fund (IMF) where theagriculture sector was highlighted as the topmost priority sector for rapid poverty reduction. The NationalAgriculture Policy of 2007 also mentioned that to reduce rural poverty and improve the rural livelihood, it isnecessary to extend the existing agricultural production system into a more dynamic, diversified andcommercial sector. In addition, investment in road and infrastructure in the western region will help improvehousehold characteristics and livelihood of the poor suggested by PRSP-II (GoB, 2008).
51MILLENNIUM DEVELOPMENT GOALS NEEDS ASSESSMENT AND COSTING (2009-2015) BANGLADESH
Divisions
DhakaParameters
Chittagong Rajshahi Khulna Sylhet BarisalBangla-
desh
Percent smallholderfarmers in ruralpopulation
82.00
00.43
69.00
50.56
76.00
0.38
78.00
40.13
80.00
0.49
70.60
65.60
77.00
0.53
67.00
46.29
73.00
0.89
61.28
36.03
79.00
0.51
78.00
9.13
78.83
0.54
70.65
48.32
Average farm size (ha)
% of area underHYV rice
% irrigated area
Table 3.2: Number of smallholder HH, average farm sizes and coverageof practiced interventions, 2006
Source: BBS, 2006

The second PRSP for Bangladesh "Moving Ahead" has also now been prepared under full governmentownership and direction. Twelve sectors were identified and an equal number of thematic groups set up bythe Government to coordinate the preparation of the various thematic background papers. A mapping of thesectors indicates that most sectors address MDG1 by focusing on poverty eradication. The PRSP-II alreadyemphasizes the importance of agricultural and rural development in increasing productivity, and employmentgeneration in rural areas. To increase foreign remittances, the skills-oriented manpower export from theyouth labour force is suggested as a key target and the policy matrix has been suggested accordingly. Tothis end, the Government has also reinvigorated its pro-poor bias, allocating from FY08 an increased annualpro-poor spending of one percent of GDP. This pro-poor bias is illustrated by, for example, the guaranteedemployment scheme for two million pro-poor people, providing employment for 100 days at the rate of Taka100 per man-day. For this programme, BDT 20 billion which was allocated in the national budget of FY08/09. The link between national budgeting and MDG1 was also clearly stated in the Finance Minister's budget speeches of FY 08 and FY09.
3.1.3 Situation of Poverty in Bangladesh
Bangladesh has made a significant improvement in poverty reduction in recent decades. Available estimatesindicate that Bangladesh succeeded in reducing poverty on an average one percent per year during 1990sand nearly two percent in first half of the current decade. According to the HIES report, the poverty headcount ratio declined from 58.8 percent in 1991-92 to 48.9 percent in 2000, and to 40.0 percent in 2005.Immediately after independence, Bangladesh's poverty level was estimated at 88.15 percent (1972-1975).Compared with this, the current figures suggest that Bangladesh has achieved a substantial reduction in theincidence of poverty over the last three decades (Ahmed and Sattar, 2004).
Bangladesh has enjoyed steady growth in per capita income over the past two decades. An increase in riceproductivity through improved seeds varieties, and through improved fertilizer and irrigation technologiesand use, has contributed to an increase in farmers' income. A large expansion in the RMG sector, as well asincreasing remittances and a liberalized trading environment also had a large impact on income levels (Arndtet al., 2002). Structural changes in the agricultural sector in the early 1990s through the liberalization of theimport of irrigation equipment and the fertilizer market, led to a significant increase in rice productivity inBangladesh (Klytchnikova and Doip, 2006). Increasing rice production has been associated with a decreasein price of approximately 25 percent. Analysis results show that the net effect of increased rice productionand lower market price mostly benefited poor households. Large producers of rice were the principal losersdue to lower market prices. Since net buyers are poorer than net sellers in the rural areas, agricultural tradeliberalization has tended to benefit the poor most.
Liberalization also favourably contributes to output growth, market size, size of the private stock, seasonalityas well as declining real rice prices. National import dependency for food grains fell from 12 percent in 1980to 5.5 percent in 2004. This might reflect movement towards self sufficiency in food grain production, but theaverage volume of import is still more than previously because of the higher demands of an increasingpopulation. The size of the market surplus of rice over the last two decades grew at twice the rate of outputgrowth. This can be attributed to increasing productivity due to the adoption of modern rice varieties(Hossain et al., 2003), better market development, and infrastructural development. Liberalization led tocomplete replacement of the public imports by the private sector. Because of low entry barriers, tradingbecame extremely competitive. Evidence showed that due to liberalization there has been an increase incompetition, and at the same time, an increase in the rate of growth of during the reforms period (Krisna andMitra, 1998). Real price of food grains decreased remarkably. Seasonal fluctuation was also reducedbetween the 1980s and 2000s, and there was greater spatial market integration following liberalization(Chowdhury et al., 2006).
Adopting MV (Modern Variety) rice technology, combined with other non-rice crops as well as non-cropagriculture like poultry, livestock and fisheries have a significant contribution to the household income level,which in turn helping to escape from poverty (Sen, 2003). Privatization of irrigation system and agriculturalinput market through reducing import barriers providing incentives to the private sector import since 1980s
52 MILLENNIUM DEVELOPMENT GOALS NEEDS ASSESSMENT AND COSTING (2009-2015) BANGLADESH
CHAPTER 3
helped for the adoption of MV in 1990s (Hossain et al., 2003). Findings show that 50 percent of householdshave experienced direct positive impact from the adoption of MVs through higher yields and higher farmincomes. It is argued that although profitability is comparatively less due to the lower output price, the lowerprice has largely poor households by achieving food security and reducing vulnerability. Evidence alsosuggests that the real wage increased about 4.8 percent per year, from 1987 to 2000.
There is also impressive progress in the diffusion of improved agricultural technology, which has helped thecountry to sustain the food-population balance. This consequently has contributed to a decline in the realprice of food grains to the benefit of the rural landless and the urban poor (Hossain, 1996). The author alsomentions that technological progress took place when government reforms were transforming agriculturalpolicies and changing public sector control to the private sector for the procurement and distribution offertilizer and irrigation and elimination of subsidies on agricultural inputs. The major changes happened inagricultural production from the spread of minor irrigation following the removal of the ban on private sectorimports of irrigation equipment and a reduction in import tariffs. This policy reduced the irrigation cost throughincreased competition which helped to reduce water charges, and helped with the adoption of new modernvarieties of rice. Policy reforms in trade and the marketing of inputs have an effect through influences onprice mechanisms.
3.2 Progress in Achieving the MDG 1
The experience of the last few decades indicates that, on average, economic growth in Bangladesh hasbeen associated with reductions in income poverty and hunger, and faster reductions in non-income povertyand hunger. Poverty and hunger reduction, however, has not proceeded at the same rate as growth ofincome in different sub-periods. The rate of poverty and hunger reduction varied in different sub-periods. Itmay be noted that a simple measure of pro-poor growth is given by the growth elasticity of poverty, definedas the ratio of the percentage change in the poverty headcount ratio to the percentage change in the growthrate. The higher the growth elasticity of poverty, the more pro-poor the economic growth. The need for apro-poor growth strategy emerges out of the fact that poverty and hunger are not only disgraceful to the poorbut also a barrier to development since they limit economic demand, squeeze human capability and hampersocial cohesion and the political stability of a society. A pro-poor growth strategy is thus a precondition forthe more sustainable and stable development of a society especially where there is the enormous magnitudeof poverty and hunger as in Bangladesh.
Target 1(a): Halve, between 1990 and 2015, the proportion of people whose income is lessthan one US dollar a day
To achieve MDG1, Bangladesh must reduce by 2015 the proportion of population with an income less thanone US dollar (PPP) a day from 58.8 percent in 1990 to 29.4 percent.
3.2.1 Poverty reduction
The proportion of population below national poverty line in 2005 was 40.0 and the extrapolated value was47.2 in 2007 though the price hikes on general commodities increased proportion of the population belowpoverty line (by some estimates it could be as much as more than 8.50 percent) (Table 3.3).
53MILLENNIUM DEVELOPMENT GOALS NEEDS ASSESSMENT AND COSTING (2009-2015) BANGLADESH
POVERTY AND HUNGER

The poverty situation varied in different periods of time, as well as between urban and rural areas. The rateof poverty reduction was found higher during 2000-05 (Table 3.4). The plausible reason for higher growth ofpoverty reduction during this period could be due to productions of all major crops which include rice, wheat,jute, pulses, oilseed, and sugarcane, which account for approximately 79 percent of total cultivated area andwhich increased steadily during the first PRS. Policy support in the form of liberalization of equipmentimports, deregulation, rationalization of subsidy and restructuring of agricultural research-extension-farmers'linkages and public-private partnership approach, buttressed by private sector investment in production,seed production (especially hybrid seeds), chemical and blended fertilizers, and agro-processing enterpriseshas facilitated the progress in the crop sector (Draft PRS-II, 2008). On the other hand, the flood in 1997 and1998 seriously affected human life and crops and animals were severely damaged.
The rate of poverty reduction was also higher in the urban areas during 2000-05 due to rapid expansion ofprivate sector involvement in the sectors like textile, ICT, telecommunication, hydrocarbon, electricity, airtransport, tourism, railway and banking and insurance. In the recent years, private sector activities haveexpanded significantly in diverse economic fields. The private sector acts as the engine of growth in a marketoriented economy. At present it accounts for about 80 percent of GDP, 90 percent of employment, 77 percentof investment, 93 percent of domestic saving, 74 percent of consumption expenditure, and 72 percent ofdomestic credit in Bangladesh (Draft PRS-II, 2008). Rural non-farm (RNF) households grew at 5.0 percentper annum, compared with only 1.5 percent per annum growth in the number of farm holdings, from the
54 MILLENNIUM DEVELOPMENT GOALS NEEDS ASSESSMENT AND COSTING (2009-2015) BANGLADESH
CHAPTER 3
Period Rural Urban National
1990-95
1995-00
2000-05
2005-07
1990-2007 (Normal existing rate)
Required rate (Normal)
Time required to achieve targets (yrs) (normal rate since 2007)
Status
1.93
1.08
3.25
1.71
1.82
1.46
6.43
On-track
6.86
3.86
3.86
1.41
2.27
0.64
2.25
On-track
2.65
0.82
3.64
1.63
2.01
1.16
4.63
On-track
Table 3.4: Annual rate of poverty reduction (%) over 1990-2007
Year Rural Urban National
1990
1995
2000
2005
2007*
2015
NormalIf 8.50% additional addeddue to price hikes in 2007/08
61.20
55.30
52.30
43.80
42.30
50.80
30.60
44.90
29.50
35.20
28.40
27.60
36.10
22.50
58.80
51.00
48.90
40.00
38.66
47.20
29.40
Table 3.3: Proportion of population below national poverty line
Source: i) Mid-term progress report of MDG, 2007, ii) HIES 2000, 2005 iii) BBS 2006
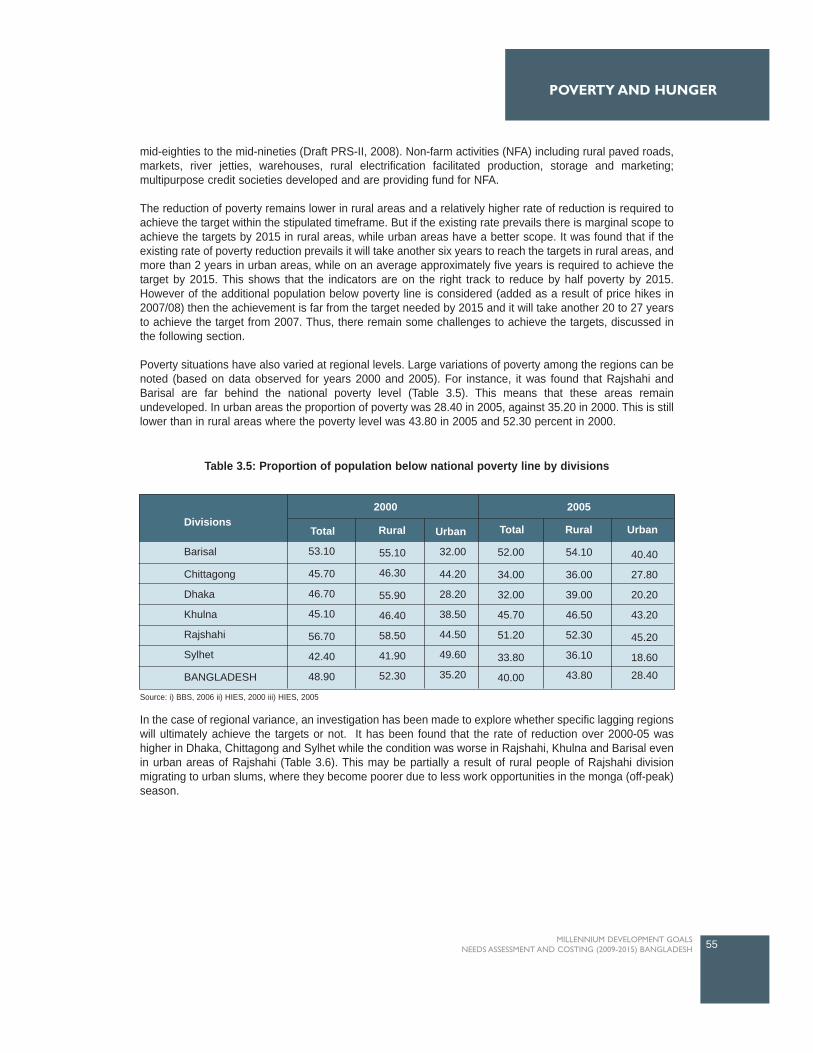
mid-eighties to the mid-nineties (Draft PRS-II, 2008). Non-farm activities (NFA) including rural paved roads,markets, river jetties, warehouses, rural electrification facilitated production, storage and marketing;multipurpose credit societies developed and are providing fund for NFA.
The reduction of poverty remains lower in rural areas and a relatively higher rate of reduction is required toachieve the target within the stipulated timeframe. But if the existing rate prevails there is marginal scope toachieve the targets by 2015 in rural areas, while urban areas have a better scope. It was found that if theexisting rate of poverty reduction prevails it will take another six years to reach the targets in rural areas, andmore than 2 years in urban areas, while on an average approximately five years is required to achieve thetarget by 2015. This shows that the indicators are on the right track to reduce by half poverty by 2015.However of the additional population below poverty line is considered (added as a result of price hikes in2007/08) then the achievement is far from the target needed by 2015 and it will take another 20 to 27 yearsto achieve the target from 2007. Thus, there remain some challenges to achieve the targets, discussed inthe following section.
Poverty situations have also varied at regional levels. Large variations of poverty among the regions can benoted (based on data observed for years 2000 and 2005). For instance, it was found that Rajshahi andBarisal are far behind the national poverty level (Table 3.5). This means that these areas remainundeveloped. In urban areas the proportion of poverty was 28.40 in 2005, against 35.20 in 2000. This is stilllower than in rural areas where the poverty level was 43.80 in 2005 and 52.30 percent in 2000.
In the case of regional variance, an investigation has been made to explore whether specific lagging regionswill ultimately achieve the targets or not. It has been found that the rate of reduction over 2000-05 washigher in Dhaka, Chittagong and Sylhet while the condition was worse in Rajshahi, Khulna and Barisal evenin urban areas of Rajshahi (Table 3.6). This may be partially a result of rural people of Rajshahi divisionmigrating to urban slums, where they become poorer due to less work opportunities in the monga (off-peak)season.
55MILLENNIUM DEVELOPMENT GOALS NEEDS ASSESSMENT AND COSTING (2009-2015) BANGLADESH
POVERTY AND HUNGER
Divisions
Barisal
Chittagong
Dhaka
Khulna
Rajshahi
Sylhet
BANGLADESH
Total
53.10
45.70
46.70
45.10
56.70
42.40
48.90
Rural
55.10
46.30
55.90
46.40
58.50
41.90
52.30
Urban
32.00
44.20
28.20
38.50
44.50
49.60
35.20
Total
52.00
34.00
32.00
45.70
51.20
33.80
40.00
Rural
54.10
36.00
39.00
46.50
52.30
36.10
43.80
Urban
40.40
27.80
20.20
43.20
45.20
18.60
28.40
20052000
Table 3.5: Proportion of population below national poverty line by divisions
Source: i) BBS, 2006 ii) HIES, 2000 iii) HIES, 2005

In PRSP-II, "Moving Ahead", it has been mentioned that there exists statistically significant difference insome of the covariates of the households between the eastern (Dhaka and Chittagong divisions) and thewestern regions (Barisal and Khulna divisions). Households in the eastern region have more assetscomprising house, land, business assets and durable goods compared to those in the western region. Thepersistence of these differences is attributable to the emergence of two growth poles, namely Dhaka andChittagong, in the eastern region and easier access of people living in this part of the country to these cities.Growth of these cities is also spreading in nearby rural areas. People in the western part of the country haveless access to the growth poles because of lesser connectivity. Faster poverty reduction in this region of thecountry can be achieved through investment in infrastructure, especially road infrastructure, and bridgesespecially over the Padma to increase connectivity. Another policy would consist of investment in humancapital and improvements in employment opportunities which will improve household characteristics. Table3.6 above shows the number of years required to achieve the targets on poverty reduction and as evident,in Khulna, Barisal and Rajshahi, there is less chance to achieve the targets within the next decades if theexisting rate of poverty reduction prevails. The recommendations emerging from these findings is that MDGlocalization at the Divisional level is crucial to achieve MDG1 in Bangladesh.
In addition, extreme poverty is observed in some of the pockets of Bangladesh. The persistence of extremepoverty in some identified areas of the country has been a stark reality in Bangladesh (Annex Table A1-A2).People living in remote char areas with little assets and a lack of employment opportunities during particularperiods of the year, are common victims of extreme poverty. Further, people living in remote areas of the hilltracts region and ethnic people are also victim of extreme poverty. Investment in infrastructure, creation ofemployment opportunities during the lean period, and increased coverage of SSNPs will improve the povertysituation.
An assessment of national poverty situation based on farm categories found that as the farm size increased,the proportion of population below poverty line decreased. The situation was far better in 2005 compared to2000 (Table 3.7). It is shown that most farms above 0.50 acres had lower poverty levels than the target setfor 2015.
56 MILLENNIUM DEVELOPMENT GOALS NEEDS ASSESSMENT AND COSTING (2009-2015) BANGLADESH
CHAPTER 3
Table 3.6: Annual rate of poverty reduction over 2000-05 by divisions
Time required (years)
Based onrequired
rate
Based onexisting rateSince 2005
TotalTotalTotal
Divisions
UrbanRural
Required rate ofpoverty reductionto achieve targets
by 2015
Rate of reductionover 2000-2005
Total
Barisal
Chittagong
Dhaka
Khulna
Rajshahi
Sylhet
BANGLADESH
0.41
5.12
6.30
0.27
1.94
4.06
3.64
0.36
4.45
6.05
0.04
2.12
2.77
3.25
5.25
7.42
5.67
2.44
0.31
12.50
3.86
4.35
1.35
0.81
3.57
4.26
1.30
2.65
5.20
3.40
3.20
4.57
5.12
3.38
4.00
0.90 (On-track)
0.41 (On-track)
61.26 (Off-track)
11.24 (Off-track)
1.08 (On-track)
2.91 (On-track)
55.12 (Off-track)

Table 3.8 below explains the time required for achieving the target by 2015 in different farm categories. Ithas been found that the urban landless will never achieve the targets while the rural landless would takeanother 39 years from 2005 to achieve the targets. Thus, the situation for landless as well as farm ownershaving less than 0.05 acres of land remains grim as shown below. Poverty reduction for such sectionsshould be done either through an effective land reform or by giving massive ceiling incentives. Ministry ofFood could take responsibility for addressing this issue.
57MILLENNIUM DEVELOPMENT GOALS NEEDS ASSESSMENT AND COSTING (2009-2015) BANGLADESH
POVERTY AND HUNGER
2000 2005
Total Rural Urban Total Rural UrbanFarm size (acre)
Landless
Less than 0.05
0.05-0.49
0.50-1.49
1.50-2.49
2.50-7.49
7.50 and above
BANGLADESH
46.30
56.40
44.90
34.30
22.90
15.40
3.10
40.00
66.60
65.70
50.70
37.10
25.60
17.40
3.60
43.80
40.10
39.70
25.70
17.40
8.80
4.20
0.00
28.40
46.60
57.90
57.10
46.20
34.30
21.90
9.50
48.90
69.70
63.00
59.30
47.50
35.40
22.80
9.70
52.30
36.60
38.30
27.30
27.40
10.20
9.10
0.00
35.20
Time required (years)Farm size
(acre)
Rate of reduction over 2000-2005
Required rate to achieve
targets by 2015
Since 2005
Total Rural Urban Total Total Rural Urban
Landless
Less than 0.05
0.05-0.49
0.50-1.49
1.50-2.49
2.50-7.49
7.50 and above
BANGLADESH
-0.36
-0.53
-5.43
-6.94
-9.96
-8.44
-41.29
-4.45
-0.93
0.82
-3.39
-5.61
-7.66
-6.21
-33.89
-3.88
1.75
0.71
-1.25
-11.49
-3.18
-23.33
0.00
-4.79
-1.69
-2.70
-1.55
-0.49
0.65
1.40
2.63
-1.06
128.61
50.76
2.85
0.71
-0.65
-1.66
-0.64
2.38
38.67
-42.71
5.92
1.16
-0.65
-2.13
-0.80
3.40
-10.08
-24.39
2.57
-0.44
-4.31
-0.78
0.00
1.23
Notes:Never possible Possible out of target period
Possible within target periodAlready achievedtargets
Table 3.7: Proportion of population below national poverty line by farm size
Source: i) BBS, 2006 ii) HIES, 2000 iii) HIES, 2005
Table 3.8: Annual rate of poverty reduction over 2000-05 by farm sizes
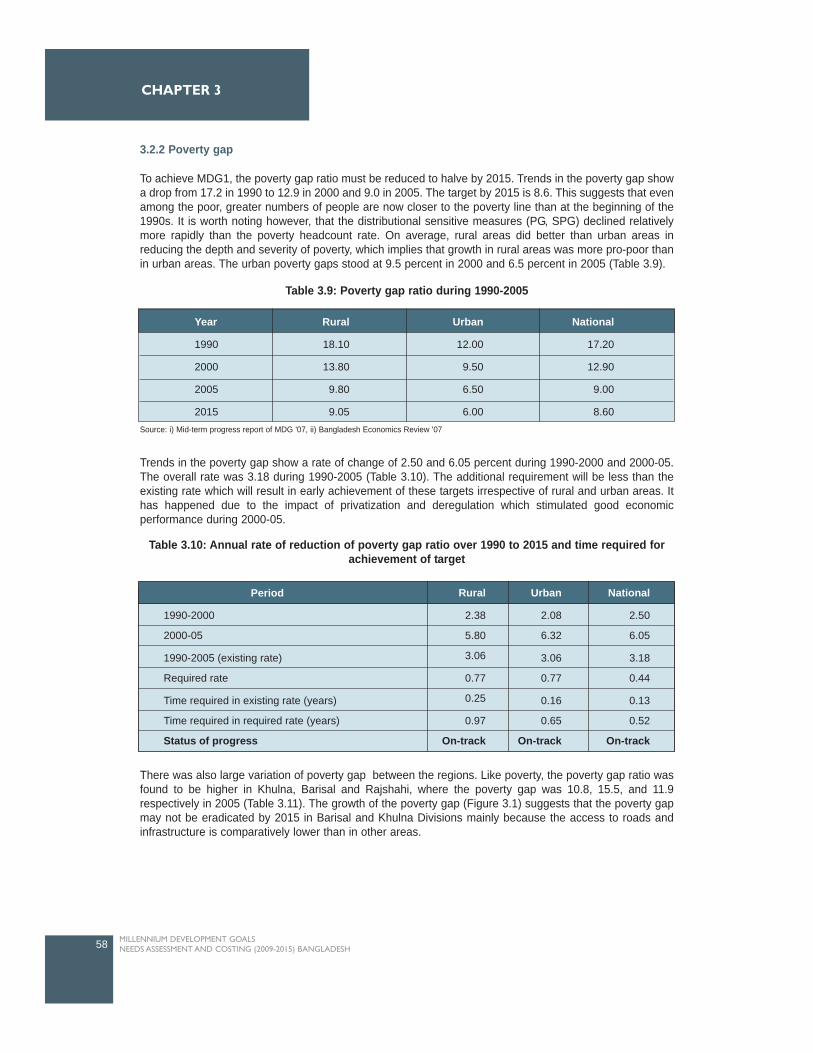
3.2.2 Poverty gap
To achieve MDG1, the poverty gap ratio must be reduced to halve by 2015. Trends in the poverty gap showa drop from 17.2 in 1990 to 12.9 in 2000 and 9.0 in 2005. The target by 2015 is 8.6. This suggests that evenamong the poor, greater numbers of people are now closer to the poverty line than at the beginning of the1990s. It is worth noting however, that the distributional sensitive measures (PG, SPG) declined relativelymore rapidly than the poverty headcount rate. On average, rural areas did better than urban areas inreducing the depth and severity of poverty, which implies that growth in rural areas was more pro-poor thanin urban areas. The urban poverty gaps stood at 9.5 percent in 2000 and 6.5 percent in 2005 (Table 3.9).
Trends in the poverty gap show a rate of change of 2.50 and 6.05 percent during 1990-2000 and 2000-05.The overall rate was 3.18 during 1990-2005 (Table 3.10). The additional requirement will be less than theexisting rate which will result in early achievement of these targets irrespective of rural and urban areas. Ithas happened due to the impact of privatization and deregulation which stimulated good economicperformance during 2000-05.
There was also large variation of poverty gap between the regions. Like poverty, the poverty gap ratio wasfound to be higher in Khulna, Barisal and Rajshahi, where the poverty gap was 10.8, 15.5, and 11.9respectively in 2005 (Table 3.11). The growth of the poverty gap (Figure 3.1) suggests that the poverty gapmay not be eradicated by 2015 in Barisal and Khulna Divisions mainly because the access to roads andinfrastructure is comparatively lower than in other areas.
58 MILLENNIUM DEVELOPMENT GOALS NEEDS ASSESSMENT AND COSTING (2009-2015) BANGLADESH
CHAPTER 3
Table 3.9: Poverty gap ratio during 1990-2005
Source: i) Mid-term progress report of MDG '07, ii) Bangladesh Economics Review '07
Year
1990
2000
2005
2015
Rural
18.10
13.80
9.80
9.05
Urban
12.00
9.50
6.50
6.00
National
17.20
12.90
9.00
8.60
Table 3.10: Annual rate of reduction of poverty gap ratio over 1990 to 2015 and time required forachievement of target
1990-2000
2000-05
1990-2005 (existing rate)
Required rate
Time required in existing rate (years)
Time required in required rate (years)
Status of progress
Period Rural
2.38
5.80
3.06
0.77
0.25
0.97
On-track
Urban
2.08
6.32
3.06
0.77
0.16
0.65
On-track
National
2.50
6.05
3.18
0.44
0.13
0.52
On-track
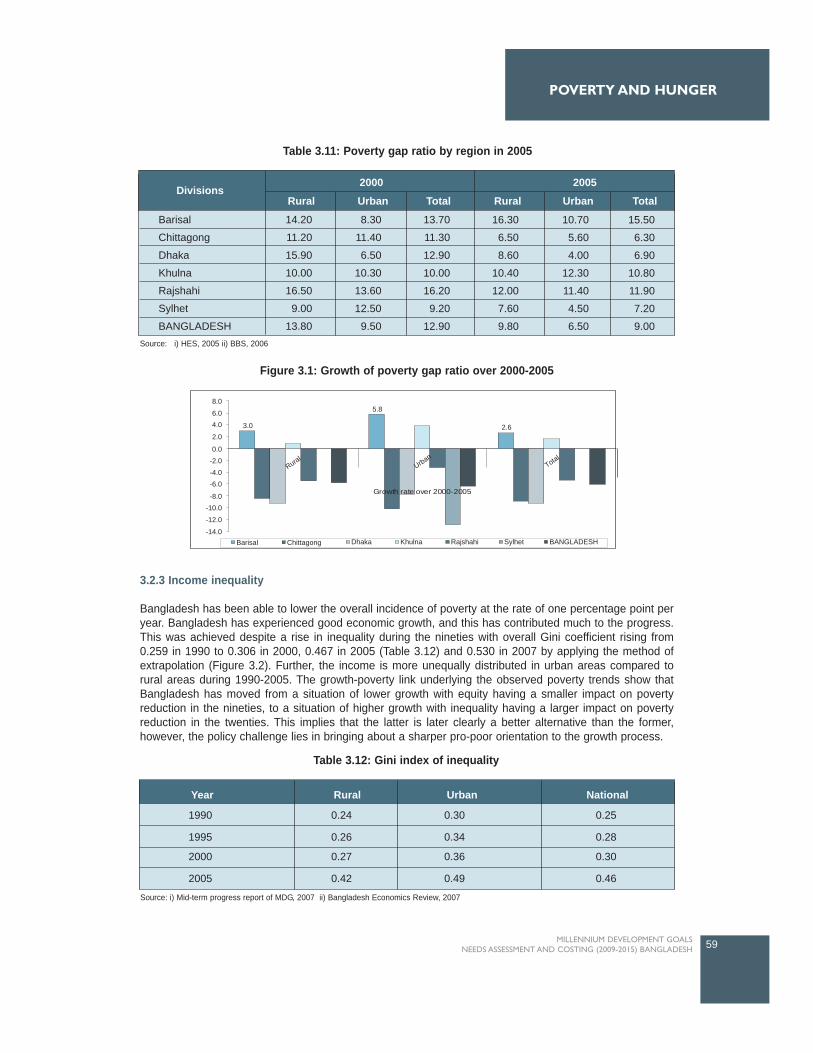
3.2.3 Income inequality
Bangladesh has been able to lower the overall incidence of poverty at the rate of one percentage point peryear. Bangladesh has experienced good economic growth, and this has contributed much to the progress.This was achieved despite a rise in inequality during the nineties with overall Gini coefficient rising from0.259 in 1990 to 0.306 in 2000, 0.467 in 2005 (Table 3.12) and 0.530 in 2007 by applying the method ofextrapolation (Figure 3.2). Further, the income is more unequally distributed in urban areas compared torural areas during 1990-2005. The growth-poverty link underlying the observed poverty trends show thatBangladesh has moved from a situation of lower growth with equity having a smaller impact on povertyreduction in the nineties, to a situation of higher growth with inequality having a larger impact on povertyreduction in the twenties. This implies that the latter is later clearly a better alternative than the former,however, the policy challenge lies in bringing about a sharper pro-poor orientation to the growth process.
59MILLENNIUM DEVELOPMENT GOALS NEEDS ASSESSMENT AND COSTING (2009-2015) BANGLADESH
POVERTY AND HUNGER
Divisions2000
Rural Urban Total Rural Urban Total
2005
Barisal
Chittagong
Dhaka
Khulna
Rajshahi
Sylhet
BANGLADESH
14.20
11.20
15.90
10.00
16.50
9.00
13.80
8.30
11.40
6.50
10.30
13.60
12.50
9.50
13.70
11.30
12.90
10.00
16.20
9.20
12.90
16.30
6.50
8.60
10.40
12.00
7.60
9.80
10.70
5.60
4.00
12.30
11.40
4.50
6.50
15.50
6.30
6.90
10.80
11.90
7.20
9.00
8.0
6.04.0 3.0
5.8
Growth rate over 2000-2005
Barisal Chittagong Dhaka Khulna Rajshahi Sylhet BANGLADESH
2.62.0
0.0-2.0-4.0-6.0
-8.0-10.0
-12.0
-14.0
RuralUrban
Total
Table 3.11: Poverty gap ratio by region in 2005
Figure 3.1: Growth of poverty gap ratio over 2000-2005
Source: i) HES, 2005 ii) BBS, 2006
Table 3.12: Gini index of inequality
1990 0.24 0.30 0.25
1995 0.26 0.34 0.28
2000 0.27 0.36 0.30
2005 0.42 0.49 0.46
Year Rural Urban National
Source: i) Mid-term progress report of MDG, 2007 ii) Bangladesh Economics Review, 2007
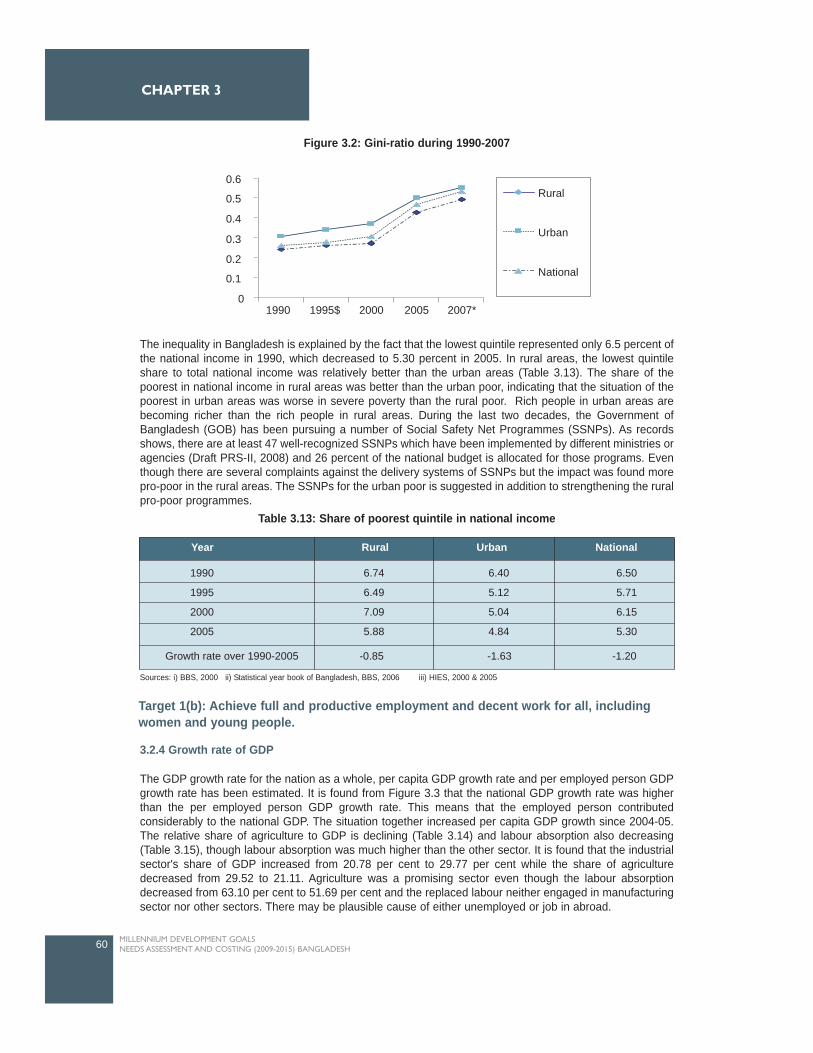
The inequality in Bangladesh is explained by the fact that the lowest quintile represented only 6.5 percent ofthe national income in 1990, which decreased to 5.30 percent in 2005. In rural areas, the lowest quintileshare to total national income was relatively better than the urban areas (Table 3.13). The share of thepoorest in national income in rural areas was better than the urban poor, indicating that the situation of thepoorest in urban areas was worse in severe poverty than the rural poor. Rich people in urban areas arebecoming richer than the rich people in rural areas. During the last two decades, the Government ofBangladesh (GOB) has been pursuing a number of Social Safety Net Programmes (SSNPs). As recordsshows, there are at least 47 well-recognized SSNPs which have been implemented by different ministries oragencies (Draft PRS-II, 2008) and 26 percent of the national budget is allocated for those programs. Eventhough there are several complaints against the delivery systems of SSNPs but the impact was found morepro-poor in the rural areas. The SSNPs for the urban poor is suggested in addition to strengthening the ruralpro-poor programmes.
3.2.4 Growth rate of GDP
The GDP growth rate for the nation as a whole, per capita GDP growth rate and per employed person GDPgrowth rate has been estimated. It is found from Figure 3.3 that the national GDP growth rate was higherthan the per employed person GDP growth rate. This means that the employed person contributedconsiderably to the national GDP. The situation together increased per capita GDP growth since 2004-05.The relative share of agriculture to GDP is declining (Table 3.14) and labour absorption also decreasing(Table 3.15), though labour absorption was much higher than the other sector. It is found that the industrialsector's share of GDP increased from 20.78 per cent to 29.77 per cent while the share of agriculturedecreased from 29.52 to 21.11. Agriculture was a promising sector even though the labour absorptiondecreased from 63.10 per cent to 51.69 per cent and the replaced labour neither engaged in manufacturingsector nor other sectors. There may be plausible cause of either unemployed or job in abroad.
60 MILLENNIUM DEVELOPMENT GOALS NEEDS ASSESSMENT AND COSTING (2009-2015) BANGLADESH
CHAPTER 3
1990 6.74 6.40 6.50
1995 6.49 5.12 5.71
2000 7.09 5.04 6.15
2005 5.88 4.84 5.30
Year Rural Urban National
Growth rate over 1990-2005 -0.85 -1.63 -1.20
Table 3.13: Share of poorest quintile in national income
Target 1(b): Achieve full and productive employment and decent work for all, includingwomen and young people.
Sources: i) BBS, 2000 ii) Statistical year book of Bangladesh, BBS, 2006 iii) HIES, 2000 & 2005
0.6
0.5
0.4
0.3
0.2
0.1
01995$1990 2000 2005 2007*
Rural
Urban
National
Figure 3.2: Gini-ratio during 1990-2007
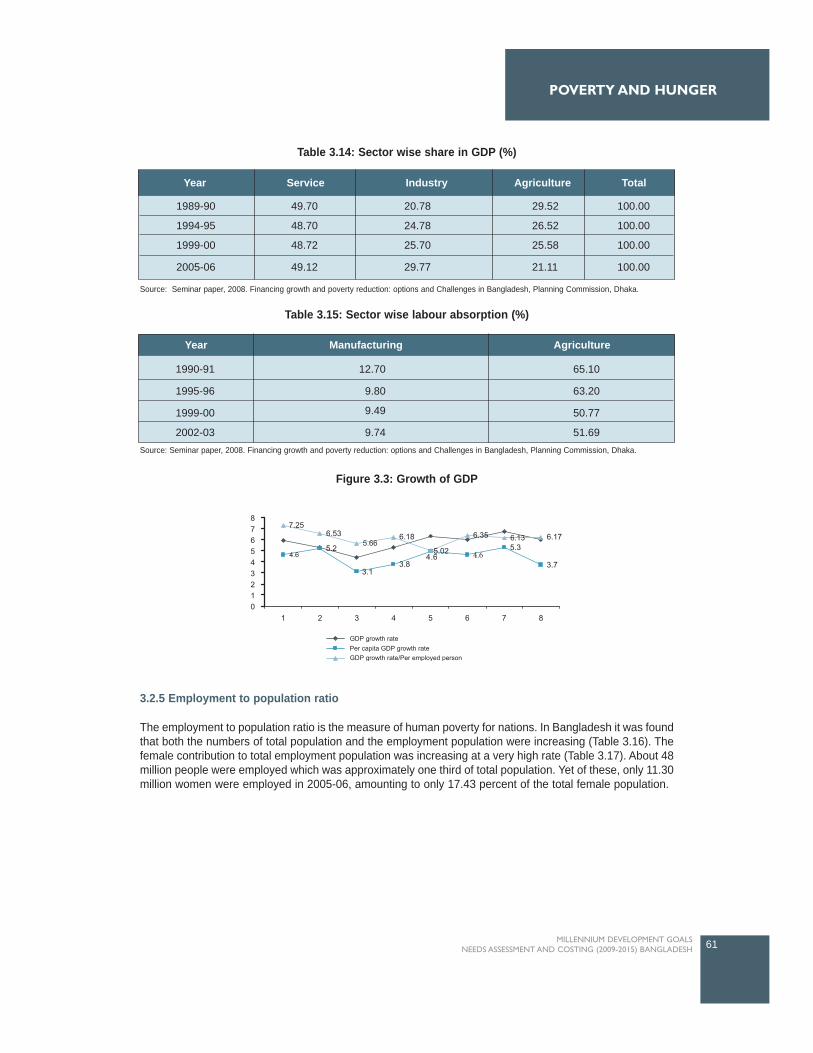
3.2.5 Employment to population ratio
The employment to population ratio is the measure of human poverty for nations. In Bangladesh it was foundthat both the numbers of total population and the employment population were increasing (Table 3.16). Thefemale contribution to total employment population was increasing at a very high rate (Table 3.17). About 48million people were employed which was approximately one third of total population. Yet of these, only 11.30million women were employed in 2005-06, amounting to only 17.43 percent of the total female population.
61MILLENNIUM DEVELOPMENT GOALS NEEDS ASSESSMENT AND COSTING (2009-2015) BANGLADESH
POVERTY AND HUNGER
Table 3.14: Sector wise share in GDP (%)
Figure 3.3: Growth of GDP
Table 3.15: Sector wise labour absorption (%)
Source: Seminar paper, 2008. Financing growth and poverty reduction: options and Challenges in Bangladesh, Planning Commission, Dhaka.
Source: Seminar paper, 2008. Financing growth and poverty reduction: options and Challenges in Bangladesh, Planning Commission, Dhaka.
1989-90 49.70 20.78 29.52 100.00
1994-95 48.70 24.78 26.52 100.00
1999-00 48.72 25.70 25.58 100.00
2005-06 49.12 29.77 21.11 100.00
Year Service Industry Agriculture Total
Year Manufacturing Agriculture
1990-91
1995-96
1999-00
2002-03
12.70
9.80
9.49
9.74
65.10
63.20
50.77
51.69
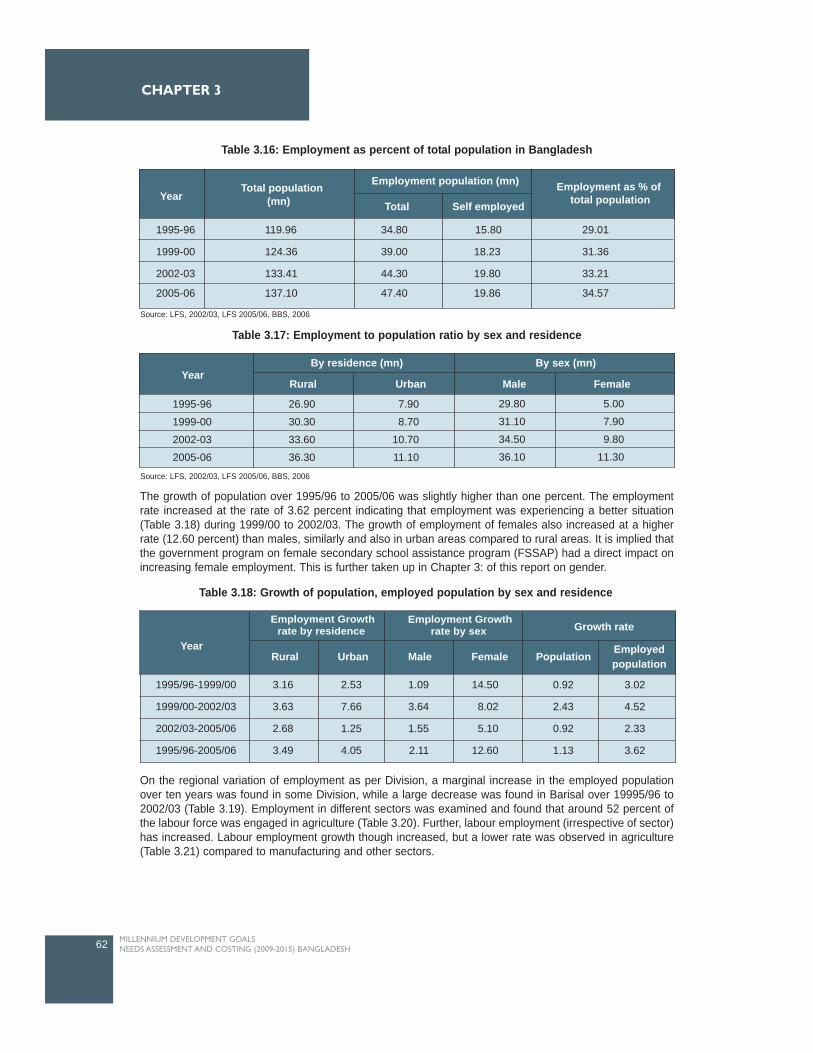
The growth of population over 1995/96 to 2005/06 was slightly higher than one percent. The employmentrate increased at the rate of 3.62 percent indicating that employment was experiencing a better situation(Table 3.18) during 1999/00 to 2002/03. The growth of employment of females also increased at a higherrate (12.60 percent) than males, similarly and also in urban areas compared to rural areas. It is implied thatthe government program on female secondary school assistance program (FSSAP) had a direct impact onincreasing female employment. This is further taken up in Chapter 3: of this report on gender.
On the regional variation of employment as per Division, a marginal increase in the employed populationover ten years was found in some Division, while a large decrease was found in Barisal over 19995/96 to2002/03 (Table 3.19). Employment in different sectors was examined and found that around 52 percent ofthe labour force was engaged in agriculture (Table 3.20). Further, labour employment (irrespective of sector)has increased. Labour employment growth though increased, but a lower rate was observed in agriculture(Table 3.21) compared to manufacturing and other sectors.
62 MILLENNIUM DEVELOPMENT GOALS NEEDS ASSESSMENT AND COSTING (2009-2015) BANGLADESH
CHAPTER 3
Table 3.16: Employment as percent of total population in Bangladesh
Table 3.17: Employment to population ratio by sex and residence
Table 3.18: Growth of population, employed population by sex and residence
Source: LFS, 2002/03, LFS 2005/06, BBS, 2006
Source: LFS, 2002/03, LFS 2005/06, BBS, 2006
Total population (mn)
Employment population (mn) Employment as % of total populationTotal Self employed
1995-96 119.96 34.80 15.80 29.01
1999-00 124.36 39.00 18.23 31.36
2002-03 133.41 44.30 19.80 33.21
2005-06 137.10 47.40 19.86 34.57
Year
Year By residence (mn) By sex (mn)
Rural Urban Male Female
5.00
7.90
9.80
11.30
29.80
31.10
34.50
36.10
7.90
8.70
10.70
11.10
26.90
30.30
33.60
36.30
1995-96
1999-00
2002-03
2005-06
Growth rate
Year
Employment Growthrate by residence
Employment Growthrate by sex
Rural Urban Male Female Population Employed population
1995/96-1999/00
1999/00-2002/03
2002/03-2005/06
1995/96-2005/06
3.16
3.63
2.68
3.49
2.53
7.66
1.25
4.05
1.09
3.64
1.55
2.11
14.50
8.02
5.10
12.60
0.92
2.43
0.92
1.13
3.02
4.52
2.33
3.62
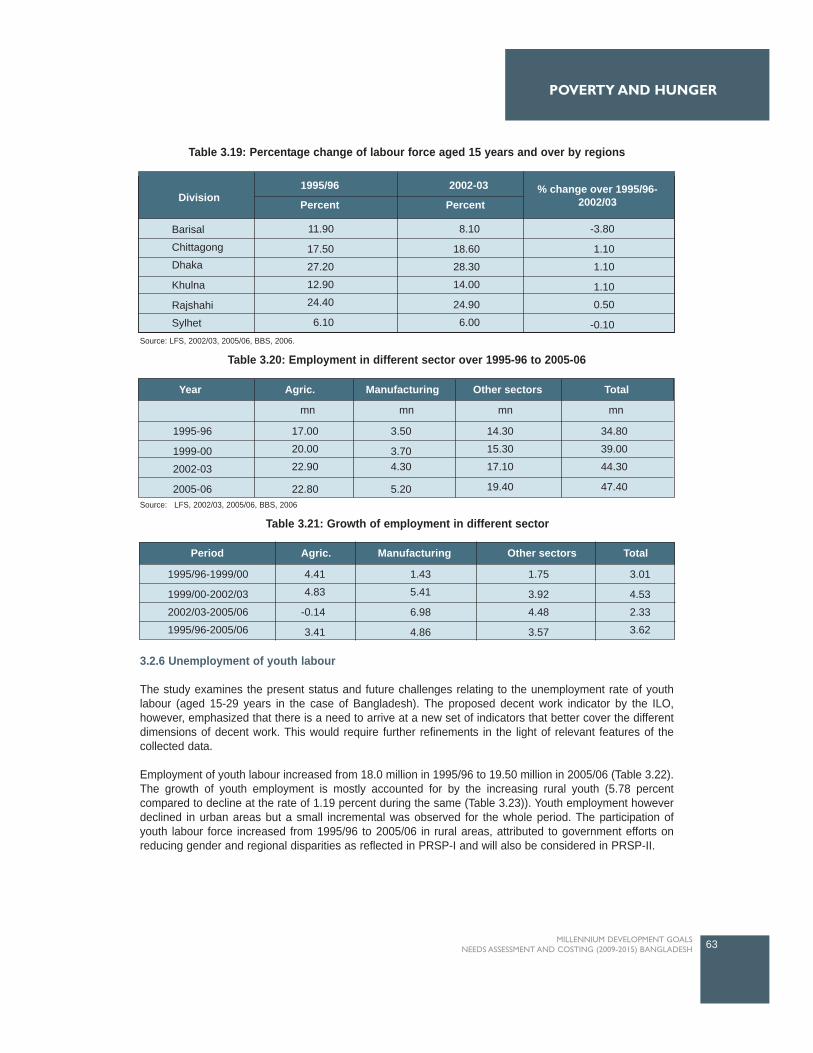
3.2.6 Unemployment of youth labour
The study examines the present status and future challenges relating to the unemployment rate of youthlabour (aged 15-29 years in the case of Bangladesh). The proposed decent work indicator by the ILO,however, emphasized that there is a need to arrive at a new set of indicators that better cover the differentdimensions of decent work. This would require further refinements in the light of relevant features of thecollected data.
Employment of youth labour increased from 18.0 million in 1995/96 to 19.50 million in 2005/06 (Table 3.22).The growth of youth employment is mostly accounted for by the increasing rural youth (5.78 percentcompared to decline at the rate of 1.19 percent during the same (Table 3.23)). Youth employment howeverdeclined in urban areas but a small incremental was observed for the whole period. The participation ofyouth labour force increased from 1995/96 to 2005/06 in rural areas, attributed to government efforts onreducing gender and regional disparities as reflected in PRSP-I and will also be considered in PRSP-II.
63MILLENNIUM DEVELOPMENT GOALS NEEDS ASSESSMENT AND COSTING (2009-2015) BANGLADESH
POVERTY AND HUNGER
Source: LFS, 2002/03, 2005/06, BBS, 2006.
Source: LFS, 2002/03, 2005/06, BBS, 2006
Table 3.19: Percentage change of labour force aged 15 years and over by regions
Table 3.20: Employment in different sector over 1995-96 to 2005-06
1995/96 2002-03Division
% change over 1995/96-2002/03Percent Percent
Barisal
Chittagong
Dhaka
Khulna
Rajshahi
Sylhet
11.90
17.50
27.20
12.90
24.40
6.10
8.10
18.60
28.30
14.00
24.90
6.00
-3.80
1.10
1.10
1.10
0.50
-0.10
1995-96
1999-00
2002-03
2005-06
17.00
20.00
22.90
22.80
3.50
3.704.30
5.20
14.30
15.30
17.10
19.40
34.80
39.00
44.30
47.40
mn
Agric.Year Manufacturing Other sectors Total
mn mn mn
Table 3.21: Growth of employment in different sector
Period Agric. Manufacturing Other sectors Total
1995/96-1999/00
1999/00-2002/03
2002/03-2005/06
1995/96-2005/06
4.41
4.83
-0.14
3.41
1.43
5.41
6.98
4.86
1.75
3.92
4.48
3.57
3.01
4.53
2.33
3.62
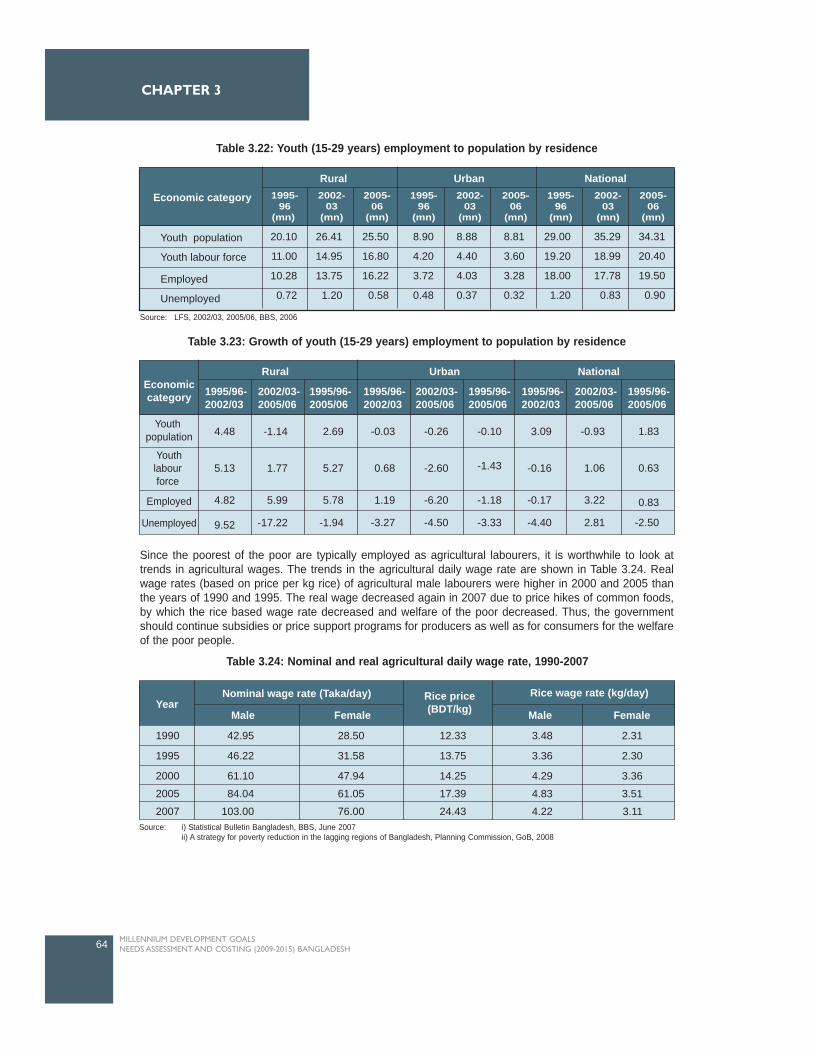
Since the poorest of the poor are typically employed as agricultural labourers, it is worthwhile to look attrends in agricultural wages. The trends in the agricultural daily wage rate are shown in Table 3.24. Realwage rates (based on price per kg rice) of agricultural male labourers were higher in 2000 and 2005 thanthe years of 1990 and 1995. The real wage decreased again in 2007 due to price hikes of common foods,by which the rice based wage rate decreased and welfare of the poor decreased. Thus, the governmentshould continue subsidies or price support programs for producers as well as for consumers for the welfareof the poor people.
64 MILLENNIUM DEVELOPMENT GOALS NEEDS ASSESSMENT AND COSTING (2009-2015) BANGLADESH
CHAPTER 3
Nominal wage rate (Taka/day) Rice price(BDT/kg)
Rice wage rate (kg/day)
Male Female Male FemaleYear
1990
1995
2000
2005
2007
42.95
46.22
61.10
84.04
103.00
28.50
31.58
47.94
61.05
76.00
12.33
13.75
14.25
17.39
24.43
3.48
3.36
4.29
4.83
4.22
2.31
2.30
3.36
3.51
3.11
Table 3.24: Nominal and real agricultural daily wage rate, 1990-2007
Source: i) Statistical Bulletin Bangladesh, BBS, June 2007ii) A strategy for poverty reduction in the lagging regions of Bangladesh, Planning Commission, GoB, 2008
Table 3.22: Youth (15-29 years) employment to population by residence
Table 3.23: Growth of youth (15-29 years) employment to population by residence
Source: LFS, 2002/03, 2005/06, BBS, 2006
Economic category
Rural Urban National1995-
96(mn)
2002-03
(mn)
2005-06
(mn)
1995-96
(mn)
2002-03
(mn)
2005-06
(mn)
1995-96
(mn)
2002-03
(mn)
2005-06
(mn)
Youth population
Youth labour force
Employed
Unemployed
20.10
11.00
10.28
0.72
26.41
14.95
13.75
1.20
25.50
16.80
16.22
0.58
8.90
4.20
3.72
0.48
8.88
4.40
4.03
0.37
8.81
3.60
3.28
0.32
29.00
19.20
18.00
1.20
35.29
18.99
17.78
0.83
34.31
20.40
19.50
0.90
Economiccategory
Rural Urban National
1995/96-2002/03
2002/03-2005/06
1995/96-2005/06
1995/96-2002/03
2002/03-2005/06
1995/96-2005/06
1995/96-2002/03
2002/03-2005/06
1995/96-2005/06
Youth population
Youthlabour force
Employed
Unemployed
4.48
5.13
4.82
9.52
-1.14
1.77
5.99
-17.22
2.69
5.27
5.78
-1.94
-0.03
0.68
1.19
-3.27
-0.26
-2.60
-6.20
-4.50
-0.10
-1.43
-1.18
-3.33
3.09
-0.16
-0.17
-4.40
-0.93
1.06
3.22
2.81
1.83
0.63
0.83
-2.50
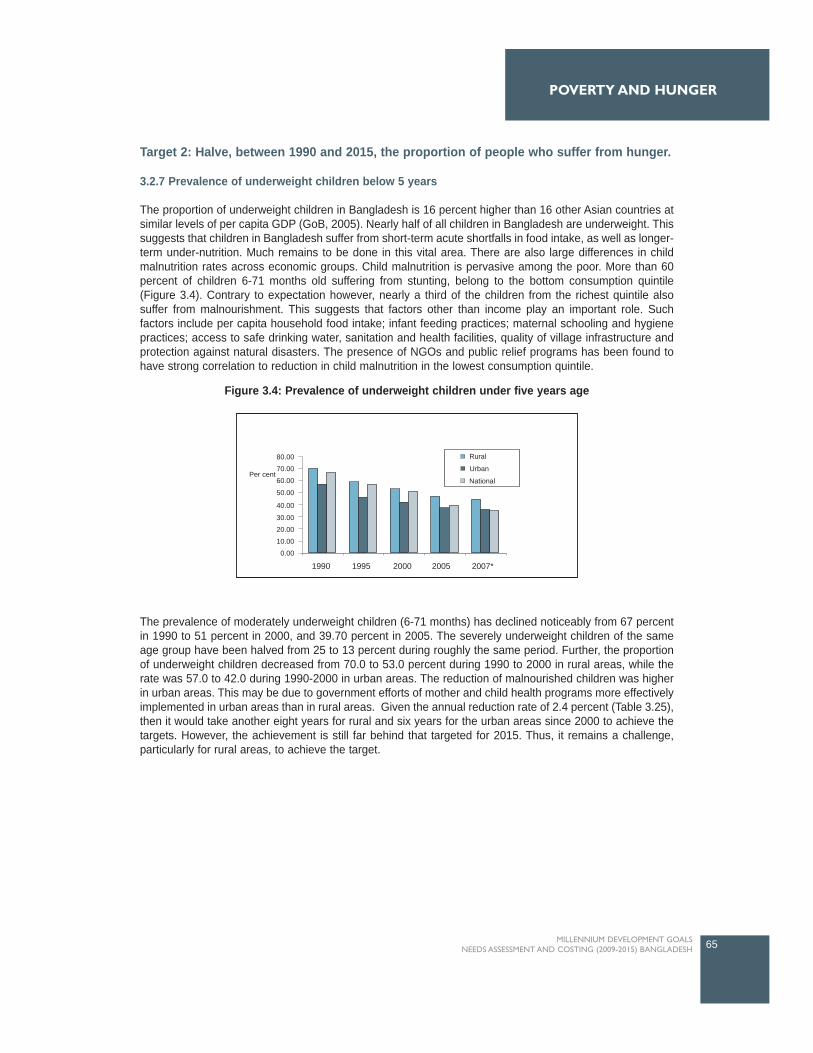
Target 2: Halve, between 1990 and 2015, the proportion of people who suffer from hunger.
3.2.7 Prevalence of underweight children below 5 years
The proportion of underweight children in Bangladesh is 16 percent higher than 16 other Asian countries atsimilar levels of per capita GDP (GoB, 2005). Nearly half of all children in Bangladesh are underweight. Thissuggests that children in Bangladesh suffer from short-term acute shortfalls in food intake, as well as longer-term under-nutrition. Much remains to be done in this vital area. There are also large differences in childmalnutrition rates across economic groups. Child malnutrition is pervasive among the poor. More than 60percent of children 6-71 months old suffering from stunting, belong to the bottom consumption quintile(Figure 3.4). Contrary to expectation however, nearly a third of the children from the richest quintile alsosuffer from malnourishment. This suggests that factors other than income play an important role. Suchfactors include per capita household food intake; infant feeding practices; maternal schooling and hygienepractices; access to safe drinking water, sanitation and health facilities, quality of village infrastructure andprotection against natural disasters. The presence of NGOs and public relief programs has been found tohave strong correlation to reduction in child malnutrition in the lowest consumption quintile.
The prevalence of moderately underweight children (6-71 months) has declined noticeably from 67 percentin 1990 to 51 percent in 2000, and 39.70 percent in 2005. The severely underweight children of the sameage group have been halved from 25 to 13 percent during roughly the same period. Further, the proportionof underweight children decreased from 70.0 to 53.0 percent during 1990 to 2000 in rural areas, while therate was 57.0 to 42.0 during 1990-2000 in urban areas. The reduction of malnourished children was higherin urban areas. This may be due to government efforts of mother and child health programs more effectivelyimplemented in urban areas than in rural areas. Given the annual reduction rate of 2.4 percent (Table 3.25),then it would take another eight years for rural and six years for the urban areas since 2000 to achieve thetargets. However, the achievement is still far behind that targeted for 2015. Thus, it remains a challenge,particularly for rural areas, to achieve the target.
65MILLENNIUM DEVELOPMENT GOALS NEEDS ASSESSMENT AND COSTING (2009-2015) BANGLADESH
POVERTY AND HUNGER
1990 1995 2000 2005 2007*
80.00
70.00
60.00Per cent
50.00
40.00
30.00
20.00
10.00
0.00
Rural
Urban
National
Figure 3.4: Prevalence of underweight children under five years age

3.2.8 Population below minimum level of dietary energy consumption
The number of people falling below the hardcore poverty mark (consume 1805Kcal/day) is shown in Table3.28. It is found that the population below the hardcore decreased from 28.3 million in 1990 to 17.6 in 2007.The population below the hard core poverty mark was 24.6 million and 20.0 million respectively in 1995 and2000 which clearly demonstrates a sharp decrease. At the existing rate of reduction (Table 3.26) the statusof progress is 'Off-track' for absolute poverty in both urban and rural areas, and 'Off-track' for hard corepoverty in rural areas.
66 MILLENNIUM DEVELOPMENT GOALS NEEDS ASSESSMENT AND COSTING (2009-2015) BANGLADESH
CHAPTER 3
Year
National Rural Urban National Rural Urban
Absolute poverty
(2122 Kcal/person/day) (1805 Kcal/person/day)
Hard core poverty
Rate of reduction During 200-2005
Required yrs toachieve target at theabove reduction rate
Status of progress
1990
19952000
2005
2007*2015
47.50
47.5044.30
40.40
36.80
23.80
1.00
16.66
Off-track
47.60
47.1042.30
39.50
36.80
23.80
1.34
13.83
Off-track
46.70
49.70
52.5043.20
36.10
23.30
0.50
39.80
Off-track
28.30
24.60
20.00
17.9017.60
14.20
2.15
1.50
On-track
26.30
27.30
18.7024.40
24.20
14.10
0.48
21.38
Off-track
28.00
25.10
25.00
19.5019.30
13.20
2.03
3.11
On-track
Table 3.26: Proportion of population below minimum level of dietary energy consumption(DCI method in mn)
Note: *- Calculated by extrapolationSource: i) A future within the reach 2005. Reshaping institutions in a region of disparities to meet the MDGs in Asia and the Pacific, UNDP
ii) Mid-term progress report of MDG, 2007.
Note: *- Calculated by extrapolationSource: i) BBS, 2006 ii) HIES, 2005.
Year Rural Urban National
1990
1995
2000
2005
2007*
2015
70.00
59.00
53.00
47.00*
44.60
35.00
2.43
7.82
57.00
46.00
42.00
38.00*
36.40
29.00
2.63
5.42
67.00
57.00
51.00
39.70
35.20
33.00
2.39
7.40
Annual reduction rate(%) during 1990-2000Time required (yr.) in existinggrowth rate since 2000
Table 3.25: Prevalence (%) of underweight children under five years of age
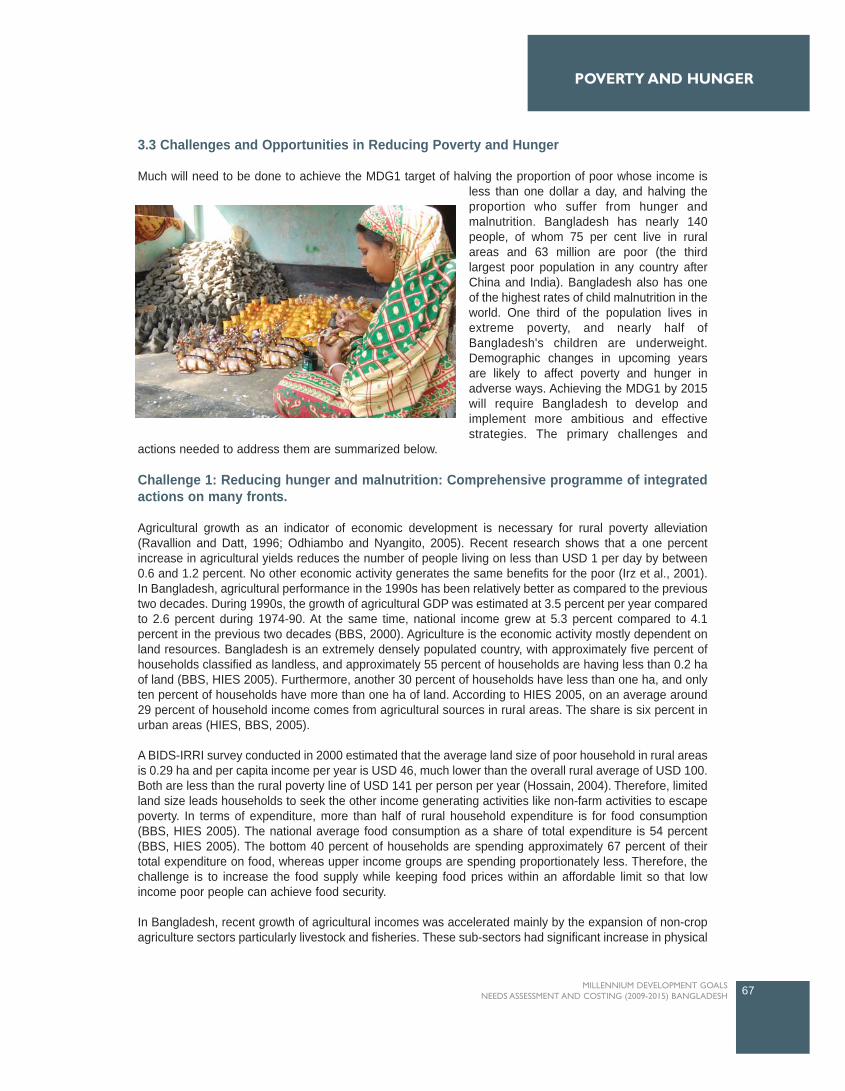
3.3 Challenges and Opportunities in Reducing Poverty and Hunger
Much will need to be done to achieve the MDG1 target of halving the proportion of poor whose income is
less than one dollar a day, and halving the
proportion who suffer from hunger and
malnutrition. Bangladesh has nearly 140
people, of whom 75 per cent live in rural
areas and 63 million are poor (the third
largest poor population in any country after
China and India). Bangladesh also has one
of the highest rates of child malnutrition in the
world. One third of the population lives in
extreme poverty, and nearly half of
Bangladesh's children are underweight.
Demographic changes in upcoming years
are likely to affect poverty and hunger in
adverse ways. Achieving the MDG1 by 2015
will require Bangladesh to develop and
implement more ambitious and effective
strategies. The primary challenges and
actions needed to address them are summarized below.
Challenge 1: Reducing hunger and malnutrition: Comprehensive programme of integrated
actions on many fronts.
Agricultural growth as an indicator of economic development is necessary for rural poverty alleviation
(Ravallion and Datt, 1996; Odhiambo and Nyangito, 2005). Recent research shows that a one percent
increase in agricultural yields reduces the number of people living on less than USD 1 per day by between
0.6 and 1.2 percent. No other economic activity generates the same benefits for the poor (Irz et al., 2001).
In Bangladesh, agricultural performance in the 1990s has been relatively better as compared to the previous
two decades. During 1990s, the growth of agricultural GDP was estimated at 3.5 percent per year compared
to 2.6 percent during 1974-90. At the same time, national income grew at 5.3 percent compared to 4.1
percent in the previous two decades (BBS, 2000). Agriculture is the economic activity mostly dependent on
land resources. Bangladesh is an extremely densely populated country, with approximately five percent of
households classified as landless, and approximately 55 percent of households are having less than 0.2 ha
of land (BBS, HIES 2005). Furthermore, another 30 percent of households have less than one ha, and only
ten percent of households have more than one ha of land. According to HIES 2005, on an average around
29 percent of household income comes from agricultural sources in rural areas. The share is six percent in
urban areas (HIES, BBS, 2005).
A BIDS-IRRI survey conducted in 2000 estimated that the average land size of poor household in rural areas
is 0.29 ha and per capita income per year is USD 46, much lower than the overall rural average of USD 100.
Both are less than the rural poverty line of USD 141 per person per year (Hossain, 2004). Therefore, limited
land size leads households to seek the other income generating activities like non-farm activities to escape
poverty. In terms of expenditure, more than half of rural household expenditure is for food consumption
(BBS, HIES 2005). The national average food consumption as a share of total expenditure is 54 percent
(BBS, HIES 2005). The bottom 40 percent of households are spending approximately 67 percent of their
total expenditure on food, whereas upper income groups are spending proportionately less. Therefore, the
challenge is to increase the food supply while keeping food prices within an affordable limit so that low
income poor people can achieve food security.
In Bangladesh, recent growth of agricultural incomes was accelerated mainly by the expansion of non-crop
agriculture sectors particularly livestock and fisheries. These sub-sectors had significant increase in physical
67MILLENNIUM DEVELOPMENT GOALS
NEEDS ASSESSMENT AND COSTING (2009-2015) BANGLADESH
POVERTY AND HUNGER
output, as well as favorable prices compared to the crop sector. Thus, agriculture has become much morediversified than it was at the time of independence (Ahmed and Chowdhury, 2000).
Privatization of minor irrigation systems and a reduction in import duties helped to adopt modern variety ricein the 1990s, and the upper 50 percent households have directly benefited in the form of increased yields,reduction in per unit cost, and average farm incomes (Hossain et al., 2003). On the other hand the increasedproductivity leads to reduced output market prices which have caused limited income gains for producers.Although not highly profitable, indirectly there have been positive impacts to the both poor and richhouseholds in the form of reduced real prices of rice, improved food security and reduced vulnerability.Further, the rice equivalent wage has increased about 4.8 percent per year from 1987-2000 (Hossain et al.,2003).
The development of agriculture also contributed to reductions in poverty in an indirect way. The expansionof non-farm sector (which is vertically integrated with agriculture) has also been contributing to increases inthe income of poor households. Infrastructural development with roads and transportation system have alsocreated employment opportunities in transporting surplus agricultural produces from rural to urban areas aswell as trading with rice, vegetables, fruits etc. Many NGOs are supporting marginal and landless farmers togenerate income through raising livestock, poultry, and small trading by providing logistic and micro-creditsupport.
Improvement of the growth performance of the agriculture sector with various sub-sectors calls for acomprehensive multi-sectoral approach to address all aspects of agricultural production focusing on foodproduction (cereals and non-cereals), food security, employment, and income generating activities (IGAs).Bangladesh faces tremendous challenges in doing this. Some of the important challenges are as follows:
In the face of decreasing farm sizes, degrading soil quality and limited water resources, the mainchallenge for the country is to maximize production in order to improve food availability fromdomestic sources;With the present production technology package approaching a limit, one major challenge is toharness productivity gains by making breakthroughs in yield frontier technology (i.e.,hybrids/crossbreds, biotechnology, genetic engineering in crop, livestock, fisheries and forestry); Against the backdrop of decreasing water resources and increasing irrigation costs due to risingfuel/energy prices, an emerging challenge is to improve water use efficiency in rice production andto shift to water-efficient food crops;The growing competition in global markets due to trade liberalization has, without doubt, createdopportunities as well as constraints for Bangladeshi small holders (in horticulture, dairy, poultry,shrimp, fish and wood products) who account for four-fifths of all farm holdings. They have to begiven effective support to allow a level playing field for them to compete with others, and to reapthe benefits of a globalized world;With 63.0 million people living below the poverty line, Bangladesh has a formidable challenge tostrike a balance between ensuring adequate incentives for the numerous small producers (rice,poultry, dairy, fish, nursery etc.) on the one hand and keeping food prices low for poor consumerson the other;With economic growth, income inequality in rural areas is also on the rise, which brings forth achallenge to escalate income generating programmes and accelerate poverty reduction in ruralareas;While there has been an overall improvement in food availability at the household level, intra-household food entitlements between men and women (especially lactating women), and betweenadults and children remains an issue to be addressed; The already vulnerable food security situation worsens when food production (crops, livestock andfisheries) drops due to natural disasters. This means that the country needs to bolster its capacityin agriculture production to guarantee food security, especially in vulnerable disaster-prone areas;With the increase in population, increases in the production of fish, milk, meat and eggs, and self-employment of fishermen and livestock-rearing farmers are important to supply balanced food fora growing population, possibly through encouraging small holders and private sector promotion inpoultry, dairy and fisheries sub-sectors;
68 MILLENNIUM DEVELOPMENT GOALS NEEDS ASSESSMENT AND COSTING (2009-2015) BANGLADESH
CHAPTER 3
Coping with the effects of climate change, maintaining ecological balance and conservingbiodiversity for the growing population is a key challenge for Bangladesh;To meet these challenges, the overriding task is to mobilize resources for the agriculture sectorincluding adequate financial support from internal and external sources, and to strengthencooperation between countries in the region in the fields of science, technology and knowledgesharing.
Challenge 2: Youth unemployment
The challenge in the case of youth labour (which is likely to reach a level of nearly 30 million in 2015), is tocreate employment at a much faster rate compared with other segments of the labour force. For example, ifthe target is to reduce the youth unemployment rate to the same growth rate of labour force in 2015, thenBangladesh will have to generate more than 11 million jobs specifically for the youth population.
There are two important issues to be considered here. First, the problem of unemployment mostly affectsyouth labour in Bangladesh. The economy therefore needs to accelerate the generation of employmentopportunities for the youth. Second, the large majority of the educated youth remain unemployed due to amismatch between supply and demand in the labour market, inappropriate and inadequate skills, and theslow pace of job creation, particularly in the formal sector. In order to meet the challenge of the growing youthlabour market, Bangladesh will need to rapidly expand the productive and skill-intensive formal and informalsectors. Reforms in the education sector to match these emerging priority demands of the labour market isdesirable.
Global partnerships can contribute by providing new formats and strategic directions in creating decent andproductive employment for youth. Although domestic investment is the main driver of growth and foreigndirect investment (FDI) flows are yet to rise rapidly in Bangladesh, development dimensions of the youth canbe made an integral part of the country's FDI policy through global partnerships in transferring technology,upgrading skills and management capabilities of the youth labour force in ways that not only attract moreFDI but that also support higher productivity.
Challenge 3: Protecting the vulnerable: Supporting effective and sustainable safety netprogrammes for the vulnerable in poor areas
The persistence of disparities in poverty and hunger warrants the evaluation of social safety net options thattarget particular groups and areas. Some groups of the poor and hungry are chronically vulnerable, andsome face vulnerabilities that are regional or seasonal in nature. Targeted interventions need to be designedand prioritized taking into account their financial sustainability and the country's other demands for pro-poorspending. Tradeoffs between reaching the poorest and the not-so-poor, and the distinctions between short-term palliatives and long-term measures to enhance the prospects for poverty reduction, must berecognized.
Types of targeted interventions that should be introduced include:Identifying and promoting infrastructure investment projects with high expected impacts onemployment, growth, and market access in poor (especially rural) areas.Supporting safety nets for protection against natural disasters and the associated hardships indisaster-prone areas.
Challenge 4: Reaching the poor: Promoting pro-poor growth
The initial level of inequality of income and ownership of assets and its possible further deterioration willdetermine the poverty outcome. Pro-poor growth, therefore, needs to be promoted so that the positiveimpact of economic growth on poverty reduction is increasingly larger than the adverse impact of income
69MILLENNIUM DEVELOPMENT GOALS NEEDS ASSESSMENT AND COSTING (2009-2015) BANGLADESH
POVERTY AND HUNGER
inequality, and the poor are able to participate more actively in the growth process and derive increasinglyhigher benefits from it. The creation of more jobs and opportunities for entrepreneurship and selfemployment by the poor will need to be speeded up aggressively, so as to address the massive backlog ofunderemployment, as well as the large annual addition to the labour force on account of demographicfactors. Income growth in rural areas has proven to be pro-poor in Bangladesh, and its continuation will needto be promoted proactively. Pro-poor policy reforms are suggested, and the coordinated actions will berequired in areas such as:
Building the income-generating capacities of the poor by pursuing social sector programmes andpolicies that develop their human capital. This should include improving poor people's access to theessential health service packages (ESP), addressing the problem of child malnutrition, andundertaking a comprehensive programme to improve the coverage and quality of education andskill development. These are covered in later section on health and education.Enabling the poor to participate more actively in economic activities through initiatives to facilitatetheir access to markets for credit, land, and labour.Enhancing cooperation and partnership among Government, the private sector, and civil society inscaled-up efforts to implement the PRSP.
Challenge 5: Expansion of rural infrastructure to ensure access to health and modernfacilities, and also to strengthen the rural-urban market linkages by the poor
Upgrading and construction of paved secondary or district roads. Upgrading and construction of small paved roads connecting villages and farmers to the nearestdistrict road.Extension and improvement of footpaths connecting individual rural farmers to feeder roads.Institutional structure and funding arrangements for adequate road maintenance.Investments in supply and distribution systems for bicycles and motorized vehicles.Deregulation of transport market to increase competition. Support to small-scale transport entrepreneurs to reduce barriers to market entry.
Challenge 6: Creation of job opportunities to the urban poor
The urban population and the urban labour force experiences accelerated growth due to natural increases,rural-urban migration, and the reclassification of rural as urban areas. As the large majority of the urbanlabour force will belong to the youth labour category, the formal sector will be required to provideemployment to a progressively larger segment of the youth labour force. This has direct implications forensuring decent work to meet the dual role of employment in terms of both generating income and fulfillingthe individual's social functions. In the situation analysis it was found that the urban poor were worse off thanthe rural poor. Thus, there remains a challenge to create job opportunities for the urban poor.
3.4 Major Interventions and Targets for MDG1
3.4.1 Agriculture and Rural Development
Agriculture has been and will continue to be the life line of the Bangladesh economy representing about 21percent of total GDP. Agriculture continues to be the most important sector in a sense that it plays significantrole in the production of food, employment and income in the rural areas for improving the well-being of thepoor. As one of the largest private enterprises, crop production contributes about 12 percent to the GDP(MOF, 2007) and is a major supplier of raw materials in agro-based industries.
The agriculture sector is the sum of crops, forests, fisheries and livestock where only crop sub-sectorcontributes 71 percent of the total agricultural GDP (MOF, 2007). In terms of contribution to country's GDP,within the broad agriculture sector, the contribution of agriculture and forestry and fisheries are estimated at
70 MILLENNIUM DEVELOPMENT GOALS NEEDS ASSESSMENT AND COSTING (2009-2015) BANGLADESH
CHAPTER 3
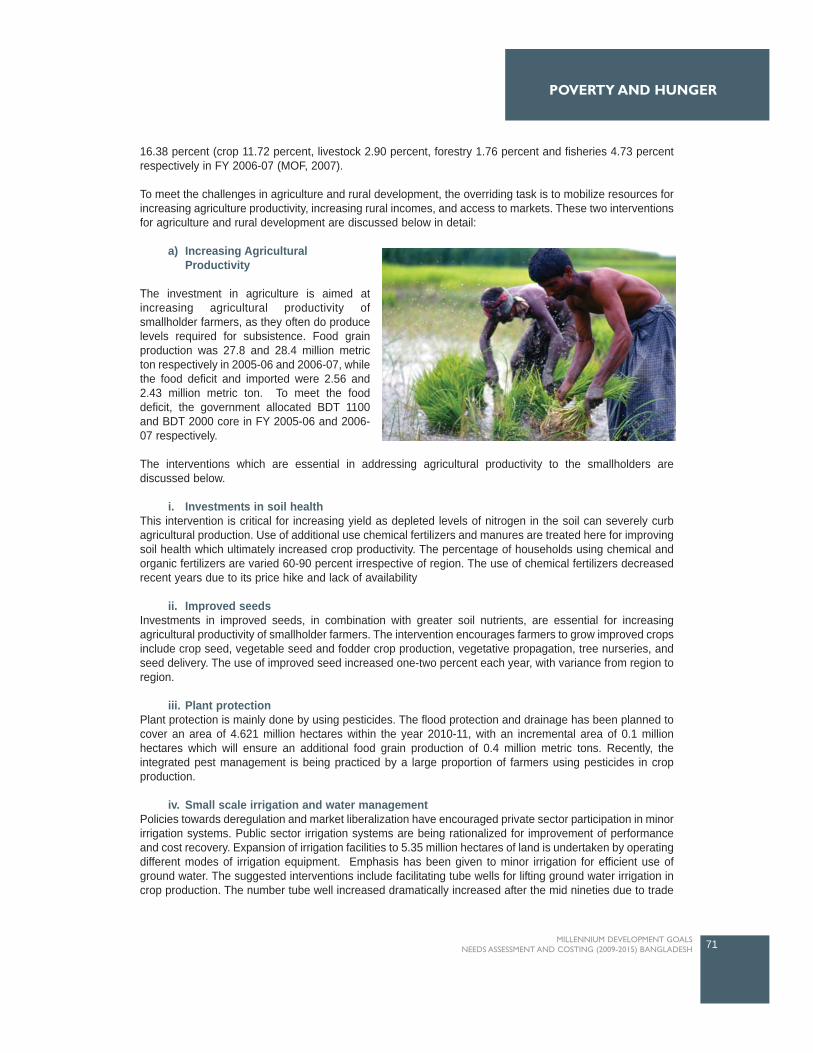
16.38 percent (crop 11.72 percent, livestock 2.90 percent, forestry 1.76 percent and fisheries 4.73 percentrespectively in FY 2006-07 (MOF, 2007).
To meet the challenges in agriculture and rural development, the overriding task is to mobilize resources forincreasing agriculture productivity, increasing rural incomes, and access to markets. These two interventionsfor agriculture and rural development are discussed below in detail:
a) Increasing AgriculturalProductivity
The investment in agriculture is aimed atincreasing agricultural productivity ofsmallholder farmers, as they often do producelevels required for subsistence. Food grainproduction was 27.8 and 28.4 million metricton respectively in 2005-06 and 2006-07, whilethe food deficit and imported were 2.56 and2.43 million metric ton. To meet the fooddeficit, the government allocated BDT 1100and BDT 2000 core in FY 2005-06 and 2006-07 respectively.
The interventions which are essential in addressing agricultural productivity to the smallholders arediscussed below.
i. Investments in soil healthThis intervention is critical for increasing yield as depleted levels of nitrogen in the soil can severely curbagricultural production. Use of additional use chemical fertilizers and manures are treated here for improvingsoil health which ultimately increased crop productivity. The percentage of households using chemical andorganic fertilizers are varied 60-90 percent irrespective of region. The use of chemical fertilizers decreasedrecent years due to its price hike and lack of availability
ii. Improved seedsInvestments in improved seeds, in combination with greater soil nutrients, are essential for increasingagricultural productivity of smallholder farmers. The intervention encourages farmers to grow improved cropsinclude crop seed, vegetable seed and fodder crop production, vegetative propagation, tree nurseries, andseed delivery. The use of improved seed increased one-two percent each year, with variance from region toregion.
iii. Plant protection Plant protection is mainly done by using pesticides. The flood protection and drainage has been planned tocover an area of 4.621 million hectares within the year 2010-11, with an incremental area of 0.1 millionhectares which will ensure an additional food grain production of 0.4 million metric tons. Recently, theintegrated pest management is being practiced by a large proportion of farmers using pesticides in cropproduction.
iv. Small scale irrigation and water managementPolicies towards deregulation and market liberalization have encouraged private sector participation in minorirrigation systems. Public sector irrigation systems are being rationalized for improvement of performanceand cost recovery. Expansion of irrigation facilities to 5.35 million hectares of land is undertaken by operatingdifferent modes of irrigation equipment. Emphasis has been given to minor irrigation for efficient use ofground water. The suggested interventions include facilitating tube wells for lifting ground water irrigation incrop production. The number tube well increased dramatically increased after the mid nineties due to trade
71MILLENNIUM DEVELOPMENT GOALS NEEDS ASSESSMENT AND COSTING (2009-2015) BANGLADESH
POVERTY AND HUNGER
liberalization and it is expected that the number will be 400,000 to 450,000 during 2009-20015 while thenumber of pumps will be decreased from 25,000 to 20,000 during 2009-2015.
v. Agricultural researchAlong with production and delivery, research is also an important component of supplying farmers withimproved seeds. The UN Millennium Project recommends allocating around two percent of agricultural GDPfor agricultural research. In Bangladesh, currently, this amounts to around two percent of agricultural GDPand expected to increase three percent by 2015. The agricultural research institutions are BRRI, BARI, BJRI,BLRI, BFRI, BSRI, BTRI, BFRI with coordination by BARC.
vi. Extension services of DAE, DLS and DoFIncreasing agricultural productivity depends on a strong extension system that is participatory and reachesup-to-date knowledge of soil health, small-scale water management, improved seeds, high value nicheproducts and other ecologically sound products. Extension services in the country are supported by DAE,DLS and DoF. About 24,000 extension workers are working on best practice production methods, tools anddemonstration plots, among others. The livestock and fisheries services especially, need strengthening interms of manpower, resources and policy support. These two sectors have only 12,000 extension workers,and need to be increased. Emphasis will be given to facilitate partnership of DAE, DLS, DoF and BRDBcooperatives with the private sector and NGOs, and which have developed many successful approaches todisseminating promising technologies. DLS is also trying to increase livestock production by delivering bestpractices of updated knowledge to farmers. Farmers are also very much aware about the best methods ofproduction required to produce different species of livestock and poultry. Similarly, the DoF is supplying thedelivery and services of best practicess for production of different species of fish.
vii.Subsidy in agricultureBangladesh has increased subsidies for agricultural inputs. Indeed, the main challenge for the Governmentis to maintain the right type and mix of support programmes and to prioritize the implementation strategy, sothat the support package may contribute to productivity gains as well as benefit poor farmers most. At thismoment, about BDT 45 billion is used to subsidize fertilizers while diesel costs are also subsidized by thegovernment (cost of BDT 2.50 billion in 2007-08). The pump owners rebate 20 percent of electricity bills forirrigation purposes. It is expected that the subsidization policy will not be increased due to budgetaryconstraints, but efficient delivery and coverage from 70 percent to 100 percent smallholders are targeted.
The Millennium Project developed costing model was used to calculate the costs of farm, community andnational-level interventions in the agricultural sector, as well as the cost of roads and infrastructure using theExcel spreadsheets.
In some cases, the current coverage data was not available. In these cases, they have been considered withsome previous micro level studies and/or through the key informant discussions and interviews in additionto the discussions in the Thematic Working Group (TWG) members (Table 3.27).
72 MILLENNIUM DEVELOPMENT GOALS NEEDS ASSESSMENT AND COSTING (2009-2015) BANGLADESH
CHAPTER 3

b) Rural incomes and access to markets
In addition to increasing agriculture productivity, improved access to credit, storage facilities, processing, andvalue added technologies can help raise incomes. Access to markets, farmer cooperatives/associations, andphysical market spaces are also beneficial. Interventions to increase rural incomes and access to marketsare discussed below:
i. Building storage facilities to reduce post-harvest lossesPromoting farmers associations and cooperatives to improve economies of scale and bargaining. Promotingvalue added food processing for smallholders is also important for access to fair prices to the farmers. About4 percent of the total households are using the existing 2700 storage facilities especially for cold storagewhere one storage facility is used on an average by 300 households. It is expected that the storage facilities'usage will increase by 10 percent and while on an average 200 households will use each storage facility thatwill reduce post harvest losses and help in getting fair price to the farmers.
ii. Agro-processing ActivitiesAgri-business and agro-processing are given top priority as thrust sectors to promote value addition to crops,livestock, fish and horticultural products. Increased budgetary allocations will be made for supporting agro-processing activities, which remain predominantly in the private sector. The private sector will also getsupport for technical training, technology development, and improvement of hygienic standards, handlingand packaging of processed products. It is important to recognize that without compliance with internationalstandards for food safety, sanitary and phyto-sanitary measures, exports are unlikely to become significant.For agro-processing, the existing rice mills numbering 22,000 units have been considered with increasedcoverage from 90 to 100 percent by 2015.
73MILLENNIUM DEVELOPMENT GOALS NEEDS ASSESSMENT AND COSTING (2009-2015) BANGLADESH
POVERTY AND HUNGER
Table 3.27: Coverage target of farm interventions in Bangladesh agriculture
Source : BBS. 2006Note : na is not appropriate, many cases trends were taken into consideration
Divisions
ParametersChittagong Rajshahi Khulna Sylhet Barisal
Cover-age
Cover-age
Cover-age
Cover-age
Cover-age
Cover-age Target Target Target Target Target Target
Percent smallholder
Average farm size (ha)
Percent of rural population% of area under HYV rice % irrigated area
Averagecoverageand target
Dhaka
64.00
0.43
28.00
73.00
50.56
61.78
74.00
0.33
na
90.00
60.56
75.00
62.00
0.38
18.00
80.00
40.13
60.06
72.00
0.29
na
100.00
50.13
75.00
62.00
0.49
27.00
86.00
65.60
75.80
72.00
0.38
na
100.00
75.60
75.00
63.00
0.53
13.00
45.00
46.29
45.65
73.00
0.41
na
75.00
56.29
75.00
60.00
0.89
6.00
55.00
36.03
45.52
70.00
0.69
na
80.00
46.03
75.00
65.00
0.51
8.00
33.00
9.13
21.07
75.00
0.39
na
58.00
19.13
75.00
iii. Access to Micro CreditNGOs operate a large number of micro credit programmes which generate income and employment, andwhich directly reduce poverty among beneficiaries. As of December 2006, as many as 611 NGOs wereoperating micro-credit programmes with the total number of beneficiaries standing at approximately 30.8million, of whom 3.8 million were male and 26.9 million were female. Ventures like small poultry farms, seedproduction, processing and marketing, fruit orchard development, marketing of quality fruits, vegetableproduction and group marketing, shrimp hatcheries, fish farming, shrimp processing and marketing andprocessing of fruits at farm level (such as preparation of jam, jelly, chatny, dry vegetable etc.) can besupported through ensuring credit in agriculture sector in PRS II period for fostering the reduction of poverty.From FGD with civil society organizations, it is expected that the use of micro credit will shift from 48.0percent to 68.0 percent across the total number of rural households by 2015, by which agro-basedproduction and entrepreneurship should be developed.
3.4.2 Development of transport infrastructure
In PRSP-II, it is mentioned that the interventions on improving rural access would be directed at achievingthe target of reducing the proportion of the rural population living more than an hour's walk from the nearestroad to less than 20 percent. There are three main modes of transport in Bangladesh: road, rail andwaterways with an increasing emphasis on roads. Both the quality and quantity of the railways andwaterways has declined over recent decades.
The key challenge in the transport sector is to expand the country's relatively new and small roads network.The major interventions include the expansion of national, district and feeder roads (including bridges andculverts), where necessary. It is expected that interventions on roads and transports will increase access ofcommunities to socio-economic development, thus reducing poverty and facilitating the achievement ofMDG1. The government has recently placed increased emphasis on roads and transport. However, despiteinvestment in the system, the cost of transport, construction and maintenance remain high due totopographical obstacles such as the extensive river system, periodic flooding and poor soil conditions (BIDS,2004).
The development of the provisions for an efficient transport system facilitates generation of economies ofscale, expansion of competitive markets, reduction of transportation costs, urbanization and exports growthwhich will exert beneficial effects on the economy. The provisions of transport services improved significantlyin the past few years along with the construction of rural roads and key major highways. The developmentof the transport network and the provision of better services facilitate movement of raw materials and goodsfrom the place of origin to the place of destination at cheaper costs.
Status of transport sector in Bangladesh
Bangladesh witnessed rapid growth in the transportation sector since independence. The road network hasexpanded rapidly to 182,286 km, covering national and other categories of roads to provide nation widetransport services to all (Table 3.28). The 159,853 km of the road network in rural areas had significantimpact on ensuring affordable transport services in the rural sector and improving the living conditions of therural poor.
74 MILLENNIUM DEVELOPMENT GOALS NEEDS ASSESSMENT AND COSTING (2009-2015) BANGLADESH
CHAPTER 3
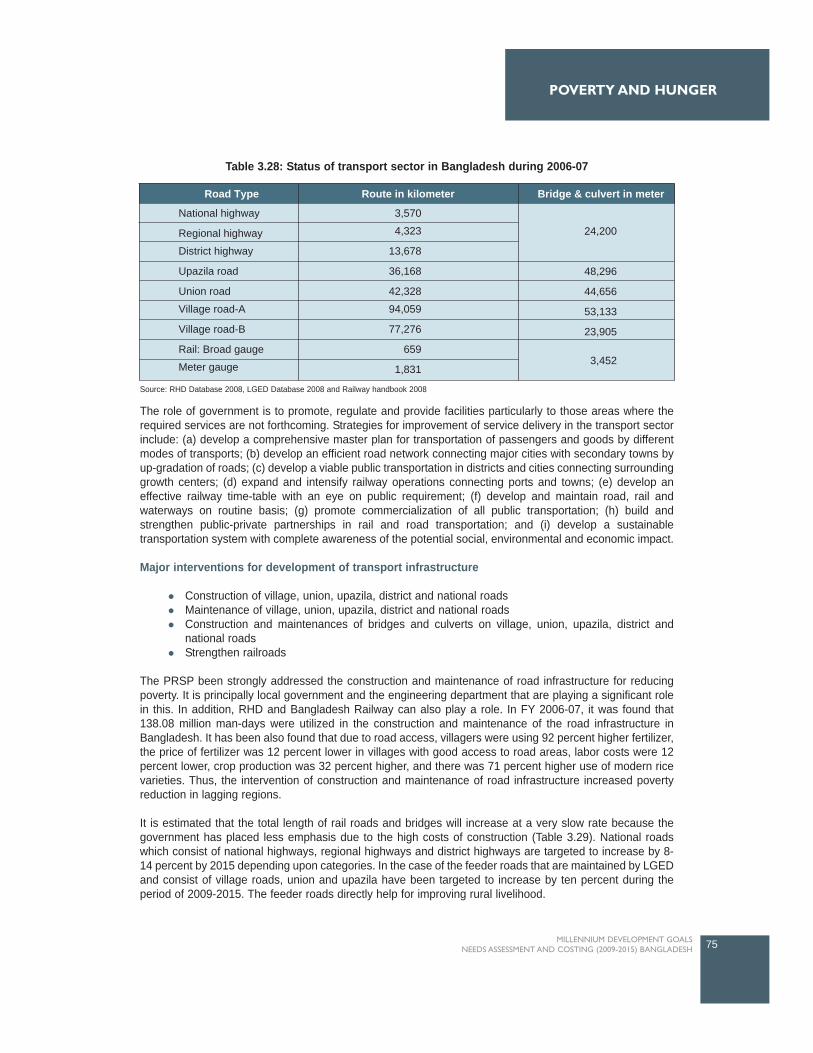
The role of government is to promote, regulate and provide facilities particularly to those areas where therequired services are not forthcoming. Strategies for improvement of service delivery in the transport sectorinclude: (a) develop a comprehensive master plan for transportation of passengers and goods by differentmodes of transports; (b) develop an efficient road network connecting major cities with secondary towns byup-gradation of roads; (c) develop a viable public transportation in districts and cities connecting surroundinggrowth centers; (d) expand and intensify railway operations connecting ports and towns; (e) develop aneffective railway time-table with an eye on public requirement; (f) develop and maintain road, rail andwaterways on routine basis; (g) promote commercialization of all public transportation; (h) build andstrengthen public-private partnerships in rail and road transportation; and (i) develop a sustainabletransportation system with complete awareness of the potential social, environmental and economic impact.
Major interventions for development of transport infrastructure
Construction of village, union, upazila, district and national roadsMaintenance of village, union, upazila, district and national roadsConstruction and maintenances of bridges and culverts on village, union, upazila, district andnational roadsStrengthen railroads
The PRSP been strongly addressed the construction and maintenance of road infrastructure for reducingpoverty. It is principally local government and the engineering department that are playing a significant rolein this. In addition, RHD and Bangladesh Railway can also play a role. In FY 2006-07, it was found that138.08 million man-days were utilized in the construction and maintenance of the road infrastructure inBangladesh. It has been also found that due to road access, villagers were using 92 percent higher fertilizer,the price of fertilizer was 12 percent lower in villages with good access to road areas, labor costs were 12percent lower, crop production was 32 percent higher, and there was 71 percent higher use of modern ricevarieties. Thus, the intervention of construction and maintenance of road infrastructure increased povertyreduction in lagging regions.
It is estimated that the total length of rail roads and bridges will increase at a very slow rate because thegovernment has placed less emphasis due to the high costs of construction (Table 3.29). National roadswhich consist of national highways, regional highways and district highways are targeted to increase by 8-14 percent by 2015 depending upon categories. In the case of the feeder roads that are maintained by LGEDand consist of village roads, union and upazila have been targeted to increase by ten percent during theperiod of 2009-2015. The feeder roads directly help for improving rural livelihood.
75MILLENNIUM DEVELOPMENT GOALS NEEDS ASSESSMENT AND COSTING (2009-2015) BANGLADESH
POVERTY AND HUNGER
Route in kilometerRoad Type
National highway
Regional highway
District highway
Upazila road
Union road
Village road-A
Village road-B
Rail: Broad gauge
Meter gauge
3,570
4,323
13,678
36,168
42,328
94,059
77,276
659
1,831
Bridge & culvert in meter
24,200
3,452
48,296
44,656
53,133
23,905
Table 3.28: Status of transport sector in Bangladesh during 2006-07
Source: RHD Database 2008, LGED Database 2008 and Railway handbook 2008
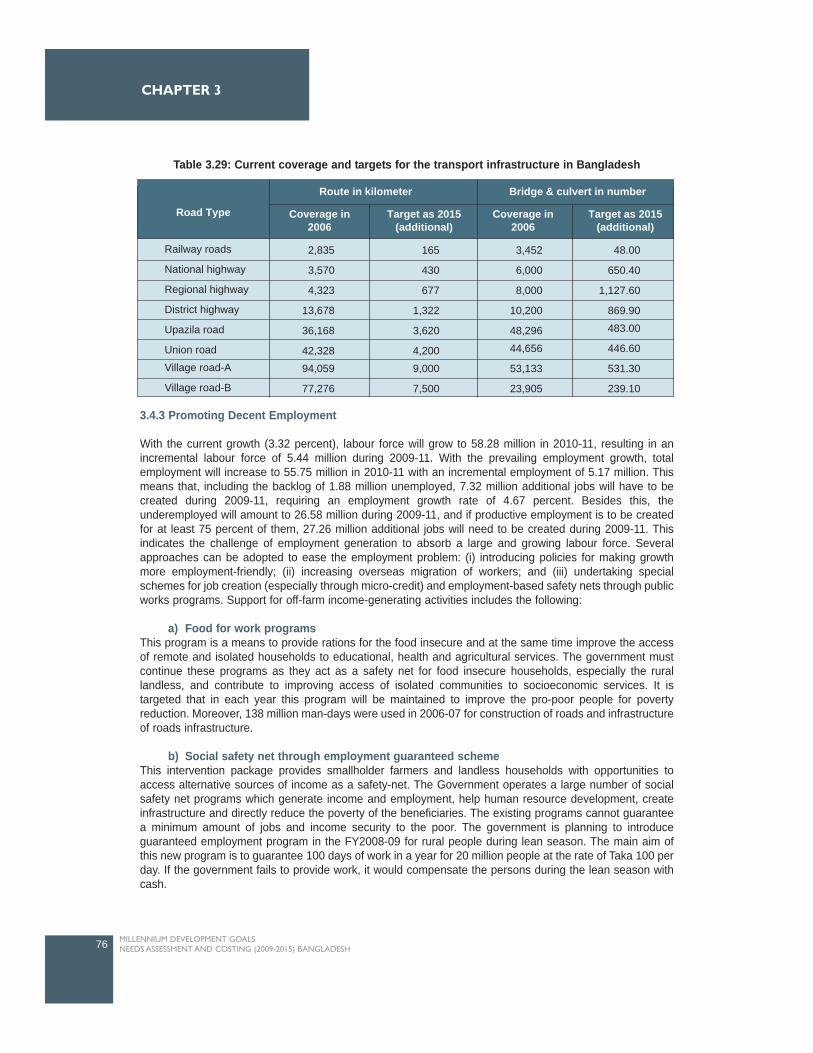
3.4.3 Promoting Decent Employment
With the current growth (3.32 percent), labour force will grow to 58.28 million in 2010-11, resulting in anincremental labour force of 5.44 million during 2009-11. With the prevailing employment growth, totalemployment will increase to 55.75 million in 2010-11 with an incremental employment of 5.17 million. Thismeans that, including the backlog of 1.88 million unemployed, 7.32 million additional jobs will have to becreated during 2009-11, requiring an employment growth rate of 4.67 percent. Besides this, theunderemployed will amount to 26.58 million during 2009-11, and if productive employment is to be createdfor at least 75 percent of them, 27.26 million additional jobs will need to be created during 2009-11. Thisindicates the challenge of employment generation to absorb a large and growing labour force. Severalapproaches can be adopted to ease the employment problem: (i) introducing policies for making growthmore employment-friendly; (ii) increasing overseas migration of workers; and (iii) undertaking specialschemes for job creation (especially through micro-credit) and employment-based safety nets through publicworks programs. Support for off-farm income-generating activities includes the following:
a) Food for work programsThis program is a means to provide rations for the food insecure and at the same time improve the accessof remote and isolated households to educational, health and agricultural services. The government mustcontinue these programs as they act as a safety net for food insecure households, especially the rurallandless, and contribute to improving access of isolated communities to socioeconomic services. It istargeted that in each year this program will be maintained to improve the pro-poor people for povertyreduction. Moreover, 138 million man-days were used in 2006-07 for construction of roads and infrastructureof roads infrastructure.
b) Social safety net through employment guaranteed schemeThis intervention package provides smallholder farmers and landless households with opportunities toaccess alternative sources of income as a safety-net. The Government operates a large number of socialsafety net programs which generate income and employment, help human resource development, createinfrastructure and directly reduce the poverty of the beneficiaries. The existing programs cannot guaranteea minimum amount of jobs and income security to the poor. The government is planning to introduceguaranteed employment program in the FY2008-09 for rural people during lean season. The main aim ofthis new program is to guarantee 100 days of work in a year for 20 million people at the rate of Taka 100 perday. If the government fails to provide work, it would compensate the persons during the lean season withcash.
76 MILLENNIUM DEVELOPMENT GOALS NEEDS ASSESSMENT AND COSTING (2009-2015) BANGLADESH
CHAPTER 3
Road Type
Route in kilometer
Coverage in2006
Target as 2015(additional)
Coverage in2006
Target as 2015(additional)
Bridge & culvert in number
Railway roads
National highway
Regional highway
District highway
Upazila road
Union road
Village road-A
Village road-B
2,835
3,570
4,323
13,678
36,168
42,328
94,059
77,276
165
430
677
1,322
3,620
4,200
9,000
7,500
3,452
6,000
8,000
10,200
48,296
44,656
53,133
23,905
48.00
650.40
1,127.60
869.90
483.00
446.60
531.30
239.10
Table 3.29: Current coverage and targets for the transport infrastructure in Bangladesh
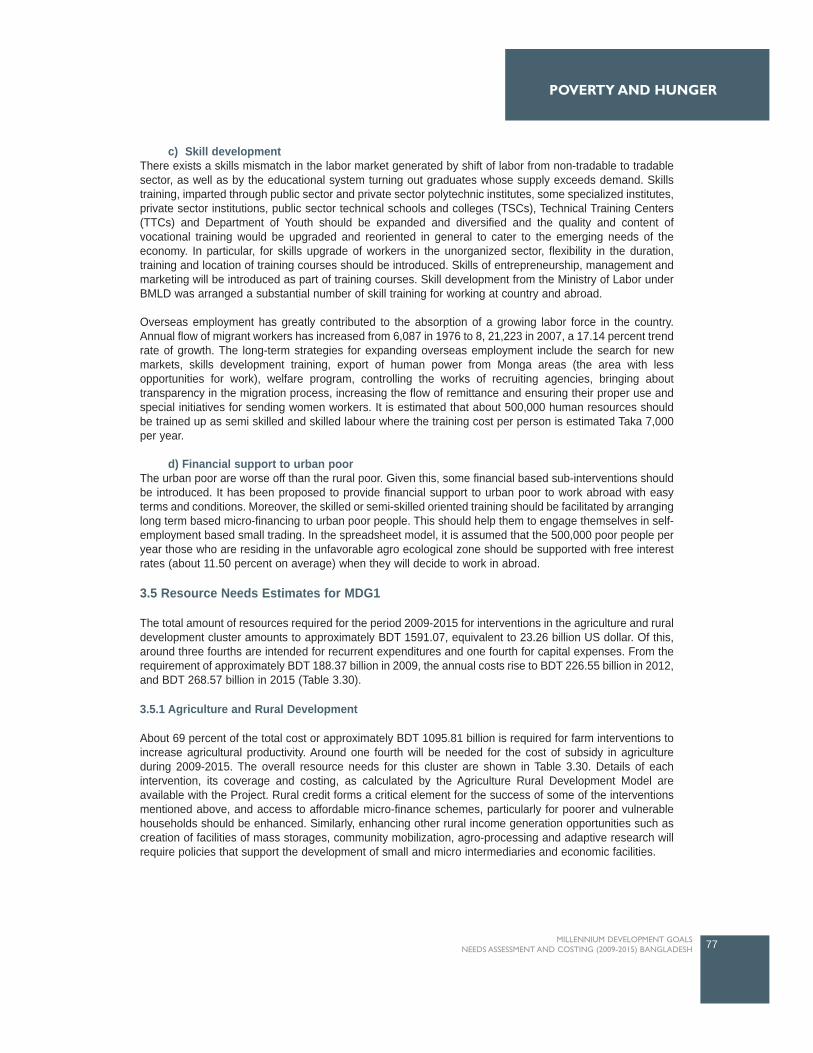
c) Skill development There exists a skills mismatch in the labor market generated by shift of labor from non-tradable to tradablesector, as well as by the educational system turning out graduates whose supply exceeds demand. Skillstraining, imparted through public sector and private sector polytechnic institutes, some specialized institutes,private sector institutions, public sector technical schools and colleges (TSCs), Technical Training Centers(TTCs) and Department of Youth should be expanded and diversified and the quality and content ofvocational training would be upgraded and reoriented in general to cater to the emerging needs of theeconomy. In particular, for skills upgrade of workers in the unorganized sector, flexibility in the duration,training and location of training courses should be introduced. Skills of entrepreneurship, management andmarketing will be introduced as part of training courses. Skill development from the Ministry of Labor underBMLD was arranged a substantial number of skill training for working at country and abroad.
Overseas employment has greatly contributed to the absorption of a growing labor force in the country.Annual flow of migrant workers has increased from 6,087 in 1976 to 8, 21,223 in 2007, a 17.14 percent trendrate of growth. The long-term strategies for expanding overseas employment include the search for newmarkets, skills development training, export of human power from Monga areas (the area with lessopportunities for work), welfare program, controlling the works of recruiting agencies, bringing abouttransparency in the migration process, increasing the flow of remittance and ensuring their proper use andspecial initiatives for sending women workers. It is estimated that about 500,000 human resources shouldbe trained up as semi skilled and skilled labour where the training cost per person is estimated Taka 7,000per year.
d) Financial support to urban poorThe urban poor are worse off than the rural poor. Given this, some financial based sub-interventions shouldbe introduced. It has been proposed to provide financial support to urban poor to work abroad with easyterms and conditions. Moreover, the skilled or semi-skilled oriented training should be facilitated by arranginglong term based micro-financing to urban poor people. This should help them to engage themselves in self-employment based small trading. In the spreadsheet model, it is assumed that the 500,000 poor people peryear those who are residing in the unfavorable agro ecological zone should be supported with free interestrates (about 11.50 percent on average) when they will decide to work in abroad.
3.5 Resource Needs Estimates for MDG1
The total amount of resources required for the period 2009-2015 for interventions in the agriculture and ruraldevelopment cluster amounts to approximately BDT 1591.07, equivalent to 23.26 billion US dollar. Of this,around three fourths are intended for recurrent expenditures and one fourth for capital expenses. From therequirement of approximately BDT 188.37 billion in 2009, the annual costs rise to BDT 226.55 billion in 2012,and BDT 268.57 billion in 2015 (Table 3.30).
3.5.1 Agriculture and Rural Development
About 69 percent of the total cost or approximately BDT 1095.81 billion is required for farm interventions toincrease agricultural productivity. Around one fourth will be needed for the cost of subsidy in agricultureduring 2009-2015. The overall resource needs for this cluster are shown in Table 3.30. Details of eachintervention, its coverage and costing, as calculated by the Agriculture Rural Development Model areavailable with the Project. Rural credit forms a critical element for the success of some of the interventionsmentioned above, and access to affordable micro-finance schemes, particularly for poorer and vulnerablehouseholds should be enhanced. Similarly, enhancing other rural income generation opportunities such ascreation of facilities of mass storages, community mobilization, agro-processing and adaptive research willrequire policies that support the development of small and micro intermediaries and economic facilities.
77MILLENNIUM DEVELOPMENT GOALS NEEDS ASSESSMENT AND COSTING (2009-2015) BANGLADESH
POVERTY AND HUNGER
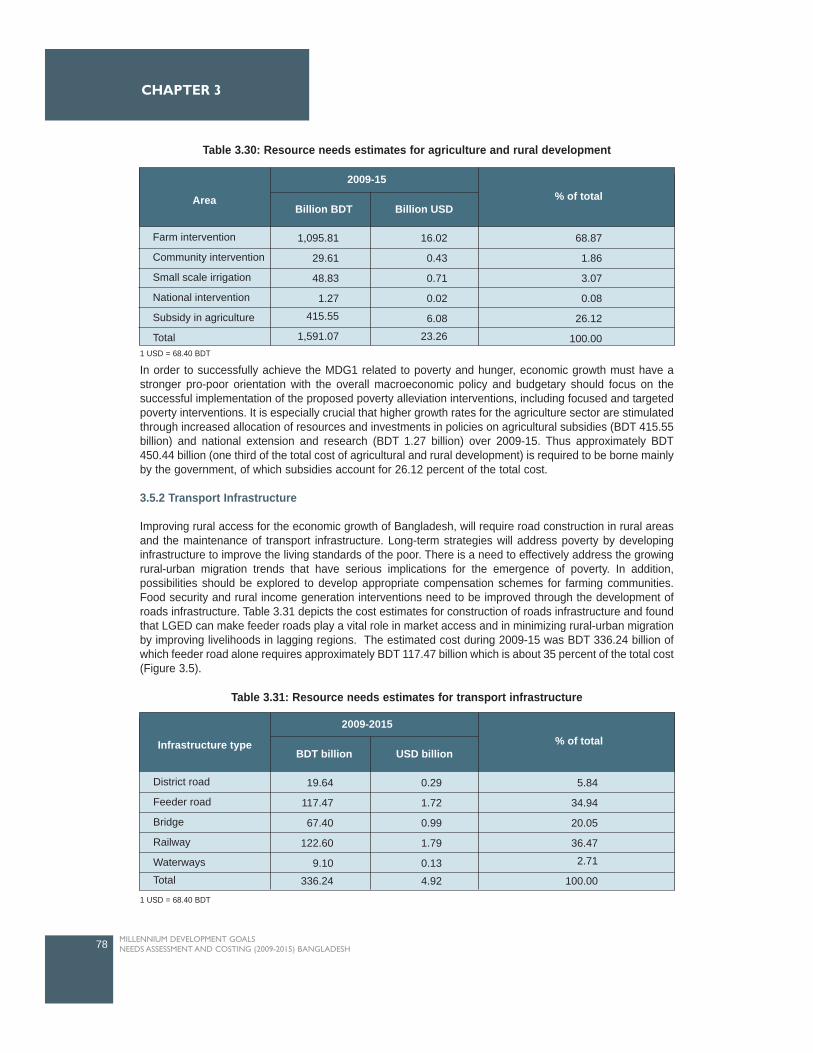
In order to successfully achieve the MDG1 related to poverty and hunger, economic growth must have astronger pro-poor orientation with the overall macroeconomic policy and budgetary should focus on thesuccessful implementation of the proposed poverty alleviation interventions, including focused and targetedpoverty interventions. It is especially crucial that higher growth rates for the agriculture sector are stimulatedthrough increased allocation of resources and investments in policies on agricultural subsidies (BDT 415.55billion) and national extension and research (BDT 1.27 billion) over 2009-15. Thus approximately BDT450.44 billion (one third of the total cost of agricultural and rural development) is required to be borne mainlyby the government, of which subsidies account for 26.12 percent of the total cost.
3.5.2 Transport Infrastructure
Improving rural access for the economic growth of Bangladesh, will require road construction in rural areasand the maintenance of transport infrastructure. Long-term strategies will address poverty by developinginfrastructure to improve the living standards of the poor. There is a need to effectively address the growingrural-urban migration trends that have serious implications for the emergence of poverty. In addition,possibilities should be explored to develop appropriate compensation schemes for farming communities.Food security and rural income generation interventions need to be improved through the development ofroads infrastructure. Table 3.31 depicts the cost estimates for construction of roads infrastructure and foundthat LGED can make feeder roads play a vital role in market access and in minimizing rural-urban migrationby improving livelihoods in lagging regions. The estimated cost during 2009-15 was BDT 336.24 billion ofwhich feeder road alone requires approximately BDT 117.47 billion which is about 35 percent of the total cost(Figure 3.5).
78 MILLENNIUM DEVELOPMENT GOALS NEEDS ASSESSMENT AND COSTING (2009-2015) BANGLADESH
CHAPTER 3
Infrastructure type
2009-2015
BDT billion USD billion% of total
District road
Feeder road
Bridge
Railway
Waterways
Total
19.64
117.47
67.40
122.60
9.10
336.24
0.29
1.72
0.99
1.79
0.13
4.92
5.84
34.94
20.05
36.47
2.71
100.00
Area
2009-15
Billion BDT Billion USD% of total
Farm intervention
Community intervention
Small scale irrigation
National intervention
Subsidy in agriculture
Total
1,095.81
29.61
48.83
1.27
415.55
1,591.07
16.02
0.43
0.71
0.02
6.08
23.26
68.87
1.86
3.07
0.08
26.12
100.00
Table 3.30: Resource needs estimates for agriculture and rural development
1 USD = 68.40 BDT
Table 3.31: Resource needs estimates for transport infrastructure
1 USD = 68.40 BDT
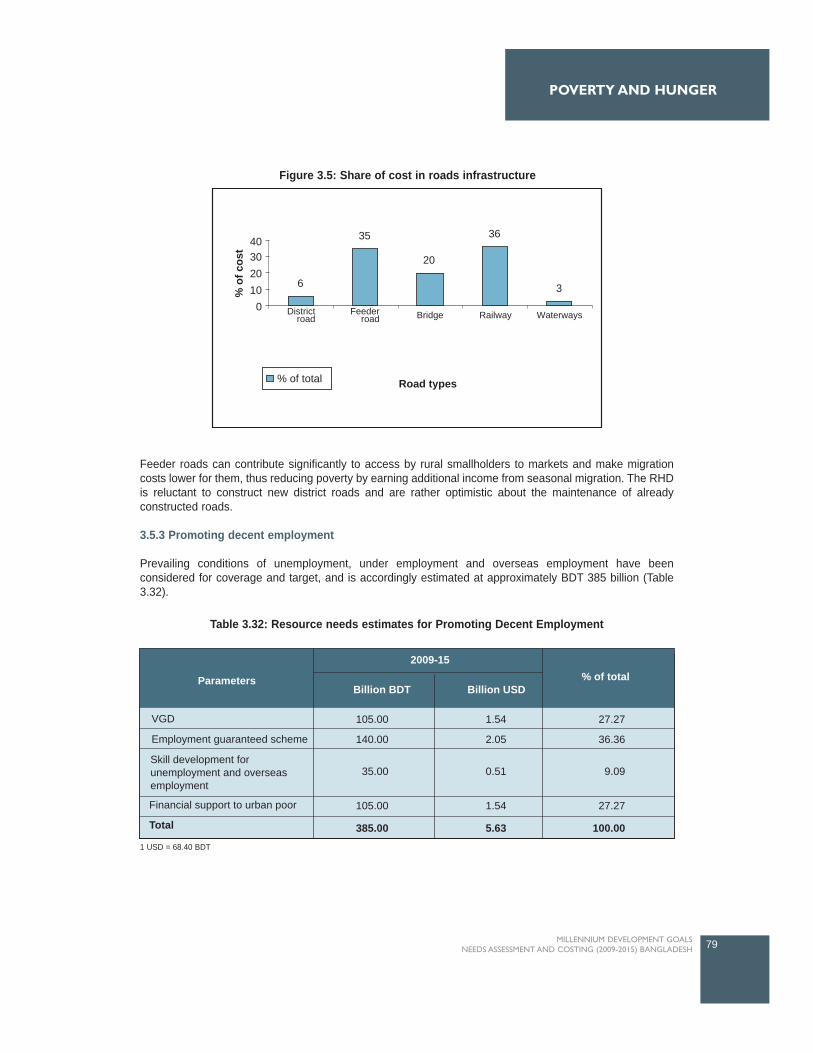
Feeder roads can contribute significantly to access by rural smallholders to markets and make migrationcosts lower for them, thus reducing poverty by earning additional income from seasonal migration. The RHDis reluctant to construct new district roads and are rather optimistic about the maintenance of alreadyconstructed roads.
3.5.3 Promoting decent employment
Prevailing conditions of unemployment, under employment and overseas employment have beenconsidered for coverage and target, and is accordingly estimated at approximately BDT 385 billion (Table3.32).
79MILLENNIUM DEVELOPMENT GOALS NEEDS ASSESSMENT AND COSTING (2009-2015) BANGLADESH
POVERTY AND HUNGER
Parameters
2009-15
Billion BDT Billion USD% of total
Employment guaranteed scheme
Financial support to urban poor
Total
VGD 105.00
140.00
35.00
105.00
385.00
1.54
2.05
0.51
1.54
5.63
27.27
36.36
9.09
27.27
100.00
Skill development forunemployment and overseasemployment
6
35
20
36
3
Road types
% o
f cos
t
0
40302010
Districtroad
Feederroad Bridge Railway Waterways
% of total
Figure 3.5: Share of cost in roads infrastructure
Table 3.32: Resource needs estimates for Promoting Decent Employment
1 USD = 68.40 BDT
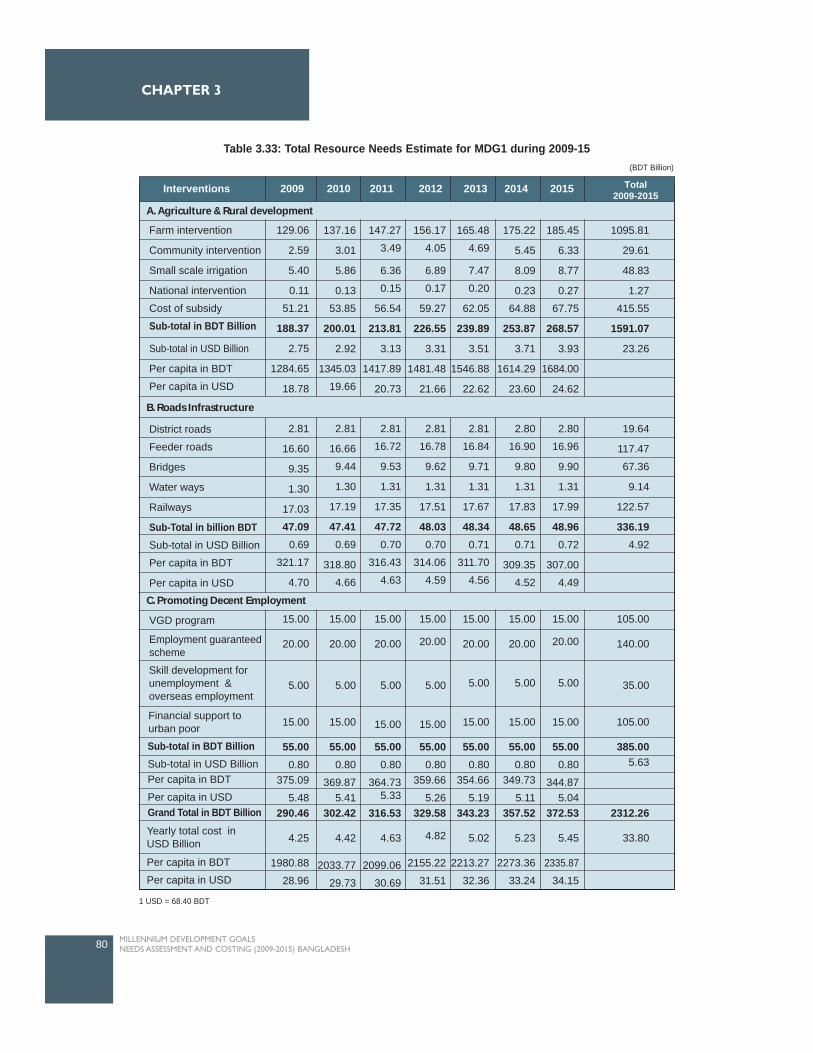
80 MILLENNIUM DEVELOPMENT GOALS NEEDS ASSESSMENT AND COSTING (2009-2015) BANGLADESH
CHAPTER 3
Table 3.33: Total Resource Needs Estimate for MDG1 during 2009-15(BDT Billion)
1 USD = 68.40 BDT
2009Interventions 2010 2011 2012 2013 2014 2015 Total2009-2015
A. Agriculture & Rural development
B. Roads Infrastructure
C. Promoting Decent Employment
Farm intervention
Community intervention
Small scale irrigation
National intervention
Cost of subsidy
Sub-total in BDT Billion
Sub-total in USD Billion
Per capita in BDT
Per capita in USD
District roads
Feeder roads
Bridges
Water ways
Railways
Sub-Total in billion BDTSub-total in USD Billion
Per capita in BDT
Per capita in USD
VGD program
129.06
2.59
5.40
0.11
51.21
188.37
2.75
1284.65
18.78
2.81
16.60
9.35
1.30
17.03
47.090.69
321.17
4.70
15.00
20.00
5.00
15.00
55.000.80
375.09
5.48290.46
4.25
1980.88
28.96
15.00
20.00
5.00
15.00
55.000.80
369.875.41
302.42
4.42
2033.77
29.73
15.00
20.00
5.00
15.00
55.000.80
364.735.33
316.53
4.63
2099.06
30.69
15.00
20.00
5.00
15.00
55.000.80
359.66
5.26329.58
4.82
2155.22
31.51
15.00
20.00
5.00
15.00
55.000.80
354.66
5.19343.23
5.02
2213.27
32.36
15.00
20.00
5.00
15.00
55.000.80
349.73
5.11357.52
5.23
2273.36
33.24
15.00
20.00
5.00
15.00
55.000.80
344.875.04
372.53
5.45
2335.87
34.15
105.00
140.00
35.00
105.00
385.005.63
2312.26
33.80
2.81
16.66
9.44
1.30
17.19
47.410.69
318.80
4.66
2.81
16.72
9.53
1.31
17.35
47.720.70
316.43
4.63
2.81
16.78
9.62
1.31
17.51
48.030.70
314.06
4.59
2.81
16.84
9.71
1.31
17.67
48.340.71
311.70
4.56
2.80
16.90
9.80
1.31
17.83
48.650.71
309.35
4.52
2.80
16.96
9.90
1.31
17.99
48.960.72
307.00
4.49
19.64
117.47
67.36
9.14
122.57
336.194.92
137.16
3.01
5.86
0.13
53.85
200.01
2.92
1345.03
19.66
147.27
3.49
6.36
0.15
56.54
213.81
3.13
1417.89
20.73
156.17
4.05
6.89
0.17
59.27
226.55
3.31
1481.48
21.66
165.48
4.69
7.47
0.20
62.05
239.89
3.51
1546.88
22.62
175.22
5.45
8.09
0.23
64.88
253.87
3.71
1614.29
23.60
185.45
6.33
8.77
0.27
67.75
268.57
3.93
1684.00
24.62
1095.81
29.61
48.83
1.27
415.55
1591.07
23.26
Sub-total in BDT BillionSub-total in USD BillionPer capita in BDT
Per capita in USDGrand Total in BDT Billion
Employment guaranteedscheme
Financial support tourban poor
Skill development forunemployment &overseas employment
Yearly total cost inUSD Billion
Per capita in BDT
Per capita in USD
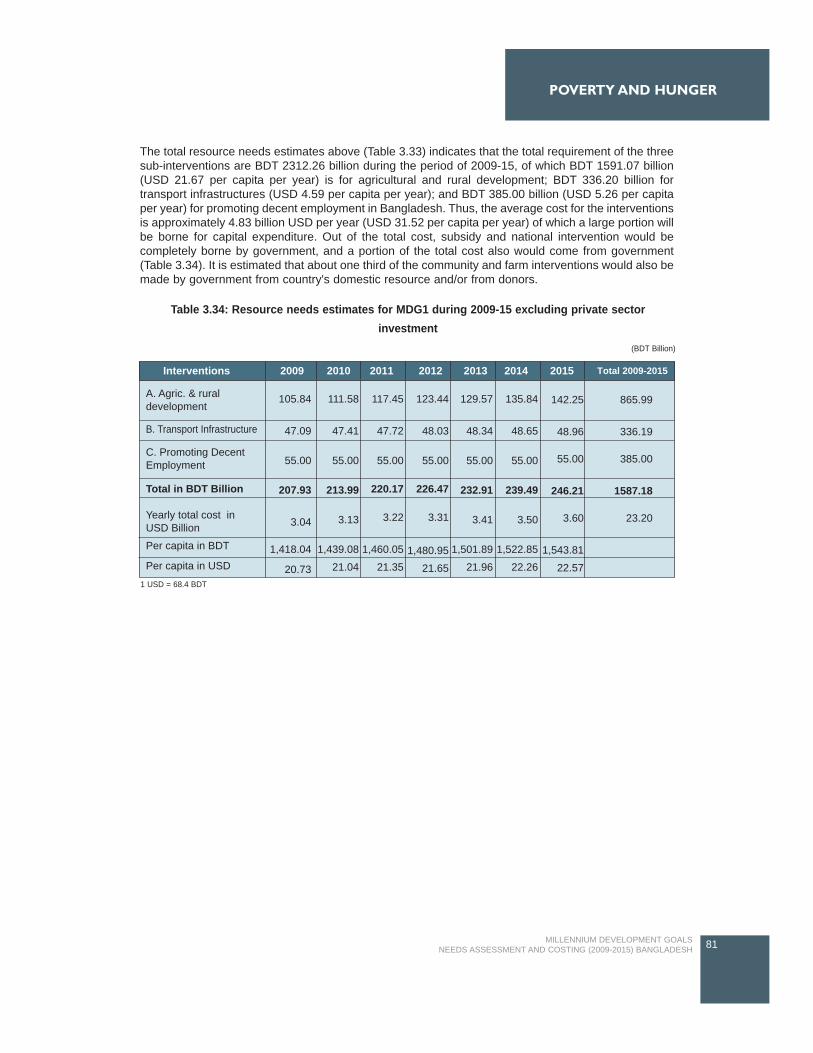
The total resource needs estimates above (Table 3.33) indicates that the total requirement of the threesub-interventions are BDT 2312.26 billion during the period of 2009-15, of which BDT 1591.07 billion(USD 21.67 per capita per year) is for agricultural and rural development; BDT 336.20 billion fortransport infrastructures (USD 4.59 per capita per year); and BDT 385.00 billion (USD 5.26 per capitaper year) for promoting decent employment in Bangladesh. Thus, the average cost for the interventionsis approximately 4.83 billion USD per year (USD 31.52 per capita per year) of which a large portion willbe borne for capital expenditure. Out of the total cost, subsidy and national intervention would becompletely borne by government, and a portion of the total cost also would come from government(Table 3.34). It is estimated that about one third of the community and farm interventions would also bemade by government from country's domestic resource and/or from donors.
81MILLENNIUM DEVELOPMENT GOALS NEEDS ASSESSMENT AND COSTING (2009-2015) BANGLADESH
POVERTY AND HUNGER
Table 3.34: Resource needs estimates for MDG1 during 2009-15 excluding private sectorinvestment
(BDT Billion)
1 USD = 68.4 BDT
2009Interventions 2010 2011 2012 2013 2014 2015 Total 2009-2015
B. Transport Infrastructure
A. Agric. & ruraldevelopment
C. Promoting DecentEmployment
Total in BDT Billion
Yearly total cost inUSD Billion
Per capita in BDT
Per capita in USD
105.84
47.09
55.00
207.93
3.04
1,418.04
20.73
111.58
47.41
55.00
213.99
3.13
1,439.08
21.04
117.45
47.72
55.00
220.17
3.22
1,460.05
21.35
123.44
48.03
55.00
226.47
3.31
1,480.95
21.65
129.57
48.34
55.00
232.91
3.41
1,501.89
21.96
135.84
48.65
55.00
239.49
3.50
1,522.85
22.26
142.25
48.96
55.00
246.21
3.60
1,543.81
22.57
865.99
336.19
385.00
1587.18
23.20

82 MILLENNIUM DEVELOPMENT GOALS NEEDS ASSESSMENT AND COSTING (2009-2015) BANGLADESH
CHAPTER 3
EDUCATION

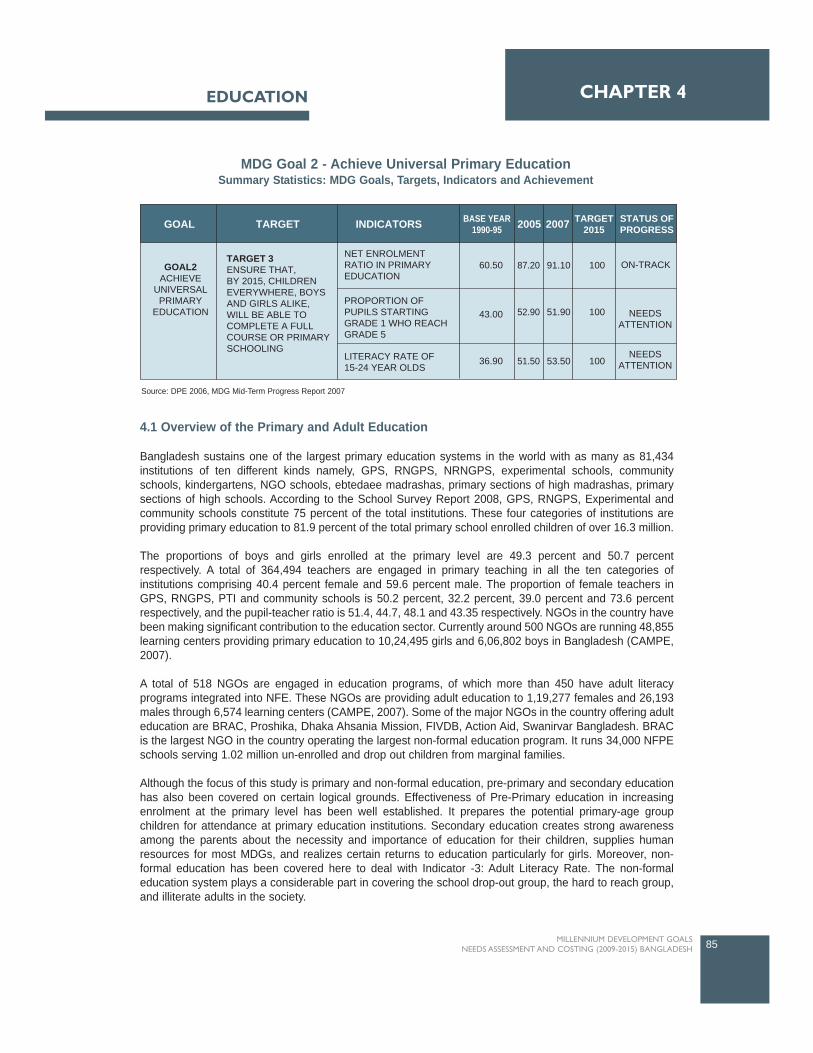
4.1 Overview of the Primary and Adult Education
Bangladesh sustains one of the largest primary education systems in the world with as many as 81,434institutions of ten different kinds namely, GPS, RNGPS, NRNGPS, experimental schools, communityschools, kindergartens, NGO schools, ebtedaee madrashas, primary sections of high madrashas, primarysections of high schools. According to the School Survey Report 2008, GPS, RNGPS, Experimental andcommunity schools constitute 75 percent of the total institutions. These four categories of institutions areproviding primary education to 81.9 percent of the total primary school enrolled children of over 16.3 million.
The proportions of boys and girls enrolled at the primary level are 49.3 percent and 50.7 percentrespectively. A total of 364,494 teachers are engaged in primary teaching in all the ten categories ofinstitutions comprising 40.4 percent female and 59.6 percent male. The proportion of female teachers inGPS, RNGPS, PTI and community schools is 50.2 percent, 32.2 percent, 39.0 percent and 73.6 percentrespectively, and the pupil-teacher ratio is 51.4, 44.7, 48.1 and 43.35 respectively. NGOs in the country havebeen making significant contribution to the education sector. Currently around 500 NGOs are running 48,855learning centers providing primary education to 10,24,495 girls and 6,06,802 boys in Bangladesh (CAMPE,2007).
A total of 518 NGOs are engaged in education programs, of which more than 450 have adult literacyprograms integrated into NFE. These NGOs are providing adult education to 1,19,277 females and 26,193males through 6,574 learning centers (CAMPE, 2007). Some of the major NGOs in the country offering adulteducation are BRAC, Proshika, Dhaka Ahsania Mission, FIVDB, Action Aid, Swanirvar Bangladesh. BRACis the largest NGO in the country operating the largest non-formal education program. It runs 34,000 NFPEschools serving 1.02 million un-enrolled and drop out children from marginal families.
Although the focus of this study is primary and non-formal education, pre-primary and secondary educationhas also been covered on certain logical grounds. Effectiveness of Pre-Primary education in increasingenrolment at the primary level has been well established. It prepares the potential primary-age groupchildren for attendance at primary education institutions. Secondary education creates strong awarenessamong the parents about the necessity and importance of education for their children, supplies humanresources for most MDGs, and realizes certain returns to education particularly for girls. Moreover, non-formal education has been covered here to deal with Indicator -3: Adult Literacy Rate. The non-formaleducation system plays a considerable part in covering the school drop-out group, the hard to reach group,and illiterate adults in the society.
85MILLENNIUM DEVELOPMENT GOALS NEEDS ASSESSMENT AND COSTING (2009-2015) BANGLADESH
CHAPTER 4EDUCATION
TARGET INDICATORSGOAL BASE YEAR1990-95 2005 2007 TARGET
2015STATUS OFPROGRESS
GOAL2ACHIEVE
UNIVERSALPRIMARY
EDUCATION
TARGET 3ENSURE THAT,BY 2015, CHILDRENEVERYWHERE, BOYSAND GIRLS ALIKE,WILL BE ABLE TOCOMPLETE A FULLCOURSE OR PRIMARYSCHOOLING
NET ENROLMENTRATIO IN PRIMARYEDUCATION
PROPORTION OFPUPILS STARTINGGRADE 1 WHO REACHGRADE 5
LITERACY RATE OF15-24 YEAR OLDS
60.50
43.00
36.90
87.20
52.90
51.50
91.10
51.90
53.50
100
100
100
ON-TRACK
NEEDSATTENTION
NEEDSATTENTION
MDG Goal 2 - Achieve Universal Primary EducationSummary Statistics: MDG Goals, Targets, Indicators and Achievement
Source: DPE 2006, MDG Mid-Term Progress Report 2007
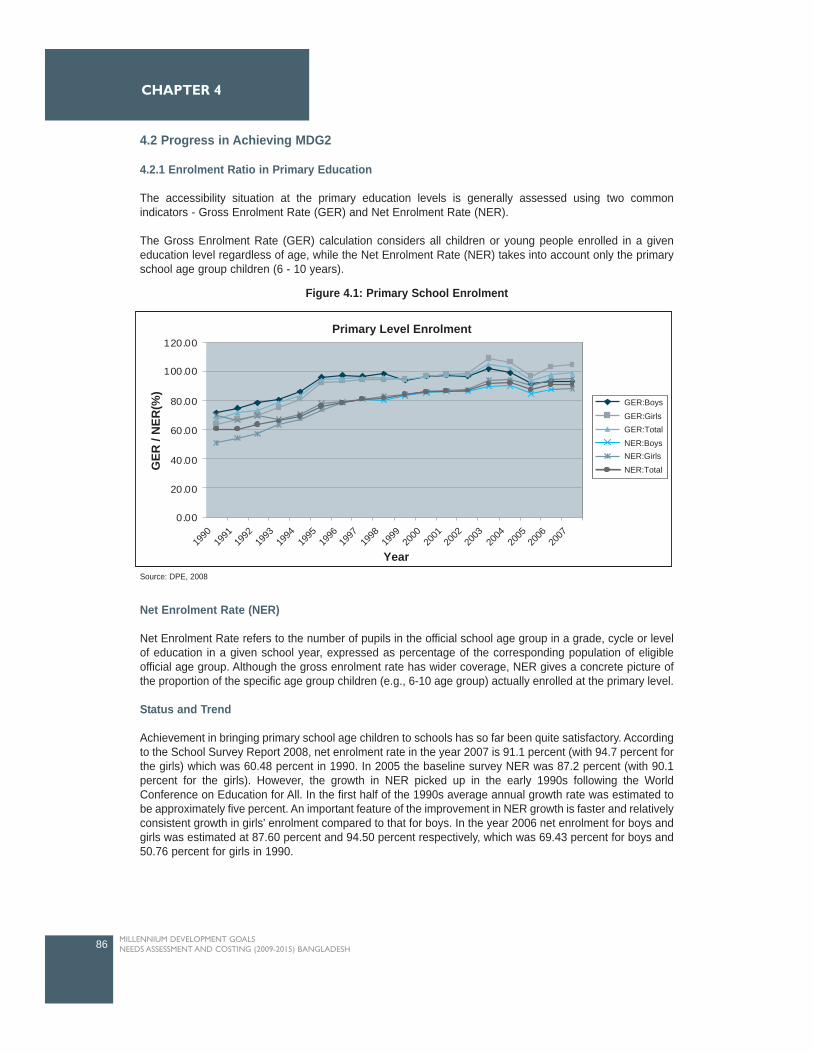
4.2 Progress in Achieving MDG2
4.2.1 Enrolment Ratio in Primary Education
The accessibility situation at the primary education levels is generally assessed using two commonindicators - Gross Enrolment Rate (GER) and Net Enrolment Rate (NER).
The Gross Enrolment Rate (GER) calculation considers all children or young people enrolled in a giveneducation level regardless of age, while the Net Enrolment Rate (NER) takes into account only the primaryschool age group children (6 - 10 years).
Net Enrolment Rate (NER)
Net Enrolment Rate refers to the number of pupils in the official school age group in a grade, cycle or levelof education in a given school year, expressed as percentage of the corresponding population of eligibleofficial age group. Although the gross enrolment rate has wider coverage, NER gives a concrete picture ofthe proportion of the specific age group children (e.g., 6-10 age group) actually enrolled at the primary level.
Status and Trend
Achievement in bringing primary school age children to schools has so far been quite satisfactory. Accordingto the School Survey Report 2008, net enrolment rate in the year 2007 is 91.1 percent (with 94.7 percent forthe girls) which was 60.48 percent in 1990. In 2005 the baseline survey NER was 87.2 percent (with 90.1percent for the girls). However, the growth in NER picked up in the early 1990s following the WorldConference on Education for All. In the first half of the 1990s average annual growth rate was estimated tobe approximately five percent. An important feature of the improvement in NER growth is faster and relativelyconsistent growth in girls' enrolment compared to that for boys. In the year 2006 net enrolment for boys andgirls was estimated at 87.60 percent and 94.50 percent respectively, which was 69.43 percent for boys and50.76 percent for girls in 1990.
86 MILLENNIUM DEVELOPMENT GOALS NEEDS ASSESSMENT AND COSTING (2009-2015) BANGLADESH
CHAPTER 4
GER:BoysGER:GirlsGER:TotalNER:BoysNER:GirlsNER:Total
Primary Level Enrolment
GER
/ N
ER(%
)
120.00
100.00
80.00
60.00
40.00
20.00
0.00
Year19
9019
9119
9219
9319
9419
9519
9619
9719
9819
9920
0020
0120
0220
0320
0420
0520
0620
07
Figure 4.1: Primary School Enrolment
Source: DPE, 2008
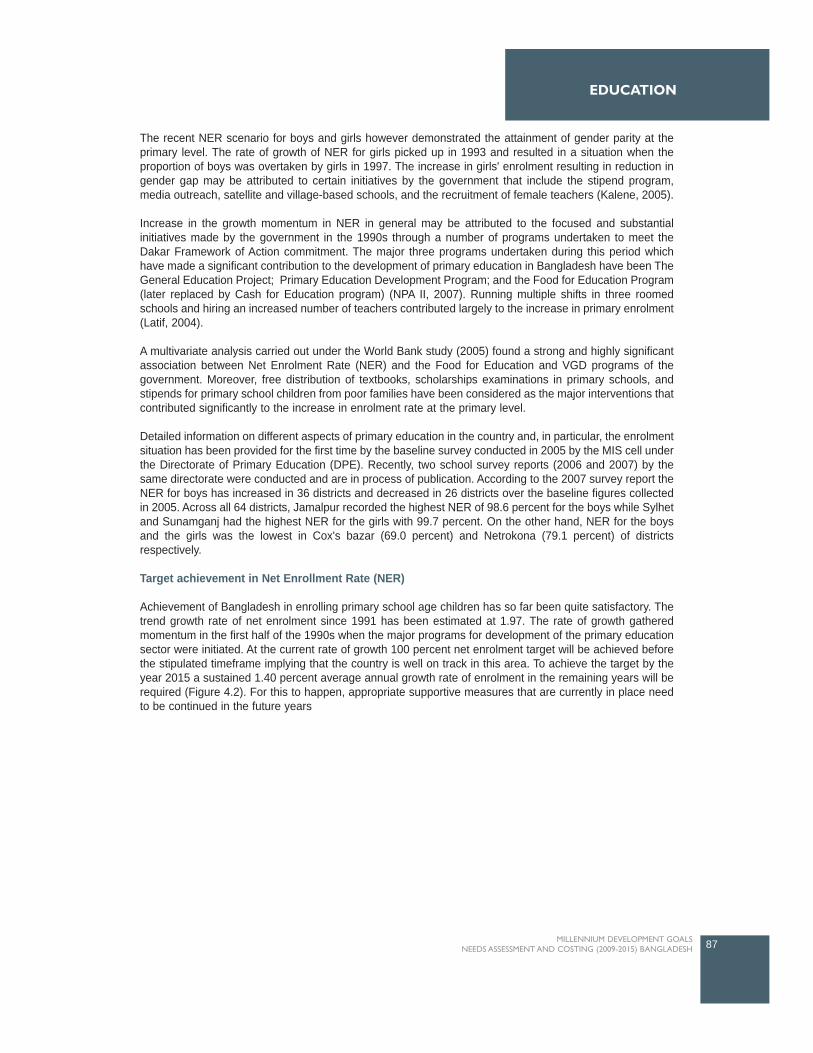
EDUCATION
The recent NER scenario for boys and girls however demonstrated the attainment of gender parity at theprimary level. The rate of growth of NER for girls picked up in 1993 and resulted in a situation when theproportion of boys was overtaken by girls in 1997. The increase in girls' enrolment resulting in reduction ingender gap may be attributed to certain initiatives by the government that include the stipend program,media outreach, satellite and village-based schools, and the recruitment of female teachers (Kalene, 2005).
Increase in the growth momentum in NER in general may be attributed to the focused and substantialinitiatives made by the government in the 1990s through a number of programs undertaken to meet theDakar Framework of Action commitment. The major three programs undertaken during this period whichhave made a significant contribution to the development of primary education in Bangladesh have been TheGeneral Education Project; Primary Education Development Program; and the Food for Education Program(later replaced by Cash for Education program) (NPA II, 2007). Running multiple shifts in three roomedschools and hiring an increased number of teachers contributed largely to the increase in primary enrolment(Latif, 2004).
A multivariate analysis carried out under the World Bank study (2005) found a strong and highly significantassociation between Net Enrolment Rate (NER) and the Food for Education and VGD programs of thegovernment. Moreover, free distribution of textbooks, scholarships examinations in primary schools, andstipends for primary school children from poor families have been considered as the major interventions thatcontributed significantly to the increase in enrolment rate at the primary level.
Detailed information on different aspects of primary education in the country and, in particular, the enrolmentsituation has been provided for the first time by the baseline survey conducted in 2005 by the MIS cell underthe Directorate of Primary Education (DPE). Recently, two school survey reports (2006 and 2007) by thesame directorate were conducted and are in process of publication. According to the 2007 survey report theNER for boys has increased in 36 districts and decreased in 26 districts over the baseline figures collectedin 2005. Across all 64 districts, Jamalpur recorded the highest NER of 98.6 percent for the boys while Sylhetand Sunamganj had the highest NER for the girls with 99.7 percent. On the other hand, NER for the boysand the girls was the lowest in Cox's bazar (69.0 percent) and Netrokona (79.1 percent) of districtsrespectively.
Target achievement in Net Enrollment Rate (NER)
Achievement of Bangladesh in enrolling primary school age children has so far been quite satisfactory. Thetrend growth rate of net enrolment since 1991 has been estimated at 1.97. The rate of growth gatheredmomentum in the first half of the 1990s when the major programs for development of the primary educationsector were initiated. At the current rate of growth 100 percent net enrolment target will be achieved beforethe stipulated timeframe implying that the country is well on track in this area. To achieve the target by theyear 2015 a sustained 1.40 percent average annual growth rate of enrolment in the remaining years will berequired (Figure 4.2). For this to happen, appropriate supportive measures that are currently in place needto be continued in the future years
87MILLENNIUM DEVELOPMENT GOALS NEEDS ASSESSMENT AND COSTING (2009-2015) BANGLADESH
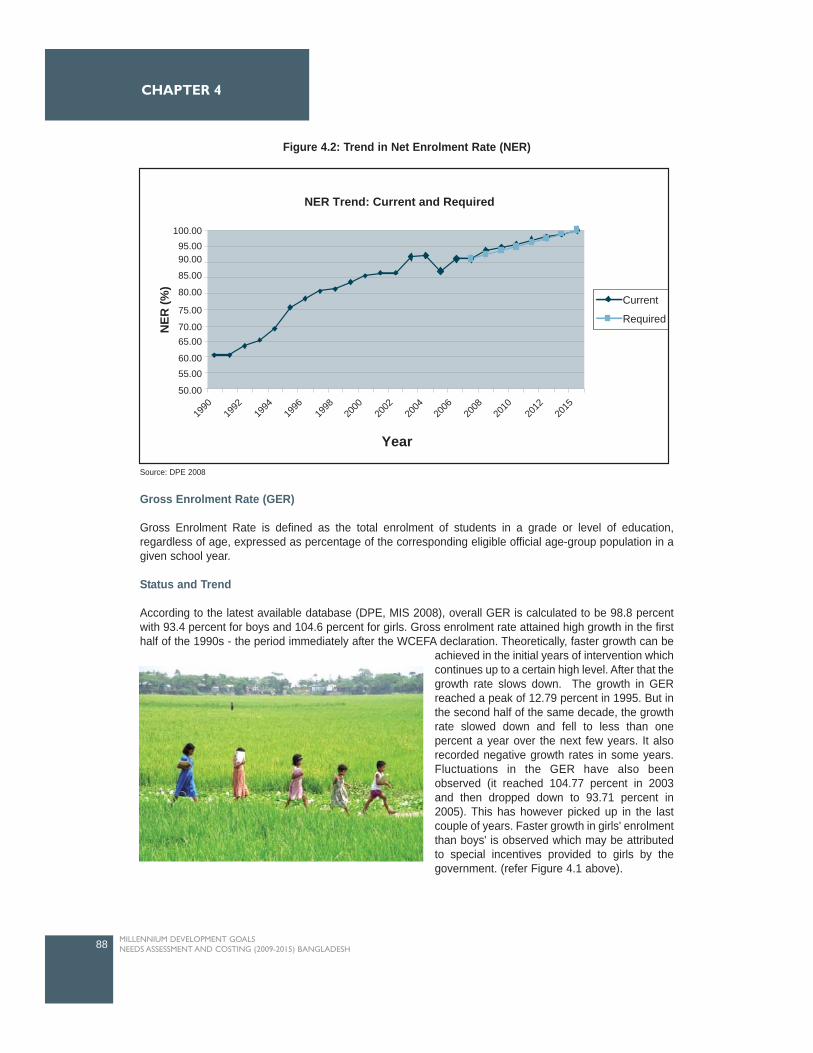
Gross Enrolment Rate (GER)
Gross Enrolment Rate is defined as the total enrolment of students in a grade or level of education,regardless of age, expressed as percentage of the corresponding eligible official age-group population in agiven school year.
Status and Trend
According to the latest available database (DPE, MIS 2008), overall GER is calculated to be 98.8 percentwith 93.4 percent for boys and 104.6 percent for girls. Gross enrolment rate attained high growth in the firsthalf of the 1990s - the period immediately after the WCEFA declaration. Theoretically, faster growth can be
achieved in the initial years of intervention whichcontinues up to a certain high level. After that thegrowth rate slows down. The growth in GERreached a peak of 12.79 percent in 1995. But inthe second half of the same decade, the growthrate slowed down and fell to less than onepercent a year over the next few years. It alsorecorded negative growth rates in some years.Fluctuations in the GER have also beenobserved (it reached 104.77 percent in 2003and then dropped down to 93.71 percent in2005). This has however picked up in the lastcouple of years. Faster growth in girls' enrolmentthan boys' is observed which may be attributedto special incentives provided to girls by thegovernment. (refer Figure 4.1 above).
88 MILLENNIUM DEVELOPMENT GOALS NEEDS ASSESSMENT AND COSTING (2009-2015) BANGLADESH
CHAPTER 4
NER Trend: Current and Required
Current
Required
100.0095.0090.00
85.00
80.00
75.00
70.0065.00
60.0055.00
50.00
NER
(%)
1990
1992
1994
1996
1998
2000
2002
2004
2006
2008
2010
2012
2015
Year
Figure 4.2: Trend in Net Enrolment Rate (NER)
Source: DPE 2008

According to the school survey of 2007, GER increased in 29 districts and decreased in 31 districts over the2005 baseline survey findings. The highest GER for boys was found in Magura (114.9 percent) followed byNarail (109.5 percent), Tangail (109.2 percent) and Jhalkathi (107.5 percent). For the girls the highest GERwas also recorded in Magura (119.5 percent) followed by Mymensing (117.3 percent) Barisal (117.2 percent)and Sylhet (115.9 percent).On the other hand, Netrokona (73.8 percent) recorded the lowest GER followedby Cox's Bazar (77.6 percent) and Nawabganj (78.6 percent). For the girls Netrokona (84.6 percent) is atthe bottom followed by Sherpur (85.3 percent) and Sirajgonj (89.5 percent).
Target achievement in Gross Enrollment Ratio (GER)
Although there was no target set for GER under MDG2, the National Plan of Action II suggested targets for2005, 2010 and 2015 as 103, 108 and 110 respectively. Comparing these targets with the current GERgrowth trend it can be concluded that with a little acceleration in the current growth rate will put the countryclose to the EFA target of 110 by the year 2015. It should also be mentioned that when the NER increasesand reaches at universal level, the GER is expected to drop, and the gap between GER and NER becomenarrower, before finally converging.
4.2.2 Proportion of Pupils Starting Grade I who reach Grade V
Primary school completion rate, measured as the number of pupils starting grade I and completing grade V,has been one of the three indicators for attaining the target set for achieving universal primary education i.e.,MDG2. The target set for this indicator is 100 percent by the year 2015.
Status and Trend
In comparison with progress in other fronts of primary education (such as net and gross enrolment rate)achievement in the area of primary cycle completion has not been quite satisfactory. Data on completion anddrop out rate is available only for a few years with no gender level dis-aggregation. However, in the first halfof the 1990s the growth in completion rate was 7.5 percent per annum which slowed down to 5.8 percent inthe second half of the decade. Compared to other indicators the baseline completion rate figure was verylow (only 40 percent in the year 1991). Since 2000 the rate became virtually stagnant at 67 percent.Moreover, in 2005, the survival rate to grade five and the drop out rate are calculated at 52.9 percent and47.2 percent respectively. Both are however significantly higher than earlier figures. In the last two schoolsurveys (2006 and 2007) survival rate is found to have fluctuated a bit: 50.2 percent in 2006 and 51.9percent in 2007.
The potentially low primary cycle completion rate, and a very high drop out rate, is manifest in all threesurvey findings. Survival rates of primary level students to grade five (i.e. 4 years of primary schooling) isalso important for a sustainable level of education. Before 2005, completion rate was calculated based onthe sample survey conducted in Dhaka, using only the reconstructed cohort method. Since 2005, completionand drop out rates have been calculated based on the data collected from GPSs and RNGPSs. The pupilswho left these two categories of schools and joined other schools are not taken into account. As a result, thedrop out rate is considered to be slightly overestimated because transfer of pupils is treated as dropouts(DPE 2008).
Several reasons behind the low primary completion rate or high drop out rate at the primary level have beenidentified. Among these, poverty in the family has been identified by several studies as the major one. This,however, leads to student absenteeism in general in schools due to high opportunity costs and other hiddencosts. The 2007 baseline survey data estimated 20 percent rate of absenteeism in the three majorcategories of schools (GPS, RNGPS, and community schools). Overcrowded classrooms and a lack offacilities at schools are generally considered to be responsible for low school attendance rates (Chowdhury,2002).
89MILLENNIUM DEVELOPMENT GOALS NEEDS ASSESSMENT AND COSTING (2009-2015) BANGLADESH
EDUCATION
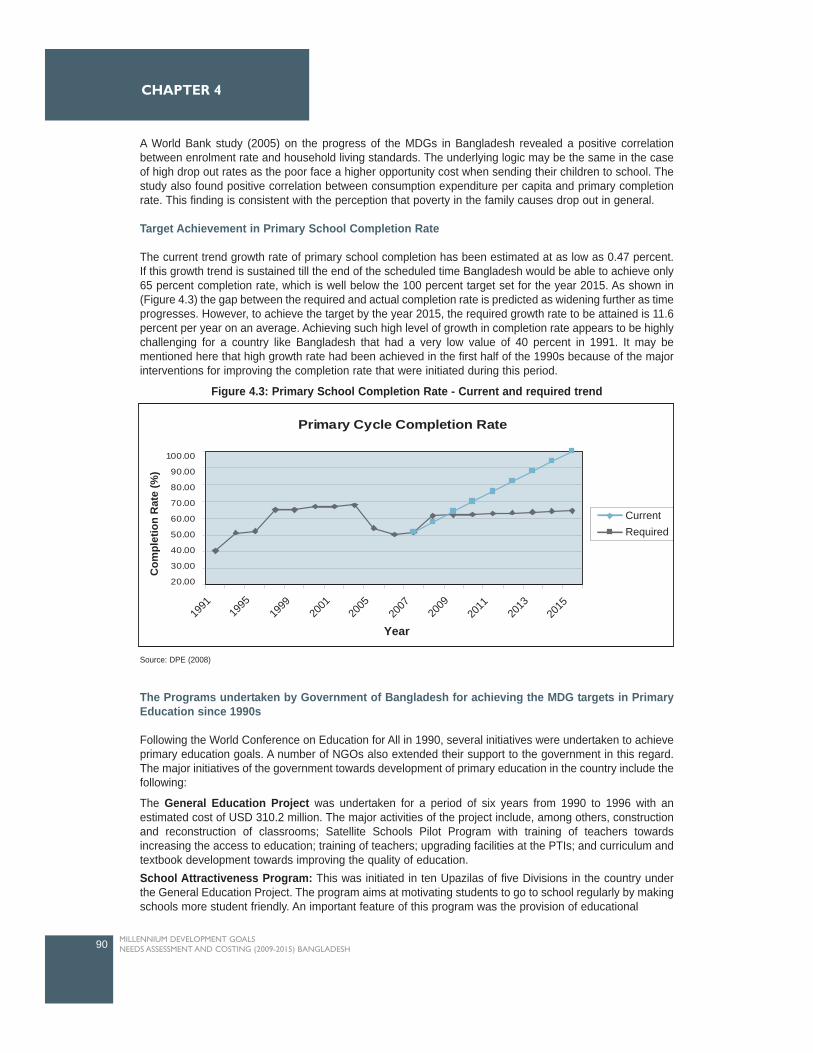
A World Bank study (2005) on the progress of the MDGs in Bangladesh revealed a positive correlationbetween enrolment rate and household living standards. The underlying logic may be the same in the caseof high drop out rates as the poor face a higher opportunity cost when sending their children to school. Thestudy also found positive correlation between consumption expenditure per capita and primary completionrate. This finding is consistent with the perception that poverty in the family causes drop out in general.
Target Achievement in Primary School Completion Rate
The current trend growth rate of primary school completion has been estimated at as low as 0.47 percent.If this growth trend is sustained till the end of the scheduled time Bangladesh would be able to achieve only65 percent completion rate, which is well below the 100 percent target set for the year 2015. As shown in(Figure 4.3) the gap between the required and actual completion rate is predicted as widening further as timeprogresses. However, to achieve the target by the year 2015, the required growth rate to be attained is 11.6percent per year on an average. Achieving such high level of growth in completion rate appears to be highlychallenging for a country like Bangladesh that had a very low value of 40 percent in 1991. It may bementioned here that high growth rate had been achieved in the first half of the 1990s because of the majorinterventions for improving the completion rate that were initiated during this period.
The Programs undertaken by Government of Bangladesh for achieving the MDG targets in PrimaryEducation since 1990s
Following the World Conference on Education for All in 1990, several initiatives were undertaken to achieveprimary education goals. A number of NGOs also extended their support to the government in this regard.The major initiatives of the government towards development of primary education in the country include thefollowing:
The General Education Project was undertaken for a period of six years from 1990 to 1996 with anestimated cost of USD 310.2 million. The major activities of the project include, among others, constructionand reconstruction of classrooms; Satellite Schools Pilot Program with training of teachers towardsincreasing the access to education; training of teachers; upgrading facilities at the PTIs; and curriculum andtextbook development towards improving the quality of education. School Attractiveness Program: This was initiated in ten Upazilas of five Divisions in the country underthe General Education Project. The program aims at motivating students to go to school regularly by makingschools more student friendly. An important feature of this program was the provision of educational
90 MILLENNIUM DEVELOPMENT GOALS NEEDS ASSESSMENT AND COSTING (2009-2015) BANGLADESH
CHAPTER 4
Source: DPE (2008)
Figure 4.3: Primary School Completion Rate - Current and required trend
Primary Cycle Completion Rate
Com
plet
ion
Rat
e (%
)
100.00
90.00
80.00
70.00
60.00
50.00
40.00
30.00
20.00
1991
1995
1999
2001
2005
2007
2009
2011
2013
2015
Year
RequiredCurrent
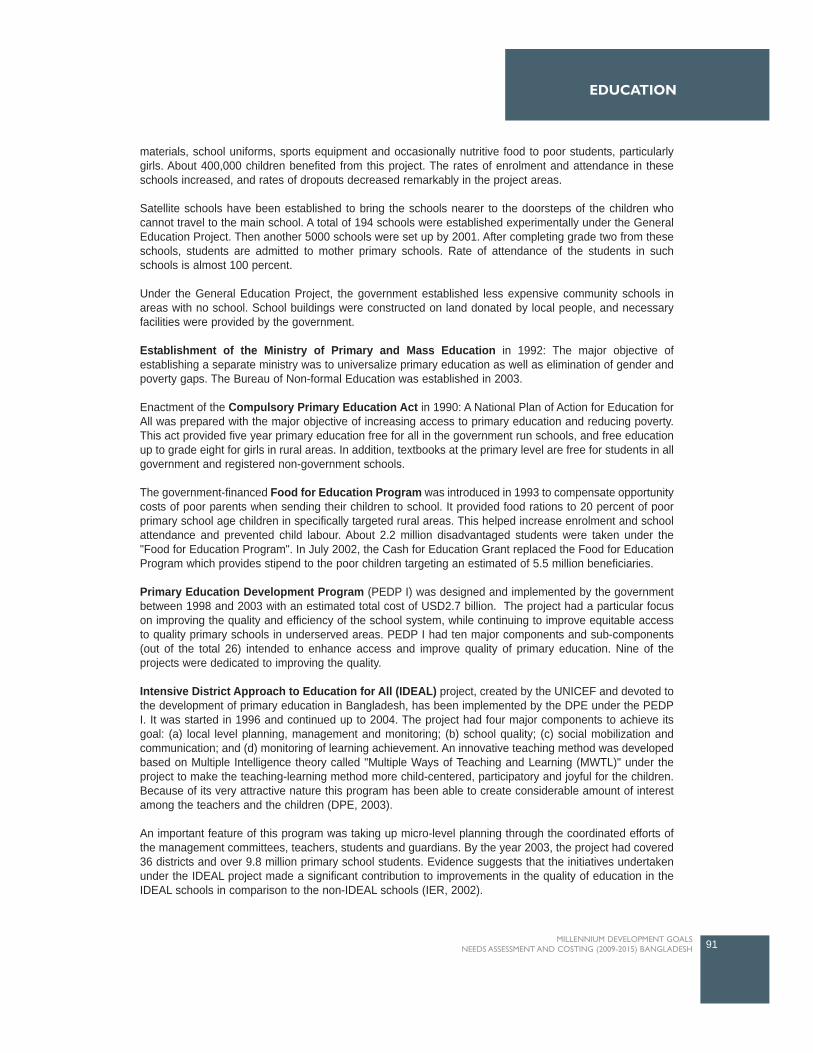
materials, school uniforms, sports equipment and occasionally nutritive food to poor students, particularlygirls. About 400,000 children benefited from this project. The rates of enrolment and attendance in theseschools increased, and rates of dropouts decreased remarkably in the project areas.
Satellite schools have been established to bring the schools nearer to the doorsteps of the children whocannot travel to the main school. A total of 194 schools were established experimentally under the GeneralEducation Project. Then another 5000 schools were set up by 2001. After completing grade two from theseschools, students are admitted to mother primary schools. Rate of attendance of the students in suchschools is almost 100 percent.
Under the General Education Project, the government established less expensive community schools inareas with no school. School buildings were constructed on land donated by local people, and necessaryfacilities were provided by the government.
Establishment of the Ministry of Primary and Mass Education in 1992: The major objective ofestablishing a separate ministry was to universalize primary education as well as elimination of gender andpoverty gaps. The Bureau of Non-formal Education was established in 2003.
Enactment of the Compulsory Primary Education Act in 1990: A National Plan of Action for Education forAll was prepared with the major objective of increasing access to primary education and reducing poverty.This act provided five year primary education free for all in the government run schools, and free educationup to grade eight for girls in rural areas. In addition, textbooks at the primary level are free for students in allgovernment and registered non-government schools.
The government-financed Food for Education Program was introduced in 1993 to compensate opportunitycosts of poor parents when sending their children to school. It provided food rations to 20 percent of poorprimary school age children in specifically targeted rural areas. This helped increase enrolment and schoolattendance and prevented child labour. About 2.2 million disadvantaged students were taken under the"Food for Education Program". In July 2002, the Cash for Education Grant replaced the Food for EducationProgram which provides stipend to the poor children targeting an estimated of 5.5 million beneficiaries.
Primary Education Development Program (PEDP I) was designed and implemented by the governmentbetween 1998 and 2003 with an estimated total cost of USD2.7 billion. The project had a particular focuson improving the quality and efficiency of the school system, while continuing to improve equitable accessto quality primary schools in underserved areas. PEDP I had ten major components and sub-components(out of the total 26) intended to enhance access and improve quality of primary education. Nine of theprojects were dedicated to improving the quality.
Intensive District Approach to Education for All (IDEAL) project, created by the UNICEF and devoted tothe development of primary education in Bangladesh, has been implemented by the DPE under the PEDPI. It was started in 1996 and continued up to 2004. The project had four major components to achieve itsgoal: (a) local level planning, management and monitoring; (b) school quality; (c) social mobilization andcommunication; and (d) monitoring of learning achievement. An innovative teaching method was developedbased on Multiple Intelligence theory called "Multiple Ways of Teaching and Learning (MWTL)" under theproject to make the teaching-learning method more child-centered, participatory and joyful for the children.Because of its very attractive nature this program has been able to create considerable amount of interestamong the teachers and the children (DPE, 2003).
An important feature of this program was taking up micro-level planning through the coordinated efforts ofthe management committees, teachers, students and guardians. By the year 2003, the project had covered36 districts and over 9.8 million primary school students. Evidence suggests that the initiatives undertakenunder the IDEAL project made a significant contribution to improvements in the quality of education in theIDEAL schools in comparison to the non-IDEAL schools (IER, 2002).
91MILLENNIUM DEVELOPMENT GOALS NEEDS ASSESSMENT AND COSTING (2009-2015) BANGLADESH
EDUCATION
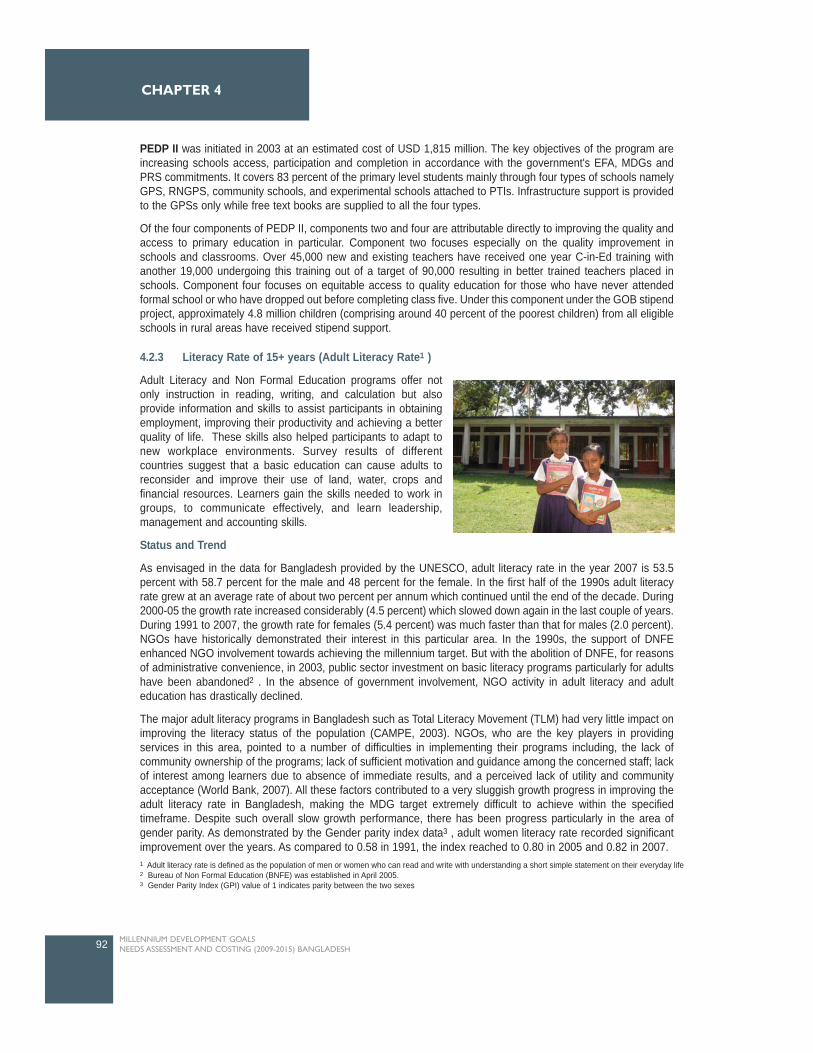
PEDP II was initiated in 2003 at an estimated cost of USD 1,815 million. The key objectives of the program areincreasing schools access, participation and completion in accordance with the government's EFA, MDGs andPRS commitments. It covers 83 percent of the primary level students mainly through four types of schools namelyGPS, RNGPS, community schools, and experimental schools attached to PTIs. Infrastructure support is providedto the GPSs only while free text books are supplied to all the four types.
Of the four components of PEDP II, components two and four are attributable directly to improving the quality andaccess to primary education in particular. Component two focuses especially on the quality improvement inschools and classrooms. Over 45,000 new and existing teachers have received one year C-in-Ed training withanother 19,000 undergoing this training out of a target of 90,000 resulting in better trained teachers placed inschools. Component four focuses on equitable access to quality education for those who have never attendedformal school or who have dropped out before completing class five. Under this component under the GOB stipendproject, approximately 4.8 million children (comprising around 40 percent of the poorest children) from all eligibleschools in rural areas have received stipend support.
4.2.3 Literacy Rate of 15+ years (Adult Literacy Rate1 )
Adult Literacy and Non Formal Education programs offer notonly instruction in reading, writing, and calculation but alsoprovide information and skills to assist participants in obtainingemployment, improving their productivity and achieving a betterquality of life. These skills also helped participants to adapt tonew workplace environments. Survey results of differentcountries suggest that a basic education can cause adults toreconsider and improve their use of land, water, crops andfinancial resources. Learners gain the skills needed to work ingroups, to communicate effectively, and learn leadership,management and accounting skills.
Status and Trend
As envisaged in the data for Bangladesh provided by the UNESCO, adult literacy rate in the year 2007 is 53.5percent with 58.7 percent for the male and 48 percent for the female. In the first half of the 1990s adult literacyrate grew at an average rate of about two percent per annum which continued until the end of the decade. During2000-05 the growth rate increased considerably (4.5 percent) which slowed down again in the last couple of years.During 1991 to 2007, the growth rate for females (5.4 percent) was much faster than that for males (2.0 percent).NGOs have historically demonstrated their interest in this particular area. In the 1990s, the support of DNFEenhanced NGO involvement towards achieving the millennium target. But with the abolition of DNFE, for reasonsof administrative convenience, in 2003, public sector investment on basic literacy programs particularly for adultshave been abandoned2 . In the absence of government involvement, NGO activity in adult literacy and adulteducation has drastically declined.
The major adult literacy programs in Bangladesh such as Total Literacy Movement (TLM) had very little impact onimproving the literacy status of the population (CAMPE, 2003). NGOs, who are the key players in providingservices in this area, pointed to a number of difficulties in implementing their programs including, the lack ofcommunity ownership of the programs; lack of sufficient motivation and guidance among the concerned staff; lackof interest among learners due to absence of immediate results, and a perceived lack of utility and communityacceptance (World Bank, 2007). All these factors contributed to a very sluggish growth progress in improving theadult literacy rate in Bangladesh, making the MDG target extremely difficult to achieve within the specifiedtimeframe. Despite such overall slow growth performance, there has been progress particularly in the area ofgender parity. As demonstrated by the Gender parity index data3 , adult women literacy rate recorded significantimprovement over the years. As compared to 0.58 in 1991, the index reached to 0.80 in 2005 and 0.82 in 2007.
92 MILLENNIUM DEVELOPMENT GOALS NEEDS ASSESSMENT AND COSTING (2009-2015) BANGLADESH
CHAPTER 4
1 Adult literacy rate is defined as the population of men or women who can read and write with understanding a short simple statement on their everyday life2 Bureau of Non Formal Education (BNFE) was established in April 2005.3 Gender Parity Index (GPI) value of 1 indicates parity between the two sexes
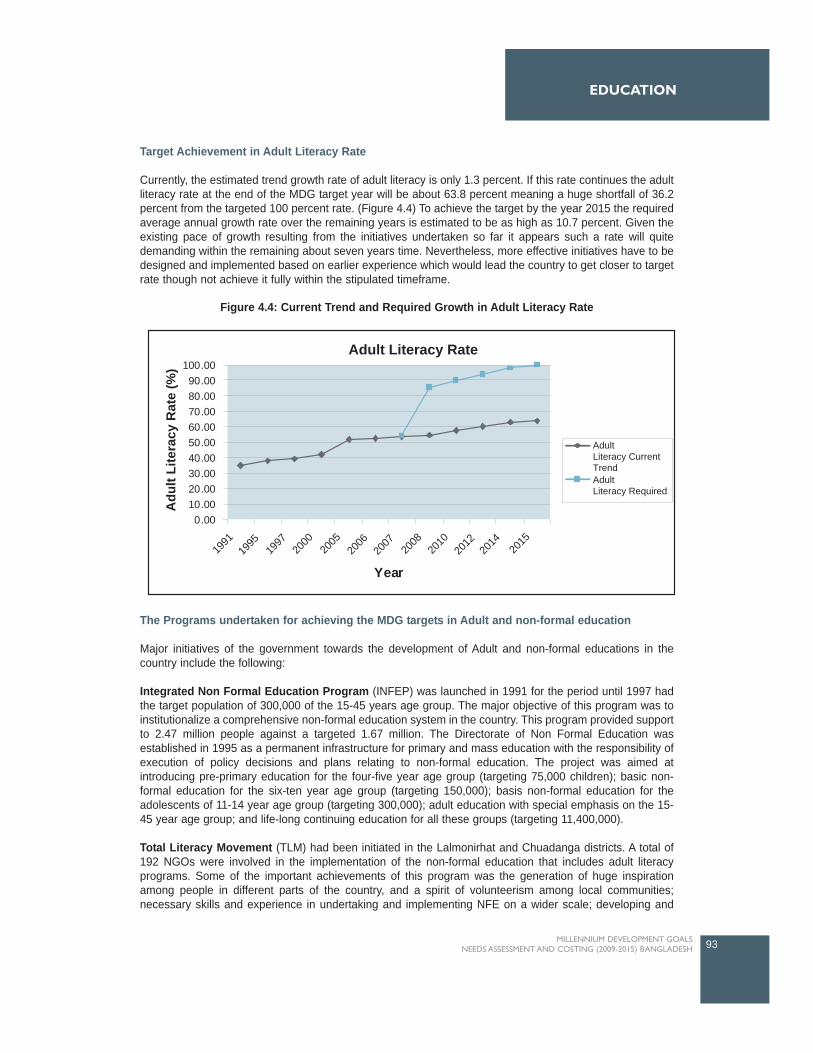
Target Achievement in Adult Literacy Rate
Currently, the estimated trend growth rate of adult literacy is only 1.3 percent. If this rate continues the adultliteracy rate at the end of the MDG target year will be about 63.8 percent meaning a huge shortfall of 36.2percent from the targeted 100 percent rate. (Figure 4.4) To achieve the target by the year 2015 the requiredaverage annual growth rate over the remaining years is estimated to be as high as 10.7 percent. Given theexisting pace of growth resulting from the initiatives undertaken so far it appears such a rate will quitedemanding within the remaining about seven years time. Nevertheless, more effective initiatives have to bedesigned and implemented based on earlier experience which would lead the country to get closer to targetrate though not achieve it fully within the stipulated timeframe.
The Programs undertaken for achieving the MDG targets in Adult and non-formal education
Major initiatives of the government towards the development of Adult and non-formal educations in thecountry include the following:
Integrated Non Formal Education Program (INFEP) was launched in 1991 for the period until 1997 hadthe target population of 300,000 of the 15-45 years age group. The major objective of this program was toinstitutionalize a comprehensive non-formal education system in the country. This program provided supportto 2.47 million people against a targeted 1.67 million. The Directorate of Non Formal Education wasestablished in 1995 as a permanent infrastructure for primary and mass education with the responsibility ofexecution of policy decisions and plans relating to non-formal education. The project was aimed atintroducing pre-primary education for the four-five year age group (targeting 75,000 children); basic non-formal education for the six-ten year age group (targeting 150,000); basis non-formal education for theadolescents of 11-14 year age group (targeting 300,000); adult education with special emphasis on the 15-45 year age group; and life-long continuing education for all these groups (targeting 11,400,000).
Total Literacy Movement (TLM) had been initiated in the Lalmonirhat and Chuadanga districts. A total of192 NGOs were involved in the implementation of the non-formal education that includes adult literacyprograms. Some of the important achievements of this program was the generation of huge inspirationamong people in different parts of the country, and a spirit of volunteerism among local communities;necessary skills and experience in undertaking and implementing NFE on a wider scale; developing and
93MILLENNIUM DEVELOPMENT GOALS NEEDS ASSESSMENT AND COSTING (2009-2015) BANGLADESH
EDUCATION
Year
Adult Literacy Rate
Adu
lt Li
tera
cy R
ate
(%) 100.00
90.0080.0070.0060.0050.0040.0030.0020.0010.000.00
AdultLiteracy CurrentTrendAdultLiteracy Required
1991
1995
1997
2000
2005
2006
2007
2008
2010
2012
2014
2015
Figure 4.4: Current Trend and Required Growth in Adult Literacy Rate

extending areas of cooperation between the government and NGOs; experience and skills in implementingpost literacy programs and material development (Rashid, Harun. 2003).
Based on the experiences of the INFEP some non-formal education projects were undertaken namely,NFEP 1, 2, 3, 4. NFPE 1 was formulated with the major objectives of reducing poverty and improving thestatus of women. This program, implemented between 1996-2001 included only illiterate young adults aged15-24 years, estimated to be approximately 2.95 million people. The program started in 32 of the 64 districtsselected based on below 45 percent literacy rate criteria. The estimated total cost of the project was BDT2,208.90 million composed of GoB, World Bank, ADB and SDC funding.
NFPE 2 was implemented during 1995-2002 with a target population of 5.88 million falling in the group aged11-45 years. A special feature of the program was large scale mobilization and motivation of non-literatesand adults educated with a view to developing sense of belonging among them. The program wasimplemented through the three delivery modes: TLM, CBA, and NFE through books. Terminal evaluation ofthe program undertaken in Lalmonirhat indicated a 94 percent success rate and a drop out rate of threepercent (Haque, 1997).
NFPE 3 was targeted to the Hard to Reach urban children of the age group of 8-14 years living in the sixmetropolitan cities of the country. The project was implemented during 1996 to 2004 following Centre BasedApproach covering 35 thousand slum, street, floating and working children. The course duration was twoyears targeting 270,000. The estimated total cost of the project was BDT805.5 million with financialassistance from the GoB, SIDA, UNICEF and DFID.
NFPE 4 was undertaken for those in the age group of 11-45 years and who could not be covered under othernon formal education projects. This project was implemented in 448 Upazilas of 62 districts with anestimated cost of BDT 6,829.96 million during 1997 and 2003. The major objectives of these programs wereto provide literacy to 22.89 million people, and to create employment opportunities for the educated andunemployed young male and female following TLM approach.
PLCEHD-1, a five-year project, was implemented by the government during January 2001 to December2007, supported by the World Bank and Swiss Agency for Development Cooperation with the fundamentalobjective of consolidation of literacy followed by application of literacy skills in skill training for incomegeneration. The coverage of this program is 1.3626 million neo neo-literates in 230 upazilas of 32 districts.The target achievement of the project is about 72 percent (i.e., only 0.973 million people have been providedpost literacy and continuing education).
PLCEHD-2, similar to the above, supported by ADB, SDC and DFID that came into operation at the fieldlevel in May 2008 and due to be completed in 2011 has a coverage of 1.60 million neo-literates of age group11-45 years in 210 Upazilas of 29 districts.
PLCEHD-3, a pilot project, was designed with support from the IDB to cover 63,000 neo-literates who havedropped out of schools and/or graduated from TLM, in two Upazilas in the age group of 11-45 years.
Reaching Out of Schools Children (ROSC) project is currently under implementation (2004-2009) with anestimated cost of about USD 63 million. The major objective of this project is promoting primary educationthrough a non-formal community managed approach targeting a total of 500,000 children during the projectperiod. This project is being implemented in 60 Upazilas. ROSC develops interventions to encourage out ofschool children to attend school, and to retain these children by improving the quality of education in theseschools.
The Basic Education for Hard to Reach Urban Children Project (BEHTRUC) was implemented during1997-2003 with the major objective of providing non-formal education (including basic education up to gradethree as well as life skills) to poor and under-privileged working children in the age group of 8-14 years,often engaged in hazardous jobs. The total budget for the project, as of March 2004, was BDT 805.799
94 MILLENNIUM DEVELOPMENT GOALS NEEDS ASSESSMENT AND COSTING (2009-2015) BANGLADESH
CHAPTER 4
million comprising of BDT 778.592 million donor and BDT 27.207 million GoB contribution. The project wasdesigned to provide education to 351,000 working children two years of schooling (two hours a day) in sixdivisional head quarters. UNICEF provided technical support while funds were drawn from DFID, SIDA,UNICEF and the Government of Bangladesh. The project offered a 24 month course on literacy andnumeracy and skill development. The terminal evaluation report prepared in 2004 revealed that the projectbenefited 346,000 children across the six divisional cities and successfully attained gender equity in termsof numbers.
Basic Education for Hard to Reach Working Children (BEHTRUWC) Project Second Phase is designedfor an implementation period of five years, begun in October 2004. This is in fact a formal approach in a non-formal way. A total of 8000 centers are to be set up under this project for serving about 200,000 workingchildren aged 10-14 years, comprising 60 percent girls in six divisional cities of the country. The learners areselected from children engaged in hazardous and exploitative occupations without access to education. Ofthe target 200,000 children, 20,000 are to be selected for livelihood skills training (of the age 13 years andabove) and 5,000 of them would be provided with livelihood skills training by the project.
4.2.4 Overview of Early Childhood Care and Education (ECCE) and Secondary Education
Although the focus of this study is primary and non-formal education but pre-primary and secondaryeducation has also been covered on certain logical grounds. Effectiveness of Pre-Primary education inincreasing enrolment at the primary level has been well established. It prepares the potential primary-agegroup children for attendance at primary education institutions. Secondary education creates strongawareness among the parents about the necessity and importance of education for their children, supplieshuman resources for most MDGs, and realizes certain returns to education particularly for girls. Moreover,non-formal education has been covered here to deal with Indicator on Adult Literacy Rate. The non-formaleducation system plays a considerable part in covering the school drop-out group, the hard to reach group,and illiterate adults in the society.
Early Childhood Care and Education (ECCE)
For pre-school aged children, preschool or early childhood education can contribute to human capitaldevelopment especially among poor children (Danzinger and Waldfogel, 2000). In line with EFA goals, NPAI proposed an Early Childhood Education Development Programme, covering the four-five year old children.NPA II also envisages that by 2015, all pre-school children, aged three-five, will be attending ECCEprograms of some kind and will have access to programmes of health, nutrition, social, physical andintellectual development, and initiated into formal education.
In Bangladesh although Early Childhood Care and Development is a relatively new concept severalinitiatives have already been undertaken by the government, NGOs, and development partners. BRAC,DAM, Save the Children USA, Plan International, UNICEF can be named as some of such organisationsworking in this area with a number of innovative programs which are mostly at their pilot stage and arerunning on a relatively small scale. These initiatives include, 'baby classes' within and outside primaryschools, need-based school preparedness skills programmes, pre-school programmes for thedisadvantaged, 'baby classes' in satellite schools, pre-reading, pre-writing and pre-numeracy skillsprogrammes, introduction of play groups and kindergarten classes in English medium schools, pre-primaryreligious education in maktabs, and literacy skills training in day care centres (UNESCO-IBE, 2006). Thetarget groups for these programmes are mothers, facilitators, community monitors.
The Integrated Non Formal Education Program began ECCE in 1993 in 69 thanas implemented by NGOswith support of the government and UNICEF. The major objective of this program was to prepare children inpoor, rural households for primary schooling. Ministry of Women and Children Affairs started an ECD projectin 2001 (up to 2004) which was implemented by Bangladesh Shishu Academy. Advocacy, caregivers'education, school readiness, and networking and capacity building had been the major activities of thisproject.
95MILLENNIUM DEVELOPMENT GOALS NEEDS ASSESSMENT AND COSTING (2009-2015) BANGLADESH
EDUCATION
Ministry of Religious Affairs has been undertaking programs (2006-08) to provide pre-primary education to1,620,000 children through 18,000 education centers (mosques) at an estimated cost of BDT 2,160 million.They also have future targets aimed at covering 3,600,000 children through 24,000 centers during 2009-13.Another program that is currently underway (2006-08) of the ministry is to provide pre-primary education to80,610 children through 2,687 temples at an estimated cost of BDT 75.7 million. Further extension of thisproject (2009-10) will cover 161,220 children through the same number of temples.
BRAC and NGO has initiated its own program of one year pre-primary class. As of 2005, 16,025 pre-primarycenters are in operation with 400,625 children (25 in each class).
Secondary Education
At the secondary level three categories of schools are in operation across the country (Junior secondary,public secondary and private secondary schools). According to BANBEIS data of 2005, the total number ofsecondary schools in the country is 18,500 comprising 4,322 Junior secondary schools, 317 PublicSecondary schools and 13861 Private Secondary schools. About 20 percent of these schools are exclusivelyfor the female students. Approximately 86 percent of these schools are located in the rural areas. The totalnumber of teachers working in these schools is 238,158 with 20.28 percent female. The average teacher-student ratio is 1:33. The proportion of trained teachers is much high in the public schools (73.08 percent)than in the private schools (53.53 percent). On average, female enrolment (52.28 percent) is higher than thatfor males. But the issue that needs special attention is the consistently low rate of completion at thesecondary level. In 2005, the completion rate is estimated at a mere 19.98 percent (23.46 percent male and16.71 percent female).
During the last decade the government has undertaken a number of programs aimed at improving accessto, and increasing the quality of, secondary education, as well as reducing the drop out rate, and increasingfemale enrolment and survival rate at the secondary level. Developing and expanding physical infrastructure,the construction of new buildings, supplying computer and other office equipments, providing financialsupport to the female students through the stipend program, imparting training to the teachers and the headteachers to improve their efficiency have been the major activities under these initiatives. These projects aresupported by the government and development partners. The programs include the following:
Improvement of Selected Madrashas (government and non-government) Project (1997-2004) at anestimated cost of BDT 1,997.5 million funded by the government;Improvement of Selected Secondary Schools (government and non-government) Project (1997-2007) at an estimated cost of BDT 5,200 million and funded by the GoB. Extension of the existing buildings of the Selected Education Institutions Project (1999-2006) withan estimated cost of BDT 4,830.7 million funded by the GoBConstruction and re-construction of the Education Institution Buildings Project (1998-2006) with anestimated cost of BDT 5,000 million funded by GoBSecondary Education Sector Improvement Project (1999-2006) funded by GoB and ADB at anestimated cost of BDT 4,902 millionFemale Secondary Stipend Project - Phase II (2005-08) at a cost of BDT 5,029.86 million from GoBsourcesFemale Secondary School Assistance Project - Phase II (2001-07) at a cost of BDT 7,662.68 millionfunded by IDAFemale Secondary Education Stipend Project - Phase III (2004-06) at an estimated cost of BDT209.96 million funded by NORADTeaching Quality Improvement in Secondary Education Project (2005-11) at an estimated cost ofBDT 6,301.9 million funded by GoB, CIDA, and ADB
96 MILLENNIUM DEVELOPMENT GOALS NEEDS ASSESSMENT AND COSTING (2009-2015) BANGLADESH
CHAPTER 4
4.3 The Challenges ahead in achieving Universal Primary Education
Although there has been satisfactory progress in certain areas in achieving the goal of universal access toeducation, there are still many challenges that must be met to fully realize the MDG2 target. Some of themajor challenges facing basic education are mentioned below.
4.3.1 Primary Education
Although the MDG target for net enrolment rate has been set 100 percent by the year 2015, and the currentprogress that the country is well on track for achieving the target, in reality it may be difficult to achieve thistarget fully for several reasons. One of the reasons is an anticipated slow down of the rate of growth as itapproaches the 100 percent target. Indeed, it has been empirically demonstrated that, once countries attaina NER of say 90 to 95 percent, it usually becomes very challenging and costly to reach the last five-tenpercent of children who, for various reasons, are difficult to cover (nomadic, marginal populations,populations living in remote and land-locked areas, the poorest, and sick or disabled children, ethnicminorities having difficulties in understanding Bangla, etc.) (UNESCO, 2005).
Bangladesh is currently running one of the largest primary education sectors in the world. Yet theorganizational capacity needed to run such a huge primary education system would be a big challenge forany country in the world. Insufficient instructional time, inadequate number of classrooms and teaching staff,low teacher effectiveness, lack of sufficient teaching-learning materials, and a lack of adequately trainedmanpower to manage such a large education system are identified as some of the major constraints facingthe country's primary education system (DPE, 2006).
Government expenditure on education in Bangladesh is still low compared to other countries in South Asia.Although about 39.51 percent of the annual budget is dedicated for primary education it accounts for only2.28 percent of the country's GDP. The proportion needs to be enhanced to four-five percent to effect effortstowards achieving the MDG targets.
Despite satisfactory achievements in providing access to primary education, a large part of the population(especially the physically and mentally challenged, geographically, socially or economically hard to reachchildren) remain out of the facility. A large proportion of the tribal/indigenous populations, living mainly in theChittagong and Sylhet divisions, and in remote parts of the north of the country, have not yet beenadequately reached by the primary school expansion of the government (ADB, 2005)
Eradicating the high incidence of poverty has been one of the biggest challenges on the way of achievingthe MDG2 targets. Low incentives for attending schools vis-à-vis acute poverty in the families keep thechildren away from the schools as they have to engage in wage-earning for a living. This contributes to alow attendance rate and a high drop-out rate.
Linkages between infrastructure and education have already been established. Improved roads andtransportation have major implications for enrolment ratios, especially for girls' enrolment and attendancerates (particularly those living in rural areas), Many government schools are too far away or too crowded,discouraging the parents from sending their children to school. It is especially true in the case of girl studentsin rural areas.
Current progress in net enrolment and the gender situation gives a strong indication that the country is wellon track in achieving the respective targets (100 percent net enrolment and gender parity in primary schools)well ahead of the stipulated time frame. The current trend growth rate for net enrolment rate at the primarylevel is estimated at 1.97 percent. If this growth continues the target will be achieved by the year 2012.Nevertheless, there is no scope for complacency from sustaining the current rate of growth in enrolment andgender ratio with the ongoing initiatives at the primary level.
97MILLENNIUM DEVELOPMENT GOALS NEEDS ASSESSMENT AND COSTING (2009-2015) BANGLADESH
EDUCATION

On the other hand, progress in primary school completion or the survival rate to grade five poses a bigchallenge in achieving the education MDG. The trend growth rate for primary cycle completion is estimatedto be 1.3 percent during 1990 and 2005. This growth performance is way below the warranted growth ratefor achieving the 100 percent target due the low completion rate (40 percent) in the initial year. In 2007 theachievement in this area is only 51.9 percent. If current growth trend continues in the remaining years onlyabout 80 percent completion rate will be achieved by the year 2015. At this situation achieving the target bythe year 2015 requires an average annual growth rate about 11.5 percent. This indeed appears to be quitechallenging from the Bangladesh perspective because of certain realities such as high incidence of povertyand resource constraints. However, interventions to deal with these issues are suggested in this study whichwould help in improving the situation greatly and achieving the MDG target.
4.3.2 Adult Literacy
In the case of adult literacy the situation is even worse. During 1991 and 2007 adult literacy rate increasedfrom as low as 35.3 percent to 53.5 percent. Although female literacy rate during this period has increasedat an average annual rate of 5.4 percent that for the male recorded two percent growth per annum. The trendgrowth rate for this indicator, estimated at 1.3 percent, suggests that only 63.8 percent literacy rate will beachieved by the year 2015. This situation however warrants special attention in view of the MDG target.Creating adequate opportunities for the adults is vitally important for addressing this issue despite thechallenges posed by the prevailing poverty situation. Continuity of adult literacy programs for longer periodswith wider coverage through increasing the number of learning centers can contribute to increasing the adultliteracy rate by a significant proportion. This initiative can really take the country much closer to the 100percent target by the end of the MDG target period.
As seen above, although the progress in achieving the targets has been commendable in Bangladesh,challenges remain especially in primary cycle completion rates and adult literacy. This issue is really a greatcause of concern for the government as well as for the development partners who are taking part in theinitiatives in Bangladesh. It is imperative that current efforts be carried on and new initiatives introducedfocused especially on retaining enrolled pupils for the full five years of the primary education cycle, and onproviding teaching to an increased percentage of the adult population. This study, however, makes anattempt to assess the current situation and identify the needs for meeting the Millennium Summitcommitment. Based on these needs, the study also attempts to estimate the resource requirements(physical, human and financial) for achieving universal access to primary education by the year 2015.
4.4 Major Interventions and Targets for MDG2
In view of the current situation however, it appears quite challenging to attain 100 percent primary cyclecompletion rate and 100 percent adult literacy rate within the remaining seven years. This study has howeveridentified certain necessary measures, in addition to existing ones, to improve the current situation andachieve the education MDG. These measures or interventions have been identified through a wide range ofconsultations within and outside the education thematic working group. The education thematic workinggroup comprises representatives from relevant ministries, government departments and agencies, anddevelopment partners. Consultation also made with NGO professionals, and academics. In addition,relevant research, policy and other documents have also been reviewed.
Improving the quality of primary education, creating a child friendly atmosphere at the primary schools,creating adequate physical infrastructure provisions, reducing opportunity cost of school attendance,providing incentives for the key players at both demand and supply levels, and building mass awarenesshave been the key areas that need particular attention for achieving the millennium targets. Theseinterventions, however, have strong theoretical and practical backing as having successful test results fromdifferent countries of the world including Bangladesh. These interventions also largely comply with theNational Plan of Action prepared for the improvement of the primary education sector and the recentlyprepared Poverty Reduction Strategies of the government thereby meeting the MDG target.
98 MILLENNIUM DEVELOPMENT GOALS NEEDS ASSESSMENT AND COSTING (2009-2015) BANGLADESH
CHAPTER 4
The interventions that address the requirements for achieving the time-bound targets can broadly becategorized as supply side and demand side interventions. Supply side interventions deal with provisions forinfrastructure and human resources needs. On the other hand, demand side interventions address theneeds of the service recipients (i.e., the students enrolled in different education/literacy programs). Therecommended interventions, along with the current and future coverage targets for each of the foureducation sectors considered under this study, are discussed below separately.
4.4.1 Primary Education
Infrastructure provisions: Creating adequate accommodation for primary school aged children isimportant from both enrolment and completion perspective. Although success in net enrolment has beenquite remarkable, primary cycle completion remains a major challenge with regard to achieving the 100percent target by the year 2015. High pupil -teacher ratio (54:1) and low contact hours have been identifiedas the areas that require special attention. In Bangladesh about 90 percent of primary schools, particularlyin the public sector, are run on two shifts following the staggering system. Therefore, increasing the contacthours will require all the existing double shift schools to convert to single shift systems. In this system therewill be an increased requirement of classrooms and other rooms for conducting the learning activities.Classroom requirement in a single shift school system has been estimated in this study based on a standardclass size (one classroom per 40 children). The study proposes, in line with the National Plan of Action,provision of nine rooms in each school which includes five classrooms for primary section, one classroomfor Pre-primary section, one library, one staff room, and one computer room. However currently, theclassroom-staff room ratio stands at 6:1.
Adequate sanitation facilities for all enrolled children (separate toilets for the boys and the girls) and theteachers have been proposed in this study. These two interventions are expected to contribute significantlyto increasing enrolment and also the primary cycle completion rate. The cost of construction that includesclassrooms, office rooms, laboratories and other rooms is estimated at, on an average, BDT 210,000 andconstruction cost of toilets is estimated at BDT 50,000.
Human resource provision and its development: Human resource provisions include supply of requirednumber of teachers. The requirement for new teachers is determined based on the standard pupil-teacherratio of 40:1. The targeted proportion of trained teachers (or skilled) for the year 2015 is set at 100 percentwhich is currently 72 percent. Adequate financial provisions for a variety of skill development training for allteachers (including subject-based training and monthly refreshers training) has been made while estimatingthe cost and assessing the human resource needs in light of achieving the MDG2. The estimated per teachercost of these trainings together approximately stands at ten percent of teachers' salary per annum.
Teaching - Learning Materials: Textbooks for children and teaching manuals for the primary level areproposed to be provided free to children and teachers. Free distribution of these two categories of teaching-learning materials is already in place at both primary and non-formal levels. However, the life span for thetextbooks and teaching guides has been estimated at one year and five years respectively.
Other Supply side Interventions: Other supply side interventions, in the current study, include programsto be initiated at the primary level in general. Enhancing salaries of the primary school teachers byapproximately 20 percent, and giving excellence allowances to stimulate better performers are the two othermajor supply side interventions that might contribute significantly to motivating the teachers to providequality teaching with regular attendance and adequate levels of sincerity. The amount of this award isestimated to be approximately BDT 3,500 (one month's basic salary) each to 1,000 teachers every year.
Demand side interventions: Demand side interventions are those that have been proposed in the currentneed assessment and costing exercise for the service recipients (i.e., the primary school attending children).The interventions such as school feeding program have been the tested cases with quite encouragingresults in increasing the enrolment rate. Currently the program is in place covering two percent of the total
99MILLENNIUM DEVELOPMENT GOALS NEEDS ASSESSMENT AND COSTING (2009-2015) BANGLADESH
EDUCATION
enrolled population. The study proposed that coverage be extended to 20 percent of the total primary schoolenrolled children, targeting in particular the poorest section (comprising approximately 40 percent who arecurrently living below the poverty line).
Pro-poor subsidies in the form of cash incentives have been considered here as a demand side intervention.This is undertaken as a compensation for the opportunity costs of poor children attending primary schools.An average amount of BDT 125 per month may be given to the parents of the enrolled children with 30percent coverage across the country.
In addition to the above mentioned provisions, other support, equivalent to an estimated BDT 500 per yearhas been created for each child. This includes health cards, remedial classes, and examination fees etc.Moreover, BDT 1,000 worth of additional support may be provided to each primary class per annum forbuying teaching-learning materials such as mats, chalk, duster, and sports materials etc.
4.4.2 Secondary Education (General and Technical):
Infrastructure provisions: Infrastructure provisions including the required number of classrooms, toilets foradequate sanitation facilities, and laboratories and other rooms have been determined based on thestandard ratio. Classrooms requirement is estimated based on the suggested student-classroom ratio of40:1. Moreover, three laboratories (approximately 20 percent of classrooms) have been suggested for eachschool for conducting practical classes properly.
For technical education classroom requirement is determined based on a student to classroom ratio of 20:1.As lessons in technical education are more practical oriented compared to general education, therequirement targets for laboratory and other rooms have been set at 50 percent and 15 percent respectivelyof the total number of classes.
Human resource: Provisions for human resources are estimated based on the standard student-teacherratio. The requirement of teachers at the secondary level is determined based on the student-teacher ratioof 40:1 (with an attrition rate of five percent). For teacher development in-service training should continuefor all categories of teachers. As an effective measure of human resource development regular in-servicetraining that includes monthly subject-based refresher training for the teachers is suggested.
In technical education, due to its specialized nature, the majority of teachers (90 percent target) are requiredto be well trained in their respective fields. To make lessons more interactive, and effective, the student-teacher ratio target for secondary level technical education is set at 20:1. In addition to the teaching staff, aconsiderable proportion of supervisory staff (target: 30 percent of teaching staff) is required to support theteachers in conducting practical classes. Moreover, clerical and other staff requirement target is set at 20percent (of the total teaching staff).
Demand side interventions: To increase enrolment and the secondary completion rate, pro-poor subsidiesin the form of stipends are already in place. But the current coverage is only two percent of the total enrolledstudents. The coverage may be extended to 20 percent by the year 2015. The amount of stipend may alsobe increased to BDT 150 from the existing rate of BDT 125 on the average.
4.4.3 Non-Formal Education
The major intervention in increasing enrolment in non-formal education programs targeted for illiterate adultsor youth could be increasing the number of learning centers. These learning centers are to be locatedgenerally close to the work places of the learners, and the programs are to be run with flexible timing
100 MILLENNIUM DEVELOPMENT GOALS NEEDS ASSESSMENT AND COSTING (2009-2015) BANGLADESH
CHAPTER 4
Facilitators and supervisors at the field levels are directly engaged in implementing these programs.Currently two non-formal education programs exist, namely Post Literacy and Continuing Education forHuman Development Phase II (PLCEHD 2) and Basic Education for Hard to Reach Urban Working Children(BEHTRUWC). The capacity of each learning center is 25 for PLCEHD, and 30 for BEHTRUWC programs.One facilitator takes care of each center. One supervisor is in charge of every 10 centers. However, theincreasing enrolment-adult literacy rate requires an increased number of learning centers to accommodatethe proportion of the population who are illiterate. The number of facilitators and supervisors required toconduct these programs on a larger scale is based upon the currently maintained proportions. As a measurefor teacher development, there will be regular in-service training programs for all the teachers/facilitators andfor that, an estimated cost equivalent to ten percent of the total individual salary is required per teacher.
Although there is no cash incentives for attending the literacy programs, provision is made for providing allnecessary learning materials such as books, writing pads, pencils etc free to all the program participants.
4.4.4 Early Childhood / Pre-primary Education
To run the pre-primary/early childhood education program NPA 2 has already suggested for constructing anextra classroom in each government primary school. Since the pre-primary education program will be runusing the public primary school infrastructure and there will be no requirement for any separate infrastructurefacility. For this program, the pupil-teacher and pupil-classroom ratio has been set at 35:1 in each case.
4.5 Resource Needs Estimates for MDG2
Resource requirements have been estimated in light of the interventions identified for addressing thechallenges associated with achieving the universal access to primary education. In doing this, the year 2005has been used as the base year as most of the relevant data is available for this year. Infrastructure andhuman resource requirements that include number of classrooms, laboratories, toilets and otherinfrastructure facilities, teachers, etc are determined following the guidelines of the national policydocuments. In other cases (e.g., in the area of demand side and other supply side interventions), estimationbases are finalized through consultation with the education thematic working group members (comprisingrepresentatives from relevant ministries, government departments, development partners), professionalsworking in the relevant areas and review of different research documents. The resource requirements forprimary, secondary, non-formal and early childhood education are provided separately in the following.
Further, the tables presented below provide a snapshot of capital, recurrent and per pupil cost for the period2005 through 2015 separately for all the four programs (pre primary, primary, secondary and adult literacy)studied for achieving the MDG for universal access to primary education in Bangladesh. Capital costscomprise new construction of classrooms, laboratories, staff rooms and other rooms, toilets etc. Buyingequipments for the teaching/learning activities is also considered under this head of expenditure. On theother hand, recurrent costs cover all the day to day expenses of the programs that include staff salaries,textbooks, teaching guides, rental cost, training costs, and costs incurred by any demand side interventionsconsidered in the cost estimation.
4.5.1 Primary Education
Primary education has been the major focus of the current exercise as MDG2 deals largely with universalaccess to primary education. Therefore, creating greater access, as well as retaining the current success inenrolment, and also dealing with the major problem of low rate of primary cycle completion, a number ofinterventions in terms of physical infrastructure, human resource, and other demand and supply sidesupports have been proposed. The physical and financial requirements for achieving the MDG in the areaof primary education are given below.
101MILLENNIUM DEVELOPMENT GOALS NEEDS ASSESSMENT AND COSTING (2009-2015) BANGLADESH
EDUCATION
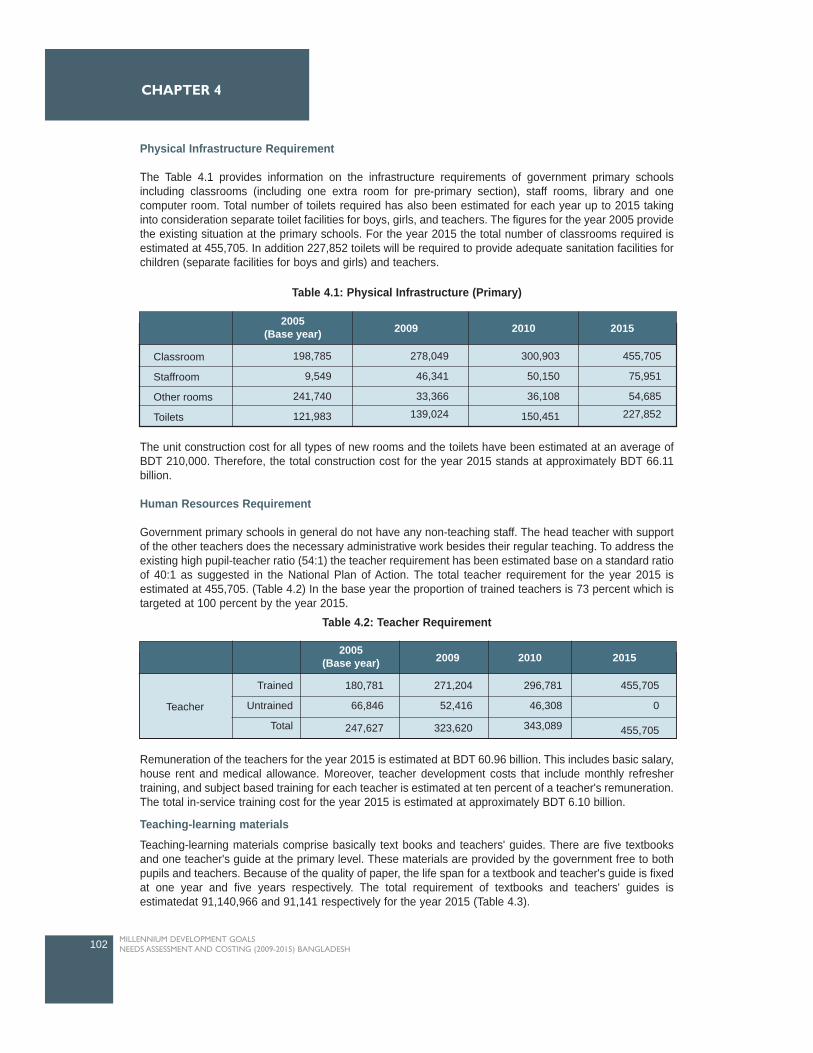
Physical Infrastructure Requirement
The Table 4.1 provides information on the infrastructure requirements of government primary schoolsincluding classrooms (including one extra room for pre-primary section), staff rooms, library and onecomputer room. Total number of toilets required has also been estimated for each year up to 2015 takinginto consideration separate toilet facilities for boys, girls, and teachers. The figures for the year 2005 providethe existing situation at the primary schools. For the year 2015 the total number of classrooms required isestimated at 455,705. In addition 227,852 toilets will be required to provide adequate sanitation facilities forchildren (separate facilities for boys and girls) and teachers.
The unit construction cost for all types of new rooms and the toilets have been estimated at an average ofBDT 210,000. Therefore, the total construction cost for the year 2015 stands at approximately BDT 66.11billion.
Human Resources Requirement
Government primary schools in general do not have any non-teaching staff. The head teacher with supportof the other teachers does the necessary administrative work besides their regular teaching. To address theexisting high pupil-teacher ratio (54:1) the teacher requirement has been estimated base on a standard ratioof 40:1 as suggested in the National Plan of Action. The total teacher requirement for the year 2015 isestimated at 455,705. (Table 4.2) In the base year the proportion of trained teachers is 73 percent which istargeted at 100 percent by the year 2015.
Remuneration of the teachers for the year 2015 is estimated at BDT 60.96 billion. This includes basic salary,house rent and medical allowance. Moreover, teacher development costs that include monthly refreshertraining, and subject based training for each teacher is estimated at ten percent of a teacher's remuneration.The total in-service training cost for the year 2015 is estimated at approximately BDT 6.10 billion.
Teaching-learning materialsTeaching-learning materials comprise basically text books and teachers' guides. There are five textbooksand one teacher's guide at the primary level. These materials are provided by the government free to bothpupils and teachers. Because of the quality of paper, the life span for a textbook and teacher's guide is fixedat one year and five years respectively. The total requirement of textbooks and teachers' guides isestimatedat 91,140,966 and 91,141 respectively for the year 2015 (Table 4.3).
102 MILLENNIUM DEVELOPMENT GOALS NEEDS ASSESSMENT AND COSTING (2009-2015) BANGLADESH
CHAPTER 4
2005(Base year) 2009 2010 2015
Classroom
Staffroom
Other rooms
Toilets
198,785
9,549
241,740
121,983
278,049
46,341
33,366
139,024
455,705
75,951
54,685
227,852
300,903
50,150
36,108
150,451
2005(Base year) 20102009 2015
Teacher
Trained
Untrained
Total
180,781
66,846
247,627
296,781
46,308
343,089
455,705
0
455,705
271,204
52,416
323,620
Table 4.1: Physical Infrastructure (Primary)
Table 4.2: Teacher Requirement
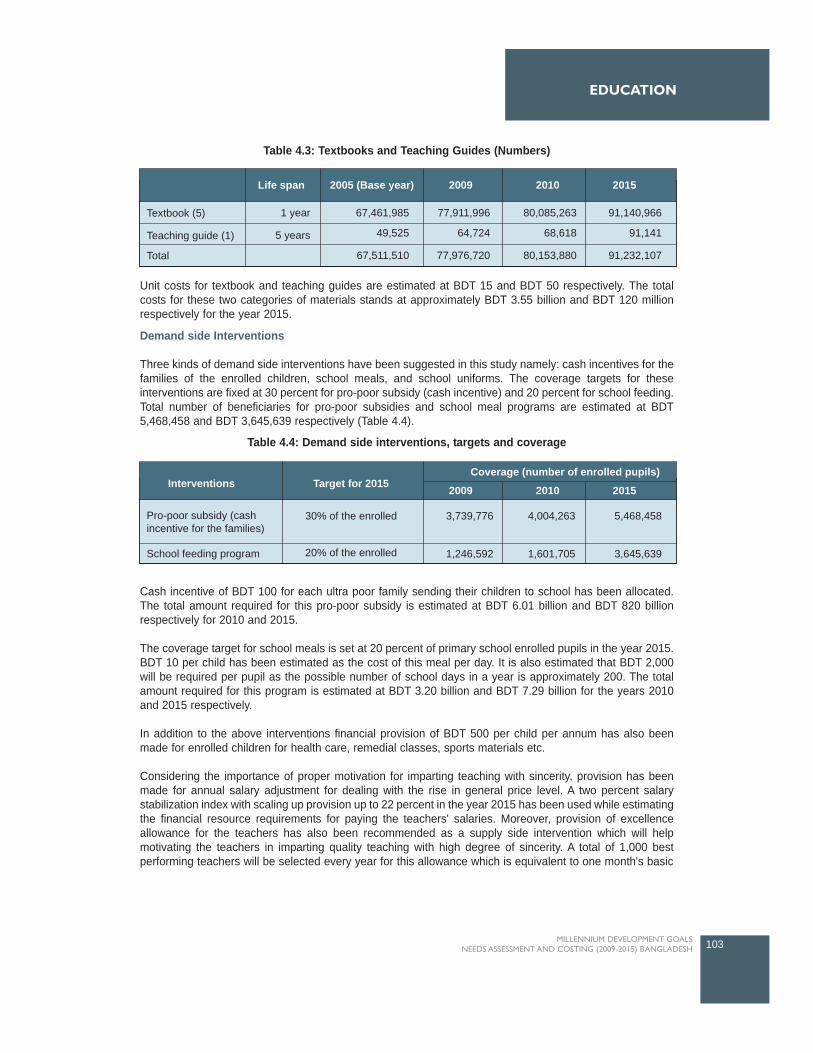
Unit costs for textbook and teaching guides are estimated at BDT 15 and BDT 50 respectively. The totalcosts for these two categories of materials stands at approximately BDT 3.55 billion and BDT 120 millionrespectively for the year 2015.
Demand side Interventions
Three kinds of demand side interventions have been suggested in this study namely: cash incentives for thefamilies of the enrolled children, school meals, and school uniforms. The coverage targets for theseinterventions are fixed at 30 percent for pro-poor subsidy (cash incentive) and 20 percent for school feeding.Total number of beneficiaries for pro-poor subsidies and school meal programs are estimated at BDT5,468,458 and BDT 3,645,639 respectively (Table 4.4).
Cash incentive of BDT 100 for each ultra poor family sending their children to school has been allocated.The total amount required for this pro-poor subsidy is estimated at BDT 6.01 billion and BDT 820 billionrespectively for 2010 and 2015.
The coverage target for school meals is set at 20 percent of primary school enrolled pupils in the year 2015.BDT 10 per child has been estimated as the cost of this meal per day. It is also estimated that BDT 2,000will be required per pupil as the possible number of school days in a year is approximately 200. The totalamount required for this program is estimated at BDT 3.20 billion and BDT 7.29 billion for the years 2010and 2015 respectively.
In addition to the above interventions financial provision of BDT 500 per child per annum has also beenmade for enrolled children for health care, remedial classes, sports materials etc.
Considering the importance of proper motivation for imparting teaching with sincerity, provision has beenmade for annual salary adjustment for dealing with the rise in general price level. A two percent salarystabilization index with scaling up provision up to 22 percent in the year 2015 has been used while estimatingthe financial resource requirements for paying the teachers' salaries. Moreover, provision of excellenceallowance for the teachers has also been recommended as a supply side intervention which will helpmotivating the teachers in imparting quality teaching with high degree of sincerity. A total of 1,000 bestperforming teachers will be selected every year for this allowance which is equivalent to one month's basic
103MILLENNIUM DEVELOPMENT GOALS NEEDS ASSESSMENT AND COSTING (2009-2015) BANGLADESH
EDUCATION
2005 (Base year)Life span 20102009 2015
Textbook (5)
Teaching guide (1)
Total
1 year
5 years
67,461,985
49,525
67,511,510
80,085,263
68,618
80,153,880
91,140,966
91,141
91,232,107
77,911,996
64,724
77,976,720
Target for 2015Interventions 2010
Coverage (number of enrolled pupils)
2009 2015
Pro-poor subsidy (cashincentive for the families)
30% of the enrolled
20% of the enrolled
3,739,776
1,246,592
4,004,263
1,601,705
5,468,458
3,645,639School feeding program
Table 4.3: Textbooks and Teaching Guides (Numbers)
Table 4.4: Demand side interventions, targets and coverage
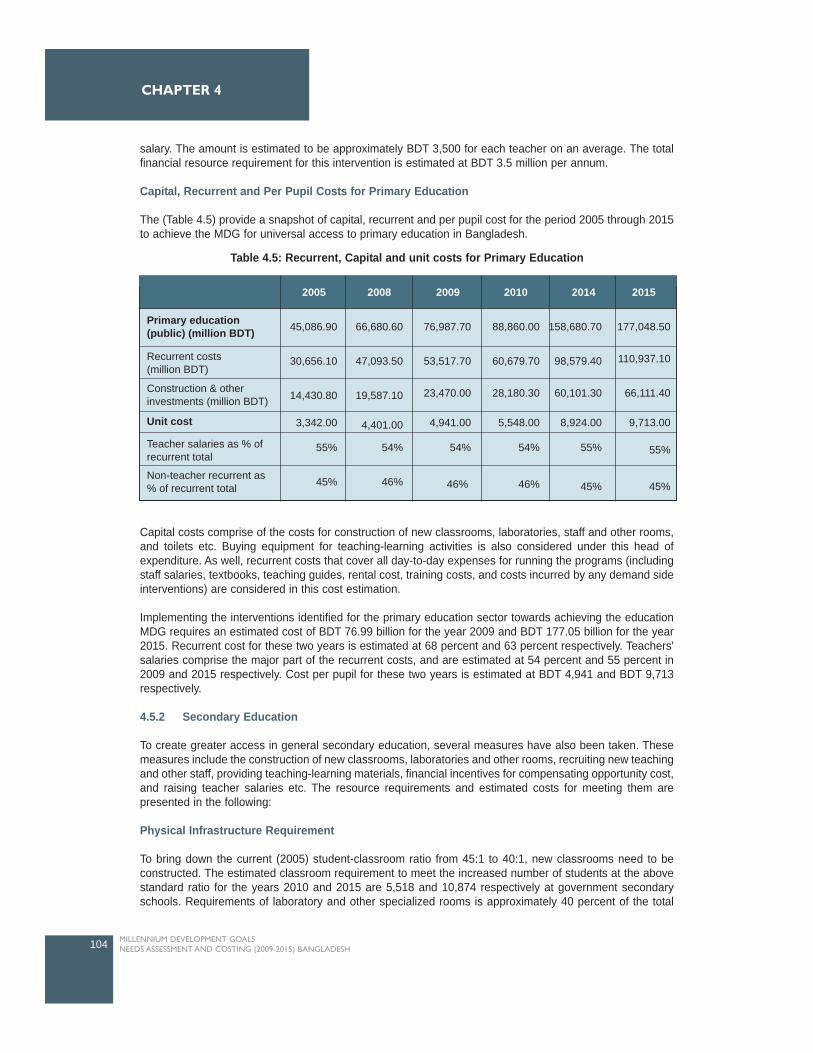
salary. The amount is estimated to be approximately BDT 3,500 for each teacher on an average. The totalfinancial resource requirement for this intervention is estimated at BDT 3.5 million per annum.
Capital, Recurrent and Per Pupil Costs for Primary Education
The (Table 4.5) provide a snapshot of capital, recurrent and per pupil cost for the period 2005 through 2015to achieve the MDG for universal access to primary education in Bangladesh.
Capital costs comprise of the costs for construction of new classrooms, laboratories, staff and other rooms,and toilets etc. Buying equipment for teaching-learning activities is also considered under this head ofexpenditure. As well, recurrent costs that cover all day-to-day expenses for running the programs (includingstaff salaries, textbooks, teaching guides, rental cost, training costs, and costs incurred by any demand sideinterventions) are considered in this cost estimation.
Implementing the interventions identified for the primary education sector towards achieving the educationMDG requires an estimated cost of BDT 76.99 billion for the year 2009 and BDT 177.05 billion for the year2015. Recurrent cost for these two years is estimated at 68 percent and 63 percent respectively. Teachers'salaries comprise the major part of the recurrent costs, and are estimated at 54 percent and 55 percent in2009 and 2015 respectively. Cost per pupil for these two years is estimated at BDT 4,941 and BDT 9,713respectively.
4.5.2 Secondary Education
To create greater access in general secondary education, several measures have also been taken. Thesemeasures include the construction of new classrooms, laboratories and other rooms, recruiting new teachingand other staff, providing teaching-learning materials, financial incentives for compensating opportunity cost,and raising teacher salaries etc. The resource requirements and estimated costs for meeting them arepresented in the following:
Physical Infrastructure Requirement
To bring down the current (2005) student-classroom ratio from 45:1 to 40:1, new classrooms need to beconstructed. The estimated classroom requirement to meet the increased number of students at the abovestandard ratio for the years 2010 and 2015 are 5,518 and 10,874 respectively at government secondaryschools. Requirements of laboratory and other specialized rooms is approximately 40 percent of the total
104 MILLENNIUM DEVELOPMENT GOALS NEEDS ASSESSMENT AND COSTING (2009-2015) BANGLADESH
CHAPTER 4
201020092005 2008 2014 2015
Primary education(public) (million BDT)
Recurrent costs (million BDT)
Construction & otherinvestments (million BDT)
Unit cost
Teacher salaries as % ofrecurrent total
Non-teacher recurrent as% of recurrent total
45,086.90
30,656.10
14,430.80
3,342.00
55%
45%
66,680.60
47,093.50
19,587.10
4,401.00
54%
46%
76,987.70
53,517.70
23,470.00
4,941.00
54%
46%
88,860.00
60,679.70
28,180.30
5,548.00
54%
46%
158,680.70
98,579.40
60,101.30
8,924.00
55%
45%
177,048.50
110,937.10
66,111.40
9,713.00
55%
45%
Table 4.5: Recurrent, Capital and unit costs for Primary Education
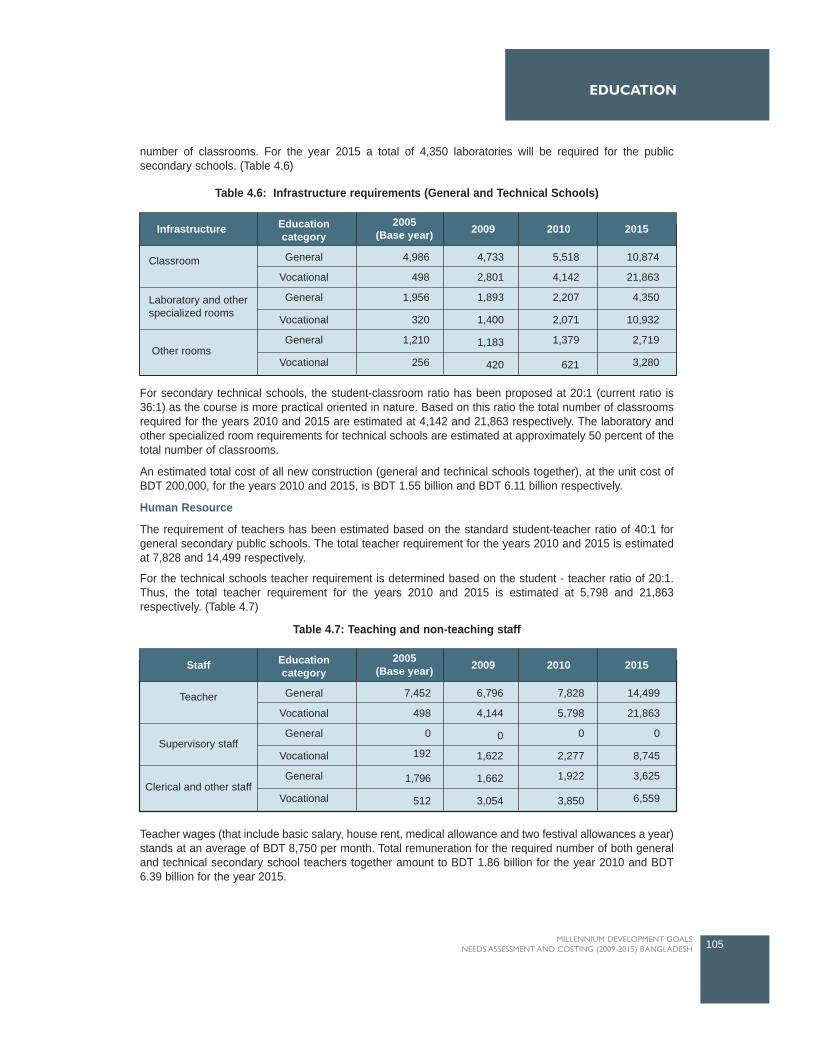
number of classrooms. For the year 2015 a total of 4,350 laboratories will be required for the publicsecondary schools. (Table 4.6)
For secondary technical schools, the student-classroom ratio has been proposed at 20:1 (current ratio is36:1) as the course is more practical oriented in nature. Based on this ratio the total number of classroomsrequired for the years 2010 and 2015 are estimated at 4,142 and 21,863 respectively. The laboratory andother specialized room requirements for technical schools are estimated at approximately 50 percent of thetotal number of classrooms.
An estimated total cost of all new construction (general and technical schools together), at the unit cost ofBDT 200,000, for the years 2010 and 2015, is BDT 1.55 billion and BDT 6.11 billion respectively.
Human Resource
The requirement of teachers has been estimated based on the standard student-teacher ratio of 40:1 forgeneral secondary public schools. The total teacher requirement for the years 2010 and 2015 is estimatedat 7,828 and 14,499 respectively.
For the technical schools teacher requirement is determined based on the student - teacher ratio of 20:1.Thus, the total teacher requirement for the years 2010 and 2015 is estimated at 5,798 and 21,863respectively. (Table 4.7)
Teacher wages (that include basic salary, house rent, medical allowance and two festival allowances a year)stands at an average of BDT 8,750 per month. Total remuneration for the required number of both generaland technical secondary school teachers together amount to BDT 1.86 billion for the year 2010 and BDT6.39 billion for the year 2015.
105MILLENNIUM DEVELOPMENT GOALS NEEDS ASSESSMENT AND COSTING (2009-2015) BANGLADESH
EDUCATION
2005(Base year)
Educationcategory
Infrastructure 20102009 2015
Classroom General
Vocational
General
Vocational
General
Vocational
4,986
498
1,956
320
1,210
256
4,733
2,801
1,893
1,400
1,183
420
5,518
4,142
2,207
2,071
1,379
621
10,874
21,863
4,350
10,932
2,719
3,280Other rooms
Laboratory and otherspecialized rooms
Table 4.6: Infrastructure requirements (General and Technical Schools)
2005(Base year)
Educationcategory
Staff 20102009 2015
Teacher General
Vocational
General
Vocational
General
Vocational
7,452
498
0
192
1,796
512
6,796
4,144
0
1,622
1,662
3,054
7,828
5,798
0
2,277
1,922
3,850
14,499
21,863
0
8,745
3,625
6,559Clerical and other staff
Supervisory staff
Table 4.7: Teaching and non-teaching staff
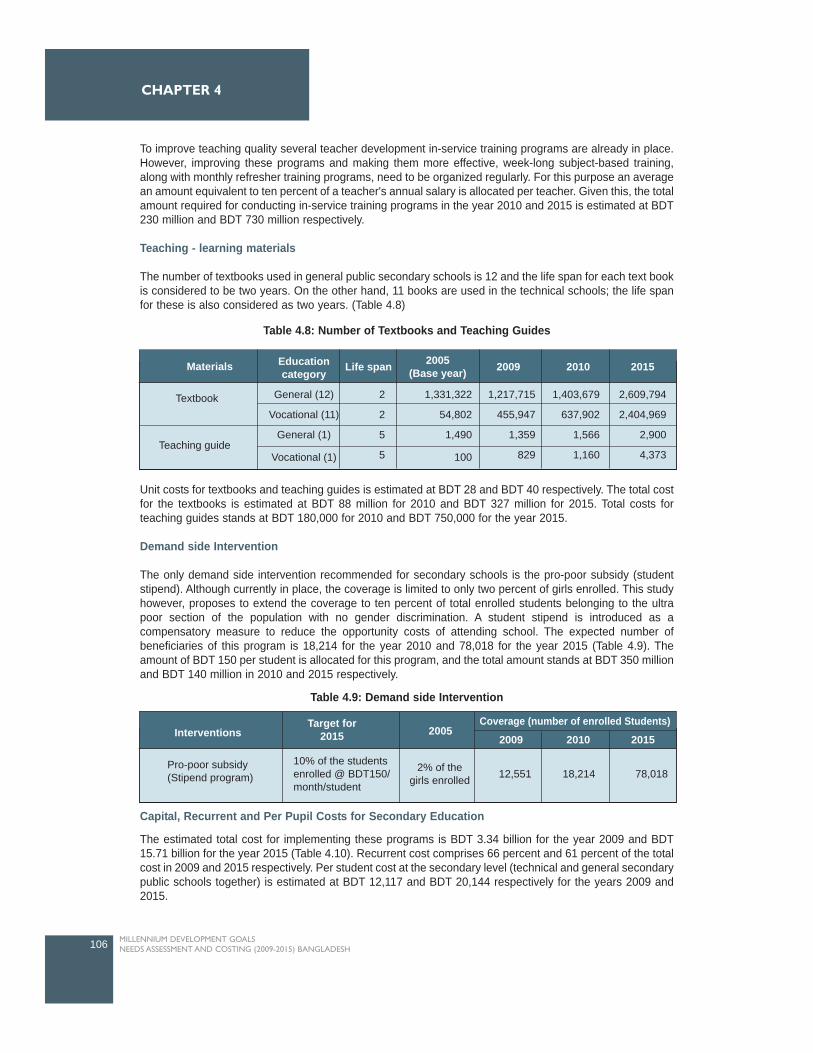
To improve teaching quality several teacher development in-service training programs are already in place.However, improving these programs and making them more effective, week-long subject-based training,along with monthly refresher training programs, need to be organized regularly. For this purpose an averagean amount equivalent to ten percent of a teacher's annual salary is allocated per teacher. Given this, the totalamount required for conducting in-service training programs in the year 2010 and 2015 is estimated at BDT230 million and BDT 730 million respectively.
Teaching - learning materials
The number of textbooks used in general public secondary schools is 12 and the life span for each text bookis considered to be two years. On the other hand, 11 books are used in the technical schools; the life spanfor these is also considered as two years. (Table 4.8)
Unit costs for textbooks and teaching guides is estimated at BDT 28 and BDT 40 respectively. The total costfor the textbooks is estimated at BDT 88 million for 2010 and BDT 327 million for 2015. Total costs forteaching guides stands at BDT 180,000 for 2010 and BDT 750,000 for the year 2015.
Demand side Intervention
The only demand side intervention recommended for secondary schools is the pro-poor subsidy (studentstipend). Although currently in place, the coverage is limited to only two percent of girls enrolled. This studyhowever, proposes to extend the coverage to ten percent of total enrolled students belonging to the ultrapoor section of the population with no gender discrimination. A student stipend is introduced as acompensatory measure to reduce the opportunity costs of attending school. The expected number ofbeneficiaries of this program is 18,214 for the year 2010 and 78,018 for the year 2015 (Table 4.9). Theamount of BDT 150 per student is allocated for this program, and the total amount stands at BDT 350 millionand BDT 140 million in 2010 and 2015 respectively.
Capital, Recurrent and Per Pupil Costs for Secondary Education
The estimated total cost for implementing these programs is BDT 3.34 billion for the year 2009 and BDT15.71 billion for the year 2015 (Table 4.10). Recurrent cost comprises 66 percent and 61 percent of the totalcost in 2009 and 2015 respectively. Per student cost at the secondary level (technical and general secondarypublic schools together) is estimated at BDT 12,117 and BDT 20,144 respectively for the years 2009 and2015.
106 MILLENNIUM DEVELOPMENT GOALS NEEDS ASSESSMENT AND COSTING (2009-2015) BANGLADESH
CHAPTER 4
Life span 2005(Base year)
Educationcategory
Materials 20102009 2015
Textbook General (12)
Vocational (11)
General (1)
Vocational (1)
2
2
5
5
1,331,322
54,802
1,490
100
1,217,715
455,947
1,359
829
1,403,679
637,902
1,566
1,160
2,609,794
2,404,969
2,900
4,373Teaching guide
Table 4.8: Number of Textbooks and Teaching Guides
Interventions 2010
Coverage (number of enrolled Students)
2009 2015
Pro-poor subsidy(Stipend program)
10% of the studentsenrolled @ BDT150/month/student
18,21412,551 78,018
Target for2015 2005
2% of thegirls enrolled
Table 4.9: Demand side Intervention
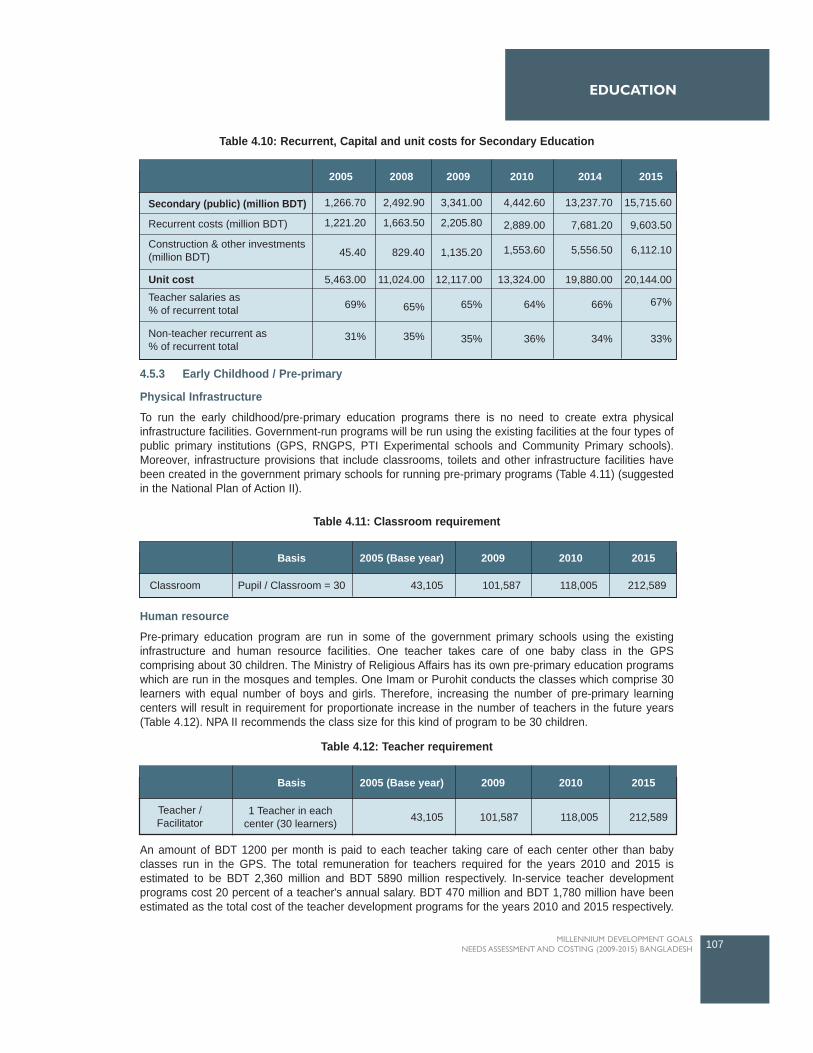
4.5.3 Early Childhood / Pre-primary
Physical Infrastructure
To run the early childhood/pre-primary education programs there is no need to create extra physicalinfrastructure facilities. Government-run programs will be run using the existing facilities at the four types ofpublic primary institutions (GPS, RNGPS, PTI Experimental schools and Community Primary schools).Moreover, infrastructure provisions that include classrooms, toilets and other infrastructure facilities havebeen created in the government primary schools for running pre-primary programs (Table 4.11) (suggestedin the National Plan of Action II).
Human resource
Pre-primary education program are run in some of the government primary schools using the existinginfrastructure and human resource facilities. One teacher takes care of one baby class in the GPScomprising about 30 children. The Ministry of Religious Affairs has its own pre-primary education programswhich are run in the mosques and temples. One Imam or Purohit conducts the classes which comprise 30learners with equal number of boys and girls. Therefore, increasing the number of pre-primary learningcenters will result in requirement for proportionate increase in the number of teachers in the future years(Table 4.12). NPA II recommends the class size for this kind of program to be 30 children.
An amount of BDT 1200 per month is paid to each teacher taking care of each center other than babyclasses run in the GPS. The total remuneration for teachers required for the years 2010 and 2015 isestimated to be BDT 2,360 million and BDT 5890 million respectively. In-service teacher developmentprograms cost 20 percent of a teacher's annual salary. BDT 470 million and BDT 1,780 million have beenestimated as the total cost of the teacher development programs for the years 2010 and 2015 respectively.
107MILLENNIUM DEVELOPMENT GOALS NEEDS ASSESSMENT AND COSTING (2009-2015) BANGLADESH
EDUCATION
20142005 2008 2009 2010 2015
Secondary (public) (million BDT)
Unit cost
Recurrent costs (million BDT)
Construction & other investments (million BDT)
Teacher salaries as % of recurrent total
Non-teacher recurrent as % of recurrent total
1,266.70
1,221.20
45.40
5,463.00
69%
31%
2,492.90
1,663.50
829.40
11,024.00
65%
35%
3,341.00
2,205.80
1,135.20
12,117.00
65%
35%
4,442.60
2,889.00
1,553.60
13,324.00
64%
36%
13,237.70
7,681.20
5,556.50
19,880.00
66%
34%
15,715.60
9,603.50
6,112.10
20,144.00
67%
33%
2005 (Base year)Basis 2009 2010 2015
Classroom Pupil / Classroom = 30 43,105 101,587 118,005 212,589
Table 4.10: Recurrent, Capital and unit costs for Secondary Education
Table 4.11: Classroom requirement
2005 (Base year)Basis 2009 2010 2015
Teacher /Facilitator
1 Teacher in eachcenter (30 learners) 43,105 101,587 118,005 212,589
Table 4.12: Teacher requirement

Teaching-learning materials
One book for the children and one teaching guide for the teachers have been the major teaching-learningmaterials for pre-primary classes (Table 4.13). These books are provided free to learners and teachers. Inaddition, school bags, slates, and pencils etc, are provided free to each children participating in the programwhich is equivalent to approximately BDT 500 per child per annum. In addition, each class is supplied withmats, colorful posters, toys and other small learning materials which will cost approximately BDT 500 perannum. These two supports together cost approximately BDT 3.12 billion in 2010 and BDT 8.55 billion in 2015.
Demand side InterventionSchool meals are the only demand side intervention proposed in this study as an incentive for attending thegovernment pre-primary education programs. This program is estimated to cover 20 percent of total childrenenrolled. The expected number of beneficiaries of this program is 1,275,534 for the year 2015 (Table 4.14). Anallocation of approximately BDT10 per day per child has been made for the children enrolled in the four typesof public primary schools. Total cost for the school meal program for the years 2010 and 2015 is estimated atBDT 0.75 billion and BDT 2.55 billion respectively.
Capital, Recurrent and Per Pupil Costs for Pre-primary / Early Childhood EducationTotal cost comprising both recurrent and capital costs (construction and other investments) is estimated atapproximately BDT 5671.5 million for the year 2009 and BDT 1,9470 million for the year 2015 (Table 4.15).Recurrent costs for these two years are estimated at 96 percent and 97 percent respectively. The reason forlow capital cost is due to the fact that construction cost is almost absent for this sector. Cost per pupil forthese two years is estimated at BDT 1,739 and BDT 3,053 respectively.
108 MILLENNIUM DEVELOPMENT GOALS NEEDS ASSESSMENT AND COSTING (2009-2015) BANGLADESH
CHAPTER 4
2005(Base year)
Number ofmaterials 2009 2010 2015
Textbook
Teaching guide
1 per student
1 per teacher
1,443,830
43,105
3,260,685
101,587
3,746,410
118,005
6,377,671
212,589
Interventions 2010
Coverage (number of enrolled students)
2009 2015
School meal (BDT 10/child/day) 20% of the enrolled 374,641260,855 1,275,534
Target for 20152005
Nil
201020092005 2008 2014 2015
Pre-primary (public)(million BDT)
Recurrent costs(million BDT)
Construction & otherinvestments (million BDT)
Unit cost
Teacher salaries as% of recurrent total
Non-teacher recurrent as% of recurrent total
1,625.70
1,552.50
73.20
1,126.00
40%
60%
4,375.20
4,214.60
160.60
1,569.00
36%
64%
5,671.50
5,469.00
202.50
1,739.00
35%
65%
7,199.60
6,947.00
252.60
1,922.00
34%
66%
16,299.25
15,733.00
566.30
2,799.00
32%
68%
19,470.00
18,847.10
622.90
3,053.00
31%
69%
Table 4.13: Teaching - learning materials
Table 4.14: Demand Side Intervention, Target and Coverage
Table 4.15: Recurrent, Capital and unit costs for Pre-primary Education
4.5.4 Non-formal Education
Currently two government programs namely Post Literacy and Continuing Education for HumanDevelopment (PLCEHD 2) and Basic Education for Hard to Reach Working Children (BEHTRWC) are inoperation to address the educational needs of adults and hard to reach working children. These programsare being implemented through a number of NGOs.
Post Literacy and Continuing Education for Human Development II (PLCEHD 2)
In PLCEHD 2 the size of enrolment is 63,240 with equal proportion of male and female participation coveringthe age group 11-45 years. Each learning center/class comprises 30 learners and is taken care of by onefacilitator. This program is being implemented by a total of 2108 learning centers. Enrolment in this programis expected to increase by approximately 66.5 percent for males and 71 percent for female learners toachieve 100 percent literacy rates by 2015 with an enrolment target of 7,062,496 learners by the year 2015.
A total of 2108 facilitators are currently imparting literacy training. One supervisory staff is responsible forevery ten centers. There are also 18 clerical and other staff involved in this program.
Monthly remuneration for a teacher and a supervisor are BDT 1500 and BDT 2500 respectively. Totalremuneration required for teachers in this program are estimated at BDT 666.31 million for 2010 and BDT12,683.83 million for 2015. Total remuneration required for the supervisors and other staffs engaged in thisprogram are estimated at BDT 169.62 million in 2010 and BDT 4141.99 million for the year 2015respectively. An amount equivalent to ten percent of a teacher's salary is spent on programs undertaken fora teacher's quality development.
A number of learning materials and teaching guides are provided free to the learners and teachersparticipating in the program, the estimated cost of which is BDT 328.10 million and BDT 7275.91 million for2010 and 2015 respectively.
On an average BDT 100 is spent per learner every year for other supports that include writing pads, pens,other learning materials, and buying fuel, etc. An estimated amount for this support stands at BDT 139.61million and BDT 3096.13 million for 2010 and 2015 respectively.
PLCEHD is run generally in rented rooms or spaces. BDT 10,500 is spent annually for rental purpose foreach learning center.
Basic Education for Hard to Reach Working Children (BEHTRWC)
This program was undertaken to address the educational needs of the working children who are basicallydropped out of the formal system. Although the target age group for this program is 11-14 years, this programwill contribute to increasing the adult literacy rate in the country. This program is currently being implementedthrough 2000 learning centers with a total enrolment of 20,000 male and 30,000 female learners. Enrolmentin each center is 25 and is taken care of by one facilitator. The enrolment rate is targeted to increase by 15percent through increasing the number of learning centers.
A total of 2000 facilitators are providing non-formal education to the working children. There is onesupervisory staff for every ten centers. Monthly remuneration of a teacher and a supervisor is BDT 1500 andBDT 2500 respectively. Total amount required to pay teachers and supervisors in the years 2010 and 2015are estimated at BDT 117 million and BDT 326 million respectively. Like the earlier programs an amountequivalent to ten percent of a teacher's remuneration is spent for teacher development in-service trainingprograms annually.
EDUCATION
109MILLENNIUM DEVELOPMENT GOALS NEEDS ASSESSMENT AND COSTING (2009-2015) BANGLADESH
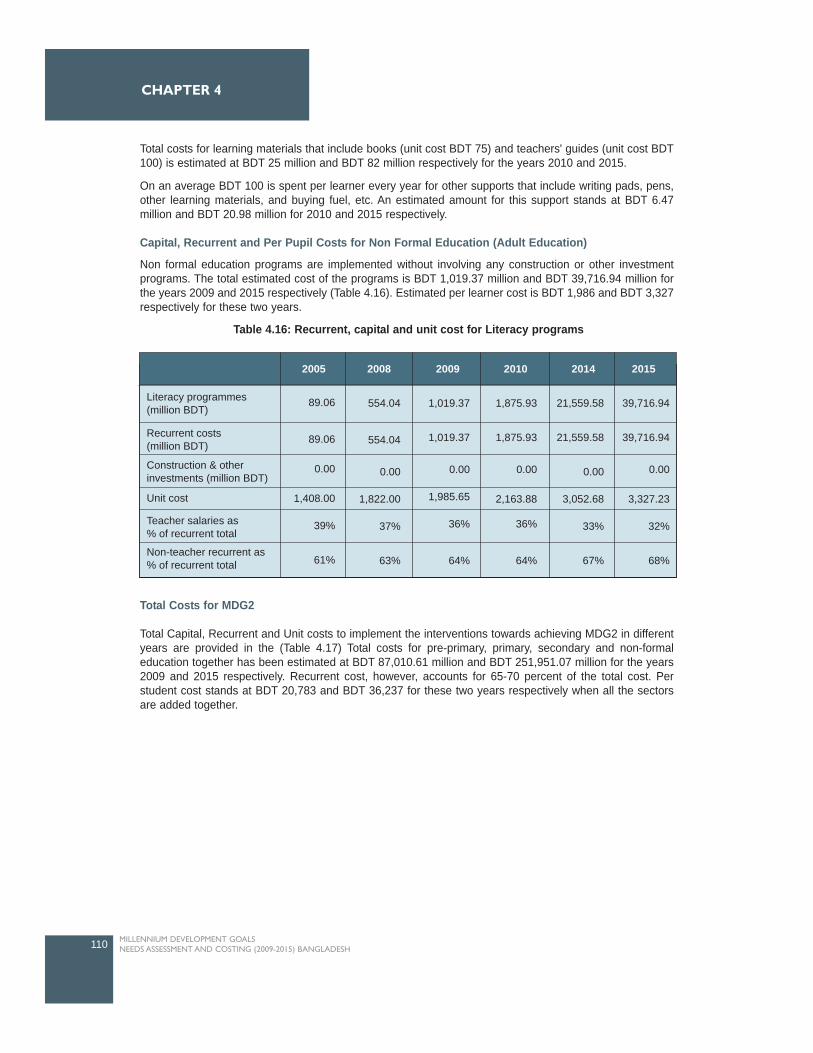
Total costs for learning materials that include books (unit cost BDT 75) and teachers' guides (unit cost BDT100) is estimated at BDT 25 million and BDT 82 million respectively for the years 2010 and 2015.
On an average BDT 100 is spent per learner every year for other supports that include writing pads, pens,other learning materials, and buying fuel, etc. An estimated amount for this support stands at BDT 6.47million and BDT 20.98 million for 2010 and 2015 respectively.
Capital, Recurrent and Per Pupil Costs for Non Formal Education (Adult Education)
Non formal education programs are implemented without involving any construction or other investmentprograms. The total estimated cost of the programs is BDT 1,019.37 million and BDT 39,716.94 million forthe years 2009 and 2015 respectively (Table 4.16). Estimated per learner cost is BDT 1,986 and BDT 3,327respectively for these two years.
Total Costs for MDG2
Total Capital, Recurrent and Unit costs to implement the interventions towards achieving MDG2 in differentyears are provided in the (Table 4.17) Total costs for pre-primary, primary, secondary and non-formaleducation together has been estimated at BDT 87,010.61 million and BDT 251,951.07 million for the years2009 and 2015 respectively. Recurrent cost, however, accounts for 65-70 percent of the total cost. Perstudent cost stands at BDT 20,783 and BDT 36,237 for these two years respectively when all the sectorsare added together.
110 MILLENNIUM DEVELOPMENT GOALS NEEDS ASSESSMENT AND COSTING (2009-2015) BANGLADESH
CHAPTER 4
201020092005 2008 2014 2015
Literacy programmes(million BDT)
Recurrent costs(million BDT)
Construction & otherinvestments (million BDT)
Unit cost
Teacher salaries as% of recurrent total
Non-teacher recurrent as% of recurrent total
89.06
89.06
0.00
1,408.00
39%
61%
554.04
554.04
0.00
1,822.00
37%
63%
1,019.37
1,019.37
0.00
1,985.65
36%
64%
1,875.93
1,875.93
0.00
2,163.88
36%
64%
21,559.58
21,559.58
0.00
3,052.68
33%
67%
39,716.94
39,716.94
0.00
3,327.23
32%
68%
Table 4.16: Recurrent, capital and unit cost for Literacy programs
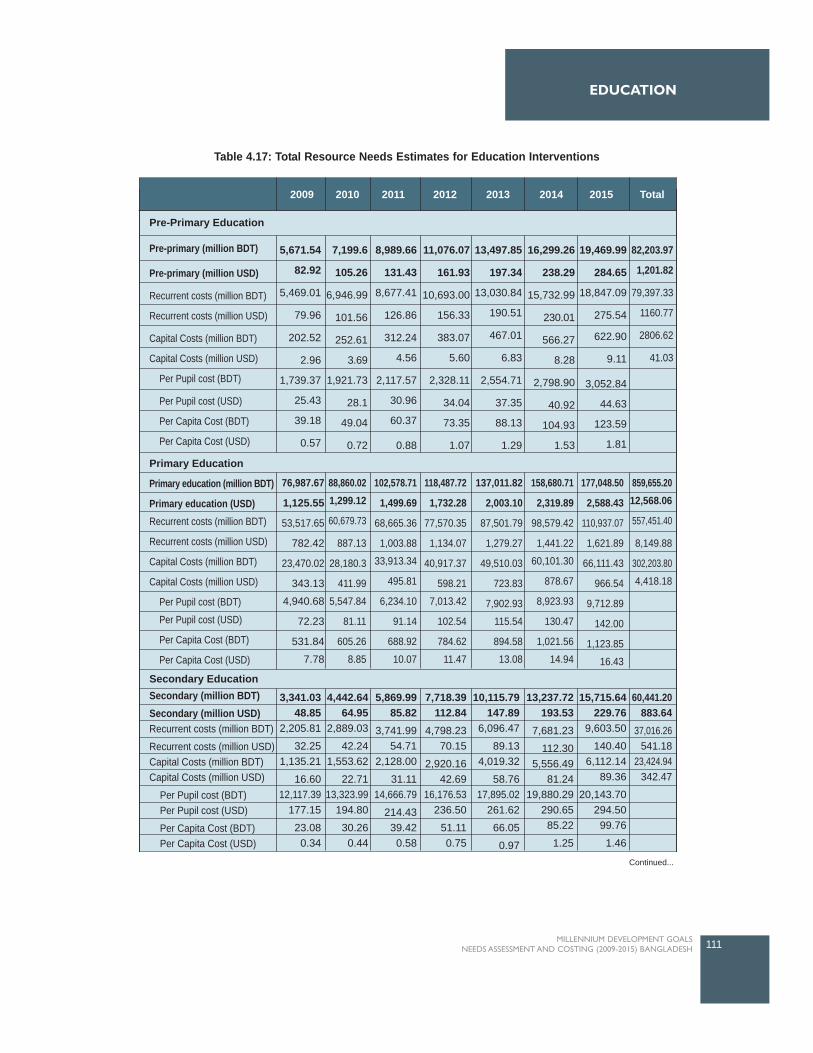
111MILLENNIUM DEVELOPMENT GOALS NEEDS ASSESSMENT AND COSTING (2009-2015) BANGLADESH
EDUCATION
201220112009 2010 2013 2014 2015 Total
Pre-Primary Education
Primary Education
Secondary Education
Pre-primary (million BDT)
Pre-primary (million USD)
Recurrent costs (million BDT)
Recurrent costs (million USD)
Capital Costs (million BDT)
Capital Costs (million USD)
Per Pupil cost (BDT)
Per Pupil cost (USD)
Per Capita Cost (BDT)
Per Capita Cost (USD)
Primary education (million BDT)
Primary education (USD)Recurrent costs (million BDT)
Recurrent costs (million USD)
Capital Costs (million BDT)
Capital Costs (million USD)
Per Pupil cost (BDT)
Per Pupil cost (USD)
Per Capita Cost (BDT)
Per Capita Cost (USD)
5,671.54
82.92
5,469.01
79.96
202.52
2.96
1,739.37
25.43
39.18
0.57
76,987.67
1,125.55
53,517.65
782.42
23,470.02
343.13
4,940.68
72.23
531.84
7.78
3,341.0348.85
2,205.81
32.251,135.21
16.6012,117.39
177.15
23.080.34
4,442.6464.95
2,889.03
42.241,553.62
22.7113,323.99
194.80
30.260.44
5,869.9985.82
3,741.9954.71
2,128.00
31.1114,666.79
214.4339.420.58
7,718.39112.84
4,798.2370.15
2,920.1642.69
16,176.53236.50
51.110.75
10,115.79147.89
6,096.47
89.134,019.32
58.7617,895.02
261.62
66.05
0.97
13,237.72193.53
7,681.23
112.305,556.49
81.2419,880.29
290.6585.22
1.25
15,715.64229.76
9,603.50
140.406,112.14
89.36
20,143.70294.5099.76
1.46
60,441.20883.64
37,016.26541.18
23,424.94342.47
88,860.021,299.12
60,679.73
887.13
28,180.3
411.99
5,547.84
81.11
605.26
8.85
102,578.71
1,499.69
68,665.36
1,003.88
33,913.34
495.81
6,234.10
91.14
688.92
10.07
118,487.72
1,732.28
77,570.35
1,134.07
40,917.37
598.21
7,013.42
102.54
784.62
11.47
137,011.82
2,003.10
87,501.79
1,279.27
49,510.03
723.83
7,902.93
115.54
894.58
13.08
158,680.71
2,319.89
98,579.42
1,441.22
60,101.30
878.67
8,923.93
130.47
1,021.56
14.94
177,048.50
2,588.43
110,937.07
1,621.89
66,111.43
966.54
9,712.89
142.00
1,123.85
16.43
859,655.2012,568.06
557,451.40
8,149.88
302,203.80
4,418.18
7,199.6
105.26
6,946.99
101.56
252.61
3.69
1,921.73
28.1
49.04
0.72
8,989.66
131.43
8,677.41
126.86
312.24
4.56
2,117.57
30.96
60.37
0.88
11,076.07
161.93
10,693.00
156.33
383.07
5.60
2,328.11
34.04
73.35
1.07
13,497.85
197.34
13,030.84
190.51
467.01
6.83
2,554.71
37.35
88.13
1.29
16,299.26
238.29
15,732.99
230.01
566.27
8.28
2,798.90
40.92
104.93
1.53
19,469.99
284.65
18,847.09
275.54
622.90
9.11
3,052.84
44.63
123.59
1.81
82,203.97
1,201.82
79,397.33
1160.77
2806.62
41.03
Secondary (million BDT)Secondary (million USD)Recurrent costs (million BDT)
Recurrent costs (million USD)Capital Costs (million BDT)Capital Costs (million USD)
Per Pupil cost (BDT) Per Pupil cost (USD)
Per Capita Cost (BDT) Per Capita Cost (USD)
Table 4.17: Total Resource Needs Estimates for Education Interventions
Continued...
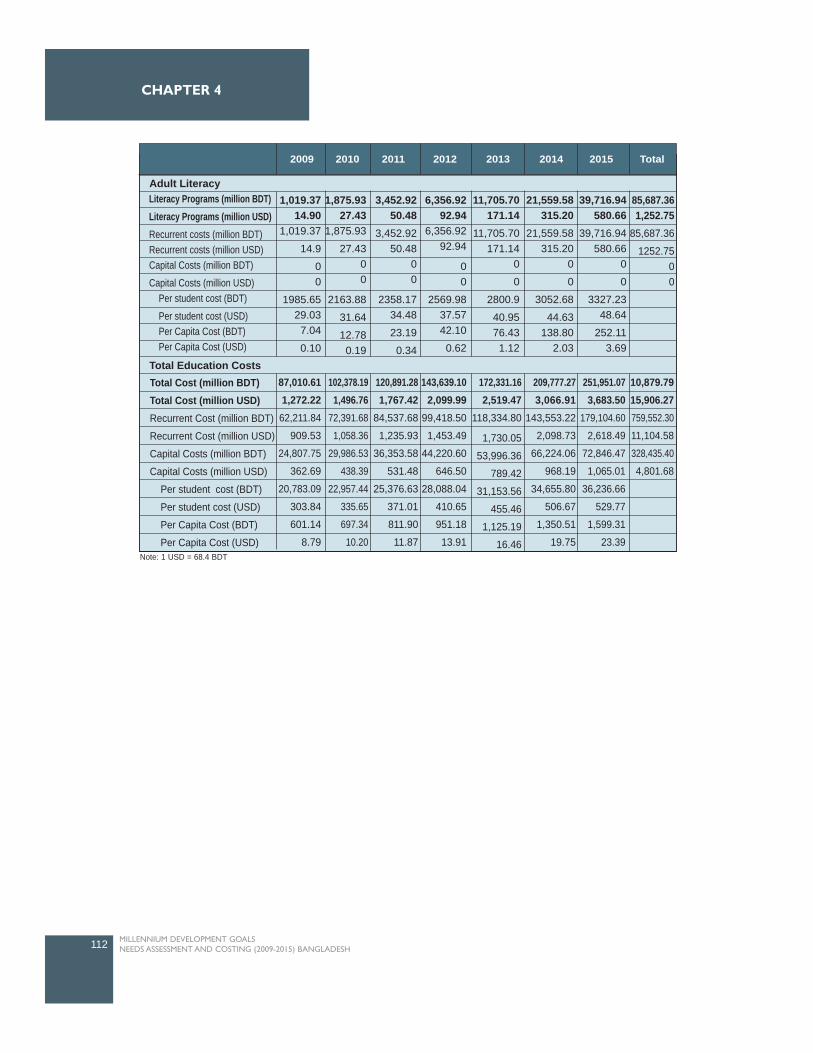
112 MILLENNIUM DEVELOPMENT GOALS NEEDS ASSESSMENT AND COSTING (2009-2015) BANGLADESH
CHAPTER 4
Adult Literacy
Total Education Costs
p ( )
Literacy Programs (million BDT)Literacy Programs (million USD)Recurrent costs (million BDT)Recurrent costs (million USD)Capital Costs (million BDT)
Capital Costs (million USD) Per student cost (BDT)
Per student cost (USD) Per Capita Cost (BDT) Per Capita Cost (USD)
1,019.3714.90
1,019.37
14.9
00
1985.6529.037.04
0.10
1,875.9327.43
1,875.93
27.4300
2163.88
31.64
12.780.19
3,452.9250.48
3,452.9250.48
00
2358.1734.48
23.19
0.34
6,356.9292.94
6,356.9292.94
00
2569.9837.5742.10
0.62
11,705.70171.14
11,705.70171.14
0
0
2800.9
40.9576.431.12
21,559.58315.20
21,559.58315.20
0
0
3052.68
44.63138.80
2.03
39,716.94580.66
39,716.94580.66
0
0
3327.2348.64
252.113.69
85,687.361,252.75
85,687.36
1252.7500
Total Cost (million BDT)Total Cost (million USD)Recurrent Cost (million BDT)
Recurrent Cost (million USD)
Capital Costs (million BDT)
Capital Costs (million USD)
Per student cost (BDT)
Per student cost (USD)
Per Capita Cost (BDT)
Per Capita Cost (USD)
87,010.611,272.22
62,211.84
909.53
24,807.75
362.69
20,783.09
303.84
601.14
8.79
120,891.281,767.42
84,537.68
1,235.93
36,353.58
531.48
25,376.63
371.01
811.90
11.87
143,639.102,099.99
99,418.50
1,453.49
44,220.60
646.50
28,088.04
410.65
951.18
13.91
172,331.162,519.47
118,334.80
1,730.05
53,996.36
789.42
31,153.56
455.46
1,125.19
16.46
209,777.273,066.91
143,553.22
2,098.73
66,224.06
968.19
34,655.80
506.67
1,350.51
19.75
251,951.073,683.50
179,104.60
2,618.49
72,846.47
1,065.01
36,236.66
529.77
1,599.31
23.39
10,879.7915,906.27759,552.30
11,104.58
328,435.40
4,801.68
102,378.191,496.76
72,391.68
1,058.36
29,986.53
438.39
22,957.44
335.65
697.34
10.20
201220112009 2010 2013 2014 2015 Total
Note: 1 USD = 68.4 BDT

GENDER
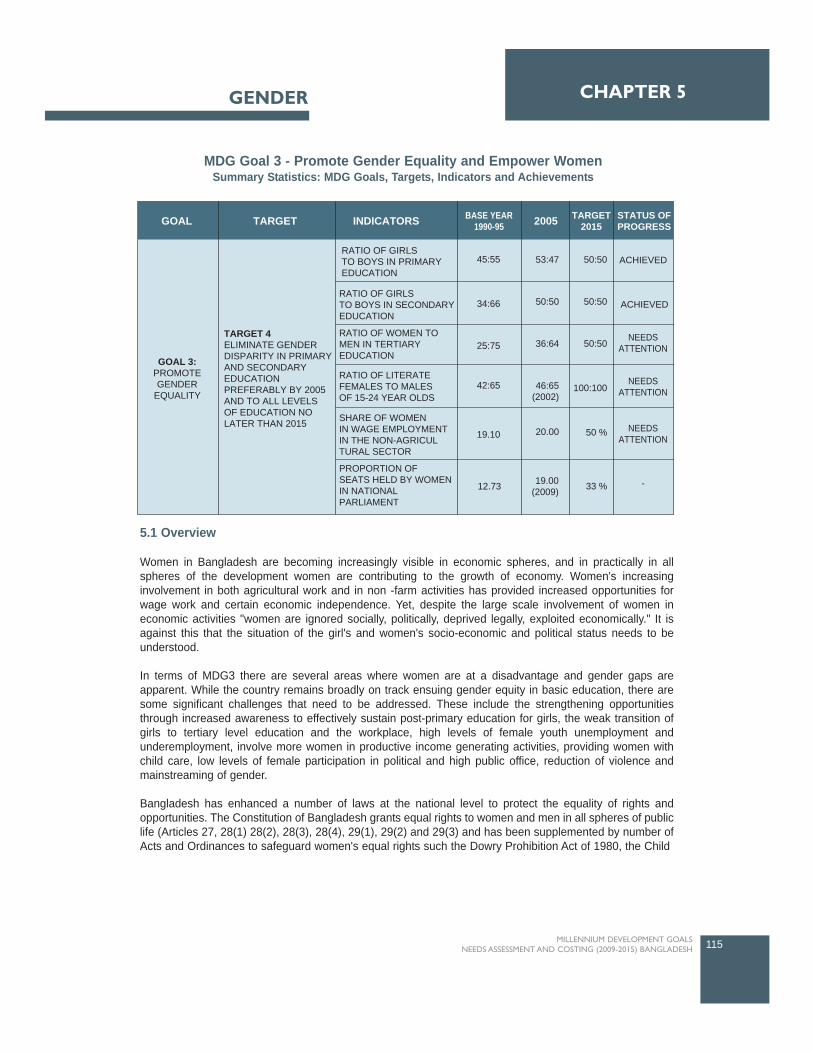
5.1 Overview
Women in Bangladesh are becoming increasingly visible in economic spheres, and in practically in allspheres of the development women are contributing to the growth of economy. Women's increasinginvolvement in both agricultural work and in non -farm activities has provided increased opportunities forwage work and certain economic independence. Yet, despite the large scale involvement of women ineconomic activities "women are ignored socially, politically, deprived legally, exploited economically." It isagainst this that the situation of the girl's and women's socio-economic and political status needs to beunderstood.
In terms of MDG3 there are several areas where women are at a disadvantage and gender gaps areapparent. While the country remains broadly on track ensuing gender equity in basic education, there aresome significant challenges that need to be addressed. These include the strengthening opportunitiesthrough increased awareness to effectively sustain post-primary education for girls, the weak transition ofgirls to tertiary level education and the workplace, high levels of female youth unemployment andunderemployment, involve more women in productive income generating activities, providing women withchild care, low levels of female participation in political and high public office, reduction of violence andmainstreaming of gender.
Bangladesh has enhanced a number of laws at the national level to protect the equality of rights andopportunities. The Constitution of Bangladesh grants equal rights to women and men in all spheres of publiclife (Articles 27, 28(1) 28(2), 28(3), 28(4), 29(1), 29(2) and 29(3) and has been supplemented by number ofActs and Ordinances to safeguard women's equal rights such the Dowry Prohibition Act of 1980, the Child
115MILLENNIUM DEVELOPMENT GOALS NEEDS ASSESSMENT AND COSTING (2009-2015) BANGLADESH
CHAPTER 5GENDER
TARGET INDICATORSGOAL BASE YEAR1990-95 2005 TARGET
2015STATUS OFPROGRESS
GOAL 3:PROMOTEGENDER
EQUALITY
TARGET 4ELIMINATE GENDERDISPARITY IN PRIMARYAND SECONDARYEDUCATIONPREFERABLY BY 2005AND TO ALL LEVELSOF EDUCATION NOLATER THAN 2015
RATIO OF GIRLSTO BOYS IN PRIMARYEDUCATION
RATIO OF GIRLSTO BOYS IN SECONDARYEDUCATION
RATIO OF WOMEN TOMEN IN TERTIARYEDUCATION
RATIO OF LITERATEFEMALES TO MALESOF 15-24 YEAR OLDS
SHARE OF WOMENIN WAGE EMPLOYMENTIN THE NON-AGRICULTURAL SECTOR
PROPORTION OFSEATS HELD BY WOMENIN NATIONALPARLIAMENT
45:55
34:66
25:75
42:65
19.10
53:47
50:50
36:64
46:65(2002)
20.00
50:50
50:50
50:50
100:100
50 %
33 %
ACHIEVED
ACHIEVED
NEEDSATTENTION
NEEDSATTENTION
NEEDSATTENTION
-19.00(2009)12.73
MDG Goal 3 - Promote Gender Equality and Empower WomenSummary Statistics: MDG Goals, Targets, Indicators and Achievements
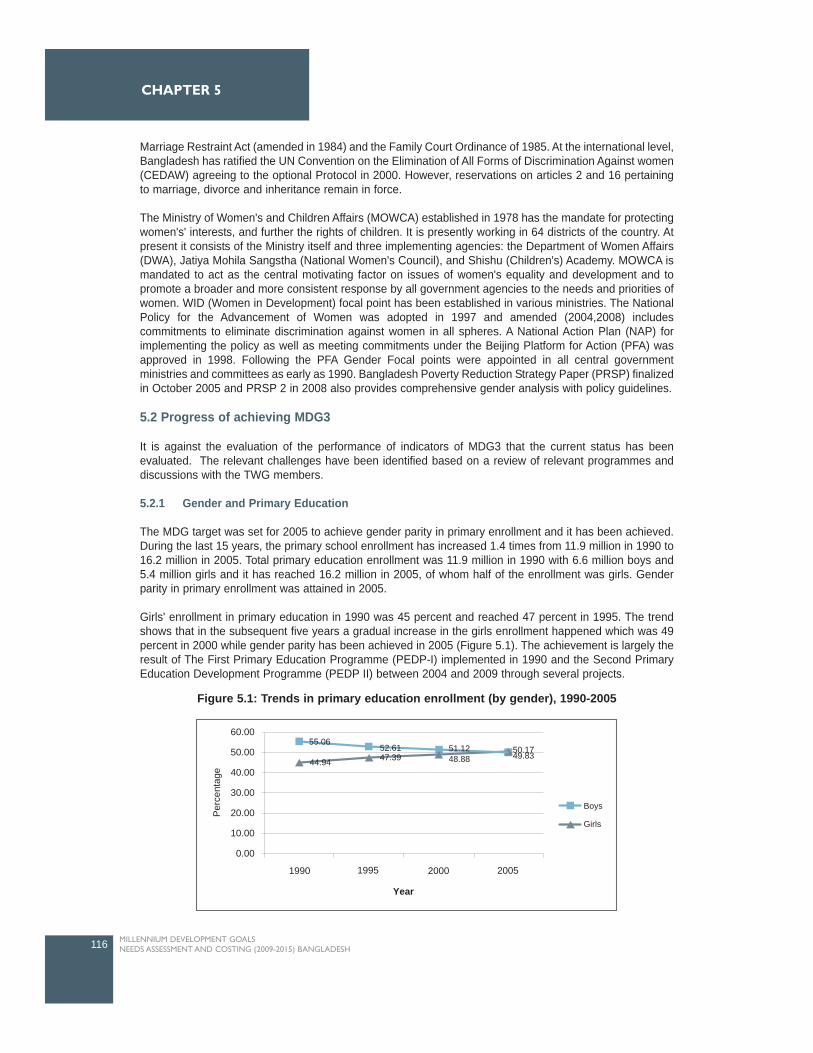
Marriage Restraint Act (amended in 1984) and the Family Court Ordinance of 1985. At the international level,Bangladesh has ratified the UN Convention on the Elimination of All Forms of Discrimination Against women(CEDAW) agreeing to the optional Protocol in 2000. However, reservations on articles 2 and 16 pertainingto marriage, divorce and inheritance remain in force.
The Ministry of Women's and Children Affairs (MOWCA) established in 1978 has the mandate for protectingwomen's' interests, and further the rights of children. It is presently working in 64 districts of the country. Atpresent it consists of the Ministry itself and three implementing agencies: the Department of Women Affairs(DWA), Jatiya Mohila Sangstha (National Women's Council), and Shishu (Children's) Academy. MOWCA ismandated to act as the central motivating factor on issues of women's equality and development and topromote a broader and more consistent response by all government agencies to the needs and priorities ofwomen. WID (Women in Development) focal point has been established in various ministries. The NationalPolicy for the Advancement of Women was adopted in 1997 and amended (2004,2008) includescommitments to eliminate discrimination against women in all spheres. A National Action Plan (NAP) forimplementing the policy as well as meeting commitments under the Beijing Platform for Action (PFA) wasapproved in 1998. Following the PFA Gender Focal points were appointed in all central governmentministries and committees as early as 1990. Bangladesh Poverty Reduction Strategy Paper (PRSP) finalizedin October 2005 and PRSP 2 in 2008 also provides comprehensive gender analysis with policy guidelines.
5.2 Progress of achieving MDG3
It is against the evaluation of the performance of indicators of MDG3 that the current status has beenevaluated. The relevant challenges have been identified based on a review of relevant programmes anddiscussions with the TWG members.
5.2.1 Gender and Primary Education
The MDG target was set for 2005 to achieve gender parity in primary enrollment and it has been achieved.During the last 15 years, the primary school enrollment has increased 1.4 times from 11.9 million in 1990 to16.2 million in 2005. Total primary education enrollment was 11.9 million in 1990 with 6.6 million boys and5.4 million girls and it has reached 16.2 million in 2005, of whom half of the enrollment was girls. Genderparity in primary enrollment was attained in 2005.
Girls' enrollment in primary education in 1990 was 45 percent and reached 47 percent in 1995. The trendshows that in the subsequent five years a gradual increase in the girls enrollment happened which was 49percent in 2000 while gender parity has been achieved in 2005 (Figure 5.1). The achievement is largely theresult of The First Primary Education Programme (PEDP-I) implemented in 1990 and the Second PrimaryEducation Development Programme (PEDP II) between 2004 and 2009 through several projects.
116 MILLENNIUM DEVELOPMENT GOALS NEEDS ASSESSMENT AND COSTING (2009-2015) BANGLADESH
CHAPTER 5
Per
cent
age
60.00
50.00
40.00
30.00
20.00
10.00
0.00
1990 1995
Year
2000 2005
Boys
Girls
44.9450.17 49.83
52.6147.39
55.0651.1248.88
Figure 5.1: Trends in primary education enrollment (by gender), 1990-2005

GENDER
5.2.2 Gender and Secondary Education
The secondary education enrollment of girls in rural areas has increased gradually, from 46 percent to 53percent during 1995 to 2000, whereas it has declined to 52 percent by the next five years. Boy's enrollmenthas declined gradually from 54 to 47 percent between 1995 to 2000. However, it has increased by onepercent in the next five years as shown in Figure 5.2.
The share of secondary education (excluding intermediate) enrollment in urban areas by sex shows apositive trend for girls' enrollment from 49 to 52 percent during 1995 to 2005. On the other hand theenrollment rate of boy's has declined from 51 percent 48 percent during the same period. The annual growthrate of secondary enrollment shows a declining trend for both the boys and girls during two time periods,namely 1995-2000 and 2000-2005. However, the relative share of declining growth has been lesspronounced for girls than that for boys: the annual average growth for girls has declined from 5.04 percentin 1995-2000 to 2.38 percent in 2000-2005, the same for the boys has been 3.76 and 1.28 percentrespectively.
The secondary education system in Bangladesh consists of two levels: secondary education (grades six-ten,of which six-eight is junior secondary), and higher secondary education (grades 11-12). Excluding theintermediate between 1990 and 2000, the secondary education enrollment for female students depicts sharpincrease (34 percent in 1991, 47 percent in 1995) whereas the enrollment of boy students substantiallydecreased (from 66 percent in 199 to 53 percent in 1995). In 2000, girls' enrollment surpasses than boys(51 percent for girls and 49 percent for boys). The similar pattern of enrollment for both sexes was seen in2005.
This impressive enrollment rate of girls in secondary school is the consequence of a government initiative,the Female Secondary School Assistance Program (FSSAP), launched in late 1980's and nationally coveredin early 1990's. Under the FSS, the government provides a cash incentive or stipend to secondary schoolgirls to cover a large portion of direct school expenses incurred by girls in grades six-ten. The FSSprogramme also provides tuition assistance, though this part of the financial assistance is paid to the schoolwhere the girl is enrolled, rather than to girls directly. The coverage of other costs rise with grade becauseextra incentive is needed in the upper grades to reduce high dropout rates.
The program, with twin objectives, seems to be successful in increasing the number of female studentsentering secondary school, and in keeping them in school until graduation. Thus this type of stipend
117MILLENNIUM DEVELOPMENT GOALS NEEDS ASSESSMENT AND COSTING (2009-2015) BANGLADESH
Per
cent
age
70.00
60.00
50.00
40.00
30.00
20.00
10.00
0.00
1990 1995 2000 2005
33.93
46.97 47.43 47.72
66.07 53.03 52.57 52.28
Girls
Boys
Figure 5. 2: Trends in secondary education (excluding Intermediate) enrollment (by gender), 1995-2005
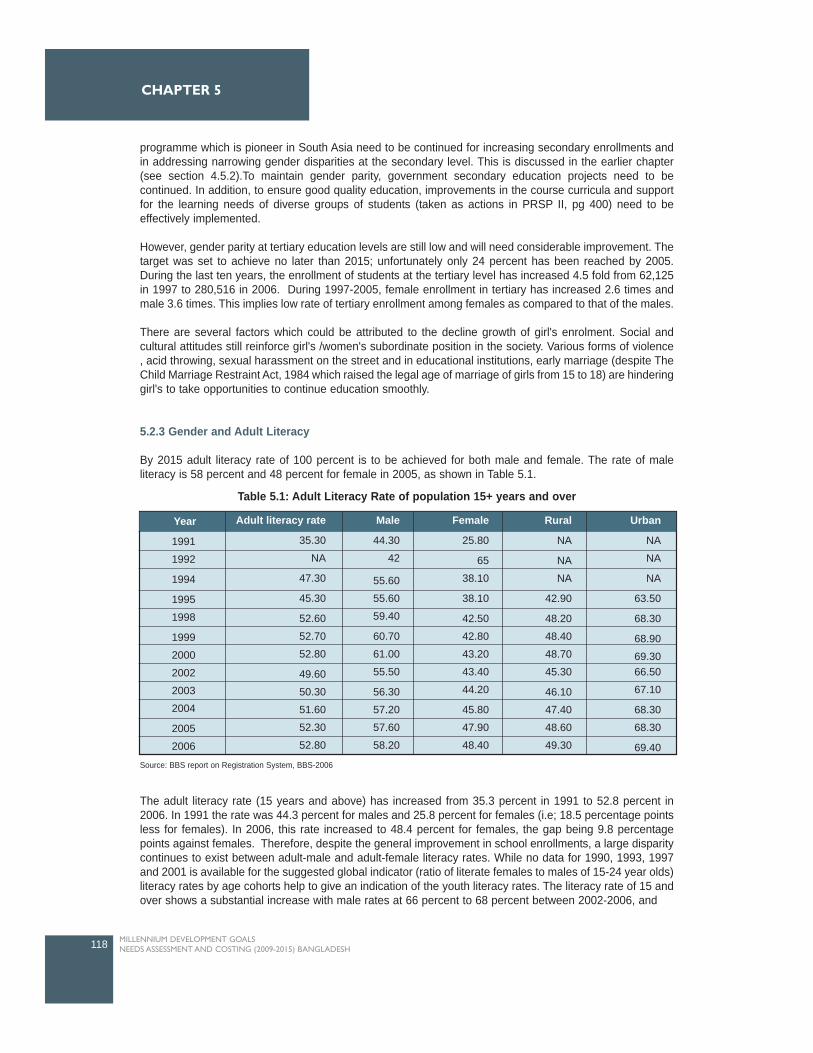
programme which is pioneer in South Asia need to be continued for increasing secondary enrollments andin addressing narrowing gender disparities at the secondary level. This is discussed in the earlier chapter(see section 4.5.2).To maintain gender parity, government secondary education projects need to becontinued. In addition, to ensure good quality education, improvements in the course curricula and supportfor the learning needs of diverse groups of students (taken as actions in PRSP II, pg 400) need to beeffectively implemented.
However, gender parity at tertiary education levels are still low and will need considerable improvement. Thetarget was set to achieve no later than 2015; unfortunately only 24 percent has been reached by 2005.During the last ten years, the enrollment of students at the tertiary level has increased 4.5 fold from 62,125in 1997 to 280,516 in 2006. During 1997-2005, female enrollment in tertiary has increased 2.6 times andmale 3.6 times. This implies low rate of tertiary enrollment among females as compared to that of the males.
There are several factors which could be attributed to the decline growth of girl's enrolment. Social andcultural attitudes still reinforce girl's /women's subordinate position in the society. Various forms of violence, acid throwing, sexual harassment on the street and in educational institutions, early marriage (despite TheChild Marriage Restraint Act, 1984 which raised the legal age of marriage of girls from 15 to 18) are hinderinggirl's to take opportunities to continue education smoothly.
5.2.3 Gender and Adult Literacy
By 2015 adult literacy rate of 100 percent is to be achieved for both male and female. The rate of maleliteracy is 58 percent and 48 percent for female in 2005, as shown in Table 5.1.
The adult literacy rate (15 years and above) has increased from 35.3 percent in 1991 to 52.8 percent in2006. In 1991 the rate was 44.3 percent for males and 25.8 percent for females (i.e; 18.5 percentage pointsless for females). In 2006, this rate increased to 48.4 percent for females, the gap being 9.8 percentagepoints against females. Therefore, despite the general improvement in school enrollments, a large disparitycontinues to exist between adult-male and adult-female literacy rates. While no data for 1990, 1993, 1997and 2001 is available for the suggested global indicator (ratio of literate females to males of 15-24 year olds)literacy rates by age cohorts help to give an indication of the youth literacy rates. The literacy rate of 15 andover shows a substantial increase with male rates at 66 percent to 68 percent between 2002-2006, and
118 MILLENNIUM DEVELOPMENT GOALS NEEDS ASSESSMENT AND COSTING (2009-2015) BANGLADESH
CHAPTER 5
Year
1991
1992
1994
1995
1998
1999
2000
2002
2003
2004
2005
2006
Adult literacy rate
35.30
NA
47.30
45.30
52.60
52.70
52.80
49.60
50.30
51.60
52.30
52.80
Male
44.30
42
55.60
55.60
59.40
60.70
61.00
55.50
56.30
57.20
57.60
58.20
Female
25.80
65
38.10
38.10
42.50
42.80
43.20
43.40
44.20
45.80
47.90
48.40
Rural
NA
NA
NA
42.90
48.20
48.40
48.70
45.30
46.10
47.40
48.60
49.30
Urban
NA
NA
NA
63.50
68.30
68.90
69.3066.50
67.10
68.30
68.30
69.40
Table 5.1: Adult Literacy Rate of population 15+ years and over
Source: BBS report on Registration System, BBS-2006
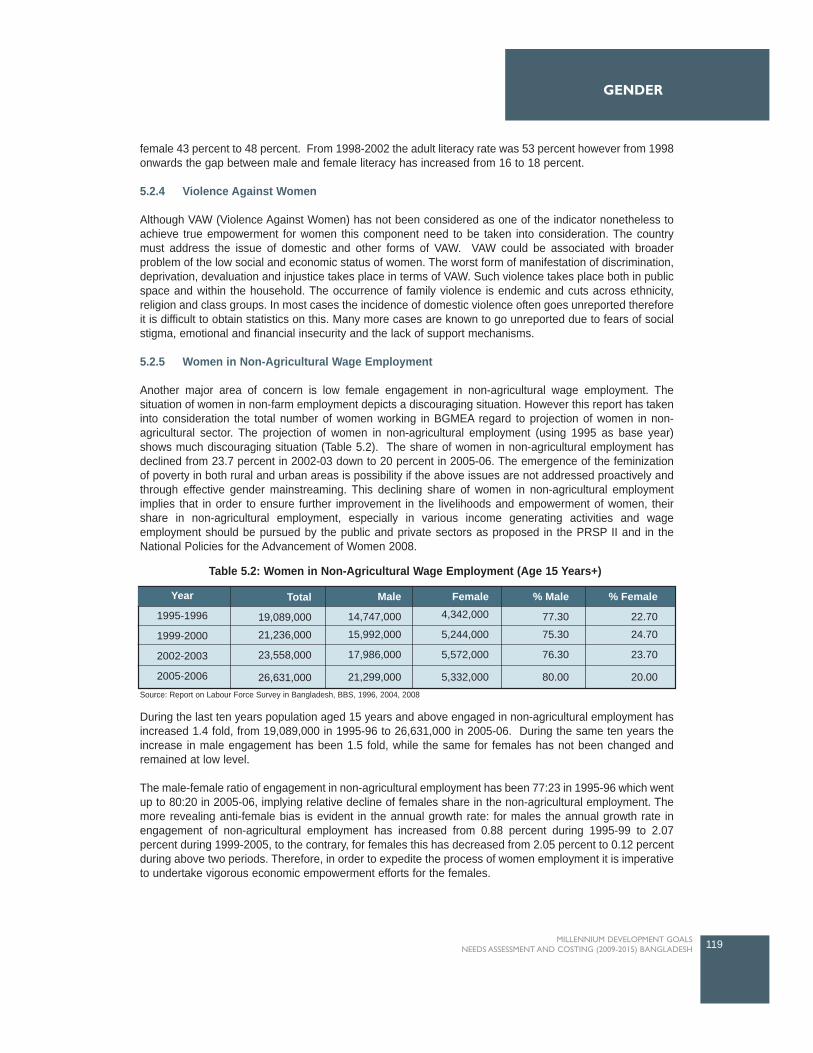
female 43 percent to 48 percent. From 1998-2002 the adult literacy rate was 53 percent however from 1998onwards the gap between male and female literacy has increased from 16 to 18 percent.
5.2.4 Violence Against Women
Although VAW (Violence Against Women) has not been considered as one of the indicator nonetheless toachieve true empowerment for women this component need to be taken into consideration. The countrymust address the issue of domestic and other forms of VAW. VAW could be associated with broaderproblem of the low social and economic status of women. The worst form of manifestation of discrimination,deprivation, devaluation and injustice takes place in terms of VAW. Such violence takes place both in publicspace and within the household. The occurrence of family violence is endemic and cuts across ethnicity,religion and class groups. In most cases the incidence of domestic violence often goes unreported thereforeit is difficult to obtain statistics on this. Many more cases are known to go unreported due to fears of socialstigma, emotional and financial insecurity and the lack of support mechanisms.
5.2.5 Women in Non-Agricultural Wage Employment
Another major area of concern is low female engagement in non-agricultural wage employment. Thesituation of women in non-farm employment depicts a discouraging situation. However this report has takeninto consideration the total number of women working in BGMEA regard to projection of women in non-agricultural sector. The projection of women in non-agricultural employment (using 1995 as base year)shows much discouraging situation (Table 5.2). The share of women in non-agricultural employment hasdeclined from 23.7 percent in 2002-03 down to 20 percent in 2005-06. The emergence of the feminizationof poverty in both rural and urban areas is possibility if the above issues are not addressed proactively andthrough effective gender mainstreaming. This declining share of women in non-agricultural employmentimplies that in order to ensure further improvement in the livelihoods and empowerment of women, theirshare in non-agricultural employment, especially in various income generating activities and wageemployment should be pursued by the public and private sectors as proposed in the PRSP II and in theNational Policies for the Advancement of Women 2008.
During the last ten years population aged 15 years and above engaged in non-agricultural employment hasincreased 1.4 fold, from 19,089,000 in 1995-96 to 26,631,000 in 2005-06. During the same ten years theincrease in male engagement has been 1.5 fold, while the same for females has not been changed andremained at low level.
The male-female ratio of engagement in non-agricultural employment has been 77:23 in 1995-96 which wentup to 80:20 in 2005-06, implying relative decline of females share in the non-agricultural employment. Themore revealing anti-female bias is evident in the annual growth rate: for males the annual growth rate inengagement of non-agricultural employment has increased from 0.88 percent during 1995-99 to 2.07percent during 1999-2005, to the contrary, for females this has decreased from 2.05 percent to 0.12 percentduring above two periods. Therefore, in order to expedite the process of women employment it is imperativeto undertake vigorous economic empowerment efforts for the females.
119MILLENNIUM DEVELOPMENT GOALS NEEDS ASSESSMENT AND COSTING (2009-2015) BANGLADESH
GENDER
Year
1995-1996
1999-2000
2002-2003
2005-2006
Total
19,089,000
21,236,000
23,558,000
26,631,000
Male
14,747,000
15,992,000
17,986,000
21,299,000
Female4,342,000
5,244,000
5,572,000
5,332,000
% Male
77.30
75.30
76.30
80.00
% Female
22.70
24.70
23.70
20.00
Table 5.2: Women in Non-Agricultural Wage Employment (Age 15 Years+)
Source: Report on Labour Force Survey in Bangladesh, BBS, 1996, 2004, 2008
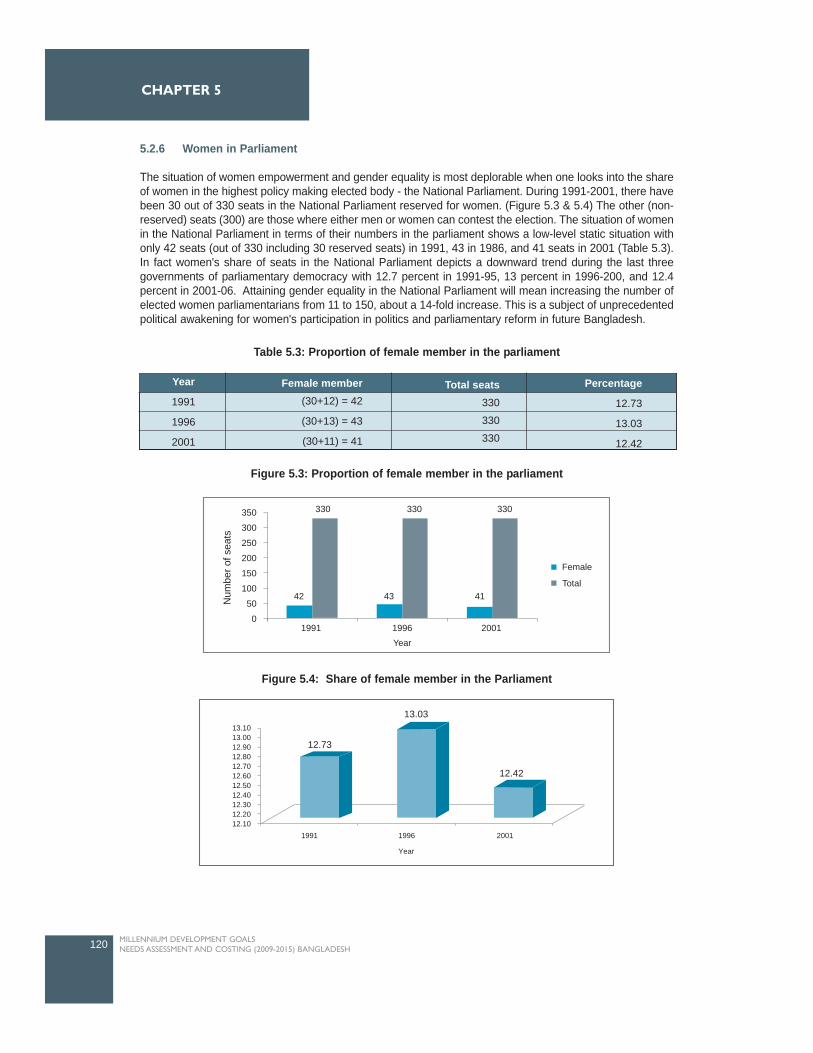
5.2.6 Women in Parliament
The situation of women empowerment and gender equality is most deplorable when one looks into the shareof women in the highest policy making elected body - the National Parliament. During 1991-2001, there havebeen 30 out of 330 seats in the National Parliament reserved for women. (Figure 5.3 & 5.4) The other (non-reserved) seats (300) are those where either men or women can contest the election. The situation of womenin the National Parliament in terms of their numbers in the parliament shows a low-level static situation withonly 42 seats (out of 330 including 30 reserved seats) in 1991, 43 in 1986, and 41 seats in 2001 (Table 5.3).In fact women's share of seats in the National Parliament depicts a downward trend during the last threegovernments of parliamentary democracy with 12.7 percent in 1991-95, 13 percent in 1996-200, and 12.4percent in 2001-06. Attaining gender equality in the National Parliament will mean increasing the number ofelected women parliamentarians from 11 to 150, about a 14-fold increase. This is a subject of unprecedentedpolitical awakening for women's participation in politics and parliamentary reform in future Bangladesh.
120 MILLENNIUM DEVELOPMENT GOALS NEEDS ASSESSMENT AND COSTING (2009-2015) BANGLADESH
CHAPTER 5
12.73
13.03
12.42
13.1013.00 12.90 12.80 12.70 12.60 12.50 12.40 12.30 12.20 12.10
1991 1996
Year
2001
Year
1991
1996
2001
Female member(30+12) = 42
(30+13) = 43
(30+11) = 41
Total seats330
330
330
Percentage
12.73
13.03
12.42
Table 5.3: Proportion of female member in the parliament
Num
ber o
f sea
ts
350
300
250
200
150
100
50
0
330
42 43 41
200119961991Year
330 330
Female
Total
Figure 5.3: Proportion of female member in the parliament
Figure 5.4: Share of female member in the Parliament
5.3 Challenges in promoting gender equality and empowerment of women
5.3.1 Challenges in Education
Although primary and secondary education is free in the country, increase enrolment in the tertiary sector isyet to reach the desired level of gender parity. Attaining the target of full gender parity at tertiary level seemsimprobable and requires serious attention if the country is even to come close to realizing it. Lower levels offemale enrolment at the higher secondary and tertiary levels, and thereby weaker educational attainmentsand lower tertiary levels, also explains to some extent, the prevailing gender gaps in representation inpolitics, public office and the civil service.
National level primary enrolment shows that Bangladesh has achieved gender parity by 2005. However,regional variation in terms of primary enrolment exists; Barisal is yet to achieve the desired position whilenegative growth for Rajshahi and Khulna exists. Thus more concentration is required to strengthening -primary education projects, programmes in above mentioned divisions. In addition, it is also vital tostrengthen opportunities for post-primary education for girls while meeting commitments to universaleducation.
Increased girls' enrolment in secondary schools has been a significant phenomenon in Bangladesh. Thechallenge is to sustain the twin objectives of the FSSAP in keeping increasing number of girl students insecondary schools and retain them until graduation. Regional and urban -rural variation in terms ofsecondary enrollment requires special attention. To maintain the impressive enrollment of girls in secondaryschool effective continuation of secondary education projects are required.
The accelerated attainment of gender parity in secondary through successful implementation of FSSAP andSEQAEP suggests that in regard to achieving such success at tertiary levels, the major challenge is toeffectively continue such programmes to reach gender parity by 2015. A major challenge is the need forgreater effort towards attaining gender parity at the tertiary education levels by 2015. This is an area hasbeen highlighted in the MDG Progress Report 2005 as requiring critical attention. Concerted efforts will berequired to address the particular challenges of easing the transition of females from the secondary throughthe continuation to tertiary levels and thereafter to the workplace; reducing their dropout after the completionof secondary education and promoting greater enrolment into technical, professional and vocationalinstitutions.
Despite many improvements in primary and secondary school enrollments a large disparity exits betweenmale and female literacy rates more in rural areas, and divisions like Sylhet. The challenge is to narrow thegap through intensive public and private initiatives. Extensive social mobilization programme need to be aswell implemented.
5.3.2 Challenges in Encountering Violence Against Women and Protecting Women
The other important matter of concern is VAW. Physical assault, sexual assault and acid throwing arecommon in Bangladesh. In addition, trafficking, death due to dowry are also reported. Most of the affectedwomen and children are poor. Poverty, dowry, early marriage, superstition, social attitude among many arethe major causes of violence against women. Violence affects children's health, education and overallwellbeing. To combat such violence, well articulated policy interventions are required. The PRSP II has givendue importance in this regard and demanded for ensuring 100 percent reporting of VAW incidence.Moreover the target has also been fixed to reduce the rate of incidence to 50 percent violence.
121MILLENNIUM DEVELOPMENT GOALS NEEDS ASSESSMENT AND COSTING (2009-2015) BANGLADESH
GENDER
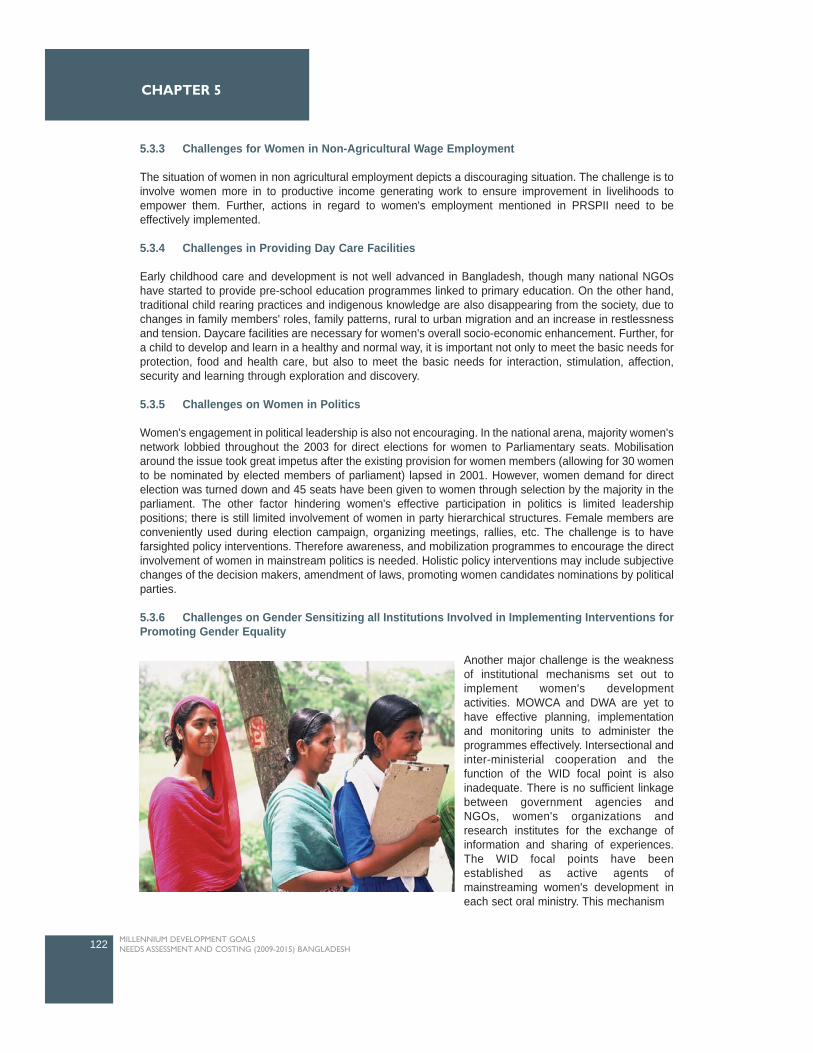
5.3.3 Challenges for Women in Non-Agricultural Wage Employment
The situation of women in non agricultural employment depicts a discouraging situation. The challenge is toinvolve women more in to productive income generating work to ensure improvement in livelihoods toempower them. Further, actions in regard to women's employment mentioned in PRSPII need to beeffectively implemented.
5.3.4 Challenges in Providing Day Care Facilities
Early childhood care and development is not well advanced in Bangladesh, though many national NGOshave started to provide pre-school education programmes linked to primary education. On the other hand,traditional child rearing practices and indigenous knowledge are also disappearing from the society, due tochanges in family members' roles, family patterns, rural to urban migration and an increase in restlessnessand tension. Daycare facilities are necessary for women's overall socio-economic enhancement. Further, fora child to develop and learn in a healthy and normal way, it is important not only to meet the basic needs forprotection, food and health care, but also to meet the basic needs for interaction, stimulation, affection,security and learning through exploration and discovery.
5.3.5 Challenges on Women in Politics
Women's engagement in political leadership is also not encouraging. In the national arena, majority women'snetwork lobbied throughout the 2003 for direct elections for women to Parliamentary seats. Mobilisationaround the issue took great impetus after the existing provision for women members (allowing for 30 womento be nominated by elected members of parliament) lapsed in 2001. However, women demand for directelection was turned down and 45 seats have been given to women through selection by the majority in theparliament. The other factor hindering women's effective participation in politics is limited leadershippositions; there is still limited involvement of women in party hierarchical structures. Female members areconveniently used during election campaign, organizing meetings, rallies, etc. The challenge is to havefarsighted policy interventions. Therefore awareness, and mobilization programmes to encourage the directinvolvement of women in mainstream politics is needed. Holistic policy interventions may include subjectivechanges of the decision makers, amendment of laws, promoting women candidates nominations by politicalparties.
5.3.6 Challenges on Gender Sensitizing all Institutions Involved in Implementing Interventions forPromoting Gender Equality
Another major challenge is the weaknessof institutional mechanisms set out toimplement women's developmentactivities. MOWCA and DWA are yet tohave effective planning, implementationand monitoring units to administer theprogrammes effectively. Intersectional andinter-ministerial cooperation and thefunction of the WID focal point is alsoinadequate. There is no sufficient linkagebetween government agencies andNGOs, women's organizations andresearch institutes for the exchange ofinformation and sharing of experiences.The WID focal points have beenestablished as active agents ofmainstreaming women's development ineach sect oral ministry. This mechanism
122 MILLENNIUM DEVELOPMENT GOALS NEEDS ASSESSMENT AND COSTING (2009-2015) BANGLADESH
CHAPTER 5
was set up from the realization that looking after women's interests and progress is the responsibility of alldevelopment sectors. However, there is still scope for strengthening networking and linkages and thecapacity development of WID focal points. (Country Briefing Paper...Women in Bangladesh)
Overcoming the situation of the major gender gaps in female participation in national parliament, public officeand civil service represents a significant challenge in itself. The ground realities must conform to, and reflectthe spirit of, gender equality and non-discrimination that is inherent in the Constitution. This is however,constrained by a general lack of awareness among government employees, the judiciary, police and theprivate sector on gender equality and the lack of clarity of existing policy measures aimed at preventinggender discrimination against women. The situation is further complicated by the lack of in-depthunderstanding of the various causal factors and conditions that create these significant gender gaps. In otherareas of decision-making such as the bureaucracy and high level jobs, which entail visibility and exercise ofauthority, women's presence is negligible4 .
5.4 Major Interventions and Targets for Achieving MDG 3
5.4.1 Community Based Awareness for Sustaining Gender-based Equality
The broad intervention suggested to sustain gender equality in education is community based awareness.The sub-intervention gender based equality would be achieved through community based awareness. Toensure equity and equality in education at the primary/secondary level community based awareness issuggested to strengthen opportunities for primary and post primary education for girls while meetingcommitment to universal education. The major activities to achieve interventions are as follows:workshop/dialogue/seminars, training, meetings, uthan boithoks, and TV/Radio campaign.
To ensure increased enrolment in secondary girls, the stipend programme FSSAP, SEQAEP and the otherneed to be continued. To maintain the impressive enrolment of girls in secondary school effectivecontinuation of secondary projects are required. Sustenance of girls at the secondary level will be enhancedthrough continuing awareness on the provisions of adequate facilities such as stipend/scholarships.Continuing focus on stipend/scholarships facilities to target needy students, both girls and boys, to reducethe gender gap.
5.4.2 Helping Girls Transition to Work
The progress of gender parity in tertiary education remains discouraging in comparison to primary andsecondary levels. This suggests that in order to achieve such success in tertiary level of education the majorchallenge is to facilitate the unemployed dropped out female for gainful employment/self employmentproviding vocational/skill development training. The broad activities chalked under this intervention includethe following: i) create more opportunities at the vocational level to help girls/women who are unable tocontinue with school to learn skills to enable them to get employed ii) facilitating programmes to familiarizegraduates with available job opportunities. The major activities to achieve the target are: professionaltraining, vocational training (includes computer basic course, electronics, live stock poultry, fishery &agriculture, modern office management, dress making, wool knitting, hair dressing, housekeepingcommunicative english, etc) and to initiate school to work programme . The objective of above mentionedtrainings is to involve the young females in socio-economic development activities like literacy programme,disaster management, primary health care, environmental improvement, resource conservation andawareness building against anti-social activities, drug abuse, AIDS/STD etc.
123MILLENNIUM DEVELOPMENT GOALS NEEDS ASSESSMENT AND COSTING (2009-2015) BANGLADESH
GENDER
4 Millennium Development Goals: A people's progress report, BANGLADESH, Overview, September 2005
The other sub interventions under this broad intervention aim to increase the share of women in wageemployment in non-agricultural sector will be effectively enhanced through: providing women with productiveIGA, (Income Generating Activities) Micro credit. The low share of women in non-agricultural employmentimplies that in order to ensure further improvement in the livelihood of women and to economically empowerthem, their share in non-agricultural employment, especially in various income generating activities andwage employment should be pursued by the public and private sector as proposed in the PRSP II and in theNational Policies for the Advancement of Women 2008.
5.4.3 Encouraging Political Participation
While there is a highly supportive legal and policy in the development sector to encourage women'sparticipation in development activities and in decision making, women are still poorly represented in thelegislative, judiciary and executive branches of government Therefore women encounter greater difficultiesin changing their realities in their favour. To influence decisions in favour of women, full women's participationin political decision-making process is essential.
Increasing the proportion of elected women by encouraging their political participation will be effectivelypromoted through the following interventions: i) promotion related activities primarily throughtraining/support/awareness for women candidates contesting for election, holding relevant workshops,dialogue to motivate and prepare them for effective participation in politics, ii) providing training/support forelected female parliaments. The aim of the major intervention encouraging political participation aims atincreasing the number of women parliamentarians in the national parliament. Increasing the proportion ofelected women by encouraging their political participation will also be effectively also promoted throughmass media campaign.
5.4.4 Ending Violence Against Women
Although Bangladesh Constitution mentioned earlier guarantees equality and equal protection for allcitizens, the principle is often curtailed with respect to women's right. It is necessary to reduce various formsof violence to ensure girls' productive and reproductive role. Furthermore, women's security needs to beensured while taking opportunities of primary/secondary and post secondary education and employment. Asthe issue of domestic violence has not been addressed in the past on an institutional basis, there is very littlecapacity and experience in the country to deal with this effectively. As such, promoting relevant remedialmeasures such as encouraging women and child friendly police and court services, taking care of affectedwomen, raising awareness through community, safe homes and mass media programmes is needed. Alsoeffective implementation of activities which are hampered by a lack of professional and institutional capacityis important. Therefore, following interventions are seen to be significant.
Prevention-related activities promoted primarily through Community-based Awareness Campaignsincluding mass media campaigns; holding relevant workshops, seminars, trainings and orientationprogrammes; undertaking relevant research and dissemination of research findings; buildingnetwork and linkages involving relevant NGOs; building partnerships at the grassroots etc.Curative services provided through One Stop Crisis Centres (OCC) established in six administrativedivisions under the auspices of public medical colleges hospitals. These OCCs provide legal,medical and social services.Violence prevention cells exists at the DWA and Jatio Mahila Sangtha (National WomenOrganization). The government and NGOs, although largely inadequate, have also establishedshelter homes for abused and tortured women. Both preventive and curative service activities areprovided through Women Support Centre (WSC). The WSC in forty areas provides among others,training and legal services.Department of Social Welfare has Safe Home for children under 16 to provide protection . FurtherBNWLA (Bangladesh National Lawyers Women's Association) also has safe home for sheltervictims which provides medical care, counseling , repatriation and reintegration services to thevictims of trafficking.
124 MILLENNIUM DEVELOPMENT GOALS NEEDS ASSESSMENT AND COSTING (2009-2015) BANGLADESH
CHAPTER 5
5.4.5 Day Care
The other intervention is to provide women with Day Care facilities to enable women to seek gainfulemployment. Day Care is essential to facilitate women workers to participate in various income generatingactivities with young children. This facilitates breast-feeding and enables parents to have peace of mindabout their children's care during working hours. Day Care assists women to acquire the management skillsthey need in order to compete with men and "move-up" in their workplace.
5.4.6 Systemic Issues (Gender Mainstreaming)
The relevant interventions to address various systemic issues are: to provide support to for capacitydevelopment of focal points in line ministries to mainstream gender, sensitization campaigns coveringjudges and judiciary officials including registrars, civil servants, police officers and Registration officers toeffectively address various women's issues. Sensitization campaign/training for officials, judges and othersis necessary to effectively implement gender related programmes.
5.4.7 Expected Outcomes of Interventions
Gender disparity is a reflection of complex social, economic and cultural issues. While some achievementshave been acquired in education, health, labour employment and democratic participation however, inBangladesh meaningful empowerment is still a distant goal. Therefore, if the above mentioned interventionsare effectively implemented substantial women's socio-economic and political development is not far away.
5.5 Coverage and Resource Needs Estimates for MDG 3
Estimates of coverage and costs by specific interventions have been done using the computerizedprogramme designed for this purpose by UNDP. This programme requires input data on three broad areas,namely national demographic, coverage rate (by specific intervention), and relevant costs. The nationaldemographic data were needed to identify the relevant denominator against specific intervention, the
125MILLENNIUM DEVELOPMENT GOALS NEEDS ASSESSMENT AND COSTING (2009-2015) BANGLADESH
GENDER
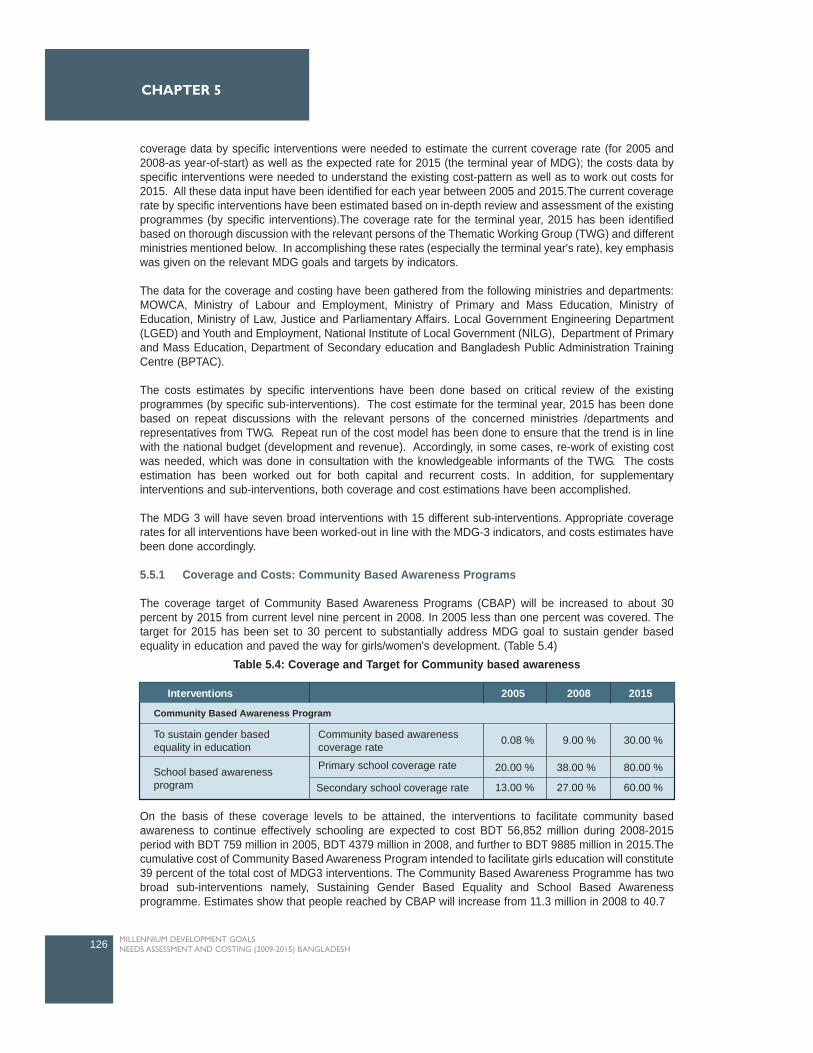
coverage data by specific interventions were needed to estimate the current coverage rate (for 2005 and2008-as year-of-start) as well as the expected rate for 2015 (the terminal year of MDG); the costs data byspecific interventions were needed to understand the existing cost-pattern as well as to work out costs for2015. All these data input have been identified for each year between 2005 and 2015.The current coveragerate by specific interventions have been estimated based on in-depth review and assessment of the existingprogrammes (by specific interventions).The coverage rate for the terminal year, 2015 has been identifiedbased on thorough discussion with the relevant persons of the Thematic Working Group (TWG) and differentministries mentioned below. In accomplishing these rates (especially the terminal year's rate), key emphasiswas given on the relevant MDG goals and targets by indicators.
The data for the coverage and costing have been gathered from the following ministries and departments:MOWCA, Ministry of Labour and Employment, Ministry of Primary and Mass Education, Ministry ofEducation, Ministry of Law, Justice and Parliamentary Affairs. Local Government Engineering Department(LGED) and Youth and Employment, National Institute of Local Government (NILG), Department of Primaryand Mass Education, Department of Secondary education and Bangladesh Public Administration TrainingCentre (BPTAC).
The costs estimates by specific interventions have been done based on critical review of the existingprogrammes (by specific sub-interventions). The cost estimate for the terminal year, 2015 has been donebased on repeat discussions with the relevant persons of the concerned ministries /departments andrepresentatives from TWG. Repeat run of the cost model has been done to ensure that the trend is in linewith the national budget (development and revenue). Accordingly, in some cases, re-work of existing costwas needed, which was done in consultation with the knowledgeable informants of the TWG. The costsestimation has been worked out for both capital and recurrent costs. In addition, for supplementaryinterventions and sub-interventions, both coverage and cost estimations have been accomplished.
The MDG 3 will have seven broad interventions with 15 different sub-interventions. Appropriate coveragerates for all interventions have been worked-out in line with the MDG-3 indicators, and costs estimates havebeen done accordingly.
5.5.1 Coverage and Costs: Community Based Awareness Programs
The coverage target of Community Based Awareness Programs (CBAP) will be increased to about 30percent by 2015 from current level nine percent in 2008. In 2005 less than one percent was covered. Thetarget for 2015 has been set to 30 percent to substantially address MDG goal to sustain gender basedequality in education and paved the way for girls/women's development. (Table 5.4)
On the basis of these coverage levels to be attained, the interventions to facilitate community basedawareness to continue effectively schooling are expected to cost BDT 56,852 million during 2008-2015period with BDT 759 million in 2005, BDT 4379 million in 2008, and further to BDT 9885 million in 2015.Thecumulative cost of Community Based Awareness Program intended to facilitate girls education will constitute39 percent of the total cost of MDG3 interventions. The Community Based Awareness Programme has twobroad sub-interventions namely, Sustaining Gender Based Equality and School Based Awarenessprogramme. Estimates show that people reached by CBAP will increase from 11.3 million in 2008 to 40.7
126 MILLENNIUM DEVELOPMENT GOALS NEEDS ASSESSMENT AND COSTING (2009-2015) BANGLADESH
CHAPTER 5
Interventions 2005 2008 2015
Community Based Awareness Program
To sustain gender basedequality in education
Community based awarenesscoverage rate
Primary school coverage rateSchool based awarenessprogram
0.08 %
20.00 %
13.00 %
9.00 %
38.00 %
27.00 %
30.00 %
80.00 %
60.00 %Secondary school coverage rate
Table 5.4: Coverage and Target for Community based awareness
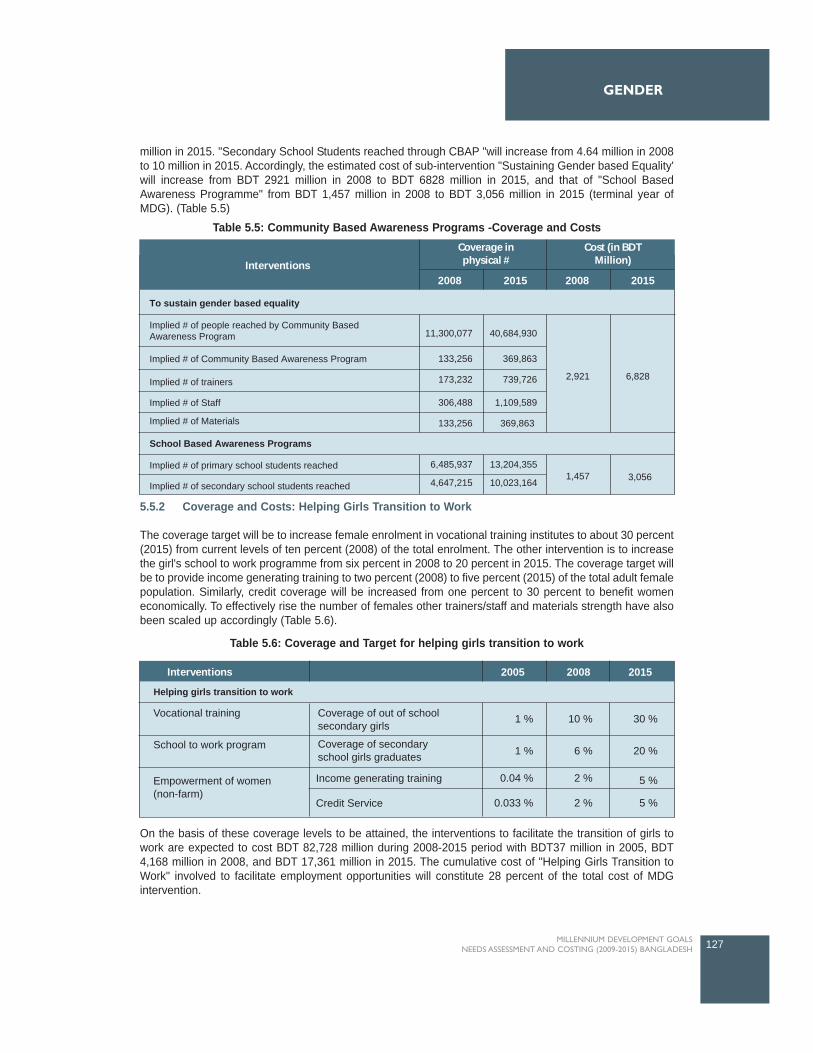
million in 2015. "Secondary School Students reached through CBAP "will increase from 4.64 million in 2008to 10 million in 2015. Accordingly, the estimated cost of sub-intervention "Sustaining Gender based Equality'will increase from BDT 2921 million in 2008 to BDT 6828 million in 2015, and that of "School BasedAwareness Programme" from BDT 1,457 million in 2008 to BDT 3,056 million in 2015 (terminal year ofMDG). (Table 5.5)
5.5.2 Coverage and Costs: Helping Girls Transition to Work
The coverage target will be to increase female enrolment in vocational training institutes to about 30 percent(2015) from current levels of ten percent (2008) of the total enrolment. The other intervention is to increasethe girl's school to work programme from six percent in 2008 to 20 percent in 2015. The coverage target willbe to provide income generating training to two percent (2008) to five percent (2015) of the total adult femalepopulation. Similarly, credit coverage will be increased from one percent to 30 percent to benefit womeneconomically. To effectively rise the number of females other trainers/staff and materials strength have alsobeen scaled up accordingly (Table 5.6).
On the basis of these coverage levels to be attained, the interventions to facilitate the transition of girls towork are expected to cost BDT 82,728 million during 2008-2015 period with BDT37 million in 2005, BDT4,168 million in 2008, and BDT 17,361 million in 2015. The cumulative cost of "Helping Girls Transition toWork" involved to facilitate employment opportunities will constitute 28 percent of the total cost of MDGintervention.
127MILLENNIUM DEVELOPMENT GOALS NEEDS ASSESSMENT AND COSTING (2009-2015) BANGLADESH
GENDER
Interventions 2005 2008 2015
Helping girls transition to work
Vocational training Coverage of out of schoolsecondary girls
Coverage of secondaryschool girls graduates
School to work program
Empowerment of women (non-farm)
1 %
1 %
0.04 %
0.033 %
10 %
6 %
2 %
2 %
30 %
20 %
5 %
5 %
Income generating training
Credit Service
Table 5.6: Coverage and Target for helping girls transition to work
Interventions
Cost (in BDTMillion)
Coverage inphysical #
2008 2015 2008 2015
To sustain gender based equality
School Based Awareness Programs
Implied # of Community Based Awareness Program
Implied # of trainers
Implied # of Staff
Implied # of Materials
Implied # of primary school students reached
Implied # of secondary school students reached1,457
2,921 6,828
3,0566,485,937
4,647,215
11,300,077
133,256
173,232
306,488
133,256
40,684,930
369,863
739,726
1,109,589
369,863
13,204,355
10,023,164
Implied # of people reached by Community BasedAwareness Program
Table 5.5: Community Based Awareness Programs -Coverage and Costs
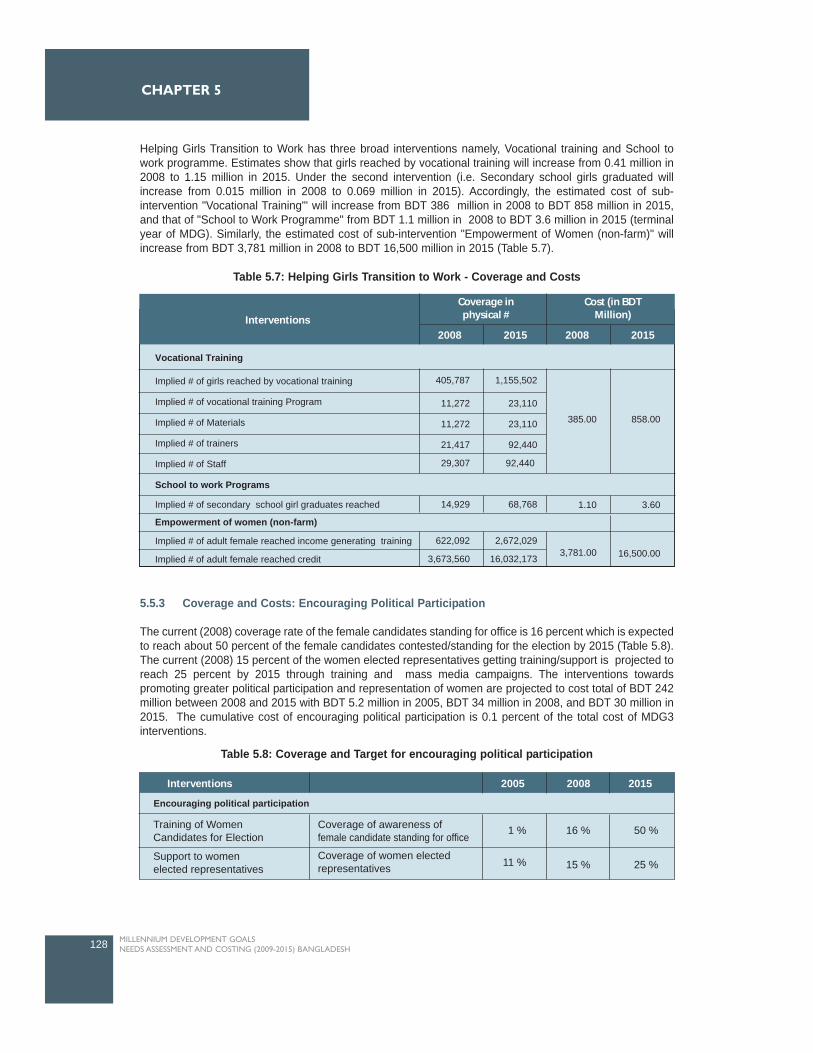
Helping Girls Transition to Work has three broad interventions namely, Vocational training and School towork programme. Estimates show that girls reached by vocational training will increase from 0.41 million in2008 to 1.15 million in 2015. Under the second intervention (i.e. Secondary school girls graduated willincrease from 0.015 million in 2008 to 0.069 million in 2015). Accordingly, the estimated cost of sub-intervention "Vocational Training"' will increase from BDT 386 million in 2008 to BDT 858 million in 2015,and that of "School to Work Programme" from BDT 1.1 million in 2008 to BDT 3.6 million in 2015 (terminalyear of MDG). Similarly, the estimated cost of sub-intervention "Empowerment of Women (non-farm)" willincrease from BDT 3,781 million in 2008 to BDT 16,500 million in 2015 (Table 5.7).
5.5.3 Coverage and Costs: Encouraging Political Participation
The current (2008) coverage rate of the female candidates standing for office is 16 percent which is expectedto reach about 50 percent of the female candidates contested/standing for the election by 2015 (Table 5.8).The current (2008) 15 percent of the women elected representatives getting training/support is projected toreach 25 percent by 2015 through training and mass media campaigns. The interventions towardspromoting greater political participation and representation of women are projected to cost total of BDT 242million between 2008 and 2015 with BDT 5.2 million in 2005, BDT 34 million in 2008, and BDT 30 million in2015. The cumulative cost of encouraging political participation is 0.1 percent of the total cost of MDG3interventions.
128 MILLENNIUM DEVELOPMENT GOALS NEEDS ASSESSMENT AND COSTING (2009-2015) BANGLADESH
CHAPTER 5
Interventions
Cost (in BDTMillion)
Coverage inphysical #
2008 2015 2008 2015
Vocational Training
School to work Programs
Empowerment of women (non-farm)
Implied # of secondary school girl graduates reached
Implied # of adult female reached income generating training
Implied # of adult female reached credit
Implied # of girls reached by vocational training
Implied # of vocational training Program
Implied # of Materials
Implied # of trainers
Implied # of Staff
3,781.00
385.00 858.00
1.10 3.60
16,500.00622,092
3,673,560
14,929 68,768
2,672,029
16,032,173
405,787
11,272
11,272
21,417
29,307
1,155,502
23,110
23,110
92,440
92,440
Table 5.7: Helping Girls Transition to Work - Coverage and Costs
Interventions 2005 2008 2015
Encouraging political participation
Training of WomenCandidates for Election
Coverage of awareness offemale candidate standing for office
Coverage of women electedrepresentatives
Support to womenelected representatives
1 %
11 %
16 %
15 %
50 %
25 %
Table 5.8: Coverage and Target for encouraging political participation
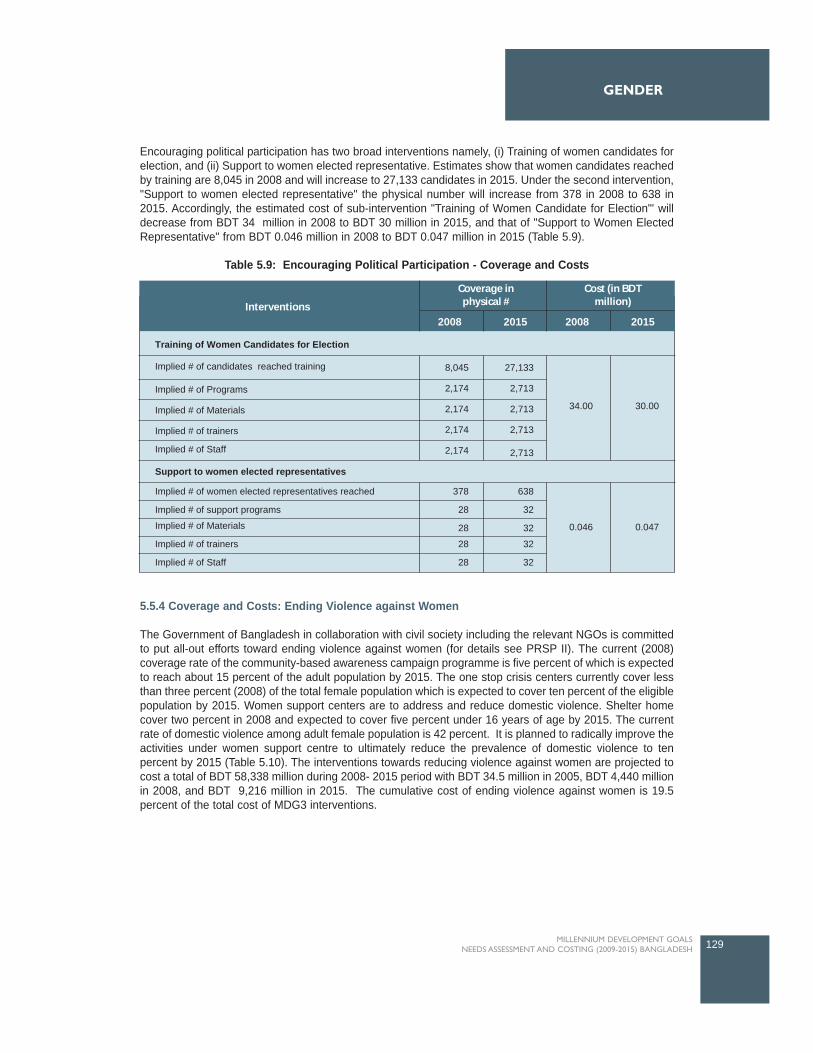
Encouraging political participation has two broad interventions namely, (i) Training of women candidates forelection, and (ii) Support to women elected representative. Estimates show that women candidates reachedby training are 8,045 in 2008 and will increase to 27,133 candidates in 2015. Under the second intervention,"Support to women elected representative" the physical number will increase from 378 in 2008 to 638 in2015. Accordingly, the estimated cost of sub-intervention "Training of Women Candidate for Election"' willdecrease from BDT 34 million in 2008 to BDT 30 million in 2015, and that of "Support to Women ElectedRepresentative" from BDT 0.046 million in 2008 to BDT 0.047 million in 2015 (Table 5.9).
5.5.4 Coverage and Costs: Ending Violence against Women
The Government of Bangladesh in collaboration with civil society including the relevant NGOs is committedto put all-out efforts toward ending violence against women (for details see PRSP II). The current (2008)coverage rate of the community-based awareness campaign programme is five percent of which is expectedto reach about 15 percent of the adult population by 2015. The one stop crisis centers currently cover lessthan three percent (2008) of the total female population which is expected to cover ten percent of the eligiblepopulation by 2015. Women support centers are to address and reduce domestic violence. Shelter homecover two percent in 2008 and expected to cover five percent under 16 years of age by 2015. The currentrate of domestic violence among adult female population is 42 percent. It is planned to radically improve theactivities under women support centre to ultimately reduce the prevalence of domestic violence to tenpercent by 2015 (Table 5.10). The interventions towards reducing violence against women are projected tocost a total of BDT 58,338 million during 2008- 2015 period with BDT 34.5 million in 2005, BDT 4,440 millionin 2008, and BDT 9,216 million in 2015. The cumulative cost of ending violence against women is 19.5percent of the total cost of MDG3 interventions.
129MILLENNIUM DEVELOPMENT GOALS NEEDS ASSESSMENT AND COSTING (2009-2015) BANGLADESH
GENDER
Interventions
Cost (in BDTmillion)
Coverage inphysical #
2008 2015 2008 2015
Training of Women Candidates for Election
Support to women elected representatives
Implied # of women elected representatives reached
Implied # of support programs
Implied # of Materials
Implied # of trainers
Implied # of Staff
378
28
28
28
28
8,045
2,174
2,174
2,174
2,174
27,133
2,713
2,713
2,713
2,713
638
32
32
32
32
Implied # of candidates reached training
Implied # of Programs
Implied # of Materials
Implied # of trainers
Implied # of Staff
0.046
34.00 30.00
0.047
Table 5.9: Encouraging Political Participation - Coverage and Costs
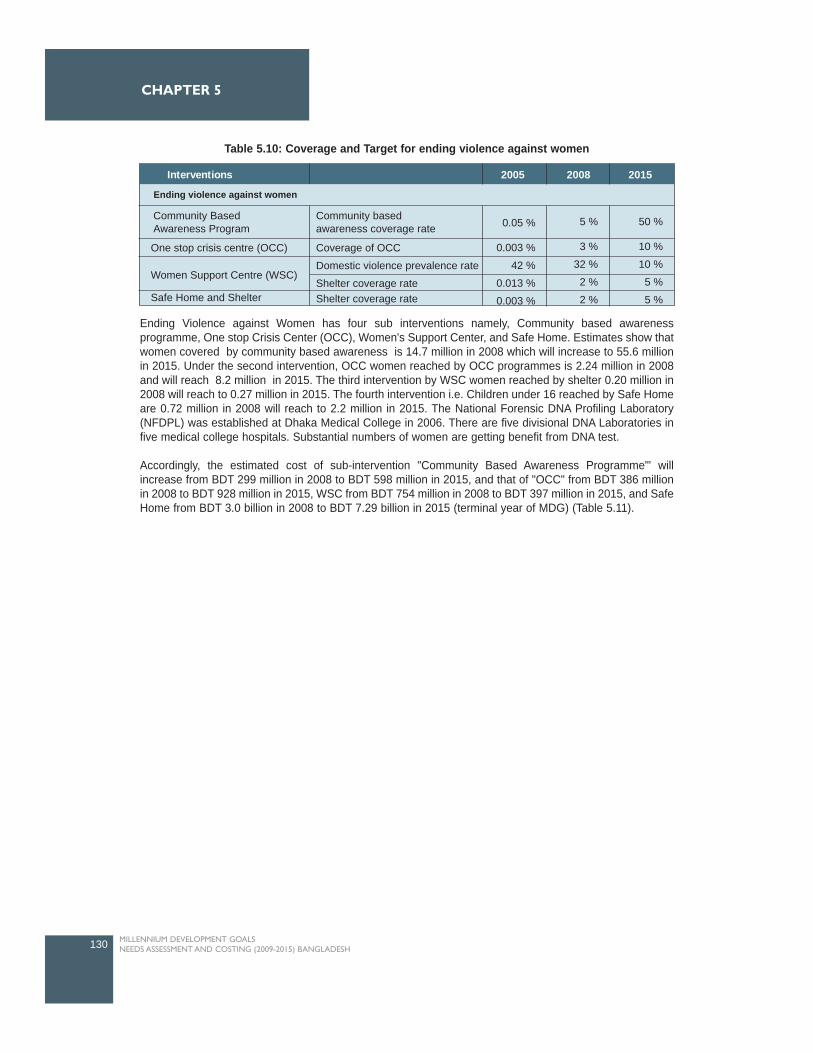
Ending Violence against Women has four sub interventions namely, Community based awarenessprogramme, One stop Crisis Center (OCC), Women's Support Center, and Safe Home. Estimates show thatwomen covered by community based awareness is 14.7 million in 2008 which will increase to 55.6 millionin 2015. Under the second intervention, OCC women reached by OCC programmes is 2.24 million in 2008and will reach 8.2 million in 2015. The third intervention by WSC women reached by shelter 0.20 million in2008 will reach to 0.27 million in 2015. The fourth intervention i.e. Children under 16 reached by Safe Homeare 0.72 million in 2008 will reach to 2.2 million in 2015. The National Forensic DNA Profiling Laboratory(NFDPL) was established at Dhaka Medical College in 2006. There are five divisional DNA Laboratories infive medical college hospitals. Substantial numbers of women are getting benefit from DNA test.
Accordingly, the estimated cost of sub-intervention "Community Based Awareness Programme"' willincrease from BDT 299 million in 2008 to BDT 598 million in 2015, and that of "OCC" from BDT 386 millionin 2008 to BDT 928 million in 2015, WSC from BDT 754 million in 2008 to BDT 397 million in 2015, and SafeHome from BDT 3.0 billion in 2008 to BDT 7.29 billion in 2015 (terminal year of MDG) (Table 5.11).
130 MILLENNIUM DEVELOPMENT GOALS NEEDS ASSESSMENT AND COSTING (2009-2015) BANGLADESH
CHAPTER 5
Table 5.10: Coverage and Target for ending violence against women
Interventions 2005 2008 2015
Ending violence against women
One stop crisis centre (OCC)
Women Support Centre (WSC)
Safe Home and Shelter
Coverage of OCC
Domestic violence prevalence rate
Shelter coverage rateShelter coverage rate
Community basedawareness coverage rate
Community BasedAwareness Program 0.05 %
0.003 %
42 %
0.013 %
0.003 %
5 %
3 %
32 %
2 %
2 %
50 %
10 %
10 %
5 %
5 %
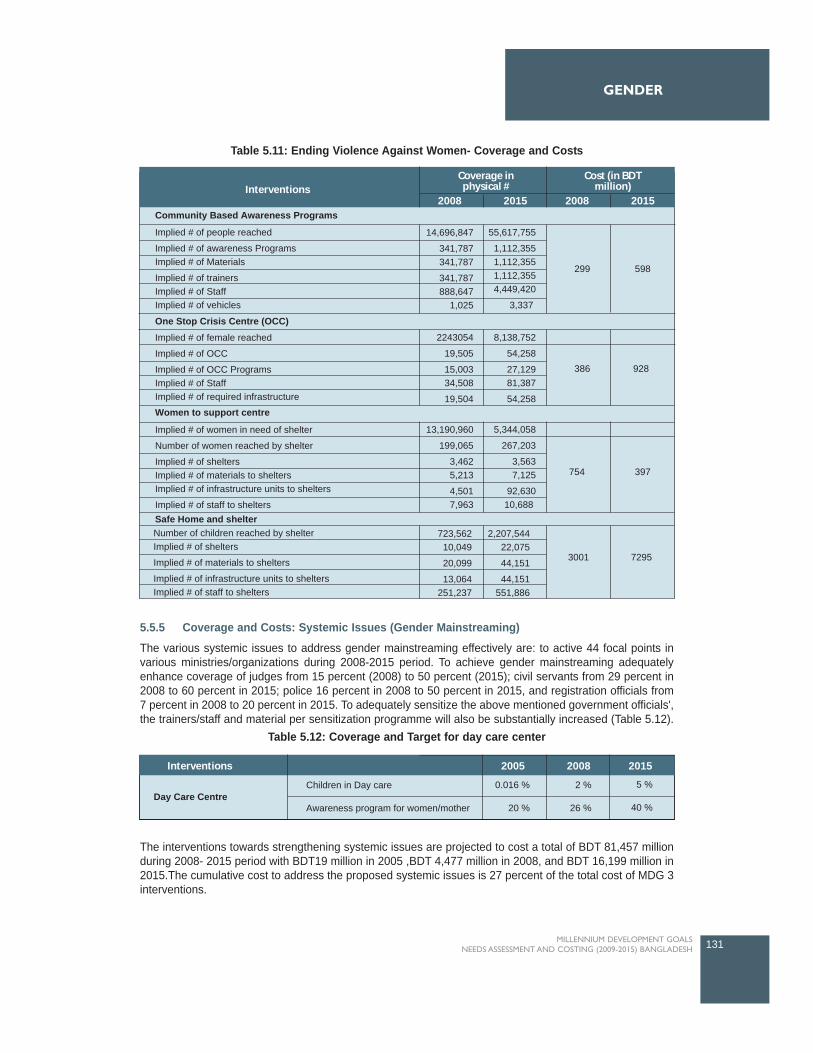
5.5.5 Coverage and Costs: Systemic Issues (Gender Mainstreaming)
The various systemic issues to address gender mainstreaming effectively are: to active 44 focal points invarious ministries/organizations during 2008-2015 period. To achieve gender mainstreaming adequatelyenhance coverage of judges from 15 percent (2008) to 50 percent (2015); civil servants from 29 percent in2008 to 60 percent in 2015; police 16 percent in 2008 to 50 percent in 2015, and registration officials from7 percent in 2008 to 20 percent in 2015. To adequately sensitize the above mentioned government officials',the trainers/staff and material per sensitization programme will also be substantially increased (Table 5.12).
The interventions towards strengthening systemic issues are projected to cost a total of BDT 81,457 millionduring 2008- 2015 period with BDT19 million in 2005 ,BDT 4,477 million in 2008, and BDT 16,199 million in2015.The cumulative cost to address the proposed systemic issues is 27 percent of the total cost of MDG 3interventions.
131MILLENNIUM DEVELOPMENT GOALS NEEDS ASSESSMENT AND COSTING (2009-2015) BANGLADESH
GENDER
InterventionsCost (in BDT
million)Coverage in
physical #2008 2015 2008 2015
Community Based Awareness Programs
One Stop Crisis Centre (OCC)
Women to support centre
Safe Home and shelter
Implied # of female reached
Implied # of OCC
Implied # of OCC ProgramsImplied # of StaffImplied # of required infrastructure
Implied # of women in need of shelter
Number of women reached by shelter
Implied # of sheltersImplied # of materials to sheltersImplied # of infrastructure units to shelters
Implied # of staff to shelters
Number of children reached by shelterImplied # of shelters
Implied # of materials to shelters
Implied # of infrastructure units to sheltersImplied # of staff to shelters
Implied # of people reached
Implied # of awareness ProgramsImplied # of Materials
Implied # of trainersImplied # of StaffImplied # of vehicles
14,696,847
341,787341,787
341,787888,647
1,025
2243054
19,505
15,00334,508
19,504
8,138,752
54,258
27,12981,387
54,258
13,190,960
199,065
3,4625,213
4,5017,963
723,562 10,049
20,099
13,064 251,237
2,207,54422,075
44,151
44,151551,886
3001 7295
5,344,058
267,203
3,5637,125
92,63010,688
55,617,755
1,112,3551,112,3551,112,3554,449,420
3,337
299 598
754
386 928
397
Table 5.11: Ending Violence Against Women- Coverage and Costs
Interventions 2005 2008 2015
Day Care CentreChildren in Day care
Awareness program for women/mother
0.016 %
20 %
2 %
26 %
5 %
40 %
Table 5.12: Coverage and Target for day care center
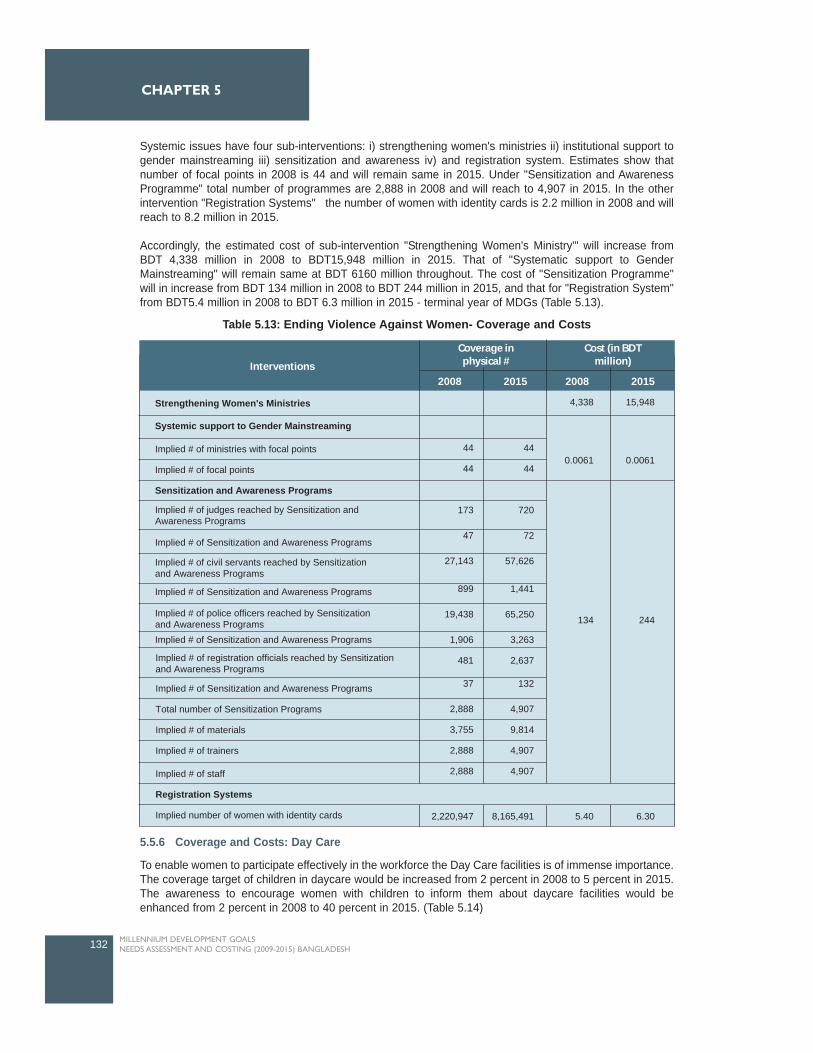
Systemic issues have four sub-interventions: i) strengthening women's ministries ii) institutional support togender mainstreaming iii) sensitization and awareness iv) and registration system. Estimates show thatnumber of focal points in 2008 is 44 and will remain same in 2015. Under "Sensitization and AwarenessProgramme" total number of programmes are 2,888 in 2008 and will reach to 4,907 in 2015. In the otherintervention "Registration Systems" the number of women with identity cards is 2.2 million in 2008 and willreach to 8.2 million in 2015.
Accordingly, the estimated cost of sub-intervention "Strengthening Women's Ministry"' will increase fromBDT 4,338 million in 2008 to BDT15,948 million in 2015. That of "Systematic support to GenderMainstreaming" will remain same at BDT 6160 million throughout. The cost of "Sensitization Programme"will in increase from BDT 134 million in 2008 to BDT 244 million in 2015, and that for "Registration System"from BDT5.4 million in 2008 to BDT 6.3 million in 2015 - terminal year of MDGs (Table 5.13).
5.5.6 Coverage and Costs: Day Care
To enable women to participate effectively in the workforce the Day Care facilities is of immense importance.The coverage target of children in daycare would be increased from 2 percent in 2008 to 5 percent in 2015.The awareness to encourage women with children to inform them about daycare facilities would beenhanced from 2 percent in 2008 to 40 percent in 2015. (Table 5.14)
132 MILLENNIUM DEVELOPMENT GOALS NEEDS ASSESSMENT AND COSTING (2009-2015) BANGLADESH
CHAPTER 5
Interventions
Cost (in BDTmillion)
Coverage inphysical #
2008 2015 2008 2015
Implied # of Sensitization and Awareness Programs
Total number of Sensitization Programs
Implied # of materials
Implied # of trainers
Implied # of staff
Registration Systems
Implied number of women with identity cards
Strengthening Women's Ministries
Systemic support to Gender Mainstreaming
Implied # of ministries with focal points
Implied # of focal points
Sensitization and Awareness Programs
Implied # of judges reached by Sensitization andAwareness Programs
Implied # of civil servants reached by Sensitizationand Awareness Programs
Implied # of Sensitization and Awareness Programs
Implied # of Sensitization and Awareness Programs
Implied # of Sensitization and Awareness Programs
Implied # of police officers reached by Sensitizationand Awareness Programs
Implied # of registration officials reached by Sensitizationand Awareness Programs
44
44
173
47
27,143
899
19,438
1,906
481
37
2,888
3,755
2,888
2,888
44
44
720
72
57,626
1,441
65,250
3,263
2,637
132
4,907
9,814
4,907
4,907
4,338 15,948
0.0061 0.0061
134
5.408,165,4912,220,947 6.30
244
Table 5.13: Ending Violence Against Women- Coverage and Costs
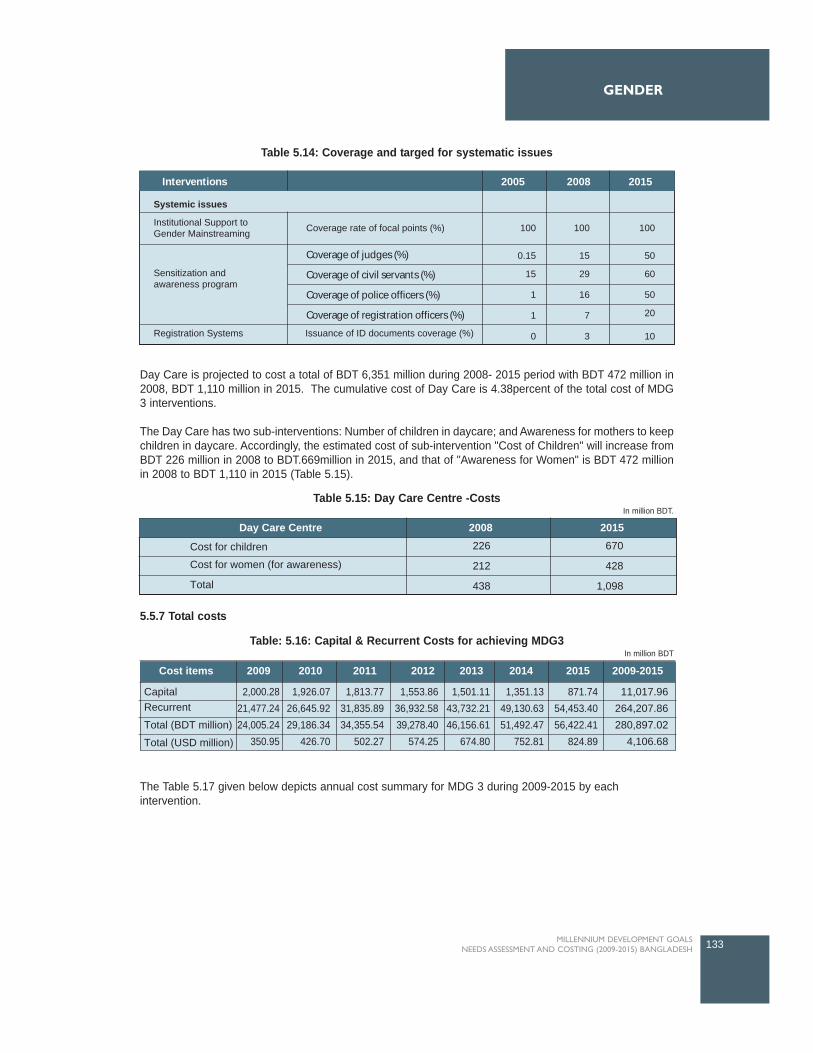
Day Care is projected to cost a total of BDT 6,351 million during 2008- 2015 period with BDT 472 million in2008, BDT 1,110 million in 2015. The cumulative cost of Day Care is 4.38percent of the total cost of MDG3 interventions.
The Day Care has two sub-interventions: Number of children in daycare; and Awareness for mothers to keepchildren in daycare. Accordingly, the estimated cost of sub-intervention "Cost of Children" will increase fromBDT 226 million in 2008 to BDT.669million in 2015, and that of "Awareness for Women" is BDT 472 millionin 2008 to BDT 1,110 in 2015 (Table 5.15).
5.5.7 Total costs
The Table 5.17 given below depicts annual cost summary for MDG 3 during 2009-2015 by eachintervention.
133MILLENNIUM DEVELOPMENT GOALS NEEDS ASSESSMENT AND COSTING (2009-2015) BANGLADESH
GENDER
Interventions 2005 2008 2015
Systemic issues
Institutional Support toGender Mainstreaming
Sensitization andawareness program
Registration Systems
Coverage rate of focal points (%) 100
0.15
15
1
1
15
29
16
7
50
60
50
20
0 3 10
100 100
Issuance of ID documents coverage (%)
Coverage of judges (%)
Coverage of civil servants (%)
Coverage of police officers (%)
Coverage of registration officers (%)
Table 5.14: Coverage and targed for systematic issues
Day Care Centre 2008 2015
Cost for children
Cost for women (for awareness)
Total
226
212
438
670
428
1,098
Table 5.15: Day Care Centre -CostsIn million BDT.
2009-20152009 2010 2011 2012 2013 2014 2015Cost items
Capital
Recurrent
Total (BDT million)
Total (USD million)
2,000.28
21,477.24
24,005.24
350.95
1,926.07
26,645.92
29,186.34
426.70
1,813.77
31,835.89
34,355.54
502.27
1,553.86
36,932.58
39,278.40
574.25
1,501.11
43,732.21
46,156.61
674.80
1,351.13
49,130.63
51,492.47
752.81
871.74
54,453.40
56,422.41
824.89
11,017.96
264,207.86
280,897.02
4,106.68
Table: 5.16: Capital & Recurrent Costs for achieving MDG3In million BDT
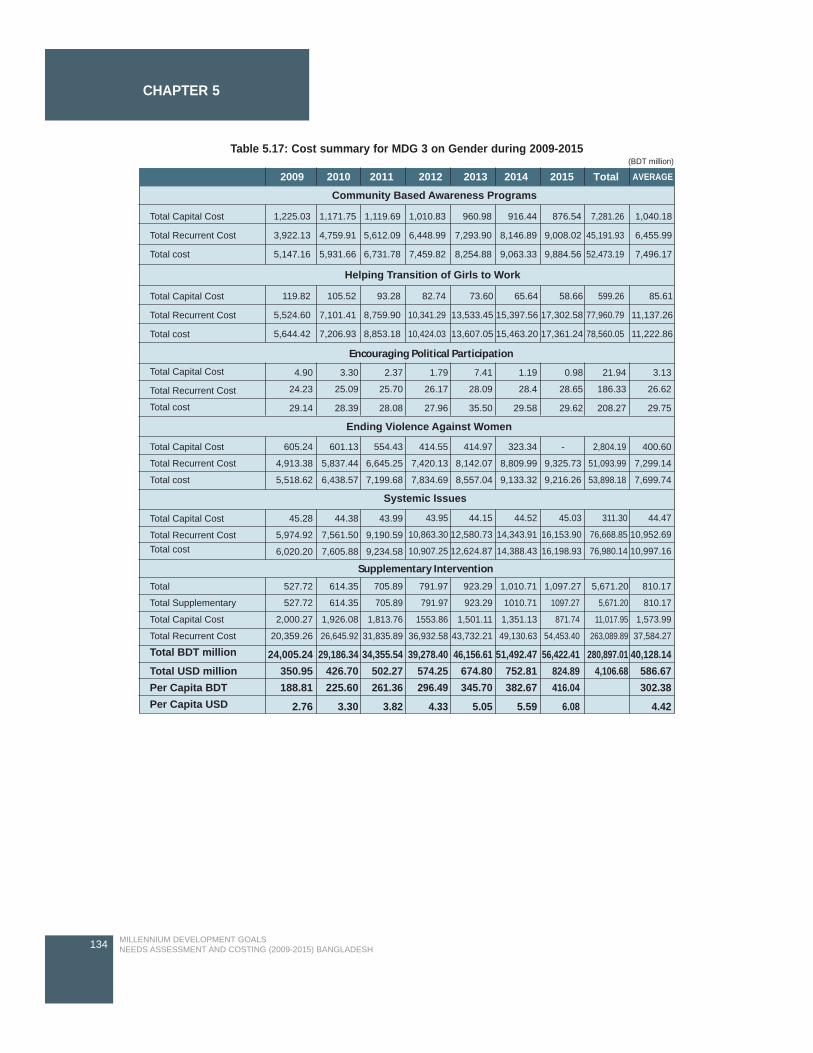
134 MILLENNIUM DEVELOPMENT GOALS NEEDS ASSESSMENT AND COSTING (2009-2015) BANGLADESH
CHAPTER 5
2009 2010 2011 2012 2013 2014 2015 Total AVERAGE
Community Based Awareness Programs
Helping Transition of Girls to Work
Encouraging Political Participation
Systemic Issues
Supplementary Intervention
Ending Violence Against Women
Total Capital Cost
Total Recurrent Cost
Total cost
Total Capital Cost
Total Recurrent Cost
Total cost
Total Capital Cost
Total Recurrent Cost
Total cost
Total Capital Cost
Total Recurrent Cost
Total cost
Total Capital Cost
Total Recurrent CostTotal cost
Total Supplementary
Total Capital Cost
Total Recurrent Cost
Total BDT million
Total USD millionPer Capita BDTPer Capita USD
1,225.03
3,922.13
5,147.16
119.82
5,524.60
5,644.42
105.52
7,101.41
7,206.93
93.28
8,759.90
8,853.18
82.74
10,341.29
10,424.03
73.60
13,533.45
13,607.05
65.64
15,397.56
15,463.20
58.66
17,302.58
17,361.24
599.26
77,960.79
78,560.05
85.61
11,137.26
11,222.86
1,171.75
4,759.91
5,931.66
1,119.69
5,612.09
6,731.78
1,010.83
6,448.99
7,459.82
960.98
7,293.90
8,254.88
916.44
8,146.89
9,063.33
876.54
9,008.02
9,884.56
7,281.26
45,191.93
52,473.19
1,040.18
6,455.99
7,496.17
605.24
4,913.38
5,518.62
45.28
5,974.92
6,020.20
44.38
7,561.50
7,605.88
43.99
9,190.59
9,234.58
43.95
10,863.30
10,907.25
44.15
12,580.73
12,624.87
44.52
14,343.91
14,388.43
45.03
16,153.90
16,198.93
311.30
76,668.85
76,980.14
44.47
10,952.69
10,997.16
601.13
5,837.44
6,438.57
554.43
6,645.25
7,199.68
414.55
7,420.13
7,834.69
414.97
8,142.07
8,557.04
323.34
8,809.99
9,133.32
-
9,325.73
9,216.26
2,804.19
51,093.99
53,898.18
400.60
7,299.14
7,699.74
Total 527.72 614.35 705.89 791.97 923.29 1,010.71 1,097.27 5,671.20 810.17
4.90
24.23
29.14
3.30
25.09
28.39
2.37
25.70
28.08
1.79
26.17
27.96
7.41
28.09
35.50
1.19
28.4
29.58
0.98
28.65
29.62
21.94
186.33
208.27
3.13
26.62
29.75
527.72
2,000.27
20,359.26
24,005.24350.95188.81
2.76
614.35
1,926.08
26,645.92
29,186.34426.70225.60
3.30
705.89
1,813.76
31,835.89
34,355.54502.27261.36
3.82
791.97
1553.86
36,932.58
39,278.40574.25296.49
4.33
923.29
1,501.11
43,732.21
46,156.61674.80345.70
5.05
1010.71
1,351.13
49,130.63
51,492.47752.81382.67
5.59
1097.27
871.74
54,453.40
56,422.41824.89416.04
6.08
5,671.20
11,017.95
263,089.89
280,897.014,106.68
810.17
1,573.99
37,584.27
40,128.14586.67302.38
4.42
Table 5.17: Cost summary for MDG 3 on Gender during 2009-2015 (BDT million)

HEALTH
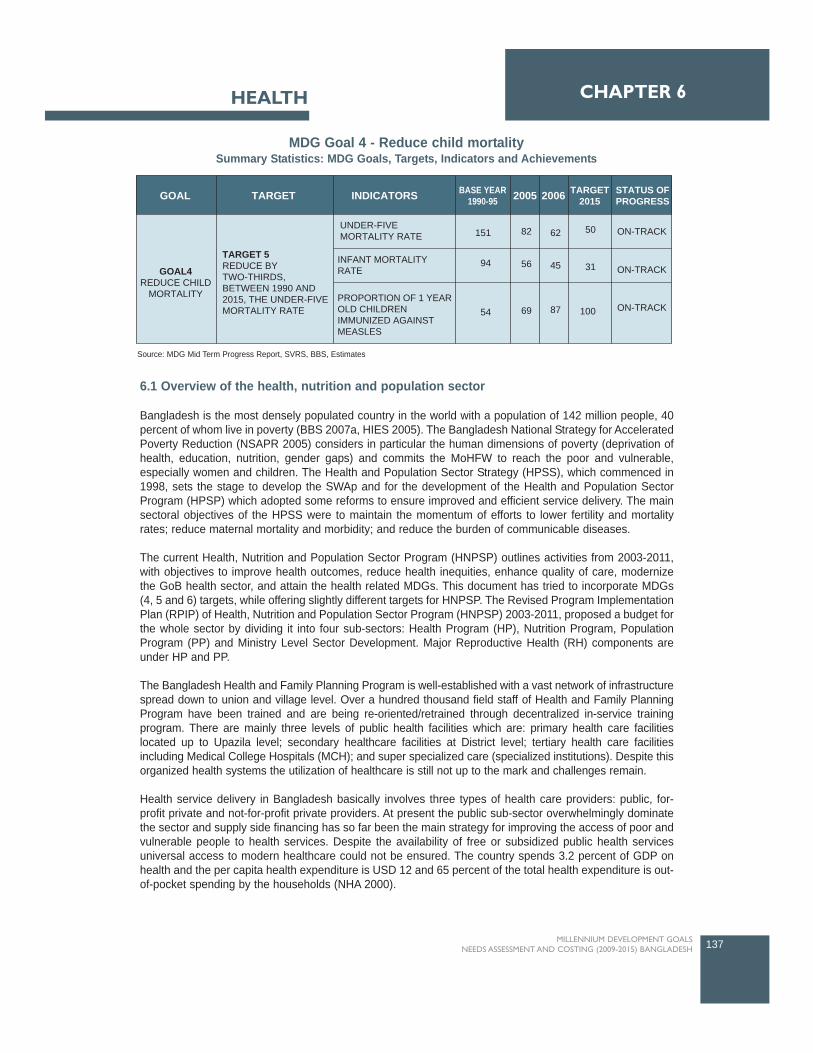
6.1 Overview of the health, nutrition and population sector
Bangladesh is the most densely populated country in the world with a population of 142 million people, 40percent of whom live in poverty (BBS 2007a, HIES 2005). The Bangladesh National Strategy for AcceleratedPoverty Reduction (NSAPR 2005) considers in particular the human dimensions of poverty (deprivation ofhealth, education, nutrition, gender gaps) and commits the MoHFW to reach the poor and vulnerable,especially women and children. The Health and Population Sector Strategy (HPSS), which commenced in1998, sets the stage to develop the SWAp and for the development of the Health and Population SectorProgram (HPSP) which adopted some reforms to ensure improved and efficient service delivery. The mainsectoral objectives of the HPSS were to maintain the momentum of efforts to lower fertility and mortalityrates; reduce maternal mortality and morbidity; and reduce the burden of communicable diseases.
The current Health, Nutrition and Population Sector Program (HNPSP) outlines activities from 2003-2011,with objectives to improve health outcomes, reduce health inequities, enhance quality of care, modernizethe GoB health sector, and attain the health related MDGs. This document has tried to incorporate MDGs(4, 5 and 6) targets, while offering slightly different targets for HNPSP. The Revised Program ImplementationPlan (RPIP) of Health, Nutrition and Population Sector Program (HNPSP) 2003-2011, proposed a budget forthe whole sector by dividing it into four sub-sectors: Health Program (HP), Nutrition Program, PopulationProgram (PP) and Ministry Level Sector Development. Major Reproductive Health (RH) components areunder HP and PP.
The Bangladesh Health and Family Planning Program is well-established with a vast network of infrastructurespread down to union and village level. Over a hundred thousand field staff of Health and Family PlanningProgram have been trained and are being re-oriented/retrained through decentralized in-service trainingprogram. There are mainly three levels of public health facilities which are: primary health care facilitieslocated up to Upazila level; secondary healthcare facilities at District level; tertiary health care facilitiesincluding Medical College Hospitals (MCH); and super specialized care (specialized institutions). Despite thisorganized health systems the utilization of healthcare is still not up to the mark and challenges remain.
Health service delivery in Bangladesh basically involves three types of health care providers: public, for-profit private and not-for-profit private providers. At present the public sub-sector overwhelmingly dominatethe sector and supply side financing has so far been the main strategy for improving the access of poor andvulnerable people to health services. Despite the availability of free or subsidized public health servicesuniversal access to modern healthcare could not be ensured. The country spends 3.2 percent of GDP onhealth and the per capita health expenditure is USD 12 and 65 percent of the total health expenditure is out-of-pocket spending by the households (NHA 2000).
137MILLENNIUM DEVELOPMENT GOALS NEEDS ASSESSMENT AND COSTING (2009-2015) BANGLADESH
CHAPTER 6HEALTH
TARGET INDICATORSGOAL BASE YEAR1990-95 2005 2006 TARGET
2015STATUS OFPROGRESS
GOAL4REDUCE CHILD
MORTALITY
TARGET 5REDUCE BYTWO-THIRDS,BETWEEN 1990 AND2015, THE UNDER-FIVEMORTALITY RATE
UNDER-FIVEMORTALITY RATE
INFANT MORTALITYRATE
PROPORTION OF 1 YEAROLD CHILDRENIMMUNIZED AGAINSTMEASLES
151
94
54
62
45
87
50
31
100
82
56
69
ON-TRACK
ON-TRACK
ON-TRACK
MDG Goal 4 - Reduce child mortality Summary Statistics: MDG Goals, Targets, Indicators and Achievements
Source: MDG Mid Term Progress Report, SVRS, BBS, Estimates
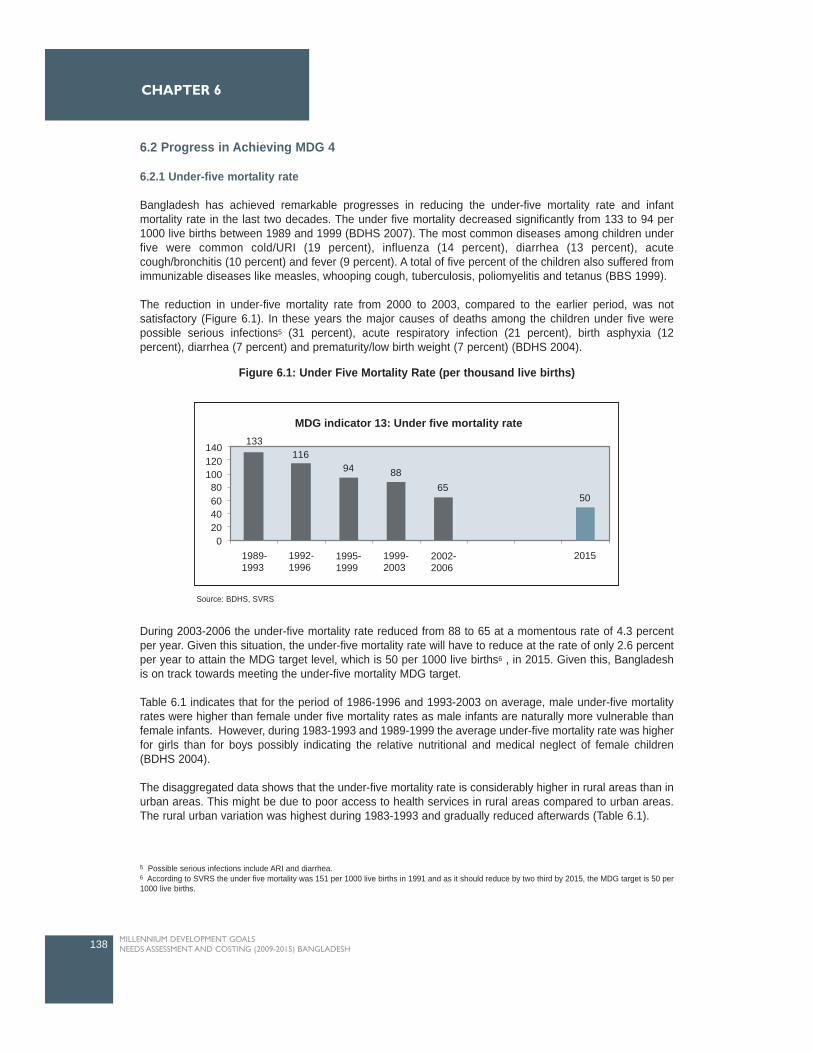
6.2 Progress in Achieving MDG 4
6.2.1 Under-five mortality rate
Bangladesh has achieved remarkable progresses in reducing the under-five mortality rate and infantmortality rate in the last two decades. The under five mortality decreased significantly from 133 to 94 per1000 live births between 1989 and 1999 (BDHS 2007). The most common diseases among children underfive were common cold/URI (19 percent), influenza (14 percent), diarrhea (13 percent), acutecough/bronchitis (10 percent) and fever (9 percent). A total of five percent of the children also suffered fromimmunizable diseases like measles, whooping cough, tuberculosis, poliomyelitis and tetanus (BBS 1999).
The reduction in under-five mortality rate from 2000 to 2003, compared to the earlier period, was notsatisfactory (Figure 6.1). In these years the major causes of deaths among the children under five werepossible serious infections5 (31 percent), acute respiratory infection (21 percent), birth asphyxia (12percent), diarrhea (7 percent) and prematurity/low birth weight (7 percent) (BDHS 2004).
During 2003-2006 the under-five mortality rate reduced from 88 to 65 at a momentous rate of 4.3 percentper year. Given this situation, the under-five mortality rate will have to reduce at the rate of only 2.6 percentper year to attain the MDG target level, which is 50 per 1000 live births6 , in 2015. Given this, Bangladeshis on track towards meeting the under-five mortality MDG target.
Table 6.1 indicates that for the period of 1986-1996 and 1993-2003 on average, male under-five mortalityrates were higher than female under five mortality rates as male infants are naturally more vulnerable thanfemale infants. However, during 1983-1993 and 1989-1999 the average under-five mortality rate was higherfor girls than for boys possibly indicating the relative nutritional and medical neglect of female children(BDHS 2004).
The disaggregated data shows that the under-five mortality rate is considerably higher in rural areas than inurban areas. This might be due to poor access to health services in rural areas compared to urban areas.The rural urban variation was highest during 1983-1993 and gradually reduced afterwards (Table 6.1).
138 MILLENNIUM DEVELOPMENT GOALS NEEDS ASSESSMENT AND COSTING (2009-2015) BANGLADESH
CHAPTER 6
MDG indicator 13: Under five mortality rate
14012010080604020
1989- 1993
1992- 1996
1995- 1999
1999- 2003
2002- 2006
2015
50
0
133116
94 8865
Figure 6.1: Under Five Mortality Rate (per thousand live births)
Source: BDHS, SVRS
5 Possible serious infections include ARI and diarrhea.6 According to SVRS the under five mortality was 151 per 1000 live births in 1991 and as it should reduce by two third by 2015, the MDG target is 50 per1000 live births.
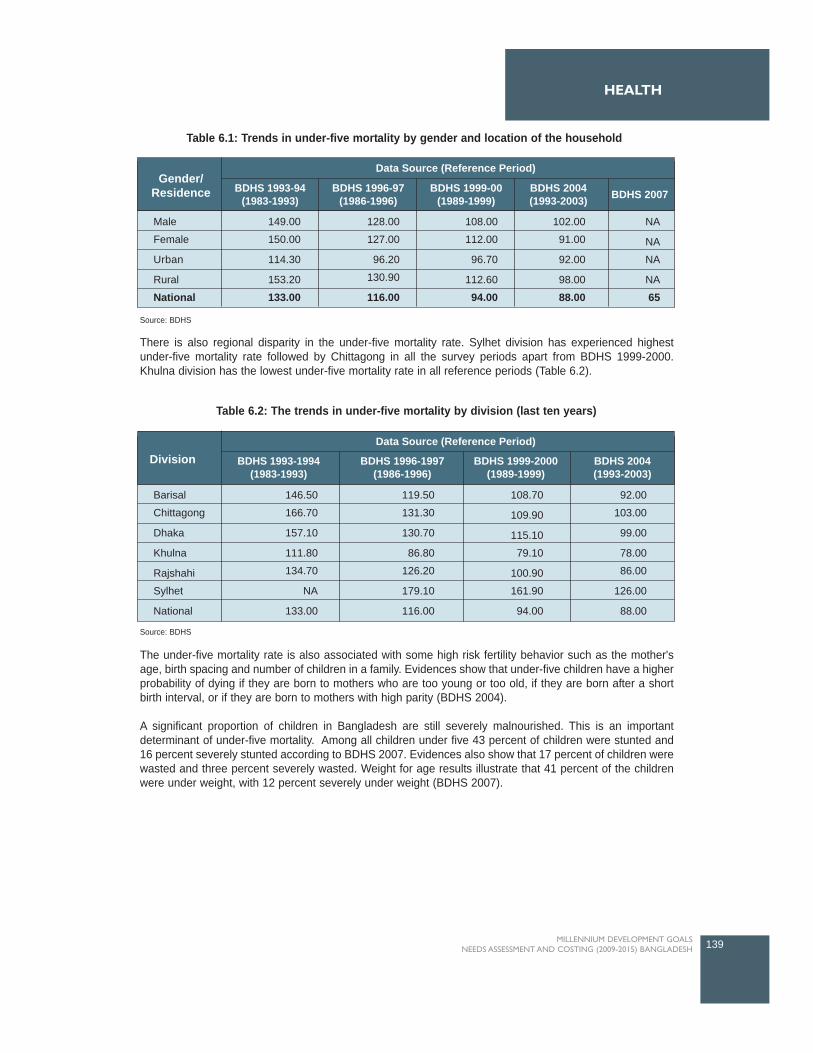
HEALTH
There is also regional disparity in the under-five mortality rate. Sylhet division has experienced highestunder-five mortality rate followed by Chittagong in all the survey periods apart from BDHS 1999-2000.Khulna division has the lowest under-five mortality rate in all reference periods (Table 6.2).
The under-five mortality rate is also associated with some high risk fertility behavior such as the mother'sage, birth spacing and number of children in a family. Evidences show that under-five children have a higherprobability of dying if they are born to mothers who are too young or too old, if they are born after a shortbirth interval, or if they are born to mothers with high parity (BDHS 2004).
A significant proportion of children in Bangladesh are still severely malnourished. This is an importantdeterminant of under-five mortality. Among all children under five 43 percent of children were stunted and16 percent severely stunted according to BDHS 2007. Evidences also show that 17 percent of children werewasted and three percent severely wasted. Weight for age results illustrate that 41 percent of the childrenwere under weight, with 12 percent severely under weight (BDHS 2007).
139MILLENNIUM DEVELOPMENT GOALS NEEDS ASSESSMENT AND COSTING (2009-2015) BANGLADESH
Gender/Residence BDHS 1993-94
(1983-1993)BDHS 1996-97
(1986-1996)BDHS 1999-00
(1989-1999)BDHS 2004(1993-2003) BDHS 2007
Data Source (Reference Period)
Male
Female
Urban
Rural
National
149.00
150.00
114.30
153.20
133.00
128.00
127.00
96.20
130.90
116.00
108.00
112.00
96.70
112.60
94.00
102.00
91.00
92.00
98.00
88.00
NA
NA
NA
NA
65
Division BDHS 1993-1994(1983-1993)
BDHS 1996-1997(1986-1996)
BDHS 1999-2000(1989-1999)
BDHS 2004(1993-2003)
Data Source (Reference Period)
Barisal
Chittagong
Dhaka
Khulna
Rajshahi
Sylhet
National
146.50
166.70
157.10
111.80
134.70
NA
133.00
119.50
131.30
130.70
86.80
126.20
179.10
116.00
108.70
109.90
115.10
79.10
100.90
161.90
94.00
92.00
103.00
99.00
78.00
86.00
126.00
88.00
Table 6.1: Trends in under-five mortality by gender and location of the household
Table 6.2: The trends in under-five mortality by division (last ten years)
Source: BDHS
Source: BDHS
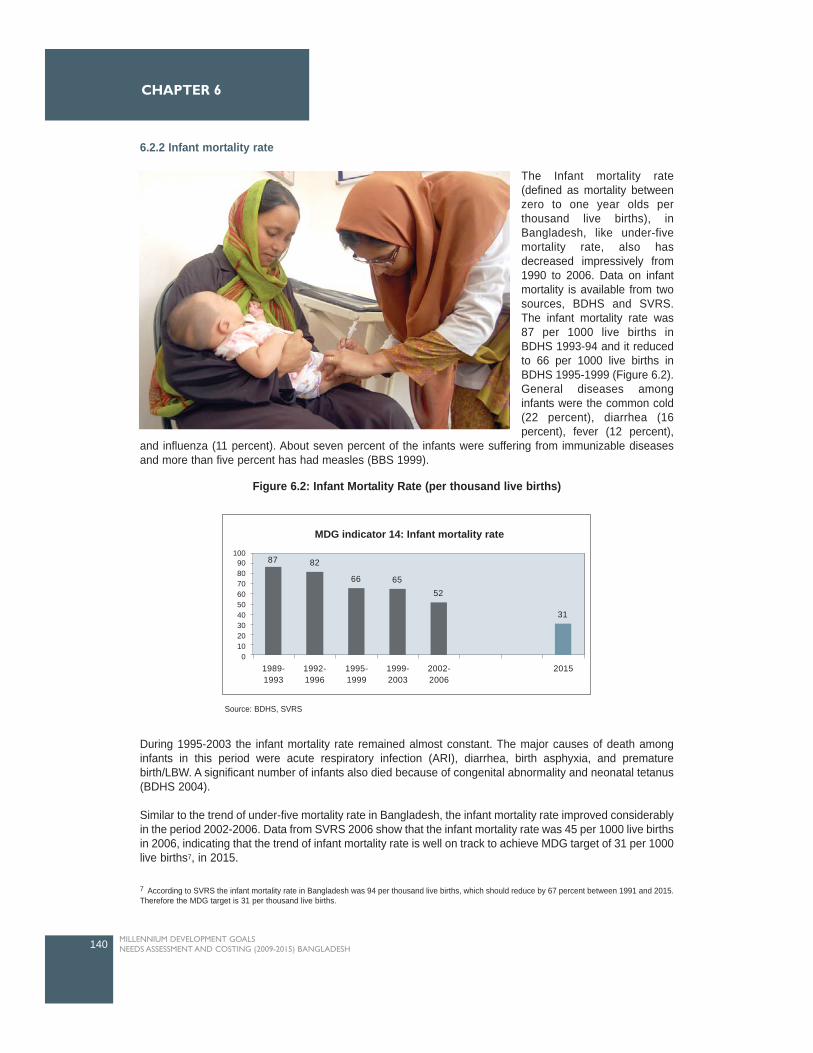
6.2.2 Infant mortality rate
The Infant mortality rate(defined as mortality betweenzero to one year olds perthousand live births), inBangladesh, like under-fivemortality rate, also hasdecreased impressively from1990 to 2006. Data on infantmortality is available from twosources, BDHS and SVRS.The infant mortality rate was87 per 1000 live births inBDHS 1993-94 and it reducedto 66 per 1000 live births inBDHS 1995-1999 (Figure 6.2).General diseases amonginfants were the common cold(22 percent), diarrhea (16percent), fever (12 percent),
and influenza (11 percent). About seven percent of the infants were suffering from immunizable diseasesand more than five percent has had measles (BBS 1999).
During 1995-2003 the infant mortality rate remained almost constant. The major causes of death amonginfants in this period were acute respiratory infection (ARI), diarrhea, birth asphyxia, and prematurebirth/LBW. A significant number of infants also died because of congenital abnormality and neonatal tetanus(BDHS 2004).
Similar to the trend of under-five mortality rate in Bangladesh, the infant mortality rate improved considerablyin the period 2002-2006. Data from SVRS 2006 show that the infant mortality rate was 45 per 1000 live birthsin 2006, indicating that the trend of infant mortality rate is well on track to achieve MDG target of 31 per 1000live births7, in 2015.
140 MILLENNIUM DEVELOPMENT GOALS NEEDS ASSESSMENT AND COSTING (2009-2015) BANGLADESH
CHAPTER 6
87 82
66 6552
31
1989-1993
1992-1996
1995-1999
1999-2003
2002-2006
2015
MDG indicator 14: Infant mortality rate10090 80 70 60 50 40 30 20 10 0
Figure 6.2: Infant Mortality Rate (per thousand live births)
Source: BDHS, SVRS
7 According to SVRS the infant mortality rate in Bangladesh was 94 per thousand live births, which should reduce by 67 percent between 1991 and 2015.Therefore the MDG target is 31 per thousand live births.
The data disaggregated by gender shows that, as expected, male children are more likely to die in infancy thanfemale children. In all reference periods infant mortality rates were higher for boys than for girls (Table 6.3). The rural-urban variation in infant mortality rate is also evident from the analysis. The differences in infantmortality rate amongst divisions are large. Khulna division has the lowest levels of infant mortality rates whileSylhet division has the highest levels of infant mortality rates in all years. However the gap between thehighest and lowest infant mortality decreased from 63 per 1000 live births in 1992-1996 to 39 per 1000 livebirths in 1999-2003 (Table 6.4).
The infant mortality rate, as the under-five mortality rate, is also highly correlated to mother's age, birthspacing and number of children in a family. Infant mortality is likely to be higher if the mothers are less than18 years of age or over 34 years of age at the time of delivery. Birth spacing is negatively related to infantmortality rate and birth order is positively associated with infant mortality rate (BDHS 2004).
6.2.3 Child immunization against measles
Bangladesh has improved significantly in childhood vaccination coverage, which is crucial for reducing infantand child morbidity and mortality. Under the government's Expanded Program on Immunization (EPI),children under one year of age should receive immunization for six vaccine-preventable diseases(tuberculosis; diphtheria, pertussis, and tetanus (DPT); poliomyelitis; and measles). Recently a Hepatitis Bvaccine was also recommended as part of the immunization schedule in Bangladesh. This program hasbeen highly successful in increasing the immunization coverage from less than one percent in 1981 to 84percent in 2006 (MICS 2006).
141MILLENNIUM DEVELOPMENT GOALS NEEDS ASSESSMENT AND COSTING (2009-2015) BANGLADESH
HEALTH
Gender/Residence BDHS 1993-94
(1989-1993)BDHS 1996-97
(1992-1996)BDHS 1999-00
(1995-1999)BDHS 2004(1999-2003)
Data Source (Reference Period)
Male
Female
Urban
Rural
Total
107
93
81
103
101
95
84
73
91
90
82
77
75
81
80
80
64
72
72
NA
Division BDHS 1993-94(1989-1993)
BDHS 1996-97(1992-1996)
BDHS 1999-00(1995-1999)
BDHS 2004(1999-2003)
Data Source (Reference Period)
Barisal
Chittagong
Dhaka
Khulna
Rajshahi
Sylhet
Total
102
103
106
89
95
NA
101
86
77
91
75
95
138
90
76
69
84
64
76
127
80
61
68
75
66
70
100
NA
Table 6.3: Trends in infant mortality rate by gender and location of the household
Table 6.4: The trends in infant mortality rate by division
Source: BDHS
Source: BDHS
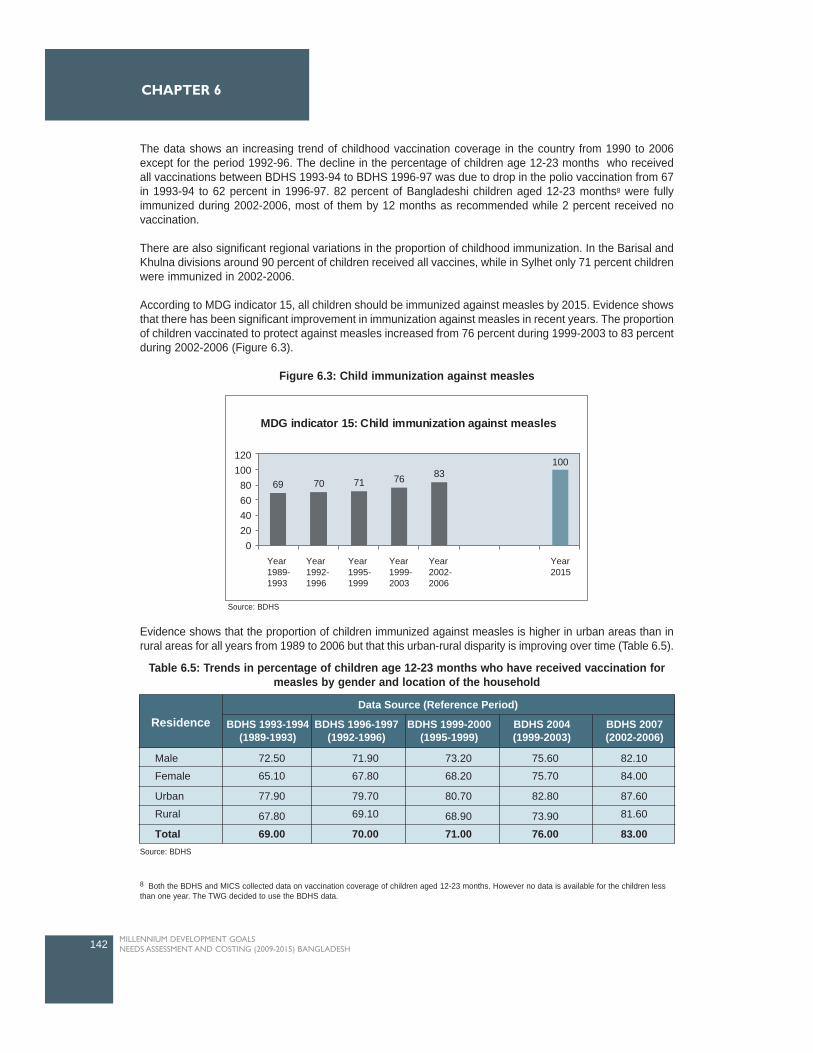
The data shows an increasing trend of childhood vaccination coverage in the country from 1990 to 2006except for the period 1992-96. The decline in the percentage of children age 12-23 months who receivedall vaccinations between BDHS 1993-94 to BDHS 1996-97 was due to drop in the polio vaccination from 67in 1993-94 to 62 percent in 1996-97. 82 percent of Bangladeshi children aged 12-23 months8 were fullyimmunized during 2002-2006, most of them by 12 months as recommended while 2 percent received novaccination.
There are also significant regional variations in the proportion of childhood immunization. In the Barisal andKhulna divisions around 90 percent of children received all vaccines, while in Sylhet only 71 percent childrenwere immunized in 2002-2006.
According to MDG indicator 15, all children should be immunized against measles by 2015. Evidence showsthat there has been significant improvement in immunization against measles in recent years. The proportionof children vaccinated to protect against measles increased from 76 percent during 1999-2003 to 83 percentduring 2002-2006 (Figure 6.3).
Figure 6.3: Child immunization against measles
Evidence shows that the proportion of children immunized against measles is higher in urban areas than inrural areas for all years from 1989 to 2006 but that this urban-rural disparity is improving over time (Table 6.5).
142 MILLENNIUM DEVELOPMENT GOALS NEEDS ASSESSMENT AND COSTING (2009-2015) BANGLADESH
CHAPTER 6
Residence BDHS 1993-1994(1989-1993)
BDHS 1996-1997(1992-1996)
BDHS 1999-2000(1995-1999)
BDHS 2004(1999-2003)
BDHS 2007(2002-2006)
Data Source (Reference Period)
Male
Female
Urban
Rural
Total
72.50
65.10
77.90
67.80
69.00
71.90
67.80
79.70
69.10
70.00
73.20
68.20
80.70
68.90
71.00
75.60
75.70
82.80
73.90
76.00
82.10
84.00
87.60
81.60
83.00
Table 6.5: Trends in percentage of children age 12-23 months who have received vaccination formeasles by gender and location of the household
Source: BDHS
8 Both the BDHS and MICS collected data on vaccination coverage of children aged 12-23 months. However no data is available for the children lessthan one year. The TWG decided to use the BDHS data.
69 70 71 76 83100
MDG indicator 15: Child immunization against measles
120 100
80 60 40 20
0Year1989-1993
Year1992-1996
Year1995-1999
Year1999-2003
Year2002-2006
Year2015
Source: BDHS
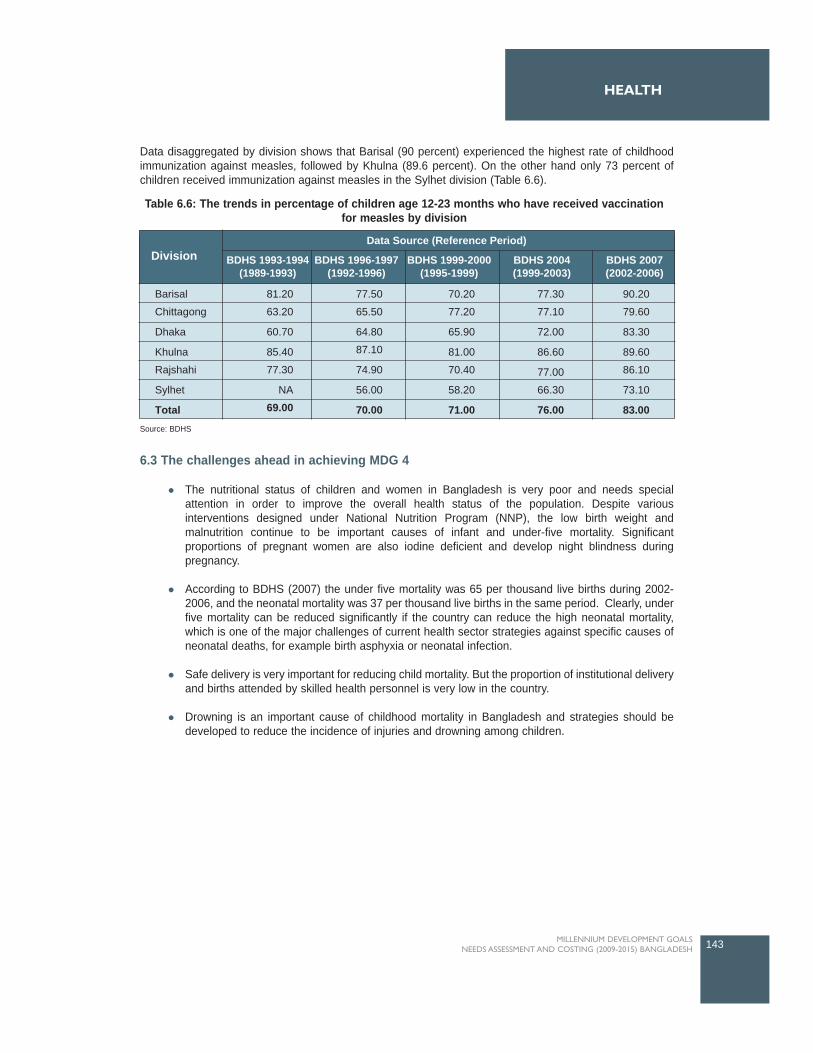
Data disaggregated by division shows that Barisal (90 percent) experienced the highest rate of childhoodimmunization against measles, followed by Khulna (89.6 percent). On the other hand only 73 percent ofchildren received immunization against measles in the Sylhet division (Table 6.6).
6.3 The challenges ahead in achieving MDG 4
The nutritional status of children and women in Bangladesh is very poor and needs specialattention in order to improve the overall health status of the population. Despite variousinterventions designed under National Nutrition Program (NNP), the low birth weight andmalnutrition continue to be important causes of infant and under-five mortality. Significantproportions of pregnant women are also iodine deficient and develop night blindness duringpregnancy.
According to BDHS (2007) the under five mortality was 65 per thousand live births during 2002-2006, and the neonatal mortality was 37 per thousand live births in the same period. Clearly, underfive mortality can be reduced significantly if the country can reduce the high neonatal mortality,which is one of the major challenges of current health sector strategies against specific causes ofneonatal deaths, for example birth asphyxia or neonatal infection.
Safe delivery is very important for reducing child mortality. But the proportion of institutional deliveryand births attended by skilled health personnel is very low in the country.
Drowning is an important cause of childhood mortality in Bangladesh and strategies should bedeveloped to reduce the incidence of injuries and drowning among children.
143MILLENNIUM DEVELOPMENT GOALS NEEDS ASSESSMENT AND COSTING (2009-2015) BANGLADESH
HEALTH
Division BDHS 1993-1994(1989-1993)
BDHS 1996-1997(1992-1996)
BDHS 1999-2000(1995-1999)
BDHS 2004(1999-2003)
BDHS 2007(2002-2006)
Data Source (Reference Period)
Barisal
Chittagong
Dhaka
Khulna
Rajshahi
Sylhet
Total
81.20
63.20
60.70
85.40
77.30
NA
69.00
77.50
65.50
64.80
87.10
74.90
56.00
70.00
70.20
77.20
65.90
81.00
70.40
58.20
71.00
77.30
77.10
72.00
86.60
77.00
66.30
76.00
90.20
79.60
83.30
89.60
86.10
73.10
83.00
Table 6.6: The trends in percentage of children age 12-23 months who have received vaccinationfor measles by division
Source: BDHS
6.4 Major Interventions and Targets for attaining MDG 4
This section describes the key interventions for reducing child mortality in Bangladesh.
6.4.1 Expanded Program on Immunization (EPI)
The specific objectives of this Program were to increase the vaccination coverage with full series ofroutine EPI vaccines to 90 percent by 2010; to achieve neonatal tetanus elimination in all districts; andto reduce the prevalence of HepB chronic infection by 80 percent by 2010 among three to five yearsold children compared to pre-vaccination era (MIS 2007). According to BDHS, the vaccinationcoverage for BCG was 97 percent, DPT was 91 percent, Polio was 91 percent, Hepatitis B was 83percent, and Measles was 83 percent during 2002-2006. The coverage in 2007, calculated using thetrends and the corresponding figures, were 98 percent, 94 percent, 93 percent, 84 percent, and 85percent respectively. It is expected that the Hib vaccine will be provided with DPT and HepB(pentavalent vaccine) from 2009 (EPI data 2008). The target set by the TWG was 100 percentcoverage for all vaccines by 2015 (Table 6.7).
6.4.2 Integrated Management of Childhood Illness (IMCI)
To reduce infant and under five child mortality, the government has started the Integrated Management ofChildhood Illness (IMCI)9 programme in 2001 in three Upazilas. In 2007, the IMCI was expanded to 274Upazilas. The main objectives of this program were to reduce morbidity and mortality associated with majorcauses of diseases in under-five children and to promote healthy growth and development by preventingdiseases and promoting healthy practices (MIS 2007). Under the Program, clinical management training isprovided to doctors and paramedics. Other interventions under this program included: facilitator training forthe doctors; IMCI training for basic health workers and village doctors; training on Control of DiarrhoealDiseases (CDD) and Acute Respiratory Infection (ARI) in the non IMCI area; and counseling training forcommunity-based health volunteer. So far, 1704 doctors, 4510 paramedics, 1600 basic health workers and1800 village doctors have been trained under this program (MIS 2007). The Second PRSP suggestedincreasing the use of IMCI at union level.
6.4.3 Treatment of Diarrhea and ARI
Dehydration from diarrhoea is an important contributing cause of childhood mortality. The estimated numberof deaths due to diarrhea was about 250,000 per year in the late 1980s. The innovation and widespread useof ORT (Oral Rehydration Therapy) with either oral rehydration salts (ORS) or home fluids have greatlyreduced the diarrhea-related mortality and the number of deaths due to diarrhea was 45,000 in 2004(HNPSP 2008). The coverage of ORT was around 80 percent in 2007 (BDHS). The target set by thestudy/TWG was 100 percent coverage by 2015.
6.4.4 Treatment of ARI and fever
Data from BDHS 2007 also show that about 40 percent of children under-five had fever and around 21percent suffered from acute respiratory infection. The current coverage of ARI is only 20 percent. About 70percent of the ARI cases can be managed by the community-based case management through an increasein early detection and modern treatment. Thus the coverage should be increased to 50 percent by 2011(HNPSP 2008). The National Task Force for MDGs 1, 4 and 5 in Bangladesh also set target of 50 percentcoverage for 2015. The TWG used the target coverage of 50 percent for the costing exercise.
6.4.5 Micronutrient Supplementation
The objective of the micronutrient supplementation program is to reduce the micronutrient deficiencies ofvulnerable groups like children, women and adolescent. The vitamin A is an important micronutrient and highlevels of vitamin A deficiency can cause night blindness among children as well as increase severity of otherillnesses like measles and diarrhea. Under the Nutrition Blindness Prevention Programme (NBPP) childrenunder one year are provided high potency vitamin A capsule during measles vaccination. Children aged on
144 MILLENNIUM DEVELOPMENT GOALS NEEDS ASSESSMENT AND COSTING (2009-2015) BANGLADESH
CHAPTER 6
9 WHO and UNICEF have developed the strategy of Integrated Management of Childhood Illness (IMCI) in the early nineties and promoted in morethan 100 developing countries to reduce childhood morbidity and mortality and for promoting healthy growth and development.
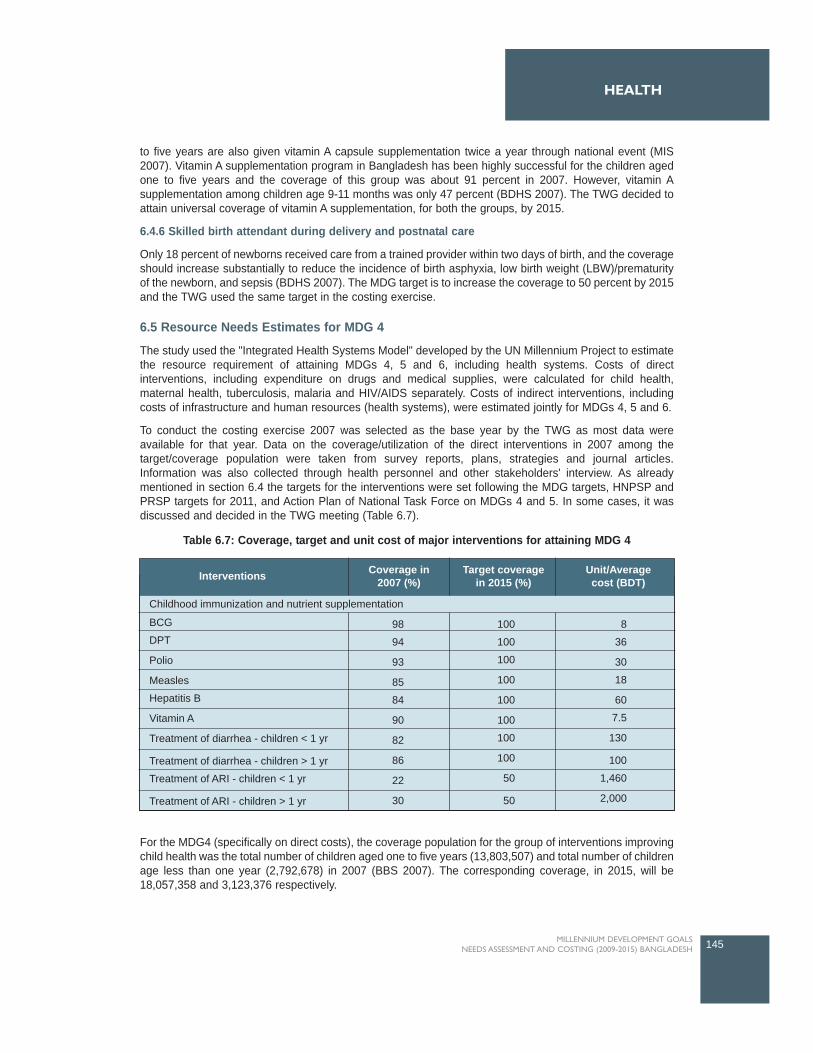
to five years are also given vitamin A capsule supplementation twice a year through national event (MIS2007). Vitamin A supplementation program in Bangladesh has been highly successful for the children agedone to five years and the coverage of this group was about 91 percent in 2007. However, vitamin Asupplementation among children age 9-11 months was only 47 percent (BDHS 2007). The TWG decided toattain universal coverage of vitamin A supplementation, for both the groups, by 2015.
6.4.6 Skilled birth attendant during delivery and postnatal care
Only 18 percent of newborns received care from a trained provider within two days of birth, and the coverageshould increase substantially to reduce the incidence of birth asphyxia, low birth weight (LBW)/prematurityof the newborn, and sepsis (BDHS 2007). The MDG target is to increase the coverage to 50 percent by 2015and the TWG used the same target in the costing exercise.
6.5 Resource Needs Estimates for MDG 4
The study used the "Integrated Health Systems Model" developed by the UN Millennium Project to estimatethe resource requirement of attaining MDGs 4, 5 and 6, including health systems. Costs of directinterventions, including expenditure on drugs and medical supplies, were calculated for child health,maternal health, tuberculosis, malaria and HIV/AIDS separately. Costs of indirect interventions, includingcosts of infrastructure and human resources (health systems), were estimated jointly for MDGs 4, 5 and 6.
To conduct the costing exercise 2007 was selected as the base year by the TWG as most data wereavailable for that year. Data on the coverage/utilization of the direct interventions in 2007 among thetarget/coverage population were taken from survey reports, plans, strategies and journal articles.Information was also collected through health personnel and other stakeholders' interview. As alreadymentioned in section 6.4 the targets for the interventions were set following the MDG targets, HNPSP andPRSP targets for 2011, and Action Plan of National Task Force on MDGs 4 and 5. In some cases, it wasdiscussed and decided in the TWG meeting (Table 6.7).
For the MDG4 (specifically on direct costs), the coverage population for the group of interventions improvingchild health was the total number of children aged one to five years (13,803,507) and total number of childrenage less than one year (2,792,678) in 2007 (BBS 2007). The corresponding coverage, in 2015, will be18,057,358 and 3,123,376 respectively.
145MILLENNIUM DEVELOPMENT GOALS NEEDS ASSESSMENT AND COSTING (2009-2015) BANGLADESH
HEALTH
Table 6.7: Coverage, target and unit cost of major interventions for attaining MDG 4
Interventions
Childhood immunization and nutrient supplementation
Coverage in2007 (%)
Target coveragein 2015 (%)
Unit/Averagecost (BDT)
BCG
DPT
Polio
Measles
Hepatitis B
Vitamin A
Treatment of diarrhea - children < 1 yr
Treatment of diarrhea - children > 1 yr
Treatment of ARI - children < 1 yr
Treatment of ARI - children > 1 yr
8
36
30
18
60
7.5
130
100
1,460
2,000
100
100
100
100
100
100
100
100
50
50
98
94
93
85
84
90
82
86
22
30
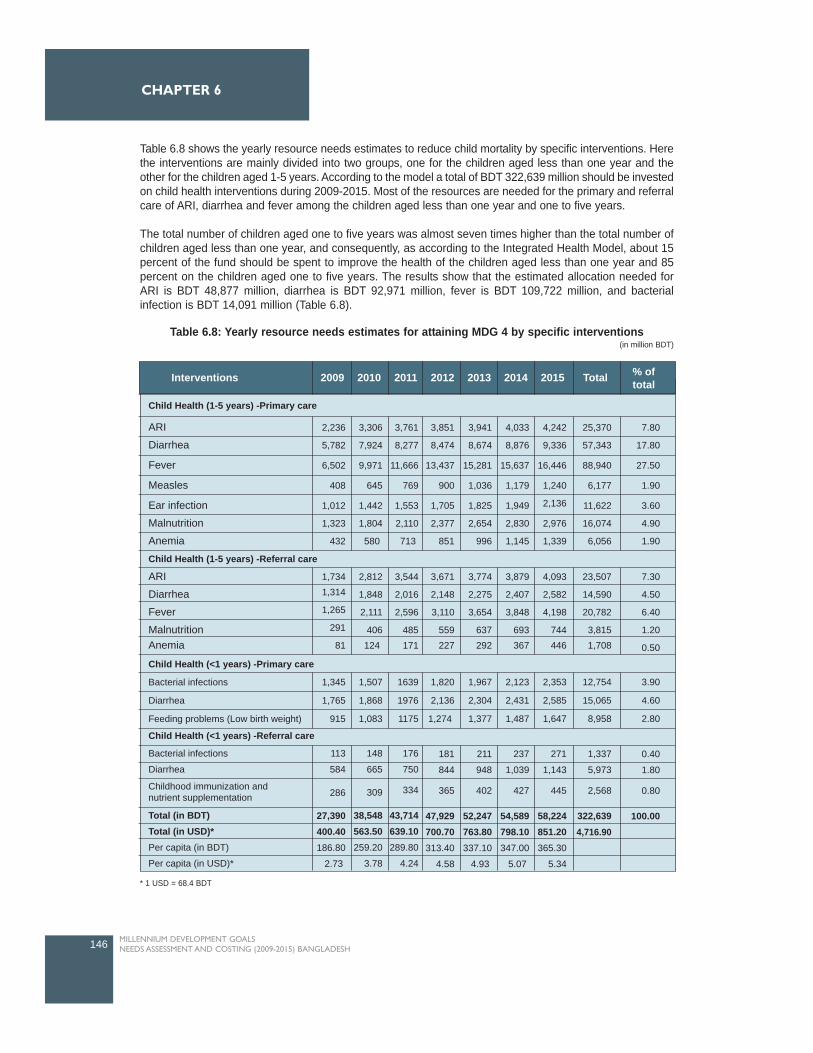
Table 6.8 shows the yearly resource needs estimates to reduce child mortality by specific interventions. Herethe interventions are mainly divided into two groups, one for the children aged less than one year and theother for the children aged 1-5 years. According to the model a total of BDT 322,639 million should be investedon child health interventions during 2009-2015. Most of the resources are needed for the primary and referralcare of ARI, diarrhea and fever among the children aged less than one year and one to five years.
The total number of children aged one to five years was almost seven times higher than the total number ofchildren aged less than one year, and consequently, as according to the Integrated Health Model, about 15percent of the fund should be spent to improve the health of the children aged less than one year and 85percent on the children aged one to five years. The results show that the estimated allocation needed forARI is BDT 48,877 million, diarrhea is BDT 92,971 million, fever is BDT 109,722 million, and bacterialinfection is BDT 14,091 million (Table 6.8).
146 MILLENNIUM DEVELOPMENT GOALS NEEDS ASSESSMENT AND COSTING (2009-2015) BANGLADESH
CHAPTER 6
Table 6.8: Yearly resource needs estimates for attaining MDG 4 by specific interventions (in million BDT)
Interventions 2009 2010 2011 2012 2013 2014 2015 Total % oftotal
Child Health (1-5 years) -Primary care
Child Health (1-5 years) -Referral care
Child Health (<1 years) -Referral care
Child Health (<1 years) -Primary care
Bacterial infections
Diarrhea
Feeding problems (Low birth weight)
1,345
1,765
915
1,507
1,868
1,083
1639
1976
1175
1,820
2,136
1,274
1,967
2,304
1,377
2,123
2,431
1,487
2,353
2,585
1,647
12,754
15,065
8,958
3.90
4.60
2.80
Bacterial infections
Diarrhea
113
584
148
665
309
38,548563.50259.20
3.78
176
750
334
43,714639.10289.80
4.24
181
844
365
47,929700.70313.40
4.58
211
948
402
52,247763.80337.10
4.93
237
1,039
427
54,589798.10347.00
5.07
271
1,143
445
58,224851.20365.30
5.34
1,337
5,973
2,568
322,6394,716.90
0.40
1.80
0.80
100.00
286
27,390400.40186.80
2.73
ARI
Diarrhea
Fever
Measles
Ear infection
Malnutrition
Anemia
2,236
5,782
6,502
408
1,012
1,323
432
3,306
7,924
9,971
645
1,442
1,804
580
3,761
8,277
11,666
769
1,553
2,110
713
3,851
8,474
13,437
900
1,705
2,377
851
3,941
8,674
15,281
1,036
1,825
2,654
996
4,033
8,876
15,637
1,179
1,949
2,830
1,145
4,242
9,336
16,446
1,240
2,136
2,976
1,339
25,370
57,343
88,940
6,177
11,622
16,074
6,056
7.80
17.80
27.50
1.90
3.60
4.90
1.90
1,7341,314
1,265
291
81
2,812
1,848
2,111
406124
3,544
2,016
2,596
485171
3,671
2,148
3,110
559227
3,774
2,275
3,654
637292
3,879
2,407
3,848
693367
4,093
2,582
4,198
744446
23,507
14,590
20,782
3,8151,708
7.30
4.50
6.40
1.20
0.50
ARI
Diarrhea
Fever
MalnutritionAnemia
Childhood immunization andnutrient supplementation
Total (in BDT)Total (in USD)*Per capita (in BDT)
Per capita (in USD)*
* 1 USD = 68.4 BDT
The required per capita expenditure on drugs and other supply related interventions for improving childhealth is USD 2.73 in 2009. The per capita resource invested on child health need to be increased graduallyto USD 5.34 in 2015 as both the coverage population and the target utilization rate will increase, during2009-2015, to attain the MDG4 targets and indicators (Table 6.8).
The estimated resource needs are much higher than current spending on child health. The estimatedallocation for 2008-2011 under HNPSP is BDT 9,574 million. According to the Second Revised ProgramImplementation Plan 2003-2011, the estimated allocation for 2008-2011 is BDT 216 million for IMCI; BDT335 million for CDD; and BDT 5,845 million for routine EPI. However, these figures represent only publicexpenditure on health and exclude the huge household healthcare expenditure, which is about 65 percentof the total health expenditure in Bangladesh.
147MILLENNIUM DEVELOPMENT GOALS NEEDS ASSESSMENT AND COSTING (2009-2015) BANGLADESH
HEALTH
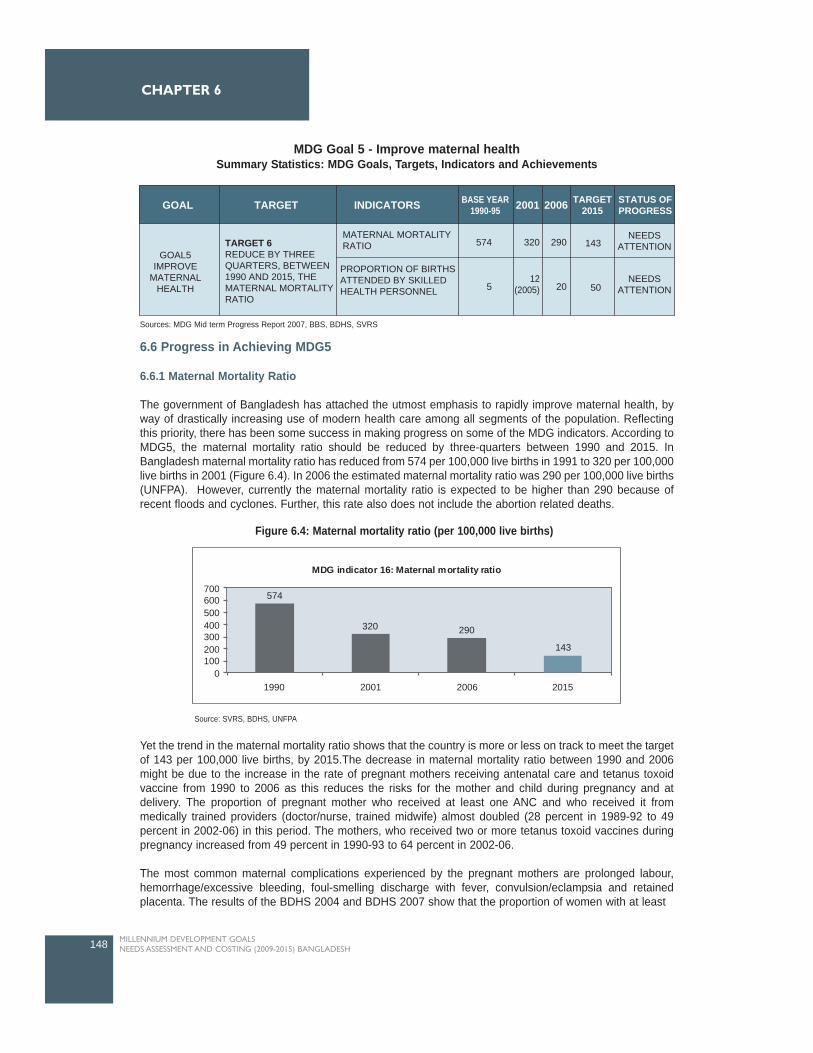
6.6 Progress in Achieving MDG5
6.6.1 Maternal Mortality Ratio
The government of Bangladesh has attached the utmost emphasis to rapidly improve maternal health, byway of drastically increasing use of modern health care among all segments of the population. Reflectingthis priority, there has been some success in making progress on some of the MDG indicators. According toMDG5, the maternal mortality ratio should be reduced by three-quarters between 1990 and 2015. InBangladesh maternal mortality ratio has reduced from 574 per 100,000 live births in 1991 to 320 per 100,000live births in 2001 (Figure 6.4). In 2006 the estimated maternal mortality ratio was 290 per 100,000 live births(UNFPA). However, currently the maternal mortality ratio is expected to be higher than 290 because ofrecent floods and cyclones. Further, this rate also does not include the abortion related deaths.
Yet the trend in the maternal mortality ratio shows that the country is more or less on track to meet the targetof 143 per 100,000 live births, by 2015.The decrease in maternal mortality ratio between 1990 and 2006might be due to the increase in the rate of pregnant mothers receiving antenatal care and tetanus toxoidvaccine from 1990 to 2006 as this reduces the risks for the mother and child during pregnancy and atdelivery. The proportion of pregnant mother who received at least one ANC and who received it frommedically trained providers (doctor/nurse, trained midwife) almost doubled (28 percent in 1989-92 to 49percent in 2002-06) in this period. The mothers, who received two or more tetanus toxoid vaccines duringpregnancy increased from 49 percent in 1990-93 to 64 percent in 2002-06.
The most common maternal complications experienced by the pregnant mothers are prolonged labour,hemorrhage/excessive bleeding, foul-smelling discharge with fever, convulsion/eclampsia and retainedplacenta. The results of the BDHS 2004 and BDHS 2007 show that the proportion of women with at least
148 MILLENNIUM DEVELOPMENT GOALS NEEDS ASSESSMENT AND COSTING (2009-2015) BANGLADESH
CHAPTER 6
TARGET INDICATORSGOAL BASE YEAR1990-95 2001 2006 TARGET
2015STATUS OFPROGRESS
GOAL5IMPROVE
MATERNALHEALTH
TARGET 6REDUCE BY THREEQUARTERS, BETWEEN1990 AND 2015, THEMATERNAL MORTALITYRATIO
MATERNAL MORTALITYRATIO
PROPORTION OF BIRTHSATTENDED BY SKILLEDHEALTH PERSONNEL
574
5
320 290
20
143
5012
(2005)
NEEDSATTENTION
NEEDSATTENTION
MDG Goal 5 - Improve maternal healthSummary Statistics: MDG Goals, Targets, Indicators and Achievements
Sources: MDG Mid term Progress Report 2007, BBS, BDHS, SVRS
Figure 6.4: Maternal mortality ratio (per 100,000 live births)
MDG indicator 16: Maternal mortality ratio
574
320 290
143
0100200300400500600700
1990 2001 2006 2015
Source: SVRS, BDHS, UNFPA
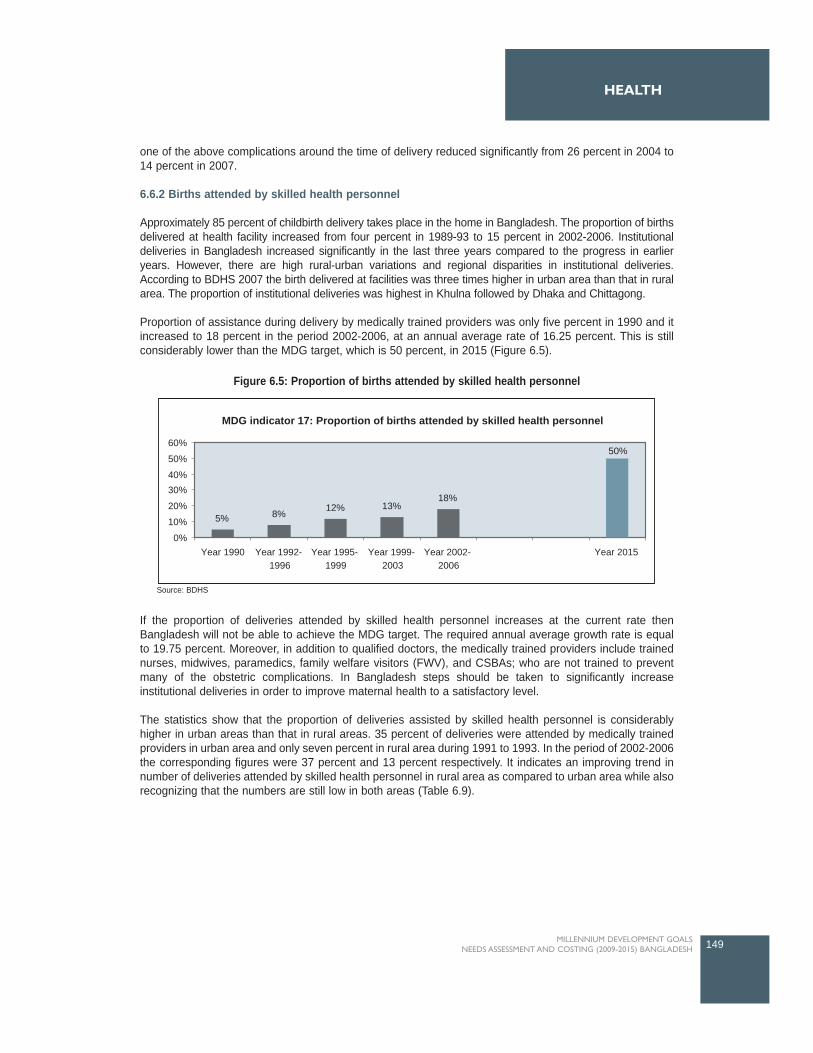
one of the above complications around the time of delivery reduced significantly from 26 percent in 2004 to14 percent in 2007.
6.6.2 Births attended by skilled health personnel
Approximately 85 percent of childbirth delivery takes place in the home in Bangladesh. The proportion of birthsdelivered at health facility increased from four percent in 1989-93 to 15 percent in 2002-2006. Institutionaldeliveries in Bangladesh increased significantly in the last three years compared to the progress in earlieryears. However, there are high rural-urban variations and regional disparities in institutional deliveries.According to BDHS 2007 the birth delivered at facilities was three times higher in urban area than that in ruralarea. The proportion of institutional deliveries was highest in Khulna followed by Dhaka and Chittagong.
Proportion of assistance during delivery by medically trained providers was only five percent in 1990 and itincreased to 18 percent in the period 2002-2006, at an annual average rate of 16.25 percent. This is stillconsiderably lower than the MDG target, which is 50 percent, in 2015 (Figure 6.5).
If the proportion of deliveries attended by skilled health personnel increases at the current rate thenBangladesh will not be able to achieve the MDG target. The required annual average growth rate is equalto 19.75 percent. Moreover, in addition to qualified doctors, the medically trained providers include trainednurses, midwives, paramedics, family welfare visitors (FWV), and CSBAs; who are not trained to preventmany of the obstetric complications. In Bangladesh steps should be taken to significantly increaseinstitutional deliveries in order to improve maternal health to a satisfactory level.
The statistics show that the proportion of deliveries assisted by skilled health personnel is considerablyhigher in urban areas than that in rural areas. 35 percent of deliveries were attended by medically trainedproviders in urban area and only seven percent in rural area during 1991 to 1993. In the period of 2002-2006the corresponding figures were 37 percent and 13 percent respectively. It indicates an improving trend innumber of deliveries attended by skilled health personnel in rural area as compared to urban area while alsorecognizing that the numbers are still low in both areas (Table 6.9).
149MILLENNIUM DEVELOPMENT GOALS NEEDS ASSESSMENT AND COSTING (2009-2015) BANGLADESH
HEALTH
Figure 6.5: Proportion of births attended by skilled health personnel
5% 8% 12% 13%18%
50%
0%
10%
20%
30%40%
50%
60%
Year 1990 Year 1992-1996
Year 1995-1999
Year 1999-2003
Year 2002-2006
Year 2015
MDG indicator 17: Proportion of births attended by skilled health personnel
Source: BDHS
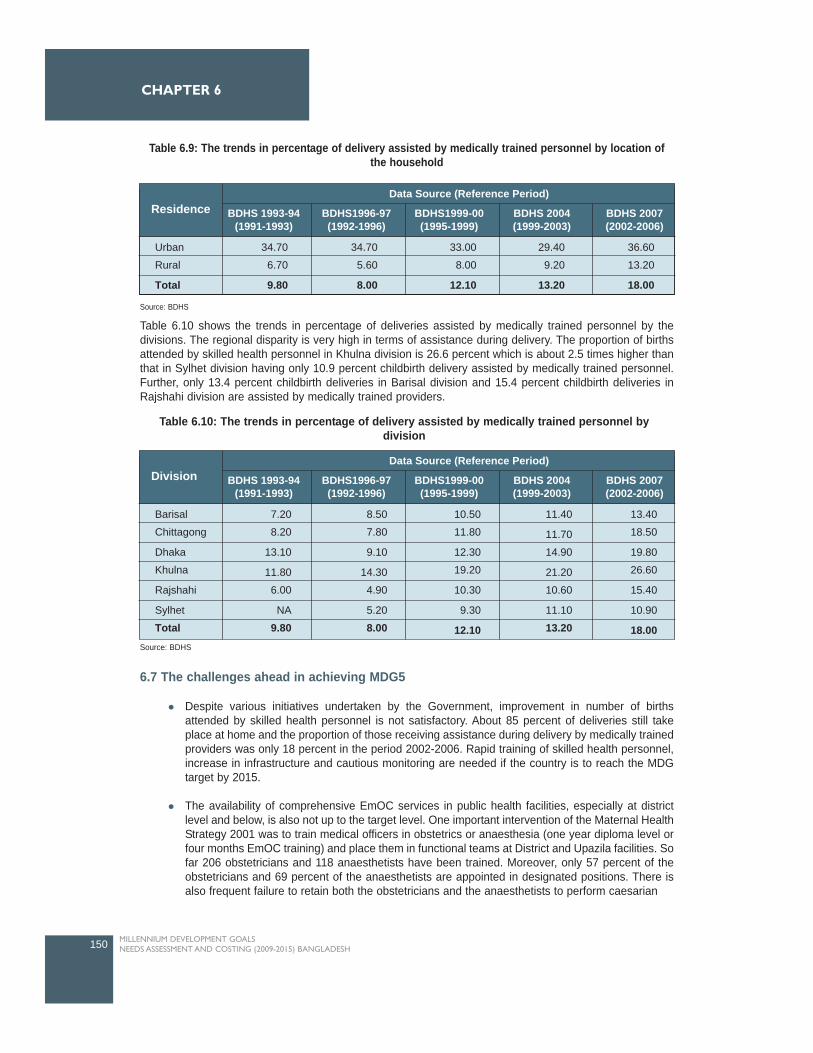
Table 6.10 shows the trends in percentage of deliveries assisted by medically trained personnel by thedivisions. The regional disparity is very high in terms of assistance during delivery. The proportion of birthsattended by skilled health personnel in Khulna division is 26.6 percent which is about 2.5 times higher thanthat in Sylhet division having only 10.9 percent childbirth delivery assisted by medically trained personnel.Further, only 13.4 percent childbirth deliveries in Barisal division and 15.4 percent childbirth deliveries inRajshahi division are assisted by medically trained providers.
6.7 The challenges ahead in achieving MDG5
Despite various initiatives undertaken by the Government, improvement in number of birthsattended by skilled health personnel is not satisfactory. About 85 percent of deliveries still takeplace at home and the proportion of those receiving assistance during delivery by medically trainedproviders was only 18 percent in the period 2002-2006. Rapid training of skilled health personnel,increase in infrastructure and cautious monitoring are needed if the country is to reach the MDGtarget by 2015.
The availability of comprehensive EmOC services in public health facilities, especially at districtlevel and below, is also not up to the target level. One important intervention of the Maternal HealthStrategy 2001 was to train medical officers in obstetrics or anaesthesia (one year diploma level orfour months EmOC training) and place them in functional teams at District and Upazila facilities. Sofar 206 obstetricians and 118 anaesthetists have been trained. Moreover, only 57 percent of theobstetricians and 69 percent of the anaesthetists are appointed in designated positions. There isalso frequent failure to retain both the obstetricians and the anaesthetists to perform caesarian
150 MILLENNIUM DEVELOPMENT GOALS NEEDS ASSESSMENT AND COSTING (2009-2015) BANGLADESH
CHAPTER 6
Table 6.9: The trends in percentage of delivery assisted by medically trained personnel by location ofthe household
Residence BDHS 1993-94(1991-1993)
BDHS1996-97(1992-1996)
BDHS1999-00(1995-1999)
BDHS 2004(1999-2003)
BDHS 2007(2002-2006)
Data Source (Reference Period)
Urban
Rural
Total
34.70
6.70
9.80
34.70
5.60
8.00
33.00
8.00
12.10
29.40
9.20
13.20
36.60
13.20
18.00
Source: BDHS
Division BDHS 1993-94(1991-1993)
BDHS1996-97(1992-1996)
BDHS1999-00(1995-1999)
BDHS 2004(1999-2003)
BDHS 2007(2002-2006)
Data Source (Reference Period)
Barisal
Chittagong
Dhaka
Khulna
Rajshahi
Sylhet
Total
7.20
8.20
13.10
11.80
6.00
NA
9.80
8.50
7.80
9.10
14.30
4.90
5.20
8.00
10.50
11.80
12.30
19.20
10.30
9.30
12.10
11.40
11.70
14.90
21.20
10.60
11.10
13.20
13.40
18.50
19.80
26.60
15.40
10.90
18.00
Table 6.10: The trends in percentage of delivery assisted by medically trained personnel bydivision
Source: BDHS
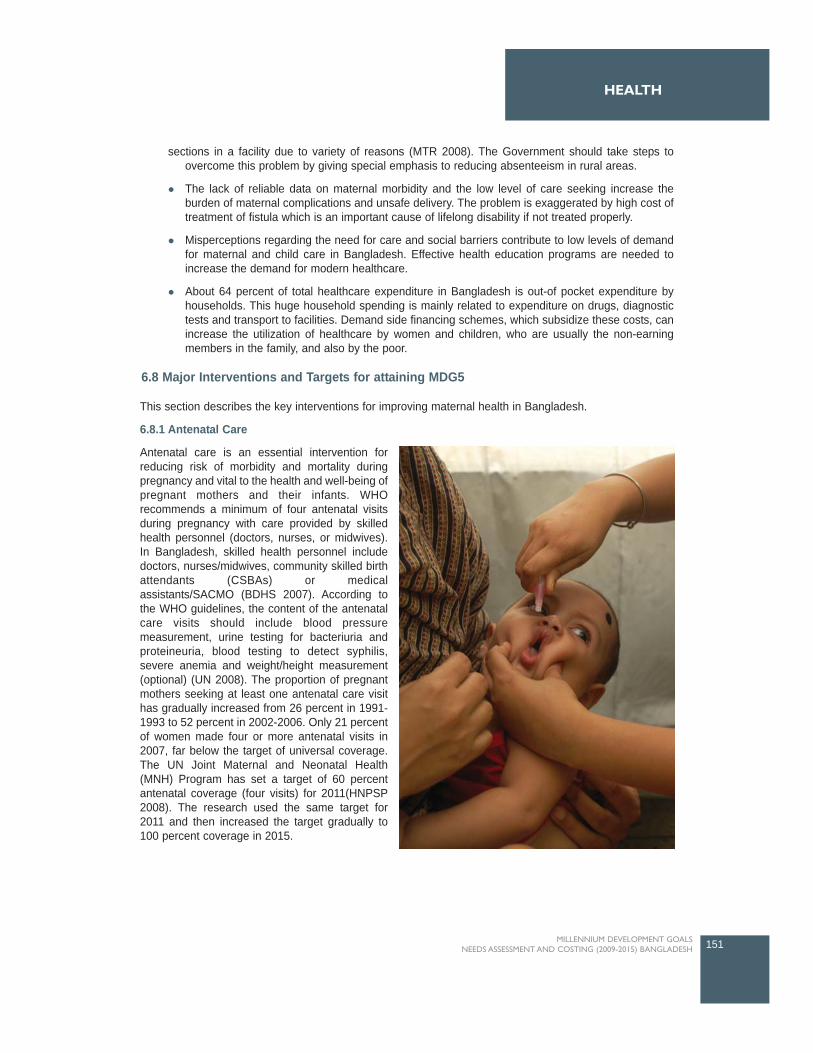
sections in a facility due to variety of reasons (MTR 2008). The Government should take steps toovercome this problem by giving special emphasis to reducing absenteeism in rural areas.
The lack of reliable data on maternal morbidity and the low level of care seeking increase theburden of maternal complications and unsafe delivery. The problem is exaggerated by high cost oftreatment of fistula which is an important cause of lifelong disability if not treated properly.
Misperceptions regarding the need for care and social barriers contribute to low levels of demandfor maternal and child care in Bangladesh. Effective health education programs are needed toincrease the demand for modern healthcare.
About 64 percent of total healthcare expenditure in Bangladesh is out-of pocket expenditure byhouseholds. This huge household spending is mainly related to expenditure on drugs, diagnostictests and transport to facilities. Demand side financing schemes, which subsidize these costs, canincrease the utilization of healthcare by women and children, who are usually the non-earningmembers in the family, and also by the poor.
6.8 Major Interventions and Targets for attaining MDG5
This section describes the key interventions for improving maternal health in Bangladesh.
6.8.1 Antenatal Care
Antenatal care is an essential intervention forreducing risk of morbidity and mortality duringpregnancy and vital to the health and well-being ofpregnant mothers and their infants. WHOrecommends a minimum of four antenatal visitsduring pregnancy with care provided by skilledhealth personnel (doctors, nurses, or midwives).In Bangladesh, skilled health personnel includedoctors, nurses/midwives, community skilled birthattendants (CSBAs) or medicalassistants/SACMO (BDHS 2007). According tothe WHO guidelines, the content of the antenatalcare visits should include blood pressuremeasurement, urine testing for bacteriuria andproteineuria, blood testing to detect syphilis,severe anemia and weight/height measurement(optional) (UN 2008). The proportion of pregnantmothers seeking at least one antenatal care visithas gradually increased from 26 percent in 1991-1993 to 52 percent in 2002-2006. Only 21 percentof women made four or more antenatal visits in2007, far below the target of universal coverage.The UN Joint Maternal and Neonatal Health(MNH) Program has set a target of 60 percentantenatal coverage (four visits) for 2011(HNPSP2008). The research used the same target for2011 and then increased the target gradually to100 percent coverage in 2015.
151MILLENNIUM DEVELOPMENT GOALS NEEDS ASSESSMENT AND COSTING (2009-2015) BANGLADESH
HEALTH
6.8.2 Skilled birth attendance during delivery
Assistance by medically trained personnel during delivery is a key intervention for reducing both maternaland neonatal mortality. Only 18 percent of births in the country were attended by skilled health personnelduring 2002-2006. This very low level of trained provider assisted delivery is one of major obstacles inattaining MDG5 and coverage should increase substantially for safe home delivery and appropriate referralcare. The target set in the second PRS is to increase coverage of skilled birth attendants during delivery to35 percent in 2011. The MDG target is to increase the coverage to 50 percent by 2015 and the study/TWGused the same targets to estimate resource requirements of this essential intervention.
6.8.3 Basic and Comprehensive emergency obstetric care (EmOC)
Availability of basic and comprehensive emergency obstetric care at the facility level is also very importantfor achieving MDG5. According to the guideline jointly developed by WHO, UNICEF and UNFPA, thereshould be four facilities offering basic10 and one facility offering comprehensive emergency obstetric care11
for every 500,000 people (UNFPA 2008). Currently, CEmoc is provided at district and upper level facilitieswith very limited access in Upazila level. The government should strengthen the existing facilities to provideEmOC and increase coverage in public and not-for-profit private health facilities, specially in all UHCs, inorder to achieve MDG 4 and 5.
6.8.4 Treatment of other maternal complications
The results of the national maternal mortality survey show that maternal complications like haemorrhage andeclampsia are the major causes of maternal deaths in Bangladesh (NIPORT 2003). Proper and timelytreatment of these maternal complications can significantly reduce maternal mortality ratio in Bangladesh.During 2002-2006, only 43 percent of the women, who suffered from haemorrhage around delivery time,sought care from a medically trained provider. The treatment coverage for eclampsia and prolonged laborwas 56 percent and 51 percent respectively during the same period (BDHS 2007). The target coverage ofthese treatment interventions of maternal complications was set at 100 percent in 2015.
6.8.5 Family planning
The contraceptive prevalence rate for currently married women in Bangladesh was about 56 percent in theperiod of 2002-2006. The most common methods of family planing were oral pills (28.5 percent), injectables(7 percent), female sterilization (5 percent) and male condom (4.5 percent) (BDHS 2007). The HNPSP aimsto reduce total fertility rate (TFR) from 3.3 to 2.2 per women and to increase CPR from 56 percent to 72percent by 2011 (HNPSP 2008). The study/TWG set the same target for 2011 and slightly increased thetarget to 80 percent in 2015.
6.8.6 Demand Side Financing (DSF)
Some major constraints for improved maternal healthcare is the cost of delivery, the fear of costs (especiallyfor a complicated delivery), and the inability to find money when needed. The Health, Nutrition andPopulation Sector Program (HNPSP) identified demand side approaches as a means to increase access ofthe poor to health services particularly maternal health services. With this aim the Ministry of Health andFamily Welfare (MOHFW) has embarked on piloting a DSF scheme initially in 21 Upazilas and recently thepilot has been expanded to 12 more upazilas. Under this scheme, eligible pregnant women (means tested)are entitled to receive 3 ANC (BDT 150), safe delivery (BDT 750) including c-section (BDT 6000) andcomplication management (BDT 2000) and 1 PNC (BDT 50). In addition cash benefits are provided includingBDT 500 for transport, BDT 500 for nutritious food and other items and BDT 500 for referral. Designatedproviders get reimbursed upon providing the designated services to the voucher holders (MIS 2008 andDGHS).
152 MILLENNIUM DEVELOPMENT GOALS NEEDS ASSESSMENT AND COSTING (2009-2015) BANGLADESH
CHAPTER 6
10 Basic emergency obstetric care (BEmOC) includes administration of antibiotics, oxytocics, and anticonvulsants, manual removal of placenta, removalof retained products following abortion, and assisted vaginal delivery (UNFP 2008). 11 Comprehensive emergency care (CEmOC) includes caesarean section and safe blood transfusion in addition to all BEmOC.
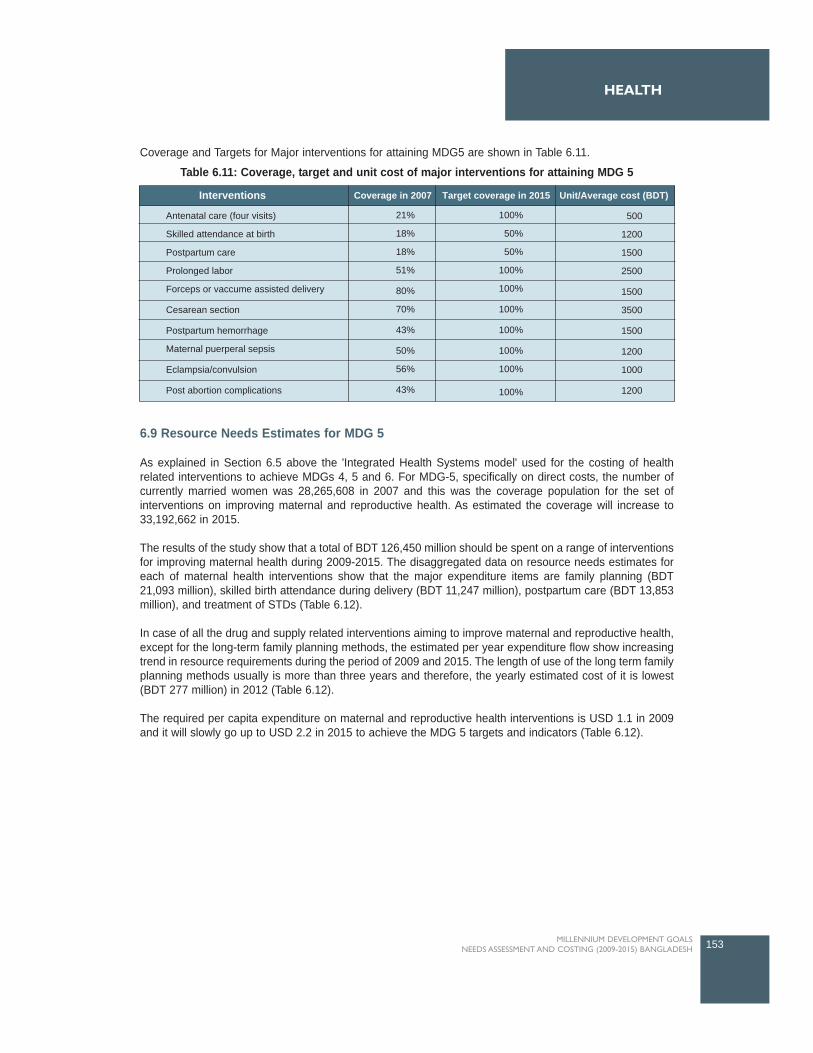
Coverage and Targets for Major interventions for attaining MDG5 are shown in Table 6.11.
6.9 Resource Needs Estimates for MDG 5
As explained in Section 6.5 above the 'Integrated Health Systems model' used for the costing of healthrelated interventions to achieve MDGs 4, 5 and 6. For MDG-5, specifically on direct costs, the number ofcurrently married women was 28,265,608 in 2007 and this was the coverage population for the set ofinterventions on improving maternal and reproductive health. As estimated the coverage will increase to33,192,662 in 2015.
The results of the study show that a total of BDT 126,450 million should be spent on a range of interventionsfor improving maternal health during 2009-2015. The disaggregated data on resource needs estimates foreach of maternal health interventions show that the major expenditure items are family planning (BDT21,093 million), skilled birth attendance during delivery (BDT 11,247 million), postpartum care (BDT 13,853million), and treatment of STDs (Table 6.12).
In case of all the drug and supply related interventions aiming to improve maternal and reproductive health,except for the long-term family planning methods, the estimated per year expenditure flow show increasingtrend in resource requirements during the period of 2009 and 2015. The length of use of the long term familyplanning methods usually is more than three years and therefore, the yearly estimated cost of it is lowest(BDT 277 million) in 2012 (Table 6.12).
The required per capita expenditure on maternal and reproductive health interventions is USD 1.1 in 2009and it will slowly go up to USD 2.2 in 2015 to achieve the MDG 5 targets and indicators (Table 6.12).
153MILLENNIUM DEVELOPMENT GOALS NEEDS ASSESSMENT AND COSTING (2009-2015) BANGLADESH
HEALTH
Interventions
Antenatal care (four visits)
Skilled attendance at birth
Postpartum care
Prolonged labor
Forceps or vaccume assisted delivery
Cesarean section
Postpartum hemorrhage
Maternal puerperal sepsis
Eclampsia/convulsion
Post abortion complications
Coverage in 2007 Target coverage in 2015 Unit/Average cost (BDT)
21%
18%
18%
51%
80%
70%
43%
50%
56%
43%
100%
50%
50%
100%
100%
100%
100%
100%
100%
100%
500
1200
1500
2500
1500
3500
1500
1200
1000
1200
Table 6.11: Coverage, target and unit cost of major interventions for attaining MDG 5

The estimated resource need for drug and supply related interventions for achieving the MDG 5 is also muchhigher than the current allocation of resources for the same sub-sector. The estimated allocation for 2008-2011 under HNPSP is BDT 3096 million for reproductive health under ESP, BDT 4,020 million for clinicalcontraception service delivery, BDT 7,845 million for family planning health service delivery, and BDT 4994million for maternal, child and reproductive health services under DGFP (HNPSP 2008). However, thesefigures only include the public health expenditures and exclude the significant household out-of-pocketspending.
154 MILLENNIUM DEVELOPMENT GOALS NEEDS ASSESSMENT AND COSTING (2009-2015) BANGLADESH
CHAPTER 6
Interventions 2009 2010 2011 2012 2013 2014 2015 Total % oftotal
Family planning - short term methods
Family planning - long term methods
Antenatal care (exl. IPT)
Antenatal care - IPT for malaria
Skilled attendance at birth
Postpartum care
Prolonged labor
Forceps or vaccume assisted delivery
Cesarean section
Postpartum hemorrhage
Maternal puerperal sepsis
Eclampsia/convulsion
Post abortion complications
Obstetric fistula
Urinary track infection
Mastitis
Gonoria
Syphilis
Trichomonas
Pelvic Inflammatory disease
Total (in million BDT)Total (in million USD)*Per capita (in million BDT)
Per capita (in million USD)*
1,848
301
631
152
964
1,181
339
113
286
122
139
42
83
597
425
91
679
1,494
688
1,012
11,191163.61
76.30
1.10
2,103
328
816
192
1,097
1,417
357
122
317
130
142
43
86
704
510
117843
1,855
854
1,255
13,291194.3189.40
1.30
2,386
357
1,013
251
1,338
1,673
410
132
351
152
160
47
100
743
597
144
1,0152,233
1,028
1,510
15,643228.70103.70
1.50
2,655
277
1,222314
1,592
1,945
466
142
387
177
179
53
118
719
695
174
1,205
2,651
1,221
1,795
17,992263.04117.67
1.70
2,970
345
1,445
383
1,896
2,241
527
153
425
208
200
59
135
681
796
205
1,404
3,088
1,423
2,095
20,681302.35133.42
1.90
3,208
372
1,681
457
2,089
2,558
586
163
444
243
222
66
152
575
818
237
1,610
3,543
1,632
2,409
23,068337.25146.64
2.10
3,426
517
1,987
536
2,271
2,838
624
170
463
267
245
76
172
476
834
268
1,647
3,624
1,669
2,471
24,584359.42154.22
2.20
18,596
2,497
8,795
2,285
11,247
13,853
3,309
995
2,673
1,299
1,287
386
846
4,495
4,675
1,236
8,403
18,488
8,515
12,547
126,4501,848.68
14.70
1.90
6.90
1.80
8.90
10.90
2.60
0.80
2.10
1.00
1.00
0.30
0.70
3.50
3.70
0.90
6.60
14.60
6.70
9.90
100.00
Table 6.12: Yearly resource needs estimates for attaining MDG 5 by specific interventions (in million BDT)
* 1 USD = 68.4 BDT
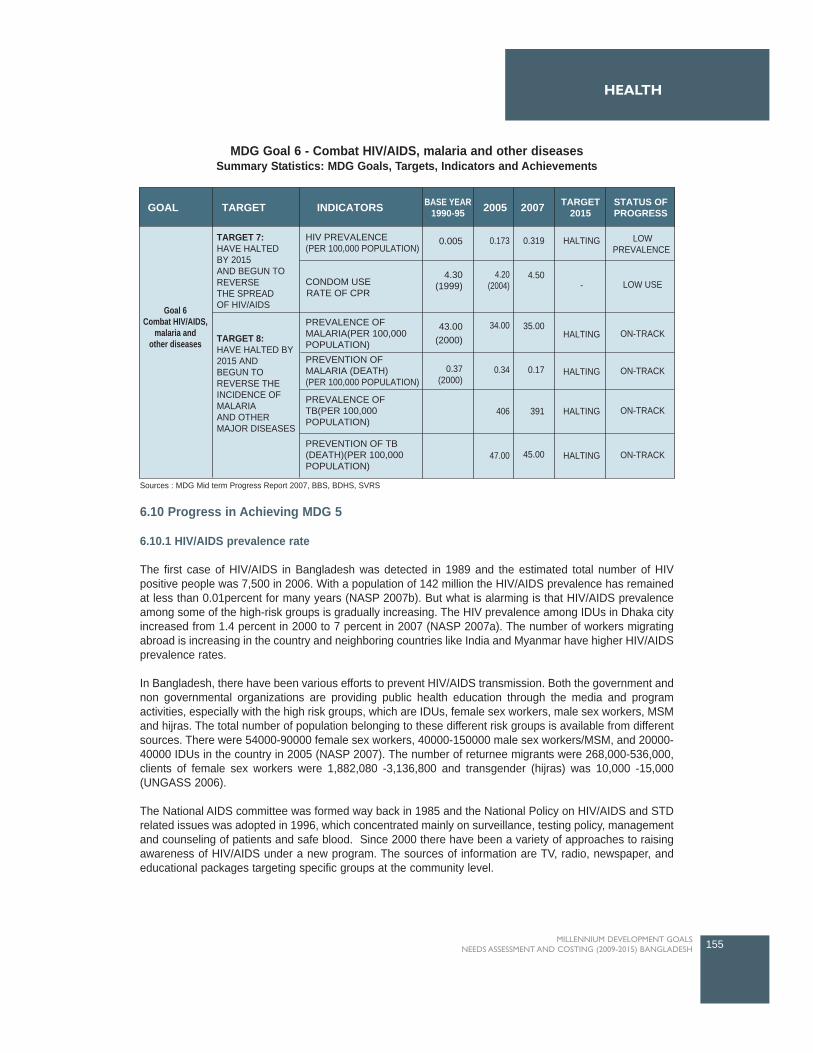
6.10 Progress in Achieving MDG 5
6.10.1 HIV/AIDS prevalence rate
The first case of HIV/AIDS in Bangladesh was detected in 1989 and the estimated total number of HIVpositive people was 7,500 in 2006. With a population of 142 million the HIV/AIDS prevalence has remainedat less than 0.01percent for many years (NASP 2007b). But what is alarming is that HIV/AIDS prevalenceamong some of the high-risk groups is gradually increasing. The HIV prevalence among IDUs in Dhaka cityincreased from 1.4 percent in 2000 to 7 percent in 2007 (NASP 2007a). The number of workers migratingabroad is increasing in the country and neighboring countries like India and Myanmar have higher HIV/AIDSprevalence rates.
In Bangladesh, there have been various efforts to prevent HIV/AIDS transmission. Both the government andnon governmental organizations are providing public health education through the media and programactivities, especially with the high risk groups, which are IDUs, female sex workers, male sex workers, MSMand hijras. The total number of population belonging to these different risk groups is available from differentsources. There were 54000-90000 female sex workers, 40000-150000 male sex workers/MSM, and 20000-40000 IDUs in the country in 2005 (NASP 2007). The number of returnee migrants were 268,000-536,000,clients of female sex workers were 1,882,080 -3,136,800 and transgender (hijras) was 10,000 -15,000(UNGASS 2006).
The National AIDS committee was formed way back in 1985 and the National Policy on HIV/AIDS and STDrelated issues was adopted in 1996, which concentrated mainly on surveillance, testing policy, managementand counseling of patients and safe blood. Since 2000 there have been a variety of approaches to raisingawareness of HIV/AIDS under a new program. The sources of information are TV, radio, newspaper, andeducational packages targeting specific groups at the community level.
155MILLENNIUM DEVELOPMENT GOALS NEEDS ASSESSMENT AND COSTING (2009-2015) BANGLADESH
HEALTH
TARGET INDICATORSGOAL BASE YEAR1990-95 2005 2007 TARGET
2015STATUS OFPROGRESS
Goal 6Combat HIV/AIDS,
malaria andother diseases
TARGET 7:HAVE HALTEDBY 2015AND BEGUN TOREVERSE THE SPREADOF HIV/AIDS
TARGET 8:HAVE HALTED BY2015 ANDBEGUN TOREVERSE THEINCIDENCE OFMALARIAAND OTHERMAJOR DISEASES
HIV PREVALENCE(PER 100,000 POPULATION)
CONDOM USERATE OF CPR
PREVALENCE OFMALARIA(PER 100,000POPULATION)PREVENTION OFMALARIA (DEATH)(PER 100,000 POPULATION)
PREVALENCE OFTB(PER 100,000POPULATION)
PREVENTION OF TB(DEATH)(PER 100,000POPULATION)
0.005
4.30(1999)
0.173
4.20(2004)
34.00
0.34
406
47.00
0.319
4.50
35.00
0.17
391
45.00
HALTING
-
HALTING
HALTING
HALTING
HALTING
LOWPREVALENCE
LOW USE
ON-TRACK
ON-TRACK
ON-TRACK
ON-TRACK
43.00(2000)
0.37(2000)
MDG Goal 6 - Combat HIV/AIDS, malaria and other diseasesSummary Statistics: MDG Goals, Targets, Indicators and Achievements
Sources : MDG Mid term Progress Report 2007, BBS, BDHS, SVRS
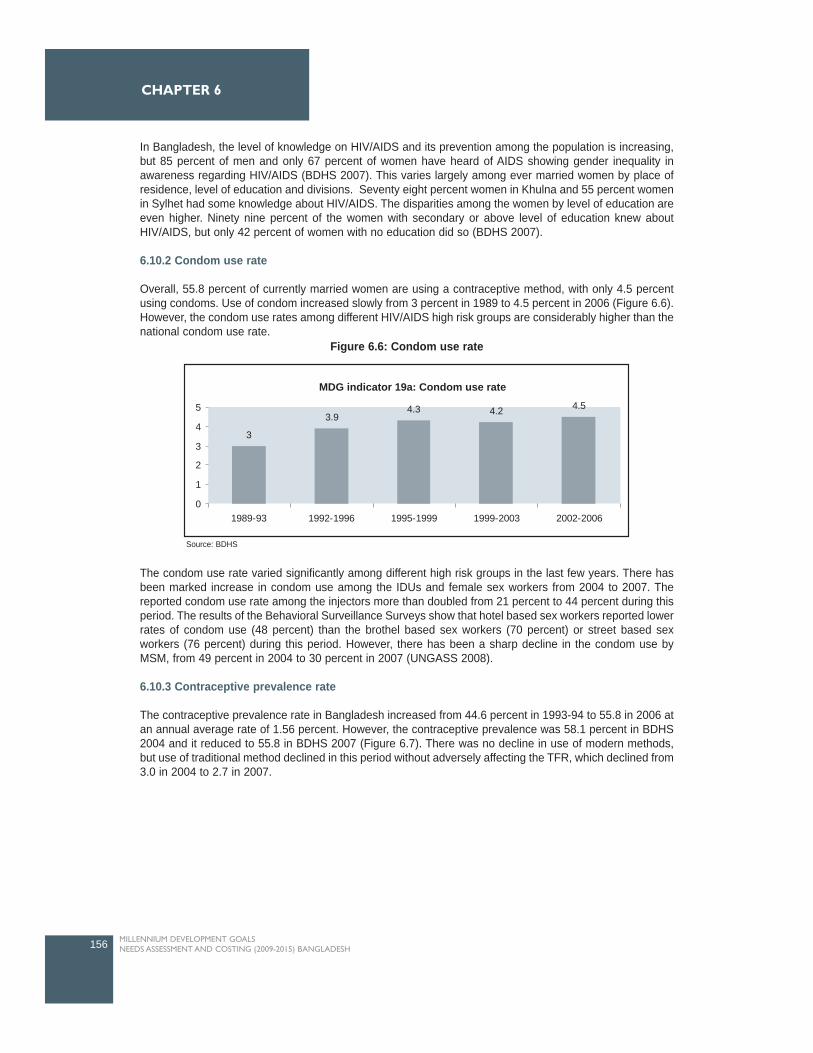
In Bangladesh, the level of knowledge on HIV/AIDS and its prevention among the population is increasing,but 85 percent of men and only 67 percent of women have heard of AIDS showing gender inequality inawareness regarding HIV/AIDS (BDHS 2007). This varies largely among ever married women by place ofresidence, level of education and divisions. Seventy eight percent women in Khulna and 55 percent womenin Sylhet had some knowledge about HIV/AIDS. The disparities among the women by level of education areeven higher. Ninety nine percent of the women with secondary or above level of education knew aboutHIV/AIDS, but only 42 percent of women with no education did so (BDHS 2007).
6.10.2 Condom use rate
Overall, 55.8 percent of currently married women are using a contraceptive method, with only 4.5 percentusing condoms. Use of condom increased slowly from 3 percent in 1989 to 4.5 percent in 2006 (Figure 6.6).However, the condom use rates among different HIV/AIDS high risk groups are considerably higher than thenational condom use rate.
The condom use rate varied significantly among different high risk groups in the last few years. There hasbeen marked increase in condom use among the IDUs and female sex workers from 2004 to 2007. Thereported condom use rate among the injectors more than doubled from 21 percent to 44 percent during thisperiod. The results of the Behavioral Surveillance Surveys show that hotel based sex workers reported lowerrates of condom use (48 percent) than the brothel based sex workers (70 percent) or street based sexworkers (76 percent) during this period. However, there has been a sharp decline in the condom use byMSM, from 49 percent in 2004 to 30 percent in 2007 (UNGASS 2008).
6.10.3 Contraceptive prevalence rate
The contraceptive prevalence rate in Bangladesh increased from 44.6 percent in 1993-94 to 55.8 in 2006 atan annual average rate of 1.56 percent. However, the contraceptive prevalence was 58.1 percent in BDHS2004 and it reduced to 55.8 in BDHS 2007 (Figure 6.7). There was no decline in use of modern methods,but use of traditional method declined in this period without adversely affecting the TFR, which declined from3.0 in 2004 to 2.7 in 2007.
156 MILLENNIUM DEVELOPMENT GOALS NEEDS ASSESSMENT AND COSTING (2009-2015) BANGLADESH
CHAPTER 6
MDG indicator 19a: Condom use rate
3
3.94.3 4.2 4.5
0
1
2
3
4
5
1989-93 1992-1996 1995-1999 1999-2003 2002-2006
Figure 6.6: Condom use rate
Source: BDHS
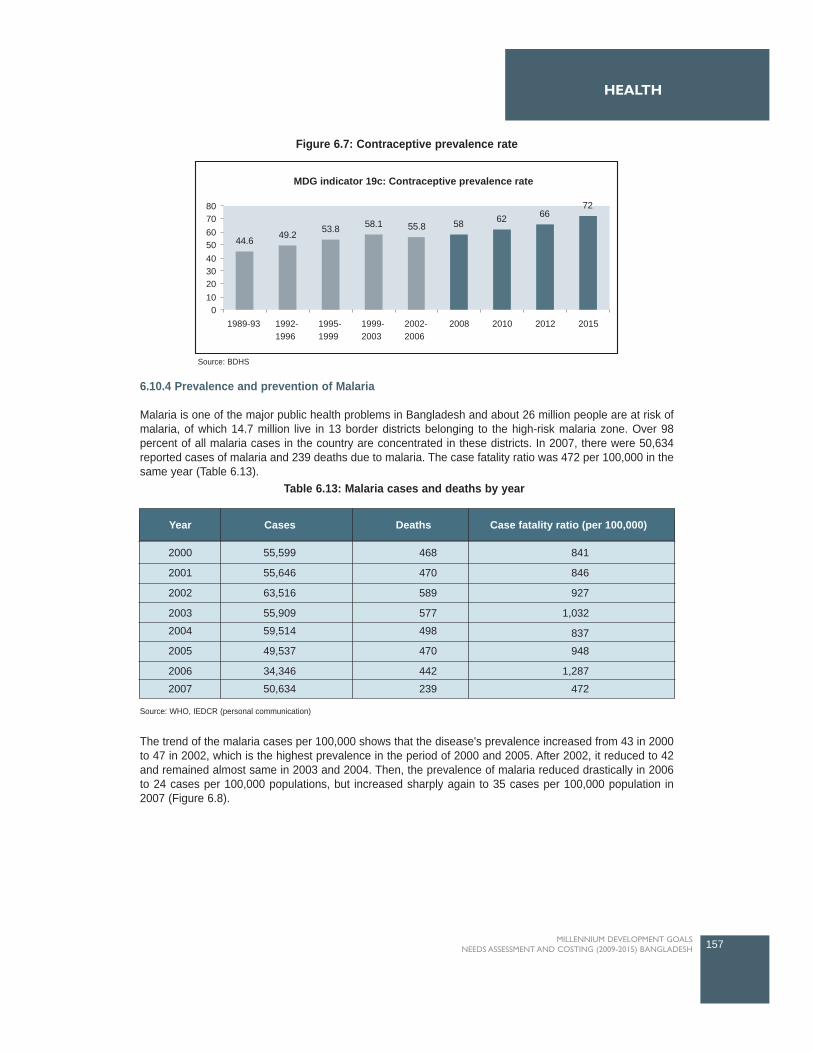
6.10.4 Prevalence and prevention of Malaria
Malaria is one of the major public health problems in Bangladesh and about 26 million people are at risk ofmalaria, of which 14.7 million live in 13 border districts belonging to the high-risk malaria zone. Over 98percent of all malaria cases in the country are concentrated in these districts. In 2007, there were 50,634reported cases of malaria and 239 deaths due to malaria. The case fatality ratio was 472 per 100,000 in thesame year (Table 6.13).
The trend of the malaria cases per 100,000 shows that the disease's prevalence increased from 43 in 2000to 47 in 2002, which is the highest prevalence in the period of 2000 and 2005. After 2002, it reduced to 42and remained almost same in 2003 and 2004. Then, the prevalence of malaria reduced drastically in 2006to 24 cases per 100,000 populations, but increased sharply again to 35 cases per 100,000 population in2007 (Figure 6.8).
157MILLENNIUM DEVELOPMENT GOALS NEEDS ASSESSMENT AND COSTING (2009-2015) BANGLADESH
HEALTH
MDG indicator 19c: Contraceptive prevalence rate
44.6 49.2 53.8 58.1 55.8 58 62 6672
01020304050607080
1989-93 1992-1996
1995-1999
1999-2003
2002-2006
2008 2010 2012 2015
Year Cases Deaths Case fatality ratio (per 100,000)
2000
2001
2002
2003
2004
2005
2006
2007
55,599
55,646
63,516
55,909
59,514
49,537
34,346
50,634
468
470
589
577
498
470
442
239
841
846
927
1,032
837
948
1,287
472
Figure 6.7: Contraceptive prevalence rate
Source: WHO, IEDCR (personal communication)
Table 6.13: Malaria cases and deaths by year
Source: BDHS
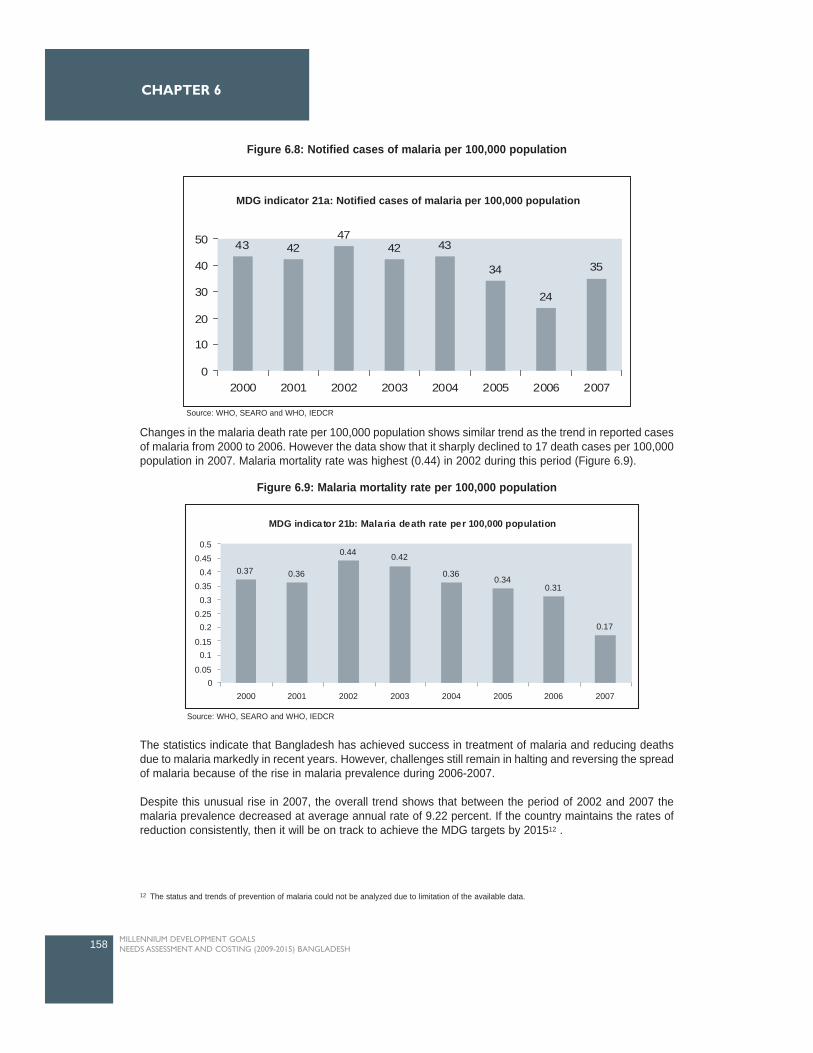
Changes in the malaria death rate per 100,000 population shows similar trend as the trend in reported casesof malaria from 2000 to 2006. However the data show that it sharply declined to 17 death cases per 100,000population in 2007. Malaria mortality rate was highest (0.44) in 2002 during this period (Figure 6.9).
The statistics indicate that Bangladesh has achieved success in treatment of malaria and reducing deathsdue to malaria markedly in recent years. However, challenges still remain in halting and reversing the spreadof malaria because of the rise in malaria prevalence during 2006-2007.
Despite this unusual rise in 2007, the overall trend shows that between the period of 2002 and 2007 themalaria prevalence decreased at average annual rate of 9.22 percent. If the country maintains the rates ofreduction consistently, then it will be on track to achieve the MDG targets by 201512 .
158 MILLENNIUM DEVELOPMENT GOALS NEEDS ASSESSMENT AND COSTING (2009-2015) BANGLADESH
CHAPTER 6
43 4247
42 43
34
24
35
0
10
20
30
40
50
2000 2001 2002 2003 2004 2005 2006 2007
MDG indicator 21a: Notified cases of malaria per 100,000 population
Figure 6.8: Notified cases of malaria per 100,000 population
Source: WHO, SEARO and WHO, IEDCR
Figure 6.9: Malaria mortality rate per 100,000 population
MDG indicator 21b: Malaria death rate per 100,000 population
0.37 0.36
0.44 0.42
0.360.34
0.31
0.17
00.05
0.10.15
0.20.25
0.30.35
0.40.45
0.5
2000 2001 2002 2003 2004 2005 2006 2007
Source: WHO, SEARO and WHO, IEDCR
12 The status and trends of prevention of malaria could not be analyzed due to limitation of the available data.
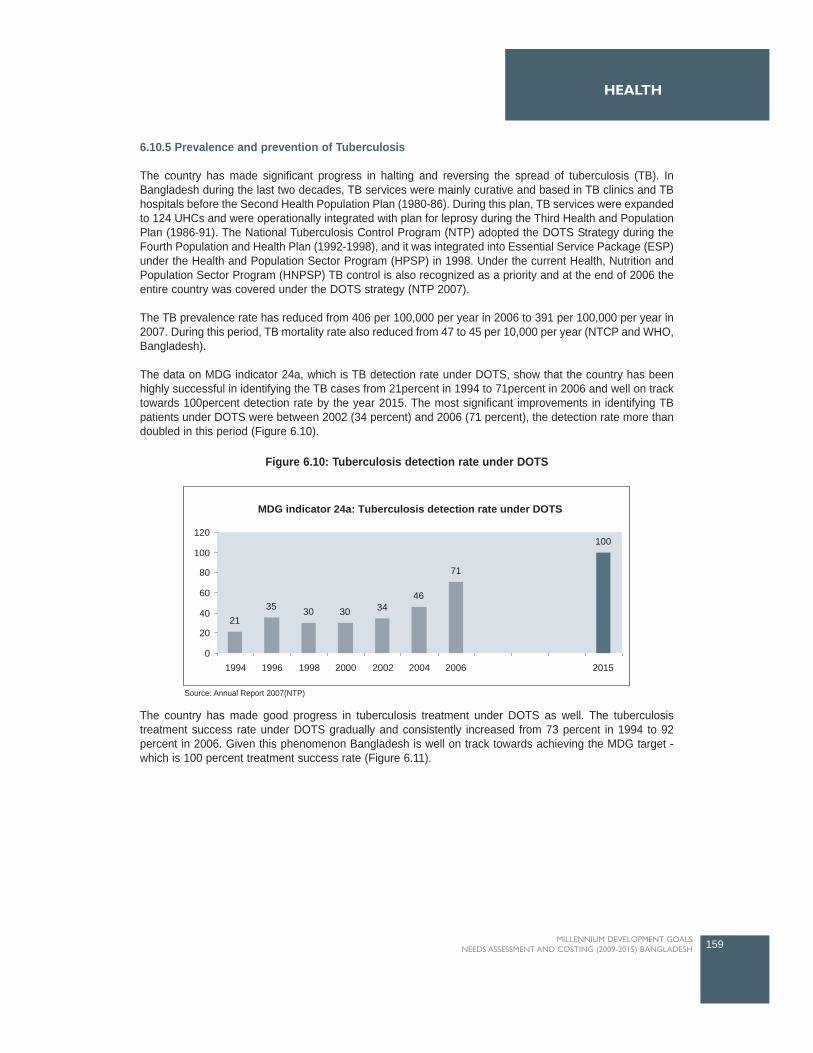
6.10.5 Prevalence and prevention of Tuberculosis
The country has made significant progress in halting and reversing the spread of tuberculosis (TB). InBangladesh during the last two decades, TB services were mainly curative and based in TB clinics and TBhospitals before the Second Health Population Plan (1980-86). During this plan, TB services were expandedto 124 UHCs and were operationally integrated with plan for leprosy during the Third Health and PopulationPlan (1986-91). The National Tuberculosis Control Program (NTP) adopted the DOTS Strategy during theFourth Population and Health Plan (1992-1998), and it was integrated into Essential Service Package (ESP)under the Health and Population Sector Program (HPSP) in 1998. Under the current Health, Nutrition andPopulation Sector Program (HNPSP) TB control is also recognized as a priority and at the end of 2006 theentire country was covered under the DOTS strategy (NTP 2007).
The TB prevalence rate has reduced from 406 per 100,000 per year in 2006 to 391 per 100,000 per year in2007. During this period, TB mortality rate also reduced from 47 to 45 per 10,000 per year (NTCP and WHO,Bangladesh).
The data on MDG indicator 24a, which is TB detection rate under DOTS, show that the country has beenhighly successful in identifying the TB cases from 21percent in 1994 to 71percent in 2006 and well on tracktowards 100percent detection rate by the year 2015. The most significant improvements in identifying TBpatients under DOTS were between 2002 (34 percent) and 2006 (71 percent), the detection rate more thandoubled in this period (Figure 6.10).
The country has made good progress in tuberculosis treatment under DOTS as well. The tuberculosistreatment success rate under DOTS gradually and consistently increased from 73 percent in 1994 to 92percent in 2006. Given this phenomenon Bangladesh is well on track towards achieving the MDG target -which is 100 percent treatment success rate (Figure 6.11).
159MILLENNIUM DEVELOPMENT GOALS NEEDS ASSESSMENT AND COSTING (2009-2015) BANGLADESH
HEALTH
MDG indicator 24a: Tuberculosis detection rate under DOTS
2135 30 30 34
46
71
100
0
20
40
60
80
100
120
1994 1996 1998 2000 2002 2004 2006 2015
Figure 6.10: Tuberculosis detection rate under DOTS
Source: Annual Report 2007(NTP)
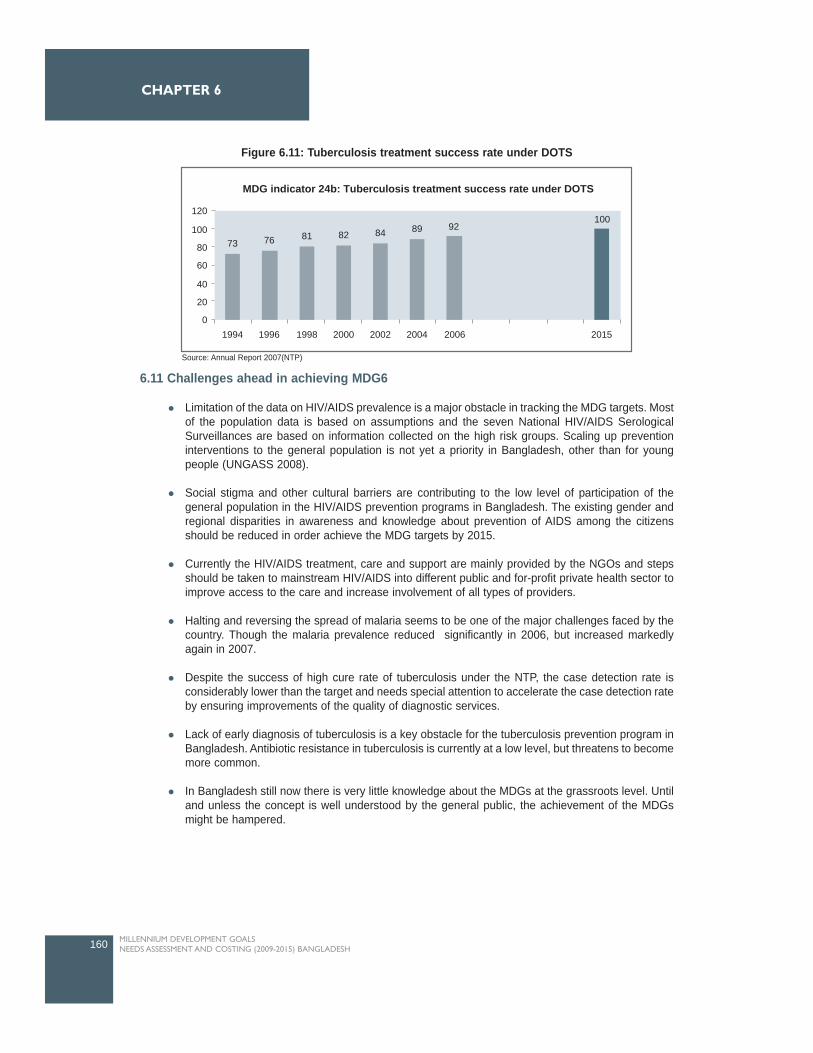
6.11 Challenges ahead in achieving MDG6
Limitation of the data on HIV/AIDS prevalence is a major obstacle in tracking the MDG targets. Mostof the population data is based on assumptions and the seven National HIV/AIDS SerologicalSurveillances are based on information collected on the high risk groups. Scaling up preventioninterventions to the general population is not yet a priority in Bangladesh, other than for youngpeople (UNGASS 2008).
Social stigma and other cultural barriers are contributing to the low level of participation of thegeneral population in the HIV/AIDS prevention programs in Bangladesh. The existing gender andregional disparities in awareness and knowledge about prevention of AIDS among the citizensshould be reduced in order achieve the MDG targets by 2015.
Currently the HIV/AIDS treatment, care and support are mainly provided by the NGOs and stepsshould be taken to mainstream HIV/AIDS into different public and for-profit private health sector toimprove access to the care and increase involvement of all types of providers.
Halting and reversing the spread of malaria seems to be one of the major challenges faced by thecountry. Though the malaria prevalence reduced significantly in 2006, but increased markedlyagain in 2007.
Despite the success of high cure rate of tuberculosis under the NTP, the case detection rate isconsiderably lower than the target and needs special attention to accelerate the case detection rateby ensuring improvements of the quality of diagnostic services.
Lack of early diagnosis of tuberculosis is a key obstacle for the tuberculosis prevention program inBangladesh. Antibiotic resistance in tuberculosis is currently at a low level, but threatens to becomemore common.
In Bangladesh still now there is very little knowledge about the MDGs at the grassroots level. Untiland unless the concept is well understood by the general public, the achievement of the MDGsmight be hampered.
160 MILLENNIUM DEVELOPMENT GOALS NEEDS ASSESSMENT AND COSTING (2009-2015) BANGLADESH
CHAPTER 6
73 76 81 82 84 89 92100
0
20
40
60
80
100
120
1994 1996 1998 2000 2002 2004 2006 2015
MDG indicator 24b: Tuberculosis treatment success rate under DOTS
Figure 6.11: Tuberculosis treatment success rate under DOTS
Source: Annual Report 2007(NTP)
6.12 Major Interventions and Targets for attaining MDG6
This section describes the key interventions for attaining MDG6 in Bangladesh.
6.12.1 HIV/AIDS
The Second National Strategic Plan 2004-2010 prioritized some interventions of the HIV/AIDS Program andalso set targets for those interventions. Based on the analysis of the HIV/AIDS situation and vulnerabilityfactors to the epidemic in Bangladesh this MDG Needs Assessment and Costing study has finalized theinterventions for attaining the HIV/AIDS related targets of MDG 6 by discussing with the key stakeholdersand reviewing the policies and plans.
The interventions can be classified into four broad groups: HIV/AIDS prevention programs, treatment ofPLHIV, care and support programs for the HIV/AIDS infected and vulnerable population, and enablingenvironment.
6.12.1.1 HIV/AIDS prevention Program
The prevention programs are mainly targeted for specific risk groups like female sex workers, MSM, IDUs,clients of sex workers, truck drivers, and migrant workers. The other important interventions which aim toprevent the spread of HIV/AIDS infection in Bangladesh are youth education of HIV/AIDS, safe bloodtransfusion program, mass media campaign, and voluntary counseling and testing (VCT).
Prevention Programs for the high-risk groups
The prevention program for the risk groups includes counseling and condom distribution. 57 percent of thefemale sex workers, 47 percent of the male sex workers/MSM, 82 percent of the IDUs and 15 percent of thetransgender have been reached by the prevention programs in 2007 (UNGASS 2008, UNGASS 2006, MIS2007). The Governments Strategic Plan 2004-2010 aims at universal coverage of prevention programs by 2010.Considering the current situation the study/TWG set the same target coverage for 2012 in the costing exercise.
However the proportion of high-risk individuals who received HIV/AIDS testing in the last 12 months and whoknow the results is quite low (five percent of the female sex workers, eight percent of the male sexworkers/MSM, and three percent of IDUs). The harm reduction program such as needle/syringe exchangeprogram for the IDUs has been launched few years back. Recent studies show that the program started topositively influence the risk behavior of the IDUs. However, no data are available on the current coverage.
Safe Blood Transfusion Program (SBTP)
Safe Blood Transfusion Program (SBTP) was launched in Bangladesh in 2000 and before that bloodscreening was not mandatory in either government or NGO facilities. Currently five transfusion transmissibleinfections (TTI) - HIV, Hepatitis B, Hepatitis C, Syphilis and Malaria are being screened before transfusionin 99 blood centers. A total of 13,36,699 units of blood have been screened since 2000 to 2007 (MIS 2008).The proportion of blood screened before transfusion per year in Bangladesh is yet not known, and as a resultthe study used the percentage of safe blood donation in developing countries (57percent) as a proxyindicator for 2007.
Youth Education of HIV/AIDS
The Bangladesh HIV/AIDS Program has successfully incorporated HIV/AIDS information into the secondaryand higher secondary school curriculum (grade VI to XII). Under this program around 36,000 teachers havebeen trained in 2007. "Train the Trainer" program taught teachers how to develop lesson plans and leadclassroom sessions. These trained teachers have trained about 32,000 teachers of 6,375 institutes andadditional 63,750 teachers have participated in orientation sessions on HIV/AIDS (NASP 2007b). The schoolHIV/AIDS Program, which now operates in 20 districts, will be scaled up to cover 40 of the 64 districts inBangladesh during 2007-2012 (UNGASS 2008).
161MILLENNIUM DEVELOPMENT GOALS NEEDS ASSESSMENT AND COSTING (2009-2015) BANGLADESH
HEALTH

Mass Media Campaign
Mass media campaigns are expected to play a key role in behavioral change towards HIV/AIDS prevention.In Bangladesh the current mass media campaigns are using television, radio, newspapers and local folkmedia to create awareness on various HIV/AIDS related issues and also to reduce stigma and discriminationagainst the PLHIV.
Voluntary HIV/AIDS counseling and testing (VCT)
Voluntary Counseling and Testing (VCT) is client initiated testing, and coverage of VCT is extremely low inBangladesh because of fear of social stigma and discrimination and low perception of risk. VCT servicesare still targeted at the high-risk population and there is little coverage for the general population. Only sevenfacilities have been established for this purpose till 2006 and few of them are fully functional (UNGASS 2006,UNGASS 2008). NASP is developing counseling modules and guidelines on minimum standards of VCT.The VCT units are needed to be established for providing the counseling and laboratory services in bloodtransfusion centers since all facilities for HIV/AIDS testing are available there.
6.12.1.2. Treatment of PLHIV
Antiretroviral Therapy (ART)
Development of antiretroviral therapy (ART) has significantly improved the mortality and morbidity ofHIV/AIDS diseases around the world. This intervention can prolong and improve life for people living withHIV/AIDS (PLHIV). In Bangladesh, only 13.3 percent of adults with advanced HIV/AIDS infection havereceived ART in 2007 (UNGASS 2008)13 . Five organizations including four NGOs or self-help groups andone public institute (Infectious Diseases Hospital) are providing ART. The current coverage is far below thenational demand and concentrated in Dhaka city. The study/TWG decided to set the target of universalcoverage of treatment by 2010 for the costing exercise.
Laboratory tests associated with ART
The people living with HIV/AIDS infection need to go through pathological investigations on a regular basisand they are an integral part of the treatment procedure. The laboratory tests associated with ART are CD4,viral load, full blood count, creatinine, ALT, cholesterol and screening for TB. Currently, only two institutes,ICDDR,B and Combined Military Hospital, have the equipment to conduct the CD4 tests in the country.
6.12.1.3 Care and Support
The most important care and support Programs of HIV/AIDS are clinical management of commonopportunistic infections (OIs), nutritional support to PLHIV, and support to orphans and vulnerable children.Currently the treatment of common opportunistic infections is provided to those patients receiving ARTbased on their disease profile. However, the number is considerably low compared to the total nationaldemand.
No current estimate is available on the number of children who have lost one or both of their parents due toAIDS. In 2002, there may have been 100 orphans and in 2004 somewhere between 44 and 132 childrenwould have lost one or both parents, which is a very insignificant number in Bangladesh's population(UNGASS 2008).
6.12.1.4 Enabling environment
HIV/AIDS-related stigma and discrimination is one of the major barriers to fight against HIV and AIDSepidemic. Research should be conducted to estimate the extent of stigma and discriminations and to identifyappropriate measures to reduce it. AIDS case surveillance or routine AIDS reporting of AIDS cases iscurrently not conducted in Bangladesh.
162 MILLENNIUM DEVELOPMENT GOALS NEEDS ASSESSMENT AND COSTING (2009-2015) BANGLADESH
CHAPTER 6
13 Six different types of ARV drugs are currently produced by two national pharmaceutical companies in Bangladesh, but paediatric formulations andARV formulations for pregnant mothers are not available (Azim et al. 2008).
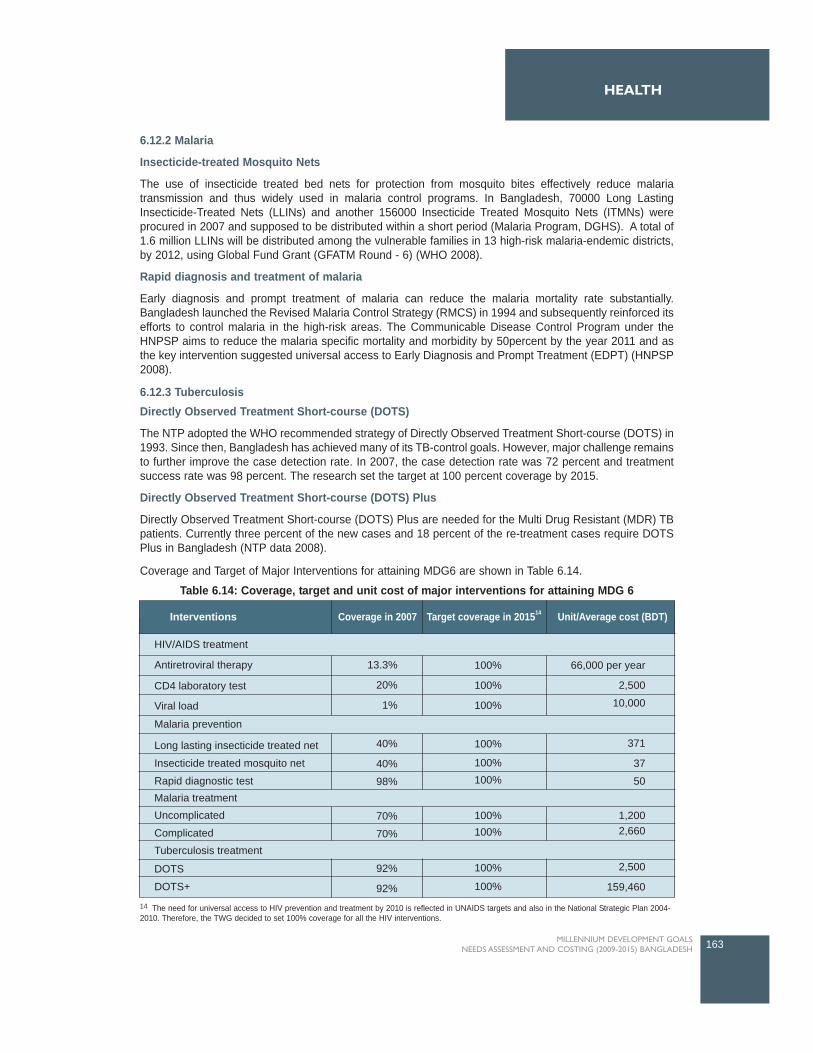
6.12.2 Malaria
Insecticide-treated Mosquito Nets
The use of insecticide treated bed nets for protection from mosquito bites effectively reduce malariatransmission and thus widely used in malaria control programs. In Bangladesh, 70000 Long LastingInsecticide-Treated Nets (LLINs) and another 156000 Insecticide Treated Mosquito Nets (ITMNs) wereprocured in 2007 and supposed to be distributed within a short period (Malaria Program, DGHS). A total of1.6 million LLINs will be distributed among the vulnerable families in 13 high-risk malaria-endemic districts,by 2012, using Global Fund Grant (GFATM Round - 6) (WHO 2008).
Rapid diagnosis and treatment of malaria
Early diagnosis and prompt treatment of malaria can reduce the malaria mortality rate substantially.Bangladesh launched the Revised Malaria Control Strategy (RMCS) in 1994 and subsequently reinforced itsefforts to control malaria in the high-risk areas. The Communicable Disease Control Program under theHNPSP aims to reduce the malaria specific mortality and morbidity by 50percent by the year 2011 and asthe key intervention suggested universal access to Early Diagnosis and Prompt Treatment (EDPT) (HNPSP2008).
6.12.3 TuberculosisDirectly Observed Treatment Short-course (DOTS)
The NTP adopted the WHO recommended strategy of Directly Observed Treatment Short-course (DOTS) in1993. Since then, Bangladesh has achieved many of its TB-control goals. However, major challenge remainsto further improve the case detection rate. In 2007, the case detection rate was 72 percent and treatmentsuccess rate was 98 percent. The research set the target at 100 percent coverage by 2015.
Directly Observed Treatment Short-course (DOTS) Plus
Directly Observed Treatment Short-course (DOTS) Plus are needed for the Multi Drug Resistant (MDR) TBpatients. Currently three percent of the new cases and 18 percent of the re-treatment cases require DOTSPlus in Bangladesh (NTP data 2008).
Coverage and Target of Major Interventions for attaining MDG6 are shown in Table 6.14.
163MILLENNIUM DEVELOPMENT GOALS NEEDS ASSESSMENT AND COSTING (2009-2015) BANGLADESH
HEALTH
Coverage in 2007 Target coverage in 201514 Unit/Average cost (BDT)Interventions
HIV/AIDS treatment
Antiretroviral therapy 13.3%
20%
1%
40%
40%
98%
70%
70%
92%
92%
Malaria prevention
Malaria treatment
Tuberculosis treatment
CD4 laboratory test
Viral load
Long lasting insecticide treated net
Insecticide treated mosquito net
Rapid diagnostic test
Uncomplicated
Complicated
DOTS
DOTS+
100% 66,000 per year
2,500
10,000
371
37
50
100%
100%
100%
100%100%
100% 1,2002,660100%
100%
100%
2,500
159,460
Table 6.14: Coverage, target and unit cost of major interventions for attaining MDG 6
14 The need for universal access to HIV prevention and treatment by 2010 is reflected in UNAIDS targets and also in the National Strategic Plan 2004-2010. Therefore, the TWG decided to set 100% coverage for all the HIV interventions.
6.13 Resource Needs Estimates for MDG 6
The Integrated Health Systems Model used to estimate the resource need included interventions for healthsystems, MDG 4 and 5 and for the interventions related to malaria and TB for MDG 6. However for estimatesrelating to combating HIV/AIDS, a separate HIV/AIDS costing model was used to estimate the directinterventions.
For estimates using the HIV/AIDS costing model for intervention to combat HIV/AIDS, following base yeardata was considered: In 2006, the estimated people living with HIV infection were 7,500 in the country(NASP 2007b). No confirmed estimate is available for 200715.The coverage population for HIV/AIDStreatment and care was set at 11000 in 2007.
For estimates using Integrated Health Systems model, following data were considered for malaria: InBangladesh, there were 50,634 confirmed cases of malaria in 2007, but the presumptive or clinicallydiagnosed number of malaria cases supposed to be much higher16. The data collected from the MalariaControl Program, DGHS, show that about 24,000 confirmed cases of malaria and 22,000 clinical cases werereported in three months only in the 13 malaria high-risk districts in 2008. Taking all these information intoconsideration, the coverage for malaria was set around 300,000 including presumptive cases.
For estimates using Integrated Health Systems model, following data were considered for tuberculosis: Thetuberculosis incidence was 225 per 100,000 people in 2007 (NTP data 2008). Therefore, the coveragepopulation for tuberculosis prevention and treatment program was 320,850 in 2007 and will be 358,844 in2015 (BBS 2007).
Resource Needs for combating HIV/AIDS
In Bangladesh, current coverage of the treatment and prevention programs for HIV/AIDS are considerablylow and if the country wants to provide appropriate treatment and care to all PLHIV, then it has to scale upexpenditure on HIV/AIDS significantly. The results of the costing exercise show that a total of BDT 184,161million should be spent on HIV/AIDS programs during 2009-2015 to achieve the MDG targets. About 55percent of the total expenditure should be on HIV/AIDS prevention programs and 34 percent on HIV/AIDStreatment programs (Table 6.13).
The result of the cost analysis show that a total of BDT 102,296 million should be spent on HIV/AIDSprevention programs to halt and reverse the spread of HIV/AIDS in a densely populated country likeBangladesh. The estimated resource requirement for this program is BDT 10,514 million in 2009 and BDT16,496 million in 2015.
The costing exercise estimated the expenditure flow needed for treatment of PLHIV and the results suggestthat BDT 1,589 million will be needed, in 2009, to provide treatment to the PLHIV. The study/TWG estimatedthe number of HIV positive people in 2009-2015 based on the data that the number of PLHIV was 7,500 in2006 and 11,000 in 2007. The treatment cost will increase significantly over the years because of currentlow levels of coverage of treatment procedures, the expected increasing number of PLHIV, and risingtreatment cost. A total of BDT 63,103 million will be required, from 2009 to 2015, for treatment of PLHIV andthe estimated resource requirement in 2015 will be BDT 21,606 (Table 6.13). The estimated allocation for2008-2011 under HNPSP is BDT 3,327 million for prevention and treatment of HIV/AIDS (HNPSP 2008).
164 MILLENNIUM DEVELOPMENT GOALS NEEDS ASSESSMENT AND COSTING (2009-2015) BANGLADESH
CHAPTER 6
15 There is data discrepancy in estimated number of PLHIV. According to some sources the estimated population living with HIV infection was 13000in 2007 (HNPSP 2008, WHO 2007). However, reported estimated PLHIV from other sources were lower for same year. 16 According to World Malaria Report 2005, there were 400,000 clinical cases and more than 57,000 laboratory confirmed malaria cases per year inBangladesh (WHO 2005).
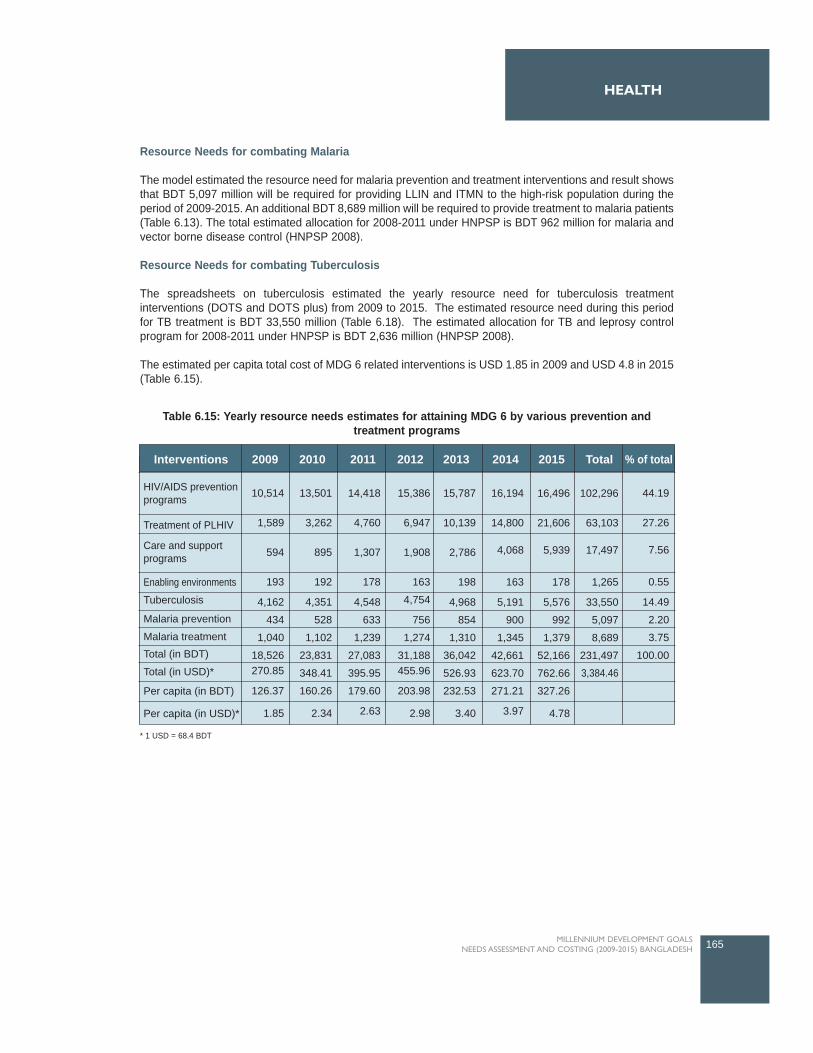
Resource Needs for combating Malaria
The model estimated the resource need for malaria prevention and treatment interventions and result showsthat BDT 5,097 million will be required for providing LLIN and ITMN to the high-risk population during theperiod of 2009-2015. An additional BDT 8,689 million will be required to provide treatment to malaria patients(Table 6.13). The total estimated allocation for 2008-2011 under HNPSP is BDT 962 million for malaria andvector borne disease control (HNPSP 2008).
Resource Needs for combating Tuberculosis
The spreadsheets on tuberculosis estimated the yearly resource need for tuberculosis treatmentinterventions (DOTS and DOTS plus) from 2009 to 2015. The estimated resource need during this periodfor TB treatment is BDT 33,550 million (Table 6.18). The estimated allocation for TB and leprosy controlprogram for 2008-2011 under HNPSP is BDT 2,636 million (HNPSP 2008).
The estimated per capita total cost of MDG 6 related interventions is USD 1.85 in 2009 and USD 4.8 in 2015(Table 6.15).
165MILLENNIUM DEVELOPMENT GOALS NEEDS ASSESSMENT AND COSTING (2009-2015) BANGLADESH
HEALTH
* 1 USD = 68.4 BDT
Interventions 2009 2010 2011 2012 2013 2014 2015 Total % of total
HIV/AIDS preventionprograms
Treatment of PLHIV
Enabling environments
Tuberculosis
Malaria prevention
Malaria treatmentTotal (in BDT)
Total (in USD)*
Per capita (in BDT)
Per capita (in USD)*
Care and supportprograms
10,514
1,589
594
193
4,162
434
1,040
18,526270.85
126.37
1.85
13,501
3,262
895
192
4,351
528
1,102
23,831
348.41
160.26
2.34
14,418
4,760
1,307
178
4,548
633
1,239
27,083
395.95
179.60
2.63
15,386
6,947
1,908
163
4,754
756
1,274
31,188455.96
203.98
2.98
15,787
10,139
2,786
198
4,968
854
1,310
36,042
526.93
232.53
3.40
16,194
14,800
4,068
163
5,191
900
1,345
42,661
623.70
271.21
3.97
16,496
21,606
5,939
178
5,576
992
1,379
52,166
762.66
327.26
4.78
102,296
63,103
17,497
1,265
33,550
5,097
8,689
231,4973,384.46
44.19
27.26
7.56
0.55
14.49
2.20
3.75
100.00
Table 6.15: Yearly resource needs estimates for attaining MDG 6 by various prevention andtreatment programs
Health Systems (MDGs 4, 5 and 6)
6.14 Health systems of Bangladesh: current status and future need
The following two subsections discuss the current status, and future needs of infrastructure and humanresources of the health, nutrition and population sector of Bangladesh to attain MDG 4,5 and 6 by 2015.
6.14.1 Infrastructure
There are three main levels of health facilities in Bangladesh: primary health care (UHC, UHFWC, USC &CCs), secondary healthcare (District Hospitals), tertiary health care including Medical College Hospitals(MCH), and super specialized care (specialized institutions).
Under the HPSP, about 13,500 new community clinics (CCs), each for 6,000 people, were supposed to beconstructed. So far, 11,883 CCs have been constructed and 8,426 are functioning either with DGHS HealthAssistant (HA) and DGFP Family Welfare Assistant (FWA) or handed over to NGOs (DGHS data 2008). TheHA and FWA are performing home visits and working from CCs (if operational) and are providing familyplanning services, maternal and child health care, including immunization, communicable disease control,symptomatic curative care for common complaints, and upward referrals (HNPSP 2008).
At Union level there are 3,622 Union Health and Family Welfare Centres (UHFWCs) under DGFP andupgraded UHFWC (formerly called Union Sub-centres, USC) under DGHS (HEU 2008). UHFWC has oneSub-Assistant Community Medical Officer (SACMO), one Family Welfare Visitor (FWV), one Pharmacist,one Aya and one MLSS. In the Unions, where no UHFWC has been constructed, there is a post of FWV only(HNPSP 2005). The training of FWVs in FWV Training Institutes managed by NIPORT started in 1970s, butunfortunately has stopped since 1997. The termination of the training of FWVs is expected to have adverseeffect on maternal and child health in Bangladesh as FWVs provide services to mainly rural women (BHW2007). Each of the 1,275 upgraded UHFWCs has the posts of a Medical Officer, a Medical Assistant and aPharmacist (HNPSP 2008).
There are 431 Upazila Health Complexes (UHCs) with 31-50 beds in each facility and 60 Rural HealthCentres (RHCs) with 10-20 beds in each facility, and providing both outpatient and inpatient care, at Upazilalevel. A total 107 UHCs have been upgraded from 31-bed hospital to 50-bed hospital so far and in another163 facilities the extension is under construction (CMMU data 2008). Another 16 UHCs (31 bed) will beconstructed soon. The 20 bed hospitals are located in remote areas of the upazilas where there are no UHCsor the place is 10 to 15 kilometres away from the UHC and DH (CMMU data 2008).
In each of the UHCs, on the health side there are nine doctors including one dental surgeon, nursingsupervisor and senior staff nurses, two Medical Assistants, medical technologists (pharmacy, radiology,dental) and an EPI technician along with other support staff. The UHCs also have the posts of Upazila FamilyPlanning Officer (UFPO), Medical Officer (Maternal and Child Health), Assistant Family Planning Officer,Senior FWV and two FWVs on the family planning side (HNPSP 2005).
The second layer facilities on the health side in the country constitutes of 61 District Hospitals (DHs). DHsare larger facilities in comparison with UHC, with an average bed size of 133 (range 50 to 375). There wereseventeen 50 bed DHs, one 75 bed DH, thirty-three 100 bed DH, one 120 bed DH, four 150 bed DHs, andtwo 250 bed DHs in 2007 (HEU 2007).
The districts also have Maternal and Child Welfare Centres (MCWCs) based in the district town which offerComprehensive Emergency Obstetric Care (C-EmOC) and clinical contraception run by the DGFP. Thereare a total 98 MCWCs in the country. Among them 62 are located at each district level17 , 12 at Upazila level
166 MILLENNIUM DEVELOPMENT GOALS NEEDS ASSESSMENT AND COSTING (2009-2015) BANGLADESH
CHAPTER 6
17 The construction of the other two MCWCs at the district level is suspended for some unknown reasons.
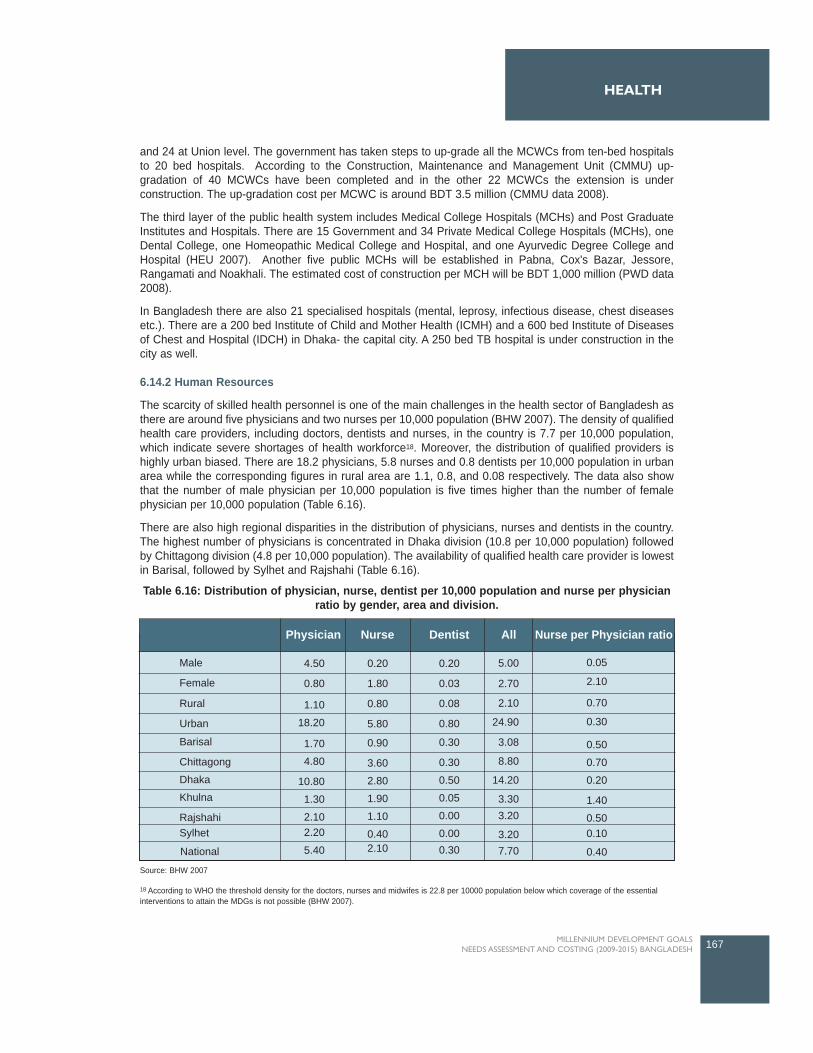
and 24 at Union level. The government has taken steps to up-grade all the MCWCs from ten-bed hospitalsto 20 bed hospitals. According to the Construction, Maintenance and Management Unit (CMMU) up-gradation of 40 MCWCs have been completed and in the other 22 MCWCs the extension is underconstruction. The up-gradation cost per MCWC is around BDT 3.5 million (CMMU data 2008).
The third layer of the public health system includes Medical College Hospitals (MCHs) and Post GraduateInstitutes and Hospitals. There are 15 Government and 34 Private Medical College Hospitals (MCHs), oneDental College, one Homeopathic Medical College and Hospital, and one Ayurvedic Degree College andHospital (HEU 2007). Another five public MCHs will be established in Pabna, Cox's Bazar, Jessore,Rangamati and Noakhali. The estimated cost of construction per MCH will be BDT 1,000 million (PWD data2008).
In Bangladesh there are also 21 specialised hospitals (mental, leprosy, infectious disease, chest diseasesetc.). There are a 200 bed Institute of Child and Mother Health (ICMH) and a 600 bed Institute of Diseasesof Chest and Hospital (IDCH) in Dhaka- the capital city. A 250 bed TB hospital is under construction in thecity as well.
6.14.2 Human Resources
The scarcity of skilled health personnel is one of the main challenges in the health sector of Bangladesh asthere are around five physicians and two nurses per 10,000 population (BHW 2007). The density of qualifiedhealth care providers, including doctors, dentists and nurses, in the country is 7.7 per 10,000 population,which indicate severe shortages of health workforce18. Moreover, the distribution of qualified providers ishighly urban biased. There are 18.2 physicians, 5.8 nurses and 0.8 dentists per 10,000 population in urbanarea while the corresponding figures in rural area are 1.1, 0.8, and 0.08 respectively. The data also showthat the number of male physician per 10,000 population is five times higher than the number of femalephysician per 10,000 population (Table 6.16).
There are also high regional disparities in the distribution of physicians, nurses and dentists in the country.The highest number of physicians is concentrated in Dhaka division (10.8 per 10,000 population) followedby Chittagong division (4.8 per 10,000 population). The availability of qualified health care provider is lowestin Barisal, followed by Sylhet and Rajshahi (Table 6.16).
167MILLENNIUM DEVELOPMENT GOALS NEEDS ASSESSMENT AND COSTING (2009-2015) BANGLADESH
HEALTH
Source: BHW 2007
Nurse per Physician ratioAll
5.00
2.70
2.10
24.90
3.08
8.80
14.20
3.303.20
3.20
DentistNursePhysician
7.70
0.05
2.10
0.70
0.30
0.50
0.70
0.20
1.40
0.500.10
Male
Female
4.50
0.80
0.20
1.80
0.20
0.03
0.08
0.80
0.30
0.30
0.50
0.05
0.00
0.00
0.80
5.80
0.90
3.60
2.80
1.90
1.10
0.40
1.10
18.20
Rural
Urban
Barisal
Chittagong
Dhaka
Khulna
RajshahiSylhet
National
1.70
4.80
10.80
1.30
2.102.20
5.40 2.10 0.30 0.40
Table 6.16: Distribution of physician, nurse, dentist per 10,000 population and nurse per physicianratio by gender, area and division.
18 According to WHO the threshold density for the doctors, nurses and midwifes is 22.8 per 10000 population below which coverage of the essentialinterventions to attain the MDGs is not possible (BHW 2007).
The current status of health personnel and the future capacity of the health sector are discussed below.
Physicians
The total number of estimated doctors available in 2007 was 38,537 and only 38 percent of them areemployed in the public sector and 62 percent are employed in the private sector. The total number of dentalsurgeons in the same period was 2995. The government owned institutes producing doctors include onemedical university, 23 post-graduate medical institutes (including medical colleges offering post graduatedegree/diploma), 15 medical colleges, one dental college and two dental units attached to Rajshahi andChittagong medical college. The private medical institutes producing doctors include 34 medical colleges,nine dental colleges and five post graduate medical institutes. The total enrollment capacity of theseinstitutes is 4,816 seats including public medical colleges (2,260) and private medical colleges (2,556) (BHW2007). Currently, these MCHs produce around 1,200 doctors per year (BHW 2007).
The total number of available doctors falls greately short of what is required for attaining the MDGs.According to Main Report of Mid Term Review 2008, the estimated need of doctors was 98,550 (based onLow Income Countries average) in 2007. This implies that there was a shortage of around 60,000 doctors.
Nurses
There are 70 nursing institutes, 51 run by the Government and 19 by private entrepreneurs, in the countryoffering three years Diploma in General Nursing and one year Diploma in Midwifery/Orthopedic. There is oneCollege of Nursing affiliated to the University of Dhaka offering two years Bachelor of Science Degree (BSc.)in Nursing and Public Health Nursing (BHW 2007). Another Nursing College will be constructed soon.Though the nursing institutes admit 2280 students every year, around 1200 students qualify as diplomanurses (BHW 2007).
The total number of registered nurses in the country was 21,715 in 2007 and 14,971 nurses were employedin the public sector (HEU 2007). The shortage of nurses was even much higher than the shortage of doctors.A total of 163,177 additional nurses are required, based on the Low Income Countries average, to achievethe MDGs (MTR 2008).
Medical Assistants
Medical Assistants provide assistance to doctors and play an important role in the health sector ofBangladesh, specially in the primary health tier (UHC, UHFWC and USC). The Medical Assistants TrainingSchools (MATS) was established in 1979 and it offers a three-year diploma course. All five MATS are locatedat the district level and the teachers of the institutes are medical doctors. The main challenges to trainmedical assistance are to teach SSC-passed students complex subjects like anatomy and physiology, andlack of textbooks designed for such students, especially in Bengali. These training institutes train around 300medical assistants each year (BHW 2007). More than 1900 medical assistants were employed in the publichealth facilities under DGHS in 2007 (MIS data 2007).
Health Technologists
The demand for Health Technologist is rising rapidly with increasing number of hospitals, clinics anddiagnostic centers and also for the upgradation of the public facilities. The health technologists includelaboratory technicians, pharmacists, radiographers, sanitary inspectors, and physical therapists.
There were a total of 79 training institutes for the health technologists in Bangladesh in 2007. Under the StateMedical Faculty (SMF), MOHFW, there were 32 health technology institutes and 47 private healthtechnology institutes were functioning under the Technical Education Board of the Ministry of Education.Another 30 institutes have been already sanctioned by the Ministry of Education. A total of 4,386 studentsgot admitted into the public and 3375 in the private health technologist institutes in 2006 (BHW 2007).
168 MILLENNIUM DEVELOPMENT GOALS NEEDS ASSESSMENT AND COSTING (2009-2015) BANGLADESH
CHAPTER 6
In 2007 there were 10,653 health technologists in Bangladesh (BHW 2007). Among them around 5,000health technologists were employed in the public sector (MIS 2007). The generally acceptable ratio of healthtechnologist to doctor is 5:1. But in Bangladesh the ratio of technician to doctor is 1:3.6 implying severeshortage of health technologists which is greatly hampering the cost effective health service delivery.
Skilled Birth Attendants
The WHO definition of skilled birth attendant is " an accredited health professional such as midwife, doctoror nurse, who has been educated and trained to proficiency in the skills needed to manage normal(uncomplicated) pregnancies, child birth and the immediate postnatal period, and in the identification,management and referral of complications in women and newborn" (WHO 2004). However in Bangladeshby definition assistance during delivery by skilled health professional includes doctor, nurse, midwife,paramedic and also the Community Skilled Birth attendant (CSBA)19 (BDHS 2007). CSBA are the accreditedhealth workers working at the community level, i.e., Family Welfare Assistant and female Health Assistants,who have been educated and trained to proficiency in all the midwifery skills.
The Government of Bangladesh started the "Community-Based Skilled Birth Attendant Training Program",with technical and financial assistance from WHO and UNFPA, in 2003. Obstetrical and GynaecologicalSociety of Bangladesh (OGSB) has been providing six month training to FWA and female HA in facilities likethe Family Welfare Visitor Training Institute (FWVTI), Nursing Institutes and Mother and Child WelfareCenter (MCWC). On average 480 CSBAs are produced each year by providing training to batches of 18trainees in 38 centers in 48 districts. A total of 4,000 CSBAs have been trained out of the target 13,500 sofar, from 2003 to 2007, in 216 Upazilas (BHW 2007). To achieve the target by 2015 the OGSB will have totrain 1250 CSBA per year (UNFPA data 2008). The training cost per CSBA is BDT 150,000 and thereforeBDT 187,500,000 will be required annually to achieve the target by 2015.
6.15 The challenges ahead in Health systems in Bangladesh
Scarcity and poor distribution of qualified health professionals is one of the major challenges facedby the health sector of Bangladesh. Improved human resource management is required to addressthe urban bias of the health workforce and the absenteeism in rural health facilities.
Current capacity of the pre service training institutes falls greatly short of the requirement and newtraining institutes, especially for nurses and medical technologists, should be built and the capacityof the existing institutes should be increased.
About 64 percent of the total healthcare expenditure in Bangladesh is out-of pocket expenditure bythe households. This huge household spending is mainly related to expenditure on drugs,diagnostic tests and transport to the facility. Demand side financing schemes, which subsidizetheses costs, can increase the utilization of healthcare by the women and children, who are usuallythe non-earning members in the family, and also by the poor.
Misperceptions regarding the need for care and social barriers contribute to low levels of demandfor maternal and child care in Bangladesh. Effective health education programs are needed toincrease the demand for modern healthcare.
169MILLENNIUM DEVELOPMENT GOALS NEEDS ASSESSMENT AND COSTING (2009-2015) BANGLADESH
HEALTH
19 The community skilled birth attendants (CSBAs) are to provide normal safe delivery in homes and referral to the emergency obstetric care (EmOC)sites, if needed.
6.16 Major interventions for Health systems
This section describes the key interventions for improving health systems for MDGs 4, 5 and 6 inBangladesh.
Construction of new health facilities
In Bangladesh the private health facilities are located mainly in urban areas and the public and not-for-profitprivate hospital/health facilities are the predominant modern health service delivery points in rural areas.Construction of new facilities in rural areas to increase the access to health care and reduce indirect cost 20
is essential to improve the health sector performance. In view of that more CCs, UHFWCs and UHCs needto be built to increase the utilization of healthcare, especially by women and children. Under the currenthealth, nutrition and population sector program about 1600 CCs, 16 UHCs and 5 new MCHs will beconstructed by 2011 (HNPSP 2008).
Upgradation of existing health facilities
Upgradation of the existing health facilities is one of the key health system interventions of the current healthsector program. A total 107 UHCs have been upgraded from 31-bed hospital to 50-bed hospital so far andin another 163 facilities the extension is under construction. Ten DHs will be upgraded from 100 bedhospitals to 200 bed hospitals and in other two DHs, the capacity will be increased by additional 150 beds.Two MCHs will be expanded from 500 bed hospitals to 1,000 bed hospitals (Table 6.17)
Pre-service training of health personnel
The current capacity of the post-graduate medical institutes and medical colleges need to be increased tofill the gap between the required and actual number of qualified physicians in the health sector ofBangladesh. More public and private nursing training institutes need to be established urgently to increasethe number of nurses.
In-service training of health personnel
The important in-service training programs for MDGs are clinical management training for doctors andparamedics under Integrated Management of Childhood Illness (IMCI), to train medical officers in obstetricsor anesthesia under comprehensive EmOC program, and training of FWA and female HA to produce CSBAby the Obstetrical and Gynecological Society of Bangladesh (OGSB).
6.17 Resource needs estimate for Health Systems
For the health systems, the information on current number of health personnel employed in the health sectorwas collected from MIS, DGHS. The study also collected detail information on cost of infrastructure andequipment of each type of facilities. The construction costs of primary level facilities were collected fromConstruction, Maintenance and Management Unit (CMMU) and secondary and above level facilities werecollected from Public Works Department (PWD). Under the previous and current health sector programs, asignificant numbers of facilities at primary (UHC), secondary (DH, MCWC) and tertiary level (MCH) havebeen and will be upgraded by increasing the number of existing beds, with the aim of enhancing the capacityof the hospitals. The estimated upgradation/construction costs of DH and MCH under HNPSP are presentedin Table 6.17 below. The estimated average upgradation/construction cost of the DHs is around BDT 80million and of the MCHs is BDT 300 million.
170 MILLENNIUM DEVELOPMENT GOALS NEEDS ASSESSMENT AND COSTING (2009-2015) BANGLADESH
CHAPTER 6
20 In public and not-for-profit private health facilities services are provided free of cost or at nominal prices. Yet the distance to the facility and travel cost,which are often called as indirect costs, are important determinants of demand for health care.
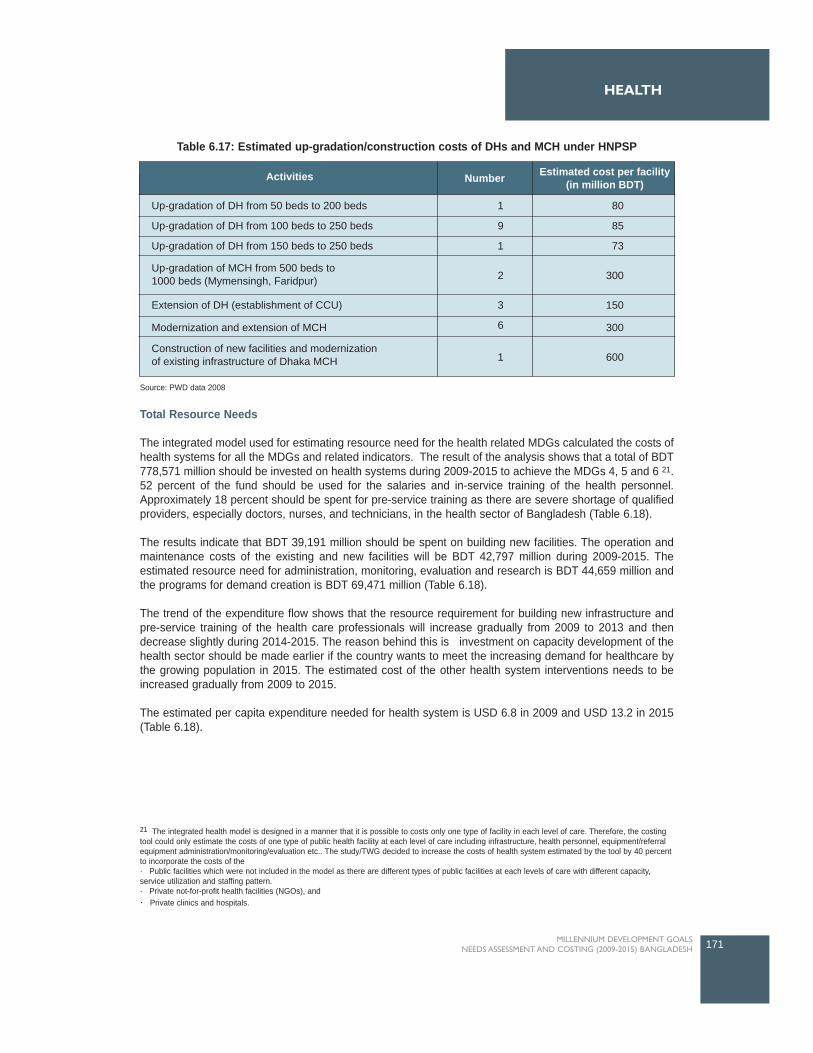
Total Resource Needs
The integrated model used for estimating resource need for the health related MDGs calculated the costs ofhealth systems for all the MDGs and related indicators. The result of the analysis shows that a total of BDT778,571 million should be invested on health systems during 2009-2015 to achieve the MDGs 4, 5 and 6 21.52 percent of the fund should be used for the salaries and in-service training of the health personnel.Approximately 18 percent should be spent for pre-service training as there are severe shortage of qualifiedproviders, especially doctors, nurses, and technicians, in the health sector of Bangladesh (Table 6.18).
The results indicate that BDT 39,191 million should be spent on building new facilities. The operation andmaintenance costs of the existing and new facilities will be BDT 42,797 million during 2009-2015. Theestimated resource need for administration, monitoring, evaluation and research is BDT 44,659 million andthe programs for demand creation is BDT 69,471 million (Table 6.18).
The trend of the expenditure flow shows that the resource requirement for building new infrastructure andpre-service training of the health care professionals will increase gradually from 2009 to 2013 and thendecrease slightly during 2014-2015. The reason behind this is investment on capacity development of thehealth sector should be made earlier if the country wants to meet the increasing demand for healthcare bythe growing population in 2015. The estimated cost of the other health system interventions needs to beincreased gradually from 2009 to 2015.
The estimated per capita expenditure needed for health system is USD 6.8 in 2009 and USD 13.2 in 2015(Table 6.18).
171MILLENNIUM DEVELOPMENT GOALS NEEDS ASSESSMENT AND COSTING (2009-2015) BANGLADESH
HEALTH
21 The integrated health model is designed in a manner that it is possible to costs only one type of facility in each level of care. Therefore, the costingtool could only estimate the costs of one type of public health facility at each level of care including infrastructure, health personnel, equipment/referralequipment administration/monitoring/evaluation etc.. The study/TWG decided to increase the costs of health system estimated by the tool by 40 percentto incorporate the costs of the · Public facilities which were not included in the model as there are different types of public facilities at each levels of care with different capacity,service utilization and staffing pattern.· Private not-for-profit health facilities (NGOs), and· Private clinics and hospitals.
Up-gradation of DH from 50 beds to 200 beds
Up-gradation of DH from 100 beds to 250 beds
Up-gradation of DH from 150 beds to 250 beds
Extension of DH (establishment of CCU)
Modernization and extension of MCH
1
9
1
2
3
6
1
80
85
73
300
150
300
600
Activities Estimated cost per facility(in million BDT)Number
Construction of new facilities and modernizationof existing infrastructure of Dhaka MCH
Up-gradation of MCH from 500 beds to1000 beds (Mymensingh, Faridpur)
Table 6.17: Estimated up-gradation/construction costs of DHs and MCH under HNPSP
Source: PWD data 2008
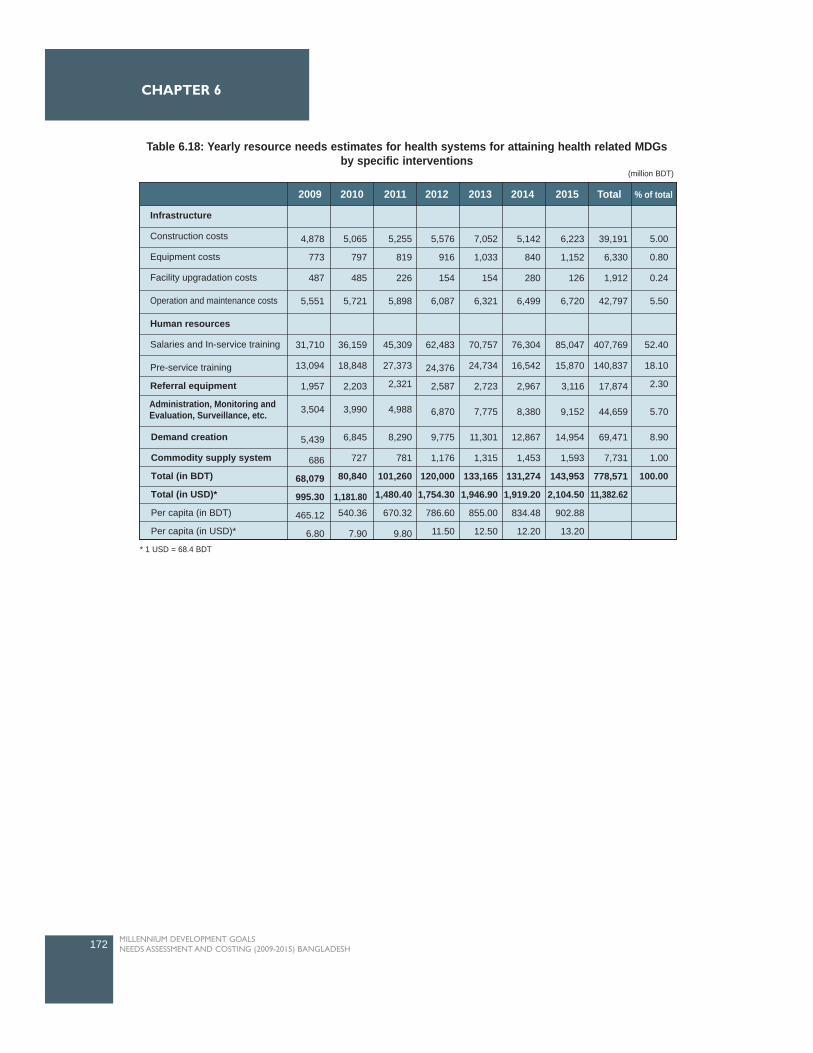
172 MILLENNIUM DEVELOPMENT GOALS NEEDS ASSESSMENT AND COSTING (2009-2015) BANGLADESH
CHAPTER 6
2009 2010 2011 2012 2013 2014 2015 Total % of total
4,878
773
487
5,551
31,710
13,094
1,957
3,504
5,439
686
68,079
995.30
465.12
6.80
5,065
797
485
5,721
36,159
18,848
2,203
3,990
6,845
727
80,840
1,181.80540.36
7.90
5,255
819
226
5,898
45,309
27,373
2,321
4,988
8,290
781
101,260
1,480.40
670.32
9.80
5,576
916
154
6,087
62,483
24,376
2,587
6,870
9,775
1,176
120,000
1,754.30
786.60
11.50
7,052
1,033
154
6,321
70,757
24,734
2,723
7,775
11,301
1,315
133,165
1,946.90
855.00
12.50
5,142
840
280
6,499
76,304
16,542
2,967
8,380
12,867
1,453
131,274
1,919.20
834.48
12.20
6,223
1,152
126
6,720
85,047
15,870
3,116
9,152
14,954
1,593
143,953
2,104.50
902.88
13.20
39,191
6,330
1,912
42,797
407,769
140,837
17,874
44,659
69,471
7,731
778,571
11,382.62
5.00
0.80
0.24
5.50
52.40
18.10
2.30
5.70
8.90
1.00
100.00
Demand creation
Commodity supply system
Total (in BDT)
Total (in USD)*
Per capita (in BDT)
Per capita (in USD)*
Administration, Monitoring andEvaluation, Surveillance, etc.
Infrastructure
Construction costs
Equipment costs
Facility upgradation costs
Operation and maintenance costs
Human resources
Salaries and In-service training
Pre-service training
Referral equipment
Table 6.18: Yearly resource needs estimates for health systems for attaining health related MDGsby specific interventions
(million BDT)
* 1 USD = 68.4 BDT
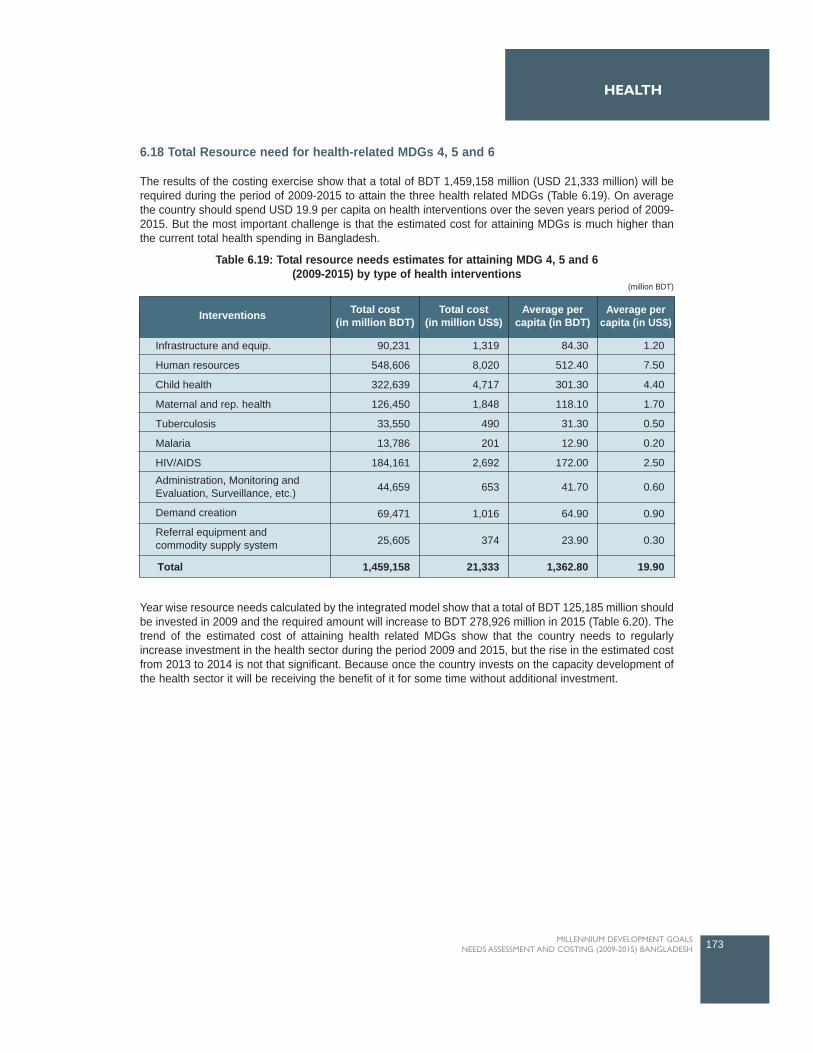
6.18 Total Resource need for health-related MDGs 4, 5 and 6
The results of the costing exercise show that a total of BDT 1,459,158 million (USD 21,333 million) will berequired during the period of 2009-2015 to attain the three health related MDGs (Table 6.19). On averagethe country should spend USD 19.9 per capita on health interventions over the seven years period of 2009-2015. But the most important challenge is that the estimated cost for attaining MDGs is much higher thanthe current total health spending in Bangladesh.
Year wise resource needs calculated by the integrated model show that a total of BDT 125,185 million shouldbe invested in 2009 and the required amount will increase to BDT 278,926 million in 2015 (Table 6.20). Thetrend of the estimated cost of attaining health related MDGs show that the country needs to regularlyincrease investment in the health sector during the period 2009 and 2015, but the rise in the estimated costfrom 2013 to 2014 is not that significant. Because once the country invests on the capacity development ofthe health sector it will be receiving the benefit of it for some time without additional investment.
173MILLENNIUM DEVELOPMENT GOALS NEEDS ASSESSMENT AND COSTING (2009-2015) BANGLADESH
HEALTH
Interventions
Infrastructure and equip.
Human resources
Child health
Maternal and rep. health
Tuberculosis
Malaria
HIV/AIDS
90,231
548,606
322,639
126,450
33,550
13,786
184,161
44,659
69,471
25,605
1,459,158
1,319
8,020
4,717
1,848
490
201
2,692
653
1,016
374
21,333
84.30
512.40
301.30
118.10
31.30
12.90
172.00
41.70
64.90
23.90
1,362.80
1.20
7.50
4.40
1.70
0.50
0.20
2.50
0.60
0.90
0.30
19.90
Total cost(in million BDT)
Total cost(in million US$)
Average percapita (in BDT)
Average percapita (in US$)
Total
Administration, Monitoring andEvaluation, Surveillance, etc.)
Demand creation
Referral equipment andcommodity supply system
Table 6.19: Total resource needs estimates for attaining MDG 4, 5 and 6(2009-2015) by type of health interventions
(million BDT)
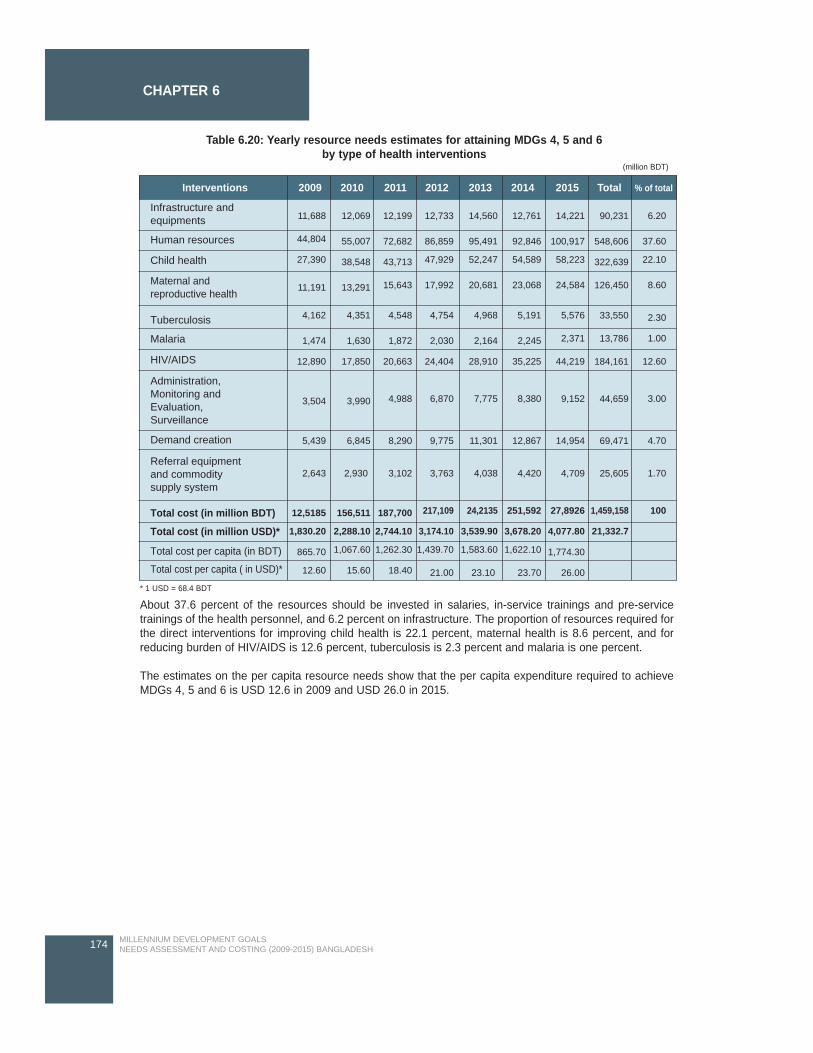
About 37.6 percent of the resources should be invested in salaries, in-service trainings and pre-servicetrainings of the health personnel, and 6.2 percent on infrastructure. The proportion of resources required forthe direct interventions for improving child health is 22.1 percent, maternal health is 8.6 percent, and forreducing burden of HIV/AIDS is 12.6 percent, tuberculosis is 2.3 percent and malaria is one percent.
The estimates on the per capita resource needs show that the per capita expenditure required to achieveMDGs 4, 5 and 6 is USD 12.6 in 2009 and USD 26.0 in 2015.
174 MILLENNIUM DEVELOPMENT GOALS NEEDS ASSESSMENT AND COSTING (2009-2015) BANGLADESH
CHAPTER 6
Interventions 2009 2010 2011 2012 2013 2014 2015 Total % of total
Infrastructure andequipments
Human resources
Child health
Maternal andreproductive health
Tuberculosis
Malaria
HIV/AIDS
Administration,Monitoring andEvaluation,Surveillance
Demand creation
Total cost (in million BDT)
Total cost (in million USD)*
Total cost per capita (in BDT)
Total cost per capita ( in USD)*
Referral equipmentand commoditysupply system
11,688
44,804
27,390
11,191
4,162
1,474
12,890
3,504
5,439
2,643
12,5185
1,830.20
865.70
12.60
12,069
55,007
38,548
13,291
4,351
1,630
17,850
3,990
6,845
2,930
156,511
2,288.10
1,067.60
15.60
12,199
72,682
43,713
15,643
4,548
1,872
20,663
4,988
8,290
3,102
187,700
2,744.10
1,262.30
18.40
12,733
86,859
47,929
17,992
4,754
2,030
24,404
6,870
9,775
3,763
217,109
3,174.10
1,439.70
21.00
14,560
95,491
52,247
20,681
4,968
2,164
28,910
7,775
11,301
4,038
24,2135
3,539.90
1,583.60
23.10
12,761
92,846
54,589
23,068
5,191
2,245
35,225
8,380
12,867
4,420
251,592
3,678.20
1,622.10
23.70
14,221
100,917
58,223
24,584
5,576
2,371
44,219
9,152
14,954
4,709
27,8926
4,077.80
1,774.30
26.00
90,231
548,606
322,639
126,450
33,550
13,786
184,161
44,659
69,471
25,605
1,459,158
21,332.7
6.20
37.60
22.10
8.60
2.30
1.00
12.60
3.00
4.70
1.70
100
* 1 USD = 68.4 BDT
Table 6.20: Yearly resource needs estimates for attaining MDGs 4, 5 and 6 by type of health interventions
(million BDT)

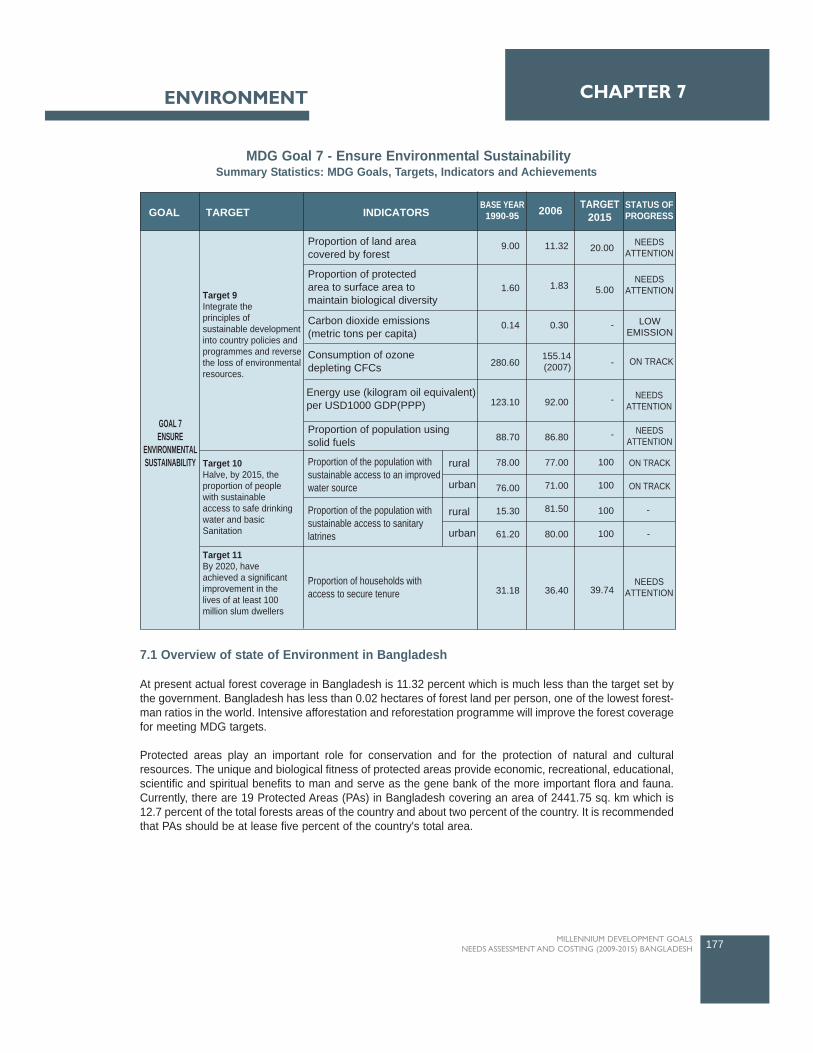
7.1 Overview of state of Environment in Bangladesh
At present actual forest coverage in Bangladesh is 11.32 percent which is much less than the target set bythe government. Bangladesh has less than 0.02 hectares of forest land per person, one of the lowest forest-man ratios in the world. Intensive afforestation and reforestation programme will improve the forest coveragefor meeting MDG targets.
Protected areas play an important role for conservation and for the protection of natural and culturalresources. The unique and biological fitness of protected areas provide economic, recreational, educational,scientific and spiritual benefits to man and serve as the gene bank of the more important flora and fauna.Currently, there are 19 Protected Areas (PAs) in Bangladesh covering an area of 2441.75 sq. km which is12.7 percent of the total forests areas of the country and about two percent of the country. It is recommendedthat PAs should be at lease five percent of the country's total area.
177MILLENNIUM DEVELOPMENT GOALS NEEDS ASSESSMENT AND COSTING (2009-2015) BANGLADESH
CHAPTER 7ENVIRONMENT
TARGET INDICATORSGOALBASE YEAR
1990-95 2006 TARGET2015
STATUS OFPROGRESS
GOAL 7ENSURE
ENVIRONMENTALSUSTAINABILITY
Target 9Integrate theprinciples ofsustainable developmentinto country policies andprogrammes and reversethe loss of environmentalresources.
Target 10Halve, by 2015, the proportion of people with sustainable access to safe drinking water and basic Sanitation
Target 11By 2020, have achieved a significant improvement in the lives of at least 100 million slum dwellers
NEEDSATTENTION
NEEDSATTENTION
NEEDSATTENTION
-
LOWEMISSION
ON TRACK
NEEDSATTENTION
ON TRACK
ON TRACK
-
NEEDSATTENTION
20.00
5.00
-
-
-
-
100
100
100
100
39.74
11.32
1.83
0.30
92.00
86.80
77.00
71.00
81.50
80.00
36.40
9.00
1.60
0.14
280.60
123.10
88.70
78.00
76.00
15.30
61.20
31.18
Proportion of land areacovered by forest
Carbon dioxide emissions(metric tons per capita)
Consumption of ozonedepleting CFCs
Energy use (kilogram oil equivalent)per USD1000 GDP(PPP)
Proportion of population usingsolid fuels
Proportion of the population with sustainable access to an improvedwater source
Proportion of the population withsustainable access to sanitarylatrines
Proportion of households withaccess to secure tenure
Proportion of protectedarea to surface area tomaintain biological diversity
rural
urban
rural
urban
155.14(2007)
MDG Goal 7 - Ensure Environmental SustainabilitySummary Statistics: MDG Goals, Targets, Indicators and Achievements
Government of Bangladesh has recently declared 8 areas as Ecologically Critical Area (ECA) underEnvironmental Conservation Act, 1995. DOE has designated six ECAs and has plans to designate severalmore from 2006. Over the next five years, the DOE will concentrate on assessing the need and priorities fordesignating and managing ECAs, and on defining a strategy for meeting these needs.
The primary source of the increased atmospheric concentration of CO2 since pre-industrial period is fromthe use of fossil fuels, with land use change providing another significant but smaller contribution. Emissionof CO2 was 0.141 Mt in 1990 and increased about 20 percent in 2000 and reaching to 0.30 Mt in 2007. Asa least developing country (LDC) Bangladesh DOEs not have any commitment for GHG reduction.Notwithstanding it's favorable position, sustained efforts are still being made to actively control major sourcesof CO2 emissions in order to mitigate the country's impact on global climate.
The major Ozone Depleting Substances dropped from 280.68 metric tons in 1995 to 155.14 metric tons in2007. The highest consumption (870.99 MT) of CFCs was recorded in 1997 which was reduced to 328.0 MtODS used in 2002. Consumption reduced sharply during 2000-2002 due to the implementation of ACIproject. However, implementation of 'CFC Free Technology Transfer' project (1998-2002) by ACI Ltd reducedthe highest limit consumption in the aerosol sector and reduced about 50 percent consumption of CFCs.Bangladesh undertook a good number of national policies and programmes to protect ozone layer at thenational and international level since 1994. The national ODS Phase-out Plan is being implemented by theDOE.
A major portion of the urban waste of Bangladesh is composed of organic materials, which produce methane(CH4) as they decompose. The contribution of methane to global warming is much higher than that of carbondioxide. Proper management of urban waste could thus be an important area for mitigation while ensuringa cleaner city. Some of the toxic and hazardous components of the wastes, particularly hospital andindustrial wastes while mixed with household garbage increase the risk of spread of diseases. Untreatedliquid garbage once dumped into the open water bodies destroys the fish habitat and some of it toxiccomponents may eventually go into the human food chain. Surface water pollution affects the health of poorpeople. Waterborne diseases are the major cause suffering for the poor people living in the rural and urbanareas. Surface water scarcity in the dry period, water logging, groundwater pollution by arsenic are somechallenges of water resource management.
Community based schemes help low income fishermen by creating employment and livelihood opportunitiesin backward and forward linkage activities, fingerling production, fish catching, processing, and marketing,these are all has particular significance for poverty reduction. Poor fishermen in Bangladesh aredisadvantaged by policies that favor powerful people capturing fishing rights.
Effective and equitable land use policy will the best possible use of land resources and delivery of landrelated services to people through modernized and efficient land administration. Land user's right willenhance preventing land degradation. Land zoning will also provide the security of lands for improvingenvironmental activates.
The poor families in urban towns live in slums, squatters' settlements in un-hygienic and unendurableenvironment. Basic services like pure drinking water, sanitation, footpaths, drainage are totally absent in theareas. The population density in the slums is 200 times greater than the usual density of Bangladesh.Despite the problems, migrants from rural areas continue to migrate to the cities. Currently there is no landtitle for slum dwellers. Government policies and environmental interventions must focus on reducing theincidences of environment related or environment conditioned poverty due to lack of access to resources orloss of livelihoods.
178 MILLENNIUM DEVELOPMENT GOALS NEEDS ASSESSMENT AND COSTING (2009-2015) BANGLADESH
CHAPTER 7
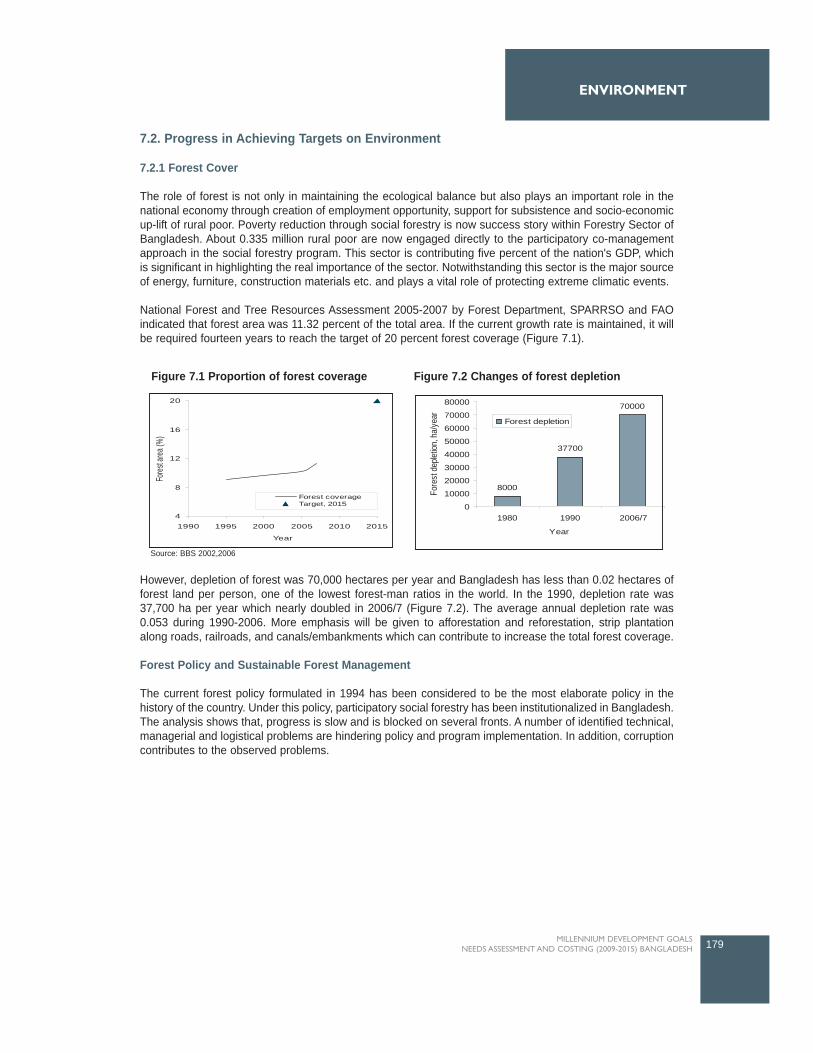
ENVIRONMENT
7.2. Progress in Achieving Targets on Environment
7.2.1 Forest Cover
The role of forest is not only in maintaining the ecological balance but also plays an important role in thenational economy through creation of employment opportunity, support for subsistence and socio-economicup-lift of rural poor. Poverty reduction through social forestry is now success story within Forestry Sector ofBangladesh. About 0.335 million rural poor are now engaged directly to the participatory co-managementapproach in the social forestry program. This sector is contributing five percent of the nation's GDP, whichis significant in highlighting the real importance of the sector. Notwithstanding this sector is the major sourceof energy, furniture, construction materials etc. and plays a vital role of protecting extreme climatic events.
National Forest and Tree Resources Assessment 2005-2007 by Forest Department, SPARRSO and FAOindicated that forest area was 11.32 percent of the total area. If the current growth rate is maintained, it willbe required fourteen years to reach the target of 20 percent forest coverage (Figure 7.1).
However, depletion of forest was 70,000 hectares per year and Bangladesh has less than 0.02 hectares offorest land per person, one of the lowest forest-man ratios in the world. In the 1990, depletion rate was37,700 ha per year which nearly doubled in 2006/7 (Figure 7.2). The average annual depletion rate was0.053 during 1990-2006. More emphasis will be given to afforestation and reforestation, strip plantationalong roads, railroads, and canals/embankments which can contribute to increase the total forest coverage.
Forest Policy and Sustainable Forest Management
The current forest policy formulated in 1994 has been considered to be the most elaborate policy in thehistory of the country. Under this policy, participatory social forestry has been institutionalized in Bangladesh.The analysis shows that, progress is slow and is blocked on several fronts. A number of identified technical,managerial and logistical problems are hindering policy and program implementation. In addition, corruptioncontributes to the observed problems.
179MILLENNIUM DEVELOPMENT GOALS NEEDS ASSESSMENT AND COSTING (2009-2015) BANGLADESH
4
8
12
16
20
1990 1995 2000 2005 2010 2015
Year
Fores
t area
(%)
Forest coverageTarget, 2015
8000
37700
70000
0
10000
20000
30000
40000
50000
60000
70000
80000
1980 1990 2006/7
Year
Fore
st d
eplet
ion, h
a/ye
ar Forest depletion
Figure 7.1 Proportion of forest coverage Figure 7.2 Changes of forest depletion
Source: BBS 2002,2006
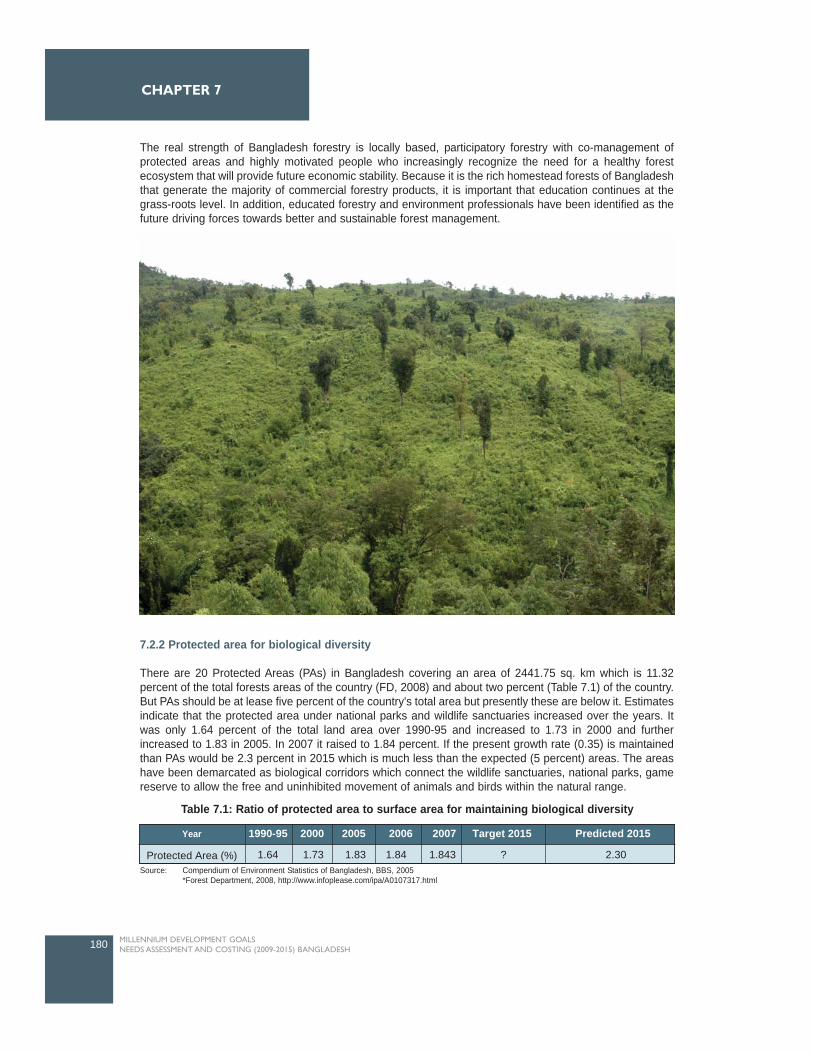
The real strength of Bangladesh forestry is locally based, participatory forestry with co-management ofprotected areas and highly motivated people who increasingly recognize the need for a healthy forestecosystem that will provide future economic stability. Because it is the rich homestead forests of Bangladeshthat generate the majority of commercial forestry products, it is important that education continues at thegrass-roots level. In addition, educated forestry and environment professionals have been identified as thefuture driving forces towards better and sustainable forest management.
7.2.2 Protected area for biological diversity
There are 20 Protected Areas (PAs) in Bangladesh covering an area of 2441.75 sq. km which is 11.32percent of the total forests areas of the country (FD, 2008) and about two percent (Table 7.1) of the country.But PAs should be at lease five percent of the country's total area but presently these are below it. Estimatesindicate that the protected area under national parks and wildlife sanctuaries increased over the years. Itwas only 1.64 percent of the total land area over 1990-95 and increased to 1.73 in 2000 and furtherincreased to 1.83 in 2005. In 2007 it raised to 1.84 percent. If the present growth rate (0.35) is maintainedthan PAs would be 2.3 percent in 2015 which is much less than the expected (5 percent) areas. The areashave been demarcated as biological corridors which connect the wildlife sanctuaries, national parks, gamereserve to allow the free and uninhibited movement of animals and birds within the natural range.
180 MILLENNIUM DEVELOPMENT GOALS NEEDS ASSESSMENT AND COSTING (2009-2015) BANGLADESH
CHAPTER 7
Year 1990-95 2000 2005 2006 2007 Target 2015 Predicted 2015
Protected Area (%) 2.30?1.8431.841.831.731.64
Table 7.1: Ratio of protected area to surface area for maintaining biological diversity
Source: Compendium of Environment Statistics of Bangladesh, BBS, 2005 *Forest Department, 2008, http://www.infoplease.com/ipa/A0107317.html
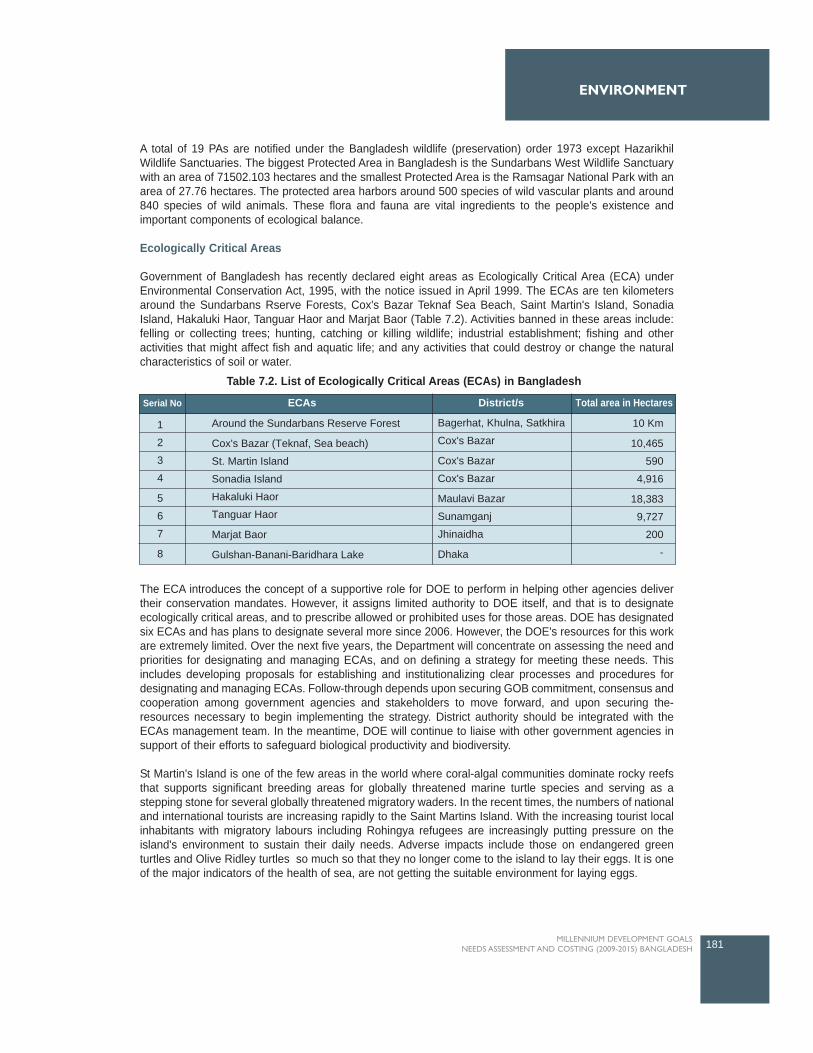
A total of 19 PAs are notified under the Bangladesh wildlife (preservation) order 1973 except HazarikhilWildlife Sanctuaries. The biggest Protected Area in Bangladesh is the Sundarbans West Wildlife Sanctuarywith an area of 71502.103 hectares and the smallest Protected Area is the Ramsagar National Park with anarea of 27.76 hectares. The protected area harbors around 500 species of wild vascular plants and around840 species of wild animals. These flora and fauna are vital ingredients to the people's existence andimportant components of ecological balance.
Ecologically Critical Areas
Government of Bangladesh has recently declared eight areas as Ecologically Critical Area (ECA) underEnvironmental Conservation Act, 1995, with the notice issued in April 1999. The ECAs are ten kilometersaround the Sundarbans Rserve Forests, Cox's Bazar Teknaf Sea Beach, Saint Martin's Island, SonadiaIsland, Hakaluki Haor, Tanguar Haor and Marjat Baor (Table 7.2). Activities banned in these areas include:felling or collecting trees; hunting, catching or killing wildlife; industrial establishment; fishing and otheractivities that might affect fish and aquatic life; and any activities that could destroy or change the naturalcharacteristics of soil or water.
The ECA introduces the concept of a supportive role for DOE to perform in helping other agencies delivertheir conservation mandates. However, it assigns limited authority to DOE itself, and that is to designateecologically critical areas, and to prescribe allowed or prohibited uses for those areas. DOE has designatedsix ECAs and has plans to designate several more since 2006. However, the DOE's resources for this workare extremely limited. Over the next five years, the Department will concentrate on assessing the need andpriorities for designating and managing ECAs, and on defining a strategy for meeting these needs. Thisincludes developing proposals for establishing and institutionalizing clear processes and procedures fordesignating and managing ECAs. Follow-through depends upon securing GOB commitment, consensus andcooperation among government agencies and stakeholders to move forward, and upon securing the-resources necessary to begin implementing the strategy. District authority should be integrated with theECAs management team. In the meantime, DOE will continue to liaise with other government agencies insupport of their efforts to safeguard biological productivity and biodiversity.
St Martin's Island is one of the few areas in the world where coral-algal communities dominate rocky reefsthat supports significant breeding areas for globally threatened marine turtle species and serving as astepping stone for several globally threatened migratory waders. In the recent times, the numbers of nationaland international tourists are increasing rapidly to the Saint Martins Island. With the increasing tourist localinhabitants with migratory labours including Rohingya refugees are increasingly putting pressure on theisland's environment to sustain their daily needs. Adverse impacts include those on endangered greenturtles and Olive Ridley turtles so much so that they no longer come to the island to lay their eggs. It is oneof the major indicators of the health of sea, are not getting the suitable environment for laying eggs.
181MILLENNIUM DEVELOPMENT GOALS NEEDS ASSESSMENT AND COSTING (2009-2015) BANGLADESH
ENVIRONMENT
Serial No ECAs District/s Total area in Hectares
1
2
3
4
5
6
7
8
Around the Sundarbans Reserve Forest
Cox's Bazar (Teknaf, Sea beach)
St. Martin Island
Sonadia Island
Hakaluki Haor
Tanguar Haor
Marjat Baor
Gulshan-Banani-Baridhara Lake
Bagerhat, Khulna, Satkhira
Cox's Bazar
Cox's Bazar
Cox's Bazar
Maulavi Bazar
Sunamganj
Jhinaidha
Dhaka
10 Km
10,465
590
4,916
18,383
9,727
200
-
Table 7.2. List of Ecologically Critical Areas (ECAs) in Bangladesh
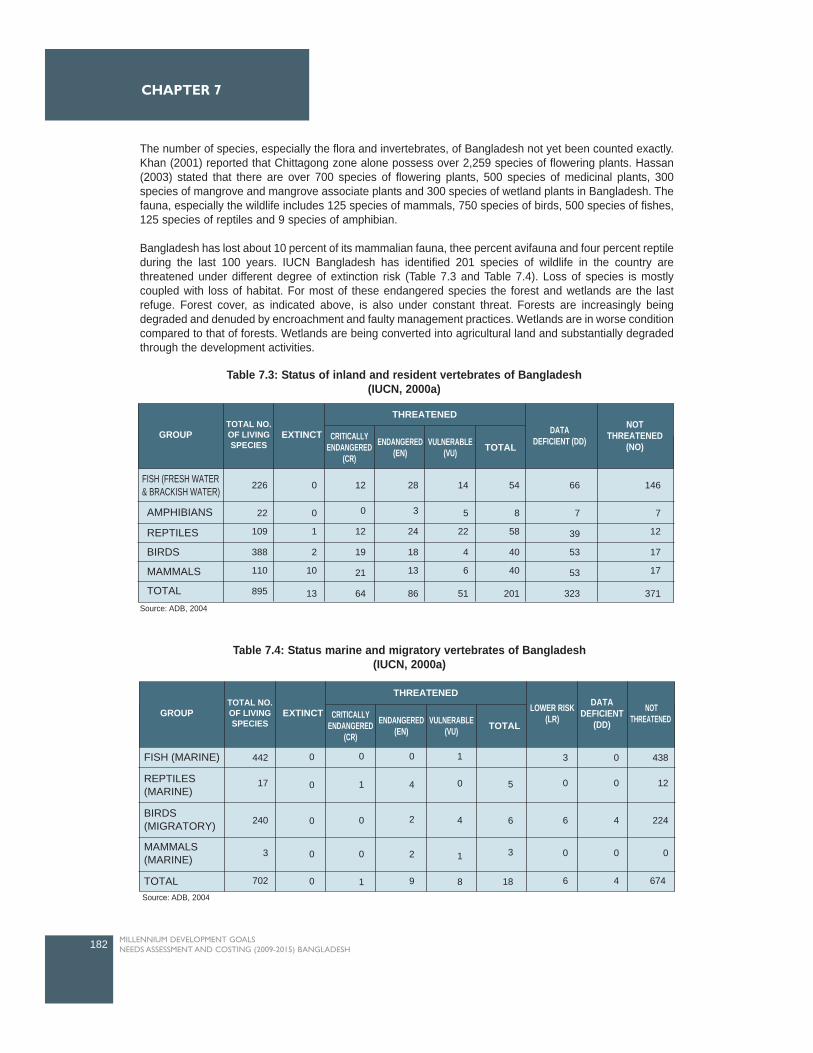
The number of species, especially the flora and invertebrates, of Bangladesh not yet been counted exactly.Khan (2001) reported that Chittagong zone alone possess over 2,259 species of flowering plants. Hassan(2003) stated that there are over 700 species of flowering plants, 500 species of medicinal plants, 300species of mangrove and mangrove associate plants and 300 species of wetland plants in Bangladesh. Thefauna, especially the wildlife includes 125 species of mammals, 750 species of birds, 500 species of fishes,125 species of reptiles and 9 species of amphibian.
Bangladesh has lost about 10 percent of its mammalian fauna, thee percent avifauna and four percent reptileduring the last 100 years. IUCN Bangladesh has identified 201 species of wildlife in the country arethreatened under different degree of extinction risk (Table 7.3 and Table 7.4). Loss of species is mostlycoupled with loss of habitat. For most of these endangered species the forest and wetlands are the lastrefuge. Forest cover, as indicated above, is also under constant threat. Forests are increasingly beingdegraded and denuded by encroachment and faulty management practices. Wetlands are in worse conditioncompared to that of forests. Wetlands are being converted into agricultural land and substantially degradedthrough the development activities.
182 MILLENNIUM DEVELOPMENT GOALS NEEDS ASSESSMENT AND COSTING (2009-2015) BANGLADESH
CHAPTER 7
GROUP
FISH (FRESH WATER& BRACKISH WATER)
TOTAL NO.OF LIVINGSPECIES
EXTINCT CRITICALLYENDANGERED
(CR)
ENDANGERED(EN)
VULNERABLE(VU) TOTAL
DATADEFICIENT (DD)
NOTTHREATENED
(NO)
226
22
109
388
110
895
0
0
1
2
10
13
12
0
12
19
21
64
28
3
24
18
13
86
14
5
22
4
6
51
54
8
58
40
40
201
66
7
39
53
53
323
146
7
12
17
17
371
THREATENED
AMPHIBIANS
REPTILES
BIRDS
MAMMALS
TOTAL
Table 7.3: Status of inland and resident vertebrates of Bangladesh (IUCN, 2000a)
Source: ADB, 2004
GROUP
FISH (MARINE)
REPTILES(MARINE)
BIRDS(MIGRATORY)
MAMMALS(MARINE)
TOTAL
TOTAL NO.OF LIVINGSPECIES
EXTINCT CRITICALLYENDANGERED
(CR)
ENDANGERED(EN)
VULNERABLE(VU) TOTAL
LOWER RISK(LR)
DATADEFICIENT
(DD)
NOTTHREATENED
442
17
240
3
702
3
0
6
0
6
0
0
4
0
4
438
12
224
0
674
0 0 0 1
0 5
6
3
18
4
1
8
1 4
2
2
91
0
0 0
00
0
THREATENED
Table 7.4: Status marine and migratory vertebrates of Bangladesh (IUCN, 2000a)
Source: ADB, 2004
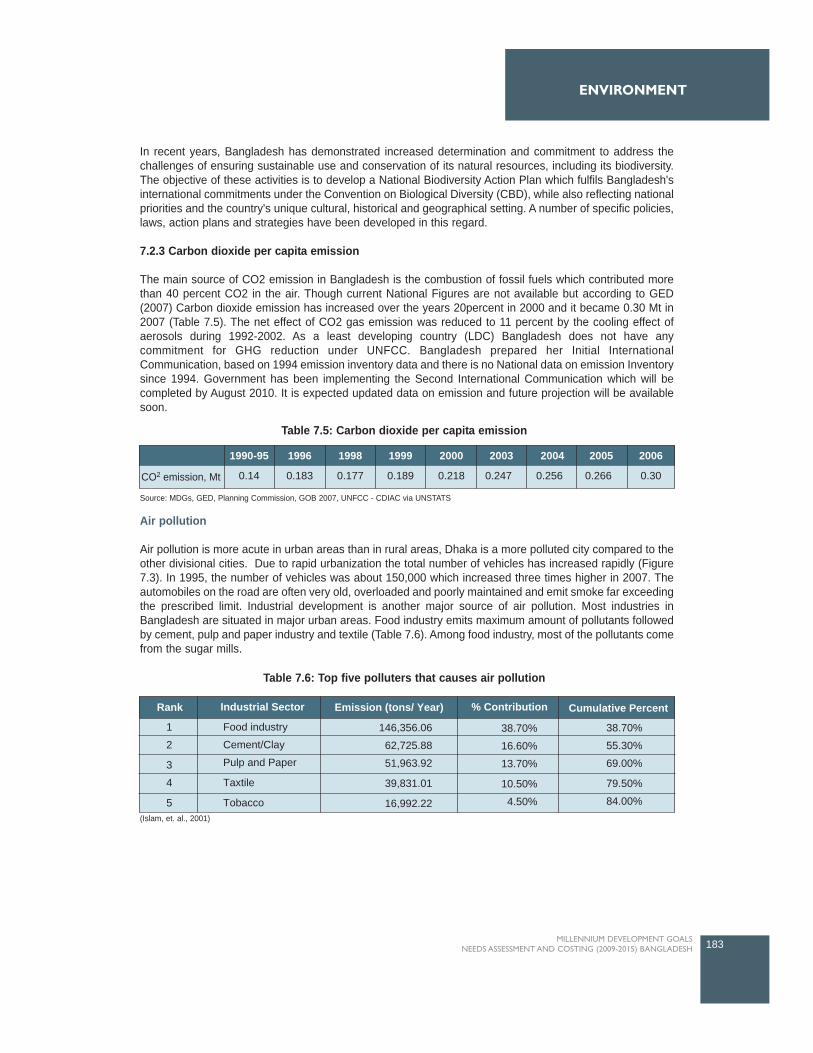
In recent years, Bangladesh has demonstrated increased determination and commitment to address thechallenges of ensuring sustainable use and conservation of its natural resources, including its biodiversity.The objective of these activities is to develop a National Biodiversity Action Plan which fulfils Bangladesh'sinternational commitments under the Convention on Biological Diversity (CBD), while also reflecting nationalpriorities and the country's unique cultural, historical and geographical setting. A number of specific policies,laws, action plans and strategies have been developed in this regard.
7.2.3 Carbon dioxide per capita emission
The main source of CO2 emission in Bangladesh is the combustion of fossil fuels which contributed morethan 40 percent CO2 in the air. Though current National Figures are not available but according to GED(2007) Carbon dioxide emission has increased over the years 20percent in 2000 and it became 0.30 Mt in2007 (Table 7.5). The net effect of CO2 gas emission was reduced to 11 percent by the cooling effect ofaerosols during 1992-2002. As a least developing country (LDC) Bangladesh does not have anycommitment for GHG reduction under UNFCC. Bangladesh prepared her Initial InternationalCommunication, based on 1994 emission inventory data and there is no National data on emission Inventorysince 1994. Government has been implementing the Second International Communication which will becompleted by August 2010. It is expected updated data on emission and future projection will be availablesoon.
Air pollution
Air pollution is more acute in urban areas than in rural areas, Dhaka is a more polluted city compared to theother divisional cities. Due to rapid urbanization the total number of vehicles has increased rapidly (Figure7.3). In 1995, the number of vehicles was about 150,000 which increased three times higher in 2007. Theautomobiles on the road are often very old, overloaded and poorly maintained and emit smoke far exceedingthe prescribed limit. Industrial development is another major source of air pollution. Most industries inBangladesh are situated in major urban areas. Food industry emits maximum amount of pollutants followedby cement, pulp and paper industry and textile (Table 7.6). Among food industry, most of the pollutants comefrom the sugar mills.
183MILLENNIUM DEVELOPMENT GOALS NEEDS ASSESSMENT AND COSTING (2009-2015) BANGLADESH
ENVIRONMENT
CO2 emission, Mt
1990-95
0.14 0.183 0.177 0.189 0.218 0.247 0.256 0.266 0.30
1996 1998 1999 2000 2003 2004 2005 2006
Table 7.5: Carbon dioxide per capita emission
Source: MDGs, GED, Planning Commission, GOB 2007, UNFCC - CDIAC via UNSTATS
Table 7.6: Top five polluters that causes air pollution
Rank
1
2
3
4
5
Industrial Sector Emission (tons/ Year) % Contribution Cumulative Percent
Food industry
Cement/Clay
Pulp and Paper
Taxtile
Tobacco
146,356.06
62,725.88
51,963.92
39,831.01
16,992.22
38.70%
16.60%
13.70%
10.50%
4.50%
38.70%
55.30%
69.00%
79.50%
84.00%(Islam, et. al., 2001)
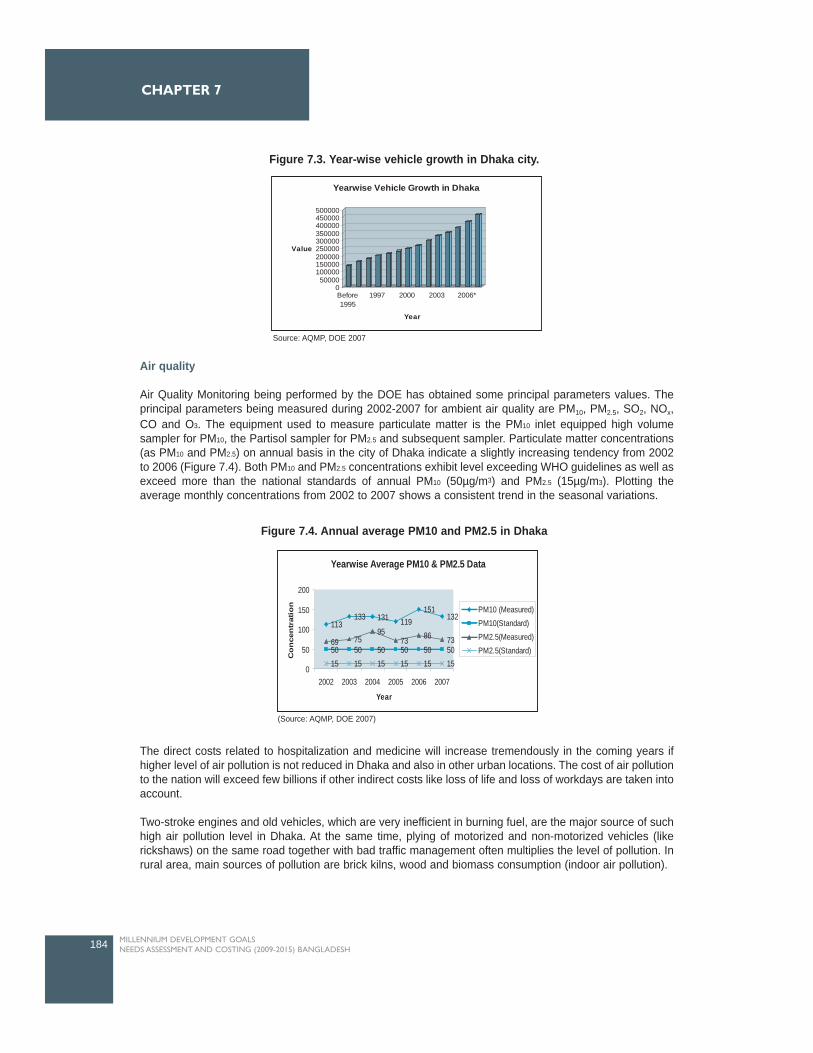
Air quality
Air Quality Monitoring being performed by the DOE has obtained some principal parameters values. Theprincipal parameters being measured during 2002-2007 for ambient air quality are PM10, PM2.5, SO2, NOx,CO and O3. The equipment used to measure particulate matter is the PM10 inlet equipped high volumesampler for PM10, the Partisol sampler for PM2.5 and subsequent sampler. Particulate matter concentrations(as PM10 and PM2.5) on annual basis in the city of Dhaka indicate a slightly increasing tendency from 2002to 2006 (Figure 7.4). Both PM10 and PM2.5 concentrations exhibit level exceeding WHO guidelines as well asexceed more than the national standards of annual PM10 (50µg/m3) and PM2.5 (15µg/m3). Plotting theaverage monthly concentrations from 2002 to 2007 shows a consistent trend in the seasonal variations.
The direct costs related to hospitalization and medicine will increase tremendously in the coming years ifhigher level of air pollution is not reduced in Dhaka and also in other urban locations. The cost of air pollutionto the nation will exceed few billions if other indirect costs like loss of life and loss of workdays are taken intoaccount.
Two-stroke engines and old vehicles, which are very inefficient in burning fuel, are the major source of suchhigh air pollution level in Dhaka. At the same time, plying of motorized and non-motorized vehicles (likerickshaws) on the same road together with bad traffic management often multiplies the level of pollution. Inrural area, main sources of pollution are brick kilns, wood and biomass consumption (indoor air pollution).
184 MILLENNIUM DEVELOPMENT GOALS NEEDS ASSESSMENT AND COSTING (2009-2015) BANGLADESH
CHAPTER 7
050000
100000150000200000250000300000350000400000450000500000
Value
Before1995
1997 2000 2003 2006*
Year
Yearwise Vehicle Growth in Dhaka
Figure 7.3. Year-wise vehicle growth in Dhaka city.
Source: AQMP, DOE 2007
Yearwise Average PM10 & PM2.5 Data
113133 131 119
151132
50 50 50 50 50 5069 75
9573 86 73
15 15 15 15 15 150
50
100
150
200
2002 2003 2004 2005 2006 2007
Year
Co
nce
ntr
atio
n PM10 (Measured)PM10(Standard)PM2.5(Measured)PM2.5(Standard)
Figure 7.4. Annual average PM10 and PM2.5 in Dhaka
(Source: AQMP, DOE 2007)
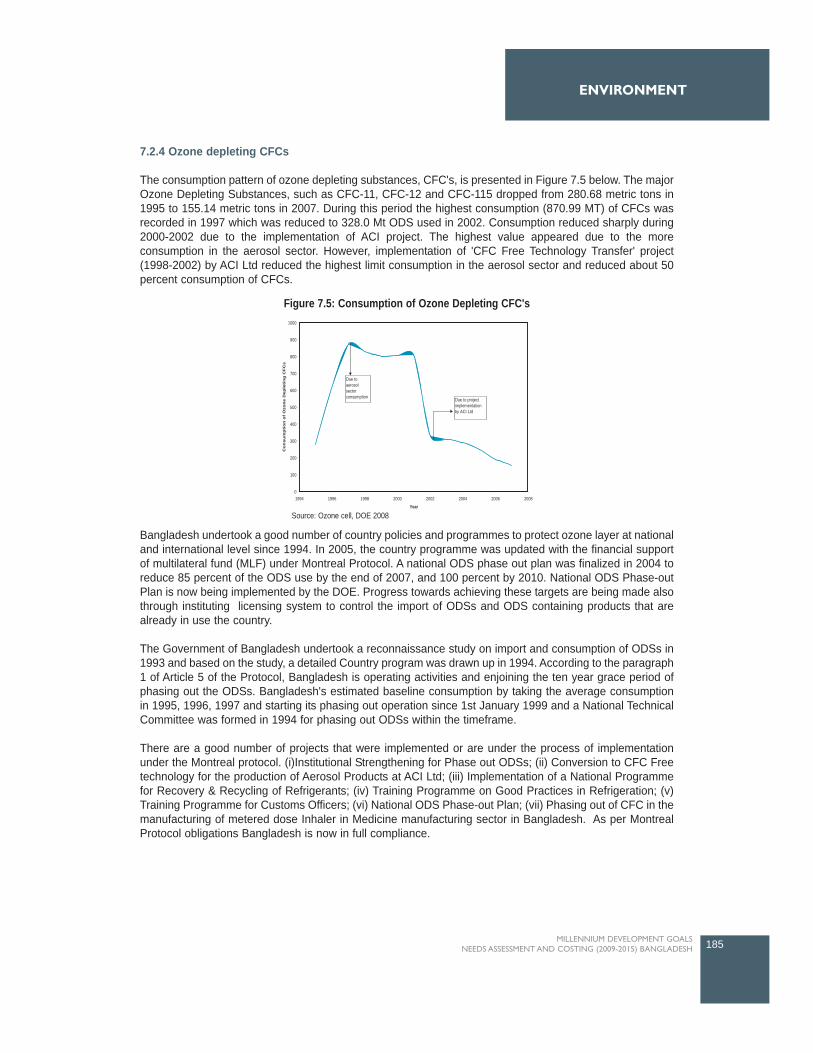
7.2.4 Ozone depleting CFCs
The consumption pattern of ozone depleting substances, CFC's, is presented in Figure 7.5 below. The majorOzone Depleting Substances, such as CFC-11, CFC-12 and CFC-115 dropped from 280.68 metric tons in1995 to 155.14 metric tons in 2007. During this period the highest consumption (870.99 MT) of CFCs wasrecorded in 1997 which was reduced to 328.0 Mt ODS used in 2002. Consumption reduced sharply during2000-2002 due to the implementation of ACI project. The highest value appeared due to the moreconsumption in the aerosol sector. However, implementation of 'CFC Free Technology Transfer' project(1998-2002) by ACI Ltd reduced the highest limit consumption in the aerosol sector and reduced about 50percent consumption of CFCs.
Bangladesh undertook a good number of country policies and programmes to protect ozone layer at nationaland international level since 1994. In 2005, the country programme was updated with the financial supportof multilateral fund (MLF) under Montreal Protocol. A national ODS phase out plan was finalized in 2004 toreduce 85 percent of the ODS use by the end of 2007, and 100 percent by 2010. National ODS Phase-outPlan is now being implemented by the DOE. Progress towards achieving these targets are being made alsothrough instituting licensing system to control the import of ODSs and ODS containing products that arealready in use the country.
The Government of Bangladesh undertook a reconnaissance study on import and consumption of ODSs in1993 and based on the study, a detailed Country program was drawn up in 1994. According to the paragraph1 of Article 5 of the Protocol, Bangladesh is operating activities and enjoining the ten year grace period ofphasing out the ODSs. Bangladesh's estimated baseline consumption by taking the average consumptionin 1995, 1996, 1997 and starting its phasing out operation since 1st January 1999 and a National TechnicalCommittee was formed in 1994 for phasing out ODSs within the timeframe.
There are a good number of projects that were implemented or are under the process of implementationunder the Montreal protocol. (i)Institutional Strengthening for Phase out ODSs; (ii) Conversion to CFC Freetechnology for the production of Aerosol Products at ACI Ltd; (iii) Implementation of a National Programmefor Recovery & Recycling of Refrigerants; (iv) Training Programme on Good Practices in Refrigeration; (v)Training Programme for Customs Officers; (vi) National ODS Phase-out Plan; (vii) Phasing out of CFC in themanufacturing of metered dose Inhaler in Medicine manufacturing sector in Bangladesh. As per MontrealProtocol obligations Bangladesh is now in full compliance.
185MILLENNIUM DEVELOPMENT GOALS NEEDS ASSESSMENT AND COSTING (2009-2015) BANGLADESH
ENVIRONMENT
Figure 7.5: Consumption of Ozone Depleting CFC's
Source: Ozone cell, DOE 2008
0
100
200
300
400
500
600
700
800
900
1000
1994 1996 1998 2000 2002 2004 2006 2008
Year
Co
nsu
mp
tio
n o
f O
zon
e D
eple
tin
g C
FC
s
Due to project implementation by ACI Ltd
Due to aerosol sector consumption
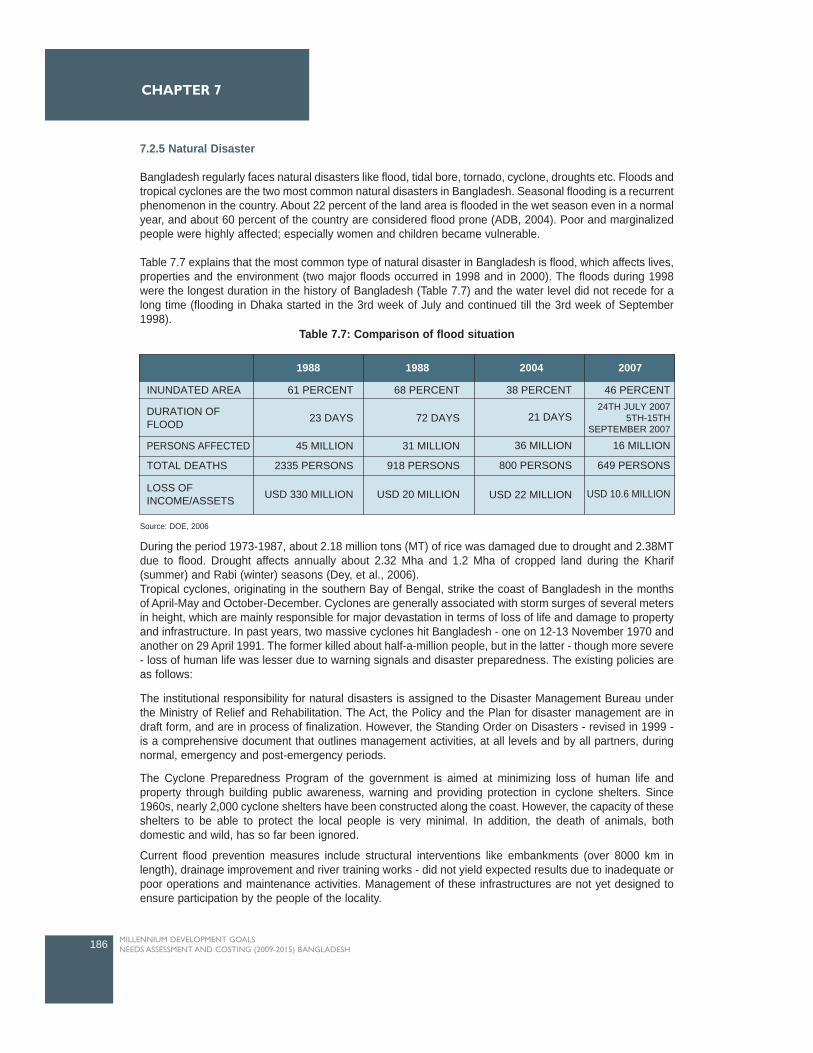
7.2.5 Natural Disaster
Bangladesh regularly faces natural disasters like flood, tidal bore, tornado, cyclone, droughts etc. Floods andtropical cyclones are the two most common natural disasters in Bangladesh. Seasonal flooding is a recurrentphenomenon in the country. About 22 percent of the land area is flooded in the wet season even in a normalyear, and about 60 percent of the country are considered flood prone (ADB, 2004). Poor and marginalizedpeople were highly affected; especially women and children became vulnerable.
Table 7.7 explains that the most common type of natural disaster in Bangladesh is flood, which affects lives,properties and the environment (two major floods occurred in 1998 and in 2000). The floods during 1998were the longest duration in the history of Bangladesh (Table 7.7) and the water level did not recede for along time (flooding in Dhaka started in the 3rd week of July and continued till the 3rd week of September1998).
During the period 1973-1987, about 2.18 million tons (MT) of rice was damaged due to drought and 2.38MTdue to flood. Drought affects annually about 2.32 Mha and 1.2 Mha of cropped land during the Kharif(summer) and Rabi (winter) seasons (Dey, et al., 2006).Tropical cyclones, originating in the southern Bay of Bengal, strike the coast of Bangladesh in the monthsof April-May and October-December. Cyclones are generally associated with storm surges of several metersin height, which are mainly responsible for major devastation in terms of loss of life and damage to propertyand infrastructure. In past years, two massive cyclones hit Bangladesh - one on 12-13 November 1970 andanother on 29 April 1991. The former killed about half-a-million people, but in the latter - though more severe- loss of human life was lesser due to warning signals and disaster preparedness. The existing policies areas follows:
The institutional responsibility for natural disasters is assigned to the Disaster Management Bureau underthe Ministry of Relief and Rehabilitation. The Act, the Policy and the Plan for disaster management are indraft form, and are in process of finalization. However, the Standing Order on Disasters - revised in 1999 -is a comprehensive document that outlines management activities, at all levels and by all partners, duringnormal, emergency and post-emergency periods.
The Cyclone Preparedness Program of the government is aimed at minimizing loss of human life andproperty through building public awareness, warning and providing protection in cyclone shelters. Since1960s, nearly 2,000 cyclone shelters have been constructed along the coast. However, the capacity of theseshelters to be able to protect the local people is very minimal. In addition, the death of animals, bothdomestic and wild, has so far been ignored.
Current flood prevention measures include structural interventions like embankments (over 8000 km inlength), drainage improvement and river training works - did not yield expected results due to inadequate orpoor operations and maintenance activities. Management of these infrastructures are not yet designed toensure participation by the people of the locality.
186 MILLENNIUM DEVELOPMENT GOALS NEEDS ASSESSMENT AND COSTING (2009-2015) BANGLADESH
CHAPTER 7
1988 1988 2004 2007
INUNDATED AREA 61 PERCENT 68 PERCENT 38 PERCENT 46 PERCENT
21 DAYS24TH JULY 2007
5TH-15THSEPTEMBER 2007
36 MILLION 16 MILLION
800 PERSONS 649 PERSONS
USD 22 MILLION USD 10.6 MILLION
23 DAYS 72 DAYS
45 MILLION 31 MILLION
2335 PERSONS 918 PERSONS
USD 330 MILLION USD 20 MILLION
TOTAL DEATHS
PERSONS AFFECTED
DURATION OFFLOOD
LOSS OFINCOME/ASSETS
Table 7.7: Comparison of flood situation
Source: DOE, 2006
The Flood Forecasting and Warning Centre (established in 1972) of the BWDB that collect rainfall and waterlevel data and provide flood forecasts is yet to deliver the results to the public. In this, accuracy in forecastingand dissemination of information are essential ingredients for their success.
One of the tectonic faults passes through Bangladesh increasing the risk of earthquake. At the same time,construction of high-rise buildings in the cities has increased risk of damages (both human life and cost ofproperty damages) due to an earthquake. The government cannot ignore this any more and should considerthe following actions:
Construction of cyclone shelters should receive priority with the aim to provide protection to at least80 percent of the high-risk population in an area. The recommendations of the MultipurposeCyclone Shelter Plan of 1992 can provide directions for implementation.All shelters must be equipped with facilities to provide a decent living for the people duringdisasters. Government shall take steps to review existing flood protection embankments for the shortcomingsand inadequacies and take measures to remove them.To manage the flood protection and irrigation infrastructure, an appropriate management structureshall be developed so that it guarantees public participation both in selecting locations for any newembankment as well as in sharing the costs of its operations.The 1998 flood has shown the weakness in the current structural protection plan of Dhaka city.Consequently, embankments in all major and secondary towns to prevent urban flooding must bemaintained and water level within the protected area must be monitored to prevent any futuredisasters. At the same time, the eastern side of Dhaka City shall be protected to reduce damagesof properties and resources. An embankment along the Balu river is, therefore, recommended. Recent floods have shown the inherent weakness of our existing flood forecasting system. It is notpossible for people to understand the true picture of the flood from the existing warning messages.Consequently, it is strongly recommended that localized flood-warning languages be used to alertpeople on the upcoming floods. Government should authorize local governments to monitor compliance of building codes duringconstructions to minimize life and property damages during a earthquake. Government should actively consider introducing a 'disaster insurance scheme' to prevent asudden collapse of the economy in case of a natural disaster. This will help the government toquickly rebuild the economy after disasters.
Vulnerability and Adaptation to Climate Change
Bangladesh is extremely susceptible to the impacts of natural disasters such as frequent tropical cyclonesand climate-related vulnerabilities. As a result, the coastal belt and its connected riverbanks are at seriousrisk due to their geographical locations. The coastal area is ecologically sensitive and climatically vulnerable,due to the continuous process of land accretion and erosion. In addition, current global climatic change isexpected to result in loss of human habitation and destruction of coastal resources through rising sea levelsNumerous environmental, cultural and socio-economic problems are predominant in the area due to water-logging, salinity intrusion, river siltation, and reduction in the agricultural production are increasing povertyand social conflicts.Coastal Zone Management and Sustainability
The coastal zone of Bangladesh is highly fertile and characterized by rich biodiversity and natural resources- both renewable and non-renewable. The world largest mangrove forest, the Sundarbans, is an importantworld heritage area situated in this coastal system. Recently, coastal Bangladesh has also attractedinternational attention for its high potential of inshore and offshore natural gas, minerals, aquaculture, foodavailability, tourism industry and tidal power. However this zone is extremely susceptible to the impacts ofnatural disasters such as frequent tropical cyclones and climate-related disturbances such as sea level riseand loss of habitable land mass and vulnerability to natural disasters. As a result, the coastal belt and itsconnected riverbanks are at serious risk due to their geographical locations. The coastal area is ecologicallysensitive and climatically vulnerable due to the continuous process of land accretion and erosion. In addition,
187MILLENNIUM DEVELOPMENT GOALS NEEDS ASSESSMENT AND COSTING (2009-2015) BANGLADESH
ENVIRONMENT
current global climatic change is expected to result in loss of human habitation and destruction of coastalresources through increasing sea levels. Thus the inhabitants of coastal areas are under threat. Themanagement systems of coastal resources are also not well organised.
Coastal Bangladesh consists of 19 districts that comprises of 2.85 million hectares (7.6 million acres) in areaand is 200 km in length (120 miles) including about 148,000 square km of crisscrossed watercourses of themighty rivers - Padma, Jamuna, Meghna and Karnophuli and with a 710 km long coastline. Since 1974, thecoastal area has also been expanded to include an exclusive economic zone (EEZ) of 200 nautical milesthat reaches the edge of the continental shelf. This is now under the economic jurisdiction of the country forexploration, exploitation, conservation and management of its living and non-living resources.
Bangladesh has made its initial steps as to build on present achievements and develop further initiativessuch as promotion of an enabling institutional environment, supporting continued efforts in the process ofestablishing ICZM in Bangladesh (as specified in the Coastal Zone Policy (CZP) and Coastal DevelopmentStrategy (CDS)), coordinate the implementation of the CZP, CDS and the Priority Investment Program (PIP)especially for the issues of climate change, monitoring and assess PIP and knowledge management andsocial communication. An integration of tidal power into coastal development offers potential benefits ineconomic, social and environmental improvement by involving local people through community-based co-management. In the integrated coastal development process, multi-sectoral activities would contribute to thesustainable livelihood of the communities, where tidal power would help to improve and modernise theeconomy of the coastal community through integration of aquaculture, livestock, poultry, agriculture, publichealth, and micro-credit systems.
Impact of Climate change
The impact of climate change is a serious risk to poverty reduction and threatens to undo decades ofdevelopment efforts. As the Johannesburg Declaration on Sustainable Development states, "the adverseeffects of climate change are already evident, natural disasters are more frequent and more devastating anddeveloping countries more vulnerable". While climate change is a global phenomenon, its negative impactsare more severely felt by poor people and poor countries like Bangladesh. Bangladesh is more vulnerablebecause of its high dependence on natural resources, and its limited capacity to cope with climate variabilityand extremes. Experience suggests that the best way to address climate change impacts on the poor is byintegrating adaptation responses along with the mitigation measures into development planning.
Adaptation Measures for Climate Change Impacts
As climate change is a global problem, so all countries must work to reduce their greenhouse gas emissionsand learn how to cope with the impacts of climate change. Bangladesh, however, have relatively smallgreenhouse gas emissions, so mitigation is less important for her. Adaptation is more relevant for poorernations because of its relative vulnerability to the impacts of climate change, which stems partly fromgeographic location funnel shaped Bay of Bengal's locations and the tidal affected areas of flood-pronecoastal Bangladesh. As a developing country, Bangladesh's adaptive capacity is also lower than that ofdeveloped countries because of its limited financial resources, skills and technologies and high levels ofpoverty. Reliance on climate sensitive sectors such as agriculture and fishing is also high.
The Intergovernmental Panel on Climate Change (IPCC) recognizes Bangladesh as one of the mostvulnerable to climatic variability and change because of multiple stresses, such as poverty, and its lowadaptive capacity. Actions should aim to reduce the vulnerability of a system (such as a city) or population(such as a coastal village) to the negative impacts of anticipated human-induced climate change. Adaptationto climate variability involves taking action to reduce vulnerability to short-term climate shocks. Oftenadaptation to climate variability will also result in adaptation to climate change. Adaptation activities can beof different types, from the purely technological (such as sea defense construction), to behavioral (such asshifts in choice of food or recreation), managerial (such as changes in farming methods) and policy (such as
188 MILLENNIUM DEVELOPMENT GOALS NEEDS ASSESSMENT AND COSTING (2009-2015) BANGLADESH
CHAPTER 7
planning regulations). Climate risk assessment needs to be incorporated into development activities by allof relevant professionals.
The IPCC states that in Bangladesh, agricultural production, including access to food, is projected to beseverely compromised by climate variability and change. Adaptation activities include using drought-resistant crops, introducing new farming techniques and diversifying income sources. As climate-relateddisasters such as floods, cyclones and droughts are recurring problems for Bangladesh, early warningsystems along with institutional plans are of crucial important. Some are quite successful (such as thecyclone warning system in Bangladesh), but many are inefficient and unlikely to be able to cope with futuredisasters exacerbated by climate change. Strengthening national and local capacity in disaster risk reductionand disaster management by working with existing structures is thus a precursor for the disastermanagement in Bangladesh.
This is fundamental to achieve the Millennium Development Goals (MGDs), including the over-arching goalof halving extreme poverty by 2015, and sustaining progress beyond 2015. Climate change is now verymuch a reality, and for the poorest of the poor the implications are particularly daunting. These often remoteor marginalized Bangladesh communities are so burdened they will struggle to meet the coming challenges.Adaptation - learning to cope with rising temperature and other effects of climate change - is a difficult butessential task for these vulnerable millions.
7.2.6 Solid Waste Management
With the high density of population and continued urban migration of more people, the task of managingsolid waste has become a monumental challenge for major urban center like Dhaka, Khulna, Chittagong,Rajshahi etc. The present system (i.e., run by the Dhaka City Corporation), is inefficient and unsatisfactory.Everyday the population of DCC area produces 3,200-3,500 tons of garbage and only 42 percent of this iscollected by DCC and disposed of in open landfill site. Solid waste management in the slum areas in thethree urban areas, like Narayangong, Chittagong and Kustia are deplorable with only 27.1 percent solidwaste being managed (UN-Habitat, 2007).
Collection of household garbage by the city corporations and the municipalities are insufficient and so a largepercentage (often more than 50 percent) of the garbage is left on city streets. These eventually find their wayinto the city drainage lines and in the sewage system and are responsible for water logging in many cities.Organic and inorganic garbages are not separated at source and the dumping in the landfill sites isbecoming risky as the possibility of groundwater contamination increases. Some of the toxic and hazardouscomponents of the wastes, particularly hospital and industrial wastes while mixed with household garbageincrease the risk of spread of diseases. Untreated liquid garbage once dumped into the open water bodiesdestroys the fish habitats and some of it toxic components may eventually end up in the human food chain.
However, some success in the collection of household wastes should be noted. These are mainlyadministered by local residents, organized local communities or associations, and also some NGOs.Success in this area should be capitalized and efforts should be duplicated in other areas. The Kalabaganmethod of waste collection from households and the work of Waste Concerns are some examples whereprivate and voluntary institutions were successful in building a 'clean neighborhood'.
To deal with the problem of waste management, following actions are suggested:Separation of toxic / hazardous components of hospital / industrial waste for appropriate treatmentand hospital wastes should be disposed-off using environmentally safe technology.All industries, new or existing, should have their respective ETPs constructed and running.Introduce area-based primary collection from households by NGOs and Community organizationsin all built-up residential areas.Promote recycling and resource recovery both at the industrial level and at the household level.Promote secondary collection and transportation of garbage by private and voluntary organizations.Establish Sanitary landfill sites.
189MILLENNIUM DEVELOPMENT GOALS NEEDS ASSESSMENT AND COSTING (2009-2015) BANGLADESH
ENVIRONMENT
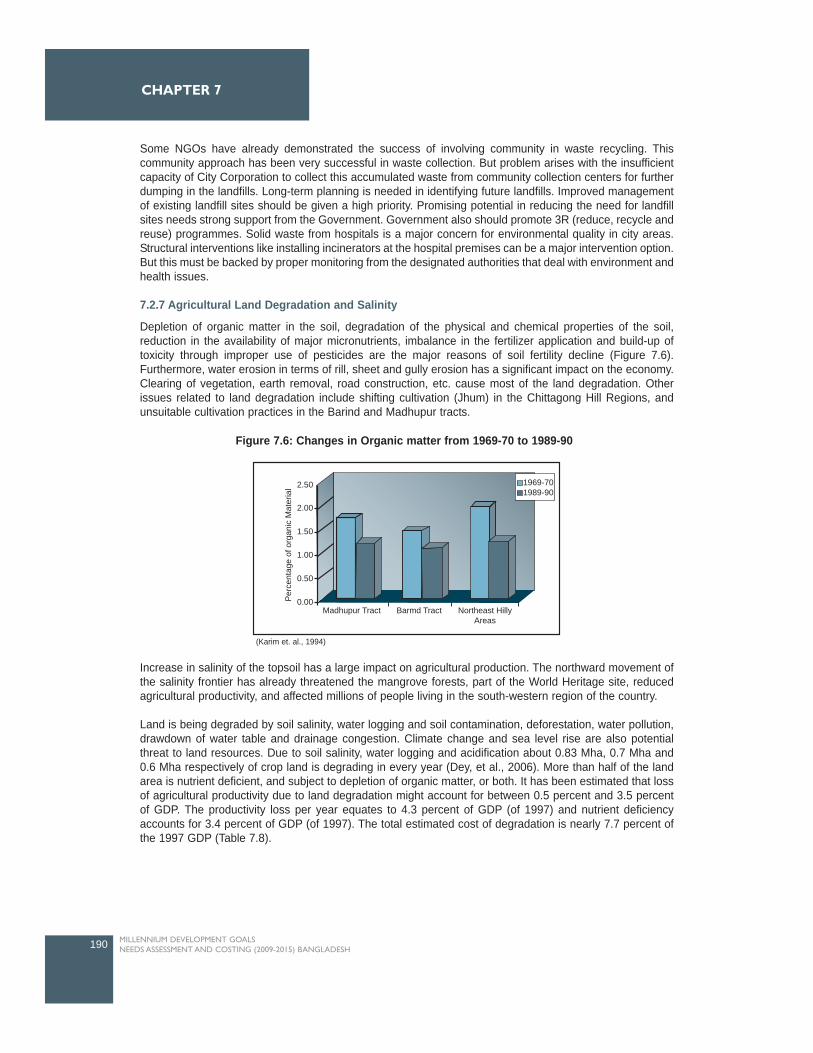
Some NGOs have already demonstrated the success of involving community in waste recycling. Thiscommunity approach has been very successful in waste collection. But problem arises with the insufficientcapacity of City Corporation to collect this accumulated waste from community collection centers for furtherdumping in the landfills. Long-term planning is needed in identifying future landfills. Improved managementof existing landfill sites should be given a high priority. Promising potential in reducing the need for landfillsites needs strong support from the Government. Government also should promote 3R (reduce, recycle andreuse) programmes. Solid waste from hospitals is a major concern for environmental quality in city areas.Structural interventions like installing incinerators at the hospital premises can be a major intervention option.But this must be backed by proper monitoring from the designated authorities that deal with environment andhealth issues.
7.2.7 Agricultural Land Degradation and Salinity
Depletion of organic matter in the soil, degradation of the physical and chemical properties of the soil,reduction in the availability of major micronutrients, imbalance in the fertilizer application and build-up oftoxicity through improper use of pesticides are the major reasons of soil fertility decline (Figure 7.6).Furthermore, water erosion in terms of rill, sheet and gully erosion has a significant impact on the economy.Clearing of vegetation, earth removal, road construction, etc. cause most of the land degradation. Otherissues related to land degradation include shifting cultivation (Jhum) in the Chittagong Hill Regions, andunsuitable cultivation practices in the Barind and Madhupur tracts.
Increase in salinity of the topsoil has a large impact on agricultural production. The northward movement ofthe salinity frontier has already threatened the mangrove forests, part of the World Heritage site, reducedagricultural productivity, and affected millions of people living in the south-western region of the country.
Land is being degraded by soil salinity, water logging and soil contamination, deforestation, water pollution,drawdown of water table and drainage congestion. Climate change and sea level rise are also potentialthreat to land resources. Due to soil salinity, water logging and acidification about 0.83 Mha, 0.7 Mha and0.6 Mha respectively of crop land is degrading in every year (Dey, et al., 2006). More than half of the landarea is nutrient deficient, and subject to depletion of organic matter, or both. It has been estimated that lossof agricultural productivity due to land degradation might account for between 0.5 percent and 3.5 percentof GDP. The productivity loss per year equates to 4.3 percent of GDP (of 1997) and nutrient deficiencyaccounts for 3.4 percent of GDP (of 1997). The total estimated cost of degradation is nearly 7.7 percent ofthe 1997 GDP (Table 7.8).
190 MILLENNIUM DEVELOPMENT GOALS NEEDS ASSESSMENT AND COSTING (2009-2015) BANGLADESH
CHAPTER 7
2.50
2.00
1.50
1.00
0.50
0.00Per
cent
age
of o
rgan
ic M
ater
ial
Madhupur Tract Northeast HillyAreas
Barmd Tract
1969-70 1989-90
Figure 7.6: Changes in Organic matter from 1969-70 to 1989-90
(Karim et. al., 1994)
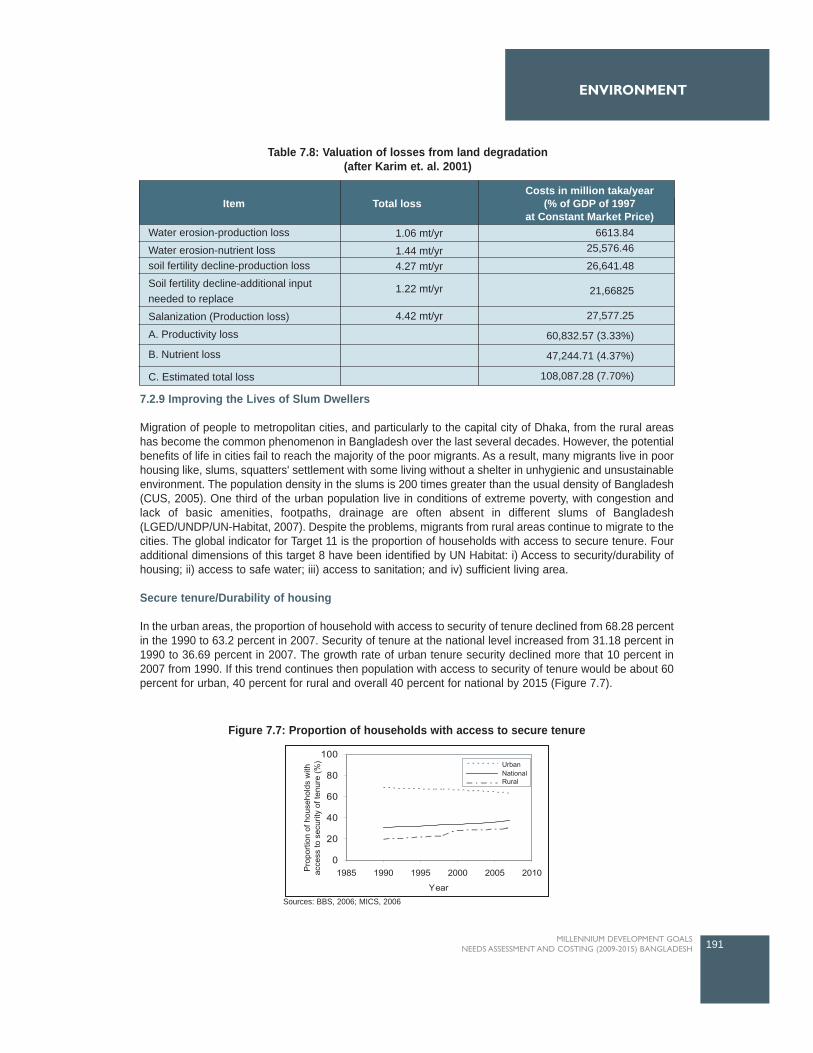
7.2.9 Improving the Lives of Slum Dwellers
Migration of people to metropolitan cities, and particularly to the capital city of Dhaka, from the rural areashas become the common phenomenon in Bangladesh over the last several decades. However, the potentialbenefits of life in cities fail to reach the majority of the poor migrants. As a result, many migrants live in poorhousing like, slums, squatters' settlement with some living without a shelter in unhygienic and unsustainableenvironment. The population density in the slums is 200 times greater than the usual density of Bangladesh(CUS, 2005). One third of the urban population live in conditions of extreme poverty, with congestion andlack of basic amenities, footpaths, drainage are often absent in different slums of Bangladesh(LGED/UNDP/UN-Habitat, 2007). Despite the problems, migrants from rural areas continue to migrate to thecities. The global indicator for Target 11 is the proportion of households with access to secure tenure. Fouradditional dimensions of this target 8 have been identified by UN Habitat: i) Access to security/durability ofhousing; ii) access to safe water; iii) access to sanitation; and iv) sufficient living area.
Secure tenure/Durability of housing
In the urban areas, the proportion of household with access to security of tenure declined from 68.28 percentin the 1990 to 63.2 percent in 2007. Security of tenure at the national level increased from 31.18 percent in1990 to 36.69 percent in 2007. The growth rate of urban tenure security declined more that 10 percent in2007 from 1990. If this trend continues then population with access to security of tenure would be about 60percent for urban, 40 percent for rural and overall 40 percent for national by 2015 (Figure 7.7).
191MILLENNIUM DEVELOPMENT GOALS NEEDS ASSESSMENT AND COSTING (2009-2015) BANGLADESH
ENVIRONMENT
Item
Water erosion-production loss
Water erosion-nutrient losssoil fertility decline-production loss
Soil fertility decline-additional inputneeded to replace
Salanization (Production loss)
A. Productivity loss
B. Nutrient loss
C. Estimated total loss
1.06 mt/yr
1.44 mt/yr4.27 mt/yr
1.22 mt/yr
4.42 mt/yr
Costs in million taka/year(% of GDP of 1997
at Constant Market Price)Total loss
6613.8425,576.46
26,641.48
21,66825
27,577.25
60,832.57 (3.33%)
47,244.71 (4.37%)
108,087.28 (7.70%)
Table 7.8: Valuation of losses from land degradation(after Karim et. al. 2001)
Figure 7.7: Proportion of households with access to secure tenure
Sources: BBS, 2006; MICS, 2006
Bangladesh currently has no clear-cut policy for urban management. The Local Partnerships for UrbanPoverty Alleviation Project of LGED/UNDP/UN-Habitat during 1996-2006 has improved communityempowerment especially women and strong partnerships between the local government and communitiesin some areas of Bangladesh.
Tenure Insecurity
Evictions of slums on government land are a common event. A study conducted by Center for Urban studies(CUS, 2005) found of the 9,048 slums, 6.5 percent experienced one or more evictions in their presentlocation or were currently under the threat of eviction (Table 7.9). It must be emphasized, however, that thisprovides only a partial indication of the extent of eviction.
To assure household security, it requires agreement of the landowner to at least ten years security of tenure.It is not clear however that communities recognize this as sufficient security to risk investment of their owncapital and savings in improving their housing as seen in other Asian cities (LGED/UNDP/UN-Habitat, 2007).Indeed, when questioned why families were not investing in improved shelter, the common response wasthat this may be wasted investment if they are required to move.
The income status of different urban sites households describes in Table 7.10. It is found that householdincomes were to be less than BDT 5000 per month. The highest percentage was found within the range ofBDT. 2001-3000.
192 MILLENNIUM DEVELOPMENT GOALS NEEDS ASSESSMENT AND COSTING (2009-2015) BANGLADESH
CHAPTER 7
NONE
ONCE
TWICE/MORE
95.50
1.40
1.90
1.20
0.00
100.00
89.60
2.80
1.90
5.70
0.00
100.00
82.50
5.00
6.00
6.50
0.00
100.00
91.10
-
6.90
2.00
0.00
100.00
98.90
0.50
0.10
0.40
0.00
100.00
94.90
1.70
3.10
0.30
0.30
100.00
93.50
1.70
2.40
2.40
0.00
100.00
EVICTIONINCIDENCE DHAKA KHULNA SYLHET BARISAL ALL
CITIESRAJSHAHICHITTAGONG
DON'T KNOW
TOTAL
CURRENTLY UNDEREVICTION THREAT
<2000
2001-3000
3001-4000
4001-5000
>5000
TOTAL
0
4
4
0
1
9
0.00
44.40
44.40
0.00
11.10
100.00
1
3
3
0
3
10
10.00
30.00
3.00
0.00
30.00
100.00
2
4
30
1
0
9
22.20
44.40
2.00
11.10
0.00
100.00
3
11
9
1
4
28
10.70
39.30
32.10
3.50
14.30
100.00
% % %INCOME RANGE(BDT/MONTH ) CHITTAGONGNARAYANGANJ KUSTIA TOTAL %
Table 7.9: Threat of Eviction: Tenure Insecurity(% of clusters)
Table 7.10: Income group
Source: LGED/UNDP/UN-Habitat, 2007
Source: CUS, 2005
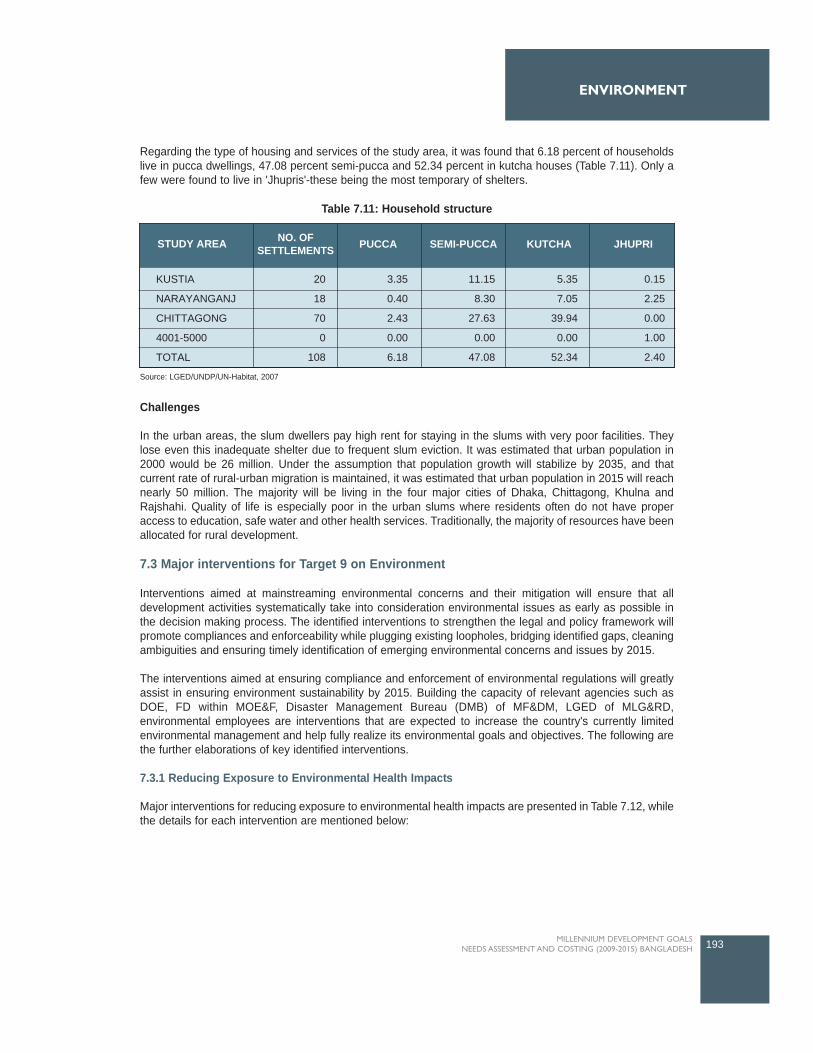
Regarding the type of housing and services of the study area, it was found that 6.18 percent of householdslive in pucca dwellings, 47.08 percent semi-pucca and 52.34 percent in kutcha houses (Table 7.11). Only afew were found to live in 'Jhupris'-these being the most temporary of shelters.
Challenges
In the urban areas, the slum dwellers pay high rent for staying in the slums with very poor facilities. Theylose even this inadequate shelter due to frequent slum eviction. It was estimated that urban population in2000 would be 26 million. Under the assumption that population growth will stabilize by 2035, and thatcurrent rate of rural-urban migration is maintained, it was estimated that urban population in 2015 will reachnearly 50 million. The majority will be living in the four major cities of Dhaka, Chittagong, Khulna andRajshahi. Quality of life is especially poor in the urban slums where residents often do not have properaccess to education, safe water and other health services. Traditionally, the majority of resources have beenallocated for rural development.
7.3 Major interventions for Target 9 on Environment
Interventions aimed at mainstreaming environmental concerns and their mitigation will ensure that alldevelopment activities systematically take into consideration environmental issues as early as possible inthe decision making process. The identified interventions to strengthen the legal and policy framework willpromote compliances and enforceability while plugging existing loopholes, bridging identified gaps, cleaningambiguities and ensuring timely identification of emerging environmental concerns and issues by 2015.
The interventions aimed at ensuring compliance and enforcement of environmental regulations will greatlyassist in ensuring environment sustainability by 2015. Building the capacity of relevant agencies such asDOE, FD within MOE&F, Disaster Management Bureau (DMB) of MF&DM, LGED of MLG&RD,environmental employees are interventions that are expected to increase the country's currently limitedenvironmental management and help fully realize its environmental goals and objectives. The following arethe further elaborations of key identified interventions.
7.3.1 Reducing Exposure to Environmental Health Impacts
Major interventions for reducing exposure to environmental health impacts are presented in Table 7.12, whilethe details for each intervention are mentioned below:
193MILLENNIUM DEVELOPMENT GOALS NEEDS ASSESSMENT AND COSTING (2009-2015) BANGLADESH
ENVIRONMENT
STUDY AREA
KUSTIA
NARAYANGANJ
CHITTAGONG
4001-5000
TOTAL
20
18
70
0
108
3.35
0.40
2.43
0.00
6.18
11.15
8.30
27.63
0.00
47.08
5.35
7.05
39.94
0.00
52.34
0.15
2.25
0.00
1.00
2.40
NO. OFSETTLEMENTS PUCCA SEMI-PUCCA KUTCHA JHUPRI
Table 7.11: Household structure
Source: LGED/UNDP/UN-Habitat, 2007
a. Water Quality Monitoring
Increase the numbers of water quality monitoring system to identify and monitor water qualitystandardsWater pollution is a major problem in most parts of Bangladesh. The nature of the problem varies betweenregions and locations. For example, major urban water pollution is linked with disposal of untreated industrialwastes in the rivers and lakes and major rural water pollution is linked with open-air latrine by the rivers andlakes. Surface water pollution affects the health of poor people who cannot afford to choose betweencontaminated and non-contaminated sources. Waterborne diseases are the major cause suffering for thepoor people living in the rural and urban areas. It is necessary to effectively monitor the surface water aswell as ground water sources to protect poor people from health affect. There are 30 water quality monitoringsystems are working in DOE. It is expected that additional 30 WQM systems will be added by 2015. Sixtytrained staff are working for water quality monitoring, it is expected that the number of staff will be 200 in thecoming days by 2015.
b. Air Quality Monitoring
Increase the numbers of air quality monitoring system for identify and monitor air quality standardsOutdoor air pollution has been a major problem in all most of the cities of Bangladesh, especially in Dhaka.Air pollution in Dhaka is a serious health problem, which is growing worse as the population and number ofvehicles keep rising. Recently, the pollution level had reduced significantly due to the introduction of lead-free gasoline in Bangladesh. However, the emission of lead has increased due to gasoline and totalsuspended particulate matter (SPM) levels are 4 to 8 times higher than the Bangladesh standard of 200µg/m3. The causes of air pollution are rise in vehicular traffic and increase in population density. In the ruralarea, main sources are brick kilns and wood and biomass. To identify the source of pollution, it is thereforenecessary to increase AQM systems as well as more trained staff for implementation. Acceptance TestProcedure (ATP) should be running in each industry. There are five air quality monitoring (AQM) systemsare working all over Bangladesh. It is expected that additional six AQM systems will be increased by 2015.At present, there are 35 trained staffs working for AQM all over Bangladesh, it is expected that additional 85air quality monitoring system will be added with the present numbers.
c. Reducing CO2 emission
Inter Dhaka train service
Population is increasing tremendously in Dhaka city day by day. Vehicular traffic is a common phenomenonin Dhaka which increases air pollution. There no inter rail service in Dhaka. Mono rail service can reduce airpollution as well as traffic jam in Dhaka. At least two train services are necessary to reduce air pollution aswell as traffic jam.
Alternative fuel- compressed natural gas (CNG)
To avoid health risks for millions of people, there is no alternative than switching to 'cleaner' fuel. In thisregard, Bangladesh is fortunate as CNG is a cleaner fuel compared to other imported fuels. It is expectedthat within the next five to six years, all light vehicles will be converted into CNG system, and foruninterrupted supply of gas to these vehicles more CNG stations will be planned.
d. Chemicals standard Monitoring
Pesticides use, which was on an average 3,850 metric tons annually during 1973-1990, has graduallyincreased to a record consumption of 25,443 metric tons in 2005. Rising use of pesticides has led to fearsof adverse health consequences and of water contamination. Furthermore, many studies have documenteduse of low quality and banned pesticides in the agricultural sector field which poses a serious threat to theenvironment. It is an urgent need to increase monitoring activities to identify pesticides standard. The
194 MILLENNIUM DEVELOPMENT GOALS NEEDS ASSESSMENT AND COSTING (2009-2015) BANGLADESH
CHAPTER 7
Department of Agricultural Extension has a monitoring unit to identify pesticides quality standard. It isexpected that additional four pesticides quality monitoring units will be set-up in divisional cities.
e. Management of urban waste
A major portion of the urban waste of Bangladesh is composed of organic materials, which produce methane(CH4) as they decompose. The unit contribution of methane to global warming is much higher than that ofcarbon dioxide. Methane could be captured for subsequent use or waste could be incinerated to produceelectricity. Proper management of urban waste could thus be an important area for mitigation while ensuringa cleaner city. Furthermore, the lowered emissions could be traded in the carbon market. Promote CDM inwaste management sector. All industries, new and existing, should have their respective ETPs constructedand running. Promotion of 3R (reduce, reuse, recycling) through policy development, capacity-building,awareness-raising and technological interventions can be effective modern action for waste management.
Increase the number of waste collection vehicles and equipment
Current waste collection vehicles and equipments are not sufficient and not environment friendly to collectand transport the solid waste in the divisional cities, highest shortage of vehicles and equipments in Dhakacity. Currently, 890 vehicles and equipments (trucks, container carriers & containers) are being used forcollecting waste and transport to all cities, with highest numbers (790 vehicles and equipments) in Dhakacity. It is expected that additional 210 vehicles and equipments will be added by 2015 when no waste will bekept on roads or dumped in drainage canals.
Community based primary collection
Introduce area-based primary collection from the households by NGOs and Community organizations in allbuilt-up residential areas. At present 280 CBOs are working for collecting waste from door to door. It isexpected that an additional 320 CBOs will be working by 2015.
Composting
Composting can enhance the life of landfill by reducing the volume of waste. The dumping site at Matuail,will, within a year's time be filled up. Composting can create new jobs for the poor unemployed labour forcein the city. There is heavy demand for compost by the farmers because organic matter depletion from soil inrural areas demands replenishment. About 82.90 percent of soils in Bangladesh have less than 3.5 percentorganic matter. Composting can reduce green house gas and attract investments from developed countries.Recently the first Composting Clean Development Mechanism (CDM) project has become operational in thecountry. There are about 30 composting plants presently working in Bangladesh. It is expected thatadditional 170 composting plants will be installed by 2015.
Sanitary landfill
Dhaka has only two landfill sites, one is Matuail and other is in Amin Bazar, Boliumpur, Dhaka. There is nosanitary landfill site in the other five divisional cities. It is very important to develop at least five sanitarylandfills in the other five divisional cities.
Recycling programs
Recycling involves processing used materials into new products in order to prevent waste of potentiallyuseful materials, reduce the consumption of fresh raw materials, reduce energy usage, reduce air pollution(from incineration) and water pollution (from landfills) by reducing the need for "conventional" wastedisposal, and lower greenhouse gas emissions. Recycling is a key component of modern wastemanagement and is the third component of the "3R" waste hierarchy. There are more than four recyclingprograms are being used for recycling of waste in Bangladesh. It is expected additional ten recyclingprograms would be started by 2015.
195MILLENNIUM DEVELOPMENT GOALS NEEDS ASSESSMENT AND COSTING (2009-2015) BANGLADESH
ENVIRONMENT
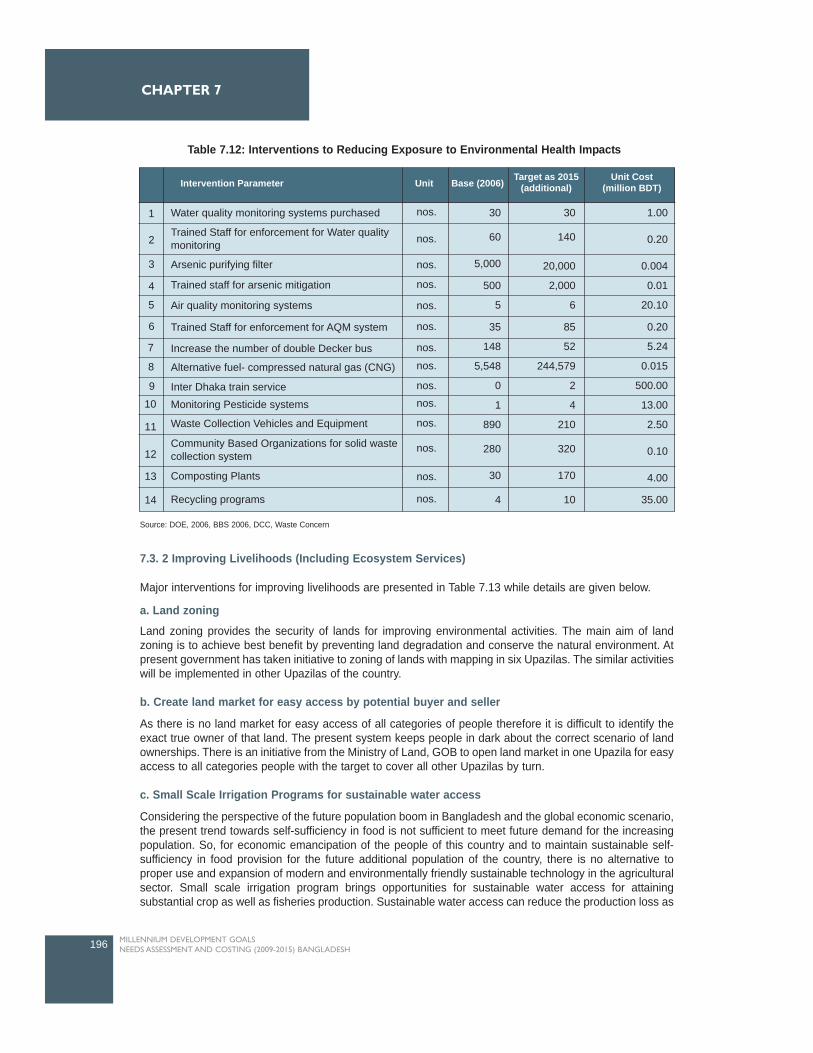
7.3. 2 Improving Livelihoods (Including Ecosystem Services)
Major interventions for improving livelihoods are presented in Table 7.13 while details are given below.
a. Land zoning
Land zoning provides the security of lands for improving environmental activities. The main aim of landzoning is to achieve best benefit by preventing land degradation and conserve the natural environment. Atpresent government has taken initiative to zoning of lands with mapping in six Upazilas. The similar activitieswill be implemented in other Upazilas of the country.
b. Create land market for easy access by potential buyer and seller
As there is no land market for easy access of all categories of people therefore it is difficult to identify theexact true owner of that land. The present system keeps people in dark about the correct scenario of landownerships. There is an initiative from the Ministry of Land, GOB to open land market in one Upazila for easyaccess to all categories people with the target to cover all other Upazilas by turn.
c. Small Scale Irrigation Programs for sustainable water access
Considering the perspective of the future population boom in Bangladesh and the global economic scenario,the present trend towards self-sufficiency in food is not sufficient to meet future demand for the increasingpopulation. So, for economic emancipation of the people of this country and to maintain sustainable self-sufficiency in food provision for the future additional population of the country, there is no alternative toproper use and expansion of modern and environmentally friendly sustainable technology in the agriculturalsector. Small scale irrigation program brings opportunities for sustainable water access for attainingsubstantial crop as well as fisheries production. Sustainable water access can reduce the production loss as
196 MILLENNIUM DEVELOPMENT GOALS NEEDS ASSESSMENT AND COSTING (2009-2015) BANGLADESH
CHAPTER 7
2
3
4
30
60
5,000
500
5
35
148
5,548
0
1
890
280
30
4
30
140
20,000
2,000
6
85
52
244,579
2
4
210
320
170
10
1.00
0.20
0.004
0.01
20.10
0.20
5.24
0.015
500.00
13.00
2.50
0.10
4.00
35.00
Intervention Parameter Unit Base (2006) Target as 2015(additional)
Unit Cost(million BDT)
Water quality monitoring systems purchased 1 nos.
nos.
nos.
nos.
nos.
nos.
nos.
nos.
nos.nos.
nos.
nos.
nos.
nos.
Trained Staff for enforcement for Water qualitymonitoring
Trained staff for arsenic mitigation
Arsenic purifying filter
Air quality monitoring systems
Trained Staff for enforcement for AQM system
Increase the number of double Decker bus
Alternative fuel- compressed natural gas (CNG)
Inter Dhaka train serviceMonitoring Pesticide systems
Waste Collection Vehicles and Equipment
Community Based Organizations for solid wastecollection system
Composting Plants
Recycling programs
11
12
13
14
5
6
7
8
9
10
Table 7.12: Interventions to Reducing Exposure to Environmental Health Impacts
Source: DOE, 2006, BBS 2006, DCC, Waste Concern
well as adverse environmental conditions. At present ten small scale irrigation projects are beingimplemented all over Bangladesh. It is expected that the number will be increased to 50 by 2015.
d. Participatory Irrigation Management Program
Participatory approaches to irrigation through the exchange of best practices, lessons learned, trainingmaterials and networking among professionals, researchers, policy makers and farmers is important. Properirrigation water management may allow irrigation of additional land with the same volume of water andprovide a remarkable increase in crop yield. The increased crop yields may contribute to the reduction inhunger and poverty in rural Bangladesh. Bangladesh can save USD 8,962 million annually which is one-sixthof total annual budget of fiscal year 2003/4 if irrigation is managed properly (Dey et al., 2006b). This type ofprogram is being implemented in 71 Upazilas, it is expected this program will be extend to 120 Upazilas by2015.
e. Climate resilience seeds
Drought affects annually about 2.32 Mha and 1.2 Mha of cropped land during the Kaharfi (summer)(November to June) and Rabi (winter) (July to October) seasons respectively (Sajjan et al., 2002), while soilsalinity, water logging and acidification affect 3.05 Mha, 0.7 Mha and 0.6 Mha of crop land, respectively(BARC, 2000) in the country. During the period of 1973-87, about 2.18 million tons of rice was damaged dueto drought -the corresponding loss was 2.38 million tons due to flood (Paul, 1995). Bangladesh RiceResearch Institute (BRRI) has developed ten varieties (for Salt tolerant: BRRI Dhan 40, 41, 47; Droughttolerant: BRRI Dhan 42, 43; Saline prone: BRRI Dhan 10, 23, 30; Cold tolerant: BRRI Dhan: 26, 27) inadverse situation after a long research work of 15-20 years. It is expected that five more varieties would bedeveloped by 2015.
f. Forests and Biological Diversity: sustainable management that benefits poor people
From the situation analysis it can be seen that the actual forest coverage is much less than the target set bythe government. The similar situation has appeared in case of protected areas which is less that thestandard value. Many interventions have been suggested to improve forest coverage to reach target of 20percent. Suggested interventions for forest and biological diversity for sustainable management that benefitspoor people are explained in Table 7.13. The present investments in forestry sector are explained in thefollowing aspects as cross-cutting issues of environment, under mainstream funding:
Co-managed forest initiatives for benefiting poor people
Co-managed forestry is a benefit sharing scheme in which the landless and the marginal farmers areemployed in tree plantation work. Today's forests are evolving toward the dynamic, economic, integrated,diverse and shared forests of tomorrow. To a large extent, tomorrow's forests will be those of private andcommunity initiative. Tomorrow's forests will be everywhere-in farmer's fields, in fallows, on roadsides, incompounds, and on hillsides and degraded lands. The aim of the co-managed forest is to protect the forestsinvolving local people for sustainable management that benefits poor. At present there are five co-managedforest initiatives (in five PAs) that have been implemented. It is expected that 14 more initiatives will beimplemented by 2015.
Pro-poor forest and wild life management plans
Develop and implement forestry and wildlife management plans with stakeholders, especially poor residents.At present there are nine management plans have implemented and it is expected that 35 plans will beimplemented by 2015.
Pro-poor timber and NTFP value addition schemes
The value addition schemes will give support to poor people for maintaining their daily requirements by
197
ENVIRONMENT
MILLENNIUM DEVELOPMENT GOALS NEEDS ASSESSMENT AND COSTING (2009-2015) BANGLADESH

selling the value added products like, toys, furniture, flower branch, etc in the market from timber and nontimber forest products. Currently there is no such scheme in Bangladesh but it is expected that FD willimplement a scheme like to benefit the poor.
Pro-poor nature tourism initiatives for benefiting poor peopleThe aim of the nature tourism initiatives is to benefit poor through employment, local purchasing andentrance fees etc. There are 28 pro-poor nature tourism initiatives already working in the field. It is expectedthat 40 more initiatives will be implemented by 2015.
Afforestation and reforestation programme
Forestry is an important way to sequester carbon. In addition, the afforestation and reforestation of degradedland contributes to food security by providing fruits and other edible products; energy security by providingfuel wood; livelihood security by employing people in forest plantations; harvesting and trade in forestproducts; and can protect land from soil erosion and landslides, particularly in hilly areas. Afforestation andreforestation thus address multiple needs. The programme needs to be divided into several sub-programmes. Currently forest coverage is ten percent of total area which is half the targeted coverage. Thereis a pressing need to increase forest coverage with sufficient technological support. Following are someareas that can increase the forest coverage:
Timber and non timber forest product development
51,800 hectares of forest plantations lands are covered by timber and non-timber forest. It is expected thatthe total areas of timber and non timber forest will be 9,720 hectares by 2015.
Strip plantation
The total length of strip plantations along roads, railroads, and canals/embankments is 49,500 km which isexpected to be increased to 74,500 km by 2015.
Coastal belt afforestation
For the coastal belt, selection of species will be a major concern. As salinity is expected to increase withrising sea levels, emphasis should be given to saline tolerant species. For freshwater wetlands, suitablesubmergence tolerant species such as Hijol (Pongamia pinnata) and Coroch (Baringtonia actangula), whichcan also protect against wave erosion, could be used. Currently, the area of the coastal belt afforestation is160,000 ha and it is expected that additional 5,000 ha will be increased by 2015.
Biodiversity protectionBiodiversity in Bangladesh is significant. Like other sectors of Bangladesh ecology, the diverse biologicalresources are also threatened by human activity. Forest area is already is a small proportion of the total landarea and is being depleted by the combined pressure from timber extraction, encroachment by expanded byagricultural activities and by the land grabbers. Medicinal, food & fodder and indigenous plants have beentinned out significantly in the recent years and will be extended in the coming days. 50 ha of medicinal andindigenous pants were planted by 2006. It is expected that massive plantation will be taken by FD to reach5,000 ha of medicinal & indigenous plants by 2015.
Increase the number of co-managed Protected Areas (PAs)Protected Areas (PAs) in Bangladesh cover about two percent of the country's total area. But PAs should beat least five percent of the country's total area. The unique and biological fitness of protected areas provideeconomic, recreational, educational, scientific and spiritual benefits to man and serve as the gene bank ofthe more important flora and fauna. The PAs have been demarcated as biological corridors which connectthe wildlife sanctuaries, national parks, game reserve to allow the free and uninhibited movement of animalsand birds within the natural range. At present number of protected areas is five which is expected to increase25 by 2015.
Trained staff enforcement
There is a great shortage of trained staff in most of the sectors for sustainable environment. It is necessaryof trained staff enforcement in each sector for efficiently performing task.
198 MILLENNIUM DEVELOPMENT GOALS NEEDS ASSESSMENT AND COSTING (2009-2015) BANGLADESH
CHAPTER 7
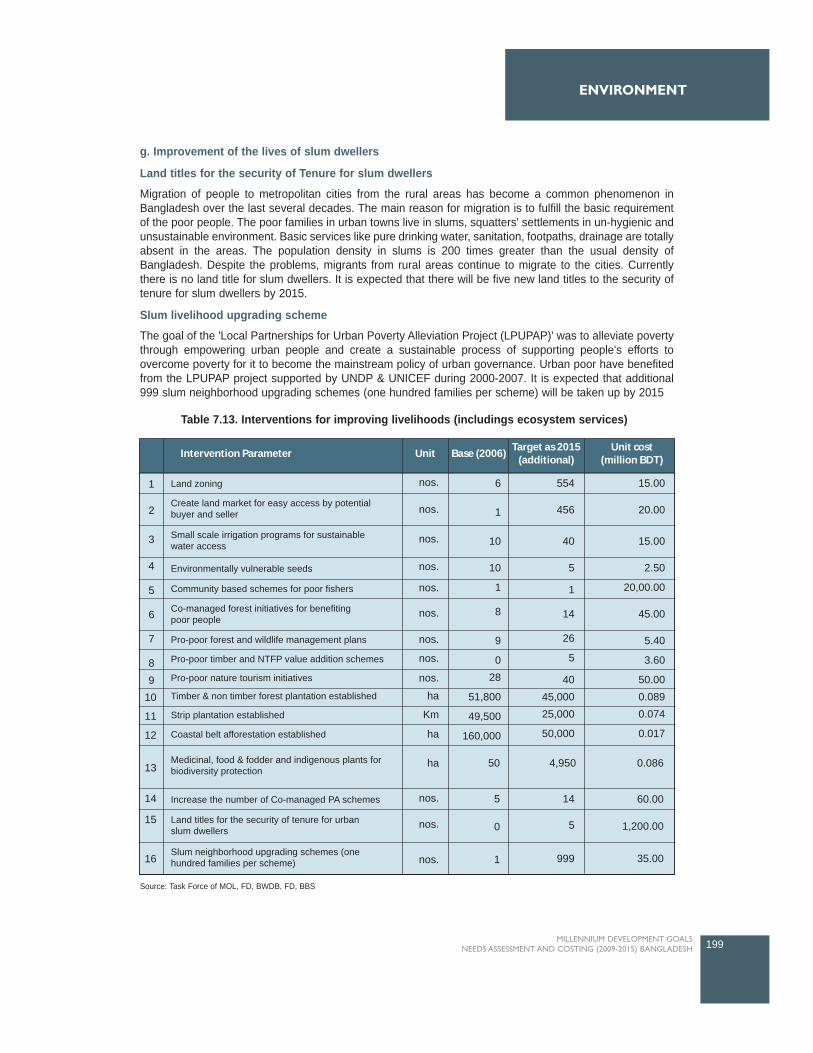
g. Improvement of the lives of slum dwellers
Land titles for the security of Tenure for slum dwellers
Migration of people to metropolitan cities from the rural areas has become a common phenomenon inBangladesh over the last several decades. The main reason for migration is to fulfill the basic requirementof the poor people. The poor families in urban towns live in slums, squatters' settlements in un-hygienic andunsustainable environment. Basic services like pure drinking water, sanitation, footpaths, drainage are totallyabsent in the areas. The population density in slums is 200 times greater than the usual density ofBangladesh. Despite the problems, migrants from rural areas continue to migrate to the cities. Currentlythere is no land title for slum dwellers. It is expected that there will be five new land titles to the security oftenure for slum dwellers by 2015.
Slum livelihood upgrading scheme
The goal of the 'Local Partnerships for Urban Poverty Alleviation Project (LPUPAP)' was to alleviate povertythrough empowering urban people and create a sustainable process of supporting people's efforts toovercome poverty for it to become the mainstream policy of urban governance. Urban poor have benefitedfrom the LPUPAP project supported by UNDP & UNICEF during 2000-2007. It is expected that additional999 slum neighborhood upgrading schemes (one hundred families per scheme) will be taken up by 2015
199MILLENNIUM DEVELOPMENT GOALS NEEDS ASSESSMENT AND COSTING (2009-2015) BANGLADESH
ENVIRONMENT
Table 7.13. Interventions for improving livelihoods (includings ecosystem services)
Source: Task Force of MOL, FD, BWDB, FD, BBS
2
3
4
5
6
7
8 9
6
1
10
10
1
8
9
028
51,800
49,500
160,000
554
456
40
5
1
14
26
5
4045,00025,000
50,000
15.00
20.00
15.00
2.50
20,00.00
45.00
5.40
3.60
50.000.0890.074
0.017
Intervention Parameter Unit Base (2006)Target as 2015
(additional)Unit cost
(million BDT)
Land zoning1 nos.
nos.
nos.
nos.
nos.
nos.
nos.
nos.
nos.
nos.
nos.
nos. 1
0
5 14
5
999 35.00
1,200.00
60.00
ha
Km
ha
ha 50 4,950 0.086
Create land market for easy access by potentialbuyer and seller
Small scale irrigation programs for sustainablewater access
Environmentally vulnerable seeds
Community based schemes for poor fishers
Co-managed forest initiatives for benefitingpoor people
Pro-poor forest and wildlife management plans
Pro-poor timber and NTFP value addition schemes
Pro-poor nature tourism initiatives
Timber & non timber forest plantation established
Strip plantation established
Coastal belt afforestation established
Medicinal, food & fodder and indigenous plants forbiodiversity protection
Increase the number of Co-managed PA schemes
Land titles for the security of tenure for urbanslum dwellers
Slum neighborhood upgrading schemes (onehundred families per scheme)
10
11
12
13
14
15
16
7.3.3 Reducing vulnerability through capacity and Investment for Climate Adaptation & Disastermanagement
Major interventions for reducing vulnerability through capacity and investment for climate adaptation &disaster management are presented in Table 7.16 while details are given below.
Capacity development for climate adaptation
Development of adequate human capacity to effectively manage climate resilient development programmesand to take part in international negotiations. Adequately trained people do not currently exist in the countryto develop and implement climate change policies, programmes and projects. Due to this lack of expertise,Bangladesh has been unable to grasp opportunities to effectively use new global financial instruments. Also,climate change negotiations have now entered a phase where constant tracking and decision making atshort notice are required. While Bangladesh has so far been in the forefront of such negotiations, she hasoften been unable to take part fully because of a shortage of exhaustive information in key areas. The AWG-LCA negotiations need expertise of the highest order. Available expertise is neither adequate nor always ofthe right type. It is therefore necessary to build human resource capacity in all these relevant areas acrossGovernment departments, private business and civil society, as all will be involved in different aspects ofclimate change management and action Activities will include short and long term training at home andabroad, study tours, exchange programmes, and financing for attending negotiations.
Development of national strategy for climate adaptation
Bangladesh Climate Change Strategy and Action Plan (BCCSAP) will be main basis of efforts to combatclimate change over the next ten years. Adaptation to climate change is ultimately an issue of sustainabledevelopment. Even without climate change, LDCs are already severely affected by climate variability andextremes, and they remain extremely vulnerable to future changes in the regional climate that could increasethe risks. It is essential that Bangladesh prepares now to adapt to climate change and safeguard the futurewell-being of population. It is expected that an additional national strategy and action plan will be added by2015. It is important to note that Government of Bangladesh could able to establish of climate change fundof USD 45 million from national resources.
Funds for additional cost for climate proofing
Climate proofing is a shorthand term for identifying risks to a development project, or any other specifiednatural or human asset, as a consequence of climate variability and change, and ensuring that those risksare reduced to acceptable levels through long-lasting and environmentally sound, economically viable, andsocially acceptable changes implemented at one or more of the following stages in the project cycle:planning, design, construction, operation, and decommissioning. Funds for additional cost coverinfrastructure, human health and environment components. Climate proofing funds are not yet implementedbut government has an initiative to provide climate proofing fund. It is expected that climate proofing fundswill be invested in at least five programs by 2015.
Asset and Income support schemes
This support is for non-farm incomes in environmentally degraded rural areas, including voluntary migration.At present there is no income support scheme however it is expected the number of income supportschemes will be ten by 2015.
Crop insurance
Crop insurance is purchased by agricultural producers, including farmers, ranchers, and others to protectthemselves against either the loss of their crops due to natural disasters (such as floods, drought, cyclone),or the loss of revenue due to declines in the prices of agricultural commodities. Crop insurance schemes can
200 MILLENNIUM DEVELOPMENT GOALS NEEDS ASSESSMENT AND COSTING (2009-2015) BANGLADESH
CHAPTER 7
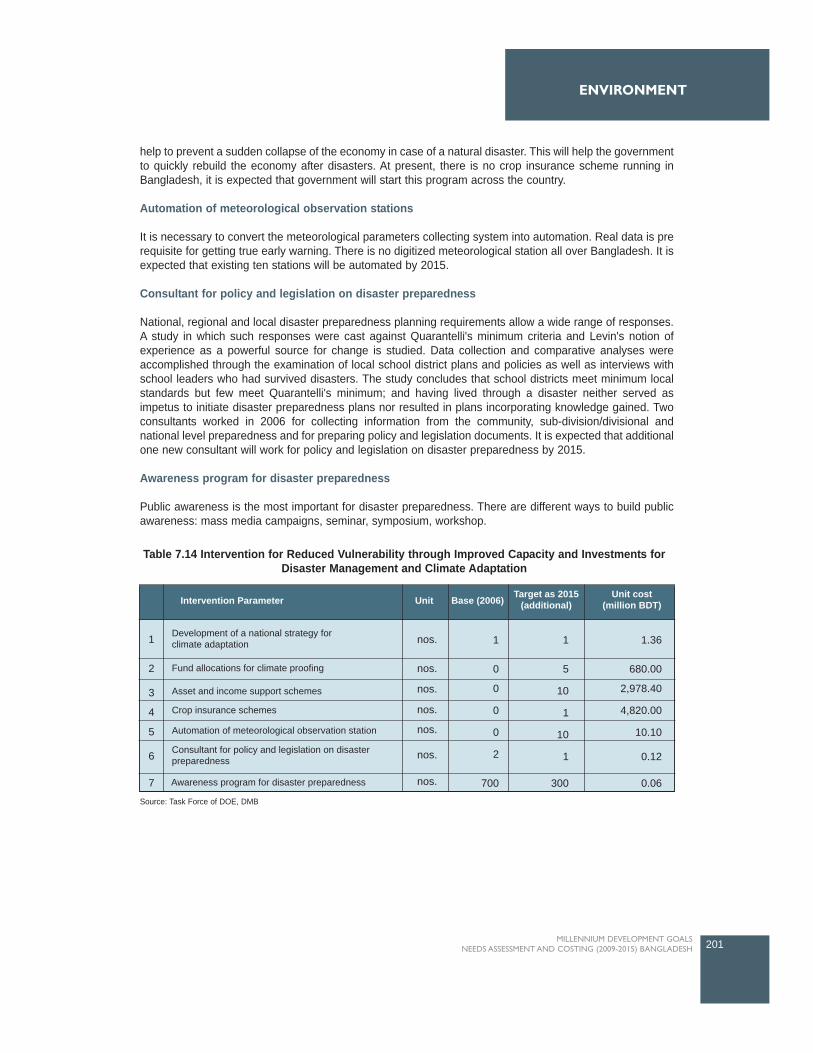
help to prevent a sudden collapse of the economy in case of a natural disaster. This will help the governmentto quickly rebuild the economy after disasters. At present, there is no crop insurance scheme running inBangladesh, it is expected that government will start this program across the country.
Automation of meteorological observation stations
It is necessary to convert the meteorological parameters collecting system into automation. Real data is prerequisite for getting true early warning. There is no digitized meteorological station all over Bangladesh. It isexpected that existing ten stations will be automated by 2015.
Consultant for policy and legislation on disaster preparedness
National, regional and local disaster preparedness planning requirements allow a wide range of responses.A study in which such responses were cast against Quarantelli's minimum criteria and Levin's notion ofexperience as a powerful source for change is studied. Data collection and comparative analyses wereaccomplished through the examination of local school district plans and policies as well as interviews withschool leaders who had survived disasters. The study concludes that school districts meet minimum localstandards but few meet Quarantelli's minimum; and having lived through a disaster neither served asimpetus to initiate disaster preparedness plans nor resulted in plans incorporating knowledge gained. Twoconsultants worked in 2006 for collecting information from the community, sub-division/divisional andnational level preparedness and for preparing policy and legislation documents. It is expected that additionalone new consultant will work for policy and legislation on disaster preparedness by 2015.
Awareness program for disaster preparedness
Public awareness is the most important for disaster preparedness. There are different ways to build publicawareness: mass media campaigns, seminar, symposium, workshop.
201MILLENNIUM DEVELOPMENT GOALS NEEDS ASSESSMENT AND COSTING (2009-2015) BANGLADESH
ENVIRONMENT
2
3
4
5
1
0
0
0
0
2
700
1
5
10
1
10
1
300
1.36
680.00
2,978.40
4,820.00
10.10
0.12
0.06Awareness program for disaster preparedness
Intervention Parameter Unit Base (2006) Target as 2015(additional)
Unit cost(million BDT)
Development of a national strategy forclimate adaptation
Fund allocations for climate proofing
Asset and income support schemes
Crop insurance schemes
Automation of meteorological observation station
Consultant for policy and legislation on disasterpreparedness
1
7
6
nos.
nos.
nos.
nos.
nos.
nos.
nos.
Table 7.14 Intervention for Reduced Vulnerability through Improved Capacity and Investments forDisaster Management and Climate Adaptation
Source: Task Force of DOE, DMB
7.3.4. Governance Institutions, capacity and systemic issues
Interventions, coverage target and unit cost for Governance, institutions, capacity and systemic issues arepresented in Table 7.15.
Capacity Building and Institutional Strengthening
Mainstreaming environment issues in national and sectoral development will require strong organizationsand a robust institutional framework to ensure that the activities are sustained over the next several decadesand beyond. Some organizations will be new (e.g., climate cells in Ministries and their agencies); others willhave to be reformed and strengthened. In all cases, organizations will need to be provided with adequatelogistics and other facilities for which adequate financing will have to be ensured. There is a pressing needto strengthen a number of existing organizations that are already underperforming in implementing theregular development programme.
Awareness, advocacy and education on environmental issues
Mass media campaigns:
Mass media include newspapers and other printed material, radio, television, billboards, etc. Mass mediahas an important role in information delivery to a vast percentage of population. A mass-media campaign isto promote important activities like, disaster preparedness, effectiveness of road safety public informationcampaigns, bad impact of air and water pollution on health, properly waste management etc. Mass mediacan also be effectively used for counter advertising and information delivery. There were 96 mass mediacampaigns conducted in 2006 and it is expected that an additional 54 mass media campaigns will be workingby 2015.
Community based awareness programs:
Prevention of water resources from pollution, improvement in the local water supply and use, improvementof solid waste management, prevention of surface water sources from pollution in any given community arethe some crucial community based awareness program which will make more water available forcommunities across the sections. Crucial changes in behavioral patterns as well as simple technicalsolutions can best be established at community level. There were 50 community based awareness programsconducted in 2006 which is expected that additional one hundred fifty community based awarenessprograms increased by 2015.
School based awareness programs
School based awareness program is very important because "our future is in the hands of our children". Mostof all are aware that we have to take care of our environment but our children are not completely aware ofit. School curriculum can make the school children more aware of such laws and the benefits of a healthyenvironment. Two hundred and fifty school based awareness programs were conducted in 2006. It isexpected that awareness programs will be covered in all schools of Bangladesh.
Capacity building on EIA
Develop integrated impact assessment combining environmental, social and economic concerns tostrengthen government's ability to manage environment for poverty reduction. At present there is no EIAprogram for poverty reduction however it is expected that this type of programs will be increased to 90 by2015.
Develop data collection and management system
Data collection system as well as management is very weak in all concerned environment organizations. It
202 MILLENNIUM DEVELOPMENT GOALS NEEDS ASSESSMENT AND COSTING (2009-2015) BANGLADESH
CHAPTER 7

is essential to develop separate database systems in each institution and then make linkage to LAN as wellas WAN for easy access to vendors. RS and GIS can be used for real time data estimation and presentation.MIS can also used for office management. It is expected that four data collection as well as management by2015. At present there is no database system and it is expected that four database systems will bedeveloped by 2015.
Research and studies on emerging environmental issues
Intensive focus should be given to conduct more research on emerging environmental issues. 12 adaptiveresearches on climate adaptation are conducted by different institutions supported by DOE. It is expectedthat 88 more research programs will be conducted by 2015.
Publications
Departmental activities can be published monthly, half yearly or research publication can be half yearly.Other issues of publications can be environmental quality guidelines, public notification on the developedguidelines and regulations. Each department like DOE, FD and LGED publishes yearly, and sometimes halfyearly report. It is expected that four additional publications will be included by 2015.
7.4 Resource Needs Estimates for meeting Targets on Environmental issues
It is estimated that a total of BDT 122,227.30 million will be required to undertake the entire interventionssuggested above for the period 2009-2015 where capital cost is BDT 33,323.90 million and recurrent cost is88,903.44 million. The cost breakup by interventions is shown in Table 7.16.
203MILLENNIUM DEVELOPMENT GOALS NEEDS ASSESSMENT AND COSTING (2009-2015) BANGLADESH
ENVIRONMENT
1
2
3
4
5
6
7
nos.
nos.
nos.
nos.
nos.
nos.
nos.
96
50
250
0
0
12
4
54
150
9,861
90
4
88
4
0.50
0.002
0.003
0.130
11.68
2.10
0.98
Intervention Parameter Unit Base (2006) Target as 2015(additional)
Unit cost(million BDT)
Mass media campaigns
Community base awareness programs
School based awarness programs
Number of capacity building programs on EIA
Develop data collection and management systems
Research and studies on emergingenvironmental issuesPublications and dissemination material
Table 7.15: Interventions, coverage target and unit cost for Governance, institutions, capacity andsystemic issues
Source: Task Force, DOE, FD, and DMB
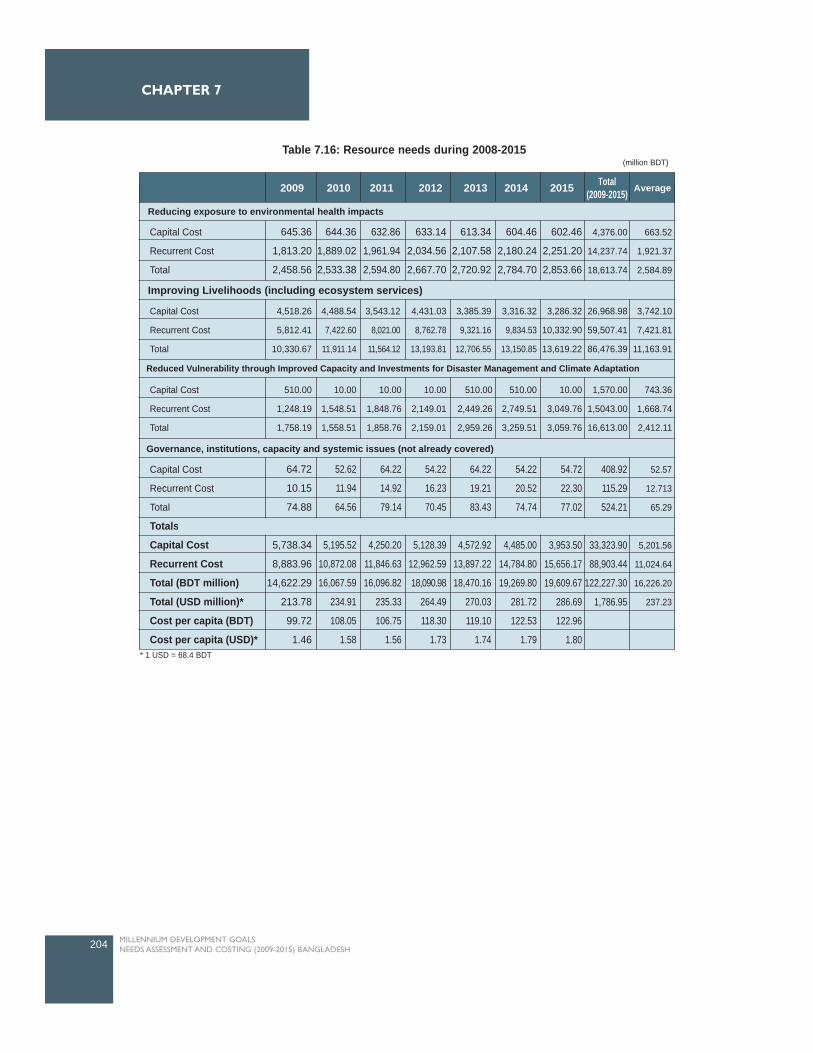
204 MILLENNIUM DEVELOPMENT GOALS NEEDS ASSESSMENT AND COSTING (2009-2015) BANGLADESH
CHAPTER 7
2009 2010 2011 2012 2013 2014 2015 Total(2009-2015) Average
Reducing exposure to environmental health impacts
Capital Cost
Recurrent Cost
Total
645.36
1,813.20
2,458.56
644.36
1,889.02
2,533.38
632.86
1,961.94
2,594.80
633.14
2,034.56
2,667.70
613.34
2,107.58
2,720.92
604.46
2,180.24
2,784.70
602.46
2,251.20
2,853.66
4,376.00
14,237.74
18,613.74
663.52
1,921.37
2,584.89
Capital Cost
Recurrent Cost
Total
4,518.26
5,812.41
10,330.67
4,488.54
7,422.60
11,911.14
3,543.12
8,021.00
11,564.12
4,431.03
8,762.78
13,193.81
3,385.39
9,321.16
12,706.55
3,316.32
9,834.53
13,150.85
3,286.32
10,332.90
13,619.22
26,968.98
59,507.41
86,476.39
3,742.10
7,421.81
11,163.91
Capital Cost
Recurrent Cost
Total
510.00
1,248.19
1,758.19
10.00
1,548.51
1,558.51
10.00
1,848.76
1,858.76
10.00
2,149.01
2,159.01
510.00
2,449.26
2,959.26
510.00
2,749.51
3,259.51
10.00
3,049.76
3,059.76
1,570.00
1,5043.00
16,613.00
743.36
1,668.74
2,412.11
Capital Cost
Recurrent Cost
Total
Totals
Capital Cost
Recurrent Cost
Total (BDT million)
Total (USD million)*
Cost per capita (BDT)
Cost per capita (USD)*
64.72
10.15
74.88
5,738.34
8,883.96
14,622.29
213.78
99.72
1.46
52.62
11.94
64.56
5,195.52
10,872.08
16,067.59
234.91
108.05
1.58
64.22
14.92
79.14
4,250.20
11,846.63
16,096.82
235.33
106.75
1.56
54.22
16.23
70.45
5,128.39
12,962.59
18,090.98
264.49
118.30
1.73
64.22
19.21
83.43
4,572.92
13,897.22
18,470.16
270.03
119.10
1.74
54.22
20.52
74.74
4,485.00
14,784.80
19,269.80
281.72
122.53
1.79
54.72
22.30
77.02
3,953.50
15,656.17
19,609.67
286.69
122.96
1.80
408.92
115.29
524.21
33,323.90
88,903.44
122,227.30
1,786.95
52.57
12.713
65.29
5,201.56
11,024.64
16,226.20
237.23
Improving Livelihoods (including ecosystem services)
Reduced Vulnerability through Improved Capacity and Investments for Disaster Management and Climate Adaptation
Governance, institutions, capacity and systemic issues (not already covered)
Table 7.16: Resource needs during 2008-2015(million BDT)
* 1 USD = 68.4 BDT
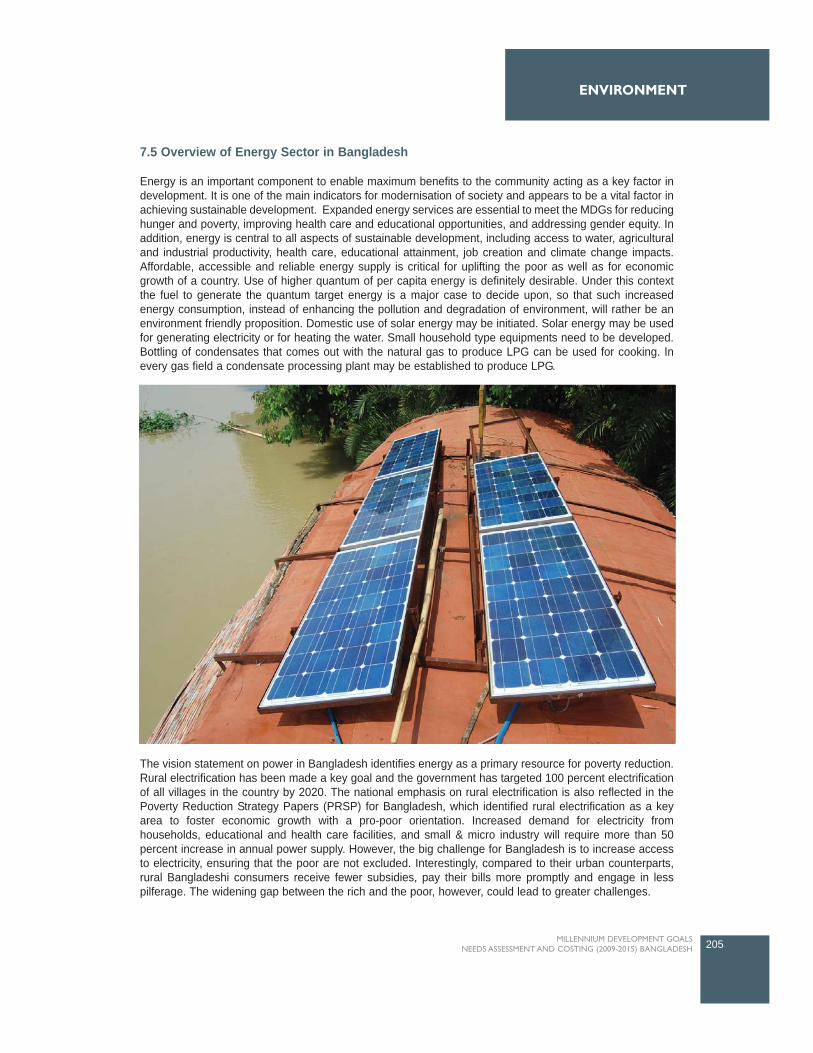
7.5 Overview of Energy Sector in Bangladesh
Energy is an important component to enable maximum benefits to the community acting as a key factor indevelopment. It is one of the main indicators for modernisation of society and appears to be a vital factor inachieving sustainable development. Expanded energy services are essential to meet the MDGs for reducinghunger and poverty, improving health care and educational opportunities, and addressing gender equity. Inaddition, energy is central to all aspects of sustainable development, including access to water, agriculturaland industrial productivity, health care, educational attainment, job creation and climate change impacts.Affordable, accessible and reliable energy supply is critical for uplifting the poor as well as for economicgrowth of a country. Use of higher quantum of per capita energy is definitely desirable. Under this contextthe fuel to generate the quantum target energy is a major case to decide upon, so that such increasedenergy consumption, instead of enhancing the pollution and degradation of environment, will rather be anenvironment friendly proposition. Domestic use of solar energy may be initiated. Solar energy may be usedfor generating electricity or for heating the water. Small household type equipments need to be developed.Bottling of condensates that comes out with the natural gas to produce LPG can be used for cooking. Inevery gas field a condensate processing plant may be established to produce LPG.
The vision statement on power in Bangladesh identifies energy as a primary resource for poverty reduction.Rural electrification has been made a key goal and the government has targeted 100 percent electrificationof all villages in the country by 2020. The national emphasis on rural electrification is also reflected in thePoverty Reduction Strategy Papers (PRSP) for Bangladesh, which identified rural electrification as a keyarea to foster economic growth with a pro-poor orientation. Increased demand for electricity fromhouseholds, educational and health care facilities, and small & micro industry will require more than 50percent increase in annual power supply. However, the big challenge for Bangladesh is to increase accessto electricity, ensuring that the poor are not excluded. Interestingly, compared to their urban counterparts,rural Bangladeshi consumers receive fewer subsidies, pay their bills more promptly and engage in lesspilferage. The widening gap between the rich and the poor, however, could lead to greater challenges.
205MILLENNIUM DEVELOPMENT GOALS NEEDS ASSESSMENT AND COSTING (2009-2015) BANGLADESH
ENVIRONMENT
The performance of the power sector in the last two decades fell short of expectations. The presentgeneration capacity is not adequate to meet the peak power demand. The present generation capacity is notadequate to meet the peak power demand. Present peak demand is 6000 MW and available capacity is3800-4200 MW, resulting in anticipated load shed is 800-1200MW (BPDB 2009). About 87 percent of thepower generation capacity is gas based, 5.5percent is imported oil based, 5.0 percent is coal and 2.5 percentis hydro-based. Power generation is highly dependent on natural gas. Currently gas production is notsufficient to serve the existing power generation requirement. Further, due to gas transmission anddistribution bottlenecks, the gas cannot be transported in some locations, resulting in inadequate powergeneration. Fuel diversity is essential to meet power generation needs in the face of gas shortage and highoil prices in the international market.
Bangladesh per capita annual fuel consumption is only 56 litres of oil, which is one of the lowest in the world.With a predominantly agro-based population, bio-fuel is the main cooking fuel in the rural sector. RuralBangladesh is characterised by insignificant energy supply and the country as a whole has the lowest usageof electricity (only 156 kilowatt hours (kWh) per capita) in the world.
Biomass (fuel wood, tree leaves, crop residues and animal residues, mainly in the form of dried cow dungcakes or sticks) is the principal form of energy used by the people, particularly in the rural areas. Accordingto a survey by BIDS, a rural household uses nearly three metric tons of biomass in a year. Of this about 1.7metric tons is tree biomass composed of 1.2 metric tons of fuel wood and 0.5 metric tons of tree leaves.Practically all of the biomass is used for cooking and parboiling of rice. The relationship between the amountof fire wood use and levels of income is clearly positive and monotonic. This means that the poor have muchless access to quality fuel for cooking. Income poverty thus translates into energy poverty. While switchingto modern and better quality energy such as electricity is highly preferable, it is not possible to do so rapidly.
Secondly, it is highly desirable to have as much tree cover as possible for the benefit of the country.Nationally and locally, this helps in reducing the energy deficiency while this also helps in keeping globalcarbon emission at a lower level. Initiating, application and habitation of waste to resource recovery (bothbiogas and fertilizer from solid waste, cow dung and night soil) is thus a good option and feasible too. A keyfactor in successful scaling up of rural energy access is the demonstration of replicable and sustainableinstitutional and financing mechanisms to deliver those services. The ground reality is quite stark. Populationpressures on land have been leading to conversion of forest land and land under tree cover into other uses.At the same time this further lowers the supply of biomass and fuel wood for cooking raising their marketvalue stimulating further deforestation and cutting down of trees. Smoke due to fuel wood burning also is amajor cause of a significant rise in the level of indoor air pollution affecting adversely the health of womenand children. Increased demand for furniture also adds pressure to forestland.
Energy sources of wood fuel, agricultural waste, solar energy, animal power and wind energy aredecentralized, and can be considered renewable and environmentally friendly within demand limits.Renewable energy technologies (RETs) create income-generating activities for male landless and marginalfarmers and for women from such households, while reducing environmental problems, like deforestationand indoor air pollution from cooking with poor quality fuels. In Bangladesh, the average solar radiation is3.85 kWh/m2/year which is quite good for photovoltaic (PV) applications, except the monsoon season. Thisis now being used for lighting, radio and television in rural villages instead of kerosene lamps, which providepoor illumination, inadequate working hours of rural people at night. RETs could thus be selectively appliedto various rural applications, potentially generating income, improving health and educational quality, andincreasing labour productivity.
Solar power, Wind Energy and Biogas will be major interventions for RETs for electricity generation.Promoting energy saving bulbs will be one of the major interventions as electricity technologies which wouldhelp in reducing pressure on less electricity supply. Clean energy (an environmentally preferable energysource), in a crucial transition from short term 'environmental management' is also important for environmentfriendly sustainable development. Its application not only benefits the environment but also improves overallquality of life, raising standards of health and bringing about greater social and environmental equity. It could
206 MILLENNIUM DEVELOPMENT GOALS NEEDS ASSESSMENT AND COSTING (2009-2015) BANGLADESH
CHAPTER 7
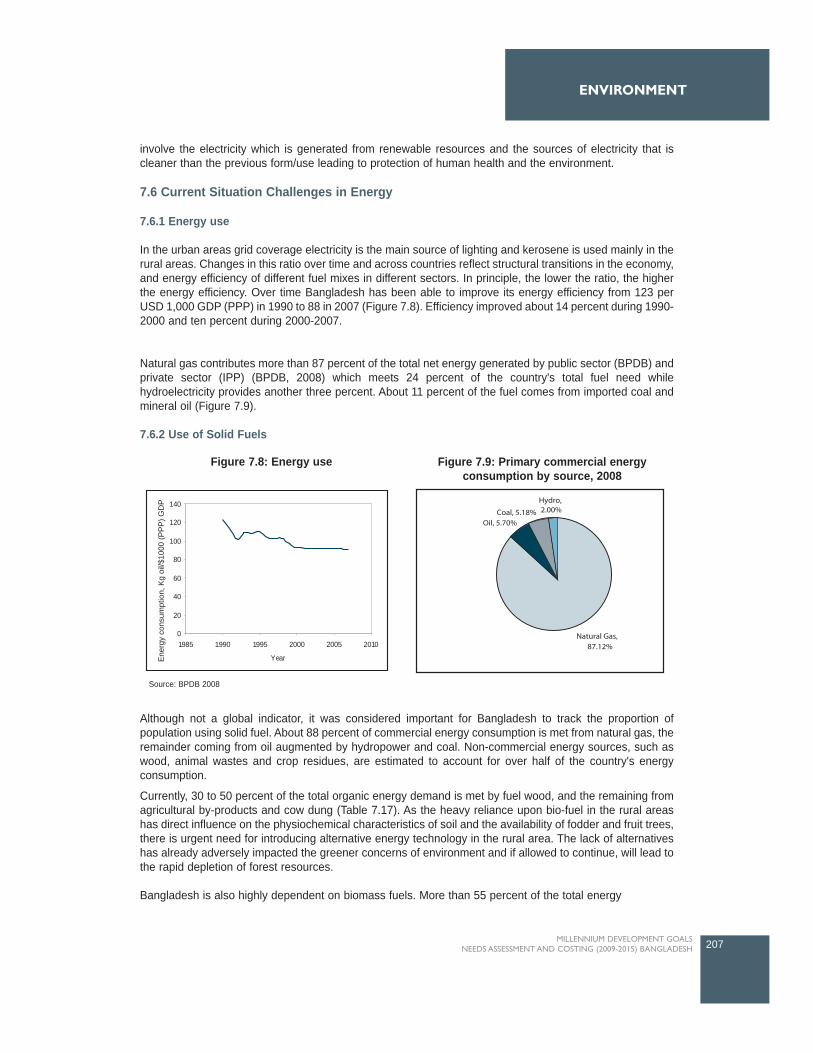
involve the electricity which is generated from renewable resources and the sources of electricity that iscleaner than the previous form/use leading to protection of human health and the environment.
7.6 Current Situation Challenges in Energy
7.6.1 Energy use
In the urban areas grid coverage electricity is the main source of lighting and kerosene is used mainly in therural areas. Changes in this ratio over time and across countries reflect structural transitions in the economy,and energy efficiency of different fuel mixes in different sectors. In principle, the lower the ratio, the higherthe energy efficiency. Over time Bangladesh has been able to improve its energy efficiency from 123 perUSD 1,000 GDP (PPP) in 1990 to 88 in 2007 (Figure 7.8). Efficiency improved about 14 percent during 1990-2000 and ten percent during 2000-2007.
Natural gas contributes more than 87 percent of the total net energy generated by public sector (BPDB) andprivate sector (IPP) (BPDB, 2008) which meets 24 percent of the country's total fuel need whilehydroelectricity provides another three percent. About 11 percent of the fuel comes from imported coal andmineral oil (Figure 7.9).
7.6.2 Use of Solid Fuels
Although not a global indicator, it was considered important for Bangladesh to track the proportion ofpopulation using solid fuel. About 88 percent of commercial energy consumption is met from natural gas, theremainder coming from oil augmented by hydropower and coal. Non-commercial energy sources, such aswood, animal wastes and crop residues, are estimated to account for over half of the country's energyconsumption.
Currently, 30 to 50 percent of the total organic energy demand is met by fuel wood, and the remaining fromagricultural by-products and cow dung (Table 7.17). As the heavy reliance upon bio-fuel in the rural areashas direct influence on the physiochemical characteristics of soil and the availability of fodder and fruit trees,there is urgent need for introducing alternative energy technology in the rural area. The lack of alternativeshas already adversely impacted the greener concerns of environment and if allowed to continue, will lead tothe rapid depletion of forest resources.
Bangladesh is also highly dependent on biomass fuels. More than 55 percent of the total energy
207MILLENNIUM DEVELOPMENT GOALS NEEDS ASSESSMENT AND COSTING (2009-2015) BANGLADESH
ENVIRONMENT
0
20
40
60
80
100
120
140
1985 1990 1995 2000 2005 2010
YearEne
rgy
cons
umpt
ion,
Kg
oil/$
1000
(PP
P) G
DP
Figure 7.8: Energy use Figure 7.9: Primary commercial energyconsumption by source, 2008
Source: BPDB 2008
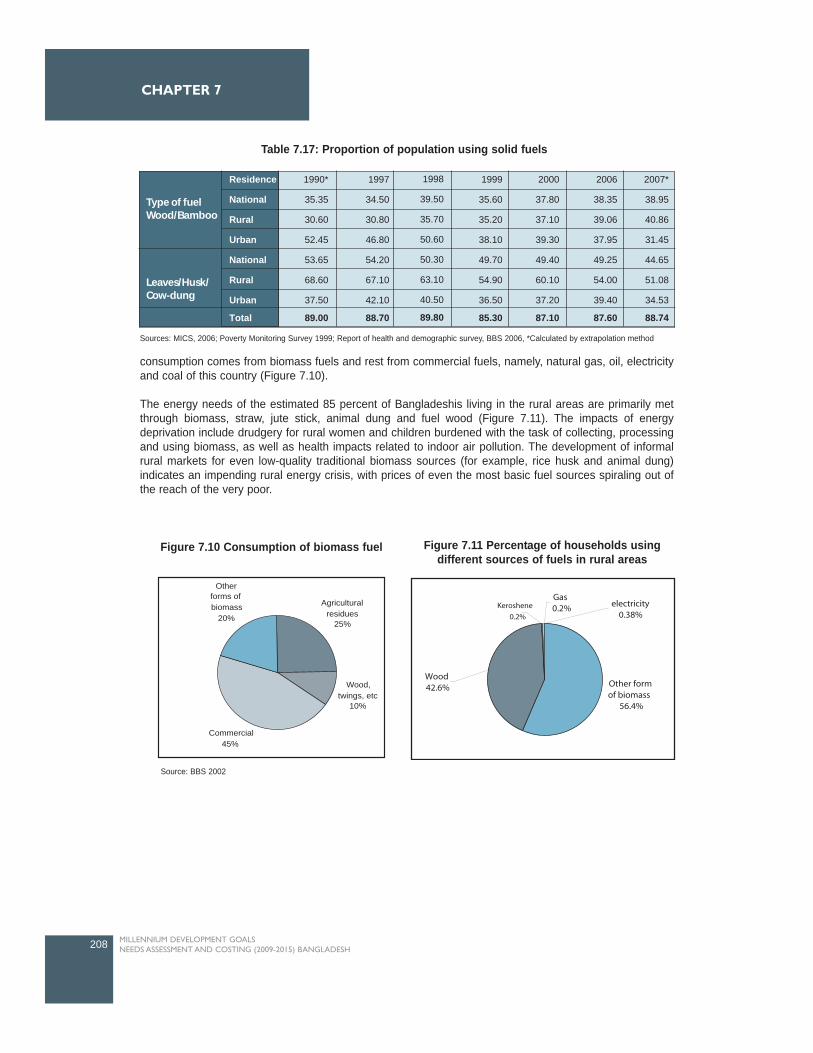
consumption comes from biomass fuels and rest from commercial fuels, namely, natural gas, oil, electricityand coal of this country (Figure 7.10).
The energy needs of the estimated 85 percent of Bangladeshis living in the rural areas are primarily metthrough biomass, straw, jute stick, animal dung and fuel wood (Figure 7.11). The impacts of energydeprivation include drudgery for rural women and children burdened with the task of collecting, processingand using biomass, as well as health impacts related to indoor air pollution. The development of informalrural markets for even low-quality traditional biomass sources (for example, rice husk and animal dung)indicates an impending rural energy crisis, with prices of even the most basic fuel sources spiraling out ofthe reach of the very poor.
208 MILLENNIUM DEVELOPMENT GOALS NEEDS ASSESSMENT AND COSTING (2009-2015) BANGLADESH
CHAPTER 7
Commercial45%
Agricultural residues
25%
Other forms of biomass
20%
Wood, twings, etc
10%
Figure 7.10 Consumption of biomass fuel Figure 7.11 Percentage of households usingdifferent sources of fuels in rural areas
Source: BBS 2002
Residence
National
Rural
Urban
National
Rural
Urban
Total
1990*
35.35
30.60
52.45
53.65
68.60
37.50
89.00
1997
34.50
30.80
46.80
54.20
67.10
42.10
88.70
1998
39.50
35.70
50.60
50.30
63.10
40.50
89.80
1999
35.60
35.20
38.10
49.70
54.90
36.50
85.30
2000
37.80
37.10
39.30
49.40
60.10
37.20
87.10
2006
38.35
39.06
37.95
49.25
54.00
39.40
87.60
2007*
38.95
40.86
31.45
44.65
51.08
34.53
88.74
Leaves/Husk/Cow-dung
Type of fuelWood/Bamboo
Table 7.17: Proportion of population using solid fuels
Sources: MICS, 2006; Poverty Monitoring Survey 1999; Report of health and demographic survey, BBS 2006, *Calculated by extrapolation method
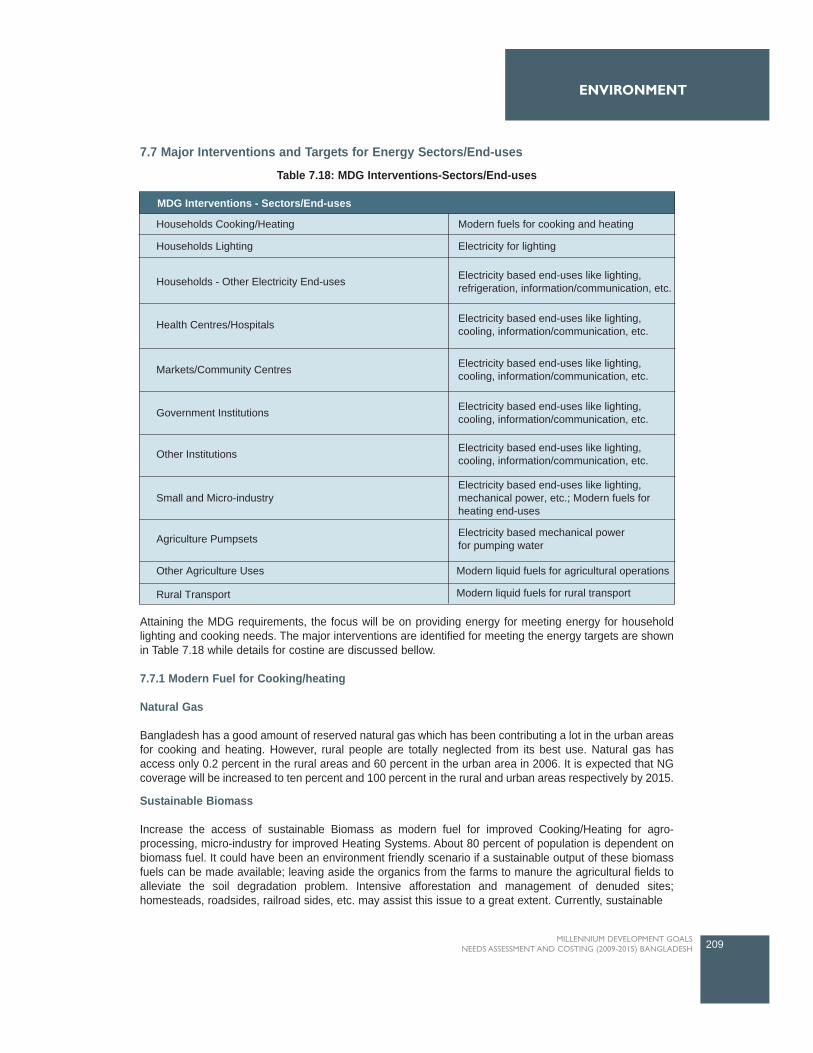
7.7 Major Interventions and Targets for Energy Sectors/End-uses
Attaining the MDG requirements, the focus will be on providing energy for meeting energy for householdlighting and cooking needs. The major interventions are identified for meeting the energy targets are shownin Table 7.18 while details for costine are discussed bellow.
7.7.1 Modern Fuel for Cooking/heating
Natural Gas
Bangladesh has a good amount of reserved natural gas which has been contributing a lot in the urban areasfor cooking and heating. However, rural people are totally neglected from its best use. Natural gas hasaccess only 0.2 percent in the rural areas and 60 percent in the urban area in 2006. It is expected that NGcoverage will be increased to ten percent and 100 percent in the rural and urban areas respectively by 2015.
Sustainable Biomass
Increase the access of sustainable Biomass as modern fuel for improved Cooking/Heating for agro-processing, micro-industry for improved Heating Systems. About 80 percent of population is dependent onbiomass fuel. It could have been an environment friendly scenario if a sustainable output of these biomassfuels can be made available; leaving aside the organics from the farms to manure the agricultural fields toalleviate the soil degradation problem. Intensive afforestation and management of denuded sites;homesteads, roadsides, railroad sides, etc. may assist this issue to a great extent. Currently, sustainable
209MILLENNIUM DEVELOPMENT GOALS NEEDS ASSESSMENT AND COSTING (2009-2015) BANGLADESH
ENVIRONMENT
MDG Interventions - Sectors/End-uses
Households Cooking/Heating
Households Lighting
Households - Other Electricity End-uses Electricity based end-uses like lighting,refrigeration, information/communication, etc.
Electricity based end-uses like lighting,cooling, information/communication, etc.
Electricity based end-uses like lighting,cooling, information/communication, etc.
Electricity based end-uses like lighting,cooling, information/communication, etc.
Electricity based end-uses like lighting,cooling, information/communication, etc.
Electricity based end-uses like lighting,mechanical power, etc.; Modern fuels forheating end-uses
Electricity based mechanical powerfor pumping water
Modern liquid fuels for agricultural operations
Modern liquid fuels for rural transport
Health Centres/Hospitals
Markets/Community Centres
Government Institutions
Other Institutions
Small and Micro-industry
Agriculture Pumpsets
Other Agriculture Uses
Rural Transport
Electricity for lighting
Modern fuels for cooking and heating
Table 7.18: MDG Interventions-Sectors/End-uses
biomass (SB) has access one percent for cooking/heating as modern fuel. It is expected that access of SBwill be increased to 30 percent by 2015.
7.7.2 Renewable Energy
The objective is to maximize the use of renewable energy sources to lower GHG emission and ensuringenergy security. The scope for developing renewable energy supplies (e.g., solar, wind and sustainablebiomass technologies) has not been explored well in Bangladesh.
Electricity production
Off-grid electricity
Existing grid has access of 96.8 percent and rest 3.2 percent from off-grid solar PV (three percent) in therural area. It is expected that existing grid (grid-natural gas) coverage will be reduced to 68 percent andaccess of grid-coal will be increased to 20 percent. The off-grid access will be increased to ten percent whereaccess of solar-pv and wind energy will be three percent and one percent respectively. In the urban area,existing grid has access of 100 percent, however, it is expected that the existing grid access will be reducedto 37 percent and access of grid-coal will be increased to 45 percent and off-grid access will also beincreased to 14 percent where solar-pv, wind energy and biomass gasifier will be seven percent, five percentand two percent respectively.
Solar power
There is some use of solar power for limited domestic purposes. The main barrier to expanded solar energyuse is the capital cost. However, since the cost of solar cells and solar panels in global markets is expectedto fall gradually, Government of Bangladesh is actively considering for withdrawal of CDVAT-tax on solarpanels to gear up solar energy and is also considering encouraging entrepreneurs who wish to start solarprojects, possibly through incentives.
Wind Energy
The potential of harvesting wind energy, though recognized for many years, has not produced tangibleresults so far. The initial capital cost remains the main stumbling block. High variations in wind speed andsharp seasonal changes also present difficulties. The tidal range of the coastal belt is considered to beadequate for the generation of tidal power. However, there has not been any attempt to harvest such energy.
Biogas
Biogas development remains in its infancy. Even the popularization programs for improved cooking stoves,which save a lot of fuel wood, have had limited success. There are, then, technical, economic, social andinstitutional barriers to the adoption of renewable technologies. However, since renewable technology forpower generation or direct use is carbon-neutral (or nearly so), technologies such as these should beconsidered.
The country has already set up a Sustainable Energy Development Authority to popularize renewableenergy technologies. It should be provided with adequate financial and other support so that renewableenergy becomes a part of the move towards a low-carbon development path. Each of these technologies,however, will need to be evaluated carefully to understand the technological and economic barriers andpotential. If start-up costs are high, the issues of subsidy or other support may have to be considered. Powergeneration policy should also take these technologies into account in its planning.
210 MILLENNIUM DEVELOPMENT GOALS NEEDS ASSESSMENT AND COSTING (2009-2015) BANGLADESH
CHAPTER 7
7.7.3 Electricity Technologies
Electricity demand was 5500 MW whereas supply was 3500 MW, resulting in a shortage of about 2000MWin 2007. Alternative options are highly encouraged to meet the power demand of Bangladesh.
Promoting energy saving bulbs
Energy saving bulbs are nowadays very popular in different countries of the world. These bulbs are user-friendly. They consume less electricity but produce more light. However the use of such lamps in Bangladeshis insignificant due to lack of awareness about the benefits of using such lamps and most people in thecountry continue to use conventional lamps that consume more electricity but emit less light.
The use of energy-saving bulbs is important for the country because of the crisis of power being faced forsome time. Bangladesh has a serious shortage of electricity as the total generation 3,500 MW falls short ofthe total peak hour demand of 4,500 MW. The use of such bulbs would help reduce pressure on supply. Itis reported in the media that 30 per cent of total electricity is used for domestic lighting. It amounts to some1050 megawatts a day. It is estimated that extensive use of energy saving bulbs can bring down this powerconsumption for lighting to 300 MW with a saving of as much as 700-750 MW every day. Energy experts arereported to have said that saving of this amount of power will help bring down load shedding to 50 per centwith a decrease of household consumers' bill by 80 per cent.
The use of such bulbs is still very limited in Bangladesh as most people do not know about the merits of theiruse. Another reason is that high prices of energy-saving bulbs discourage people from using these. Peopleof low income groups cannot buy such costly bulbs. It is thought that at present only eight enterprises importthem and maintain monopoly control over their marketing, thus the prices do not come down to the reach ofthe majority of the consumers. To increase the use of such bulbs the government should take a number ofsteps. On the one hand, publicity campaigns to make people aware of the availability and usefulness ofthose must be undertaken. People's attention must be drawn to the fact that, though costly initially, thosebulbs are poor-friendly in the long run. They will also prove to be cost effective for big industries. On theother, steps must be taken to reduce their prices. More business organizations may be allowed to importenergy saving bulbs. The Trading Corporation of Bangladesh may also be asked to import them to makesales at price affordable for people of low income groups possible. Technologies may be imported to producethese locally. The government may also withdraw or cut duty on import of energy-saving bulbs to popularizetheir use.
7.7.4 Diesel Fuel for Transportation and Agricultural related end-uses
Increase the access of diesel fuel for Agricultural and Transport related end-uses in the rural areas. Accessof diesel fuel is 70 percent for transportation of agricultural use in 2006, it is expected that access will beincreased to 100 percent by 2015.
7.7.5 Training for Capacity Development
Capacity development through training will be necessarily important to the government (BPDB), public andprivate sectors, CBOs and individuals for energy access.
7.7.6 Awareness and Education campaign
Mass media include newspapers and other printed material, radio, television and billboards, etc. Mass mediahas an important role in information delivery to a large percentage of the population.
A mass-media campaign to promote important activities like, energy saving bulbs, indoor air pollution, andincreased use of sustainable biomass is necessary. Intensive afforestation and management of denuded
211MILLENNIUM DEVELOPMENT GOALS NEEDS ASSESSMENT AND COSTING (2009-2015) BANGLADESH
ENVIRONMENT
sites; homesteads, roadsides, railroad sides, etc. may assist with the increase sustainable biomass reserveto a great extent.
Among others, the interventions in the energy sector will facilitate agricultural mechanization and agroprocessing, stimulate employment generation and development generation and development of ruralenterprises, education of children, improve health, reduce deforestation and other forms of land degradation,help to increasing carbon sinks and mitigating climate change, boost manufacturing, and generation of youthemployment.
7.8 Resource Needs Estimates for Energy
The needs assessment is primarily based on rural and urban electrification programme of the BangladeshPower Development Board (BPDB) which consists of on-grid and off-grid electrification programmes. Theoff-grid programmes includes solar-pv, wind energy and biomass gasifier power. The solar programme willneed to be supplemented by other energy sources for cooking.
Data Sources
The sources of data for estimating resource needs are the BPDB 2006 data and data from Petrobangla ofBangladesh Oil, Gas and Mineral Corporation. Year 2006 data has been used as the base line in case ofdiscrepancies. Demographic data, number of institutions, number of vehicles, etc have been collected fromstatistical year book, 2006, BBS. Number of small and micro-industry has been collected from Ministry ofCommerce and Industry's report.
Methods
The estimation of resource requirement needs was done by using the pre-developed spread sheet-basedmodel (Energy Costing Tool, Version 1.8) to project the gradual scaling up of investments and resourcerequirements. In addition to human resources and infrastructure targets, these models also include capitaland operating/recurring costs. Unit costs were derived from existing national planning documents, projectbudgets, national expenditure reviews and other planning documents. In cases where existing unit costsappeared uncharacteristically low (e.g. salaries for civil servants); a more competitive and realistic figurewere used. These costs were applied to the targets to get the total cost of the interventions, per annum. Incases where it was not possible to calculate the resources required for each individual intervention, moreaggregate estimates from other studies (e.g. PRSP and MTEF) cost estimates were used.
Resource needs
The Annual cost of meeting MDG energy needs in Bangladesh are given below. The annual average costfor cooking/heating is BDT 78,358.02 million where capital cost is BDT 9,245.24 million and recurrent costis BDT 69,112.78 million. The annual average cost for electricity end uses is BDT 47,351.37 million wherecapital cost is BDT 21,779.69 million and recurrent cost is BDT 25,571.68 million. The annual averagerecurrent cost for Liquid Fuel End-uses is BDT 2,570.84 million.
The total cost for entire energy interventions for the period 2009-2015 is estimated at BDT 897,961.58million. The total capital cost of interventions BDT 217,174.51 million and total recurrent cost is BDT680,787.07 million with the total for 7 years (Table 7.19).
212 MILLENNIUM DEVELOPMENT GOALS NEEDS ASSESSMENT AND COSTING (2009-2015) BANGLADESH
CHAPTER 7
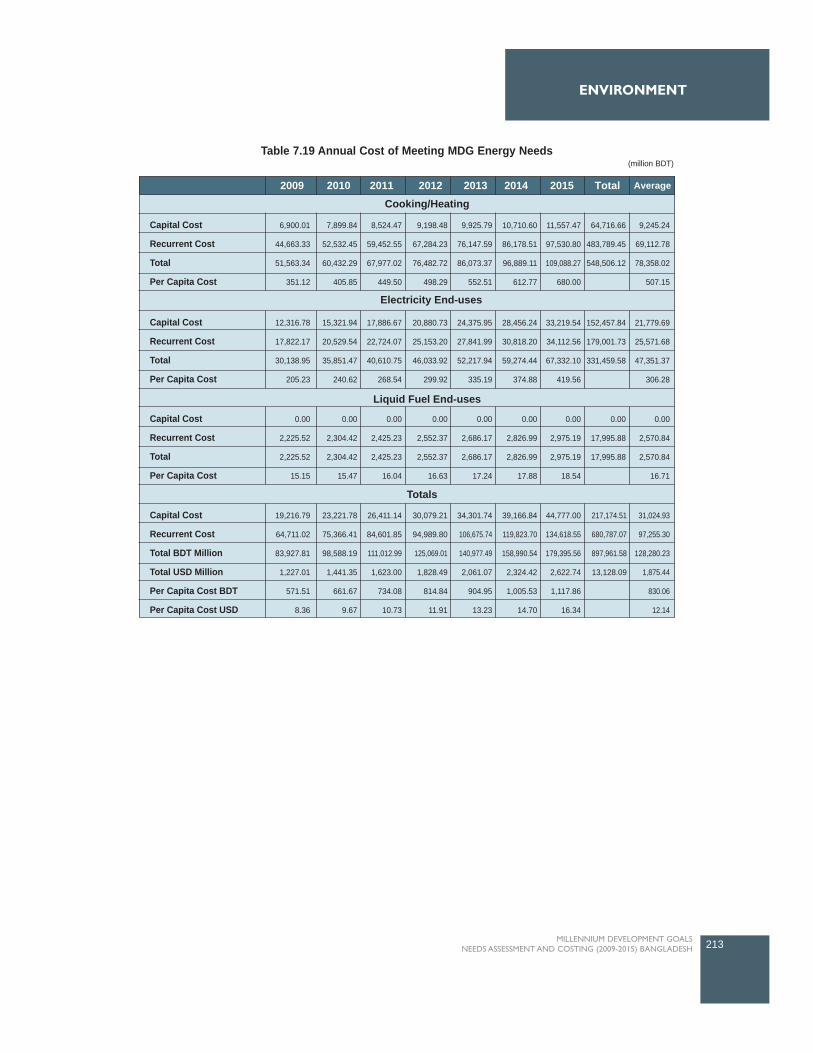
213MILLENNIUM DEVELOPMENT GOALS NEEDS ASSESSMENT AND COSTING (2009-2015) BANGLADESH
ENVIRONMENT
2009 2010 2011 2012 2013 2014 2015 Total Average
Cooking/Heating
Capital Cost
Recurrent Cost
Total
Per Capita Cost
6,900.01
44,663.33
51,563.34
351.12
7,899.84
52,532.45
60,432.29
405.85
8,524.47
59,452.55
67,977.02
449.50
9,198.48
67,284.23
76,482.72
498.29
9,925.79
76,147.59
86,073.37
552.51
10,710.60
86,178.51
96,889.11
612.77
11,557.47
97,530.80
109,088.27
680.00
64,716.66
483,789.45
548,506.12
9,245.24
69,112.78
78,358.02
507.15
Capital Cost
Recurrent Cost
Total
Per Capita Cost
12,316.78
17,822.17
30,138.95
205.23
15,321.94
20,529.54
35,851.47
240.62
17,886.67
22,724.07
40,610.75
268.54
20,880.73
25,153.20
46,033.92
299.92
24,375.95
27,841.99
52,217.94
335.19
28,456.24
30,818.20
59,274.44
374.88
33,219.54
34,112.56
67,332.10
419.56
152,457.84
179,001.73
331,459.58
21,779.69
25,571.68
47,351.37
306.28
Capital Cost
Recurrent Cost
Total
Per Capita Cost
0.00
2,225.52
2,225.52
15.15
0.00
2,304.42
2,304.42
15.47
0.00
2,425.23
2,425.23
16.04
0.00
2,552.37
2,552.37
16.63
0.00
2,686.17
2,686.17
17.24
0.00
2,826.99
2,826.99
17.88
0.00
2,975.19
2,975.19
18.54
0.00
17,995.88
17,995.88
0.00
2,570.84
2,570.84
16.71
Capital Cost
Recurrent Cost
Total BDT Million
Total USD Million
Per Capita Cost BDT
Per Capita Cost USD
19,216.79
64,711.02
83,927.81
1,227.01
571.51
8.36
23,221.78
75,366.41
98,588.19
1,441.35
661.67
9.67
26,411.14
84,601.85
111,012.99
1,623.00
734.08
10.73
30,079.21
94,989.80
125,069.01
1,828.49
814.84
11.91
34,301.74
106,675.74
140,977.49
2,061.07
904.95
13.23
39,166.84
119,823.70
158,990.54
2,324.42
1,005.53
14.70
44,777.00
134,618.55
179,395.56
2,622.74
1,117.86
16.34
217,174.51
680,787.07
897,961.58
13,128.09
31,024.93
97,255.30
128,280.23
1,875.44
830.06
12.14
Electricity End-uses
Liquid Fuel End-uses
Totals
Table 7.19 Annual Cost of Meeting MDG Energy Needs (million BDT)
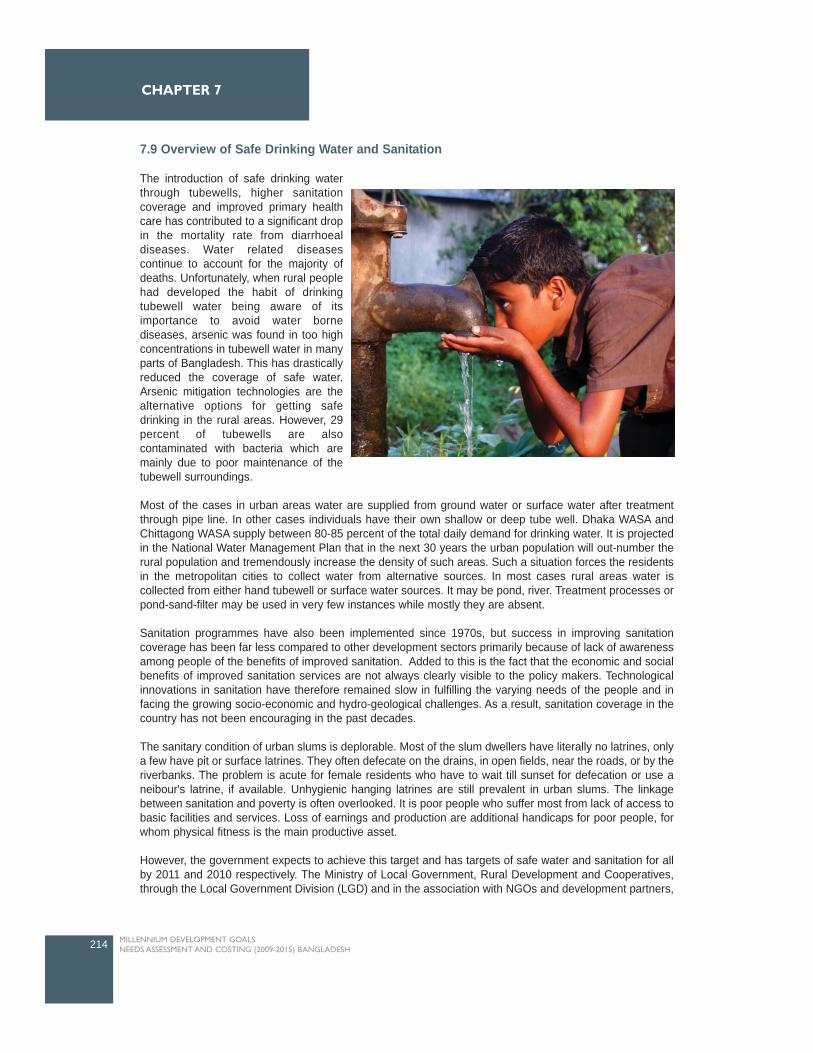
7.9 Overview of Safe Drinking Water and Sanitation
The introduction of safe drinking waterthrough tubewells, higher sanitationcoverage and improved primary healthcare has contributed to a significant dropin the mortality rate from diarrhoealdiseases. Water related diseasescontinue to account for the majority ofdeaths. Unfortunately, when rural peoplehad developed the habit of drinkingtubewell water being aware of itsimportance to avoid water bornediseases, arsenic was found in too highconcentrations in tubewell water in manyparts of Bangladesh. This has drasticallyreduced the coverage of safe water.Arsenic mitigation technologies are thealternative options for getting safedrinking in the rural areas. However, 29percent of tubewells are alsocontaminated with bacteria which aremainly due to poor maintenance of thetubewell surroundings.
Most of the cases in urban areas water are supplied from ground water or surface water after treatmentthrough pipe line. In other cases individuals have their own shallow or deep tube well. Dhaka WASA andChittagong WASA supply between 80-85 percent of the total daily demand for drinking water. It is projectedin the National Water Management Plan that in the next 30 years the urban population will out-number therural population and tremendously increase the density of such areas. Such a situation forces the residentsin the metropolitan cities to collect water from alternative sources. In most cases rural areas water iscollected from either hand tubewell or surface water sources. It may be pond, river. Treatment processes orpond-sand-filter may be used in very few instances while mostly they are absent.
Sanitation programmes have also been implemented since 1970s, but success in improving sanitationcoverage has been far less compared to other development sectors primarily because of lack of awarenessamong people of the benefits of improved sanitation. Added to this is the fact that the economic and socialbenefits of improved sanitation services are not always clearly visible to the policy makers. Technologicalinnovations in sanitation have therefore remained slow in fulfilling the varying needs of the people and infacing the growing socio-economic and hydro-geological challenges. As a result, sanitation coverage in thecountry has not been encouraging in the past decades.
The sanitary condition of urban slums is deplorable. Most of the slum dwellers have literally no latrines, onlya few have pit or surface latrines. They often defecate on the drains, in open fields, near the roads, or by theriverbanks. The problem is acute for female residents who have to wait till sunset for defecation or use aneibour's latrine, if available. Unhygienic hanging latrines are still prevalent in urban slums. The linkagebetween sanitation and poverty is often overlooked. It is poor people who suffer most from lack of access tobasic facilities and services. Loss of earnings and production are additional handicaps for poor people, forwhom physical fitness is the main productive asset.
However, the government expects to achieve this target and has targets of safe water and sanitation for allby 2011 and 2010 respectively. The Ministry of Local Government, Rural Development and Cooperatives,through the Local Government Division (LGD) and in the association with NGOs and development partners,
214 MILLENNIUM DEVELOPMENT GOALS NEEDS ASSESSMENT AND COSTING (2009-2015) BANGLADESH
CHAPTER 7
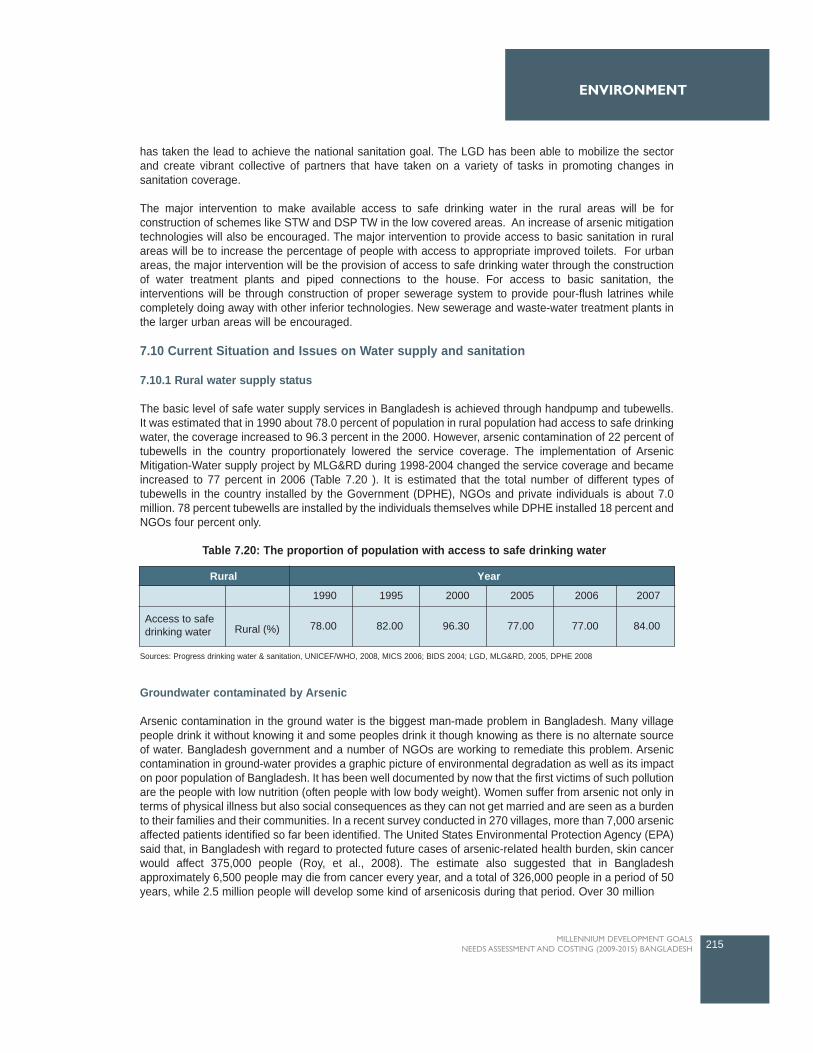
has taken the lead to achieve the national sanitation goal. The LGD has been able to mobilize the sectorand create vibrant collective of partners that have taken on a variety of tasks in promoting changes insanitation coverage.
The major intervention to make available access to safe drinking water in the rural areas will be forconstruction of schemes like STW and DSP TW in the low covered areas. An increase of arsenic mitigationtechnologies will also be encouraged. The major intervention to provide access to basic sanitation in ruralareas will be to increase the percentage of people with access to appropriate improved toilets. For urbanareas, the major intervention will be the provision of access to safe drinking water through the constructionof water treatment plants and piped connections to the house. For access to basic sanitation, theinterventions will be through construction of proper sewerage system to provide pour-flush latrines whilecompletely doing away with other inferior technologies. New sewerage and waste-water treatment plants inthe larger urban areas will be encouraged.
7.10 Current Situation and Issues on Water supply and sanitation
7.10.1 Rural water supply status
The basic level of safe water supply services in Bangladesh is achieved through handpump and tubewells.It was estimated that in 1990 about 78.0 percent of population in rural population had access to safe drinkingwater, the coverage increased to 96.3 percent in the 2000. However, arsenic contamination of 22 percent oftubewells in the country proportionately lowered the service coverage. The implementation of ArsenicMitigation-Water supply project by MLG&RD during 1998-2004 changed the service coverage and becameincreased to 77 percent in 2006 (Table 7.20 ). It is estimated that the total number of different types oftubewells in the country installed by the Government (DPHE), NGOs and private individuals is about 7.0million. 78 percent tubewells are installed by the individuals themselves while DPHE installed 18 percent andNGOs four percent only.
Groundwater contaminated by Arsenic
Arsenic contamination in the ground water is the biggest man-made problem in Bangladesh. Many villagepeople drink it without knowing it and some peoples drink it though knowing as there is no alternate sourceof water. Bangladesh government and a number of NGOs are working to remediate this problem. Arseniccontamination in ground-water provides a graphic picture of environmental degradation as well as its impacton poor population of Bangladesh. It has been well documented by now that the first victims of such pollutionare the people with low nutrition (often people with low body weight). Women suffer from arsenic not only interms of physical illness but also social consequences as they can not get married and are seen as a burdento their families and their communities. In a recent survey conducted in 270 villages, more than 7,000 arsenicaffected patients identified so far been identified. The United States Environmental Protection Agency (EPA)said that, in Bangladesh with regard to protected future cases of arsenic-related health burden, skin cancerwould affect 375,000 people (Roy, et al., 2008). The estimate also suggested that in Bangladeshapproximately 6,500 people may die from cancer every year, and a total of 326,000 people in a period of 50years, while 2.5 million people will develop some kind of arsenicosis during that period. Over 30 million
215MILLENNIUM DEVELOPMENT GOALS NEEDS ASSESSMENT AND COSTING (2009-2015) BANGLADESH
ENVIRONMENT
2006 20072005200019951990
78.00 82.00 96.30 77.00 77.00 84.00
YearRural
Rural (%)Access to safedrinking water
Table 7.20: The proportion of population with access to safe drinking water
Sources: Progress drinking water & sanitation, UNICEF/WHO, 2008, MICS 2006; BIDS 2004; LGD, MLG&RD, 2005, DPHE 2008
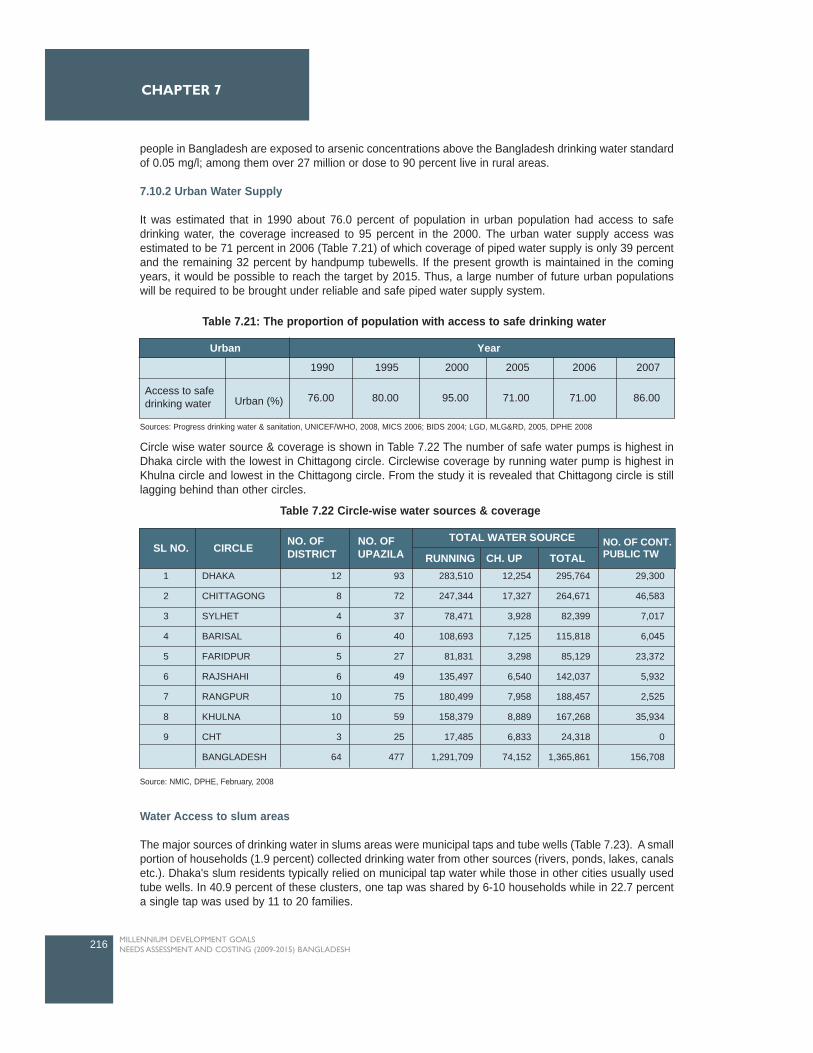
people in Bangladesh are exposed to arsenic concentrations above the Bangladesh drinking water standardof 0.05 mg/l; among them over 27 million or dose to 90 percent live in rural areas.
7.10.2 Urban Water Supply
It was estimated that in 1990 about 76.0 percent of population in urban population had access to safedrinking water, the coverage increased to 95 percent in the 2000. The urban water supply access wasestimated to be 71 percent in 2006 (Table 7.21) of which coverage of piped water supply is only 39 percentand the remaining 32 percent by handpump tubewells. If the present growth is maintained in the comingyears, it would be possible to reach the target by 2015. Thus, a large number of future urban populationswill be required to be brought under reliable and safe piped water supply system.
Circle wise water source & coverage is shown in Table 7.22 The number of safe water pumps is highest inDhaka circle with the lowest in Chittagong circle. Circlewise coverage by running water pump is highest inKhulna circle and lowest in the Chittagong circle. From the study it is revealed that Chittagong circle is stilllagging behind than other circles.
Water Access to slum areas
The major sources of drinking water in slums areas were municipal taps and tube wells (Table 7.23). A smallportion of households (1.9 percent) collected drinking water from other sources (rivers, ponds, lakes, canalsetc.). Dhaka's slum residents typically relied on municipal tap water while those in other cities usually usedtube wells. In 40.9 percent of these clusters, one tap was shared by 6-10 households while in 22.7 percenta single tap was used by 11 to 20 families.
216 MILLENNIUM DEVELOPMENT GOALS NEEDS ASSESSMENT AND COSTING (2009-2015) BANGLADESH
CHAPTER 7
Table 7.22 Circle-wise water sources & coverage
Source: NMIC, DPHE, February, 2008
1
2
3
4
5
6
7
8
9
DHAKA
CHITTAGONG
SYLHET
BARISAL
FARIDPUR
RAJSHAHI
RANGPUR
KHULNA
CHT
BANGLADESH
12
8
4
6
5
6
10
10
3
64
93
72
37
40
27
49
75
59
25
477
283,510
247,344
78,471
108,693
81,831
135,497
180,499
158,379
17,485
1,291,709
12,254
17,327
3,928
7,125
3,298
6,540
7,958
8,889
6,833
74,152
295,764
264,671
82,399
115,818
85,129
142,037
188,457
167,268
24,318
1,365,861
29,300
46,583
7,017
6,045
23,372
5,932
2,525
35,934
0
156,708
SL NO. CIRCLE NO. OFDISTRICT
NO. OFUPAZILA RUNNING CH. UP
TOTAL WATER SOURCE
TOTALNO. OF CONT.PUBLIC TW
2006 20072005200019951990
76.00 80.00 95.00 71.00 71.00 86.00
YearUrban
Urban (%)Access to safedrinking water
Table 7.21: The proportion of population with access to safe drinking water
Sources: Progress drinking water & sanitation, UNICEF/WHO, 2008, MICS 2006; BIDS 2004; LGD, MLG&RD, 2005, DPHE 2008
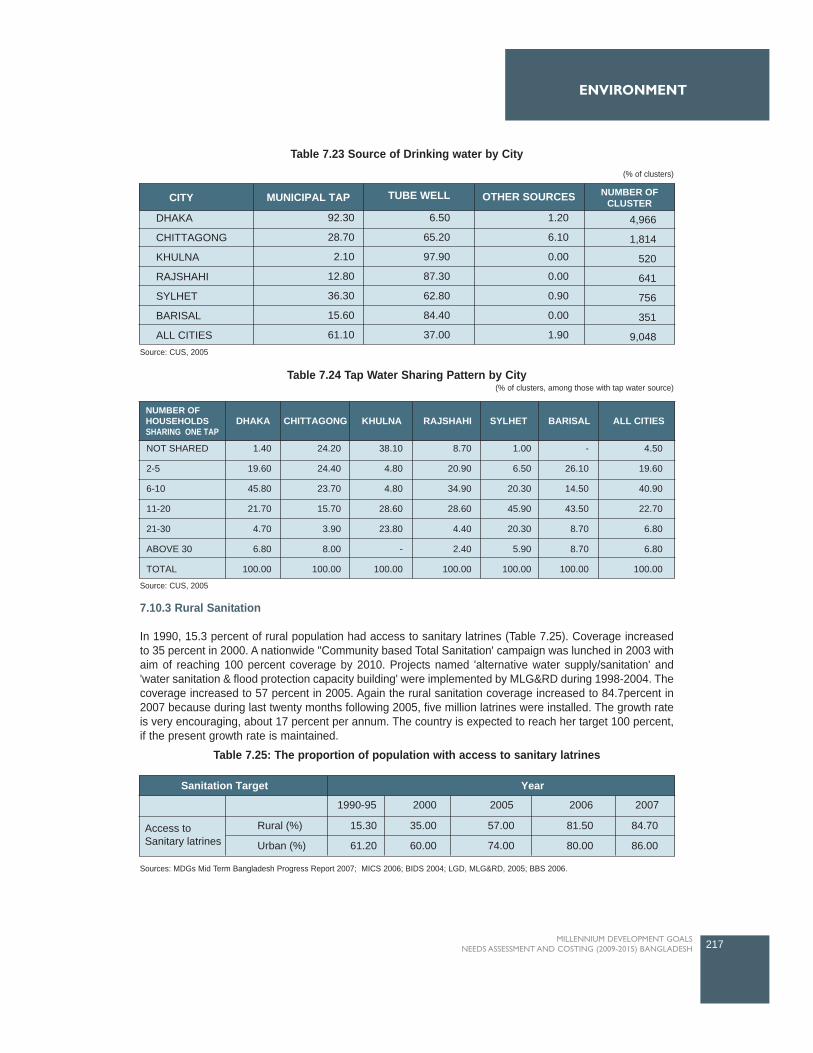
7.10.3 Rural Sanitation
In 1990, 15.3 percent of rural population had access to sanitary latrines (Table 7.25). Coverage increasedto 35 percent in 2000. A nationwide "Community based Total Sanitation' campaign was lunched in 2003 withaim of reaching 100 percent coverage by 2010. Projects named 'alternative water supply/sanitation' and'water sanitation & flood protection capacity building' were implemented by MLG&RD during 1998-2004. Thecoverage increased to 57 percent in 2005. Again the rural sanitation coverage increased to 84.7percent in2007 because during last twenty months following 2005, five million latrines were installed. The growth rateis very encouraging, about 17 percent per annum. The country is expected to reach her target 100 percent,if the present growth rate is maintained.
217MILLENNIUM DEVELOPMENT GOALS NEEDS ASSESSMENT AND COSTING (2009-2015) BANGLADESH
ENVIRONMENT
Table 7.23 Source of Drinking water by City(% of clusters)
Source: CUS, 2005
CITY MUNICIPAL TAP TUBE WELL OTHER SOURCES
4,966
1,814
520
641
756
351
9,048
1.20
6.10
0.00
0.00
0.90
0.00
1.90
6.50
65.20
97.90
87.30
62.80
84.40
37.00
92.30
28.70
2.10
12.80
36.30
15.60
61.10
DHAKA
CHITTAGONG
KHULNA
RAJSHAHI
SYLHET
BARISAL
ALL CITIES
NUMBER OFCLUSTER
DHAKA CHITTAGONG KHULNA RAJSHAHI SYLHET BARISAL ALL CITIES
NOT SHARED
2-5
6-10
11-20
21-30
ABOVE 30
TOTAL
1.40
19.60
45.80
21.70
4.70
6.80
100.00
24.20
24.40
23.70
15.70
3.90
8.00
100.00
38.10
4.80
4.80
28.60
23.80
-
100.00
8.70
20.90
34.90
28.60
4.40
2.40
100.00
1.00
6.50
20.30
45.90
20.30
5.90
100.00
-
26.10
14.50
43.50
8.70
8.70
100.00
4.50
19.60
40.90
22.70
6.80
6.80
100.00
NUMBER OFHOUSEHOLDSSHARING ONE TAP
Table 7.24 Tap Water Sharing Pattern by City(% of clusters, among those with tap water source)
Source: CUS, 2005
20072006200520001990-95
YearSanitation Target
84.70
86.00
81.50
80.00
57.00
74.00
35.00
60.00
15.30
61.20
Rural (%)
Urban (%)Access toSanitary latrines
Table 7.25: The proportion of population with access to sanitary latrines
Sources: MDGs Mid Term Bangladesh Progress Report 2007; MICS 2006; BIDS 2004; LGD, MLG&RD, 2005; BBS 2006.
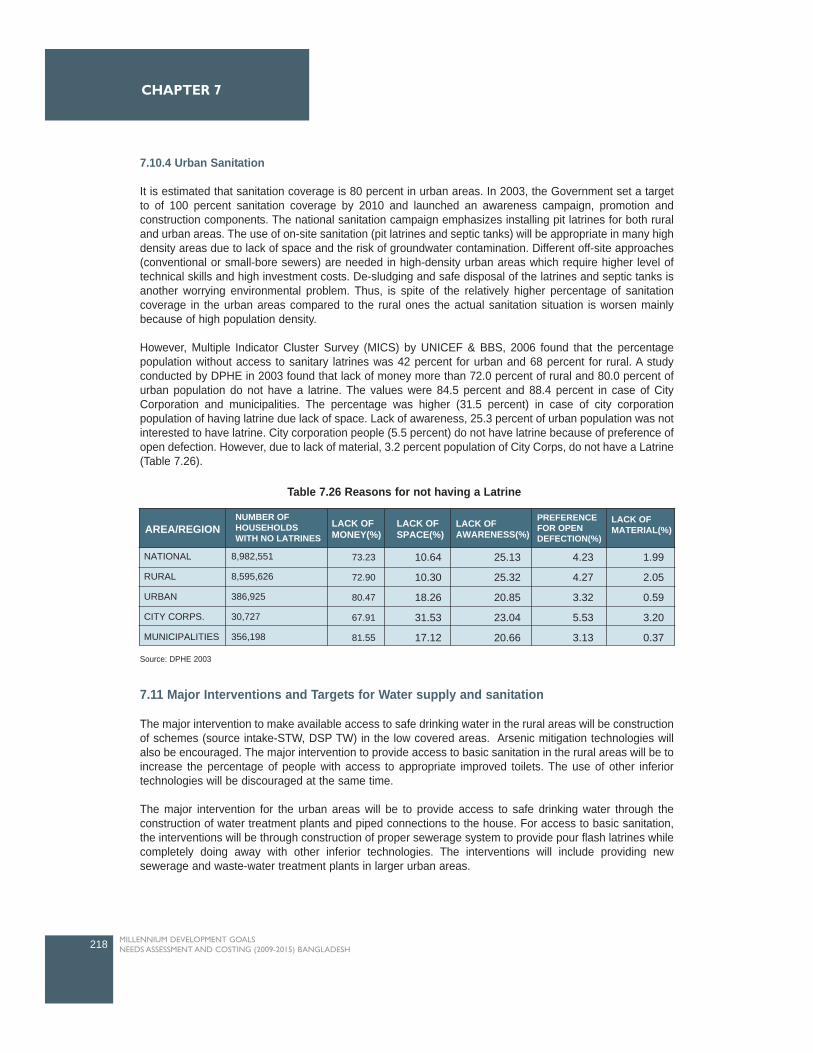
7.10.4 Urban Sanitation
It is estimated that sanitation coverage is 80 percent in urban areas. In 2003, the Government set a targetto of 100 percent sanitation coverage by 2010 and launched an awareness campaign, promotion andconstruction components. The national sanitation campaign emphasizes installing pit latrines for both ruraland urban areas. The use of on-site sanitation (pit latrines and septic tanks) will be appropriate in many highdensity areas due to lack of space and the risk of groundwater contamination. Different off-site approaches(conventional or small-bore sewers) are needed in high-density urban areas which require higher level oftechnical skills and high investment costs. De-sludging and safe disposal of the latrines and septic tanks isanother worrying environmental problem. Thus, is spite of the relatively higher percentage of sanitationcoverage in the urban areas compared to the rural ones the actual sanitation situation is worsen mainlybecause of high population density.
However, Multiple Indicator Cluster Survey (MICS) by UNICEF & BBS, 2006 found that the percentagepopulation without access to sanitary latrines was 42 percent for urban and 68 percent for rural. A studyconducted by DPHE in 2003 found that lack of money more than 72.0 percent of rural and 80.0 percent ofurban population do not have a latrine. The values were 84.5 percent and 88.4 percent in case of CityCorporation and municipalities. The percentage was higher (31.5 percent) in case of city corporationpopulation of having latrine due lack of space. Lack of awareness, 25.3 percent of urban population was notinterested to have latrine. City corporation people (5.5 percent) do not have latrine because of preference ofopen defection. However, due to lack of material, 3.2 percent population of City Corps, do not have a Latrine(Table 7.26).
7.11 Major Interventions and Targets for Water supply and sanitation
The major intervention to make available access to safe drinking water in the rural areas will be constructionof schemes (source intake-STW, DSP TW) in the low covered areas. Arsenic mitigation technologies willalso be encouraged. The major intervention to provide access to basic sanitation in the rural areas will be toincrease the percentage of people with access to appropriate improved toilets. The use of other inferiortechnologies will be discouraged at the same time.
The major intervention for the urban areas will be to provide access to safe drinking water through theconstruction of water treatment plants and piped connections to the house. For access to basic sanitation,the interventions will be through construction of proper sewerage system to provide pour flash latrines whilecompletely doing away with other inferior technologies. The interventions will include providing newsewerage and waste-water treatment plants in larger urban areas.
218 MILLENNIUM DEVELOPMENT GOALS NEEDS ASSESSMENT AND COSTING (2009-2015) BANGLADESH
CHAPTER 7
NUMBER OFHOUSEHOLDSWITH NO LATRINES
LACK OFMONEY(%)
LACK OFSPACE(%)
LACK OFAWARENESS(%)
PREFERENCEFOR OPENDEFECTION(%)
LACK OFMATERIAL(%)
10.64
10.30
18.26
31.53
17.12
NATIONAL
RURAL
URBAN
CITY CORPS.
MUNICIPALITIES
8,982,551
8,595,626
386,925
30,727
356,198
73.23
72.90
80.47
67.91
81.55
25.13
25.32
20.85
23.04
20.66
4.23
4.27
3.32
5.53
3.13
1.99
2.05
0.59
3.20
0.37
AREA/REGION
Table 7.26 Reasons for not having a Latrine
Source: DPHE 2003
Common interventions in both urban and rural areas will be to focus on improving drinking water standardsthrough monitoring of water quality and training to build up the capacity of the government (DPHE), NGOsand private individuals. Rehabilitation and repair of old and non-functional infrastructure will continue, andawareness and educational programmes will also be under-taken to emphasize the importance of safedrinking water and basic sanitation.
The total population was 140.6 million in 2006 where 75 percent live in rural areas. The number of ruralhousehold was 21.2 million. The average household size, 4.9 persons have been used. The populationgrowth rate was 0.95 for rural and 2.98 for urban areas.
As the MDG water and sanitation targets are well on track, the coverage targets for both urban and ruralareas are to provide universal access to safe drinking water and basic sanitation by 2011 and 2010respectively. The coverage targets for provision of sewerage and wastewater treatment facilities in the fiveurban divisional cities by 2015.
7.11.1 Rural Areas
The major interventions for providing access to safe drinking water in the rural areas are:
Increase access of rural communities through the ongoing Rural Water Supply & Sanitation programme,which include the construction of schemes and extension of existing ones; like increase the numbers ofShallow Tubewell (STW), Deep Set Pump (DSP) Tubewell and Arsenic Mitigation Technology which are costeffective, durable and simple.
Rural Water Infrastructure Coverage
The percentage of rural population who will be provided with access to safe drinking water will be increasedfrom the existing 71 percent to near 100 by 2011 through the construction of more schemes andrehabilitation of existing ones.
Shallow Tubewell
The depth of STW is typically within 30-50 m. STW is a low cost, easy to operate and maintain robusttechnology. It is the common technology in Bangladesh. When the GWT is below the suction limit of 7.5 m,the STW are not functional. In some areas, water from shallow depths are contaminated by Arsenic. Atpresent 29 percent of population are covered STW and it is expected that water coverage will be nearlysame in 2015. Unit cost of a STW is BDT 5,000 (according to DPHE).
Deep Set Pump Tubewell
The depth of deep set tubewell (DST) is usually within 100 to 150 m. Due to excessive withdrawal of GWfor irrigation, the GW level is gradually lowering, particularly during the dry season. As such there is anincreasing trend of the LWT areas, which at present is estimated to be 26 percent of the total area ofBangladesh. The use of DSP TW technology is also increasing in those areas. At present 19 percentpopulation is covered by DSP. Due to the increasing demand, it is expected that the coverage will reach to32 percent by 2015. The unit cost of a DSP is set to be BDT 15,000
Deep Tubewell
Deep tubewells (DTW) are used to extract water from deeper aquifers. In Bangladesh, a handpump tubewellis called a deep tubewell when its depth is over 75m. DTW technology operates under suction mode in thesame principal as a STW, the only difference is that the depth of the tubewell is more than 75m DTWtechnology is mostly used in the saline zone (coastal belt) where the depth of tubewell is around 300 m.
219MILLENNIUM DEVELOPMENT GOALS NEEDS ASSESSMENT AND COSTING (2009-2015) BANGLADESH
ENVIRONMENT

However, due to arsenic in groundwater, DTW technology increased all over Bangladesh. Water from DTWis free from arsenic that many studies documented. The technology is easy to operate and robust like STW.At present seven percent population are covered by DTW and it is expected the coverage will be same in2015 because of its installation cost is too high. As such, only, a limited number of houses can afford aprivate tubewell and most of the population depends on the public community wells.
Arsenic Mitigation Technology
Arsenic mitigation technologies are considered as a separate technology because of the vast magnitude ofthe problem. The government of Bangladesh has recommended four alternative technologies for arsenicaffected areas. These technologies avoid the use of arsenic contaminated groundwater. They are (i) dugwells, (ii) pond sand filter, (iii) rain water harvesting and (iv) deep tubewells (using deep aquifer that isarsenic free). Apart from these recommended technologies many household and community levels arsenicremoval alternative technologies are being tried out. Appropriate technological solutions are being tried outthough many are still in a development stage in Bangladesh. Piped water supply is also considered as afeasible option for many arsenic affected areas. Arsenic removal technologies require validation from theGovernment. More than 22 percent tube wells are contaminated by arsenic of Adopting alternative cleanwater source technologies like arsenic mitigation technology that is cost effective, durable and simple.Currently 16 percent population is covered by Arsenic mitigation technology and it is expected that thecoverage will be increased to about 22 percent by 2015. Unit cost of a DTW is set to be BDT 45,000
Rural Piped Water Supply System
There are a very limited number of rural piped water supply schemes in water-scarce LWT areas innorthwestern part of Bangladesh. Recently piped water supply is being promoted as an alternative to thearsenic contaminated hand tubewells and also in villages where the socio-economic conditions arefavorable. Many villages in Bangladesh are believed to have potential to move from manually operatedhandpump tubewells to piped water systems. Unlike HTWs and other alternative technologies, piped watersupply systems might need proper drainage system as domestic water use (bathing, washing, etc) is muchhigher. It is expected the piped water supply will be increased to about ten percent by 2015.
Rural Sanitation
The percentage of the rural population who will be provided with access to sanitation through improvedtoilets will increase from 81.5 to 100 by 2015. The main intervention for providing access to basic sanitationin the rural areas is to increase access to rural communities by upgrading sanitation facilities. In rural areas,sanitation infrastructures are generally single pit pour-flush water- seal latrines, improved pit latrine, septictank and VIP. Table 7.27 presents the rural sanitation infrastructures coverage and unit cost of eachinfrastructure.
220 MILLENNIUM DEVELOPMENT GOALS NEEDS ASSESSMENT AND COSTING (2009-2015) BANGLADESH
CHAPTER 7
Table 7.27: Rural Sanitation Infrastructure Coverage and Unit Cost
Implied % popCovered, 2006
Target % popcovered, 2015
# HH perConnection Unit Cost (BDT)
Rural Sanitation Infrastructure Coverage
1
1
1
1
Single pit pour- flush water- seal latrine
Improved pit latrine (Two Pit)
Septic tank
VIP
Total
26.00%
32.50%
17.00%
6.00%
81.50%
58.00%
35.00%
5.00%
2.00%
100.00%
10,618.00
7,190.00
50,690.00
10,618.00
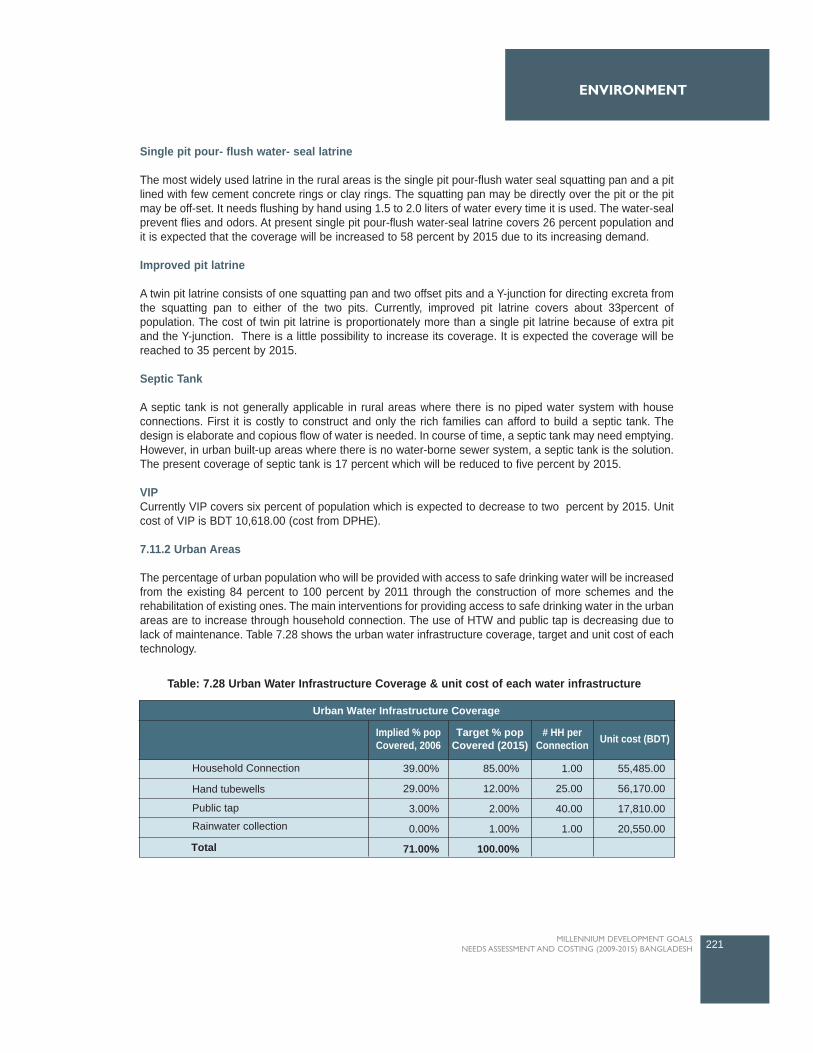
Single pit pour- flush water- seal latrine
The most widely used latrine in the rural areas is the single pit pour-flush water seal squatting pan and a pitlined with few cement concrete rings or clay rings. The squatting pan may be directly over the pit or the pitmay be off-set. It needs flushing by hand using 1.5 to 2.0 liters of water every time it is used. The water-sealprevent flies and odors. At present single pit pour-flush water-seal latrine covers 26 percent population andit is expected that the coverage will be increased to 58 percent by 2015 due to its increasing demand.
Improved pit latrine
A twin pit latrine consists of one squatting pan and two offset pits and a Y-junction for directing excreta fromthe squatting pan to either of the two pits. Currently, improved pit latrine covers about 33percent ofpopulation. The cost of twin pit latrine is proportionately more than a single pit latrine because of extra pitand the Y-junction. There is a little possibility to increase its coverage. It is expected the coverage will bereached to 35 percent by 2015.
Septic Tank
A septic tank is not generally applicable in rural areas where there is no piped water system with houseconnections. First it is costly to construct and only the rich families can afford to build a septic tank. Thedesign is elaborate and copious flow of water is needed. In course of time, a septic tank may need emptying.However, in urban built-up areas where there is no water-borne sewer system, a septic tank is the solution.The present coverage of septic tank is 17 percent which will be reduced to five percent by 2015.
VIPCurrently VIP covers six percent of population which is expected to decrease to two percent by 2015. Unitcost of VIP is BDT 10,618.00 (cost from DPHE).
7.11.2 Urban Areas
The percentage of urban population who will be provided with access to safe drinking water will be increasedfrom the existing 84 percent to 100 percent by 2011 through the construction of more schemes and therehabilitation of existing ones. The main interventions for providing access to safe drinking water in the urbanareas are to increase through household connection. The use of HTW and public tap is decreasing due tolack of maintenance. Table 7.28 shows the urban water infrastructure coverage, target and unit cost of eachtechnology.
221MILLENNIUM DEVELOPMENT GOALS NEEDS ASSESSMENT AND COSTING (2009-2015) BANGLADESH
ENVIRONMENT
Implied % popCovered, 2006
Household Connection
Hand tubewells
Public tap
Rainwater collection
Total
Target % popCovered (2015)
# HH perConnection Unit cost (BDT)
Urban Water Infrastructure Coverage
39.00%
29.00%
3.00%
0.00%
71.00%
85.00%
12.00%
2.00%
1.00%
100.00%
1.00
25.00
40.00
1.00
55,485.00
56,170.00
17,810.00
20,550.00
Table: 7.28 Urban Water Infrastructure Coverage & unit cost of each water infrastructure

Urban Water Infrastructure Coverage
Household Connection
Houses that are directly connected to the piped system have the highest comfort of water supply since therewill be internal pumping with several water points inside the house like baths, showers and toilets. This typeof connection has the highest per capita use of water as a result of the high availability of the water (e.g. forbath, shower and flush-toilet). The cost of one m3 is low as compared to other service levels, ranging fromBDT 30 to 200 per month, varying with pourashava / city but also depending on the size of the connection.At present, household connection covered 39 percent of the total urban population which is expected toincrease 85 percent by 2015.
Hand tubewells
A number of hand tubewells (HTW) for public use have been sunk in the Pourashavas, mostly outside theareas served by piped supply. These tubewells are maintained by the local DPHE office and by caretakersand users themselves. As with public taps, over time the number of tubewells has gone down due to wearof the pumps and boreholes and lack of maintenance. HTW currently covers 29 percent of the urbanpopulation. It is expected that the coverage will be decreased to 12 percent by 2015.
Public tap
In many Pourashava, public taps are used by people who do not have house connection or public tap butlive within the area of the piped system. Usually there is no charge for the water thus obtained but alsocomfort is lower than the other two types of piped connection. Supervision of the tap is not always availableleading to vandalism or theft, rendering the tap useless and often the tap is then closed and sealed off. Overtime the number of public taps in most municipalities has diminished. At present, public tap covered 2.5percent of population which will go down to two percent by 2015 due to its proper supervision andmaintenance.
Rainwater collection
A very few numbers of people collect rain water for their consumption. There is a target to increase thecoverage of one percent by 2015.
Urban sanitation
The focus on sanitation in the urban areas will be to provide improved access of sanitation which is expectedto be increased from 80 percent to 100 percent by 2010. The above described rural sanitation options existalso for urban areas, their applicability depending on the population density. Other options, specific for urbanareas, are described in Table 7.29. The main interventions for providing access to sanitation in urban areasare described below:
222 MILLENNIUM DEVELOPMENT GOALS NEEDS ASSESSMENT AND COSTING (2009-2015) BANGLADESH
CHAPTER 7
Implied % popCovered 2006
Conventional Sewer systems
Simplified sewerage
Septic tank
Pour flush latrine
VIP
Public toilets
Total
20.00%
1.00%
15.00% 1
1
1
1
1
1
20,550.00
Target % popCovered (2015)
# HH perConnection Unit cost (BDT)
Urban Sanitation Infrastructure Coverage
14.50%
34.00%
5.00%
4.00%
78.50%
0.00%
10.00%
68.00%
2.00%
5.00%
100.00%
10,138.00
26,520.00
10,618.00
10,618.00
500,000.00
Table: 7.29: Urban Sanitation Infrastructure Coverage & unit cost of each sanitation infrastructure
Conventional sewer systems
The collection and transport of wastewater by means of sewers is a well known method widely applied allover the world. The amount of wastewater discharged to the system should be sufficient to let the self-cleaning process take place in the sewer pipes. If the water use is low then too many blockage will appear.The collected wastewater needs adequate treatment before the effluent can be discharged into open watersto protect downstream water users from polluted sources.
Wastewater collection as well as treatment is a costly undertaking (for investment as well as in operationand maintenance) and if cost-recovery methods would be applied to set the tariffs for users of the systems,these probably would be just as high or higher than a full cost-recovery tariffs for drinking water supply. InBangladesh a very minor part of population is served by sewerage systems (only the central and south partof Dhaka), it would be worthwhile to consider other methods of sanitation for the remaining areas ofBangladesh. Therefore, it is expected that the coverage will be decreased from 20 percent in 2008 to 15percent in 2015.
Pour flush latrine
Suitability of Pour flush latrine is described in the above section, the most widely acceptable latrine in ruralas well as urban areas. The present coverage is 34 percent which is expected to increase 68 percent by2015.
Waste water treatment coverage
Currently 30 percent of sewer connections are fitted with wastewater treatment where ten percent for eachprimary, secondary and advance treatment are taken place. It is expected that the 60 percent of existingsewer connections will be connected for waste water treatment and 70 percent of newly built sewerconnection will be fitted for waste water treatment.
223MILLENNIUM DEVELOPMENT GOALS NEEDS ASSESSMENT AND COSTING (2009-2015) BANGLADESH
ENVIRONMENT
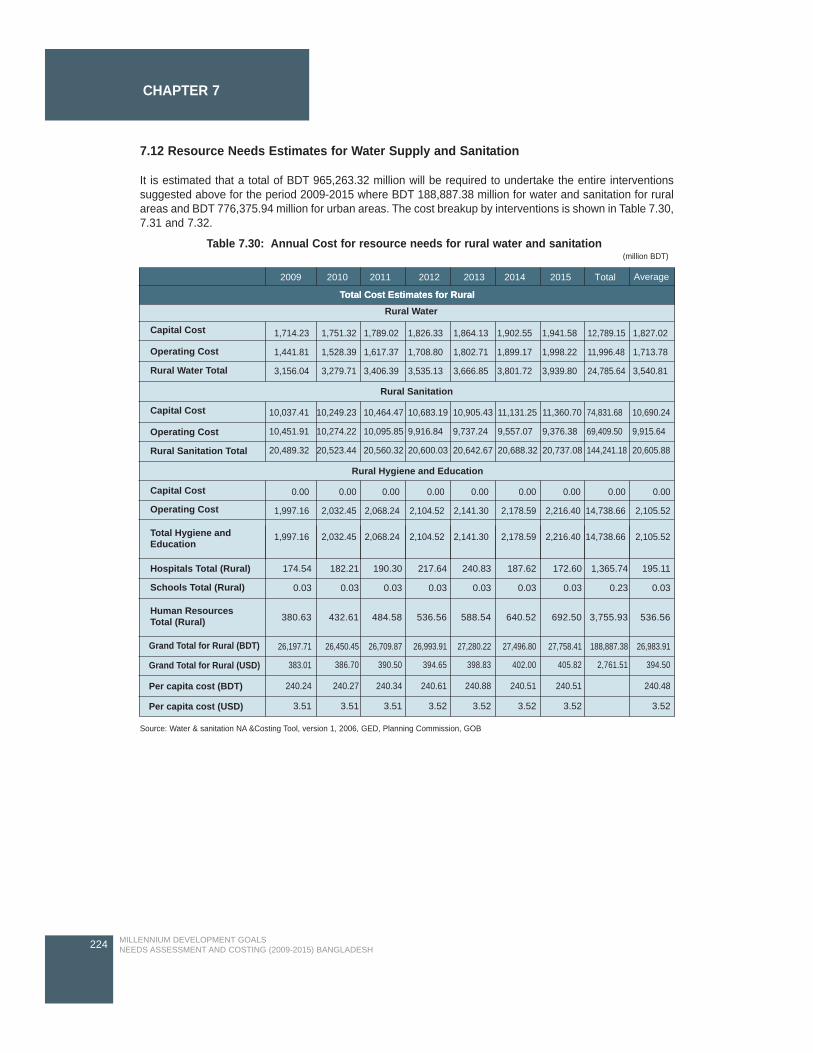
7.12 Resource Needs Estimates for Water Supply and Sanitation
It is estimated that a total of BDT 965,263.32 million will be required to undertake the entire interventionssuggested above for the period 2009-2015 where BDT 188,887.38 million for water and sanitation for ruralareas and BDT 776,375.94 million for urban areas. The cost breakup by interventions is shown in Table 7.30,7.31 and 7.32.
224 MILLENNIUM DEVELOPMENT GOALS NEEDS ASSESSMENT AND COSTING (2009-2015) BANGLADESH
CHAPTER 7
2009 2010 2011 2012 2013 2014 2015 Total Average
Capital Cost
Operating Cost
Rural Water Total
Capital Cost
Operating Cost
Capital Cost
Operating Cost
Hospitals Total (Rural) 174.54
0.03 0.03 0.03 0.03 0.03 0.03 0.03 0.23 0.03
182.21 190.30 217.64 240.83 187.62 172.60 1,365.74 195.11
Schools Total (Rural)
Human ResourcesTotal (Rural)
26,197.71
383.01
240.24
3.51 3.51 3.51 3.52 3.52 3.52 3.52 3.52
240.27 240.34 240.61 240.88 240.51 240.51 240.48
26,709.87 26,993.91 27,280.22 27,496.80 27,758.41 188,887.38 26,983.9126,450.45
Per capita cost (USD)
Per capita cost (BDT)
Grand Total for Rural (BDT)
Grand Total for Rural (USD)
Total Hygiene andEducation
Rural Sanitation Total
Total Cost Estimates for RuralTotal Cost Estimates for Rural
Rural Water
1,751.32
1,528.39
3,279.71
1,714.23
1,441.81
3,156.04
1,789.02
1,617.37
3,406.39
1,826.33
1,708.80
3,535.13
1,864.13
1,802.71
3,666.85
1,902.55
1,899.17
3,801.72
10,037.41
10,451.91
20,489.32
0.00
1,997.16
1,997.16
0.00
2,032.45
2,032.45
0.00
2,068.24
2,068.24
0.00
2,104.52
2,104.52
0.00
2,141.30
2,141.30
0.00
2,178.59
2,178.59
0.00
2,216.40
2,216.40
0.00
14,738.66
14,738.66
0.00
2,105.52
2,105.52
10,249.23
10,274.22
20,523.44
10,464.47
10,095.85
20,560.32
10,683.19
9,916.84
20,600.03
10,905.43
9,737.24
20,642.67
11,131.25
9,557.07
20,688.32
11,360.70
9,376.38
20,737.08
74,831.68
69,409.50
144,241.18
10,690.24
9,915.64
20,605.88
1,941.58
1,998.22
3,939.80
1,827.02
1,713.78
3,540.81
12,789.15
11,996.48
24,785.64
Rural Sanitation
Rural Hygiene and Education
380.63 432.61
386.70 390.50 394.65 398.83 402.00 405.82 2,761.51 394.50
484.58 536.56 588.54 640.52 692.50 3,755.93 536.56
Table 7.30: Annual Cost for resource needs for rural water and sanitation(million BDT)
Source: Water & sanitation NA &Costing Tool, version 1, 2006, GED, Planning Commission, GOB
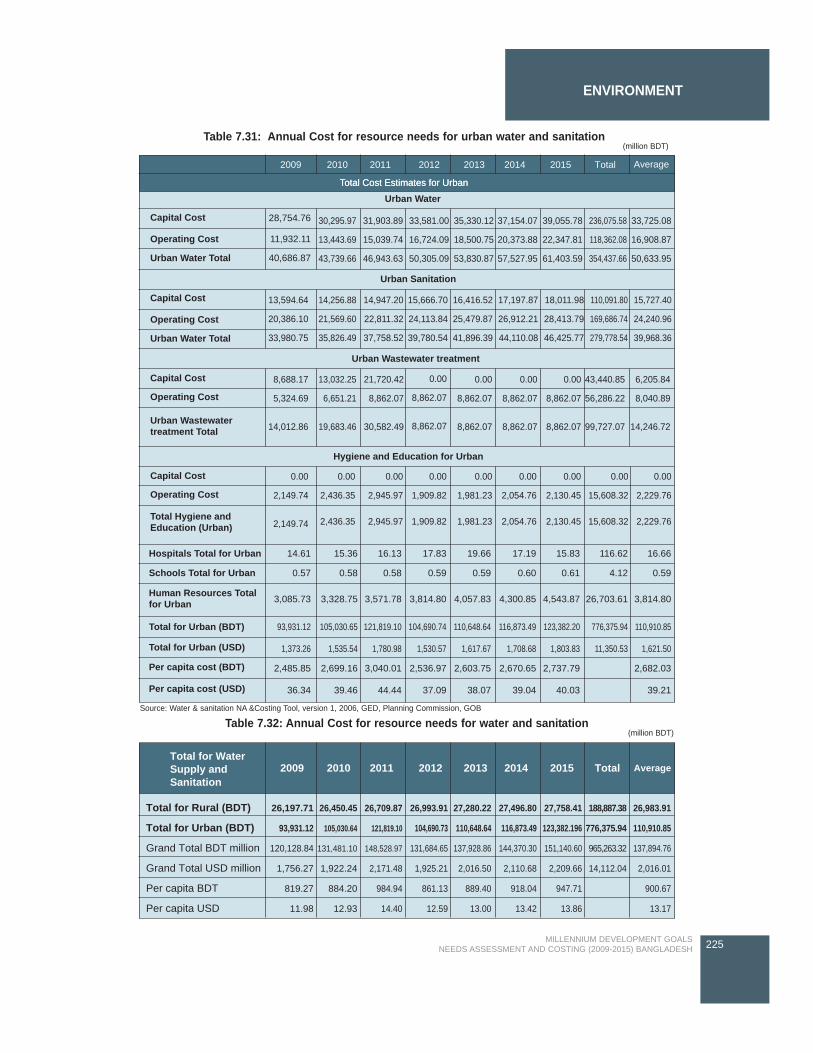
225MILLENNIUM DEVELOPMENT GOALS NEEDS ASSESSMENT AND COSTING (2009-2015) BANGLADESH
ENVIRONMENT
2009 2010 2011 2012 2013 2014 2015 Total Average
Capital Cost 28,754.76
Operating Cost 11,932.11
Urban Water Total
Capital Cost
Operating Cost
Capital Cost
Operating Cost
Capital Cost
Operating Cost
Hospitals Total for Urban 14.61 15.36 16.13 17.83 19.66 17.19 15.83 116.62 16.66
0.57 0.58 0.58 0.59 0.59 0.60 0.61 4.12 0.59
3,085.73 3,328.75 3,571.78 3,814.80 4,057.83 4,300.85 4,543.87 26,703.61 3,814.80
93,931.12 105,030.65 121,819.10 104,690.74 110,648.64 116,873.49 123,382.20 776,375.94 110,910.85
1,373.26 1,535.54 1,780.98 1,530.57 1,617.67 1,708.68 1,803.83 11,350.53 1,621.50
2,485.85 2,699.16 3,040.01 2,536.97 2,603.75 2,670.65 2,737.79 2,682.03
36.34 39.46 44.44 37.09 38.07 39.04 40.03 39.21
Schools Total for Urban
Total for Urban (BDT)
Total for Urban (USD)
Per capita cost (BDT)
Per capita cost (USD)
Human Resources Totalfor Urban
Urban Wastewatertreatment Total
Total Hygiene andEducation (Urban)
Urban Water Total
40,686.87
Total Cost Estimates for UrbanTotal Cost Estimates for Urban
Urban Water
30,295.97
13,443.69
43,739.66
31,903.89
15,039.74
46,943.63
33,581.00
16,724.09
50,305.09
35,330.12
18,500.75
53,830.87
37,154.07
20,373.88
57,527.95
13,594.64
20,386.10
33,980.75
8,688.17
5,324.69
14,012.86
0.00
2,149.74
2,149.74
0.00
2,436.35
2,436.35
0.00
2,945.97
2,945.97
0.00
1,909.82
1,909.82
0.00
1,981.23
1,981.23
0.00
2,054.76
2,054.76
0.00
2,130.45
2,130.45
0.00
15,608.32
15,608.32
0.00
2,229.76
2,229.76
13,032.25
6,651.21
19,683.46
21,720.42
8,862.07
30,582.49
0.00
8,862.07
8,862.07
0.00
8,862.07
8,862.07
0.00
8,862.07
8,862.07
0.00
8,862.07
8,862.07
43,440.85
56,286.22
99,727.07
6,205.84
8,040.89
14,246.72
14,256.88
21,569.60
35,826.49
14,947.20
22,811.32
37,758.52
15,666.70
24,113.84
39,780.54
16,416.52
25,479.87
41,896.39
17,197.87
26,912.21
44,110.08
18,011.98
28,413.79
46,425.77
110,091.80
169,686.74
279,778.54
15,727.40
24,240.96
39,968.36
39,055.78
22,347.81
61,403.59
33,725.08
16,908.87
50,633.95
236,075.58
118,362.08
354,437.66
Urban Sanitation
Urban Wastewater treatment
Hygiene and Education for Urban
Table 7.31: Annual Cost for resource needs for urban water and sanitation (million BDT)
Source: Water & sanitation NA &Costing Tool, version 1, 2006, GED, Planning Commission, GOB
Table 7.32: Annual Cost for resource needs for water and sanitation (million BDT)
Total for WaterSupply andSanitation
Total for Rural (BDT)
Total for Urban (BDT)
Grand Total BDT million
Grand Total USD million
Per capita BDT
Per capita USD
26,197.71
93,931.12
120,128.84
1,756.27
819.27
11.98
26,450.45
105,030.64
131,481.10
1,922.24
884.20
12.93
26,709.87
121,819.10
148,528.97
2,171.48
984.94
14.40
26,993.91
104,690.73
131,684.65
1,925.21
861.13
12.59
27,280.22
110,648.64
137,928.86
2,016.50
889.40
13.00
27,496.80
116,873.49
144,370.30
2,110.68
918.04
13.42
27,758.41
123,382.196
151,140.60
2,209.66
947.71
13.86
26,983.91
110,910.85
137,894.76
2,016.01
900.67
13.17
188,887.38
776,375.94
965,263.32
14,112.04
2009 2010 2011 2012 2013 2014 2015 Total Average

226 MILLENNIUM DEVELOPMENT GOALS NEEDS ASSESSMENT AND COSTING (2009-2015) BANGLADESH
CHAPTER 7

SUMMARY AND CONCLUSION
Poverty and Hunger
In order to successfully achieve the MDG1 related to poverty and hunger, economic growth must have astronger pro-poor orientation. This should be reflect in overall macroeconomic policy and budgeting for thesuccessful implementation of the proposed poverty alleviation interventions, including focused and targetedpoverty interventions. It is especially crucial that higher growth rates for the agriculture sector are stimulatedthrough increased allocation of resources and investments in policies on agricultural subsidies, extension,and legislation such as the Land Act. These will have considerable impact on the agricultural productivity ofsmallholder farmers, and need to be reviewed to ensure that they facilitate poverty reduction and equitableaccess. Rural credit also forms a critical element for the success, as indicated in some of the interventionsmentioned above. Ensuring access to affordable micro-insurance schemes, particularly for the poorer andvulnerable households, should be enhanced. Similarly, enhancing other rural income generationopportunities will require policies that support the development of small and micro intermediaries andeconomic facilities.
Bangladesh's progress on the MDG1 indicators during the 1990s has been good, but challenges remainmoving forward. Indeed, there are several areas of concern highlighted in this report. First, there are verylarge regional disparities in virtually all of the MDG1 indicators in Bangladesh. Divisions such as Barisal,Rajshahi and Khulna have generally not performed well on several of the MDG1 indicators. Even ifBangladesh as a whole attains some of the MDG1 indicators, there will be several areas of the country thatwill remain distantly behind. In particular, these are specific rural and urban areas, as well as specializedzones such as haor, hilly areas, coastal areas and char areas. The analysis also suggests that achievementthus far of many of the MDG1 indicators is geographically concentrated in a few regions. This in turn meansthat targeted interventions, central government resources, and economic growth opportunities to the laggingdivisions are needed to speed up the attainment of MDG1.
The primary challenges and actions needed to address are addressed to achieving the targets of MDG1 by2015 are: reducing hunger and malnutrition; comprehensive programmes of integrated actions on manyfronts including youth unemployment; supporting effective and sustainable safety net programmes for thevulnerable in poor areas; promoting pro-poor growth; expansion of rural infrastructure for ensuring accessto health and modern facilities; and strengthening rural-urban market linkages for the poor.
The major interventions and targets for MDG1 are agriculture and rural development which consists ofincreasing agricultural productivity, investments in soil health, improved seeds, plant protection, small scaleirrigation and water management, agricultural research, extension services of DAE, DLS and DoF, andsubsidy in agriculture. Rural incomes and access to markets that includes building storage facilities toreduce post-harvest losses, agro-processing activities, access to micro credit.
The long term strategies to address urban poverty including formulation urban development plans to improvethe living standards of the urban poor and the whole urban settlements at large should be initiated. There isa need to effectively address the growing rural-urban migration trends that have serious implications for theemergence of urban poverty and acute farm labour shortages. Improving rural access will require reviewingpolicies and regulations related to road construction in rural areas, especially the prolonged delays inacquiring required clearances, the maintenance of road infrastructure. Moreover, the following policiestowards addressing the roads infrastructure to the rural areas are mentioned as:
Ensure rural-urban linkages through selective expansion of district to village road network Extension and improvement of railway network access to rural poor;Ensure water transport services to the mass people especially poor people in unfavorable zone.Prioritize development of road communication to link growth center, union head quarters, upazilahead quarters and national road systemExtension of reliable and affordable electricity in the rural area of Bangladesh.
229MILLENNIUM DEVELOPMENT GOALS NEEDS ASSESSMENT AND COSTING (2009-2015) BANGLADESH
CHAPTER 8SUMMARY AND CONCLUSION
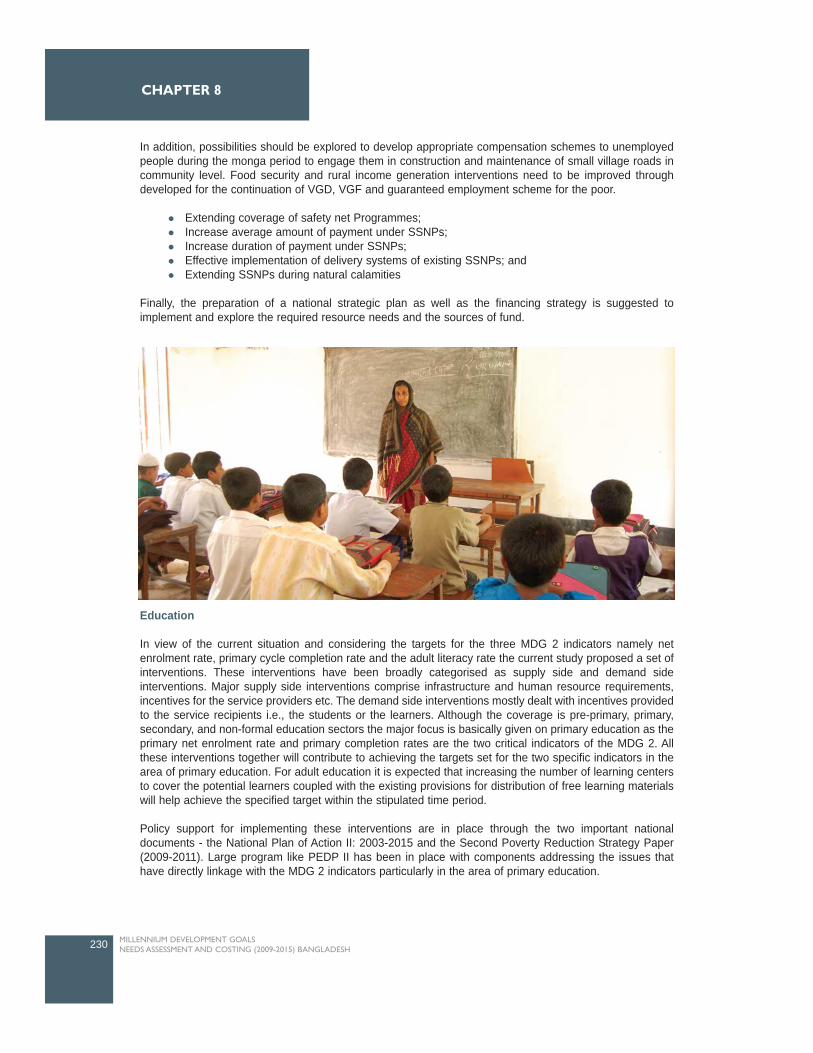
In addition, possibilities should be explored to develop appropriate compensation schemes to unemployedpeople during the monga period to engage them in construction and maintenance of small village roads incommunity level. Food security and rural income generation interventions need to be improved throughdeveloped for the continuation of VGD, VGF and guaranteed employment scheme for the poor.
Extending coverage of safety net Programmes;Increase average amount of payment under SSNPs;Increase duration of payment under SSNPs;Effective implementation of delivery systems of existing SSNPs; andExtending SSNPs during natural calamities
Finally, the preparation of a national strategic plan as well as the financing strategy is suggested toimplement and explore the required resource needs and the sources of fund.
Education
In view of the current situation and considering the targets for the three MDG 2 indicators namely netenrolment rate, primary cycle completion rate and the adult literacy rate the current study proposed a set ofinterventions. These interventions have been broadly categorised as supply side and demand sideinterventions. Major supply side interventions comprise infrastructure and human resource requirements,incentives for the service providers etc. The demand side interventions mostly dealt with incentives providedto the service recipients i.e., the students or the learners. Although the coverage is pre-primary, primary,secondary, and non-formal education sectors the major focus is basically given on primary education as theprimary net enrolment rate and primary completion rates are the two critical indicators of the MDG 2. Allthese interventions together will contribute to achieving the targets set for the two specific indicators in thearea of primary education. For adult education it is expected that increasing the number of learning centersto cover the potential learners coupled with the existing provisions for distribution of free learning materialswill help achieve the specified target within the stipulated time period.
Policy support for implementing these interventions are in place through the two important nationaldocuments - the National Plan of Action II: 2003-2015 and the Second Poverty Reduction Strategy Paper(2009-2011). Large program like PEDP II has been in place with components addressing the issues thathave directly linkage with the MDG 2 indicators particularly in the area of primary education.
230 MILLENNIUM DEVELOPMENT GOALS NEEDS ASSESSMENT AND COSTING (2009-2015) BANGLADESH
CHAPTER 8
SUMMARY AND CONCLUSION
Still there are challenges in implementing these interventions within the specified timeframe in terms offinancial and human resource capacity. The estimated cost of implementing the suggested programs forachieving the MDG for education will require a huge amount of budgetary allocation. Need for a large poolof human resources with adequate managerial and technical skills cannot be denied. In both these areasthere is enough room for the development partners to participate in the development activities and helpachieving the MDG goals related to education. This will ease the path for achieving the other MDGs too.
Gender
The government's commitment to gender equity is the result of decades of development work inBangladesh. The suggested interventions are expected to contribute to achieve the goals set out in MDGgoals related to gender equality. The interventions for gender equality are believed to bring change in theattitude of policy makers, civil servants, judiciary, police, public leaders and media personnel. The broadinterventions will address gender inequality for women's empowerment through dialogue with policy makers,politicians, media personnel for involvement of women in decision -making and in political bodies.
It is important that the support and involvement of policy makers will ensure community based awarenessprogramme for sustaining gender based equality in education, helping girls transition to work, encouragingwomen's political participation and parliamentary reform to encourage major political parties to increase thenumber of women's nomination during national election. Further attention of policy makers is necessary to reduce gender based violence and strengthening ofgender mainstreaming in all ministries and organizations. The policy makers are in such position that theycan influence the relevant bodies responsible to address gender inequality. They can advocate and lobbyfor increased budgetary allocation for the gender based programmes to effectively meet the desired goalsof MDG goals on gender equality.
Support should be provided to address issues like discriminatory legislative and policy provisions andpractices against women and girls. Sensitization of various groups is important and need to be done inculturally sensitive manner so they emerge as advocates for gender equality and speaks against VAW.
The practical understanding of the situation of women and prevailing gender inequality is needed to carryforward the MDG 3. Gender equity & equality is therefore one of the most important focus areas of MOWCAboth at the organizational and the program levels. As an implementing ministry efforts by MOWCA toinstitutionalize gender equity got a major boost from its first official Gender Policy in 1997. The ambitiousscope of this policy set the stage for much subsequent work in Gender, focusing MOWCA's organizationalculture, accountability, technical capacity, programme, design, implementation, monitoring & evaluation,partnership and advocacy.
However the most important matter of concern is to develop mechanisms to provide a clear picture of howto translate the Gender Policy into concrete, behavioral terms. MOWCA has focal points which stronglyencourage all sectoral ministries to have gender screening of their policies and to implement gender focusedprogrammes. The major burden of gender integration remains with the MOWCA, with its staff approachingother sectors for assessment of gender component in their work. The onus should be actually be on theother ministries to approach MOWCA, which they rarely do because gender is yet to be priority. MOWCAshould be at the lead to for ensuring integration of gender in other government sectors. This could be aneffective strategy given the marginalization of the MOWCA .
Some indicators of MDG related to reduce gender disparity are on track, some are not on track and somehave structural and socio-cultural barriers to be on the track in 2015 considering 2005 as benchmark.Therefore, if the current trends of those indicators which are far from being on track continue to it will bechallenging to reach all the goals by2015. Even the recent trends may not be continued over the next twoyears (2007-08 and 2008/09) owing to the global economic shock. Bangladesh will require massive levelsof investment to fully take up the challenges of MDG 3, in particular those where current performance isbehind schedule. It may not be possible to generate resources from domestic sources only, and will thereforerequire the support and assistance of its development partners.
231MILLENNIUM DEVELOPMENT GOALS NEEDS ASSESSMENT AND COSTING (2009-2015) BANGLADESH
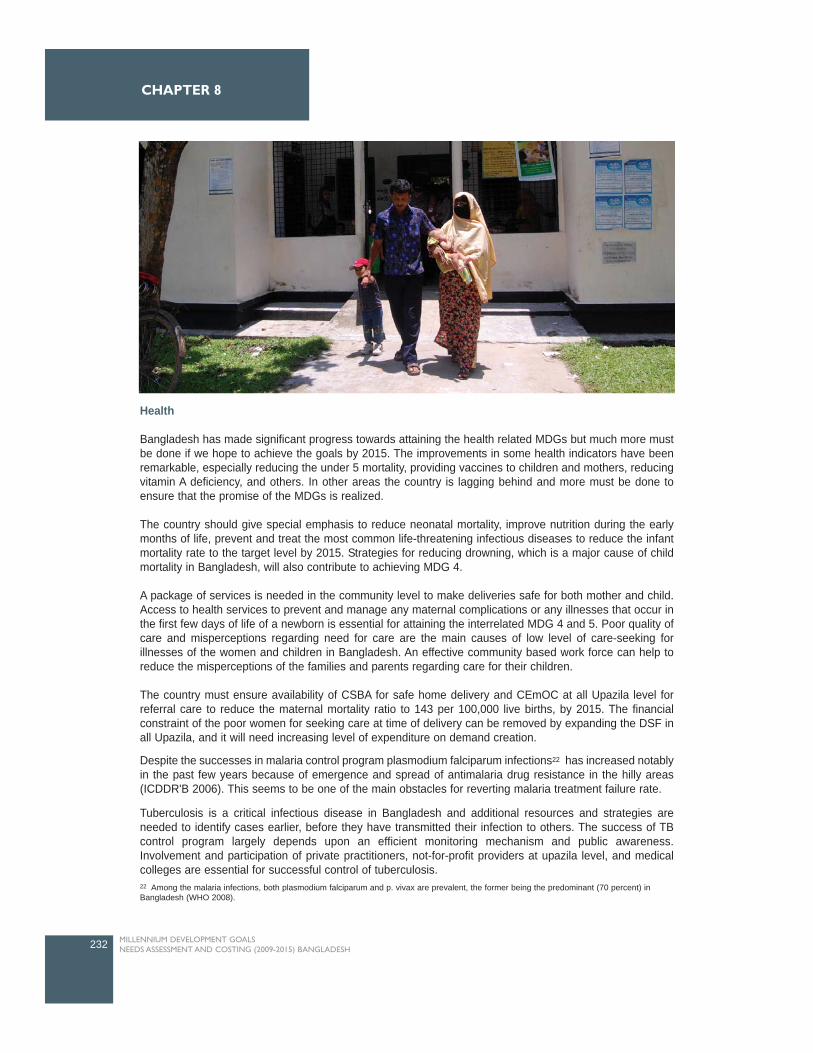
Health
Bangladesh has made significant progress towards attaining the health related MDGs but much more mustbe done if we hope to achieve the goals by 2015. The improvements in some health indicators have beenremarkable, especially reducing the under 5 mortality, providing vaccines to children and mothers, reducingvitamin A deficiency, and others. In other areas the country is lagging behind and more must be done toensure that the promise of the MDGs is realized.
The country should give special emphasis to reduce neonatal mortality, improve nutrition during the earlymonths of life, prevent and treat the most common life-threatening infectious diseases to reduce the infantmortality rate to the target level by 2015. Strategies for reducing drowning, which is a major cause of childmortality in Bangladesh, will also contribute to achieving MDG 4.
A package of services is needed in the community level to make deliveries safe for both mother and child.Access to health services to prevent and manage any maternal complications or any illnesses that occur inthe first few days of life of a newborn is essential for attaining the interrelated MDG 4 and 5. Poor quality ofcare and misperceptions regarding need for care are the main causes of low level of care-seeking forillnesses of the women and children in Bangladesh. An effective community based work force can help toreduce the misperceptions of the families and parents regarding care for their children.
The country must ensure availability of CSBA for safe home delivery and CEmOC at all Upazila level forreferral care to reduce the maternal mortality ratio to 143 per 100,000 live births, by 2015. The financialconstraint of the poor women for seeking care at time of delivery can be removed by expanding the DSF inall Upazila, and it will need increasing level of expenditure on demand creation.
Despite the successes in malaria control program plasmodium falciparum infections22 has increased notablyin the past few years because of emergence and spread of antimalaria drug resistance in the hilly areas(ICDDR'B 2006). This seems to be one of the main obstacles for reverting malaria treatment failure rate.
Tuberculosis is a critical infectious disease in Bangladesh and additional resources and strategies areneeded to identify cases earlier, before they have transmitted their infection to others. The success of TBcontrol program largely depends upon an efficient monitoring mechanism and public awareness.Involvement and participation of private practitioners, not-for-profit providers at upazila level, and medicalcolleges are essential for successful control of tuberculosis.
232 MILLENNIUM DEVELOPMENT GOALS NEEDS ASSESSMENT AND COSTING (2009-2015) BANGLADESH
CHAPTER 8
22 Among the malaria infections, both plasmodium falciparum and p. vivax are prevalent, the former being the predominant (70 percent) inBangladesh (WHO 2008).
The low HIV/AIDS prevalence among the general population in Bangladesh places the country in a goodposition to halting and reversing the spread of HIV/AIDS by 2015. However, one of the major challenges isto provide treatment and care to all PLHIV. The exact number of people living with HIV/AIDS infection is notknown and the coverage of VCT is extremely low. Moreover, the diagnosis, treatment and care of PLHIVrequire costly interventions, which are unaffordable by most of the population of risk groups.
Bangladesh currently spends on health considerably lower than what is required to achieve the healthrelated MDGs. The country has to scale-up resources for the health sector and at the same time ensureoptimum utilization of resources. The capacity of the pre-service training institutes for the health personnelshould be increased substantially and strategies to increase the accountability of health sector professionalsand deal with absenteeism problem in rural areas are essential for improving health sector performances inBangladesh.
Environment
The natural environment is constantly changing due to both human interventions and natural phenomenalike floods, cyclone, river bank erosion, landslides, water logging, drought etc. To ensure long-termenvironmental sustainability, environment policies have to keep up with the changing environment along withthe change in human and development activities that impact it. Policy interventions should seek to improveenvironment outcomes that matter to improve by mainstreaming poverty environment issues into keyprocess and their implementation including the national plans, sectoral strategies and sub-national planning.
As mentioned in the report above, the forest cover is depleting fast in Bangladesh and it has only 0.02hectares of forest land per person (one of the lowest forest-man ratios in the world). Further, interventionsare needed to reduce the air pollution including its timely and effective monitoring. It is evident thatundertaking interventions related to environment will also have impact on other areas as well, especially onhealth.
Further, the impact of climate change, the natural disasters and loss of land due to degradation and salinityare important issues in Bangladesh. The TWG decided to consider the interventions on Environment in fourbroad categories - Reducing exposure to environmental health impacts; Improving livelihoods; Reducingvulnerability through capacity enhancement and investment for climate change and adaptation & disastermanagement; and Governance Institutions, capacity and systemic issues. For reducing exposure to environment, the interventions identified relate to monitoring of air and waterquality, reducing exposure to CO2 emissions through mass transit (railway) and through promotion of usealternative fuel (CNG), and solid waste management. Further, it was agreed that improving livelihoods isvery important and interventions identified amongst other include co-managed forest initiatives for benefitingpoor people, pro-poor forest and wild life management plans, slum livelihoods upgradation schemes andsecurity of tenure for the slum dwellers.
The impacts of climate change have been a daunting challenge for Bangladesh, and the frequent naturaldisasters need interventions that address the reduction of vulnerability through capacity enhancement forclimate adaptation while also providing asset and income support schemes. In addition capacity building andmass awareness campaigns will help sensitize people on environmental issues.
The approach adopted by the TWG emphasizes on preventive measures while also on remedial action. Itwas felt that addressing the key challenges will advance multiple goals and targets simultaneously and willhave faster, deeper, wider, more cost effective and more lasting impact on environmental sustainability andhuman well being in the long-term than sequential interventions that address environmental challengesdirectly.
233MILLENNIUM DEVELOPMENT GOALS NEEDS ASSESSMENT AND COSTING (2009-2015) BANGLADESH
SUMMARY AND CONCLUSION
The vision Statement on Power recognizes energy as a prime resource for poverty reduction. Ruralelectrification has been made a key goal and the Government has targeted electrifying the country by 2020through grid and off grid methods. The national emphasis on rural electrification is also reflected in thenational Poverty Reduction Strategy Paper (PRSP), which identified rural electrification as a key area tofoster economic growth with a pro-poor orientation (GOB 2005).
The interventions have been recommended by the Thematic Working Group for inclusion the MDG needsAssessment and Costing relate to modern fuel for cooking/heating, promotion and use of renewable energy,promotion of energy saving bulbs. Since grid electricity is highly subsided by the government, it isrecommended that government will consider grants for enhancing programmes, particularly solar PV andbio-gas plant programmes.
Reduction of the use of fuel-wood and agricultural residues, exploring alternative energy resources,precautionary measures against potentially harmful use of nuclear energy and nuclear radiation,conservation of forest fuel and development of improved energy saving technology are recommendedoptions for the sector. Apart from these, EIA has been made mandatory before implementing projects forexploration and extraction of fuel and mineral resources.
The provision of universal access to safe drinking water and basic sanitation will help to attaining basichuman needs. It will also contribute to the achievement of MDGs in other areas like health, education andgender. Bangladesh has shown good progress towards achieving universal access to safe drinking waterand sanitation, but challenges still remain in ensuing 100 percent access to all. Access to clean water andsanitation will result in reduction of water borne and sanitation related diseases such as typhoid, diarrhea,dysentery and cholera. Provision of safe drinking water will help in reducing child mortality and improvematernal health as both the child and mother. Women will not have to travel long distance to fetch water andit will reduce their water carrying burden and enable them to carry out other more productive and usefulworks. The additional income earned from the extra works undertaken in saved time will help to reduce withfetching water will also have more time to spend on their studies and other useful activities.
Needs, Costs and Financing
Assessment of Needs based on the situation analysis and the challenges through the Thematic WorkingGroups (TWGs) resulted in identification of interventions in all of the above mentioned areas with a view toachieve the MDG Targets in Bangladesh by 2015. The exercise has been comprehensive and has had activeinvolvement of representatives of the respective Ministries of the Government of Bangladesh and the UnitedNations Agencies. Use of costing tools to cost the interventions has facilitated a harmonized approach forall sectors with MDGs.
An earlier study conducted by Millennium Project on MDG Needs Assessments in 2004 for Country CaseStudies of: Bangladesh, Cambodia, Ghana, Tanzania and Uganda (lead by Jeffery Sachs) mentions that, inorder to meet the MDGs, Bangladesh would need to spend a total of USD 66 per capita in 2005 increasingto USD 102 per capita by 2015. This translated into a total investment need of USD 155 billion between 2005and 2015, which is equivalent to an average annual per capita need of USD 84.
However the study also notes certain important observations that will have impact on the total costs. Thestudy notes "When interpreting these results, it is important to note the gaps in the current analysis …... wehave so far not been able to include a number of interventions for each sector or area. In the case ofBangladesh, the missing interventions, which might have the strongest impact on the overall results, aresummarized below":
This MDG Needs Assessment and Costing done by the Government of Bangladesh and UN family partnerssupported by the project "Support of Monitoring PRS and MDGs in Bangladesh" has included some of thecost factors mentioned above.
234 MILLENNIUM DEVELOPMENT GOALS NEEDS ASSESSMENT AND COSTING (2009-2015) BANGLADESH
CHAPTER 8
According to this current study, about Total BDT 7,125.76 billion (USD 104.18 billion) are needed to bespent to achieve all MDGs in Bangladesh from 2009-2015 at a per capita cost of BDT 5,115.95 (USD 74.79)in 2009 and BDT 8,289.48 (USD 121.19) in 2015. Thus annually about BDT 1,017.97 billion (USD 14.88billion) would be needed to achieve MDGs in Bangladesh at an annual per capita costs of about BDT6,676.15 (USD 97.60) (Refer Table 1).
Thus although the estimates costs are different due to inclusion of additional cost factors mentioned withinthe current exercise. However these are not too far apart also considering the different time periods.
However, it is important to note that the estimated costs resulting from the MDG Needs Assessment andCosting exercise will be borne not only through Government expenditure, but will also have its share ofhousehold expenditure. Household expenditures will be an important part of estimated costs for MDG1 andMDG 4,5 and6. It is thus essential that a follow-up study is done on Financing of MDGs in Bangladesh tothis MDG Needs Assessment and Costing exercise that will have a detailed budget analysis wherein theexpenditures regularly being incurred/planned by the Government of Bangladesh are reflected in addition tothe household contributions by the people of Bangladesh.
235MILLENNIUM DEVELOPMENT GOALS NEEDS ASSESSMENT AND COSTING (2009-2015) BANGLADESH
ANNEX ISUMMARY AND CONCLUSION

236 MILLENNIUM DEVELOPMENT GOALS NEEDS ASSESSMENT AND COSTING (2009-2015) BANGLADESH
CHAPTER 8


Bibliography and References
Bibliography - Poverty and Hunger
A. Begum and M. Salimullah (2004) Millennium Development Goals Needs Assessment: Bangladesh,Working Draft, 17 January 2004, Bangladesh Institute of Development Studies, Dhaka.
ADB (2005) A Future Within Reach: Reshaping institutions of disparities to meet the MillenniumDevelopment Goals in Asia and the Pacific, ESCAP-UNDP, Dhaka.
Ahmed, S. (2002) The political economy of reforms in South Asia: Bangladesh and Pakistan. SouthAsia Region Internal Discussion Paper 183, World Bank, Washington D.C.
Ahmed, R., S. Haggblade and Chowdhury (2000) Out of shadow of famine: Evolving food markets andfood policy in Bangladesh. Baltimore: Johns Hopkins University Press, USA.
Ahmed and Z. Karim (2006) Bangladesh: uncertain prospects. In Padrey, P.G., J.M. Alston and R.R.Piggott (eds.). Agricultural research and development in the developing world. International FoodPolicy Research Institute, Washington D.C., Ch. 6, pp. 129-154.
Barakat, M A. (2008) Financing growth and poverty reduction: options and Challenges in Bangladesh,Seminar paper, Planning Commission, Dhaka, Bangladesh.
BBS (2000) Report of the household income and expenditure (HIES), Ministry of Planning, Dhaka,Bangladesh.
BBS (2005) Report of the household income and expenditure (HIES), Ministry of Planning, Dhaka,Bangladesh.
BBS (2006) Statistical Yearbook of Bangladesh, Ministry of Planning, Dhaka, Bangladesh.
BDHS (2004) Bangladesh Demographic and Health Survey, NEPORT, Dhaka.
BIDS. 2001. Bangladesh Human Development Report 2000. Bangladesh Institute of DevelopmentStudies, Sher-e-Bangla Nagar, Dhaka. 12. Chandrika Bahadur (2005) Preparing NationalStrategies to Achieve the Millennium Development Goals; A Handbook, Millennium Project, UnitedNations.
GoB (2007) Millennium Development Goals: Mid-Term Bangladesh Progress Report 2007, GED,Planning Commission, Dhaka.
GoB (2008) A Strategy for Poverty Reduction in the Lagging Regions of Bangladesh, GED, PlanningCommission, Dhaka.
GoB (2005) Unlocking the Potential: National Strategy for Accelerated Poverty Reduction, GED,Planning Commission, Dhaka.
GoB (2005, 2006, 2007) Annual Development Plan, Planning Commission, Dhaka, Bangladesh.
Hossain, M. (1988) Nature and Impact of Green Revolution in Bangladesh. Research Report no. 67,International Food Policy Research Institute, Washington DC.
Hossain, M., M.A. Quasem, M.A. Jabbar and M.M. Akash (1994) Production environments, modernvariety adoption and income distribution in Bangladesh. In David C.C. and K. Otsuka (eds.).Modern Rice Technology and Income Distribution in Asia. Lynne Rienner Publishers, Inc., pp. 221-279.
239MILLENNIUM DEVELOPMENT GOALS NEEDS ASSESSMENT AND COSTING (2009-2015) BANGLADESH

Hoque, E. 1999. Farmers Participation in Agricultural and Rural Development for Sustainable FoodSecurity in Bangladesh. FAO, Fourth Session, Tokyo.
Huq (2000) Agricultural Development in Bangladesh. The University Press Limited, Dhaka.
Chowdhury, N., N. Farid and D. Roy (2006) Food policy liberalization in Bangladesh: How theGovernment and the markets delivered?. MTID Discussion paper no. 92, International Food PolicyResearch Institute, Washington D.C.
Klytchnikova, I. and N. Doip. 2006. Trade reforms, farm productivity and poverty in Bangladesh. PolicyResearch Working Paper 3980, World Bank, Washington D.C.
MICS (2006) Monitoring the situation of children and women, Multiple Indicator Cluster Survey, Vol. I,Technical Report, Progotir Pothey, BBS & UNICEF.
MOA (2005) Ministry of Agriculture, GoB, Dhaka, Bangladesh.
MOA (2007) Ministry of Agriculture, GoB, Dhaka, Bangladesh.
MOF (2007) Bangladesh Economic Review, Ministry of Finance, GoB, Dhaka, Bangladesh.
People's Forum on MDG (2005) Millennium Development Goals: A People's Progress Report,BANGLADESH.
Raihan and Razzaque (2007) Global agricultural trade liberalization: Implications for the BangladeshEconomy. In Raihan, S. and A. Razzaque (eds.). WTO and regional trade negotiation outcomes:Quantitative assessment of potential Implications on Bangladesh. Pathak Shamabesh, 27 AzizMarket, Dhaka, Bangladesh, pp. 47-75.
Ravallion, M. and G. Datt (1996) How Important to India's Poor is the Sectoral composition of EconomicGrowth?. World Bank Economic Review, Vol. 10, No. 1, pp.1-25.
Richard Anker et al 2002, Measuring Decent Work with Statistical Indicators, Working Paper No. 2,Policy Integration Department, Statistical Development and Analysis Group, International LabourOffice, Geneva, October 2002.
UNCT (2005) A future within the reach. 2005: Reshaping institutions in a region of disparities to meetthe MDGs in Asia and the Pacific, UNDP.
Web page of UN. Official list of MDG indictors Achieve full and productive employment and decentwork for all including women and young people.
World Bank (2005) Attaining The Millennium Development Goals In Bangladesh: How Likely and WhatWill It Take To Reduce Poverty, Child Mortality and Malnutrition, Gender Disparities, and toIncrease School Enrollment and Completion?, Human Development Unit, South Asia Region.
WFP (2006) Rural Bangladesh: Socioeconomic Profile of WFP Operational Areas & Beneficiaries,TANGO International, Dhaka.
WFP (2004) Local Estimation of poverty and malnutrition in Bangladesh, BBS & WFP, Dhaka,Bangladesh.
240 MILLENNIUM DEVELOPMENT GOALS NEEDS ASSESSMENT AND COSTING (2009-2015) BANGLADESH
Bibliography and References
Bibliography - Education
ADB (2005), Second Primary Education Development Program: Bangladesh, May, 2005Ahmadullah Mia and Wolfgang Vollmann (2007), Adult Literacy and Learning in Bangladesh:The UNESCO and NGO Experience. Literacy, Knowledge and Development, edited by MadhuSing and Luz Maria Castro Mussot, UNESCO Institute of Lifelong Learning.
Ardt, Kalene (2005). Report on Primary Education in Bangladesh: Challenges and Successes,BANBEIS, MWCA, for the 3rd Summit on South Asian Development, May 19, 2005.
BANBEIS (2006), Bangladesh Educational Statistics 2006.
BBS Statistical Yearbook, 2006.
BBS (2007), Multiple Indicator Survey, Progotir Pothey, BBS and UNICEF, October 2007 CAMPE (2007), Directory of NGOs with Education Programmes, 2007.
CAMPE (2003), Education Watch 2002, Literacy in Bangladesh, Need for a New Vision, CAMPE.
Chowdhury, Mushtaque R. et al (2002), Renewed Hope, Daunting Challenges: State of PrimaryEducation in Bangladesh, Dhaka, UPL, 2002.
Danzinger and Waldfogel, 2000. Investing in our children: What do we know? In Danzinger, S andWasldfogel, J. (eds.) Securing the Future: Investing in Children from Birth to College. RusselSage Foundation, New York.
DPE, MOPME (2006), State Reports for the Seventh Consultation of Member States on theImplementation on the Convention and Recommendation against Discrimination in Education,Report on Primary Education, Dhaka, September 2006.
DPE (2002) MIS Report.
DPE (2003) Primary Education in Bangladesh, Directorate of Primary and Mass Education, September2003.
DPE (2006) Baseline Report (2005) of Second Primary Education Development Programme (PEDPII), Directorate of Primary Education, MoPME, GoB, June 2006.
DPE (2007) School Survey Report (2006) of Second Primary Education Development Programme(PEDP II), Directorate of Primary Education, MoPME, GoB.
DPE (2008) School Survey Report (2007) of Second Primary Education Development Programme(PEDP II), Directorate of Primary Education, MoPME, GoB.
Haque, A H M Sadique, (1997). Adult Education in Bangladesh: Recent Innovations, Asia LiteracyRegional Forum, May 5-9, Manila, Philippines.
IER (2002) A Formative Study on the Impact of the IDEAL Project, Vol I, Institute of Education andResearch, August 2002.
Latif, Scherezad, (2004), Improvements in the quality of Primary Education in Bangladesh,Background paper prepared for the EFA Global Monitoring Report, 2005.
241MILLENNIUM DEVELOPMENT GOALS NEEDS ASSESSMENT AND COSTING (2009-2015) BANGLADESH
ANNEX IIBibliography and References
Julien Bayou, et al, (2005), Projected Net Enrolment Rates for Primary School Age Children in primaryand secondary school and gender parity indices for 2015, 2006/ED/EFA/MRT/PI/10, UNESCO.
MoE (2006). Annual Report (2005-06), Ministry of Education, Government of the People's Republic ofBangladesh, December 2006.
MOPME (2007). Learning for Change, Education for All, National Plan of Action (NPA II), 2003-2015,Ministry of Primary and Mass Education.
Rashid, Harun-Al (2003) Country Report EFA National Plan of Action, Directorate of Non FormalEducation.
UNESCO (2008), Institute for Statistics Database, 2008.
UNESCO-IBE (2006), Country Profile, Bangladesh, Strong Foundations: Early Childhood Care andEducation. Education for All Global Monitoring Report, 2007, UNESCO International Bureau ofEducation, Geneva, 2006.
World Bank (2007), Literacy, Knowledge and Development: South-South Dialogue.
Bibliography - Gender
Bangladesh Educational Statistics BANBEIS 1991.
Development Project Proposal (DPP) Secondary Education Sector Development project, Directorateof Secondary and Higher Education, July 2006.
Development Project Proposal (DPP) For Secondary Education Quality and Access EnhancementProject (SEQAEP), prepared of Secondary and Higher Education Ministry of Education, July2008.
Educational Institution Survey (Post Primary), 2003, BANBEIS, December 2004.
GED, Government of the Peoples Republic of Bangladesh, May 2008.
Government of the People's Republic of Bangladesh¸MOWCA, DWA, RDPP For Safe Custody For Women , Children & Adolescent Girls, Gazipur Project, July/2003-June /2009.
Government of the People's Republic of Bangladesh Department of Youth and Development, Ministryof Youth and Sports July 1998.
Government of the People's Republic of Bangladesh Department of Youth Development Ministry ofYouth Development, Revised, (2003-2007).
Government of the People's Republic of Bangladesh Department of Youth Development Ministry ofYouth Development, Revised (1998-2006).
Jatiyo Mohila Sangstha, Ministry of Women & Children Affairs.
Labour Force Survey 1995-96, BBS December 1996.
Labour Force Survey 2002-03, BBS December 2004.
242 MILLENNIUM DEVELOPMENT GOALS NEEDS ASSESSMENT AND COSTING (2009-2015) BANGLADESH
Bibliography and References
Labour Force Survey 2005-06, BBS February 2008.
Mahtab, N. Women in Bangladesh, From Inequality to Empowerment, AH Development Publishing House, 2007.
Millennium Development Goals: A people's progress report, BANGLADESH, Overview, September2005.
Millennium Development Goals: Mid-Term Bangladesh Progress Report, December, 2007.
Moving Ahead: National Strategy for Accelerated poverty Reduction 2009-2011.
News Letter, Rehabilitation & Reintegration of Victims of Violence in the Society, Vol.2, Issue 3,MSPVAW(2nd phase) MOWCA, July 2008.
News Letter, Counseling Need & National Trauma & Counseling Centre of MSPVAW, Vol.2, Issue 4,MSPVAW(2nd phase) MOWCA, October 2008.
Statistical Profile on Education in Bangladesh, BANBEIS 2006.Technical Assistance Project Proposal (TPP) on Promotion of Gender Equality and Women'sEmpowerment, Department of Women Affairs, Ministry of women and children Affairs, 2006.
Bibliography - Health
Azim T, Khan S I, Haseen F, Huq N L, Henning L, Pervez M M, Choudhury M E, and Sarafian I, HIVand AIDS in Bangladesh Journal of Health, Population and Nutrition, 26 (3), 2008, [ P. 311-324].
Bangladesh Demographic and Health Survey (BDHS), 1993-1994. National Institution of PopulationResearch and Training, Mitra and associates, ORC-Macro, Dhaka.
Bangladesh Demographic and Health Survey (BDHS), 1996-1997. National Institution of PopulationResearch and Training, Mitra and associates, ORC-Macro, Dhaka.
Bangladesh Demographic and Health Survey (BDHS), 1999-2000. National Institution of PopulationResearch and Training, Mitra and associates, ORC-Macro, Dhaka.
Bangladesh Demographic and Health Survey (BDHS), 2004. National Institution of PopulationResearch and Training, Mitra and associates, ORC-Macro, Dhaka.
Bangladesh Demographic and Health Survey (BDHS), 2007. National Institution of PopulationResearch and Training, Mitra and associates, ORC-Macro, Dhaka.
Bangladesh Health Watch (BHW) 2007, Bangladesh State of Health Report: Health Workforce inBangladesh, Who Constitutes the Healthcare System?, BRAC University.
BBS (2005) Report of the Household Income and Expenditure Survey (HIES) 2005.
BBS (2006) Report on Sample Vital Registration System 2004.
BBS (2007a) Pocket Year Book, Bangladesh Bureau of Statistics.
BBS (2007b) Report on Sample Vital Registration System 2006, Bangladesh Bureau of Statistics.
243MILLENNIUM DEVELOPMENT GOALS NEEDS ASSESSMENT AND COSTING (2009-2015) BANGLADESH
Bibliography and References
BBS 1999, Report of survey on prevalenceof morbidity, treatment status, treatment expenditures,fertility, immunization and smoking, Bangladesh Bureau of Statistics.
BBS and UNICEF, Multiple Indicator Cluster Survey (MICS) 2006.
GED Planning Commission, Mid-Term Bangladesh Millennium Development Goals Progress Report2007.
GoB and UN, Bangladesh Millennium Development Goals Progress Report 2005.
HEU (2007) A Fact Book on the Bangladesh HNP Sector, Health Economics Unit, MOHFW.
HNPSP 2005, Revised Program Implementation Plan (2003-2010), Health, Nutrition, and PopulationSector Program, MOHFW.
HNPSP 2008, Revised Program Implementation Plan (RPIP), Ministry of Health and Family Welfare.
HNPSP Main Consolidated Report of Mid Term Review (MTR) 2008.
HPSP (1998-2003) Program Implementation Plan, Health, and Population Sector Program, MOHFW.http://www.searo.who.int/LinkFiles/Malaria_in_the_SEAR_ban_mortality.pdf.
ICDDR'B 2006, New strategies for treating falciparum malaria in Bangladesh, Health and ScienceBulletin, 4(3), 2006.
MIS 2007, Year Book 2007, Management Information System (MIS), DGHS, Ministry of Health andFamily Welfare.
MoHFW (2001) Bangladesh National Strategy for Maternal Health.
NASP 2007a, 7th round technical report of National HIV Serological Surveillance 2006, NationalAIDS/STD Program (NASP), DGHS, MOHFW.
NASP 2007b, World AIDS day, NASP, DGHS, Ministry of Health and Family Welfare.
NHA 2003, Bangladesh National Health Accounts (1999-2000,) HEU and Data International.
NIPORT 2003, Bangladesh maternal health service and mortality survey. Dhaka: National Institute ofPopulation Research and Training, 2003. 111 p.
NTP 2007, Annual Report of Tuberculosis control in Bangladesh, National Tuberculosis ControlProgram, DGHS, MoHFW.
PER 2007, Public Expenditure Review of the health sector, HEU, MOHFW.
Sack D A 2008, Achieving the Millennium Development Goals for Health and Nutrition in Bangladesh:Key Issues and Interventions-An Introduction, Journal of Health, Population and Nutrition, 26 (3),2008, [ P. 253 - 260 ] .
UN 2008, http://mdgs.un.org/unsd/mdg/Metadata.aspx?IndicatorId=0&SeriesId=762.
UNFPA 2008, http://www.unfpa.org/mothers/obstetric.htm.
244 MILLENNIUM DEVELOPMENT GOALS NEEDS ASSESSMENT AND COSTING (2009-2015) BANGLADESH
Bibliography and References
UNGASS 2006, UNGASS Indicators Country Report, Reporting Period: January 2003 - December2005, Bangladesh National AIDS Committee.
UNGUSS 2008, UNGASS Country Progress Report, Bangladesh, Reporting Period: January 2006 -December 2007, NASP, Ministry of Health and Family welfare.
WHO 2004, Making pregnancy safer: the critical role of the skilled attendants A Joint Statement byWHO, ICM and FIGO, Geneva, World Health Organization.
WHO 2005, World malaria report. Geneva: World Health Organization,(http://rbm.who.int/wmr2005/profiles/bangladesh.pdf, accessed in 2008)
WHO 2008 http://www.whoban.org/communicable_dis_malaria.html.
Bibliography - Environment
Begum and M. Salimullah (2004). Millennium Development Goals Needs Assessment: Bangladesh,Working Draft, 17 January 2004, Bangladesh Institute of Development Studies, Dhaka.
ADB (2004). Country Environment analysis, 3rd draft final.
BARC (Bangladesh Agricultural Research Council) (2000). Bangladesh National Agricultural ResearchSystem (NARS)-2020. In A Vision for Agricultural Research, Farmgate, Dhaka.
BBS (2000). Report of the household income and expenditure (HIES), Ministry of Planning, Dhaka,Bangladesh.
BBS (2005). Compendium of Environment Statistics of Bangladesh, Dhaka, Bangladesh.
BBS (2006). Statistical Yearbook of Bangladesh, Ministry of Planning, Dhaka, Bangladesh.
Barakat, M A. (2008). Financing growth and poverty reduction: options and Challenges in Bangladesh,Seminar paper, Planning Commission, Dhaka, Bangladesh.
BPDB (2008). Commercial operation statistics (executive summery) provisional, Dhaka.
Chandrika Bahadur (2005). Preparing National Strategies to Achieve the Millennium DevelopmentGoals; A Handbook, Millennium Project, United Nations.
CUS (2005). Center for Urban Studies: Slums of Urban Bangladesh: mapping and census-2005.
CPD, 200. Centre for Policy dialogue, Policy Brief on Environmental Policy, Dhaka, Bangladesh.
Dey, NC, Bala, S.K, Hayakawa, S. (2006). Assessing the economic benefits of improved irrigationmanagement: a case study in Bangladesh. Water Policy Journal, UK, 8(6), 573-584.
DOE (2006). Environment for sustainable development, MoEF, GoB.
GoB (2007). Millennium Development Goals: Mid-Term Bangladesh Progress Report 2007, GED,Planning Commission, Dhaka.
GoB (2008). A Strategy for Poverty Reduction in the Lagging Regions of Bangladesh, GED, PlanningCommission, Dhaka.
245MILLENNIUM DEVELOPMENT GOALS NEEDS ASSESSMENT AND COSTING (2009-2015) BANGLADESH
Bibliography and References
GoB (2005). Unlocking the Potential: National Strategy for Accelerated Poverty Reduction, GED,Planning Commission, Dhaka.
GoB (2007). Bangladesh Economics Review, Ministry of Finance, GoB, Dhaka, Bangladesh.
GoB (2005, 2006, 2007). Annual Development Plan, Planning Commission, Dhaka, Bangladesh.
Hassan (2003). Eco-Degradation and Rural Livelihood Relationship. The Bangladesh, Observer,August 10, 2003.
Islam, M. F., Shammin, Junaid, J. (2001). Industrial pollution. In Nishat, A. Ullah, M., Haque, A. K. E(eds.) Bangladesh environmental outlook. Centre for Sustainable Development. Dhaka,Bangladesh.
IPCC (2007). The physical Science basis, Climate Change, 2007.
Khan, M.H. (2001). Biodiversity. In Nishat, A. Ullah, M., Haque, A. K. E (eds.) Bangladeshenvironmental outlook. Centre for Sustainable Development. Dhaka, Bangladesh.
LGED, UNDP & UN-Habitat (2007), Land tenure Security and Land Administration in Bangladesh,Project BGD/98/006, Final Report, Dhaka.
MICS (2006). Monitoring the situation of children nad women, Multiple Indicator Cluster Survey, Vol. I,Technical Report, Progotir Pothey, BBS & UNICEF.
Paul, B. K. (1995). Farmers' and Public Responses to the 1994-95 Drought in Bangladesh: A CaseStudy. Kansas State University, Manhattan.
People's Forum on MDG (2005). Millennium Development Goals: A People's Progress Report,BANGLADESH.
Roy, K., Nepal C. Dey and MIM Zulfiker (2008). About Bangladesh and Country's Arsenic Problem: Ata Glance; Arsenic Calamity of Groundwater in Bangladesh: Contamination in Water, Soil andPlants edited by K. Roy, Assoc. Prof. of Nihon University, Japan, Vol 1. pp. 1-11.
UNCT (2005). A future within the reach.2005: Reshaping institutions in a region of disparities to meetthe MDGs in Asia and the Pacific, UNDP.
Web page of UN. Official list of MDG indictors Achieve full and productive employment and decentwork for all including women and young people.
Waste Concern (2005). Waste is resource.., Sustainable Environment Management Program (SEMP),MOE&F, GOB.
WHO (2006). Appropriate sanitation technologies, Environmental Health Unit, Bangladesh.
WFP (2006). Rural Bangladesh: Socioeconomic Profile of WFP Operational Areas & Beneficiaries,TANGO International, Dhaka.
246 MILLENNIUM DEVELOPMENT GOALS NEEDS ASSESSMENT AND COSTING (2009-2015) BANGLADESH
Bibliography and References


MDG Needs Assessment and Costing Team
Dr. M. Golam Sarwar, National Project DirectorSupport to Monitoring PRS and MDGs in BangladeshandJoint Chief, General Economics DivisionPlanning CommissionMinistry of PlanningBangladesh.
Mr. Kalyan Raj Pandey, Project ManagerSupport to Monitoring PRS and MDGs in BangladeshUNDP.
Mr. Narendra Mishra, Local Development and MDG Localisation Specialist Coordinator for MDG Needs Assessment and CostingSupport to Monitoring PRS and MDGs in BangladeshUNDP.
Dr. Md. Akteruzzaman Consultant for Poverty and Hunger.Dr. Habibur Rahman Consultant for Education. Dr. Sadeka Halim Consultant for Gender.Ms. Nahid Akter Jahan Consultant for Health.Dr. Nepal Chandra Dey Consultant for Environment.
Resource persons from the UN Regional Offices and Country Offices:
Dr. Yuba Raj Khatiwada- MDGI, UNDP Regional Center Colombo.Ms. Gabriele Koehler - UNICEF Regional Officer for South Asia.Ms. Patricia Alexander - Gender Team, UNDP Regional Center Colombo.Mr. Kazuyuki Uji -HIV/AIDS Practice Team, UNDP Regional Center Colombo.Ms. Menaka Gunawardana -MDGI, UNDP Regional Center Colombo. Mr. Neil Fernando - MDGI, UNDP Regional Center Colombo. Dr. Nandita Mongia - UNDP Regional Center Bangkok. Mr. Nabendra Dahal- UNICEF Bangladesh.Mr. Tauhid Alam - UNFPA Bangladesh.Mr. Paul Edwards - UNICEF Bangladesh.Mr. Aminul Islam - UNDP Bangladesh.
TWG - Poverty and Hunger (MDG1)
Dr. Md. Golam Sarwar, Joint Chief, GED, Planning Commission, Dhaka & National Project Director, Supportto Monitoring PRS and MDGs in Bangladesh Project, Chairperson to TWG1.Mr. Naquib Bin Mahmud, GED, Planning Commission, Dhaka & Deputy Project Director Support toMonitoring PRS and MDGs in Bangladesh Project.Md. Ashrafuzzaman, Assistant Chief & Member Secretary of TWG 1 GED, Planning Commission, Dhaka.Md. Matiur Rahman, Deputy Secretary, M/O Fisheries & Livestock.Dr. Shahjahan Ali Khandaker, Deputy Chief, Rural Development and Co-operative Division.Prof. Dr. Md. Akteruzzaman, Consultant for TWG 1, Support to Monitoring PRS and MDGs in BangladeshProject.Mr. Narendra Mishra, Coordinator - MDG Needs Assessment and Costing, Local Development and MDGLocalisation Specialist, Support to Monitoring PRS and MDGs in Bangladesh Project, UNDP.
249MILLENNIUM DEVELOPMENT GOALS NEEDS ASSESSMENT AND COSTING (2009-2015) BANGLADESH
ANNEXUREPARTICIPANTS OF THE MDG NEEDSASSESSMENT AND COSTING EXERCISE
Md. Humayun Kabir, Sr. Assistant Chief, M/o Labour and Employment.Mir Nadia Nivin, Result Management Officer, Support to Monitoring PRS and MDGs in Bangladesh Project.Ms. Naima Begum, Assistant Chief, M/o Food and Disaster Management.Mohammad Saifur Rahman, Assistant Chief, M/o Health and Family Welfare.Md. Zakir Hossain, Deputy Chief, M/o Social Welfare.Mr. TIM Nurunnabi Khan, Senior, Program Officer, ILO, House-12, Road-12, Dhanmondi R/A, Dhaka,Bangladesh.Mr. Sayed kabir Ahmed, Head, PM & R Section, WFP, E/8-A, Begum Rokeya Sarani, Shere-Banglanagar,Dhaka.Mr. Kalyan Raj Pandey, Project manager, UNDP, Support to Monitoring PRS and MDGs in BangladeshProject.
TWG - Education (MDG 2)
Ms Shamima Ahmed, Deputy Secretary, Ministry of Primary and Mass Education, Chairperson of the TWG2.Md. Zakir Hossain Chowdhury, Senior Assistant Chief, Ministry of Primary and Mass Education, MemberSecretary of TWG 2.Mr Sheikh Abdul Ahad, Director, Census Wing, Bangladesh Bureau of Statistics.Md Amin Sharif, Assistant Chief, Local Government Division, Bangladesh Secretariat.Mr Abu Jafar Md Farid Udding Chowdhury, Senior Assistant Chief, Ministry of Religious Affairs.Md Mahbubul Haque Patwary, Senior Assistant Chief, Ministry of Youth and Sports.Md Selim, Senior Assistant Chief (Education wing), Socio Economic Infrastructure, Planning Commission.Mr Al Amin Sarkar, Assistant Chief, General Economics Division, Planning Commission. Md Tariqul Islam, Assistant Statistical Officer, Bangladesh Bureau of Educational Information and Statistics(BANBEIS).Ms Sajeda Begum, Assistant Director, M&E, Directorate of Primary Education.Md Abu Taleb Mia, Assistant Director (Planning), Bureau of Non-formal Education.Md Saifur Rahman, Assistant Chief, Ministry of Health and Family Welfare.Mr Zahirul Islam, World Food Programme.Ms Shahida Akhter, World Food Programme.Begum Shirin Akhter, UNESCO (Dhaka Office).Mr Prodip Kumar Mohottom, Senior Assistant Chief, Ministry of Education.Mr. Narendra Mishra, Coordinator - MDG Needs Assessment and Costing, Local Development and MDGLocalisation Specialist, Support to Monitoring PRS and MDGs in Bangladesh Project, UNDP. Dr. Habibur Rahman, Consultant for TWG 2, Support to Monitoring PRS and MDGs in Bangladesh Project.
TWG - Gender (MDG 3)
Ms. Mushfiqa Ikfad (Joint Sectretary, MOWCA) Chairperson of TWG3.Mr A.S. M. Ashraful Alam (MOWCA , Member Secretary of TWG3). Ms Tania Khan (Ministry of Information). Mr Mujiban Rahman (Ministry of Education).Md Rafiqul Hasan (Ministry of Law).Mr. Rafiqul Islam (Ministry of Labour and Employment).Md. Sabbirul Haque (Ministry of Social Welfare).Mr Narendra Mishra (UNDP).Dr Sadananda (UNDP).Nazia Afrin Chowdhury (GED).Md. Mozaharul Islam KhanQurratul Ayen. S. (Ministry of Primary and Mass Education ).Md. Shamsul Alam (BBS). Mr. Mozaharul Islam Khan (UNDP).
250 MILLENNIUM DEVELOPMENT GOALS NEEDS ASSESSMENT AND COSTING (2009-2015) BANGLADESH
ANNEXURE
Dr. Sadeka Halim, Consultant for TWG 3, Support to Monitoring PRS and MDGs in Bangladesh Project.
TWG 4 - Health (MDG 4, 5 and 6)
Md. Jahangir, Joint Chief, Health Economics Unit, Ministry of Health and Family Welfare, Chairperson ofTWG4.Abdul Hamid Moral, Assistant Chief, Health Economics Unit, Ministry of Health and Family Welfare,Member Secretary of TWG4.Mr. Md. Abul Kalam Azad, Director (Demography & Health Wing), Bangladesh Bureau of Statistics (BBS),Agargaon, Dhaka.Ms. Hamida Begum, Senior Assistant Secretary (Admin. - 2), Ministry of Women and Children Affairs,Bangladesh Secretariat, Dhaka.Mr. Probhash Chandra Roy, Senior Assistant Chief (Health Wing), SEI Division, Planning Commission,Sher-e-Bangla Nagar, Dhaka.Mr. Md. Sajjadul Islam, Senior Assistant Chief, Ministry of Information, Bangladesh Secretariat, Dhaka.Mr. Md. Sabbirul Haque , Assistant Chief, Ministry of Social welfare, Bangladesh Secretariat, Dhaka.Mr. Md. Mahbubul Alam Siddique, Assistant Chief, General Economic Division (GED), PlanningCommission, Sher-e-Bangla Nagar, Dhaka.Dr. Md. Shajedul Hasan, DPM (AOP & Monitoring), SWPM, Planning Unit, DGHS, Mohakhali, Dhaka.Dr. A. S. M. Alamgir, Officer -on-Special Duty, Department of Virology, IEDCR, Mohakhali, Dhaka.Mr. Mir Sajedur Rahman, Assistant Chief (Planning Unit), DGFP, 6 Karwan Bazar, Dhaka.Ms. Nahid Akhter Jahan, consultant for TWG 4, Support to monitoring PRS and MDG in Bangladesh.Ms. Tahmina Begum, GTZ Consultant, 14/2 Topkhana Road (3rd floor), Dhaka.Mr. Narendra Mishra, Coordinator - MDG Needs Assessment and Costing, Local Development and MDGLocalisation Specialist, Support to Monitoring PRS and MDGs in Bangladesh Project, UNDP. Ms. Nadia Nivin, Results Management Officer, UNDP, IDB Bhanan, 6th Floor, Agargaon, Dhaka.Dr. Igor Kazanets, International Organization for Migration (IOM).Dr. Amzad Ali, International Organization for Migration (IOM).Mr. Tauhid Alam, UNFPA.Mr. Abdul Quddus, WFP.
TWG 5 - Environment (MDG 7)
Dr. AHM Mustain Billah, Joint Secretary (Dev), Chairperson of TWG 5, M/O Environment & Forest.Ms Dilruba Yasmin, Deputy Chief, M/O Environment & Forest.Md. Mosharaf Hossain, Sr. Assistant Chief, SEI (Forest Wing) Agriculture WR & RI division.Omar Md. Imrul Mohsin, Senior Assistant Chief, Energy & Mineral Resources Division.SM Shawkat Ali, Director, Statistical StaffTraining Ins., BBS.Md. Aminur Rahman, Deputy Secretary (Sec. 11), M/O Land.Ms. Hasina Begum, Assistant Chief, General Economics Division.Md. Jotirmoi Samadder, Deputy Secretary, M/O Science & Technology.Ms Sirat Mahmuda, Assistant Chief, M/O Industries.Mohammed Tasharuf Hossain Farazi, Senior Assistant Chief, M/O Local Govt. Division.Mr. Molla Md. Anisuzzaman, Assistant Chief, M/O Housing & Public Works.Md. Abdul Motalab, Deputy Chief of Forest Conservator, Forest Department.Kazi Sarwar Imtiaz Hashmi, Deputy Director, Department of Environment.Md. Shehab Ullah, P.Eng, Supt. Engineer, Dhaka City Corporation.Robin Rahian Ahmed, Executive Engineer, Department of Public Health.Ms. Mahabunessa, Executive Engineer, Water Supply and Sanitation.Md. Abdullah, Director, Disaster Management Bureau. M. Aminul Islam, Assistant Country Director, UNDP-Bangladesh.Mr. Narendra Mishra, Coordinator, MDG Needs Assessment and Costing, Local Development and MDGLocalization Specialist, UNDP-Bangladesh.Dr. Nepal Chandra Dey, Consultant for TWG 5, Support to Monitoring PRS and MDGs in BangladeshProject.
251MILLENNIUM DEVELOPMENT GOALS NEEDS ASSESSMENT AND COSTING (2009-2015) BANGLADESH
ANNEXURE

252 MILLENNIUM DEVELOPMENT GOALS NEEDS ASSESSMENT AND COSTING (2009-2015) BANGLADESH
ANNEXURE