Chapter 10 - Activity-Based Costing and Management
46
D AVID M ASON OWNS AND OPERATES Mason Kitchen Cabinets (MKC) in High Point, North Carolina. Each of MKC’s three product lines targets a distinct market segment: (1) the Silver line is low-priced and functional; (2) the Gold line is a mid- market product with a touch of elegance; and (3) the Platinum line offers the finest design features and highest quality. Within each product line, individual models offer different door paneling styles, woods or veneers, and colors. David is particularly proud of the Platinum line because it is a testament to his company’s workmanship. The market, too, appears to perceive the value of this line, as evidenced by the recent growth in Platinum sales. Despite all the success, MKC’s profit has decreased over the last few years. Puzzled, David asks you to take a closer look at the profitability of each of MKC’s products. Chapter 10 Activity-Based Costing and Management APPLYING THE DECISION FRAMEWORK What Is the Problem? MKC’s profit has shown a decreas- ing trend in recent years. What Are the Options? There are numerous options, including changing the product mix and contracting or expanding capacity levels. What Are the Costs and Benefits? We need to gather information regarding the long-term profitabil- ity of each product line. We will use cost allocations and, in particular, activity-based costing, to estimate the costs of the resources used by each product. Make the Decision! Once we know the costs of the resources used by each product and each product’s profitability, we will be able to suggest where David should focus his efforts. To download more slides, ebooks, solution manual, and test bank, visit http://downloadslide.blogspot.com
-
Upload
khangminh22 -
Category
Documents
-
view
5 -
download
0
Transcript of Chapter 10 - Activity-Based Costing and Management
DaviD Mason owns anD operates Mason Kitchen Cabinets (MKC) in High Point, North Carolina. Each of MKC’s three product lines targets a distinct market segment: (1) the Silver line is low-priced and functional; (2) the Gold line is a mid-market product with a touch of elegance; and (3) the Platinum line offers the finest design features and highest quality. Within each product line, individual models offer different door paneling styles, woods or veneers, and colors.
David is particularly proud of the Platinum line because it is a testament to his company’s workmanship. The market, too, appears to perceive the value of this line, as evidenced by the recent growth in Platinum sales. Despite all the success, MKC’s profit has decreased over the last few years. Puzzled, David asks you to take a closer look at the profitability of each of MKC’s products.
C h a p t e r 1 0
Activity-Based Costing and
Management
APPlyinG the DeciSion FrAmeworkWhat Is the Problem?
MKC’s profit has shown a decreas-ing trend in recent years.
What Are the Options?
There are numerous options, including changing the product mix and contracting or expanding capacity levels.
What Are the Costs and Benefits?
We need to gather information regarding the long-term profitabil-ity of each product line. We will use cost allocations and, in particular, activity-based costing, to estimate the costs of the resources used by each product.
Make the Decision!
Once we know the costs of the resources used by each product and each product’s profitability, we will be able to suggest where David should focus his efforts.
To download more slides, ebooks, solution manual, and test bank, visit http://downloadslide.blogspot.com

In Chapter 9, we examined how cost allocations facilitate long-term decisions by estimating each product’s share of capacity costs. In this chapter, we take a closer look at the use of cost allocations for long-term decisions. We discuss how activity-based costing (ABC) could improve these estimates and thus provide a better picture of long-term product profitability.
We begin this chapter by reviewing the concept of a profit margin, which is important in making long-term decisions. We then describe the steps associated with designing product-costing systems and develop an activity-based costing (ABC) system for MKC. We conclude by illustrating how to use the data from ABC systems for product planning, cus-tomer profitability analysis, and targeting process improvements.
After studying this chapter, you will be able to:
1 Understand the elements of an activity-based costing (ABC) system.
2 Argue the decision usefulness of ABC systems.
3 Explain the importance of activity-based manage-ment (ABM) in planning products, customers, and resources.
L E A r N I N g O B j E C T I v E s
Mason Kitchen Cabinets is famous for its workmanship. Although the sales of its Platinum line has been increasing, profits have not kept pace.
Alamy
To download more slides, ebooks, solution manual, and test bank, visit http://downloadslide.blogspot.com

402 Chapter 10 • Activity-Based Costing and Management
Exhibit 10.1 presents MKC’s income statement for the most recent year of operations. MKC prepares this gross margin statement after allocating fixed manufacturing costs to products in proportion to their actual labor cost. Consistent with GAAP, MKC expenses all sales, marketing, and administrative costs in the period incurred.
Based on the data similar to that in Exhibit 10.1, David expanded the Platinum line and scaled down the Silver line several years back. Unfortunately, MKC’s profit has decreased in the years following this decision. David knows something is not right.
As you learned in Chapter 9, David’s problem might exist because he uses gross margin as a measure of product profitability. This metric is designed for financial reporting. It is not suited for decision making because it often excludes controllable costs and includes noncontrollable costs. Contribution margin, too, is not appropri-ate for this decision because it ignores changes in capacity costs. Profit margin, which equals a product’s contribution margin less the cost of capacity resources needed to support its production, is the appropriate measure for evaluating long-term profitability.
CHAPTEr CONNECTIONsIn Chapter 11, we examine capital budgeting, a technique used for long-term resource planning. We discuss how to include the time value of money when evaluating long-term projects and how to best allocate capital among competing projects.
Elements of Activity-Based Costing (ABC) Systems
Understand the elements of an activity-based costing (ABC) system.
LEArNINg OBjECTIvE 1
Mason Kitchen Cabinets: Gross Margin Income Statement for the Most Recent YearExhibit 10.1
To download more slides, ebooks, solution manual, and test bank, visit http://downloadslide.blogspot.com
Assume that the amounts in Exhibit 10.1 represent MKC’s total expenditures on fixed manufacturing costs and labor during the most recent year. Verify that MKC’s manufacturing overhead rate is $0.95 per labor $ and that we would allocate $9.50 per linear foot of the Gold line.
Check It! Exercise #1
Elements of Activity-Based Costing (ABC) Systems 403
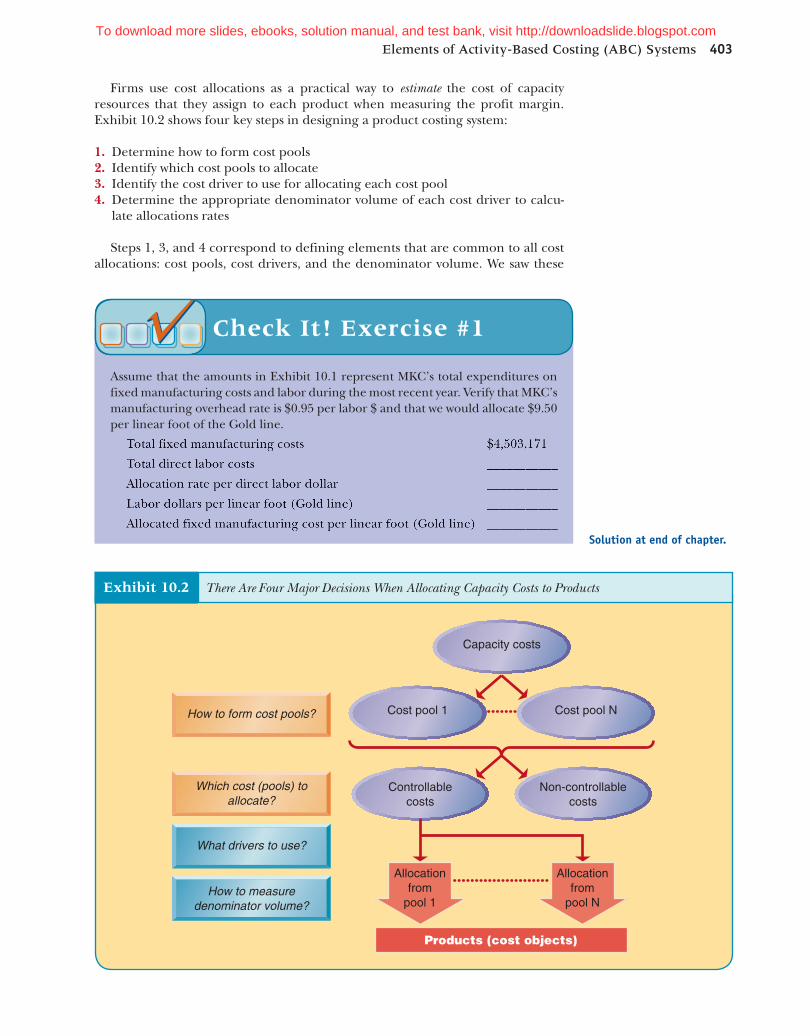
Firms use cost allocations as a practical way to estimate the cost of capacity resources that they assign to each product when measuring the profit margin. Exhibit 10.2 shows four key steps in designing a product costing system:
1. Determine how to form cost pools 2. Identify which cost pools to allocate 3. Identify the cost driver to use for allocating each cost pool 4. Determine the appropriate denominator volume of each cost driver to calcu-
late allocations rates
Steps 1, 3, and 4 correspond to defining elements that are common to all cost allocations: cost pools, cost drivers, and the denominator volume. We saw these
There Are Four Major Decisions When Allocating Capacity Costs to ProductsExhibit 10.2
Balakrishnan-Managerial Accounting/J. Wiley_Exh 10-2 w56
Non-controllablecosts
Cost pool N
Controllablecosts
Cost pool 1
How to measuredenominator volume?
What drivers to use?
Which cost (pools) toallocate?
How to form cost pools?
Capacity costs
Allocationfrom
pool 1
Allocationfrom
pool N
Products (cost objects)
solution at end of chapter.
To download more slides, ebooks, solution manual, and test bank, visit http://downloadslide.blogspot.com

404 Chapter 10 • Activity-Based Costing and Management
elements in Chapter 3 when we first discussed cost allocation procedures in organi-zations. Step 2 (which pools to allocate) corresponds to a refinement in the alloca-tion process from Chapter 3. This refinement is to separate the costs of capacity resources into controllable and noncontrollable costs to properly evaluate the impact of various long-term decisions on profitability.
Activity-based costing (ABC) is an approach to determining product costs. This method assigns the controllable costs of capacity resources more reliably than tradi-tional systems do. As you will see, traditional and activity-based product costing sys-tems differ from each other in each of the four steps involved in a developing a product costing system. We will describe the activity-based system as we lead you through these four steps.
StEp 1: FormIng CoSt poolSThe first step in designing a product costing system is to group capacity costs into cost pools. Recall from Chapter 3 that a cost pool is a collection of the costs of simi-lar resources. We could form cost pools by functions (as we did with EZ-Rest in Chapter 9), departments, or any other logical basis. ABC systems use activities as the basis for forming cost pools.
Activities as Building BlocksActivity-based costing views an organization as a set of coordinated business pro-cesses. A business process converts organizational inputs into a measurable out-put. Examples of business processes in a manufacturing firm include purchase order processing, inventory management, production scheduling, production operations, quality control, and sales order processing. In turn, each business pro-cess is a collection of activities. Purchase order processing includes the activities of soliciting bids from potential vendors, preparing purchase orders, ensuring proper execution of purchase orders, and paying vendors on time. Exhibit 10.3 shows the activities in UPS’s main business process—moving a package from a shipper to a receiver.
Each product (a package in the case of UPS) requires one or more business processes. The cost of a product equals the sum of the costs of the resources it consumes in each of these business processes. That is, in ABC, we form cost pools by the activities that make up a business process. At a fundamental level, activity-based costing systems capture the notion that products require activities and activities consume resources.
Activity HierarchyWe classify organizational activities into one of four categories. These categories correspond to the cost hierarchy that we discussed in Chapter 2.
• Unit-level activities are proportional to production volume. Examples include assembly, inspection, and machining. The more units a firm produces, the
CHAPTEr CONNECTIONsIn Chapter 3, we learned that every cost allocation has four elements: cost pools, cost objects, cost driver, and denominator volume. Products are the cost objects in every product costing system. Activity-based costing provides finer cost estimates because it carefully considers choices regarding the other three elements.
To download more slides, ebooks, solution manual, and test bank, visit http://downloadslide.blogspot.com

greater the machining, assembly, and inspection times. MKC has two kinds of unit-level activities. The first concerns the work of production employees, and the second relates to the operation of equipment.
For a company such as Citibank, unit-level activities include ATM and teller trans-actions, as these activities increase in proportion to the number of customers.
• Batch-level activities pertain to a group of units. When starting production, a firm performs activities such as setting up a machine and first-part inspections. These activities enable the firm to produce many units of the same product in a single run. MKC makes its cabinets in batches. It must schedule each batch, purchase appropriate material, and set up machines. Similarly, for each customer order, it must issue a pick list that specifies the items in the order, pack ordered materials, invoice the customer, and collect payment. These batch-level activities relate to executing production orders and customer orders that may pertain to many units.
For Citibank, opening a bank account is a one-time activity that allows the customer to execute many ATM and teller transactions.
• Product- or customer-level activities relate to a specific product or a specific customer. Examples include product-specific advertising and the work of product managers and product engineers. At MKC, each product line has dedicated tools, jigs, and fixtures. In addition, each product line has dedicated supervisory staff. The lines also occupy differing amounts of warehouse space. Moreover, MKC expends considerable effort to promote its three product lines, with the Platinum line accounting for the lion’s share. Thus, MKC has three product-level activities: production support, marketing support, and warehousing.
For Citibank, maintaining the ATM computer network is a product-level activity. Such activities do not relate to production volume or batches. Rather, these activities relate to introducing a product, maintaining it, or enhancing its features.
• Facility-level activities sustain the business. Examples include the activities performed by security personnel, building and grounds maintenance, and general administration staff. These activities are not specific to any particular unit, batch, or product, but pertain to the business as a whole. MKC’s facility-level costs relate to the long-term lease on factory and office space, including office and general administration.
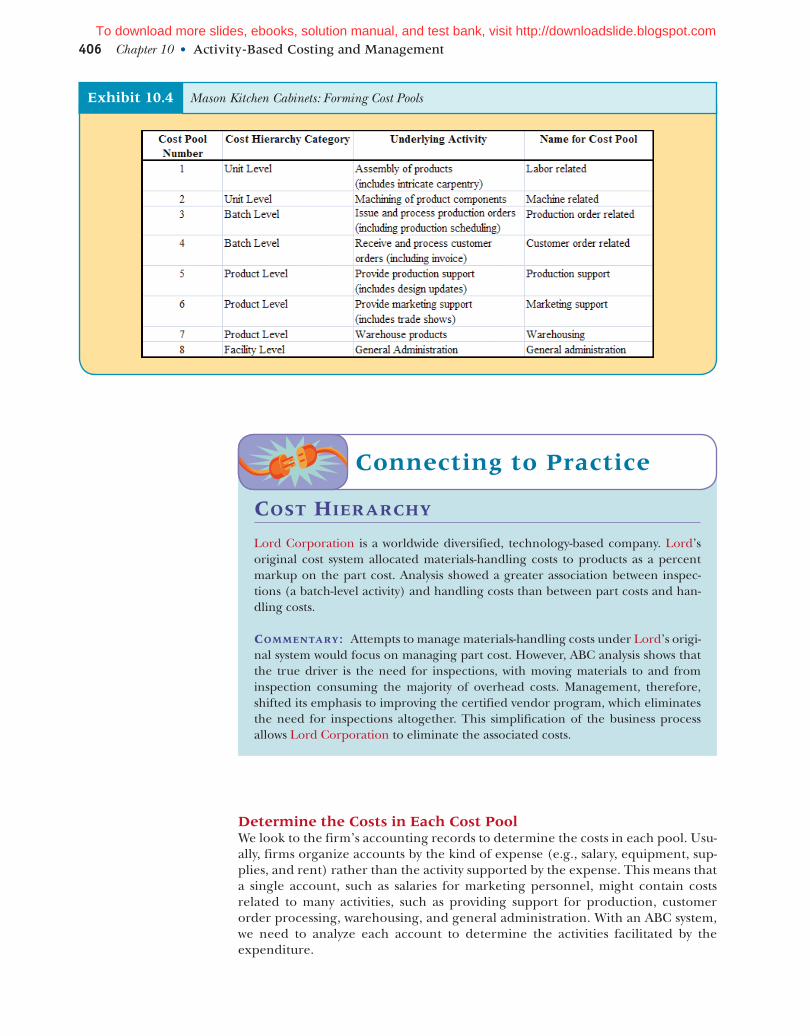
ABC systems require forming cost pools by activities. Therefore, we obtain four kinds of cost pools, corresponding to the four categories of activities in the cost hierarchy. There could be many pools for each category of activity. For MKC, we form eight cost pools corresponding to eight activities, as listed in Exhibit 10.4.
Elements of Activity-Based Costing (ABC) Systems 405
Exhibit 10.3 Shipping a Package Triggers Many Activities and Business Processes
Balakrishnan-Managerial Accounting/J. Wiley_Exh 10-3 w57
Shipper
Pickup
Origincenter
Pickup Sort
Huboperations
Hub Sort
Destinationcenter
Delivery Sort
Receiver
Deliver
Travelfrom
customerTransport Transport
Travelto
customer
For a company such as Citibank, unit-level activities include ATM and teller trans-actions, as these activities increase in proportion to the number of customers. (©Justin Lane/epa/©Corbis)
To download more slides, ebooks, solution manual, and test bank, visit http://downloadslide.blogspot.com
406 Chapter 10 • Activity-Based Costing and Management
Determine the Costs in Each Cost poolWe look to the firm’s accounting records to determine the costs in each pool. Usu-ally, firms organize accounts by the kind of expense (e.g., salary, equipment, sup-plies, and rent) rather than the activity supported by the expense. This means that a single account, such as salaries for marketing personnel, might contain costs related to many activities, such as providing support for production, customer order processing, warehousing, and general administration. With an ABC system, we need to analyze each account to determine the activities facilitated by the expenditure.
Cost HierarCHy
Lord Corporation is a worldwide diversified, technology-based company. Lord’s original cost system allocated materials-handling costs to products as a percent markup on the part cost. Analysis showed a greater association between inspec-tions (a batch-level activity) and handling costs than between part costs and han-dling costs.
Commentary: Attempts to manage materials-handling costs under Lord’s origi-nal system would focus on managing part cost. However, ABC analysis shows that the true driver is the need for inspections, with moving materials to and from inspection consuming the majority of overhead costs. Management, therefore, shifted its emphasis to improving the certified vendor program, which eliminates the need for inspections altogether. This simplification of the business process allows Lord Corporation to eliminate the associated costs.
Connecting to practice
Mason Kitchen Cabinets: Forming Cost PoolsExhibit 10.4
To download more slides, ebooks, solution manual, and test bank, visit http://downloadslide.blogspot.com
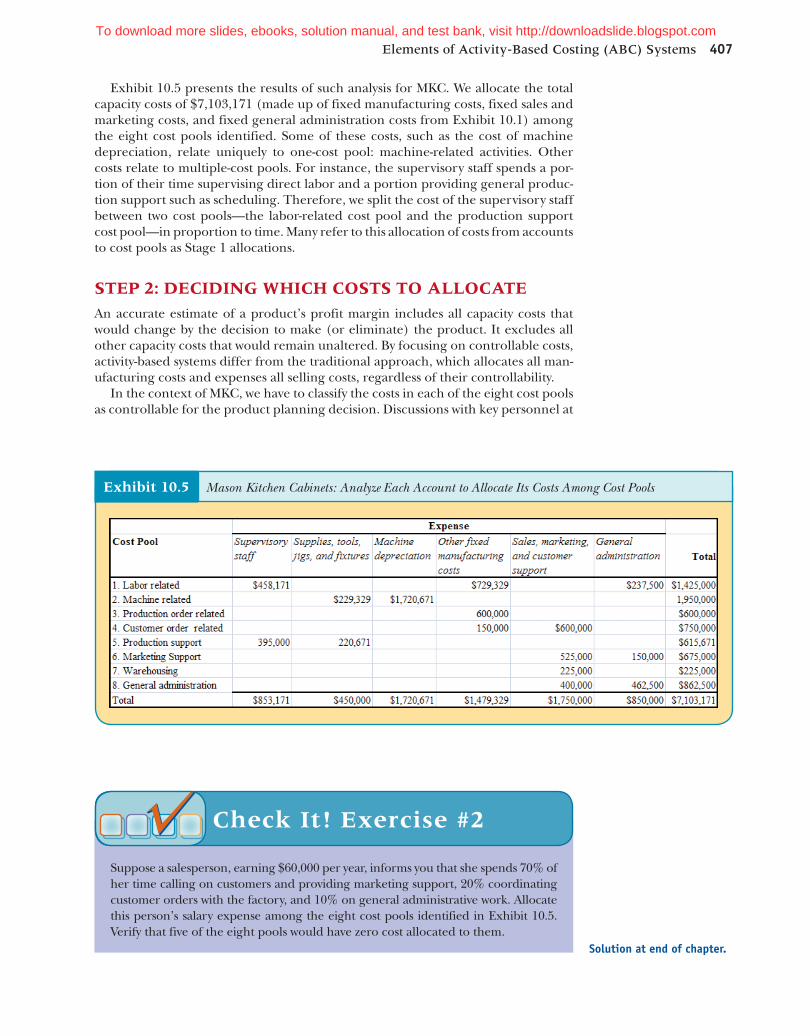
Exhibit 10.5 presents the results of such analysis for MKC. We allocate the total capacity costs of $7,103,171 (made up of fixed manufacturing costs, fixed sales and marketing costs, and fixed general administration costs from Exhibit 10.1) among the eight cost pools identified. Some of these costs, such as the cost of machine depreciation, relate uniquely to one-cost pool: machine-related activities. Other costs relate to multiple-cost pools. For instance, the supervisory staff spends a por-tion of their time supervising direct labor and a portion providing general produc-tion support such as scheduling. Therefore, we split the cost of the supervisory staff between two cost pools—the labor-related cost pool and the production support cost pool—in proportion to time. Many refer to this allocation of costs from accounts to cost pools as Stage 1 allocations.
StEp 2: DECIDIng WHICH CoStS to AlloCAtEAn accurate estimate of a product’s profit margin includes all capacity costs that would change by the decision to make (or eliminate) the product. It excludes all other capacity costs that would remain unaltered. By focusing on controllable costs, activity-based systems differ from the traditional approach, which allocates all man-ufacturing costs and expenses all selling costs, regardless of their controllability.
In the context of MKC, we have to classify the costs in each of the eight cost pools as controllable for the product planning decision. Discussions with key personnel at
Elements of Activity-Based Costing (ABC) Systems 407
Suppose a salesperson, earning $60,000 per year, informs you that she spends 70% of her time calling on customers and providing marketing support, 20% coordinating customer orders with the factory, and 10% on general administrative work. Allocate this person’s salary expense among the eight cost pools identified in Exhibit 10.5. Verify that five of the eight pools would have zero cost allocated to them.
Check It! Exercise #2
Exhibit 10.5 Mason Kitchen Cabinets: Analyze Each Account to Allocate Its Costs Among Cost Pools
solution at end of chapter.
To download more slides, ebooks, solution manual, and test bank, visit http://downloadslide.blogspot.com
408 Chapter 10 • Activity-Based Costing and Management
MKC lead us to conclude that the costs in Pools 1–7 are controllable for product level decisions, whereas the costs in the general administration pool are not. The costs in Pool 8 include expenses, such as the salaries of administrative personnel that are only controllable at the business level.
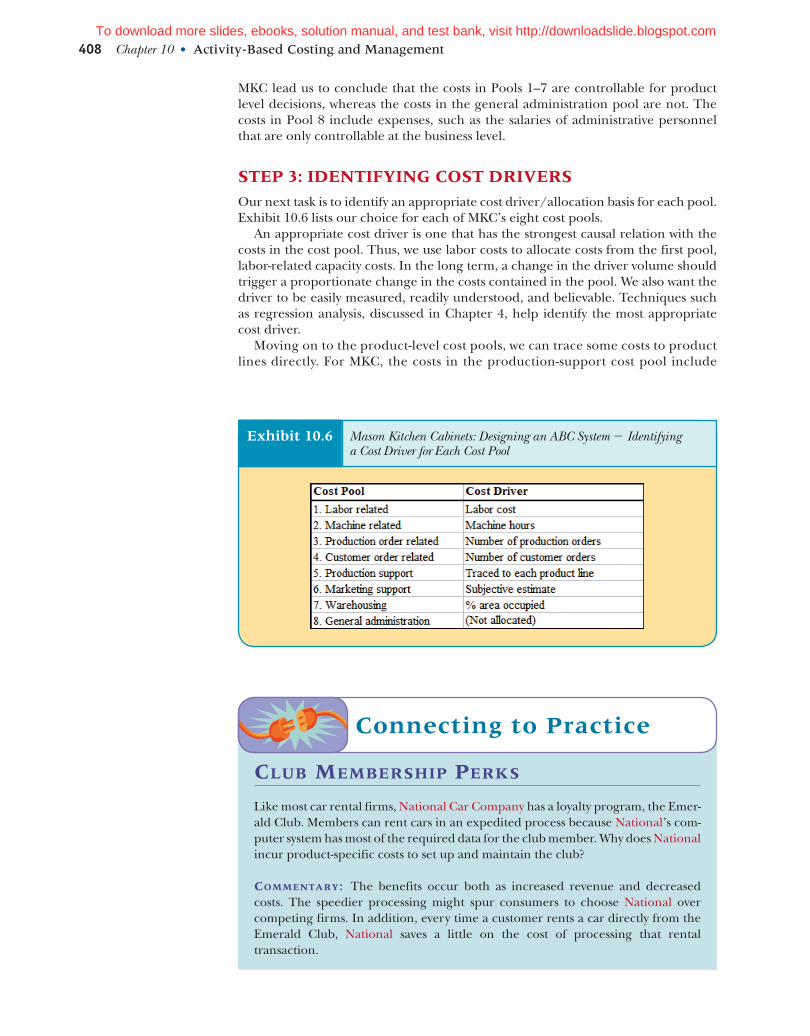
StEp 3: IDEntIFyIng CoSt DrIvErSOur next task is to identify an appropriate cost driver/allocation basis for each pool. Exhibit 10.6 lists our choice for each of MKC’s eight cost pools.
An appropriate cost driver is one that has the strongest causal relation with the costs in the cost pool. Thus, we use labor costs to allocate costs from the first pool, labor-related capacity costs. In the long term, a change in the driver volume should trigger a proportionate change in the costs contained in the pool. We also want the driver to be easily measured, readily understood, and believable. Techniques such as regression analysis, discussed in Chapter 4, help identify the most appropriate cost driver.
Moving on to the product-level cost pools, we can trace some costs to product lines directly. For MKC, the costs in the production-support cost pool include
Exhibit 10.6 Mason Kitchen Cabinets: Designing an ABC System 2 Identifying a Cost Driver for Each Cost Pool
Club membersHip perks
Like most car rental firms, National Car Company has a loyalty program, the Emer-ald Club. Members can rent cars in an expedited process because National’s com-puter system has most of the required data for the club member. Why does National incur product-specific costs to set up and maintain the club?
Commentary: The benefits occur both as increased revenue and decreased costs. The speedier processing might spur consumers to choose National over competing firms. In addition, every time a customer rents a car directly from the Emerald Club, National saves a little on the cost of processing that rental transaction.
Connecting to practice
To download more slides, ebooks, solution manual, and test bank, visit http://downloadslide.blogspot.com

items such as dedicated supervisory staff, and product-specific tools, jigs, and fixtures. We directly trace, rather than allocate, these costs to the product lines.
In contrast, the marketing support cost pool contains costs related to marketing and sales staff. These personnel serve all products, requiring the allocation of the associated costs. As is the case for MKC, this allocation often is subjective because marketing and sales staff do not keep detailed time sheets. We allocate warehousing using the number of square feet as the driver.
StEp 4: mEASurIng DEnomInAtor volumEUnlike traditional systems, ABC systems frequently use practical capacity as the denominator volume when calculating allocation rates. In traditional systems, we compute allocation rates by dividing the costs in a cost pool by the actual (or bud-geted) volume in any given period. This procedure spreads all capacity costs over actual (or budgeted) volume—regardless of whether we use, or expect to use, avail-able capacity fully. Thus, during periods when production volume is low and there is idle capacity, we spread capacity costs over a smaller production volume, driving up allocation rates. Products will seem costlier than normal in periods of low demand simply because of the way we allocate capacity costs.
ABC systems use practical capacity, an estimate of the maximum possible activity level, as the basis to allocate capacity costs. The advantage of a practical capacity-based allocation rate is that it does not change across periods. If a product con-sumes the same amount of resources, the cost allocated to it will also stay the same. In other words, this method assigns capacity costs to products strictly in proportion to use.
Unallocated activity cost is the difference between allocated activity costs and actual spending on capacity resources. It represents the cost of unused capacity. For example, suppose the direct labor cost is $250,000 in a given month, but only
MKC’s selling and administration costs include $225,000 toward warehousing. The warehouse has a capacity of 100,000 square feet. Currently, the Silver, Gold, and Platinum lines occupy 45,000, 20,000, and 15,000 square feet of space, respectively. Verify that (1) there is zero unused capacity if we use actual capacity as the denomi-nator volume, and that (2) the cost of unused capacity is $45,000 if we use practical capacity to allocate costs.
Check It! Exercise #3
Elements of Activity-Based Costing (ABC) Systems 409
solution at end of chapter.
To download more slides, ebooks, solution manual, and test bank, visit http://downloadslide.blogspot.com
410 Chapter 10 • Activity-Based Costing and Management
$225,000 is allocated to activities performed. Then the difference, $25,000, is the cost of underutilizing direct labor during that month; that is, it is the cost of unused labor capacity.
Highlighting the cost of unused capacity is valuable for managing costs. If a por-tion of the cost remains unallocated period after period, the company may as well cut back on wasteful spending by eliminating the unused capacity. From a decision-making perspective, identifying and isolating the cost of unused capacity is the primary reason for using practical capacity as the denominator volume. In the Appendix, we discuss accounting for the cost of unused capacity in detail.
Having made choices concerning each of the four elements of a product costing system, we are now in a position to compute the cost of each of MKC’s product lines and examine how data from an ABC system can help in decision making.
aCtivity-based Costing in praCtiCe
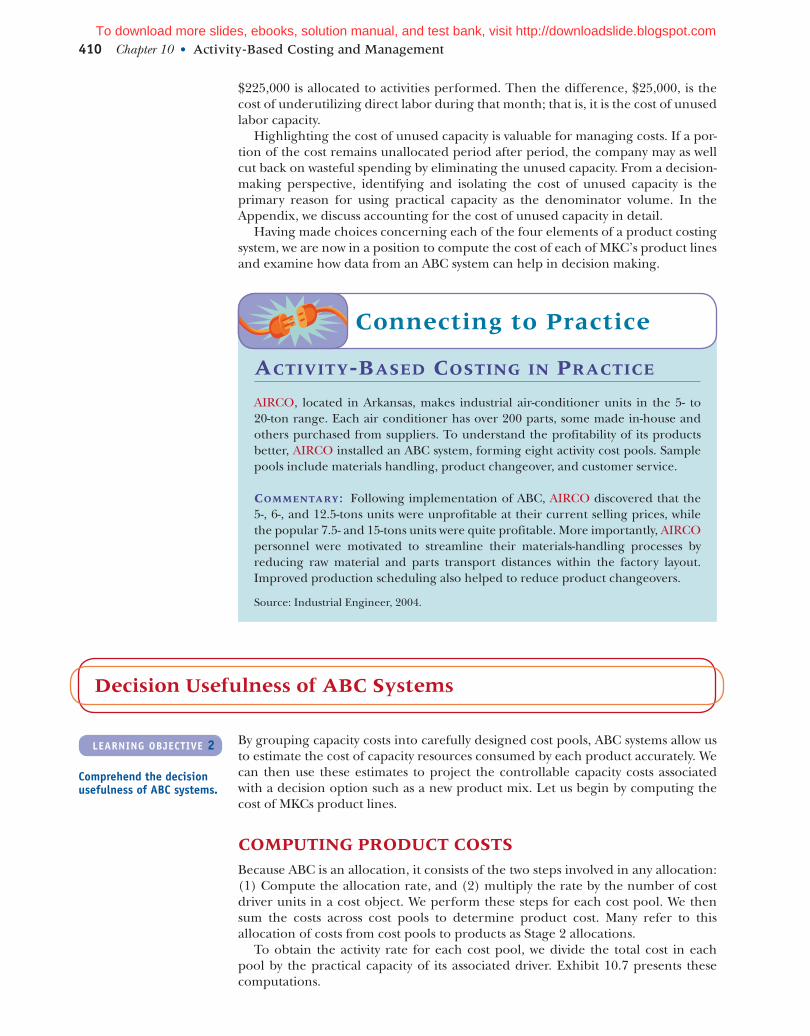
AIRCO, located in Arkansas, makes industrial air-conditioner units in the 5- to 20-ton range. Each air conditioner has over 200 parts, some made in-house and others purchased from suppliers. To understand the profitability of its products better, AIRCO installed an ABC system, forming eight activity cost pools. Sample pools include materials handling, product changeover, and customer service.
Commentary: Following implementation of ABC, AIRCO discovered that the 5-, 6-, and 12.5-tons units were unprofitable at their current selling prices, while the popular 7.5- and 15-tons units were quite profitable. More importantly, AIRCO personnel were motivated to streamline their materials-handling processes by reducing raw material and parts transport distances within the factory layout. Improved production scheduling also helped to reduce product changeovers.
Source: Industrial Engineer, 2004.
Connecting to practice
By grouping capacity costs into carefully designed cost pools, ABC systems allow us to estimate the cost of capacity resources consumed by each product accurately. We can then use these estimates to project the controllable capacity costs associated with a decision option such as a new product mix. Let us begin by computing the cost of MKCs product lines.
ComputIng proDuCt CoStSBecause ABC is an allocation, it consists of the two steps involved in any allocation: (1) Compute the allocation rate, and (2) multiply the rate by the number of cost driver units in a cost object. We perform these steps for each cost pool. We then sum the costs across cost pools to determine product cost. Many refer to this allocation of costs from cost pools to products as Stage 2 allocations.
To obtain the activity rate for each cost pool, we divide the total cost in each pool by the practical capacity of its associated driver. Exhibit 10.7 presents these computations.
Decision usefulness of ABC Systems
Comprehend the decision usefulness of ABC systems.
LEArNINg OBjECTIvE 2
To download more slides, ebooks, solution manual, and test bank, visit http://downloadslide.blogspot.com
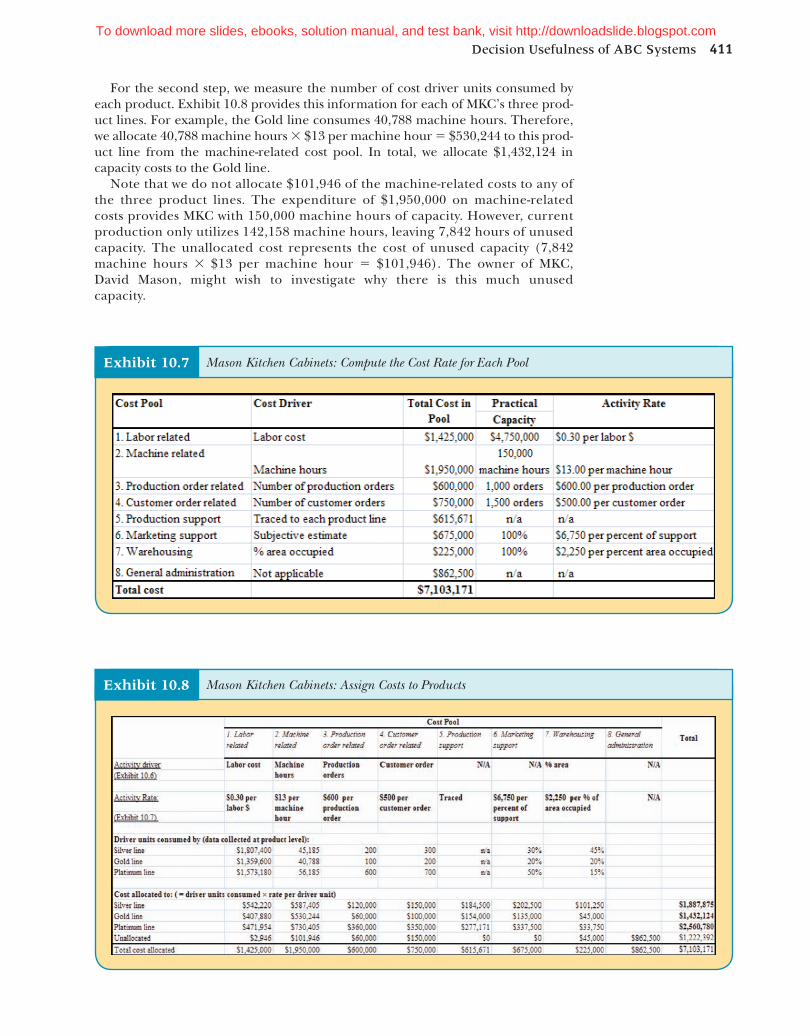
For the second step, we measure the number of cost driver units consumed by each product. Exhibit 10.8 provides this information for each of MKC’s three prod-uct lines. For example, the Gold line consumes 40,788 machine hours. Therefore, we allocate 40,788 machine hours 3 $13 per machine hour 5 $530,244 to this prod-uct line from the machine-related cost pool. In total, we allocate $1,432,124 in capacity costs to the Gold line.
Note that we do not allocate $101,946 of the machine-related costs to any of the three product lines. The expenditure of $1,950,000 on machine-related costs provides MKC with 150,000 machine hours of capacity. However, current production only utilizes 142,158 machine hours, leaving 7,842 hours of unused capacity. The unallocated cost represents the cost of unused capacity (7,842 machine hours 3 $13 per machine hour 5 $101,946). The owner of MKC, David Mason, might wish to investigate why there is this much unused capacity.
Exhibit 10.7 Mason Kitchen Cabinets: Compute the Cost Rate for Each Pool
Exhibit 10.8 Mason Kitchen Cabinets: Assign Costs to Products
Decision Usefulness of ABC Systems 411To download more slides, ebooks, solution manual, and test bank, visit http://downloadslide.blogspot.com
412 Chapter 10 • Activity-Based Costing and Management
Now that we have completed our ABC system for MKC, we are ready to report ABC data.
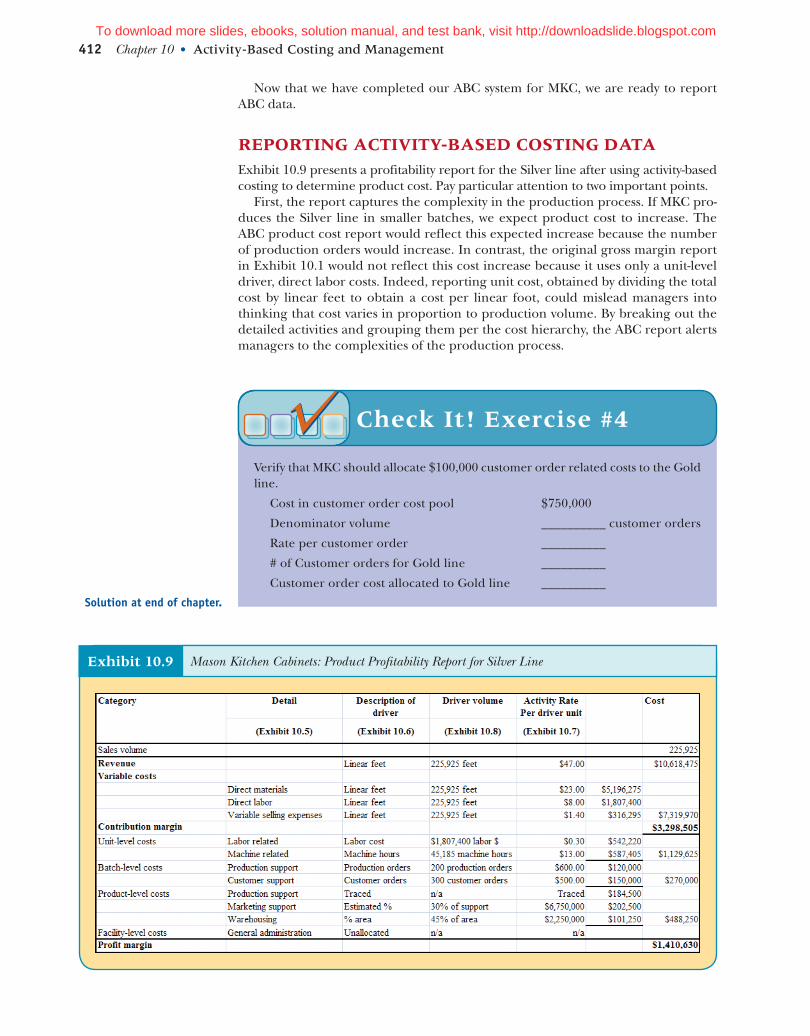
rEportIng ACtIvIty-BASED CoStIng DAtAExhibit 10.9 presents a profitability report for the Silver line after using activity-based costing to determine product cost. Pay particular attention to two important points.
First, the report captures the complexity in the production process. If MKC pro-duces the Silver line in smaller batches, we expect product cost to increase. The ABC product cost report would reflect this expected increase because the number of production orders would increase. In contrast, the original gross margin report in Exhibit 10.1 would not reflect this cost increase because it uses only a unit-level driver, direct labor costs. Indeed, reporting unit cost, obtained by dividing the total cost by linear feet to obtain a cost per linear foot, could mislead managers into thinking that cost varies in proportion to production volume. By breaking out the detailed activities and grouping them per the cost hierarchy, the ABC report alerts managers to the complexities of the production process.
Verify that MKC should allocate $100,000 customer order related costs to the Gold line.
Cost in customer order cost pool $750,000
Denominator volume __________ customer orders
Rate per customer order __________
# of Customer orders for Gold line __________
Customer order cost allocated to Gold line __________
Check It! Exercise #4
Exhibit 10.9 Mason Kitchen Cabinets: Product Profitability Report for Silver Line
solution at end of chapter.
To download more slides, ebooks, solution manual, and test bank, visit http://downloadslide.blogspot.com

Second, the ABC report uses batch-, product-, and facility-level drivers. Neverthe-less, unit-level costs still account for a substantial part of capacity costs. Consider the total firm level data shown in Exhibit 10.7. By adding labor-related costs and machine-related costs, we find that unit-level costs equal $3,375,000, which is 47.5% of the total overhead of $7.1 million. Thus, the volume of operations is still an important driver of the capacity resources consumed by the product.
Exhibit 10.10 provides a product-profitability statement for MKC, using ABC to evaluate each product line’s profit margin. Notice that MKC’s profit before taxes under the ABC method remains the same as in Exhibit 10.1. This equivalence shows that ABC is just another cost allocation system. Changing the method for allocating costs does not change total cost. Aggregate net income will stay the same.
Use the worksheet below to verify the profit margin for the Gold line as $947,176.
Check It! Exercise #5
Exhibit 10.10 Mason Kitchen Cabinets: Product Profitability Statement
Decision Usefulness of ABC Systems 413
solution at end of chapter.
To download more slides, ebooks, solution manual, and test bank, visit http://downloadslide.blogspot.com

414 Chapter 10 • Activity-Based Costing and Management
However, changing the allocation method affects the reported profit margins for each of the product lines. As we see in Exhibit 10.11, ABC dramatically alters the ranking of products per their profitability. Contrary to David’s belief, the Platinum line incurs a loss on a fully allocated basis! There are logical reasons for this reversal in profitability. The Silver line is popular among high-volume low-cost homebuild-ers. Order sizes typically are large, and the production lot sizes are large as well. On the other hand, the Platinum line is popular among custom builders. While MKC receives numerous orders for this line, the order sizes are usually small. The ABC report factors in the cost of processing the additional orders, which leads to lower profitability for the Platinum line.
Why does the gross margin report in Exhibit 10.1 not reflect these features? The answer is that we allocate more than a proportionate share of capacity costs to high-volume products when we use volume-based drivers such as direct labor hours. Because total overhead is the same, volume-based allocations generally underreport costs for low-volume products. Managers refer to this phenomenon as the high-vol-ume product cross subsidizing the low-volume product.
Finally, notice that the product profit margins reported in Exhibit 10.10 do not include $862,500 of facility-level costs or $359,892 of the cost of unused capacity. We did not allocate the $862,500 among the three product lines because this cost is not controllable at the product level. Furthermore, changing the product mix is unlikely to affect the magnitude of this cost. The cost is relevant, however, when evaluating firm profitability. For example, the facility-level cost is controllable for the decision to keep MKC going or to shut it down. The remaining $359,892 represents the cost of unused capacity in various cost pools (see last line in Exhibit 10.8). This amount includes, for example, the 20% of unused warehouse space.
DECISIonS At mKCDavid sees the logic and merit in the design of the ABC system. He agrees that ABC data provide a more realistic estimate of the capacity resources consumed by the products, relative to the absorption costing system MKC currently uses. Based on the ABC data, he identifies several paths for MKC to increase profitability.
• Deemphasize the Platinum line: This move will allow David to use the freed-up resources to produce more of the Silver or Gold lines. However, David believes that the Platinum line contributes significantly to the company’s reputation as a quality kitchen cabinetmaker. Reputation is hard to quantify but should not be ignored. Cost information should not be the only basis for making product-related decisions. Strategically, MKC might prefer to maintain a limited production of the Platinum line.
Exhibit 10.11 Mason Kitchen Cabinets: Comparing Product Margins Using Contribution Margin, Gross Margin, and ABC
To download more slides, ebooks, solution manual, and test bank, visit http://downloadslide.blogspot.com

• Increase the price of the Platinum line : This may be a viable option for David if he still wants to emphasize the Platinum line. It is possible that the customer segment for the Platinum line is not price-sensitive. Customers should be willing to pay the price at which MKC can profitably sell this line. David may have underpriced this line based on inaccurate cost information from the old cost system.
• Manage costs : A third option is to find ways to improve production efficiencies within the organization and cut costs. As it turns out, the ABC system provides valuable information to manage costs effectively. We discuss this process, activity-based management, later in this chapter.
These options are not mutually exclusive. David should also consider pursuing a combination of these avenues.
APPlyinG the DeciSion FrAmeworkWhat Is the Problem?
MKC’s profits have shown a decreasing trend in recent years.
What Are the Options?
There are numerous options, including changing the product mix and contracting or expanding capacity levels.
What Are the Costs and Benefits?
The ABC product costing system shows the Silver line to be more profitable than believed, while the Platinum line is less profitable.
Make the Decision!
David decides to change the emphasis among and the prices of his three lines. This strategy could include a number of decisions such as increasing the price for the Platinum line, focusing only on some market segments, and rearranging production processes to reduce cost.
abC at ups
Deregulation of interstate commerce freight provided the impetus for detailed ABC implementation at UPS, the world’s largest package distribution company. UPS transports more than 3.1 billion parcels and documents annually. With over 500 aircraft, 157,000 vehicles, and 1,700 facilities providing service in over 200 countries, UPS has made a worldwide commitment to serving the needs of the global marketplace. Prior to deregulation, UPS based its prices on weight and dis-tance alone. The revised system considers numerous factors such as location of pickup/drop-off, the nature of delivery, and the number of packages shipped in determining the price charged to a customer.
Commentary: Many events can spur ABC implementations, including fluctuat-ing profit margins and the adoption of new technologies. Moreover, external change such as deregulation or the emergence of new competition can also trig-ger a reexamination of the firm’s business processes and costing systems.
Connecting to practice
Decision Usefulness of ABC Systems 415
UPS makes extensive use of detailed cost data when setting prices. (REUTERS/ John Sommers II/Landov LLC)
To download more slides, ebooks, solution manual, and test bank, visit http://downloadslide.blogspot.com
416 Chapter 10 • Activity-Based Costing and Management
ImplEmEntIng ACtIvIty-BASED CoStIngOf course, there is no free lunch! ABC provides a firm with improved data for plan-ning and control. The firm gains by basing its decisions on better data. However, implementing a full-fledged activity-based costing system is often a costly, time- consuming, and tedious exercise. ABC advocates the use of multiple-cost pools and cost drivers to capture more accurately the consumption of resources by cost objects. Therefore, it also requires more detailed information systems. Thus, there is a sub-stantive cost associated with designing, implementing, and maintaining an ABC sys-tem. Indeed, a survey by the Institute of Management Accountants shows that only 54% of responding firms in the United States use activity-based costing.
Activity-Based management
In this section, we discuss how to use the information from ABC systems to improve profitability by managing products, customers, and resources. We refer to this use of activity-based costing information as activity-based management, or simply ABM.
proDuCt plAnnIngAs we have learned in this chapter so far, ABC provides useful information for prod-uct planning by providing accurate estimates of profit margins. Like MKC, firms routinely rebalance their product portfolios to remain competitive as new market trends emerge and as technologies change. For example, two decades ago only a few automobile manufacturers marketed sports utility vehicles (SUVs). Now, virtu-ally all auto manufacturers, including BMW, Mercedes, and Porsche, offer SUVs. Some industries, such as consumer electronics, have dynamic market conditions. Firms in those industries must rebalance their product portfolios more frequently. Companies such as Fisher continuously update their audio and CD product lines. In industries characterized by stable market conditions, such as energy and staple foods, product portfolio rebalancing occurs less frequently.
In the case of MKC, the Platinum line has a positive contribution margin. Yet we found that it has a negative profit margin. As we learned in Chapters 5 and 6, a prod-uct with a positive contribution margin may help improve short-term profits. Over an extended horizon, however, a firm cannot survive unless its products have posi-tive profit margins. Absent strategic considerations, MKC should either raise the price on the Platinum line or consider dropping the product from its portfolio.
Decisions about product pricing and quantity determine the revenue received from products. Typically, we conceive of an inverse relation between price and quantity—the lower the price, the higher the quantity demanded and vice versa. While reducing the price of a product decreases its profit margin, a firm may be able to make up for the lost margin by selling more of the product. Nevertheless, in the long-term, the ABC cost provides a floor for setting the price. If the firm is not able to generate a unit price above this cost, dropping the product from its portfolio may be the best option.
CuStomEr plAnnIngAs we have seen, ABC systems help greatly in accurately evaluating the profitability of various products. However, we have assumed thus far that selling a product generates the same amount of profit regardless of who buys it, which is often not the case. Some
Explain the importance of activity-based management (ABM) in planning prod-ucts, customers, and resources.
LEArNINg OBjECTIvE 3
To download more slides, ebooks, solution manual, and test bank, visit http://downloadslide.blogspot.com

customers are more demanding, requiring more of an organization’s time and resources. Selling to these customers at the same price would yield lower profits.
Firms perform customer planning to examine the profitability of individual cus-tomers and market segments, and take appropriate actions to improve profitability. For example, MKC supplies kitchen cabinets to high-end custom homebuilders as well as retail home improvement stores. Knowing the profitability of each of these two market segments is clearly important for MKC in making decisions such as which segment to focus on, how to price their cabinets in the two segments, and how to allocate its resources. As Exhibit 10.12 shows, we can use an ABC system to measure the profitability or profit potential of an individual customer or a market segment. Instead of the product, we simply use the customer or the market segment as the cost object or the unit of analysis. That is, we allocate controllable capacity costs to various customers, rather than products, in proportion to their relative use to the capacity resources.
Customer-focused analysis is important because sales and administration costs associated with acquiring, servicing, and retaining customers often account for a significant portion of total costs, as they do for firms in the financial services indus-try like Citibank and FirstUSA. For many businesses, a few large customers account for a significant portion of total revenue. For example, Motorola is a major cus-tomer for Air Products & Chemicals. WalMart is often the major customer for many of its suppliers. It is good business practice for firms to measure customer costs and monitor the profitability of major customers. They may then effectively manage these relationships to improve profitability.
Customer costs include the unit-, batch-, product-, and facility-level capacity costs consumed by specific customers. Unit-level costs are proportional to customers’ order volume and include items such as packaging and freight. Batch-level costs relate to customers’ frequency of ordering or order sizes. Product-level costs may include the costs associated with tailoring a product to customers’ desires. Facility-level costs may
Exhibit 10.12 Product- and Customer-Level Profit Analysis Group the Same Costs Differently
Balakrishnan-Managerial Accounting/J. Wiley_Exh 10-12 w58
Overall Profit
Product-levelcontribution
margin
–
–
=
–
–
=
= =
Product-levelcosts
Product profitmargin
Noncontrollablecosts
(Products)
Customer-levelcontribution
margin
Product Profitability Customer Profitability
Customer-levelcosts
Customer profitmargin
Noncontrollablecosts
(Customers)
Capacity
Analyzeby
products
Analyzeby
customers
Revenue &variable cost
Groupby
products
Groupby
customers
Activity-Based Management 417To download more slides, ebooks, solution manual, and test bank, visit http://downloadslide.blogspot.com
418 Chapter 10 • Activity-Based Costing and Management
include warehousing of customers’ products. Exhibit 10.13 presents typical profiles of customers with high and low costs that emerge from analyzing information provided by ABC systems.
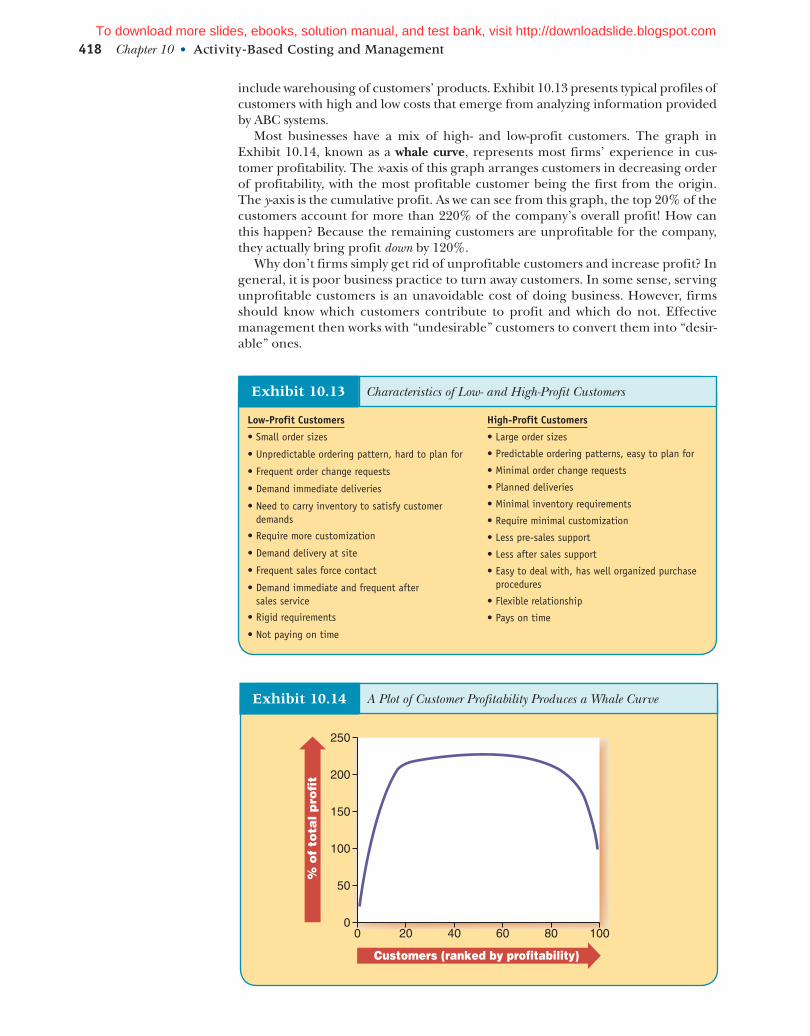
Most businesses have a mix of high- and low-profit customers. The graph in Exhibit 10.14, known as a whale curve, represents most firms’ experience in cus-tomer profitability. The x-axis of this graph arranges customers in decreasing order of profitability, with the most profitable customer being the first from the origin. The y-axis is the cumulative profit. As we can see from this graph, the top 20% of the customers account for more than 220% of the company’s overall profit! How can this happen? Because the remaining customers are unprofitable for the company, they actually bring profit down by 120%.
Why don’t firms simply get rid of unprofitable customers and increase profit? In general, it is poor business practice to turn away customers. In some sense, serving unprofitable customers is an unavoidable cost of doing business. However, firms should know which customers contribute to profit and which do not. Effective management then works with “undesirable” customers to convert them into “desir-able” ones.
Exhibit 10.13 Characteristics of Low- and High-Profit Customers
Low-Profit Customers High-Profit Customers
• Small order sizes • Large order sizes
• Predictable ordering patterns, easy to plan for
• Minimal order change requests
• Planned deliveries
• Minimal inventory requirements
• Require minimal customization
• Less pre-sales support
• Less after sales support
• Easy to deal with, has well organized purchase procedures
• Flexible relationship
• Pays on time
• Unpredictable ordering pattern, hard to plan for
• Frequent order change requests
• Demand immediate deliveries
• Need to carry inventory to satisfy customer demands
• Require more customization
• Demand delivery at site
• Frequent sales force contact
• Demand immediate and frequent after sales service
• Rigid requirements
• Not paying on time
Exhibit 10.14 A Plot of Customer Profitability Produces a Whale Curve
Balakrishnan-Managerial Accounting/J. Wiley_Exh 10-14 w59
Customers (ranked by profitability)
% o
f to
tal p
rofi
t
0 100806040200
50
100
150
200
250
To download more slides, ebooks, solution manual, and test bank, visit http://downloadslide.blogspot.com

rESourCE plAnnIngBy estimating product costs based on resource usage, an ABC system enables us to determine the capacity levels required by a proposed product portfolio. When a firm contemplates a change in the product portfolio, it can use ABC to determine how much additional capacity is needed or how much can be freed up. With such resource planning information, the firm can evaluate how its profits will change under various product planning options.
Firms plan their capacity levels to match demand conditions over the long term. Once machines are purchased, factories are built, and other commitments are made, it is difficult to make quick changes. There is no sense in installing more capacity than required, or investing in insufficient capacity.
Activity-based costing helps resource planning in a number of ways. First, it pin-points activities and business processes that are costly. Firms can then target these specific areas for improving efficiencies. Second, it isolates the cost of excess capac-ity from the productive use of capacity, so that firms can find profitable ways of deal-ing with the excess capacity.
Improving Business process/Activity performanceIn a competitive environment, it is important for firms to perform various activities efficiently to ensure that they stay in business for a long time. Firms must therefore constantly look out for ways to improve their operations. But we must first know where to look. This is not an easy task; organizations have many business processes and a multitude of activities. It is both difficult and inefficient to go through every activity systematically and then analyze it in detail. How then does a firm decide which activities to target for improvement?
There is no simple answer to this question. Frequently, firms will emphasize costly activities or business processes. Improving efficiencies with respect to these activities can make a significant difference in the firm’s cost structure. To identify
Customer profitability at a Credit union
The following (disguised) data are from a credit union. All data are in percentages.
Commentary: The data clearly show that a few households contribute to the bulk of the Credit Union’s profit. The top 39% of households are profitable, while the bottom 61% are not profitable. Furthermore, loans appear to be a primary driver of profitability. Notice, however, that the credit union needs the Tier 5 households to obtain the capital that it lends! Thus, just as we consider product portfolios, we also need to consider customer portfolios to take account of the relations among different customer segments.
Connecting to practice
Activity-Based Management 419To download more slides, ebooks, solution manual, and test bank, visit http://downloadslide.blogspot.com
420 Chapter 10 • Activity-Based Costing and Management
costly activities and processes, firms can use their ABC system. For example, by using ABC, MKC has found that it currently spends a total of $1,350,000 on order-related activities. Each production order currently costs $600, and each customer order currently costs $500. These are two processes that MKC may target for im-proving efficiencies, leading to lower costs.
Once a process is selected, the following steps describe how we can go about improving its efficiency:
• Develop a process map for each activity/process chosen. Understand how it works. Each element in the process performs a function and consumes resources.
• Identify value- and non-value-adding activities. Non-value-adding activities cost money but do not provide commensurate benefits. Firms can identify non-value-adding activities by asking, “If we eliminate this activity, would the customer notice?” An activity such as issuing the production order clearly adds value. However, entering the customer’s order in multiple data systems adds no value from the perspective of the customer. Eliminating non-value-adding activities improves costs and efficiencies—by eliminating the need for MKC’s various personnel to enter the customer’s order, it may be possible to reduce the activity rate from $500 to, say, $400.
• Seek ways to improve value-adding activities. One way of reducing the cost of customer inquiries is to set up an informative Web site with all the necessary details and provide on-line access to a database of frequently asked questions and responses. Although developing and maintaining this Web site has its own costs, the site may well be a cheaper alternative.
Firms also may focus on activities that appear inefficient compared to industry best practices. Many companies “benchmark” their activities and business processes against the best industry practice or a market rival in order to identify areas of improvement. Usually, benchmarking exercises involve consulting with industry experts. Firms compare the ABC cost of performing these activities and businesses processes with these benchmarks. They can then determine the competitiveness of their operations and assess the extent to which they need to improve to become competitive. In this way, activity-based management is a valuable tool for companies in achieving their business goals.
resourCe planning in Hospitals
The Des Moines Register reports that patients had to wait for up to 23 days to sched-ule a CAT scan at “University Hospital,” a real hospital that chose to remain anony-mous. After studying the process, the hospital had the patients drink the “contrast material” needed for the scan when they first arrived rather than after completing the preparatory work.
Commentary: How can this seemingly small change in the process improve the waiting time?
It eliminated the need for a staging room, allowing for better coordination of high-cost screening equipment, which require technicians’ and nurses’ time. Patients now wait no more than a day to schedule a scan, the hospital does 12 more scans each day, and the patient time in the office has dropped 38 minutes.
Source: Des Moines Register, October 31, 2004.
Connecting to practice
To download more slides, ebooks, solution manual, and test bank, visit http://downloadslide.blogspot.com
understand the elements of an activity-based costing (ABC) system.
LEArNINg OBjECT IvE 1
rapid review
summary
Comprehend the decision usefulness of ABC systems.
LEArNINg OBjECT IvE 2
Explain the importance of activity-based management (ABm) in planning products, customers, and resources.
LEArNINg OBjECT IvE 3
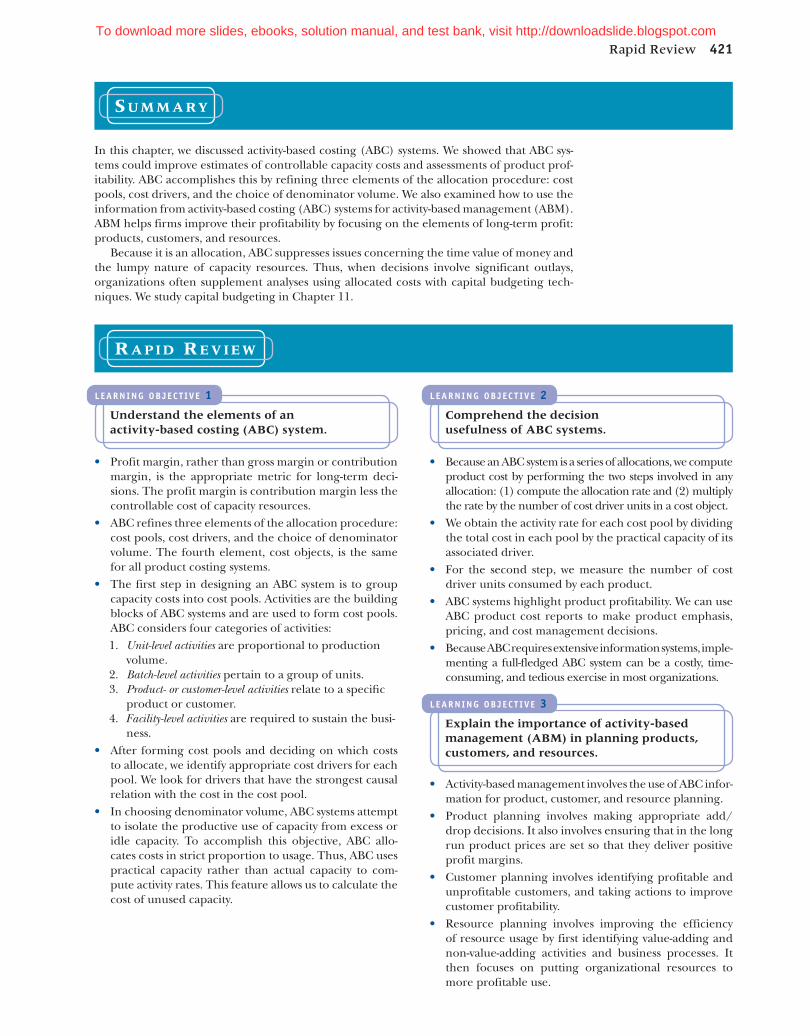
In this chapter, we discussed activity-based costing (ABC) systems. We showed that ABC sys-tems could improve estimates of controllable capacity costs and assessments of product prof-itability. ABC accomplishes this by refining three elements of the allocation procedure: cost pools, cost drivers, and the choice of denominator volume. We also examined how to use the information from activity-based costing (ABC) systems for activity-based management (ABM). ABM helps firms improve their profitability by focusing on the elements of long-term profit: products, customers, and resources.
Because it is an allocation, ABC suppresses issues concerning the time value of money and the lumpy nature of capacity resources. Thus, when decisions involve significant outlays, organizations often supplement analyses using allocated costs with capital budgeting tech-niques. We study capital budgeting in Chapter 11.
• Profit margin, rather than gross margin or contribution margin, is the appropriate metric for long-term deci-sions. The profit margin is contribution margin less the controllable cost of capacity resources.
• ABC refines three elements of the allocation procedure: cost pools, cost drivers, and the choice of denominator volume. The fourth element, cost objects, is the same for all product costing systems.
• The first step in designing an ABC system is to group capacity costs into cost pools. Activities are the building blocks of ABC systems and are used to form cost pools. ABC considers four categories of activities:1. Unit-level activities are proportional to production
volume.2. Batch-level activities pertain to a group of units.3. Product- or customer-level activities relate to a specific
product or customer.4. Facility-level activities are required to sustain the busi-
ness.• After forming cost pools and deciding on which costs
to allocate, we identify appropriate cost drivers for each pool. We look for drivers that have the strongest causal relation with the cost in the cost pool.
• In choosing denominator volume, ABC systems attempt to isolate the productive use of capacity from excess or idle capacity. To accomplish this objective, ABC allo-cates costs in strict proportion to usage. Thus, ABC uses practical capacity rather than actual capacity to com-pute activity rates. This feature allows us to calculate the cost of unused capacity.
• Because an ABC system is a series of allocations, we compute product cost by performing the two steps involved in any allocation: (1) compute the allocation rate and (2) multiply the rate by the number of cost driver units in a cost object.
• We obtain the activity rate for each cost pool by dividing the total cost in each pool by the practical capacity of its associated driver.
• For the second step, we measure the number of cost driver units consumed by each product.
• ABC systems highlight product profitability. We can use ABC product cost reports to make product emphasis, pricing, and cost management decisions.
• Because ABC requires extensive information systems, imple-menting a full-fledged ABC system can be a costly, time-consuming, and tedious exercise in most organizations.
• Activity-based management involves the use of ABC infor-mation for product, customer, and resource planning.
• Product planning involves making appropriate add/drop decisions. It also involves ensuring that in the long run product prices are set so that they deliver positive profit margins.
• Customer planning involves identifying profitable and unprofitable customers, and taking actions to improve customer profitability.
• Resource planning involves improving the efficiency of resource usage by first identifying value-adding and non-value-adding activities and business processes. It then focuses on putting organizational resources to more profitable use.
Rapid Review 421To download more slides, ebooks, solution manual, and test bank, visit http://downloadslide.blogspot.com

422 Chapter 10 • Activity-Based Costing and Management
Because ABC uses practical capacity to calculate allocation rates, it helps isolate the cost of unused capacity. How should firms deal with the cost of unused capacity?
The correct way to deal with the cost depends on the reason for the idle capacity. It is possible that the unused capacity has no gainful purpose whatsoever. In this case, the firm should avoid the cost by ridding itself of the excess capacity. However, it also is possible that the unused capacity is attributable to a temporary lull in demand, such as when demand is seasonal, as is the case for a utility company like MidAmerican Energy. In such instances, firms cannot dispose of this capacity because it will need the capacity in times when demand peaks. Accordingly, we attri-bute the cost of having to carry excess capacity during lean months to the produc-tion in peak months.
Another reason for carrying excess capacity is that it serves a strategic role. For instance, analysts speculate that Monsanto built a large glyphosate plant in Cama-cari, Brazil, partly to deter entry from competitors. In this case, we attribute the cost of unused capacity to management strategy. Other reasons for unused capacity include planning for growth or uncertain demand from a large customer.
By isolating the cost of unused capacity, ABC helps management investigate the underlying reason and charge the cost to its cause (e.g., the customer or product deriving the related benefit). If no one gets any benefit, we should dispose of the capacity or redeploy it into value-adding projects.
A p p e n d i x
A C C o u n t I n g F o r t H E C o S t o F
u n u S E D C A pA C I t y
Excess Capacity and the Downward Demand Spiral
Identifying unused capacity is particularly important when firms engage in cost-based pricing. Firms experience unused capacity in periods with low demand. Allocation rates based on actual capacity increase in such periods because fixed costs do not decrease proportionally with activity volume. Naturally, the reported costs of all products increase. If the firm responds to the higher reported cost by raising prices, it risks setting off a dangerous trend. Higher prices would lower demand even more, raising allocation rates yet again. Use of practical capacity to calculate allocation rates guards against this phenomenon by isolating the cost of unused capacity rather than including it in the allocation rate and, in turn, reported product costs.
To download more slides, ebooks, solution manual, and test bank, visit http://downloadslide.blogspot.com
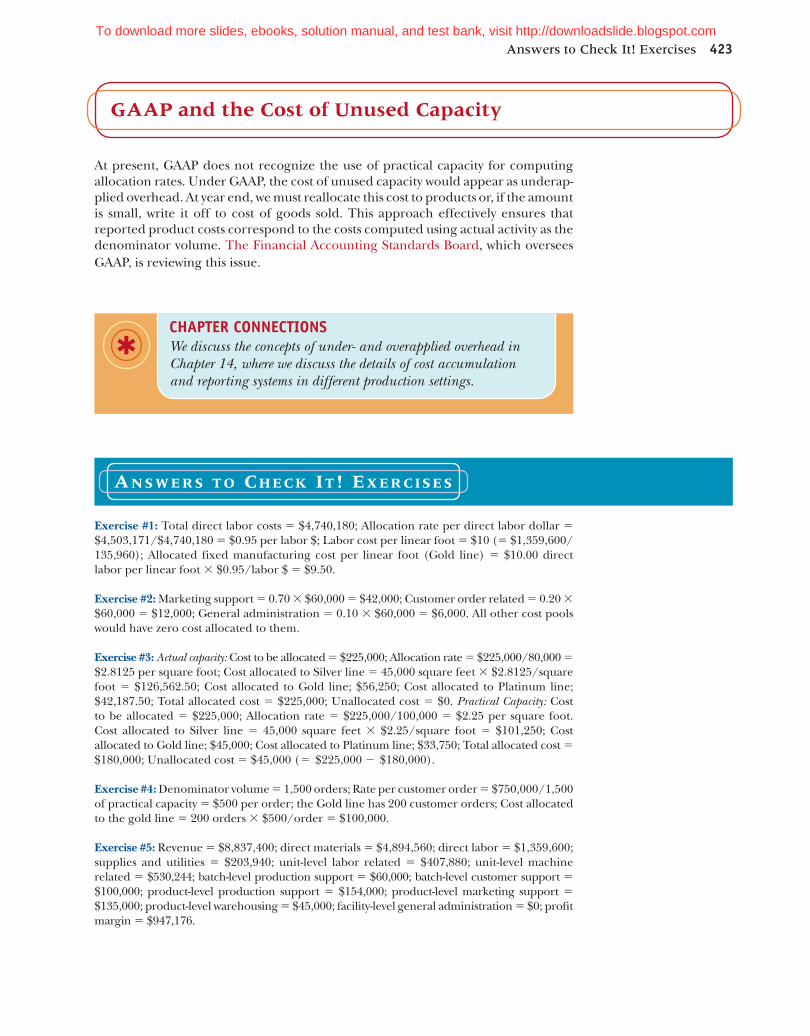
At present, GAAP does not recognize the use of practical capacity for computing allocation rates. Under GAAP, the cost of unused capacity would appear as underap-plied overhead. At year end, we must reallocate this cost to products or, if the amount is small, write it off to cost of goods sold. This approach effectively ensures that reported product costs correspond to the costs computed using actual activity as the denominator volume. The Financial Accounting Standards Board, which oversees GAAP, is reviewing this issue.
gAAp and the Cost of unused Capacity
Exercise #1: Total direct labor costs 5 $4,740,180; Allocation rate per direct labor dollar 5 $4,503,171/$4,740,180 5 $0.95 per labor $; Labor cost per linear foot 5 $10 (5 $1,359,600/ 135,960); Allocated fixed manufacturing cost per linear foot (Gold line) 5 $10.00 direct labor per linear foot 3 $0.95/labor $ 5 $9.50.
Exercise #2: Marketing support 5 0.70 3 $60,000 5 $42,000; Customer order related 5 0.20 3 $60,000 5 $12,000; General administration 5 0.10 3 $60,000 5 $6,000. All other cost pools would have zero cost allocated to them.
Exercise #3: Actual capacity: Cost to be allocated 5 $225,000; Allocation rate 5 $225,000/80,000 5 $2.8125 per square foot; Cost allocated to Silver line 5 45,000 square feet 3 $2.8125/square foot 5 $126,562.50; Cost allocated to Gold line; $56,250; Cost allocated to Platinum line; $42,187.50; Total allocated cost 5 $225,000; Unallocated cost 5 $0. Practical Capacity: Cost to be allocated 5 $225,000; Allocation rate 5 $225,000/100,000 5 $2.25 per square foot. Cost allocated to Silver line 5 45,000 square feet 3 $2.25/square foot 5 $101,250; Cost allocated to Gold line; $45,000; Cost allocated to Platinum line; $33,750; Total allocated cost 5 $180,000; Unallocated cost 5 $45,000 (5 $225,000 2 $180,000).
Exercise #4: Denominator volume 5 1,500 orders; Rate per customer order 5 $750,000/1,500 of practical capacity 5 $500 per order; the Gold line has 200 customer orders; Cost allocated to the gold line 5 200 orders 3 $500/order 5 $100,000.
Exercise #5: Revenue 5 $8,837,400; direct materials 5 $4,894,560; direct labor 5 $1,359,600; supplies and utilities 5 $203,940; unit-level labor related 5 $407,880; unit-level machine related 5 $530,244; batch-level production support 5 $60,000; batch-level customer support 5 $100,000; product-level production support 5 $154,000; product-level marketing support 5 $135,000; product-level warehousing 5 $45,000; facility-level general administration 5 $0; profit margin 5 $947,176.
answers to CHeCk it! exerCises
Answers to Check It! Exercises 423
CHAPTEr CONNECTIONsWe discuss the concepts of under- and overapplied overhead in Chapter 14, where we discuss the details of cost accumulation and reporting systems in different production settings.
To download more slides, ebooks, solution manual, and test bank, visit http://downloadslide.blogspot.com

424 Chapter 10 • Activity-Based Costing and Management
Self-Study Problem #1: Profit Margins and Activity-Based CostingRitchie Simmons sells two versions, Deluxe and Premium, of his firm’s only product, the GoGoJuicer. The GoGoJuicer uses patented technology to extract the last drop of juice from most fruits. The Premium version can handle larger fruit and has more options relative to the Deluxe version. The following table provides the financial results for the most recent year of operations. Labor costs $16 per hour, and each product requires one hour of labor. Ritchie currently allocates all fixed manufacturing costs to products, using labor hours as the alloca-tion basis. He also allocates all fixed selling and administrative expenses, using revenue as the allocation basis.
a. Although the unit profit margin of the Deluxe Juicer is rather low, Ritchie believes that it is important to keep this model in the product mix. However, Ritchie believes that he can tailor his promotion and sales strategies to improve the sales mix to a 6:4 ratio from the current 9:1 ratio of Deluxe to Premium juicers, with total volume staying the same at 100,000 units. Using the current fixed manufacturing costs activity rate and the current fixed selling and administrative costs activity rate, compute Ritchie’s expected profit if sales change to 60,000 Deluxe Juicers and 40,000 Premium Juicers.The current fixed manufacturing costs activity rate 5 $3,800,000/100,000 labor hours 5 $38 per labor hour. (Because each product requires 1 hour of labor, the total labor hours equals the total number of units produced). The current fixed selling and administrative expenses activity rate 5 $287,500/$7,200,000 5 $0.03993 per $1 of revenue. Finally, we calculate the unit prices, materials, and labor costs by dividing revenue, materials costs, and labor costs by the number of units. For example, the materials cost per unit of a Premium juicer 5 $250,000/10,000 units 5 $25 per unit.The following table provides the income statement for the new product mix:
self-study problems
To download more slides, ebooks, solution manual, and test bank, visit http://downloadslide.blogspot.com
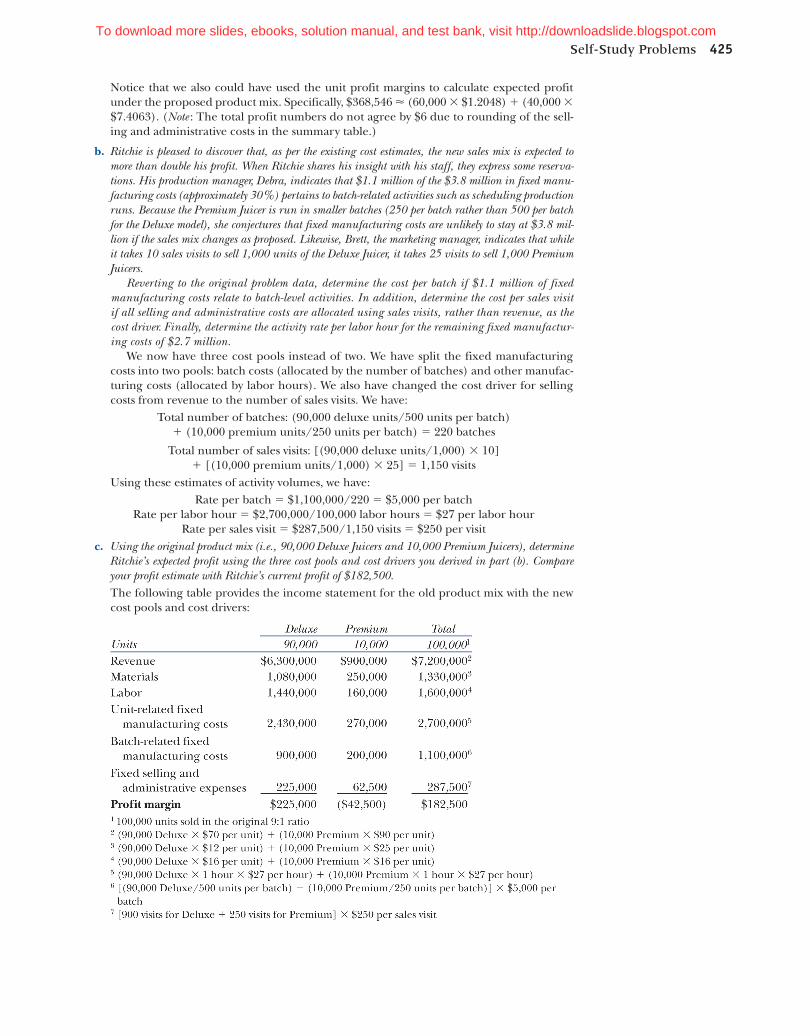
Notice that we also could have used the unit profit margins to calculate expected profit under the proposed product mix. Specifically, $368,546 (60,000 3 $1.2048) 1 (40,000 3 $7.4063). (Note : The total profit numbers do not agree by $6 due to rounding of the sell-ing and administrative costs in the summary table.)
b. Ritchie is pleased to discover that, as per the existing cost estimates, the new sales mix is expected to more than double his profit. When Ritchie shares his insight with his staff, they express some reserva-tions. His production manager, Debra, indicates that $1.1 million of the $3.8 million in fixed manu-facturing costs (approximately 30%) pertains to batch-related activities such as scheduling production runs. Because the Premium Juicer is run in smaller batches (250 per batch rather than 500 per batch for the Deluxe model), she conjectures that fixed manufacturing costs are unlikely to stay at $3.8 mil-lion if the sales mix changes as proposed. Likewise, Brett, the marketing manager, indicates that while it takes 10 sales visits to sell 1,000 units of the Deluxe Juicer, it takes 25 visits to sell 1,000 Premium Juicers.
Reverting to the original problem data, determine the cost per batch if $1.1 million of fixed manufacturing costs relate to batch-level activities. In addition, determine the cost per sales visit if all selling and administrative costs are allocated using sales visits, rather than revenue, as the cost driver. Finally, determine the activity rate per labor hour for the remaining fixed manufactur-ing costs of $2.7 million.
We now have three cost pools instead of two. We have split the fixed manufacturing costs into two pools: batch costs (allocated by the number of batches) and other manufac-turing costs (allocated by labor hours). We also have changed the cost driver for selling costs from revenue to the number of sales visits. We have:
Total number of batches: (90,000 deluxe units/500 units per batch)1 (10,000 premium units/250 units per batch) 5 220 batches
Total number of sales visits: [(90,000 deluxe units/1,000) 3 10]1 [(10,000 premium units/1,000) 3 25] 5 1,150 visits
Using these estimates of activity volumes, we have:Rate per batch 5 $1,100,000/220 5 $5,000 per batch
Rate per labor hour 5 $2,700,000/100,000 labor hours 5 $27 per labor hourRate per sales visit 5 $287,500/1,150 visits 5 $250 per visit
c. Using the original product mix (i.e., 90,000 Deluxe Juicers and 10,000 Premium Juicers), determine Ritchie’s expected profit using the three cost pools and cost drivers you derived in part (b). Compare your profit estimate with Ritchie’s current profit of $182,500.The following table provides the income statement for the old product mix with the new cost pools and cost drivers:
Self-Study Problems 425To download more slides, ebooks, solution manual, and test bank, visit http://downloadslide.blogspot.com
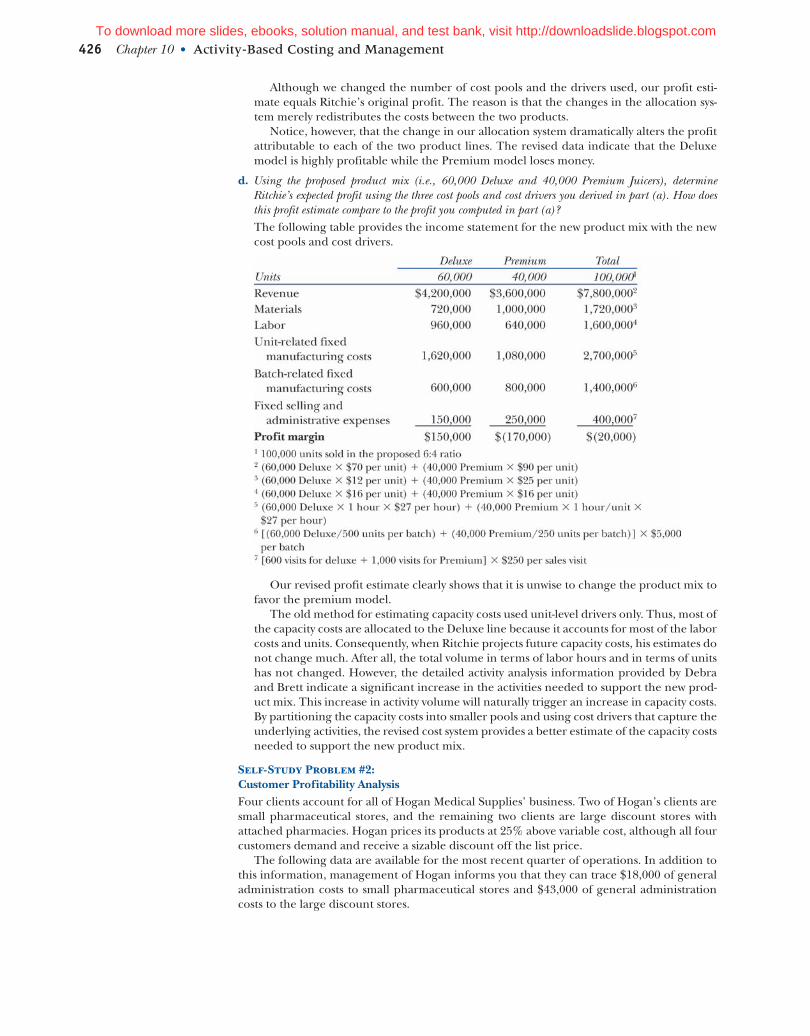
426 Chapter 10 • Activity-Based Costing and Management
Although we changed the number of cost pools and the drivers used, our profit esti-mate equals Ritchie’s original profit. The reason is that the changes in the allocation sys-tem merely redistributes the costs between the two products.
Notice, however, that the change in our allocation system dramatically alters the profit attributable to each of the two product lines. The revised data indicate that the Deluxe model is highly profitable while the Premium model loses money.
d. Using the proposed product mix (i.e., 60,000 Deluxe and 40,000 Premium Juicers), determine Ritchie’s expected profit using the three cost pools and cost drivers you derived in part (a). How does this profit estimate compare to the profit you computed in part (a)?The following table provides the income statement for the new product mix with the new cost pools and cost drivers.
Our revised profit estimate clearly shows that it is unwise to change the product mix to favor the premium model.
The old method for estimating capacity costs used unit-level drivers only. Thus, most of the capacity costs are allocated to the Deluxe line because it accounts for most of the labor costs and units. Consequently, when Ritchie projects future capacity costs, his estimates do not change much. After all, the total volume in terms of labor hours and in terms of units has not changed. However, the detailed activity analysis information provided by Debra and Brett indicate a significant increase in the activities needed to support the new prod-uct mix. This increase in activity volume will naturally trigger an increase in capacity costs. By partitioning the capacity costs into smaller pools and using cost drivers that capture the underlying activities, the revised cost system provides a better estimate of the capacity costs needed to support the new product mix.
Self-Study Problem #2: Customer Profitability AnalysisFour clients account for all of Hogan Medical Supplies’ business. Two of Hogan’s clients are small pharmaceutical stores, and the remaining two clients are large discount stores with attached pharmacies. Hogan prices its products at 25% above variable cost, although all four customers demand and receive a sizable discount off the list price.
The following data are available for the most recent quarter of operations. In addition to this information, management of Hogan informs you that they can trace $18,000 of general administration costs to small pharmaceutical stores and $43,000 of general administration costs to the large discount stores.
To download more slides, ebooks, solution manual, and test bank, visit http://downloadslide.blogspot.com

a. Prepare a customer-profitability report that shows the profit from each customer and each customer channel, stand-alone pharmaceuticals, and large pharmaceuticals attached to discount stores.The table below provides the required information for each of Hogan’s customers as well as each customer channel, stand-alone pharmaceuticals, and large pharmaceuticals attached to discount stores.
b. Based on your analysis, recommend how Hogan could improve its profit.Hogan is barely breaking even with small pharmaceuticals. Dolan is much more profitable than Ryan because Ryan receives a higher discount. Moreover, although sales volumes are similar, Ryan places more orders. These costs outweigh the favorable aspect of Ryan not demanding expedited deliveries. Hogan could coordinate with Ryan to increase order size and also try to negotiate a smaller discount. Likewise, it might try to work with Dolan to reduce the number of expedited deliveries even if the action increases order frequency.
Hogan makes substantial profit from the large pharmaceuticals. BiLo is more than twice as profitable as MegaMart with half the sales volume. The primary reason is the aggres-sive pricing for MegaMart. BiLo also is a very desirable customer as its orders are for large quantities and the company requires little extra attention. Hogan could possibly increase profit by cultivating BiLo further. Hogan may have no choice but to deal with MegaMart as a less profitable customer, because MegaMart accounts more than 50% of Hogan’s sales.
Self-Study Problems 427To download more slides, ebooks, solution manual, and test bank, visit http://downloadslide.blogspot.com
428 Chapter 10 • Activity-Based Costing and Management
Activity The basic element of any business process.Activity-based costing (ABC) An allocation methodology used
to estimate the controllable cost of capacity resources.Activity-based management (ABM) Using information from
ABC systems to improve profitability by managing prod-ucts, customers, and resources.
Batch-level activities Activities that pertain to a group of units.
Business process Converts a set of organizational inputs into a measurable output.
Cross-subsidization Some cost allocation systems allocate systematically lower amounts to some products and higher amounts to allocate other products. In such instances, products receiving higher allocations are said to cross-subsidize products receiving lower allocations.
Customer planning The set of decisions to assess the prof-itability of individual customers and customer segments, including the actions taken to improve their profitability.
Facility-level activities Activities that are required to sus-tain the business.
Practical capacity A realistic estimate of the maximum possible activity level.
Product-/customer-level activities Activities that relate to a specific product or a specific customer.
Product planning The set of decisions about which prod-ucts to offer and their prices.
Profit margin Contribution margin less the controllable cost of capacity resources.
Resource planning Decisions that pertain to improv-ing the efficiency and effectiveness of organizational processes.
Unit-level activities Activities that are proportional to pro-duction volume.
Whale curve A curve that plots customer profitability, after ranking customers in order of their profitability. Has the appearance of a “whale.”
10.16 LO1. Some might argue that the costs of developing a product are sunk at the time the product goes into production. Thus, these costs are not controllable for any decisions. Should we allocate these costs to products to determine their profit margin?
10.17 LO1. Suppose we are choosing between two driv-ers to allocate the costs in the “perform setup” cost pool: the number of setups or the number of setup hours. When will the choice not matter
(i.e., will result in the same amount costs being allocated to the various products from this pool?) What factors do we need to consider when making this choice?
10.18 LO2. What are some of the problems that we are likely to encounter in measuring practical capacity? For con-creteness, consider measuring the practical capacity of a purchasing department that has five persons, and whose primary activity is issuing purchase orders.
glossary
10.1 LO1. What is the definition of unit profit margin?10.2 LO1. What are the four key steps in designing a
product costing system?10.3 LO1. What is a business process? How are activities
and business processes related?10.4 LO1. What is the basis that ABC systems use to form
cost pools?10.5 LO1. What is the primary criterion that we should
use when choosing a driver to allocate costs from an activity pool to products?
10.6 LO2. What is practical capacity? How does it differ from budgeted capacity? How does it differ from actual capacity?
10.7 LO2. Why does allocating costs using an ABC system not change the total reported income for the orga-nization as a whole?
10.8 LO2. What is cross-subsidization?10.9 LO2. List three ways in which a company can
improve profitability using ABC data. 10.10 LO3. What are the two key customer-planning deci-
sions that companies face? 10.11 LO3. What are the differences between product-level
profit analysis and customer-level profit analysis? 10.12 LO3. List five characteristics of customers that are
“high cost-to-serve” customers. List five characteristics of customers that are “low cost-to-serve” customers.
10.13 LO3. What is a whale curve? 10.14 LO3. What is the key objective of resource-planning
decisions? 10.15 LO3. What is a non-value-adding activity?
review Questions
disCussion Questions
To download more slides, ebooks, solution manual, and test bank, visit http://downloadslide.blogspot.com

10.19 LO2. Surveys show that over 40% of all firms do not employ ABC systems. What might be the underlying reasons for this finding?
10.20 LO2. Suppose your firm is currently employing a traditional volume-based product costing system. Further, suppose that you begin to improve this sys-tem by incrementally modifying one cost pool at a time by refining its drivers and so on. Would such actions always increase the accuracy of reported product costs? Justify your response.
10.21 LO2 (Advanced). Organizations have employed ABC systems with multiple objectives corresponding to the four reasons for allocating costs (see Chapter 9). Consider an ABC system whose primary objective is to facilitate decision making versus another whose objective is to induce desired behavior. How, if at all, would the difference in objectives manifest itself in choices regarding the number of cost pools and activity drivers?
10.22 LO3. Is the activity “inspect incoming materials for requisite quality” a value-adding activity? Justify.
10.23 LO3. Consider the retail operations for a bank. For these operations, how should the bank define its customer? Should each individual be the customer? Alternatively, should each household be the unit of analysis?
10.24 LO3. Cell phone companies, credit card issuers, and cable companies are prominent examples of firms that spend large amounts to acquire customers. How do these firms justify these investments? How could we modify the traditional customer profitabil-ity report to assess a customer’s lifetime value?
10.25 LO3. Suppose a firm increased the efficiency of all of its processes. The firm needs fewer resources to produce the same volume and mix of goods and ser-vices. However, the firm does not cut spending on
the resources freed up as a result. What is the effect of these actions on the firm’s reported profit? What is the key additional step required to translate effi-ciency improvements into profit gains?
10.26 LO3. Describe a process that you undertake each day (e.g., pack for school in the morning). Further, describe how you could improve the process with virtually no investment of capital (e.g., pack the bag the prior night). Finally, describe how the change improves the process (e.g., avoids searching for items).
10.27 LO3. Iguana Insurance allows its customers to pay their premiums in full, in four quarterly payments, or as twelve monthly payments. Iguana adds a sur-charge of $3 per payment if the customers choose a mode other than annual payment. It offers a rebate of $1 per payment if the customers set up an auto-matic withdrawal plan with their bank. How might Iguana justify these surcharges and discounts?
10.28 LO3 (Advanced). Because of the way a firm is orga-nized, different managers (representing different regions or products) might negotiate with the same customer. Moreover, the customer’s profit profile may not be the same across regions and/or prod-ucts. The customer might even be a marginal or loss-making customer for some regions/product lines. Discuss the costs and benefits of alternate incen-tive schemes that a firm could employ to motivate its managers to consider a customer’s entire rela-tionship with the firm when negotiating with the customer.
10.29 Customer actions and resource planning, qualitative (LO3). Airlines have sought to reduce long lines by introducing self-service kiosks and on-line services for passenger check in. What might be the reasoning that underlies the introduction of such initiatives?
exerCises
10.30 Computing cost of activity (LO2). The University Credit Union (UCU) has engaged your services to determine the cost of its various activities. The following data are avail-able for a representative branch.
The average branch processes 600,000 deposits and 1,250,000 check transactions each year.Required:Compute the cost per deposit and the cost to process a check.
10.31 Volume based and ABC allocations, manufacturing (LO2). The Acme Corporation manufactures a number of different kinds of sprinklers in three broad product lines. The following table provides relevant information about the product lines.
Exercises 429To download more slides, ebooks, solution manual, and test bank, visit http://downloadslide.blogspot.com
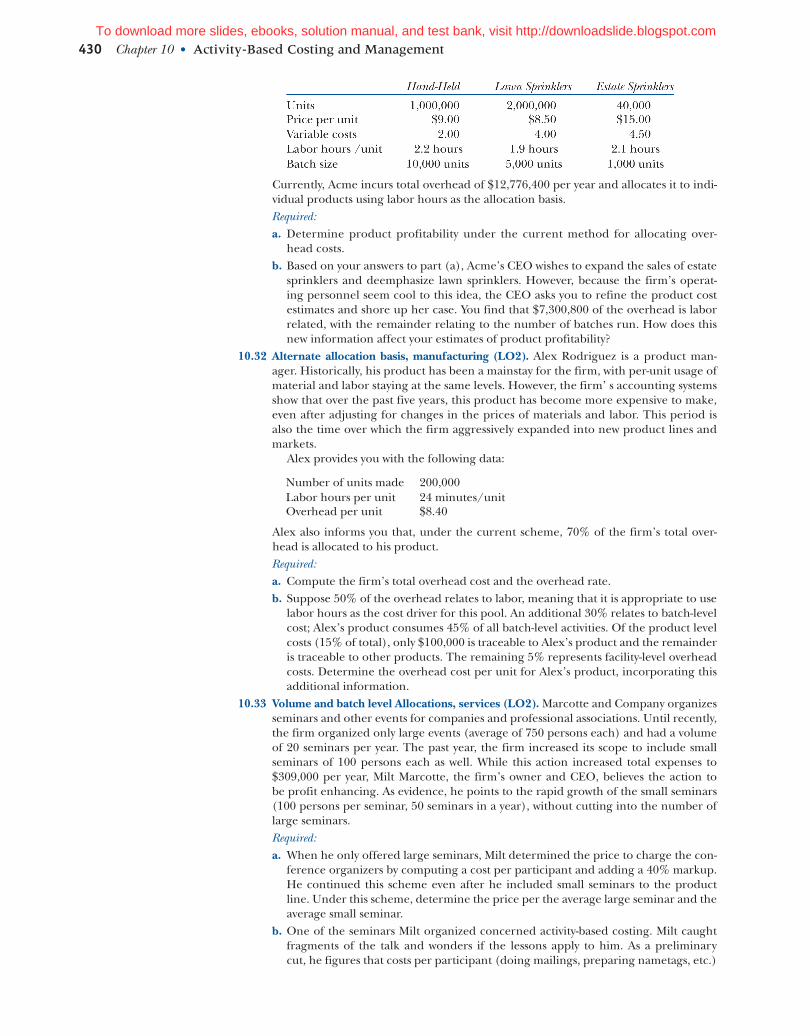
430 Chapter 10 • Activity-Based Costing and Management
Currently, Acme incurs total overhead of $12,776,400 per year and allocates it to indi-vidual products using labor hours as the allocation basis.Required:a. Determine product profitability under the current method for allocating over-
head costs.b. Based on your answers to part (a), Acme’s CEO wishes to expand the sales of estate
sprinklers and deemphasize lawn sprinklers. However, because the firm’s operat-ing personnel seem cool to this idea, the CEO asks you to refine the product cost estimates and shore up her case. You find that $7,300,800 of the overhead is labor related, with the remainder relating to the number of batches run. How does this new information affect your estimates of product profitability?
10.32 Alternate allocation basis, manufacturing (LO2). Alex Rodriguez is a product man-ager. Historically, his product has been a mainstay for the firm, with per-unit usage of material and labor staying at the same levels. However, the firm’ s accounting systems show that over the past five years, this product has become more expensive to make, even after adjusting for changes in the prices of materials and labor. This period is also the time over which the firm aggressively expanded into new product lines and markets.
Alex provides you with the following data:
Number of units made 200,000Labor hours per unit 24 minutes/unitOverhead per unit $8.40
Alex also informs you that, under the current scheme, 70% of the firm’s total over-head is allocated to his product.Required:a. Compute the firm’s total overhead cost and the overhead rate.b. Suppose 50% of the overhead relates to labor, meaning that it is appropriate to use
labor hours as the cost driver for this pool. An additional 30% relates to batch-level cost; Alex’s product consumes 45% of all batch-level activities. Of the product level costs (15% of total), only $100,000 is traceable to Alex’s product and the remainder is traceable to other products. The remaining 5% represents facility-level overhead costs. Determine the overhead cost per unit for Alex’s product, incorporating this additional information.
10.33 Volume and batch level Allocations, services (LO2). Marcotte and Company organizes seminars and other events for companies and professional associations. Until recently, the firm organized only large events (average of 750 persons each) and had a volume of 20 seminars per year. The past year, the firm increased its scope to include small seminars of 100 persons each as well. While this action increased total expenses to $309,000 per year, Milt Marcotte, the firm’s owner and CEO, believes the action to be profit enhancing. As evidence, he points to the rapid growth of the small seminars (100 persons per seminar, 50 seminars in a year), without cutting into the number of large seminars.Required:a. When he only offered large seminars, Milt determined the price to charge the con-
ference organizers by computing a cost per participant and adding a 40% markup. He continued this scheme even after he included small seminars to the product line. Under this scheme, determine the price per the average large seminar and the average small seminar.
b. One of the seminars Milt organized concerned activity-based costing. Milt caught fragments of the talk and wonders if the lessons apply to him. As a preliminary cut, he figures that costs per participant (doing mailings, preparing nametags, etc.)
To download more slides, ebooks, solution manual, and test bank, visit http://downloadslide.blogspot.com

cost $225,000 per year. The remainder of $84,000 per year relates to coordinating with the hotel and caterers, organizing AV equipment, hanging banners, and so on. Using activity-based costing, determine the price per large seminar and the average small seminar.
10.34 Product planning (LO2). The following table provides the ABC report for product KJ-29.
The firm currently sells 6,000 units of KJ-29 for $16 per unit.Required:The firm is considering lowering the price of KJ-29 to $15.25 per unit. Because this action will increase sales by 25%, the firm is also considering increasing the batch size to 750 units. Compute expected profit if the firm implements both actions.
10.35 Activity rate, stages 1 and 2 (LO2). Yousef Ibrahim manages a plastics plant. He has provided you with the following data.
Tools, jigs and fixtures 650,000 Traceable to individual productsMachine operators 240,000 Salaried employeesOils, coolants and lubricants 67,500 Required to operate machinesFactory power 125,000 30% is used for general heating
and lightingMachine depreciation $1,200,000 Although the average machine
lasts many years, Yousef spends considerable amounts to replace worn-out machines each year.
Factory lease 144,000 60% occupied by various machines. The plant is in year 3 of a 10-year lease.
Total costs $2,436,500
Yousef believes that the factory has a practical capacity of 25,000 machine hours. He wants to determine the full cost of a machine hour to use in determining his product mix over the next two to three years.Required:Forming a cost pool that contains all machine related costs in the above accounts, compute the overhead rate per machine hour.
10.36 Volume and ABC allocations (LO2). A world-famous photographer of wild animals and nature, Sonja Rego sells framed prints of select photographs over the Internet. Regardless of the picture bought, she offers buyers a choice in framing: a plain black frame or a fancy frame with a certificate of authenticity.
Based on initial cost estimates, Sonja believes the Deluxe frames to be more profit-able than the Standard frames. However, her profits have slipped every quarter even
Exercises 431To download more slides, ebooks, solution manual, and test bank, visit http://downloadslide.blogspot.com

432 Chapter 10 • Activity-Based Costing and Management
as the proportion of Deluxe frames sold has increased. She has asked for your help in figuring out what she might be doing wrong. She provides the following data:
She further informs us that her total overhead is $390,000 per year.Required:a. Calculate the profit per unit for the Deluxe and Standard prints, if Sonja allocates
overhead using labor hours as the allocation basis.b. You find that only $156,000 of Sonja’s cost relates directly to labor. Of the remain-
der, $136,500 corresponds to batch-level activities and $58,500 to product-level activities. She runs separate batches (50 prints for Deluxe, 250 for Standard) for Deluxe and Standard pictures. The product-level costs, she believes, are equally attributable to both product lines. The remaining facility-level costs relate to the rent on her studio, hosting the Web site, and other such business-sustaining actions. Prepare an income statement for Sonja, clearly highlighting the allocation from each cost pool.
c. Based on the answers to parts (a) and (b), what insights could you offer to Sonja?10.37 Product interdependency in product planning (LO3). The QwikFill Corporation
recently hired David Oxley to figure out ways to improve profit. David notes that, like virtually all gas stations, QwikFill’s stations also had an air pump that customers could use to fill air in their tires. As per David’s detailed cost report, an air pump’s fully allocated cost is around $1,200 per year. Variable costs are negligible.
David offers two solutions. One is to eliminate the pump and save $1,200 each year. The second is to charge a quarter (25 cents) for each minute of operation. Currently, about 20 customers use the pump each day in any given gas station. The average cus-tomer takes about 3 minutes to check and inflate all tires.Required:a. At the current volume of operations, identify the increase in profit if David’s first
proposal were to be implemented at all 243 of QwikFill’s stations. What is the profit with the second proposal?
b. Do you recommend following either of David’s proposals? Why or why not?10.38 Resource planning (LO3). Carolyn Evans manages the lunchroom at West High, a
large (approximately 1,600 students) school in Scottsdale, Arizona. The current cash payment system requires four cashiers (paid $8 per hour), employed for about 6 hours a day. The lunchroom operates approximately 250 days a year.
Carolyn is considering an electronic system, where a student could just swipe an ID card for payment. This system would cost $15,000 to set up and $2,000 per year to operate. Carolyn believes that she could manage with two cashiers if she were to imple-ment the system.Required:a. Ignoring the time value of money, estimate the five-year cost savings from imple-
menting the system.b. What other qualitative costs and benefits should Carolyn consider in her decision?
Comment on how such process reconfigurations help improve the effectiveness of organizational resources.
10.39 Activity cost pools, financial services, qualitative (LO2). A checking account is a primary product for many banks. The typical account permits teller and ATM trans-actions, in addition to allowing the owner to write checks. Furthermore, while banks still mail paper statements each month (increasingly only upon request), most banks encourage account holders to check balances and perform other transactions electronically.Required:a. Prepare a list of activities that might help determine the cost of a checking account
for the average customer. Classify each activity as a unit-level, batch- or process-level activity.
To download more slides, ebooks, solution manual, and test bank, visit http://downloadslide.blogspot.com
b. How might a bank use the information from the activity map to tailor multiple versions of its checking accounts?
c. Should the bank allocate the cost of advertising its checking accounts (a product-level activity) to individual accounts, when assessing its profitability?
10.40 Symptoms of failing systems. Qualitative (LO2, advanced). David Chang, a student, mows lawns part-time. He determined that the average lawn mowing charge in his neighborhood is $30 per lawn, and he set his price to match. Soon, he had enough demand to fill his self-imposed quota of 12 lawns. As and when existing customers decided to mow their own lawns or hired another lawn mowing service, David would seek new engagements. Over time, David notices that he is spending more and more time mowing lawns. Whereas he was devoting 15 hours a week when he started, he finds himself putting in more than 20 hours during recent times. This trend puzzles him as he is still mowing only 12 lawns per week and the average rate in the neighborhood is still $30 per lawn.Required:Help David understand the root causes for the increase in the time required to mow 12 lawns.
10.41 Product pricing, qualitative (LO3). United Parcel Services (UPS) is a multibillion dol-lar corporation that offers numerous options for shipping documents and parcels. Until the mid-1980s, UPS priced deliveries based solely on weight and on distance. During this era, UPS used trucks to move most goods, and it focused on delivering small parcels to businesses. However, after deregulation of interstate freight and the emergence of competition such as FedEx, UPS’s pricing for the same service now con-siders many factors such as the time of pickup/delivery, place of pickup/delivery, size of package, and customer ID in addition to weight and distance.Required:a. Why might these factors be relevant for pricing parcel delivery in this now intensely
competitive business?b. How might ABC help UPS with its attempt to discern the costs of various types of
services and to fine-tune its pricing strategy?
problems
10.42 Volume based and ABC allocations, distribution (LO2). Jim Vermeer is a flower whole-saler. Jim prices his product (as is the industry custom) at 12 cents over the price he pays to the exporter. Current volume is 50,000 stems per day. Jim is happy with this state of affairs as it costs him only 10 cents per stem in overhead charges (i.e., his over-head cost is $150,000 per month or $5,000 per day).
Jim’s daughter recently joined the business. Exploiting her artistic talents, JoAnne expanded the product line to include bouquets. The average bouquet contains 24 stems and yields a contribution of 15 cents per stem.
Jim is delighted at this chance to increase his profit per stem. Indeed, he is consid-ering expanding the bouquet business from 10 to 30% of his overall volume. However, his enthusiasm is somewhat tempered because his profit has dropped to only $750 a day, even though total daily volume is steady at 50,000 stems. He knows that there is more work in assembling a bouquet but has no reason to doubt the cost system that has worked well for many years.Required:a. Compute Jim’s overhead using the new product mix, profit, and contribution
margins.b. How could expanding into a product line with higher contribution margin erode
the firm’s profit margin?c. What features of the new business line might account for the surge in overhead?
10.43 ABC allocations, service (LO2) .Vanessa Xu is the general manager for “The Grand” Hotel in Hong Kong. Vanessa is pondering about how to respond to a request from a major cli-ent regarding long-stay rates. A long stay would be a single visit of a week or more.
Problems 433To download more slides, ebooks, solution manual, and test bank, visit http://downloadslide.blogspot.com
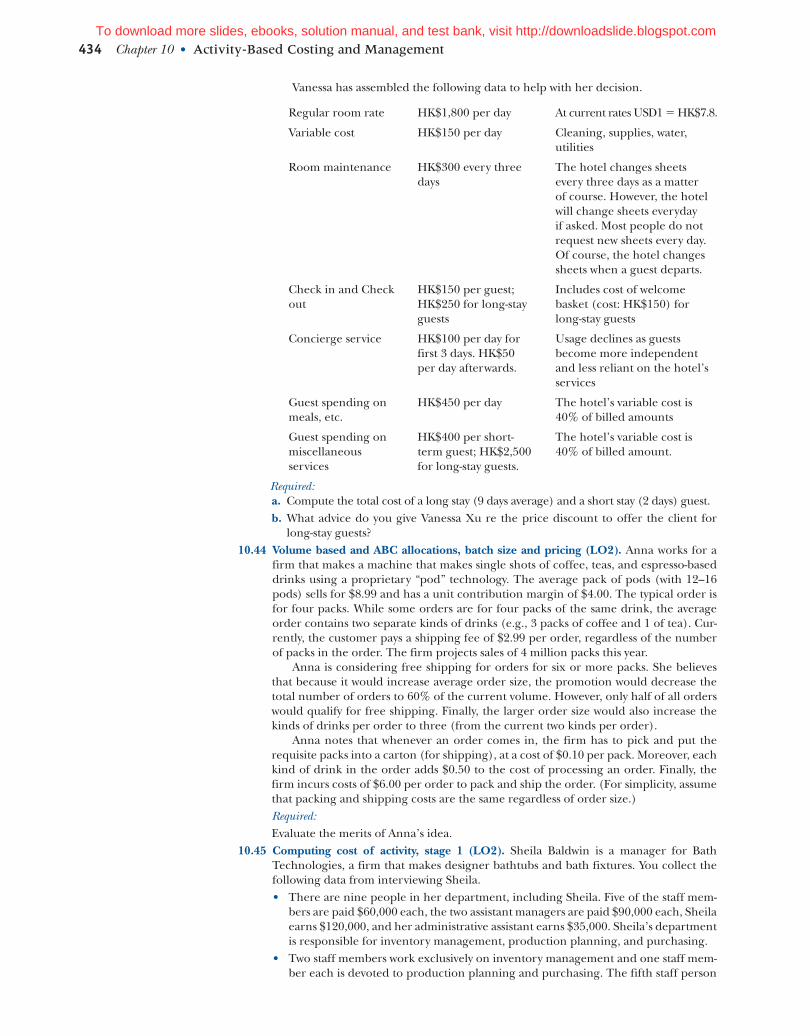
434 Chapter 10 • Activity-Based Costing and Management
Vanessa has assembled the following data to help with her decision.
Regular room rate HK$1,800 per day At current rates USD1 5 HK$7.8.
Variable cost HK$150 per day Cleaning, supplies, water, utilities
Room maintenance HK$300 every three days
The hotel changes sheets every three days as a matter of course. However, the hotel will change sheets everyday if asked. Most people do not request new sheets every day. Of course, the hotel changes sheets when a guest departs.
Check in and Check out
HK$150 per guest; HK$250 for long-stay guests
Includes cost of welcome basket (cost: HK$150) for long-stay guests
Concierge service HK$100 per day for first 3 days. HK$50 per day afterwards.
Usage declines as guests become more independent and less reliant on the hotel’s services
Guest spending on meals, etc.
HK$450 per day The hotel’s variable cost is 40% of billed amounts
Guest spending on miscellaneous services
HK$400 per short- term guest; HK$2,500 for long-stay guests.
The hotel’s variable cost is 40% of billed amount.
Required:a. Compute the total cost of a long stay (9 days average) and a short stay (2 days) guest.b. What advice do you give Vanessa Xu re the price discount to offer the client for
long-stay guests?10.44 Volume based and ABC allocations, batch size and pricing (LO2). Anna works for a
firm that makes a machine that makes single shots of coffee, teas, and espresso-based drinks using a proprietary “pod” technology. The average pack of pods (with 12–16 pods) sells for $8.99 and has a unit contribution margin of $4.00. The typical order is for four packs. While some orders are for four packs of the same drink, the average order contains two separate kinds of drinks (e.g., 3 packs of coffee and 1 of tea). Cur-rently, the customer pays a shipping fee of $2.99 per order, regardless of the number of packs in the order. The firm projects sales of 4 million packs this year.
Anna is considering free shipping for orders for six or more packs. She believes that because it would increase average order size, the promotion would decrease the total number of orders to 60% of the current volume. However, only half of all orders would qualify for free shipping. Finally, the larger order size would also increase the kinds of drinks per order to three (from the current two kinds per order).
Anna notes that whenever an order comes in, the firm has to pick and put the requisite packs into a carton (for shipping), at a cost of $0.10 per pack. Moreover, each kind of drink in the order adds $0.50 to the cost of processing an order. Finally, the firm incurs costs of $6.00 per order to pack and ship the order. (For simplicity, assume that packing and shipping costs are the same regardless of order size.)Required:Evaluate the merits of Anna’s idea.
10.45 Computing cost of activity, stage 1 (LO2). Sheila Baldwin is a manager for Bath Technologies, a firm that makes designer bathtubs and bath fixtures. You collect the following data from interviewing Sheila.• There are nine people in her department, including Sheila. Five of the staff mem-
bers are paid $60,000 each, the two assistant managers are paid $90,000 each, Sheila earns $120,000, and her administrative assistant earns $35,000. Sheila’s department is responsible for inventory management, production planning, and purchasing.
• Two staff members work exclusively on inventory management and one staff mem-ber each is devoted to production planning and purchasing. The fifth staff person
To download more slides, ebooks, solution manual, and test bank, visit http://downloadslide.blogspot.com

splits her time equally on inventory management, production planning, and purchasing activities. One assistant manager is responsible for production plan-ning, and the other for purchasing.
• Sheila spends about 30% of her time overseeing the managers and staff. She also spends 10% of her time attending meetings with senior managers and coor-dinating with other departments. She spends the remaining time on inventory management.
• The administrative assistant spends 75% of his time working for Sheila, and the remainder for the two assistant managers.
• Accounting records indicate that Sheila’s department spent $75,000 last year on supplies, travel, and other items. Accounting tells you that it is difficult to break out the expense by person as it would require some manual sorting of travel records and such. Sheila believes that each activity consumes supplies equally.
Required:Allocate the cost of Sheila’s department among the activities performed.
10.46 Computing activity cost, stages 1 and 2 (LO2). Lim Chee Wah is conducting a study of order processing costs for his company, a wholesaler of Chinese handicrafts. He has identified that every new customer order triggers the following actions.• Sales representatives generate customer orders and enter them into the system.
The firm estimates that each of its six salespersons earns $65,000 annually. Total order volume in a typical year is 5,000 orders. Sales representatives spend 80% of their time in these activities.
• The shipping department assembles the various products contained in the order, and then packs and ships the order. The shipping department employs two people full time and occupies 12,000 square feet of warehouse space. These two persons are paid $40,000 each; warehouse rental and upkeep is $48,000 for the year. The employees believe that 70% of their time is devoted to assembling, packing, and shipping an order. They estimate the time needed to enter the order into the sys-tem and such at 20%. These employees are also responsible for the general upkeep of the warehouse (10% of time).
• The Accounting Department issues an invoice, once per month, for each customer who has placed an order or has an outstanding balance. This invoice lists all of the orders placed that month. Most customers place multiple orders each month. The accounting manager estimates her department’s budget at $140,000 and believes that invoicing and collections occupy 30% of her department’s time. She believes that 40% of her department’s effort is spent on coordinating purchases, 10% is spent on payroll, and 20% on general accounting and special projects.
Required:Collecting all costs related to order processing in one pool and using expected activity levels as the denominator volume, compute the cost to process a customer order. Be sure to justify your choice if you exclude any of the costs listed above from the order-processing cost pool.
10.47 Customer planning (LO3). Aqua Distribution buys bottled water at $12 per case and sells it to retail clients at $14.40 per case. Data pertaining to four customers are as follows:
The firm estimates the following rates:
Number of orders $100 per order (number of cases in a order varies)Customer visits $80 per visitDelivery $2 per delivery mile traveledProduct handling $0.50 per case soldExpedited deliveries $300 per incident
Problems 435To download more slides, ebooks, solution manual, and test bank, visit http://downloadslide.blogspot.com
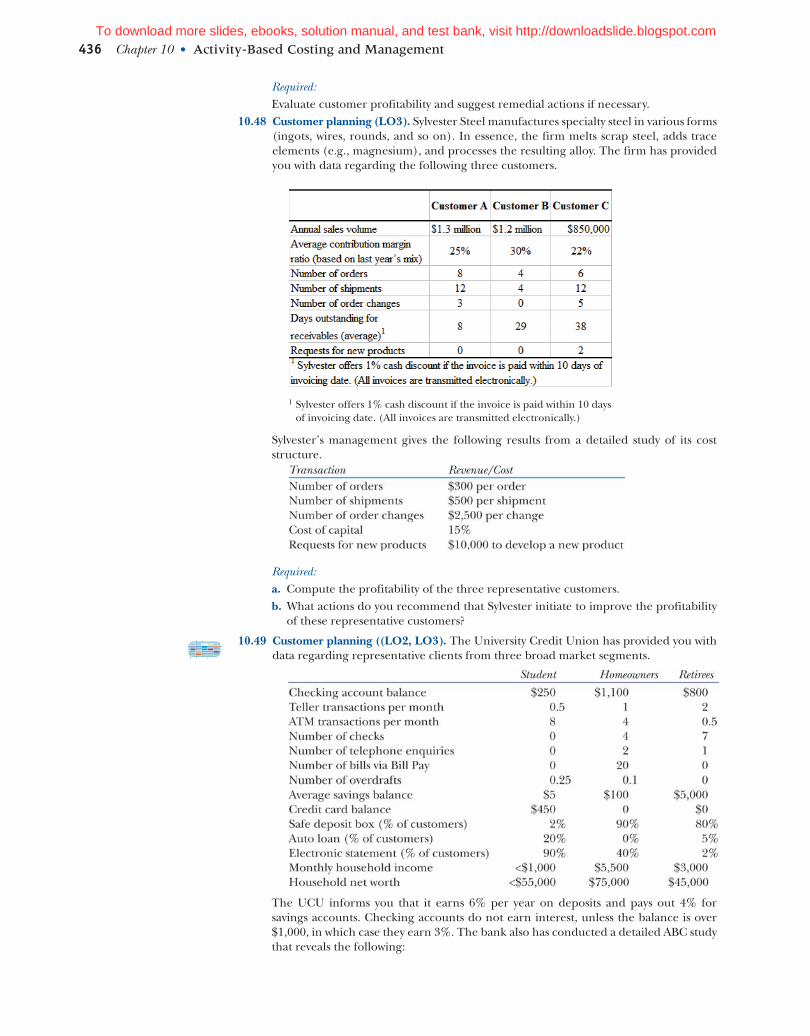
436 Chapter 10 • Activity-Based Costing and Management
Required:Evaluate customer profitability and suggest remedial actions if necessary.
10.48 Customer planning (LO3). Sylvester Steel manufactures specialty steel in various forms (ingots, wires, rounds, and so on). In essence, the firm melts scrap steel, adds trace elements (e.g., magnesium), and processes the resulting alloy. The firm has provided you with data regarding the following three customers.
1 Sylvester offers 1% cash discount if the invoice is paid within 10 days of invoicing date. (All invoices are transmitted electronically.)
Sylvester’s management gives the following results from a detailed study of its cost structure.
Required:a. Compute the profitability of the three representative customers.b. What actions do you recommend that Sylvester initiate to improve the profitability
of these representative customers?
10.49 Customer planning ((LO2, LO3). The University Credit Union has provided you with data regarding representative clients from three broad market segments.
The UCU informs you that it earns 6% per year on deposits and pays out 4% for savings accounts. Checking accounts do not earn interest, unless the balance is over $1,000, in which case they earn 3%. The bank also has conducted a detailed ABC study that reveals the following:
To download more slides, ebooks, solution manual, and test bank, visit http://downloadslide.blogspot.com

Required:a. Compute the monthly profitability of the three representative accounts.b. What actions do you recommend that UCU initiate to improve its profitability?
10.50 Process simplification (LO3). Moin Ahmed is a process engineer at Xyon Technolo-gies, which manufactures power supply systems. Moin notices that one of the steps involved requires 4.2 hours of setup per batch. The firm currently estimates setup costs to be $65 per hour.
Moin believes that the firm should acquire quick-change dies that could be preloaded when the current job is still running. These dies, specific to each product, cost $5,000 each and would last two years. With the dies, setup times would be reduced to 5 minutes per changeover. Moin argues that acquiring the dies makes sense from a strategic perspective. The dies would allow the company to reduce batch size from 750 units per batch to a much smaller number. This reduction would reduce inventories, thereby adding to the com-pany’s flexibility in matching demand with supply. He also thinks that the change would improve product quality because it might be easier to detect errors in a smaller batch.Required:a. Compute the cost savings from acquiring the quick-change die for a product with an
annual volume of 6,000 units and for a product with an annual volume of 7,500 units.b. Considering the qualitative benefits, what do you recommend?
10.51 Resource planning, classifying activities (LO3). Spring Distribution has expanded its operations into a number of different soft drinks. It has classified its warehousing activities into the following steps (the steps are scrambled and not in the sequence performed):
Required:a. Suppose Spring Fresh staffs its warehouse with a five-person team. Average annual sal-
ary is $32,000, based on 2,000 hours per person. Compute the cost of unused capacity.
Problems 437To download more slides, ebooks, solution manual, and test bank, visit http://downloadslide.blogspot.com
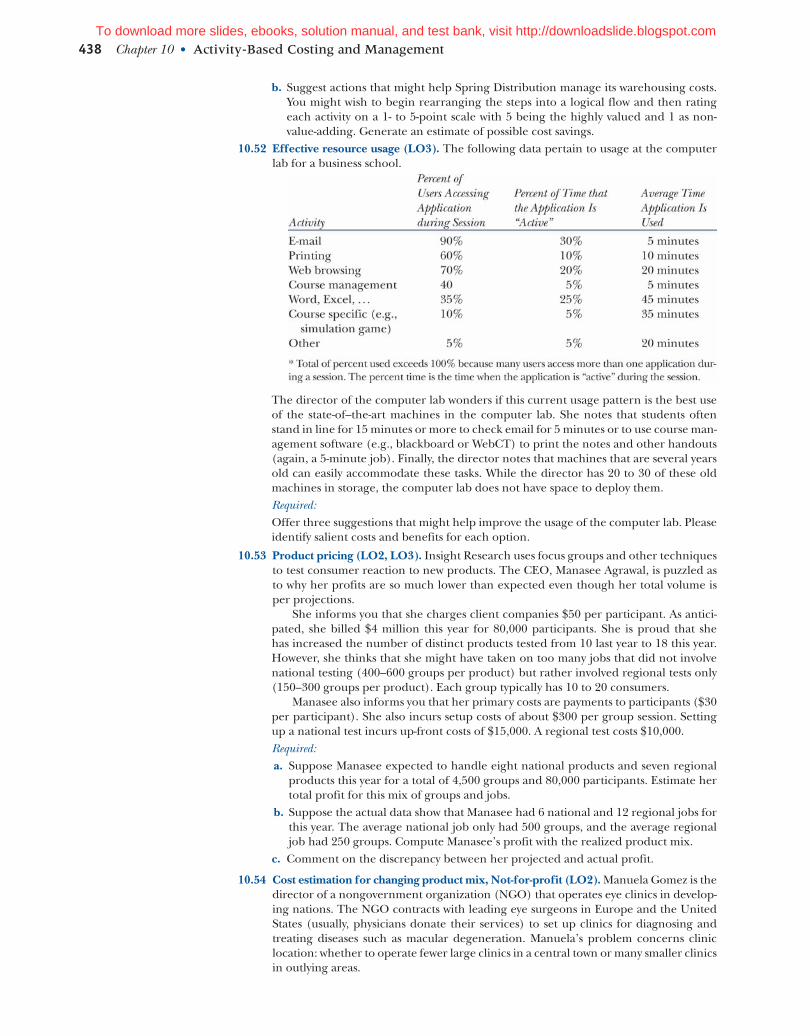
438 Chapter 10 • Activity-Based Costing and Management
b. Suggest actions that might help Spring Distribution manage its warehousing costs. You might wish to begin rearranging the steps into a logical flow and then rating each activity on a 1- to 5-point scale with 5 being the highly valued and 1 as non-value-adding. Generate an estimate of possible cost savings.
10.52 Effective resource usage (LO3). The following data pertain to usage at the computer lab for a business school.
The director of the computer lab wonders if this current usage pattern is the best use of the state-of–the-art machines in the computer lab. She notes that students often stand in line for 15 minutes or more to check email for 5 minutes or to use course man-agement software (e.g., blackboard or WebCT) to print the notes and other handouts (again, a 5-minute job). Finally, the director notes that machines that are several years old can easily accommodate these tasks. While the director has 20 to 30 of these old machines in storage, the computer lab does not have space to deploy them.Required:Offer three suggestions that might help improve the usage of the computer lab. Please identify salient costs and benefits for each option.
10.53 Product pricing (LO2, LO3). Insight Research uses focus groups and other techniques to test consumer reaction to new products. The CEO, Manasee Agrawal, is puzzled as to why her profits are so much lower than expected even though her total volume is per projections.
She informs you that she charges client companies $50 per participant. As antici-pated, she billed $4 million this year for 80,000 participants. She is proud that she has increased the number of distinct products tested from 10 last year to 18 this year. However, she thinks that she might have taken on too many jobs that did not involve national testing (400–600 groups per product) but rather involved regional tests only (150–300 groups per product). Each group typically has 10 to 20 consumers.
Manasee also informs you that her primary costs are payments to participants ($30 per participant). She also incurs setup costs of about $300 per group session. Setting up a national test incurs up-front costs of $15,000. A regional test costs $10,000.Required:a. Suppose Manasee expected to handle eight national products and seven regional
products this year for a total of 4,500 groups and 80,000 participants. Estimate her total profit for this mix of groups and jobs.
b. Suppose the actual data show that Manasee had 6 national and 12 regional jobs for this year. The average national job only had 500 groups, and the average regional job had 250 groups. Compute Manasee’s profit with the realized product mix.
c. Comment on the discrepancy between her projected and actual profit.
10.54 Cost estimation for changing product mix, Not-for-profit (LO2). Manuela Gomez is the director of a nongovernment organization (NGO) that operates eye clinics in develop-ing nations. The NGO contracts with leading eye surgeons in Europe and the United States (usually, physicians donate their services) to set up clinics for diagnosing and treating diseases such as macular degeneration. Manuela’s problem concerns clinic location: whether to operate fewer large clinics in a central town or many smaller clinics in outlying areas.
To download more slides, ebooks, solution manual, and test bank, visit http://downloadslide.blogspot.com
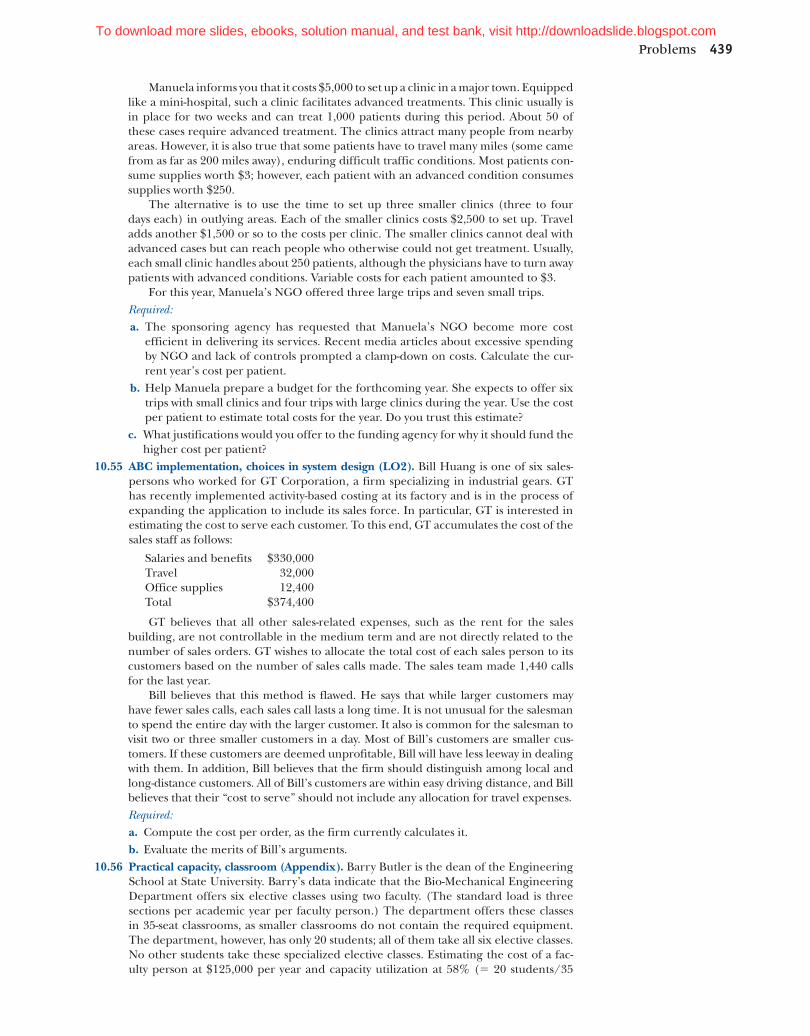
Manuela informs you that it costs $5,000 to set up a clinic in a major town. Equipped like a mini-hospital, such a clinic facilitates advanced treatments. This clinic usually is in place for two weeks and can treat 1,000 patients during this period. About 50 of these cases require advanced treatment. The clinics attract many people from nearby areas. However, it is also true that some patients have to travel many miles (some came from as far as 200 miles away), enduring difficult traffic conditions. Most patients con-sume supplies worth $3; however, each patient with an advanced condition consumes supplies worth $250.
The alternative is to use the time to set up three smaller clinics (three to four days each) in outlying areas. Each of the smaller clinics costs $2,500 to set up. Travel adds another $1,500 or so to the costs per clinic. The smaller clinics cannot deal with advanced cases but can reach people who otherwise could not get treatment. Usually, each small clinic handles about 250 patients, although the physicians have to turn away patients with advanced conditions. Variable costs for each patient amounted to $3.
For this year, Manuela’s NGO offered three large trips and seven small trips.Required:a. The sponsoring agency has requested that Manuela’s NGO become more cost
efficient in delivering its services. Recent media articles about excessive spending by NGO and lack of controls prompted a clamp-down on costs. Calculate the cur-rent year’s cost per patient.
b. Help Manuela prepare a budget for the forthcoming year. She expects to offer six trips with small clinics and four trips with large clinics during the year. Use the cost per patient to estimate total costs for the year. Do you trust this estimate?
c. What justifications would you offer to the funding agency for why it should fund the higher cost per patient?
10.55 ABC implementation, choices in system design (LO2). Bill Huang is one of six sales-persons who worked for GT Corporation, a firm specializing in industrial gears. GT has recently implemented activity-based costing at its factory and is in the process of expanding the application to include its sales force. In particular, GT is interested in estimating the cost to serve each customer. To this end, GT accumulates the cost of the sales staff as follows:
Salaries and benefits $330,000Travel 32,000Office supplies 12,400Total $374,400
GT believes that all other sales-related expenses, such as the rent for the sales building, are not controllable in the medium term and are not directly related to the number of sales orders. GT wishes to allocate the total cost of each sales person to its customers based on the number of sales calls made. The sales team made 1,440 calls for the last year.
Bill believes that this method is flawed. He says that while larger customers may have fewer sales calls, each sales call lasts a long time. It is not unusual for the salesman to spend the entire day with the larger customer. It also is common for the salesman to visit two or three smaller customers in a day. Most of Bill’s customers are smaller cus-tomers. If these customers are deemed unprofitable, Bill will have less leeway in dealing with them. In addition, Bill believes that the firm should distinguish among local and long-distance customers. All of Bill’s customers are within easy driving distance, and Bill believes that their “cost to serve” should not include any allocation for travel expenses.Required:a. Compute the cost per order, as the firm currently calculates it.b. Evaluate the merits of Bill’s arguments.
10.56 Practical capacity, classroom (Appendix). Barry Butler is the dean of the Engineering School at State University. Barry’s data indicate that the Bio-Mechanical Engineering Department offers six elective classes using two faculty. (The standard load is three sections per academic year per faculty person.) The department offers these classes in 35-seat classrooms, as smaller classrooms do not contain the required equipment. The department, however, has only 20 students; all of them take all six elective classes. No other students take these specialized elective classes. Estimating the cost of a fac-ulty person at $125,000 per year and capacity utilization at 58% (5 20 students/35
Problems 439To download more slides, ebooks, solution manual, and test bank, visit http://downloadslide.blogspot.com
440 Chapter 10 • Activity-Based Costing and Management
seats), Barry estimates the cost of the unused capacity at $105,000. (Barry multiplies $125,000 per faculty person 3 2 faculty persons 3 (1 2 0.58) 5 cost of unused capac-ity). He informs the department chair that she must decrease this waste of valuable resources or risk being closed down.Required:Focusing just on elective classes, is Barry correct in asserting that the Bio Mechanical Department is not fully utilizing its capacity? What is the capacity resource in this set-ting, and what is the right measure of capacity utilization?
10.57 Effect of loss of product (Appendix). Innova Machines (Pvt) Limited, located in Chennai, India, supplies automotive components to two-wheeler (scooters, motorcy-cles, mopeds, and such) manufacturers. A dozen major customers located within India account for most of its sales. The largest customer accounted for 20% of the sales, and the smallest accounted for about 6% of the sales volume. As elsewhere in the world, the market for automotive components is extremely competitive, and price is the key determinant of which supplier gets the order.
For 2006, management estimated materials cost at Rs. 80,000,000 (Rs. denotes Rupees—Rupee is the Indian currency), labor at Rs. 120,000,000, and manufacturing overhead at Rs. 75,000,000. The (industry) standard of 15% markup on manufactur-ing cost yielded total revenue of Rs. 316,250,000. The firm made a modest profit after accounting for selling and administration expenses.
One of Innova’s smaller customers (accounting for 8% of sales) went bankrupt and closed at the end of 2006. Innova’s management tried hard to replace the busi-ness but was unsuccessful, and budgeted manufacturing overhead at Rs. 72 million for 2007. They then computed prices based using the standard markup.
Despite heroic efforts from its sales force, the firm lost another customer in 2007—a customer who accounted for 15% of 2006 sales. Despite another saving of Rs. 7 mil-lion in budgeted overhead costs for 2008, it appeared that the firm had succumbed to nimbler competitors making the product at lower cost.Required:Help management figure out what is going on. (Hint: Compute the overhead rate per labor Rupee over time, assuming that labor cost will decline proportionately as demand declines).
10.58 Allocations in new product setting, choice of denominator (Appendix, Advanced). Vijay Srirangan, a successful entrepreneur, set up Indipan Industries to manufacture and sell convenience gadgets such as rice cookers, steamers, and tabletop grills to the burgeon-ing middle class in India. He believed strongly that, with the rise of two-career couples, the demand for these products would skyrocket. He wanted in on the ground floor!
Vijay teamed up with a well-known Japanese firm to set up his plant with the capacity to produce 50,000 rice cookers per month. However, because the product was new to most consumers in the target market, current production is only 20,000 cookers per month.
Vijay’s total materials cost is Indian Rs. 6 million, and labor cost is Rs.9 million. Overhead amounts to an additional Rs.18 million per month. Vijay seeks his accoun-tant’s help in pricing the cooker. The accountant divides the total cost of Rs. 33 million per month into the expected production volume of 20,000 cookers, and determines the cost per cooker to be Rs. 1,650. With a nominal markup of 10%, the accountant recommends pricing the product at Rs. 1,850 per cooker.
Vijay is not happy with this estimate. He believes that he can sell fewer than 7,500 cookers a month if he prices them at Rs. 1,850 each. He had used a price of Rs. 1,400 per cooker when projecting demand at 20,000 cookers a month. He believes that even-tually, the consumer will value convenience, and demand will rise to 50,000 cookers per month, as long as the price is less than Rs. 1,500 per cooker.Required:a. Do you believe that the accountant’s cost estimate accurately reflects the cost to
produce each cooker? Why or why not?b. Vijay’s marketing manager argues that the accountant’s cost estimate is high only
because the factory is operating under capacity. She argues that, with full production of 50,000 cookers, the cost per cooker is only Rs. 1,110 (5 Rs 300 for materials 1
To download more slides, ebooks, solution manual, and test bank, visit http://downloadslide.blogspot.com
Rs. 450 for labor 1 Rs. 360 for overhead). A 10% markup then leads to a price of about Rs. 1,250 per cooker. Evaluate the merits of this argument.
c. Suppose that Vijay follows his marketing manager’s recommendation and allocates only Rs. 360 (5 Rs. 18 million/50,000 cookers) to each cooker. How should Vijay deal with the cost of unused capacity of 30,000 cookers?
Mini-Cases 441
mini-Cases
10.59 ABC Allocations & pricing (LO3). Carolyn McKinsey is in charge of the copy center at Midwest University’s Business College. Carolyn seeks your help in figuring out how she should price the course packets that she prepares for many of the courses offered in the college. Her internal customers for course packets are the academic departments. The school charges each student a fixed fee for textbooks and notes, with each student getting the appropriate books and notes during the first class.
After investigating her costs and analyzing her operations, you determine that her major activities comprise the following:
Obtain copyrights for articles This step applies to some articles only. The copy center must repeat this step each semester, even if the same article is used. Carolyn handled this step and estimated that a small course pack (5 or fewer articles) took about an hour to com-plete. Every additional article would consume about 10 minutes. The average fee is $2 per article.
Make a master copy This step is done once per course pack. Faculty members usually change the pack slightly each semester, meaning that a new master must be made. Her assistant took ½ hour per course pack for this step.
Set up machine Load the appropriate type of cover, printing, and binding options. The staff person handled this chore and consumed ½ hour per order. This step was taken each time the job was run, regardless of the number of copies made.
Print and bind the copies The number of copies made depends on the order from the department. Each course pack contains a different number of pages. Tradition-ally, the academic departments underestimate the number of copies needed. When enroll-ment is finalized, they ask for a rush job to make up the shortfall. Student assistants ran the copy machine. Carolyn insisted that a student stand by the machine in case of paper jams and such. The last thing she desires is for the machine to break down at the start of a semester.
Deliver to classroom The number of deliveries depends on the number of sections. One delivery per 30 course packs is a good rule of thumb. The student assistants did the delivery, averaging about ½ hour for each delivery.
To download more slides, ebooks, solution manual, and test bank, visit http://downloadslide.blogspot.com

442 Chapter 10 • Activity-Based Costing and Management
Carolyn’s primary costs comprised the following.Copy paper $0.02 per sheet.
Other supplies (binders, clips, and so on)
$2,500 per semester
Copy machine supplies $0.01 per copy made (cost of toner etc)
Copy machine capacity The manufacturer advertises the machine cost (including maintenance) as only $0.01 per copy and is the lowest in the industry. The manufacturer arrived at this number by dividing the total machine cost (including machine supplies) by the total num-ber of copies over its lifetime. The machine could print 60 copies per minute. An average course pack contained 240 pages. Some course packs, though, were only 30 pages, and others were “monsters” that ran to 5001 pages.
Personnel $35,000 for Carolyn, $27,500 for her one assistant. Student employees are paid $8 per hour. Carolyn and her assistant worked 2,000 hours each year. The university does not charge the Center for the space and power used, for the furniture, and so on.
Required:a. Help Carolyn develop the price for a course pack that contains 12 articles (7 copy-
righted) and that contains 240 copies (120 sheets of paper with double-sided print-ing). The instructor estimates the demand at 30 students. (Note : It is much easier to work with total costs than cost per pack.)
b. The day before classes began, the instructor for the class discovered that actual enrollment is 40 students. Thus, Carolyn has to run an extra 10 copies. What is the cost of the resources consumed by the additional run?
c. The head of the Management and Organizations Department (a department that has many classes with large course packs) believes that the pricing scheme should only include the cost of papers and other consumables. He argues that the cost of the machine, Carolyn’s salary, and other such expenses are fixed costs and there-fore are not relevant for the pricing decision. He further argues that this is a short-term decision because each course pack is valid only for one semester. Evaluate the merits of this argument.
10.60 Volume based allocations, inventory values, rationing scarce resource, & ABC (LO1, LO2 and LO3). Mark Ahren is an award-winning potter whose primary products are custom-designed cups and mugs in unique shapes. Mark estimates that the variable costs (clay bisque, pigments, glaze, and so on) are $3.50 per mug. He estimates 75% of this cost relates to materials, and the other 25% to labor and variable overhead. The average mug weighs a pound and sells for $13.
Mark also incurs costs for operating his office ($50,750 per year), travel to fairs, and so on ($26,250), and, most important, for firing his custom-built, high-temperature oven ($77,000).
For the past couple of years, Mark has expanded his product line to include larger items such as water pitchers and vases. Pitchers weigh in at 2 pounds per unit, have a variable cost of $6 per unit, and retail for $20. Corresponding data for vases are 3 pounds, $8 per unit, and $24 per unit. Mark believes that materials constitute 75% of the variable cost for these items as well. For the coming year, he estimates producing 29,000 mugs and 3,000 units each of the larger items, or 35,000 pieces in total.
Mark emphasizes the importance of having a high-quality reliable oven in his line of work. Indeed, he tells you that the oven capacity essentially controls what he could do in terms of product volume. In particular, he claims that he could easily hire more labor to mix the clay and do other miscellaneous tasks. While it might take several months, he also believes that he could also expand his sales and administrative capacity by hiring appropriate staff. However, replacing the oven will take close to two years. In addition to the substantial investment, Mark has to coordinate with the manufacturer
To download more slides, ebooks, solution manual, and test bank, visit http://downloadslide.blogspot.com
so that the oven meets Mark’s exacting specifications. Mark notes that he started with a smallest possible oven, with a capacity of 25,000 pounds. Each replacement oven has been larger, although he thinks he might have reached the limit for a single oven.
Finally, because of the time required to set up, load, and unload the oven, Mark could fire the oven only 200 times (or about 40,000 pounds) per year. He could pro-duce 250 mugs, 50 vases, or 100 pitchers per firing. Mark is careful to note that the actual number of firings in any given year might be a bit higher or lower. Moreover, he observes that the time required for a firing depends on the weight of the products fired. Because most firings have a combination of mugs, vases, and pitchers, the actual time per firing of the oven varies quite a bit.Required:a. Suppose Mark allocates all overhead to products using the number of units as the
allocation basis. Determine the unit contribution and unit profit margin for each of Mark’s three product lines. What is the implication for which products to empha-size and which to deemphasize?
b. Repeat requirement (a) assuming that Mark allocates all overhead using the num-ber of pounds as the allocation basis. What is the implication for which products to emphasize and which to deemphasize?
c. Continue with pounds as the allocation basis. For each product, what value could Mark attach to a unit in inventory? Recall that Mark would employ this unit for computing reported income, meaning that the allocation choices must conform with GAAP.
d. Is there a clear choice for the basis (pounds versus units) that Mark should choose for valuing inventory? for assessing product profitability? Justify your answer.
e. Mark also learns about activity-based costing. Again, he understands the logic of this method. He therefore wants to compute product profitability using the expected number of firings (200) to allocate oven-related costs and the number of units to allocate selling costs. He wants to allocate all other costs at the rate of $0.10 per revenue dollar. Perform this computation and rank order products as per their ABC profit margin.
f. Compute Mark’s total income using ABC to allocate costs. Why do you expect this income to be the same (subject to rounding) as the income computed when you use the number of units to allocate costs?
g. Under what conditions would you expect the ABC income you computed for part (g) to differ from the income reported under GAAP?
h. By now, Mark is thoroughly confused as to which of his three products is the most profitable, and deserves more emphasis in his product mix. Please be sure to out-line the implicit assumptions and requirements for each of the methods (the two volume-based allocations, inventory value, and ABC).
10.61 Refining Cost Drivers. LO1-LO3. Tom and Lynda are considering several actions in response to another gym opening nearby. Tom believes that Hercules should focus on actions that target family memberships, as he believes family memberships to be more profitable than individual memberships. He therefore wishes to add more classes and other activities of greater interest to families. Lynda is less sure because she thinks that families also use the gym more intensively. She thinks that individuals might cost less (even if their apparent usage is more) because they tend to focus on using easy to maintain and long-lasting exercise equipment (e.g., dumbbells) rather than costly items such as the pool. They provide the following data regarding uses and costs.
Individuals Family
Number of memberships 500 200Persons per membership (average) 1 2# of visits per month per person 8 2Minutes on exercise equipment per month 120 30# of class sessions attended per person 3 12Minutes on cardio machines per month per person 120 120# of visits to pool per person 0.2 0.5% of members paying with credit card 0.5 0.8Membership fee per month $100 $160
Mini-Cases 443To download more slides, ebooks, solution manual, and test bank, visit http://downloadslide.blogspot.com
444 Chapter 10 • Activity-Based Costing and Management
Variable costsSupplies—towels, etc. 22,500Supplies—for classes 2,500Water (50% relates to pool and 50% relates to showers) 3,000Credit card fees 1,012Fixed costsEstimated wear and tear on cardio equipment 1,500Estimated wear and tear on weights and related equipment
900
Instructor salaries and other class-related costs 12,000Pool maintenance 1,200Utilities (electric and gas) 2,500Staff salaries (front desk, office) 13,500Rental and maintenance for building 5,000Other admin expenses 3,500Total costs $69,112
Required:a. Calculate profit per individual and family membership. Allocate all costs (fixed and
variable) using the number of visits as the allocation basis.b. Calculate profit per individual and family membership. Develop suitable drivers for
each of the costs except for the items deemed to be facility-level costs.c. Based on your answers to the above parts, what advice do you offer Tom and
Lynda?d. Would you classify the analysis in part (b) as activity-based costing?
10.62 LO1, LO2, LO3. ABC model of product costs. Zeus Optical is a specialist manufac-turer of optical instruments. Zeus has recently expanded its core product market of binoculars into making eyepieces for microscopes/telescopes, and screw-on lenses for digital SLR cameras. The firm believes that it makes little money selling binoculars, and that these new markets have great profit potential.
Somewhat to Zeus’s surprise, it finds it tough to make money with eyepieces. As of now, the firm is selling the product at a negative profit margin. Yet, Zeus faces intense price pressure in this segment and thinks that it might have to lower prices by 5% or more to stay competitive. The market for binoculars has been stable for several years, and Zeus expects the trends to continue for the near future. Zeus is most excited about entering the market for screw-on lenses for digital SLR cameras. Although current vol-umes are small (relatively), Zeus believes that there is substantial market potential for this product. Leveraging its excellent reputation for optics and lenses, Zeus believes that it could reach and sustain three times the current volume of this product. This strategy also makes sense financially as this product is the most profitable of the three lines, per the firm’s accounting records.
The following table provides key information about the product lines. (Note : All data have been disguised for confidentiality. However, relations among data items have been preserved.)
Currently, the firm incurs $1,161,100 in overhead costs annually. It allocates this overhead among product lines using the number of labor hours used by each prod-uct line. Zeus’s management realizes that moving to camera lenses is a major shift in their product and market focus. Moreover, they know that factory personnel have complained about the increased coordination required for producing lenses. Thus, management wants you to conduct a detailed study of product costs.
To download more slides, ebooks, solution manual, and test bank, visit http://downloadslide.blogspot.com

You collect the following data.
Analyzing the overhead, you discover the following:
You are wondering how best to allocate these costs into cost pools. You settle on form-ing five pools.
• Volume-related costs, allocated to products using labor hours.• Cost related to executing a production order (this would include first part inspec-
tions), allocated using the number of batches.• Costs related to inventory, receiving, and shipping. These costs would be allocated
using the number of transactions per product line (5 components 3 number of transactions).
• Costs related to parts administration, which will be equally shared by all product lines.
• Facility-level costs. You decide not to allocate these costs to individual product lines, reasoning that these costs are not controllable at the product level.
Required:a. Verify the profit margin data reported in the problem text, using the current alloca-
tion system.b. Compute the amounts in the five cost pools and the rate per driver unit for each
cost pool.c. Using the driver rates you computed in part (b), determine the product cost for
each product line. That is, compute the profit margin for each product line using activity-based costing.
d. Based on the ABC profit margins, what actions would you recommend for Zeus’s management.
e. How could you further improve the accuracy of reported product costs, using the ABC system? Be sure to indicate the additional data, if any, which you might need to implement your suggestions.
Mini-Cases 445To download more slides, ebooks, solution manual, and test bank, visit http://downloadslide.blogspot.com