NEAR SHORE AND BEACH NOURISHMENT’S EFFECTS ON THE STABILITY OF ROSETTA PROMONTORY, EGYPT
12
Eighteenth International Water Technology Conference, IWTC18SharmElSheikh, 12-14 March 2015 NEAR SHORE AND BEACH NOURISHMENT’S EFFECTS ON THE STABILITY OF ROSETTA PROMONTORY, EGYPT Ali Masria 1 , Kazuo Nadaoka 2 , Yoshiaki Kuriyama 3 , Abdelazim Negm 1 , Moheb Iskander 4 , and Oliver C. Saavedra 5 1 Department of Environmental Engineering, Egypt-Japan University of Science and Technology E-JUST, New Borg El-Arab, Alexandria, Egypt, E-mail: [email protected], [email protected] 2 Department of Mechanical and Environmental Informatics, Graduate School of Information Science and Engineering, Tokyo Institute of Technology, Tokyo, Japan, Email: [email protected] 3 Director of Coastal and Estuarine Environment Field, and Director General of Asia-Pacific Center for Coastal Disaster Research (APaC-CDR), Email:[email protected] 4 Coastal Research Institute, Alexandria, Egypt, Email: [email protected] 5 Department of Civil Engineering, Graduate School of Science and Engineering, Tokyo Institute of Technology, Tokyo, Email: [email protected] ABSTRACT Rosetta promontory is located on the Mediterranean Sea where the Rosetta branch of Nile meets the sea. Shoreline erosion and the river mouth sedimentation at Rosetta promontory were magnified after construction of Aswan High Dam (AHD) in 1964 that dramatically decreased both water discharge, and sediment transport to the sea. Many attempts to solve the erosion, and sedimentation problem were performed. Hard protection works have been implemented since 1989 such as seawalls on the tip of the promontory and several groins along the eastern and western shores of the promontory. Additionally continuous dredging works were implemented within the river mouth. However, the shoreline along Rosetta Promontory is still unstable and these measures has a limited effect on the promontory stability where it transfers the problems to the adjacent areas. Two techniques of coastal nourishment are proposed in this study to avoid further degradation of the Rosetta coastal zone and to minimize erosion problems. These techniques include near shore and beach nourishment. A calibrated/verified Coastal Modeling System (CMS) was used to address the effect of the nourishment on the morphology of the hot spot areas (erosion and accretion). Results of different scenarios were discussed in detail. Beach nourishment on the western headland of the promontory will modify the stability of the shoreline specially the western side of the promontory as well as decrease the siltation problem inside the river mouth. Keywords: Shoreline erosion, sedimentation, nourishment process, Rosetta. 1 INTRODUCTION AND STUDY AREA The majority of coastlines‟ shape changes over time due to many factors such as ocean currents, rise of sea level, wave action, sediment loads, and long shore drift. Coastal erosion occurs worldwide along coastlines, and has been reported in the literature for several decades (Hamm et al. 2002;Castelle et al. 2009; Spielmann et al. 2011; Shi et al. 2013 and Stive et al. 2013). Traditionally, eroded coastlines have been protected by civil engineering structures involving revetments, groins, seawalls, breakwaters and the like (Charlier et al. 2005). Major advances in the technology of beach nourishment have been made over the past three decades (Houston 1996; Elko et al. 2005a), and spread widely. So, not only coastal engineers are investigating beach nourishment, but also geoscientists(Hamm et al. 2002; Hanson et al. 2002). Nourishment and bypassing of sand are often required to mitigate the unavoidable side-effects of engineering works. This „building with nature‟ approach requires a profound understanding of the sediment transport processes in morphological systems Coastal erosion (Van Rijn, 2004). This approach is recommended to apply in Egypt (Iskander 2010).
Transcript of NEAR SHORE AND BEACH NOURISHMENT’S EFFECTS ON THE STABILITY OF ROSETTA PROMONTORY, EGYPT
Eighteenth International Water Technology Conference, IWTC18SharmElSheikh, 12-14 March 2015
NEAR SHORE AND BEACH NOURISHMENT’S EFFECTS ON THE
STABILITY OF ROSETTA PROMONTORY, EGYPT
Ali Masria1, Kazuo Nadaoka
2, Yoshiaki Kuriyama
3, Abdelazim Negm
1, Moheb Iskander
4, and
Oliver C. Saavedra5
1Department of Environmental Engineering, Egypt-Japan University of Science and Technology E-JUST,
New Borg El-Arab, Alexandria, Egypt, E-mail: [email protected], [email protected] 2Department of Mechanical and Environmental Informatics, Graduate School of Information Science and
Engineering, Tokyo Institute of Technology, Tokyo, Japan, Email: [email protected] 3Director of Coastal and Estuarine Environment Field, and Director General of Asia-Pacific Center for
Coastal Disaster Research (APaC-CDR), Email:[email protected] 4Coastal Research Institute, Alexandria, Egypt, Email: [email protected]
5Department of Civil Engineering, Graduate School of Science and Engineering, Tokyo Institute of
Technology, Tokyo, Email: [email protected]
ABSTRACT
Rosetta promontory is located on the Mediterranean Sea where the Rosetta branch of Nile meets the
sea. Shoreline erosion and the river mouth sedimentation at Rosetta promontory were magnified after
construction of Aswan High Dam (AHD) in 1964 that dramatically decreased both water discharge,
and sediment transport to the sea. Many attempts to solve the erosion, and sedimentation problem were
performed. Hard protection works have been implemented since 1989 such as seawalls on the tip of the
promontory and several groins along the eastern and western shores of the promontory. Additionally
continuous dredging works were implemented within the river mouth. However, the shoreline along
Rosetta Promontory is still unstable and these measures has a limited effect on the promontory stability
where it transfers the problems to the adjacent areas.
Two techniques of coastal nourishment are proposed in this study to avoid further degradation of the
Rosetta coastal zone and to minimize erosion problems. These techniques include near shore and beach
nourishment.
A calibrated/verified Coastal Modeling System (CMS) was used to address the effect of the
nourishment on the morphology of the hot spot areas (erosion and accretion). Results of different
scenarios were discussed in detail. Beach nourishment on the western headland of the promontory will
modify the stability of the shoreline specially the western side of the promontory as well as decrease
the siltation problem inside the river mouth.
Keywords: Shoreline erosion, sedimentation, nourishment process, Rosetta.
1 INTRODUCTION AND STUDY AREA
The majority of coastlines‟ shape changes over time due to many factors such as ocean currents, rise
of sea level, wave action, sediment loads, and long shore drift. Coastal erosion occurs worldwide
along coastlines, and has been reported in the literature for several decades (Hamm et al. 2002;Castelle
et al. 2009; Spielmann et al. 2011; Shi et al. 2013 and Stive et al. 2013). Traditionally, eroded
coastlines have been protected by civil engineering structures involving revetments, groins, seawalls,
breakwaters and the like (Charlier et al. 2005). Major advances in the technology of beach nourishment
have been made over the past three decades (Houston 1996; Elko et al. 2005a), and spread widely. So,
not only coastal engineers are investigating beach nourishment, but also geoscientists(Hamm et al.
2002; Hanson et al. 2002). Nourishment and bypassing of sand are often required to mitigate the
unavoidable side-effects of engineering works. This „building with nature‟ approach requires a
profound understanding of the sediment transport processes in morphological systems Coastal erosion
(Van Rijn, 2004). This approach is recommended to apply in Egypt (Iskander 2010).
Eighteenth International Water Technology Conference, IWTC18SharmElSheikh, 12-14 March 2015
In general, beach nourishment involves the placement of sediment on an eroding beach to migrate
the shoreline seaward in order to promote storm protection, natural habitat and beach amenity. A wide
application of numerical models have been developed, both simple (Dean & Yoo 1992; Elko et al.
2005b) and more complex (Van Duin et al. 2004; Li et al. 2006; Lin et al. 2013; Kuroiwa et al. 2011),
to predict the impact of nourishment placement projects.
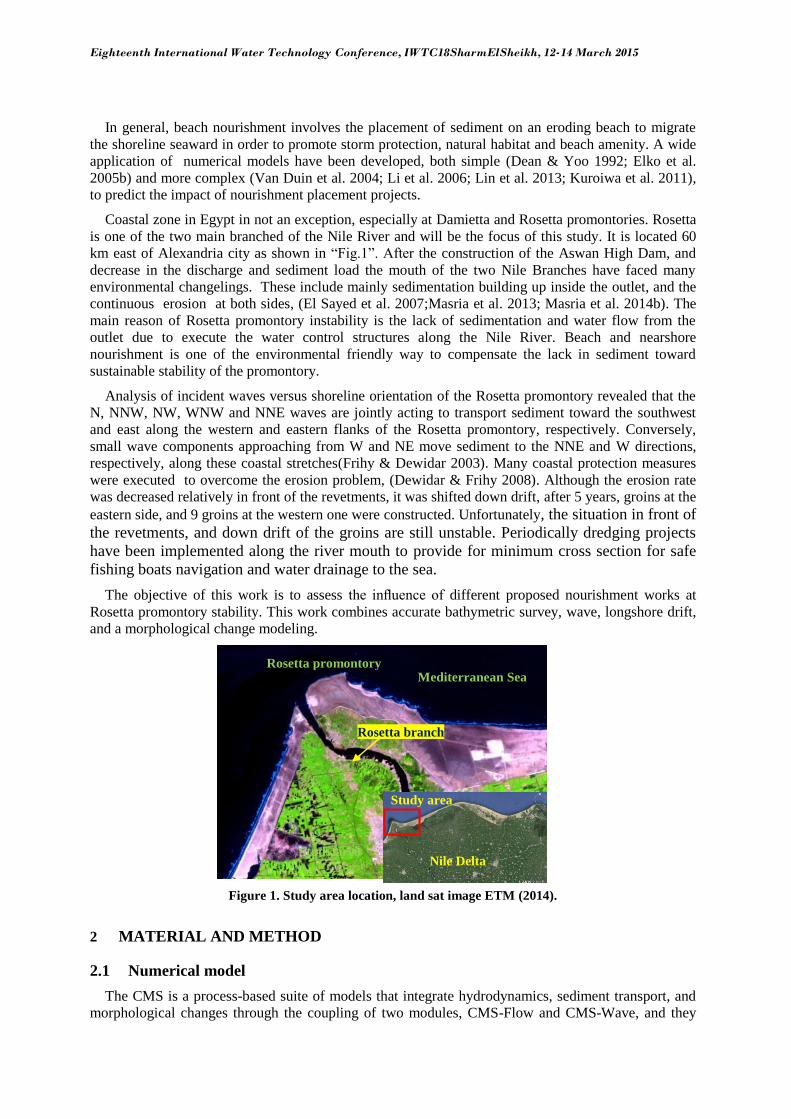
Coastal zone in Egypt in not an exception, especially at Damietta and Rosetta promontories. Rosetta
is one of the two main branched of the Nile River and will be the focus of this study. It is located 60
km east of Alexandria city as shown in “Fig.1”. After the construction of the Aswan High Dam, and
decrease in the discharge and sediment load the mouth of the two Nile Branches have faced many
environmental changelings. These include mainly sedimentation building up inside the outlet, and the
continuous erosion at both sides, (El Sayed et al. 2007;Masria et al. 2013; Masria et al. 2014b). The
main reason of Rosetta promontory instability is the lack of sedimentation and water flow from the
outlet due to execute the water control structures along the Nile River. Beach and nearshore
nourishment is one of the environmental friendly way to compensate the lack in sediment toward
sustainable stability of the promontory.
Analysis of incident waves versus shoreline orientation of the Rosetta promontory revealed that the
N, NNW, NW, WNW and NNE waves are jointly acting to transport sediment toward the southwest
and east along the western and eastern flanks of the Rosetta promontory, respectively. Conversely,
small wave components approaching from W and NE move sediment to the NNE and W directions,
respectively, along these coastal stretches(Frihy & Dewidar 2003). Many coastal protection measures
were executed to overcome the erosion problem, (Dewidar & Frihy 2008). Although the erosion rate
was decreased relatively in front of the revetments, it was shifted down drift, after 5 years, groins at the
eastern side, and 9 groins at the western one were constructed. Unfortunately, the situation in front of
the revetments, and down drift of the groins are still unstable. Periodically dredging projects
have been implemented along the river mouth to provide for minimum cross section for safe
fishing boats navigation and water drainage to the sea.
The objective of this work is to assess the influence of different proposed nourishment works at
Rosetta promontory stability. This work combines accurate bathymetric survey, wave, longshore drift,
and a morphological change modeling.
Figure 1. Study area location, land sat image ETM (2014).
2 MATERIAL AND METHOD
2.1 Numerical model
The CMS is a process-based suite of models that integrate hydrodynamics, sediment transport, and
morphological changes through the coupling of two modules, CMS-Flow and CMS-Wave, and they
a b a Rosetta promontory
Study area
Mediterranean Sea
Rosetta branch
Nile Delta
Study area
Eighteenth International Water Technology Conference, IWTC18SharmElSheikh, 12-14 March 2015
are coupled through steering module. It is conducted to simulate waves, interacting waves and currents,
water level, sediment transport, and morphology change at coastal inlets, entrances and nearby. The
CMS was developed specially for modeling outlet processes and morphology changes., (Demirbilek et
al. 2008). Model setup, calibration, verification and parameter sensitivity analysis were conducted by
using several hydrographic surveys during years 2005-2006, one year of wave and tide data as well as
bed sediment characteristics. The important parameter used in calibration; hydrodynamic time step,
Manning coefficient, different transport formulas, scaling factor for bed load and suspended load, total
adaptation length, and also the effect of smoothing the bathymetric contour. For more details see
(Masria et al. 2014a; Masria et al. 2013).
2.2 Nourishment Scenarios Set-up
Two different nourishment sets were simulated: beach nourishment, and near shore nourishment.
(Masria et al. 2014c) checked the availability of sediment resources for the nourishment and indentify
two main sources; offshore source with mean grain size range between 0.1 and 0.18 mm and land
source with mean grain size range between 0.24 - 0.32 mm. Also by using Particle Tracking Model
(PTM) he found that the sediment source come from El Khatatba which located 150 km from the site
landward with mean grain size 0.32 mm is more efficient within this area.
Based on the data availability, the simulation is conducted starting from October 2005 for one year
duration. The simulation is implemented to calculate the sediment transport using tide, and wave
forcing. These sediment volumes is presented in (CMS) as a uniform layer above the existing seabed
inside the placement area. Adding the nourishment is executed through interpolating the scatter of
placement site with the proposed nourished depth to the original grid, and using „linear‟ for
interpolation and „distance weighted‟ for extrapolation (to make sure the boundary depth is correctly
mapped).
(El Sayed et al. 2007) used multi-years hydrographic survey as well as GENESES model and found
that the needed quantity of sand nourishment for both western and eastern sides of the Rosetta
promontory, are about 500,000 m3/yr.
2.2.1 Beach nourishment group
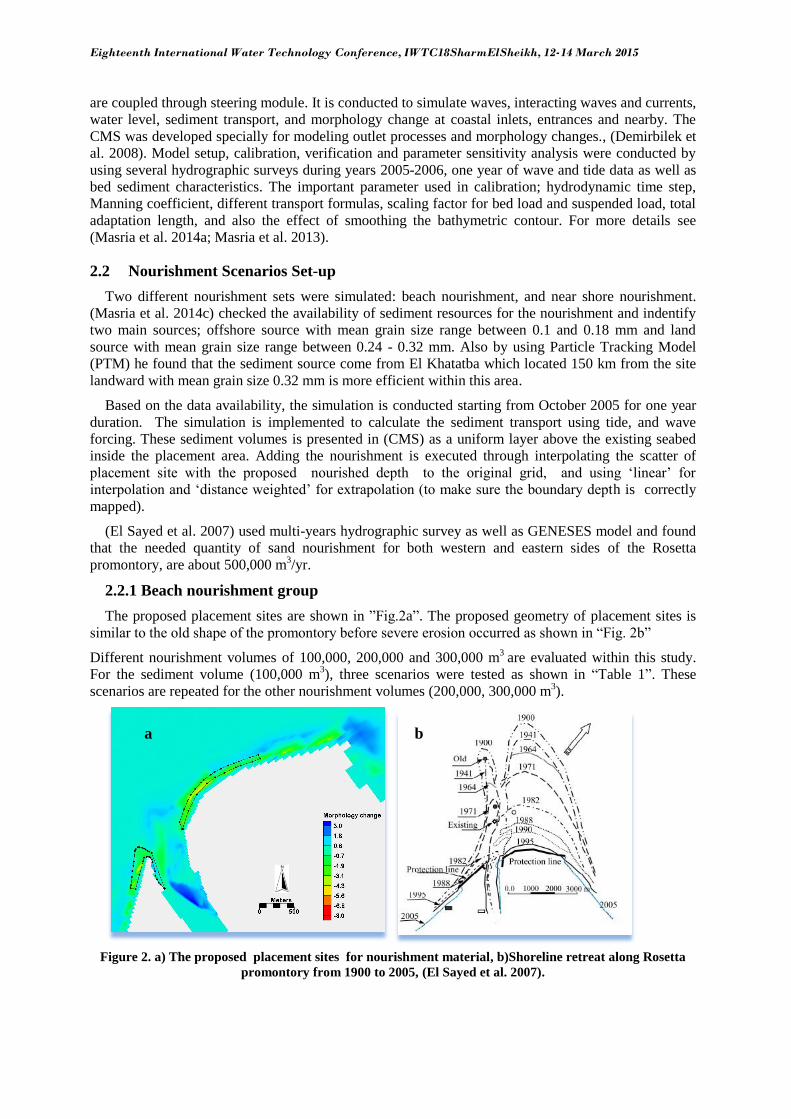
The proposed placement sites are shown in ”Fig.2a”. The proposed geometry of placement sites is
similar to the old shape of the promontory before severe erosion occurred as shown in “Fig. 2b”
Different nourishment volumes of 100,000, 200,000 and 300,000 m3
are evaluated within this study.
For the sediment volume (100,000 m3), three scenarios were tested as shown in “Table 1”. These
scenarios are repeated for the other nourishment volumes (200,000, 300,000 m3).
Figure 2. a) The proposed placement sites for nourishment material, b)Shoreline retreat along Rosetta
promontory from 1900 to 2005, (El Sayed et al. 2007).
a b
Eighteenth International Water Technology Conference, IWTC18SharmElSheikh, 12-14 March 2015
Table 1. Scenarios assessed by CMS for different sediment volumes and locations
Scenario Description Total
sediment
volume(m3)
0 Do no thing 0
1 Placement site is at eastern side only. 100,000
2 Placement site is at western only. 100,000
3 Placement sites is at (eastern side + western side ), and
the volume is distributed equally between both sides. 100,000
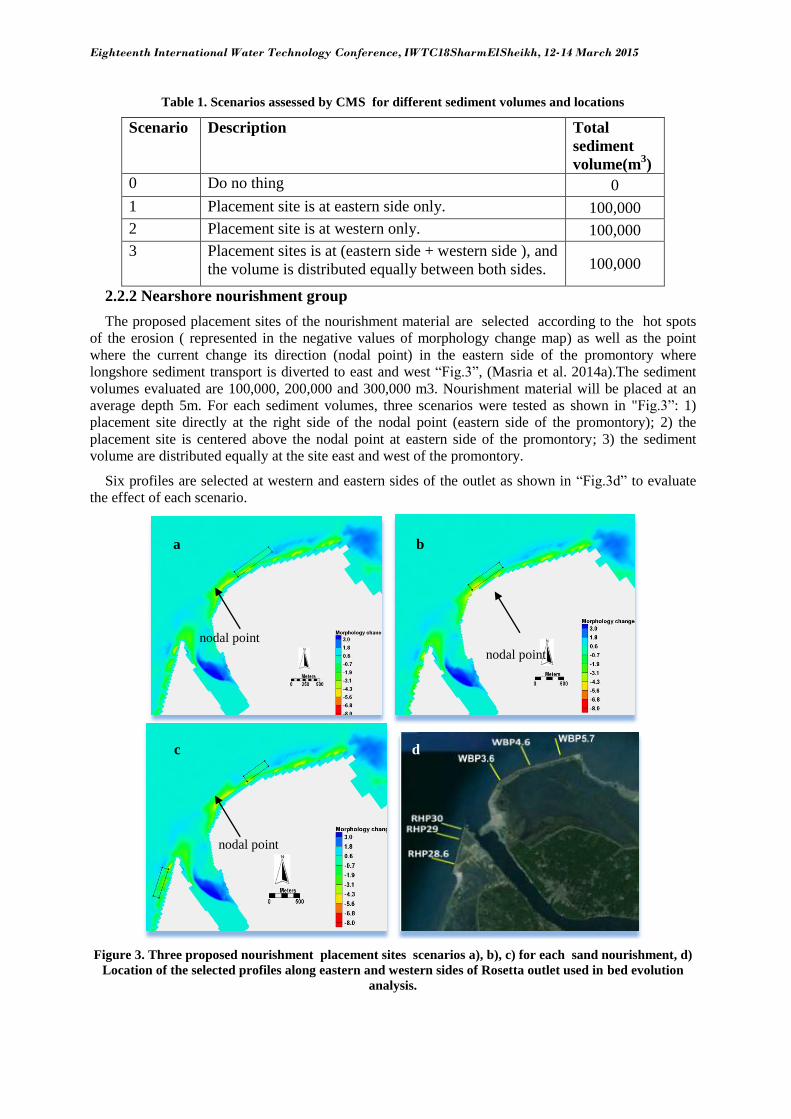
2.2.2 Nearshore nourishment group
The proposed placement sites of the nourishment material are selected according to the hot spots
of the erosion ( represented in the negative values of morphology change map) as well as the point
where the current change its direction (nodal point) in the eastern side of the promontory where
longshore sediment transport is diverted to east and west “Fig.3”, (Masria et al. 2014a).The sediment
volumes evaluated are 100,000, 200,000 and 300,000 m3. Nourishment material will be placed at an
average depth 5m. For each sediment volumes, three scenarios were tested as shown in "Fig.3”: 1)
placement site directly at the right side of the nodal point (eastern side of the promontory); 2) the
placement site is centered above the nodal point at eastern side of the promontory; 3) the sediment
volume are distributed equally at the site east and west of the promontory.
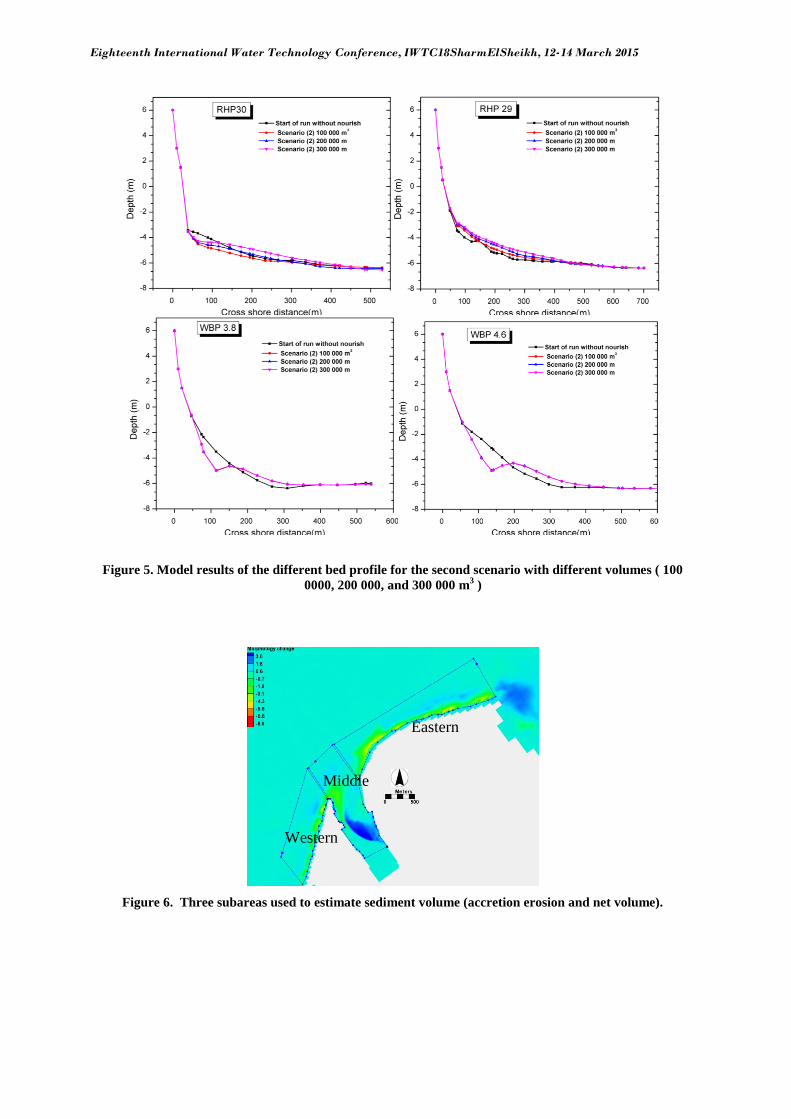
Six profiles are selected at western and eastern sides of the outlet as shown in “Fig.3d” to evaluate
the effect of each scenario.
Figure 3. Three proposed nourishment placement sites scenarios a), b), c) for each sand nourishment, d)
Location of the selected profiles along eastern and western sides of Rosetta outlet used in bed evolution
analysis.
nodal point
nodal point
nodal point
a b
c d
Eighteenth International Water Technology Conference, IWTC18SharmElSheikh, 12-14 March 2015
3 RESULTS AND ANALYSIS
To evaluate the effect of the different nourishment scenarios, various outputs from one year
simulation implemented with Coastal Modeling System Software (CMS) are analyzed. The outputs
include morphology change, current velocity, and sediment concentrations.
3.1 Beach nourishment
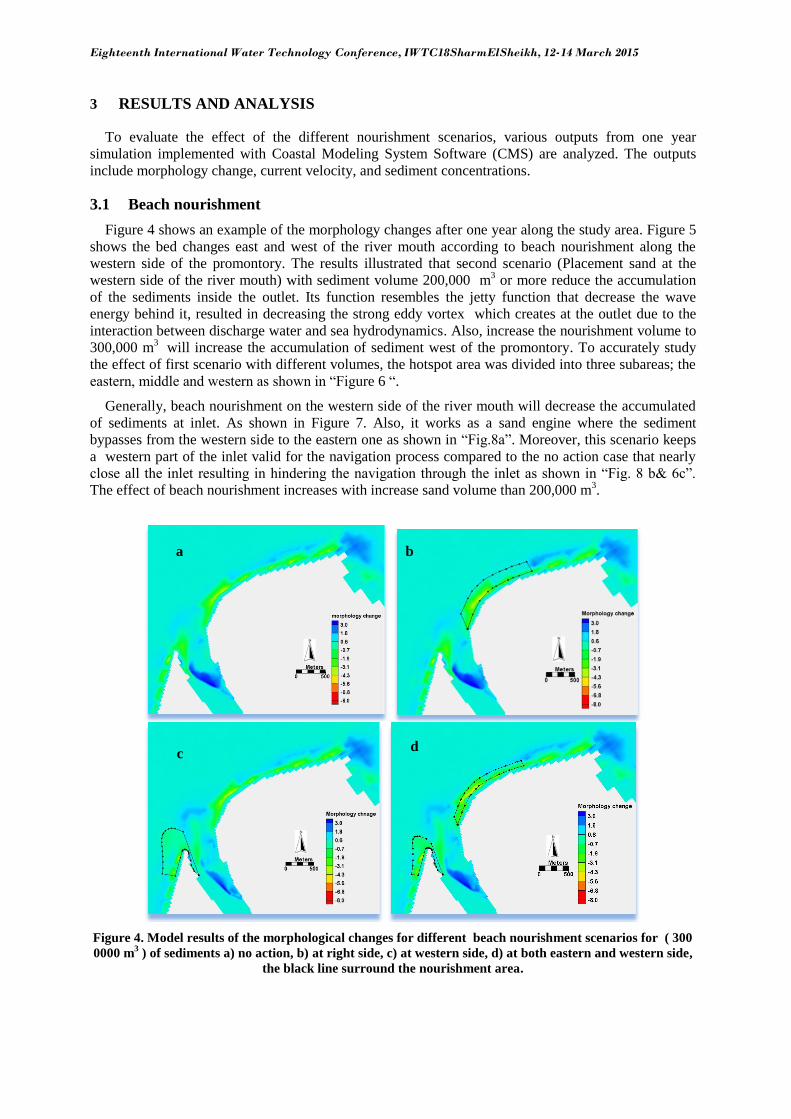
Figure 4 shows an example of the morphology changes after one year along the study area. Figure 5
shows the bed changes east and west of the river mouth according to beach nourishment along the
western side of the promontory. The results illustrated that second scenario (Placement sand at the
western side of the river mouth) with sediment volume 200,000 m3 or more reduce the accumulation
of the sediments inside the outlet. Its function resembles the jetty function that decrease the wave
energy behind it, resulted in decreasing the strong eddy vortex which creates at the outlet due to the
interaction between discharge water and sea hydrodynamics. Also, increase the nourishment volume to
300,000 m3 will increase the accumulation of sediment west of the promontory. To accurately study
the effect of first scenario with different volumes, the hotspot area was divided into three subareas; the
eastern, middle and western as shown in “Figure 6 “.
Generally, beach nourishment on the western side of the river mouth will decrease the accumulated
of sediments at inlet. As shown in Figure 7. Also, it works as a sand engine where the sediment
bypasses from the western side to the eastern one as shown in “Fig.8a”. Moreover, this scenario keeps
a western part of the inlet valid for the navigation process compared to the no action case that nearly
close all the inlet resulting in hindering the navigation through the inlet as shown in “Fig. 8 b& 6c”.
The effect of beach nourishment increases with increase sand volume than 200,000 m3.
Figure 4. Model results of the morphological changes for different beach nourishment scenarios for ( 300
0000 m3 ) of sediments a) no action, b) at right side, c) at western side, d) at both eastern and western side,
the black line surround the nourishment area.
c
b
d
a
Eighteenth International Water Technology Conference, IWTC18SharmElSheikh, 12-14 March 2015
Figure 5. Model results of the different bed profile for the second scenario with different volumes ( 100
0000, 200 000, and 300 000 m3 )
Figure 6. Three subareas used to estimate sediment volume (accretion erosion and net volume).
Eastern
Western
Middle
Eighteenth International Water Technology Conference, IWTC18SharmElSheikh, 12-14 March 2015
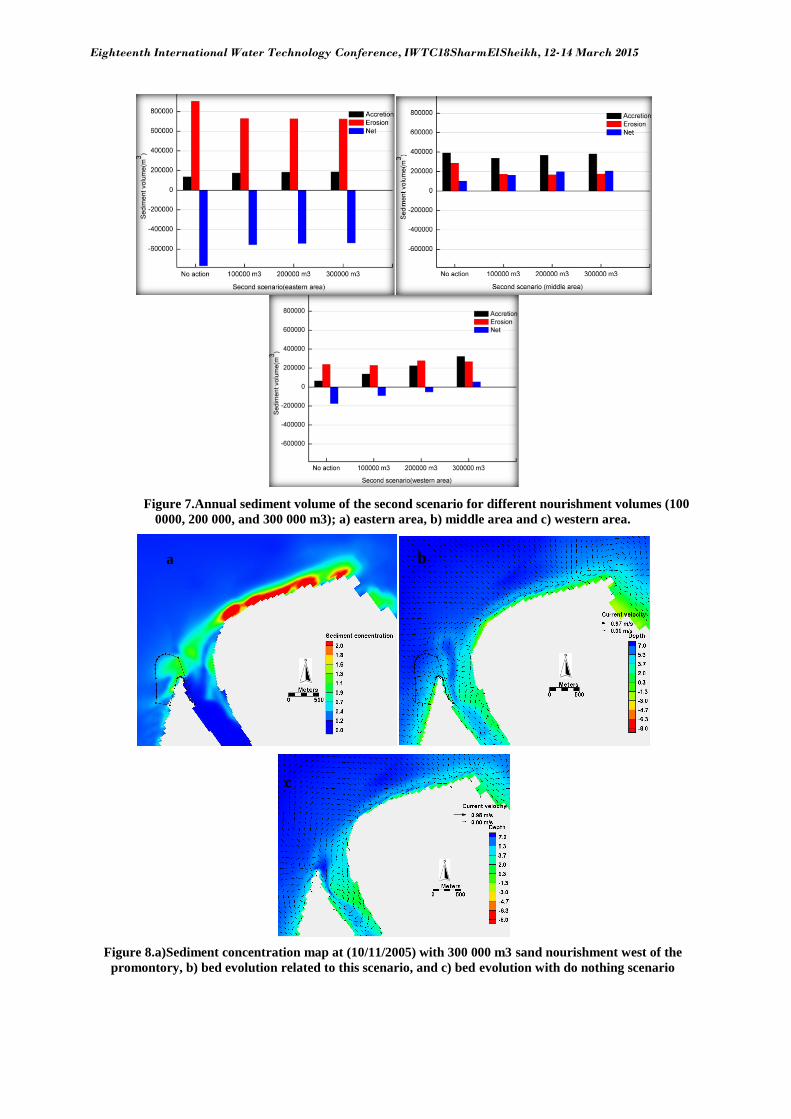
Figure 7.Annual sediment volume of the second scenario for different nourishment volumes (100
0000, 200 000, and 300 000 m3); a) eastern area, b) middle area and c) western area.
Figure 8.a)Sediment concentration map at (10/11/2005) with 300 000 m3 sand nourishment west of the
promontory, b) bed evolution related to this scenario, and c) bed evolution with do nothing scenario
a
c
b
Eighteenth International Water Technology Conference, IWTC18SharmElSheikh, 12-14 March 2015
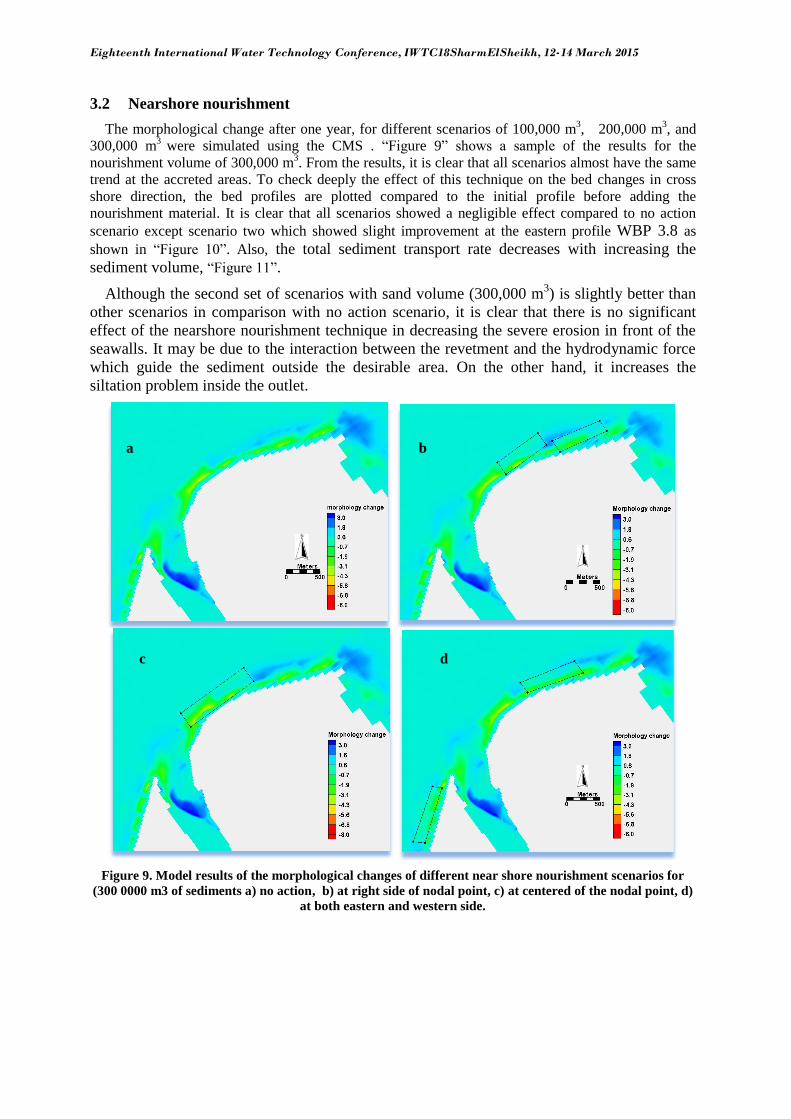
3.2 Nearshore nourishment
The morphological change after one year, for different scenarios of 100,000 m3, 200,000 m
3, and
300,000 m3
were simulated using the CMS . “Figure 9” shows a sample of the results for the
nourishment volume of 300,000 m3. From the results, it is clear that all scenarios almost have the same
trend at the accreted areas. To check deeply the effect of this technique on the bed changes in cross
shore direction, the bed profiles are plotted compared to the initial profile before adding the
nourishment material. It is clear that all scenarios showed a negligible effect compared to no action
scenario except scenario two which showed slight improvement at the eastern profile WBP 3.8 as
shown in “Figure 10”. Also, the total sediment transport rate decreases with increasing the
sediment volume, “Figure 11”.
Although the second set of scenarios with sand volume (300,000 m3) is slightly better than
other scenarios in comparison with no action scenario, it is clear that there is no significant
effect of the nearshore nourishment technique in decreasing the severe erosion in front of the
seawalls. It may be due to the interaction between the revetment and the hydrodynamic force
which guide the sediment outside the desirable area. On the other hand, it increases the
siltation problem inside the outlet.
Figure 9. Model results of the morphological changes of different near shore nourishment scenarios for
(300 0000 m3 of sediments a) no action, b) at right side of nodal point, c) at centered of the nodal point, d)
at both eastern and western side.
a b
c d
Eighteenth International Water Technology Conference, IWTC18SharmElSheikh, 12-14 March 2015
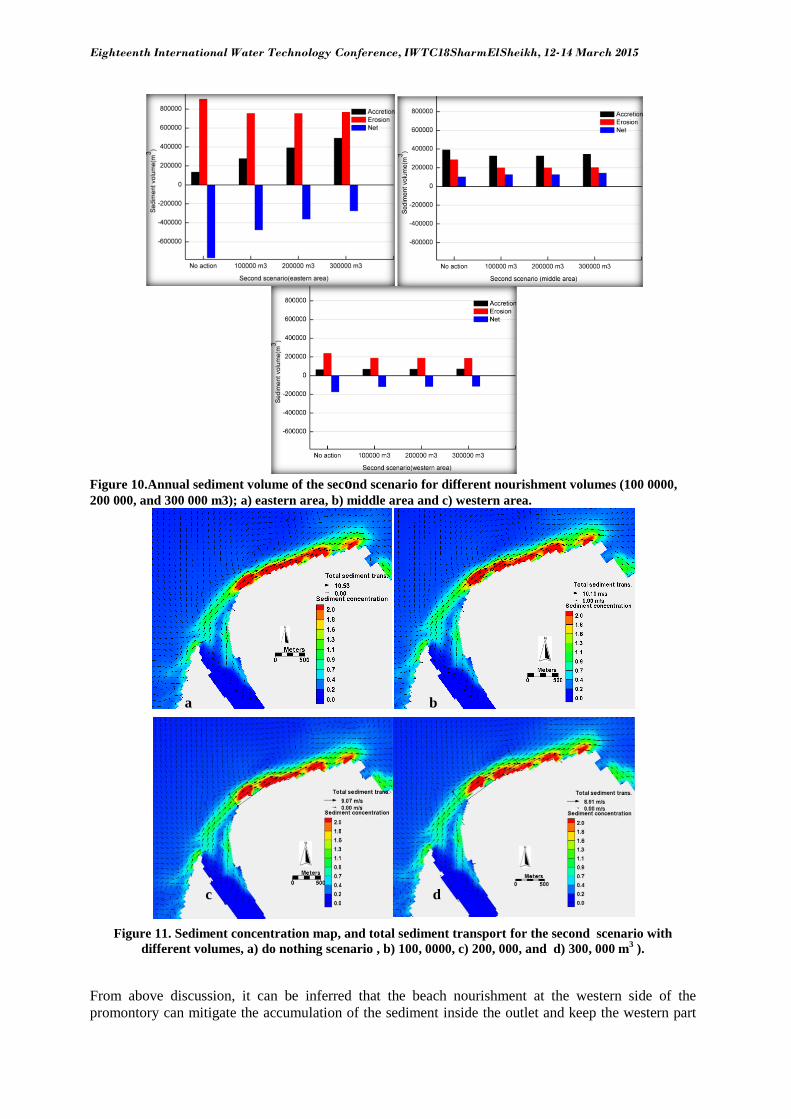
Figure 10.Annual sediment volume of the second scenario for different nourishment volumes (100 0000,
200 000, and 300 000 m3); a) eastern area, b) middle area and c) western area.
Figure 11. Sediment concentration map, and total sediment transport for the second scenario with
different volumes, a) do nothing scenario , b) 100, 0000, c) 200, 000, and d) 300, 000 m3 ).
From above discussion, it can be inferred that the beach nourishment at the western side of the
promontory can mitigate the accumulation of the sediment inside the outlet and keep the western part
a b
c d
Eighteenth International Water Technology Conference, IWTC18SharmElSheikh, 12-14 March 2015
of the outlet with suitable water depths for the navigation, "fig4-c". On the other hand, this scenario
shows a partial improvement regarding the erosion problem especially at the western side of the
promontory. For the second method of the near shore nourishment, the accumulation of the sediment
inside the outlet is continuous because the outlet is already exposed to the waves coming from NW
direction which generate strong eddy vortex inside the outlet that combined with the current diverted at
the nodal point towards the outlet. This eddy vortex pushes the sediment toward the outlet. In addition
to that, there is no significant effect on shoreline stability.
4 CONCLUSIONS AND RECOMMENDATION
Rosetta outlet experienced continuous erosion in front of the existing seawalls, and accretion inside
Rosetta outlet. To enhance the stability of the promontory, soft protection measures represented in sand
nourishment are proposed. Beach nourishment and nearshore nourishment are applied using a
calibrated Coastal Modeling System software. The sediment sizes are selected according to the
availability of the material, and the distance from the site. The suitable size based on the particle
tracking modeling is 0.32 mm come from El Khatatba 150 km south of the site.
For the two nourishment techniques, three scenarios were selected. For each scenario, three different
volumes are selected (100,000, 200,000, and 300,000 m3). For the beach nourishment technique, the
beach nourishment on the western headland decreases the accretion problem inside the outlet and
enhances the situation regarding the erosion problem particularly at the western side of the
promontory. The second technique of the nearshore nourishment has insignificant effect on the
promontory. This is due to hydrodynamic effect of the promontory with the revetment which transfers
the sediment outside the desired area.
Although, the beach nourishment shows a significant effect in mitigating the accretion problem and the
erosion one especially at the western side, but the eastern part of the promontory still suffer from
erosion. So, it is recommended to test a combination of two jetties which control the flow and sediment
from the outlet with beach nourishment east and west of the promontory to solve the erosion problem.
ACKNOWLEDGMENTS
The first author would like to thank Egyptian Ministry of Higher Education (MoHE) for granting
him the PhD scholarship. Appreciations also goes to Egypt-Japan University of Science and
Technology (E-JUST) and JICA for their support and for offering the tools needed for this research.
Sincere thanks are due to Dr. Lihwa Lin and Honghai Li, the developers of (CMS and PTM software),
Research Hydraulic Engineer, at Coastal and Hydraulics Laboratory, US Army Corps of Engineers for
their enormous and continuous technical support. All appreciation to Coastal Research Institute and
Hydraulic Research Institute for great support with field data. This work was partially supported by
JSPS "Core-to-Core Program, B.Asia-Africa Science Platforms".
REFERENCES
Castelle, B., Turner, I. L., Bertin, X., & Tomlinson, R. (2009). Beach nourishments at Coolangatta Bay over the
period 1987–2005: Impacts and lessons. Coastal Engineering, 56(9), 940–950.
doi:10.1016/j.coastaleng.2009.05.005
Charlier, R. H., Chaineux, M. C. P., & Morcos, S. (2005). Panorama of the history of coastal protection. Journal
of Coastal Research, 79–111.
Dean, R. G., & Yoo, C.-H. (1992). Beach-nourishment performance predictions. Journal of Waterway, Port,
Coastal, and Ocean Engineering, 118(6), 567–586.
Eighteenth International Water Technology Conference, IWTC18SharmElSheikh, 12-14 March 2015
Demirbilek, Z., Connell, K. J., MacDonald, N. J., & Zundel, A. K. (2008). Particle Tracking Model (PTM) in the
SMS 10: IV. Link to Coastal Modeling System.
Dewidar, K., & Frihy, O. E. (2008). Pre- and post-beach response to engineering hard structures using Landsat
time-series at the northwestern part of the Nile delta, Egypt. Journal of Coastal Conservation, 11(2), 133–
142. doi:10.1007/s11852-008-0013-z
El Sayed, W. R., Ali, M. A., Iskander, M. ., & Fanos, M. (2007). Evolution of Rosetta Promontory during the
Last 500 Years , Nile Delta Coast , Egypt. Proceedings of the Eight International Conference on the
Mediterranean Coastal Environment, MEDCOAST 07, Alexandria, Egypt, 1.
Elko, N. A., Holman, R. A., & Gelfenbaum, G. (2005a). Quantifying the rapid evolution of a nourishment project
with video imagery. Journal of Coastal Research, 633–645.
Elko, N. A., Holman, R. A., & Gelfenbaum, G. (2005b). Quantifying the rapid evolution of a nourishment project
with video imagery. Journal of Coastal Research, 633–645.
Frihy, O., & Dewidar, K. (2003). Patterns of erosion/sedimentation, heavy mineral concentration and grain size
to interpret boundaries of littoral sub-cells of the Nile Delta, Egypt. Marine Geology, 199(1-2), 27–43.
doi:10.1016/S0025-3227(03)00145-2
Hamm, L., Capobianco, M., Dette, H. H., Lechuga, A., Spanhoff, R., & Stive, M. J. F. (2002). A summary of
European experience with shore nourishment. Coastal Engineering, 47(2), 237–264.
Hanson, H., Brampton, A., Capobianco, M., Dette, H. H., Hamm, L., Laustrup, C., … Spanhoff, R. (2002). Beach
nourishment projects, practices, and objectives�a European overview. Coastal Engineering, 47(2), 81–
111.
Houston, J. R. (1996). Engineering practice for beach-fill design. Shore and Beach, 64, 26–35.
Kuroiwa, M., Shibutani, Y., Matsubara, Y., Kuchiishi, T., & Abualtyef, M. (2011). Numerical model of 3D
morphodynamic after offshore nourishment. Coastal Engineering Proceedings, 1(32), sediment–55.
Iskander M.M., 2010. "Environmental Friendly Methods for the Egyptian Coastal Protection." First international
conference on Coastal Zone management of River Deltas and Low Land Coastlines, Alexandria, Egypt, 6-
10 March 2010, pp. 625-642.
Li, F., Dyt, C., & Griffiths, C. (2006). Multigrain sedimentation/erosion model based on cross-shore equilibrium
sediment distribution: application to nourishment design. Estuarine, Coastal and Shelf Science, 67(4), 664–
672.
Lin, L., Li, H., Brown, M. E., Andes, L. C., Wu, F., & others. (2013). Numerical Modeling of Coastal Dredged
Material Placement Study at Noyo Harbor, CA. In The Twenty-third International Offshore and Polar
Engineering Conference.
Masria, A., Iskander, M., Negm, A., & Saavedra, O. (2014). The effect of potential discharges on the stability of
the Rosetta promontory, Egypt. In River Flow 2014 (pp. 1345–1353). CRC Press. doi:doi:10.1201/b17133-
179
Masria, A., Negm, A. M., Iskander, M. M., & Saavedra, O. C. (2013). Numerical Simulation of Constructing
Jetties to Stabilize Rosetta Inlet, Egypt. In Seventeenth International Water Technology Conference,
IWTC17 Istanbul, 5-7 November.
Masria, A., Negm, A. M., Iskander, M. M., & Saavedra, O. C. (2014a). Hydrodynamic modeling of outlet
stability case study Rosetta promontory in Nile delta. Water Science, 27(54), 39–47.
doi:10.1016/j.wsj.2013.12.004
Eighteenth International Water Technology Conference, IWTC18SharmElSheikh, 12-14 March 2015
Masria, A., Negm, A. M., Iskander, M. M., & Saavedra, O. C. (2014b). Numerical Investigation of the Impact of
Jetties on Accretion Problem at Rosetta Promontory , Egypt. International Journal of Environmental
Science and Development, 5(6). doi:10.7763/IJESD.2014.V5.536
Masria, A., Negm, A. M., Iskander, M. M., & Saavedra, O. C. (2014c). Numerical Modeling of Coastal
Nourishment at Rosetta Inlet, Egypt. International Water Technology Journal.
Shi, F., Cai, F., Kirby, J. T., & Zheng, J. (2013). Morphological modeling of a nourished bayside beach with a
low tide terrace. Coastal Engineering, 78, 23–34. doi:10.1016/j.coastaleng.2013.03.005
Spielmann, K., Certain, R., Astruc, D., & Barusseau, J.-P. (2011). Analysis of submerged bar nourishment
strategies in a wave-dominated environment using a 2DV process-based model. Coastal Engineering,
58(8), 767–778. doi:10.1016/j.coastaleng.2011.03.015
Stive, M. J. F., de Schipper, M. a., Luijendijk, A. P., Aarninkhof, S. G. J., van Gelder-Maas, C., van Thiel de
Vries, J. S. M., … Ranasinghe, R. (2013). A New Alternative to Saving Our Beaches from Sea-Level Rise:
The Sand Engine. Journal of Coastal Research, 290, 1001–1008. doi:10.2112/JCOASTRES-D-13-00070.1
Van Duin, M. J. P., Wiersma, N. R., Walstra, D. J. R., Van Rijn, L. C., & Stive, M. J. F. (2004). Nourishing the
shoreface: observations and hindcasting of the Egmond case, The Netherlands. Coastal Engineering, 51(8),
813–837.
Van Rijn, L. C. (2004). Estuarine and coastal sedimentation problems. In Proceedings of the Ninth International
Symposium on River Sedimentation (pp. 105–120).