Near-bottom current direction inferred from comatulid crinoid feeding postures on the Terre Adélie...
7
Near-bottom current direction inferred from comatulid crinoid feeding postures on the Terre Ade ´ lie and George V shelf, East Antarctica Marc Ele ´ aume a,n , Robin J. Beaman b , Huw J. Griffiths c , Ben Best d , Martin J. Riddle e , Victoria Wadley e , Stephen R. Rintoul f , Lenaı ¨g G. Hemery a , Nadia Ame ´ ziane a a Muse´um national d’Histoire naturelle, UMR BOREA, CNRS 7208, IRD 207, 43 rue Cuvier, 75005 Paris, France b School of Earth and Environmental Sciences, James Cook University, PO Box 6811, Cairns, Queensland 4870, Australia c British Antarctic Survey, Natural Environmental Research Council, High Cross, Madingley Road, Cambridge CB3 OET, United Kingdom d Marine Geospatial Ecology Laboratory, Lab 5, Rm 3b, Duke University Marine Laboratory, 135 Duke Marine Lab Road, Beaufort, NC 28516, USA e Australian Antarctic Division, Channel Highway, Kingston, Tasmania 7050, Australia f CSIRO Wealth from Oceans National Research Flagship and Antarctic Climate and Ecosystem Cooperative Research Centre, Centre for Australian Weather and Climate Research—A Partnership between CSIRO and the Bureau of Meteorology, Hobart, Tasmania 7000, Australia article info Article history: Received 15 May 2010 Accepted 15 May 2010 Available online 1 June 2010 Keywords: Comatulid Near-bottom current Antarctica Terre Ade ´ lie abstract For the first time, comatulid crinoid feeding behaviour is used to infer near-bottom current (NBC) directions on the Terre Ade ´lie and George V shelf, East Antarctica. We analysed 47 still-image and video transects sampled during the Collaborative East Antarctic Marine Census (CEAMARC) expedition in 2007–2008. We recorded the inferred current direction from 1537 comatulid observations and interpolated these data across the shelf using the Natural Neighbour Interpolation (NNI) method. Results revealed a mode current directionality at each station and a close local agreement between the observed and interpolated NBC directions. The interpolated NBC directions show a coherent counter-clockwise gyre in the deep George V Basin, with a northward and westward flow over the northern flank of the basin and eastward flow near the coast, consistent with the distribution of bottom salinity. There also appears to be a clockwise gyre on the relatively shallow Ade ´ lie Bank, with an easterly or southeasterly flow along the outer-shelf, south and southwesterly on the east Ade ´ lie Bank, and westerly along the Terre Ade ´ lie coast. & 2010 Elsevier Ltd. All rights reserved. 1. Introduction The Antarctic shelf benthic communities are characterised by multi-storey suspension-feeder assemblages (Gili et al., 2006) that exploit suspended particles as a potential food source (Gili and Coma, 1998) using a variety of mechanisms, all of which depend on the motility of particles and the current flow regime (Rubenstein and Koehl, 1977). Near-bottom currents (NBCs) are therefore essential to benthic organisms in order to feed, as well as to reproduce and disperse. Knowing the direction and speed of NBC is a basic requirement for understanding the dynamics of Antarctic benthic populations. For example, the importance of larval transport and survival in determining the dynamics of fish and invertebrate populations dates back to the seminal ideas of Hjort (1926) and Thorson (1946). More recently, increasing anthropogenic influence on ecosystems has made it critical to understand which populations act as sources and which act as sinks, and how sites are connected by larval exchange as well as by sperm dispersal, and post-larval dispersal (by drifting, rafting, dislodgement), or adult migrations (Havenhand, 1995; Levin, 2006). In the case of sperm, larvae, post-larvae and some adults, dispersal is directly effected by water-borne transport (Largier, 2003). In Antarctica, some benthic organisms produce buoyant gametes or larvae (McClintock and Pearse, 1987) that depend on surface currents to disperse, while others produce benthic gametes or larvae that depend on NBC velocity to disperse (Pearse et al., 1991). Therefore, knowledge of ocean dispersal mechanisms, water movement rates and directions can contribute to: (1) determining the optimal size, configuration, and location of marine protected areas (MPAs; e.g., Planes et al., 2009); (2) understanding and control of the spread of invasive species (e.g., Viard et al., 2006; Dupont et al., 2007); and (3) predicting the effects of climate change (e.g., Ayres and Hughes, 2004; Largier, 2003; Levin, 2006). Knowledge of the NBC is also useful for physical oceanographic studies over the Antarctic shelf, where it is difficult to determine a sensible reference depth for geostrophic velocity calculations (Bindoff et al., 2000). Four comatulid species, Promachocrinus kerguelensis Carpenter, 1888, Anthometra adriani (Bell, 1908), Florometra mawsoni A.H. Clark, 1937 and Notocrinus virilis Mortensen, 1917, are very abundant on the Antarctic shelf (Ele ´ aume, 2006) and in the study area Contents lists available at ScienceDirect journal homepage: www.elsevier.com/locate/dsr2 Deep-Sea Research II 0967-0645/$ - see front matter & 2010 Elsevier Ltd. All rights reserved. doi:10.1016/j.dsr2.2010.05.023 n Corresponding author. E-mail address: [email protected] (M. Ele ´ aume). Deep-Sea Research II 58 (2011) 163–169
Transcript of Near-bottom current direction inferred from comatulid crinoid feeding postures on the Terre Adélie...
Deep-Sea Research II 58 (2011) 163–169
Contents lists available at ScienceDirect
Deep-Sea Research II
0967-06
doi:10.1
n Corr
E-m
journal homepage: www.elsevier.com/locate/dsr2
Near-bottom current direction inferred from comatulid crinoid feedingpostures on the Terre Adelie and George V shelf, East Antarctica
Marc Eleaume a,n, Robin J. Beaman b, Huw J. Griffiths c, Ben Best d, Martin J. Riddle e,Victoria Wadley e, Stephen R. Rintoul f, Lenaıg G. Hemery a, Nadia Ameziane a
a Museum national d’Histoire naturelle, UMR BOREA, CNRS 7208, IRD 207, 43 rue Cuvier, 75005 Paris, Franceb School of Earth and Environmental Sciences, James Cook University, PO Box 6811, Cairns, Queensland 4870, Australiac British Antarctic Survey, Natural Environmental Research Council, High Cross, Madingley Road, Cambridge CB3 OET, United Kingdomd Marine Geospatial Ecology Laboratory, Lab 5, Rm 3b, Duke University Marine Laboratory, 135 Duke Marine Lab Road, Beaufort, NC 28516, USAe Australian Antarctic Division, Channel Highway, Kingston, Tasmania 7050, Australiaf CSIRO Wealth from Oceans National Research Flagship and Antarctic Climate and Ecosystem Cooperative Research Centre, Centre for Australian Weather and
Climate Research—A Partnership between CSIRO and the Bureau of Meteorology, Hobart, Tasmania 7000, Australia
a r t i c l e i n f o
Article history:
Received 15 May 2010
Accepted 15 May 2010Available online 1 June 2010
Keywords:
Comatulid
Near-bottom current
Antarctica
Terre Adelie
45/$ - see front matter & 2010 Elsevier Ltd. A
016/j.dsr2.2010.05.023
esponding author.
ail address: [email protected] (M. Eleaume).
a b s t r a c t
For the first time, comatulid crinoid feeding behaviour is used to infer near-bottom current (NBC)
directions on the Terre Adelie and George V shelf, East Antarctica. We analysed 47 still-image and video
transects sampled during the Collaborative East Antarctic Marine Census (CEAMARC) expedition in
2007–2008. We recorded the inferred current direction from 1537 comatulid observations and interpolated
these data across the shelf using the Natural Neighbour Interpolation (NNI) method. Results revealed a
mode current directionality at each station and a close local agreement between the observed and
interpolated NBC directions. The interpolated NBC directions show a coherent counter-clockwise gyre in
the deep George V Basin, with a northward and westward flow over the northern flank of the basin and
eastward flow near the coast, consistent with the distribution of bottom salinity. There also appears to be a
clockwise gyre on the relatively shallow Adelie Bank, with an easterly or southeasterly flow along the
outer-shelf, south and southwesterly on the east Adelie Bank, and westerly along the Terre Adelie coast.
& 2010 Elsevier Ltd. All rights reserved.
1. Introduction
The Antarctic shelf benthic communities are characterised bymulti-storey suspension-feeder assemblages (Gili et al., 2006)that exploit suspended particles as a potential food source (Giliand Coma, 1998) using a variety of mechanisms, all of whichdepend on the motility of particles and the current flow regime(Rubenstein and Koehl, 1977). Near-bottom currents (NBCs) aretherefore essential to benthic organisms in order to feed, as wellas to reproduce and disperse.
Knowing the direction and speed of NBC is a basic requirementfor understanding the dynamics of Antarctic benthic populations.For example, the importance of larval transport and survival indetermining the dynamics of fish and invertebrate populationsdates back to the seminal ideas of Hjort (1926) and Thorson(1946). More recently, increasing anthropogenic influence onecosystems has made it critical to understand which populationsact as sources and which act as sinks, and how sites are connectedby larval exchange as well as by sperm dispersal, and post-larval
ll rights reserved.
dispersal (by drifting, rafting, dislodgement), or adult migrations(Havenhand, 1995; Levin, 2006).
In the case of sperm, larvae, post-larvae and some adults,dispersal is directly effected by water-borne transport (Largier,2003). In Antarctica, some benthic organisms produce buoyantgametes or larvae (McClintock and Pearse, 1987) that depend onsurface currents to disperse, while others produce benthicgametes or larvae that depend on NBC velocity to disperse(Pearse et al., 1991). Therefore, knowledge of ocean dispersalmechanisms, water movement rates and directions can contributeto: (1) determining the optimal size, configuration, and location ofmarine protected areas (MPAs; e.g., Planes et al., 2009);(2) understanding and control of the spread of invasive species(e.g., Viard et al., 2006; Dupont et al., 2007); and (3) predicting theeffects of climate change (e.g., Ayres and Hughes, 2004; Largier,2003; Levin, 2006). Knowledge of the NBC is also useful forphysical oceanographic studies over the Antarctic shelf, where itis difficult to determine a sensible reference depth for geostrophicvelocity calculations (Bindoff et al., 2000).
Four comatulid species, Promachocrinus kerguelensis Carpenter,1888, Anthometra adriani (Bell, 1908), Florometra mawsoni A.H. Clark,1937 and Notocrinus virilis Mortensen, 1917, are very abundanton the Antarctic shelf (Eleaume, 2006) and in the study area
M. Eleaume et al. / Deep-Sea Research II 58 (2011) 163–169164
(Eleaume et al., unpublished data). These four species, like manycomatulids (Macurda and Meyer, 1974), form a filtration fan to feedand seek moderately strong current flow in order to settle (Eleaume,2006; Eleaume, unpublished data). Optimal current speeds requiredby the reef-dwelling comatulid Oligometra serripinna (Carpenter,1881) have been estimated at 6 cm s�1 (Leonard et al., 1988), butMeyer (1997) found that this value may vary among species. Thepresence of these species alone is therefore indicative of a moderatecurrent flow; however, behavioural observations (Meyer, 1973;Macurda and Meyer, 1974; Meyer and Macurda, 1980) and tube-foot measurements (Meyer, 1979) are required to determine anycurrent direction and speed data.
Detailed observations of comatulid behaviour by scuba divingand from submersibles have shown that rheophilic species tend toarrange their arms in a fan perpendicular to the main current flowdirection with the food groove facing downcurrent (Meyer andMacurda, 1980). We propose that these feeding characteristicscan be used to infer NBC direction on the East Antarctic shelf. Theextensive video, still images, and CTD datasets collected duringthe Census of Antarctic Marine Life (CAML) Collaborative EastAntarctic Marine Census (CEAMARC) survey (December2007–January 2008) on the Terre Adelie and George V shelf,provide an opportunity to infer NBC directions using comatulidcrinoid feeding behaviour and to compare these results againstexisting knowledge of the current regime on the shelf.
2. Materials and methods
2.1. NBC direction
Near-bottom current (NBC) direction data were derived fromcomatulid feeding behaviour observations. During feeding, the
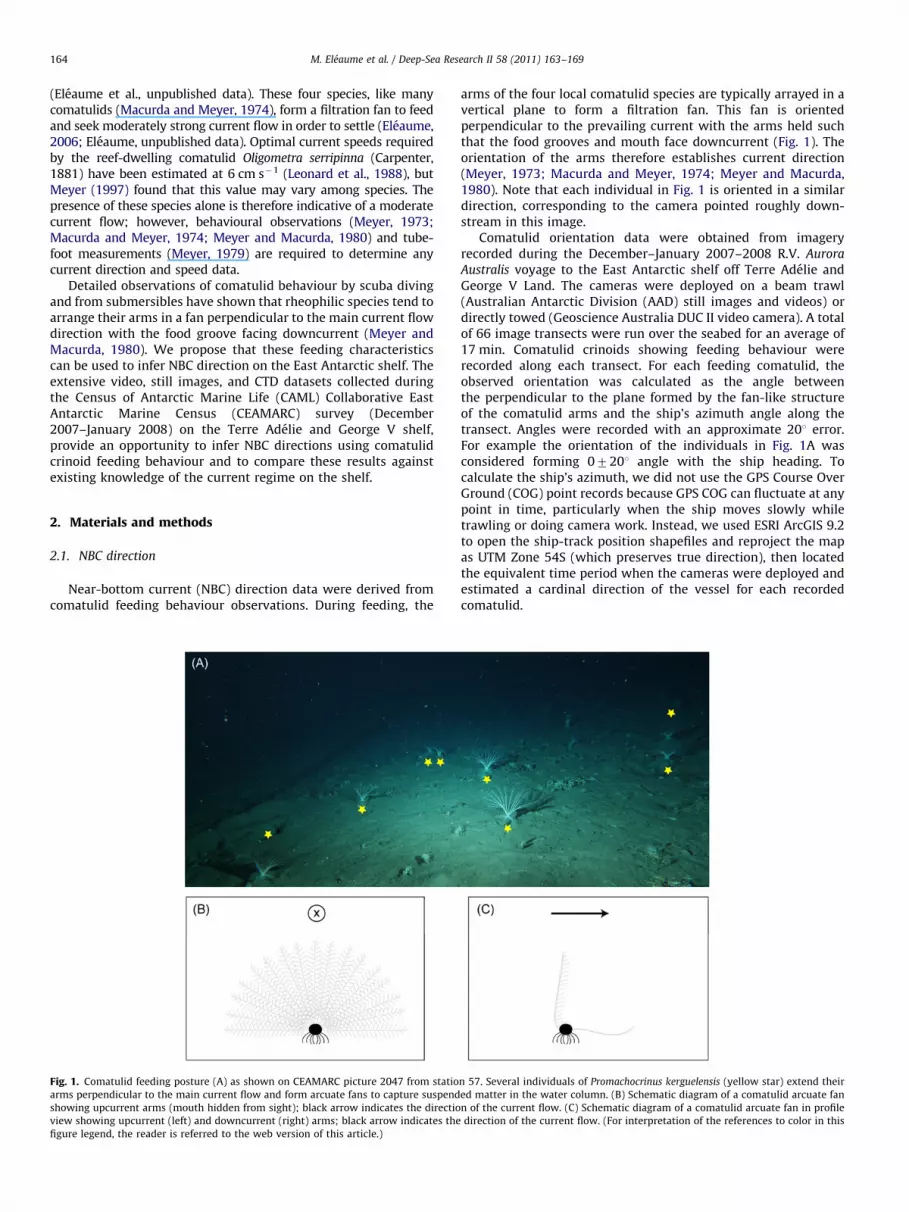
Fig. 1. Comatulid feeding posture (A) as shown on CEAMARC picture 2047 from statio
arms perpendicular to the main current flow and form arcuate fans to capture suspend
showing upcurrent arms (mouth hidden from sight); black arrow indicates the directio
view showing upcurrent (left) and downcurrent (right) arms; black arrow indicates the
figure legend, the reader is referred to the web version of this article.)
arms of the four local comatulid species are typically arrayed in avertical plane to form a filtration fan. This fan is orientedperpendicular to the prevailing current with the arms held suchthat the food grooves and mouth face downcurrent (Fig. 1). Theorientation of the arms therefore establishes current direction(Meyer, 1973; Macurda and Meyer, 1974; Meyer and Macurda,1980). Note that each individual in Fig. 1 is oriented in a similardirection, corresponding to the camera pointed roughly down-stream in this image.
Comatulid orientation data were obtained from imageryrecorded during the December–January 2007–2008 R.V. Aurora
Australis voyage to the East Antarctic shelf off Terre Adelie andGeorge V Land. The cameras were deployed on a beam trawl(Australian Antarctic Division (AAD) still images and videos) ordirectly towed (Geoscience Australia DUC II video camera). A totalof 66 image transects were run over the seabed for an average of17 min. Comatulid crinoids showing feeding behaviour wererecorded along each transect. For each feeding comatulid, theobserved orientation was calculated as the angle betweenthe perpendicular to the plane formed by the fan-like structureof the comatulid arms and the ship’s azimuth angle along thetransect. Angles were recorded with an approximate 201 error.For example the orientation of the individuals in Fig. 1A wasconsidered forming 07201 angle with the ship heading. Tocalculate the ship’s azimuth, we did not use the GPS Course OverGround (COG) point records because GPS COG can fluctuate at anypoint in time, particularly when the ship moves slowly whiletrawling or doing camera work. Instead, we used ESRI ArcGIS 9.2to open the ship-track position shapefiles and reproject the mapas UTM Zone 54S (which preserves true direction), then locatedthe equivalent time period when the cameras were deployed andestimated a cardinal direction of the vessel for each recordedcomatulid.
n 57. Several individuals of Promachocrinus kerguelensis (yellow star) extend their
ed matter in the water column. (B) Schematic diagram of a comatulid arcuate fan
n of the current flow. (C) Schematic diagram of a comatulid arcuate fan in profile
direction of the current flow. (For interpretation of the references to color in this

M. Eleaume et al. / Deep-Sea Research II 58 (2011) 163–169 165
2.2. Data analysis and directionality
Statistical calculations were considered meaningless for no6(Durand and Greenwood, 1958). As a consequence, descriptivestatistics and tests were not computed for 14 stations which hadcomatulid observations o6 (Table 1). Instead, comatulidorientation distributions were graphically explored in a map. Allcircular statistics (Table 1) and graph visualisation wereperformed using Oriana v. 3.0 (Kovach Computing Services,2009). Descriptive statistics (i.e. mean current direction, lengthof mean vector, variance and standard deviation) were calculatedwith Oriana software. Comatulid orientations were exploredgraphically using rose diagrams (Guerry, 1829) for directionalitytrends. In addition Rayleigh’s Uniformity (Fisher, 1993; Zar, 1998;Mardia and Jupp, 2000) and Rao’s Spacing (Mardia and Jupp,2000; Batschelet, 1981) tests were performed to calculate theprobability that the data were distributed in a uniform manner(¼null hypothesis). Rayleigh’s Uniformity test looks at the
Table 1Near-bottom currents descriptive statistics.
Station n m r Var Stdev Z
1 1 – – – – –
2 19 55 0.94 0.06 19.53 16.92
3 2 – – – – –
5 3 – – – – –
8 30 290 0.94 0.06 19.71 26.65
9 3 – – – – –
10 11 298 0.87 0.13 30.15 8.34
12 107 17 0.73 0.27 45.28 57.31
13 21 270 0.91 0.09 25.20 17.31
14 103 223 0.98 0.02 12.53 98.19
16 127 47 0.99 0.01 7.66 124.75
17 10 222 0.98 0.02 12.18 9.56
18 20 224 0.98 0.02 12.18 19.12
20 1 – – – – –
21 24 40 0.98 0.03 12.77 22.84
22 8 294 1.00 0.00 1.73 7.99
26 38 31 0.73 0.28 45.96 19.97
29 3 – – – – –
31 73 345 0.95 0.05 17.82 66.27
34 16 325 0.88 0.12 28.57 12.48
35 90 226 0.98 0.02 11.29 86.57
36 44 352 0.94 0.07 20.98 38.48
40 10 288 0.98 0.02 11.54 9.60
42 3 – – – – –
43 1 – – – – –
45 49 117 0.87 0.13 30.33 37.03
48 12 178 1.00 – – 12.00
49 2 – – – – –
50 150 153 0.90 0.10 26.27 121.57
51 14 333 0.98 0.02 11.68 13.43
52 12 299 0.59 0.41 58.48 4.23
53 7 242 0.97 0.03 14.03 6.59
54 25 312 0.99 0.01 9.59 24.31
55 1 – – – – –
57 60 285 0.97 0.04 15.38 55.83
61 1 – – – – –
62 53 245 0.98 0.02 12.10 50.69
63 120 358 0.96 0.04 16.73 110.19
66 1 – – – – –
67 4 – – – – –
69 31 111 0.90 0.10 26.86 24.88
71 10 265 0.96 0.04 15.45 9.30
72 87 276 0.98 0.02 10.51 84.12
73 6 345 0.98 0.02 10.39 5.81
79 111 36 0.97 0.03 13.97 104.60
80 3 – – – – –
86 10 82 0.95 0.05 18.37 9.02
n¼number of observations; m¼mean angle in degrees; r¼ length of mean vector; var¼c
p(Z)¼probability of Rayleigh’s Uniformity Test; U¼Rao’s Spacing Test; p(U)¼probabi
�¼not calculated.
concentration of the data around the mean and Rao’s Spacingtest examines whether the spacing between adjacentobservations is roughly equal around a circle. Mode directions,i.e. the values that occur the most frequently in the dataset, werecalculated using the R (R Development Core Team, 2009) functionmfv from the package ‘modeest’ (Poncet, 2009). All observedcomatulid orientations for sampled stations were projected onto amap using ArcGIS, and the distributions of directions at eachtransect were visually examined across the study area.
2.3. Georeferencing of imagery
Comatulid orientations collected from the AAD still imageswere time referenced (UTC date and time) using the metadataembedded within each image. Comatulid orientations collectedfrom the Geoscience Australia videos were time referenced usingthe time code stamp recorded over the image. Due to the video
p(Z) U p(U) m1 m2 m3
– – – 186 – –
50.05 284.21 o0.05 41 – –
– – – 114 135 –
– – – 273 330 342
50.05 291.00 o0.05 288 – –
– – – 262 – –
50.05 227.55 o0.05 290 – –
50.05 339.81 o0.05 356 – –
50.05 277.43 o0.05 260 – –
50.05 339.03 o0.05 224 – –
50.05 351.50 o0.05 49 – –
50.05 279.00 o0.05 220 – –
50.05 306.00 o0.05 222 – –
– – – 140 – –
50.05 307.00 o0.05 49 – –
50.05 311.00 o0.05 293 – –
50.05 292.63 o0.05 25 – –
– – – 226 – –
50.05 320.55 o0.05 342 – –
50.05 267.50 o0.05 335 – –
50.05 333.00 o0.05 218 – –
50.05 282.09 o0.05 2 – –
50.05 301.00 o0.05 276 299 –
– – – 143 – –
– – – 119 – –
50.05 315.92 o0.05 112 – –
50.05 330.00 o0.05 178 – –
– – – 290 – –
50.05 277.00 o0.05 185 – –
50.05 289.29 o0.05 336 – –
0.011 225.00 o0.05 257 325 –
50.05 264.57 o0.05 245 – –
50.05 316.80 o0.05 315 – –
– – – 337 – –
50.05 336.00 o0.05 291 – –
– – – 310 – –
50.05 332.83 o0.05 238 – –
50.05 342.00 o0.05 4 – –
– – – 135 – –
– – – 278 – –
50.05 281.94 o0.05 90 – –
50.05 280.00 o0.05 263 – –
50.05 347.59 o0.05 270 – –
50.05 278.00 o0.05 352 – –
50.05 347.03 o0.05 48 – –
– – – 134 – –
50.05 288.00 o0.05 91 – –
ircular variance; stdev¼circular standard deviation; Z¼Rayleigh’s Uniformity Test;
lity of Rao’s Spacing Test; m1–3¼most frequently recorded NBC direction angle;

M. Eleaume et al. / Deep-Sea Research II 58 (2011) 163–169166
configuration, the AAD videos had no associated time code butwere switched on at about the start of each trawling event.Comatulid orientations collected from the AAD videos weretherefore time referenced as the elapsed time from event starttime (beginning of trawling operation). The elapsed time wascalculated using VLC Media Player v0.9.9 (VLC Media Player,2009). Thus, comatulid orientations were georeferenced bymatching the recorded time reference with the correspondingtime within the ship-track underway data file.
2.4. Interpolation of the comatulid orientations
Maximum spatial resolution was estimated using the averagenearest neighbour value as implemented in ArcGIS SpatialStatistics Tools and used as the cell size for interpolation. Alldata points sampled from all stations were included to account forlocal variation of comatulid orientation along the transects.
The interpolated current direction method used NaturalNeighbour Interpolation (NNI) (Sibson, 1980, 1981) as implemen-ted in ArcGIS Spatial Analyst. NNI is a weighted moving averagemethod that uses geometric relationships in order to choose andweight nearby points. It uses natural neighbour coordinates basedon the Voronoi tessellation of a set of sites. The advantages are thatit is local, non-parametric and assumes no special properties of thedata. Coincident measures of comatulid orientations were replacedby the mean. For visualisation, the NNI raster was resampled withcell size¼0.08 decimal degrees. The resampled raster dataset wasthen converted to a point shapefile using ArcGIS Conversion Tools.The interpolated and resampled comatulid orientations were thenprojected as arrows on a map for visualisation.
3. Results
Forty-seven of the 66 stations (20 still-image and 27 videotransects; Table 1) yielded comatulid orientation data. These
Fig. 2. Map of the study area off Terre Adelie and George V Land shelf, east Antarctic
bathymetric model (Beaman, 2008), and (B) the interpolated NBC inferred from comat
triangles indicate the position of the stations and white numerals are the CEAMARC s
station. The black arrows indicate the interpolated NBC directions resulting from the N
orientation observations form a regular grid over the CEAMARCstudy area (Fig. 2A). Depths range from 140 to 1960 m andtopographic features include the shelf break, the George V Basin,the Adelie Bank and the Adelie Basin (Fig. 2A). A total of 1537observations are included and analysed. The number ofindividuals observed per station varies from 1 to 150 (Table 1)depending on the presence of comatulids, the imagery quality,and the length of transects.
Rayleigh’s Uniformity test shows that the null hypothesis(i.e. the data is distributed in a uniform manner) should berejected at a significance level of 0.05 in all cases except station 52(U¼4.23, p(U)¼0.011). Rao’s Spacing test shows that the nullhypothesis of uniformity should be rejected at a significance levelof 0.05 in all cases, also including station 52 (Table 1).
Most stations display a single mode or dominant currentdirection (Fig. 3A). Only stations 3, 5, 40 and 52 display more thanone mode (Fig. 3B). Graphical exploration using rose diagramsshows that stations 12, 26 and 52 display frequent comatulidorientations other than the modes (Fig. 3B–D). However,exploration of the projected comatulid orientations on a mapshows that variation in direction is generally uniformlydistributed along all transects, including stations 12, 26 and 52(Fig. 4A–D).
The average nearest neighbour value is 0.001684 decimaldegrees. The NNI process generates a raster grid file coverage overthe full geographic extent of the input data. The interpolatedcomatulid orientation values span the input data range (min¼61,max¼3571). When projected on a map together (Fig. 2B), theinterpolated comatulid orientation values generally visually agreewith the comatulid orientation mode values (Table 1, m1). Onlystations 10, 26, 34, 36 and 45 show divergent directions.
Interpolated comatulid orientations show an eastward currentflow following the slope break, starting from station 86 in the farwest of the study area and deviating at station 80 to asoutheastward direction over the Adelie Bank (Fig. 2B). In theGeorge V Basin, a westward current appears to flow from stations
a, showing (A) the sampled stations and major geographic features over a recent
ulid orientations over the bottom salinity field (Beaman, unpublished). The white
tation numbers. The white arrows indicate the modal direction for each sampled
atural Neighbour Interpolation.

Fig. 3. Rose diagrams showing variability in directionality of comatulid orientation and near-bottom current (NBC) (A) for unimodal station 16, (B) bimodal station 52,
(C) station 12 with frequent comatulid orientations other than the mode, and (D) station 26 with frequent comatulid orientations other than the mode. Black sectors
illustrate distribution frequency of the NBC directions. Their width is defined by the limits of the classes, and their height is determined by the frequency in each given
interval.
Fig. 4. Comatulid orientations along stations (A) 52, (B) 26, (C) 12, and (D) 16. The white arrows indicate each observed comatulid orientation along a given transect.
M. Eleaume et al. / Deep-Sea Research II 58 (2011) 163–169 167
M. Eleaume et al. / Deep-Sea Research II 58 (2011) 163–169168
near the Mertz Glacier then deviates southwestward at stations63 and 67 on the shelf break into the deeper part of the basin.The current direction is northwestward at stations 50 and 51 onthe edge of the Mertz Bank and along the shelf break to station54. The generally westward flow deviates south at stations 49, 48,45, 43 and 40 in the relatively shallow coastal zone on the GeorgeV shelf. The generally westward current on the inner-shelfcontinues to flow along the Terre Adelie coast between stations8, 9 and 12 on the Adelie Bank. In the deep Adelie Basin at the farwest of the study area, comatulid orientation trends are not soobvious, with stations 71, 16, 18, 22 recording widely varyingdirections.
Overall, there appears to be a clockwise gyre existing on therelatively shallow Adelie Bank. Along the outer-shelf, current flowis easterly or southeasterly flowing, then flows south andsouthwesterly on the east Adelie Bank and westerly along theTerre Adelie coast. Within the deeper George V Basin, there alsoappears to be a counter-clockwise gyre with a northwesterly towesterly flow on the outer-shelf, a southwesterly current towardsthe deeper basin and a southerly to easterly flow along theshallow George V coast.
4. Discussion
Comatulid orientations are interpreted as reflecting near-bottomcurrent direction (NBC). The dataset records strong currentdirectionality throughout. Almost all stations with a sufficientnumber of observations show a unique modal NBC direction. In8.5% of the stations, multimodal directionality is found. But suchvariations may have multiple explanations. Variations in fanorientation (or the lack of a fan posture) might derive fromrepletion, recent movement, disturbance, injury or disease. Localtopographic features may locally change the main NBC flow as isthe case for station 52 near the Mertz Bank, where the seabedappears particularly rough. Some comatulids, apparently onlyPromachocrinus kerguelensis (sensu lato as in Clark and Clark(1967), not as in Wilson et al. (2007) or Hemery and Eleaume,unpublished data), reacted to the approaching trawl by swimmingactively away or changing the fan-like position of their arms.However, swimming individuals were not included in the dataset;only individuals displaying a clear feeding behaviour wererecorded. Examination of the distribution of the individual NBCdirections along each transect on a map determined that changesin directionality in these 8.5% of the stations were randomlydistributed and did not form clear clusters, suggesting thatrandom behaviour or local environmental differences such aslocal current eddies were responsible for multimodal or highlyvariable NBC directions distribution.
Current flow over the George V and Terre Adelie is stronglyinfluenced by bathymetry (Fig. 2A, B). The mapped current fieldshows a gyre filling the George V Basin, with a generallywestward flow on the northern side of the depression and aneastward flow along the coast. The inferred gyre is broadlyconsistent with salinity gradients on the seafloor, which showshigh-salinity values over the northern flank and in the deeperparts of the basin. These high-salinity waters are produced inpolynias near the Mertz Glacier (Williams and Bindoff, 2003) andare expected to be advected away from the Mertz Glacier,consistent with the NBC direction inferred from comatulidorientations. In the deep Adelie Basin in the western part of thesurvey area, the current directions are more variable, perhapsreflecting a dominance of variable tidal motions over a weakmean flow. Video observation and sediment sample analysis(Post et al., 2011) indicate that most stations in the Adelie Basin
area (e.g., stations 71, 16, 18, 22) showed significant accumula-tions of siliceous mud and ooze, indicating weak current speeds.
On the relatively shallow, flat-topped Adelie Bank, currents onthe shelf break are likely influenced by the Circumpolar DeepWater that flows easterly and advects onto the outer-shelf.Sediment samples along the outer-shelf were gravelly sands togravelly muddy sands, indicating stronger current energy. Theseshallow bank waters are also likely influenced by the East WindDrift, a coastal current on the Antarctic shelf that is driven bystrong coastal winds from the east. The East Wind Drift may beresponsible for the apparent southerly deviation of the NBC onthe eastern Adelie Bank towards the land, then westerly along theTerre Adelie coast.
A near-bottom clockwise gyre on the Adelie Bank adjacent to acounter-clockwise gyre in the George V Basin could act as anecological barrier and reduce population connectivity betweenbrooding species (e.g., the isopod crustaceans Glyptonotus spp.,sea urchins Sterechinus spp., and comatulids Isometra spp. andNotocrinus spp.) or between species with benthic larvae. Hemeryet al. (2009) have suggested that, in the Alboran Sea (westernMediterranean), two adjacent gyres, a western clockwise gyre andan eastern counter-clockwise gyre, act as ecological barrier tocomatulid larval dispersal. As a result, isolated populations havediverged and speciation has occurred between Antedon bifida andAntedon mediterranea. Further studies using molecular markerswill be necessary to test the population connectivity of broodingspecies between the Adelie Bank and the George V Basin.
5. Conclusion
Comatulid crinoids are good local current direction indicators.By combining numerous observations over a broad geographicarea, broader-scale current patterns can be revealed where thespatial sampling is sufficient to resolve the flow trends. Inferringcurrent directions from measurements of water density proper-ties and geostrophic flow relationships is difficult over theAntarctic continental shelf because there is no clear choice ofreference depth. The NBC directions inferred by comatulid crinoidfeeding behaviour can help constrain circulation directionestimates on the Antarctic shelf.
Acknowledgments
We thank the ANTFLOCKS project funded by the FrenchNational Research Agency (‘‘ANR’’; USAR no. 07-BLAN-0213-01).Funding parties also include the Departement des Milieux etPeuplements Aquatiques at the Museum national d’Histoirenaturelle in Paris (BQR), the French Polar Institute IPEV, and theSCAR. The R.V. Aurora Australis V3 voyage 2007–2008 was part ofthe CEAMARC (Collaborative East Antarctic Marine Census)program, International Polar Year (IPY) project 53 of the Censusof Antarctic Marine Life (CAML). This work was partly developedat the Polar Synthesis Macroscope held in Villefranche/Mer inMay 2009. Special thanks are due to Philippe Koubbi whoorganised this workshop. We thank the two reviewers, CharlesMessing and Tomasz Baumiller, for improving the paper. This isCAML contribution #43.
References
Ayre, D.J., Hughes, T.P., 2004. Climate change, genotypic diversity and gene flow inreefbuilding corals. Ecology Letters 7, 273–278.
Batschelet, E., 1981. Circular Statistics in Biology. Academic Press, London.Beaman, R.J., 2008. A bathymetric Digital Elevation Model (DEM) of the George V
and Terre Adelie continental shelf and margin. CAASM /http://gcmd.nasa.gov/

M. Eleaume et al. / Deep-Sea Research II 58 (2011) 163–169 169
KeywordSearch/Home.do?Portal=amd_au&MetadataType=0S [Data Set TextSearch¼GVdem_2008].
Bindoff, N.L., Rosenberg, M.A., Warner, M.J., 2000. On the circulation and watermasses over the Antarctic continental slope and rise between 80 and 1501E.Deep-Sea Research II 47, 2299–2326.
Clark, A.H., Clark, A.M., 1967. A monograph on the existing crinoids, vol. 1. Thecomatulids. Part 5—Suborders Oligophreata (concluded) and Macrophreata.Bulletin of the United States National Museum 82, 1–860.
Dupont, L., Ellien, C., Viard, F., 2007. Limits to gene flow in the slipper limpetCrepidula fornicata as revealed by microsatellite data and a larval dispersalmodel. Marine Ecology Progress Series 348, 125–138.
Durand, D., Greenwood, J.A., 1958. Modifications of the Rayleigh test foruniformity in analysis of two-dimensional orientation data. The Journal ofGeology 66 (3), 229–238.
Eleaume, M., 2006. Approche morphometrique de la variabilite phenotypique:consequences systematiques et evolutives. Application aux crinoıdes actuels(Crinoidea: Echinodermata). Ph.D. Thesis, Museum national d’Histoire natur-elle, Paris, unpublished.
Fisher, N.I., 1993. Statistical Analysis of Circular Data. Cambridge University Press,Cambridge.
Gili, J.-M., Coma, R., 1998. Benthic suspension feeders: their paramount role inlittoral marine food webs. Trends in Ecology and Evolution 13 (8), 316–321.
Gili, J.-M., Arntz, W.E., Palanques, A., Orejas, C., Clarke, A., Dayton, P.K., Isla, E.,Teixido, N., Rossi, S., Lopez-Gonzalez, P.J., 2006. A unique assemblage ofepibenthic sessile suspension feeders with archaic features in the high-Antarctic. Deep-Sea Research II 53 (8–10), 1029–1052.
Guerry, A.-M., 1829. Memoire sur les variations meterologiques comparees auxphenom�enes physiologiques. Annales d’Hygi�ene Publique et de MedecineLegal 1, 228.
Havenhand, J.N., 1995. Evolutionary ecology of larval types. In: McEdward, L.R. (Ed.),Ecology of Marine Invertebrate Larvae. CRC Press, Boca Raton, FL, pp. 79–122.
Hemery, L., Eleaume, M., Chevaldonne, P., Dettaı, A., Ameziane N., 2009. The genusAntedon (Crinoidea: Echinodermata): an example of evolution throughvicariance. In: 13th International Echinoderm Conference University ofTasmania, Australia, 5–9 January 2009.
Hjort, J., 1926. Fluctuations in the year classes of important food fishes. Journal duConseil 1, 5–38.
Kovach, W.L., 2009. Oriana. Kovach Computing Services. Anglesey, Wales, UnitedKingdom.
Largier, J.L., 2003. Considerations in estimating larval dispersal distancesfromoceanographic data. Ecological Applications 13 (1, Suppl.), S71–S89.
Leonard, A.B., Strickler, J.R., Holland, N.D., 1988. Effects of current speed onfiltration during suspension feeding in Oligometra serripinna (Echinodermata:Crinoidea). Marine Biology 97, 111–125.
Levin, L.A., 2006. Recent progress in understanding larval dispersal: new directionsand digressions. Integrative and Comparative Biology 46 (3), 282–297.
Macurda, D.B., Meyer, D.L., 1974. Feeding posture of modern stalked crinoids.Nature 247 (5440), 394–396.
Mardia, K.V., Jupp, P.E., 2000. Statistics of Directional Data. John Wiley and Sons,Chichester.
McClintock, J.B., Pearse, J.S., 1987. Reproductive biology of the common antarcticcrinoid Promachocrinus kerguelensis (Echinodermata: Crinoidea). MarineBiology 96 (3), 1432–1793.
Meyer, D.L., 1973. Feeding behavior and ecology of shallow-water unstalkedcrinoids (Echinodermata) in the Caribbean Sea. Marine Biology 22 (2),105–129.
Meyer, D.L., 1979. Length and spacing of the tube feet in crinoids (Echinodermata)and their role in suspension-feeding. Marine Biology 51 (4), 361–369.
Meyer, D.L., 1997. Reef crinoids as current meters: feeding responses to variableflow. In: Proceedings of the Eighth International Coral Reef Symposium, vol. 2,pp. 1127–1130.
Meyer, D.L., Macurda, D.B., 1980. Ecology and distribution of shallow-watercrinoids of Palau and Guam. Micronesica 16 (1), 59–99.
Pearse, J.S., McClintock, J.B., Bosch, I., 1991. Reproduction of Antarctic benthic marineinvertebrates: tempos, modes, and timing. American Zoologist 31, 65–80.
Planes, S., Jones, G.P., Thorrold, S.R., 2009. Larval dispersal connects fish populationsin a network of marine protected areas. Proceedings of the National Academy ofSciences of the United States of America 106 (14), 5693–5697.
Poncet, P., 2009. modeest: Mode Estimation. R package version 1.09 /http://CRAN.Rproject.org/package=modeestS.
Post, A.L., Beaman, R.J., O’Brien, P.E., Eleaume, M., Riddle, M.J., 2011. Communitystructure and benthic habitats across the George V Shelf, East Antarctica:trends through space and time. Deep-Sea Research II 58 (1–2), 105–118.
R Development Core Team, 2009. R: a language and environment for statisticalcomputing. R Foundation for Statistical Computing, Vienna, Austria. ISBN3-900051-07-0, URL /http://www.R-project.orgS.
Rubenstein, D.I., Koehl, M.A.R., 1977. The mechanisms of filter feeding: sometheoretical considerations. American Naturalist 111, 981–984.
Sibson, R., 1980. A vector identity for the Dirichlet tessellation. MathematicalProceedings of the Cambridge Philosophical Society 87, 151–155.
Sibson, R., 1981. A brief description of natural neighbour interpolation. In: Barnett,V. (Ed.), Interpreting Multivariate Data. John Wiley and Sons, Chichester.
Thorson, G., 1946. Reproduction and larval development of Danish marinebottominvertebrates. Meddelelser fra Kommissionen for HovundersoegelserSerie Plankton 4, 1–523.
VLC Media Player, 2009. The VideoLAN project /http://www.videolan.org/vlcS.Viard, F., Ellien, C., Dupont, L., 2006. Dispersal ability and invasion success of
Crepidula fornicata in a single gulf: insights from genetic markers and larval-dispersal model. Helgoland Marine Research 60, 144–152.
Wilson, N.G., Belcher, R.L., Lockhart, S.J., Halanych, K.M., 2007. Multiple lineagesand an absence of panmixia in the ‘circumpolar’ crinoid Promachocrinuskerguelensis in the Atlantic sector of Antarctica. Marine Biology 152, 895–904.
Williams, G.D., Bindoff, N.L., 2003. Wintertime oceanography of the Adeliedepression. Deep-Sea Research II 50 (8–9), 1373–1392.
Zar, J.H., 1998. Biostatistical Analysis. Prentice-Hall, New Jersey.