ncomms3018.pdf - Nature
10
ARTICLE Received 14 Jan 2013 | Accepted 16 May 2013 | Published 17 Jun 2013 Automated long-term tracking and social behavioural phenotyping of animal colonies within a semi-natural environment Aharon Weissbrod 1 , Alexander Shapiro 1 , Genadiy Vasserman 1 , Liat Edry 1 , Molly Dayan 1 , Assif Yitzhaky 2 , Libi Hertzberg 2,3 , Ofer Feinerman 2 & Tali Kimchi 1 Social behaviour has a key role in animal survival across species, ranging from insects to primates and humans. However, the biological mechanisms driving natural interactions between multiple animals, over long-term periods, are poorly studied and remain elusive. Rigorous and objective quantification of behavioural parameters within a group poses a major challenge as it requires simultaneous monitoring of the positions of several individuals and comprehensive consideration of many complex factors. Automatic tracking and phenotyping of interacting animals could thus overcome the limitations of manual tracking methods. Here we report a broadly applicable system that automatically tracks the locations of multiple, uniquely identified animals, such as mice, within a semi-natural setting. The system combines video and radio frequency identified tracking data to obtain detailed behavioural profiles of both individuals and groups. We demonstrate the usefulness of these data in characterizing individual phenotypes, interactions between pairs and the collective social organization of groups. DOI: 10.1038/ncomms3018 1 Department of Neurobiology, Weizmann Institute of Science, Rehovot 76100, Israel. 2 Department of Physics of Complex Systems, Weizmann Institute of Science, Rehovot 76100, Israel. 3 The Emotion-Cognition Research Center, Shalvata Mental Health Center, Sackler Faculty of Medicine, Tel Aviv University, Tel Aviv 39040, Israel. Correspondence and requests for materials should be addressed to T.K. (email: [email protected]). NATURE COMMUNICATIONS | 4:2018 | DOI: 10.1038/ncomms3018 | www.nature.com/naturecommunications 1 & 2013 Macmillan Publishers Limited. All rights reserved.
-
Upload
khangminh22 -
Category
Documents
-
view
2 -
download
0
Transcript of ncomms3018.pdf - Nature

ARTICLE
Received 14 Jan 2013 | Accepted 16 May 2013 | Published 17 Jun 2013
Automated long-term tracking and socialbehavioural phenotyping of animalcolonies within a semi-natural environmentAharon Weissbrod1, Alexander Shapiro1, Genadiy Vasserman1, Liat Edry1, Molly Dayan1, Assif Yitzhaky2,
Libi Hertzberg2,3, Ofer Feinerman2 & Tali Kimchi1
Social behaviour has a key role in animal survival across species, ranging from insects to
primates and humans. However, the biological mechanisms driving natural interactions
between multiple animals, over long-term periods, are poorly studied and remain elusive.
Rigorous and objective quantification of behavioural parameters within a group poses a major
challenge as it requires simultaneous monitoring of the positions of several individuals and
comprehensive consideration of many complex factors. Automatic tracking and phenotyping
of interacting animals could thus overcome the limitations of manual tracking methods. Here
we report a broadly applicable system that automatically tracks the locations of multiple,
uniquely identified animals, such as mice, within a semi-natural setting. The system combines
video and radio frequency identified tracking data to obtain detailed behavioural profiles of
both individuals and groups. We demonstrate the usefulness of these data in characterizing
individual phenotypes, interactions between pairs and the collective social organization
of groups.
DOI: 10.1038/ncomms3018
1 Department of Neurobiology, Weizmann Institute of Science, Rehovot 76100, Israel. 2 Department of Physics of Complex Systems, Weizmann Institute ofScience, Rehovot 76100, Israel. 3 The Emotion-Cognition Research Center, Shalvata Mental Health Center, Sackler Faculty of Medicine, Tel Aviv University, TelAviv 39040, Israel. Correspondence and requests for materials should be addressed to T.K. (email: [email protected]).
NATURE COMMUNICATIONS | 4:2018 | DOI: 10.1038/ncomms3018 | www.nature.com/naturecommunications 1
& 2013 Macmillan Publishers Limited. All rights reserved.

Social interaction and communication are basic complexbehavioural features crucial to the survival of all animalorganisms in their ecosystems. Laboratory animals, from
mouse and rat to simpler animal models, such as fruit fly, displaya wide range of social behaviours that can be quantitativelymeasured with laboratory techniques1,2. Indeed, the study ofanimal social behaviours in laboratory settings has tremendousimpact on a wide range of research fields, including psychology,ecology, evolution, genetics and neuroscience. Furthermore, thereis increasing recognition in the importance of defining themolecular and neuronal principles of social interactions thatcould facilitate the understanding and treatment of social-relatedsymptoms as are observed in many common neuropsychiatricdisorders (for example, autism and schizophrenia)1,3.
Successful social behaviour analysis requires recognition of keysocial interactions in a realistic context that captures social andenvironmental situations that occur in natural habitats4.However, the increasing number of methods developed to studyanimal social behaviour within laboratory environments1,3
typically achieve reliability by forsaking environmentalcomplexity. This is largely because studying the socialbehaviour of groups for extended periods of time and withinsemi-natural environments is a highly challenging task. It
requires the tracking of multiple identified individuals with ahigh spatiotemporal precision that can allow for accurateidentification of a complex series of behavioural patterns.Manual quantification of such behavioural traits requires a vasttime investment in terms of both training and analysis, whileremaining susceptible to errors and subjectivity, and potentiallyoverlooking the most meaningful phenotypes5–7.
To circumvent inherent human constraints, there is a criticalneed for machine-based tracking and behavioural phenotypingtechnologies that are applicable toward the analysis of sociallyinteracting groups of animals. Several research teams havedeveloped automated vision-based tracking tools that supportbehavioural phenotyping of a single individual in its homecage8–10, a pair of socially interacting animals11–14 and ofindividuals in the context of large groups15–17. However, suchmethods limit: (i) the number of animals that can be concurrentlyobserved over an extended period of time (for example, up tothree mice) and (ii) the size of the testing environments, alongsidea requirement for minimal visual obstructions. Techniquesfor tracking large numbers of targets (for example, humans)moving in a crowded environment usually rely on detection ofdistinguishable vision-based physical features for each trackedindividual18. However, such tracking solutions cannot be
a
Antenna
CCDCamera
RFID decoder
Timesynchronization
1
2
Water Food ArenaHiding cage
Sleeping cage
IR lamp
Bridge
Detection of video and RFIDmice positions, simulatenousely
Mouse4
Mouse2
Mouse1
Mouse5
Mouse3
RFID tracking
video tracking
3 4
Video and RFID data fusion
cb
Time (s)
0 1,000 2,000 3,000 4,000 5,000 6,000 7,000 8,000 9,000
Mou
se 4
Mou
se 5
RunningWalking
Being avoidedAvoiding
Being chasedChasing
Static
RunningWalking
Being avoidedAvoiding
Being chasedChasing
Static
Hiding cage
Sleeping cage
Hiding cage
Sleeping cage
Mouse 4
Mouse 3Mouse 2
Mouse 5
Mouse 1
RFIDmicrochip
Figure 1 | Automated behavioural phenotyping system for multiple individually identifiable socially interacting animals. (a) Presentation of the
major system components and operational stages to capture the X–Y coordinates and identification of each animal in the arena, for each processed frame.
(1) Before its introduction to the enclosure, two RFID microchips (B2mm in diameter,B10mm in length) are subcutaneously implanted in the ventral part
of the front and hind foot of each tested animal. (2) The RFID-tagged animals are placed in a semi-natural enclosure equipped with a large central
exploratory arena and eight peripheral sleeping nests. Time-synchronized video and RFID-tracking systems are used to survey the entire area.
The video and RFID data indicating the location and identity of each tracked animal are simultaneously sampled and stored on two computer units.
(3) Video (coloured blobs) and RFID data (open circles) are then independently processed offline to extract the X–Y coordinates of each identified
mouse within the arena. The black dots represent the location of the RFID antennas. (4) The two data sets are then fused to obtain high-precision
spatiotemporal tracking data. Scale bar, 10 cm. (b) A sample of 1-min trajectories of five socially interacting mice within the semi-natural arena. (c) A
sample of locomotion and social behaviour classifications as extracted from 150-min trajectories of two interacting mice (as part of a group of five animals).
ARTICLE NATURE COMMUNICATIONS | DOI: 10.1038/ncomms3018
2 NATURE COMMUNICATIONS | 4:2018 | DOI: 10.1038/ncomms3018 | www.nature.com/naturecommunications
& 2013 Macmillan Publishers Limited. All rights reserved.
translated to analysis of small species that exhibit very fewdifferences in shape, size and colour, such as in most rodents, fishand insects.
Radio-frequency identified (RFID) tagging has been success-fully applied to track the position of uniquely identified animalswithin a group19,20. RFID technology allows for remoteidentification of objects that bear specific vision-independenttag (small glass-coated transponders labelling), which transmitinformation to antenna receivers. This technology supportsunique tagging and tracking of an indefinite number ofindividuals, which can be monitored for unlimited periods.Although RFID-based animal-tracking solutions efficiently followthe gross movements of large numbers of animals in both fieldand laboratory conditions, they have rarely been applied toevaluate rodent social behaviour. This is probably due to theirlow spatial accuracy (usually greater than 20–40 cm) andrelatively low temporal resolution20–25, which fails to generatehigh-precision tracking of animals moving at moderate to highspeed, as in the case of small rodents (for example, mousemaximum velocity can exceed 110 cm s� 1 (ref. 26)).
Here we describe an automatic behavioural analysis of multiplesocially interacting animals, such as small rodents, within diversecomplex environments and social contexts, and over testingdurations of several minutes up to several weeks (limitedonly by data storage capacity). The method simultaneously andcontinuously tracks the identity and spatial position of manyanimals (for example, Z10 mice), without the need for visualtagging, by integrating video and RFID tracking data sets, whichare time-synchronized and then fused by means of a machine-based algorithm. This hybrid-tracking method simultaneouslyprovides X, Y coordinates position, speed and orientation ofnumerous uniquely identified socially interacting individuals,with a mean spatial precision of B±0.5 cm and a temporalprecision of B30ms (Supplementary Movie 1, Fig. 1a,b).Our technique allows for the evaluation of the effects of groupcharacteristics on individual behavioural traits (such as, locomo-tion pattern; Supplementary Movie 2). Furthermore, the trackingtechnology constitutes a useful tool toward the definition ofcomplex social interactions between multiple pairs of animals, aswell as in the analysis of the formation and stability of dominant-subordinate hierarchy within a group (Supplementary Movie 3,Fig. 1c).
ResultsSystem modules. The animal-tracking apparatus consist of acustom-designed semi-natural enclosure furnished with: (1) anarray of radio-frequency-identified (RFID) position-trackingsystem; and (2) a commercially available, standard digital video-recording unit. The tracking software was comprised two stand-alone modules: (1) an RFID-based data acquisition module and(2) a video- and RFID-tracking data fusion module (for furtherdetails see Supplementary Methods and http://www.weizmann.ac.il/neurobiology/labs/kimchi/content/downloads).
Simultaneous data collection of video and RFID data. Wedesigned a set-up for automatically tracking mouse groups withinsemi-natural environments for the purpose of analysing theirsocial interactions (Fig. 1a and Methods). The system is com-prised an elaborate testing arena, of an area nearly 50-times largerthan the standard laboratory mouse cage that included severalshelter boxes and peripheral nest cages (Fig. 1a, SupplementaryFig. S1). Such semi-natural environments have previouslybeen demonstrated to support the monitoring of complexsocial interactions in mouse groups as well as improve screeningquality of various behavioural alterations in mouse models27,28.
The video- and RFID-tracking systems were positioned above andbeneath the testing arena, respectively, to prevent any interferencewith the behaviour of the tested animals.
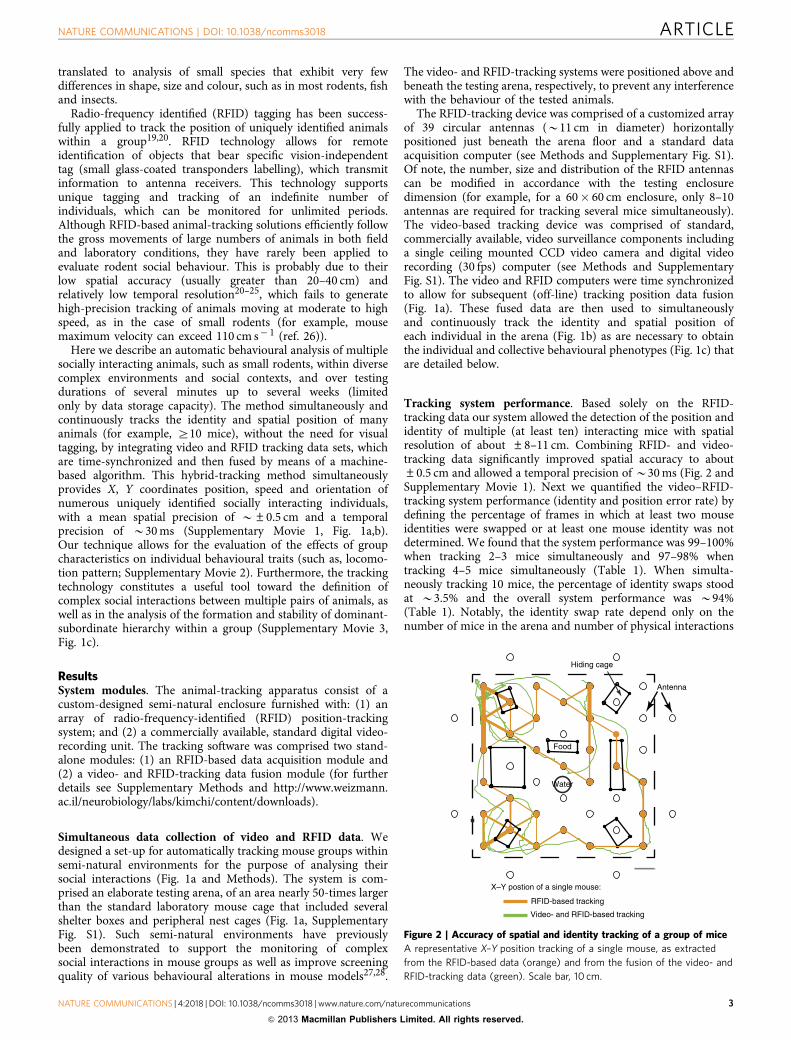
The RFID-tracking device was comprised of a customized arrayof 39 circular antennas (B11 cm in diameter) horizontallypositioned just beneath the arena floor and a standard dataacquisition computer (see Methods and Supplementary Fig. S1).Of note, the number, size and distribution of the RFID antennascan be modified in accordance with the testing enclosuredimension (for example, for a 60� 60 cm enclosure, only 8–10antennas are required for tracking several mice simultaneously).The video-based tracking device was comprised of standard,commercially available, video surveillance components includinga single ceiling mounted CCD video camera and digital videorecording (30 fps) computer (see Methods and SupplementaryFig. S1). The video and RFID computers were time synchronizedto allow for subsequent (off-line) tracking position data fusion(Fig. 1a). These fused data are then used to simultaneouslyand continuously track the identity and spatial position ofeach individual in the arena (Fig. 1b) as are necessary to obtainthe individual and collective behavioural phenotypes (Fig. 1c) thatare detailed below.
Tracking system performance. Based solely on the RFID-tracking data our system allowed the detection of the position andidentity of multiple (at least ten) interacting mice with spatialresolution of about ±8–11 cm. Combining RFID- and video-tracking data significantly improved spatial accuracy to about±0.5 cm and allowed a temporal precision of B30ms (Fig. 2 andSupplementary Movie 1). Next we quantified the video–RFID-tracking system performance (identity and position error rate) bydefining the percentage of frames in which at least two mouseidentities were swapped or at least one mouse identity was notdetermined. We found that the system performance was 99–100%when tracking 2–3 mice simultaneously and 97–98% whentracking 4–5 mice simultaneously (Table 1). When simulta-neously tracking 10 mice, the percentage of identity swaps stoodat B3.5% and the overall system performance was B94%(Table 1). Notably, the identity swap rate depend only on thenumber of mice in the arena and number of physical interactions
Food
Water
Hiding cage
Antenna
RFID-based tracking
Video- and RFID-based tracking
X–Y postion of a single mouse:
Figure 2 | Accuracy of spatial and identity tracking of a group of mice
A representative X–Y position tracking of a single mouse, as extracted
from the RFID-based data (orange) and from the fusion of the video- and
RFID-tracking data (green). Scale bar, 10 cm.
NATURE COMMUNICATIONS | DOI: 10.1038/ncomms3018 ARTICLE
NATURE COMMUNICATIONS | 4:2018 | DOI: 10.1038/ncomms3018 | www.nature.com/naturecommunications 3
& 2013 Macmillan Publishers Limited. All rights reserved.

between pairs of mice. Conversely, it is not dependent on theexperiment duration (that is, system performance is stable overtime).
To further improve the accuracy of our mouse trackinganalysis, we integrated our tracking software with a recentlydeveloped vision-based tracking algorithm for pairs of interactingmice (MiceProfilier11). This combination further enhancedsystem performance by rectifying B60% of the frames, whichcontained swapped identities. In a group of five mice, this isequivalent to an increase in system performance from 97.2 to98.1%. Furthermore, integration of these two tracking systemsshould also yield improvements in defining the mouse-bodyorientation (that is, head–rear axis) which may allowcharacterization of more fine pairwise social behaviourphenotyping (for example, head–head investigation versushead–rear/anogenital investigation).
Last, in effort to define whether the video–RFID system may besimplified, we tested what number of active RFID antennas isrequired to maintain high performance. We found that operatingthe RFID-based tracking system with 60% of the total number ofRFID antennas (that is, 0.0018 antennas per cm2) had only littleeffect on the performance. Specifically, in this case, accuracy rateswere B98% for groups of three mice (compared with 499%when all antennas are active) and B90% for groups of six mice(compared with 495%) (for more details see SupplementaryFig. S2). This implies that for an arena of size 120� 120 cm(24 times the size of conventional mouse cage)—one could use23 antennas to get reliable tracking data. While for arena of size60� 60 cm only five antennas are required for reliable trackingdata.
System applications in phenotyping of mouse groups. Theintegrated video–RFID system was applied to test two inbredmouse strains: C57BL/6� 129Sv (C57� 129) and BTBR Tþ tf/J(BTBR), which were previously reported to exhibit significantlydifferent behavioural phenotypes29–31. Three independent groupsof mice were tested for each of the mouse strains (that is, a total ofsix experiments), using an identical standard operation protocol;the duration of each experiment was 8 days. An RFID-taggedgroup of five adult males, from either one of the strains,was introduced into the enclosure and the spatial positionand identity of each individual were automatically identifiedthroughout the duration of the experiment. A biologicallyrelevant social stimulus was then presented (day 7), byintroducing two alien adult female mice into the enclosure. Todemonstrate the system’s behavioural phenotyping performance,three examples of data analysis are presented and discussed indetails below. All analyses were performed within the same social
and environmental context, but differ in that they focus on:(i) individual mouse behaviour (Supplementary Movies 1–2),(ii) pair interactions (Supplementary Movies 3–6), or (iii) groupdynamics (social hierarchy).
Individual locomotion patterns within a group. To allow single-mouse behavioural analysis, we developed a set of sensitivebehavioural parameters that profile an individual’s momentarylocomotion patterns and its spatial position relative to keyinteraction–promoting objects (for example, shelter box, sleepingnest) (Fig. 3a and Supplementary Fig. S3 and SupplementaryMovie 2). To the best of our knowledge, this is the first report ofevaluation of the locomotion/exploration behavioural phenotypeof mice in the context of group social interactions and within acomplex semi-natural environment. We found that, during thefirst 4 h of the first day (Fig. 3b,c) of the experiment, all threeindependently tested BTBR groups, presented a significantlylower locomotion level, that is, total distance travelled and run-ning time percentage were lower than in the three C57� 129groups (Po0.001). No significant difference was observedbetween the experiments within each strain. Similar findings wereobtained when locomotion pattern was quantified using ourRFID system alone (Supplementary Fig. S4).
Interestingly, evaluating the locomotion pattern during the first15min of the test period, a maximum testing duration of classiclocomotion and anxiety-related assays (for example, open-fieldassay)32, yielded no significant behavioural difference between thestrains (Fig. 3d,e). Our findings stand in line with previous studiesthat reported low locomotion level among BTBR mice whenmonitored over several hours8, but normal locomotion (that is,similar to other classical inbred mouse strains) when monitoredover short testing duration (5–15min)30,33. We suggest thatstress-related behavioural fluctuations are reduced when testingactivity patterns for extended periods of time and within semi-natural large set-ups, thereby allowing for capture of enduringbehavioural phenotypes9,34,35. Finally, we found that fivelocomotion features collected by the system in a single testingday are sufficient to predict the mouse strain with an accuracy of80–90%, the experimental stage (for example, behaviouralchanges upon introduction of the females) with an accuracy ofB70% and the sex with an accuracy of B80% (see Methods andSupplementary Fig. S5).
Social interactions between mouse pairs. We developed amethod for detecting and quantifying commonly observed socialinteractions between mouse pairs, namely, chasing/being-chasedand avoidance/approach behaviours (see Methods, Fig. 4a,b,Supplementary Fig. S6 and Supplementary Movies 3–6). Wefound that the all-male mouse groups, from both strains, pre-sented complex dynamic changes in pairwise social interactionsover the experiment days, with the highest level of social inter-actions on the first day of the experiment and following theintroduction of alien females to the arena (day 7) (Fig. 4c).Furthermore, we found that the BTBR male mice engaged insignificantly fewer social interactions, when compared with theC57� 129 male mice, throughout the experiment. This holds foranalyses that address the first 15min (Po0.05), the first 4 h (firstday) (Po0.001, Fig. 4d) and days 2–6 of the experiment(Po0.001, Fig. 4e). These findings strongly support previousstudies that suggested a social behaviour deficiency in the BTBRmouse strain29,31. Moreover, we found that by using four socialbehaviour features collected by the system in a single testing day,we could predict the mouse strain with an accuracy of about90–95% (see Methods and Supplementary Fig. S5).
Table 1 | Video–RFID-tracking system performance accuracy.
Number ofmice in arena
Swapsidentities
(%)Unknown
identities (%)Overall systemperformance (%)
1 0 0 1002 0.12 0 99.883 0.48 0 99.524 0.97 0.66 98.375 1.25 1.48 97.2710 3.52 1.69 94.79
RFID, radio-frequency identification.Tracking system accuracy (error rate), determined by the number of frames (%) at which thesystem swapped identities between pairs of interacting mice or failed to determine the identityof at least one mouse while tracking mice groups of different sizes.
ARTICLE NATURE COMMUNICATIONS | DOI: 10.1038/ncomms3018
4 NATURE COMMUNICATIONS | 4:2018 | DOI: 10.1038/ncomms3018 | www.nature.com/naturecommunications
& 2013 Macmillan Publishers Limited. All rights reserved.

Social hierarchy formation and stability in mouse colonies.The formation of a social hierarchy is one of the most robustbehavioural features presented by group-housed male mice insemi-natural conditions36. We developed a method to reliablydefine the social hierarchy rank of each individual in a group
(see Methods). Applying this analysis revealed that a clearlinear-order dominance hierarchy, formed as early as the secondday of the experiment and retained throughout the experiment,was evident in all C57� 129 groups tested. Specifically, the socialhierarchy of each tested C57� 129 group consisted of a single
b c
Hiding cageRunningWalking
Sleeping cageStatic
0 1,000 2,000 3,000 4,000 5,000 6,000 7,000 8,000 9,000
Hiding cageRunningWalking
Sleeping cageStatic
Time (s)
Time (s)2,980 3,000 3,020 3,040 3,060 3,080
Single-mouse ethogram (locomotion)
100
020406080
Hiding cageRunningWalking
StaticSleeping cage %
Of t
ime
0
100
200
300
400
500
600
Pat
h le
ngth
(m
)
Exp 1
Exp 2Exp 3
***
d
10 AM 10 AM 6 PM 10 AM6 PM
10 PM 10 PM10 PM10 PM 7 PM
5 Males
+2 Females
0
2
4
6
8
10
12
14
C57x129 BTBR
Run
ning
tim
e (%
)
Exp 1
Exp 2Exp 3
***
Strain
C57x129 BTBR
Strain
a
First 15 min First 240 min
***
Duration of behavior monitoring
First 15 min First 240 min
Duration of behavior monitoring
e
Pat
h le
ngth
(m
)
Run
ning
tim
e (%
)
C57x129
BTBR C57x129
BTBR
***
0
100
200
300
400
500
0
2
4
6
8
10
12
Day1 2 5 7 8
Time
Figure 3 | Ethograms of five automatically detected locomotion behaviours. (a) An example of an ethogram of single-mouse locomotion features
characterized by the automatically extracted trajectories and presented on three different time scales (see Supplementary Movies 1 and 2). Upper ethogram:
periods during which the mouse was engaged in each of the five examined behaviours (sleeping, hiding, static, walking and running), which are colour-coded
and depicted over a period of about 2min. The upper ethogram is a zoom-in of the middle ethogram, which represents a period of 150min. Lower ethogram:
each row corresponds to a locomotion feature, while each column represents 1 h of testing. The colour represents the percentage of time the mouse engaged
in the corresponding behaviour. (b) Travelled path length and (c) percentage of running time per hour on the first day of the experiment in three independent
tests (n¼ 5 individuals for each test) in two mouse strains. (d) Travelled path length and (e) percentage of running time per hour for the first 15min and first
240min of testing, for two mouse strains (n¼ 15 individuals in each strain). Data are presented as the mean±s.e.; ***Po0.001 between strains, analysis of
variance (ANOVA) tests. No significant differences were detected between the experiments within each strain.
NATURE COMMUNICATIONS | DOI: 10.1038/ncomms3018 ARTICLE
NATURE COMMUNICATIONS | 4:2018 | DOI: 10.1038/ncomms3018 | www.nature.com/naturecommunications 5
& 2013 Macmillan Publishers Limited. All rights reserved.

1.8s0.8s0s0s
6s
2.8s
Avoidance behavior
AvoidingBeing avoidedBeing chased
Chasing
Chasing behavior
Being avoided
Avoiding
Being chased
Chasing
0 1,000 2,000 3,000 4,000 5,000 6,000 7,000 8,000 9,000
Time (s)
Time (s)2,980 3,000 3,020 3,040 3,060 3,080
Single mouse ethogram (social)
60
0
20
40
Eve
nts
per
hour
Beingavoided
ChasingBeing chased
Avoiding
10 AM 10 AM 6PM 10 AM6 PM
10 PM 10 PM 10 PM10 PM 7 PM
5 Males
+2 Females
a
b
dc
Mouse3
Mouse1Mouse2
Mouse4Mouse5
Experiment timeline
Day
Soc
ial i
nter
actio
ns (
even
ts p
er h
our)
0 1 2 3 4 5 6 7 8 90
20
40
60
80
100
120
Soc
ial i
nter
actio
ns (
even
ts p
er h
our)
C57x129 BTBR
Exp 1
Exp 2
Exp 3
***
C57x129 BTBR
Day1 Day2- 6
Exp 1
Exp 2
Exp 3
0
5
10
15
20
25
30***
Soc
ial i
nter
actio
ns (
even
ts/h
)
Strain Strain
Being chasedChasing
Being avoided
Avoiding
+2 Females
5 Males
e
0
50
100
150
200
250
300
Day1 2 5 7 8
Exploration Stable sociability Social stimulus
Time
e36
926e926e
926e
926e
e36
e365
08/08/2011 / 18:50:48.82908/08/2011 / 18:49:26.829
08fa08fa
08fa
08fa
0.020.070.580.030.02
0.150.140.020.320.01
zd7
084
084zd7
zd7
e365
e365
zd7e365
Figure 4 | Ethograms of four automatically detected social behaviours. (a) Sequential video frame samples of automatically detected chasing behaviour
(left-hand panels) and avoidance behaviour (right-hand panels) of pairs of mice. Dashed coloured lines represent the trajectories of the socially engaged animals.
Arrows represent the direction of motion for each mouse. Time codes (left upper corners) are presented relative to the first frame shown (see Supplementary
Movies 3–4). (b) Sample ethograms of four pairwise interaction features (shown for a single mouse) automatically extracted from the spatial position data and
presented for three different time scales. Upper ethogram: periods during which the mouse engaged in each of the four interaction behaviours (chasing/being
chased, avoiding/being avoided) are colour-coded and depicted over a period of about 2min. The upper ethogram is a zoom-in of the middle ethogram, which
represents a period of 150min. Lower ethogram: each row corresponds to a social behaviour feature, while each column represents 1 h of testing. The colour
represents the percentage of time during which the mouse was engaged in the corresponding social behaviour. (c) A representative sample of C57� 129 mouse
group social interactions over the 8 days of the experiment. On day 7 (social stimulus), two alien females were introduced into the enclosure and allowed to interact
with the five resident males. (d,e) Social interaction frequency (per hour) during the first day (d) and days 2–6 (e) of the experiment. Data are presented as the
mean±s.e.; ***Po0.001 between strains, analysis of variance (ANOVA) tests; no significant differences were detected between the experiments within each strain.
ARTICLE NATURE COMMUNICATIONS | DOI: 10.1038/ncomms3018
6 NATURE COMMUNICATIONS | 4:2018 | DOI: 10.1038/ncomms3018 | www.nature.com/naturecommunications
& 2013 Macmillan Publishers Limited. All rights reserved.

dominant (a) and one or two sub-dominant (b) mice (Fig. 5a,band Supplementary Fig. S7). This stands in striking contrast tothe situation in BTBR groups where almost all individualschased each other to a similar extent and presented a weak, if any,dominant-subordinate social hierarchy pattern (Fig. 5c,d andSupplementary Fig. S7).
The social rank, generated by our system, of each individualwithin a group was validated by comparing it with the level ofaggression observed in the attacks presented by tested individualsin classical resident–intruder assays37,38. The latter, manuallyquantified results confirmed that the dominant males identifiedby our automated system present the most aggressive attackstoward an alien male mouse. However, unlike our system, theclassical resident–intruder assay was not spatially sensitiveenough to establish the detailed social hierarchy organizationwithin the mouse groups (Supplementary Fig. S7). Furthermore,we found that integrating RFID and video data were absolutelynecessary to obtain the collective behaviour phenotypes detailedbelow. For example, using our social interaction data in which theidentities of mice are randomly swapped at some small rate leadsto the complete loss of any hierarchical group structure that was
present in the original data. Moreover, using our RFID systemalone was insufficient for robust classification of mouse socialbehaviours (chasing and approaching) and group organization(see Supplementary Fig. S8).
Finally, it should be noted that the BTBR mouse strain,unlike the C57� 129 strain, is known to present severesocio-behavioural deficiencies and other behavioural abnormal-ities30, and is routinely used as a mouse model for studyingautism3,29. This is the first time that deficiency in groupsocial organization is reported in a mouse model for autism.This new type of social behaviour analysis may open newfrontiers toward a rigorous characterization of socialorganizational deficiencies and an evaluation of their severity inother mouse models for autism.
DiscussionThis report describes an animal-tracking method that enableslong-term automated tracking of a large number of animals thatare group-housed in elaborate semi-natural environments, whileproviding high temporal and spatial resolution of the identity of
3
1
2
4
5
6
7
Mouse5 (α)
Mouse4 (β)
Mouse3
a b Social hierarchy treeSocial interaction matrix d
Mouse3Mouse2
Mouse1(α)
3
2
4
5
6
7
1
0
10
20
30
40
50
60
70
80
0
10
20
30
40
50
60
70
80
c
Mouse5 (α)
Mouse4 (β)
Mouse2
Mouse1
Mouse6
Mouse3
Mouse7
Mouse6 Mouse7
Mouse 1,2,3,4,5
Mou
se
Day 2 Day 7
Being chased
Cha
sing
Being chased
Cha
sing
Mouse2
Day 7Social hierarchy tree
Day 2 Day 7Social interaction matrix
Day 7
1 2 3 4 5 6 7M
ouse 1 2 3 4 5 6 7
Num
ber
of e
vent
s
Num
ber
of e
vent
s
e
α
β
Submissive
−5 −4 −3 −2 −1 0 1 2 3 4 5−5
−4
−3
−2
−1
0
1
2
3
4
5
Strain (sex):C57x129 (females)BTBR (males)C57x129 (males)α = Dominantβ = Sub-dominant
Principal component 1
Prin
cipa
l com
pone
nt 2
Figure 5 | Quantification of social dominance hierarchy of mouse groups. Social organization of a representative C57� 129 mouse group (a,b), and
BTBR mouse group (c,d). ‘Chasing’ and ‘Being-chased’ interaction matrix of a C57� 129 (a) and BTBR group (c), on day 7 of the experiment, following a
social stimulus. Colour-code at position (i, j) represents the number of events during day 7 in which mouse ‘i’ was chasing mouse ‘j’. Hierarchy trees
were constructed for day 2, and day 7 of the experiment for C57� 129 (b) and BTBR (d) groups of mice, based on the social matrices (interaction
matrix not shown). Note: the social ranks of some individuals, for example, mouse 1 of the C57� 129 group, could not be defined on day 2 due to a
restricted number of social interactions; they were thus omitted from the hierarchy tree (see also Supplementary Fig. S7). (e) Principal component
analysis was performed on all social interaction parameters gathered from day 2 until day 8 of the experiment, inclusive, in six independent experiments
(red: male C57� 129 (n¼ 15); blue: female C57� 129 (n¼ 12); green: male BTBR (n¼ 15)).
NATURE COMMUNICATIONS | DOI: 10.1038/ncomms3018 ARTICLE
NATURE COMMUNICATIONS | 4:2018 | DOI: 10.1038/ncomms3018 | www.nature.com/naturecommunications 7
& 2013 Macmillan Publishers Limited. All rights reserved.

each individual within the group, without requiring visual tags(see Methods and Supplementary Movie 1).
Our system is unique in that it integrates two-independent,time-synchronized position-tracking tools (Fig. 1a), which, whenjointly applied, overcome the limitations of each single technique.For instance, a video-tracking system requires unique visualtagging (for example, painting with different colour dyes) of eachanimal in order to track multiple individual identities. Such visualmarking is limited by the maximal number of distinguishablecolour/pattern labels, has relatively high costs in terms ofimage analysis time and computer memory, imposes visibilityconstraints and may interfere with normal animal behaviour. Ouruse of RFID-tagging rids the system of visual markings and oflimitations on the number of cohabiting animals that can besimultaneously tracked. Hence, RFID tracking provides a mean ofsimple, vision-independent identification of multiple individualsthat may be used for classification of locomotion behaviouralpatterns (Supplementary Fig. S4). However, the spatial accuracyof RFID tracking is substantially limited when compared withwhat may be achieved using video photography. Thus, using ourRFID system alone was insufficient for robust classification ofmouse social behaviours (chasing and approaching) and grouporganization (Supplementary Fig. S8). Our integrated systemprovides a novel hybrid approach for multi-object tracking and aunique platform for both locomotion and social behaviourphenotyping of large groups of small and agile animals(for example, small rodents) (Fig. 1). Moreover, as this fusedtracking system is not colour-based, infra-red illumination can beused to effectively track multiple animals in the dark, which is theactive period for most rodent species.
As a proof of concept of the potential applications of thesystem towards the analysis of mouse behaviour phenotypes incomplex environments and socially dynamic mouse colonies, wehave developed a repertoire of user-defined analytical tools and abattery of biologically relevant parameters to characterize thelocomotion and social behaviour. These enable us to robustlyand consistently measure a set of behavioural traits (Fig. 1c,Supplementary Figs S3,S4) that can be used to accurately classifythe strain and sex of the tested animals, pairwise socialinteractions and social hierarchical organization (SupplementaryFig. S5 and Fig. 5e). Further study is required to extend ouranalytical toolbox to include a wider range of more subtlesocio-behavioural parameters, such as sexual and aggressivebehaviours, possibly by incorporating modules that allow forfurther analysis of our tracking data together with newlydeveloped vision-based behavioural phenotyping programs11,12.In its current state, our system may allow rapid and systematicanalysis of sets of locomotion and socio-behavioural mousephenotypes across multiple wild-type strains and in thenumerous available genetically modified models for neuro-psychiatric disorders (for example, anxiety, autism andschizophrenia)1,5,39.
Furthermore, our automated behavioural phenotyping systemallows behavioural analysis over testing durations that rangefrom several minutes (adjusted to classical testing paradigms) to a100-fold longer (multiple hours to multiple days) within the sameparadigm.
Finally, as our experimental platform poses no significant sizeor structure constraints, it can be readily adjusted to enable a widerange of multi-purpose, stable measurements on diverse animalresearch models. Particularly, although not yet directly tested, ourfused video- and RFID tracking technology could be applied totrack the behaviour of any 2D-mobile organism (includinginsects, reptiles and aquatic species), so long that the animal canbear the load of an RFID tag. This may provide scientists with ameans of tackling an entirely new set of questions about social
behaviour across animal species and models, such as defining themechanism underlying the formation of social hierarchy,collective group decisions and organization of large animalgroups (for example, insect colonies, fish schools)40.
MethodsAnimals. Adult male and female mice from the C57BL/6Jx129sv and BTBRToþ4 tf/J strains (both from Jackson Laboratories, ME) were used in theexperiments. Mice were housed and bred in a pathogen-free animal facility on a12/12 h light/dark cycle, with food and water ad libitum. All experimentalprocedures were approved by the IACUC of the Weizmann Institute of Science.
RFID-based mouse tagging. Two RFID microchips (ID-100, operating frequency125–135 kHz; Trovan Ltd) were subcutaneously implanted into anaesthetized mice,2 weeks before the initiation of the experiment. We found that for best detectionof RFID signals, the microchip should be positioned perpendicular to the RFIDantennas, which lay horizontally beneath the enclosure floor. Hence, to achievebest signal intensity by the RFID antennas, the microchips were implantedlengthwise beneath the skin, parallel to the lower hind/front limb of the mouse.We confirmed that the implanted microchips did not interfere with the healthor typical behaviour of the mice for at least 6 months following implantation.
Testing procedure. Each experiment tested seven adult mice of the same age andstrain. On day 1 of the experiment, five non-littermate males were introduced inrandom order into the enclosure. On day 7, two alien adult females were intro-duced into the enclosure and allowed to socially interact with the five males.On day 8, the experiment was terminated. On day 8, all mice were removed fromthe enclosure. The males were housed individually in a cage for 1 week and thentested in a classical resident–intruder assay, by exposing each individual to an alienmale mouse and manually evaluating the resident mouse’s social behaviour(for example, aggression) toward the alien mouse, as previously described38.The manually recorded aggressive behaviour of the resident males toward thealien mouse was compared with the automatically quantified behaviour(Supplementary Fig. S7).
Experimental set-up. Enclosure: The testing enclosure included a large centralsquare exploratory arena (L�W�H, 119.2� 119.2� 80 cm) constructed oftransparent polycarbonate boards. In addition, two standard mouse cages werefitted to each of the four arena walls by short Perspex tubes, and served as sleepingnests. Mice were allowed to freely move between the exploratory region and thesleeping nests. The arena floor was covered evenly with sawdust bedding. It wasalso equipped with custom-made transparent shelter boxes and bridges, as well aswith a custom-made, free-access feeder (rodent pellets) and water container(Supplementary Methods and Supplementary Fig. S1).
RFID position-tracking system: The tracking system was comprised thefollowing parts: (1) an array of antennas; (2) RFID decoder cards (LID650; TrovanLtd); and (3) a PC equipped with an RS485 data acquisition card PCIe-8431/8(National Instruments). The 39-antenna array was positioned beneath the floor ofthe exploratory arena (4–5 cm beneath the bedding surface) and one antenna waspositioned beneath each of the eight tubes connecting the peripheral cages with theexploratory arena (Supplementary Fig. S1). Uniquely identifiable RFID decodercards, with a reading rate of 24ms, were connected to each antenna in the arrayand transmitted their data to the PC.
Video position-tracking system: A low-light sensitivity, black and white CCDcamera (MTV-13V5HC Mintron; 795� 596 pixels) and infra-red LED illuminatorswere mounted above the arena to allow video recording of mice behaviour in thearena throughout both day and night. Video data were recorded on a commercialmulti-channel digital video recording computer (DVR; CTTI Ltd) that allowsvideo-recording from multiple cameras, at 30 frames per second.
Time-synchronization of RFID and video recording computers: High-accuracytime synchronization is essential for system operation, and was achieved usingAbsolute Time Server software (FlexibleSoft) installed on both the video- andRFID-recording computers. The DVR computer was set to serve as the ‘time server’(the time setter of the experiment) and the RFID-recording computer wasconfigured to serve as the ‘time client’ computer.
Video and RFID-based trajectory extraction. Our software is comprisedseveral stand-alone software modules (Supplementary Methods), as listed below.
RFID-based data acquisition software: The RFID-acquired spatial position dataof each mouse were recorded using a software module we wrote in Lab Windows/CVI (see Supplementary Methods). The software was designed to instantly extractthe information transferred to the RFID decoders each time a mouse crossed/stoodabove one of the RFID antennas. Our software recorded the following parameters:the 10-digit number of the detected RFID microchip, the antenna/decoder numberby which it was detected, and the date and time (with a resolution of 1 ms). The datawere stored locally on the RFID-recording computer (see Supplementary Movie 7).
ARTICLE NATURE COMMUNICATIONS | DOI: 10.1038/ncomms3018
8 NATURE COMMUNICATIONS | 4:2018 | DOI: 10.1038/ncomms3018 | www.nature.com/naturecommunications
& 2013 Macmillan Publishers Limited. All rights reserved.

Video-based mouse location extraction: We used OpenCV Cþ þ to writesoftware to determine (off-line) the spatial position of each mouse in each recordedvideo image frame. The software extracted the location of each mouse in afour-step process (Fig. 1). (1) The background was subtracted from each videoframe. (2) The pixels belonging to each mouse in the arena were determined.(3) The video pixels for each mouse detected in the exploratory arena wereclustered using k-means clustering. (4) The X–Y position of each mouse wasextracted by computing the center of mass of each of the clustered pixels(see Supplementary Methods).
System performance and error rate analysis: Tracking system performance wasautomatically analysed using a Matlab application designed for this purpose andwas validated by two well-trained human observers. We analysed tracking accuracyover several hours of recordings, from three independent experiments, as afunction of the number of mice detected in arena during the testing duration(Table 1). The system performance index was defined as the percentage of therecorded video frames in which the tracked mice were successfully identifiedand localized. This was defined as: 100� (swap identitiesþ unknowns) (%). Swapidentity was defined as identity of swapping/jumping to a wrong location limitedby B4 cm offset. Unknown was defined as mouse identity and localization thatcould not be identified.
Quantification of behavioural parameters. Locomotion behavioural parameters:Locomotion and social interaction behaviours were extracted for each mouse fromthe trajectory data. The locomotive behavioural pattern assessed the following fiveparameters (Fig. 3 and Supplementary Movie 2): ‘Sleeping (nest) cage’—the spatialposition of the mouse was within one of the peripheral sleeping cages. ‘Hidingcage’—mouse spatial position was within one of the arena’s shelter cages.‘Static’—the mouse was stationary (speed: o1 cm s� 1) in the exploratory arena.‘Walking’—the mouse was moving in the arena with a mean speed within givenranges. ‘Running’—the mouse was moving in the arena at a mean speed, whichexceeded the maximum speed of walking (see Supplementary Methods). The speedranges were set based on examples of previously reported physical measurementsof laboratory mice41,42.
Social behavioural parameters: Socio-behavioural patterns between a pair ofmice (Mouse A and Mouse B) measured the following parameters: chasing/beingchased and avoiding/being avoided (Fig. 4, Supplementary Movies 3–6 andSupplementary Methods). In brief, chasing behaviour was defined as follows:Mouse A running after Mouse B was defined as the ‘chasing’ mouse, while mouse Bwas defined as the ‘being chased’ mouse. Behaviour was classified as chasing whentwo mice were moving forward in the same direction and time, the two interactingmice travelled at least 60 cm, the distance between the two mice was below 40 cm,and the trajectory correlation between the interacting mice was 40.7. Avoidancebehaviour was defined as follows: Mouse A advanced toward Mouse B (which waswalking or static), which led Mouse B (the ‘avoiding mouse’ to rapidly changedirection and flee from Mouse A (the ‘being avoided’ or ‘approaching’ mouse(see Supplementary Methods).
Validation of social behaviour parameter classifiers: The data analysis softwarefor classification of social behaviour patterns was evaluated by comparing themachine quantification results with those derived from manual quantification bytwo trained human observers. We found that for classifying of ‘no socialinteraction’, the evaluation provided by our automated classifier was in fullagreement with the quantification of both human observers. Surprisingly, werevealed that developing classifiers to distinguish between types of socialinteractions (in particularly of avoidance behaviour) is an extremely challengingtask as even well-trained human observers will often disagree with regard to correctclassification of behaviour (that is, the ground truth). Our automatic classifier wasat least as good as either one of the well-trained human observers for classificationof chasing and avoidance behaviour (Supplementary Fig. S9).
Social hierarchy status: A social hierarchy tree for each mouse group (five malesand two females) was constructed based on the chasing/being-chased pairwiseinteraction data for each day of the experiment (Fig. 5). First, the pairwiserelationships between the mice (dominant-subordinate, equality or undetermined)were classified43. The classification was based on comparing the number of wins(in chasing events) with the total number of chasing/being chased interactions.In the case of a conflict in determining the social ranks (that is, A4B, B4C,C4A), the animal hierarchy was defined as undetermined.
References1. Silverman, J. L., Yang, M., Lord, C. & Crawley, J. N. Behavioural phenotyping
assays for mouse models of autism. Nat. Rev. Neurosci. 11, 490–502 (2010).2. Sokolowski, M. B. Social interactions in "simple" model systems. Neuron 65,
780–794 (2010).3. Moy, S. S. & Nadler, J. J. Advances in behavioural genetics: mouse models of
autism. Mol. Psychiatr. 13, 4–26 (2008).4. Insel, T. R. & Fernald, R. D. How the brain processes social information:
searching for the social brain. Annu. Rev. Neurosci. 27, 697–722 (2004).5. Baker, M. Technology feature inside the minds of mice and men. Nature 475,
123–128 (2011).
6. Mandillo, S. et al. Reliability, robustness, and reproducibility in mousebehavioural phenotyping: a cross-laboratory study. Physiol. Genomics. 34,243–255 (2008).
7. Editorial. Building a better mouse test. Nat. Methods 8, 697 (2011).8. Jhuang, H. et al. Automated home-cage behavioural phenotyping of mice.
Nat. Commun. 1, 68 (2010).9. Steele, A. D., Jackson, W. S., King, O. D. & Lindquist, S. The power of
automated high-resolution behaviour analysis revealed by its application tomouse models of Huntington’s and prion diseases. Proc. Natl Acad. Sci. USA104, 1983–1988 (2007).
10. Zarringhalam, K. et al. An open system for automatic home-cage behavioralanalysis and its application to male and female mouse models of Huntington’sdisease. Behav. Brain. Res. 229, 216–225 (2012).
11. de Chaumont, F. et al. Computerized video analysis of social interactions inmice. Nat. Methods 9, 410–417 (2012).
12. Kabra, M., Robie, A. A., Rivera-Alba, M., Branson, S. & Branson, K. JAABA:interactive machine learning for automatic annotation of animal behaviour.Nat. Methods 10, 64–67 (2012).
13. Burgos-Artizzu, X. P., Dollar, P., Lin, D. Y., Anderson, D. J. & Perona, P.Social behaviour recognition in continuous video. 2012 Ieee Conference onComputer Vision and Pattern Recognition (Cvpr) 1322–1329 (2012).
14. Burkett, J. P., Spiegel, L. L., Inoue, K., Murphy, A. Z. & Young, L. J. Activationof mu-opioid receptors in the dorsal striatum is necessary for adult socialattachment in monogamous prairie voles. Neuropsychopharmacology 36,2200–2210 (2011).
15. Swierczek, N. A., Giles, A. C., Rankin, C. H. & Kerr, R. A. High-throughputbehavioral analysis in C. elegans. Nat. Methods 8, 592–U112 (2011).
16. Branson, K., Robie, A. A., Bender, J., Perona, P. & Dickinson, M. H. High-throughput ethomics in large groups of Drosophila. Nat. Methods 6, 451–U477(2009).
17. Dankert, H., Wang, L. M., Hoopfer, E. D., Anderson, D. J. & Perona, P.Automated monitoring and analysis of social behaviour in Drosophila. Nat.Methods 6, 297–303 (2009).
18. Zhao, T., Nevatia, R. & Wu, B. Segmentation and tracking of multiple humansin crowded environments. Ieee T. Pattern Anal 30, 1198–1211 (2008).
19. Robinson, E. J. H., Richardson, T. O., Sendova-Franks, A. B., Feinerman, O. &Franks, N. R. Radio tagging reveals the roles of corpulence, experience and socialinformation in ant decision making. Behav. Ecol. Sociobiol. 63, 627–636 (2009).
20. Lewejohann, L., Hoppmann, A. M., Kegel, P., Kritzler, M., Kruger, A. &Sachser, N. Behavioral phenotyping of a murine model of Alzheimer’s diseasein a seminaturalistic environment using RFID tracking. Behav. Res. Methods 41,850–856 (2009).
21. Schaefer, A. T. & Claridge-Chang, A. The surveillance state of behavioralautomation. Curr. Opin. Neurobiol. 22, 170–176 (2012).
22. Krackow, S., Vannoni, E., Codita, A., Mohammed, A. H., Cirulli, F. & Branchi,I. et al. Consistent behavioral phenotype differences between inbred mousestrains in the IntelliCage. Genes Brain Behav. 9, 722–731 (2010).
23. Endo, T., Maekawa, F., Voikar, V., Haijima, A., Uemura, Y. & Zhang, Y. et al.Automated test of behavioral flexibility in mice using a behavioral sequencingtask in IntelliCage. Behav. Brain. Res. 221, 172–181 (2011).
24. Aguzzi, J., Sbragaglia, V., Sarria, D., Garcia, J. A., Costa, C. & del Rio, J. et al.A new laboratory radio frequency identification (RFID) system for behaviouraltracking of marine organisms. Sensors 11, 9532–9548 (2011).
25. Howerton, C. L., Garner, J. P. & Mench, J. A. A system utilizing radio frequencyidentification (RFID) technology to monitor individual rodent behaviour incomplex social settings. J. Neurosci. Meth. 209, 74–78 (2012).
26. De Bono, J. P., Adlam, D., Paterson, D. J. & Channon, K. M. Novel quantitativephenotypes of exercise training in mouse models. Am. J. Physiol. Reg. I 290,R926–R934 (2006).
27. Kimchi, T., Xu, J. & Dulac, C. A functional circuit underlying male sexualbehaviour in the female mouse brain. Nature 448, 1009–U1001 (2007).
28. Ragnauth, A. K. et al. Female oxytocin gene-knockout mice, in a semi-naturalenvironment, display exaggerated aggressive behavior. Genes Brain. Behav.4, 229–239 (2005).
29. Meyza, K. Z. et al. The BTBR T(þ )tf/J mouse model for autism spectrumdisorders-in search of biomarkers. Behav. Brain. Res. http://dx.doi.org/10.1016/j.bbr.2012.07.021.
30. Karvat, G. & Kimchi, T. Systematic autistic-like behavioral phenotyping of 4mouse strains using a novel wheel-running assay. Behav. Brain. Res. 233,405–414 (2012).
31. Pobbe, R. L. H., Defensor, E. B., Pearson, B. L., Bolivar, V. J., Blanchard, D. C. &Blanchard, R. J. General and social anxiety in the BTBR T plus tf/J mousestrain. Behav. Brain. Res. 216, 446–451 (2011).
32. Bailey, K. R. & Crawley, J. N. in Methods in Neuroscience 2nd Edn (ed.Buccafusco, J. J.) (CRC Press, Buca Raton, Fl, USA, 2009).
33. Moy, S. S. et al. Mouse behavioral tasks relevant to autism: phenotypes of 10inbred strains. Behav. Brain. Res. 176, 4–20 (2007).
NATURE COMMUNICATIONS | DOI: 10.1038/ncomms3018 ARTICLE
NATURE COMMUNICATIONS | 4:2018 | DOI: 10.1038/ncomms3018 | www.nature.com/naturecommunications 9
& 2013 Macmillan Publishers Limited. All rights reserved.

34. Fonio, E., Golani, I. & Benjamini, Y. Measuring behavior of animal models:faults and remedies. Nat. Methods 9, 1167–1170 (2012).
35. Fonio, E., Benjamini, Y. & Golani, I. Short and long term measures of anxietyexhibit opposite results. PLoS ONE 7, e48414 (2012).
36. Uhrich, J. The social hierarchy in albino mice. J. Comp. Psychol. 25, 373–413(1938).
37. Kaliste-Korhonen, E. & Eskola, S. Fighting in NIH/S male mice: consequencesfor behaviour in resident-intruder tests and physiological parameters. Lab.Anim. 34, 189–198 (2000).
38. Stowers, L., Holy, T. E., Meister, M., Dulac, C. & Koentges, G. Loss of sexdiscrimination and male-male aggression in mice deficient for TRP2. Science295, 1493–1500 (2002).
39. Bucan, M. & Abel, T. The mouse: Genetics meets behaviour. Nat. Rev. Genet. 3,114–123 (2002).
40. Berdahl, A., Torney, C. J., Ioannou, C. C., Faria, J. J. & Couzin, I. D. EmergentSensing of Complex Environments by Mobile Animal Groups. Science 339,574–576 (2013).
41. Serradj, N. & Jamon, M. The adaptation of limb kinematics to increasingwalking speeds in freely moving mice 129/Sv and C57BL/6. Behav. Brain. Res.201, 59–65 (2009).
42. Niell, C. M. & Stryker, M. P. Modulation of visual responses by behavioral statein mouse visual cortex. Neuron 65, 472–479 (2010).
43. Izar, P., Ferreira, R. G. & Sato, T. Describing the organization of dominancerelationships by dominance-directed tree method. Am. J. Primatol. 68, 189–207(2006).
AcknowledgementsWe thank A. Jahanfard and B. Pasmantirer for mechanical designs; A. Harmelin and hisstaff for their veterinary support; Y. Toledo and G. Gitliz for software designs and
technical supports; and G. Brodsky for art designs. N. Barak for data analysis assistant;N.Sobel for the advice and professional support; B. Nadler and Y. Dudai for thehelpful advice on the manuscript; E. Domany and T. Flash for their assistance with theinitial data analysis. This work was supported by the DoD US Army Autism ResearchProgram - Resource Development Award no. AR100419 (T.K), Yeda-Sela grant (T.K),Jonathan Birbach Foundation (T.K.) and the Israel Science Foundation-Grant no. 1694/10 (O.F.).
Author contributionsT.K. conceived the project and together with A.W., designed and constructed theexperimental setting. G.V., A.S. and O.F., with the help of A.Y. and L.H., wrote the dataanalysis software. T.K., together with A.W., M.D. and L.E., performed the experimentsand T.K., A.W., O.F. and G.V wrote the paper. O.F. is the incumbent of the Shlomo andMichla Tomarin Career Development Chair and supported by the Clore Foundation.T.K is the incumbent of the Joanathan Birnbach Career Development Chair.
Additional informationSupplementary Information accompanies this paper at http://www.nature.com/naturecommunications
Competing financial interests: The authors declare no competing financial interests.
Reprints and permission information is available online at http://npg.nature.com/reprintsandpermissions/
How to cite this article: Weissbrod, A. et al. Automated long-term tracking and socialbehavioural phenotyping of animal colonies within a semi-natural environment. Nat.Commun. 4:2018 doi: 10.1038/ncomms3018 (2013).
ARTICLE NATURE COMMUNICATIONS | DOI: 10.1038/ncomms3018
10 NATURE COMMUNICATIONS | 4:2018 | DOI: 10.1038/ncomms3018 | www.nature.com/naturecommunications
& 2013 Macmillan Publishers Limited. All rights reserved.