Naturalisation and socioeconomic integration: The Case of the Netherlands
28
IZA DP No. 2153 Naturalisation and Socioeconomic Integration: The Case of the Netherlands Pieter Bevelander Justus Veenman DISCUSSION PAPER SERIES Forschungsinstitut zur Zukunft der Arbeit Institute for the Study of Labor May 2006
-
Upload
independent -
Category
Documents
-
view
1 -
download
0
Transcript of Naturalisation and socioeconomic integration: The Case of the Netherlands
IZA DP No. 2153
Naturalisation and Socioeconomic Integration:The Case of the Netherlands
Pieter BevelanderJustus Veenman
DI
SC
US
SI
ON
PA
PE
R S
ER
IE
S
Forschungsinstitutzur Zukunft der ArbeitInstitute for the Studyof Labor
May 2006
Naturalisation and Socioeconomic
Integration: The Case of the Netherlands
Pieter Bevelander IMER, Malmö University
and IZA Bonn
Justus Veenman Erasmus University Rotterdam
Discussion Paper No. 2153 May 2006
IZA
P.O. Box 7240 53072 Bonn
Germany
Phone: +49-228-3894-0 Fax: +49-228-3894-180
Email: [email protected]
Any opinions expressed here are those of the author(s) and not those of the institute. Research disseminated by IZA may include views on policy, but the institute itself takes no institutional policy positions. The Institute for the Study of Labor (IZA) in Bonn is a local and virtual international research center and a place of communication between science, politics and business. IZA is an independent nonprofit company supported by Deutsche Post World Net. The center is associated with the University of Bonn and offers a stimulating research environment through its research networks, research support, and visitors and doctoral programs. IZA engages in (i) original and internationally competitive research in all fields of labor economics, (ii) development of policy concepts, and (iii) dissemination of research results and concepts to the interested public. IZA Discussion Papers often represent preliminary work and are circulated to encourage discussion. Citation of such a paper should account for its provisional character. A revised version may be available directly from the author.
IZA Discussion Paper No. 2153 May 2006
ABSTRACT
Naturalisation and Socioeconomic Integration: The Case of the Netherlands*
This paper investigates Dutch immigrants’ naturalisation decision and how naturalisation affects their employment chances and wages in the Netherlands. The population under consideration consists mainly of refugees from Afghanistan, Iran, Iraq, Somalia and former Yugoslavia, and a minority of immigrants from Turkey and Morocco. The data used come from the Dutch survey ‘Social Position and Use of Public Utilities by Migrants’ for the years 2002 and 2003. A multivariate analysis shows that higher educational levels and having obtained an education in the Netherlands positively affects naturalisation. In turn naturalisation is positively related to the job chances among immigrants and refugees. It is also positively related to wages among refugees, but not among Mediterranean immigrants who came to the Netherlands for various reasons. JEL Classification: F22 J61 J68 Keywords: immigration, naturalisation, citizenship, socio-economic integration Corresponding author: Pieter Bevelander IMER Malmö University 205 06 Malmö Sweden Email: [email protected]
* We thank Don DeVoretz and an anonymous reviewer for earlier comments on the paper and acknowledge the Volkswagen Foundation for its financial support to IZA's Diversity Project.
1. Introduction
Since the middle of the last century the Netherlands has received an
increasing number of immigrants, which has made it a net-immigration country.
During the last two decades immigration in the Netherlands consists to a high
degree of refugees. This made the issue of naturalisation more actual, as it did in
other EU-countries where the number of naturalisations sharply increased during
the 1990s. The Netherlands has a high number of naturalisations relative to other
EU-countries. For instance in 1997 360,000 people obtained another nationality in
one of the EU-countries. After France (84,000) and Germany (83,000) the
Netherlands has the highest number of naturalisations (60,000), far ahead of e.g.
Great-Britain (28,000), Sweden (25,000) and Belgium (22,000). In 1997 France,
Germany and the Netherlands accounted for two-third of the EU-total number of
naturalisations (Van der Erf, 2000:1-2). Relative to the number of inhabitants that
could have opted for naturalisation, the Netherlands had the highest proportion
(almost 9%). Now Sweden comes next with 5.5%, far before e.g. France (1.5%)
and Germany (1.1%) (ibidem:2).
In general the extent to which naturalisation is requested, depends both on
the legal status of ‘non-nationals’ and on the opportunity a country offers to
obtain its legal citizenship. In connection to the legal status (or juridical rights)
one can isolate several features including the jus sangunis or jus soli framework
(the latter applies in the Netherlands), the residence right, the right to vote and to
be voted in all elections and not just in local elections, and unrestricted movement
within the EU. The possibility to obtain Dutch citizenship depends among other
things on individual characteristics like age, duration of legal residence, conduct,
and the degree of integration in the receiving country. However, in particular the
maintenance of the original nationality affected naturalisation in the Netherlands.
Unless it was prevented by legislation on nationality in the country of origin (as in
the case of Morocco), those who opted for Dutch citizenship lost their original
nationality. This general requirement was applied more flexible since 1992, in
advance of a change of law proposed by the government. Because the new
3
citizenship law was not accepted by the Dutch Parliament, the rules reverted to the
strict policy of single citizenship after October 1997.
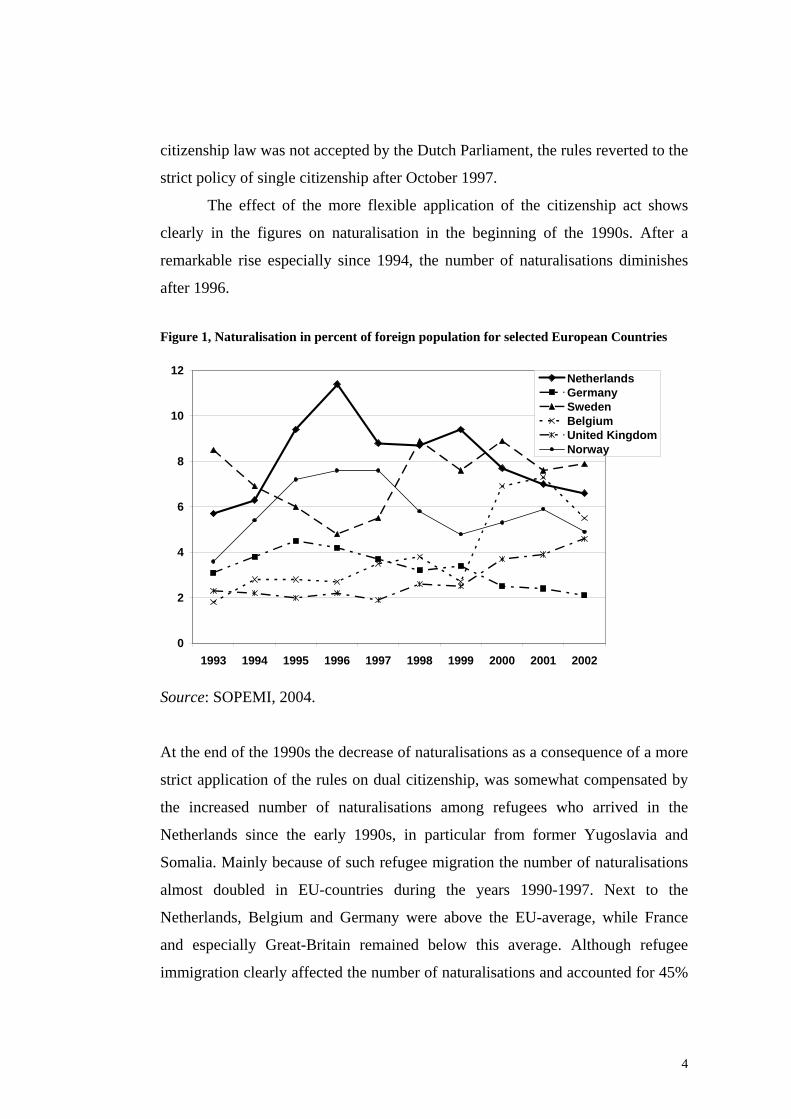
The effect of the more flexible application of the citizenship act shows
clearly in the figures on naturalisation in the beginning of the 1990s. After a
remarkable rise especially since 1994, the number of naturalisations diminishes
after 1996.
Figure 1, Naturalisation in percent of foreign population for selected European Countries
0
2
4
6
8
10
12
1993 1994 1995 1996 1997 1998 1999 2000 2001 2002
NetherlandsGermanySwedenBelgiumUnited KingdomNorway
Source: SOPEMI, 2004.
At the end of the 1990s the decrease of naturalisations as a consequence of a more
strict application of the rules on dual citizenship, was somewhat compensated by
the increased number of naturalisations among refugees who arrived in the
Netherlands since the early 1990s, in particular from former Yugoslavia and
Somalia. Mainly because of such refugee migration the number of naturalisations
almost doubled in EU-countries during the years 1990-1997. Next to the
Netherlands, Belgium and Germany were above the EU-average, while France
and especially Great-Britain remained below this average. Although refugee
immigration clearly affected the number of naturalisations and accounted for 45%
4
of all naturalisations in the Netherlands in 1998, the non-refugees, such as Turks
(23%) and Moroccans (19%), still obtain the highest rates by country of origin
(Van der Erf, 2000). For this reason we will also include these immigrant groups
in our analysis.
Considering immigrant integration problems, the Dutch government has opted for
a more restrictive migration and naturalisation policy at the beginning of the new
century. At the moment there are two procedures for obtaining Dutch nationality.
The first is the option procedure, which is meant for those of age (a) who were
born in the Netherlands and have lived there (or in the Dutch Antilles or Aruba)
continuously since birth or for at least three years if the person was stateless, or
(b) who have legally lived there since age 4, or (c) who are former Dutch citizens
and have lived there for at least one year on the basis of a permanent residence
permit or a residence permit for a non-temporary residence objective, or (d) who
have been married to a Dutch national for at least three years and have legally
lived there for an uninterrupted period of at least 15 years, or (e) who are 65 or
over and have legally lived there for an uninterrupted period of at least 15 years.
The option procedure is also applicable to minors who are acknowledged by a
Dutch citizen and have been cared for and brought up by this Dutch citizen for an
uninterrupted period of at least three years.1
A person is eligible for naturalisation if he or she has had a residence
permit and in addition meets all the following conditions: (a) being of age, (b)
having lived in the Netherlands, the Dutch Antilles or Aruba for an uninterrupted
period of 5 years with a valid residence permit, (c) being sufficiently integrated in
Dutch society and able to read, write, speak and understand Dutch, all of which
should be proven by taking a naturalisation test2, (d) having no record of a
1 The same condition applies to minors who are under the joint custody of a non-Dutch father or mother and spouse is a Dutch citizen. 2 An exemption will be made for those who have successfully completed an integration course (at NT2-level 2) or have attained another diploma. As of 15 March 2006 a civic integration examination abroad was introduced. As of this date migrants wishing to settle in the Netherlands for, in particular, the purposes of marrying or forming a relationship will be required to take the examination. Besides, their partner’s income should be at least 120% of the minimum-wage.
5
custodial sentence or a substantial monetary fine, and (e) being prepared to
remove his or her current nationality. If the immigrant does not give up his or her
current nationality, Dutch nationality will be revoked. There are however some
exceptions to giving up the current nationality. This still has to do with legislation
on nationality in the country of origin, or with the immigrant’s inability to contact
the authorities in the country of which the immigrant is a national.3
2. Frame of reference
If we assume that the decision to acquire another nationality is mainly
based on rational calculations, one should know the net-balance of advantages and
disadvantages of naturalisation to fully understand the phenomenon. While losing
the original nationality often can be considered as the most important
disadvantage, the first positive effect of becoming a Dutch citizen is the
possibility to obtain a Dutch passport and therefore to travel freely within the EU.
The second consequence is that the immigrant is entitled to vote in general
elections.4 In relation to the labour market the most important consequence
probably is that those with Dutch nationality are no longer a foreign national. This
formally increases job chances in e.g. the civil service, the police, the justice
system and the military which are only open for Dutch nationals. For this reason
one can expect improved job chances for those who have acquired naturalisation.
Although an individual cost/benefit-analysis offers an interesting
perspective to study the naturalisation decision, Yang (1994:450) argues that this
is not the starting point of most studies on naturalisation. Much of the existing
research focuses on the influence of immigrants’ integration into the receiving
country on their acquirement of naturalisation. In relation to this, Yang
distinguishes two research traditions. The first one stresses the role of
3 Other exceptions apply to cases in which the state of which the immigrant is a national, is not recognised by the Netherlands or in which the immigrant is originally an Italian or French national and is part of one of the target groups of the so-called Second Protocol. 4 Non-EU legal inhabitants of the Netherlands without Dutch nationality are only entitled to vote and seek office in municipal elections.
6
socioeconomic achievements in the naturalisation process. The second tradition
emphasises the influence of immigrants’ cultural adaptation to the host society as
well as his or her demographic characteristics. Yang notices that, despite their
differences, both research traditions use immigrants’ characteristics as predictors
of their naturalisation and both view naturalisation as an outcome of immigrants’
successful integration into the receiving country, be it on different dimensions of
integration.
A shortcoming of both traditions is the omission of a cost/benefit-analysis
to predict naturalisation. As stated before, the costs could be related to giving up
the original nationality, which means losing the status of citizenship in the country
of origin. This also implies losing Dutch remigration facilities (such as a return
premium), and can imply the loss of a claim on inheritance or real estate in the
country of origin. Furthermore, the costs may include the time and money
invested in Dutch language courses and tests before the immigrant is allowed to
start the naturalisation procedure. Looking at the aforementioned direct benefits of
naturalisation, in particular in relation to the labour market, we could turn round
the causal relation between socioeconomic status and naturalisation. Instead of
being the result of immigrants’ socioeconomic integration, naturalisation might be
the cause of it. It is the purpose of this chapter to shed some light on this
relationship in the context of the Netherlands. In other words, we hope to find an
answer to two research questions, viz.: (1) Which factors may be considered as
causes of naturalisation?, and (2) Has naturalisation positive effects on the job
chances and earnings of immigrants, and therefore on their socioeconomic
status?5 A reservation should be made in relation to our research question,
however, since we do not have paneldata or data on the naturalisation moment.
Strictly spoken, it is impossible to discern causal relationships. Nonetheless we try
5 The extent to which rational calculations of costs and benefits determine the naturalisation decision will vary across individuals. This variation can explain individual differences in the request to naturalise. Unfortunately, we do not have data that contain information on the perceived costs and benefits. We are therefore not able to study the effects of these factors directly, but will try to involve these factors in our explanation of naturalisation.
7
to find out which empirical correlations exist in relation to naturalisation in the
Netherlands.
In the Netherlands research on immigrants’ labour market integration is extensive.
The causes and consequences of naturalisation on the contrary have been rarely
studied from an economic perspective. Only Bevelander and Veenman (2005)
have elaborated on the relationship between naturalisation and the socioeconomic
integration of Turks and Moroccans. In a multivariate analysis they found only a
weak relation between cultural integration and naturalisation. Controlling for
various individual characteristics they show that age, age at migration and
education influences the propensity of naturalisation among Turkish and
Moroccan immigrants. In addition, gender affects the likelihood of obtaining
Dutch citizenship. Turkish and Moroccan women who score high on a
‘modernisation’ scale and Moroccan women who identify themselves as ‘Dutch’,
have a significantly higher probability to naturalise.
3. Some stylized facts
With the exception of 1967, the Netherlands has been a net-immigration
country since the 1960s. From this time up to the 1990s immigration was
dominated by four immigrant groups, and still the majority, about 70 percent of
the immigrants and their descendents, come from Turkey and Morocco (the
Mediterraneans), and from Suriname and the Dutch Antilles (the Caribbeans). The
latter were or still are Dutch colonies and therefore most Surinamese immigrants
and all Antilleans have Dutch nationality. For this reason we exclude the latter
and focus on the migration history and naturalisation rate of Turks and
Moroccans. In the 1990s, however, the Dutch immigration scene changed as
refugee flows started to dominate. We will also describe the migration history and
naturalisation rate of the five largest refugee groups in the Netherlands: the
Afghans, Iraqis, Iranians, former Yugoslavs and Somalis.
The first immigrants from Turkey arrived in the beginning of the 1960s via
Germany and Belgium, relieving the unskilled and low-skilled labor shortage in
8
the Netherlands. The migration movement was more institutionalized in 1964
when a labor recruitment agreement between the Netherlands and Turkey was
entered. The number of Turkish labor migrants, mainly target earners, increased
rapidly peaked in the early 1970s. At the end of 1973 labor market recruitment
came to an end when Turks were no longer admitted as labor migrants. This
however did not diminish the number of immigrants from Turkey to the
Netherlands, given increased family reunification and later family formation. The
rise in immigration since the middle of the 1980s is caused by the children of the
labor migrants marrying brides and bridegrooms from Turkey. Furthermore, since
the 1970s a number of Turkish refugees for religious or political reasons entered
the Netherlands. The number of Turks in the Netherlands is around 351,000 in
2004, 45 percent of them are born in the Netherlands.
Since the middle of the 1960s the immigration from Morocco to the
Netherlands consisted of 3,000 individuals annually. Until the first oil crisis in
1973, mostly men with poor educational background who were recruited through
the agency of the Moroccan government, immigrated and thereby alleviated the
growing need of low-skilled workers in the Dutch industry. Initially most
Moroccans did unskilled work in cleaning companies and in the metal, timber and
food industries. The dominant idea was that their stay in the Netherlands would
only be temporary, since many of them would like to return and start their own
business at home with the savings derived from working in the Netherlands.
However, since 1973 when labor recruitment was stopped by the Dutch
government, family reunification of women and children became the primary
form of immigration. The majority of the Moroccan immigrants came from the
Rif-area, which is one of the more traditional parts of the country. This explains
why their educational level was low and why they were little prepared to
participate in the Dutch society. Family reunification migration reached its peak in
the first half of the 1980s, while at the same time a third kind of migration started,
viz. marriage migration. The educational background of these recent immigrants
is higher than of earlier Moroccan immigrants. Approximately 306,000
9
Moroccans lived in the Netherlands in the year 2004. Almost 46 percent of them
belong to the second generation.
Immigrants from Afghanistan came mainly during the second half of the
1990s and sought asylum in the Netherlands as a consequence of war. From 1994
to 2002, asylum seekers from Afghanistan were given a residence permit without
further scrutiny. Since 2002 refugee applications by individuals from Afghanistan
are examined individually. The Afghan population in the Netherlands is relatively
young and less educated than the Dutch population. The low economic integration
of this group is also due to the relatively short stay in the Netherlands. In 2004
36,043 individuals from Afghanistan and their children lived in the Netherlands.
The so called ‘second generation’ holds 11 percent of the total Afghan population
in the Netherlands.
Refugees from Iraq came mainly in the second half of the 1990s and
sought asylum due to political reasons and war. They came partly as quota
refugees sent by UNHCR and partly as spontaneous refugees as well as reunified
family members. The Iraqi population in the Netherlands increased by seven times
between 1996 and 2004. It is a young immigrant group, like the Afghan
population. The Iraqis in the Netherlands are overrepresented in lower educational
categories compared to Dutch natives and only 45 percent of the population in the
ages 15-64 are gainfully employed. In the population registers of 2004 42,931
persons with an Iraqi background can be found, and 16 percent of them belong to
the ‘second generation’.
Iranians started to come in the 1980s after the ‘Islamic revolution’ in 1979.
The war with Iraq also increased the number that fled Iran. Those who were not
accepted as refugees could often stay on conditional residence permits. Since
1995 a more restrictive asylum led to a decrease in asylum seekers from Iran with
the exception for the year 2000. In comparison with the Dutch natives, Iranians in
the Netherlands have a higher educational profile with more individuals obtained
university level education. This fact however has not yet been translated into high
labour participation. The total number of Iranians and their descendants in the
10
Netherlands is 28,438 in 2004, with the ‘second generation’ accounting for 16
percent of this number.
The migration background for former Yugoslavs in the Netherlands is
diverse. This group consists of both earlier labour migrants who came to the
Netherlands in the 1960s and 1970s due to labour shortage, and refugees from
different parts of the former Yugoslavian republic due to the civil war in the early
1990s. In 2004, 76,346 individuals with roots in former Yugoslavia are living in
the Netherlands with the second generation of this group constitutes 28 percent.
The educational profile of the group is somewhat lower than for Dutch natives and
the labour participation of both males and females is just below that of natives.
The Somali immigration to the Netherlands grew in number in the 1990s
due to the civil war in Somalia. The more restrictive asylum application procedure
in 1995 led to a decrease in the number of asylum requests in the following years.
A relatively large part of the asylum seekers consists of minors, which implies
that the Somali population is relatively young. The total number of Somalis in the
Netherlands is 25,001 in 2004 of which 31 percent belongs to the second
generation. The Somali group in the Netherlands has a lower educational level and
a labour force participation of just 41 percent.
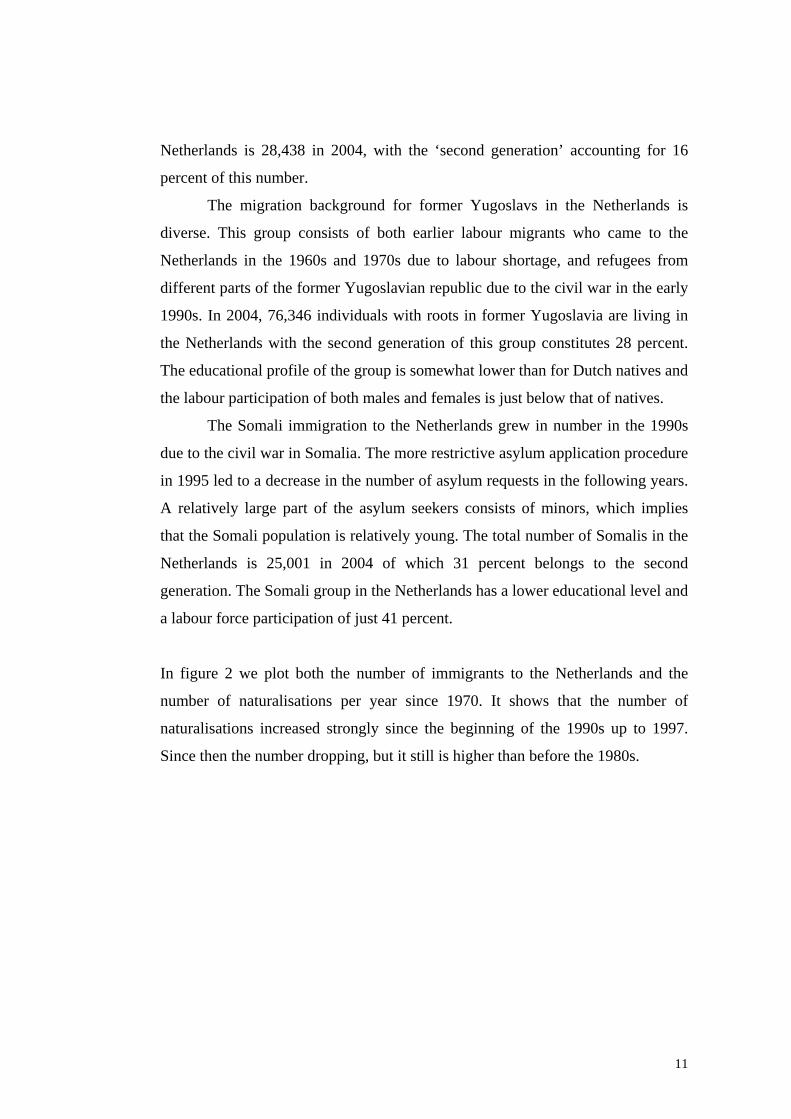
In figure 2 we plot both the number of immigrants to the Netherlands and the
number of naturalisations per year since 1970. It shows that the number of
naturalisations increased strongly since the beginning of the 1990s up to 1997.
Since then the number dropping, but it still is higher than before the 1980s.
11
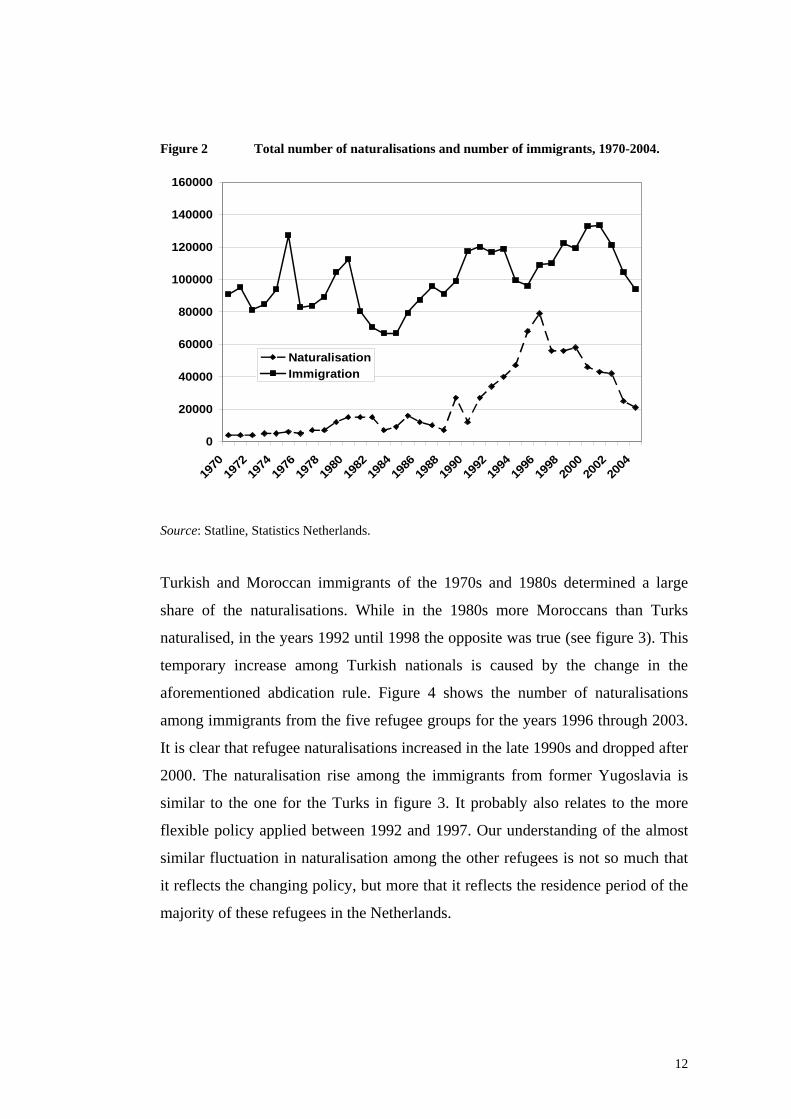
Figure 2 Total number of naturalisations and number of immigrants, 1970-2004.
0
20000
40000
60000
80000
100000
120000
140000
160000
1970
1972
1974
1976
1978
1980
1982
1984
1986
1988
1990
1992
1994
1996
1998
2000
2002
2004
NaturalisationImmigration
Source: Statline, Statistics Netherlands.
Turkish and Moroccan immigrants of the 1970s and 1980s determined a large
share of the naturalisations. While in the 1980s more Moroccans than Turks
naturalised, in the years 1992 until 1998 the opposite was true (see figure 3). This
temporary increase among Turkish nationals is caused by the change in the
aforementioned abdication rule. Figure 4 shows the number of naturalisations
among immigrants from the five refugee groups for the years 1996 through 2003.
It is clear that refugee naturalisations increased in the late 1990s and dropped after
2000. The naturalisation rise among the immigrants from former Yugoslavia is
similar to the one for the Turks in figure 3. It probably also relates to the more
flexible policy applied between 1992 and 1997. Our understanding of the almost
similar fluctuation in naturalisation among the other refugees is not so much that
it reflects the changing policy, but more that it reflects the residence period of the
majority of these refugees in the Netherlands.
12
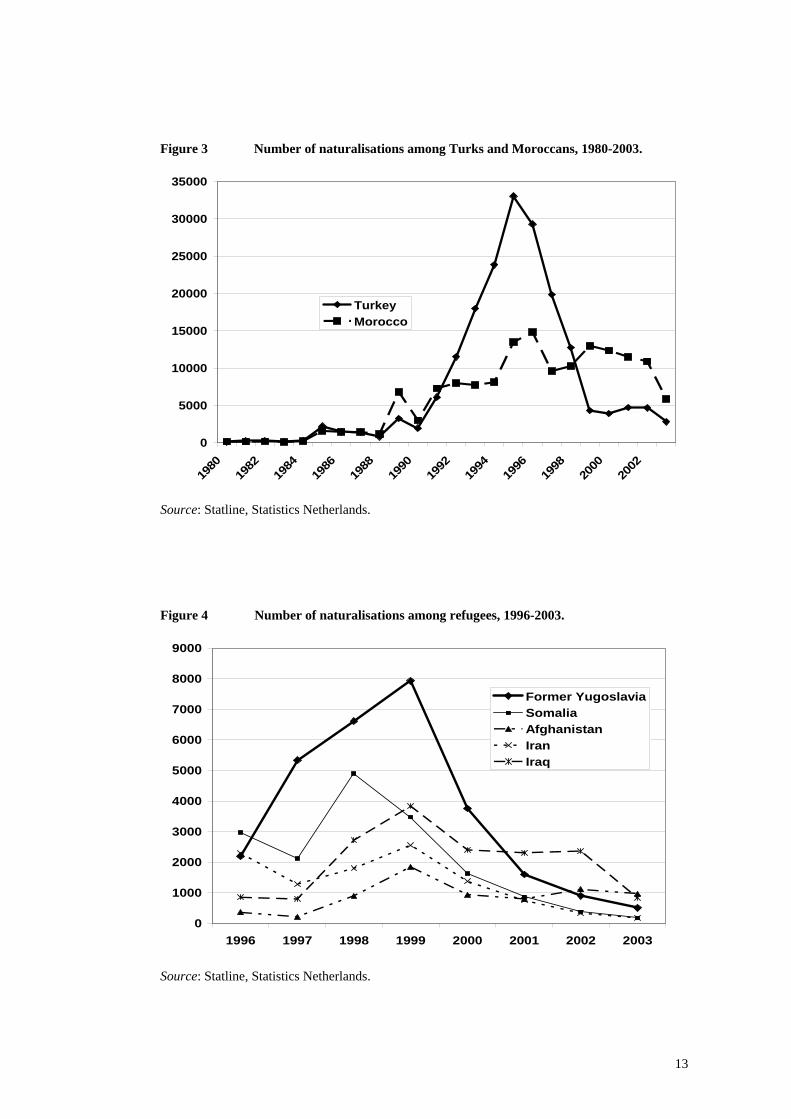
Figure 3 Number of naturalisations among Turks and Moroccans, 1980-2003.
0
5000
10000
15000
20000
25000
30000
35000
1980
1982
1984
1986
1988
1990
1992
1994
1996
1998
2000
2002
TurkeyMorocco
Source: Statline, Statistics Netherlands.
Figure 4 Number of naturalisations among refugees, 1996-2003.
0
1000
2000
3000
4000
5000
6000
7000
8000
9000
1996 1997 1998 1999 2000 2001 2002 2003
Former YugoslaviaSomaliaAfghanistanIran Iraq
Source: Statline, Statistics Netherlands.
13
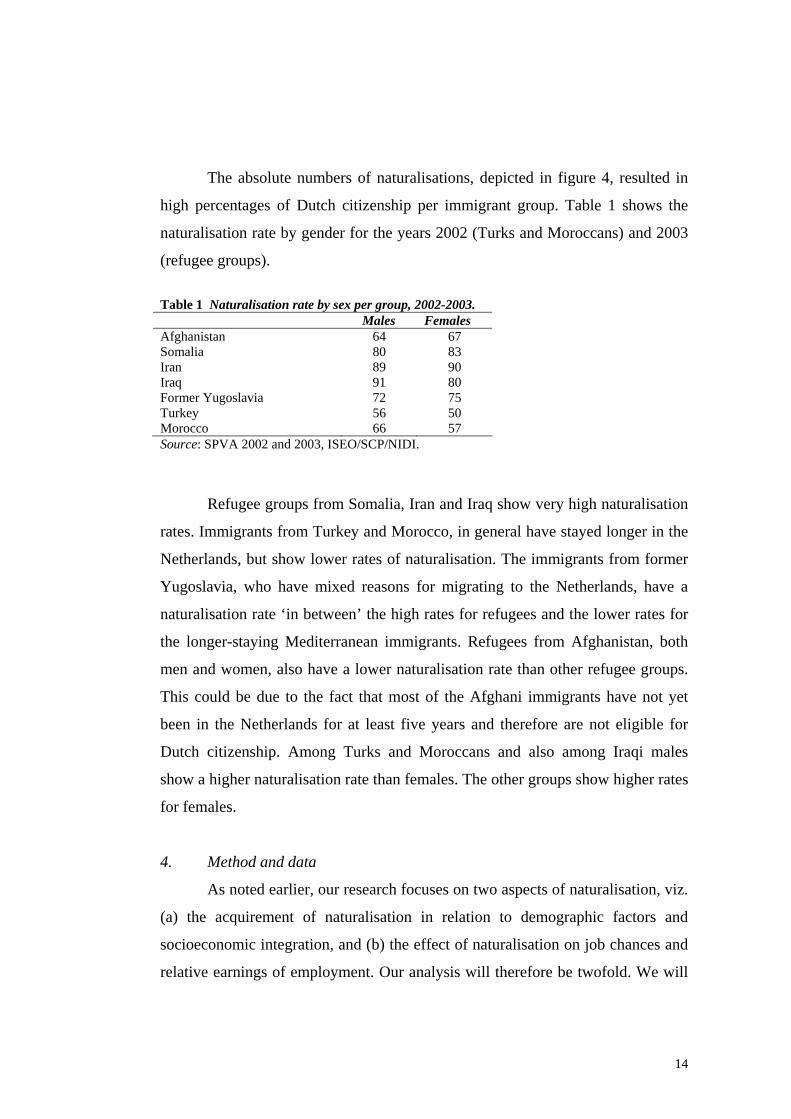
The absolute numbers of naturalisations, depicted in figure 4, resulted in
high percentages of Dutch citizenship per immigrant group. Table 1 shows the
naturalisation rate by gender for the years 2002 (Turks and Moroccans) and 2003
(refugee groups).
Table 1 Naturalisation rate by sex per group, 2002-2003. Males Females Afghanistan 64 67 Somalia 80 83 Iran 89 90 Iraq 91 80 Former Yugoslavia 72 75 Turkey 56 50 Morocco 66 57 Source: SPVA 2002 and 2003, ISEO/SCP/NIDI.
Refugee groups from Somalia, Iran and Iraq show very high naturalisation
rates. Immigrants from Turkey and Morocco, in general have stayed longer in the
Netherlands, but show lower rates of naturalisation. The immigrants from former
Yugoslavia, who have mixed reasons for migrating to the Netherlands, have a
naturalisation rate ‘in between’ the high rates for refugees and the lower rates for
the longer-staying Mediterranean immigrants. Refugees from Afghanistan, both
men and women, also have a lower naturalisation rate than other refugee groups.
This could be due to the fact that most of the Afghani immigrants have not yet
been in the Netherlands for at least five years and therefore are not eligible for
Dutch citizenship. Among Turks and Moroccans and also among Iraqi males
show a higher naturalisation rate than females. The other groups show higher rates
for females.
4. Method and data
As noted earlier, our research focuses on two aspects of naturalisation, viz.
(a) the acquirement of naturalisation in relation to demographic factors and
socioeconomic integration, and (b) the effect of naturalisation on job chances and
relative earnings of employment. Our analysis will therefore be twofold. We will
14

first elaborate on the probability of obtaining Dutch citizenship, dependent on the
individual’s socioeconomic and demographic characteristics. Secondly, we will
analyse the job chances and wages in relation to Dutch citizenship while
controlling for some other individual characteristics. As stated before, it will be
difficult to discern causal relationships since paneldata are lacking and we have
only information on the year of naturalisation for the refugee sample.
The operationalisation of the three core variables is as follows. Citizenship
status is divided into having or not having obtained Dutch citizenship.
Employment, the first dependent variable in the second part of the analysis, is
divided into having no job at all or having any kind of employment. The income
variable, which is the second dependent variable in this part of the analysis, is the
natural logarithm of monthly wages.
The analysis of obtaining Dutch citizenship also includes as independent
variables the educational level as well as demographic variables (such as age and
gender), and immigrant-specific variables (such as the country of birth, reason for
migration, years in the host country, whether education is obtained in the
Netherlands or in the home country and whether the immigrant has participated in
an ‘integration program’). Such programs are obligatory since 1998, except for
those who are under 15 years of age or meet the requirements on language and
knowledge upon arrival in the Netherlands. This implies that participation in an
integration program only differentiates for those who participated before 1998.
Unfortunately, we have no information on the year of participation.6
In the employment and earnings analysis age, gender, the country of birth,
the years the individual has been in the country, the reason for migration, the
educational level, whether or not the education is obtained in the Netherlands,
whether the immigrant has participated in an ‘integration program’, the citizenship
6 Correlation coefficients of 0.05 and 0.14 where measured for the variables naturalisation, participation in ‘integration’ program and employment indicating no endogeneity between the variables.
15
status and years since acquiring Dutch citizenship are used as explanatory
variables.7
In line with Yang (1994), the statistical analysis will comprise logistic
regressions to predict the effect of various variables on the probability of
obtaining Dutch nationality and the probability of being employed respectively.
We use OLS regressions to estimate the log-linear earnings model. Both
descriptive and earlier research on citizenship attainment and employment and
earnings of these groups will be presented and used to analyze the results of the
statistical analysis.
The data we use come from the SPVA, the survey ’Social Position and Use
of Public Utilities by Immigrants’ for the years 2002 and 2003. These surveys
have been carried out by the Institute for Sociological and Economic Research
(ISEO) of the Erasmus University in Rotterdam, the Dutch Social and Cultural
Planning Office (SCP) and the Dutch Interdisciplinary Demographic Institute
(NIDI), and aim to describe and analyse the socioeconomic and cultural
integration of the four largest immigrant groups and the five largest refugee
groups in the Netherlands. Given the geographical concentration of the migrant
population, the SPVA consists of random samples of the population in thirteen
cities, including the four largest, in the Netherlands.8 In this paper we focus on
seven groups, viz.: foreign-born immigrants from Turkey, Morocco, Afghanistan,
Former Yugoslavia, Iraq, Iran and Somalia (‘first generation’). For our analysis
we will use a weighted pooled sub-sample of SPVA which comprises the
population of these groups in the ages of 18 to 64 years and those individuals who
have been in the Netherlands for at least five years. These restrictions are due to
the Dutch legislation on naturalisation (see section 1).
7 Weekly hours worked is included as a control variable in the monthly income regressions. 8 Further detailed information for the versions of the SPVA used in this paper can be found in Groeneveld & Weijers-Martens (2003) and Van den Maagdenburg & Groeneveld (2005).
16
5. Results
A. Citizenship acquisition In Table 2 we present the results of four simple logistic regressions on the
probability of obtaining Dutch nationality by immigrants and refugees. The first
model with all immigrant groups included (first column) shows that a higher
educational level as well as having obtained education in the Netherlands has a
positive and a significant effect on the probability of obtaining Dutch nationality.
Contrary to what we expected, no significant effect is found for gender and years
of residence (beyond 5 years). When we restrict our analysis to refugee groups
(second column) and include the variables ‘integration program’ and migration
reason, we find no significant effect for participation in an ‘integration program’.
Refugees who have fled from war or came for political reasons as well as family
reunion-migrants have a significantly higher probability of obtaining Dutch
citizenship. Women from refugee countries have a higher probability of ascending
to Dutch citizenship. Increasing years of residence is also positively and
significantly related to Dutch citizenship acquisition
In model 2 of the same table the different groups are included as a
variable. The model is again subdivided in one with all countries (column 3) and
one with only the refugee groups and some extra explanatory variables (column
4). In the regression including all countries we find that most of the earlier
included variables are significant and in this case this also applies to the variable
for years of residence. When we include country of birth, we find that refugees
have a higher probability of obtaining Dutch citizenship than Mediterranean
immigrants. This confirms the differences in naturalisation rate observed in Table
2. The analysis that only includes refugee groups shows once more that
participation in an ‘integration program’ has no significant effect on the
17
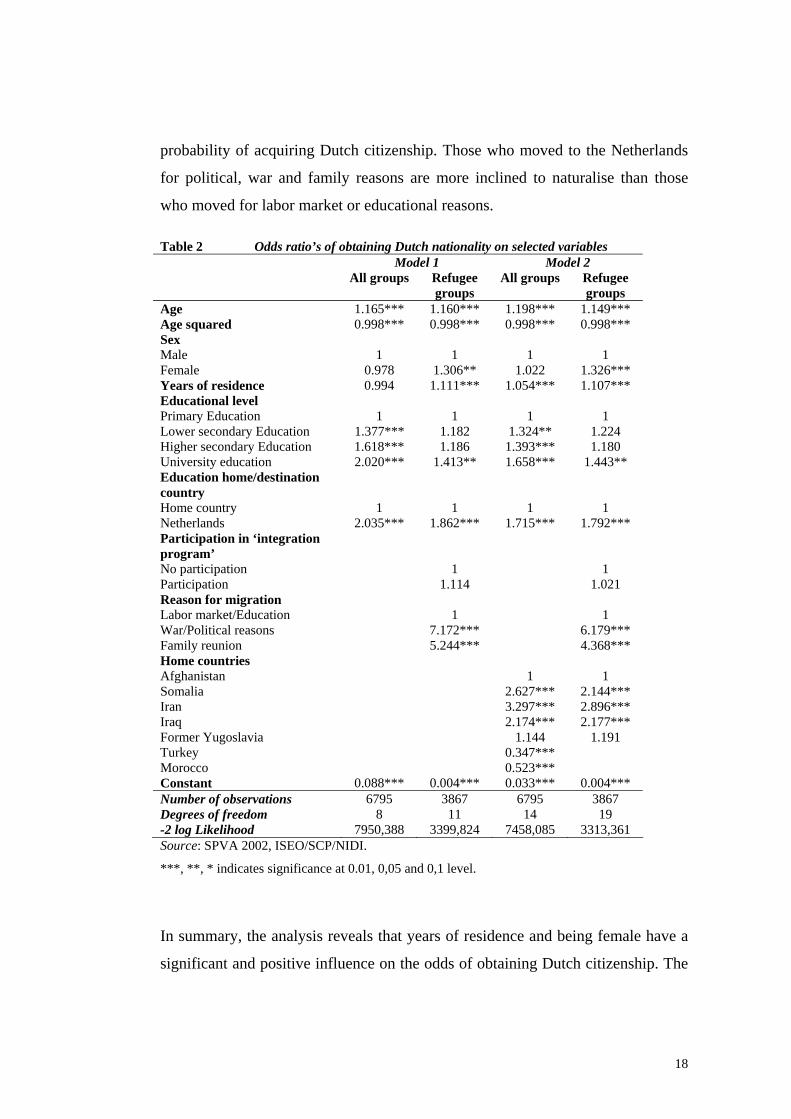
probability of acquiring Dutch citizenship. Those who moved to the Netherlands
for political, war and family reasons are more inclined to naturalise than those
who moved for labor market or educational reasons. Table 2 Odds ratio’s of obtaining Dutch nationality on selected variables Model 1 Model 2 All groups Refugee
groups All groups Refugee
groups Age 1.165*** 1.160*** 1.198*** 1.149*** Age squared 0.998*** 0.998*** 0.998*** 0.998*** Sex Male 1 1 1 1 Female 0.978 1.306** 1.022 1.326*** Years of residence 0.994 1.111*** 1.054*** 1.107*** Educational level Primary Education 1 1 1 1 Lower secondary Education 1.377*** 1.182 1.324** 1.224 Higher secondary Education 1.618*** 1.186 1.393*** 1.180 University education 2.020*** 1.413** 1.658*** 1.443** Education home/destination country
Home country 1 1 1 1 Netherlands 2.035*** 1.862*** 1.715*** 1.792*** Participation in ‘integration program’
No participation 1 1 Participation 1.114 1.021 Reason for migration Labor market/Education 1 1 War/Political reasons 7.172*** 6.179*** Family reunion 5.244*** 4.368*** Home countries Afghanistan 1 1 Somalia 2.627*** 2.144*** Iran 3.297*** 2.896*** Iraq 2.174*** 2.177*** Former Yugoslavia 1.144 1.191 Turkey 0.347*** Morocco 0.523*** Constant 0.088*** 0.004*** 0.033*** 0.004*** Number of observations 6795 3867 6795 3867 Degrees of freedom 8 11 14 19 -2 log Likelihood 7950,388 3399,824 7458,085 3313,361 Source: SPVA 2002, ISEO/SCP/NIDI.
***, **, * indicates significance at 0.01, 0,05 and 0,1 level.
In summary, the analysis reveals that years of residence and being female have a
significant and positive influence on the odds of obtaining Dutch citizenship. The
18
finding that women have a higher probability of obtaining Dutch citizenship is
divergent from the seminal work by Yang (1993) and other studies in this volume
(DeVoretz and Pivnenko, 2004). A regression including the interaction between
gender and immigrant group showed that only women from Turkey have a
significantly higher probability of acquiring Dutch citizenship.9 The educational
level of the immigrant as well as whether he or she received their education in the
Netherlands had a strong impact on the probability to naturalise. Contrary to what
we expected, participation in an ‘integration program’ does not increase the log
odds to naturalise. More important for naturalisation is the migration reason and
the admission status of the migrant. We found a huge significant probability to
naturalise when the immigrant came to the Netherlands for political/war reasons
or because of family reunion.
B. Citizenship and employment
We now want to find out whether naturalisation affects the labor market
outcomes of immigrants. We therefore wish to answer the question whether there
are differences in job chances between immigrants with an original nationality and
immigrants with Dutch or dual nationality. Bevelander (2000) and others expected
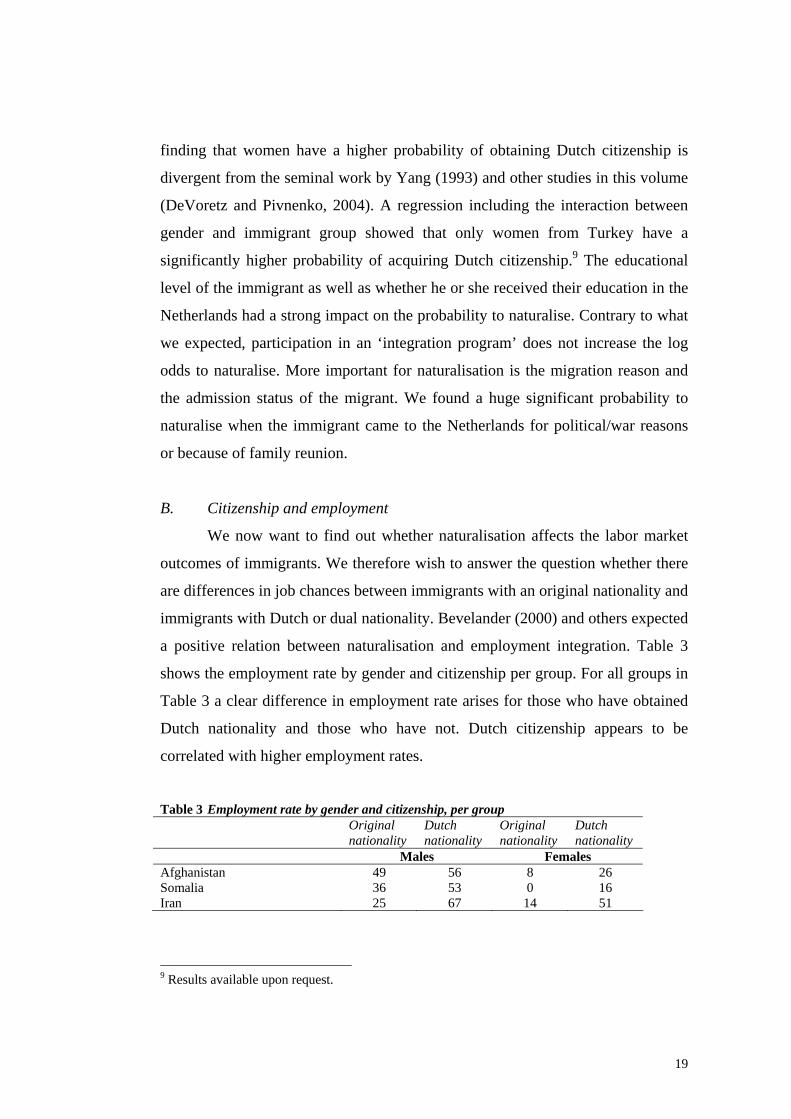
a positive relation between naturalisation and employment integration. Table 3
shows the employment rate by gender and citizenship per group. For all groups in
Table 3 a clear difference in employment rate arises for those who have obtained
Dutch nationality and those who have not. Dutch citizenship appears to be
correlated with higher employment rates.
Table 3 Employment rate by gender and citizenship, per group Original
nationality Dutch nationality
Original nationality
Dutch nationality
Males Females Afghanistan 49 56 8 26 Somalia 36 53 0 16 Iran 25 67 14 51
9 Results available upon request.
19
Iraq 20 49 8 23 Former Yugoslavia 58 71 47 59 Turkey 59 64 21 36 Morocco 47 62 14 34 Source: SPVA 2002 and 2003, ISEO/SCP/NIDI.
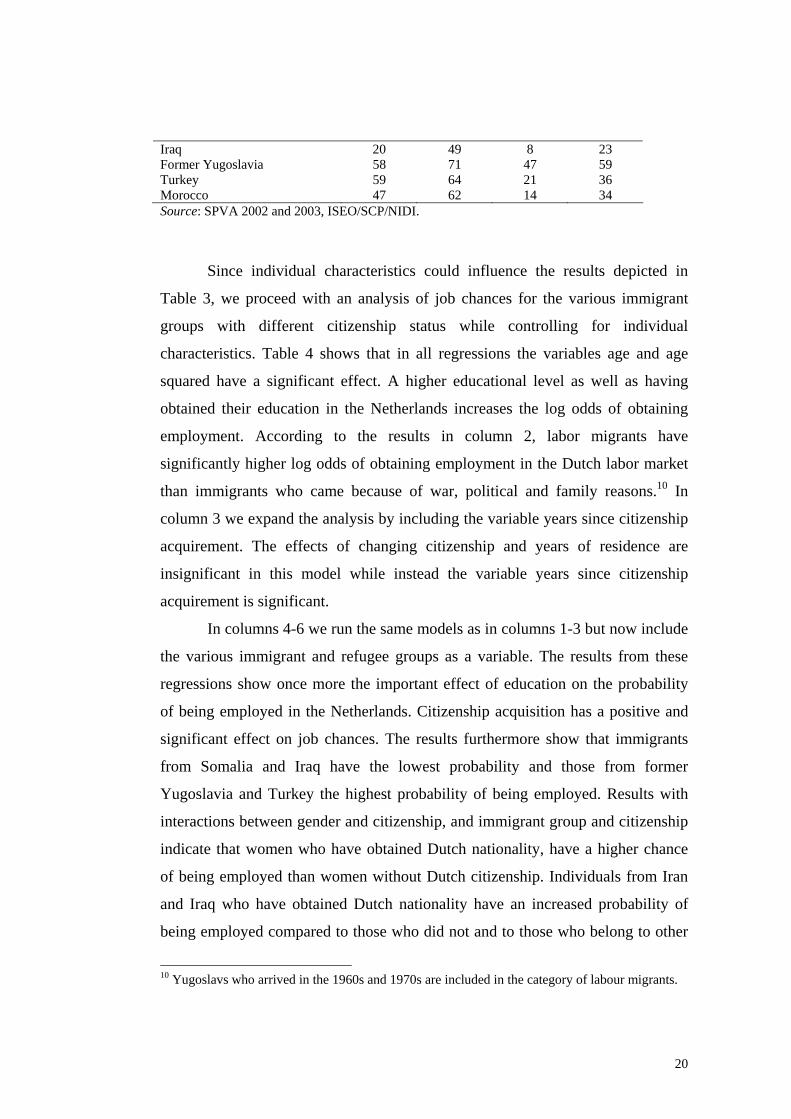
Since individual characteristics could influence the results depicted in
Table 3, we proceed with an analysis of job chances for the various immigrant
groups with different citizenship status while controlling for individual
characteristics. Table 4 shows that in all regressions the variables age and age
squared have a significant effect. A higher educational level as well as having
obtained their education in the Netherlands increases the log odds of obtaining
employment. According to the results in column 2, labor migrants have
significantly higher log odds of obtaining employment in the Dutch labor market
than immigrants who came because of war, political and family reasons.10 In
column 3 we expand the analysis by including the variable years since citizenship
acquirement. The effects of changing citizenship and years of residence are
insignificant in this model while instead the variable years since citizenship
acquirement is significant.
In columns 4-6 we run the same models as in columns 1-3 but now include
the various immigrant and refugee groups as a variable. The results from these
regressions show once more the important effect of education on the probability
of being employed in the Netherlands. Citizenship acquisition has a positive and
significant effect on job chances. The results furthermore show that immigrants
from Somalia and Iraq have the lowest probability and those from former
Yugoslavia and Turkey the highest probability of being employed. Results with
interactions between gender and citizenship, and immigrant group and citizenship
indicate that women who have obtained Dutch nationality, have a higher chance
of being employed than women without Dutch citizenship. Individuals from Iran
and Iraq who have obtained Dutch nationality have an increased probability of
being employed compared to those who did not and to those who belong to other
10 Yugoslavs who arrived in the 1960s and 1970s are included in the category of labour migrants.
20
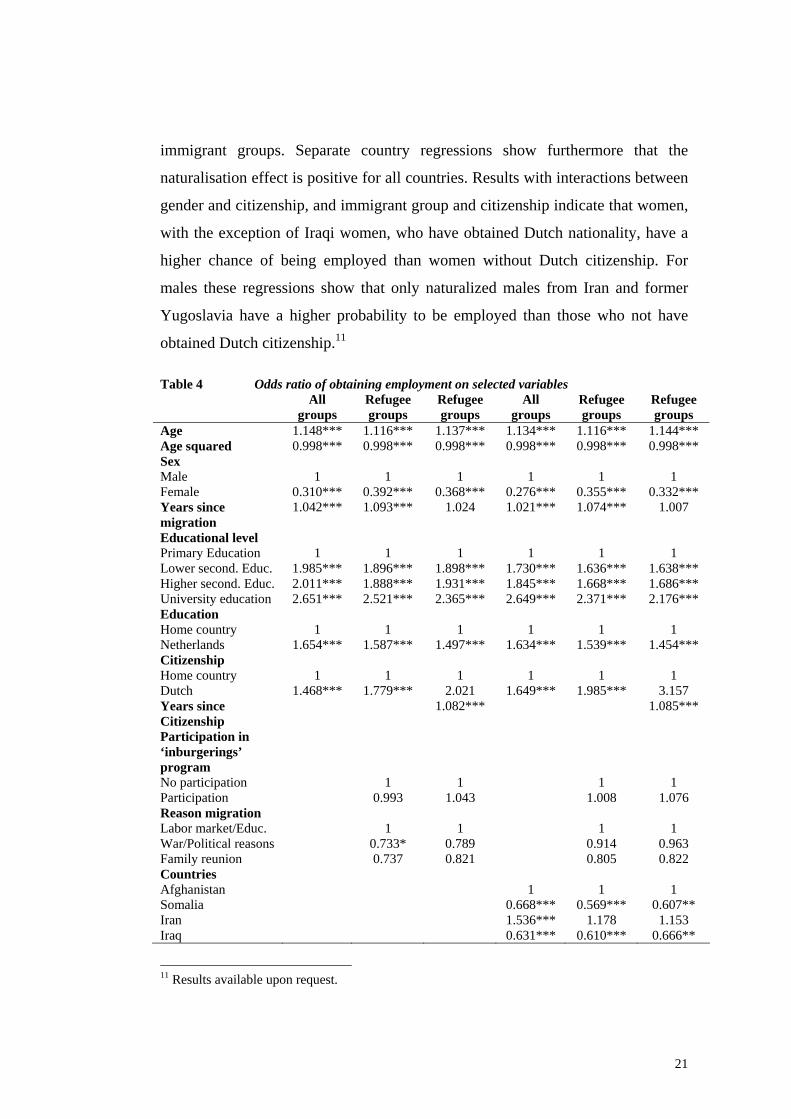
immigrant groups. Separate country regressions show furthermore that the
naturalisation effect is positive for all countries. Results with interactions between
gender and citizenship, and immigrant group and citizenship indicate that women,
with the exception of Iraqi women, who have obtained Dutch nationality, have a
higher chance of being employed than women without Dutch citizenship. For
males these regressions show that only naturalized males from Iran and former
Yugoslavia have a higher probability to be employed than those who not have
obtained Dutch citizenship.11
Table 4 Odds ratio of obtaining employment on selected variables All
groups Refugee groups
Refugee groups
All groups
Refugee groups
Refugee groups
Age 1.148*** 1.116*** 1.137*** 1.134*** 1.116*** 1.144*** Age squared 0.998*** 0.998*** 0.998*** 0.998*** 0.998*** 0.998*** Sex Male 1 1 1 1 1 1 Female 0.310*** 0.392*** 0.368*** 0.276*** 0.355*** 0.332*** Years since migration
1.042*** 1.093*** 1.024 1.021*** 1.074*** 1.007
Educational level Primary Education 1 1 1 1 1 1 Lower second. Educ. 1.985*** 1.896*** 1.898*** 1.730*** 1.636*** 1.638*** Higher second. Educ. 2.011*** 1.888*** 1.931*** 1.845*** 1.668*** 1.686*** University education 2.651*** 2.521*** 2.365*** 2.649*** 2.371*** 2.176*** Education Home country 1 1 1 1 1 1 Netherlands 1.654*** 1.587*** 1.497*** 1.634*** 1.539*** 1.454*** Citizenship Home country 1 1 1 1 1 1 Dutch 1.468*** 1.779*** 2.021 1.649*** 1.985*** 3.157 Years since Citizenship
1.082*** 1.085***
Participation in ‘inburgerings’ program
No participation 1 1 1 1 Participation 0.993 1.043 1.008 1.076 Reason migration Labor market/Educ. 1 1 1 1 War/Political reasons 0.733* 0.789 0.914 0.963 Family reunion 0.737 0.821 0.805 0.822 Countries Afghanistan 1 1 1 Somalia 0.668*** 0.569*** 0.607** Iran 1.536*** 1.178 1.153 Iraq 0.631*** 0.610*** 0.666**
11 Results available upon request.
21
Former Yugoslavia 2.968*** 2.069*** 2.002*** Turkey 1.810*** Morocco 1.496*** Constant 0.056*** 0.021*** 0.013* 0.076*** 0.022*** 0.006** Observations 6795 3867 3867 6795 3867 3867 D. of freedom 9 12 13 15 16 17 -2 log likelihood 7920,392 4182,306 2744,60 7674,372 4053,586 2674,188 Source: SPVA 2002, ISEO/SCP/NIDI.
***, **, * indicates significance at 0.01, 0,05 and 0,1 level.
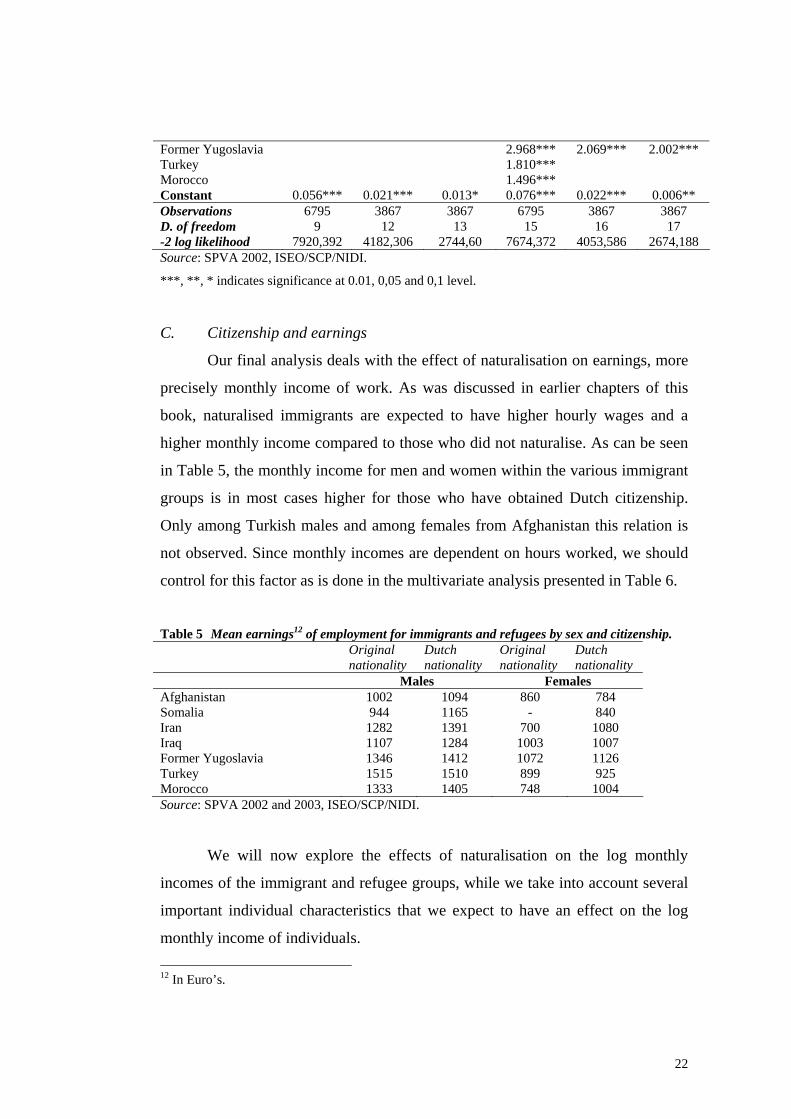
C. Citizenship and earnings
Our final analysis deals with the effect of naturalisation on earnings, more
precisely monthly income of work. As was discussed in earlier chapters of this
book, naturalised immigrants are expected to have higher hourly wages and a
higher monthly income compared to those who did not naturalise. As can be seen
in Table 5, the monthly income for men and women within the various immigrant
groups is in most cases higher for those who have obtained Dutch citizenship.
Only among Turkish males and among females from Afghanistan this relation is
not observed. Since monthly incomes are dependent on hours worked, we should
control for this factor as is done in the multivariate analysis presented in Table 6.
Table 5 Mean earnings12 of employment for immigrants and refugees by sex and citizenship. Original
nationality Dutch nationality
Original nationality
Dutch nationality
Males Females Afghanistan 1002 1094 860 784 Somalia 944 1165 - 840 Iran 1282 1391 700 1080 Iraq 1107 1284 1003 1007 Former Yugoslavia 1346 1412 1072 1126 Turkey 1515 1510 899 925 Morocco 1333 1405 748 1004 Source: SPVA 2002 and 2003, ISEO/SCP/NIDI.
We will now explore the effects of naturalisation on the log monthly
incomes of the immigrant and refugee groups, while we take into account several
important individual characteristics that we expect to have an effect on the log
monthly income of individuals. 12 In Euro’s.
22
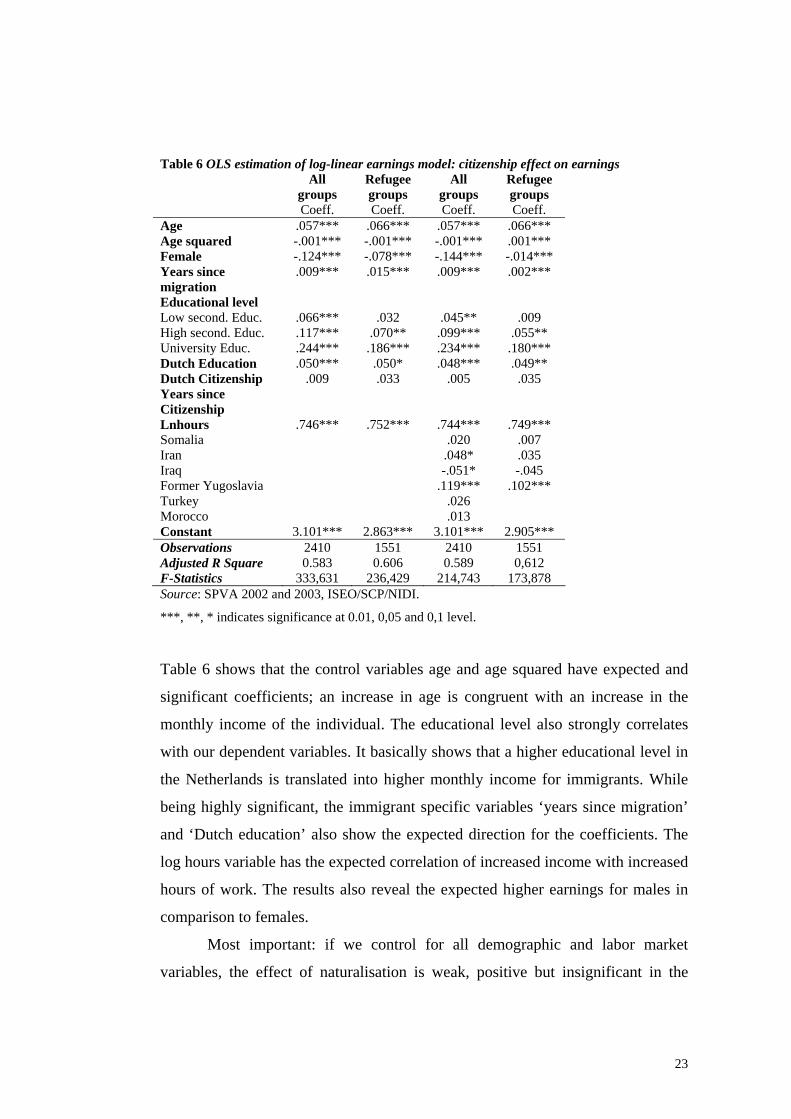
Table 6 OLS estimation of log-linear earnings model: citizenship effect on earnings All
groups Refugee groups
All groups
Refugee groups
Coeff. Coeff. Coeff. Coeff. Age .057*** .066*** .057*** .066*** Age squared -.001*** -.001*** -.001*** .001*** Female -.124*** -.078*** -.144*** -.014*** Years since migration
.009*** .015*** .009*** .002***
Educational level Low second. Educ.
.066***
.032
.045**
.009
High second. Educ. .117*** .070** .099*** .055** University Educ. .244*** .186*** .234*** .180*** Dutch Education .050*** .050* .048*** .049** Dutch Citizenship .009 .033 .005 .035 Years since Citizenship
Lnhours .746*** .752*** .744*** .749*** Somalia .020 .007 Iran .048* .035 Iraq -.051* -.045 Former Yugoslavia .119*** .102*** Turkey .026 Morocco .013 Constant 3.101*** 2.863*** 3.101*** 2.905*** Observations 2410 1551 2410 1551 Adjusted R Square 0.583 0.606 0.589 0,612 F-Statistics 333,631 236,429 214,743 173,878 Source: SPVA 2002 and 2003, ISEO/SCP/NIDI.
***, **, * indicates significance at 0.01, 0,05 and 0,1 level.
Table 6 shows that the control variables age and age squared have expected and
significant coefficients; an increase in age is congruent with an increase in the
monthly income of the individual. The educational level also strongly correlates
with our dependent variables. It basically shows that a higher educational level in
the Netherlands is translated into higher monthly income for immigrants. While
being highly significant, the immigrant specific variables ‘years since migration’
and ‘Dutch education’ also show the expected direction for the coefficients. The
log hours variable has the expected correlation of increased income with increased
hours of work. The results also reveal the expected higher earnings for males in
comparison to females.
Most important: if we control for all demographic and labor market
variables, the effect of naturalisation is weak, positive but insignificant in the
23
analysis in which we include all groups. However, when we only analyse refugee
groups, the result becomes significant. Including dummies for individual groups
has only small effects on the various background variables and does not change
the effects of the citizenship variables. Finally, a very weak but significant
citizenship premium can be found for the refugees in the Dutch labor market.
6. Conclusions
In this paper we analysed the relation between socioeconomic integration
and naturalisation. We started with an analysis of various factors, demographic
and educational, affecting naturalisation rates. In this case naturalisation is the
dependent variable. We then analysed the relation between the job chances and
earnings on the one hand and naturalisation on the other hand. We used a sample
of Afghani, Somali, Iranian, Iraqi, former Yugoslav, Turkish and Moroccan
immigrants in the Netherlands, with data from the 2002 and 2003-version of the
survey ‘Social Position and Use of Public Utilities by Immigrants’ (SPVA).
Our main finding in relation to the acquirement of naturalisation is that the
educational level of the immigrant as well as whether he or she received this
education in the Netherlands, has a strong positive impact. This confirms the
hypothesis that a better socioeconomic position positively affects the chance of
having Dutch nationality. However, the naturalization effect on employment is
positive for women of most refugee groups. For men this is not the case. Only for
two out of five refugee groups we observe higher probabilities for naturalized
males versus non-naturalized. Furthermore participation in ‘integration programs’
did not correlate with naturalisation, which may be due to the fact that
participation in such programs is obligatory since 1998. Finally the variable years
of residence is also positively related to naturalisation rates.
When it comes to the consequences of naturalisation we found that
whether and when Dutch nationality was acquired both have a positive and
significant effect on the immigrants’ job chances. This confirms the hypothesis
that naturalisation enhances labour market opportunities. We furthermore found
24
that naturalisation has no significant effect on wages when we pool both
immigrants and refugee groups, but that it is significant for refugee groups
separately. The effect of years since naturalisation is significant but weak. The
findings on earnings do not directly confirm the hypothesis on positive effects of
naturalisation on the labour market position. They rather specify the hypothesis:
naturalisation has positive earnings effect for refugees, but not for Mediterranean
immigrants who came to the Netherlands for various reasons (labour migration,
family reunification, family formation). This diversity may explain the unexpected
result.
25
References
Bevelander, P. (2000) Immigrant Employment Integration and Structural Change in Sweden, 1970-1995, Almqvist & Wiksell International, Sweden.
Bevelander, P. & J. Veenman, (2005) ‘Naturalisation and Employment Integration of Turkish and Moroccan Immigrants in the Netherlands, In review for Journal of International Migration and Integration.
Devoretz, D.J. & S. Pivnenko (2006), ‘The Economic Causes and Consequences of Canadian Citizenship’, Journal of International Migration and Integration (fortcomming).
Groeneveld, S. & Weyers-Martens, Y. (2003) Minderheden in beeld, SPVA-02, Instituut voor Sociologisch-Econmisch Onderzoek (ISEO), Rotterdam.
Heijs, E., (1995) Van vreemdeling tot Nederlander, De verlening van het Nederlanderschap aan de vreemdelingen (1813-1992), Dissertation, Het Spinhuis.
Van den Bedem, R.F.A. (1993), Motieven voor naturalisatie, Onderzoek en beleid, No. 125, Gouda Quint bv.
Van der Erf, R. (2000), Naturalisatie in de EU, Nederlanderschap blijkt populair, in: Demos, Vol. 16, August 2000, p. 1-7.
Volkskrant De, september 3, (2004) ‘Kabinet blijft fel tegen dubbele nationaliteit’, retrieved, October 4, 2004, from http://www.volkskrant.nl/denhaag/printversie /1094102585211.html.
Yang, P. Q. (1994) ‘Explaining Immigrant Naturalisation’, International Migration Review, Vol. 28, No. 3: 449-477.
26
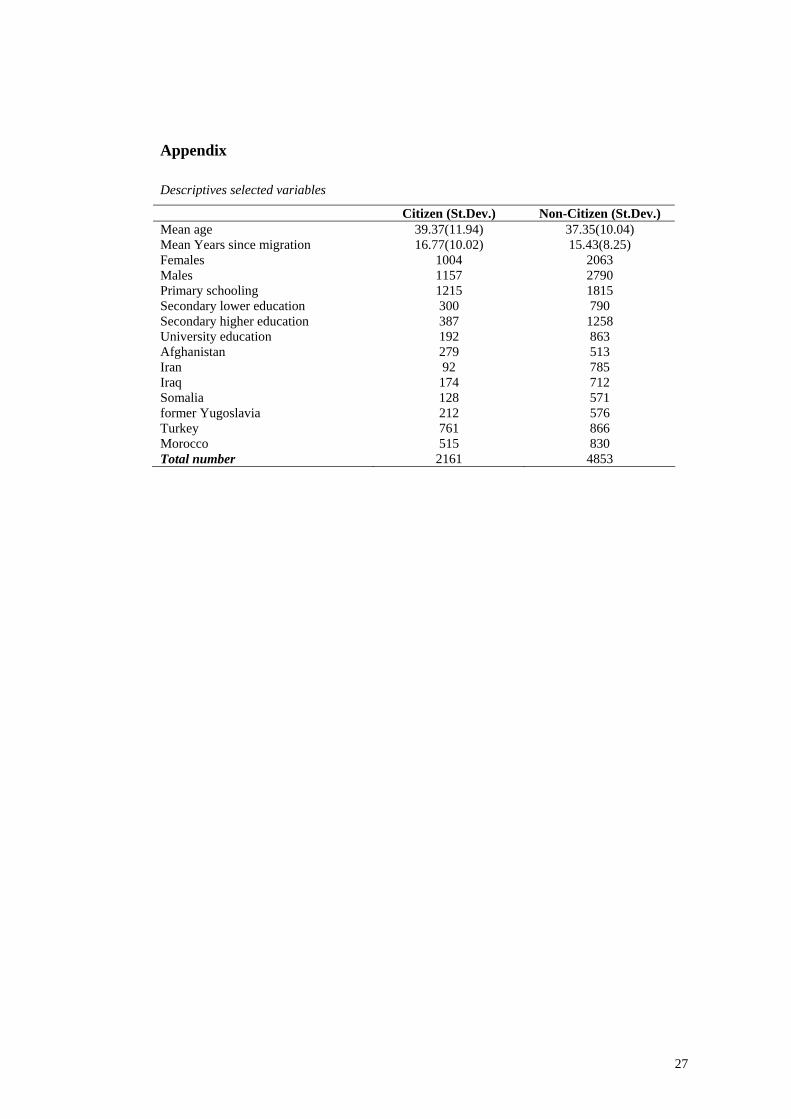
Appendix
Descriptives selected variables
Citizen (St.Dev.) Non-Citizen (St.Dev.) Mean age 39.37(11.94) 37.35(10.04) Mean Years since migration 16.77(10.02) 15.43(8.25) Females 1004 2063 Males 1157 2790 Primary schooling 1215 1815 Secondary lower education 300 790 Secondary higher education 387 1258 University education 192 863 Afghanistan 279 513 Iran 92 785 Iraq 174 712 Somalia 128 571 former Yugoslavia 212 576 Turkey 761 866 Morocco 515 830 Total number 2161 4853
27