National Planning Commission
73
NEPAL Assessment of Implementation of the Istanbul Programme of Action for the LDCs for the Decade 2011-2020 Government of Nepal National Planning Commission Singhadurbar, Kathmandu November, 2019
-
Upload
khangminh22 -
Category
Documents
-
view
0 -
download
0
Transcript of National Planning Commission

NEPAL
Assessment of Implementation of the Istanbul Programme of
Action for the LDCs for the Decade 2011-2020
Government of Nepal
National Planning Commission Singhadurbar, Kathmandu
November, 2019


Preface
Nepal has full commitment on the graduation from the LDC status and has given its highest
priority through its national plans, policies and programs since the adoption of the landmark
Istanbul Programme of Action (IPoA). The Government of Nepal does not perceive this as an
isolated milestone but rather as a process that demands a thorough consideration of up-front costs
and back-end benefits. The LDC Graduation is an integral part of Nepal’s overall development
strategy. Nepal has expressed its overall readiness of the country to graduate from the LDC
Category meaningfully, smoothly, sustainably and irreversibly. The government has set the
Vision of "Prosperous Nepal, Happy Nepali" and the ambitious goals in the current Fifteenth
Plan (2019-2024) aligning with graduation by 2022, achieving the Agenda 2030 and becoming a
middle-income country by 2030, and a high-income country by 2043.
The United Nations Committee for Development Policy identified that Nepal had met two of the
three thresholds for graduation, i.e. related to human assets and economic vulnerability indices in
the last two consecutive triennial reviews. While the calculation of Nepal’s statistical criteria for
2018, the performance was however inadequate in terms of gross national income (GNI) per
capita which was well below the designated threshold. The Human Assets Index (HAI), reflects
quantitative achievements in enrolment, literacy, undernourishment and mortality, but needs to
focus efforts in enhancing quality in public services in Nepal. The Economic Vulnerability index
(EVI), too, hardly measures the recurring nature of different forms of vulnerability of Nepal to
external shocks including natural disasters.
In this background, the Government of Nepal has prepared the report on Assessment of
Implementation of the Istanbul Programme of Action for the LDCs for the Decade 2011-2020
and submitted it to the UNOHRLLS. The graduation from LDC status can be sustained with an
operative development strategy and consultative process in a climate of greater political stability
and faster economic pace in the country.


Table of Contents
List of Tables i
Acronyms ii
Executive Summary iv
I. Introduction 1
1. Background 1
II. National Development Planning Process 5
1. Development Planning before 1990 5
2. Development Planning, 1991-2007 6
3. Development Planning, 2008-2018 8
4. Vision 2043 and the Fifteenth Plan (2019-2024) 10
5. Challenges 11
III. Assessment of the Implementation of the IPoA 13
1. Productive Capacity 13
2. Agriculture Food Security and Rural development 14
3. Trade 16
4. Commodities 17
5. Private Sector Development 18
6. Human and Social Development 21
7. Multiple Crises and Other Emerging Challenges 29
8. Good Governance 34
9. Mobilizing Financial Resources for Development and Capacity Building 35
9. Progress towards Graduation 37
IV. Coherence and linkages with the 2030 Agenda and other Global Processes 41
V. Towards the next LDC Agenda 44
References 48

i
List of Tables
Table 1 : Human Development Indicators of Nepal 21
Table 2 : Progress in Health Indicators 24
Table 3 : Gender Development Index of Nepal (2017) 26
Table 4: Educational Achievement Indicators based on GPI 27
Table 5: Social Protection Coverage 29
Table 6: Resource Mobilization 35
Table 7: Nepal's Progress Status for LDC Graduation Criteria 38
Table 8: Investment Requirements to Meet SDG Targets 42

ii
Acronyms
ADS Agriculture Development Strategy
AIDS Acquired Immune Deficiency Syndrome
BFIs Banks and Financial Institutions
BIMSTEC Bay of Bengal Initiative for Multi-Sectoral Technical and Economic
Cooperation
BOP Balance of Payments
CBS Central Bureau of Statistics
CDP Committee for Development Policy
DFIs Development Finance Institutions
DRRM Disaster Risk Reduction and Management
EVI Economic Vulnerability Index
FCGO Financial Comptroller General Office
FDI Foreign Direct Investment
FITTA Foreign Investment and Technology Transfer Act
FNCCI Federation of Nepalese Chamber of Commerce and Industries
FY Fiscal Year
GCRI Global Climate Risk Index
GDI Gender Development Index
GDP Gross Domestic Product
GFCF Gross Fixed Capital Formation
GLOF Glacial Lake Outburst Flooding
GNI Gross National Income
GoN Government of Nepal
GPI Gender Parity Index
GSP Generalized System of Preferences
HAI Human Assets Index
HDI Human Development Index
HIV Human Immunodeficiency Virus
HS Harmonized System
IMR Infant Mortality Rate
IPoA Istanbul Programme of Action
IPRs Intellectual Property Rights
KM Kilometre
KPIs Key Performance Indicators
LDC Least Developed Countries
LLDC Landlocked Least Developed Country
LPG Liquefied Petroleum Gas
MAPs Medicinal and Aromatic Plants
MDGs Millennium Development Goals
MEDEP Microenterprise Development Programme
MICS Multiple Indicator Cluster Survey

iii
MoF Ministry of Finance
MoICS Ministry of Industry Commerce and Supplies
MoWSS Ministry of Water Supply and Sanitation
MoYS Ministry of Youth and Sports
MT Metric Tonne
MW Mega Watt
NDHS Nepal Demographic and Health Survey
NER Net Enrolment Rate
NIB Nepal Infrastructure Bank
NLFS Nepal Labour Force Survey
NPC National Planning Commission
NPR Nepali Rupees
NRB Nepal Rastra Bank
NSEs National Sector Export Strategies
NTIS Nepal Trade Integration Strategy
NTMs Non-Tariff Measures
ODA Official Development Assistance
ODF Open Defecation Free
OECD Organization for Economic Cooperation and Development
OOF Other Official Flows
PPP Purchasing Power Parity
SAFTA South Asian Free Trade Area
SDGs Sustainable Development Goals
SDP Sector Development Plan
SEZA Special Economic Zone Act
TOE Ton of Oil Equivalent
U5MR Under-five Mortality Rate
UN United Nations
UNCTAD United Nations Conference on Trade and Development
UNDESA United National Department of Economic and Social Affairs
UNDP United Nation Development Programme
USD United States Dollar
VPOA Vienna Program of Action
WASH Water Sanitation and Hygiene
WB World Bank
WEF World Economic Forum
WTO World Trade Organization

iv
Executive Summary
1. Background
The Istanbul Programme of Action (IPoA), 2011–20, was adopted in May 2011 by the Fourth
United Nations Conference on Least Developed Countries (LDCs). It represents high-level
commitments and ownership of LDCs and their development partners in the spirit of a renewed
and strengthened global partnership. The overarching goal of the IPoA is to overcome the
structural challenges faced by LDCs to help them eradicate poverty, achieve internationally
agreed development goals and enable graduation from the LDC category. The IPoA has five
guiding principles and eight priority areas of action to be implemented in close partnership
between the LDCs themselves and international development partners. The support measures
from the development partners devised for the programme period have focused on the priority
areas of action to facilitate structural transformation of LDC economies, achieve at least seven
per cent annual growth rate and enable half the number of LDCs to meet the criteria for
graduation by 2020.
2. Nepal's Progress towards LDC Graduation
Nepal is one of the 47 LDCs. It has a population of 29.5 million and per capita income of
USD1047 (CBSa, 2019)1. The country is now passing through the transition from a unitary
system to a federal system of governance after the successful conclusion of the peace process. It
is also going through the post-disaster reconstruction phase following the devastating
earthquakes of 2015. The Constitution of Nepal, promulgated in September 2015, guarantees
civil rights, establishes a federal polity with three tiers of government and guides the
development roadmap towards prosperity.
The country is determined to achieve inclusive and high economic growth and to graduate from
the LDC category by 2022. Nepal's development plans and programmes are geared towards the
direction set by IPoA for poverty eradication and graduation from the LDC category.
The United Nations Committee for Development Policy (CDP) found Nepal eligible for
graduation from LDC as it met two of the three thresholds in its triennial reviews of 2015 and
1The preliminary estimates of per capita GDP for FY2018/19 is USD1,034 and per capita disposable income is
USD1,364 according to the National Accounts (CBS, 2019).

v
2018. At the time of both reviews, Nepal's GNI per capita was well below the graduation
threshold of USD1,242 and USD1,230 respectively. But the Human Assets Criteria, measured by
the Human Assets Index (HAI), was found to be above the graduation threshold of 66. Similarly,
vulnerability measured by the Economic Vulnerability Index (EVI), was also below the
maximum threshold of 32. Nepal is the first country to be eligible for graduation without meeting
the GNI per capita (income) criterion. Nepal considers this a key risk for a smooth and
sustainable graduation and so the decision to graduate was deferred until the next CDP triennial
review, scheduled for 2021. At the same time, Nepal is committed to implement the 2030
Agenda of Sustainable Development and achieve the Sustainable Development Goals (SDGs).
The country’s Fifteenth Plan (2019-2024) has set the vision of "Prosperous Nepal, Happy
Nepali" and milestone targets for 25 years' development pathway to become a middle-income
country by 2030 and a developed country by 2043.
3. Progress towards IPoA Implementation
Guided by the spirit of IPoA principles and priority areas of action, Nepal has implemented its
national policies and programmes to achieve the broad IPoA goals on schedule. While the IPoA
has a positive role to play in the country’s development process, the specific goals and actions
may not fully be realized by 2020.
Productive Capacity Currently available indicators show that Nepal has made satisfactory
progress in, for instance expanding infrastructure, enhancing productive capacities. However,
such improvements in limited areas are not sufficient for employment creation and poverty
reduction to the desired extent. Structural transformation is slow, as the contribution of
manufacturing value added to GDP has fallen over the years.
Agriculture, Food Security and Rural Development Over the review period, the structure of
agriculture sub-sectors has changed, shifting from subsistence farming to commercial
agriculture. This indicates the importance of commercialization in agriculture sector which
contributed in improving food security situation in Nepal. However, enhancing agricultural
productivity and reducing regional and rural-urban disparities remains a challenge for the
inclusive and sustainable development in Nepal.

vi
Trade and Commodities Nepal’s international trade pattern has changed significantly in the
review period. Various policy measures have been taken to improve trade competitiveness and
terms of trade through diversification. However, Nepal's exports have fallen in absolute terms
over the review period reducing its already paltry global share from 0.005 percent in 2011 to
0.0047 percent in 2018. The result is a high trade deficit that is more than almost 40 percent of
the GDP. Although Nepal's export base is broad in comparison with other LDCs, the
merchandise items in exports and imports baskets are almost the same for the review period
indicating a lower level of export sophistication. Increasing cereal items in its import basket is
making the country food-dependent. This increases its vulnerability to rapid declines in export
earnings and capital flows, which are related to global crises and challenges, such as increased
food insecurity, and volatile fuel and commodity prices.
Private Sector Development Nepal's economy is private sector-led with public sector
consumption and GFCF limited to 14 percent and 15 percent respectively for FY2018-19 (CBS,
2019a). The contribution of cooperatives has increased in recent years, but the impact is limited.
The private sector has been playing a pivotal role in the development of financial and capital
markets, quality health services, tourism, hospitality, and education, including information and
communications technology sectors. Change in the sectoral composition of GDP, however, has
been much slower, indicating poor structural transformation and low productive capacities. The
share of manufacturing, which was the driver of economic growth during the 1990s, has
decreased in recent years. This undermines efforts made by the government, the private sector
and development partners to promote private sector development in Nepal.
Human and Social Development Nepal has made remarkable progress in human and social
development, including health, education, water and sanitation, youth and women’s
empowerment, and social protection over the review period. Nepal has realized universal
primary education, with good improvements in the literacy rate, across all age groups. But
improvement in learning, employability and productivity outcomes of educational attainments
are not satisfactory. Data indicate that a considerable number of children are still out of school.
Notable progress has been achieved in reducing child and maternal mortality rates, including the
infant mortality rate (IMR), under-five mortality rate (U5MR) and Maternal Mortality Rate
(MMR). The proportion of births attended by skilled providers has increased significantly. But

vii
there is still a long way to go to achieve universal health coverage, to reduce the risk of non-
communicable diseases and transport injuries, and to improve the nutritional status of women
and children.
Access to basic drinking water has reached to 88 percent and basic sanitation facilities have been
available for up to 99 percent of the population respectively. As progress accelerated, Nepal was
declared Open Defecation Free (ODF) on 1 October 2019, the first country to achieve ODF
status in South Asia. But increasing access to quality water and improved sanitation remains a
major challenge due to poor drinking water quality, inefficient functionality of water supply
systems, and high regional disparity in access to WASH services.
The introduction of old age pension for senior citizens in 1995 was a milestone for social
protection initiatives in Nepal. Major social protection schemes currently available are cash
transfers, in-kind transfers, access to services, social insurance, public works,
employment/livelihood creation, and care services. By 2018, about 17 percent people benefited
from these schemes, and government spending on social protection reached about 12 percent of
the government budget and over 5 percent of GDP. However, social protection measures have
been found inadequate in mitigating the adverse impact of unexpected shocks, which may push
the marginalized people below absolute poverty.
Nepal has made good progress in youth development, gender equality and women’s
empowerment. More than one-third of members are women in the Federal Parliament and
Provincial assemblies whereas more than 40 percent members of local level assemblies are
women. For the first time, Nepal witnessed women as Head of State, Chief Justice, and Speaker
of the Parliament. The proportion of women has also significantly increased in government
service in recent years. Indicators show that impressive progress has been made in women's
economic empowerment in the private and business sectors. This is reflected in the Gender
Development Index, which is now at 0.92. However, disparities in educational, health and
income related outcomes within the gender groups are still high.
Multiple Crises and Emerging Challenges Nepal’s economic outlook looks optimistic in the
medium to longer terms. It has recovered from various shocks, such as conflict and political
transition, border disruptions, and natural disasters including devastating earthquakes. Despite
the optimism in Nepal’s economic outlook, the country remains vulnerable to multiple shocks,

viii
including environmental shocks, while the possibility of fall-back to the trajectory of slow
economic growth cannot be ruled out. Major crises and challenges include geological hazards
such as earthquakes; climate change induced disasters like floods, drought and landslides;
unfavourable labour markets; investment gaps and food insecurity.
Mobilization of Resources for Development Finance and Capacity Development Nepal has
maintained comfortable macroeconomic stability over the review period. The gross national debt
is about 30 percent of GDP in 2018, with average debt servicing expenditure below 3 percent of
GDP. This has been possible due to low budget execution rates, in particular low capital
spending and a significant rise in government revenues. It gives great potential of raising more
finance from official development assonance (ODA) where the challenge is to increase the aid
utilization capacity of government machinery. Despite considerable efforts made to mobilize
domestic resources for development finance, Nepal faces a huge financing gap, and ODA has
continued to be the largest source of development financing. At the same time, foreign direct
invest has increased substantially, but without a visible impact on structural change.
Good Governance at all Levels Governance in Nepal has undergone significant changes and
reforms after the promulgation of the Constitution in 2015. The country is politically divided into
753 local level and seven provinces. The election of local government after almost two decades
has raised hopes of strengthening the country’s governance system.
4. The 2030 Agenda for Sustainable Development
The 2030 Agenda for Sustainable Development has been one of the guiding principles for
Nepal's development efforts after 2015 to ensure that no one is left behind. The Constitution of
Nepal, 2015 also carries the aspiration of the Agenda 2030. Most of the sectoral plans, priorities
and targets are aligned with the Sustainable Development Goals (SDGs), while some are in the
alignment process. This reflects Nepal's commitment to achieving the SDGs within the given
timeframe. The 17 SDGs have been synchronized within the results framework of Fourteenth
Plan (2016-19). The Fifteenth Plan has fully incorporated the SDGs in the national and sectoral
goals, strategies and working policies. The annual programmes are fully aligned with the targets
and indicators of SDGs. The budget allocation in the annual programmes has also given high
priority for SDGs and auditing has also been done against the SDGs indicators. Some of these
initiatives have started to yield promising results. The Needs Assessment, Costing and Financing

ix
Strategy for SDGs, however, shows that further efforts are required to mobilize resources for
achieving the SDGs targets. Similarly, the Government of Nepal (GoN) has published planning
and monitoring and evaluation guidelines for provincial and local level and has developed the
SDG localization guidelines for provinces and local level providing the hands-on tools and
techniques for incorporating SDGs in planning and implementation of sub-national level.
5. Towards the Next LDC Agenda
Nepal believes that the IPoA adopted for 2011-2020 will be a landmark for various reasons.
Since the adoption of the IPoA in 2011, many LDCs have made notable progress in economic,
social and human development. However, IPoA is not going to meet the goal set to enable half
the number of LDCs to be eligible for graduation by 2020, and most of the people of LDCs live
in poverty. It is therefore a matter of deep concern that only a few countries are going to have
graduated from the LDC category by the end of this decade. From this perspective, Nepal is
hopeful that the upcoming UN Conference on LDCs will be able to address the unfinished
concerns of LDCs related to trade and development, tackling the inherent challenges of low
productive capacity and maximizing the ability of LDCs to exploit the opportunities brought
about by the process of globalization.
6. Organization of the Report
The report is organized in five core chapters. With the background, the first chapter briefly
summarizes the key implementation status of IPoA and government endeavours in Nepal. The
chapter also includes the methodology adopted for needs assessment, scope and coverage of the
report and some limitations. The second chapter assesses the plans, policies and strategies
adopted in line with the principles and priorities of IPoA and the Agenda 2030. In such an
assessment, mainstreaming and localizing of the agenda in national planning, implementation
and monitoring framework is especially looked into.
The third chapter discusses progress made to date in the IPoA’s priority areas of action. It also
presents the specific programmes and projects that are being implemented by government and
then identifies the gaps that have to be bridged to achieve the goals and targets within the given
timeframe. The fourth chapter is devoted to examining the implementation of IPoA and other

x
national strategies in the light of their coherence and linkages with the SDGs and other global
agendas.
The fifth chapter concentrates on exploring the policy and institutional options necessary for the
next LDC agenda to be adopted at the Fifth UN Conference on LDCs that will coincide with the
remaining 10 years of the SDGs implementation. The way forward for sustainable graduation
related to policies and development objectives for accelerated, sustainable, and inclusive
economic growth is presented in the last chapter.

1
I. Introduction
1. Background
Nepal is not only a least developed, but also a landlocked country located between India and
China, two large emerging economies. It has made remarkable social indicators in recent years.
Over these years, poverty has declined remarkably, social development indicators have improved
substantially, gender disparity has narrowed, and social inclusion has improved. For rapid
transformation of the economy and moving to a higher trajectory of growth, Nepal is committed
to graduate from the Least Developed Country status by 2022. To meet such a target, necessary
preparations are underway.
Adoption of the new constitution in September 2015 after a long political transition has created
an enabling environment for accelerated development in Nepal. Transformation from unitary to
federal system of governance with three tiers has further enhanced the prospect of more
participatory and equitable development. More noticeably, the newly elected stable government
has come forward with the long-term vision of ‘Prosperous Nepal, Happy Nepali’. Hence the
periodic plan, strategies, policies and programmes are designed to create prosperity in the
country in the near future. The implementation of the IPoA is an integral part of such
endeavours.
Adopted in 2011, the IPoA has set the goal of enabling half of LDCs to meet the criteria for
graduation by 2020 (UN, 2011). Following the IPoA, Nepal through its Thirteenth Plan (2013-
2016) formally set the goal of graduating from LDC status by 2022 with accelerated growth and
poverty reduction. Nepal is fully committed to accomplish the IPoA goals within the stipulated
time. For this, optimum utilization of natural, financial and human resources, promotion of
technological innovation, prioritization of infrastructure development and employment
generation have been given a high priority. Similarly, improvements in productive capacity
through structural policy reforms, improved governance and focus on IPoA priority areas have
remained our prime agenda.
In 2015, the Committee for Development Policy (CDP) found that Nepal is pre-eligible for
graduation from LDC as it had already met two of the three thresholds. At the time of the 2015
review, though Nepal's GNI per capita was estimated at USD 659, well below the graduation
threshold of USD 1,242, as noted by CDP in its 2015 Report, the Human Assets Index (HAI) at

2
68.7 was above the graduation threshold of 66. Similarly, the Economic Vulnerability Index
(EVI) at 26.8 was below the maximum threshold of 32. At its 2018 triennial review of the LDCs,
the CDP again found Nepal eligible for graduation from the LDC category. Despite GNI per
capita lagging far behind the threshold, the HAI and EVI scores satisfied the requirements.
Ideally, graduation should mark a transformative change in the Nepali economy, which is in the
process of structural change. It is expected to help reduce poverty, diversify economy, generate
employment, raise productive capacity and accelerate growth to accomplish IPOA targets and
SDGs on time. Amidst such brighter prospects, there are certain downside risks as well. One the
one hand, Nepal will probably be the first country ever to graduate without meeting the income
criteria. On the other hand, a highly vulnerable external sector and low productivity are common
features of the Nepali economy. Nepal is also highly vulnerable to natural disasters and climate
change. As a mountainous country in the hotspot of climate change impacts, the challenges
facing Nepal are further compounded. The trade frictions between China and US and slowdown
of economic growth of India and China may have the impacts on trade and economic
performance of the country. These reflect the challenges for Nepal’s sustainable graduation.
Against this background, Nepal recognises the need for intensive preparatory work, taking both
strengths and weaknesses into consideration. Therefore, it is an opportune moment for Nepal to
ensure a smooth transition to graduation by identifying policy, institutional and structural gaps
and devising a robust strategy to address them. Considering this, for sustainable and irreversible
graduation, Nepal requested the CDP in its expert group meeting held in February 2018 to re-
consider Nepal's graduation at the triennial review scheduled for 2021. The CDP decided not to
recommend graduation and deferred until the 2021 review.
A mixed approach combining both quantitative and qualitative techniques have been followed in
the study. The assessment of progress status of development programmes is mainly based on
secondary data and information. Such quantitative data have been used to identify trends and
patterns of various priority sectors and activities. The qualitative analytical approach has been
followed to assess the plans, policies, and strategies pursued to support and facilitative the
implementation of programmes designed to achieve the set targets.
Such an approach is also known as a sequential explanatory approach in which data collected
through quantitative and qualitative methods are processed and interpreted to draw conclusions
3
and develop suitable strategies. In the course of the study, the experts' views and stakeholders’
opinions (qualitative data) have also been collected and processed before drafting the report.
The report consolidates the existing data and information with a focus on the priority areas of
actions under the IPoA framework. Since the IPoA is based on commitments, accountability and
partnership between LDCs and its development partners to undertake concrete actions in related
areas, the report tries to track the progress made so far by Nepal in the identified areas. Efforts
were made to integrate data and information across a wide range of economic, social and
environmental areas consistent with the IPoA’s objectives.
The report therefore tries to cover the national and subnational policies, plans, strategies and
programme initiatives that aim to achieve goals and targets set by IPoA in the priority areas of
actions. These are (i) productive capacity, (ii) agriculture food security and rural development,
(iii) trade, (iv) commodities, (v) private sector development, (vi) human and social development,
(vii) multiple crises and other emerging challenges, (viii) mobilization of financial resources and
capacity, (ix) good governance at all levels, and (x) progress towards the graduation agenda.
The IPoA also highlighted that the national the efforts of LDCs should be complemented by
supportive global programmes, measures and policies aimed at expanding the development
opportunities of countries with respect to their national priorities. Therefore, attempts have been
made to enhance coherence and linkages of national policies and plans with the Agenda 2030
and other global development processes. Similarly, it tries to highlight priority areas of action
that the Fifth UN Conference on LDCs should address to support and facilitate countries in
attaining the SDGs, including measures at the national, regional and global levels to eradicate
poverty and accelerate graduation over the next 10 years.
As the study report is based on secondary sources of information, the quantification of progress
status of eight priority areas are based on such information. The inability of the IPoA to define
the indicators so that they can measure the performance of the priority areas of action has
necessitated such an approach. Given the limitations or non-availability of certain data, some
indicators (mainly in governance, private sector development, employment, and youth
development related areas) have been obtained from the international sources such as the World
Bank and the World Economic Forum.

4
In the absence of an IPoA-consistent macroeconomic framework, data available in the existing
framework have been used to capture dynamic linkages between macroeconomic variables such
as GDP, trade, investment, ODA, domestic borrowing, and revenue mobilization. Therefore,
analysis of progress and against targets should be interpreted cautiously. As the federal system of
governance has started only recently, availability of data and information at the province level is
limited and requires a more disaggregated analysis.

5
II. National Development Planning Process
Nepal has made enormous efforts to achieve rapid socio-economic development since six
decades through the development planning process. The brief review below reflects the efforts
Nepal has been making in its development planning and implementation process.
1. Development Planning before 1990
Before the establishment of a democratic system in 1951, Nepal was considered one of the
world’s most isolated countries and its economy was stagnant. The National Planning
Commission (NPC) was established in 1956 as a specialized and apex planning body of the
government. The NPC was given responsibility to formulate a national vision, overall
development and sectoral policies, periodic plans and programmes for Nepal (NPC, 1956). It is
chaired by the Prime Minister and has one full-time Vice-Chair, six members, and one Member-
Secretary, with a fully staffed secretariat. The NPC is mandated to assess resource needs,
identifies sources of funding, and allocate budgets for development plans, projects and
programmes.
The NPC also serves as an intellectual hub for the exchange of new development ideas and
proposals from scholars, the private sector, civil society, and development partners. In the initial
years, plans were focused on institutionalization of democratic policies and systems of
government with the overarching goal of socio-economic development. The major achievements
of the planned development process, in the early stage, were establishment of connections with
the outside world, adaptation of foreign aid policy and programmes, increasing cooperation with
development partners, and the launch of development programmes and projects.
The broad objectives of previous plans were largely to increase production, generate
employment, fulfil basic needs, and raise the living standards of people. The plans were focused
on improving the capacity of development administration, and enhancing the public and private
sectors' contribution to accelerating economic growth and development. Similarly, attempts were
made to promote economic stability, ensure social justice, and decentralize development efforts
to achieve regional balance. For this, strategies were designed to improve the economy’s
productive capacity through effective use of the available natural and human resources in close

6
coordination with development partners for harnessing benefits from the international
development programmes.
During the period prior to the restoration of democracy in 1990, a three-year plan and six five-
year plans were formulated and implemented. Despite the aim of achieving rapid economic
growth to take forward the pace of socio-economic transformation of the country through
planned development efforts, there were gaps between targets and achievements. One of the
major weaknesses of the plans was an inability to clearly establish relationships/linkages among
the goals and objectives, priorities, strategies and programmes of the plans (NPC, 1992). At the
same time, a lack of basic infrastructure and technology, weak market mechanisms and an
undeveloped private sector were equally responsible for poor performance of the development
plans.
More importantly, the planning process was top-down and could not garner people's participation
in the process of plan formulation and implementation. Lack of accountability in the governance
system made the planning process weak and left it poorly institutionalized. The gains of the
planned development process were unevenly distributed, resulting in inequality and a widening
absolute gap between rich and poor.
2. Development Planning, 1991-2007
The Eighth Plan (1991-1996) was implemented following the restoration of a multi-party
democratic system in 1990. The planning process was participatory and bottom-up where
programmes and projects were identified in close consultation with Village Development
Committees, District Development Committees, and regional and national level stakeholders
including political parties and development partners. The key objectives of the Plan were to
achieve sustainable economic growth, alleviate poverty and reduce regional disparities.
Accordingly, available economic, human and institutional resources were prioritized to help
achieve the set objectives.
The Plan (1991-1996) emphasized a liberal, market-oriented economy by encouraging
government to play an active role in facilitating economic activities, promoting the private sector
and building a physical infrastructure to enhance economic activities. The principal objective
was to achieve sustainable economic growth by alleviating poverty and reducing regional
imbalances (NPC, 1992). The plan targeted populations living below the poverty line and

7
envisioned the village as a centre of development. Programmes were focused on formulating
integrated and inter-regional programmes that created productive assets based and employment
opportunities to alleviate poverty. For this, the government adopted a decentralization policy
effectively by delegation of authority to local bodies with the transfer of resources required to
execute the programmes and projects.
In the same spirit, the sole objective of the Ninth Plan (1996-2001) was poverty alleviation,
which targeted a reduction of the population living below the poverty line to 10 percent within
20 years by increasing economic growth rates and reducing population growth rates (NPC,
1997). High priority was given to employment generation, productivity enhancement, good
governance, human resource development and the empowerment of women. The Agricultural
Perspective Plan (APP) was designed as a basis for increasing production, providing food
security, and increasing employment and income. Additional authority was devolved to local
bodies to make them capable, strong, autonomous and accountable for poverty alleviation.
Capacity development of local bodies was focused to help them achieve rapid sustainable and
inclusive development.
The major focus of the Tenth Plan (2002–07) was on poverty alleviation and raising the living
standards of people to help achieve sustainable development and social justice. This was the first
plan of the 21st century and is also known as the strategic document of poverty alleviation, since
it was formulated with the sole objective of poverty alleviation (NPC, 2002).To achieve the
objective, high, sustainable and broad-based economic growth; social and rural infrastructure
development; targeted programmes for disadvantaged groups; and good governance were
pursued as strategic areas for interventions. To make this plan result-oriented and to optimize the
use of scarce resources, programmes and projects were prioritized and classified as Priority One
(P1), Priority Two (P2) and Priority Three (P3). Programmes and projects classified under the
category P1 had been ensured with adequate resources, followed by P2 and P3.
Despite efforts to create a paradigm shift in policy regime and series of reform initiatives, the
Nepali economy performed less satisfactorily between 1990 and 2007. This was characterized by
slow growth, socio-economic underdevelopment, technological backwardness and a low level of
human development. Slow economic growth was due to power outages lasting many hours, weak
infrastructure, inadequate supply of skilled human resources, low capital formation, political

8
instability, and out-migration of working age population in search of job opportunities. Instead of
commendable progress made in reducing extreme poverty and hunger, low income and human
poverty remains the major challenge for Nepal's planned development initiatives.
3. Development Planning, 2008-2018
Nepal’s development planning went through a transition along with political transformation
between 2008 and 2018. To ensure sustainable peace and inclusive development after a decade-
long conflict and the People's Movement of 2006, Nepal implemented four development plans
over 11 years. Although interim in nature, these plans attempted to capitalize the opportunities
present after the end of a decade long conflict, change in the political system, people's aspirations
for rapid development and well-being, and a new paradigm in the international development
landscape.
This was an important period for Nepal, because it saw a successful conclusion to the country's
political transformation through the adoption of the federal Constitution in 2015. Amid internal
and external turmoil as well as natural shocks, Nepal successfully set milestones for socio-
economic development by realizing most of the targets of Millennium Development Goals
(MDGs) set for 2015. Nepal implemented the IPoA for LDCs for 2011-2020 and is
mainstreaming the 2030 Agenda for Sustainable Development into its development plans and
policies. More importantly, it was the period when Nepal set the overarching goal of graduation
from LDC to a middle-income country in 2030.
The Eleventh Plan (2008-2010), the first development plan implemented in the changed political
context set the vision of ‘Prosperous, Peaceful and Just Nepal’. The primary goal of this plan was
to reduce poverty, increase employment opportunities and make people prosperous. To achieve
the objective, the plan has emphasised: relief, rehabilitation and reintegration; pro-poor and
sustainable economic growth; increased investment in physical infrastructure; inclusive growth
and targeted development programmes; and prioritized social development with improved
governance (NPC, 2008). This was the first plan that recognized the active role of the
cooperative sector in the overall development process as an effective vehicle of poverty
alleviation. The plan incorporated special programmes for disadvantaged and marginalised
groups, including persons with disabilities, women, Dalits, Adibasi Janajatis, Madhesis, Muslim
community, and disadvantaged regions.

9
Considering lessons learned from the outcomes of previous periodic plans and changing
priorities of the people, the objectives and strategic areas of development plans have changed
over time. The Twelfth Plan (2011-2013), for instance, prioritized improving economic status of
the people through implementation of employment-centric, equitable and inclusive development
programmes and projects. Accordingly, strategies were adopted to bring about a direct positive
change in the living standards of the people by reducing economic and human poverty in an
effort to maximize the fruits of opportunities and to minimize the risks of challenges created
within the country and likely from the external environment (NPC, 2011). The approach paper of
Twelfth Plan set a goal to graduate the country from its LDC status by 2022.
After the IPoA was adopted in May 2011, Nepal revised (in May 2013) its earlier target for
graduation to 2022 in tandem with the IPoA’s overarching goal. To translate the goal set by the
IPoA into a reality, which aims to enable half the LDCs to meet the criteria for graduation by
2020, Nepal incorporated the graduation agenda in the Thirteenth Plan (2014-16).
The Fourteenth Plan (2017-2019) was based on the Constitution 2015 and Nepal's commitment
to the 2030 Agenda for Sustainable Development. The plan was envisioned to revive the country
from the impacts of the 2015 earthquakes, repercussions of the long political transitions and the
setback created by disruptions at the Nepal-India border points. Despite being an interim plan, it
considered the overarching objective of building a socialism-oriented prosperous nation based on
democratic norms and values while ensuring basic social services and maintaining food, health,
energy and job security to build a welfare state (NPC, 2016b). It has thus focused on the
sustainable path of prosperity while strengthening the national economy through participation,
independent and complementary role of public, private and cooperatives sectors under short to
medium-term development strategies.
During this period Nepal has made significant progress in MDGs, particularly on poverty
reduction and human development (NPC, 2016c). With the encouraging achievements of the
MDGs and the lessons learned—on what kind of global development agenda works at the
national level and what does not—Nepal reiterated its commitment to achieving the SDGs before
2030. Most importantly, the Fourteenth Plan has mainstreamed the 2030 Agenda with its in-built
results framework. The plan internalized key IPoA aspects and systematically integrated SDG
targets in a results monitoring framework (NPC, 2017).

10
The development plans after 2007 have been instrumental in mainstreaming the concept of
sustainable and inclusive growth in the development discourse and reorienting programmes such
as infrastructure development, socio-economic transformation, integrated spatial development,
and the fulfilment of basic needs of the people. Progress in development indicators in this period
were found to be satisfactory compared to those in the previous plans. Nepal has realized the
economic growth target of the Fourteenth Plan.
4. Vision 2043 and the Fifteenth Plan (2019-2024)
Following the promulgation of the Constitution of Nepal in 2015, the time came for Nepal to
address the people's aspirations for improving economic wellbeing and achieving prosperity.
This was an opportune moment to embark on formulating a long–term development vision and
an implementable strategy aimed at achieving socio–economic transformation of the country.
Nepal has thus set a long-term vision of socio-economic transformation to become a high income
country by 2043 i.e. per capita income USD12,100. This is guided by an overarching aim of
accelerating the pace of economic growth for smooth and sustainable development after
graduating from LDC and help achieve the SDGs and becoming a middle-income country by
2030. The Vision aims to eliminate poverty and achieve an annual average GDP growth of 10.5
percent through augmented productivity by harnessing internal resources such as hydropower,
agriculture, forests and natural resources. It is planned to double the share of industrial sector to
the GDP and reduce the contribution of agriculture sector to one-third. The long-term vision has
defined prosperity and happiness separately and set targets assuming FY2018/19 as the
foundation year for prosperity (NPC, 2019).
The Fifteenth Plan (2019-2024), the first plan of the Vision 2043, has identified the sectors with
particular growth potential, such as hydropower, tourism, agriculture and human capital
formation, as the drivers of economic growth. The plan is committed to harness the potential of
growth drivers by best utilizing the demographic dividend of an economically active young
population and aims to cater to the vast markets of neighbouring India and China with higher
connectivity.
Nepal believes a successful structural transformation would be instrumental in moving towards a
long-term sustainable development trajectory. Attempts have thus been made to maintain a
proper combination of policy reforms to enhance efficiency of the development tools, i.e.
11
hardware (e.g. infrastructure) and software (e.g. good governance) so as to reduce transaction
costs.
5. Challenges
Nepal has focused on attaining high GDP growth through a planned development process for
more than six decades. In such efforts, poverty reduction and economic prosperity remain the
key priorities. Although Nepal has made good progress in several aspects of social development
during past six decades of planning history, it has not effectively reduced inequality and
unemployment, unplanned migration, human capital formation. Eliminating poverty and rural
unemployment and promoting prosperity require large investment in all the economic fronts to
propel domestic employment and provide sustainable incomes to households. Lack of sufficient
investment is an undeniable truth, which has been the main challenge for economic prosperity.
Nepal has just overcome a prolonged political transition. The transformation from the erstwhile
unitary system of governance to a federal governance system should help to promote balanced
regional development and unlock the potential for investment in innovative sectors. Ensuring
good governance with transparency and accountability is vital for creating a conducive
environment for the private sector to thrive.
Reducing disparities among geographical regions, gender and socio-cultural status remains
challenge for inclusive and balanced development as expected. Social progress will not be
sustainable without meaningful economic development contributing to a rise in citizens’ incomes
and living standards.
Ensuring smooth access to finance for industry should be one of the priorities of development
planning to stimulate investment, improve productive capacity, increase growth and
employment, and help bring prosperity. Nepal has many inaccessible and rugged regions and
production and delivery costs are high for industry. Despite being a priority of the government,
connectivity poses significant challenges and requires a huge investment to overcome them.
Limited domestic resources is another major challenge for development financing, which is
reducing the effectiveness of the national planning process.
While growth alone cannot be sufficient to alleviate poverty, transformation of subsistence
agriculture towards commercialization and industrial development are indeed challenging.
Increasing the contribution of manufacturing sector in the economy and reducing trade deficit

12
remains vital challenge. Addressing the problem of labour market mismatch through market-
based skills development for employment, income generation and trade creation is also critical in
reaping the benefits of demographic dividend and human resources. Nepal has done its best to
mainstream all international development outcomes, including the IPoA, into its development
plans and policies. Challenges facing Nepal in this context include mobilizing resources to meet
the financing gap that looms large as the country gears up for economic growth and
development; localizing SDGs as well as IPoA and VPoA goals and targets into the country’s
new federal structure where each unit of government has a special role in resource mobilization
and development; and maintaining synergy and coherence while implementing different
international development outcomes vis-à-vis national and local development plans and policies.

13
III. Assessment of the Implementation of the IPoA
The primary objective of this report is to assess the achievements of the implementation of the
IPOA between 2011 and 2018. Therefore, all the possible quantitative and qualitative indicators
available and relevant to the IPoA's key principles and priority areas of action have been
reviewed and analysed. The quantitative indicators available for the period 2011 to 2018 have
been presented in the time series format to make the assessment simple and comprehensive.
Qualitative information obtained from consultation with experts has been synthesized in the best
possible way. The challenges faced during the implementation of the IPoA’s priority areas of
action have been identified to help develop the best policy options and provide a way forward for
improvement in the implementation and realization of the set targets on time.
1. Productive Capacity
The key to economic progress is economic growth. Economic growth depends primarily on
progress made in the nation’s productive capacity. A steady rise in living standards takes place
only when a nation's production of goods and services expanded more rapidly than the rise in
population. As identified in the IPoA, Nepal has given high priority to improving the productive
capacity of the economy. Emphasis is given to increasing the productive capacity of the
industrial sector by enhancing productivity of labour as well as capital inputs.
The current Fifteenth Plan has given high priority to employment generation and emphasis has
been laid on increasing value addition in agriculture and manufacturing products. To augment
the productivity of the sectors of comparative advantage, high importance is given to the
transport, tourism and hydropower communication sector as identified. For resource mobilization
and efficiency improvement, a public-private partnership approach has been adopted in
infrastructure development including road construction, urban development and hydropower
generation. Another area that the government has given high importance to is the financial
sector, which seeks to improve access to credit in rural areas that help increase the productivity
of natural resource-based small and micro-enterprises. Skills, technology and entrepreneurship
development programmes have been implemented in most districts to help increase the domestic
product based on local raw materials.

14
To reflect the progress made in improvement of productive capacity, quantitative indicators such
as value addition in agriculture and natural resource-based products, primary energy supply,
infrastructure including road networks, science and technology including telecommunication,
and tourism services, have been considered. Most indicators presented (Annex 1) show that
Nepal has achieved satisfactory progress in some areas, such as expanding road networks,
telecommunication coverage, availability of clean energy, and tourism and service industries.
Similarly, special economic zone has been established and government has started the
construction of garment processing zone, provincial industrial zones, and industrial villages.
However, the contribution of the manufacturing sector to GDP, which is one of the key
indicators of structural transformation and productive capacities, has been decreasing during the
review period. This indicates poor performance in structural transformation and improvement in
the productive capacity of the domestic industries. The manufacturing sector plays a key role to
improve domestic supply capacity, generate employment and help develop a sustainable and
self-reliant economy, which is a necessary condition for LDCs like Nepal for a smooth and
irreversible graduation. More importantly, manufacturing is the sector that can create more
employment opportunities and helps to increase income levels. Therefore, enhancing the
contribution of manufacturing sector in the economy is a major challenge for Nepal to increase
GNI per capita, one of the key indicators of LDC graduation where Nepal is still lagging behind.
2. Agriculture Food Security and Rural development
In the 1990s, the country’s agriculture sector contributed more than 40 percent to GDP. The
contribution of this sector has gradually reduced to around 27 per cent in 2018. Nevertheless, the
agriculture sector still remains the major source for employment, food security and livelihood of
rural community. The high level of employment in agriculture with gradual reduction in its
contributions to GDP proves that agriculture productivity is not keeping pace with productivity
in other sectors. In the review period, it is observed that the structure of agriculture sub-sectors
has been changing from subsistence farming to commercial agriculture. However, the
productivity of the agriculture sector remains low over the period of IPoA implementation.
Indicators (Annex 2) show that Nepal’s food security situation has improved over time. The
government is providing subsidies to farmers in the form of inputs such as fertilizers and
agriculture credits. Transport subsidies are also given to ensure food availability in remote

15
districts that are vulnerable to food shortages. The government has given high priority to
increasing the storage capacity of food products. As a result, food security is supply-dominated,
focusing only on food availability while little attention is given to its three other dimensions:
access, utilization, and stability. The government has been implementing the 20-year Agriculture
Development Strategy (ADS) 2015-2035 where sectoral strategies have been devised to improve
productivity.
The GoN has given priority to the commercialization of agriculture and incentivizing the
corporate sector by providing interest rate subsidies in agriculture credits. The central bank is
also channelling bank credits in agriculture through mandatory and directed lending programmes
where banks and financial institutions (BFIs) are required to invest a certain percentage of their
total portfolio in agriculture. The Insurance Board and the Central Bank have implemented a
subsidized insurance programme to ensure that BFIs’ investments in agriculture will not default.
Insurance products have been developed to insure against damage of crops due to bad monsoons,
natural disasters such as floods, drought and hailstorms. Cooperatives and the private sector have
been encouraged to engage in large scale commercial production by introducing the concept of
agriculture clustering, e.g. by zone, super zone, and pocket area approach.
Despite efforts on multiple fronts, agriculture faces challenges in factor productivity,
commercialization of high-value crops, creating enabling environment for private sector
investment, and inter sectoral coordination. Despite the focus on rural development through
construction of road networks and community infrastructures, geographic disparities including
rural and urban gaps are major barriers for balanced and inclusive development. Apart from
income, variations in health, nutrition and education parameters across geographical regions as
well as in rural and urban areas are high. This has resulted in large variations in poverty across
geographic areas with respect to remoteness and market access.
However, adoption of the federal system of governance is expected to narrow the rural-urban
divide and promote regional balance. The Fifteenth Plan, which is based on the federal system,
has given special emphasis to addressing macro and sector-specific challenges for balanced rural
development. The macro challenges call for broad-based economic growth and inclusive
development. Improvements in the quality of rural roads, market systems and supply chains will
improve agriculture, food security and rural development.
16
3. Trade
The international trade pattern of Nepal has changed significantly in the last three decades.
Policy measures have been taken with the aim of improving trade competitiveness and to
diversify trade performance. Attempts are being made to identify the export potential of existing
products and new products for diversification. However, Nepal's trade performance remained
less than satisfactory over the years resulting in huge gap between exports and imports trade in
goods. Weak physical infrastructure, inadequate human resources in export-oriented industries,
absence of quality standardization of exports, a dearth of a strong legal framework and prolonged
political instability, among other factors, have adversely affected trade performance (Annex 3).
Therefore, improving trade competitiveness is one of the major agenda of the GoN. Accordingly,
trade policies and strategies have been revised in the changed global and national environments.
As envisaged by the Trade Policy 2015, National Trade Integration Strategy (NTIS) 2010 has
also been updated to NTIS 2016, which aims to improve export competitiveness through targeted
institutional support to stimulate trade within the framework of World Trade Organization
(WTO). The strategy has identified 12 sectors of high export potential and emphasizes product
research and market promotion, trade facilitation and support services. NTIS also focuses on
promoting modern technology among farmers and producers to improve production and post-
harvest practice to increase value addition across the supply chain and maintain quality in
agriculture-based exports. It also highlights the need for inter-agency coordination and
strengthened economic diplomacy to realize greater export potentials in both existing and new
markets. Some product-specific National Sector Export Strategies (NSESs) were also developed
and implemented in 2017 for the period 2017-2021. The government has implemented the Plan
of Action for the reduction of trade deficit focussing on strategic measures.
Nepal is a member of South Asia Free Trade Agreement (SAFTA) and the Bay of Bengal
Initiative for Multi-Sectoral Technical and Economic Cooperation (BIMSTEC). As an LDC,
Nepal enjoys certain privileges and special and differential treatment, including development
finance, trade preferences and technical assistance. However, as a landlocked economy, transport
costs to international markets are usually much higher for Nepal than for adjacent countries with
common land borders. Under the WTO framework, Nepal is entitled to concessional and duty-
free, quota-free market access conditions. Less stringent preferential rules of origin are granted

17
for goods originating in LDCs under the Generalized System of Preference (GSP) schemes.
Despite such preferential treatment and market access, Nepal has been facing difficulties in
addressing key challenges such as supply side constraints, transit and transportation costs
basically because it is landlocked and geographically remote. Growing Non-Tariff Measures
(NTMs) have been serious bottlenecks for Nepali products to get easy access to international
markets. The potential of hydropower exports remain untapped due to various reasons.
Most importantly, Nepal's exports have fallen in absolute terms after adoption of IPoA in 2011,
reducing its already paltry global share from 0.005 percent to 0.0047 percent. This is irony in
this, given that the IPoA and SDGs emphasize LDCs' improved participation in global trade, but
Nepal and many other LDCs have lost in terms of gains from trade (Razzaque, 2019). Low
production and productivity, non-tariff barriers in destination markets, weak infrastructure
related to quality, standards and laboratory facilities, poor development of value chain and
inadequate legal framework to protect Intellectual Property Rights (IPRs), along with the limited
use of existing preferences and potentials by Nepali exporters are major challenges for
improving trade competitiveness.
4. Commodities
The composition of Nepal's exports has changed gradually, shifting from agriculture and primary
commodities to processed and semi-processed manufacturing commodities. Despite this, the
primary handmade commodities and agriculture-related goods still dominate the country’s export
basket. On the other hand, imports are highly concentrated on commodities including petroleum
products, industrial raw materials, machinery equipment and vehicles. Looking at the sources
and destinations of exports and imports, Nepal is over-dependent on limited (mostly single)
markets. Annex 4 presents the scenario of the top 10 commodities by the first two digit of the
Harmonized System (HS) code, also called chapter, in terms of their relative share in total
exports and imports. Comparing the year 2011, 2015 and 2018, the pattern is found to be
consistent. The top 10 commodities have contributed about two-thirds of all exports and imports.
For these years, almost the same commodities are in the list of top 10 exports and imports items.
In exports: iron and steel items; carpets and floor coverings; coffee, tea and spices, including
cardamom and ginger; manmade staple fibres; manmade textile materials, apparel; and clothing
(garment) accessories are at the top of the list.
18
Looking at broader commodity categories, textile-related products (HS 54, 55, 57, 62, and 63)
are the most important export items, followed by agriculture products (HS 07, 09, and 20); and
steel and iron materials (HS 72 and 73). In imports, the major commodities that dominate the list
are petroleum; industrial raw materials, including semi-processed iron; industrial machinery,
heavy equipment and parts; vehicles and parts; and precious and semi-precious metals.
Interestingly, cereals (processed agriculture) products now appear within the top 10 of imported
commodities (Annex 4). Nepal used to export such commodities in huge volumes until two
decades ago. This indicates that Nepal has been losing its strengths in the commodities where it
had comparative advantages with tremendous potentials.
In terms of both exports and imports, India is the top destination as well as the top source.
Among the exports to India, coffee and tea, spices including ginger and cardamom, vegetables,
textile materials, staple fibres, other textile articles, and iron and steel are the major items.
Bangladesh was a major importer for the edible vegetables. For carpets and apparels, United
States, Germany, and other EU countries are major destinations. Turkey imports some staple
fibres. China is now emerging as an important trading partner with a significant rise in exports
and imports. Diversification of commodities is critical for LDCs to improve trade
competitiveness and enhancing the productive capacity of domestic industries. It is, however,
clear that Nepal has been unable to expand exports markets to get benefits from the regional
trading arrangements such as SAFTA and BIMSTEC and has not benefited from preferential
facilities under multilateral trading arrangements.
As its major trading partners and export commodities are limited, Nepal is vulnerable to external
trade aggravation and global economic downturns, oil price fluctuations and geopolitical
tensions. Nepal faces more challenges to move into the higher value-added products to reduce an
excessive dependency on imports. Within the set of landlocked LDCs, Nepal has lower export
sophistication than what was expected after the adoption of IPOA. This implies that developing
new products for exports is important for Nepal (Razzaque, 2019).
5. Private Sector Development
Private sector development has been a priority for Nepal since the 1990s. The government has
undertaken policy and regulatory reforms to strengthen private sector capacity. A more open and
flexible approach, including encouragement of foreign direct investment in the manufacturing

19
and financial sectors, has been instrumental in increasing investment and enhancing management
competitiveness of businesses. The Industrial Policy 1992 was a milestone in creating an open
and competitive environment for the private sector by curtailing government interference in price
fixing of industrial goods. The subsequent Industrial Enterprises Act; the Foreign Investment and
Technology Transfer Act; and the One Window Policy were major thrusts to market-driven
strategies, and the dominant role of private enterprise. As a result, the private sector was
encouraged to strengthen links between manufacturing, agriculture and service sectors. Emphasis
was given to promoting labour-intensive, local resource-based and export-oriented industries.
Since then, the private sector has played a pivotal role in the development of financial and capital
markets, quality health services, tourism and hospitality, education, and information and
communications technology sectors.
The GoN implemented a private sector development strategy – the Industrial Development
Perspective Plan: Vision 2020. The main thrust of this strategy was to promote public-private
partnership for restructuring and rehabilitating sick industries, and fostering promising future
industries, raising the productive capacity of domestic firms, spurring additional investment in
physical infrastructure, improving the supply of skilled manpower for industries, and creating an
enabling business environment. Implementation of the Industrial Perspective Plan, however,
could not bring the desired positive change in the industrial sector, since the contribution of the
manufacturing sector to GDP started to decline at the same time. Many private sector industries
with comparative advantages have been shut down and the country lost hundreds of thousands of
jobs, adversely affecting the development of micro, cottage and small-scale industries.
The Industrial Policy 2010 promised easy entry and exit to investors, subcontract manufacturing,
tariff protection to local industries with high value addition, and ensured protection of
intellectual property rights. Under this policy, government support for the private sector is
prioritized to infrastructure development industries where special tax holidays are provided for
the industries established in rural and unindustrialized areas. The policy provided additional
incentives for the private sector to play an instrumental role in the improvement of social
development through Corporate Social Responsibility (CSR). The private sector contributes
about 80 percent share of capital formation in the economy (Annex 5).

20
The government has considered that private sector development is critical to achieving the
overarching objective of LDC graduation by 2022 and becoming a middle-income country by
2030. Accordingly, high priority is given to promoting a business-enabling environment through
continuous legal and structural reforms in the changed context of the federal system of
governance. Nepal Infrastructure Bank (NIB) has been established in partnership with the private
sector. To support that, the Public-Private Partnership and Investment Act, 2019 has been
enacted. This allows the Investment Board of Nepal to approve and provide full support to the
implementation of any investment that is more than NPR6 billion or to a hydropower project of
over 200-megawatt capacity. In the meantime, NIB has been mandated to finance growth
facilitating large infrastructure projects and also support raising capital from the market.
The government has recently enacted new Foreign Investment and Technology Transfer Act
(FITTA) and amended the Special Economic Zone Act (SEZA) with aim of attracting Foreign
Direct Investment (FDI) in the growth drivers and export potential sectors. The FITTA provides
a one-stop service and equal treatment of foreign investors. Equal treatment allows foreign
investors to avail themselves of benefits received by domestic investors such as tax concessions
and other incentives. However, quantitative indicators show that Nepal has been lagging behind
in terms of private sector development. The low level of private sector development has been
considered as both a cause and an outcome of the country's low level of economic development.
According to National Economic Census (2018), there are 9.23 million economic establishments
in the country in 2018 (CBS, 2019b), among them only 50.1 percent persons are engaged in the
economic activities. The Nepal Labour Force Survey (2018) reports that the labour force
participation rate was only 38.5 percent and 36.5 percent workers were engaged in the formal
sector.
As a consequences of policy and administrative reforms on entry, registration and operation of
businesses, Nepal has achieved remarkable progress in doing business index. According to
Doing Business Report 2020, Nepal has jumped from 110th position in 2018 to 94th position in
2019. The success was due to the improvements in dealing with construction permit, getting
credit, trading across border and enforcing contract. However, there is room for improvement in
starting a business and property registration.

21
Global Competitiveness Index have suggested that the environment for private sector
development needs to be improved further (Annex 5). The competitiveness of Nepal’s private
sector in today’s global economy is limited, given its small size, large degree of informality, and
low level of technological innovation. Most firms are small, operate in the informal market
space, and have limited economies of scale and profitability. Dominant large firms are generally
family-run and have survived mostly in sectors where competition is limited. Failure to manage
the domination of the informal sector may further hamper the private sector’s growth potential
and that of the economy as a whole.
However, there is huge potential for large scale investments from both domestic and foreign
private sectors, especially in sectors where Nepal has a comparative advantage. To capitalize on
that potential, the government is committed to policy and institutional reforms, development of
infrastructure and improving the investment climate by providing ready-to-invest projects. Apart
from such reforms, smooth access to finance, grants and seed funding provisions for start-ups
and scale-ups of attractive business models are major initiatives taken to accelerate private sector
development. Meanwhile, there are challenges that Nepal is facing in terms of sustainable private
sector development. Meeting the domestic demand currently fuelled by remittances and
promoting export competitiveness in the international markets to create demand outside the
country are key challenges. Enhancing supply-side capacity of domestic industries and a very
low level of FDI also pose a challenge for the gradual transition from a consumption to an
investment-led growth model in the medium-term and productivity-led growth in the long term.
6. Human and Social Development
Human development is fundamentally concerned with expanding people’s choices, which has
multiple dimensions and a widespread impact on the well-being of citizens. Human
Development Index (HDI) scores show that Nepal has made significant progress in all
dimensions of human development in the last two decades. Table 1 presents the progress made
by Nepal in HDI. The progress made in three dimensions of HDI is presented below.
Table 1: Human Development Indicators of Nepal
Year Life
expectancy
at birth
Expected years
of schooling
Mean years
of
schooling
GNI per capita
(2011 PPP$)
HDI value
2011 66.9 12.3 3.3 2042 0.535

22
2012 67.3 12.3 4 2120 0.548
2013 67.6 12.4 4.2 2181 0.554
2014 68 12.2 4.5 2305 0.56
2015 69.9 12.2 4.7 2,353 0.566
2016 70.3 12.2 4.9 2,334 0.569
2017 70.6 12.2 4.9 2,471 0.574 Source: UNDP (2018).
Education
Nepal has made impressive progress in achieving universal primary education. The large
increase in the net enrolment ratios (NERs) across all levels and a gradual improvement in the
retention rate have been reflected in encouraging improvements in literacy rates for all age
groups. Despite such progress, the drop-out rate remains high. Learning, employability and
productivity of those completing several years of education are not satisfactory. Data show that a
considerable number of children are still out of school (Annex 6).
Several policies and programmes were instrumental to achieving the MDG education goal. These
included decentralization of school management to communities, supervision of schools by
resource centres, support to schools through per student grants, introduction of teacher licensing,
upgrade of entry qualifications of primary school teachers, and the establishment of a system for
assessing learning outcomes, and provision of midday meals, other health and nutrition
programmes, scholarships, and separate toilets for girls (NPC, 2016c). With the aim of
improving the quality of education further, the GoN has recently enacted the Compulsory and
Free Education Act 2018. In the Act, provisions have been made for the scholarship to the
children of martyrs, Dalits, ultra-marginalized families, and endangered communities, along with
children affected by political conflicts. Campaigns on literacy for all citizen and enrolment for all
as well as merit-based scholarships have been implemented for some time to encourage targeted
students to complete at least higher secondary level, and to increase the retention rate.
Special and customized programmes are being implemented in close cooperation with
development partners for differently-abled students. Various technical and vocational courses
and programmes have been introduced and an emphasis has been given to producing skills that
increase employability in domestic and foreign labour markets and enhance their productivity.
However, the gap between gross and net enrolment rates clearly indicates that dropping out is
still a problem. Learning outcomes that underscore the quality of education are major challenges,

23
especially in public schools. Acquisition and retention of key foundational skills, like literacy,
language proficiency, and numeracy are not so encouraging. Thus, addressing the challenges
around learning outcomes will help lay the foundation for broader skills development and
enhancement of labour productivity.
Population and Primary Health
According to the MDG Final Status Report (NPC, 2016), Nepal made commendable progress on
improving primary health between 2000 and 2015. It was able to meet all the targets under child
health – reducing IMR, reducing U5MR and increasing immunization against measles. The
immunization programme against measles was successful, as 92.6 percent of one-year old
children were immunized in 2015. That contributed to a remarkable decline in infant and child
mortality. Progress in combating HIV/AIDS, malaria and other diseases was impressive. The
spread of the Human Immunodeficiency Virus (HIV) has started to reverse. The national
response to HIV has been institutionalized. There is a national strategic plan to end the Acquired
Immune Deficiency Syndrome (AIDS) epidemic by 2030.
Achievement in maternal health is also encouraging since the maternal mortality rate is falling
continuously. The large reduction in the MMR is associated with the rapid fall in the total
fertility rate, which is reflected by the increased proportion of married couples using
contraception. The proportion of births attended by skilled providers is gradually increasing. The
proportion of women delivering their babies with the help of skilled birth attendants increased by
more than 50 percent from 2011 to 2016. Remarkable progress was made in reducing the
proportion of wasting and stunting children during the review period (Table 2). However, these
improvements are not uniform across ethnic groups and geographical regions, as disparities
between rural and urban areas and among eco-geographical regions and social groups remain.
Despite such progress, many other reproductive health related problems exist and special
attention is needed to meet the SDGs on schedule. There are vulnerabilities, basically on how to
reduce adult mortality and to address the main causes of mortality. Reducing the disparity in
gender and age group and addressing the underlying risk factors is challenging (WB, 2019).
Maternal mortality is still a leading cause of death for young women. Physical, behavioural, and
environmental risk factors contribute to the causes of death with gender disparity.

24
It is also necessary to prevent or cure the non-communicable diseases or injuries more effectively
to improve health outcomes. So, Nepal needs to address behavioural and environmental factors
such as the use of tobacco and alcohol, air pollution and access to safe water and sanitation and
road traffic accidents.
Table 2: Progress in Health Indicators
Indicators 2011 2016
Maternal Mortality Rate (Per 100,000 live births) 250 239
Under 5 Mortality Rate (Per 1,000 live births) 54 39
Infant Mortality Rate (Per 1,000 live births) 46 32
Neonatal Mortality Rate (Per 1,000 live births) 33 21
Wasting Children 11% 10%
Immunization Coverage Rate 87% 78%
Institutional Deliveries 35% 57%
Delivery by Skilled Health Personnel 36% 58%
Total Fertility Rate (births/women) 2.6 2.3
Unmet Needs of Family Planning 27% 21%
Source: DOH (2017).
Youth Development
Youths are the crucial change agents in political, economic and social fields. Experience shows
that countries utilizing the available youth population more wisely and efficiently have achieved
remarkable progress in socio-economic and human development. According to the Population
and Housing Census 2011, youth population (age group between 16 and 40) accounts for 40.35
percent of the country's total population. There has been a clear demographic dividend in Nepal
for at least a decade. Considering this window, Nepal has taken it as an opportune moment to
scale-up the youth development initiative as an integral part of LDC graduation and the SDG
agenda. A separate ministry, Ministry of Youth and Sports (MoYS), was established in 2008 and
an autonomous National Youth Council was also established under the Youth Council Act 2015.
National Youth Policy, 2015 and Youth Vision 2025 were formulated to mobilize various
ministries, government agencies, private sector actors and development partners to achieve the
SDGs in a coordinated manner (MOYS, 2016). Importantly, the Fifteenth Plan (2019-24), apart
from priorities, has included the strategies and working policies to mobilize youth organizations,
network with them and support them in leadership development and equip them to be able to

25
work as effective change agents. However, despite a number of policies, plans and strategies for
empowering youth, there are numerous factors impeding youth development in Nepal including
shortage of employment opportunities at home, easy out-migration and a low priority for brain-
gain.
Water and Sanitation
Nepal has made impressive progress in expanding the coverage of basic water supply, sanitation
and hygiene practices. Progress in the water and sanitation sector accelerated after the adoption
of the new constitution, which recognizes access to water and sanitation as a fundamental human
right. The government has given high priority to sanitation and hygiene facilities. A separate
Ministry of Water Supply and Sanitation (MoWSS) was established in 2015. Nepal has
developed a comprehensive Water Sanitation and Hygiene (WASH) Sector Development Plan
(SDP) which has set targets, approaches and a road map for holistic development of the WASH
sector to ensure achievement of the SDGs by 2030. A decentralized service delivery arrangement
has been established and implemented, which has made sanitation promotion a social movement.
GoN has been providing fiscal transfer to provinces and local level through conditional and
special grants for improve safe drinking water. As a result, according to the latest Nepal
Demographic and Health Survey (NDHS-2016), 95 percent of households are using improved
drinking water facilities. Access to improved sanitation also dramatically increased from 40
percent in 2011 to 99 percent in 2018 respectively (MOF, 2019). Nepal has been declared as
Open Defecation Free (ODF) on 1 October 2019, the first country to achieve ODF status in
South Asia.
Increasing access to quality water and improved sanitation is still a major challenge due to poor
drinking water quality, inefficient functionality of water supply systems, and high regional
disparity in access to WASH services. Nepal’s Multiple Indicator Cluster Survey (MICS-2014)
reports that only 29 percent of water sources (at point of collection) were free from bacterial
contamination (E. coli) while only 18 percent of households had their drinking water free from
bacterial contamination. Disadvantaged and marginalized populations are more vulnerable to
poor hygiene practices in schools and health care facilities. The devastating earthquakes in 2015
damaged WASH facilities along with hundreds of thousands of houses and buildings, making the
smooth operation of the WASH infrastructure in the country more challenging (UNICEF, 2018).

26
Gender Equality and Empowerment of Women
Nepal has made good progress in gender equality and women’s empowerment, particularly on
the political front. About 40 percent of all local, provincial and federal level elected positions are
occupied by women representatives. According to the Election Commission of Nepal, at least
14,000 women were elected in the latest local elections. Women now occupy chairs and deputy
chairs of rural municipalities as well as mayors and deputy mayors of municipalities including
ward chairs and members. 37.7 percent members are women in the Federal parliament and 34.4
percent women members are elected in the provincial assemblies. And for the first time, the
Head of the State, Chief Justice, and Speaker of the Parliament were all women in 2017.
In the civil service, the representation of women has increased significantly in the last decade
due to affirmative action and positive discrimination. Currently, 23.2 percent civil servants are
women (PIS, 2019). However, the presence of women civil servants in decision-making is still
very low. The introduction of a gender-responsive budget system for more than a decade has
helped to increase gender-responsive programmes and projects across sectors. As part of
economic empowerment, women are engaged in the low productive activities. The Federation of
Nepalese Chamber of Commerce and Industries (FNCCI), a private sector umbrella organization,
is also currently led by a woman President. The recent National Economic Census 2018 reports
that 26.9 percent of the total establishments have women founders and 29 percent were the
managers of such establishments. Similarly, 40 percent employees are women in the
establishments (CBS, 2019b).
Table 3: Gender Development Index of Nepal (2017)
Indicators Female Male
Life expectancy at birth 72.2 69
Expected years of schooling 12.6 11.8
Mean years of schooling 3.6 6.4
GNI per capita (2011 $PPP) 2219 2738
HDI values 0.522 0.598
Female-Male ratio (GDI) 0.925
Source: UNDP (2018).

27
Nepal has successfully achieved gender equality at the secondary education (Grade 1-12) with
the net enrolment rate adjusted by Gender Parity Index (GPI) scores of 1.01 in 2018 (Tables 3
and 4). The GPI adjusted literacy rate also shows that gender equality is improving significantly.
Gradual improvement in the female teacher participation rate in primary as well as secondary
education also indicates gender empowerment. However, disparities in educational outcomes
within the different social groups, geographical locations, and income level of the households are
still high.
The Constitution has adopted the principle of proportional participation of women without any
gender discriminations where rights have been granted for women to participate in all state
organs, including areas such as education, health, employment and social security. The New
Industrial Policy 2010 has also made special provisions to ensure more employment
opportunities for women. Special Provisions for women entrepreneurs have been made in the
Industrial Enterprise Act 2016 with the aim of promoting female entrepreneurship. In line with
the SDG agenda, achieving gender equality and empowering all women and girls, Nepal also
undertook reforms to help women to attain equal rights to economic resources including land,
other forms of property and financial services. The Industrial Enterprises Act 2016 has a special
provision for women entrepreneurs of 35 and 20 percent exemption on the industry and industrial
property registration respectively. The companies shall have 15 percent tax exemption if they
have more than 50 percent women, disabled or dalit employees.
Table 4: Educational Achievement Indicators based on GPI
Indicators 2015 2016 2017 2018
Net Enrolment Rate (Grade 1-12) based on GPI 0.99 0.98 0.99 1.01
Female Teacher Participation Rate (Basic level) 38.8 40.7 41.2 43.1
Female Teacher Participation Rate (Secondary level) 14.1 14.8 16.13 17.4
Source: MOF (2019).
However, the Third National Labour Force Survey (NLFS-III) shows that there is a bias in terms
of gender equality in the workplace (CBS, 2019c). NLFS-III reveals that the proportion of
women employed is about 13 percent. The ratio of unemployed women is 13.1 percent against
10.3 percent for men. The labour force participation rate of women is lowest at 26.3 percent in
comparison to 53.8 percent for men. Similarly, labour underutilization rate of women is higher at
49 percent in comparison to that of men, which is 32 percent. The NLFS-III also reports that the

28
gender pay gap in Nepal is as high as 30 percent. The ratio of women to men in tertiary
education has increased over the last decade.
Social Protection
Nepal has implemented many social protection programmes including children grants and cash
transfers to senior citizens, people with disabilities, endangered ethnic communities, and single
women. Targeted programmes on poverty reduction and employment as well as public work and
micro-insurance are also other social protection schemes. Social protection programmes initiated
by government agencies in isolation, however, lacked coordination. The government has now
taken initiatives to consolidate social protection schemes building an integrated national social
protection framework and implement them through single window system.
The introduction of the old age pension for senior citizens in 1995 was a historic beginning in
social protection initiatives in Nepal. Successive governments have added schemes to provide
relief to the poor and marginalized sections of the population. A large array of programmes
under different headings, such as cash transfers, in-kind transfers, access to services, social
insurance, public works, employment/livelihood creation, labor market interventions and care
services are under implementation. Major social protection programmes include universal old-
age pension for all citizens above a certain age, child protection grants for children under five,
disadvantaged castes and regions, a disability allowance, education-related social transfers such
as caste-based stipends, school meals in government schools, and a child birth grant to the
women in remote areas.
Fourteen percent of the population has been benefited from social protection schemes (NPC,
2019). Government spending on social protection reached about 12 percent of the budget and
over 5 percent of the country's GDP on social protection programmes (Table 5). Importantly, the
Constitution 2015 has recognized social protection as one of the fundamental rights of Nepali
citizens. The federal government has the role of policy design, standard setting and coordination.
To facilitate the process, the federal government has promulgated two major legislation related to
social protection: the Labour Act, 2017, Pension Fund Act, 2019 and Contribution-based Social
Security Act, 2017. The Social Security Act, 2017 and its regulations provide legal foundations
for the introduction of the schemes. The first contributory programme includes medical, health

29
and maternity benefit, accidental and disability benefit, benefits for dependent family members
and old-age benefit. After the devastating earthquakes of 2015, shock-responsive social
protection schemes were introduced. These schemes aim to strengthen the community's resilient
capacity. Evidence suggests that such schemes scale up protection in response to unforeseeable
shocks in low-income, fragile and conflict-affected communities or areas.
Table 5: Social Protection Coverage
Indicators 2012 2013 2014 2015 2016 2017 2018
Enrolled Beneficiaries of Social
Protection Schemes (100 thousands) 217.3 216.1 226.6 224.6 255.7
Social Protection Expenditure
(Rs. 10 Million) 10.9 15.8 12.5 15.0 20.1 38.3 39.6
Social Protection Expenditure (%
to GDP) 1.80 2.57 1.97 2.22 2.90 5.51 5.28
Source: MOF (2019).
Despite impressive progress made in poverty reduction through social protection, eradicating
poverty and vulnerability remains a major challenge. Poor growth performance, lack of
productive employment, endemic natural disasters, gender violence, climate change and rising
prices are the main manifestations of vulnerability. Social protection measures initiated by the
GoN, so far, have been found inadequate to mitigate the adverse impact of unexpected shocks.
The attention of social protection must be guided to prevent marginalized people falling below
absolute poverty due to economic and natural shocks.
7. Multiple Crises and Other Emerging Challenges
With political stability and a momentum for development, the economy of Nepal has a positive
outlook in the medium to longer terms. It has recovered from shocks such as conflict and
political transition, border disruption in the southern part, and natural disasters including the
earthquakes. The economy is now growing by an average of about 7 percent per annum. The
government has taken a long-term vision of 'Prosperous Nepal, Happy Nepali' and is
encouraging both domestic and foreign investors to invest their capital in the areas such as
infrastructure, energy, manufacturing industry, tourism and hospitality sectors. However, despite
the positive prospects Nepal is still vulnerable to multiple shocks, and the impacts of climate

30
change. Some of the key areas of possible crises and emerging challenges are briefly discussed
below.
Natural Disasters
The socio-economic progress achieved by Nepal since the adoption of the IPoA was significantly
derailed by the earthquakes of 2015. According to the Post-Disaster Needs Assessment Report,
one-third of the population was impacted severely, which pushed about 3 percent of the
population below the poverty line (NPC, 2015). More than half a million homes and 19,000
classrooms were destroyed. There was widespread disruption of water supply, sanitation and
health facilities. Since 2015, most of the damaged properties has been reconstructed. But full
recovery is still underway and may take more years. Exposure to intense cyclonic frequency in
insular regions and exposure to the movement of tectonic plates are acute dimensions of the
country’s vulnerability.
The country straddles the fault line between two major tectonic plates – the Indian plate and the
Eurasian plate, which push against each other. This process periodically causes earthquakes
when strains built up along the fault lines. Historically, there has been a dangerous seismic
activity every 70 to 100 years in Nepal. According to seismic experts, only a small section of the
fault under Nepal ruptured in April and May 2015 earthquakes and aftershocks. This means that
a very large amount of energy remains stored in the ground with high risk of another large
earthquake in Nepal.
With such a high disaster risk, Nepal has enacted Disaster Risk Reduction and Management
(DRRM) Act 2017, which is expected to help mitigate some of the larger risks. The act focuses
on coordination and management of all activities pertaining to disaster management, disaster risk
reduction, disaster recuperation and disaster response, as well as monitoring and mitigation
measures on climate change. The government has implemented the National Disaster Risk
Reduction Policy 2018 and National Disaster Risk Reduction Strategic Action Plan (2018-2019)
for policy intervention and programmatic implementation of the Act. Following legislation,
policy guidelines have also been adopted at the local level to incorporate disaster risk
management in local government development plans. The upcoming Catastrophe-Deferred

31
Drawdown Option (CAT-DDO) operation supports further reforms in reducing risks from
natural disasters.
Climate Change
Global warming resulting from climate change, to which Nepal’s contribution is negligible, is
also threatening to melt Himalayan snow and glaciers thereby rendering the glacial environment
unsafe for humans. Recent reports, including that of ICIMOD2, have shown that even if the
global temperatures are contained within 1.5 degree C above pre-industrial levels, one-third of
the snow in the Himalayas will melt by 2100.
Continued warming has affected Himalayan ecology, including snowfall patterns and ice melting
– most substantially in terms of glacier retreat and significant increases in the size and volume of
glacial lakes, making them more prone to Glacial Lake Outburst Flooding (GLOF). There are at
least 20 lakes at risk in the mountainous region, and there is growing concern that an earthquake
or excessive precipitation could prompt GLOF, washing away settlements and destroying
infrastructure, such as hydroelectric plants, roads and bridges along river basins. More
worryingly, melting Himalayan glaciers could have a huge impact on water resources and fluvial
ecological systems of Nepal and those downstream.
Risks from climate-related natural disasters are also high and may impact Nepal’s development
process and growth trajectory, requiring early action to ensure that sources of growth are
climate-resilient to the maximum extent possible. Erratic monsoons regularly cause climate-
related disasters, such as drought, floods, and landslides. These undermine agricultural
production, affecting infrastructure, and reversing gains in poverty reduction. In addition, rainfall
patterns seem to have changed dramatically over the years. It is no longer easy to predict when
the monsoon rains will come or how long they will last.
The Global Climate Risk Index (GCRI) ranks Nepal as the 11th most affected country in the
world in the last 20 years and the fourth most affected country in 2017. This was further
reinforced by the country’s first tornado, which hit two Terai districts in March 2019 and
resulted in a loss of $4.6 million worth of crops and livestock (WB, 2019). As mentioned above,
the implementation of the DRRM Act, 2017 provides guidelines and a framework for all three
2 http://www.icimod.org/himap

32
levels of government to help mitigate the risks. Figure 3 indicates the farmland destroyed and
damage in crops due to climate change-related natural disasters (floods, drought and landslides).
Figure 3: Farmland Damaged by Natural Disasters (flood, drought, landslides)
Source: MOF (2019).
Labour Markets Mismatch
Economic diversification, structural transformation and broad-based income growth are crucial
to employment generation. They can also help in meeting the SDGs on schedule. However, due
to its inability to enhance the productive capacity of domestic industries, Nepal has not been able
to create quality jobs. This has resulted in persistently high unemployment, with huge numbers
of unskilled people going abroad in their search for jobs – and an enormous waste of productive
human potential. It is also associated with deteriorating social cohesion in families and
communities. Meanwhile, domestic industries are facing a shortage of skilled human resources.
The gap is being filled by the people arriving to fill those vacancies from a southern
neighbouring country. Therefore, it is challenging to create a conducive environment to generate
employment and minimize skills mismatch.
Trade Deficit and Remittance Dependency
It is well documented that remittances have significantly contributed to raising household
incomes and reducing poverty in Nepal. The flow of remittances, however, depends on the
availability of employment opportunities to Nepali workers in host countries. The expanding
economy of host countries have always provided a growing pool of jobs for migrants, thereby
33
inducing a higher level remittances inflow. But any stagnation and recession in the host
economies may have severe and adverse impacts on foreign employment and remittances. Nepal
has no leverage vis-à-vis economic policies and decisions in host countries. Therefore, its
vulnerability is very high.
Given the geographical concentration of Nepali migrant workers in oil-producing countries, a
decline in oil prices always constitutes a major risk for Nepal’s remitted income with direct
consequences on domestic consumption, savings and overall economic growth. It is therefore a
matter of concern that Nepal's heavy dependence on large-scale labour migration has added a
specific dimension to its economic vulnerability. Ever increasing trade deficits and resulting
Balance of Payments (BOP) crises indicate the growing vulnerability of the country’s external
sector. The persistence of a large current account deficits is putting pressure on Nepal’s foreign
exchange reserves, though currently these are adequate to import goods and services for more
than seven months.
Nepal is also heavily dependent on imports of goods and services as well as on petroleum
products, which include petrol, diesel, kerosene and Liquefied Petroleum Gas (LPG). The price
of these products is always subject to external shocks. The expenditure on imported fossil fuels
has generally exceeded the income Nepal generates from the export of all commodities. This will
have very serious economic consequences in future because if the trend continues, the country
may not be able to import basic necessities such as medicine and food due to the shortage of
currency reserves.
Risks related to Nepal’s Landlocked Location
As a landlocked country, Nepal has no direct access to sea ports. Its ability to trade competitively
in goods largely depends on the neighbouring countries' transit facilities. Ensuring smooth and
efficient transit facilities is necessary to harness the benefits of global trading system. This also
affects the domestic market system and the supply chain.
Food Security
Agriculture contributes 27 percent to the country's GDP. It continues to be the main source of
food supply to the growing population. Nepal’s cereal crop production – its staple foods –
34
depends heavily on monsoon rains. Consequently, agricultural production is not free of setbacks,
slumps and sharp fluctuations. The production of crops that depend on the regular provision of
surface water, such as paddy rice and maize, has been highly vulnerable to fluctuations in the
monsoon rainfall pattern. Inadequacies in soil moisture due to delayed or poor rains, and
repeated shortages of fuel for irrigation and land preparation, have curbed the expansion of food
and cash crop production.
The years of conflict deterred investment in agriculture on which more than 60 percent of the
population depends. Subsistence farmers, small plots of land and stagnant production have made
the country dependent on imported food items. The World Food Programme has been providing
food assistance to Nepal. As Nepal has been a net importer of food grains in recent years, the
situation may aggravate if the supply of such products is affected. The excessive dependence on
subsistence farming may also increases environmental degradation as a result of depletion of
forest resources. This, in turn, will lead to biodiversity loss and desertification. Food insecurity is
therefore a major challenge for the country.
Investment Gap
There is a risk that growth will slow due to the gap between the requirement and availability of
investment funds. That may create risks in meeting investment requirements in physical
infrastructure and in raising productive capacity. The financing strategy of SDG estimates that
Nepal requires average USD19.7 billion annually during 2016-2030 to achieve the SDGs targets
which is 47.8 percent of the GDP. World Bank (2019a) also reports that Nepal needs
infrastructure investment of around 10 to 15 per cent of GDP annually for the next 10 years to
accelerate the growth required to achieve the targets of IPoA and SDGs. There is financing gap
of 13.8 percent of GDP to achieve SDG targets. The government has investment commitments
worth about USD17.5 billion from the Nepal Investment Summit held in March 2019. However,
realization of these investments remains a huge challenge.
8. Good Governance
The country is politically divided into seven provincial governments and 753 local government
units. The Constitution of Nepal provides revenue and expenditure management power explicitly
to central, provincial and local governments. The election of local governments after almost two

35
decades has raised hopes of strengthening governance system in Nepal. The implementation of
federalism is expected to improve governance quality and service delivery to a great extent. Sub-
national governments are engaged in planning and resource management and financing the basic
needs of the population by ensuring quality services and equitable distribution of resources based
on development needs. But there are capacity challenges such as duplication in programme
implementation resulting in allocative inefficiency, especially at the provincial and local levels.
This poses a risk to service delivery. Furthermore, capacity challenges have impeded the
functioning of subnational governments.
9. Mobilizing Financial Resources for Development and Capacity
Building
For long, the economy of Nepal has been confronting the problem of low investment, low
growth and limited employment opportunities. Despite notable progress in poverty reduction and
social fronts, Nepal is still a low income LDC. However, it has maintained comfortable
macroeconomic stability throughout the review period. The gross national debt is below 30
percent of GDP with average debt servicing expenditure below 3 percent of GDP. This has been
possible due to low budget execution rates, in particular low capital spending and a significant
rise in government revenues (Table 6). Government revenues in the form of taxes, grants and
other non-tax revenues have gradually served as the major source of government finance and
investment programmes. However, in terms of tax revenue, imported goods have contributed
heavily to indirect tax. Without increasing the share of direct taxes, which remains relatively
low, the growth of revenue may not be sustainable in the long run.
Table 6: Resource Mobilization
Indicators 2011 2012 2013 2014 2015 2016 2017 2018
Domestic Resource Mobilization (Ratio to GDP)
Gross Domestic Saving 14.0 11.0 10.6 11.9 9.2 4.1 13.4 17.8
Gross National Saving 37.0 39.5 40.7 45.7 44.1 40.1 46.4 47.1
Gross Fixed Capital Formation 21.4 20.8 22.6 23.5 28 28.7 31.4 34.7
Total Government Expenditure 21.6 22.2 21.2 22.1 25.0 26.7 31.3 35.9
Total Revenue Collection 14.5 16.0 17.5 18.2 19.1 21.4 22.8 24.0
Foreign aid (Ratio to GDP) 4.2 3.4 2.8 3.1 3.0 3.2 3.7 4.3
National Debt Indicators (Ratio to GDP)
Outstanding Total Debt 32.5 34.3 32.7 28.2 25.6 27.9 26.3 30.2

36
Outstanding External Debt 19.0 20.3 19.7 17.7 16.1 17.3 15.5 17.3
Debt Servicing (Interest & Principal) 2.3 2.9 2.7 3.5 3.4 2.7 2.4
External Debt to Revenue (Ratio) 130.8 126.6 112.6 97.3 84.6 80.7 68.0 72.3
FDI (Ratio to GDP) 1.14 1.57 1.48 0.50 0.65 0.85 1.94 2.34
Remittances (Ratio to GDP) 18.5 23.5 25.6 27.7 29.0 29.5 26.0 24.9
Source: CBS (2019a); FCGO (2018); and NRB (2018)
Another concern about external finance is that ODA has declined over the years. Therefore, there
is a possibility of raising more finance from the ODA grants by increasing aid utilization
capacity. This suggests that Nepal has additional opportunities to qualify for larger volumes of
this source of concessional funding. However, that requires a higher capacity in project
development and effective and timely execution. Nepal is now a destination of Other Official
Flows (OOF) from non-OECD countries, such as China and India. In total, the OOF has added
another 6 to 10 percent above the ODA contributions during the last decade (MoF, 2017). A
major share of such funding has been directed towards education, health and public infrastructure
projects.
The GoN has gradually reduced its reliance on domestic and external borrowing to cover public
expenditure. The current debt levels are moderate. The proportion of debt servicing to total
revenue (excluding grants) has reduced, although such a trend may see a reverse in the coming
years. This gives increased space for debt financing on concessional terms without a significant
risk of reaching unmanageable debt service levels. Access to additional debt financing can be
acquired from concessional sources, such as multilateral development banks and Development
Finance Institutions (DFIs).
Access to domestic credit is equally important for financing new investments and allows people
to purchase assets. During the review period, domestic credit in Nepal has grown significantly,
and is contributing around 80 percent of the gross fixed capital formation. Remittances have
been the major sources of augmenting the national saving capacity and are helping to maintain
financial stability in the banking system. This could be a source of augmenting private capital
inflows to finance infrastructure development projects. It is to be noted that the repatriation of
profits from FDI ventures is also growing every year, which may pose a challenge of private
flows in the country.

37
There is also some scope to mobilize financial resources through alternative channels of
investments, including hedge funds, mutual funds and venture capital funds. While the local
venture capital industry in Nepal is still in its infancy, there are some prospects for the future.
Venture capital is directed at several sectors, including information technology, education, health
care, agriculture and tourism, among others. Despite strong commitments to supporting start-ups
in Nepal, venture capital funds lack viable start-ups in which to invest. The start-ups lack initial
funding for putting together a viable business plan and entering a pilot phase to test the business
model and market for their products and services to scale up to a viable commercial entity.
9. Progress towards Graduation
To achieve the overarching IPoA goal for graduation, Nepal has made continuous efforts in close
cooperation with the private sector, civil society organizations, UN system entities and
development partners to achieve the above objectives within the set time frame.

38
Figure 4: Annual GDP Growth Rates for the Period 2011-2018
Source: CBS (2019a).
Nepal has been eligible for graduation in two consecutive triennial reviews in 2015 and 2018. It
met two of the three criteria: the HAI and EVI. It is, however, lagging behind in GNI per capita.
At the time of the 2015 review, Nepal's GNI per capita was USD659, well below the graduation
threshold of USD1,242. In 2018, it has raised the GNI per capita to USD745 – still much lower
than the threshold of USD1,230. However, the HAI score was well above the graduation
thresholds of 66.0 and EVI was below 32, within the threshold for graduation.
Table 7: Nepal's Progress Status for LDC Graduation Criteria
Criteria Thresholds 2009 2012 2015 2018
GNI-Per Capita
(USD as per WB Atlas Method)
Inclusion Threshold 905 992 1035 1025
Graduation Threshold 1086 1190 1242 1230
Nepal's Position 380 420 659 745
Human Asset Index (HAI)
Inclusion Threshold 60 60 60 60
Graduation Threshold 66 66 66 66
Nepal's Position 58.3 59.8 68.7 71.2
Economic Vulnerability Index (EVI)
Inclusion Threshold 42 36 36 36
Graduation Threshold 38 32 32 32
Nepal's Position 33.6 27.8 26.8 28.4
Source: UN-CDP (2018).

39
Nepal has made notable progress towards LDC graduation. However, progress was disrupted by
the devastating earthquakes that struck the country in April and May 2015. Overall economic
growth of Nepal fell by half in 2015 and was 0.6 percent in 2016. The recovery effort is still
underway and will take more years still. Therefore, a case was made to defer the decision on
Nepal's graduation to the next review in 2021. Nepal was on the borderline of the graduation
thresholds in 2014 and updated indicators reflecting the full destructive impact of the
earthquakes may place the country below the thresholds in 2018. Nepal is committed to a
graduation strategy for smooth and sustainable transition out of LDC status.
The review methodology may be derailed from its original assumptions over successive three-
year periods. Meanwhile, the criteria does not fully cover all forms of vulnerability that
landlocked countries like Nepal face. Thus, Nepal is concerned about the fit of the statistical
criteria to the country-specific context. While all LDCs have common characteristics, each is
also unique. Nepal cannot be an exception although it has its unique features. This was well
noted by UNCTAD's Vulnerability Profile, which states that “the intrinsic economic
vulnerability of Nepal is significantly underplayed because of the inadequacy to the case of
Nepal of half of the components of the Economic Vulnerability Index. Nepal is economically
much more vulnerable than it appears to be on the methodological and statistical grounds the
United Nations presently leans on” (UNCTAD, 2017). Thus, the decision on graduation should
not be grounded only in statistical benchmarks. Countries that went through the graduation
process had all met the income criteria. Nepal is the first to attempt graduation from below the
income threshold. This is a special challenge, because per capita income has stagnated due to its
recurring nature of economic vulnerability and external shocks. A significant push is required to
meet the more distant threshold of income level. Nepal has underlined the importance of both
smooth and sustainable graduation. Failure to generate sufficient momentum risks a backward
slide after graduation. Human assets are necessary, but not sufficient, for sustainable
development. There is a need for a growth environment to drive the structural transformation and
economic diversification necessary for successful graduation to a middle-income economy.
Shedding preferential trade and aid mechanisms entail costs that need to be minimized through
dialogue with trading and development partners, industry and civil society. Successful dialogue
may also yield potential benefits of graduation. LDC graduation is not an end in itself, but a

40
milestone towards the SDG agenda as part of Nepal’s long-term development vision. Nepal is an
early advocate, as affirmed in its Voluntary National Review, of implementation of the 2030
Agenda where possible impacts of graduation were also presented.
Eradicating poverty and promoting shared prosperity needs honest and coordinated
implementation by the federal, provincial and local governments. Macroeconomic policy reforms
are necessary to achieve a high level of economic growth and balanced distribution of income
and benefits to poor and marginalized people through policy instruments. However, the
government is fully committed and making efforts to create an enabling environment to
accelerate the pace of inclusive growth and sustainable development to realize the graduation
target in partnership with the private sector, cooperative sector, non-governmental sectors and
development partners.

41
IV. Coherence and linkages with the 2030 Agenda and other
Global Processes
Nepal has been working on maintaining coherence and linkages of the IPoA with the 2030
Agenda to achieve the goals and targets. As we know, the universal and transformative 2030
Agenda for Sustainable Development was adopted by member countries at a high-level UN
Summit in 2015, its implementation encompasses many goals and targets of IPoA, such as
eradicating poverty, fighting hunger, tackling climate change, and accelerating economic growth
and job creation, among others. The Constitution of Nepal guarantees inclusive socio-economic
and political development; building of an egalitarian and pluralistic society; elimination of all
forms discrimination based on class, caste, geography, language, religion and gender; and
ensuring economic equality, prosperity and social justice. This is the guiding document to all
policy, plans, programmes and projects, which reflects well the aspirations of the Agenda 2030
too. Most of the sectoral plans, priorities and targets are aligned with the SDGs while some are in
the process of alignment.
Nepal was among the first countries to produce a preliminary SDGs Report in 2015, even before
the formal adoption of the 2030 Agenda. In collaboration with key development stakeholders,
Nepal set the country-specific SDG-related targets to be achieved before 2030. Accordingly,
Nepal has mainstreamed the 2030 Agenda into its national plans and policies, including the
Fourteenth Plan, the national budget, and sectoral plans. To ensure the systematic tracking of
progress made in IPoA and SDGs, the indicators and targets have been synchronized in the
results framework of periodic plans.
The SDG goals have been mapped into the five strategic areas of development planning process,
such as infrastructure development, economic prosperity, social development, governance and
crosscutting issues. Under these clusters, several programmes are being implemented closely
aligned with the 17 goals and targets. The annual programmes have been fully aligned with the
SDGs since 2016 with the SDGS coding has been assigned to each programme in terms of the
SDG country indicators. Some of them have started yielding promising results (NPC, 2017). The
budget allocation in the annual programmes has also given high priority to the SDGs.
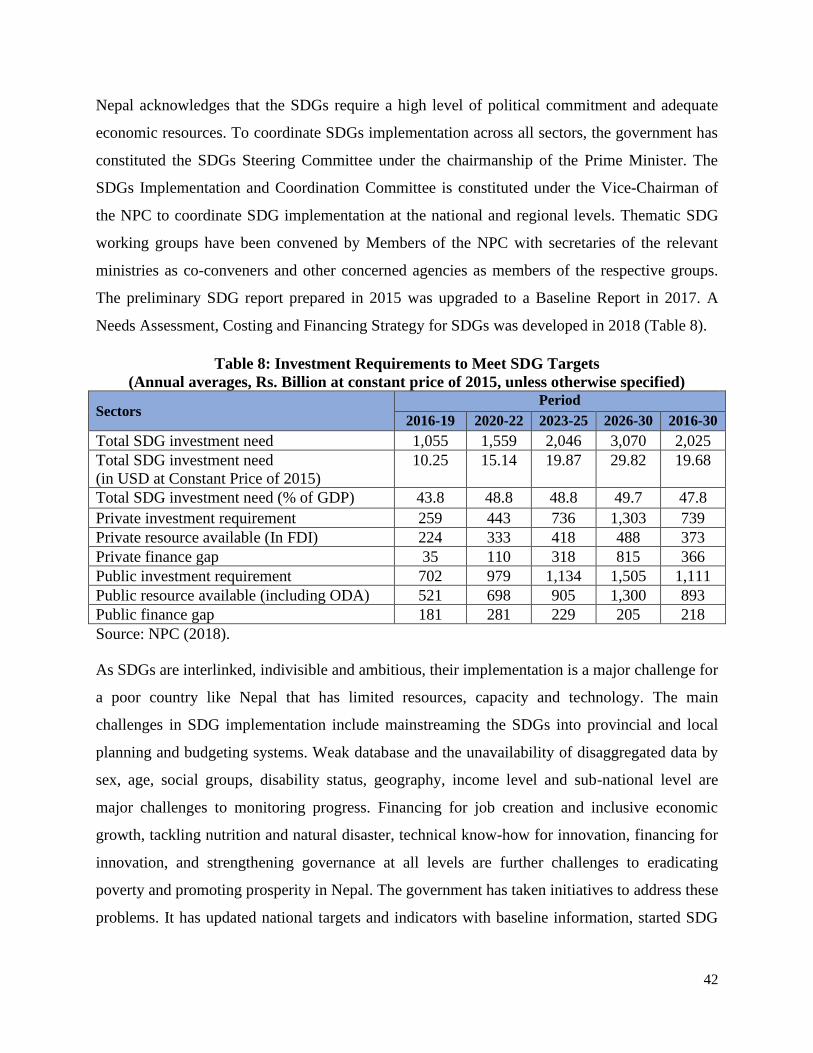
42
Nepal acknowledges that the SDGs require a high level of political commitment and adequate
economic resources. To coordinate SDGs implementation across all sectors, the government has
constituted the SDGs Steering Committee under the chairmanship of the Prime Minister. The
SDGs Implementation and Coordination Committee is constituted under the Vice-Chairman of
the NPC to coordinate SDG implementation at the national and regional levels. Thematic SDG
working groups have been convened by Members of the NPC with secretaries of the relevant
ministries as co-conveners and other concerned agencies as members of the respective groups.
The preliminary SDG report prepared in 2015 was upgraded to a Baseline Report in 2017. A
Needs Assessment, Costing and Financing Strategy for SDGs was developed in 2018 (Table 8).
Table 8: Investment Requirements to Meet SDG Targets
(Annual averages, Rs. Billion at constant price of 2015, unless otherwise specified)
Sectors Period
2016-19 2020-22 2023-25 2026-30 2016-30
Total SDG investment need 1,055 1,559 2,046 3,070 2,025
Total SDG investment need
(in USD at Constant Price of 2015)
10.25 15.14 19.87 29.82 19.68
Total SDG investment need (% of GDP) 43.8 48.8 48.8 49.7 47.8
Private investment requirement 259 443 736 1,303 739
Private resource available (In FDI) 224 333 418 488 373
Private finance gap 35 110 318 815 366
Public investment requirement 702 979 1,134 1,505 1,111
Public resource available (including ODA) 521 698 905 1,300 893
Public finance gap 181 281 229 205 218
Source: NPC (2018).
As SDGs are interlinked, indivisible and ambitious, their implementation is a major challenge for
a poor country like Nepal that has limited resources, capacity and technology. The main
challenges in SDG implementation include mainstreaming the SDGs into provincial and local
planning and budgeting systems. Weak database and the unavailability of disaggregated data by
sex, age, social groups, disability status, geography, income level and sub-national level are
major challenges to monitoring progress. Financing for job creation and inclusive economic
growth, tackling nutrition and natural disaster, technical know-how for innovation, financing for
innovation, and strengthening governance at all levels are further challenges to eradicating
poverty and promoting prosperity in Nepal. The government has taken initiatives to address these
problems. It has updated national targets and indicators with baseline information, started SDG

43
costing, established SDG implementation and process monitoring mechanisms, and has begun to
strengthen database systems.

44
V. Towards the next LDC Agenda
Since the adoption of the IPoA in 2011, many LDCs have made notable progress in economic,
social and human development. In this regard, we welcome the efforts made by the United
Nations and other development partners.
Despite the notable progress made in economic, social and human development, the IPoA is not
going to meet the goal set to enable half the LDCs to be eligible for graduation by 2020. A
majority of LDC populations still live in poverty. It is thus a matter of deep concern to the
international community that only a few countries are going to be graduating from the LDC
category by the end of this decade. From this perspective, Nepal is hopeful that the upcoming
UN Conference on the LDCs will be able to address the following concerns of LDCs related to
trade and development, tackling the inherent challenges of low productive capacity, and
maximizing the ability of LDCs to exploit the opportunities brought about by the process of
globalization.
1. The fifth UN Conference on the LDCs is going to adopt the next agenda for LDCs at a
time when many countries recently graduated from LDC status will be recognizing that
the existing patterns of global political and economic governance make it increasingly
difficult for them to effectively participate in the process of globalization and make their
graduation sustainable. To cope with such a situation, policy cushions may be ensured
particularly for the provision of a need-based extended gestation period for smooth
transition, and a clause for augmented support for countries that have special needs even
after graduation. This will ensure that their voices are heard in the global governance and
help raise confidence that they are not alone in seeking to achieve what they deserve; and,
when necessary they get support from the UN system and development partners.
2. The socio-economic progress achieved by LDCs as a group since the adoption of the
IPOA remains weak. Consequently, LDCs remain vulnerable to shocks, whether
economic, political or environmental. Such vulnerability may reverse the hard-won socio-
economic gains that have been years in the making. Nepal is a prime example of such
adverse effects, particularly from the earthquakes of 2015 followed by border disruption

45
in the southern part of the country. Thus, special support measures for land-locked and
small island developing countries should be strengthened.
3. The major IPoA goals were structural transformation of LDCs, helping them achieve a
minimum target of 7 percent annual growth, and enabling half of all LDCs to be eligible
for graduation from LDC status. This may seem daunting, given weak productive
capacities and a lack of structural transformation in their economies. The next agenda
should focus on channelling development cooperation to areas of structural
transformation and enhancing the productive capacities of LDCs.
4. To be guided by the overarching goal of the CDP, national policies of some LDCs or
recently graduated countries may need reforms to acquire benefits from specialized
international support measures (like GSP-plus and EBA of EU). Therefore, during the
next decade, the LDC agenda should focus on enabling LDCs to synchronize their
national policy and legislation in line with specific objectives set by CDP with the aim of
enabling them to graduate and help achieve a sustainable transition by the end of the next
decade. There might need country specific support measures on trade, investment and
foreign aid mobilization for smooth and sustainable graduation.
5. Guided by the spirit of solidarity among LDCs and consistent with their capabilities, the
UN system, including the Bretton Woods institutions, other multilateral institutions and
regional development banks within their respective mandates, should increase support for
the effective implementation of the Programme of Action in mutually-agreed areas of
cooperation.
6. Changes in the sectoral composition of GDP (structural transformation) have been much
slower in many LDCs than in other developing countries. In particular, the share of
manufacturing, which has been the driving force of economic development in many
middle-income countries, was found to be stagnant. Thus, the private sector, civil society
and foundations will be encouraged to contribute to the implementation of the next
Programme of Action for LDCs in their respective areas of competence in line with
LDC's national priorities.
7. The improved economic performance in some LDCs had a limited impact on
employment creation and poverty reduction. In many LDCs, structural transformation

46
was very limited, and their vulnerability to external shocks has not been reduced
significantly.
8. Many LDCs are still net food importers, which has increased their vulnerability to rapid
declines in export earnings and capital flows. Multiple, interrelated global crises and
challenges, such as increased food insecurity, volatile energy and commodity prices, and
the global financial and economic crisis, partly reversed development gains that LDCs
achieved over time. Thus, special support measures may be devised to build productive
capacity and resilience to shocks.
9. While LDCs have made considerable efforts to mobilize domestic resources for their
development, most still face a huge financing gap, and ODA continued to be the largest
source of external financing for the development of LDCs. Data show that development
partners have not given as much as attention as required to uplift the productive
capacities of LDCs and help them exit the poverty trap. ODA flows have not been
channelled in proportion to the vulnerability and the size of populations in LDC
countries. This should be the prime concern for the next LDC agenda for the decade
2021-30. This is vital to creating sustainable development in LDCs and meeting the
SDGs by 2030.
10. Underdevelopment and poverty in LDCs are not problems of LDCs alone, but also global
threats. Strategic partnerships among developed countries, LDCs and development
partners is required. The next agenda for LDCs should take the opportunity to call upon
all national and international development partners to join hands in a grand coalition of
coordinated efforts to accelerate growth, create productive jobs for all, transfer skills and
technology, help create human capital and achieve the SDGs by 2030.
11. Once they have graduated, LDCs will lose preferential treatment and concessional market
access to the developed and developing countries. This will have a huge impact on
graduating LDCs due to erosion of export competitiveness and will hamper their
sustainable graduation path. This will also hamper the global agenda of shared prosperity.
Thus, certain special concessionary support measures should be devised to compensate
the loss in trade.
47
12. LDCs are already facing financial constraints, including through illicit financial flows
from LDCs to developed countries. In partnership with developed countries and
development partners, a strong mechanism can be established to check the illicit financial
flows from the LDCs to the rest of the world. The next agenda on LDCs should take this
issue into account.
13. Commitments made by developed countries in favour of LDCs are seldom realized. This
issue persists for a long time and is evident since the category was established in 1971.
The next development agenda should address this issue.
14. Disaster risk adds further vulnerability to LDCs. While the Economic Vulnerability Index
gives consideration to the impacts of natural disasters, it doesn't adequately capture the
disaster risk in itself. Therefore, there is a need to consider the impact of disasters and
disaster risk in the process of graduation. The LDCs should also attempt to address this
issue.

48
References
CBS. (2019a). National Accounts. Kathmandu: Central Bureau of Statistics, GoN.
CBS. (2019b). National Economic Census 2018: National Report. Kathmandu: Central Bureau
of Statistics, GoN.
CBS. (2019c). Nepal Labour Force Survey-III (2018): Final Report. Kathmandu: Central Bureau
of Statistics, GoN.
CBS. (2012). Population and Housing Census 2011: Final Report. Kathmandu: Central Bureau
of Statistics, GoN.
CBS and UNICEF. (2015). Nepal Multiple Indicator Cluster Survey 2014: Final Report.
Kathmandu: Central Bureau of Statistics, GoN.
DOH. (2017). Nepal Demographic and Health Survey 2016. Kathmandu: Department of Health,
GoN.
FCGO (2010). Government Statistics of FY 2017/18). Kathmandu: Financial Comptroller
General Office, GoN.
MOF. (2019). Economic Survey 2018-2019. Kathmandu: Ministry of Finance, GoN.
MOF. (2017). Nepal Development Finance Assessment Report. Kathmandu: Ministry of Finance,
GoN.
MOYS. (2016). Youth Vision 2025. Kathmandu: Ministry of Youth and Sports, GoN.
NPC. (2019). Fifteenth Plan Approach Paper (2019-2024). Kathmandu: National Planning
Commission, GoN.
NPC. (2018). Nepal Needs Assessment, Costing and Financing Strategy for SDGs. Kathmandu:
National Planning Commission, GoN.
NPC. (2017a). Sustainable Development Goals Status and Roadmap: 2016-2030. Kathmandu:
National Planning Commission, GoN.
NPC. (2017b). Sustainable Development Goals 2016-2030: Baseline Report. Kathmandu:
National Planning Commission, GoN.
NPC. (2016a). Fourteenth Plan (2016-2019). Kathmandu: National Planning Commission.
NPC. (2016b). Millennium Development Goals Final Status Report. Kathmandu: National
Planning Commission, GoN.
NPC. (2015). Post Disaster Need Assessment Report. Kathmandu: National Planning
Commission, GoN.

49
NPC. (2013). Thirteenth Plan (2010-2013). Kathmandu: National Planning Commission.
NPC. (2010). Twelfth Plan (2010-2013). Kathmandu: National Planning Commission.
NPC. (2007). Eleventh Plan (2007-2010). Kathmandu: National Planning Commission.
NPC. (2002). Tenth Plan (2002-2007). Kathmandu: National Planning Commission.
NPC. (1997). Ninth Plan (1997-2002). Kathmandu: National Planning Commission.
NPC. (1992). Eight Plan (1992-1997). Kathmandu: National Planning Commission.
NPC. (1956). First Plan of Nepal (1956-1960). Kathmandu: National Planning Commission.
NRB (2018). Current Economic and Financial Situation of the Country (Based on Annual Data
FY 2017/18). Kathmandu: Nepal Rastra Bank.
TEPC (2019). TEPC Export Import Databank. Kathmandu: Trade Economic Promotion Centre.
Retrieved on 28 October 2019 from https://www.tepc.gov.np/.
Razzaque, M. A. (2019). Nepal's Graduation from the Least Developed Country Group:
Potential Implications and Issues for Consideration. Bangkok: UN ESCAP.
UN. (2011). Programme of Action for the Least Developed Countries for the Decade 2011-2020.
Fourth United Nations Conference on the Least Developed Countries. Istanbul: United
Nations.
UNCDP. (2018). Committee for Development Policy Report on the twentieth session (12–16
March 2018). New York: United Nations Committee for Development Policy.
UNCTAD. (2017). Vulnerability Profile of Nepal. Geneva: United Nations Conference on Trade
and Development.
UNCTAD. (2016). The Least Developed Countries Report 2016: The path to graduation and
beyond: Making the most of the process. Geneva: United Nations.
UNICEF. (2018). UNICEF Nepal WASH Programme (2018-2022): A conceptual Framework for
Resource Mobilization. Kathmandu: United Nation's Children Fund, Country Office
Nepal.
World Bank (2019a). Nepal Development Updates, Investing in People to Close the Human
Capital Gap. Washington DC: The World Bank.
World Bank (2019b). Doing Business Report 2020. Washington DC: The World Bank.
World Economic Forum (2019). The Global Competitiveness Report 2019. Washington DC: The
World Bank.

50
Statistical Annexes
Annex 1: Progress in the Indicators of Productive Capacities
Indicators 2011 2012 2013 2014 2015 2016 2017 2018
1.1 Infrastructure (Road Network in KM, 000) 1 Total 23.2 24.4 25.3 26.4 27.5 28.3 29.1 30.1
Black-topped 9.9 10.2 10.7 11.2 11.8 12.2 12.8 13.7
Gravelled 5.7 5.8 5.9 6.1 6.3 6.5 6.8 7.2
Muddy 7.6 8.4 8.7 9.2 9.4 9.7 9.5 9.2
Infra. Quality
Index 2.45 2.67 2.90 2.87 2.93 2.74 2.58 2.87
1.2 Science, Technology and Innovation3 Technology
Readiness 2.50 2.65 2.63 2.55 2.61 2.62 2.56 2.77
Availability of
latest
technology
3.94 4.24 4.26 4.04 4.02 3.73 3.54 3.77
Availability of
scientists &
engineers
3.01 3.08 3.23 3.39 3.46 3.48 3.54 3.58
Innovative
Capacity 2.25 2.29 2.42 2.89 3.12 3.27 3.34 3.42
1.3 Energy1 Energy
Consumption
Total (000,
TOE*)
1015
5 8820 10037 11232.9
11727.
6 11767. 7 12866.0 13483.9
% of Clean
Energy 0.7 1.2 1.7 2.6 2.5 2.5 2.3 2.3
Electricity
Production
(MW)
706 746 746 829.2 855.9 972.5 1074.1 1044.6
Peak Demand
(MW) 946 1094 1201 1291 1385 1444 1508 1508
Transmission
Line (KM)
1987 1987 2849 3006 3483 3538
1.4 Tele-Communication1 Telephone
Density (%) 63.8 80.5 92.7 106.1 118.8 135.4 133.8
Internet-
Density (%) 18.9 26.1 33.2 43.7 52.0 61.1 58.1
Broadband
Internet
subscription2
0.3 0.4 0.3 0.4 0.8 0.8 1.1 0.8
1.5 Tourism1 Available
Airline seats
(Million)
8 8 8 8 8
Available 30.8 31.7 34.5 36.2 37.0 38.2 39.8 40.9

51
Indicators 2011 2012 2013 2014 2015 2016 2017 2018
Hotel Beds
(no, 000)
Tourist Arrival
(no, 000) 30.8 31.7 34.5 36.2 37.0 38.2 39.8 40.9
1.6 Agriculture Productivity (MT/Hector) 1 Major Cereal
Crops 2.5 2.7 2.6 2.7 2.7 2.6 2.8 2.9
Major Cash
Crops 11.5 12.0 12.3 12.1 11.6 7.9 8.2 5.5
Vegetables 4.6 4.4 4.7 4.4 4.2 3.1 3.0 1.9
Fruits and
Spices 7.4 8.2 7.8 7.3 7.6 7.4 7.1 7.3
1.7 Industrial Productivity2 Average
Capacity
Utilization (%)
54.0 57.8 57.8 59.7 52.7 48.2 57.3 59.7
Industrial
Credit (Rs.
Billion)
194.7 236.6 315.8 395.1 478.4 529.3 637.2 803.4
1.8 Gross Value Addition of Major Sectors to the GDP1 Agriculture,
Forestry and
Fishing (%)
33.58 33.53 32.55 32.11 31.42 31.30 30.43 29.33
Manufacturing
(%)
6.55 6.48 6.46 6.47 6.29 5.75 5.83 5.97
*Ton of Oil Equivalent, Source: 1MOF (2019); 2NRB (2018); 3World Economic Forum (2019).

52
Annex 2: Agriculture, Food Security and Rural Development Indicators
Indicators 2011 2012 2013 2014 2015 2016 2017 2018
2.1 Availability of agriculture Inputs
Fertilizer
(000, MT) 123.6 145.7 177.0 233.0 298.7 258.9 324.0 340.0
Irrigation
(000, ha) 1273 1300 1333 1353 1371 1390 1394 1470
Agriculture
Credit (Rs.
billion)
31.5 50.9 65.8 78.8 90.0 132.8 128.3
2.2 Production of Major Agriculture Products (000, MT)
Cereal
Crops 8614.8 9457.0 8737.1 9562.4 9266.2 8614.3 9741.7 10009.4
Cash Crops 5416.4 5746.4 5877.5 6037.3 5875.4 5765.9 6137.8 4127.9
Vegetables 3203.0 3401.0 3409.7 3472.1 3580.1 3819.8 4163.6 4099.3
Fruits and
Spices
831.6 885.5 1086.8 965.0 992.0 992.5 1025.3 1010.2
Improved
Seeds (MT)
3669 7290 9151 12480 8785.3 4366.4 2856.4
2.3 Livestock Related Products (000, MT)
Meat and
Fish 329.7 342.9 349.5 364.0 370.3 369.2 286.9 424.0
Milk and
Related
items
1556.5 1622.8 1681.1 1700.0 1724.8 1853.9 1911.2 2085.0
Eggs
(Million) 704.1 787.0 838.9 872.9 899.5 1208.7 1352.3 1512.3
2.4 Local/Rural Road Networks (KM, 000)
Total 51.4 53.0 53.3 57.9 58.4
Gravelled 12.3 12.4 12.5 12.8 12.8
Blacktoppe
d
1.7 1.8 1.9 2.3 2.7
Muddy 37.4 38.8 38.9 42.8 42.9
Bridges 63 73 63 72 82
Source: MOF (2019); MOF (2018).

53
Annex 3: International Trade Performance of Nepal
Indicators 2011 2012 2013 2014 2015 2016 2017 2018
Goods and Services Trade (Ratio to GDP)
Net Exports -24.0 -23.5 -26.8 -29.2 -29.9 -29.8 -33.4 -37.4
Imports 32.9 33.6 37.5 40.8 41.5 39.3 42.4 46.3
Goods (G) 28.4 29.8 32.3 35.4 35.8 33.6 36.6 40.5
Services (S) 4.5 3.8 5.2 5.3 5.7 5.7 5.8 5.8
Exports 8.9 10.1 10.7 11.5 11.6 9.5 9.0 8.9
Goods (G) 5.0 5.3 5.1 5.1 4.6 3.3 3.1 3.1
Services (S) 3.9 4.7 5.6 6.4 7.0 6.1 5.9 5.9
External Sector Account (Ratio to GDP) Current A/C -0.90 5.00 3.40 4.60 5.10 6.20 -0.40 -8.20
BOP 0.30 8.60 4.10 6.50 6.80 8.40 3.10 0.00
Forex Reserves 19.90 28.80 31.50 33.90 38.70 46.10 40.40 36.40
Import Capacity of Foreign Exchange Reserves (Month) Goods 8.4 11.6 11.7 11.5 13 16.5 13.2 10.8
Goods & Services 7.3 10.3 10.1 10 11.2 14.1 11.4 9.4
Export-Import
Ratio 16.20 16.10 13.80 12.90 11.00 9.10 7.40 6.60
Terms of Trade 71.91 72.10 73.95 76.45 85.09 84.92 80.47 78.62
Source: CBS (2019a); MOF (2019).

54
Annex 4: Concentration of Exports and Imports Commodities
2011 2015 2018
Top Ten Exports Commodities
Products HS
Code
Weight
(%)
Products HS
Code
Weight
(%)
Products HS
Code
Weight
(%)
Iron and steel 72 12.89 Coffee, tea,
and spices
09 10.35 Man-made
staple fibres
55 11.90
Carpets and
other floor
coverings
57 8.50 Carpets and
other floor
coverings
57 9.73 Carpets and
other floor
coverings
57 11.75
Not knitted
articles of
clothing
62 7.69 Man-made
staple fibres
55 7.98 Coffee, tea,
and spices
09 6.44
Filaments;
strip and like
man-made
textile items
54 7.39 Not knitted
articles of
apparel and
clothing
62 7.97 Beverages,
spirits and
vinegar
22 6.06
Man-made
staple fibres
55 7.33 Iron and steel 72 6.32 Not knitted
articles of
clothing
62 6.06
Coffee, tea,
and spices
09 6.31 Vegetables,
fruit, nuts or
parts of plants
20 5.53 Plastics and
articles
thereof
39 5.67
Other made-
up textile
articles and
worn articles
63 4.72 Filaments;
strip and like
man-made
textile items
54 5.35 Other made-
up textile
articles and
worn articles
63 5.12
Vegetables,
fruit, nuts or
other parts of
plants
20 3.74 Other made-
up textile
articles and
worn articles
63 5.15 Iron and steel 72 4.93
Articles of
iron or steel
73 2.85 Articles of
iron or steel
73 3.16 Knitted
articles of
apparel and
clothing
61 4.82
Edible
vegetables,
roots and
tubers
07 2.82 Footwear,
gaiters and the
like; parts of
such articles
64 2.62 Residues from
food
industries;
animal fodder
23 4.42
Total 64.25 Total 64.18 Total 67.17
Top Ten Import Commodities
Products HS
Code
Weight
(%)
Products HS
Code
Weight
(%)
Products HS
Code
Weight
(%)
Mineral fuels,
mineral oils
and products
27 20.72 Mineral fuels,
mineral oils
and products
27 13.33 Mineral fuels,
mineral oils
and products
27 17.06
Iron and steel 72 8.35 Iron and steel 72 8.79 Iron and steel 72 11.96
Electrical 85 7.10 Electrical 85 7.39 Machinery, 84 9.09

55
machinery
equipment and
parts thereof
machinery
equipment and
parts thereof
mechanical
appliances,
nuclear
reactors and
parts thereof
Machinery,
mechanical
appliances,
nuclear
reactors and
parts thereof
84 6.02 Vehicles other
than railway,
and parts and
accessories
thereof
87 6.20 Vehicles other
than railway
and parts and
accessories
thereof
87 7.61
Precious or
semi-precious
stones,
precious
metals
71 5.77 Machinery,
mechanical
appliances,
nuclear
reactors and
parts thereof
84 6.20 Electrical
machinery
equipment and
parts thereof
85 5.94
Vehicles other
than railway,
and parts and
accessories
thereof
87 5.16 Precious or
semi-precious
stones,
precious
metals,
71 5.15 Precious or
semi-precious
stones,
precious
metals,
71 4.84
Plastics and
articles
thereof
39 3.92 Cereals 10 4.80 Cereals 10 3.83
Prepared
edible fats
15 3.58 Pharmaceutica
l products
30 3.99 Aircraft, and
parts thereof
88 3.17
Plastering
materials,
lime and
cement
25 3.01 Plastics and
articles
thereof
39 3.82 Pharmaceutica
l products
30 2.66
Pharmaceutica
l products
30 2.83 Aircraft, and
parts thereof
88 2.82 Plastics and
articles
thereof
39 2.61
Total 66.47 Total 62.49 Total 68.76
Source: TEPC (2019).

56
Annex 5: Private Sector Development Indicators
Indicators 2011 2012 2013 2014 2015 2016 2017 2018
Doing Business Index4 57.84 59.27 59.8 60.6 59.85 57.6 59.95 59.63
Logistic Performance Index3 2.04 2.59 2.38 2.51
Capacity to Retain Talent3 2.4750 2.6981 2.8809 2.7229 2.6745
Capacity to Attract Talent3 1.9855 2.2785 2.5045 2.4902 2.4437
Ethical behaviour of firms3 2.8745 3.1074 3.2128 3.2221 3.3268 3.3455 3.2499 3.4231
Domestic market 3 2.9611 3.0095 3.0451 3.0456 3.0922 3.3370 3.2151 3.3954
Ease of access to loans3 2.4766 2.4977 2.5118 2.3679 2.2636 2.2636 4.0000 3.8577
Customer Orientation3 4.2950 4.1780 4.1265 3.9553 3.7628 4.0073 4.0301 4.1347
Business Sophistication3 3.0442 3.1453 3.2096 3.2545 3.3389 3.3087 3.2550 3.3916
Financial Market
Development3 3.6398 3.6656 3.8094 3.7528 3.9039 3.8275 3.9116 3.9122
Control of International
Distribution3 3.5060 3.6566 3.3838 3.2232 3.2658 3.1547 3.0246 3.0099
Spending on Research &
Development 3 2.36 2.43 2.57 2.69 2.61 2.63 2.49 2.61
Industrial Relations3 3.0902 3.2512 3.1744 3.0365 3.2338 3.4621 3.5184 3.4712
FDI and technology transfer3 3.6624 3.7115 3.7682 3.7318 3.7299 3.5963 3.2308 3.2663
Domestic Credit to Private
sector (% of GDP)1 53.2 53.0 57.4 58.6 64.5 75.1 74.7 80.6
Private GFCF to GDP Ratio1 15.5 13.8 16.0 16.7 19.7 16.2 23.4 25.4
Share of Private Sector on
GFCF (%)1 78.2 77.4 80.3 79.4 81.3 76.4 83.0 81.3
Source: 1MOF (2019); 3 World Bank (2018); 4WEF (2019).

57
Annex 6: Education Attainment Indicators
Indicators 2011 2012 2013 2014 2015 2016 2017 2018
Net Enrolment Rate (Grade 1-5) 94.5 95.1 95.6 96.2 96.6 96.9 97.2 96.5
Net Enrolment Rate (Grade 1-8) 86 86.6 86.3 87.6 89.4 91 92.3 92.7
Net Enrolment Rate (Grade 9-
12) 33.2 34.7 37.7 38.9 43.9 46.4
Retention Rate (Till 10) 37.9 45.2 57.1 58.5
Out of School Children Rate
(Age 5-12) 10.6 9 8.7 7.3
Literacy Rate (Above age 6) 60.9 63.2 65.9 65.9 78 78 78 78
Literacy Rate (15-24 age) 80 80 84.7 84.7 84.7 88.6 88.6 88.6
Literacy Rate (Above 15) 56.5 56.5 56.5 56.5 57 57 57 57
Vocational Training (Person) 22130 16552 15107 17328 15879 17493 20066 19689
Source:MOF(2019).

Government of Nepal
National Planning Commission Singhadurbar, Kathmandu