"Introduction" And The World Changed: Contemporary Stories by Pakistani Women
Upload
khangminh22Category
view
0download
0
(1)
CHAPTER - I
INTRODUCTION
�There is a region called Haryana, which is like a heaven on earth�- Vikrami Samvat (1385).
Haryana � the land where 3000 years ago, Lord Krishna preached the Bhagvad-Gita and admonished
Arjuna, �your right is to do your duty and not bother about the fruits�; the land which formed the
battleground in the famous epic Mahabharata. It was here that Ved Vyas wrote Mahabharata. In this
epic, this land was referred to a Bahudhhanyaka, �land of plentiful grains� and Bahudhana, �land of
immense riches. One myth propagates that Prajapati created the world and the four castes at Prithudaka,
the contemporary Pehowa. Another legend traces the birth of Brahma to Brahmayoni in the same
place.
Archaelogical excavations reveal Haryana to have been one of the cradles of Indian culture and
civilization. It was the home of the legendary Bharata dynasty, which has given the name Bharat to
India. The region has been the scene of many a war as the Gateway to north India. It has witnessed
decisive battles with successive streams of Huns, Turks and Afghans. It became the seat of early Indian
empires.
In the middle ages, Panipat became the ground for two major battles with the Mughals1 and by
1556 Mughals had established their rule over this land. Towards the middle of the 18th Century,
Marathas had established their sway, but after their defeat in the 3rd battle of Panipat, the Britishers
assumed power in this region. Haryana and Haryanvis equally held fort during the struggle for independence
and Haryana remained one of the major sites for the independence struggle.
Post independence, Haryana became a part of Punjab province, which had been divided during
the Partition into East and West Punjab. It was only in 1966 following the Punjab Reorganisation Act,
that Haryana emerged as a separate entity in the Indian Political landscape
Located on the doorstep of the national capital, Delhi, Haryana is bounded on the north by the
Shivalik Hill range, in the east by the River Yamuna, in the south by the Aravalli Hills and the Thar
Desert and in the west by River Sutlej. A number of streams flow down the Shivalik Hills, the most
significant ones are the Ghaggar, Markanda, Chautang and the Saraswati. However, there is no
perennial river, except for the Yamuna, which flows in the eastern side and irrigates the land. The
Haryana plain is part of the Indo-Gangetic plain, formed by alluvial deposits of the Himalayan rivers.
1 The First Battle of Panipat took place in 1526 A.D. between Babur and the Lodis. The Second Battle of Panipat was betweenAkbar and Hemu in 1556 A.D.

(2)
It is bordered by Himachal Pradesh in the north, Punjab in the west, Rajasthan in the south and
Uttar Pradesh and Delhi in the east. It shares its capital city, viz. Chandigarh with Punjab.
One of the most developed States of India, Haryana has a basically agrarian economy, with
about 80 per cent of the population dependent upon agriculture. Haryana, as much as neighbouring
Punjab, witnessed the successful Green Revolution, which led to a great deal of prosperity in its rural
economy. Along with Punjab, it is a major contributor to the central pool of foodgrains. In per capita
production and availability of cereals and milk, Haryana ranks second only to Punjab amongst the
Indian States and in pulses to Madhya Pradesh.
It also has a sound industrial base and manufactures the largest number of tractors amongst
the States in India, along with a third of the sanitary wares and a fourth of the bicycles produced in
India. The city of Panipat is known as the �weavers city� of India, for its� exquisite handmade woollen
carpets and handloom products.
It has one of the highest per capita incomes of the country and the incidence of poverty is
relatively low, with only 8.74 per cent of the population below the poverty line in 1999-2000. It ranks
4th in this respect after Punjab, Chandigarh and Himachal Pradesh. Significantly, it is the first State
in the country to have provided piped drinking water and electricity to all its villages.
It has also made significant strides in the fields of health and education, resulting in a decline
in overall mortality and increased life expectancy as well an increase in literacy rates.
A look at Table 1.1 below reveals that Haryana has also progressed in providing basic facilities
to its citizens. According to the NFHS-II Survey Report of Haryana, 89.1 percent of its households are
electrified; 47.1 per cent are getting piped water, another 40.8 per cent get water from handpumps,
11.8 per cent draw water from wells. One of the most cumbersome and time-consuming tasks of
women is getting water for the household. In Haryana 68 per cent are able to get water in less than
15 minutes. However, from women�s point of view sanitation and fuel are equally significant and it is
in these that Haryana falls below the expectations. At least 60.9 per cent of the households have no
sanitation facility. The problem is worse in rural areas where as many as 80.7 per cent report no
sanitation facility. The type of fuel used for cooking equally impacts women�s health. A major proportion
of women�s work consists in preparing food for the family. Studies have revealed that use of wood and
cowdung as fuel has resulted in lots of respiratory problems for women due to the smoke emanating
from these. It may be seen from the table below that 56.9 per cent of the households are using wood
as fuel and only 27.2 per cent use liquefied petroleum gas.

(3)
Table 1.1
Housing characteristics
Percent distribution of households by housing characteristic, according to residence, Haryana, 1998-99
Housing Characteristic Urban Rural Total
Electricity
Yes 98.1 85.0 89.1
No 1.9 15.0 10.9
Total Payment 100.0 100.0 100.0
Source of Drinking water
Piped 71.8 35.7 47.1
Hand Pump 27.7 46.9 40.8
Well Water 0.5 17.0 11.8
Surface Water 0.0 0.1 0.1
Other 0.0 0.3 0.2
Total Percent 100.0 100.0 100.0
Time to get Drinking water
Percentage < 15 minutes 92.9 56.5 68.0
Median time (minutes) 0.0 9.4 0.0
Method of drinking water purification
Strains water by cloth 0.9 2.2 1.8
Uses alum 0.2 2.1 1.5
Uses water filter 11.6 0.0 3.7
Boils water 6.2 1.7 3.2
Uses electronic purifier 1.8 0.1 0.6
Uses other method 0.2 0.1 0.1
Does not purify water 80.9 94.3 90.1
Sanitation facility
Flush toilets 72.1 11.1 30.4
Pit toilet/latrine 9.9 8.0 8.6
Other 0.0 0.2 0.1
No facility 17.9 80.7 60.9
Total percent 100.0 100.0 100.0

(4)
Housing Characteristic Urban Rural Total
Main type of fuel used for cooking
Wood 19.5 74.1 56.9
Crop residues 0.4 1.0 0.8
Dung cakes 4.4 11.3 9.2
Coal/coke/lignite/Charcoal 0.5 0.1 0.2
Kerosene 9.3 3.7 5.5
Electricity 0.2 0.0 0.1
Liquid petroleum gas 65.5 9.5 27.2
Biogas 0.1 0.1 0.1
Other 0.0 0.3 0.2
Total Percent 100.0 100.0 100.0
Type of house
Kachha 0.3 8.1 5.6
Semi-pucca 15.6 62.2 47.5
Pucca 83.9 29.5 46.7
Missing 0.1 0.2 0.2
Total percent 100.0 100.0 10.0
Persons per room
<3 77.8 65.6 69.4
3-4 13.8 22.6 19.8
5-6 6.5 9.0 8.2
7+ 1.9 2.8 2.5
Total percent 100.0 100.0 100.0
Mean number of persons per room 2.1 2.6 2.4
Number of house holds 897 1,944 2,841
Totals may add to more than 100.0 because households may use more than one method of purification.
Source: NFHS-II, 1998-99, Haryana
Minor hiccups apart, Haryana has progressed rapidly on the socio-economic front. These rapid
development advances are obvious from a look at the Human Development Index for major States of
India.2 Table 1.2 below reveals that the Human Development Index for India as a whole has increased
2 Human Development Index measures the human development of a State through the indices of per capita income, lifeexpectancy and adult literacy.

(5)
from 0.302 in 1981 to 0.472 in 2001. The corresponding values for Haryana have been 0.360 in 1981
and 0.509 in 2001. Kerala ranks at the top for all three years, followed by Punjab. Haryana has been
consecutively ranking 5th in all three years.
Table 1.2
Human Development Index for India
States/UTs 1981 Value 1981 Rank 1991 Value 1991 Rank 2001 Value 2001 Rank
Andhra Pradesh 0.298 9 0.377 9 0.416 10
Assam 0.272 10 0.348 10 0.386 14
Bihar 0.237 15 0.308 15 0.367 15
Gujarat 0.360 4 0.431 6 0.479 6
Haryana 0.360 5 0.443 5 0.509 5
Karnataka 0.346 6 0.412 7 0.478 7
Kerala 0.500 1 0.591 1 0.638 1
Madhya Pradesh 0.245 14 0.328 13 0.394 12
Maharashtra 0.363 3 0.452 4 0.523 4
Orissa 0.267 11 0.345 12 0.404 11
Punjab 0.411 2 0.475 2 0.537 2
Rajasthan 0.256 12 0.347 11 0.424 9
Tamil Nadu 0.343 7 0.466 3 0.531 3
Uttar Pradesh 0.255 13 0.314 14 0.388 13
West Bengal 0.305 8 0.404 8 0.472 8
All India 0.302 0.381 0.472
Source: National Human Development Report 2001, Planning Commission, Government of India, March
2002
(6)
This historically progressive social scenario has another side, a carefully fortressed patriarchal
and feudal society where gender discrimination and inequality are the norms. In the words of Jean
Dreze and Amartya Sen, �The north-western States, for instance, are notorious for highly unequal
gender relations, some symptoms of which include the continued practice of female seclusion, very low
female labour participation rates, a large gap in literacy rates, extremely restricted property rights,
strong boy preference in fertility decisions, widespread neglect of female children and drastic separation
of a married woman from her natal family.�3 Women in Haryana, continue to be subordinated, subjugated
and deprived, as evidenced in the extremely low sex ratio, high level of anaemia among women and
children and prevalent violence against women.
Table 1.3
Gender-Related Development Index for Indian States, 1991-2
GDI State GDI Share of Earned Life Expectancy at Adult Literacy Rate
Rank Income (Per cent) Birth (Years) 1990-92 (Per Cent)
Females Males Females Males Females Males
1 Kerala 0.565 12.4 87.6 74.4 68.8 80.6 91.7
2 Maharashtra 0.492 29.4 70.6 64.7 63.1 44.2 74.4
3. Gujarat 0.437 26.8 73.2 61.3 59.1 41.8 70.4
4. Himachal Pradesh 0.432 37.5 62.5 64.2 63.8 35.5 64.4
5. Punjab 0.424 5.9 94.1 67.5 65.4 41.8 60.5
6. Karnataka 0.417 25.4 74.6 63.6 60.0 37.7 65.3
3 Jean Dreze and Amartya Sen, India: Economic Development and Social Opportunity, OUP, Delhi, 1995, p.47.
Human Development in India
0
0.1
0.2
0.3
0.4
0.5
0.6
0.7
Andhra
Pra
des
h
Ass
am
Bih
ar
Guja
rat
Hary
ana
Karn
ata
ka
Ker
ala
Madhya
Pra
des
h
Mahara
shtr
a
Ori
ssa
Punja
b
Raja
sthan
Tam
il N
adu
Utt
ar
Pra
des
h
Wes
t B
engal
All
India
State
HD
I valu
e 1981 value
1991 Value
2001 Value

(7)
GDI State GDI Share of Earned Life Expectancy at Adult Literacy Rate
Rank Income (Per cent) Birth (Years) 1990-92 (Per Cent)
Females Males Females Males Females Males
7. Tamil Nadu 0.402 21.4 78.6 63.2 61.0 35.8 65.0
8. West Bengal 0.399 8.0 92.0 62.0 60.5 42.8 69.3
9. Andhra Pradesh 0.371 27.2 72.8 61.5 59.0 27.3 52.4
10. Haryana 0.370 7.0 93.0 63.6 62.2 27.0 64.3
11. Assam 0.347 23.7 76.3 53.8 54.8 33.9 62.4
12. Orissa 0.329 19.1 80.9 54.8 55.9 29.0 62.5
13. Madhya Pradesh 0.312 25.4 74.6 53.5 54.1 24.3 56.6
14. Rajasthan 0.309 23.0 77.0 57.8 57.6 17.5 52.7
15. Bihar 0.306 21.8 78.2 58.3 60.4 18.2 55.3
16. Uttar Pradesh 0.293 12.9 87.1 54.6 56.8 20.6 53.6
India 0.388 23.2 76.8 59.4 59.0 33.9 62.4
Source: A K Shiva Kumar, �UNDP�s Gender-Related Development Index: A Computation for Indian
States, Economic and Political Weekly, April 6, 1996.
This is reflected through the Gender Development Index (GDI), which measures the unequal
achievements of men and women using the same indicators as HDI. The greater the gender disparity
in basic capabilities, the lower a country�s GDI as compared to its HDI. Haryana�s GDI is 1991-2 was
only 0.370 as compared to its relatively high HDI in 1991 at 0.443.
Table 1.3 reveals the Gender Development Index (GDI) values of sixteen States vis-à-vis Haryana
in 1991-2. Of the 16 States, Haryana ranks a lowly 10th with only Assam, Orissa, Rajasthan, Madhya
Pradesh, Bihar and Uttar Pradesh ranking below it. Haryana�s affluence, then, is not reflected in the
gender relations scenario. This, on the one hand, highlights the pronounced gender inequalities in
these States4 , and on the other, reinforces the fact that gender inequalities may not be correlated to
income levels in any predictable manner, as also alludes to the anti-female bias and systematic
deprivation of women.
4 See A K Shiva Kumar, �UNDP�s Gender-Related Development Index: A Computation for Indian States, Economic and PoliticalWeekly, April 6, 1996.

(8)
However, while HDI and GDI provide some indication towards the status of women in any
society, in recent years, it is argued, that these indicators are not reliable indices for measuring the
status of women as some of the key indicators are non-quantifiable. The real successes and failures
in the State in relation to women�s development have to be assessed within the complex socio-cultural
situation of the State. The status of women in any society must be assessed in the context not only
of the indicators taken for calculating the GDI, but in terms of various demographic criteria, health,
education, work, political participation as well as crimes against women, which is the aim and object
of the present situational analysis of women in Haryana.

(9)
CHAPTER � II
DEMOGRAPHIC PROFILE
Demographic indicators are significant indices of the status of women in any given society.
Haryana, with a territory of 44,212 sq.km, which is merely 1.44 per cent of the territory of India has
a total population of 210.83 lakhs, which is 2.05 per cent of the total population of India.
Density of Population
Density of population, i.e. the number of persons per square kilometer, reveals the population
concentration in an area. As against an all-India density of population of 324, Haryana has a high
density of 477 and ranks 12th in terms of density amongst the Indian States and Union Territories.
Furthermore, as against an all India increase of 57 points in density over the last Census, the corresponding
increase in Haryana, to the tune of 105 points, is almost double the national increase.
Growth Rate of Population
Apart from a higher density of population, as compared to the national average, Haryana also
reveals a higher growth rate of population. It is equally significant that while the national growth rate
is declining, Haryana is one of the few States which reveal an increase in this rate, bringing it more
in the category of the less developed States such as Bihar, Uttar Pradesh, Sikkim, Nagaland which
show an increase in growth rates for the population. A majority of the States in India reveal a decline
in this ratio.
The average annual exponential growth rate of population in India is 1.94 percent, which has
declined from 2.14 percent in the last census. The decadal growth rate of population for all of India
is 21.34 per cent over the last decade. This too has declined from 23.86 percent in the decade 1981-
1991.
In contrast, Haryana shows a decadal as well as annual exponential growth rate of population
considerably higher than the national average. At 28.06 percent, the Haryana Decadal growth rate of
population is almost 7 per cent higher than the national average. Significantly, while the nation as a
whole reveals a decline in the decadal growth rate, Haryana shows an increase from 27.41 percent
in the last decade (1981-1991) to 28.06 per cent in 1991-2001. Likewise, the average annual exponential
growth rate is 2.47, which is at least 0.54 per cent higher than the national average. In this context
too, Haryana reveals an increase over the last census.

(10)
Rural Urban Distribution of Population
Haryana is basically an agricultural State and this is reflected in its population distribution,
wherein 71 per cent of the population resides in rural areas and a mere 29 per cent of its population
is urban based.
Sex Ratio
A highly masculine sex ratio has been one of the most significant characteristics of India
throughout the 20th century. Even more noteworthy is the fact that this sex ratio has shown an almost
continuous decline from 972 in 1901 to 933 in 2001. It would not be out of context to mention that
the sex ratio at birth should be somewhere between 943-9521 . The better physiological strength of girl
children, which ensures better survival chances should bring the sex ratio closer to unity. Yet this is
not the case in India and the sex ratio in most of the Indian States is adverse to females. A look at
Table 2.1 below reveals that Kerala is the only State in India, which has a sex ratio favouring females
and Pondicherry is the only Union Territory which has a sex ratio above unity.
Table 2.1
States and Union Territories Ranked by Sex Ratio, India-2001
Rank States/Union Territories Sex- Rank States/Union Territories Sex-
by Ratio by Ratio
Sex- Sex
Ratio Ratio
India 933 6 Andhra Pardesh 978
1 Kerala 1058 7 Meghalaya 975
2 Pondicherry 1001 8 Orissa 972
3 Chhatisgarh 990 9 Himachal Pardesh 970
4 Tamil Nadu 986 10 Uttranchal 964
5 Manipur 978 11 Karnataka 964
Rural Urban Distribution of Population
Rural
Urban
1 See Census of India, Series 1, 2001.

(11)
Rank States/Union Territories Sex- Rank States/Union Territories Sex-
by Ratio by Ratio
Sex- Sex
Ratio Ratio
12 Goa 960 24 Nagaland 909
13 Tripura 950 25 Arunachal Pardesh 901
14 Lakshadweep 947 26 Jammu & Kashmir 900
15 Jharkhand 941 27 Uttar Pardesh 898
16 Mizoram 938 28 Sikkim 875
17 West Bengal 934 29 Punjab 874
18 Assam 932 30 Haryana 861
19 Rajasthan 922 31 Andaman & Nicobar 847
20 Maharashtra 922 32 Delhi 821
21 Bihar 921 33 Dadra & Nagar Haveli 811
22 Gujrat 921 34 Chandigarh 773
23 Madhya Pradesh 920 35 Daman & Diu 709
Source: Census of India, 2001, Series-4, Punjab (Provisional Population Totals, Paper 1 of 2001)
While this is the general scenario all over India, Haryana has the dubious distinction of ranking
at the bottom of the scale amongst the Indian States in respect of sex ratio. Having a sex ratio of
861 in 2001, Haryana ranks 30th and is better positioned only in respect to the Union Territories of
Andaman and Nicobar (847), National Capital Territory of Delhi (821), the Union Territories of Dadra
and Nagar Haveli (811), Chandigarh (773) and Daman & Diu(709). The demographic scenario is
heavily loaded in favour of males, with males constituting 53.73 per cent of the total population and
females constituting merely 46.27 per cent of the total population.
Sex-wise population of Haryana
46%
54%
Males
Females

(12)
Table 2.2
Sex Ratio Since 1901 For Haryana and Its Districts
State/District 1901 1911 1921 1931 1941 1951 1961 1971 1981 1991 2001
Haryana 867 835 844 844 869 871 868 867 870 865 861
Panchkula 765 747 749 765 805 799 805 819 833 839 823
Ambala 817 755 783 789 795 807 828 882 902 903 869
Yamunanagar 811 763 783 789 580 841 836 848 855 883 863
Kurukshetra NA NA NA NA NA 858 853 859 872 879 866
Kaithal NA NA NA NA NA 849 837 843 848 853 854
Karnal NA NA NA NA NA 860 853 856 856 864 864
Panipat NA NA NA NA NA 866 857 852 849 852 830
Sonepat 872 850 856 860 908 886 886 866 866 840 839
Jind NA NA NA NA NA 849 857 860 856 838 853
Fatehabad NA NA NA NA NA 853 852 870 881 877 886
Sirsa 871 837 877 855 878 843 845 865 877 885 882
Hissar NA NA NA NA NA 871 866 859 859 853 852
Bhiwani NA NA NA NA NA 880 880 878 897 878 880
Rohtak 883 848 840 845 904 881 885 878 869 849 847
Jhajjar NA NA NA NA NA 911 902 903 891 861 848
Mahendragarh NA NA NA NA NA 972 961 910 939 910 919
Rewari NA NA NA NA NA 930 926 927 926 927 901
Gurgaon 905 878 858 859 880 895 891 886 880 871 874
Faridabad 905 878 858 859 880 854 848 810 811 828 839
Source: Census of India, Series 7, Haryana, 2001
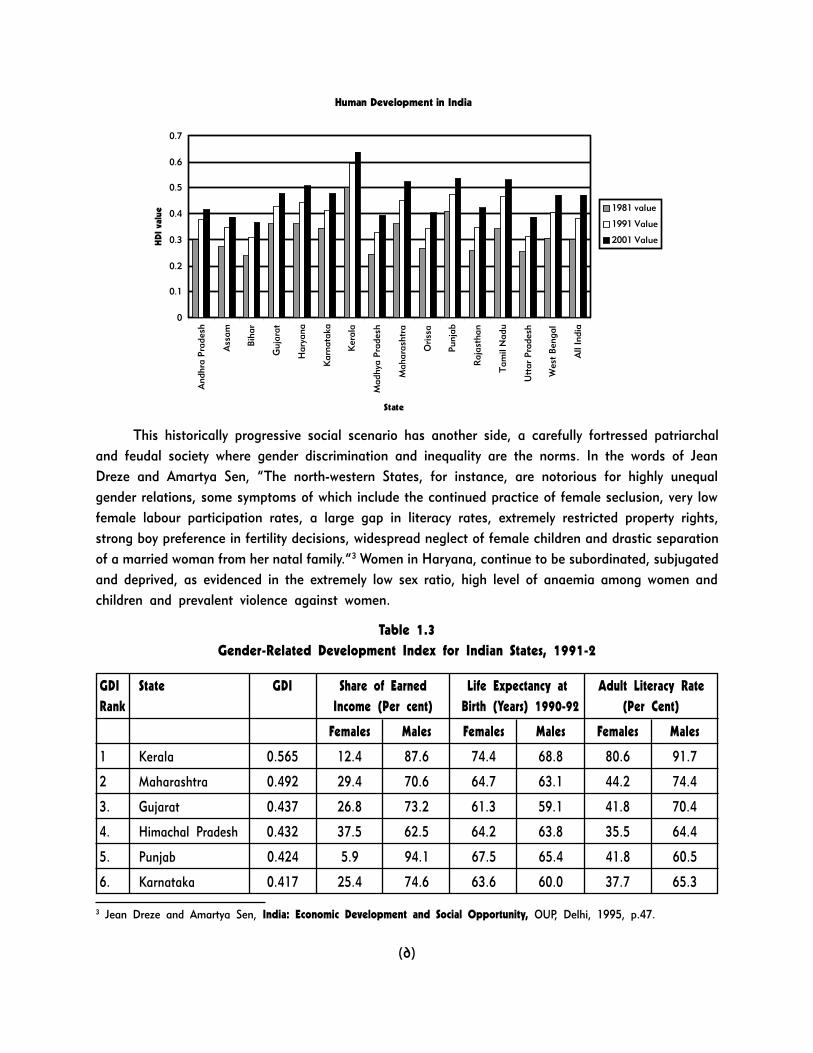
Significantly, Haryana had started off the 20th century with a sex ratio of 867 and it ended it with a sex
ratio of 865. It entered the 21st century with an even lower sex ratio of 861. What is worse is that while the
sex ratio in Haryana had witnessed a sharp drop between the years 1901 and 1911, it had been inching
upwards till 1951. The two census years of 1961 and 1971 saw a reversal of this trend with the sex ratio
falling. 1981 again witnessed an increase of 3 points over the last census, but the 1991 census again
revealed a decline of 5 points followed by another decline of 4 points in the current census, taking the sex
ratio to a point below the 1901 ratio.
(13)
The same grim picture of unfavourable sex ratio prevails at the district level. Table 2.3 below reveals
that none of the districts in the State have a sex ratio higher than the national average. As a matter of fact
the district with the highest sex ratio, Mahendragarh has a sex ratio which is 14 points lower than the
national average. Only two districts, viz. Rewari and Mahendragarh have crossed the 900 mark in respect of
sex ratio. All the other 17 districts of this State have a sex ratio falling between 823 and 886. Another
noteworthy factor in this respect is the fact that it is Panchkula, a district bordering Chandigarh (which ranks
almost at the bottom of the scale in sex ratio) which has the lowest sex ratio in the State. This would seem to
give rise to a poser: Does location have an impact on sex ratio?
A considerable variation is noticeable in the districtwise rankings, in this census and the last.
Mahendragarh and Rewari have exchanged places at the top. Rewari ranked at the top in 1991 and is now
second and vice versa. Panchkula, which ranked 17th in 1991 has moved to the bottom while, Faridabad,
which was at the bottom has moved to 17th place. The most significant change is noticeable in the ranking for
Fatehabad, which has moved from 8th place in the last census to 3rd in the current one.
While the overall sex ratio for Haryana has declined by 4 points, eight districts reveal a positive
improvement in the sex ratio. The highest improvement is visible in the district of Jind, where the sex ratio has
improved by a marked 15 points from 838 in 1991 to 853 in 2001. This is followed by Faridabad, which
shows an improvement of 11 points over the last census. Mahendragarh and Fatehabad, both reveal and
increase of 9 points, while Gurgaon, Bhiwani and Kaithal show marginal improvement by 3,2 and 1 points
respectively. Six of these districts, viz. Jind, Mahendragarh, Fatehabad, Gurgaon, Bhiwani and Kaithal have
reversed the declining trend of the previous census.
Sex Ratio in Haryana
810
820
830
840
850
860
870
880
1901y 1911y 1921y 1931y 1941y 1951y 1961y 1971y 1981y 1991y 2001y
Year
Sex R
ati
o

(14)
Table 2.3
Ranking of Districts by Sex Ratio
Rank in District Sex Ratio (Number of Females Rank in
2001 per 1000 Males 1991
2001 1991
1 Mahendragarh 919 910 2
2 Rewari 901 927 1
3 Fatehabad 886 877 8
4 Sirsa 882 885 4
5 Bhiwani 880 878 7
6 Gurgaon 874 871 9
7 Ambala 869 903 3
8 Kurukshetra 866 879 6
9 Karnal 864 864 10
10 Yamunanagar 863 883 5
11 Kaithal 854 853 12
12 Jind 853 838 18
13 Hisar 852 853 13
14 Jhajjar 848 861 11
15 Rohtak 847 849 15
16 Sonepat 839 840 16
17 Faridabad 839 828 19
18 Panipat 830 852 14
19 Panchkula 823 839 17
Source: Census of India, 2001, Series 7, Haryana
The improvement in the sex ratio of these districts is effectively countermanded by the immense
decline in others. The highest decline amounting to as much as 34 points is noticeable in the district of
Ambala, followed by Panipat (22 points), Yamunanagar (20 points), Rewari (17 points). Karnal is the only
district which shows no change in the sex ratio between the two census years.
In contrast, in 1991, 10 districts had shown an improvement in the sex ratio over that in the 1981
census. These were the districts of Panchkula, Ambala, Yamunanagar, Kurukshetra, Kaithal, Panipat, Sirsa,
Rewari and Faridabad. Out of these 10, only Faridabad and Sirsa again showed an improvement in the 2001
Census., while the other eight revealed a decline.

(15)
Table 2.4
The Five Best Tehsils In Terms Of Total Sex Ratio
In the State of Haryana in 2001
Sr.No. Name of Tahsil District Sex Ratio
1. Kosli Rewari 945
2. Narnaul Mahendragarh 921
3. Mahendergarh Mahendragharh 917
4. Bawal Rewari 905
5. Feroz � Jhirka Gurgaon 905
The Five Worst Tehsils in Total Sex Ratio
Sr.No. Name of Tahsil District Sex Ratio
1. Sonipat Sonipat 829
2. Panipat Panipat 823
3. Bahadurgarh Jhajjar 821
4. Faridabad Faridabad 816
5. Panchkula Panchkula 810
Five Best Tahsils In Sex Ratio (Rural / Urban)
Tahsil District Rural Sex Urban Tahsil District Sex ratio
Ratio
Kosli Rewari 945 Chhachhrauli Yamunanagar 948
Narnaul Mahendragarh 929 Punahana Gurgaon 913
Mahendragarh Mahendragarh 920 Ferozepurzhirka Gugaon 907
Bawal Rewari 908 Loharu Bhiwani 906
Taoru Gurgaon 907 Naraingarh Ambala 903
Five Worst Tahsils In Sex Ratio (Rural / Urban)
Tahsil District Rural Sex Urban Tahsil District Sex Ratio
Ratio
Panchkula Panchkula 774 Faridabad Faridabad 809
Sonipat Sonipat 824 Bahadurgarh Jhajjar 810
Bahadurgarh Jhajjar 828 Panipat Panipat 818
Gurgaon Gurgaon 830 Samalkha Panipat 828
Kharkhod Sonipat 830 Thanesar Kurukshetra 832
Source: Census of India, 2001, Series 7, Haryana

(16)
Sex Ratio (0-6 years) Age Group
While the overall sex ratio may be affected by extraneous factors such as migration, it is the sex ratio
in the 0-6 age group, which portrays the trend for the future. In this group, the situation of Haryana is only
a little better than that of its neighbour Punjab. Haryana reveals a decline of 59 points in the current census
as compared to the previous one, which is second only to that of Punjab which has witnessed a monumental
decline to the extent of 82 points. From its 30th position in respect of sex ratio of the total population,
Haryana slides even further down the graph to 34th position amongst the Indian States and Union Territories.
Table 2.5
Sex Ratio Of Total Population And Child Population in the
Age Group 0-6 : 1991 And 2001, India and States
State/ India/States/ Sex ratio (females per 1,000 males
UT Union territories*
Code
Total population Child population in Population aged 7
the age group 0-6 and above
1991 2001 1991 2001 1991 2001
INDIA 9.27 9.33 9.45 9.27 9.23 9.35
1. Jammu & Kashmir N.A 900 N.A. 937 N.A. 894
2. Himachal Pradesh 976 970 951 897 980 981
3. Punjab 882 874 875 793 883 886
4. Chandigarh * 790 773 899 845 772 763
5. Uttaranchal 936 964 948 906 933 976
6. Haryana 865 861 879 820 862 869
7. Delhi * 827 821 915 865 810 813
8. Rajasthan 910 922 916 909 908 925
9. Uttar Pradesh 876 898 927 916 863 895
10. Bihar 907 921 953 938 895 916
11. Sikkim 878 875 965 986 860 858
12. Arunachal Pradesh 859 901 982 961 829 888
13. Nagaland 886 909 993 975 865 899
14. Manipur 958 978 974 961 955 981
15. Mizoram 921 938 969 971 911 932
16. Tripura 945 950 967 975 940 947

(17)
State/ India/States/ Sex ratio (females per 1,000 males
UT Union territories*
Code
Total population Child population in Population aged 7
the age group 0-6 and above
1991 2001 1991 2001 1991 2001
17. Meghalaya 955 975 986 975 947 974
18. Assam 923 932 975 964 910 926
19. West Bengal 917 934 967 963 907 929
20. Jharkhand 922 941 979 966 908 936
21. Orissa 971 972 967 950 972 976
22. Chhatisgarh 985 990 984 975 986 992
23. Madhya Pradesh 912 920 941 929 905 918
24. Gujarat 934 921 928 878 936 927
25. Daman & Due 969 709 958 925 971 682
26. Dadra & Nagar Haveli 952 811 1013 973 937 779
27. Maharashtra 934 922 946 917 931 923
28. Andhra Pradesh 972 978 975 964 972 980
29. Karnataka 960 964 960 949 960 966
30. Goa 967 960 964 933 967 964
31. Lakshadweep* 943 947 941 974 943 943
32. Kerala 1036 1058 958 963 1049 1071
33. Tamil Nadu 974 986 948 939 978 992
34. Pondicherry* 979 1001 963 958 982 1007
35. Andaman & Nicobar Islands 818 846 973 965 790 830
Source: Census of India, Series 1, 2001.
The scenario is equally appalling at the district level with not a single district showing a positive
development in this regard. Gurgaon ranks at the top with a sex ratio of 863 and Kurukshetra at the bottom
with a sex ratio of 770. Significantly, Mahendragarh, which ranks at the top in respect of overall sex ratio,
ranks somewhere in the middle in this age group. Noteworthy is the fact that all the districts reveal a
downward trend. The highest decline in this respect is witnessed in the district of Ambala, which shows a
decrease of 104 points over the previous census. It is followed by Kurukshetra, which has a decline of 98
points. Noticeably, the lowest decline in this context is 28 points in Faridabad.

(18)
Table 2.6
Sex Ratio in 0-6 years Age Group, Haryana and Districts
District Sex Ratio in 0-6 years Age Group
2001 1991
Haryana 820 879
Panchkula 837 890
Ambala 784 888
Yamunanagar 807 888
Kurukshetra 770 868
Kaithal 789 854
Karnal 808 871
Panipat 807 889
Sonepat 783 878
Jind 818 858
Fatehabad 830 873
Sirsa 818 883
Hissar 830 864
Bhiwani 838 885
Rohtak 796 868
Jhajjar 805 886
Mahendragarh 814 892
Rewari 814 894
Gurgaon 863 895
Faridabad 856 884
Source: Census of India, Series 7, Haryana
A comparison of the 0-6 sex ratio with the overall sex ratio reveals that Gurgaon, which ranks 6th in
respect of overall sex ratio, ranks at the top in respect of 0-6 years age group. Paradoxically, Panchkula,
which ranks at the bottom in the general sex ratio, ranks 4th in this respect of 0-6 years age group and
Kurukshetra, which is ranked at a relatively better 8th place in the former lies at the bottom in the latter. As
many as 17 of Haryana�s 19 districts have a child sex ratio lower than 850.

(19)
The low juvenile sex ratio is merely one side of the sorry State of affairs. What is even more appalling
is the fact that out of the 10 districts in the country having the lowest child sex ratio, 3 fall in Haryana, while
the other seven belong to the neighbouring State of Punjab. A slight positive note may be sounded here, in as
much as in 1991 4 of such districts fell in Haryana, while the others belonged to Punjab (3), Tamil Nadu (1),
Madhya Pradesh (1) and Rajasthan (1). This positive development must, however, be taken with a pinch of
salt as the improvement is not due to any improvement in Haryana�s child sex ratio picture, but because of
the higher decline in Punjab.
Table 2.7
Districts With The Lowest Child Sex Ratio In India, 2001
District State Sex Ratio
Ambala Haryana 784
Amritsar Punjab 783
Sonepat Haryana 783
Bathinda Punjab 779
Mansa Punjab 779
Kapurthala Punjab 775
Gurdaspur Punjab 775
Kurukshetra Haryana 770
Patiala Punjab 770
Fatehgarh Sahib Punjab 754
Source: Presentation by Mr. Sunil Gulati, Director, Census Operations, Haryana at Regional Data Dissemination
Workshop, Chandigarh, July 10, 2001
Sex Ratio (0-6 years) Haryana and Districts, 1991 & 2001
700
720
740
760
780
800
820
840
860
880
900
920
Hary
ana
Panch
kula
Am
bala
Yam
unanagar
Kuru
kshet
ra
Kait
hal
Karn
al
Panip
at
Sonep
at
Jind
Fate
habad
Sir
sa
His
sar
Bhiw
ani
Rohta
k
Jhajja
r
Mahen
dra
garh
Rew
ari
Gurg
aon
Fari
dabad
Districts
Sex R
ati
o
2001 1991

(20)
Table 2. 8
Ten Worst Tehsils In Sex Ratio Of 0-6 Pop, (Rural / Urban)
Worst Tahsil District Rural Sex Worst Tahsil District Urban Sex
Ratio Ratio
Shahabad Kurukshetra 743 Shahabad Kurukshetra 718
Ambala Ambala 767 Ballabgarh Faridabad 722
Thanesar Kurukshetra 771 Indri Karnal 736
Narainga Ambala 772 Kaithal Kaithal 753
Barara Ambala 781 Rania Sirsa 755
Ganaur Sonipat 784 Sonipat Sonipat 756
Sonipat Sonipat 785 Narwana Jind 763
Kharkhoda Sonipat 787 Thanesar Kururshetra 768
Guhla Kaithal 792 Samalkha Panipat 770
Gohana Sonipat 794 Karnal Karnal 771
Source : Census Of India 2001, Series 7, Haryana
The issue of declining sex ratio in Haryana has become a study in contrasts with no possibility of
arriving at some general conclusions. In the first instance, Haryana has a high level of development and
ranks comparatively high in the HDI. Thus poverty cannot be cited as the reason for declining sex ratio.
The causes for this phenomenon cannot be traced to literacy either. Notably, the district with the
second highest sex ratio, viz. Rewari also has the highest overall and female literacy rate, but the districts
with the lowest sex ratio, Panchkula and Panipat (19th and 18th respectively) are also ranked considerably
high in respect of literacy rates. So the linkage with education too becomes slightly far fetched. Nor can
industrialisation and urbanisation be accepted as causes.
�The declining sex ratio must be
considered along with factors of
improved life expectancy, greater
availability of health services and
declining female mortality. Lower female
death rate and higher life expectancy,
seen along with a declining sex ratio can
only indicate the increasing incidence of
female foeticide as well as negligence
of the girl child. Sex determination clinics
continue to proliferate all over the State
and clearly advertise, in clear violation
of the Pre-natal Diagnostic Techniques
�The metal plate is repeatedly struck, the sound resonates
in the villages of Haryana, announcing the birth of a
baby boy. It fills the house with festivity, and celebrations
begin. Women dressed in beautiful colours prepare for
the feast. The proud mother distributes gifts to her
husband�s family. The family has been �gifted� with a
baby boy who will grow up to continue the lineage. The
little boy�s hand is delicately held to put on a small amulet
to protect him against evil spirits and bless him with a
ling life. Little girls in Haryana do not have this amulet.�
Our Daughter, Our Wealth, Population Council, 1999.
(21)
(Prevention of Misuse) Act, �Pay Rs 500 now instead of Rs. 5 lakhs later�; there have been no convictions
under the Act. Technology, developed to eliminate birth defects, is being used to nip innocent lives in the bud
and the girl child is even denied the right to be born. True estimates of female foeticide/infanticide are
difficult to get. But the juvenile sex ratio provides a broad picture of this� observes the Punjab Human
Development Report. The same causes would hold true for Haryana. Pramod Gouri, director of Search, a
government-financed civic-education outfit in Rohtak, offers two explanations �as to why Punjab and Haryana
should be so egregiously prone to female foeticide: the region�s social norms have proved remarkably immune
to �modernity�; and the agricultural �green revolution� put enough money in local pockets to make sex-
selection affordable. Abortion is far more prevalent among better-off, town-dwelling, higher-caste and literate
women. Smaller families have, as in China, also further encouraged female abortion.�2
Blaming female foeticide/infanticide for declining sex ratio is like looking at the problem with blinders
on. To understand the paradox of declining sex ratio in the face of improvement in other indicators, one
needs to examine the entire gamut of socio-economic and cultural variables, which make the Haryanvi
women equal yet unequal, marginalized yet valorised. The issues must be identified, the sanctity of girl-
child�s right to birth and life must be recognised, the mind-set needs to be changed, legal measures need to
be evoked; the underlying causes have to be traced and eliminated, before we can reverse this process.
Sex ratio of Slum Population
An even more depressing picture is presented by the sex ratio of the slum population of Haryana. As
against a sex ratio of 861 for the total population, the sex ratio of the slum population is merely 824.
However, on the positive side, the sex ratio of the child population in slum areas is slightly higher at 837 than
the child sex ratio of the total population.
Table 2.9
Sex Ratio of Slum Population in Haryana 2001.
Sex Ratio
Total Population 824
Child Population of age Group 0-6 837
Source: Census of India, 2001, Series 7, Haryana
Son Preference in Haryana
One of the key reasons for declining sex ratio is a high level of son preference. The Table below
enumerates the mean number of sons and daughters wanted by ever married women. Obviously the number
and percentage of women who want more sons than daughters is high, while the percentage who want more
daughters than sons is almost negligible. This factor holds true regardless of residence or literacy. At the
same time, it must be admitted that the percentage of women wanting at least one daughter is also high.
However, in contrast the percentage of women wanting at least one son is still higher. Thus, notwithstanding
2 The Economist, April 17, 2003, www.economist.com

(22)
the various schemes and attempts made by policy makers and planners, son preference continues to rule the
roost so far as families in Haryana are concerned.
Table 2.10
Indicators of Sex Preference
Mean ideal number of sons, daughters, and children of either sex for ever-married woman, percentage who
went more sons than daughters, percentage who want more daughters than sons, percentage who want at least
one son, and percentage who went of least one daughter by selected background characteristics, Haryana,
1998-89
Mean ideal number of
Back Sons Daughters Either Percentage Percentage Percentage Percentage Number
ground sex who want who wants who want who want of
characteristic more sons more at least at least women
than daughters one son one
daughters than sons daughter
Residence
Urban 1.1 0.8 0.3 25.9 0.5 84.4 78.4 820
Rural 1.5 0.9 0.2 42.2 0.5 92.0 82.0 2017
Education
Illiterate 1.6 1.0 0.2 46.2 0.3 92.4 83.4 1550
Literate < 1.3 0.8 0.3 37.3 0.6 89.4 80.0 479
middle school
complete
Middle school 1.2 0.8 0.3 31.1 0.9 87.6 78.3 234
complete
High school 1.0 0.8 0.3 16.9 0.7 84.0 76.1 574
complete
and above
Source: NFHS-II, Haryana, 1998-99
Birth and Death Rates
As against an all-India Birth Rate of 27.2 per cent, based on the Sample Registration System, Haryana
has a higher SRS birthrate of 28.3. In contrast the NFHS-II data reveals Haryana to have lower birth rate at
23.1 percent. Significantly, the rural birth rate is considerably higher than the birth rate in the urban areas.

(23)
Table 2.11
Crude Birth Rate in Haryana, NFHS-I, NFHS-II, SRS
NFHS-1 (1990-82) NFHS-2(1996-98) SRS(1997)
Age Total Urban Rural Total Urban Rural Total
CBR 32.9 18.1 25.0 23.1 23.8 29.6 28.3
Note Rates From NFHS-1 and NFHS-2 are for the period 1-36 months preceding the survey. Rates from the
SRS are for one calendar
CBR: Crude birth rate, expressed per 1,000 population
Source for SRS: Office of the Registrar General. 1999a
Source : NFHS-II, Haryana, 1998-99
Table 2.12
Age specific death rates and crude death rates (CDR) by sex from NFHS-1, NFHS-2, and the SRS, Haryana
NFHS-1 (1991-92) NFHS-2 (1997-98) SRS (1997)
Age Total Male Female Total Male Female Total
< 5 22.1 16.7 21.5 18.9 19.7 25.1 22.2
5-14 1.2 0.7 1.4 1.0 1.0 1.7 1.3
15-49 3.5 3.7 3.6 3.6 3.1 2.6 2.9
50-59 12.3 4.3 3.8 4.1 12.3 5.2 8.9
60+ 39.3 47.1 45.6 46.4 46.5 40.6 43.3
CDR 9.0 8.0 8.3 8.2 8.0 8.0 8.0
Note Age specific death rates and crude death rates by sex from NFHS-1 and NFHS-2 are based on the annual
number of deaths reported or the de jure population during the two years preceding the survey.. The SRS rates
are also de jure, based on deaths during 1997. Rates are specified on a per-thousand basis.
Sources for SRS. Office of the Registrar General, 1999b
Likewise, the crude death rate in Haryana is lower than the national average. However, it is noteworthy
that while the SRS estimates indicate no difference between male and female death rates, the NFHS-II
estimates reveal a higher Crude Death Rate for women as compared to men.

(24)
Table 2.13
Neonatal, post neonatal, infant, child and under five mortality rates for the 10 years period
preceding the survey by selected demographic characteristics, Haryana, 1998-99.
Neonatal Post neonatal Infant Child mortality Under Five
mortality mortality mortality mortality
(NN) (PNN) (1q0) (4q0) (5q0)
Sex of Child
Male 32.2 20.6 52.9 13.8 66.0
Female 36.0 30.0 66.0 30.2 94.2
Source, NFHS-II Haryana, 1998-99
It is, however, the mortality rates of infants and children, which are actually indicative of the prevailing
gender discrimination and inegalitarian status of women in the State of Haryana. A look at the table above
reveals that as against 32.2 per cent of male children dying in the first month of life, 36.0 female children die
in this period. This situation becomes even more grim when post neonatal mortality is considered. As against
20.6% of male babies dying in the period between the first month of life but before the first birthday, 30.0 per
cent of female babies die in this period. Still more horrifying is the picture for infant mortality where the
mortality differentials are 13.1 points. To make the portrait even more horrendous, the child mortality figures
(probability of dying between the first and fifth birthdays) reveal a differential of nearly 17 points. On the
whole, the under five mortality rate for males is 66.0 as compared to a gigantic 94.2 for females.
Notwithstanding the fact that female babies are supposed to be healthier and sturdier at birth with
less chances of dying as compared to baby boys, such prevailing gender differentials in mortality are indicative
of the extreme bias and discrimination which continues in this highly patriarchal State. Herein lies one of the
causes for the abysmal sex ratio of the State.
Life Expectancy
Paradoxically, higher female mortality rates are accompanied by a higher life expectancy at birth for
females as compared to males. Life expectancy at birth for females (as well as for males) has been improving
over the years and female life expectancy is higher than male life expectancy since the early eighties. At the
all-India level, while the overall life expectancy is 61.1 years, male life expectancy is 60.4 years. Female life
expectancy at 61.8 years is at least 1.4 years higher than male life expectancy.
Amongst the major States in India, Haryana ranks at 7th position in respect of female life expectancy,
with a female life expectancy of 64.6 years. It ranks behind Kerala, Punjab, Maharashtra, Himachal Pradesh,
Tamil Nadu and Karnataka. Over the period 1992-96 and 1993-97, Haryana has shown an improvement of
0.3 years for female life expectancy. Significantly, there is a six year gap between rural and urban female life
expectancy with the latter being much higher at 69.6 years as compared to 63.3 years for rural females.

(25)
Aged Women
Increased life expectancy along with decline in death rates gives rise to another issue that of the aged
and elderly. With females having a higher life expectancy, the future is likely to see more aged women, who
may be widows as male life expectancy is lower. As the National Human Development Report 2001 notes,
�The number of widows among the elderly is about three and a half times more than the number of widowers.�3
Haryana along with Kerala, Punjab and Himachal Pradesh is one of the States with a high proportion
of elderly population. The percentage of the elderly in Haryana in the 1991 census was 7.70, which is at least
one percentage point higher than the national average of 6.70. This proportion amongst the males in 7.43,
while amongst the females it is higher at 8.01. Significantly the rise in the percentage of females has been at
a faster rate from 5.73 in 1981 to 8.01 in 1991. In contrast the percentage of male elderly persons rose from
6.78 per cent to 7.43 percent.
Age at Marriage
One of the major characteristics of the Indian social and demographic scene is a low age at marriage
for girls and boys. This is particularly true for the States of Rajasthan and Bihar. In Haryana, the singulate
mean age at marriage is higher than the legally stipulated age of 18 years, yet lower than many of the
developed States such as Punjab, Kerala and Maharashtra. A look at the Table below reveals that this age at
marriage for females has risen from 17.7 years in the 1971 census to 18.9 years in 1991. NFHS-I estimates
held this age to be 18.4 years. In the years of the NFHS-II, however, there has been an improvement of 1.4
years for women and the age at marriage has risen to 19.8.
Table 2.14
Singulate Mean Age at Marriage
Singulate mean age at marriage by sex from selected sources, Haryana.
1971-1998-99
Sources Male Female Difference
1971 Census 20.9 17.7 3.2
1981 Census 21.3 17.8 3.5
1991 Census 22.8 18.9 3.9
1993 NFHS-1
Urban 24.4 19.9 4.5
Rural 22.6 17.9 4.7
Total 23.1 18.4 4.7
3 National Human Development Report, 2001, Planning Commission, Govt. of India, March 2002, p. 92

(26)
Sources Male Female Difference
1998-99 NFHS-2
Urban 25.2 21.4 3.8
Rural 24.3 19.2 5.1
Total 24.6 19.8 4.8
Note :Table is based on the de jure population
In sum, the demographic dice in Haryana is heavily loaded against women, so much so that the States
of Punjab and Haryana and the Union Territory of Chandigarh have been labeled as the �murderous trio� and
India�s �Bermuda Triangle�, where girls vanish without a trace. While the very issue of right to birth becomes
crucial with the ever decreasing sex ratio, they do not fare much better so far as indicators of birth and death
rates, and age at marriage are concerned. Do they fare any better in the field of literacy? This issue forms the
essence of the next chapter, Female Literacy in Haryana.

(27)
CHAPTER - III
EDUCATION
�Education refers to a system of training and instruction designed to provide systematic knowledge,to develop skill, abilities, character and mental powers as the result of such training. All of these canindividually become tools of empowerment for both men and women�, observes a UNIFEM report ongender biases and discrimination against women.1 The Beijing Platform for Action too recognized theeducation of women and girls as one of the critical areas of concern. At the national level the NationalPolicy for Education equally recognizes education as a vital tool in the empowerment of women. Whathas been Haryana�s progress in this regard? This is the focus of this chapter.
Female Literacy : Improvement and Gender Gaps
Significant progress has been made by Haryana in the area of female literacy. As Table 3.1below reveals female literacy rates in Haryana have made a quantum jump from a lowly 10.32 per centin 1971 to an impressive 56.31 per cent in 2001. While the male literacy rates too have registeredan improvement from 38.9 per cent to 79.25 per cent in the same period, it is significant to note thatthe improvement in female literacy rates is almost 5 times while male literacy rates have little morethan doubled in the same period.
It is also noteworthy that the increase between 1971-1981 was of about 10 percentage points.This growth rate more than doubled during the next decade and female literacy increased by morethan 20 percentage points. Although the relatively high growth rate of female literacy continued in thecurrent census, yet there is slight decline in this growth rate by about 4 percentage points.
Table 3.1
Literacy Rates
Literacy Rate 1971-2001, Haryana
Year Persons Males Females
1971 25.71 38.9 10.32
1981 37.13 51.86 20.04
1991 55.85 69.1 40.47
2001 68.59 79.25 56.31
Source: Census of India, Series 7, Haryana, 2001
1 Preet Rustagi, Gender Biases and Discrimination against Women : What Do Different Indicators Say? UNIFEM, New Delhi, 2003,p. 35

(28)
However, compare Haryana�s female literacy rates with those of other States and the picture
becomes quite dismal. Despite its immense improvement over the last four decades, Haryana remains
among the lower category States for female literacy. At the all-India level, Haryana ranks at 16th place
in respect of overall literacy, 20th for male literacy and a lowly 23rd in female literacy. While its literacy
rate is higher than the national average, it is significant to note that it is much worse than its
immediate neighbours viz.Punjab, Himachal Pradesh. and the Union Territory of Chandigarh.
Apart from the increase in literacy rates, one important indicator for female education is the
gender gap in the male and female literacy rates. At the all-India level, this gap was a vast 26.52 per
cent in 1981, coming down marginally to 24.84 per cent in 1991. In 2001 this gap has declined by
another 3 percentage points to 21.70 per cent. While the overall literacy rates in Haryana are better
as compared to the national average, the gender gap in male and female literacy rates is much higher.
As Table 3.2 below reveals, this gender gap was a whopping 28.63 per cent in 1991. However, it has
declined by almost six percentage points to 22.94 per cent in 2001.
A district-wise analysis reveals a considerable variation in regard to the educational status of
various districts vis-à-vis male and female literacy rates. Thus Rewari, which is at the top in male
literacy rates, ranks 6th in respect of female literacy rate. Mahendragarh reveals an even more paradoxical
picture in that it is 2nd in respect of male literacy rate and a lowly 12th for female literacy rate. In
contrast, Yamunanagar, which is ranked 10th in male literacy is amazingly ranked third in female
literacy. Paradoxically, Panchkula, which has the lowest sex ratio in the State is ranked first in female
literacy. Only the districts of Kaithal and Fatehabad reveal no variation in ranking for male and female
literacy rate and are uniformly placed at the bottom.
Literacy Rate in Haryana, 1971-2001
0
10
20
30
40
50
60
70
80
90
1971y 1981y 1991y 2001y
Year
Lit
era
cy R
ate
Persons Males Females

(29)
Table 3.2
Literacy Rate by Sex for State and Districts, 2001
State/District Literacy rates Gender gap
Males Ranking by Female Ranking by Male Female Rank
male female
literacy literacy
rates rate
1991 2001 1991 2001 1991 2001
Rewari 82.31 89.04 1 46.34 61.25 6 35.97 27.79 17
Mahendragarh 77.17 85.31 2 36.75 54.61 12 40.42 30.7 19
Rohtak 76.73 84.29 3 48.25 63.19 4 28.48 21.1 8
Sonepat 75.64 83.95 4 45.74 61.65 5 29.9 22.3 10
Jhajjar 78.09 83.26 5 46.12 59.88 8 31.97 23.38 12
Ambala 75.45 83.01 6 56.78 68.48 2 18.67 14.53 2
Panchkula 74.15 82.74 7 56.17 68.98 1 17.98 13.76 1
Faridabad 74.15 82.49 8 42.12 56.8 11 32.03 25.69 14
Bhiwani 70.73 81.19 9 35.07 53.5 13 35.66 27.69 16
Yamunanagar 69.81 79.28 10 50.16 64.08 3 19.65 15.2 3
Panipat 69.22 79.16 11 42.78 58.48 9 26.44 20.68 7
Kurukshetra 68.92 78.23 12 46.56 60.76 7 22.36 17.47 4
Hissar 65.01 77.62 13 33.41 52.09 14 31.6 25.53 13
Gurgaon 67.87 77.11 14 34.94 48.29 17 32.93 28.82 18
Karnal 65.36 76.74 15 41.92 58.42 10 23.44 18.32 5
Jind 60.93 74.69 16 29.86 48.97 16 31.07 25.72 15
Sirsa 57.21 70.93 17 34.02 50.31 15 23.19 20.62 6
Kaithal 54.85 69.81 18 28.78 47.6 18 26.07 22.21 9
Fatehabad 54.71 68.71 19 29.77 46.4 19 24.94 22.31 11
Source: Census of India, Series 7, Haryana, 2001
A look at the data for gender gap in literacy rates reveals a uniformly high gender gap across
all the districts with Mahendragarh having the highest gender gap. It is to be noted (at the risk of
repetition) that Mahendragarh has the highest sex ratio in the State and Panchkula the lowest. While
the gap has declined over the past 10 years, it continues to be high. Significantly, it is Panchkula which
has the lowest gender gap in male and female literacy rates in the State.

(30)
What are the causes of such a gender gap? The Human Development Report of South Asia,
published by the Mahbub-ul-Haq Human Development Centre, succinctly points out the causes for the
prevailing gender gap in education: �Low female participation in the education system is primarily the
outcome of two factors: low parental demand for girls� schooling; and the public and private sectors
supply of educational services that do not respond to the communities� needs�. It also refers to the
�opportunity costs� of sending girls to school as they perform more chores at home as compared to
boys.2
Enrolment and Dropout Rates
Literacy rates are only a partial indicator. For real empowerment, the number of years spent in
schools is a crucial factor. Hence the study of enrolment and dropout rates becomes vital to an
understanding of the status of women in any area.
Table 3.3
Enrolment Ratio in Classes I-V and VI-VIII of Schools for General Education (All Students),
1999-2000, Haryana and India
State/India Classes I-V (6-11) years Classes VI-VIII( 11-14 years)
Boys Girls Total Boys Girls Total
India 104.08 85.18 94.9 67.15 49.66 58.79
Haryana 81.22 82.98 82.04 64.58 59.02 62.00
Source: Preet Rustagi, Gender Biases and Discrimination against Women: What Do Different Indicators
Say?, UNIFEM, New Delhi, 2003
The above Table 3.3 reveals that at the national level, as against 104.08 per cent of boys aged
6-11 years enrolling in school, merely 85.18 percent of girls of the same age get enrolled in school.
However, in Haryana more girls than boys are enrolling at the primary stage. This is in sharp contrast
to the national and Statewise trend where more boys than girls enrol at the primary stage. Punjab is
the only other State which has more girls than boys enrolling at this stage.
It is also noteworthy that the State average of boy�s enrolment is about 23 percentage points
lower than the national average, while the difference in regard to female enrolment is a little more
than 2 percentage points.
However, in the next stage of classes VI-VIII, a marked drop in enrolment ratios is witnessed at
both national and State level. This drop is higher for the nation as a whole where the enrolment for
boys declines from 104.08 per cent to 67.15 per cent and for girls from 85.18 per cent to 49.66 per
cent. At the State level, boys enrolment rate shows a decline from 81.22 per cent to 64.58 per cent
and that for girls from 82.98 per cent to 59.02 per cent. Furthermore at the middle school level, while
the State�s average for boys enrolment continues to be lower than the national average, the enrolment
2 Human Development Report of South Asia, The Gender Question, 2000, p. 116

(31)
ratio of girls is higher than the national average. However, the trend of higher girls� enrolment,
noticeable at the primary stage is reversed at this stage with boys recording a higher enrolment rate.
Low enrolment of girls is compounded by higher dropout rates for girls. The causes are many,
including inadequate facilities for girls in schools, absence of female teachers, insecurity, etc.
Table 3.4
Gross Dropout Rates in Classes 1-VI, I-VIII, I-X, 2000-2001
State/India Classes I-V Classes I-VIII Classes I-X
Boys Girls Total Boys Girls Total Boys Girls Total
Haryana 23.74 19.68 21.88 13.56 22.48 17.69 31.37 42.65 36.51
India 39.71 41.90 41.67 50.33 57.95 53.67 66.41 71.51 68.58
Source: DWCD Annual Report, 2002-03, Ministry of HRD, GOI
A look at Table 3.4 above reveals the high dropout rates at both the national and State level.
While the dropout rates at the national level are certainly higher than those at the State level, what
is significant from the perspective of the present analysis is the gender differential in those rates. The
gender differential is much higher at the State level as compared to the national level. Also noteworthy
is the fact that, while at the national level, girl dropout rate is uniformly higher than that for boys,
in Haryana, at the primary stage more boys than girls are dropping out of school. At the next stage,
however, the percentage of girls dropping out is not only higher than that of boys, but the gender
differential is also quite high.
School Attendance
Another significant indicator of education, as against mere literacy is school attendance. The
table below reveals a decline in school attendance with an increase in age for both boys and girls.
While this decline exists for both boys and girls, it is much higher in the case of girls as compared
to boys. Furthermore, an areawise analysis reveals that rural areas show a much lower percentage of
females attending schools as compared to urban areas.
Table 3.5
School Attendance
Percentage of the household age 6-17 years attending school by
age, sex, and residence, Haryana, 1998-99
Male Female Total
Age Urban Rural Total Urban Rural Total Urban Rural Total
6-10 92.7 92.5 92.5 92.0 89.3 89.9 92.4 91.0 91.4
11-14 90.9 88.3 89.1 86.8 77.3 80.0 89.0 83.0 84.7

(32)
Male Female Total
Age Urban Rural Total Urban Rural Total Urban Rural Total
15-17 71.8 66.3 68.0 75.2 40.0 50.3 73.3 54.4 60.0
6-14 91.9 90.8 91.1 89.6 84.1 85.5 90.9 87.7 88.6
6-17 87.1 85.4 85.9 86.1 74.7 77.8 86.7 80.5 82.2
Source: NFHS-II, Haryana, 1998-99
What are the reasons for poor attendance in schools? A look at the table below reveals these
reasons to include factors such as education not considered necessary; required for household work;
education is expensive; not interested in studies among others. A closer look at this table reveals a
gendered variation between the reasons given for not attending school. While the highest percentage
of girls cite education not considered necessary (24.0 %); amongst boys the highest percentage are
not interested in studies (25.3%).
Table 3.6
Reasons For Children Not Attending School
Percent distribution of children age 6-17 years who never attended school by the main reason for never
attending school and percent distribution of children age 6-17 years who dropped out of school by the
main reason for not currently attending school, according to residence and sex, Haryana, 1988-89.
Urban Rural Total
Reasons Male Female Male Female Male Female
Main reason for not Attending the school
School too far away 0.0 0.0 0.9 2.5 0.6 2.1
Education not
Considered necessary 12.8 22.5 6.9 24.2 8.4 24.0
Required for house
Hold work 7.7 8.5 4.4 17.9 5.2 16.5
Required for work on
farm/family business 0.0 0.0 3.5 0.0 2.6 0.0
Required for outside work
for payment in cash or kind 0.0 0.0 2.7 0.5 2.0 0.4
Costs too Much 35.8 31.5 19.9 16.4 23.9 18.7
No proper school
facilities for girls 0.0 0.0 0.0 7.0 0.0 5.9
Required for care of siblings 2.6 0.0 0.0 1.0 0.7 0.9
Not interested in studies 18.1 22.9 27.8 14.5 25.3 15.8

(33)
Urban Rural Total
Reasons Male Female Male Female Male Female
Other 23.1 14.6 33.2 15.4 30.6 15.3
Don�t Know/missing 0.0 0.0 0.9 0.5 0.6 0.4
Total 100.0 100.0 100.0 100.0 100.0 100.0
Number of Children 39 35 114 200 154 235
Main reason for not currently attending School
School too far away 0.0 2.4 0.0 2.1 0.0 2.1
Transport not available 0.0 4.6 0.7 0.0 0.5 0.8
Further education not
Consider necessary 1.9 4.5 2.0 6.2 2.0 5.9
Required for House
Hold work 7.9 34.0 7.3 27.7 7.4 28.8
Required for work on
farm/family business 9.9 0.0 4.0 0.0 5.5 0.0
Required for outside work
for payment in cash or kind 7.8 0.0 4.6 0.0 5.5 0.0
Costs too much 15.8 9.1 9.3 11.3 10.9 10.9
No proper school
facilities for girls 0.0 0.0 0.0 2.6 0.0 2.1
Not interested in Studies 48.7 43.2 69.5 41.5 64.2 41.8
Repeated failures 0.0 0.0 0.7 2.0 0.5 1.7
Got married 0.0 2.2 0.0 6.7 0.0 5.8
Other 7.9 0.0 0.7 0.0 2.5 0.0
Don�t Know/missing 0.0 0.0 1.3 0.0 1.0 0.0
Total percent 100.0 10.0 100.0 100.0 100.0 100.0
Number of children 51 44 151 195 202 239
Source: NFHS-II, Haryana, 1998-99
Another gender discrimination is revealed in that 16.5% of the girls are unable to attend school
as they are required for household work as against merely 5.2% of the boys. Similar arguments are
presented for currently not attending school with only a slight percentage variation.
Educational Infrastructure
Haryana has definitely made progress in the field of education. One of the major reasons is the
vast institutional set up. In 2001-02, Haryana had a total of 4 Universities, 154 Arts and Science

(34)
Colleges; 1 college for Physical Education; 20 Teachers Training Colleges; 4,494 High/Senior Secondary
Schools; 2170 Middle/Senior Basic Schools; 11,208 Primary/Junior Basic Schools; 27 Per-Primary Schools;
17 Teachers Training schools and 6 schools for Handicapped.3 In 2003-04 a new University, Ch.Devilal
University has been established at Sirsa; 4 Government colleges have been established at Gurgaon,
Bhiwani, Murthal and Hisar, out of which 3 are exclusively for women. At present reports the Economic
Survey of Haryana (2003-03) there are 187 colleges, out of which 63 are girls colleges.
This vast network of institutions, notwithstanding, the number and percentage of girls schools
at various levels is quite low as the table below reveals.
Table 3.7
Classification of Schools, 2001-02
School Boys Girls Total Percentage of Percentage of
Boys school to Girls Schools to
Total Total
High/Senior Secondary
School 3973 521 4494 88.41 11.59
Middle Schools 1976 194 2170 91.06 8.94
Primary (Including
Pre-Primary/Balwari) 9581 1654 11235 85.28 14.72
Source: Statistical Abstract, Haryana, 2001-02
The percentage of girls schools is very low as compared to boys schools. It is highest at the
Primary level and lowest at the middle level. However, it is significant that schools are accessible, one
of the major causes of girls� dropping out of school, within a radius of 1.44 kms, 1.75 kms and 3.08
kms at middle, high and senior secondary level respectively. Primary education facilities are available
within a distance of 1.11 kms in the State.
Table 3.8
Sex Ratio and Literacy Rates
District Rank by Sex ratio, Ranking by 0-6 Ranking by
2001 sex ratio Literacy Rates
Mahendragarh 1 9 9
Rewari 2 10 3
Fatehabad 3 5 19
Sirsa 4 8 17
Bhiwani 5 3 13
3 Statistical Abstract, Haryana, 2001-02

(35)
District Rank by Sex ratio, Ranking by 0-6 Ranking by
2001 sex ratio Literacy Rates
Gurgaon 6 1 15
Ambala 7 17 2
Kurukshetra 8 19 10
Karnal 9 11 12
Yamunanagar 10 12 7
Kaithal 11 16 18
Jind 12 7 16
Hisar 13 6 14
Jhajjar 14 14 6
Rohtak 15 15 4
Sonepat 16 18 5
Faridabad 17 2 8
Panipat 18 13 11
Panchkula 19 4 1
Source: Derived from Census of India, Series 7, Haryana, 2001
A general assumption is that sex ratios would improve with improved literacy rates. The Table
above reveals the fallacy of this assumption. A comparison of th overall sex ratio with literacy rates
shows that Mahendragarh which has the highest sex ratio in the State is ranked 9th in terms of literacy
and Fatehabad which is ranked third in sex ratio ranks last in terms of literacy. On the other hand,
Panchkula which is ranked at the bottom in terms of sex ratio is at the top in respect of literacy rates.
A comparison of the literacy levels with the district ranking in 0-6 age group also upholds the
claim that no positive correlation can be traced between literacy and sex ratio. Rewari, which is ranked
10th in terms of 0-6 sex ratio is ranked third in respect of literacy and Fatehabad, which is ranked 5th
in terms of 0-6 sex ratio, is 19th in respect of literacy. On the other hand, Gurgaon, which tops in sex
ratio in this age group, ranks 15th in respect of literacy.
The implications of this need to be assessed and analysed for improvement in sex ratios and the
status of women.
In sum, Haryana has made rapid strides in the field of education. Yet it lags far behind in the
goal of universal elementary education, which is a basic necessity for empowerment and development
of women.

(37)
CHAPTER - IV
HEALTH
Haryana has started the new century with a large number of �missing women�. Is this demographic
imbalance indicative of the low status of women�s health in Haryana? Recent years have witnessed a
considerable reduction in the average family size, decline in fertility rates and falling mortality rates,
pointing towards an improved health status. Nevertheless, globalisation and privatisation have had
their impact in as much as free health services are replaced with user fee, a development, which
negatively impacts women�s health. A look at a few of the health indicators will reveal the true state
of women�s health in Haryana.
Fertility Rates
NFHS-II estimates reveal that an average Indian woman gives birth to three children in her
reproductive span. This rate is higher in some of the States such as Meghalaya, Uttar Pradesh,
Rajasthan, Nagaland, Madhya Pradesh and Bihar and lower or closer to the replacement rate in a few
States; Kerala being one of them. As against the all-India average of 2.85 Total Fertility Rate (TFR),
Haryana has a slightly higher total fertility rate at 2.88. A look at the table below reveals that this
TFR has declined from 3.99 in the period covered by NFHS-I. However, the SRS survey for the same
period reveal a much higher TFR at 3.42. It is also noteworthy that as against a TFR of 2.24 in urban
areas, rural areas have a much higher TFR of 3.13. Going by the age groupings, it would be noticed
that the highest TFR is visible in the age group of 20-24 years, followed by 25-29, while the lowest
is in the age group of 45-49 years.
Table 4.1
Current Fertility
Age- Specific And Total Fertility Rates And Crude Birth Rates From NFHS-1, NFHS-2,
And The SRS By Residence, Haryana
NFHS-1 NFHS-2(1996-98) SRS(1997)
(1990-82)
Age Total Urban Rural Total Urban Rural Total
15-19 0.143 0.031 0.116 0.092 0.019 0.044 0.039
20-24 0.316 0.186 0.260 0.240 0.208 0.305 0.283

(38)
NFHS-1NFHS-2(1996-98)SRS(1997)
(1990-82)
25-290.1960.1510.1500.1500.1920.2180.212
30-340.0880.0630.0620.0620.0780.0930.090
35-390.0360.0110.0180.0150.0210.0430.038
40-440.0150.0000.0130.0090.0100.0190.017
45-490.0030.0060.0080.0070.0030.0050.004
TFR 15-443.972.213.092.842.643.613.40
TFR 15-493.992.243.132.882.663.643.42
Note Rates From NFHS-1 and NFHS-2 are for the period 1-36 months preceding the survey. Rates
for the age group 45-49 might be slightly biased due to truncation. Rates from the SRS are for one
calendar year. Age-specific and total fertility rates are expressed per woman.
TFR: Total Fertility rate
Source for SRS: Office of the Registrar General, 1999
Source: NFHS-II, Haryana
A look at the time-series analysis of fertility rates reveals the consistent decline in fertility rates
over five year periods. The fall in fertility rates, paradoxically, is slightly higher in rural areas as
compared to urban areas.
Age-wise fertility rates in Haryana
0
0.05
0.1
0.15
0.2
0.25
0.3
0.35
15-19y20-24y25-29y30-34y35-39y40-44y45-49y
Age-Groups
Total Fertility Rates
NFHS-INFHS-IISRS(1997)

(39)
Table 4.2
Fertility Trends
Age Specific Fertility Rates for Five-Year Periods Preceding the Survey by Residence,
Haryana, 1998-89
Years Preceding Survey
Age 0-4 5-9 10-14 15-19
URBAN
15-19 0.039 0.091 0.115 0.101
20-24 0.214 0.259 0.298 0.280
25-29 0.143 0.173 0.187 0.249
30-34 0.059 0.081 0.099 [0.104]
35-39 0.013 0.030 [0.058] U
40-44 0.002 [0.010] U U
45-49 [0.005] U U U
RURAL
15-19 0.127 0.157 0.187 0.137
20-24 0.272 0.329 0.362 0.350
25-29 0.154 0.199 0.248 0.287
30-34 0.062 0.096 0.120 [0.211]
35-39 0.023 0.047 [0.073] U
40-44 0.013 [0.013] U U
45-49 [0.007] U U U
TOTAL
15-19 0.102 0.137 0.166 0.125
20-24 0.255 0.308 0.341 0.325
25-29 0.151 0.190 0.226 0.275
30-34 0.061 0.091 0.113 [0.178]
35-39 0.019 0.042 [0.068] U
40-44 0.010 [0.012] U U
45-49 [0.006] U U U
U - Unavailable
Source: NFHS-II

(40)
Anaemia among Women
NFHS-II reveals that 51.8 percent of women in India suffer from some degree of anaemia. 1.9
percent are affected by severe anaemia, while 14.8 per cent and 35 percent are impacted by moderate
and mild anaemia respectively. This is indicative of the continuing gender bias in nutrition. Haryana,
notwithstanding the Green Revolution and its fame as the land of milk and curd, in spite of its high
per capita income and low level of poverty has 47 percent of its women suffering from anaemia of
one form or the other. While this looks better compared with underdeveloped States such as the
BIMARU States, nevertheless it is an indicator of the low State of women�s health in a land of plenty.
An age-wise analysis reveals that the highest percentage of women suffering from any anaemia
fall in the age category of 20-24 years, which it will be remembered is also the group with the highest
TFR. While the prevalence of anaemia in the other age groups is lower, yet it is only marginally so.
The lowest percentage of anaemic women (42.3 %) fall in the 30-34 age group.
A more detailed analysis reveals that a higher percentage of married women suffer from anaemia
as against unmarried women; more rural women as compared to urban women and illiterate women
as compared to literate women. In the last category another paradox becomes evident in that while
the percentage of middle school pass women suffering from anaemia is 39.3 per cent, 42.6% of the
high school and above educated women suffer from anaemia.
Also noteworthy is the fact that a higher percentage of women working in the family farm/
business and those who have not worked in the past 12 months suffer from anaemia (48.3% and
48.0% respectively) as against a much lower percent of those women who work for somebody else
(37.3). Another paradoxical feature emerges from a religion-wise analysis. It would be seen that the
prevalence of any anaemia is highest among Muslim women. Yet when it comes to severe anaemia,
it is the Sikh women who are the worse affected.
Significantly as many as 55.5 per cent of the pregnant women are suffering from anaemia which
adversely impacts the MMR. These facts require a more detailed analysis and must weigh during
policy-making.

(41)
Table 4.3
Anaemia Among Wwomen
Percentage of ever married women classified as having iron-deficiency anaemia by degree of
anaemia, according to selected background characteristics, Haryana, 1998-99.
Background Percentage of Percentage of women with
characteristic Women with Mild Moderate Severe Number
any anaemia anaemia anaemia anaemia of women
Age
15-19 49.8 26.9 21.8 1.1 168
20-24 53.5 29.0 22.6 1.8 487
25-29 49.1 31.9 14.9 2.3 575
30-34 42.3 29.9 11.6 0.7 521
35-39 44.6 32.4 10.6 1.6 984
Martial Status
Currently married 47.2 30.9 14.7 1.6 2639
Not Currently
Married 40.0 29.7 10.3 0.0 96
Residence
Urban 45.8 34.1 10.4 1.3 787
Rural 47.5 29.6 16.2 1.7 1948
Education
Illiterate 49.7 32.6 15.3 1.8 1503
Literate, <Middle School Complete 47.1 28.3 16.9 1.9 457
Middle School Complete 39.3 25.9 12.2 1.3 230
High School Complete And above 42.6 30.6 11.3 0.7 545
Religion
Hindu 46.6 30.8 14.4 1.4 2433
Muslim 56.4 36.9 18.6 1.9 111
Sikh 46.7 29.0 12.9 4.8 183
Caste/tribe
Scheduled Caste 52.5 33.1 17.1 2.3 558
Other Backward Class 41.9 27.0 13.1 1.8 597
Other 47.0 31.6 14.1 1.2 1578

(42)
Background Percentage of Percentage of women with
characteristic Women with Mild Moderate Severe Number
any anaemia anaemia anaemia anaemia of women
Work Status
Working in Family Farm/business 48.3 32.9 13.3 2.1 89
Employed by Someone else 37.3 28.9 8.0 0.4 234
Not worked In past 12 months 48.0 31.0 15.3 1.7 2391
Standard of Living Index
Low 53.5 37.0 14.3 2.2 267
Medium 48.5 30.0 16.7 1.7 1250
High 43.9 30.3 12.3 1.3 1203
Pregnancy/Breastfeeding status
Pregnant 55.5 20.6 33.1 1.8 174
Breastfeeding (not pregnant) 56.1 33.3 20.3 2.5 649
Not pregnant/not breast feeding 43.1 31.0 10.8 1.3 1912
Height
< 145 cm 57.1 37.8 16.9 2.4 127
< 145 cm 46.5 30.6 14.4 1.5 2607
Source: NFHS-II, Haryana
Children�s Health
Related to the issue of mother�s health is that of the child, particularly the girl child, for
malnourishment in early years, adversely impacts the cognitive development and learning achievements
as well as enhancing mortality and morbidity. The all-India rate of anaemia among children is quite
high at 74.3 per cent. However, Haryana surpasses this all-India average and achieves a dubious
distinction of being the bread basket of the nation and having the highest percentage of children
suffering from any anaemia. Having a total of 83.9 percent of its children suffering from any anaemia,
Haryana stands out as a State of penury amidst plenty. Even States like Rajasthan and Bihar have a
lower percentage of children suffering from any anaemia. It is equally noteworthy that 7.1 percent of
the children suffer from severe anaemia. Only Rajasthan (9.5) and Karnataka (7.6% ) report a higher
level of severe anaemia among children.
Although, it seems ironical, a gender disaggregated analysis reveals a slight positive side to this
appalling picture. A lower percentage of female children (81.0) suffer from any anaemia as compared
to male children(86.3). This conclusion holds true for all three forms of anaemia, whether mild,
moderate or severe.

(43)
Table 4.4
Anaemia Among Children
Percentage of children age 6-35 months classified as having iron-deficiency anaemia by
selected background characteristics, Haryana, 1998-99
Back Ground Percentage Percentage of children with Number of
characteristic Of children Mild Moderate Severe Children
With any Anaemia anaemia anaemia
anaemia
Age of child
6-11 months 73.9 26.4 43.8 3.7 130
12-23 months 86.8 13.9 65.2 7.7 3.9
24-35 months 85.3 18.6 58.7 8.0 298
Sex of child
Male 86.3 18.1 59.9 8.3 407
Female 81.0 17.9 57.4 5.7 330
Source: NFHS-II, Haryana
However, notwithstanding this slightly positive development so far as the girl child is concerned,
she is again given short shrift in childhood vaccinations. A look at the table below reveals that the girl
child is less likely to have received childhood vaccinations as against the boy child.
Table 4.5
Childhood Vaccinations By Background Characteristics
Percentage of children age 12-23 months who received specific vaccinations at any time before the
interview (according to the vaccination card or the mother) and percentage with a vaccination card
that was shown to the interviewer by selected background characteristics, Haryana, 1998-99.
DPT Polio
Back BGC Polio 1 2 3 1 2 3 Measles All None Percentage Number of
Ground Showing children
Chract- Vaccination
eristic card
Sex of
Child
Male 87.6 7.2 90.3 86.0 71.6 90.8 98.7 75.3 71.5 62.4 9.2 26.2 186
Female 85.9 4.8 88.6 82.6 70.5 89.2 84.5 73.1 73.2 63.2 10.8 22.2 149

(44)
Maternal Health
One of the most drastic consequences of high level of anaemia is a high maternal mortality rate
(MMR). The number of maternal deaths in the age group 15-49 year per 100,000 live births in India
stands at a high 407 in 1998. Hence the need to stress on safe motherhood which can be assessed
through various indicators such as proportion of women receiving antenatal, delivery and postnatal
care. At the all �India level, only about 20 per cent of the women receive three or more antenatal
checkups, two or more tetanus toxoid injections and iron and folic acid tablets. Even in this low
percentage there is substantial inter-State variation with developed States like Kerala and Goa reporting
a high level of maternal care, and BIMARU and other less developed States reporting a very low level
of such care. This factor is further compounded by the fact of a very low percentage of women all
over India, who have deliveries in an institutional setting and from a trained, competent person.
According to NFHS-II statistics, only 33.6 per cent of births in India take place in an institutional
setting, and 42.3 per cent deliveries are assisted by a health professional.
Haryana, here, presents an extremely paradoxical picture. As compared to the all-India average
and many States including Punjab, Haryana had a lower MMR of 103 in 1998. However, in the
maternal health indicators, as the table below reveals Haryana stands at a relatively low place amongst
15 major States of India. According to the NSS 52nd Round, Haryana ranks at 11th place for women
registered with a health institution among these 15 States, at 10th place for two doses of TT, at 11th
place for Iron and Folic Acid tablets, at 9th place for delivery in Institutions and again at 11th place
of post natal care.
Table 4.6
Some Maternal Health Indicators of 15 Major States
State Pre-natal Natal Care Post-natal
Care Care
Number Number received Iron and Folic Delivery in Health Number
registered per per 1000 Acid Tablets Institutions Per Registered
1000 pregnant pregnant women 1000 deliveries per 1000
women Two doses of mothers
Tetanus Toxoid
Andhra Pradesh 772(3) 546(5) 670(3) 365(5) 416(5)
Assam 650(6) 377(11) 615(7) 135(12) 366(6)
Bihar 99(15) 231(15) 125(15) 95(15) 74(15)
Gujarat 644(7) 474(8) 629(6) 332(6) 419(4)
Haryana 421(11) 441(10) 416(11) 202(9) 251(11)
Karnataka 721(5) 531(6) 646(5) 458(4) 364(7)

(45)
State Pre-natal Natal Care Post-natal
Care Care
Number Number received Iron and Folic Delivery in Health Number
registered per per 1000 Acid Tablets Institutions Per Registered
1000 pregnant pregnant women 1000 deliveries per 1000
women Two doses of mothers
Tetanus Toxoid
Kerala 874(1) 644(1) 783(1) 924(1) 495(3)
Madhya Pradesh 417(12) 270(12) 399(12) 164(10) 304(8)
Maharashtra 734(4) 490(7) 665(4) 462(3) 518(2)
Orissa 489(10) 453(9) 520(9) 131(13) 277(9)
Punjab 585(9) 586(3) 502(10) 242(8) 268(10)
Rajasthan 270(13) 234(14) 289(13) 147(11) 120(14)
Tamil Nadu 828(2) 600(2) 743(2) 718(2) 554(1)
Uttar Pradesh 192(4) 246(13) 177(14) 106(14) 141(13)
West Bengal 637(8) 580(4) 573(14) 312(7) 246(12)
All India 455 381 424 254 271
Source: Sarvekshana, Vol. XXIII, No. 3, Jan-March, 2000, Issue No. 82, NSS 52nd Round, July 1995-
June 1996.
Table 4.7 below reveals that 79.7 percent of the women received two or more tetanus toxoid
vaccinations during pregnancy, while 5.4 per cent received only one TT vaccination. 67 per cent of the
women received iron and folic acid tablets. Of these 79.6 percent received three months supply and
88.3 per cent consumed all the supply.

(46)
Table 4.7
Tetanus Toxoid Vaccination And Iron And Folic Acid Tablets Or Syrup
Percent distribution of birth during the three years preceding the survey by the number of tetanus
toxoid injections received by the mother, percentage of births for which the mothers were given iron
and folic acid (IFA) tablets or syrup during the pregnancy and among those who received iron and folic
acid tablets or syrup, percentage who received enough for these months or longer and percentage who
consumed all the supply given, according to selected background characteristics, Haryana, 1998-99.
Back Ground No. of Tetanus Toxoid injections Percentage No. of Percentage Percentage Number of
Charactteristic None One Two Total given births Who Who births
Or Percentage iron and Received consumed whose
more folic acid Supply all the mothers
tablets for 3 + supply received
or syrup Months IFA
Mother Age at Birth
< 20 12.1 7.8 80.1 100.0 71.4 205 74.1 85.7 146
20-34 15.0 4.8 80.1 100.0 66.6 825 81.0 88.7 550
35-49 (33.2) (3.5) (63.3) 100.0 (46.4) 30 * * 14
Birth order
1 9.3 3.3 87.4 100.0 74.1 308 79.1 85.1 228
2-3 12.5 6.1 81.4 100.0 70.7 489 83.6 89.2 346
4-5 24.4 6.6 69.0 100.0 52.5 184 74.9 94.8 96
6* 30.0 6.3 63.7 100.0 49.8 80 (59.9) (82.5) 40
Residence
Urban 8.2 4.9 86.9 100.0 74.3 246 87.1 92.3 183
Rural 17.0 5.5 77.5 100.0 64.8 814 77.0 86.9 527
Mother Education
Illiterate 23.3 5.4 71.3 100.0 56.2 540 72.9 88.8 303
Literate, <Middle
School Complete 9.6 7.8 82.6 100.0 67.6 206 75.0 88.5 139
Middle School
Complete 7.2 4.2 88.5 100.0 76.9 95 86.3 86.2 73
High School
Complete And above 2.7 3.6 93.6 100.0 88.6 219 90.9 88.2 194
Religion
Hindu 13.7 5.2 81.1 10.0 69.4 913 79.7 88.0 634

(47)
Back Ground No. of Tetanus Toxoid injections Percentage No. of Percentage Percentage Number of
Charactteristic None One Two Total given births Who Who births
Or Percentage iron and Received consumed whose
more folic acid Supply all the mothers
tablets for 3 + supply received
or syrup Months IFA
Muslim 35.9 8.3 55.8 100.0 37.7 73 (77.8) (88.7) 27
Sikh 10.1 5.8 84.2 100.0 65.1 69 (78.1) (93.5) 45
Caste/tribe
Scheduled Caste 17.5 3.7 78.8 100.0 61.1 268 77.5 90.2 164
Other Backward
Class 16.8 7.1 76.1 100.0 65.5 257 77.9 86.8 168
Other 12.6 5.4 82.0 100.0 70.7 535 81.3 88.1 378
Standard of living
Index
Low 26.8 7.9 65.3 100.0 44.1 138 70.2 90.1 61
Medium 17.7 6.0 76.3 100.0 64.1 531 74.3 88.5 340
High 6.7 3.4 89.9 100.0 79.2 385 87.5 88.2 305
Total 15.0 5.4 79.7 100.0 67.0 1060 79.6 88.3 710
Note Table includes only the two most recent births during the three years preceding the survey. Total
includes a small number of births to mothers belonging to other religions, scheduled-tribe mothers, and
births with missing information on religion and the standard of living index, which are not shown
separately.
( ) Based on 25-49 unweighted cases.
● Percentage not shown; based on fewer than 25 unweighted cases.
1 Among births whose mothers received iron and toxic acid tablets or syrup.
2 Not belonging to a scheduled caste, a scheduled tribe, or an other backward class
Source: NFHS-II, Haryana
Furthermore, 22.4 per cent of births are delivered in a medical institution and 42 per cent of
deliveries assisted by a health professional. At the all-India level, 16.5 per cent of women going in for
non-institutional deliveries go for a medical check-up within two months after child birth and only 2.3
per cent within two days. Haryana has an even lower rate of 15.7 per cent of non-institutional
deliveries with a post partum checkup within two months of birth and only 2.5 per cent within two days
of childbirth.
Women may experience any number of problems during pregnancy. The table below reveals the
problems most commonly reported during pregnancy. These are excessive fatigue (38.7 %); anaemia
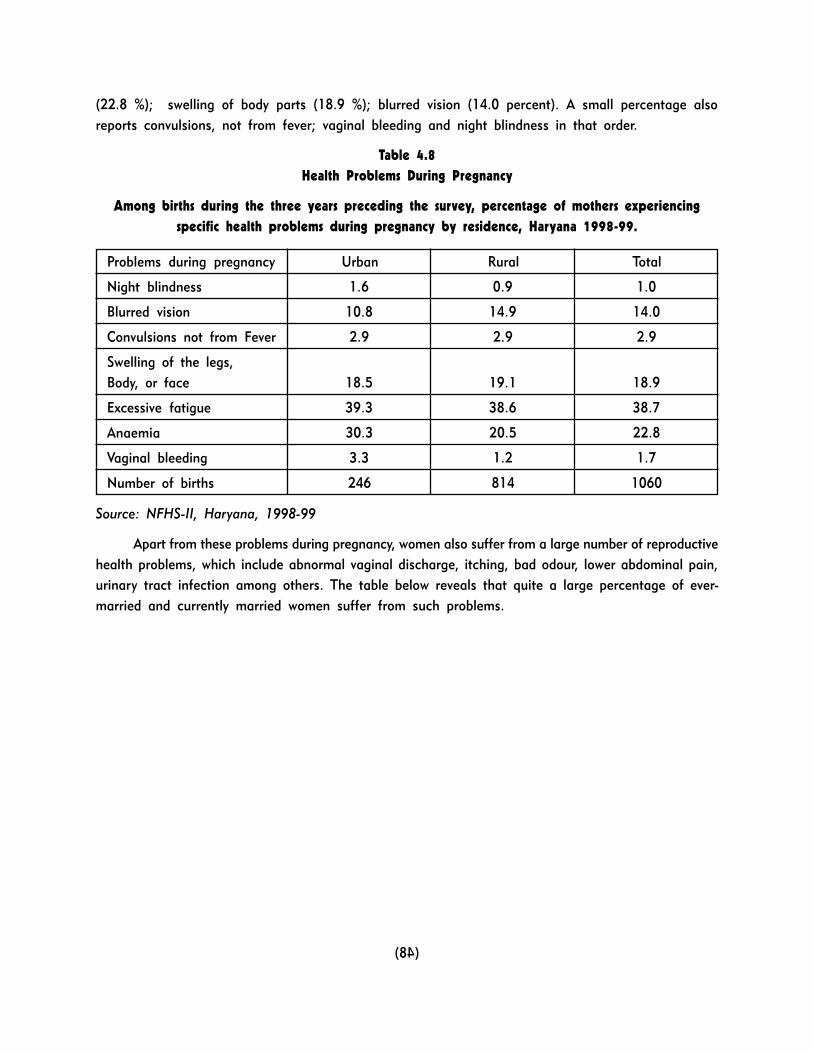
(48)
(22.8 %); swelling of body parts (18.9 %); blurred vision (14.0 percent). A small percentage also
reports convulsions, not from fever; vaginal bleeding and night blindness in that order.
Table 4.8
Health Problems During Pregnancy
Among births during the three years preceding the survey, percentage of mothers experiencing
specific health problems during pregnancy by residence, Haryana 1998-99.
Problems during pregnancy Urban Rural Total
Night blindness 1.6 0.9 1.0
Blurred vision 10.8 14.9 14.0
Convulsions not from Fever 2.9 2.9 2.9
Swelling of the legs,
Body, or face 18.5 19.1 18.9
Excessive fatigue 39.3 38.6 38.7
Anaemia 30.3 20.5 22.8
Vaginal bleeding 3.3 1.2 1.7
Number of births 246 814 1060
Source: NFHS-II, Haryana, 1998-99
Apart from these problems during pregnancy, women also suffer from a large number of reproductive
health problems, which include abnormal vaginal discharge, itching, bad odour, lower abdominal pain,
urinary tract infection among others. The table below reveals that quite a large percentage of ever-
married and currently married women suffer from such problems.

(49)
Table 4.9
Symptoms Of Reproductive Health Problems
Percentage of ever-married women reporting abnormal vaginal discharge or symptoms of a urinary
tract infection during the three months preceding the survey and percentage of currently married
women reporting painful intercourse or bleeding after intercourse by background characteristics,
Haryana 1998-99
Vaginal Discharge Accompanied by Currently
Married Women
Back Ground Any Itching Bad Severe fever Other Symptoms Any No of Pain Bleeding Any No of
Characteristic Abnormal Or odour Lower Problem of a Abnormal Ever Inter After Reprod- Currently
Vaginal irritation Abdome UTI Vaginal Married Course Inter uctive Married
Discharge Nt pain Discharge Women (Often) Course Health women
or UTI (ever) problem
Standard of
Living Index
Low 33.0 25.1 20.9 20.7 5.0 9.3 15.1 36.3 280 8.7 0.4 39.9 265
Medium 32.7 26.1 21.3 17.1 2.7 6.8 12.7 36.6 1331 7.1 1.1 39.2 1272
High 30.0 22.9 17.9 16.6 2.0 7.0 11.5 33.4 1279 9.5 1.0 36.8 1245
Work Status
Work In Family]
Farm/Business 40.7 31.5 21.3 20.3 3.2 11.2 16.3 43.8 97 3.4 0.0 45.9 86
Employed by
Someone else 35.6 28.6 21.8 22.7 4.1 12.1 15.4 37.6 247 7.9 1.3 40.7 228
Not Work in past
12 months 30.7 23.8 19.4 16.5 2.5 6.4 12.0 34.5 2542 8.5 1.0 37.6 2467
No of Child Ever
Born
0 24.5 18.2 14.5 15.9 3.2 3.7 9.0 26.7 221 19.6 3.2 36.0 219
1 23.1 17.4 14.3 12.5 0.6 5.7 12.6 28.6 350 9.4 0.9 33.0 339
2-3 32.0 26.4 20.8 18.4 2.7 8.2 12.3 36.4 1348 6.8 0.8 38.5 1300
4-5 36.9 27.6 22.6 19.2 3.5 7.8 13.4 40.3 682 8.9 0.9 42.7 652
6+ 27.4 23.1 18.6 14.7 2.6 5.2 13.7 32.6 306 4.1 0.3 24.7 288
All ever-Married
Women 31.6 24.6 19.7 17.3 2.7 7.1 12.5 35.2 2908 NA NA NA NA
All Currently
Married Women 32.2 25.0 20.1 17.6 2.7 7.1 12.6 35.9 2799 8.3 1.0 38.2 2799
Source: NFHS-II, Haryana

(50)
However, the general aversion to seeking medical advice is very much visible in this aspect. Even
when they do seek medical advice, more often than not it is a private doctor or even a nurse. The table
below reveals that 36.9 per cent of the women seek medical help from the private medical sector, while
12.2 percent seek help from the public medical sector. An areawise analysis reveals that almost
double the number of urban women take medical advice for reproductive health problems as compared
to rural women.
Table 4.10
Treatment Of Reproduction Health Problems
Among women with a reproductive health problem, percentage who sought advice or treatment
from specific providers by residence, Haryana 1998-99
Provider Urban Rural Total
Public Medical Sector 14.5 11.4 12.2
Government Doctor 10.9 7.4 8.3
Public Health nurse 0.4 0.2 0.3
ANM/LHV 3.3 3.7 3.6
Male MPW/Supervisor 0.0 0.1 0.1
Aganwadi Worker 0.0 0.1 0.1
Village Health guide 0.0 0.1 0.1
Private Medical sector 51.7 31.7 36.9
Private sector 42.7 24.8 29.4
Private Nurse 5.1 4.4 4.6
Vaidya/Hakim/homeopath 2.5 2.5 2.5
Dai (TBA) 2.6 1.5 1.8
Traditional Healer 0.0 0.1 0.1
Other Private Medical Sector 0.0 0.1 0.1
Other 0.0 0.1 0.1
None 39.6 61.3 55.7
No of women 281 809 1089
Source: NFHS-II, Haryana
Health Infrastructure
Haryana has a network of 50 Government Hospitals, 64 Community Health Centres, 404 Primary
Health Centres, 2299 Sub Centres, 12 District Tuberculosis Centres, 39 Dispensaries, 14 Mobile
Dispensaries and 2 Mobile Dental Dispensaries.1 In addition there is a Post Graduate Institution of

(51)
Medical Education and Research Centre at Rohtak and a Medical College at Agroha, Hissar. According
to the Economic Survey of Haryana, 2003-04, the per capita expenditure on health for this year is Rs
184.57.
In conclusion, it would be apt to say that while significant improvement has been made in the
status of women�s health, Haryana still lags behind in a number of indicators. In these it�s health
record is more in line with the less developed States as compared to the more developed States and
in sharp contrast to its status as one of the economically more developed States in India. Poverty
definitely is not the reason. Education could be one such reason, but Haryana shows comparatively
a better status in women�s education. Hence, it must be emphasised that in order to improve the
health status of women in Haryana, awareness campaigns have to be accompanied by a pro-active role
of the Government and NGOs in the field. In policy making in this field women�s multiple roles must
be kept in the foreground; only then can any health policy actually impact women�s health.
1 Economic Survey of Haryana, 2003-04, web1.hry.nic.in

(53)
CHAPTER - V
WORK
Discrimination in all other spheres of life is reinforced by economic deprivation , which is the
general lot of women. This, in turn, perpetuates their low status, which leads to further discrimination
resulting in a vicious circle which is difficult to break. The Human Development Report of South Asia,
2000 reports that �Some degree of statistical invisibility of women in the economy is a worldwide
phenomenon, but in South Asia it is particularly pervasive because of historical, traditional and cultural
reasons.�1
The same report citing a study by Jain and Chand (1982) ,observes, �In India, women reported
as non-workers in the Census were found to be spending up to 4 hours a day in activities such as
groundnut picking and sowing the fields or spending time grazing cattle and cutting grass, threshing
and parboiling, or working as domestic servants for as many as 8-10 hours a day.�2 The same Report
also cites another study, which reveals that in one village in India where the 1971 Census had counted
only 38 women workers, there were a total of 239 workers and 444 women workers in another village
where the Census had reported only 9.3 This fact was emphatically emphasised in Shramshakti,
�Although women work for longer hours and contribute substantially to the family income, they are not
perceived as workers by either the women themselves or the data collecting agencies and the Government
as all of them do not recognize the multidimensional functions of women which include their productive
and reproductive labour. Women quite often are the major earners for their families. This also goes
unrecognized.�4
Such statistical invisibility of women in the workforce is particularly pervasive in the Indian States
of Punjab and Haryana; women are reduced to economic non-entities. This is the result not of women�s
non-work, but of gender blindness in data collection which results in under-enumeration of women�s
work.
Thus, reliable and comprehensive information about women�s workforce participation rate is
almost non-existent. However, the Census of India has attempted to integrate gender into the accounting
of work. The statistics presented by the Census remain the major source of information on women�s
work, yet a number of gaps remain and studies continue to reveal the statistical invisibility of women
1 Human Development in South Asia, Mahbub ul Haq Human Development Centre, OUP, Karachi, 2000, p. 522 Ibid, p. 543 Ibid, p. 544 Shramshakti, p. 7
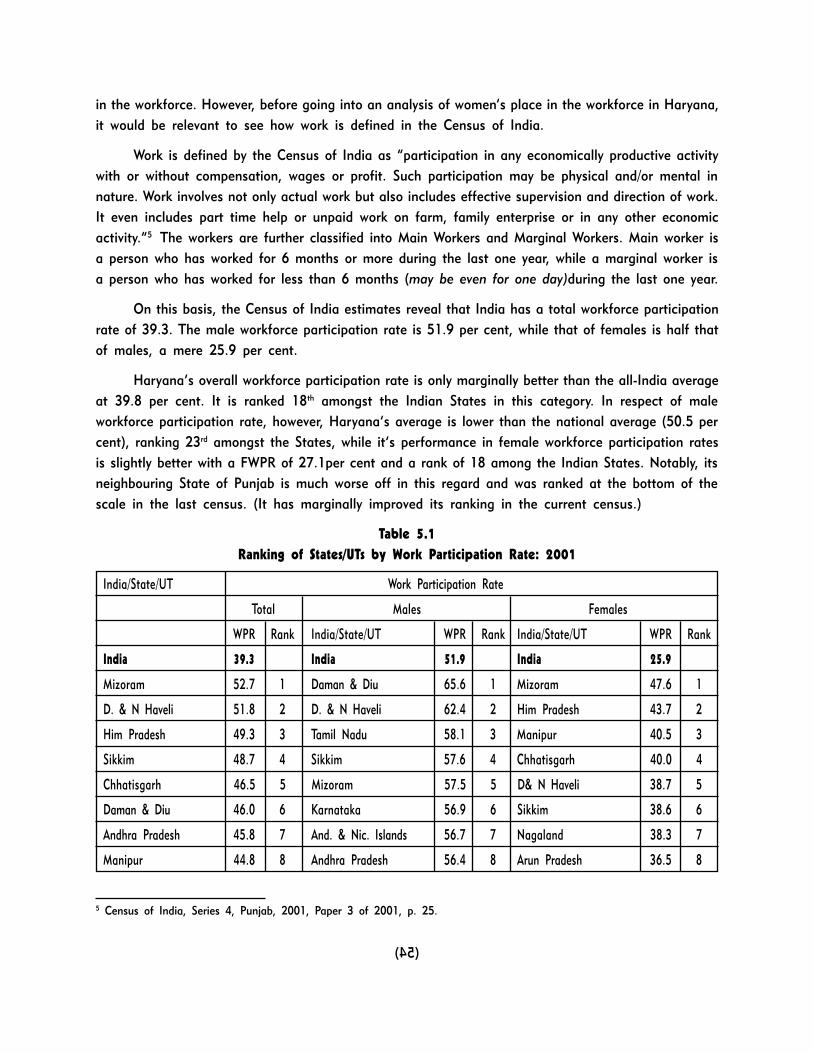
(54)
in the workforce. However, before going into an analysis of women�s place in the workforce in Haryana,
it would be relevant to see how work is defined in the Census of India.
Work is defined by the Census of India as �participation in any economically productive activity
with or without compensation, wages or profit. Such participation may be physical and/or mental in
nature. Work involves not only actual work but also includes effective supervision and direction of work.
It even includes part time help or unpaid work on farm, family enterprise or in any other economic
activity.�5 The workers are further classified into Main Workers and Marginal Workers. Main worker is
a person who has worked for 6 months or more during the last one year, while a marginal worker is
a person who has worked for less than 6 months (may be even for one day)during the last one year.
On this basis, the Census of India estimates reveal that India has a total workforce participation
rate of 39.3. The male workforce participation rate is 51.9 per cent, while that of females is half that
of males, a mere 25.9 per cent.
Haryana�s overall workforce participation rate is only marginally better than the all-India average
at 39.8 per cent. It is ranked 18th amongst the Indian States in this category. In respect of male
workforce participation rate, however, Haryana�s average is lower than the national average (50.5 per
cent), ranking 23rd amongst the States, while it�s performance in female workforce participation rates
is slightly better with a FWPR of 27.1per cent and a rank of 18 among the Indian States. Notably, its
neighbouring State of Punjab is much worse off in this regard and was ranked at the bottom of the
scale in the last census. (It has marginally improved its ranking in the current census.)
Table 5.1
Ranking of States/UTs by Work Participation Rate: 2001
India/State/UT Work Participation Rate
Total Males Females
WPR Rank India/State/UT WPR Rank India/State/UT WPR Rank
India 39.3 India 51.9 India 25.9
Mizoram 52.7 1 Daman & Diu 65.6 1 Mizoram 47.6 1
D. & N Haveli 51.8 2 D. & N Haveli 62.4 2 Him Pradesh 43.7 2
Him Pradesh 49.3 3 Tamil Nadu 58.1 3 Manipur 40.5 3
Sikkim 48.7 4 Sikkim 57.6 4 Chhatisgarh 40.0 4
Chhatisgarh 46.5 5 Mizoram 57.5 5 D& N Haveli 38.7 5
Daman & Diu 46.0 6 Karnataka 56.9 6 Sikkim 38.6 6
Andhra Pradesh 45.8 7 And. & Nic. Islands 56.7 7 Nagaland 38.3 7
Manipur 44.8 8 Andhra Pradesh 56.4 8 Arun Pradesh 36.5 8
5 Census of India, Series 4, Punjab, 2001, Paper 3 of 2001, p. 25.

(55)
India/State/UT Work Participation Rate
Total Males Females
WPR Rank India/State/UT WPR Rank India/State/UT WPR Rank
Tamil Nadu 44.8 9 Chandigarh 56.1 9 Meghalaya 35.0 9
Karnataka 44.6 10 Gujarat 55.0 10 Andhra Pradesh 34.9 10
Arun Pradesh 44.0 11 Goa 54.9 11 Rajasthan 33.5 11
Maharashtra 43.5 12 Himachal Pradesh 54.7 12 Madhya Pradesh 33.1 12
Madhya Pradesh 42.7 13 West Bengal 54.2 13 Maharashtra 32.6 13
Nagaland 42.7 14 Punjab 54.1 14 Karnataka 31.9 14
Rajasthan 42.1 15 Maharashtra 53.5 15 Tamil Nadu 31.3 15
Gurjarat 42.1 16 Pondicherry 53.3 16 Gujarat 28.0 16
Meghalaya 41.5 17 Chattisgarh 53.0 17 Haryana 27.3 17
Haryana 39.8 18 Orissa 52.8 18 Uttaranchal 27.1 18
Orissa 38.9 19 Delhi 52.2 19 Jharkahand 26.4 19
Goa 38.9 20 Madhya Pradesh 51.6 20 Orissa 24.6 20
And. & Nic. Islands 38.3 21 Tripura 50.8 21 Goa 22.2 21
Jharkand 37.6 22 Arunachal Pradesh 50.7 22 J & K 22.0 22
Chandigarh 37.6 23 Haryana 50.5 23 Tripura 21.0 23
Punjab 37.6 24 Kerala 50.4 24 Assam 20.8 24
Uttaranchal 36.9 25 Rajasthan 50.1 25 Bihar 18.8 25
West Bengal 36.8 26 Assam 49.9 26 Punjab 18.7 26
J&K 36.6 27 J & K 49.8 27 Daman & Diu 18.3 27
Tripura 36.3 28 Manipur 48.9 28 West Bengal 18.1 28
Assam 35.9 29 Jharkhand 48.2 29 Pondicherry 17.4 29
Pndicherry 35.1 30 Meghalaya 47.8 30 And. & Nic. Islands 16.4 30
Bihar 33.9 31 Bihar 47.7 31 Uttar Pradesh 16.3 31
Delhi 32.8 32 Uttar Pradesh 47.3 32 Kerala 15.3 32
Uttar Pradesh 32.6 33 Nagaland 46.8 33 Chandigarh 13.7 33
Kerala 32.3 34 Uttaranchal 46.4 34 Delhi 9.1 34
Lakshadweep 25.3 35 Lakshadweep 42.5 35 Lakshadweep 7.2 35
Source: Census of India, 2001
A look at Table 5.2 below, however reveals another reality to this picture. Of the total 39.76 per
cent workers, main workers constitute 29.62 per cent and marginal workers 10.14 per cent. Amongst

(56)
the males too, main workers constitute a high proportion of the total male workers, at 43.63 per cent,
while marginal workers are merely 6.86 per cent. In contrast amongst the females, marginal workers
constitute 13.94 % of the total female workers,, while main workers are merely 13.37 per cent. This,
in itself is illustrative of the fact that women are concentrated in the unorganized sector, which is not
governed by labour laws. Apart from this, statistics report a whopping 72 per cent of the women as
non-workers.
Table 5.2
Workers And Non-Workers In Haryana, 2001
Total Workers Main Workers Marginal Workers Non-Workers
(%) (%) (%) (%)
Persons 39.76 29.62 10.14 60.24
Males 50.49 43.63 6.86 49.51
Females 27.31 13.37 13.94 72.69
Source: Census of India, Series 7 Haryana, 2001
It is also noteworthy that women constitute the preponderant labour force amongst cultivators,
agricultural labourers and workers in the household industry, while males are a significant majority
amongst other workers. As Preet Rustagi observes, �Most of these primary sector activities offer
Workers and Non-Workers in Haryana
0
10
20
30
40
50
60
70
80
Total Workers(%) Main Workers (%) Marginal Workers (%) Non-Workers (%)
Category of Workers
Perc
enta
ge
Persons Males Females

(57)
subsistence employment and are either low paid or unpaid activities.�6 Furthermore, the predominant
involvement of women in home-based activities results in lack of social security, low wages and poor
working conditions.
Table 5.3
Category Of Workers (Main and Marginal)
Cultivators Agricultural Workers in Other worker
Labourers Household Industry
Persons 36.34 15.22 2.47 45.97
Males 32.76 12.46 2.19 52.59
Females 44.02 21.16 3.06 31.76
Source: Census of India, 2001, Series 7, Haryana
A districtwise and gender segregated analysis reveals Panchkula to be at number one position
in male work participation rates with 54.78 percent of its males engaged in productive work. Gurgaon
is at the bottom of the scale, notwithstanding its location relative to the capital of the country, Delhi.
Moreover, while Panchkula has maintained its number one position from the 1991 census, Gurgaon has
actually declined in ranking from 15th to 19th place. Hisar, Jind and Jhajjar reveal a considerable
6 Preet Rustagi, Gender Biases and Discrimination against Women : What Do Different Indicators Say?, UNIFEM, New Delhi, 2003,p. 52
Category-wise Distribution of workers
0
10
20
30
40
50
60
Cultivators Agricultural Labourers Workers in Household
Industry
Other worker
Category of workers
Perc
enta
ge
Persons Males Females

(58)
variation in ranking over the 1991 census from 10th, 11th and 16th place to 4th, 5th and 6th place
respectively.
Paradoxically, in respect of female work participation rates (FWPR), Panchkula is at the bottom
of the scale at 17th rank. It is Mahendragarh (38.23) followed by Rewari (36.81), which move to the
top of the scale. Ambala reveals the lowest female workforce participation rate in the region with just
9.96 percent of its women included in the workforce. Although an improvement over the 3.53 per cent
FWPR reported in the last census, it is the only district in the State, which has not entered the double
digits for FWPR, inspite of the expansion of the definition of work in the Census enumeration. Thus,
it has shown the least improvement in FWPR over the last census while Rewari has shown the most
(25.20 per cent).
The statistical invisibility of women in the workforce in Haryana is tellingly illustrated by a study
conducted by Savita Singal of the Haryana Agricultural University. She concludes:
1. Analysis of women�s work pattern on farm and dairy revealed that women played a key role (as
unpaid workers) in dairy as well as agricultural production. There is a need for re-defining the
concept of �worker� and giving a monetary status for these activities. These should also be
reflected in Gross National Product.
2. Women were actively found sharing livestock and farm work while men�s sharing of housework
(including childcare) was totally absent. Even among children, only female children were extending
a helping hand, which could be at the cost of their schooling. There is a need, for changing the
traditional attitude of men and awakening in them a more progressive outlook towards sharing
of housework for overall benefit of the family.
3. Analysis of rural women�s work, especially kitchen activities, showed that they were increasing
the drudgery of the household work because of lack of elementary knowledge of work simplification
techniques. The method adopted by them for doing the work involved more costs in terms of
time and energy. Non-formal education emphasizing work simplification, time and energy management
can considerably reduce the physical costs of work, thereby releasing more time and energy for
economically productive activities. In this respect, specialists in Family Resource Management
discipline can contribute a lot through their extension division.
4. Analysis of work place also presented another disquieting picture. Kitchen work, was performed
in most un-conducive environment, lacking all basic facilities at the place of work. The work
centre concept in the arrangement of simple tools, storage and cooking stove was found to be
absent. The use of dustbin, placement of water for cooking near the preparation centre etc.
which can save unnecessary energy consuming efforts was found totally lacking. Education
programs on such areas can be incorporated in rural programs transmitted through radio and
television.
5. The study revealed that the entire dairy management is done by women. Surprisingly when it
comes to training programs, it is offered to be men, which reflects poor manpower planning.

(59)
This needs due attention of the organizers of such training programs. Whenever training is given,
women should be identified as special target group along with or without the males.
Table 5.4
Ranking Of Districts By Male Work Participation Rate : 1991-2001
Rank State/District Work 1991 Net gain Rank in Rank in
in 2001 Participation 1991-201 1991 respect of
2001 gain
HARYANA 50.49 48.51 1.98 � �
1 Panchkula 54.78 52.78 2.00 1 9
2 Fatehabad 54.62 52.33 2.29 3 7
3 Sirsa 53.23 52.76 0.47 2 16
4 Hisar 52.07 49.28 2.79 10 6
5 Jind 51.79 48.93 2.86 11 5
6 Jhajjar 51.61 45.43 6.18 16 2
7 Kurukshetra 51.40 50.25 1.15 5 13
8 Panipat 51.33 49.52 1.81 9 10
9 Ambala 51.17 50.01 1.16 7 12
10 Kaithal 51.06 50.50 0.56 4 15
11 Karnal 50.40 49.75 0.65 8 14
12 Yamunanagar 50.34 50.08 0.26 6 19
13 Rewari 49.86 42.73 7.13 19 1
14 Sonipat 49.79 48.00 1.79 13 11
15 Rohtak 49.56 47.36 2.20 14 8
16 Bhiwani 49.38 45.37 4.01 17 3
17 Faridabad 48.45 48.07 0.38 12 18
18 Mahendragarh 48.08 44.76 3.32 18 4
19 Gurgaon 46.99 46.52 0.47 15 17
Source: Census of India, 2001, Series 7, Haryana

(60)
Table 5.5
Ranking of Districts by Female Work Participation Rate: 1991-2001
Rank State/District Work Participation Rate Net Gain/Loss Rank in
in 2001 2001 1991 1991-2001 1991
Haryana 27.31 10.76 16.55 -
1. Mahendragarh 38.23 15.90 22.33 2
2. Rewari 36.81 11.61 25.20 9
3. Jhajjar 35.78 13.97 21.81 5
4. Bhiwani 35.40 17.42 17.98 1
5. Jind 34.77 12.81 21.96 8
6. Fatehabad 34.32 9.58 24.74 11
7. Hisar 33.17 14.44 18.73 4
8. Sirsa 30.59 13.75 16.84 6
9. Sonepat 30.40 12.98 17.42 7
10. Gurgaon 27.79 15.46 12.33 3
11. Rohtak 27.71 10.42 17.29 10
12. Kaithal 25.73 8.74 16.99 13
13. Panipat 25.73 7.43 18.30 14
14. Faridabad 21.91 8.91 13.00 12
15. Kurukshetra 21.31 3.99 17.32 17
16. Karnal 18.90 5.84 13.06 16
17. Panchkula 17.92 6.14 11.78 15
18. Yamunanagar 11.38 2.75 8.63 19
19. Ambala 9.96 3.53 6.43 18
Source: Census of India, Series 7, Haryana, 2001
Female Literacy, Sex Ratio and Female Work Participation Rate
It would also be relevant to examine the inter-linkage of work participation with literacy rates.
Table 5.6 below reveals a very intriguing picture. The district with the highest level of female literacy,
viz. Panchkula is 17th in female workforce participation rate. Ambala, which has the second highest
female literacy in the State, has the lowest female work force participation rate. As against this
Fatehabad, which has the lowest female literacy rate in the State, ranks 6th in FWPR and Mahendragarh,
which is ranked 12th in terms of female literacy rate, is at the top in FWPR. The probable inference,
which can be drawn from such statistics is that women are employed more in the informal and

(61)
unorganised sector which has little or no need for literacy. Hence, the contradiction in the general
assumption of education leading to economic empowerment of women.
Are the economic activity correlations with sex ratio any more positive? On the face of it this
would seem to hold true for Panchkula, last in sex ratio is almost at the bottom in terms of FWPR;
Rewari, second in sex ratio is second in FWPR and Mahendragarh, at the top in sex ratio is also first
in FWPR. But then there are districts such as Ambala which is 19th in FWPR and 7th in terms of sex
ratio, while Jhajjar is 3rd in FWPR and 14th in sex ratio. Such contradictory findings leads one to
conclude that no generalisations can be made either about literacy or about sex ratio and their positive
or negative correlations with female work participation rates.
Table 5.6
Female Literacy versus Female Work Participation Rate, 2001
State/District Literacy Female Work Participation Rate Rank in Rank in
Rate FWPR Sex Ratio
Haryana 56.31 27.31
Panchkula 68.98 1 17.92 17 19
Ambala 68.48 2 9.96 19 7
Yamunanagar 64.08 3 11.38 18 10
Rohtak 63.19 4 27.71 11 15
Sonipat 61.65 5 30.40 9 16
Rewari 61.25 6 36.81 2 2
Kurukshetra 60.76 7 21.31 15 8
Jhajjar 59.88 8 35.78 3 14
Panipat 58.48 9 25.73 13 18
Karnal 58.42 10 18.90 16 9
Faridabad 56.80 11 21.91 14 17
Mahendergarh 54.61 12 38.23 1 1
Bhiwani 53.50 13 35.40 4 5
Hisar 52.09 14 33.17 7 13
Sirsa 50.31 15 30.59 8 4
Jind 48.97 16 34.77 5 12
Gurgoan 48.29 17 27.79 10 6
Kaithal 47.60 18 25.73 12 11
Fatehabad 46.40 19 34.32 6 3
Source: Census of India, 2001, Series 7, Haryana

(62)
On the whole, Haryana is relatively better placed than its equally patriarchal neighbour, Punjab,
but much worse off than its other neighbour, Himachal Pradesh, where female work participation rates
are concerned. Furthermore, as against the general assumption that it is poor educational level and
lack of formal training which act as constraints to women�s participation in the economic sector,
Haryana reveals a contradictory feature in as much as it is the districts which have low literacy, which
are high on the scale of FWPR.

(63)
CHAPTER - VI
WOMEN AND DECISION-MAKING
The political empowerment of women and their full participation in power structures and decision
making makes it an imperative for women to be in the corridors of power and have the power to
negotiate a better deal for themselves. Only then can they influence policy decisions impacting upon
them. Empowerment of women in all spheres, in particular the political sphere is crucial for their
advancement and the foundation of a gender-equal society. It is central to the achievement of the
goals of equality, development and peace. Yet women remain absent unheard and marginalized in
decision-making bodies. The Human Development Report of South Asia reports that in South Asia
women occupy only 7 per cent of the parliamentary seats and only 9 per cent of the cabinet members
are women.
India is no exception to this trend in South Asia and only 8.83 percent of the elected representatives
in the Lower House are women and women occupy only about 15 per cent of the Rajya Sabha seats.
A gendered analysis of decision-making in Haryana reveals the reality and severity of women�s
subordination. For the purpose of Parliamentary elections, Haryana is delimited into 10 constituencies.
From its creation as a State in 1966, till date, Haryana has witnessed 10 Parliamentary elections.
However, only 3 women have ever entered the Lok Sabha from Haryana. These were Ms Chandrawati
(6th Lok Sabha), Ms.Shelja Kumari (10th and 11th Lok Sabha) and Prof Kailasho Devi (12th and 13th, Lok
Sabha�s). Significantly, at no time has Haryana had more than one woman representative. There has
been no woman representative from Haryana in all the other 6 Parliamentary elections.
A similar situation prevails in respect of women�s representation in the Upper House. Only three
women have ever represented Haryana in the Rajya Sabha. These were Ms Vidya Beniwal (199-96),
Ms.Sushma Swaraj (1990-96) and Ms Sumitra Mahajan (2002-2008). Incidentally, Ms Sushma Swaraj
continues to be a Member of the Rajya Sabha, but in the current term she is representing not Haryana,
but Uttar Pradesh.
A look at the figures for the State Assembly reveal an almost equally gloomy picture so far as
women�s representation is concerned. Out of a total of 81 seats in 1967, 1968, and 1972, the
percentage of women was merely 4.9, 8.6 and 4.9 respectively. Thereafter, the number of seats were
increased to 90, but women�s representation increased only marginally from 4.9 to 5.5 in 1987 and
again to 6.7 in 1991. Even this marginal improvement was, however, not sustainable. It declined back
to an even lower level and has been a mere 4.4 in the last two elections.
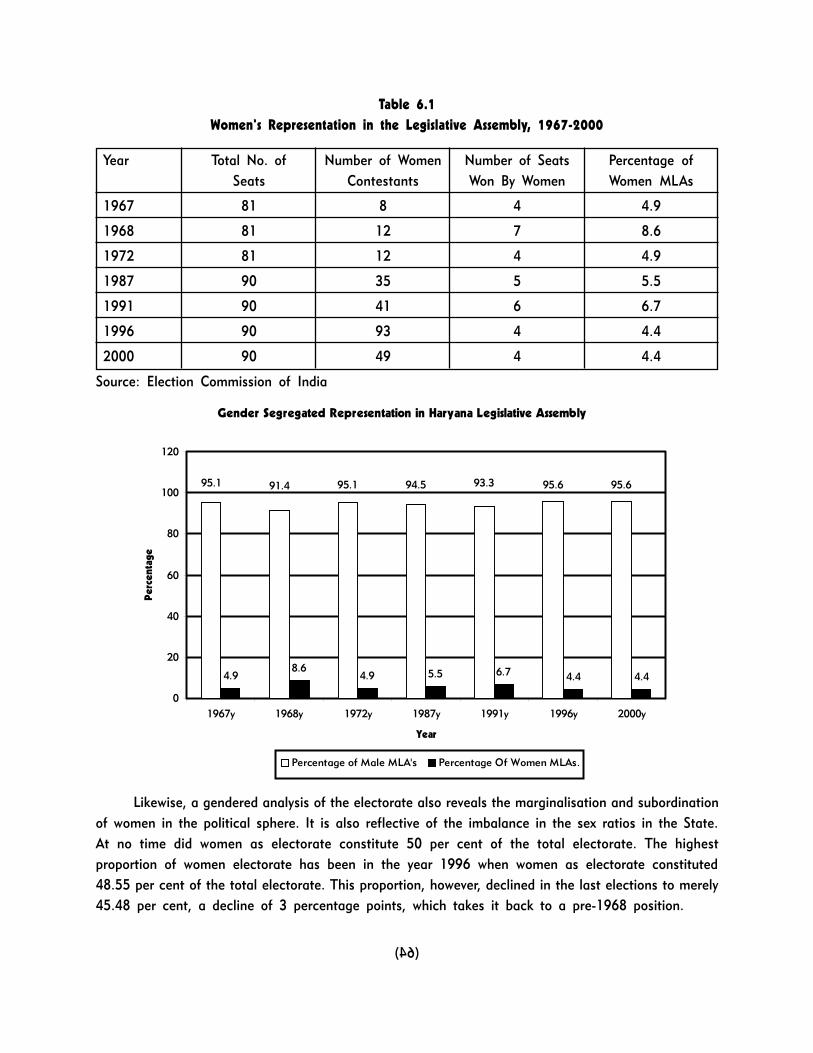
(64)
Table 6.1
Women�s Representation in the Legislative Assembly, 1967-2000
Year Total No. of Number of Women Number of Seats Percentage of
Seats Contestants Won By Women Women MLAs
1967 81 8 4 4.9
1968 81 12 7 8.6
1972 81 12 4 4.9
1987 90 35 5 5.5
1991 90 41 6 6.7
1996 90 93 4 4.4
2000 90 49 4 4.4
Source: Election Commission of India
Likewise, a gendered analysis of the electorate also reveals the marginalisation and subordination
of women in the political sphere. It is also reflective of the imbalance in the sex ratios in the State.
At no time did women as electorate constitute 50 per cent of the total electorate. The highest
proportion of women electorate has been in the year 1996 when women as electorate constituted
48.55 per cent of the total electorate. This proportion, however, declined in the last elections to merely
45.48 per cent, a decline of 3 percentage points, which takes it back to a pre-1968 position.
Gender Segregated Representation in Haryana Legislative Assembly
4.98.6
4.9 5.5 6.7 4.4 4.4
95.1 91.4 95.1 94.5 93.3 95.6 95.6
0
20
40
60
80
100
120
1967y 1968y 1972y 1987y 1991y 1996y 2000y
Year
Perc
enta
ge
Percentage of Male MLA's Percentage Of Women MLAs.

(65)
Table 6.2
Electorate in Haryana, 1967-2000
Year Total Electorate Women Electorate Men Electorate
1967 4387980 � �
1968 4552539 2130120 24222419
(46.78) (53.21)
1972 5091082 2399536 2691546
(47.13) (52.87)
1987 8700628 4059951 4640677
(46.66) (53.34)
1991 9731912 4484426 5247486
(46.07) (53.93)
1996 11155242 5146835 6008407
(48.55) (53.86)
2000 11153183 5072844 6080339
(45.48) (54.52)
* Figures in parenthesis are the percentage calculated by the researcher.
Source: Election Commission of India.
The participation of women in decision-making, however, improves at the grassroots level. The
reason is not far to seek and does not lie in any automatic empowerment of women at the grassroots,
but in the enabling provisions of the 73rd and 74th Amendments. Following these Amendments, women
have entered Panchayats and Municipal Councils in large numbers and now constitute 33 per cent both
of the total members as well as the Chairpersons.
Table 6.3
Number of Elected Women in Panchayats
Gram Panchayat Panchayat Samiti Zilla Parishad
Women Total % Women Total % Women Total %
Women Panches 17928 54159 33.10 807 2418 33.37 101 303 33.33
Women Chairpersons 6015 18264 32.94 558 1661 33.59 84 252 33.33
Source: Towards Equality: An Unfinished Agenda, National Commission for Women, New Delhi, 2002
Has this improved representation resulted in de facto empowerment of women? Only time will
tell.
(66)
Women in Household Decision-making
While women�s representation in decision-making bodies is low, women�s personal lives have
been equally male dominated. The question is, to what extent are women in control of their own lives?
Can they take decisions even in simple household matters such as what to buy and what to cook? Or
are they directed even in these by the male members of their families?
NFHS-II data reveals that at an all India level, 9.4 per cent of the women are not involved in
any decision-making in the household. The highest per cent of women not involved in any decision-
making is in Uttar Pradesh (16.4 %), while the lowest is in Nagaland (0.4%).
In Haryana, 3.4% of the women are not involved in any decision-making. Significantly, the
highest percentage of women are involved in decision making on what to cook (93.5%). This is
followed by purchase of jewellery in which 77.8 % of the women are involved, own health care (67.2%)
and staying with parents/siblings (64.5%). However only 36.7 and 20.8 per cent of the women do not
need permission to go to the market or visit/friends and relatives respectively. Thus a majority of the
women would need permission to step out of the house. An age wise segregated analysis reveals that
the highest percentage of women not involved in any decision-making is in the age group of 20-24,
followed closely by the age group of 25-29. The lowest percentage of such women not involved in any
decision-making is in the age group of 40-44. It is women in this last age group who reveal the
maximum autonomy in regard to various decisions such as what to cook and own health care, while
it is women in the age group of 35-39, who have more autonomy in respect of purchasing jewellery
and women in the age group of 15-19, who have maximum autonomy in respect of visiting parents/
siblings. However, the maximum number of women who do not need permission to go to the market
or visit friends and relatives, fall in the age group of 45-49.
Literacy seems to make a difference in that only 2.6 per cent of the women who have completed
middle school are not involved in any decision-making. However, this fact is contradicted by another
fact that a lower percentage of illiterate women are not involved in any decision-making as against
a much higher percentage of women who are literate, but have not completed middle school.
Religion-wise, Muslim women seem to have the maximum autonomy as against the generally
known stereotype of Muslim women as suppressed and subordinated. A caste-wise analysis reveals that
it is the scheduled caste women who report the least percentage of women not involved in any
decision-making.
Another paradoxical picture is presented by the figures for cash employment. The table below
reveals that 4.6 percent of the women working for cash are not involved in any decision-making, while
only 2.3 per cent and 3.3 per cent of those working, but not for cash and those who have not worked
for the past 12 months are respectively not involved in any decision-making.

(67)
Table 6.4
Household Decision Making
Percent distribution of ever-marked women by person who makes specific household decisions,
according to residence, Haryana 1998�89
Household Respondent Husband Respondent Others in Respondent Missing Total
Decision only Only With household with Others percent
husband only in household
URBAN
What items to cook 77.4 2.9 3.4 4.2 12.2 0.0 100.0
Obtaining health
care for herself 32.1 30.5 25.9 3.6 7.9 0.0 100.0
Purchasing jewellery
or other major
household items 4.0 14.9 55.6 3.8 21.6 0.0 100.0
Going and staying
with her parents or
siblings 6.8 31.4 42.5 2.9 16.5 0.0 100.0
How the money she
earns will be used 60.1 6.5 31.8 0.0 1.7 0.0 100.0
RURAL
What items to cook 76.5 204 207 4.0 14.6 0.0 100.0
Obtaining health
care for herself 33.9 27.8 21.0 4.5 12.8 0.0 100.0
Purchasing jewellery
or other major
household items 4.5 17.7 43.8 5.9 28.2 0.0 100.0
Going and staying
with her parents or
siblings 6.8 31.7 33.7 4.3 23.6 0.0 100.0
How the money she
earns will be used 56.7 11.4 29.3 0.0 2.0 0.6 100.0
TOTAL
What items to cook 76.7 2.5 2.9 4.0 13.9 0.0 100.0
Obtaining health
care for herself 33.4 28.6 22.4 4.2 11.4 0.0 100.0

(68)
Household Respondent Husband Respondent Others in Respondent Missing Total
Decision only Only With household with Others percent
husband only in household
Purchasing jewellery
or other major
household items 4.3 16.9 47.2 5.3 26.3 0.0 100.0
Going and staying
with her parents or
siblings 6.8 31.6 36.2 3.9 21.5 0.0 100.0
How the money she
earns will be used 58.2 9.3 30.4 0.0 1.8 0.3 100.0
For women earning cash
Source: NFHS-II, Haryana
A look at the table above provides an areawise analysis of household decision-making on these
aspects. It reveals minor variations in different aspects. A majority of the women can take their
decision in regard to what items to cook, although this proportion is only slightly lower for rural areas.
However, in respect of other factors such as obtaining health care for herself, or purchase of jewellery
or staying with parents/siblings, a large majority have to seek permission from others in the household.
Table 6.5
Women�s Autonomy
Percentage of ever-married women involved in household decision making, percentage with freedom of
movement, and percentage with access to money by selected background characteristics, Haryana,
1998-99
Percentage Involved in Decision Making on Percentage who do
not Need Permission to
Back ground Percentage What Own health Purchasing Staying Go to Visit Percentage Number
characteristic not to cook care Jewellery with her the market friends/ with of women
involved in etc. parents/ relative access
any siblings to money
decision
making
Age
15-19 4.4 89.0 67.1 82.5 72.0 19.1 5.5 67.3 182
20-24 5.2 90.9 62.1 76.5 65.5 24.2 9.7 63.5 515
25-29 5.1 92.0 66.4 76.5 63.6 31.3 16.6 66.6 606

(69)
Percentage Involved in Decision Making on Percentage who do
not Need Permission to
Back ground Percentage What Own health Purchasing Staying Go to Visit Percentage Number
characteristic not to cook care Jewellery with her the market friends/ with of women
involved in etc. parents/ relative access
any siblings to money
decision
making
30-34 2.8 94.5 67.6 77.8 61.5 38.0 20.9 70.2 559
35-39 2.4 95.0 67.1 80.4 65.0 43.6 28.1 75.7 418
40-44 1.2 98.0 72.0 77.2 64.5 48.8 28.9 75.9 347
45-49 1.4 94.3 71.8 77.1 65.0 54.9 39.2 83.3 281
Residence
Urban 3.7 92.9 65.9 81.3 65.7 49.9 32.0 85.8 837
Rural 3.3 93.7 67.7 76.5 64.0 31.4 16.3 64.8 2071
Education
Illiterate 2.9 94.5 68.8 77.5 64.7 33.5 18.2 65.4 1605
Literate, < Middle
School Complete 6.0 89.3 60.9 72.9 59.2 32.2 16.4 68.8 486
Middle School
Complete 2.6 93.6 64.8 78.6 59.7 32.6 15.1 72.3 234
High School
Complete And above 3.3 94.1 68.9 82.5 70.3 51.0 34.1 86.9 583
Religion
Hindu 3.6 93.2 66.9 78.3 64.8 36.5 20.9 70.9 2590
Muslim 0.9 94.7 63.9 78.6 53.7 20.4 11.9 60.8 118
Sikh 2.6 95.9 73.9 71.1 66.5 48.1 24.5 74.4 190
Caste/tribe
Scheduled Caste 2.5 94.9 66.5 73.4 62.8 37.3 17.5 64.0 597
Other Backward
Class 5.4 91.7 64.1 78.7 65.5 30.6 18.8 66.6 629
Other 3.0 93.6 68.6 79.2 64.8 38.7 22.8 74.9 1679
Cash Employment
Working For cash 4.6 94.3 71.2 82.2 69.3 58.8 40.5 80.1 281

(70)
Percentage Involved in Decision Making on Percentage who do
not Need Permission to
Back ground Percentage What Own health Purchasing Staying Go to Visit Percentage Number
characteristic not to cook care Jewellery with her the market friends/ with of women
involved in etc. parents/ relative access
any siblings to money
decision
making
Working But not
For cash 2.3 92.9 68.4 88.3 79.1 41.9 29.1 74.4 85
Not Worked in
Past 12 Months 3.3 93.4 66.7 77.0 63.5 34.1 18.4 69.7 2542
Standard of living
Index
Low 3.2 95.8 67.9 69.4 59.0 33.1 17.1 60.6 280
Medium 4.0 95.3 66.9 76.9 63.7 34.1 18.0 65.2 1331
High 2.9 93.2 67.6 80.7 66.7 40.4 24.8 79.2 1279
Total 3.4 93.5 67.2 77.8 64.5 36.7 20.8 70.8 2908
Note: Total includes 7 women belonging to other religions, 2 women belonging to scheduled tribes, and
2 and 18 women with missing information on religion and the standard of living index, respectively,
who are not shown separately.
Not belonging to a scheduled caste, a scheduled tribe, or another backward class.
In sum, women in Haryana are not merely denied the right to take birth, have higher mortality
rates, are discriminated in the spheres of education, health as well as work, but their voices go
unheard in both the public and the private sphere. In the public sphere they lack representation, while
in the private sphere, the patriarchal system is so well entrenched that they are unable to take any
major decisions. Such subordination and suppression of women equally perpetuates violence against
women, which is the focus of the next chapter.

(71)
CHAPTER - VII
VIOLENCE AGAINST WOMEN
�Any act � that results in, or is likely to result in physical, sexual or psychological harm or
suffering to women, including threats of such acts, coercion or arbitrary deprivation of liberty, whether
occurring in public or private life� is the broad all-encompassing definition of violence against women
adopted by the Beijing Platform for Action. Violence against women was recognized alongwith health,
education and political empowerment as one of the critical areas of concern and the determination
of the international community to �prevent and eliminate all forms of violence against women and
girls� was categorically emphasized.
Women, however, continue to be subjected to violence over the entire life cycle. Before birth they
are condemned to sex selection and female foeticide; during infancy and childhood they are subject
to infanticide or malnutrition; if they do manage to pass the age of five, they are neglected in medical
care and education as well as subjected to sexual or physical violence; in adolescence and adulthood,
they are faced with situations of early marriage, early pregnancy, sexual violence, domestic violence,
harassment for dowry, desertion, branded as witches, dying during child birth; and as older women and
widows condemned to a life of desertion and neglect. New modes of victimization are constantly
emerging.
The northwestern region is well known for the kind of inegalitarian gender relations that are
linked to gender violence. While Punjab is more known for the singular impact of partition, wherein
women were raped, killed, mutilated, kidnapped or simply left behind to die, it must be remembered
that Haryana was as much impacted by the madness at the time, having been a part of undivided
Punjab. Violence over the life cycle is equally pervasive in the region.
While the term violence includes both mental and physical violence, it must be remembered that
mental violence is non-quantifiable; it is possible only to identify instances of physical violence, which
are recognized as crimes against women by the Indian Penal Code. However, it must be remembered
that the various situations which result in marginalisation and deprivation of women including foeticide,
infanticide, lack of access to education, lack of opportunities as well as neglect in health care are not
only a part of gender violence, but lead to increased violence against women. These have been
analysed in the previous chapters. The focus of the present chapter is on cognizable crimes against
women and domestic violence.

(72)
The reported instances of violence are merely a tip of the iceberg , because for every one
reported case there are many which go unreported. Comparison of the incidence of rate of crime in
Haryana against other States shows Haryana to be ranked at 15th place in the percentage contribution
to all India crimes against women with at rate of 2.4%. Thus Haryana is a relatively higher risk State
than even the neighboring State of Punjab or the National Capital Territory of Delhi, which are ranked
16th and 17th respectively.
Table 7.1
Incidence & Rate Of Crime Committed Against Women In States And UTs During 2001
Sl. State/Ut Incidence Percentage Population@ Rate of Rank * Rank **
No. contribution (In Lakhs) Total
to All-India Cognizable
Total Crimes
(1) (2) (3) (4) (5) (6) (7) (8)
1 Andhra Pradesh 16477 11.5 757.3 21.8 2 2
2 Arunachal Pradesh 180 0.1 10.9 16.5 8 23
3 Assam 4243 3.0 266.4 15.9 12 13
4 Bihar 5356 3.7 828.8 6.5 28 12
5 Chhattisgarh 3989 2.8 208.0 19.2 4 14
6 Goa 83 0.1 13.4 6.2 30 28
7 Gujarat 5805 4.0 506.0 11.5 20 9
8 Haryana 3393 2.4 210.8 16.1 11 15
9 Himachal Pradesh 890 0.6 60.8 14.6 13 20
10 J & K 1656 1.2 100.7 16.4 9 19
11 Jharkhand 2229 1.6 269.1 8.3 26 18
12 Karnataka 6002 4.2 527.3 11.4 21 8
13 Kerala 5450 3.8 318.4 17.1 5 10
14 Madhya Pradesh 14549 10.1 603.9 24.1 1 3
15 Maharashtra 12524 8.7 967.5 12.9 17 4
16 Manipur 112 0.1 23.9 4.7 31 27
17 Meghalaya 66 0.0 23.1 2.9 33 29
18 Mizoram 126 0.1 8.9 14.1 15 25
19 Nagaland 30 0.0 19.9 1.5 34 31
20 Orissa 5357 3.7 367.1 14.6 14 11

(73)
Sl. State/Ut Incidence Percentage Population@ Rate of Rank * Rank **
No. contribution (In Lakhs) Total
to All-India Cognizable
Total Crimes
(1) (2) (3) (4) (5) (6) (7) (8)
21 Punjab 2361 1.6 242.9 9.7 22 16
22 Rajasthan 12175 8.5 564.7 21.6 3 5
23 Sikkim 24 0.0 5.4 4.4 32 32
24 Tamil Nadu 10111 7.0 621.1 16.3 10 6
25 Tripura 438 0.3 31.9 13.7 16 22
26 Uttar Pradesh 20227 14.1 1660.5 12.2 19 1
27 Uttaranchal 749 0.5 84.8 8.8 24 21
28 West Bengal 6570 4.6 802.2 8.2 27 7
Total (States) 141172 98.2 10105.62 14.0
29 A & N Islands 34 0.0 3.6 9.6 23 30
30 Chandigarh 150 0.1 9.0 16.6 6 24
31 D & N Haveli 19 0.0 2.2 8.6 25 33
32 Daman & Diu 10 0.0 1.6 6.3 29 34
33 Delhi 2291 1.6 137.8 16.6 7 17
34 Lakshadweep 0 0.0 0.6 0.0 - -
35 Pondicherry 119 0.1 9.7 12.2 18 26
Total (Uts) 2623 1.8 164.53 15.9
Total (All-India) 143795 100.0 10270.15 14.0
@ Actual based on 2001 census
Source: Crime in India, 2001, http://ncrb.nic.in
As a percentage of total cognizable crimes in the State, crimes against women (CAW) in
Haryana are 16.1 per cent as against an all-India rate of 14 per cent. In this Haryana slides lower
down the scale, as it is 11th in ranking amongst the States. The highest is Madhya Pradesh and the
lowest is Nagaland.
A look at the table below reveals the incidence and rate of crimes committed against women
in Haryana, category wise and the percentage to the all India total along with the all-India incidence
of such crimes. Of the total cognizable crimes in Haryana, incidence of CAW is 16.2 per cent. Of

(74)
these, the highest percentage come from the category of cruelty by relatives, followed by molestation,
rape and eve-teasing come next, but constitute a mere 1.9 per cent of the cognizable crimes. Kidnapping
and abduction and dowry deaths are next in the scale of importance, while at the bottom comes crimes
committed under the Immoral Traffic Prevention Act.
Paradoxically, there is no case registered under the Dowry Prohibition Act or the Importation of
Women Act, while media has been highlighting cases of the last, particularly in the districts bordering
Punjab. A study by Shakti Vahini reveals large scale trafficking of women to Haryana, Punjab and Delhi
from Assam, Jharkhand, West Bengal and Orissa. The reason was traced to poverty and an imbalanced
sex ratio.1 It would not be out of context to mention that the present researcher was also contacted
by the Tripura State Commission for Women to look into a case of alleged trafficking from Tripura to
Haryana. The Economist also reports that �some men in Haryana are buying �brides� (for between
10,000 and 20,000 Rupees) from other parts of India or Bangladesh. There are an estimated 15,000
such women. Many, though, are treated as slaves. Even their children are shunned.�2
Table 7.2
Incidence Of Crimes Committed Against Women During 2001, Haryana and India
Type of CAW Haryana India
I R P I R P
Rape 398 1.9 2.5 16075 1.6
Kidnapping and abduction 297 1.4 2.0 14645 1.4
Dowry deaths 285 1.4 4.2 6851 0.7
Cruelty by husbands and relatives 1513 7.2 3.1 49170 4.8
Molestation 478 2.3 1.4 34124 3.3
Eve-Teasing 401 1.9 4.1 9746 0.9
Importation of Girls 0 0 0 114 0.0
Sati-Prevention Act 0 0 0 0 0 0
Immoral Traffic Prevention Act 21 0.1 0.2 8796 0.9
Indecent Representation Act 0 0 0 1052 0.1
Dowry Prohibition Act 0 0 0 3222 0.3
Total 3393 16.1 2.4 143795 14.0
I - Incidence; R - Rate; P - Percentage Contribution to all India Total
Source: National Crime Records Bureau, Crime in India, 2001, http://ncrb.nic.in
1 The Hindu, December 12, 2003.2 The Economist, April 17, 2003, www.economist.com.

(75)
Crimes against Women and Sex Ratio
A declining sex ratio is supposed to lead to enhanced crimes against women. The Economist also
reports a District Councillor of Rohtak as alleging that as a result of the female shortage, unmarried
young men are turning to crime and violence against women has increased. 3
However, the following Table 7.3 leads us to no general conclusions in this respect. Definitely,
Panchkula and Panipat, which are 19th and 18th in ranking in sex ratio are ranked 2nd and 3rd in respect
of crimes against women and both have a similar incidence of 0.41. At the top in terms of CAW is
the District of Jhajjar, which is ranked 14th in sex ratio. Likewise, the Districts of Fatehabad and
Mahendragarh, which are ranked 3rd and 1st respectively in respect of sex ratio, also reveal the lowest
incidence of crimes against women. However, the other districts present a mixed picture, with some
of those ranked at a relatively higher position in terms of sex ratio also showing a high crime rate
against women. For instance, Ambala which is ranked 7th in terms of sex ratio is ranked 4th in respect
of incidence of crimes against women.
Table 7.3
Crime against women and Sex Ratio
District Crimes per 1000 Ranking in Crimes Sex Ranking in Sex
Females Against women Ratio Ratio
Jhajjar 0.42 1 848 14
Panchkula 0.41 2 823 19
Panipat 0.41 3 830 18
Ambala 0.39 4 869 7
Kurukshetra 0.38 5 866 8
Kaithal 0.35 6 854 11
Karnal 0.32 7 864 9
Gurgoan 0.32 8 874 6
Sirsa 0.31 9 882 4
Faridabad 0.31 10 839 17
Jind 0.27 11 853 12
Yamunanagar 0.25 12 863 10
Hisar 0.24 13 852 13
Rohtak 0.24 14 847 15
Sonipat 0.22 15 839 16
3 The Economist, op.cit.

(76)
District Crimes per 1000 Ranking in Crimes Sex Ranking in Sex
Females Against women Ratio Ratio
Rewari 0.22 16 901 2
Bhiwani 0.18 17 880 5
Mahendergarh 0.17 18 919 1
Fatehabad 0.16 19 886 3
Source: Census of India, Series 7, Haryana, 2001
Domestic Violence
Domestic violence or battery of women within the household has only recently gained recognition
as a form of violence against women which merits public concern. Domestic violence is not merely
physical assault. Rather, to recognize domestic violence means to understand the dynamics of violent
intimate relationships-particularly gendered relationships. It encompasses a range of behaviours employed
to hurt, intimidate, coerce, isolate, control or humiliate a partner or dependent. Research has revealed
that the home has become a �den of terror� for millions of women across the globe and women�s
safety, security and sanity are under greatest threat from their own family members and within the four
walls of their homes.
What�s more, it is often justified on one pretext or another. Wife battering is often seen as a
reflection of the husband�s masculinity. The UNIFEM Report �A Life Free of Violence: It�s Our Right�
(1998) reveals that 3-4 million women are battered worldwide each year; one in six women are the
victims of rape in industrialized countries and between 16 and 52 per cent of women surveyed were
assaulted by intimate partners. According to a WHO report 16.52 per cent of women all over the world
experience violence in intimate relations. The International Centre for Research on Women (ICRW)
reports that between 22 to 60 per cent of Indian women have reported being subjected to physical
violence.
NFHS-II survey in Haryana found some of the major reasons given for a husband beating his
wife. These include a suspicion that the wife is unfaithful, natal family does not give expected money
or other items; wife shows disrespect to in-laws, wife goes out without telling her husband, she
neglects the house or children, does not cook food properly. The table below reveals that 26.2 per cent
of the women agreed with at least one reason. The highest percentage viz. 20.1 per cent of the women
justified wife beating on grounds of a wife�s unfaithfulness. Second reason in order of importance was
wife going out without telling her husband followed by neglect of house or children. Next was showing
disrespect to in-laws, followed by not cooking food properly. Only a miniscule 0.2 per cent justified wife
beating on grounds of natal family not giving expected money or other items.

(77)
Table 7.4
Reasons Given For Justifying A Husband Beating His Wife
Percentage who agree with specific reasons
Backgrounds Characteristic Percentage Husband Naatal Wife Wife Wife Wife Number
who suspects Family shows goes out neglects does not of Women
Agree wife is does not disrespect without house or cook food
with at unfaithful give for in-laws telling children properly
least one expected husband
reason money or
other
items
Age
15-19 23.0 17.5 0.0 8.3 12.6 8.3 7.1 182
20-29 26.9 20.2 0.2 10.6 12.8 11.7 7.2 1,121
30-39 27.1 21.9 0.4 10.0 12.5 9.5 7.1 977
40-49 24.6 18.0 0.0 8.8 11.5 9.1 6.2 628
Martial Duration (in years)
<5 24.0 18.1 0.0 9.6 12.0 9.9 7.1 656
5-9 26.6 21.1 0.5 10.6 12.5 11.8 7.0 420
10 or more 27.9 21.3 0.2 10.1 13.0 10.3 7.1 1,724
Not currently married 11.0 10.1 0.0 3.7 4.5 3.7 3.7 109
Residence
Urban 17.5 12.6 0.0 5.0 7.6 6.5 4.1 837
Rural 29.7 23.2 0.3 11.8 14.4 11.7 8.1 2071
Education
Illiterate 29.8 22.8 0.2 10.7 14.7 11.5 7.5 1605
Literate, < middle
School Complete 29.6 23.7 0.2 10.9 13.2 11.1 9.5 486
Middle school complete 28.4 21.5 0.9 13.8 12.1 11.6 7.8 234
High school complete
and above 12.6 9.1 0.0 5.2 5.6 5.3 3.1 583
Religion
Hindu 26.8 20.9 0.2 10.3 13.1 10.3 7.4 2590

(78)
Percentage who agree with specific reasons
Backgrounds Characteristic Percentage Husband Naatal Wife Wife Wife Wife Number
who suspects Family shows goes out neglects does not of Women
Agree wife is does not disrespect without house or cook food
with at unfaithful give for in-laws telling children properly
least one expected husband
reason money or
other
items
Muslim 20.5 11.9 0.0 6.8 8.5 11.1 2.6 118
Sikh 21.6 14.1 0.5 5.2 5.8 7.4 3.7 190
Caste/tribe 23.3 8.2
Scheduled caste 29.5 22.2 0.0 11.0 14.2 10.9 8.4 597
Other backward class 29.2 18.2 0.5 11.0 14.8 13.2 6.0 629
Other 23.8 16.0 0.2 8.9 10.8 8.8 1679
Cash employment 8.2
Working for cash 21.3 61.0 0.4 8.5 11.3 8.2 8.4 281
Working but not for cash 50.1 45.4 0.0 23.3 15.2 17.4 6.0 85
Not worked in past 12 months 25.9 19.7 0.2 9.5 12.4 10.2 6.7 2542
Standard of living index
Low 27.3 21.0 0.0 8.6 13.5 8.2 6.8 280
Medium 29.5 22.8 0.5 11.3 15.1 12.1 8.8 1331
High 22.5 17.2 0.0 8.6 9.4 8.7 5.1 1279
Total 26.2 20.1 0.2 9.8 12.4 10.2 7.0 2908
Note : Total includes 7 women belonging to other religions. 2 women belonging to scheduled tribes,
and 2 and 18 women with missing information on religion and the standard of living index respectively,
who are not shown separately.
Not belonging to a scheduled caste, a scheduled tribe, or an other backward class
Source: NFHS-II, Haryana
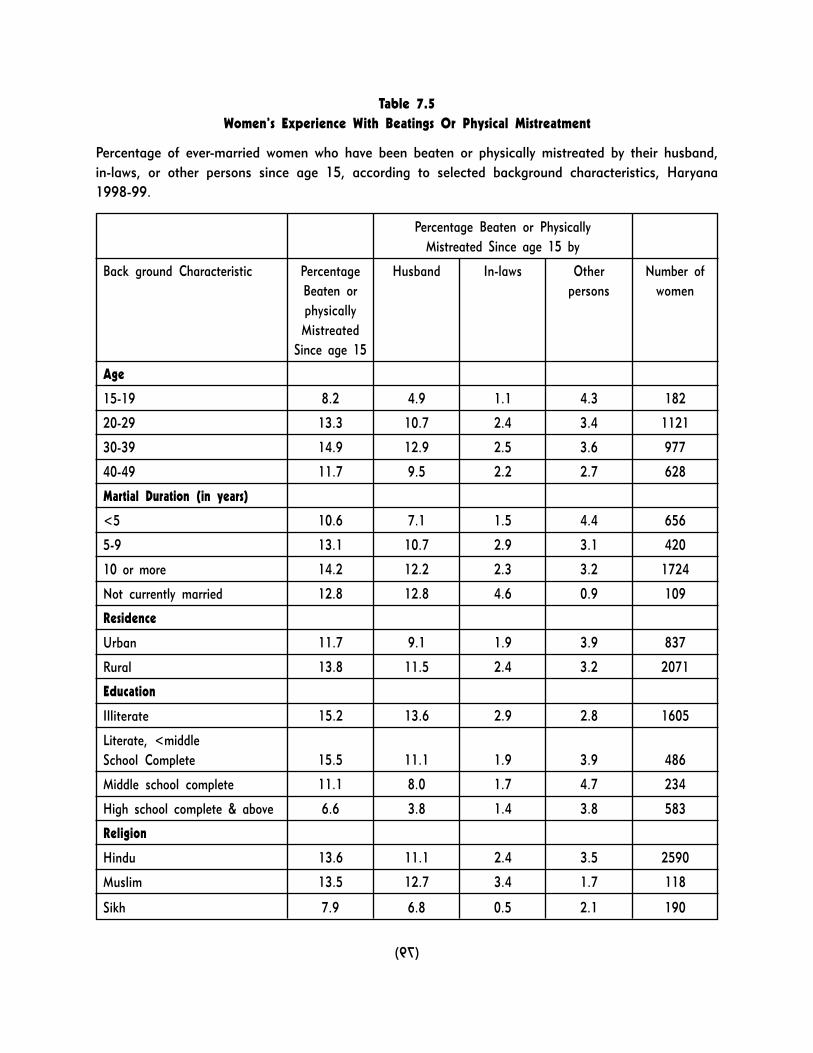
(79)
Table 7.5
Women�s Experience With Beatings Or Physical Mistreatment
Percentage of ever-married women who have been beaten or physically mistreated by their husband,
in-laws, or other persons since age 15, according to selected background characteristics, Haryana
1998-99.
Percentage Beaten or Physically
Mistreated Since age 15 by
Back ground Characteristic Percentage Husband In-laws Other Number of
Beaten or persons women
physically
Mistreated
Since age 15
Age
15-19 8.2 4.9 1.1 4.3 182
20-29 13.3 10.7 2.4 3.4 1121
30-39 14.9 12.9 2.5 3.6 977
40-49 11.7 9.5 2.2 2.7 628
Martial Duration (in years)
<5 10.6 7.1 1.5 4.4 656
5-9 13.1 10.7 2.9 3.1 420
10 or more 14.2 12.2 2.3 3.2 1724
Not currently married 12.8 12.8 4.6 0.9 109
Residence
Urban 11.7 9.1 1.9 3.9 837
Rural 13.8 11.5 2.4 3.2 2071
Education
Illiterate 15.2 13.6 2.9 2.8 1605
Literate, <middle
School Complete 15.5 11.1 1.9 3.9 486
Middle school complete 11.1 8.0 1.7 4.7 234
High school complete & above 6.6 3.8 1.4 3.8 583
Religion
Hindu 13.6 11.1 2.4 3.5 2590
Muslim 13.5 12.7 3.4 1.7 118
Sikh 7.9 6.8 0.5 2.1 190

(80)
Percentage Beaten or Physically
Mistreated Since age 15 by
Back ground Characteristic Percentage Husband In-laws Other Number of
Beaten or persons women
physically
Mistreated
Since age 15
Caste/tribe
Scheduled caste 17.8 15.2 2.5 4.3 597
Other backward class 13.6 11.7 2.9 2.9 629
Other 11.4 8.9 2.0 3.2 1679
Household type
Nuclear household 15.4 13.1 2.0 3.7 1406
Non-nuclear Household 11.1 8.7 2.6 3.1 1502
Cash Employment
Working
For cash 16.4 15.3 2.8 4.3 281
Working But not for cash 10.5 8.2 4.6 1.2 85
Not Worked in Past 12 Months 12.9 10.4 2.2 3.3 2542
Standard of living Index
Low 18.9 16.4 3.2 3.2 280
Medium 16.0 14.0 2.5 3.5 131
High 9.0 6.3 2.0 3.3 1279
Living children
No living children 7.4 3.7 1.2 4.1 245
Only daughters 9.9 7.3 2.7 3.3 303
Only sons 13.2 11.0 2.7 3.6 675
Both daughters and sons 14.6 12.4 2.2 3.2 1685
Total 13.2 10.8 2.3 3.4 2908
Note : Total includes 7 women belonging to other religions, 2 women belonging to scheduled tribes,
and 2 and 18 women with missing information on religion and the standard of living index, respectively,
who are not shown separately.
Not belonging to a scheduled caste, a scheduled tribe, or an other backward class.
Source: NFHS-II, Haryana

(81)
The table above reveals that at least 13.2 per cent of the women admitted to being physically
mistreated since age 15. Of these the largest percentage of women were beaten or physically mistreated
by husband (10.8%), 2.3 per cent by in-laws and 3.4 per cent by others.
8.1 per cent of the women reported having been beaten many times in the past 12 months
preceding the survey; 12. 5 percent reported a few times; 18 per cent reported having been beaten
once. Thus out of the total, 39 percent of the women admitted to having been beaten at one time
or the other during the 12 months preceding the survey and only 61 percent reported not having
beaten during the past twelve months.
Table 7.6
Frequency Of Beatings Or Physical Mistreatment
Percent distribution of ever-married women who report being beaten or physically mistreated since age
15 by frequency of beating or physical mistreatment in the 12 months preceding the survey according
to selected background characteristics Haryana 1998-99.
Beaten or
physically
mistreated in
Past 12
months
Background Characteristic Many times A few Times Once Not beaten Total Number of
percentage Women
Age
20-29 16.8 14.1 21.3 47.8 100.0 149
30-39 2.1 13.7 18.7 65.6 100.0 146
40-49 2.7 6.7 10.7 79.9 100.0 74
Martial Duration (in years)
<5 11.5 16.0 20.3 52.2 100.0 69
5-9 16.3 12.6 19.7 51.3 100.0 55
10 or more 5.3 12.2 18.0 64.5 100.0 246
Residence
Urban 9.3 11.4 16.6 62.8 100.0 98
Rural 7.7 12.9 18.5 61.0 100.0 285
Education
Illiterate 7.8 13.1 17.2 61.9 100.0 244

(82)
Beaten or
physically
mistreated in
Past 12
months
Background Characteristic Many times A few Times Once Not beaten Total Number of
percentage Women
Literate, <middle School Complete 7.9 10.8 24.0 57.3 100.0 75
Middle school complete 7.8 19.2 15.3 57.6 100.0 26
High school complete & above 10.4 7.7 13.1 68.8 100.0 39
Caste/tribe
Scheduled caste 13.2 13.1 14.8 58.9 100.0 107
Other backward class 5.8 15.1 23.4 55.7 100.0 86
Other 6.3 11.0 17.3 65.4 100.0 191
Household type
Nuclear household 7.0 13.8 19.9 59.3 100.0 217
Non-nuclear Household 9.5 10.8 15.5 64.2 100.0 167
Cash Employment
Working for cash 6.7 6.5 23.8 63.0 100.0 46
Not Worked in Past 12 Months 8.5 13.4 17.4 60.8 100.0 329
Standard Of living Index
Low 9.5 15.2 11.2 64.1 100.0 53
Medium 8.0 13.1 23.5 55.5 100.0 213
High 7.8 10.4 11.3 70.5 100.0 115
Living children
Only daughters 6.8 19.8 16.4 57.0 100.0 30
Only sons 4.4 15.7 21.3 58.6 100.0 89
Both daughters and sons 8.9 11.0 17.9 62.2 100.0 246
Total 8.1 12.5 18.0 61.4 100.0 383
Note : Total includes 15 women from age group 15-19, 14 women not currently married, 9 women
working but not for cash, 18 women having no living children, and 2 women with missing information
on the standard of living index, who are not shown separately.
() Based on 25-49 unweighted cases
Not belonging to a scheduled caste, a scheduled tribe, or an other backward class.
Source: NFHS-II, Haryana
(83)
At the end, it is essential to emphasize that the impact of violence upon women is both physical
(physical impairment, even death at the hands of spouses) and psychological (high levels of stress,
even mental disorder). Besides the psychological and physical trauma experienced by battered women,
domestic violence has also led to enormous economic loss for nations. Thus, while developing countries
like Chile are faced with a loss of $1.56 billion in wages as women failed to report for work in the
victimized State, developed countries like the US reported a loss of $ 5-10 billion because of this.4
It is equally noteworthy that the cases registered with the police are not a true index of the
crimes against women as for each case reported, many go unreported. Second, it is difficult to quantify
the covert acts of violence, which result in psychological harm or suffering to the woman. Thirdly, while
women are the victims of overt violence on the one hand, on the other their very subordinated and
discriminated status leads to further overt violence against women. Stopping gender violence requires
looking at and challenging the particular social and cultural norms for femininity and masculinity that
influence inequality in the power relations between men and women. Where women are supposed to
submit and men to dominate, there is likely to be gender violence.
4 The Times of India, August 22, 1999.

(84)
Missing sisters
A shortage of girls will haunt India for decades
IN THE district of Rohtak, a fairly well-off town in northern India�s farm belt, it is estimated that one in every
six girls conceived is aborted. Modern ultrasound technology, coupled with a traditional preference for boys, has
led to mass female foeticide. Progress does not help: rising prosperity, public-education campaigns and strict-
looking laws have all failed to curb the practice. But the resulting dearth of females is already wreaking social
damage, which can only worsen.
Demographers have long puzzled over India�s skewed sex ratio. Throughout the 20th century, it grew ever more
unbalanced, from 972 women for every 1,000 men in 1901, to 927 in 1991. Encouragingly, it then climbed to
933 in 2001. This, however, masked a sharp imbalance among children under the age of seven: from 945 girls
per 1,000 boys in 1991, to 927 in 2001. Data on the sex ratio at birth are scanty, because many births are not
registered. Figures must be gleaned from the ten-yearly censuses, and from local surveys.
These show wide regional disparities. In the south, especially in the State of Kerala, there are many more girls.
But in 48 of India�s 577 districts, the sex ratio among children is below 850. Of these, 34 are, like Rohtak, in
Haryana or its neighbouring State, Punjab. In Rohtak there are 847 females for every 1,000 males, and just 796
girls for every 1,000 boys.
A strong preference for boys is common in agricultural societies. Boys inherit the family name and land, and
provide an old-age insurance policy. Girls join their husbands� families, and need dowries. When mobile ultrasound
units started touring rural Haryana in the late 1980s, their advertising pitch was, appallingly, �Pay 500 rupees
now and save 50,000 later.�
Pramod Gouri, director of Search, a government-financed civic-education outfit in Rohtak, offers two explanations
as to why Punjab and Haryana should be so egregiously prone to female foeticide: the region�s social norms have
proved remarkably immune to �modernity�; and the agricultural �green revolution� put enough money in local
pockets to make sex-selection affordable. Abortion is far more prevalent among better-off, town-dwelling, higher-
caste and literate women. Smaller families have, as in China, also further encouraged female abortion.
In 1994, sex tests were made illegal. But in Haryana only three cases have been filed: the law is hard to enforce,
since ultrasound scans are now widespread. For doctors, there is good money�3,000-5,000 rupees ($60-100) a
time�to be made from (illegal) abortions.
Already, the female shortage is making itself felt. Urmila, a district councillor in the countryside near Rohtak, says
unmarried young men are turning to crime, and violence against women has increased. Some men in Haryana
are buying �brides� (for between 10,000 and 20,000 rupees) from other parts of India, or Bangladesh. There are
an estimated 15,000 such women. Many, though, are treated as slaves. Even their children are shunned.
Despite the shortage of brides, Urmila says that dowries have risen, not fallen. In Rohtak, a middle-class family
will typically spend 600,000-800,000 rupees�several years� earnings. Touring her district, she finds people
anxiously asking her if she knows of any marriageable girls. This, she hopes, may be the first sign of a change
in attitudes. But it may be too late to avoid serious social trauma.
www.economist.com

(85)
ANOTHER WOMEN
Today another woman diedand not on a foreign field
and not with a rifle strapped to her back,and not with a large defense of tanks
rumbling and rolling behind her.
She died without CNN covering her war.She died without talk of intelligent bombs
and strategic targetsThe target was simply her face, her back
her pregnant belly.
The target was her precious fleshthat was once composed like music
in her mother�s body and sung in the anthem of birth.
The target was this life that had lived its own dear wildness,
had been loved and not loved,had danced and not danced.
A life like yours or mine that had stumbled up
from a beginningand had learned to walk and had learned to read.and had learned to sing.
Another woman died today.not far from where you live;
Just there, next door where the tall lightfalls across the pavement.
Just there, a few steps awaywhere you�ve often heard shouting,
Another woman died today.
She was the same girlher mother used to kiss;
the same child you dreamedbeside in school.
The same baby her parentswalked in the night with
and listened and listened and listenedFor her cries even while they slept.
And someone has confused his rage with this woman�s only life.
-Carol Geneya Kaplan

(87)
CHAPTER - VIII
GOVERNMENT PROGRAMMES AND POLICIES FOR WOMEN
The previous chapters reveal the diminished and marginalized position occupied by women in
this highly patriarchal State. This, however, is not to say that the Government of the State is making
no efforts at improving the situation. A number of schemes are running in the State; some of these
are joint initiatives of the Centre and the State , while others are initiated by the State Government
itself. Furthermore, some of the schemes are general schemes, whose benefits are supposed to trickle
down to women, while others are women specific schemes. In this chapter, only the women specific
schemes will be dealt with.
Poverty
Haryana has a relatively low incidence of poverty. Nevertheless, feminisation of poverty is as
much an established fact here as elsewhere. Hence the need for specific poverty alleviation programmes
which have an explicit focus on women. Here, it must be emphasized that while most of the anti-
poverty programmes are general in nature, women, as they are the worse impacted by poverty, form
a special target group of each of these.
Swarnjayanti Gram Swarozgar Yojana (SGSY) is a poverty alleviation programme with a holistic
approach covering all aspects of self �employment such as organizing self-help groups, training, credit,
technology, infrastructure, marketing etc. The target group consists of families living below the poverty
line. Likewise the Sampuran Grameen Rozgar Yojana (SGRY) aims to provide additional wage employment
opportunities to rural poor who are in need of wage employment and desire to do manual and unskilled
work in and around their place of living.
In urban areas Swarna Jayanti Shahari Rozgar Yojana (SGSRY) provides gainful employment to the
urban unemployed and under-employed through setting up of self-employment ventures providing wage
employment through skill development training.
Tau Devi Lal Old Age Pension Scheme provides a pension @ Rs 200 per month to the really poor
and needy p[persons above the age of 60 years. Widow pension scheme is also being implemented to
provide security and financial assistance to widows and destitute women aged 18 and above who have
no other financial support @ Rs 200 per month. An innovative programme lauched by the Government
is that of Devi Rakshak Yojana. Under this scheme, if an earning member of a family dies an unnatural
death, the survivors are given a grant to the tune of Rs 1,00,00. A number of women have benefited
from this scheme since its launching.

(88)
Under Kanyadan scheme, the families belonging to Scheduled Castes/Backward Classes living
below poverty line are given Rs 5100/- on the marriage of their daughter.
Health
As seen in Chapter IV, Haryana has made significant progress on the health front. Yet women
continue to be in the back seat. A number of health programmes are running in the State. Some of
these are national level programmes, which the State is implementing with full gusto. Others are
innovative State schemes launched for specific target groups. Apart from the general programmes
such as National Tuberculosis Programme, Pulse Polio Programme and organizing health camps, a
Swasthya Jagruti Maah was observed from 15th January to 15th February, 2004. During this a 3 day
health Mela was organised in the 10 Parliamentary constituencies in the State.
Apart from these general programmes, the Reproductive and Child Health Programme was
launched in 1997-98 with the aim of providing quality Reproductive and Child Health Services.
Devi Rupak Scheme is an novel scheme which was introduced in 2002 to stabilize the declining
sex ratio. Under the scheme, Rs 500 per month will be given to every couple that have one girl child
for 20 years and have adopted terminal method of family planning. Similarly, Rs 200 per month will
be given to those couples that adopted this method after one male child or after the birth of second
girl child.
An innovative scheme Swasthya Aapke Dwar has been launched in 2003 under which specially
constituted teams of Health Department will visit each village to medically examine and provide
medicines free of cost.
Apni Beti Apna Dhan scheme was another unique scheme initiated by the Haryana Government
with a view to stem the declining sex ratio. Under this scheme, a girl child born to parents living below
the poverty line is provided a Gift Certificate upon her birth which can be cashed upon her attaining
the age of 18 years, provided she remains unmarried. As the scheme is yet young and the beneficiaries
are to attain the age of 18 years, it is too early to assess its impact.
Integrated Child Development Services Scheme is being implemented in 116 blocks through
13546 Anganwari centers , which provide supplementary nutrition to children and pregnant and lactating
mothers. Kishori Shakti Yojana is also being implemented in 85 ICDS projects to provide supplementary
nutrition.
Education
An Education Policy for the State of Haryana was adopted in 2000. It has a three fold target:
ensure excellence in Higher Education; make education forward looking, progressive and job oriented
and to minimize wastages to ensure optimum utilization of resources. Haryana Prathmik Shiksha Pariyojana
Parishad completed the implementation of District Primary Education Programme in June 2003. Sarva
Shiksha Abhiyan, aiming at the universalization of Elementary Education was started in the year 2001-
02 and presently it is going on, in all the 19 districts of the State.

(89)
With a view to enroll and retain children particularly girls, belonging to Scheduled Castes and
Weaker Sections of society, a number of incentives and schemes have been introduced. These include:
Free uniforms to SC/Weaker Sections girls; attendance prize to SC girls; free stationery; among others.
The State Government is also implementing cooked Mid-Day Meal Scheme in a phased manner after
monitoring its impact on education and enrolment, retention and dropout rate of students.
Apart from these efforts are made to provide drinking water and toilet facilities with separate
toilet facilities for girls in all Government .Primary Schools.
Ballika Samridhi Yojana attempts to change social attitudes towards girls.
From the next academic session, 2004-05, it is reported that the State Government will provide
free cycles to the girl students of those villages which do not have middle schools.
Institutional Mechanism
The Department of Women and Child Development is functioning in the State for overall development
of women and children. The Haryana State Commission for Women is functioning to protect the constitutional
and legal rights of women and to improve their status. Haryana Women Development Corporation
attempts to promote activities for development of women, awareness generation, vocational training
and arrange institutional finance for self employment to ameliorate the conditions of women belonging
to weaker sections. It is implementing a World Bank IFAO assisted Swa-Shakti Project, known as Rural
Women�s Development and Empowerment Project.
WAMA, Women Awareness and Management Academy, a State Training Institute is functioning at
Rai, Sonepat for providing training to grassroot level workers.
On the whole, a number of innovative schemes have been launched by the Government of
Haryana for improving the status of women in the State as well as generally for improving the socio-
economic conditions of the weaker sections. However, these schemes have to implemented by functionaries
working very much within the patriarchal mode of the State and in order to effectively implement these
schemes, it is very essential that these functionaries are first sensitized towards women�s issues and
problems. Only then will they approach and apply these schemes in a gender sensitive manner.
Furthermore, it is not enough that a woman be appointed to take charge of the schemes relating to
women, for the woman may herself have absorbed the patriarchal mindset.
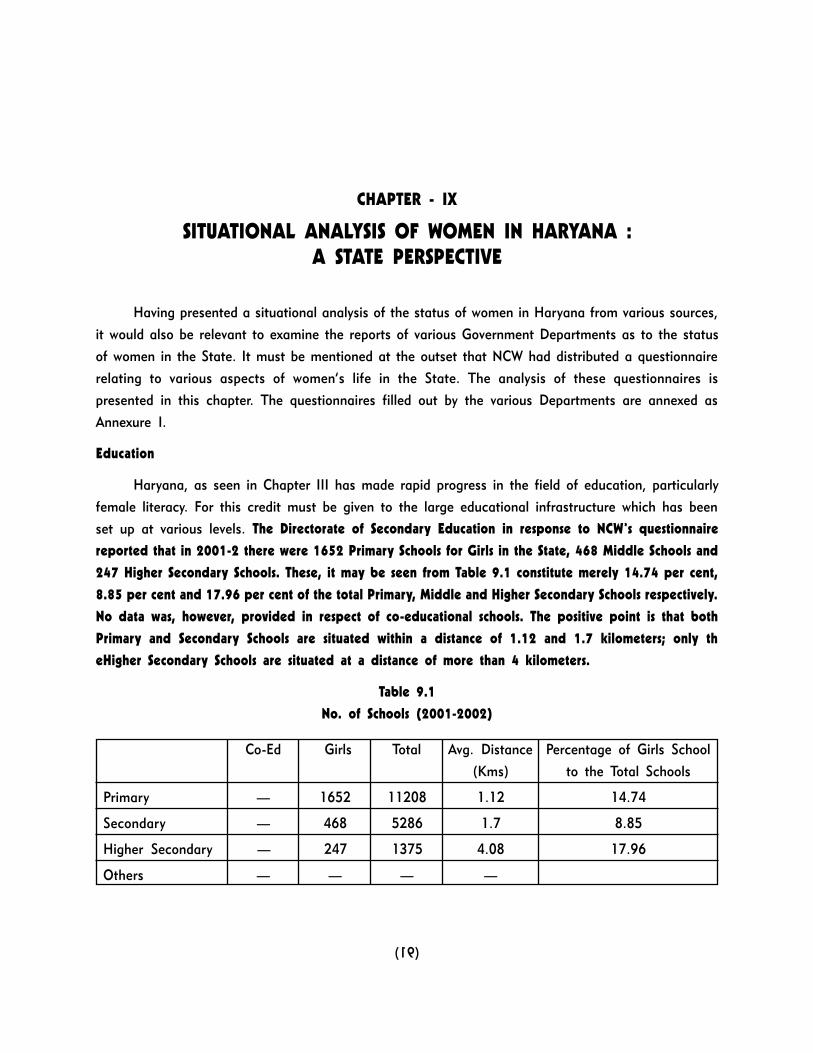
(91)
CHAPTER - IX
SITUATIONAL ANALYSIS OF WOMEN IN HARYANA :
A STATE PERSPECTIVE
Having presented a situational analysis of the status of women in Haryana from various sources,
it would also be relevant to examine the reports of various Government Departments as to the status
of women in the State. It must be mentioned at the outset that NCW had distributed a questionnaire
relating to various aspects of women�s life in the State. The analysis of these questionnaires is
presented in this chapter. The questionnaires filled out by the various Departments are annexed as
Annexure I.
Education
Haryana, as seen in Chapter III has made rapid progress in the field of education, particularly
female literacy. For this credit must be given to the large educational infrastructure which has been
set up at various levels. The Directorate of Secondary Education in response to NCW�s questionnaire
reported that in 2001-2 there were 1652 Primary Schools for Girls in the State, 468 Middle Schools and
247 Higher Secondary Schools. These, it may be seen from Table 9.1 constitute merely 14.74 per cent,
8.85 per cent and 17.96 per cent of the total Primary, Middle and Higher Secondary Schools respectively.
No data was, however, provided in respect of co-educational schools. The positive point is that both
Primary and Secondary Schools are situated within a distance of 1.12 and 1.7 kilometers; only th
eHigher Secondary Schools are situated at a distance of more than 4 kilometers.
Table 9.1
No. of Schools (2001-2002)
Co-Ed Girls Total Avg. Distance Percentage of Girls School
(Kms) to the Total Schools
Primary � 1652 11208 1.12 14.74
Secondary � 468 5286 1.7 8.85
Higher Secondary � 247 1375 4.08 17.96
Others � � � �

(92)
The Directorate of Secondary Education reported that there were no vocational schools functioning
in the State for boys or girls. It was also reported that there were no non-formal educational centers
catering to girls, or any female adult education centers. A slight lack of coordination may be noticed
among the various Departments in that there is a Department of Vocational Education, which is
running institutes fo vocational education. The confusion probably arises from the fact that different
Departments filled out the questionnaires relating to their specific field and did not consider the overall
aspect of the issue. A special note was made that girls can study in all of the boys� schools in the
State.
Table 9.2
No. of Females Enrolled at Different Levels
1999-2000 2000-2001 2001-2002
Primary 15.28% 20.92% 30.53%
Secondary 26.27% 22.14% 19.67%
Higher Secondary 21.54% � 1.93%
Vocational Schools � � �
Non-Formal Centers � � �
Female Adult Education Centers � � �
Others � � �
The information regarding the enrolment percentage too seems to be incomplete. A comparison
with the statistics presented in the previous chapter reveals a discrepancy in as much as the enrolment
ratios presented in Chapter III are considerably higher. It was reported that for the years 1999-2000,
2000-2001 and 2001-2002, there were no women enrolled in any distance education centers or in any
correspondence courses.
Table 9.3
No. of Teachers at Different Levels
Sanctioned In Position
Primary & Secondary 52547 �
Higher Secondary & Vocational 62200 59310
Non-Formal Centers � �
Female Adult Education Centers � �
Others � �
The Directorate of Secondary Education supplied no gender segregated information regarding
the number and percentage of teachers appointed at different levels. Nor was there any information
regarding the availability of buildings for existing education institutions. The only information available

(93)
was regarding Secondary schools, which Stated that there were no Kuccha buildings and all the
existing (3920) were Pucca.
However, a number of incentives are provided for increasing the enrolment ratios and retaining
girl children in schools. These include: Free uniforms for SC/BC/Other weaker sections, female education
is being encouraged in the State by starting separate primary, middle, high and senior secondary
schools for girls. So far, 89,000 girls have benefited under this scheme.
Vocational Education
The Director of Industrial Training and Vocational Education (EDUCATION) reported that there
were 25 Industrial Training Institutes for Women(ITIW), while 6 ITI�s had special women�s wing attached
to them. In 1999-00, there were 2032 women enrolled in ITIW. In 2000-01 there were 1932, and in
2001-02 the number increased to 2153. Between the ITI (W) and the ITI (WW), 151 teachers have
been sanctioned, but there only very few have been appointed. The exact figures have been: 114 in
1999-00, 11 in 2000-01 and 103 in 2001-02.
It was further reported that there were 118 co-ed schools for vocational training, but none
especially for girls. Furthermore, there were no non-formal educational centers catering to girls.
Mention was made of special incentives for girls in vocational education. However, the only
incentive which was specifically mentioned was a stipend of Rs. 100 to SC candidates and Rs 45 to
general candidates.
Welfare Schemes
The Director of the Welfare for SC&BC and Haryana State Social Welfare Advisory Board (Welfare
Schemes For Women Below The Poverty Line, Including Slum Dwellers And Welfare Of SC�s And BC�s)
reported that no separate component plan for SC women is prepared, but schemes are being implemented
for the welfare of SC women. The various schemes are:
● Education : Various educational incentives are being provided which include: scholarships, prizes
for attendance, free uniforms and stationary, etc. For upgrading of educational standard of
meritorious scheduled Caste students residing in rural areas, a Scheme of providing free residential
facility is being provided in the cities. Under the scheme, a scholarship @ Rs 700/- per month
is given. In addidition to this Rs 2,000 per annum is given for purchase of books and Rs 1500
per annum for other miscellaneous expenditure. Similarly remedial and special coaching is
provided to Scheduled Caste students at school stage for their academic improvement before/
after school hours. The girl students belonging to SCs are also drawing all the benefits along
with other students under these schemes. Further to encourage Scheduled Caste girls students,
merit scholarships @ Rs 80/-, Rs 100/-, Rs 120/- and Rs. 140/- per month is given to the
students of 9th, 10th, 11th, and 12th classes respectively.
● Employment : To provide employment opportunities to Scheduled Caste women, tailoring training
is provided to Scheduled Caste widows/destitute women/poor girls in 108 community centers run
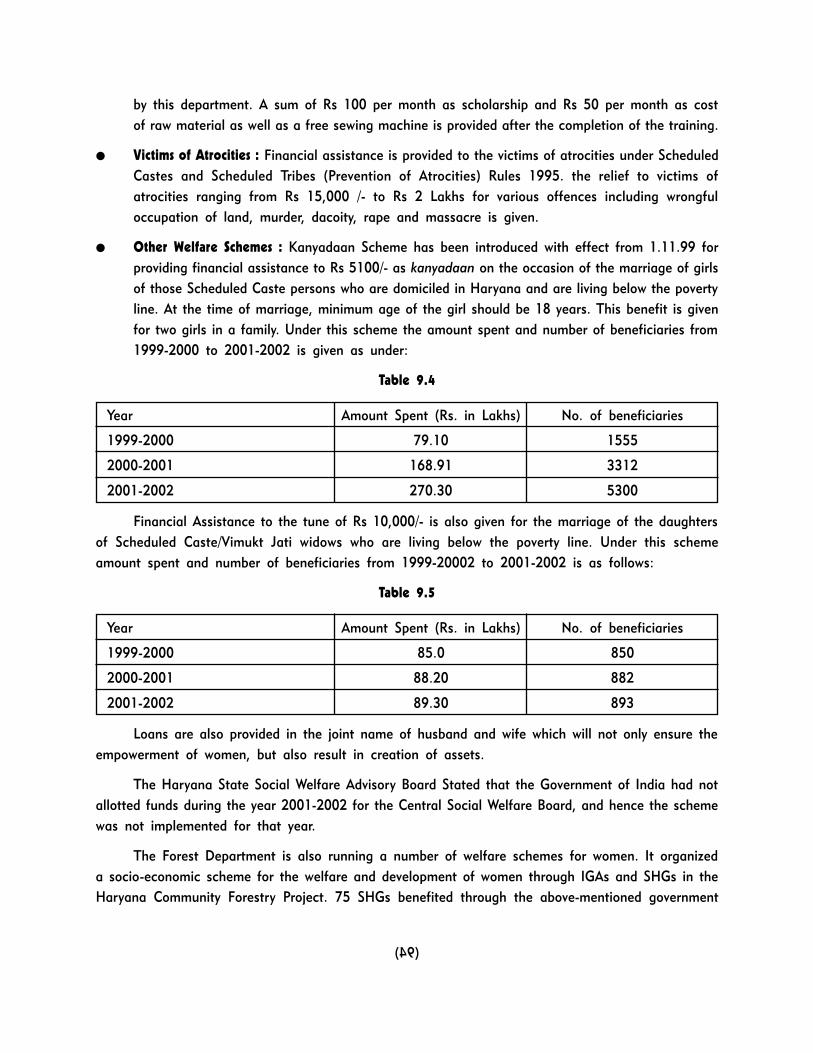
(94)
by this department. A sum of Rs 100 per month as scholarship and Rs 50 per month as cost
of raw material as well as a free sewing machine is provided after the completion of the training.
● Victims of Atrocities : Financial assistance is provided to the victims of atrocities under Scheduled
Castes and Scheduled Tribes (Prevention of Atrocities) Rules 1995. the relief to victims of
atrocities ranging from Rs 15,000 /- to Rs 2 Lakhs for various offences including wrongful
occupation of land, murder, dacoity, rape and massacre is given.
● Other Welfare Schemes : Kanyadaan Scheme has been introduced with effect from 1.11.99 for
providing financial assistance to Rs 5100/- as kanyadaan on the occasion of the marriage of girls
of those Scheduled Caste persons who are domiciled in Haryana and are living below the poverty
line. At the time of marriage, minimum age of the girl should be 18 years. This benefit is given
for two girls in a family. Under this scheme the amount spent and number of beneficiaries from
1999-2000 to 2001-2002 is given as under:
Table 9.4
Year Amount Spent (Rs. in Lakhs) No. of beneficiaries
1999-2000 79.10 1555
2000-2001 168.91 3312
2001-2002 270.30 5300
Financial Assistance to the tune of Rs 10,000/- is also given for the marriage of the daughters
of Scheduled Caste/Vimukt Jati widows who are living below the poverty line. Under this scheme
amount spent and number of beneficiaries from 1999-20002 to 2001-2002 is as follows:
Table 9.5
Year Amount Spent (Rs. in Lakhs) No. of beneficiaries
1999-2000 85.0 850
2000-2001 88.20 882
2001-2002 89.30 893
Loans are also provided in the joint name of husband and wife which will not only ensure the
empowerment of women, but also result in creation of assets.
The Haryana State Social Welfare Advisory Board Stated that the Government of India had not
allotted funds during the year 2001-2002 for the Central Social Welfare Board, and hence the scheme
was not implemented for that year.
The Forest Department is also running a number of welfare schemes for women. It organized
a socio-economic scheme for the welfare and development of women through IGAs and SHGs in the
Haryana Community Forestry Project. 75 SHGs benefited through the above-mentioned government

(95)
schemes. A total of 1092 women thus benefited in 2001-02.
Under the Haryana Community Forestry Project women experienced in nursery techniques are
being identified to assist the Department in raising fruit plants. They will be provided with inputs like
seeds, compost, polythene bags etc. They will also be given the know-how for raising species required
for the project. All healthy seedlings will be purchased by the project at a price after deducting the
cost of inputs provided earlier.
Grassroots Empowerment
In accordance with eh 74th Amendment to the Constitution of India elections to the various
urban local bodies were held in December 1994, June 1998, April 2000 and April 2002. However, no
information was provided by the Director, Urban Development Programme as to the number of seats
contested by women representatives. The seats won by women were as follows: SC- 55, ST- nil, OBC/
BC- 40 and General- 211.
Table 9.6
No. of Women Office Bearers
Chairman Vice Chairman Vice-Chancellor
SC ST OBC GEN SC ST OBC GEN SC ST OBC GEN
4 � 2 11 � � � 2 NA NA NA NA
The need for training of these women entering the decision-making sphere at the grassroots
level is emphasized by scholars as well as activists in the field. However, no regular arrangement for
training women for urban administration has been made as yet by the State Government according to
the Director, Urban Development Programme. Nevertheless, the Department sponsored a total of 16
women representatives in the Centre for Research in Rural and Industrial Development, Chandigarh
and 266 women representatives in HIPA, Gurgaon for various training courses in 2001 and 2002.
The Director of Panchayats reported that the total participation of women in local self-government
was 21373. The State Government has held elections to the various tiers of Panchayats as per the 73rd
Amendment to the Constitution on 12 March 2000 and 16 March 2000.
Table 9.7
Women Representatives
Level Seats Contested Seats Won
SC ST OBC GEN SC ST OBC GEN
Gram Panchayat
Sarpanches 1203 � � 805 1203 � � 805
Panches 11846 � � 6510 11846 � � 6510
Total 13049 � � 7315 13049 � � 7315
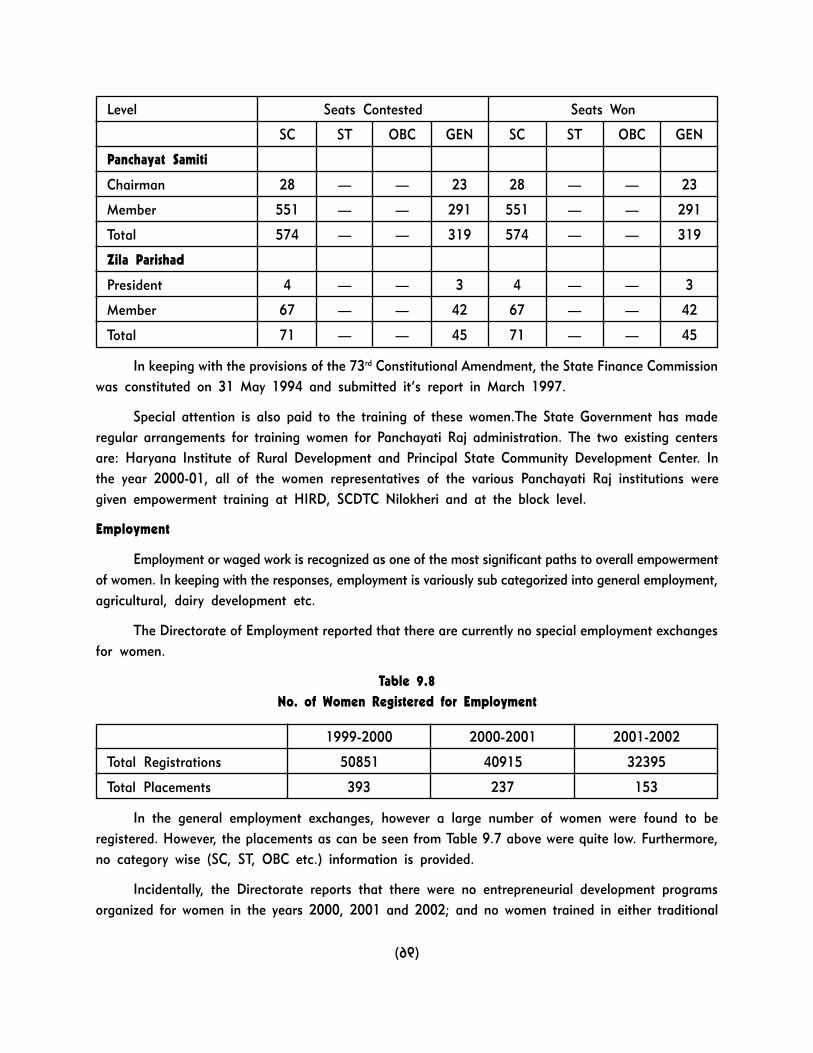
(96)
Level Seats Contested Seats Won
SC ST OBC GEN SC ST OBC GEN
Panchayat Samiti
Chairman 28 � � 23 28 � � 23
Member 551 � � 291 551 � � 291
Total 574 � � 319 574 � � 319
Zila Parishad
President 4 � � 3 4 � � 3
Member 67 � � 42 67 � � 42
Total 71 � � 45 71 � � 45
In keeping with the provisions of the 73rd Constitutional Amendment, the State Finance Commission
was constituted on 31 May 1994 and submitted it�s report in March 1997.
Special attention is also paid to the training of these women.The State Government has made
regular arrangements for training women for Panchayati Raj administration. The two existing centers
are: Haryana Institute of Rural Development and Principal State Community Development Center. In
the year 2000-01, all of the women representatives of the various Panchayati Raj institutions were
given empowerment training at HIRD, SCDTC Nilokheri and at the block level.
Employment
Employment or waged work is recognized as one of the most significant paths to overall empowerment
of women. In keeping with the responses, employment is variously sub categorized into general employment,
agricultural, dairy development etc.
The Directorate of Employment reported that there are currently no special employment exchanges
for women.
Table 9.8
No. of Women Registered for Employment
1999-2000 2000-2001 2001-2002
Total Registrations 50851 40915 32395
Total Placements 393 237 153
In the general employment exchanges, however a large number of women were found to be
registered. However, the placements as can be seen from Table 9.7 above were quite low. Furthermore,
no category wise (SC, ST, OBC etc.) information is provided.
Incidentally, the Directorate reports that there were no entrepreneurial development programs
organized for women in the years 2000, 2001 and 2002; and no women trained in either traditional

(97)
or non-traditional entrepreneurial skills in the years 2000, 2001 and 2002. As there were no women
trained, there was no information on how many of them were either employed or self-employed. Nor
have there been any surveys conducted recently for finding the potential for females in non-traditional
areas such as electronics, Para-medical areas, agro-industries etc.
Apart from these, the setting up of a complaints Committee to deal with cases of sexual
harassment at the workplace is still pending. The only benefit which is provided to women workers is
maternity leave, which is granted as per the established rules. There are no guidelines/orders to initiate
special incentives for providing facilities such as crèches, education, separate toilets, lunch facilities
etc. to female employees/laborers at the work site.
Agricultural Employment
Agricultural sector continues to be the major employer of women. Nevertheless , not only are
very few women actually owners of the land which they till, nor are there many special training
programmes directed at them. The Directorate of Agriculture reported that two main programs for the
entrepreneurial development of women had been launched. These are Women in Agriculture programme,
which is a central Government sponsored programme running in Hansi, Hisar and Tohana and Capacity
Building Programme, which is running in Kandi Area. The second programme has benefited 600
women both in 2000-01 as well as 2001-02. Another programme, which is cited by the Directorate
has no connection with Agriculture, that is Setting up of Stitching Centres in Villages. Twenty women
facilitators have been recruited in a project on contract, in order to strengthen women�s participation
in the organization in the form of SHGs and capacity building.
The Department also reports:
�Apart from these programmes Integrated Watershed Development (Hills-II) Project is being
implemented in Haryana with the objectives of increasing productive potential of the area using
community participatory approaches. For achieving these objectives, village level institutions called
Village Development Committees (VDC�s) are being formed and registered under Societies Registration
Act. To strengthen women�s participation in these VDCs, 50 per cent of the members are women with
at least 33 per cent women members in the VDC executive. Further they are being organised to form
Self Help Groups and so far 125 SHGs have been formed in project villages in addition to already
existing groups formed by DRDA and other agencies.
For upliftment of women and other disadvantaged groups lots of stress is being laid on their
capacity building. There is a lot of demand for training in stitching and tailoring especially in villages
which are inaccessible. Stitching and tailoring centers which are being run by women from the village
only have been in operation in 85 villages and so far 1729 women have been trained. The women so
trained are able to stitch their own clothes and of their children and are thus able to save their
expenditure. In addition about 10 women form different villages have also taken up stitching as income
generating activities handout of these 6 women are from Scheduled Caste. Women in 10 villages have
been given training in candle making, durrie making and dyeing of dupattas using tye and dye method

(98)
to take these up as IGA. The women have also been imparted training on Food Preservation and
nutritional aspects.
Furthermore, as the table below reveals very few women have received training. The number of
women receiving training in traditional skills is almost negligible, while that of non-traditional skills is
slightly, though only marginally better. The Directorate reports that a study was conducted on the
potential and viable income generating activities available for women, landless, and the disadvantaged
groups in the Kandi region of Haryana, however, the conclusions of the study are not presented in the
report.
Table 9.9
No. of Women Trained in Traditional & Non-Traditional Entrepreneurial Skills
Year Traditional Non-Traditional
1999-00 10 152
2000-01 25 490
2001-02 30 575
A committee headed by a Class I officer has been constituted to redress any complaints regarding
the sexual harassment of women working in the agricultural department. The directorate also reports
granting of special facilities such as maternity leave, casual leave etc. as per the rules of the Haryana
Government. Separate toilets have been provided to women workers. Separate space in the canteen
has also been provided to them. The latter facilities probably refer only to women working in the
Directorate itself, because there are and cannot be any separate canteen or toilet facilities for women
working in the fields.
The Dairy Development Department too provides special self-employment programs for educated/
uneducated young men and women from rural as well as urban areas. In 2000-01, the number of
female beneficiaries was 156, and in 2001-02, the number was 337. In 1999-00, 251 women were
trained in traditional entrepreneurial skills. In 2000-01 the number was 195, and in 2001-02, it
increased manifold to 422. Due to the nature of the program (self-employment), of that number of
trained women, nil were employed and the following were self-employed: 201 in 1999-2000, 156 in
2000-01 and 337 in 2001-02.
ATROCITIES AGAINST WOMEN
The Police department has separate cells for dealing with rape, abduction, dowry deaths, sexual
harassment etc. of women. It reported that it has recorded the following cases:

(99)
Table 9.10
Type of Crimes No. of Female Victims
2000 2001 2002
Rape 409 387 230
Abduction 289 318 223
Dowry Death 253 259 155
Sexual Harassment 517 477 357
Domestic Violence 1169 1345 905
Bigamy 14 13 11
Women in Prisons
A number of reports at the all �India level have gone into the state of affairs of prisons in India.
The special needs of women need to be addressed in a special manner. In this context the Director
General of Prisons responded that out of 18 jails, female inmates are lodged in 6.
The approved capacity of jails during 2001-02 was 4019 (male) and 117 (female). However, the
actual number of inmates lodged during this time was 10,084 (male) and 403 (female).There were 155
female under trials kept in the jail custody/remand homes for up to 6 months, 65 kept for 6-10 months
and 66 kept for over 10 months. However, contrary to allegations there were no physically or mentally
handicapped women inmates during the years 2000-01 or 2001-02.
Furthermore, it was reported that hospitals have been setup in the jails to attend to sick
prisoners. Each jail hospital has a post of medical officer and pharmacist and specialists from civil
hospitals visit the jails regularly. Separate arrangements are made to ensure a special diet for women
prisoners who require it. Such measures are implemented on the recommendation of the presiding
medical officer.Sanitation facilities have also been provided. Specifically there are 43 latrines, 1 urinal
and 32 baths.
Attempts are also made to educate the inmates and there are two female teachers posted (to
educate female inmates) in B.I. and J. Jail Hisar. A number of recreational facilities such as sports/
games/yoga, music/prayers, TV/radio, religious discourses, libraries and other cultural activities exist
for the female prisoners.
However, there are no rehabilitation programs run by the jails after the release of women
prisoners, as the department claims that their families supervise and handle caring for them. Nevertheless,
during 2001-02, 96 women prisoners were engaged in vocational occupation activities. The wages paid
to them were: Rs. 16 per day (skilled) and Rs. 10 per day (unskilled).
In the event that female under trials are accompanied by children, special provisions are made.
Only children upto the age of 6 are allowed. Accommodation, food as well as medical care/nursing

(100)
is provided, but education is not. Female under trials are allowed to meet with their families twice a
week and with their friends eight times a month. Female convicts are allowed to meet with their
families once a week and with their friends four times a month.
It was reported that NGOs frequently visit the jails to interact with the prisoners and present
programs on AIDS awareness, Vipasana, Art of Living, spiritual discourse and Yoga.
The inmates also have the opportunity to air their grievances through three main channels:
Complaint boxes, Direct reporting and Periodical reporting. Certain appointed advocates provided
women prisoners free legal aid during 2001-02. 36 women benefited under this provision.
To conclude, the Government of Haryana has made a lot of efforts to improve the situation of
women. Yet women continue to be subordinated and suppressed. Statistics may often hide more than
they reveal as becomes obvious from the next chapter which shows the NGO Perspective on the
Situation of Women in Haryana.

(101)
CHAPTER - X
STATUS OF WOMEN IN HARYANA : NGO PERSPECTIVE
Statistics reveal one part of the story of women in Haryana. It is, however, the people working
in the field and at the grassroots level who are able to tell of the day to day problems faced by women.
In order to get the perspective of such NGO�s working in Haryana, a two fold approach was adopted:
one the Haryana State Commission for Women, at the behest of National Commission for Women,
organised a Consultation with NGOs.Second, a questionnaire was distributed amongst the NGO�s of
the State and their responses were sought on various issues and concerns of women. Accordingly, the
present chapter is divided into two sections, the first presents a concise report of the Consultation and
the second deals with the NGO responses to the issues and concerns of women.
NCW Consultation with NGO�s : A Report
The Consultation was organised on April 22, 2003 with the basic objective of assessing the
progress of development for women in the State. 68 NGO�s from all the 19 Districts of Haryana
participated in this Meeting which was inaugurated by Sh.Om Prakash Chautala, Honourable Chief
Minister of Haryana. In his Inaugural Address, he referred to various schemes and policies of his
Government for women�s empowerment. The highlight of his address was his declaration that in the
coming elections his party would give thirty-three percent tickets to women candidates.
The Meeting brought to light the women�s concerns of grassroots levels relating to multifarious
issues impacting women. The Workshop was divided into three sessions: Women in Difficult Circumstances,
Socio-economic empowerment of Women and Political Empowerment of Women. The concerns, issues
and suggestions, which emerged from all the three sessions are given hereunder.
Education
One of the major problems highlighted was that of illiteracy, accompanied by lack of vocational
or skill training. It was stressed that socio-cultural taboos resulted in girl-children not being sent to
school. The presence of Ballika Mandals not withstanding, people are simply not willing to send girls
to school. The problem, it was emphasised, was further exacerbated by the absence of middle schools
at close places. As a result most of the girls drop out after primary school.
Further the existing schools suffered from lack of teachers. Many of the schools in the State
have only one teacher for many classes. It was also stressed that some places had no separate
Government Colleges for girls.

(102)
A positive factor which emerged was the effort of an NGO in Gurgaon to try and get rag-pickers
to attend school. It had asked the schools to open their doors in the afternoon. About 25 schools had
come forward for this.
Employment/ Economic Issues
Economic independence or lack of it was identified as a major obstacle in empowerment of
women. Some of the NGO�s reported that women are not getting the minimum wages fixed by the
State. One NGO from Sonepat alleged that women were merely paid Rs 15-20 Rs for working eight
hours. Men are also paid less than the minimum wages but higher than the wages paid to women.
Lower wages for women is accompanied by lack of control over money . women have no access to
liquid cash, are insolvent and hence have nothing to fall back upon in cases of emergency.
The issue of child labour also came up and the high prevalence rate of child labour in Haryana
was brought to the notice of the house.
Various obstacles which prevent women from working outside the house were also identified. The
most significant one which was emphasised was the lack of crèches.
While Self-Help Groups were posited as solution to women�s economic problems, a number of
impediments were identified in setting them up. These included:
� Women are not able to make decisions on their own
� Caste considerations come into play. Ultimately SHG�s which come into existence are divided on
the basis of caste.
� The SHG�s work under the shadow of men who are curious and suspicious of what the womenfolk
are doing.
Health
The declining sex ratio in Haryana is an obvious indication of the prevalence of female foeticide.
Yet no cases are registered under the PNDT Act. The Consultation with NGOs highlighted the continued
prevalence of female foeticide, notwithstanding the PNDT Act. It was alleged that the midwives (dais)
take the women to private nursing homes and get their pieces of silver, and abortion is done in these
nursing homes.
Son preference in the region is so strong that quacks have resorted to advertising that they can
guarantee the birth of a son. One such advertisement titled �Putra Daata Aushdalaiya� in Yamunanagar
was brought to the notice of the house.
It was also admitted that in Kurukshetra the Chief Medical Officer was taking strict action and
no ultrasound could be done without producing a doctor�s slip.
Another major problem identified was the prevalence of nutritional anaemia among women. One
of the causes was identified to be marriage at a young age of 15-16 years and quickly bearing a child.
Furthermore most of the deliveries are not conducted in institutions or even by trained professionals.

(103)
The health status of Minority women was found to be particularly backward. There was high rate
of prevalence of anaemia, leucorrhia, TB,Cervical Cancer etc.
Social Problems
Apart from these health and education related problems, a number of social problems were
highlighted. Second Marriage by males without divorcing the first wife was recognised as a major
social problem. The cause was mostly found to be economic; a working woman was chosen as the
second wife, while the first non-working wife was relegated to the background. Cases of desertion of
women by their husbands were also highlighted.
There was a division of opinion regarding the prevalence of child marriage in the State. Some
NGO�s alleged that it was occurring with impunity, others held that there was no child marriage in
Haryana.
Not only is a girl child neglected, but cases of the girl child being abandoned were also
highlighted. There were also newspaper reports of a father selling his two minor daughters to repay
a debt.
Punjab and Haryana are two States where the practice of chador andaazi is quite prevalent. An
incident of an elder brother taking the younger brother�s wife, upon the latter�s death, and trying to
get his own wife certified insane was highlighted.
It was also observed that many areas of the State had no sanitation facilities for women. This
was particularly true of rural areas. This has an adverse impact on women�s health as well as leads
to increased incidence of violence against women. Some of the Districts, it was declared, also have
no nari niketan.
Atrocities against Women
It was alleged that Government officials/ politicians played a mischievous role in most cases of
atrocities against women. The village Panchayat too was held to be guilty in sheltering persons
indulging in atrocities against women.
Interestingly,it was alleged that many of the dowry cases filed under Section 498 A of the IPC
were fake.
Jind, Rohtak and Hissar districts have a tradition called Seedi Pratha which implies bonded
labour. Such bonded women labourers are subject to sexual harassment. In Mahendragarh District,
bonded labour is employed in agriculture. The upper caste men folk use them for sexual gratification
and run a veritable brother particularly in border districts.
Custodial Justice
The behaviour of the police, it was alleged was mostly apathetic and their language abusive. So
women, for the most part did not want to go to the police with complaints. One NGO complained that

(104)
when they sent any case to the Crimes against Women Cell of the local police station they were not
informed about its outcome.
Participation of Women in Local Self-Government/Panchayats
The 73rd and 74th Amendments to the Constitution have brought a large number of hitherto
apolitical women into the political landscape. Yet in Mahendragarh, it was stated that none of the
unmarried girls cast their vote.
However, at the same time, it was also asserted that reservation has sufficiently empowered
women, that they are now beginning to get their work done. Women are now becoming more assertive
and aware. Official sources revealed that a number of training programmes for elected women are
being conducted.
Emphasis was again laid on formation of self help groups. It was asserted that once women
become economically empowered, they also become socially empowered.
Disabled Women
There is no support for mentally challenged women. A case of Rewari was highlighted where a
mentally challenged woman who roamed the streets, got pregnant and delivered a child. When authorities
were asked to admit her to an asylum, questions were raised as to her guardians. The issue raised
was that if she had a guardian, she would not be roaming the streets.
Miscellaneous
It was found that most of the NGOs were not aware of many programmes and policies for
women�s welfare. For instance only 3 were aware of the provision for Dowry Prohibition Officer and
6 were aware of the provision for Rescue Officers under PNDT Act.
It was also asserted that Government schemes do not reach the rural areas. This was disputed
by the woman Sarpanch of Raipur Rani who maintained that she is able to carry out all developmental
works in her village. Emphasis was laid upon organising capacity Building Programmes during which
awareness should be given about Governmental schemes and activities. Another NGO stressed the
need to sensitise NABARD and other financial institutions which are not cooperating with SHG�s.
Last, but not the least they lamented about Political interfenerence in NGO�s, which does not
let them work effectively and freely.
Suggestions
A number of workable suggestions for improving the status of women in Haryana emerged from
the Consultation with the NGO�s. These include:
● Women should be given training in some professional skills.

(105)
● 70-80% of the time of women is spent on agriculture and agriculture related activities. However,
most of the training given to them is on things like stitching, tailoring, beauty courses, etc. Such
training, it was emphasised should be agriculture linked.
� Women could be trained to undertake organic farming and make vermi-compost.
� Women could also be given training to make value addition to Dairy products, e.g. making
different varieties of cheese.
● Make self-help groups.
● The need to diversify training programmes so as to include non-traditional aspects was emphasised.
● Need to have shelter homes for those afflicted with HIV/AIDS
● It was suggested that Distance Education mode be used for training the elected women. A short
term Certificate Course could be started on Local Governance and Political Empowerment for
elected women and those who want to contest elections.
Status of Women in Haryana : the NGO Perspective
Apart from the Consultation Meeting with the NGO�s, a questionnaire was also distributed to
them to solicit their views and observations on various issues impacting women. An analysis of these
questionnaires is presented hereunder.
� A total of 31 NGOs responded to the questionnaires. Their areas of focus were as follows:
(a) Education � 27
(b) Health � 24
(c) Legal � 15
(d) Visually, orthopedically, hearing, mentally challenged � 14
(e) Campaign against social practices � 20
(f) Prostitution � 4
(g) Water management � 12
(h) Upliftment of socially oppressed women � 17
(i) Improving the condition of women in jails � 5
(j) Improving the condition of women in asylums � 5
(k) Domestic violence � 11
(l) Sexual harassment � 9
(m) Campaign against alcoholism � 13
(n) Nariniketan � 6
� Some NGOs are operating under an even wider scope. Other areas of focus include: Vocational
training [DISHA- Sirsa and HPSWS- Hisar], craft centers for rural women and children [BGMS-

(106)
Fatehbad], aged welfare skill development [CVS- Rohtak], youth programmes for the girl child
[NNWS- Rewari], socio-economic development for women [SVPK- Bhiwani], capacity building
and promoting local governance [PRIA- Panchkula], Self-Help Groups (SHGs) and Income-Generating
Activities (IGAs) [The Rationalist Society- Yamunanagar].
� Eleven of the NGOs had recently carried out work for the NCW. These programs covered the
following areas:
(a) Cutting and tailoring course [SDET- Jhajjar and LGUM- Kaithal]
(b) SHGs, IGAs, and health camps [VGUM- Panipat and HDES- Bhiwani]
(c) Child rape, and other rape cases [ICSW- Chandigarh and NSKSA- Jind]
(d) Organizing Lok Adalats [Bharitya Mahila Kalyaan Smiti]
(e) AGP [Reeds- Ambala Cantt.]
(f) Setting up family counseling centers [AIMSS- Rohtak]
(g) Education in the slums [The Rationalist Society- Yamunanagar]
� Two of the NGOs had carried out work for the State Commission ffor Women. The two projects
that were organized are:
(a) A perspective plan for the women of Haryana [Reeds- Ambala Cantt.]
(b) Setting up family counseling centers [AIMSS- Rohtak]
� Some of the NGO�s managed a number of facilties such as Old Age Home, Short Stay Home,
Rehabilitation Center, Female Adult Education Center, Day Care Center for the Aged, etc.
EDUCATION
The NGOs were asked to evaluate the various aspects of education within their districts. The
findings of the 19 NGOs that responded are summarized below.
� Roughly half of the NGOs thought that the numbers of schools for each level (primary, secondary,
middle and higher studies) were sufficient.
� 35% felt that the condition of the school building was poor, 20% felt it was average, 35% felt
it was satisfactory, 12.5% felt it was good and only 2.5% believed it was very good.
� When asked about the condition of basic amenities available for the students such as toilets,
water, transport, medical facilities etc., 45% thought they were poor, 25% thought they were
average, 15% thought they were good and a meager 5% thought they were very good.
� 65% of the NGOs reported that all the posts of teachers were filled in the schools, while 35%
reported some vacancies.
� When asked to assess the quality of teaching, most of the NGOs (45%) thought it was average,
15% thought it was good, 25% thought it was satisfactory and 15% thought it was poor.

(107)
� Quite favorably, 75% reported that there were special incentives for children in their districts,
and 25% felt that there was a great need for improvement in this area.
� Around 55% of the NGOs thought that there were sufficient science secondary schools/colleges
for girls. However, a large percentage (45%) believed that the facilities are nowhere near adequate
in their districts.
� Grimly, 85% of the NGOS reported that there were no female adult education centers within
their districts, and only 15% reported that they were present.
� On a more positive note, 100% of the NGOs reported that there were no scams or malpractices
within the education system that they were aware of.
� Most alarming however, were the figures for the rate of school dropouts. A staggering 45% of
the NGOs reported a dropout rate of over 20% in their districts, 10% reported a rate between
15-20%, 30% reported a rate between 10-15% and 15% reported a dropout rate between 0-5%.
Among the reasons provided for these enormous dropout rates the main causes are:
(a) Family problems and school environments
(b) Lack of awareness, dire poverty, mentality of the
(c) Children want to work and earn money
(d) Long distances, the middle and high schools are far away
Suggestions
The NGO�s made a number of workable suggestions for improvement in the field of education.
These include:
(a) The school staff should be sensitized
(b) Non-formal schooling for dropouts
(c) More NGOs should involve themselves to ensure better communication and prevent dropouts
(d) Short-term courses and more vocational training should be provided
(e) Free and equal education for all must be implemented
(f) Efforts should be made to evolve better guidance and awareness among the population
to decrease the dropout rate.
EMPLOYMENT
� Only 19 NGO�s responded to the questions relating to employment. Of these only one said that
there was a special employment exchange for women in the district while all the other 18
reported that there were no such separate employment exchanges. A majority of the responses
consisted of suggestions for improving the current situation of employment. These were:

(108)
(a) There is a dire need for making good career guidance programs available and accessible
(b) There should be measures taken to bring about a marked increase in self-employment and
awareness among women
(c) There should be co-operative facilities available where women can sell the products they
produce
� However, when asked if these suggestions had been made to the State authorities, all of the
NGOs reported that they had not done so.
ATROCITIES AGAINST WOMEN
� Around 60% of the NGOs who responded, reported that there were no arrangements for dealing
with complaints relating to sexual harassment at the workplace. 40% reported that they did have
some sort of facilities to deal with such complaints, and had successfully dealt with reported
cases.
� More than half (67%) of the NGOs found that there were no social security measures for women
workers covering maternity benefits, health, unemployment or accidents at their place of work.
33% reported that at least one or two of the aforementioned benefits were available to working
women in their districts.
� The condition of availability of facilities such as crèches was also dismal according to the NGOs.
Overall, only 18% reported that such facilities were available in the unorganized sector, while the
remaining 82% said that there was no such provision.
� In the matter of whether they were satisfied with the enforcement agencies� action against the
victimization of crimes such as rape, abduction, dowry death etc. against women, only around
40% of the NGOs said that they were. The rest indicated that it was not up to par. Certain
specific areas of concern, which they believed needed immediate attention included:
(a) Cases of domestic violence
(b) Child marriages and female illiteracy
(c) Dowry deaths
� It was reported by approximately half of the NGOs that their districts had a woman police cell
in every thana. Some of the other NGOs mentioned that they had suggested this to higher
authorities and it was under consideration.
� Among this 10%, 4/5th confirmed that they had taken some follow-up action to the complaints
of sexual harassment brought forth to them, while 1/5th said that they took no action.
FAMILY COURTS
� When asked about the condition of family courts in their respective areas of work, most of the
NGOs [20 out of 31] said that they were unaware of the existence or functioning of any.

(109)
� Out of the remaining NGOs that did have information, only 4 reported the existence and working
of family courts, while the other 7 said that there were no such courts set up in their districts.
� It was also reported that only one of the four believed that the working of these family courts
was satisfactory, while the remaining believed there was need for improvement if they were to
be effective.
� Further, all these NGOs reported that there wasn�t a single woman judge in any of the established
family courts.
� Information was also gathered on the setup and working of Mahila Courts in the various districts
of Haryana. Similar to the question on family courts, a large percentage of the NGOs said they
were unaware of any such courts but distressingly, all of the NGOs whom did have information,
reported that there were none functioning at all.
TRAFFICKING
Trafficking in women, as highlighted in the chapter on Violence Against women has become a
major social issue in Haryana, particularly in the context of declining sex ratio. Twenty NGOs responded
to the questions on trafficking of women.
� When asked if there were any known red light areas in their districts, 98% said no, while the
remaining 2% said that certain known areas did exist. However, most of the NGOs, who reported
that there weren�t any known red light areas, made a special mention that there were indeed
illegally active areas.
� 75% of the NGOs reported that they were not at all satisfied with the working of the special
police officers or rescue officers under the PITA. In fact, some NGOs even expressed that such
officers while present, did not fulfil their duties, while others even said that they had no information
regarding these officers, thereby indicating their abstinence from work.
� Furthermore around 3/4th reported that a State Advisory Board for checking trafficking had not
been set up in their districts, while 1/4th relayed that they didn�t have any knowledge pertaining
to the issue and were thus, unaware of the necessity of it�s existence.
CUSTODIAL JUSTICE
� Most of the NGOs seemed to have extremely limited knowledge on the subject of custodial
justice. Only 9 out of the 31 NGOs responded to the questions, and even these expressed a lack
of information on the topics concerned.
� 90% of the NGOs reported that there wasn�t a separate jail for women. Roughly half of these
NGOs mentioned that the construction of such a facility had been under consideration, but there
was no word on whether any concrete plans had materialized.
� The NGOs unanimously stated that the condition of the existing jails (whether common or
specially for women) was miserable.

(110)
� There was a similar response concerning the well-being of the inmates in these prisons. Greater
part of the NGOs whom responded labelled the situation as �poor� [MGPS- Rewari] and specifically
noted that �women are badly off� [Reeds- Ambala Cantt.].
CONDITION OF SCHEDULED CASTES AND SCHEDULED TRIBES
(a) The NGOs were asked to comment on the situation of SC/ST women in their respective districts.
Some of the NGO�s believed that there was an improvement in the situations, others held it to
be satisfactory, while some believed that the situation of the Scheduled Caste and Tribes women
is not so good or even poor. The last held that the women are not well off in matters of health
or economically as it tends to be a male dominated society [MGPS- Rewari, BSST- Faridabad].
Some of the NGO�s however, opined that many of them do benefit; but the others live in abject
poverty and are in dire need of assistance [Reeds- Ambala Cantt.].
SLUMS
� Out of the 18 NGOs who answered the questions relating to slums, 11 reported that they did
have slum areas in their districts, while 7 reported that there were no such areas.
� Most of the NGOs felt that the Government has not taken adequate steps to ameliorate the
condition of slum dwellers. Besides the launch of the NSDP in the Rohtak district of Haryana
(according to CVS and HNYKS- Rohtak), it has been reported that there is a gaping hole in
terms of Government help and remedial programs.
Suggestions
The NGOs furnished certain suggestions for improving the condition of slum dwellers and eradicating
slums altogether:
(a) Shelters should be provided to the homeless
(b) Basic amenities such as water, electricity, school and medical facilities should be provided
(c) Women should be empowered. CSWs should be rehabilitated through IGAs
PANCHAYATI RAJ
The subject of Panchayati Raj and it�s implementation has been by far the most positive in terms
of overall response by the NGOs and as far as positive results, by their findings.
� 100% of the NGOs who had correct information, confirmed that there had been Panchayat
elections carried out in their respective districts.
� 99% further reported that the condition of 33 ½% reservation for women was respected and
enforced.
HEALTH ISSUES
� In matters of health, the NGOs once again seemed to possess an acute shortage of information.
Most of them were unaware of the number or the existence of any Mahila hospitals in their
districts.
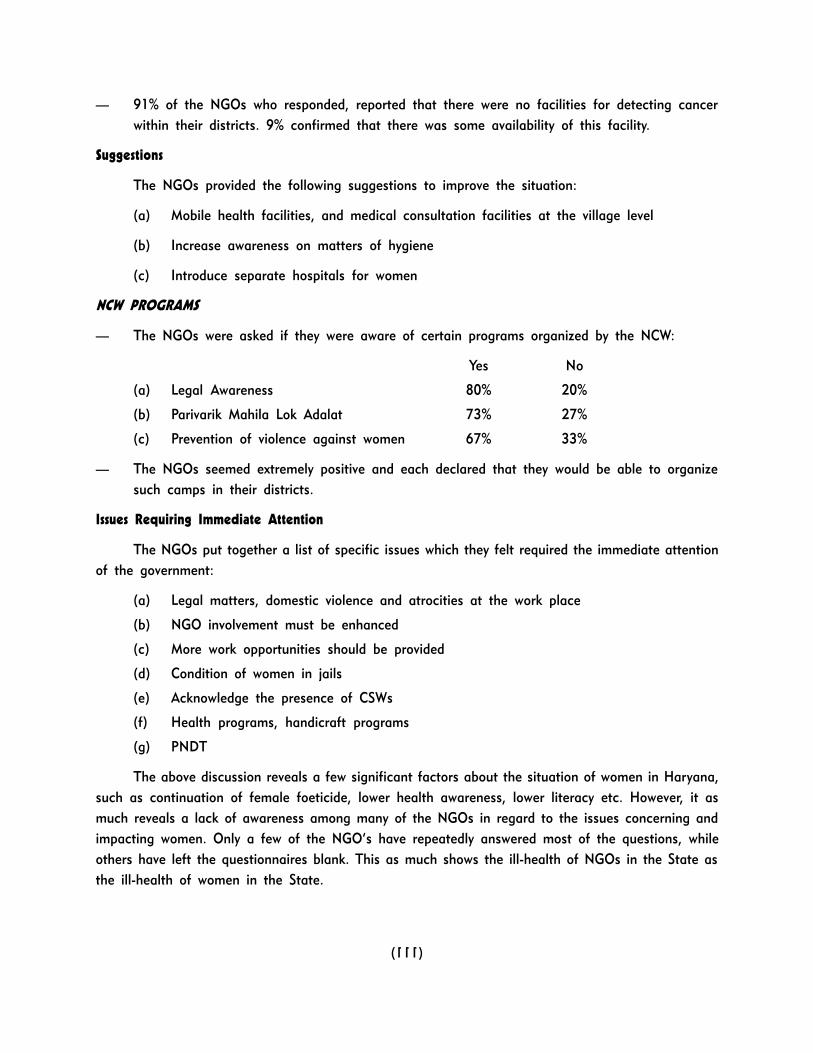
(111)
� 91% of the NGOs who responded, reported that there were no facilities for detecting cancer
within their districts. 9% confirmed that there was some availability of this facility.
Suggestions
The NGOs provided the following suggestions to improve the situation:
(a) Mobile health facilities, and medical consultation facilities at the village level
(b) Increase awareness on matters of hygiene
(c) Introduce separate hospitals for women
NCW PROGRAMS
� The NGOs were asked if they were aware of certain programs organized by the NCW:
Yes No
(a) Legal Awareness 80% 20%
(b) Parivarik Mahila Lok Adalat 73% 27%
(c) Prevention of violence against women 67% 33%
� The NGOs seemed extremely positive and each declared that they would be able to organize
such camps in their districts.
Issues Requiring Immediate Attention
The NGOs put together a list of specific issues which they felt required the immediate attention
of the government:
(a) Legal matters, domestic violence and atrocities at the work place
(b) NGO involvement must be enhanced
(c) More work opportunities should be provided
(d) Condition of women in jails
(e) Acknowledge the presence of CSWs
(f) Health programs, handicraft programs
(g) PNDT
The above discussion reveals a few significant factors about the situation of women in Haryana,
such as continuation of female foeticide, lower health awareness, lower literacy etc. However, it as
much reveals a lack of awareness among many of the NGOs in regard to the issues concerning and
impacting women. Only a few of the NGO�s have repeatedly answered most of the questions, while
others have left the questionnaires blank. This as much shows the ill-health of NGOs in the State as
the ill-health of women in the State.

(113)
CHAPTER - XI
CONCLUSION
Haryana, the karma-bhoomi of the Mahabharat, the land which gave birth to the immortal
teachings of the Gita, wherein Shri Krishna preached to Arjuna the rightfold path. Haryana is one of
the most progressive States of the Indian Union, with a high per capita income, low level of population
below the poverty line, high growth of industrialisation, almost 100 per cent electrification, the harbinger
of the Green Revolution, a land of milk and curds, where nutrition is aplenty. It has made significant
advances in the field of education and health, resulting in a decline in mortality, increase in life
expectancy and an improvement in the overall health status of the population.
This highly progressive socio-economic scenario, however, has another side and reality for half
of its population- the women. In a land where a girl child is bestowed names such as mooli(radish),
where gloom envelops a household when a girl child takes birth, where she is considered a burden,
the social condition of women continues to be relatively static.
The declining sex ratio is merely one instance of this. Its implications are far reaching and a
major cause of concern. While the decline in the overall sex ratio is worrisome, it is the major decline
in the 0-6 years sex ratio which has highlighted the grim situation of women in the State. Significantly,
three of the ten districts with the worst child sex ratio in the country fall in this State. It is indicative
of the continuation of the practice of female foeticide, notwithstanding the ban imposed by the Pre-
Natal Diagnostic Techniques Act. New techniques for bearing only sons are constantly emerging in a
society where son preference predominates the psyche of the people. Pre-conception sex selection is
rapidly replacing ultrasound as a technique of sex determination. The age-old practice of Babas and
quacks supplying medicine to bear a son, of course continues uninterrupted with some waves raised
by NGOs and women�s organisations from time to time. It would also not be out of context to mention
another technology which has gained ground in the region- Assisted Reproductive Technology (ART),
which has extended women�s childbearing years. However, this technology is being used by aged
couples who want to bear sons.
This is not to say that no action is being taken. India Today reports �Jat land, the second biggest
culprit after Punjab in the downslide in the child sex ratio, has also earned praise for the most
proactive drive for the anti-female foeticide crusade. It is led by Dahiya, an ordinary looking Haryana
Jat with extraordinary zeal.�1
1 India Today, November 10, 2003, p. 20

(114)
Declining sex ratio apart, the picture is no better on the front of mortality rates for females, both
infants and in the general population. Notwithstanding the vast network of health infrastructure, vast
gender differentials continue in mortality rates of women and the girl child, indicative of a gender bias
in accessing these health services.
Other demographic features such as Birth Rate, Age at Marriage and proportion of aged women
also do not present a very rosy picture of the state of affairs in Haryana. The birth rate in Haryana
continues to be relatively high. Age at Marriage is lower than many of the developed States such as
Punjab, Kerala and Maharashtra, while it has a high proportion of the aged in its population.
Undoubtedly Haryana has made significant strides in the field of literacy particularly female
literacy which has risen by almost five times in the past four decades. Yet again the gender gap
remains high. Not only this, it continues to stand among the lower category States in respect of female
literacy. It is also significant that there is higher enrolment of girls at the primary stage, but the
enrolment drops in succeeding stages. Low enrolment is compounded by higher dropout rates for girls.
A look at some health indicators too is revealing of the prevailing bias. Haryana has a higher
total fertility rate as compared to the national average, notwithstanding the consistent decline in this
rate over the past few years. Although relatively better ranked amongst the Indian States in respect
of anaemia among women, almost ever second woman in Haryana continues to suffer from iron-
deficiency anaemia. The situation is even more pathetic where children are concerned, for Haryana
has the highest prevalence of anaemia among children in India. Nor does Haryana perform any better
so far as maternal health indicators are concerned, although its maternal mortality ratio is low as
compared to many States in India.
Even while participating in all major activities, women continue to be statistically invisible in the
workforce. Yet women�s workforce participation rate in Haryana is almost half that of males. This is
not to deny the fact that Haryana�s performance in this regard is better than its neighbouring state
of Punjab and Haryana is ranked 18th amongst the Indian States on this front. Yet 72 per cent of the
women continue to be considered as non-workers. What�s more, more than half of the female work
force is in the marginal workers category, where chances of exploitation are extremely high, while only
a small proportion of the males come in this category.
In such a scenario, women�s issues and concerns need to be reflected at the policy making level
and who better to present women�s viewpoint than women themselves? However, women in Haryana
have been virtually unrepresented in the national Parliament and they have had a mere nominal
representation in the State Legislative Assembly. The 73rd and 74th Amendments to the Constitution of
India saw a large number of women emerging out of the four walls of the household and taking their
place in the field of decision-making at the grassroots level. Haryana was no exception to this.
However, these new entrants to the political scene are novices in the field of politics and it is alleged
that they are merely rubber stamps or proxy candidates for their husbands and other menfolk. Nor do
women fare any better in decision-making in the private sphere. NFHS-II statistics reveal that a large

(115)
majority of women have to seek permission for even minor matters such as going to the market or
visiting friends and relatives.
In terms of violence against women, Haryana continues to be a high risk State. It is indeed
noteworthy that it is ranked higher in the scale of crimes against women than even Delhi, the crime
capital of the nation.
These facts and figures indeed, present a very gloomy picture of the status of women in
Haryana. Nevertheless, it is also essential to emphasise that the Government of Haryana has initiated
a number of measures aimed at improving the status of women. These include innovative schemes
such as Apni Beti Apna Dhan, Devi Rakshak Yojana and Devi Rupak Yojana, which are supposed to
stem the declining sex ratio as well as provide financial help to destitute women, incentives for
promoting educational status of the girl child including mid-day meals and free cycles to girls where
schools are situated at some distance, free uniforms, various measures aimed at reducing poverty and
promoting employment, innovative health schemes such as Swasthya Aapke Dwar and Swasthya Maah,
which are supposed to bring health services right to the doorstep of the people, etc. Some of these
schemes have shown results, while others are still in their infancy and yet to show the promised results.
Only time will tell how effective they are. The strategies adopted to uplift the status of women indicate
a shift in emphasis from mere welfare to women�s development. Their success is contingent upon a
number of factors ranging from design to delivery and implementation.
At the moment, however, women continue to be discriminated over the entire life cycle, whether
it be in the field of sex ratio, education, health, work participation, decision-making or simple everyday
routine matters.
The reasons for this state of affairs definitely do not lie in inadequate infrastructure, for as with
everything else, Haryana has made rapid advances in the field of infrastructure. The raison d�être lies
in a culture which perpetuates discrimination against women and the girl child whether in the field of
health or education or simply in the matter of the right to take birth. There is a need to counter the
mindset which devalues and degrades the girl-child, objectifies and commodifies women, celebrates
the oppression of women by women and legitimises female foeticide and infanticide. The traditional
household bias and focus on women�s traditional roles in matters of policy making needs to changed
and their concerns and issues integrated into mainstream policies.

(117)
SELECT BIBLIOGRAPHY
Agnihotri, Satish B., �Declining Infant and Child Mortality in India: How do Girl Children Fare?�,
Economic and Political Weekly, January 20, 2001, Vol XXXVI, No.3.
Census of India, 2001, Series 7, Haryana (Provisional Population Totals, Paper 1 of 2001)
Dasgupta, Monica, �Selective Discrimination against Female Children in Rural Punjab, India�,
Population and Development Review, 13(1), March 1987.
Dreze, Jean and Sen, Amartya, India: Economic Development and Social Opprotunity, OUP, Delhi,
1995
Gopalan, Sarala and Shiva, Mira, National Profile on Women, Health and Development, VHAI and
WHO, 2000
Hirway, Indira and Mahadeva, Darshini, �Critique of Gender Development Index: Towards an
Alternative� Economic and Political Weekly, Vol. XXXI, No. 43, October 26, 1996.
Human Development in South Asia, Mahbub ul Haq Human Development Centre, OUP, Karachi,
2000
Miller, Barbara D, �Female Infanticide and Child Neglect in Rural North India� in Bretall, Caroline
B. and Sargent, Carolyn F. (eds), Gender in Cross-Cultural Perspective, Prentice-Hall, New Jersey, 1993.
National Family Health Survey �II, 1998-99, Haryana
National Human Development Report 2001, Planning Commission, Govt. of India, March 2002
Our Daughters Our Wealth, Population Council, 1999
Rustagi, Preet, Gender Biases and Discrimination Against women: What Do Diferent Indicators
Say?�, UNIFEM, New Delhi, 2003
Sarvekshana, Vol XXIII, No.3, January-March, 2000, Issue No.82, NSS 52nd Round, July 1995-
June 1996
Shiva Kumar, A.K, �UNDP�s Gender Related Development Index: A Computation for Indian
States�, Economic and Political Weekly, Vol XXXI, No. 14, April 6, 1996
Shramshakti, Report of the National Commission on Self Employed Women and Women in the
Informal Sector, 1988.

(118)
Statistical Abstract, Haryana, 2001-02
Towards Equality, Report of the Committee on the Status of Women in India, December 1974,
Govt. of India, Deptt of Social Welfare, Ministry of Education and Social Welfare, New Delhi, 1975.

A SITUATIONAL ANALYSIS
OF
WOMEN AND GIRLS IN HARYANA
BY
PAM RAJPUT
NATIONAL COMMISSION FOR WOMEN
NEW DELHI

LIST OF CONTENTS
Page No.
Foreword (i)
Haryana at a Glance (v)
I. Introduction 1
II. Demography 9
III. Education 27
IV. Health 37
V. Work 53
VI. Women and Decision-Making 63
VII. Violence Against Women 71
VIII. Government Programmes and Policies for Women 87
IX. Situational Analysis of Women in Haryana : A State Perspective 91
X. Status of Women in Haryana : NGO Perspective 101
XI. Conclusion 113
Select Bibliography 117

LIST OF TABLES
1.1 Housing Characteristics
1.2 Human Development Index for India
1.3 Gender Related Development Index for Indian States, 1991-92
2.1 States and Union Territories Ranked by Sex Ratio, India, 2001
2.2 Sex Ratio since 1901 for Haryana and Its Districts
2.3 Ranking of Districts by Sex Ratio
2.4 Best and Worst Tehsils in Sex Ratio
2.5 Sex Ratio of Total Population and Child Population in Age Group 0-6,
1991 and 2001, India and States
2.6 Sex Ratio in 0-6 years Age Group, Haryana and its Districts
2.7 Districts with the Lowest Child Sex Ratio in India
2.8 Ten Worst Tehsils in Sex ratio of 0-6 Population (Rural/Urban)
2.9 Sex Ratio of Slum Population in Haryana, 2001
2.10 Indicators of Sex Preference
2.11 Crude Birth Rate in Haryana, NFHS-I, NFHS-II, SRS
2.12 Age Specific Death Rates and Crude Death Rates by Sex
2.13 Neonatal, Post Neonatal, Infant, Child and Under Five Mortality Rates
2.14 Singulate Mean Age at Marriage
3.1 Literacy Rates, 1971-2001, Haryana
3.2 Literacy Rates by Sex for State and Districts, 2001
3.3 Enrolment Ratio
3.4 Gross Dropout Rates
3.5 School Attendance

3.6 Reasons for Children not Attending School
3.7 Classification of Schools
3.8 Sex Ratio and Literacy Rates
4.1 Current Fertility
4.2 Fertility Trends
4.3 Anaemia Among Women
4.4 Anaemia among Children
4.5 Childhood Vaccination by Background Characteristics
4.6 Some Maternal Health Indicators of 15 Major States
4.7 Tetanus Toxoid Vaccination and Iron and Folic Acid Tablets or Syrup
4.8 Health Problems During Pregnancy
4.9 Symptoms of Reproductive Health Problems
4.10 Treatment of Reproductive Health Problems
5.1 Ranking of States/UTs by Work Participation Rate, 2001
5.2 Workers and Non-Workers in Haryana, 2001
5.3 Category of Workers
5.4 Ranking of Districts by Male Work Participation Rate: 1991-2001
5.5 Ranking of Districts by Female Work Participation Rate: 1991-2001
5.6 Female Literacy versus Female Work Participation Rate, 2001
6.1 Women�s Representation in the Legislative Assembly, 1967-2000
6.2 Electorate in Haryana, 1967-2000
6.3 Number of Elected Women in Panchayats
6.4 Household Decision-Making
6.5 Women�s Autonomy
7.1 Incidence and Rate of Crime Committed Against Women in States and UTs During 2001
7.2 Incidence of Crimes Committed Against Women During 2001, Haryana and India
7.3 Crime against Women and Sex Ratio

7.4 Reasons Given for Justifying a Husband Beating His Wife
7.5 Women�s Experience with Beatings or Physical Mistreatment
7.6 Frequency of Beatings or Physical Mistreatment
9.1 Number of Schools
9.2 Number of Females Enrolled at Different Levels
9.3 Number of Teachers at Different Levels
9.4 Beneficiaries under Kanyadaan Scheme
9.5 Financial Assistance to Widows
9.6 Number of Women Office-Bearers
9.7 Number of Women Representatives in Panchayati Raj Institutions
9.8 Number of Women Registered for Employment
9.9 Number of Women Trained in Traditional and Non-Traditional Entrepreneurial Skills
9.10 Crimes Against Women

FOREWORD
The existential pathos of a woman�s life has been inimitably captured by the great
Hindi poet, Shri Maithilisharan Gupta, in a memorable couplet which says, �Alas, woman!
Thy destiny is eternal sacrifice, eternal suffering!�
Despite the exalted position given to women in some of India�s religious texts and
the exceptional attainments of individual women in fields as diverse as philosophy, statecraft
and even warfare, the profile of the average woman through the ages has been that of
a perpetually poor, perpetually pregnant and perpetually powerless being.
Independent India has tried to redeem the situation by proclaiming equality of the
sexes as a Fundamental Right under the Constitution and directing state policy towards
removing the various disabilities that thwart women in realising their potential. Five decades
of Independence have also seen a plethora of laws passed by the State and Federal
Governments to protect women from violence and discrimination and to strengthen their
entitlements in the social and economic fields. Numerous committees and commissions
have x-rayed the position of women, the advances made by them and the obstacles faced
by them, and they have made umpteen recommendations to improve the situation. Scores
of schemes have been floated by various Ministries of the Government to address women�s
problems, particularly those relating to education, health, nutrition, livelihood and personal
laws. In the institutional area, independent administrative departments to give undivided
attention to women�s problems have sprung up at the Centre as well as in the States.
Development corporations were an innovation of the Eighties to energise economic benefit
schemes. The Nineties saw the setting up of the National Commission for Women (NCW)
and State Commissions in various States to inquire into the working of various legal and
constitutional provisions concerning women, to investigate cases of violation of women�s
rights and generally to advise on the socio-economic policy framework in order to mainstream
women�s concerns. In recent years, the Governments, Central and State, have also articulated
comprehensive policies for the empowerment of women through a variety of instruments
and approaches focusing on an explicit vision of equal partnership of women in all walks
of life.
(i)

Credit must also be given to a robust women�s movement which has often given
forceful expression to women�s aspirations and joined issue with all the organs of
state � legislative, executive and judicial � for reviewing the age-old prescriptions of a
patriarchal society. Often they have networked effectively with the international community
and fora in the quest for worldwide solidarity on issues affecting women. These interactions
have often times changed the idiom of discourse on women�s right to justice and development.
The half-century of struggle and reform has undoubtedly had considerable impact
on women�s world. Some of the key indicators of development have perked up significantly;
women�s life expectancy has risen; education levels have improved; economic participation
has grown. But there are areas of darkness too; crimes against women, both at home and
outside, continue unabated; traditional economic occupations have withered in the face of
global competition; there is increasing commodification of women�s persona and vulgarisation
of their image in the media�s marketplace. The new economic regime, where Sensex
swamps sensibility, has meant the precipitate withdrawal of the state from many fields
leaving the weak, including women, in the cold. Similarly laws change; minds don�t. Therefore
between progressive legislation and sensitive enforcement falls a long shadow. Critics also
point out that whatever advances have been made remain confined to urban India and the
vast hinterland resists change obstinately.
The overall picture is thus a mixed one leaving the profile of the average Indian
woman not substantially altered. But in this vast country there is no average Indian
woman. As in all other matters, diversity marks the Indian woman�s picture too. How
society and economy are coping with the forces of modernisation differs substantially from
region to region. The geography of a state provides its own constraints and opportunities;
history gives its own moorings to values and momentum to change. Thus the regional
profile is superimposed on the national profile. The NCW has therefore commissioned
these studies to gauge how women�s life has been changing or not changing in different
States of the country, and to situate these studies in the historical and geographical
context of each region or State so that progress can be measured across time and across
space. Such spatial comparisons can highlight what lessons there are to be learnt from
the �leading� areas and equally they help in focusing the attention on the �lagging� areas.
Regionally disaggregated data helps in benchmarking progress of different regions, areas
or districts, and can be used for improving performance by attempting to raise the performance
levels of the laggards to the average of the State and then matching the State�s average
to the national average. Interesting insights can also be gleaned from the experience of
implementing agencies, both governmental and non-governmental, in dealing with different
problems. Some of these may be rooted in the soil of the region and may not lend
(ii)

themselves to replication but many others can be useful examples to emulate. That is how
Best Practices become common practices.
These studies have been carried out by different research groups having special
knowledge and interest in the area � its people, its history, its administration, its cultural
ambience etc. They have interacted with official agencies as well as with leading NGOs
working with women in the respective areas. The NCW has given a helping hand by
providing information from its own database where available and also by interacting with
the government of the State to set the stage for these exercises. The result is in your
hands.
The research effort in respect of Haryana was anchored by Prof. Pam Rajput while
the NCW team comprising Dr. Poornima Advani, Chairperson; Mrs. Sudha Malaiya, Member;
Mrs. Sunila Basant, Member Secretary & Shri H. Kumar, Senior Research Officer facilitated
the dialogue with the Haryana Administration.
Poornima Advani
(iii)

HARYANA AT A GLANCE
Sr Item Period Unit State
No Position
1. DIVISIONS No. 4
2. DISTRICTS No. 19
3. SUB-DIVISIONS No. 47
4. TEHSILS No. 67
5. SUB-TEHSILS No. 45
6. BLOCKS No. 116
7. TOWNS No. 106
8. VILLAGES(including un-inhabited) Census 2001 No. 6955
9. Geographical Area Census 2001 Lakh Sq.Kms 0.44
10. Percentage of Area Under Forest to Total Area 2002-2003 % 3.52
11. Percentage of Net Area Sown to Total Area 2001-2002 % 81.56
12. Percentage of Net Irrigated Area to Net
Area Sown 2002-2003 % 83.0(P)
13. Yield of Foodgrains 2002-2003 Qtl./Hect. 31.07(P)
14. Yield of Wheat 2002-2003 Qtl./Hect. 40.53(P)
15. Population (total) Census 2001 Lakh No. 210.83
(a) Rural Population Census 2001 Lakh No. 149.69
(b) Urban Population Census 2001 Lakh No. 61.14
(c) Percentage of Rural Population to
Total Population Census 2001 % 71
(d) Percentage of Urban Population to
Total Population Census 2001 % 29
(e) Percentage of Population in Age Census 2001 % 15.46
Group 0-6 to Total Population
(f) Decennial Growth Rate 1991-2001 % 28.06
(g) Literacy rate (Overall) Census 2001 % 68.59
Male Census 2001 % 79.25
Female Census 2001 % 56.31
(h) Birth Rate 2002 Per thousand 26.5(P)
(i) Death Rate 2002 Per thousand 7.0(P)
(v)
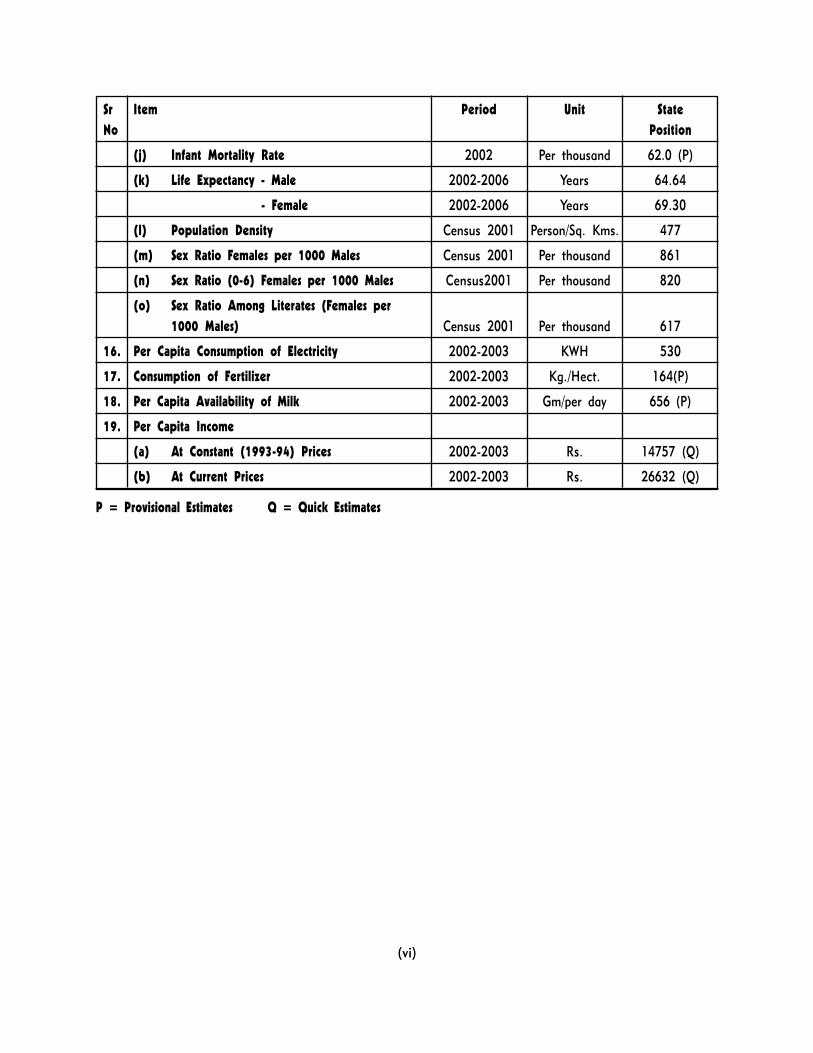
Sr Item Period Unit State
No Position
(j) Infant Mortality Rate 2002 Per thousand 62.0 (P)
(k) Life Expectancy - Male 2002-2006 Years 64.64
(k) Life Expectancy - Female 2002-2006 Years 69.30
(l) Population Density Census 2001 Person/Sq. Kms. 477
(m) Sex Ratio Females per 1000 Males Census 2001 Per thousand 861
(n) Sex Ratio (0-6) Females per 1000 Males Census2001 Per thousand 820
(o) Sex Ratio Among Literates (Females per
1000 Males) Census 2001 Per thousand 617
16. Per Capita Consumption of Electricity 2002-2003 KWH 530
17. Consumption of Fertilizer 2002-2003 Kg./Hect. 164(P)
18. Per Capita Availability of Milk 2002-2003 Gm/per day 656 (P)
19. Per Capita Income
(a) At Constant (1993-94) Prices 2002-2003 Rs. 14757 (Q)
(b) At Current Prices 2002-2003 Rs. 26632 (Q)
P = Provisional Estimates Q = Quick Estimates
(vi)
Copyright © 2022 FDOKUMEN