National HIV Sentinel Survey Report 2016.pdf - Fast-Track Cities
77
Republic of Namibia Ministry of Health and Social Services SURVEILLANCE REPORT OF THE 2016 NATIONAL HIV SENTINEL SURVEY Surveillance Trends in HIV Prevalence among Pregnant Women Receiving Antenatal Care in Namibia, 1992-2016 1992 1994 1996 1998 2000 2002 2004 2006 2008 2010 2012 2014 2016 25.0 20.0 15.0 10.0 5.0 0.0 4.2 8.4 15.4 17.4 19.3 22.0 19.7 19.9 17.8 18.8 18.2 16.9 17.2 Year of survey % HIV prevalence
-
Upload
khangminh22 -
Category
Documents
-
view
1 -
download
0
Transcript of National HIV Sentinel Survey Report 2016.pdf - Fast-Track Cities

Republic of Namibia
Ministry of Health and Social Services
Surveillance report of the 2016 national hiv Sentinel Survey
Surveillance Trends in HIV Prevalence among Pregnant Women Receiving Antenatal Care in Namibia, 1992-2016
1992 1994 1996 1998 2000 2002 2004 2006 2008 2010 2012 2014 2016
25.0
20.0
15.0
10.0
5.0
0.0
4.2
8.4
15.417.4
19.3
22.019.7 19.9
17.818.8 18.2
16.9 17.2
Year of survey
% H
IV p
reva
lenc
e
Surveillance Report of the 2016 National HIV Sentinel Survey
1Surveillance Report of the 2016 National HIV Sentinel Survey
Republic of Namibia
Ministry of Health and Social Services
Surveillance Report of the 2016 National HIV Sentinel Survey
Directorate of Special Programmes
Response Monitoring & Evaluation Subdivision
Private Bag 13198 Windhoek
Tel: +264-61-2032436
Fax: +264-61-300376
E-mail: rm&[email protected]
November 2016
Surveillance Report of the 2016 National HIV Sentinel Survey
II Surveillance Report of the 2016 National HIV Sentinel Survey
FOREWORDThe Ministry of Health and Social Services is committed to providing routine and periodic data for informed decisions. These data place the country in a better position to track the progress made toward the goals and targets that we set for ourselves. The progress made helps the country to better understand the epidemic as well as to identify achievements, challenges and also to come up with targeted interventions.
The 2016 National HIV Sentinel Survey is the thirteenth such study conducted since Namibia’s independence. For better representation, the study has been expanded to all health districts in the country since 2008 and also incorporated more health facilities in 2016. Releasing the HIV Sentinel Survey report once again attests to the willingness and commitment of the Ministry in its quest for data driven decision-making that will contribute to improved quality of health care for our people. With all confidence, we believe that the information contained in this report is useful for evidence based decisions in Namibia and beyond.
The MOHSS is thankful for the political commitment that the Government of Namibia has shown in giving the response to HIV/AIDS a top priority in all its undertakings. It is this support and commitment that create a favorable environment that has enabled the Ministry to achieve all the accomplishments it has achieved so far. The MOHSS appreciates the contribution done by our development and bilateral partners as well as collaborating partners, and everyone that contributed to the success of this report.

Surveillance Report of the 2016 National HIV Sentinel Survey
IIISurveillance Report of the 2016 National HIV Sentinel Survey
PREFACEThe National HIV Sentinel Survey (NHSS) is conducted every second year in order to determine the HIV prevalence among pregnant women attending antenatal care (ANC) clinics at public facilities throughout the country. In addition, the data from this survey is used to estimate the HIV prevalence in the general population and for programming purposes, in the absence of a population-based HIV prevalence data that is conducted every five years.
This study uses a standardized methodology recommended by the World Health Organization (WHO) as the most suitable way for countries to monitor the trend of HIV infection in different geographical areas and age groups. This methodology is embedded in the routinely conducted activities at different facilities. It provides a feasible method of data collection that is easy to collect as well as cost effective. The methodology uses anonymous unlinked data whereby the HIV testing is completed on blood samples collected from pregnant women during routine ANC services. In order to prevent the HIV status of a woman becoming known during this process, blood samples are stripped of any personal identifying information prior to HIV testing. It is essential however to mention that every woman is offered the opportunity to know her HIV status during ANC visit. This is complemented by the high coverage of HIV Counselling and Testing (HCT) services within the country. Adherence to high ethical standards to ensure confidentiality is clearly articulated and ensured throughout the survey implementation.
Results from the 2016 NHSS suggest that Namibia’s epidemic remains in a period of stabilization with slow yet sustained decreases in HIV prevalence among pregnant women since 2002. This is due to concerted efforts by government and various stakeholders. It is further evident from this report, that HIV prevalence trends vary by site, and that the distribution of infection is not uniform across the country. Recent trends show that new infections continue to occur among younger women in Namibia and we need to intensify our efforts to prevention-targeted interventions.
Data use is the primary reason why studies and surveillance are conducted. This report is packaged in a user friendly manner so that it can be easily interpreted by all people at the different levels of operation. I therefore encourage all stakeholders to familiarise themselves with the information and utilise it for planning and programmatic interventions.
Surveillance Report of the 2016 National HIV Sentinel Survey
IV Surveillance Report of the 2016 National HIV Sentinel Survey
COntEntsFOREWORD ............................................................................................................................... II
PREFACE ................................................................................................................................... III
tABLEs ..................................................................................................................................... VI
FIGUREs .................................................................................................................................. VII
ABBREVIAtIOns .................................................................................................................... VIII
DEFInItIOn OF KEY tERMs ................................................................................................... IX
EXECUtIVE sUMMARY ............................................................................................................ X
1. BACKGROUnD ................................................................................................................. 1
1.1. History and Context of Sentinel Surveillance ........................................................................................ 2
1.2. Sentinel Surveillance Justification ......................................................................................................... 3
1.3. Sentinel Surveillance and HIV and AIDS Services ............................................................................... 4
1.4. Participating Sites ................................................................................................................................. 5
2. sURVEY OBJECtIVEs ..................................................................................................... 6
2.1. General Objectives ............................................................................................................................... 6
2.2. Specific Objectives ............................................................................................................................... 6
3. MEtHODs ......................................................................................................................... 7
3.1. Overview ............................................................................................................................................... 7
3.2. Sampling ............................................................................................................................................... 7
3.2.1. Selection of sentinel sites .................................................................................................. 7
3.2.2. Survey population .............................................................................................................. 8
3.2.3. Sample size determination ................................................................................................ 8
3.3. Survey duration ..................................................................................................................................... 8
3.4. Pre-survey training ................................................................................................................................ 8
3.6. Laboratory Procedures ......................................................................................................................... 9
3.6.1. Preparation of specimens .................................................................................................. 9
3.6.2. Testing procedures ........................................................................................................... 10
3.6.3. Recording and transmission of results ............................................................................. 10
3.7. Syphilis testing .................................................................................................................................... 10
3.8. Quality Assurance ............................................................................................................................... 11
3.8.1. National Level Quality Assurance .................................................................................... 11
3.8.2. Field Level ........................................................................................................................ 11
3.8.3. Laboratory ........................................................................................................................ 11

Surveillance Report of the 2016 National HIV Sentinel Survey
VSurveillance Report of the 2016 National HIV Sentinel Survey
3.9. Data Management and Analysis ......................................................................................................... 12
3.9.1. Data Management ........................................................................................................... 12
3.9.2. Data Quality Assessment ................................................................................................. 12
3.9.3. Analysis .......................................................................................................................... 12
3.10. Ethical considerations ......................................................................................................................... 13
3.11. Dissemination and use of the results .................................................................................................. 13
4. REsULts ......................................................................................................................... 14
4.1. Summary of Enrolment ....................................................................................................................... 14
4.2: HIV Prevalence ................................................................................................................................... 17
4.3. ART Coverage among women testing HIV positive during the 2016 NHSS ....................................... 23
4.4. Trends in HIV prevalence over time ................................................................................................... 27
5. sEntInEL sURVEILLAnCE AnD OtHER DAtA sOURCEs ....................................... 35
5.1. HIV Prevalence Data from Routine PMTCT Program Data ............................................................... 35
5.2. Syphilis surveillance data from routine laboratory records ................................................................. 37
6. LIMItAtIOns ................................................................................................................... 42
7. DIsCUssIOn ................................................................................................................... 43
8. COnCLUsIOns ............................................................................................................... 46
9. RECOMMEnDAtIOns .................................................................................................... 47
10. APPEnDICEs .................................................................................................................. 48
Appendix 1: Checklist for the 2016 survey trainings .................................................... 48
Appendix 2: sites participating in national HIV sentinel survey by Year, namibia 2002-
2016 ............................................................................................................... 49
Appendix 3: Individual survey Form, 2016 nHss ........................................................... 50
Appendix 4: Laboratory shipping/Results Form, 2016 nHss ....................................... 51
Appendix 5: Clinic and Laboratory Flow Chart, 2016 nHss .......................................... 52
Appendix 6: Quality Assurance Form for Health Facilities, 2016 nHss ....................... 53
Appendix 7: Weekly Progress Report Form, 2016 nHss ............................................... 54
Appendix 8: 2016 sentinel surveillance satellite sites, 2016 nHss ............................. 55
Appendix 9: 2016 nHss technical Working Group ........................................................ 61
Appendix 10: 2016 nHss nIP specimen Logbook ........................................................... 62
Appendix 11: Quality Assurance Form for nIP Laboratories, 2016 nHss ..................... 63
11. REFEREnCEs ................................................................................................................. 64
Surveillance Report of the 2016 National HIV Sentinel Survey
VI Surveillance Report of the 2016 National HIV Sentinel Survey
tABLEsTable 1: Summary of enrolment, completeness of data, and total sample achieved, NHSS 2016 ........................ 14
Table 2: Distribution of age among women enrolled in the NHSS 2016 ................................................................ 15
Table 3: Distribution of gravidity and age among women tested for HIV in the NHSS 2016 ................................. 16
Table 4: HIV prevalence by age group, NHSS 2016 ............................................................................................. 17
Table 5: HIV prevalence by gravidity and age, NHSS 2016 .................................................................................. 18
Table 6: HIV prevalence by sentinel site, NHSS 2016 .......................................................................................... 19
Table 7: HIV prevalence by urban or rural residential status and age, NHSS 2016 .............................................. 22
Table 8: Percentage of HIV positive women who were already on ART by sentinel site, NHSS 2016 .................. 24
Table 9: Percentage of HIV positive women who were already on ART by rural or urban place of residence and age, NHSS 2016 ...................................................................................................................................... 26
Table 10: Trend in HIV prevalence by year of NHSS and age, NHSS 1996 - 2016 ................................................ 27
Table 11: Trends in HIV prevalence by year of NHSS and age, NHSS 2010 – 2016 .............................................. 28
Table 12: Trends in HIV prevalence by year of NHSS, NHSS 1992 – 2016 ............................................................ 31
Table 13: Comparison of HIV prevalence estimates from 2016 PMTCT program data versus results of the 2016 NHSS ....................................................................................................................................................... 26
Table 14: Syphilis surveillance data from routine laboratory by district among women age 15-49 years ................ 37
Table 15: Syphilis prevalence among women by age group who tested for syphilis ............................................... 39
Table 16: Syphilis prevalence trends among women age 15-49 years by site and NHSS year .............................. 39
Table 17: Syphilis prevalence among women by Age group and NHSS Year ......................................................... 41

Surveillance Report of the 2016 National HIV Sentinel Survey
VIISurveillance Report of the 2016 National HIV Sentinel Survey
FIGUREsFigure 1: Number of participating sites, NHSS 1992 - 2016 ..................................................................................... 5
Figure 2: Distribution of age among women tested for HIV in the NHSS 2016 ....................................................... 16
Figure 3: Overall HIV prevalence among pregnant women receiving antenatal care, NHSS 1992 – 2016 ............ 17
Figure 4: HIV prevalence by age group, NHSS 2016 ............................................................................................. 18
Figure 5: HIV prevalence overall and by sentinel site, NHSS 2016 ........................................................................ 21
Figure 6: HIV prevalence by urban or rural residential status and age, NHSS 2016 .............................................. 23
Figure 7: Percentage of HIV positive women who were already on ART, NHSS 2016 ........................................... 24
Figure 8: Percentage of HIV positive women who were already on ART by rural or urban place of residence and age, NHSS 2016 ...................................................................................................................................... 27
Figure 9: Trends in HIV prevalence by year of NHSS among young and old age groups, NHSS 2008 – 2016 ..... 28
Figure 10: HIV prevalence in young women (15-24 years) compared to adult women (25-46 years), NHSS 2010 and 2016 ......................................................................................................................................................... 30
Figure 11: HIV prevalence by health district, NHSS 2010, 2012, 2014 and 2016 .................................................... 33
Figure 12: HIV prevalence by age group from 2008 – 2016 and the percentage of HIV positive women who were already on ART during the 2012, 2014 and 2016 NHSS ......................................................................... 34

Surveillance Report of the 2016 National HIV Sentinel Survey
VIII Surveillance Report of the 2016 National HIV Sentinel Survey
ABBREVIAtIOnsAIDS Acquired Immunodeficiency Syndrome
ANC Antenatal Clinic
ART Anti-retroviral Therapy
CMO Chief Medical Officer
DHS+ Demographic and Health Survey Plus
DSP Directorate of Special Programmes
ELISA Enzyme linked immunosorbent assay
EPP Estimation and Projection Package
GRN Government of the Republic of Namibia
HAART Highly Active Anti-retroviral Therapy
HIS Health information System
HIV Human Immunodeficiency Virus
NHSS National HIV Sentinel Surveillance
ISF Individual Survey Form
MoHSS Ministry of Health and Social Services
MTP Medium Term Plan
NACP National AIDS Control Programme
NHSS National HIV Sentinel Survey
NIP Namibia Institute of Pathology Limited
NSF National Strategic Framework
PHC Primary Health Care
PMO Principal Medical Officer
PMTCT Prevention of Mother to Child Transmission
QC Quality Control
RM&E Response Monitoring and Evaluation
SHPO Senior Health Program Officer
RPR Rapid Plasma Reagent
STI Sexually Transmitted Infection
TWG Technical Working Group
UNAIDS Joint United Nations Programme on HIV/AIDS
WCRL Windhoek Central Reference Laboratory
WHO World Health Organization

Surveillance Report of the 2016 National HIV Sentinel Survey
IXSurveillance Report of the 2016 National HIV Sentinel Survey
DEFInItIOn OF KEY tERMs
Adult age group: women age 25-49 years.
Behavioral data: data that are collected about a study population’s attitudes, behaviors, or habits as they relate to a defined health outcome. No behavioral data is collected in the Namibia HIV sentinel survey.
Biological data: data related to medical testing performed on specimens collected from study participants. The HIV test result is an example of biological data.
Consecutive sampling: sampling method in which all patients/clients are chosen on a strict “first-come, first-chosen” basis. All persons who meet the eligibility criteria should be included, one after another, until the time that the target sample size is reached or the sampling time has lapsed.
Epidemic: a widespread occurrence of an infectious disease in a community at a particular time and this disease tends to affect a disproportionately large number of individuals within such a population, community, or region at the same time. Epidemic is usually used to describe a disease whose incidence rate is higher than what is expected under “normal” conditions.
Gravida: the number of the pregnancy. A woman who is pregnant for the first time in her life is said to be “gravida one” or “prima-gravida”. A woman who is pregnant for the third time in her life is said to be “gravida three” or “multi-gravida”. Multi-gravida can be used to describe any woman who is pregnant for the second time or greater in her life.
HIV surveillance: the systematic and regular collection of information on the occurrence, distribution, and trends in HIV infection and factors associated with HIV transmission.
Incidence: the proportion of people in a population that newly develop a disease during a specified time period. The numerator in this proportion is the number of new cases during the specified time period and the denominator is the population at risk (those who do not already have the disease and have the possibility of newly developing the disease) during the specified time period. Incidence rate is not measured through the Namibia HIV sentinel survey.
Option B+: means putting all HIV Positive antenatal mothers on ART for life, thereby protecting current and future pregnancies reducing mother to child HIV transmission and maternal death.
Prevalence: the proportion or number of people in a population who have a disease at a given point in time: the numerator is the number of existing cases of disease at a specified point in time and the denominator is the total population.
sample: a subset of a population that is included in a study. Because it is not possible to include all pregnant women in Namibia in the survey, a subset of the population that is thought to be representative of the pregnant women is included.
sentinel surveillance: a system of surveillance in which data on a specified health outcome (e.g. HIV) are collected only from a designated subset of health facilities or other reporting sources.
specimen: a sample of blood drawn from the clients/patients for medical testing.Youth age group: refers to women age 15-24 years.Old age group: refers to women aged 25-49 years.
Surveillance Report of the 2016 National HIV Sentinel Survey
X Surveillance Report of the 2016 National HIV Sentinel Survey
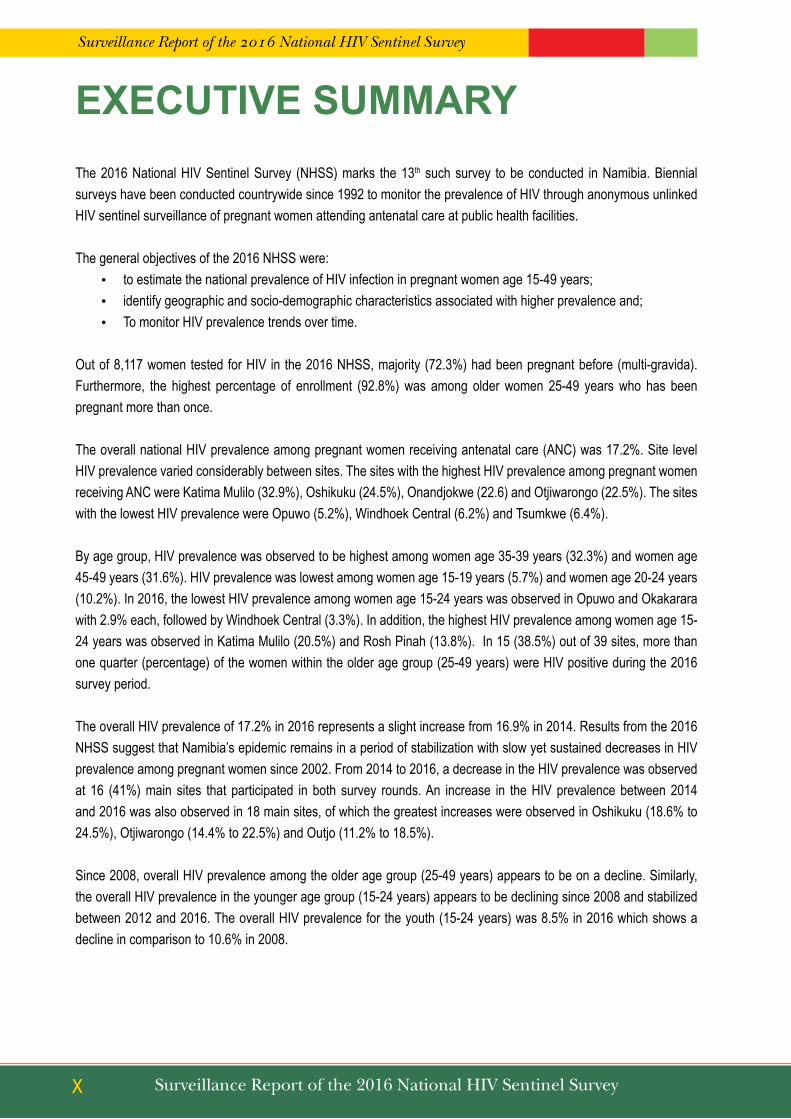
EXECUtIVE sUMMARYThe 2016 National HIV Sentinel Survey (NHSS) marks the 13th such survey to be conducted in Namibia. Biennial surveys have been conducted countrywide since 1992 to monitor the prevalence of HIV through anonymous unlinked HIV sentinel surveillance of pregnant women attending antenatal care at public health facilities.
The general objectives of the 2016 NHSS were: • to estimate the national prevalence of HIV infection in pregnant women age 15-49 years; • identify geographic and socio-demographic characteristics associated with higher prevalence and; • To monitor HIV prevalence trends over time.
Out of 8,117 women tested for HIV in the 2016 NHSS, majority (72.3%) had been pregnant before (multi-gravida). Furthermore, the highest percentage of enrollment (92.8%) was among older women 25-49 years who has been pregnant more than once.
The overall national HIV prevalence among pregnant women receiving antenatal care (ANC) was 17.2%. Site level HIV prevalence varied considerably between sites. The sites with the highest HIV prevalence among pregnant women receiving ANC were Katima Mulilo (32.9%), Oshikuku (24.5%), Onandjokwe (22.6) and Otjiwarongo (22.5%). The sites with the lowest HIV prevalence were Opuwo (5.2%), Windhoek Central (6.2%) and Tsumkwe (6.4%).
By age group, HIV prevalence was observed to be highest among women age 35-39 years (32.3%) and women age 45-49 years (31.6%). HIV prevalence was lowest among women age 15-19 years (5.7%) and women age 20-24 years (10.2%). In 2016, the lowest HIV prevalence among women age 15-24 years was observed in Opuwo and Okakarara with 2.9% each, followed by Windhoek Central (3.3%). In addition, the highest HIV prevalence among women age 15-24 years was observed in Katima Mulilo (20.5%) and Rosh Pinah (13.8%). In 15 (38.5%) out of 39 sites, more than one quarter (percentage) of the women within the older age group (25-49 years) were HIV positive during the 2016 survey period. The overall HIV prevalence of 17.2% in 2016 represents a slight increase from 16.9% in 2014. Results from the 2016 NHSS suggest that Namibia’s epidemic remains in a period of stabilization with slow yet sustained decreases in HIV prevalence among pregnant women since 2002. From 2014 to 2016, a decrease in the HIV prevalence was observed at 16 (41%) main sites that participated in both survey rounds. An increase in the HIV prevalence between 2014 and 2016 was also observed in 18 main sites, of which the greatest increases were observed in Oshikuku (18.6% to 24.5%), Otjiwarongo (14.4% to 22.5%) and Outjo (11.2% to 18.5%). Since 2008, overall HIV prevalence among the older age group (25-49 years) appears to be on a decline. Similarly, the overall HIV prevalence in the younger age group (15-24 years) appears to be declining since 2008 and stabilized between 2012 and 2016. The overall HIV prevalence for the youth (15-24 years) was 8.5% in 2016 which shows a decline in comparison to 10.6% in 2008.

Surveillance Report of the 2016 National HIV Sentinel Survey
XISurveillance Report of the 2016 National HIV Sentinel Survey
Overall, the HIV prevalence among women residing in rural areas was 16.7%, while HIV prevalence among women residing in urban areas was 17.7%. The HIV prevalence among women residing in urban or rural areas is almost similar within each age group, except for women age 15-19 years, among whom there is a higher HIV prevalence in urban areas (7.3%) compared to rural areas (4.6%) while among women age 40-49 years is higher in urban areas (34.8%) compared to rural areas (29.4%).
The 2016 NHSS collected data on the antiretroviral therapy (ART) status of women who participated in the surveillance survey. Overall, 62.5% of all women who tested HIV positive during the survey were already on ART. The percentage of HIV positive women who were already on ART was highest in the older age groups (88.8% among HIV positive women age 40-49 years and 77.9% among HIV positive women age 35-39 year) and lowest in the youngest age group (25.3%) among women age 15-19 years.
Some limitations of this survey include:
The results of this survey are not necessarily representative of the general population of Namibia because; • Specimens were only collected from women so the results are not intended to be representative of men.• Only specimens from women age 15-49 who were pregnant during the period of the survey were included in
the survey. Therefore, women younger than 15 years or older than 49 years were not included in this survey. • Only specimens from pregnant women receiving ANC at public facilities are included in the NHSS. All women
receiving ANC at private facilities are not included in the sample. Consequently, the results of this survey may overestimate or underestimate the true HIV prevalence among all pregnant women in Namibia.
Based on the results of the 2016 NHSS, some recommendations are proposed. These include:• There is a need to strengthen targeted, age-specific prevention interventions to reduce new infections
among women of all age groups. As the current NSF reaches its conclusion, the unmet prevention need among young women in particular must be addressed during Namibia’s next round of strategic planning.
• Compare NHSS data with the results of the Demographic Health Survey Plus (DHS+) and further triangulate with additional data sources to assess the consistency of these data with other available country data and to obtain a more complete and accurate understanding of the national epidemic.
• Conduct additional research and surveillance activities that will help to determine the effect of new infections and mortality on overall HIV prevalence estimate and changes of prevalence over time.
• Strengthen routine PMTCT Monitoring and Evaluation System to enable HIV surveillance using PMTCT program data
• Strengthen the supply chain management if Namibia is to transition to the use of routine PMTCT data using rapid test results.

Surveillance Report of the 2016 National HIV Sentinel Survey
XII Surveillance Report of the 2016 National HIV Sentinel Survey

Surveillance Report of the 2016 National HIV Sentinel Survey
1Surveillance Report of the 2016 National HIV Sentinel Survey
1. BACKGROUnDHIV remains a leading cause of adult morbidity and mortality in Namibia, which continues to have one of the highest HIV prevalence rates in the world (UNAIDS, 2014). UNAIDS reported that there were 210,000 [200,000 - 230,000] people living with HIV in Namibia and an estimated 3,100 [2,500 – 3,800] deaths [UNAIDS (2016)]. The Namibia Demographic and Health Survey of 2013 estimated the national HIV prevalence rate among adults (15-49 years) to be 14.0%, and varying depending on sex, age, geography, and socio-economic status. HIV prevalence is higher among women compared to men (16.9% compared to 10.9%), and peaks in the 35-39 year age group among both women (30.9%) and men (22.6%) according to the Namibia Demographic Health Survey (NDHS), 2013. HIV prevalence is slightly lower in urban areas (13.3%) than it is in rural areas (15.0%), (NDHS (2013). Substantial variation in HIV prevalence was also observed among Namibia’s 14 administrative regions, with prevalence ranging from 23.7% in Zambezi Region to 7.3% in Omaheke Region (NDHS, 2013).
Overall, the number of estimated PLHIV increased from 180,000 in 2000 to 200,000 in 2015 and this could party be attributed to the successful implementation of the ART and PMTCT programs. The number of facilities dispensing ARVs has increased over the years. In 2016, a total of 271 health facilities were dispensing ART in Namibia up from less than 10 facilities in 2002 (Programme monitoring data, 2016). Likewise, more eligible adults and children are receiving ART.
The Government of the Republic of Namibia (GRN) has mounted an aggressive and tireless campaign against HIV and AIDS disease. The national antiretroviral therapy (ART) program was rolled-out in 2002. Since then the GRN has systematically put in place plans and resources to address the challenges of HIV. Intervention areas include Social and Behaviour Change Communication (SBCC), HIV counselling and testing (HCT), Condom marketing and distribution, Voluntary Medical Male Circumcision (VMMC), Prevention of Mother to Child Transmission (PMTCT), Prevention with the Positives (PwP), Post Exposure Prophylaxis (PEP), management of Sexually Transmitted Infections (STIs) and blood safety. In 2012/13 government contributed 55.0% of total HIV expenditure while in 2013/14 contribution was 64.0%. This clearly demonstrates the commitment of government to the response towards HIV and AIDS1.
To coordinate the response better, soon after Namibia gained its independence in 1990 it launched the National AIDS Control Programme (NACP) based in the Ministry of Health and Social Services (MoHSS). This was followed by the First Medium Term Plan covering the period 1992-1998. The Second Medium Term Plan (MTPII) was launched in 1999 for the period 1999-2004, followed by the Third Medium Term Plan (MTPIII) for 2004-2009. Both the MTP II and MTPIII provided a comprehensive framework for the national multisectoral and sub-regional response to HIV/AIDS. Namibia is currently implementing the National Strategic framework for HIV/AIDS Response (NSF)1 for 2010/11-2016/17. Initially the NSF had a time frame of 2010-2015/16. However with the mid-term review that was conducted in 2013, it resulted in the NSF being extended to 2010/11-2016/17, effectively aligning the revised NSF with the implementation period of the National Development Plan (NDP 4).
1 Mid Term Plan (MTP) was replaced by the National Strategic framework for HIV/AIDS Response (NSF)

Surveillance Report of the 2016 National HIV Sentinel Survey
2 Surveillance Report of the 2016 National HIV Sentinel Survey
The NSF which calls for a combined prevention strategy, built on the strengths of the previous programme and address the areas identified for renewed attention and commitment, as well as for human resource capacity building, improved financing and enhanced coordination and cooperation. The current NSF also keeps in sight the goals of Vision 2030, and keeps the UN 2011 Political Declaration on HIV and AIDS in sight. In addition, it has prioritised basic programmes that have the potential to yield the desired results of reducing new HIV infections and AIDS related deaths. Key achievements in prevention include a reduction in new infections in adults aged 15 years and above from an estimated 18,000 [16,000-21,000] in 2000 to 7,400 [5,800-9,000] in 2015; and a decline in new HIV infections among children (0-14 years old) from an estimated 2,600 [2,200-3,000] in 2000 to <500 [<200-<1000]) in 2015 (Spectrum, 2016). Namibia is one of the countries that met the goal of providing antiretroviral medicines to 90% of pregnant women living with HIV in 2012. Namibia has increased coverage of PMTCT programs and implemented Option B+ (life-long ART for all HIV-infected women regardless of CD4 cell count) in 2014.
At national level, the Ministry has a well-established National AIDS Coordination Programme which is managed by the Directorate of Special Programmes (TB, Malaria and HIV/AIDS) since 2004. The Directorate is overall responsible for providing assistance to all sectors in the development and implementation of sector-related HIV/AIDS activity plans in accordance with sectoral obligations.
1.1. History and Context of Sentinel Surveillance
HIV surveillance forms a critical element in the expanded national response as it allows identification of the geographic and demographic population groups and sub groups most affected by the virus so that comprehensive and evidence-informed HIV prevention, treatment and care programmes are targeted to these groups. In addition, surveillance activities allow the government to generate strategic information for monitoring HIV trends in various groups, evaluate the effectiveness of policies and programmes and inform further policy development and programme design. The National Strategic Framework (NSF) for HIV and AIDS has put in place strategies to prevent the spread of HIV and AIDS and mitigate the impact of the disease in the population. In addition, it has also adopted the investment approach for prioritising and investing in the national responses. As part of this plan the government will continue to monitor the trends and measure the impact of the epidemic on the population, including conducting sentinel surveillance, special surveys and program evaluation.
HIV Sentinel surveillance survey among pregnant women receiving ANC has been conducted every second year since 1992 in Namibia. The survey started off with 8 facilities and expanded to 14 facilities in 1994 to include smaller towns and some rural areas. Sites continued to expand and as of 2008, all 35 districts were covered to better represent regional diversity. To achieve sufficient sample size, some of the primary facilities were supplemented by satellite facilities. In 2014, the MOHSS continued the sentinel surveillance survey in 35 districts sites supplemented by 98 satellite sites. In 2016, the MOHSS continued the sentinel surveillance survey in 35 main district sites as well as in the new 5 health districts (Ondangwa, Omuthiya, Ncamangoro, Rosh Pinah and Tsumkwe) supplemented by 98 satellite Sites (Appendix 8).

Surveillance Report of the 2016 National HIV Sentinel Survey
3Surveillance Report of the 2016 National HIV Sentinel Survey
For each sentinel surveillance round, the MOHSS followed a standardized methodology recommended by the World Health Organization (WHO) as the most suitable way for countries to monitor the trend of HIV infection by key socio-demographic characteristics in different geographical areas and HIV testing was completed on blood samples collected from pregnant women attending ANC clinics collected for syphilis testing. Blood samples were stripped of any personal identifying information prior to HIV testing so there was no way that the HIV status of a particular woman could become known during the process and hence there was no possibility of stigmatization.
Other information that complemented ANC sentinel surveillance included data routinely collected from Prevention of Mother-to-Child Transmission (PMTCT) program. In addition, STI data collected from ANC sites for the same period were used to compare STI and HIV prevalence at each site.
Provision of HIV and AIDS services, including ART, PMTCT and HIV Counselling and Testing (HCT), remains a high priority of the Namibian government. Public health facilities began rolling out PMTCT in 2002, ART in 2003 and VCT services in 2004. As of 2016, 347 out of 360 public health facilities and 100% of the ANC clinics were providing prevention of mother-to-child transmission (PMTCT) services with coverage of above 95%.Facility-based sentinel surveillance provides the main data used to inform service delivery roll-out and programme development and allows estimation of the needs of these programmes for national coverage.
Rapid HIV testing continues to be rolled out at PMTCT sites to increase the proportion of women receiving their results by eliminating the need to return to the clinic after results are received from the district or national laboratory. Pre- and post-test counselling is provided according to national PMTCT guidelines.
Namibia follows international guidelines for conducting unlinked anonymous testing which is ethically justifiable for public health practice as the data is used to benefit the entire population for targeting resources for HIV prevention programmes. As the PMTCT programme has had rapid scale up and is available in all ANC sentinel surveillance sites with a high uptake by clients, Namibia has the opportunity for assessing and utilising PMTCT data for surveillance purposes thereby minimising costs and duplication of efforts. However, this type of assessment could not be done due to the on and off national stock-out of rapid test kits countrywide.
1.2. Sentinel Surveillance Justification
ANC sentinel surveillance is currently the key data source that provides biennial national trend for HIV estimates in the country. The surveillance data provide inputs for the SPECTRUM, EPP and other models which estimate and project national HIV prevalence, HIV incidence, estimated number of people living with HIV, need for ART and is thus essential for programme planning and evaluation.
Sentinel surveillance provides the country program-level information on HIV prevalence trends, stratified by geographic areas as well as age group. Owing to this, MOHSS and other stakeholders will be able to design targeted interventions. This survey is essential because it provides a continuous flow of program data that can be used to model what is happening in the larger population. Periodic population-based surveys including Demographic Health Survey and planned 2017 HIV Impact Assessment that include biological data representative of the population can assist in calibrating and validating the interpretation of sentinel surveillance data.

Surveillance Report of the 2016 National HIV Sentinel Survey
4 Surveillance Report of the 2016 National HIV Sentinel Survey
1.3. Sentinel Surveillance and HIV and AIDS Services
In 2009, the GRN has set CD4 eligibility criteria to 350 cells/ μL which achieved ART coverage of those eligible from 67% baseline to over 83% by 2013 – midterm for the NSF. The Government of Namibia has since decided to change its CD4 threshold for ART eligibility for adults from 350 to 500 cells/μL. In addition, all pregnant women, all children under 15 years old, all HBV/HIV co-infected patients and HIV-positive persons whose partners are HIV-negative are eligible for ART irrespective of CD4 count. This began with the roll out of the new ART guidelines in 2014. Namibia is now piloting the Treat All initiative in three regions – Zambezi, Ohangwena and Khomas regions within 16 facilities. Similarly, the Ministry of Health is reviewing its treatment guideline in line with the new WHO guideline.
A key entry point for treatment, PMTCT and treatment as prevention has always been HIV counseling and testing (HCT). Mixed methods of HCT delivery are being implemented, ranging from facility based HCT at all levels, provider initiated counseling and testing (PICT), mobile outreach, stand-alone centers, workplace HCT integrated into Wellness programmes and door-to-door HCT.
Aligned to the Global Plan, the MOHSS has developed a costed National Strategy and Action Plan for the Elimination of New Paediatric Infections and Keeping their Mothers Alive 2012/2013 – 2015/2016. The PMTCT role has been impressive with approximately 95% of health facilities providing HIV testing and ART by March 2016. The GRN is implementing Option B+ from the WHO recommendations; this approach is expected to have a positive impact on PMTCT results.
HIV sentinel surveillance provides primary information used to inform service delivery roll-out and expansion, programme development, and estimation of the needs of these programmes for universal coverage.

Surveillance Report of the 2016 National HIV Sentinel Survey
5Surveillance Report of the 2016 National HIV Sentinel Survey
1.4. Participating Sites
In Namibia, sentinel surveillance sites have been selected based on regional coverage, geographic location (whether urban or rural) and the volume of ANC attendees at each site. Beginning with eight health facilities in 1992, the number of sites was increased to 14 in 1994 and to 24 by 2004 (Figure 1). To cover all the districts, surveillance sites were increased to all 34 districts in 2008, with 35 main hospital sites and a maximum of 9 supporting satellite sites. In 2016 five (5) new main sites were included in alignment with newly demarcated health districts. The new districts are: Ondangwa, Omuthiya, Rosh Pinah (that was previously part of Luderitz site), Tsumkwe and Ncamangoro. Furthermore, Aranos site was incorporated under Mariental site and Nankudu district became Nkurenkuru district. As a result, there were 39 sites in the 2016 survey.
Figure 1: number of participating sites, nHss 1992 - 2016

Surveillance Report of the 2016 National HIV Sentinel Survey
6 Surveillance Report of the 2016 National HIV Sentinel Survey
2. sURVEY OBJECtIVEs2.1. General Objectives
The general objectives of the 2016 NHSS were; to estimate the national prevalence of HIV-infection in pregnant women age 15-49 years; identify geographic and socio-demographic characteristics associated with higher prevalence, and; to monitor prevalence trends over time.
2.2. Specific Objectives
The following were the specific objectives of the 2016 survey:• To monitor trends over time in HIV prevalence amongst pregnant women nationally, by site and by age groups;• To compare and validate programme data from prevention of mother-to-child transmission (PMTCT) with
sentinel surveillance results; • To estimate the prevalence of syphilis among pregnant women by site and age group;• To disseminate and utilize the information provided by sentinel surveillance and to advocate and plan for more
effective services for prevention, treatment, support and care;• To provide essential input parameters for models to estimate and project national HIV estimates (prevalence,
incidence, ART need, orphans, deaths, etc.);• To retain specimens for other HIV surveillance related activities including drug resistance surveys • To estimate prevalence among the 15-24 year olds as a proxy measure of new HIV infections.

Surveillance Report of the 2016 National HIV Sentinel Survey
7Surveillance Report of the 2016 National HIV Sentinel Survey
3. MEtHODs3.1. Overview
The protocol for the 2016 NHSS was developed by the Response Monitoring and Evaluation Subdivision (RM&E) of DSP in conjunction with the National HIV Sentinel Surveillance Technical Working Group (NHSS TWG). The NHSS TWG also provided oversight of the implementation of the survey and conducted field training and supervisory visits. The methods were based on recommendations presented in the WHO Guidelines for Conducting HIV Sentinel Surveys among Pregnant Women and Other Groups.
3.2. Sampling
3.2.1. selection of sentinel sites
The first site selection strategy for the 2016 NHSS was to maintain the 2014 sentinel surveillance sites so that HIV trends can be monitored over time at these consistent sites. The second strategy was to select sites (and satellite sites) which would allow for estimations of HIV and syphilis prevalence that are representative of all geographical regions and health districts of the country. Similarly, the new health districts were added to ensure that all the health districts are represented in the 2016 survey.
In order for a health facility to be included as a main or satellite site in the NHSS, the following criteria had to be met: • Blood is routinely collected from clients;• A laboratory for processing of specimens or transport to the laboratory;• The site is accessible to surveillance staff;• On-site staff members are cooperative and trained to conduct sero-surveys;• Ability to recruit adequate clients for the required sample size during the survey period;• Availability of on-site counselling and testing services or referral to such services.
Majority of main sites had satellite sites, which assisted the main site in the effort to reach the target sample size (Appendix 8). These satellite sites were mainly clinics that were in the vicinity of the main site, i.e. clinics in the same district rendering ANC services to that district’s population. Data from these satellite sites were pooled with those from the main site (sample sizes from individual satellite sites would be too small for analysis). For a satellite site to be used, the following criteria were applied:
• Main site and satellite site are servicing the same health district populations;• Consistent satellite sites were used over survey rounds;• Staff at satellite site received the same training as the main site staff;• Supervision included the main as well as the satellite site.
Each main and satellite site were allocated their own bar coded stickers. A total of 98 satellite sites (Appendix 8) contributed to the targeted sample size attained by 39 sentinel surveillance main sites.

Surveillance Report of the 2016 National HIV Sentinel Survey
8 Surveillance Report of the 2016 National HIV Sentinel Survey
3.2.2. survey population
The target population of the 2016 NHSS included pregnant women receiving ANC services during the period of sample collection at ANC clinics designated as sentinel sites. The women were selected through consecutive sampling until the sample size was met for each site. The specimens for HIV testing were collected from residual blood from routine syphilis testing.
Inclusion criteria
Women receiving ANC that met all of the following criteria were included in the 2016 NHSS:• 15-49 years of age; • Receiving ANC for the first time during the current pregnancy;• Agreeing to a routine blood draw for syphilis screening.
Exclusion criteria
Women receiving ANC that met any of the following criteria were excluded from the 2016 NHSS:• Previously having attended any ANC clinic during the current pregnancy;• Age less than 15 years or age greater than 49 years; • Not agreeing to a routine blood draw for syphilis screening.
3.2.3. sample size determination
For the 2016 Sentinel Surveillance in Namibia, sample sizes were calculated for all the respective participating main sites based on WHO Guidelines taking into consideration previous prevalence estimates (as stated above), the confidence level desired for intervals around the survey prevalence estimates, and the relative accuracy. The relative accuracy was set such that a difference of ≥ 5% between 2014 and 2016 survey prevalence estimates for a given site was detected with statistical significance. The site prevalence for the previous survey round was used to derive the targeted sample size for the 2016 HSS round.
3.3. Survey duration
The maximum sampling duration was 29 weeks from the 14 March to 30 August 2016. When a site achieved the site-specific target sample size in a period less than the maximum sampling duration, collection of samples stopped at that particular site. However, the data collection period was extended to 30 September 2016, mainly because some sites were still far from reaching their targets.
3.4. Pre-survey training
The DSP RM&E Subdivision organized and coordinated a full week pre-survey protocol training for NHSS TWG members and regional level supervisors and included focal persons from all the districts. The national and regional level supervisors thereafter conducted district trainings to build the knowledge and skills of the site-level survey implementers. The site-level survey training for implementers included all the districts laboratory focal persons, Chief Medical Officers (CMOs), District Principal Medical Officers (PMOs), Matrons from the participating districts, nurses working in the ANC clinics or providing these services and staff from the satellite sites.

Surveillance Report of the 2016 National HIV Sentinel Survey
9Surveillance Report of the 2016 National HIV Sentinel Survey
Prior to initiation of the 2016 NHSS, materials and equipment that were needed for the survey were provided to the main sites and satellite sites, as well as the district NIP laboratories. The supplies included booklets of ISFs, unique specimen identification barcode stickers, progress reporting forms, a laminated copy of NHSS data collection and specimen collection laboratory flow chart, cool boxes, and marker pens.
3.5. Data and specimen collection
An unlinked anonymous testing approach for data collection was used, as recommended by the WHO. Individual survey forms (ISF) (Appendix 3) were used by facility staff responsible for implementing the survey to collect socio-demographic information from eligible woman receiving ANC. All required data elements for the survey were extracted from routine ANC data sources (ANC Passport & ANC/PMTCT register) and logged onto the self-carbonizing ISF. The ISF captured included the following information:
• Bar coded sticker (Unique Identification);• Date of ANC visit;• District abbreviation; • Site number;• Type of facility;• Woman’s age;• Place of residence (classified as Urban or Rural) Gravidity; • ART participation;• Patient tested for HIV• HIV test result• Surname and Initial of the person completing the form• Signature of person completing the form
A unique survey identification barcode sticker was appended to each ISF. This unique survey barcode sticker had the same ID number as a second barcode sticker that was appended to the blood specimen tube that was collected from the same woman (described below). At the end of each day, the ISF was checked alongside the blood samples by nurses for accuracy and completeness and labeling in the case of the blood specimens. The original copy of the ISF was submitted to the national level and carbonized copies of all ISF which did not contain the survey identification barcode stickers were retained at the site.
3.6. Laboratory Procedures
3.6.1. Preparation of specimens
A routine blood draw for syphilis screening was conducted for all women attending their first ANC visits. After determining a woman’s eligibility, the site staff would append the unique survey barcode sticker to the 10 ml red top tube which is used for routine syphilis testing. All tubes were sent to the local Namibia Institute of Pathology Limited (NIP) laboratory and centrifuged, after which at least three ml of serum was aliquoted into a 5 ml red top tube. A third identical survey barcode identification sticker was affixed to the five ml red top tube and refrigerated prior to being transported to the NIP in Windhoek for HIV testing. The survey barcode sticker affixed to the 10 ml tube was blackened out while the name of the patient remained on it for syphilis testing. This process completed the de-linking of the patient information from the survey. The HIV result thus could not be linked to specific patient.

Surveillance Report of the 2016 National HIV Sentinel Survey
10 Surveillance Report of the 2016 National HIV Sentinel Survey
Cold chain was maintained during specimen transportation from sites to the local laboratory as well as from the local laboratory to the central laboratory. This was done by monitoring the cool box ambient temperature on arrival by NIP laboratory staff through measuring the temperature of the water contained in the water container with the specimens in the cool box.
A shipping/results form (Appendix 4) was designed to record the unique survey barcode sticker ID, the individual data, and the HIV testing results for each specimen. A fourth identical survey barcode sticker was attached to this shipping/results form by the district NIP laboratory staff. This form and the specimens were shipped to the NIP Windhoek Central Reference Laboratory (WCRL) for HIV testing. When the HIV test was completed, the results were recorded next to the respective unique survey barcode sticker. The result forms were then forwarded to MOHSS/DSP: Response Monitoring & Evaluation (RM&E) Subdivision for data entry in the 2016 NHSS database.
3.6.2. testing procedures
For HIV testing in the 2016 NHSS, each sample was tested using the Abbot Architect HIV ag/ab combo assay (Abbot Diagnostics, USA) to detect HIV antibodies (HIV-1/2), which is a fourth generation assay that can simultaneously detect p24 antigen and HIV antibodies. The Architect HIV ag/ab combo assay has been reported to give a sensitivity of 100% (95% confidence interval [CI] (98.4 – 100%).2 All NHSS specimens that tested positive were confirmed using the DXI 800 (Beckman-Coulter, USA), which is a 4th generation ELISA test that detects p24 antigen and HIV antibodies. If the confirmation test was positive, “positive” was recorded as the final result.
3.6.3. Recording and transmission of results All HIV testing was conducted at the NIP WCRL in Windhoek, with results entered on a shipping/results form. Results were forwarded to the DSP RM&E Subdivision on a weekly basis where they were entered into a database by DSP/RM&E staff using Epi Info version 7 as a data entry application.
3.7. Syphilis testing
Syphilis screening among pregnant women is a universal practice in Namibia, even outside of NHSS. Data on syphilis serology is therefore available. Syphilis test results for each woman receiving ANC during the survey period were collected in the normal way where the results were entered into the NIP (MEDITECH) database and reported back to the woman.
The syphilis results for women collected during the survey period were extracted from the NIP database without identifying the client details.
Patient level syphilis results were not linked to patients level HIV test results during the NHSS.

Surveillance Report of the 2016 National HIV Sentinel Survey
11Surveillance Report of the 2016 National HIV Sentinel Survey
3.8. Quality Assurance
3.8.1. national Level Quality Assurance
A technical working group (TWG) was formed with representatives from DSP: RM&E Subdivision (Secretariat), other MoHSS Directorates (i.e., Primary Health Care, Policy, Planning and HRD, etc.) and other partners such as; Global Fund, NIP, NSA, WHO, UCSF, UNAIDS, USAID, UNICEF, and the CDC.
The TWG conducted regular site support visits as scheduled as well as needed. A quality assurance tool (Appendix 6) as recommended by the WHO guidelines was completed during each supervisory visit and forwarded to the DSP: RM&E Subdivision for subsequent analysis and action. In addition, another quality assurance tool (Appendix 11) was created to be used during support visits at the NIP laboratories.
3.8.2. Field Level
The Primary Heath Care (PHC) supervisors, the regional Chief Health Programme Officers (CHPO), Senior Health Programme Officer (SHPO) for Special Programmes as well as Family Health (FH) acted as site level supervisors during the 2016 NHSS. Their duties included consistent monitoring of the collection, transportation, and delivery of blood samples and collecting and submitting ISFs during the entire NHSS period at each site. The supervisors completed the weekly progress forms and submitted them to the Response Monitoring and Evaluation (RM&E) subdivision on a weekly basis. To maintain quality, the national supervisors in collaboration with the regional supervisors conducted on-site verification and trainings when problems were identified.
3.8.3. Laboratory
NIP is an important partner for the NHSS and played a critical role during the survey planning, implementation and monitoring.
All surveillance activities in the laboratory were supervised by the Laboratory Supervisor of the WCRL. Logistical aspects were handled by the Technologist assigned to the survey team at the WCRL according to the existing routine arrangement.
NIP officers (mainly Technologists/Technicians in charge) at the district NIP laboratories cross checked blood samples and completed data collection forms for all IDs for every shipment batch received. The weekly specimen tube batches were sent to NIP National Reference Laboratory in Windhoek using the existing transport to the NIP National Reference Laboratory in Windhoek.
Routine quality assurance procedures are maintained by NIP in line with International Organisation of Standardisation (ISO) and quality standard 15189:2012. This included daily internal quality assurance using known quality control materials supplied by the HIV testing assay manufacturer (Abbott) and monthly external quality assurance. The laboratory supervisors verified all the results before recording them on the data form. At the end of the testing, 10% of randomly selected samples were retested by an external independent laboratory for quality assurance to measure discordance rate and 99.9% of the results matched.
Surveillance Report of the 2016 National HIV Sentinel Survey
12 Surveillance Report of the 2016 National HIV Sentinel Survey
3.9. Data Management and Analysis
3.9.1. Data Management
All ISFs were checked for completeness and accuracy in the field by the site supervisor on a daily basis. These ISFs were also checked by the supervisors on a daily basis for completeness and accuracy. The missing or inconsistent data identified by the regional supervisors were corrected immediately.
Completed ISFs were sent in weekly batches via NIP to DSP RM&E Subdivision. Data entry was conducted in the offices of DSP: RM&E subdivision by data clerks under the supervision of the Head of the Subdivision and the Survey Coordinator. Data were electronically entered using Epi Info version 7 (Centers for Disease Control and Prevention, Atlanta, Georgia, USA).
3.9.2. Data Quality Assessment
Epi-Info “check codes” were developed and routinely applied to the NHSS dataset in order to identify missing values and out of range values for any variables as well as logical inconsistencies between any two or more variable collected from each woman. Also, ISFs that were received at the national level that had apparent missing or out of range values for any variables were flagged for investigation by the NHSS data clerks. Data quality issues identified at the national level were investigated and corrected during national level support visit which were conducted three times during the survey at all main and satellite sites.
Entry of data in the NHSS database was completed twice by two data entry clerks to create two independent files from the same hard copy data. Prior to analysis, these two files were then electronically compared. All discrepancies identified between the two separate data files were rectified by consulting the original paper tools after which a cleaned master analytic file was created.
3.9.3. Analysis
The HIV prevalence among women included in the 2016 NHSS was calculated overall and specific to each sentinel site. Results were stratified by age group, urban/rural residential status and gravidity group. The percentage of women testing HIV positive during the 2016 NHSS who were already on ART was calculated by site, age group and urban/rural residential status. Site level trends in HIV prevalence among pregnant women included in the 2010, 2012, 2014 and 2016 NHSS were estimated by using the chi-square test for linear trend. Survey data were analyzed using Stata V.12.1. Overall and site level 2016 NHSS prevalence estimates were compared with national and district level HIV prevalence estimates from PMTCT program data and routine syphilis data from the NIP reference laboratory that were reported during the same time period in which the 2016 NHSS was conducted.

Surveillance Report of the 2016 National HIV Sentinel Survey
13Surveillance Report of the 2016 National HIV Sentinel Survey
3.10. Ethical considerations
The 2016 NHSS was conducted by means of unlinked anonymous testing of blood samples obtained for routine diagnostic purposes. After routine testing, blood samples were stripped of identifying information and were coded thus eliminating any possibility of tracing the identity of ANC clients. The unique survey barcode number was recorded on the form and also used for labelling the blood samples and linking laboratory results with demographic data. The bar code was used to link the demographic information captured on the ISF with the laboratory results while maintaining anonymity of the survey participant.
The ISFs were kept in a locked location at the MoHSS, DSP RM&E Subdivision. All data were entered and analyzed on password protected computers and the NHSS dataset itself is password protected. Field visits were conducted during the survey to ensure the availability of trained staff, adherence to guidelines for the surveillance as well as confidentiality guidelines.
Means to protect the rights of participants were considered during the planning and implementation of the survey. Staff training included objectives to minimize the probability that a woman could experience any kind of negative consequence during the timeframe of the surveillance. No personal identifying information was collected with the blood sample. In addition, each ANC client was offered routine PMTCT services thus allowing clients to know their HIV status if they accepted counselling and testing.
3.11. Dissemination and use of the results
A comprehensive report of the 2016 NHSS was prepared by the DSP: RM&E Subdivision in collaboration with the TWG and submitted to the Permanent Secretary, MOHSS for comment and approval. The 2016 NHSS was officially launched on the commemoration of the World AIDS Day, December 2016. User friendly pamphlets were developed to ensure that the wider community obtain access to the information. The surveillance data generated through this survey will be used to:
• Advocate for the mobilization of human and financial resources and the targeted expansion and integration of the national ART program to meet the needs of the maturing epidemic;
• Plan for the roll-out, expansion, and integration of services for prevention, treatment care and support within the country;
• Estimate trends and impact of the HIV epidemic in various age groups and districts• Produce national models to project the magnitude of the epidemic over time;• To make well informed and evidence-based decisions.• Triangulate with other national surveys such as the DHS+, 2013
Surveillance Report of the 2016 National HIV Sentinel Survey
14 Surveillance Report of the 2016 National HIV Sentinel Survey
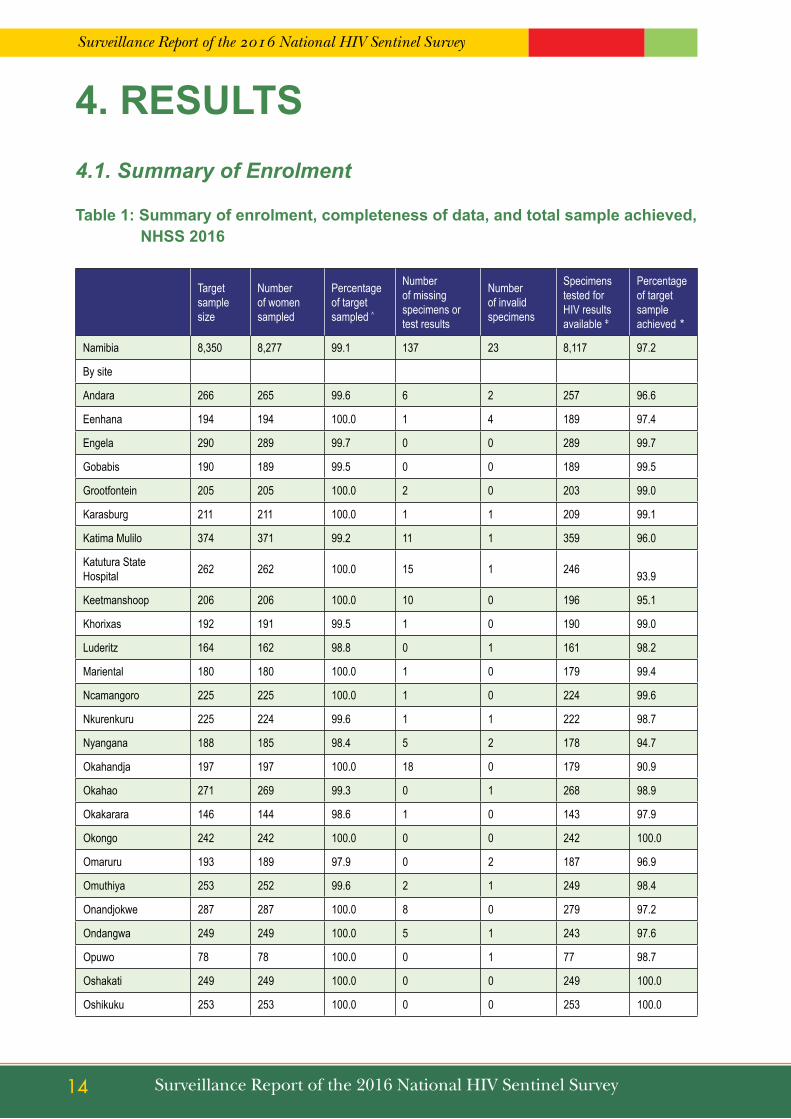
4. REsULts4.1. Summary of Enrolment
table 1: summary of enrolment, completeness of data, and total sample achieved, nHss 2016
Target sample size
Number of women sampled
Percentage of target sampled ^
Number of missing specimens or test results
Number of invalid specimens
Specimens tested for HIV results available ǂ
Percentage of target sample achieved *
Namibia 8,350 8,277 99.1 137 23 8,117 97.2
By site
Andara 266 265 99.6 6 2 257 96.6
Eenhana 194 194 100.0 1 4 189 97.4
Engela 290 289 99.7 0 0 289 99.7
Gobabis 190 189 99.5 0 0 189 99.5
Grootfontein 205 205 100.0 2 0 203 99.0
Karasburg 211 211 100.0 1 1 209 99.1
Katima Mulilo 374 371 99.2 11 1 359 96.0
Katutura State Hospital 262 262 100.0 15 1 246 93.9
Keetmanshoop 206 206 100.0 10 0 196 95.1
Khorixas 192 191 99.5 1 0 190 99.0
Luderitz 164 162 98.8 0 1 161 98.2
Mariental 180 180 100.0 1 0 179 99.4
Ncamangoro 225 225 100.0 1 0 224 99.6
Nkurenkuru 225 224 99.6 1 1 222 98.7
Nyangana 188 185 98.4 5 2 178 94.7
Okahandja 197 197 100.0 18 0 179 90.9
Okahao 271 269 99.3 0 1 268 98.9
Okakarara 146 144 98.6 1 0 143 97.9
Okongo 242 242 100.0 0 0 242 100.0
Omaruru 193 189 97.9 0 2 187 96.9
Omuthiya 253 252 99.6 2 1 249 98.4
Onandjokwe 287 287 100.0 8 0 279 97.2
Ondangwa 249 249 100.0 5 1 243 97.6
Opuwo 78 78 100.0 0 1 77 98.7
Oshakati 249 249 100.0 0 0 249 100.0
Oshikuku 253 253 100.0 0 0 253 100.0

Surveillance Report of the 2016 National HIV Sentinel Survey
15Surveillance Report of the 2016 National HIV Sentinel Survey
Otjiwarongo 209 209 100.0 0 0 209 100.0
Outapi 175 175 100.0 2 0 173 98.9
Outjo 173 174 100.6 0 0 173 100.0
Rehoboth 147 146 99.3 0 0 146 99.3
Rosh Pinah 164 163 99.4 0 1 162 98.8
Rundu 301 300 99.7 1 0 299 99.3
Swakopmund 164 163 99.4 6 1 156 95.1
Tsandi 268 268 100.0 0 0 268 100.0
Tsumeb 214 214 100.0 0 0 214 100.0
Tsumkwe 120 115 95.8 4 1 110 91.7
Usakos 283 242 85.5 30 0 212 74.9
Walvis Bay 262 261 99.6 5 1 255 97.3
Windhoek Central Hospital 80 80 100.0 0 0 80 100.0
^ % = (# of women sampled/ target sample size), ǂ this number represents the number specimens from women that were included in the final analysis, i.e. the number of women who were enrolled in the NHSS, * % = (# specimens tested with results available / target sample size).
The total national target sample size for the 2016 NHSS was 8,350. table 1 depicts that a total of 8, 277 eligible pregnant women starting ANC services were sampled for the survey. However, 160 (1.9%) of women initially sampled were excluded due to their HIV results that were either missing or declared invalid at the end of the survey. Reasons for invalid included; hemolysis of blood samples, insufficient volume of blood and indeterminate HIV test results. Therefore, 97.2% (8,117) of women had HIV testing results available and thus were included in the final analysis. The site level achievement of target sample size ranged from 74.9% to 100%.
table 2: Distribution of age among women tested for HIV in the nHss 2016
Number tested Percentage of total
Namibia 8,117 98.1
Age groups (broad bands)
15-24 3,562 43.9
25-49 4,555 56.1
Age groups (5-year bands)
15-19 1,322 16.3
20-24 2,240 27.6
25-29 1,867 23.0
30-34 1,423 17.5
35-39 896 11.0
40-44 331 4.1
45-49 38 0.5

Surveillance Report of the 2016 National HIV Sentinel Survey
16 Surveillance Report of the 2016 National HIV Sentinel Survey
Figure 2: Distribution of age among women tested for HIV in the nHss 2016
table 2 and Figure 2 shows the age distribution of women enrolled in the 2016 NHSS. Women in the 20-24 year age group accounted for the greatest percentage tested (27.6%), while the least percentages of women tested were between 40-44 years (4.1%) and 45-49 years (0.5%) respectively.
table 3: Distribution of gravidity and age among women tested for HIV in the nHss 2016
total testedPrima-gravida Multi-gravida
number tested^
Percentage of total *
number testedǂ
Percentage of total €
namibia 8,117 2,247 27.7 5,870 72.3
Age groups (broad bands)
15-24 3,562 1,920 53.9 1,642 46.1
25-49 4,555 327 7.2 4,228 92.8
Age groups (5-year bands)
15-19 1,322 1,071 81 251 19.0
20-24 2,240 849 37.9 1,391 62.1
25-29 1,867 251 13.4 1,616 86.6
30-34 1,423 52 3.7 1,371 96.3
35-39 896 18 2.0 878 98.0
40-44 331 6 1.8 325 98.2
45-49 38 0 0.0 38 100
^ represents number of women tested within age group who were prima-gravida* % = (# prima-gravida women tested/ # women tested in age group)ǂ represents number of tested within age group who were prima-gravida€ % = (# multi-gravida women tested / # women tested in age group)
Surveillance Report of the 2016 National HIV Sentinel Survey
17Surveillance Report of the 2016 National HIV Sentinel Survey
table 3 shows the distribution of gravidity by age group among women tested in the 2016 NHSS. Out of 8,117 women tested in the 2016 NHSS, 2,247 (27.7%) were prima-gravida (first pregnancy) and 5,870 (72.3%) were multi-gravida (pregnant at least one time before). The greatest age-specific percentage of women who were prima-gravida was observed within the 15-19 year age group (81.0%), while the greatest age-specific percentage of women who were multi-gravida was observed among the 40-49 year age group (98.2% -100%). Nearly half (46.1%) of women under the age of 25 years were pregnant for at least the second time.
4.2: HIV Prevalence
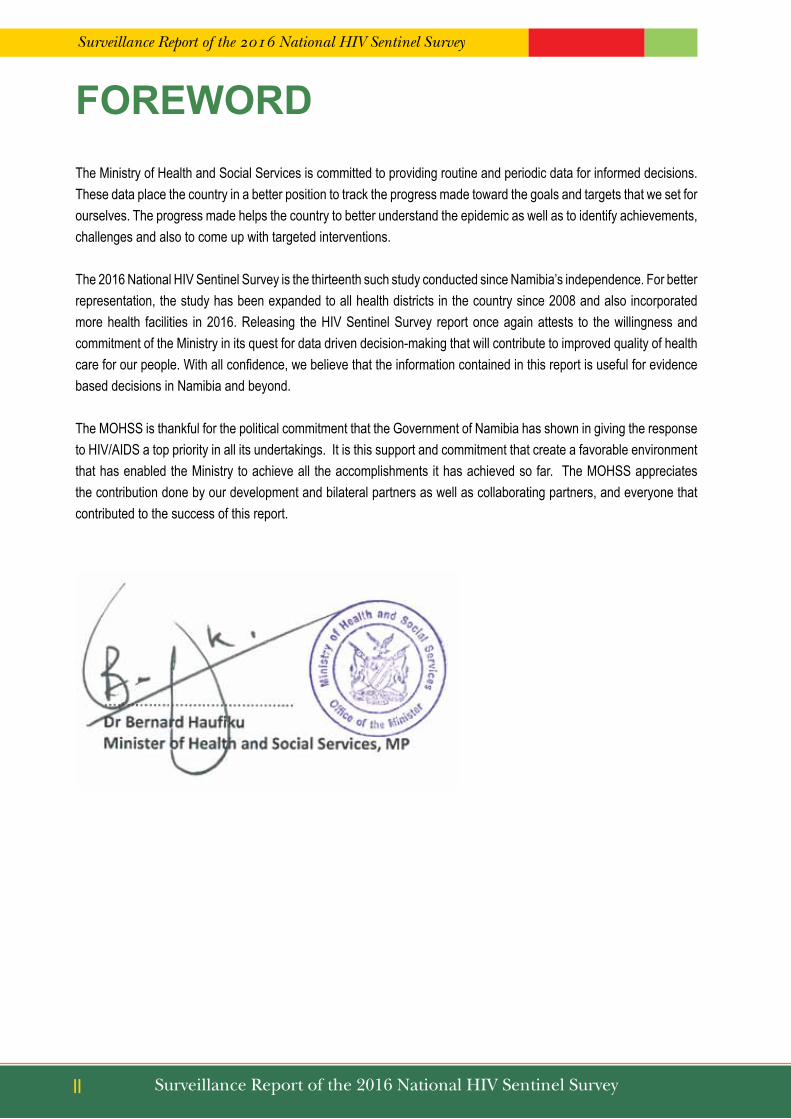
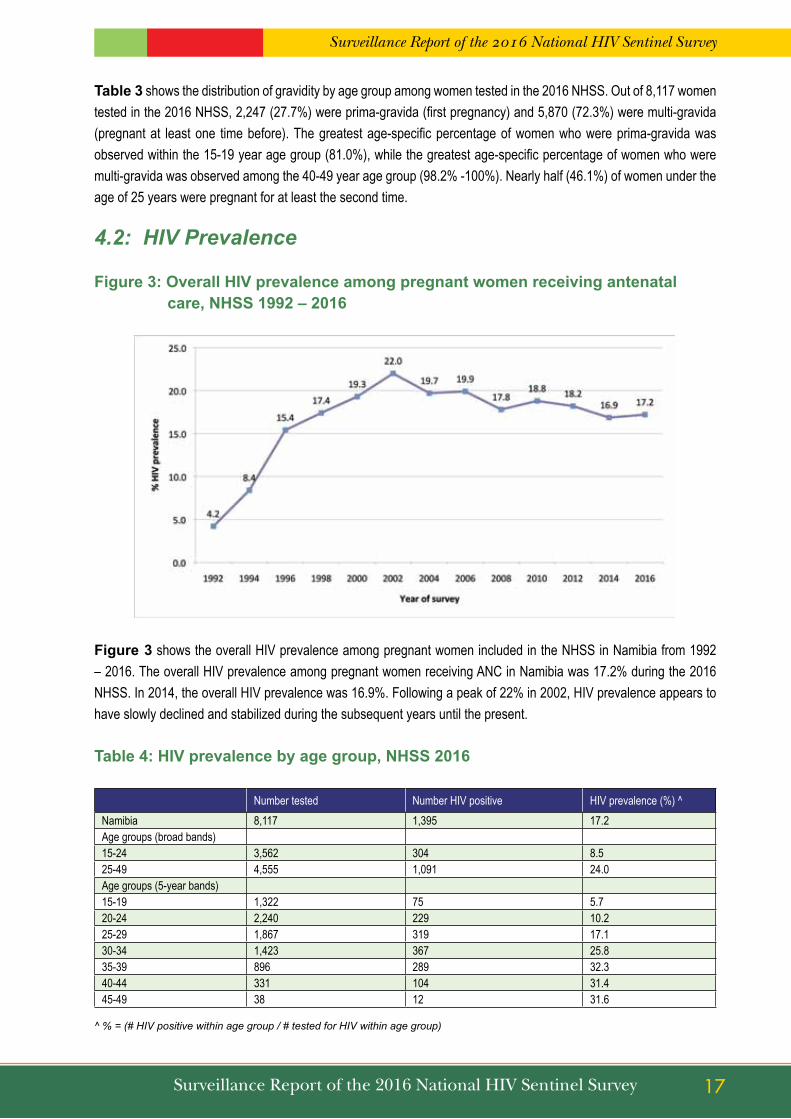
Figure 3: Overall HIV prevalence among pregnant women receiving antenatal care, nHss 1992 – 2016
Figure 3 shows the overall HIV prevalence among pregnant women included in the NHSS in Namibia from 1992 – 2016. The overall HIV prevalence among pregnant women receiving ANC in Namibia was 17.2% during the 2016 NHSS. In 2014, the overall HIV prevalence was 16.9%. Following a peak of 22% in 2002, HIV prevalence appears to have slowly declined and stabilized during the subsequent years until the present.
table 4: HIV prevalence by age group, nHss 2016
Number tested Number HIV positive HIV prevalence (%) ^Namibia 8,117 1,395 17.2Age groups (broad bands)15-24 3,562 304 8.525-49 4,555 1,091 24.0Age groups (5-year bands)15-19 1,322 75 5.720-24 2,240 229 10.225-29 1,867 319 17.130-34 1,423 367 25.835-39 896 289 32.340-44 331 104 31.445-49 38 12 31.6
^ % = (# HIV positive within age group / # tested for HIV within age group)

Surveillance Report of the 2016 National HIV Sentinel Survey
18 Surveillance Report of the 2016 National HIV Sentinel Survey
Figure 4: HIV prevalence by age group, nHss 2016
table 4 and Figure 4 show HIV prevalence by age group compared to the overall HIV prevalence in the 2016 NHSS. HIV prevalence is highest among women age 35-39 years (32.3%). HIV prevalence is lowest among women age 15-19 years (5.7%) followed by women age 20-24 years (10.2%). The relatively few number of pregnant women age 45-49 enrolled in the NHSS (n=38) limits the precision and the interpretation of the point estimate (31.6%).
table 5: HIV prevalence by gravidity and age, nHss 2016
Number tested Number HIV positive HIV prevalence (%)^
Prima-gravida
Namibia 2,247 162 7.2
Age groups (broad bands)
15-24 1,920 118 6.1
25-49 327 44 13.5
Age groups (5-year bands)
15-19 1,071 60 5.6
20-24 849 58 6.8
25-29 251 34 13.5
30-34 52 8 15.4
35-39 18 2 11.1
40-44 6 0 0
45-49 years 0 - -
Multi-gravida
Namibia 5,868 1,233 21.0
Age groups (broad bands)
15-24 1,641 186 11.3
25-49 4,227 1,047 24.8
Age groups (5-year bands)
Surveillance Report of the 2016 National HIV Sentinel Survey
19Surveillance Report of the 2016 National HIV Sentinel Survey
15-19 250 15 6.0
20-24 1,391 171 12.3
25-29 1,615 285 17.6
30-34 1,371 359 26.2
35-39 878 287 32.7
40-44 325 104 32.0
45-49 38 12 31.6
^ % = (# HIV positive within age group / # tested for HIV within age group)
table 5 shows HIV prevalence by gravidity and age group. HIV prevalence was higher among multi-gravida women (21.0%) compared to prima-gravida women (7.2%) HIV prevalence was highest among prima-gravida women age 30-34 years (15.4%) and multi-gravida women age 35-39 years (32.7%).
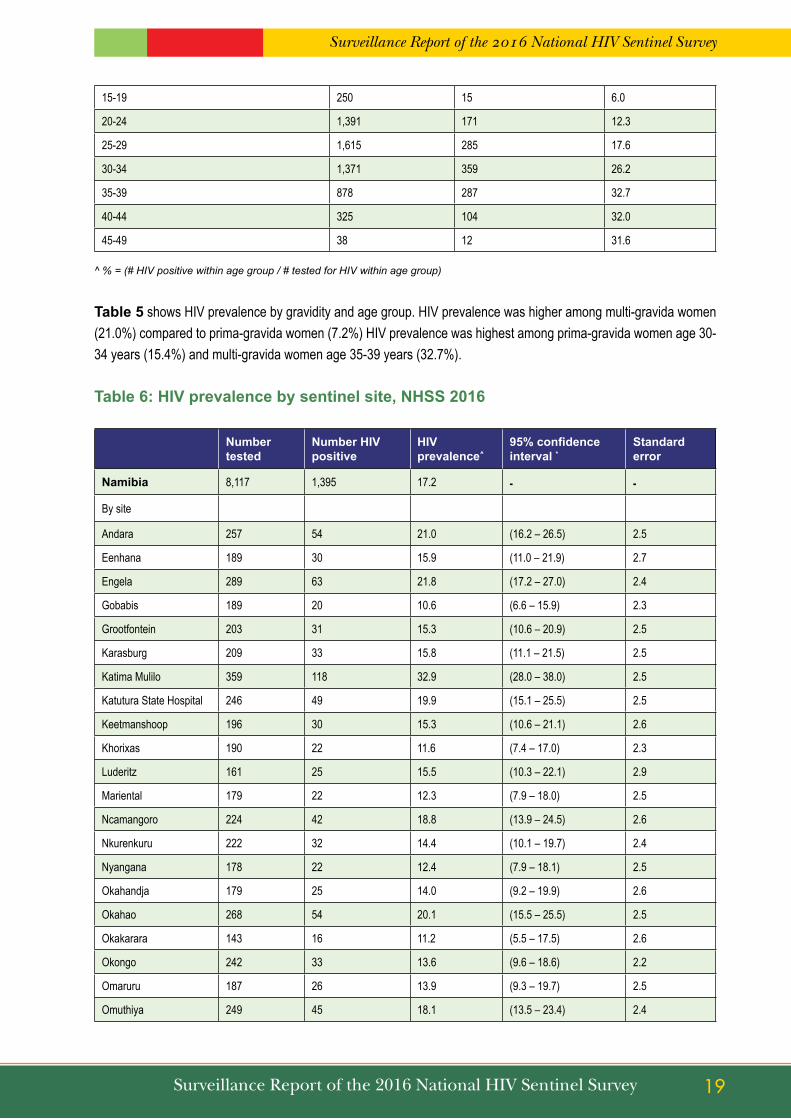
table 6: HIV prevalence by sentinel site, nHss 2016
number tested
number HIV positive
HIV prevalence^
95% confidence interval *
standard error
namibia 8,117 1,395 17.2 - -
By site
Andara 257 54 21.0 (16.2 – 26.5) 2.5
Eenhana 189 30 15.9 (11.0 – 21.9) 2.7
Engela 289 63 21.8 (17.2 – 27.0) 2.4
Gobabis 189 20 10.6 (6.6 – 15.9) 2.3
Grootfontein 203 31 15.3 (10.6 – 20.9) 2.5
Karasburg 209 33 15.8 (11.1 – 21.5) 2.5
Katima Mulilo 359 118 32.9 (28.0 – 38.0) 2.5
Katutura State Hospital 246 49 19.9 (15.1 – 25.5) 2.5
Keetmanshoop 196 30 15.3 (10.6 – 21.1) 2.6
Khorixas 190 22 11.6 (7.4 – 17.0) 2.3
Luderitz 161 25 15.5 (10.3 – 22.1) 2.9
Mariental 179 22 12.3 (7.9 – 18.0) 2.5
Ncamangoro 224 42 18.8 (13.9 – 24.5) 2.6
Nkurenkuru 222 32 14.4 (10.1 – 19.7) 2.4
Nyangana 178 22 12.4 (7.9 – 18.1) 2.5
Okahandja 179 25 14.0 (9.2 – 19.9) 2.6
Okahao 268 54 20.1 (15.5 – 25.5) 2.5
Okakarara 143 16 11.2 (5.5 – 17.5) 2.6
Okongo 242 33 13.6 (9.6 – 18.6) 2.2
Omaruru 187 26 13.9 (9.3 – 19.7) 2.5
Omuthiya 249 45 18.1 (13.5 – 23.4) 2.4

Surveillance Report of the 2016 National HIV Sentinel Survey
20 Surveillance Report of the 2016 National HIV Sentinel Survey
Onandjokwe 279 63 22.6 (17.8 – 27.9) 2.5
Ondangwa 243 46 18.9 (14.2 – 24.4) 2.5
Opuwo 77 4 5.2 (1.4 – 12.8) 2.5
Oshakati 249 43 17.3 (12.8 – 22.5) 2.4
Oshikuku 253 62 24.5 (19.3 – 30.2) 2.7
Otjiwarongo 209 47 22.5 (17.0 – 28.8) 2.9
Outapi 173 18 10.4 (6.3 – 15.9) 2.3
Outjo 173 32 18.5 (13.0 – 25.1) 3.0
Rehoboth 146 14 9.6 (5.3 – 15.6) 2.4
Rosh Pinah 162 33 20.4 (14.5 – 27.4) 3.2
Rundu 299 54 18.1 (13.9 – 22.9) 2.2
Swakopmund 156 29 18.6 (12.8 – 25.6) 3.1
Tsandi 268 47 17.5 (13.2 – 22.6) 2.3
Tsumeb 214 31 14.5 (10.2 – 19.9) 2.4
Tsumkwe 110 7 6.4 (2.6 – 12.7) 2.3
Usakos 212 23 10.8 (7.0 – 15.8) 2.1
Walvis Bay 255 45 17.6 (13.2 – 22.9) 2.4
Windhoek Central Hospital 80 5 6.2 (2.1 – 14.0) 2.7
^ % = (# positive / # tested for HIV)* Standardized methodology for conducting HIV sentinel sero-surveys does not include calculation of 95% confidence intervals of overall, or aggregate, HIV prevalence estimates.

Surveillance Report of the 2016 National HIV Sentinel Survey
21Surveillance Report of the 2016 National HIV Sentinel Survey
Figure 5: HIV prevalence overall and by sentinel site, nHss 2016
table 6 and Figure 5 show HIV prevalence by sentinel site among pregnant women included in the 2016 NHSS. The site with the highest HIV prevalence was Katima Mulilo (32.9%) followed by Oshikuku (24.5%), Onandjokwe (22.6%), and Otjiwarongo (22.5%). The sites with the lowest prevalence were Opuwo (5.2%), Windhoek Central Hospital (6.2%), Tsumkwe (6.4%), and Rehoboth (9.6%). Figure 5 presents the sites in order (top to bottom) of highest to lowest prevalence. The median HIV prevalence among sentinel sites was 15.8%.

Surveillance Report of the 2016 National HIV Sentinel Survey
22 Surveillance Report of the 2016 National HIV Sentinel Survey
table 7: HIV prevalence by urban or rural residential status and age, nHss 2016
Number tested Number HIV positive HIV prevalence *
Urban residence ^
Namibia 3,810 674 17.7
Age groups (broad bands)
15-24 1,616 155 9.6
25-49 2,194 519 23.7
Age groups (5-year bands)
15-19 535 39 7.3
20-24 1,081 116 10.7
25-29 968 169 17.5
30-34 682 173 25.4
35-39 406 129 31.8
40-44 130 43 33.1
45-49 8 5 62.5
Rural residents ^
Namibia 4,307 721 16.7
Age groups (broad bands)
15-24 1,946 149 7.7
25-49 2,361 572 24.2
Age groups (5-year bands)
15-19 787 36 4.6
20-24 1,159 113 9.7
25-29 899 150 16.7
30-34 741 194 26.2
35-39 490 160 32.7
40-44 201 61 30.3
45-49 30 7 23.3
^ The urban/rural classification refers to the woman’s place or residence, not the health facility in which the woman attended ANC.Residential status is classified as either urban or rural by the woman’s self-reported place of residence.* % = (# tested positive within age group and residential status group / # tested within age group and residential status group)

Surveillance Report of the 2016 National HIV Sentinel Survey
23Surveillance Report of the 2016 National HIV Sentinel Survey
Figure 6: HIV prevalence by urban or rural residential status and age, nHss 2016
table 7 and Figure 6 show the distribution of HIV prevalence among pregnant women included in the 2016 NHSS by urban and rural residential status and age group. Overall, HIV prevalence among pregnant women residing in rural areas (16.7%) is similar to that among women residing in urban areas (17.7%). HIV prevalence among women residing in urban or rural areas is comparable within each age group, except for women age 15-19 years, among whom there is a higher prevalence in urban areas (7.3%) compared to rural areas (4.6%). Similarly there is a higher prevalence in urban areas (34.8%) compared to rural areas (29.4%) for woman age 40-49.
4.3. ART Coverage among women testing HIV positive during the 2016 NHSS
Data about the receipt of ART among HIV positive women was transcribed from routine ANC/PMTCT program data and entered on the 2016 NHSS individual survey form. Women were classified as “already on ART” if they were already initiated on ART before the 1st ANC visit during which they were sampled for the NHSS. Results of analysis of these data are described in this section (4.3).

Surveillance Report of the 2016 National HIV Sentinel Survey
24 Surveillance Report of the 2016 National HIV Sentinel Survey
Figure 7: Percentage of HIV positive women who were already on ARt, nHss 2016
More than half (62.5%) of all women who tested HIV positive in the 2016 NHSS were already on ART (Figure 7). The observed percentage of HIV positive women who were already on ART is lowest in the youngest age group (25.3% among women age 15-19 years) and highest in the older age groups (77.9%) among HIV positive women age 35-39 and 88.8% among HIV positive women age 40-49 years, respectively).
table 8: Percentage of HIV positive women who were already on ARt by sentinel site, nHss 2016
number HIV positive
number HIV positive already on ARt
Percentage of HIV positive already on ARt ^
Namibia 1,395 872 62.5
By site
Andara 54 29 53.7
Eenhana 30 24 80.0
Engela 63 38 60.3
Gobabis 20 11 55.0
Grootfontein 31 17 54.8
Karasburg 33 20 60.6
Katima Mulilo 118 56 47.5
Katutura State Hospital 49 32 65.3
Keetmanshoop 30 19 63.3
Khorixas 22 12 54.5
Luderitz 25 18 72.0
Mariental 22 9 40.9
Ncamangoro 42 30 71.4
Nkurenkuru 32 21 65.6

Surveillance Report of the 2016 National HIV Sentinel Survey
25Surveillance Report of the 2016 National HIV Sentinel Survey
Nyangana 22 13 59.1
Okahandja 25 18 72.0
Okahao 54 44 81.5
Okakarara 16 11 68.8
Okongo 33 27 81.8
Omaruru 26 15 57.7
Omuthiya 45 25 55.6
Onandjokwe 63 44 69.8
Ondangwa 46 30 65.2
Opuwo 4 0 0.0
Oshakati 43 31 72.1
Oshikuku 62 39 62.9
Otjiwarongo 47 26 55.3
Outapi 18 11 61.1
Outjo 32 23 71.9
Rehoboth 14 6 42.9
Rosh Pinah 33 16 48.5
Rundu 54 34 63.0
Swakopmund 29 21 72.4
Tsandi 47 37 78.7
Tsumeb 31 13 41.9
Tsumkwe 7 5 71.4
Usakos 23 15 65.2
Walvis Bay 45 31 68.9
Windhoek Central Hospital 5 1 20.0
^ (# HIV positive already on ART/ (# HIV positive with district)
table 8 shows the percentage of women testing HIV positive who were already on ART during the 2016 NHSS within each site. The percentage of HIV positive women already on ART varies by site, with the highest percentages observed in Okongo (81.8%), Okahao (81.5%) and Eenhana (80.0%). The sites with the lowest percentage of HIV positive women who were already on ART are Windhoek Central Hospital (20.0%), Mariental (40.9%) and Tsumeb (41.9) respectively. No HIV positive women that were already on ART reported at Opuwo site during the sampling period.
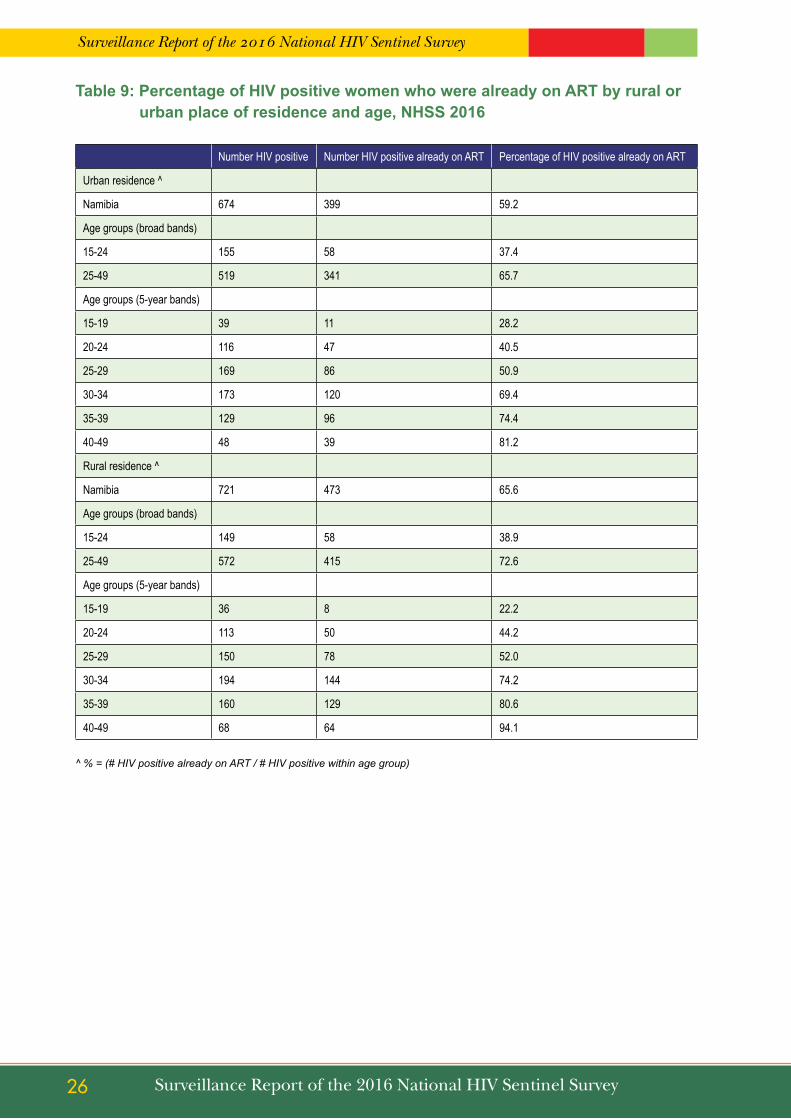
Surveillance Report of the 2016 National HIV Sentinel Survey
26 Surveillance Report of the 2016 National HIV Sentinel Survey
table 9: Percentage of HIV positive women who were already on ARt by rural or urban place of residence and age, nHss 2016
Number HIV positive Number HIV positive already on ART Percentage of HIV positive already on ART
Urban residence ^
Namibia 674 399 59.2
Age groups (broad bands)
15-24 155 58 37.4
25-49 519 341 65.7
Age groups (5-year bands)
15-19 39 11 28.2
20-24 116 47 40.5
25-29 169 86 50.9
30-34 173 120 69.4
35-39 129 96 74.4
40-49 48 39 81.2
Rural residence ^
Namibia 721 473 65.6
Age groups (broad bands)
15-24 149 58 38.9
25-49 572 415 72.6
Age groups (5-year bands)
15-19 36 8 22.2
20-24 113 50 44.2
25-29 150 78 52.0
30-34 194 144 74.2
35-39 160 129 80.6
40-49 68 64 94.1
^ % = (# HIV positive already on ART / # HIV positive within age group)
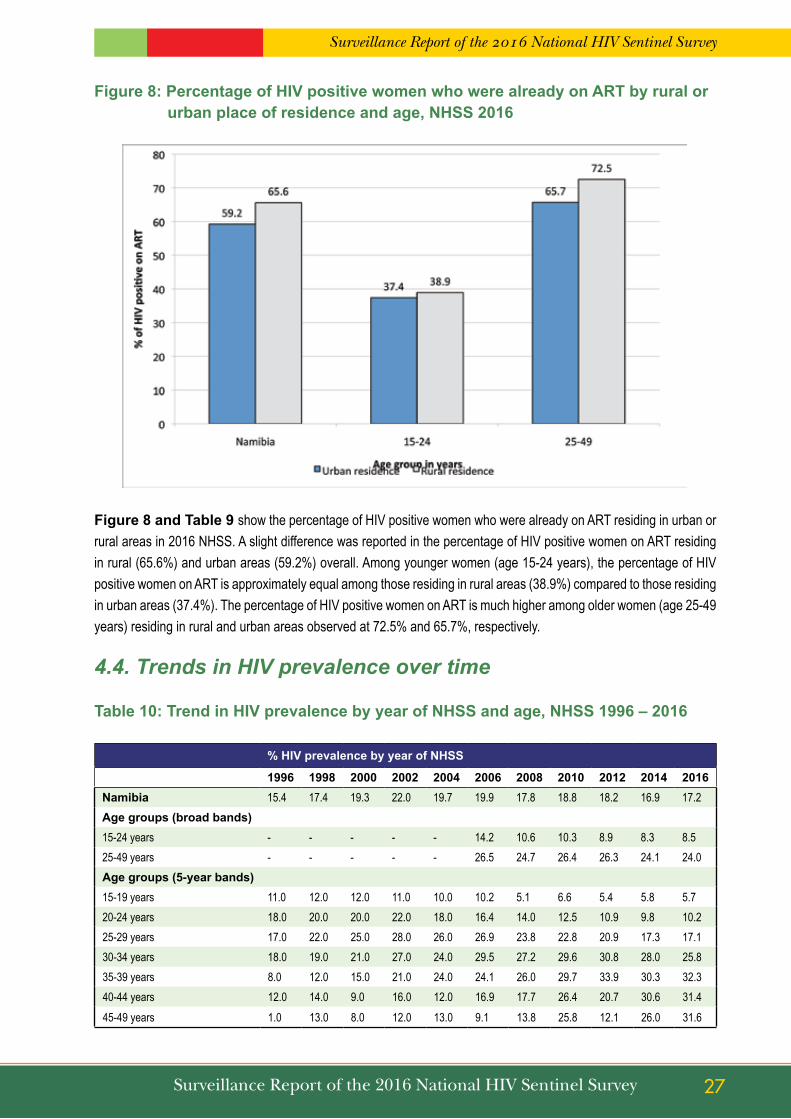
Surveillance Report of the 2016 National HIV Sentinel Survey
27Surveillance Report of the 2016 National HIV Sentinel Survey
Figure 8: Percentage of HIV positive women who were already on ARt by rural or urban place of residence and age, nHss 2016
Figure 8 and table 9 show the percentage of HIV positive women who were already on ART residing in urban or rural areas in 2016 NHSS. A slight difference was reported in the percentage of HIV positive women on ART residing in rural (65.6%) and urban areas (59.2%) overall. Among younger women (age 15-24 years), the percentage of HIV positive women on ART is approximately equal among those residing in rural areas (38.9%) compared to those residing in urban areas (37.4%). The percentage of HIV positive women on ART is much higher among older women (age 25-49 years) residing in rural and urban areas observed at 72.5% and 65.7%, respectively.
4.4. Trends in HIV prevalence over time
table 10: trend in HIV prevalence by year of nHss and age, nHss 1996 – 2016
% HIV prevalence by year of nHss
1996 1998 2000 2002 2004 2006 2008 2010 2012 2014 2016namibia 15.4 17.4 19.3 22.0 19.7 19.9 17.8 18.8 18.2 16.9 17.2Age groups (broad bands)15-24 years - - - - - 14.2 10.6 10.3 8.9 8.3 8.525-49 years - - - - - 26.5 24.7 26.4 26.3 24.1 24.0Age groups (5-year bands)15-19 years 11.0 12.0 12.0 11.0 10.0 10.2 5.1 6.6 5.4 5.8 5.720-24 years 18.0 20.0 20.0 22.0 18.0 16.4 14.0 12.5 10.9 9.8 10.225-29 years 17.0 22.0 25.0 28.0 26.0 26.9 23.8 22.8 20.9 17.3 17.130-34 years 18.0 19.0 21.0 27.0 24.0 29.5 27.2 29.6 30.8 28.0 25.835-39 years 8.0 12.0 15.0 21.0 24.0 24.1 26.0 29.7 33.9 30.3 32.340-44 years 12.0 14.0 9.0 16.0 12.0 16.9 17.7 26.4 20.7 30.6 31.445-49 years 1.0 13.0 8.0 12.0 13.0 9.1 13.8 25.8 12.1 26.0 31.6

Surveillance Report of the 2016 National HIV Sentinel Survey
28 Surveillance Report of the 2016 National HIV Sentinel Survey
Figure 9: trends in HIV prevalence by year of nHss among young and old age groups, nHss 2008 – 2016
table 10 show the trends in HIV prevalence within different age groups from 1996 – 2016 and Figure 9 illustrates the HIV prevalence from 2008 – 2016 among the younger and older age groups. HIV prevalence among women age 25-49 reached a peak of 26.4% in 2010 and has been on a decline thereafter. Among women younger than 25 years, HIV prevalence decreased slightly from 2008 to 2012 and remained stable from 2012 to 2016.
table 11: trends in HIV prevalence by year of nHss and age, nHss 2010 – 2016
15-24 year age group 25-49 year age group
2010 2012 2014 2016 2010 2012 2014 2016
Namibia 10.3 8.9 8.3 8.5 26.4 26.3 24.1 24.0
By site
Andara 12.5 10.9 10.5 12.6 28.0 28.3 30.6 30.3
Aranos 12.8 12.1 7.1 - 9.8 10.2 18.5 -
Eenhana 12.8 7.4 6.5 5.9 23.7 22.1 19.4 24.0
Engela 13.5 11.5 14.3 8.9 30.6 25.8 28.6 28.7
Gobabis 8.8 9.1 9.1 6.7 22.3 10.9 15.2 14.1
Grootfontein 9.9 6.1 12.1 10.3 19.5 24.3 15.5 19.8
Karasburg 10.3 1.2 6.0 8.4 ** 22.8 23.2 21.9 21.9
Katima Mulilo 23.1 21.5 24.3 20.5 46.6 51.8 46.9 44.2
Katutura State Hospital 11.0 4.3 9.0 8.3 32.0 20.9 29.4 27.5
Keetmanshoop 9.8 4.4 6.2 8.3 13.7 17.0 22.0 22.0
Khorixas 12.3 6.7 8.0 6.4 16.7 17.3 17.4 16.7
Luderitz 4.0 14.1 6.1 8.5 * 27.3 27.4 31.3 19.6
Mariental 7.0 9.4 7.5 6.0 20.5 18.1 16.5 17.9
Nankudu 8.1 1.7 6.0 ** - 21.9 28.9 26.3 -
Ncamangoro 11.1 28.6

Surveillance Report of the 2016 National HIV Sentinel Survey
29Surveillance Report of the 2016 National HIV Sentinel Survey
Nkurenkuru 8.5 21.2
Nyangana 8.3 8.2 8.0 4.1 19.3 36.2 17.8 22.5 *
Okahandja 8.2 9.3 2.3 8.4 16.0 27.7 22.0 18.8
Okahao 6.9 3.8 8.8 10.7 31.5 28.6 30.2 26.9
Okakarara 9.1 6.6 6.0 2.9 5.2 13.3 12.5 18.9 *
Okongo 7.6 9.6 7.9 6.5 28.6 29.8 24.8 18.1 **
Omaruru 8.5 6.8 1.3 3.8 28.7 16.2 23.3 21.3
Omuthiya 9.5 26.8
Onandjokwe 10.4 9.2 11.9 7.6 33.1 36.7 27.8 30.0
Ondangwa 9.9 25.4
Opuwo 4.8 8.8 0.0 2.9 ** 11.8 10.7 7.0 6.9
Oshakati 14.8 7.8 9.4 9.0 31.7 32.6 23.5 21.9 *
Oshikuku 4.9 12.2 5.9 9.9 35.6 35.0 28.8 35.9
Otjiwarongo 10.0 8.4 8.6 12.1 23.5 25.6 20.2 30.5
Outapi 6.3 10.9 3.5 7.3 27.8 24.3 18.0 12.5 *
Outjo 12.1 8.3 4.4 4.0 ** 17.3 18.7 17.4 29.9 **
Rehoboth 2.5 9.5 2.6 6.3 7.5 10.0 15.8 12.2
Rosh Pinah 13.8 24.0
Rundu 17.9 17.4 10.8 9.0 * 29.3 31.7 38.6 26.5
Swakopmund 7.3 6.4 5.3 6.3 26.3 21.1 14.8 27.2 **
Tsandi 11.8 8.8 9.3 4.1 37.4 37.2 29.7 28.6
Tsumeb 11.8 10.9 6.4 11.2 34.3 25.4 22.9 16.8 *
Tsumkwe 5.6 7.1
Usakos 5.0 3.2 11.1 4.3 24.4 22.4 28.4 16.1
Walvis bay 11.9 7.1 13.9 5.5 24.3 24.7 22.5 22.5
Windhoek Central Hospital 4.5 0.0 1.9 3.3 12.7 16.3 5.8 8.0
Chi-square test for linear trend used to test for significance in the association between advancing year of NHSS and HIV prevalence; * indicates a statistically significant (P < 0.05) change in HIV prevalence from 2010 to 2016; * * indicates a borderline statistically significant (P < 0.1) change in HIV prevalence from 2010 to 2016. “-“, indicates that a site was not included in NHSS
during the year.
table 11 shows site-level trends in HIV prevalence among young (age 15-24 years) and older (age 24-29 years) pregnant women from 2010 to 2016. The Chi-square test for linear trend was used to detect statistically significant changes in HIV prevalence from 2010 to 2016. Statistically significant changes within a site are annotated by “*”, respectively in the 2016 column of the table. Among young women, a statistically significant decrease in HIV prevalence was only observed in Rundu (17.9% in 2010 to 9.0% in 2016). A statistically significant increase in HIV prevalence among young women was observed in Luderitz (4.0% in 2010 to 8.5% in 2016). Among older women a statistically significant decrease in HIV prevalence was observed in Oshakati (31.7% in 2010 to 21.9% in 2016), Outapi (27.8% in 2010 to 12.5% in 2016) and Tsumeb (22.9% in 2010 to 16.8% in 2016). A statistically significant increase in HIV prevalence among older women was observed in Nyangana (19.3% in 2010 to 22.5% in 2016) and Okakarara (5.2% in 2010 to 18.9% in 2016).
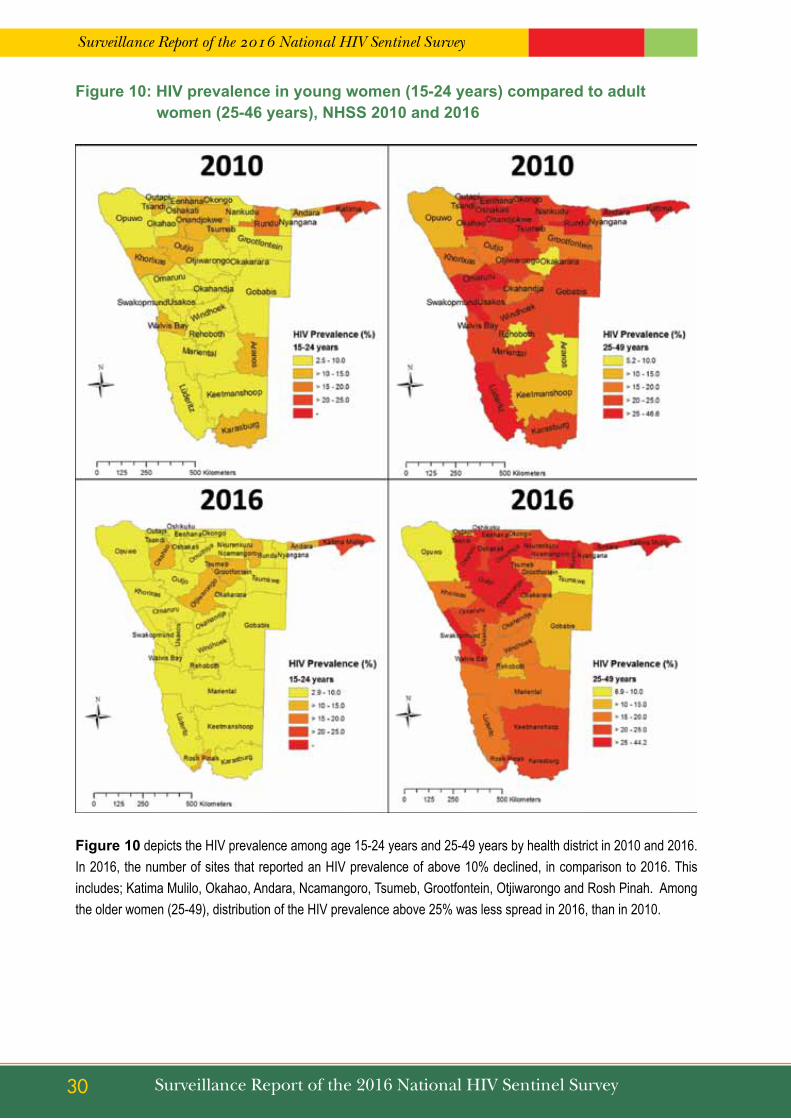
Surveillance Report of the 2016 National HIV Sentinel Survey
30 Surveillance Report of the 2016 National HIV Sentinel Survey
Figure 10: HIV prevalence in young women (15-24 years) compared to adult women (25-46 years), nHss 2010 and 2016
Figure 10 depicts the HIV prevalence among age 15-24 years and 25-49 years by health district in 2010 and 2016. In 2016, the number of sites that reported an HIV prevalence of above 10% declined, in comparison to 2016. This includes; Katima Mulilo, Okahao, Andara, Ncamangoro, Tsumeb, Grootfontein, Otjiwarongo and Rosh Pinah. Among the older women (25-49), distribution of the HIV prevalence above 25% was less spread in 2016, than in 2010.

Surveillance Report of the 2016 National HIV Sentinel Survey
31Surveillance Report of the 2016 National HIV Sentinel Survey
table 12: trends in HIV prevalence by year of nHss, nHss 1992 – 2016
1992 1994 1996 1998 2000 2002 2004 2006 2008 2010 2012 2014 2016
Namibia 4.2 8.4 15.4 17.3 19.3 22 19.7 19.9 17.8 18.8 18.2 16.9 17.2
By site
Andara - 2.0 11.0 16.0 15.0 21.0 18.0 22.7 14.2 19.2 19.1 20.0 21.0
Aranos - - - - - - - - 5.9 11.3 11.2 11.6 -
Eenhana - - - - - - - 21.4 11.6 18.6 15.0 13.0 15.9
Engela - 7.0 18.0 17.0 23.0 19.0 19.0 27.0 20.1 22.4 19.3 22.8 21.8
Gobabis 1.0 - - 9.0 9.0 13.0 13.0 7.9 13.1 15.6 9.9 12.7 10.6
Grootfontein - 9.0 - - - 30.0 28.0 19.3 16.9 14.8 15.9 14.0 15.3
Karasburg - - - - - - - 22.7 18.3 17.0 14.9 14.5 15.8
Katima Mulilo 14.0 25.0 24.0 29.0 33.0 43.0 42.0 39.4 31.7 35.6 37.7 36.0 32.9
Katutura State Hospital 4.0 7.0 16.0 23.0 31.0 27.0 22.0 21.7 21.7 23.4 14.4 19.6 19.9 *
Keetmanshoop 3.0 8.0 - 7.0 17.0 16.0 16.0 18.5 12.7 11.7 10.6 14.1 15.3
Khorixas - - - - - - - - 10.9 14.9 12.4 12.8 11.6
Luderitz - - - - - - 22.0 22.5 20.1 18.1 22.0 20.9 15.5
Mariental - - - 10.0 12.0 11.0 10.2 10.8 13.8 13.5 12.0 12.3
Nankudu - - - 13.0 18.0 16.0 19.0 13.9 10.5 13.5 13.1 15.9 -
Ncamangoro - - - - - - - - - - - - 18.8
Nkurenkuru 14.4
Nyangana 6.0 5.0 10.0 16.0 22.0 15.0 10.2 19.5 12.8 22.0 12.5 12.4
Okahandja - - - - - - - 18.5 14.9 12.6 19.3 13.3 14.0
Okahao - - - - - - - 22.5 27.4 19.8 16.3 20.6 20.1
Okakarara - - - - - - - - 11.4 7.1 9.9 9.0 11.2
Okongo - - - - - - - - 20.7 19.5 20.8 17.5 13.6
Omaruru - - - - - - - - 12.0 18.6 11.8 12.9 13.9
Omuthiya 18.1
Onandjokwe - 8.0 17.0 21.0 23.0 28.0 22.0 23.7 21.9 24.0 25.7 22.4 22.6
Ondangwa 18.9
Opuwo 3.0 1.0 4.0 6.0 7.0 9.0 9.0 7.9 7.9 8.8 9.8 3.9 5.2
Oshakati 4.0 14.0 22.0 34.0 28.0 30.0 25.0 27.1 22.4 25.1 22.3 18.2 17.3 **
Oshikuku - - - - 21.0 27.0 27.0 22.4 21.7 22.5 24.7 18.6 24.5
Otjiwarongo 2.0 9.0 - 16.0 18.0 25.0 17.0 18.7 15.2 16.9 16.9 14.4 22.5
Outapi - - - - - 23.0 17.0 20.7 19.6 18.3 18.7 11.4 10.4 *
Outjo - - - - - - - 18.0 14.6 12.8 11.2 18.5
Rehoboth - 3.0 9.0 10.0 14.0 13.9 6.3 4.2 9.8 9.1 9.6

Surveillance Report of the 2016 National HIV Sentinel Survey
32 Surveillance Report of the 2016 National HIV Sentinel Survey
Rosh Pinah - - - - - - - - - - - - 20.4
Rundu - 8.0 8.0 14.0 14.0 22.0 21.0 20.1 18.8 23.2 24.5 24.1 18.1
Swakopmund 3.0 7.0 17.0 15.0 22.0 16.0 28.0 17.3 14.2 17.8 14.5 10.5 18.6 **
Tsandi - - - - - - - - 25.9 25.5 23.4 20.2 17.5 **
Tsumeb - - - - - 25.0 16.0 17.0 17.1 24.3 19.2 14.8 14.5 *
Tsumkwe 6.4
Usakos - - - - - - - - 17.8 14.8 12.2 21.9 10.8 *
Walvis Bay - - - 29.0 28.0 25.0 26.0 22.1 21.4 19.6 17.2 19.6 17.6
Windhoek Central Hospital - - - - - - 10.0 9.1 4.7 9.1 9.6 4.1 6.2
The Chi-square test for linear trend used to test for significance in the association between advancing year of NHSS and HIV prevalence from 2010 to 2016; “*” indicates a statistically significant (P < 0.05) change in HIV prevalence from 2010 to 2016; “* *” indicates a borderline statistically significant (P < 0.1) change in HIV prevalence from 2010 to 2016.“-“indicates that no prevalence estimate available because site did not participate in HSS during indicated year.
table 12 shows site-level trends in HIV prevalence among all pregnant women (age 15-49 years) included in the NHSS from 1996 to 2016. The Chi-square test for linear trend was used to detect statistically significant changes in HIV prevalence from 2010 to 2016. Statistically significant and borderline significant changes within a site are annotated by “*” and “**”, respectively, in the 2016 column of the table. A significant or borderline significant decrease in HIV prevalence was observed in Katutura (23.4% in 2010 to 19.9% in 2016), Oshakati (25.1% in 2010 to 17.3% in 2016), Outapi (18.3% in 2010 to 10.4% in 2016), Tsumeb (24.3% in 2010 to 14.5% in 2016) and Usakos (14.8% in 2010 to 10.8% in 2016). A borderline significant increase in HIV prevalence was observed in Swakopmund (17.8% in 2010 to 18.6% in 2016).

Surveillance Report of the 2016 National HIV Sentinel Survey
33Surveillance Report of the 2016 National HIV Sentinel Survey
Figure 11: HIV prevalence by health district, nHss 2010, 2012, 2014 and 2016
Figure 11 shows the HIV prevalence by health district from 2010 - 2016. Districts with higher HIV prevalence are represented by darker orange to dark red coloring and districts with lower HIV prevalence are represented with light orange to yellow coloring. Over the past four rounds of NHSS, in general HIV prevalence is disproportionately distributed in the country. According to NHSS prevalence estimates, the burden of HIV appears to be greatest in the north (Otjiwarongo, Oshikuku, Okahao, Onandjokwe, Engela) and north east (Andara and Katima Mulilo) with high burdens also in the south (Rosh Pinah).

Surveillance Report of the 2016 National HIV Sentinel Survey
34 Surveillance Report of the 2016 National HIV Sentinel Survey
Figure 12: HIV prevalence by age group from 2008 – 2016 and the percentage of HIV positive women who were already on ARt during the 2012, 2014 and 2016 nHss
Figure 12 describes the percentages of HIV positive women who were already on ART in 2012-2016 and HIV prevalence from 2008-2016 in each age group. The columns in the figure show HIV prevalence (primary vertical access, left side of figure) within each age group from the 2008 – 2016. The lines in the figure show the percentage of HIV positive women who were already on ART before the 1st ANC visit at the participating health facility (secondary vertical access, right side of figure). From 2008 to 2016, HIV prevalence declined from 14.0% to 10.2% among women age 20-24 years, and from 23.8% to 17.1% among women age 25-29 years. During that same time, HIV prevalence among women age 30-34 increased from 27.2% and peaked at 30.8% before decreasing to 25.8% in 2016. For women age 35 and above, HIV prevalence has been on an overall increase between 2008 and 2016.
HIV prevalence was stable (approximately 5-6%) from 2008-2016 among women age 15-19 years. Among all age groups, the percentages of HIV positive women who were already on ART increased during each subsequent round of NHSS from 2012-2016. The percentages of HIV positive women who were already on ART during the 2012, 2014 and 2016 NHSS is higher in the older age groups (in which increasing prevalence was observed) compared to the younger age groups.

Surveillance Report of the 2016 National HIV Sentinel Survey
35Surveillance Report of the 2016 National HIV Sentinel Survey
5. sEntInEL sURVEILLAnCE AnD OtHER DAtA sOURCEs
In order to enhance the confidence and explanatory power of the NHSS findings, routine PMTCT programme data were analysed to see if they support the same interpretations revealed from this survey. In addition, routine data on syphilis testing was extracted from NIP database and analysed. The results of the comparisons between these data sources and the results of 2016 NHSS are presented in the section below (5.1 – 5.2).
5.1. HIV Prevalence Data from Routine PMTCT Program Data
The World Health Organization (WHO) and other leading public health organizations recommend that countries evaluate and strengthen the quality of PMTCT program data so that it can be used for routine surveillance purposes.1 Because the Namibia PMTCT programs collect basic socio-demographic and HIV testing information similar to what is collected during the NHSS, Namibia MoHSS may consider the use of PMTCT program data to complement or replace the existing method of biennial, ANC-based sentinel surveillance used to estimate HIV prevalence among pregnant women in Namibia. The population of women captured by both systems is the same (i.e., pregnant women from the geographically proximate communities). However, unlike the pregnant women who participate in the unlinked anonymous testing of the NHSS, women routinely tested for HIV through the PMTCT program provide informed consent for testing and are offered interventions including prevention education, treatment, care and support based on their test results. Furthermore, costs associated with PMTCT-based surveillance are anticipated to be low compared to ANC NHSS. 2 If PMTCT program performance is strong, geographic coverage is wide, and uptake of HIV testing is unbiased (independent of HIV sero-status) and high, PMTCT program data may be of sufficient quality to be used for HIV surveillance purposes.
For this reason, results from the NHSS 2016 were compared to data collected from PMTCT program summary data that is reported through the district health information system (DHIS). The results of this comparison are presented in table 13.
5.1.1 Comparison of nHss HIV test results and routine PMtCt program data reported through the DHIs
table 13 shows HIV prevalence estimates resulting from the 2016 NHSS that are compared to the overall and site level prevalence estimates produced from 2016 PMTCT program summary data that is reported through the district health information system (DHIS) for the equivalent survey data collection period.

Surveillance Report of the 2016 National HIV Sentinel Survey
36 Surveillance Report of the 2016 National HIV Sentinel Survey
table 13: Comparison of HIV prevalence estimates from 2016 PMtCt program data versus results of the 2016 nHss
PMtCt program data reported through DHIs nHss 2016
Prevalence (95% CI) Prevalence (95% CI)
namibia 15.9 - 17.2 -
By site
Andara 19.1 (15.7 – 22.9) 21.0 (16.2 – 26.5)
Eenhana 16.2 (14.4 – 18.0) 15.9 (11.0 – 21.9)
Engela 18.5 (17.2 – 19.7) 21.8 (17.2 – 27.0)
Gobabis 8.8 (7.3 – 10.4) 10.6 (6.6 – 15.9)
Grootfontein 13.3 (10.9 – 16.0) 15.3 (10.6 – 20.9)
Karasburg 22.4 (17.9 – 27.4) 15.8 (11.1 – 21.5)
Katima Mulilo 29.9 (27.9 – 32.0) 32.9 (28.0 – 38.0)
Katutura State Hospital 14.6 (13.5 – 15.6) 19.9 (15.1 – 25.5)
Keetmanshoop 13.9 (11.2 – 16.9) 15.3 (10.6 – 21.1)
Khorixas 10.5 (6.5 – 15.7) 11.6 (7.4 – 17.0)
Luderitz 18.4 (11.8 – 26.8) 15.5 (10.3 – 22.1)
Mariental 11.5 (9.2 – 14.0) 12.3 (7.9 – 18.0)
Ncamangoro 14.8 (12.5 – 17.3) 18.8 (13.9 – 24.5)
Nkurenkuru 16.1 (13.9 – 18.4) 14.4 (10.1 – 19.7)
Nyangana 12.4 (9.8 – 15.3) 12.4 (7.9 – 18.1)
Okahandja 12.9 (10.5 – 15.7) 14.0 (9.2 – 19.9)
Okahao 22.0 (18.5 – 29.0) 20.1 (15.5 – 25.5)
Okakarara 12.9 (9.3 – 17.2) 11.2 (5.5 – 17.5)
Okongo 17.4 (14.7 – 20.4) 13.6 (9.6 – 18.6)
Omaruru 11.0 (7.7 – 15.0) 13.9 (9.3 – 19.7)
Omuthiya 18.1 (15.3 – 21.2) 18.1 (13.5 – 23.4)
Onandjokwe 19.0 (17.0 – 21.2) 22.6 (17.8 – 27.9)
Ondangwa 15.9 (13.3 – 18.8) 18.9 (14.2 – 24.4)
Opuwo 4.3 (3.2 – 5.5) 5.2 (1.4 – 12.8)
Oshakati 19.3 (17.7 – 20.9) 17.3 (12.8 – 22.5)
Oshikuku 19.3 (17.4 – 21.3) 24.5 (19.3 – 30.2)
Otjiwarongo 15.4 (13.2 – 17.8) 22.5 (17.0 – 28.8)
Outapi 12.8 (11.5 – 14.2) 10.4 (6.3 – 15.9)
Outjo 13.2 (10.3 – 16.7) 18.5 (13.0 – 25.1)
Rehoboth 10.9 (8.6 – 13.7) 9.6 (5.3 – 15.6)
Rosh Pinah 21.7 (14.7 – 30.1) 20.4 (14.5 – 27.4)
Surveillance Report of the 2016 National HIV Sentinel Survey
37Surveillance Report of the 2016 National HIV Sentinel Survey
Rundu 17.9 (16.4 – 19.5) 18.1 (13.9 – 22.9)
Swakopmund 13.9 (12.0 – 15.6) 18.6 (12.8 – 25.6)
Tsandi 19.2 (15.7 – 23.1) 17.5 (13.2 – 22.6)
Tsumeb 15.0 (12.5 – 17.9) 14.5 (10.2 – 19.9)
Tsumkwe 6.1 (31. – 10.7) 6.4 (2.6 – 12.7)
Usakos 12.8 (9.3 – 17.1) 10.8 (7.0 – 15.8)
Walvis Bay 16.7 (14.7 – 18.8) 17.6 (13.2 – 22.9)
Windhoek Central Hospital 10.9 (9.6 – 12.4) 6.2 (2.1 – 14.0)
There is a difference of about 1.3% between the overall pooled HIV prevalence observed during the 2016 NHSS and the HIV prevalence from PMTCT program data that was reported through the DHIS during the same time period (table 13). However, discrepant prevalence estimates produced by the two data sources were observed in many sites. Identifying site level factors that may be associated with discrepant prevalence estimates is beyond the scope of this report.
5.2. Syphilis surveillance data from routine laboratory records
In Namibia, Syphilis testing (RPR testing, with positives confirmed by Treponema pallidum hemagglutination assay (TPHA) is routinely offered to all pregnant women. Syphilis testing was therefore performed as part of routine ANC services and results were obtained from the Namibia Institute of Pathology (NIP). The results are presented below, analyzed by district in table 15 and table 16.
table 14: syphilis surveillance data from routine laboratory by district among women age 15-49 years
Number negative Number positive Number tested Syphilis prevalence (%) NHSS HIV prevalence (%)
Overall 54,032 1,004 55,036 1.8 17.2
By site
Andara 582 16 598 2.7 21.0
Eenhana 1,956 27 1,983 1.4 15.9
Engela 3,562 66 3,628 1.8 21.8
Gobabis 1,653 60 1,713 3.5 10.6
Grootfontein 115 3 118 2.5 15.3
Karasburg 439 6 445 1.3 15.8
Katima Mulilo 2,356 77 2,433 3.2 32.9
Katutura State Hospital 6,649 103 6752 1.5 19.9
Keetmanshoop 1,034 10 1,044 1.0 15.3
Khorixas 221 6 227 2.6 11.6
Luderitz 220 2 222 0.9 15.5
Surveillance Report of the 2016 National HIV Sentinel Survey
38 Surveillance Report of the 2016 National HIV Sentinel Survey
Mariental 506 8 514 1.6 12.3
Ncamangoro 863 20 883 2.3 18.8
Nkurenkuru 1,186 10 1,196 0.8 14.4
Nyangana 686 8 694 1.2 12.4
Okahandja 777 9 786 1.1 14.0
Okahao 703 9 712 1.3 20.1
Okakarara 434 4 438 0.9 11.2
Okongo 783 22 805 2.7 13.6
Omaruru 351 5 356 1.4 13.9
Omuthiya 1,206 28 1,234 2.3 18.1
Onandjokwe 1,841 48 1,889 2.5 22.6
Ondangwa 528 19 547 3.5 18.9
Opuwo 1,347 10 1,357 0.7 5.2
Oshakati 4,493 109 4,602 2.4 17.3
Oshikuku 1,737 48 1,785 2.7 24.5
Otjiwarongo 1,225 25 1,250 2.0 22.5
Outapi 2,749 21 2,770 0.8 10.4
Outjo 465 11 476 2.3 18.5
Rehoboth 1,048 21 1,069 2.0 9.6
Rosh Pinah 209 1 210 0.5 20.4
Rundu 3,516 66 3,582 1.8 18.1
Swakopmund 1,392 15 1,407 1.1 18.6
Tsandi 637 5 642 0.8 17.5
Tsumeb 890 33 923 3.6 14.5
Tsumkwe 227 4 231 1.7 6.4
Usakos 189 3 192 1.6 10.8
Walvis Bay 1,462 19 1,481 1.3 17.6
Windhoek Central Hospital
3,795 47 3,842 1.2 6.2
^Source: Namibia Institute of Pathology (NIP) Limited, routine, de-identified patient level data from routine testing among pregnant women receiving ANC at health facilities in Namibia. Data is included on women from all facilities-both public and private-in which
NIP provides syphilis testing services.
table 15 shows the comparison of district syphilis prevalence among pregnant women routinely receiving syphilis testing as part ANC between March and September 2016. 1.8% syphilis prevalence was detected from the 55,036 tests performed. High levels of syphilis prevalence were reported in Tsumeb (3.6%), Ondangwa (3.5%), Gobabis (3.5%), Grootfontein (3.5%) and Katima Mulilo (3.2%). Districts of Rosh Pinah (0.5%), Opuwo (0.7%), Outapi (0.8%), Tsandi (0.8%) and Nkurenkuru had the lowest.

Surveillance Report of the 2016 National HIV Sentinel Survey
39Surveillance Report of the 2016 National HIV Sentinel Survey
table 15: syphilis prevalence among women by age group who tested for syphilis
number tested number negative number positive syphilis prevalence (%)
nHss 2016 HIV prevalence (%)
namibia 55,036 54,032 1,004 1.8 17.2
Age groups (5-year bands)
15-19 8,021 7,898 123 1.5 16.3
20-24 14,747 14,458 289 2.0 27.6
24-29 13,089 12,836 253 1.9 23.0
30-34 10,108 9,915 193 1.9 17.5
35-39 6,075 5,980 95 1.6 11.0
40-44 2,461 2,419 42 1.7 4.1
45-49 535 526 9 1.7 0.5
table 16 shows the syphilis prevalence by age group. Syphilis prevalence was highest among women 20-24 age group (2.0%) and lowest among women below 20 years (1.5%).
table 16: syphilis prevalence trends among women age 15-49 years by site and nHss year
syphilis Prevalence by Year (%)
2012 2014 2016
Namibia 1.9 1.9 1.8
By site
Andara 1.7 3.1 2.7
Aranos 3.2 3.1 -
Eenhana 1.2 0.8 1.4
Engela 1.2 3.1 1.8
Gobabis 8.2 4.8 3.5
Grootfontein 2.4 0.9 2.5
Karasburg 0.5 1.8 1.3
Katima Mulilo 2.2 3.6 3.2
Katutura State Hospital 2.0 1.7 1.5
Keetmanshoop 1.8 0.8 1.0
Khorixas 0.9 1.5 2.6
Luderitz 2.5 1.0 0.9
Mariental 1.9 2.6 1.6
Nankudu 0.5 1.5 -

Surveillance Report of the 2016 National HIV Sentinel Survey
40 Surveillance Report of the 2016 National HIV Sentinel Survey
Ncamangoro - - 2.3
Nkurenkuru - - 0.8
Nyangana 2.6 2.4 1.2
Okahandja 2.5 1.0 1.1
Okahao 3.3 0.5 1.3
Okakarara 2.4 0.0 0.9
Okongo 1.7 1.5 2.7
Omaruru 0.0 0.5 1.4
Omuthiya - - 2.3
Onandjokwe 1.1 2.0 2.5
Ondangwa - - 3.5
Opuwo 0.1 0.3 0.7
Oshakati 2.7 1.9 2.4
Oshikuku 1.6 2.5 2.7
Otjiwarongo 4.2 0.5 2.0
Outapi 0.7 0.7 0.8
Outjo 0.9 2.4 2.3
Rehoboth 6.7 5.2 2.0
Rosh Pinah - - 0.5
Rundu 2.3 2.6 1.8
Swakopmund 2.0 1.9 1.1
Tsandi 0.8 1.0 0.8
Tsumeb 2.0 1.6 3.6
Tsumkwe - - 1.7
Usakos 2.2 3.3 1.6
Walvis Bay 1.7 0.5 1.3
Windhoek Central Hospital 0.9 1.8 1.2
table 17 shows site-level trends in syphilis prevalence among pregnant women receiving syphilis testing as part of routine ANC during the 2012, 2014 and 2016 survey rounds. The table shows no difference in the overall syphilis prevalence among pregnant women in Namibia as it mainly changed from 1.9% in 2014 to 1.8% in 2016. In 2012 Gobabis and Rehoboth recorded the highest prevalence of 8.2% and 6.7% and continued in 2014 with 4.8% and 5.2%. However, in 2016 syphilis prevalence of above 3% was reported in Tsumeb, Ondangwa and Gobabis districts. Lower syphilis prevalence was observed in Opuwo, Tsandi, Outapi and Omaruru in 2012-2016.

Surveillance Report of the 2016 National HIV Sentinel Survey
41Surveillance Report of the 2016 National HIV Sentinel Survey
table 17: syphilis prevalence among women by Age group and nHss Year
syphilis Prevalence by Year (%)
2012 2014 2016
namibia 1.9 1.9 1.8
Age groups (5-year bands)
15-19 1.6 1.6 1.5
20-24 1.9 2.1 2.0
24-29 2.1 2.1 1.9
30-34 2.1 2.0 1.9
35-39 1.6 1.6 1.6
40-44 2.4 1.6 1.7
45-49 1.9 2.5 1.7
table 18 shows trends in syphilis prevalence by age group and year since 2012. It further depicts that there is no relative change in syphilis prevalence among women below 40 years, in relation to much older women. In 2016, the highest syphilis prevalence was reported among women 20-24 (2.0%) and lower among women 15-19 years.
Surveillance Report of the 2016 National HIV Sentinel Survey
42 Surveillance Report of the 2016 National HIV Sentinel Survey
6. LIMItAtIOnsThe following limitations apply to the 2016 NHSS:
The results of this survey are not necessarily representative of the general population of Namibia because of the following reasons:
• Specimens were only collected from women so the results are not intended to be representative of men.• Only specimens from pregnant women age 15-49 who were pregnant during the period of the survey were
included in the survey. Therefore, women younger than 15 years or older than 49 years were not included in this survey.
• Only specimens from pregnant women receiving ANC at public facilities are included in the HSS. All women receiving ANC at private facilities are not included in the sample. Consequently, the results of this survey may overestimate or underestimate the true HIV prevalence among all pregnant women in Namibia.
Most sites achieved above 90% of their allocated sample sizes, with only one site attaining the lowest coverage of 87.8%. However, most sites could not achieve 100% coverage and that could be attributed to few pregnancies in some sites during the survey period, while for some sites some survey test results went missing and results were declared as invalid. The NHSS is designed to give information on HIV prevalence, not HIV incidence. Although measuring HIV prevalence in the 15-24 year age group can be used as a proxy for incidence, it is not possible to make definitive conclusions about the trend in new infections over time.
NHSS uses routinely collected ANC program data and behavioral data is not routinely collected. Therefore, an assessment of behavioral factors associated with HIV cannot be made in the absence of behavioral data.

Surveillance Report of the 2016 National HIV Sentinel Survey
43Surveillance Report of the 2016 National HIV Sentinel Survey
7. DIsCUssIOn The results of the 2016 NHSS demonstrate that HIV remains a major public health challenge affecting younger and older women across Namibia. As the current NSF 2010/11-2016/17 approaches its conclusion, results from this year’s NHSS are a timely reminder that sustained – and even increased - investment in high quality prevention, care and treatment interventions must remain a priority for the GRN and its partners if it is to achieve epidemic control by 2020.
Trends in HIV prevalence among pregnant women receiving antenatal care in Namibia
Long-term trends (2002 – 2016)
Our interpretation of the results of the 2016 NHSS is consistent with that of the 2014 NHSS results in that Namibia’s epidemic remains in a period of stabilization with slow yet sustained decreases in HIV prevalence among pregnant women since 2002. When triangulated with other research and program data, the long-term trend of declining HIV prevalence among pregnant women from 2002 to 2016 strongly suggests that new infections – especially among younger women – and AIDS-related deaths – especially among older women - declined during the same period.
From 2002-2016, the observed HIV prevalence among women in the 15-19 and 20-24 year old age groups decreased from 11.0% to 5.7% and 22.0% to 10.2%, respectively. Although HIV prevalence is not a measure of new infections, HIV prevalence among younger women (age <25 years) is often at times used as a proxy measure of new infections. This is because younger pregnant women are more likely to have recently become sexually active and are thus likely to have a higher proportion of new infections than older women. In this context, the substantial decrease in HIV prevalence that has been observed among younger women in Namibia since 2002 suggests that new infections in this age group have decreased during the same period. This hypothesis is supported by Namibia’s most recent SPECTRUM model-based estimates and projections report, which shows declines in new infections among females 15-24 age from 3,096 in 2002 to 1,575 in 2016 and also by a statistically robust estimate of trend in HIV prevalence among pregnant women from NHSS from 2002 to 2012 in Namibia using Bayesian hierarchical logistic models which showed near certain declines in prevalence among younger women1. Additionally, HIV prevalence among women age 25-29 years also decreased from 28.0% to 17.1% from 2002-2016. This may represent a cohort effect, by which women become older between sampling periods and move from one age group to another. Therefore, new infections prevented among women age 15-24 during early rounds of NHSS may contribute to lower prevalence among women age 25-29 years during later rounds.
Also from 2002-2016, the observed HIV prevalence remained approximately unchanged among women age 30-34 years and increased among women age 35-39, 40-44, and 45-49 years. These trends are likely a result of decreased mortality among women living with HIV due the successful expansion of Namibia’s ART program. Namibia’s scale-up of ART has been among the most robust in the world. Namibia achieved 87% coverage of ART among eligible persons by the end of 2011 and estimates of 12-48-month-retention of patients on ART are higher than pooled estimates from other countries in the region.2,3. The total number of people receiving ART in Namibia increased from less than 100 in 2003 to 149,829 in 2016; approximately 60% of those people were women. By 2016, 79.6% of people in need of ART (at a CD4-based eligibility threshold of 500 cells/uL) were receiving it. According to SPECTRUM estimates, AIDS-related deaths among adults decreased from 9,966 in 2002 to 3,118 in 2013. Because HIV infected women on ART live longer
Surveillance Report of the 2016 National HIV Sentinel Survey
44 Surveillance Report of the 2016 National HIV Sentinel Survey
they also have the opportunity to give more births, be included in the NHSS, and contribute data to HIV prevalence estimates. This assumption is substantiated by the fact that more than (62.5%) of all women who tested positive during the 2016 NHSS were already on ART before the current pregnancy. This estimate represents an increase from that reported by the 2012 (41.0%) and 2014 NHSS (49.1%). Also worth noting is that the percentage of HIV infected women already on ART increases with each advancing age group in each year from 2012-16. (Figure 13). Younger women who were newly identified as HIV positive in earlier years were likely initiated on ART during subsequent years. These HIV-positive women would have grown older and transitioned from the younger to older age groups in subsequent years of NHSS. This transition would likely have caused increases in both HIV prevalence and ART coverage in the older groups in later years of NHSS (see Figure 13).
Recent trends (2010 - 2016) Long-term trend analysis alone may obscure several important characteristic of Namibia’s epidemic in 2016. Firstly, the majority of the decrease in HIV prevalence among young women that occurred from 2002 to 2016 actually occurred from 2002 – 2010. In other words, HIV prevalence among young women has not decreased from 2010 – 2016 and has remained at levels above the NSF target of 5% prevalence among pregnant women age 15-24 years by 2015/16 in the majority of Namibia’s health districts. HIV prevalence among pregnant women was < 5% in 6 (17%) of 35 districts in 2010. Only modest progress was achieved by 2016, with 8 (20%) of 39 districts achieving the NSF target. HIV prevalence among young women significantly decreased from above to below the target threshold between 2010 and 2016 in only one district (Outjo). These results clearly demonstrate that new HIV infections continue to occur among young women across Namibia at a rate that will sustain a generalized epidemic into the foreseeable future. Failure to achieve NSF targets for reducing levels of HIV infection among young women suggest substantial, unmet prevention need among this demographic group that should be addressed in the development of Namibia’s next NSF.
Secondly, with HIV prevalence among young women apparently unchanging since 2010, the sustained levels of HIV prevalence among older women in most districts suggests that; a) rates of AIDS related mortality also remain stable – i.e. in balance with levels of new infection - and has not decreased since 2010; b) AIDS related mortality has continued to decrease as a result of continually increasing ART coverage, and decreases in new infections in slightly older women (e.g. age 25-34 years) are balancing out sustained levels of new infections among younger women, or; c) AIDS related mortality is actually increasing since 2010, despite increased coverage of ART. Further research into trends in mortality and incidence among pregnant women are needed to further understand these trends in prevalence, especially in districts like Okongo, Oshakati, Outapi and Tsumeb wherein significant decreases in HIV prevalence between 2010 and 2016 were not accompanied by decreases in prevalence among young women.
Geographic differences in HIV prevalence
Consistent with the results of previous NHSS, results from the 2016 NHSS highlight that the burden of HIV disease in Namibia varies substantially by geographic areas. Among the 39 main health facilities HIV prevalence ranged from 32.9%, 24.5% and 22.6% in Katima Mulilo, Oshikuku, and Onandjokwe, respectively, to 6.4%, 6.2% and 5.2% in Tsumkwe, Windhoek Central and Opuwo, respectively. Recent age-specific trends in HIV prevalence also varied by health district. Significant decreases in HIV prevalence among older women were observed in Tsumeb, Outapi and Oshakati. A substantial, statistically significant decrease in HIV prevalence since 2010 is observed among younger women in Rundu. Further research should be conducted in Rundu to understand factors associated with this apparent decline in prevalence among youngest women, so that lessons may be learned and applied in other districts wherein similar declines have not been observed.

Surveillance Report of the 2016 National HIV Sentinel Survey
45Surveillance Report of the 2016 National HIV Sentinel Survey
Possible factors contributing to epidemic stabilization
Namibia’s prevention, care and treatment response has been among the most vigorous in the world. Results from the NHSS 2016 could be indicating that this comprehensive response is yielding desirable results in terms of epidemic stabilization. Namibia’s ART program has been rapidly scaled up since 2002 and has achieved near universal coverage. Comprehensive PMTCT services are available in all districts and the eradication of infant HIV infection appears achievable. Testing of blood collected for transfusion has been in place for decades. Point of care CD4 testing has also been expanded which reduces the results turnaround time and quality of care. HIV testing and counseling (HTC) opportunities have expanded, including integrated in primary health centres and clinics, dedicated fixed sites, mobile outreach and in home-based settings in several high-burden regions. Provider Initiative and in-patient testing has also been strengthened. Information and educational efforts focusing on the interruption of partner concurrency, reducing risk taking associated with alcohol use, and treatment of sexually transmitted infections (STI) are disseminated through peers, mass media, and targeted venues such as schools, workplaces, and alcohol consumption outlets. Condoms have been made more widely available, commercially and through free distribution by government, NGO, and peer outreach. Voluntary medical male circumcision (VMMC) has been set as one of the national HIV prevention strategy with a target of achieving 80% prevalence of MC among Namibian men by 2016/17. The updated 2014 national ART guidelines with earlier initiation reflect the emerging science synthesized within the revised 2013 WHO ART guidelines. Accordingly, dramatic expansion of a “test and treat” approach whereby all HIV-positive persons at diagnosis are eligible for ART now includes pregnant and breastfeeding women (Option B+), individuals in sero-discordant partnerships; children <15 years old; those co-infected with hepatitis B; and TB co-infected patients. For individuals not in one of these categories, the eligibility criterion has been advanced to earlier initiation (i.e., CD4 ≤500) which made it possible for more people to be put on ART. Similarly, three regions (Khomas, Ohangwena and Zambezi) are piloting “Test All” which pushes the country to high ART coverage and eventually improved quality of life and survival rate. The potential impact of treatment as prevention (TasP) on HIV incidence and mortality has been demonstrated in Namibia via results of SPECTRUM modeling. Therefore, increased coverage of ART has great potential to further reduce HIV incidence throughout the country.
In addition to the high ART coverage, the sustained HIV prevalence among 15-24 years from 2012 to 2016 (8.9%, 8.3% and 8.5%) could be one of the factors contributing to stabilizing HIV epidemic among older women. This is because less new infections are joining the pool of the old HIV infected cohort. Similarly, a reduction in HIV related deaths among people living with HIV is also a contributing factor.
Surveillance Report of the 2016 National HIV Sentinel Survey
46 Surveillance Report of the 2016 National HIV Sentinel Survey
8. COnCLUsIOns8.1 HIV continues to be a public health concern throughout Namibia, affecting both younger and older women of
child bearing age in all geographical areas of the country. Results from the 2016 NHSS suggest that Namibia’s epidemic remains in a period of stabilization with slow yet sustained decreases in HIV prevalence among pregnant women since 2004.
8.2 The long-term trend of declining HIV prevalence (2002-2016) may reflect a decrease in new infections relative to mortality among HIV-infected persons. However, recent trends (2010 – 2016) demonstrates that new infections continue to occur among young women in Namibia
8.3 The overall HIV prevalence among women age 15-24 years was 8.5%, which shows that it is higher than Namibia’s 2015/16 NSF target of 5% prevalence among pregnant women age 15-24 years. These results clearly demonstrate that new HIV infections continue to occur among young women across Namibia at a rate that will sustain a generalized epidemic into the foreseeable future.
8.4 The 2016 results shows that the HIV disease burden varies by geographic area and across sentinel surveillance sites, with highest HIV prevalence observed ranging above 20% to 33% in north central and eastern sites.
8.5 Among women of all ages (15-49 years) a decline in HIV prevalence from 2014 to 2016 was observed at
15 (38%) out of 39 main sites and an increase was observed at 18 (46%) out of 39 main sites. However, that these declines were statistically significant only in a limited number of sites, indicating a recent trend of continued epidemic stabilization.
8.6 The highest age-specific prevalence was observed among women age 35-39 years (32.3%) and women age 45-49 years (31.6%) representing a continuing shift in peak HIV prevalence from younger to older age groups. This shift can be expected in a mature and stabilized generalized HIV epidemic.
8.7 Overall, 62.5% of all women who tested HIV positive during the 2016 NHSS were already on ART before the Survey compared 49.1% in 2014. This indicates a notable success of the ART and PMTCT programs. The sustained high prevalence rate overall and in many sites implies that the continued expansion and
integration of ART services will remain an important component of the HIV/AIDS response in the coming years.
8.8 Overall in Namibia, there were no apparent differences in the observed HIV prevalence between pregnant women residing in urban areas and pregnant women residing in rural areas.

Surveillance Report of the 2016 National HIV Sentinel Survey
47Surveillance Report of the 2016 National HIV Sentinel Survey
9. RECOMMEnDAtIOnsAccording to the results of the 2016 NHSS, the following activities are recommended:
9.1 There is a need to strengthen targeted, age-specific prevention interventions to reduce new infections among women of all age groups. As the current NSF reaches its conclusion, the unmet prevention need among young women in particular must be addressed during Namibia’s next round of strategic planning
9.2 Compare NHSS data with the DHS+ and further triangulate with other data sources to further validate results with available country data.
9.3 Explore conducting complementary HIV surveillance studies that include the collection of behavioural and linked biological data, which can be used to assess risk behaviours of HIV positive women and to assess different factors that may be associated with increased risk for HIV infection.
9.4 Conduct additional research and surveillance activities that will help to determine the effect of new infections and mortality on overall HIV prevalence estimate and changes of prevalence over time including routine ART outcome program analysis, HIV Impact Assessment, defaulter tracing and incidence studies.
9.5 Strengthen routine PMTCT Monitoring and Evaluation System to enable HIV surveillance using PMTCT program data
10. Strengthen the supply chain management if Namibia is to transition to PMTCT routine data in order to prevent Rapid test kits stock outs.

Surveillance Report of the 2016 National HIV Sentinel Survey
48 Surveillance Report of the 2016 National HIV Sentinel Survey
10. APPENDICES
APPEnDIX 1: Checklist for the 2016 Survey Trainings
History and Context of Sentinel Surveillance Objectives of the 2016 Survey Methods
Site selection Population samples Inclusion criteria Exclusion criteria Sample size Sampling period
Blood specimen and data collection Socio-demographic data collection (Individual Survey Form) Specimen collection and processing
Namibia Institute of Pathology Limited (NIP) laboratory procedures Specimen surveillance bar code Testing procedure Recording and transmission of results De-linking syphilis Syphilis testing
Quality Assurance National level Field Laboratory
Data Management and Analysis Ethical Considerations Dissemination of Results

Surveillance Report of the 2016 National HIV Sentinel Survey
49Surveillance Report of the 2016 National HIV Sentinel Survey
APPEnDIX 2: Sites participating in National HIV Sentinel Survey by Year, Namibia 2002-2016
Region Sentinel Site NameYear of Participation
2002 2004 2006 2008 2010 2012 2014 2016
ZAMBEZI 1. Katima Mulilo
ERONGO 2. Swakopmund 3. Walvisbay 4. Omaruru 5. Usakos
HARDAP 6. Mariental 7. Rehoboth 8. Aranos
//KARAS 9. Luderitz 10. Karasburg 11. Keetmanshoop 12. Rosh Pinah
KAVANGO 13. Rundu 14. Andara 15. Nyangana 16. Nkurenkuru 17. Ncamangoro
KHOMAS 18. Katutura State Hospital 19. Windhoek Central Hospital
KUNENE 20. Opuwo Clinic 21. Outjo 22. Khorixas
OHANGWENA 23. Engela 24. Eenhana 25. Okongo
OMAHEKE 26. Gobabis
OMUSATI 27. Tsandi Clinic 28. Outapi 29. Okahao 30. Oshikuku
OSHANA 31. Oshakati 32. Ondangwa
OSHIKOTO 33. Omuthiya 34. Onandjokwe 35. Tsumeb
OTJOZONDJUPA 36. Otjiwarongo 37. Grootfontein 38. Okahandja 39. Okakarara 40. Tsumkwe
Surveillance Report of the 2016 National HIV Sentinel Survey
50 Surveillance Report of the 2016 National HIV Sentinel Survey
APPEnDIX 3: Individual Survey Form, 2016 NHSS
Ministry of Health and Social Services
2014 HIV ANC Sentinel Surveillance Surve Individual Survey Form
Form Serial # 0 0 0 1 AFFIX BAR CODE STICKER HERE
1 Date of interview D D / M M / Y Y Y Y
2 District abbreviation
3 Site Number
4 Type of facility 1=Hospital 2=Health Centre 3=Clinic
Extract information below directly from the Ante Natal Care Passport and the ANC Register
5 Patient age (in years)
6Place of current residence (town name/farm/village and not locations)
7 Gravidity
8 Patient already on HAART before this ANC visit?
1 = Yes, 2 = No
9 Was patient tested for HIV today? 1 = Yes, 2 = No 10 HIV test Result
1=Positive, 2 =Negative 3 =Unknown, 4 = Known Positive, 5 =Not Tested
11 Nurse's Surname and Initial
PLEASE NOTE!!! Double check to ensure that all questions are fully completed and then SIGN HERE inside the box!! --------->
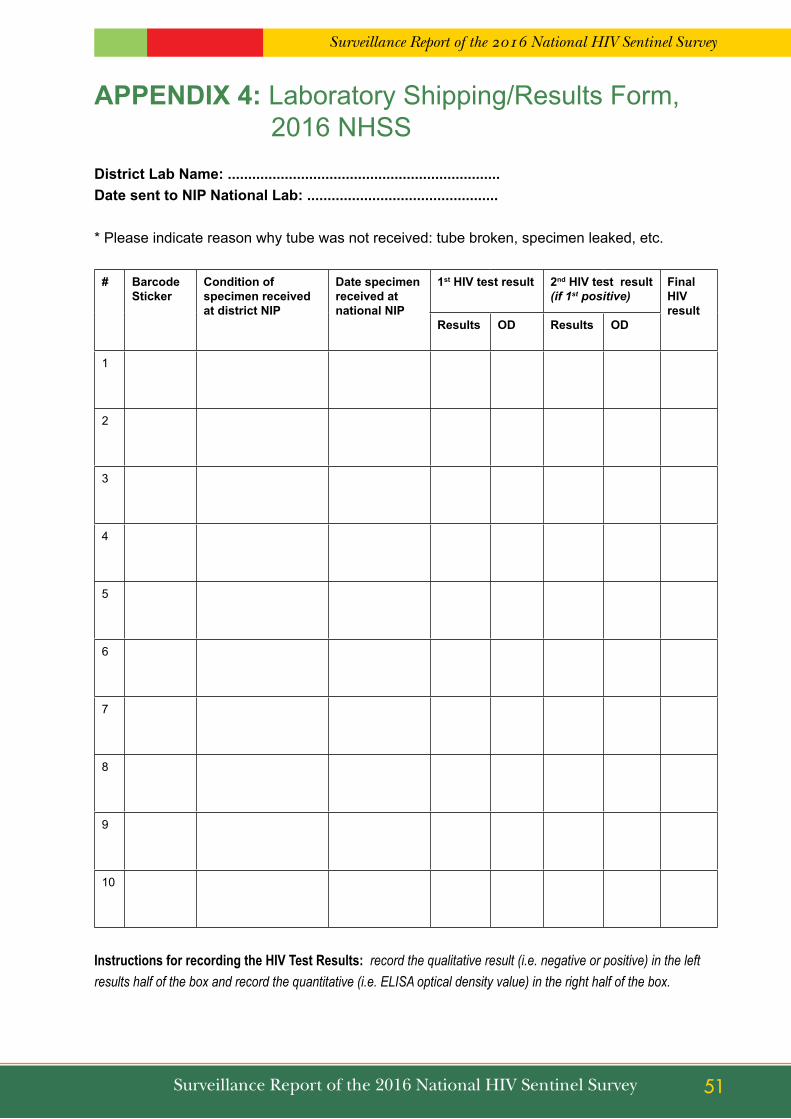
Surveillance Report of the 2016 National HIV Sentinel Survey
51Surveillance Report of the 2016 National HIV Sentinel Survey
APPEnDIX 4: Laboratory Shipping/Results Form, 2016 NHSS
District Lab name: ...................................................................Date sent to nIP national Lab: ...............................................
* Please indicate reason why tube was not received: tube broken, specimen leaked, etc.
# Barcode sticker
Condition of specimen received at district nIP
Date specimen received at national nIP
1st HIV test result 2nd HIV test result (if 1st positive)
Final HIV result
Results OD Results OD
1
2
3
4
5
6
7
8
9
10
Instructions for recording the HIV Test Results: record the qualitative result (i.e. negative or positive) in the left
results half of the box and record the quantitative (i.e. ELISA optical density value) in the right half of the box.

Surveillance Report of the 2016 National HIV Sentinel Survey
52 Surveillance Report of the 2016 National HIV Sentinel Survey
APPEnDIX 5: Clinic and Laboratory Flow Chart, 2016 NHSS
1. HIV testing performed2. HIV results recorded next to applicable bar code on
shipping/results form3. Shipping/results form sent to DSP/RM&E
1. Red top tube spun2. Routine syphilis testing conducted3. An aliquot of serum drawn from 10 ml red top tube into a 5 ml red top tube 4. 3rd Bar code is affixed to 5 ml red top tube5. Obliterate identifiers from 10 ml red top6. De-linking process completed 7. Affix 4th barcode to shipping form8. 5 ml red top tube sent to NIP Windhoek for HIV testing with the remaining
4 barcodes
Results entered electronically at DSP RM&E
DSP/RM&E5 ml tube, shipping form, remaining bar codes to NIP Windhoek
Yellow = Path to evaluate eligibility for survey inclusion
Blue = Path of routine ANC procedures where survey procedures do not apply
5 ml red top tube with shipping / results form, remaining bar codes sent to NIP Windhoek
Send red top tube and remaining 6 barcodes to Local Lab
NIP Local Lab
NIP Lab Windhoek
10 ml red-top tube remains
in lab
1. Complete health passport and register2. Complete individual survey form and affix 1st bar code sticker to
the form3. Complete NIP requisition form4. Draw blood into purple-top tube and 10 ml red-top tube5. Affix 2nd bar code sticker to the 10 ml red top tube
• Woman arrives for ANC visit• Eligibility evaluated
o Age 15-49 yearso First ANC visit this pregnancyo Agrees to a routine ANC blood drawo Not referred from another facility
Woman ineligible, continue with normal ANC visit schedule
YES to criteria
Individual survey form to DSP/RM&E (through NIP)
Survey data entered electronically at DSP RM&E
2. Result entered into MEDITECH System
NO to SSS criteria
ANC Clinic
COLOR LEGEND

Surveillance Report of the 2016 National HIV Sentinel Survey
53Surveillance Report of the 2016 National HIV Sentinel Survey
Appendix 6: Quality Assurance Form for Health Facilities, 2016 NHSS
CHECKLIST FOR QUALITY ASSURANCE OF SURVEILLANCE OPERATIONS
Supervisory staff: Use the following checklist as you monitor the quality of operational activities conducted at the sentinel site during supervisory visits.
Site name: Site Code:
SAMPLING
1. Audit records starting from the time ANC surveillance began until the supervisory visit:
Total no. of women visiting ANC for their 1st ANC since surveillance began: Total no. of women sampled since surveillance began: No. blood samples sent since surveillance began: Comments: (If numbers do not correspond, give reasons)
2. Audit records from the last day that ANC services took place in your facility:
No. of women sampled on this day: Were all eligible clients recruited on this day? Yes [ ] No [ ] Sampling consecutive? Yes [ ] No [ ] Comments: (Give reasons if not all eligible clients were sampled consecutively)
3. List any problems your Site is experiencing with the sentinel survey (for example, inadequate stock of forms, other supplies etc)
(At the Lab, list problems in terms of survey materials and supplies. Remind them to always return the cooler
boxes back to the sites).
Site staff (print name): (signature): Tel/CellSupport visit team leader (print name): (signature): Date of support visit:

Surveillance Report of the 2016 National HIV Sentinel Survey
54 Surveillance Report of the 2016 National HIV Sentinel Survey
APPEnDIX 7: Weekly Progress Report Form, 2016 NHSS
WEEKLY PROGREss REPORt FORM, nHss 2016
to be sent weekly by the local survey team to the Directorate special Programmes (DsP)
Fax to the attention of: Mr. M. siboleka/Mr. tuli nakanyala Fax: (061) 224155
Milner SibolekaTel: 061-203-2288
Email: [email protected]
Tuli NakanyalaTel: 061-203 2438
Email: [email protected]
sentinel site: Date:
AnC samples collected this week:
AnC samples collected to date:
nHss trained staff resigned/rotated:
Problems/Challenges encountered:
Form completed by:________________________ Designation: _________________signature:________________________ telephone/Cell number:_________________

Surveillance Report of the 2016 National HIV Sentinel Survey
55Surveillance Report of the 2016 National HIV Sentinel Survey
APPEnDIX 8: 2016 Sentinel Surveillance Satellite Sites, 2016 NHSS
s/N Region site name Year Code site no Barcode From Barcode to
1 ZAMBEZI KAtIMA MULILO s/n
KATIMA MULILO CLINIC 16 KMU 1 16 KMU 1 001 16 KMU 1 112
MAVULUMA CLINIC 16 KMU 2 16 KMU 2 001 16 KMU 2 088
NGWEZE CLINIC 16 KMU 3 16 KMU 3 001 16 KMU 3 084
BUKALO HEALTH CENTRE 16 KMU 4 16 KMU 4 001 16 KMU 4 039
SIBINDA HEALTH CENTRE 16 KMU 5 16 KMU 5 001 16 KMU 5 034
SANGWALI HC 16 KMU 6 16 KMU 6 001 16 KMU 6 017
Estimated sample 374
2 EROnGO sWAKOPMUnD
TAMARISKIA CLINIC 16 sWA 1 16 sWA 1 001 16 sWA 1 137
HENTIES BAY HC 16 sWA 2 16 sWA 2 001 16 sWA 2 015
ARANDIS CLINIC 16 sWA 3 16 sWA 3 001 16 sWA 3 012
Estimated sample 164
3 WALVIs BAY
KUISEBMUND HC 16 WAL 1 16 WAL 1 001 16 WAL 1 088
COASTAL CLINIC 16 WAL 2 16 WAL 2 001 16 WAL 2 081
NARRAVILLE CLINIC 16 WAL 3 16 WAL 3 001 16 WAL 3 039
WALVIS BAY CLINIC 16 WAL 4 16 WAL 4 001 16 WAL 4 054
Estimated sample 262
4 OMARURU
OMARURU CLINIC 16 OMA 1 16 OMA 1 001 16 OMA 1 114
OMATJETE CLINIC 16 OMA 2 16 OMA 2 001 16 OMA 2 031
UIS CLINIC 16 OMA 3 16 OMA 3 001 16 OMA 3 029
OKOMBAHE CLINIC 16 OMA 4 16 OMA 4 001 16 OMA 4 019
Estimated sample 193
5 UsAKOs
HAKHASEB CLINIC 16 UsA 1 16 UsA 1 001 16 UsA 1 095
DR. SAM NUYOMA HC 16 UsA 2 16 UsA 2 001 16 UsA 2 120
OTJIMBINGWE CLINIC 16 UsA 3 16 UsA 3 001 16 UsA 3 058
SPITZKOPPE CLINIC 16 UsA 4 16 UsA 4 001 16 UsA 4 005
TUBUSIS CLINIC 16 UsA 5 16 UsA 5 001 16 UsA 5 005
Estimated sample 283

Surveillance Report of the 2016 National HIV Sentinel Survey
56 Surveillance Report of the 2016 National HIV Sentinel Survey
6 HARDAP MARIEntAL
MARIENTAL CLINIC 16 MAR 1 16 MAR 1 001 16 MAR 1 087
GIBEON CLINIC 16 MAR 2 16 MAR 2 001 16 MAR 2 016
MALTAHOHE CLINIC 16 MAR 3 16 MAR 3 001 16 MAR 3 017
KALKRAND CLINIC 16 MAR 4 16 MAR 4 001 16 MAR 4 009
STAMPRIET CLINIC 16 MAR 5 16 MAR 5 001 16 MAR 5 013
ARANOS CLINIC 16 MAR 6 16 MAR 6 001 16 MAR 6 029
GOCHAS CLINIC 16 MAR 7 16 MAR 7 001 16 MAR 7 009
Estimated sample 180
7 REHOBOtH
REHOBOTH HC 16 REH 1 16 REH 1 001 16 REH 1 131
KLEIN AUB CLINIC 16 REH 2 16 REH 2 001 16 REH 2 005
RIET OOG CLINIC 16 REH 3 16 REH 3 001 16 REH 3 005
SCHLIP CLINIC 16 REH 4 16 REH 4 001 16 REH 4 006
Estimated sample 147
8 //KARAs LUDERItZ
LUDERITZ CLINIC 16 LUD 1 16 LUD 1 001 16 LUD 1 154
AUS CLINIC 16 LUD 2 16 LUD 2 001 16 LUD 2 010
Estimated sample 164
9 ROsH PInAH
ROSH PINAH CLINIC 16 ROs 1 16 ROs 1 001 16 ROs 1 112
ORANJEMUND CLINIC 16 ROs 2 16 ROs 2 001 16 ROs 2 052
Estimated sample 164
10 KARAsBURG
KARASBURG CLINIC 16 KAR 1 16 KAR 1 001 16 KAR 1 090
ARIAMSVLEI CLINIC 16 KAR 2 16 KAR 2 001 16 KAR 2 015
NOORDOEWER CLINIC 16 KAR 3 16 KAR 3 001 16 KAR 3 101
WARMBAD CLINIC 16 KAR 4 16 KAR 4 001 16 KAR 4 005
Estimated sample 211
11 KEEtMAnsHOOP
KEETMANSHOOP CLINIC 16 KEE 1 16 KEE 1 001 16 KEE 1 073
DAAN VILJOEN CLINIC 16 KEE 2 16 KEE2 001 16 KEE 2 061
BETHANIE HC 16 KEE 3 16 KEE 3 001 16 KEE 3 019
TSES CLINIC 16 KEE 4 16 KEE 4 001 16 KEE 4 011
AROAB HC 16 KEE 5 16 KEE 5 001 16 KEE 5 018
KOES CLINIC 16 KEE 6 16 KEE 6 001 16 KEE 6 014
BERSEBA CLINIC 16 KEE 7 16 KEE 7 001 16 KEE 7 010
Estimated sample 206
Surveillance Report of the 2016 National HIV Sentinel Survey
57Surveillance Report of the 2016 National HIV Sentinel Survey
12 KAVAnGO EAst RUnDU
RUNDU CLINIC 16 RUn 1 16 RUn 1 001 16 RUn 1 045
NKARAPAMWE CLINIC 16 RUn 2 16 RUn 2 001 16 RUn 1 080
NDAMA CLINIC 16 RUn 3 16 RUn 3 001 16 RUn 3 066
SAUYEMWA CLINIC 16 RUn 4 16 RUn 4 001 16 RUn 4 069
SHAMBYU HC 16 RUn 5 16 RUn 5 001 16 RUn 5 041
Estimated sample 301
13 AnDARA
ANDARA HOSPITAL 16 AnD 1 16 AnD 1 001 16 AnD 1 063
DIVUNDU CLINIC 16 AnD 2 16 AnD 2 001 16 AnD 2 046
OLD BAGANI CLINIC 16 AnD 3 16 AnD 3 001 16 AnD 3 037
OMEGA CLINIC 16 AnD 4 16 AnD 4 001 16 AnD 4 015
SHADIKONGORO CLINIC 16 AnD 5 16 AnD 5 001 16 AnD 5 033
BIRO CLINIC 16 AnD 6 16 AnD 6 001 16 AnD 6 028
MAYARA CLINIC 16 AnD 7 16 AnD 7 001 16 AnD 7 026
MUTJIKU CLINIC 16 AnD 8 16 AnD 8 001 16 AnD 8 018
Estimated sample 266
14 nYAnGAnA
NYANGANA HOSPITAL 16 nYA 1 16 nYA 1 001 16 nYA 1 055
KATERE CLINIC 16 nYA 2 16 nYA 2 001 16 nYA 2 015
MABUSHE CLINIC 16 nYA 3 16 nYA 3 001 16 nYA 3 026
MBAMBI EAST CLINIC 16 nYA 4 16 nYA 4 001 16 nYA 4 023
KANDJARA CLINIC 16 nYA 5 16 nYA 5 001 16 nYA 5 011
KARUKUTA CLINIC 16 nYA 6 16 nYA 6 001 16 nYA 6 015
NDONGA CLINIC 16 nYA 7 16 nYA 7 001 16 nYA 7 025
SHINYUNGWE CLINIC 16 nYA 8 16 nYA 8 001 16 nYA 8 018
Estimated sample 188
15 KAVAnGO WEst nKUREnKURU
NANKUDU CLINIC 16 nKU 1 16 nKU 1 001 16 nKU 1 024
MPUNGU HC 16 nKU 2 16 nKU 2 001 16 nKU 2 024
NKURENKURU HC 16 nKU 3 16 nKU 3 001 16 nKU 3 060
RUPARA HC 16 nKU 4 16 nKU 4 001 16 nKU 4 028
TONDORO HC 16 nKU 5 16 nKU 5 001 16 nKU 5 026
MBAMBI WEST CLINIC 16 nKU 6 16 nKU 6 001 16 nKU 6 018
NZINZE CLINIC 16 nKU 7 16 nKU 7 001 16 nKU 7 033
SIKAROSOMPO CLINIC 16 nKU 8 16 nKU 8 001 16 nKU 8 006
YINSU CLINIC 16 nKU 9 16 nKU 9 001 16 nKU 9 006
Estimated sample 225

Surveillance Report of the 2016 National HIV Sentinel Survey
58 Surveillance Report of the 2016 National HIV Sentinel Survey
16 nCAMAnGORO
MUPINI HC 16 nCA 1 16 nCA 1 001 16 nCA 1 093
BUNYA HC 16 nCA 2 16 nCA 2 001 16 nCA 2 082
MPORA CLINIC 16 nCA 3 16 nCA 3 001 16 nCA 3 050
Estimated sample 225
17 KHOMAs KsH
KATUTURA STATE HOSP 16 KAt 1 16 KAt 1 001 16 KAt 1 136
KATUTURA HC 16 KAt 2 16 KAt 2 001 16 KAt 2 045
KHOMASDAL HC 16 KAt 3 16 KAt 3 001 16 KAt 3 022
OKURYANGAVA CLINIC 16 KAt 4 16 KAt 4 001 16 KAt 4 059
Estimated sample 262
18 WCH
WINDHOEK CENTRAL HOSP
16 WCH 1 16 WCH 1 001 16 WCH 1 080
Estimated sample 80
19 KUnEnE OPUWO
OPUWO CLINIC 16 OPU 1 16 OPU 1 001 16 OPU 1 075
ORUMANA CLINC 16 OPU 2 16 OPU 2 001 16 OPU 2 003
Estimated sample 78
20 OUtJO
OUTJO CLINIC 16 OtO 1 16 OtO 1 001 16 OtO 1 130
KAMANJAB HC 16 OtO 2 16 OtO 2 001 16 OtO 2 043
Estimated sample 173
21 KHORIXAs
KHORIXAS CLINIC 16 KHO 1 16 KHO 1 001 16 KHO 1 164
FRANSFONTEIN CLINIC 16 KHO 2 16 KHO 2 001 16 KHO 2 014
ANKER CLINIC 16 KHO 3 16 KHO 3 001 16 KHO 3 014
Estimated sample 192
22 OHAnGWEnA EnGELA
ENGELA CLINIC 16 EnG 1 16 EnG 1 001 16 EnG 1 196
ODIBO HEALTH CENTRE 16 EnG 2 16 EnG 2 001 16 EnG 2 094
Estimated sample 290

Surveillance Report of the 2016 National HIV Sentinel Survey
59Surveillance Report of the 2016 National HIV Sentinel Survey
23 EEnHAnA
EENHANA CLINIC 16 EEn 1 16 EEn 1 001 16 EEn 1 090
EPEMBE CLINIC 16 EEn 2 16 EEn 2 001 16 EEn 2 009
EPINGA CLINIC 16 EEn 3 16 EEn 3 001 16 EEn 3 021
OMUNDAUNGILO CLINIC 16 EEn 4 16 EEn 4 001 16 EEn 4 015
ONAMBUTU CLINIC 16 EEn 5 16 EEn 5 001 16 EEn 5 009
ONGULAYANETANGA CLINIC
16 EEn 6 16 EEn 6 001 16 EEn 6 007
OSHANDI CLINIC 16 EEn 7 16 EEn 7 001 16 EEn 7 014
OSHIKUNDE CLINIC 16 EEn 8 16 EEn 8 001 16 EEn 8 029
Estimated sample 194
24 OKOnGO
OKONGO CLINIC 16 OKO 1 16 OKO 1 001 16 OKO 1 193
EKOKA CLINIC 16 OKO 2 16 OKO 2 001 16 OKO 2 023
OMBOLOKA CLINIC 16 OKO 3 16 OKO 3 001 16 OKO 3 026
Estimated sample 242
25 OMAHEKE GOBABIs
EPAKO CLINIC 16 GOB 1 16 GOB 1 001 16 GOB 1 138
OTJINENE HC 16 GOB 2 16 GOB 2 001 16 GOB 2 030
AMINUIS CLINIC 16 GOB 3 16 GOB 3 001 16 GOB 3 011
WITVLEI CLINIC 16 GOB 4 16 GOB 4 001 16 GOB 4 011
Estimated sample 190
26 OMUsAtI OUtAPI
OUTAPI CLINIC 16 OUt 1 16 OUt 1 001 16 OUt 1 175
Estimated sample 175
27 OKAHAO
OKAHAO CLINIC 16 OKA 1 16 OKA 1 001 16 OKA 1 184
INDIRA GANDHI HC 16 OKA 2 16 OKA 2 001 16 OKA 2 065
ETILYASA CLINIC 16 OKA 3 16 OKA 3 001 16 OKA 3 022
Estimated sample 271
28 OsHIKUKU
OSHIKUKU HOSPITAL 16 OsH 1 16 OsH 1 001 16 OsH 1 099
OKALONGO HC 16 OsH 2 16 OsH 2 001 16 OsH 2 131
ONHELEIWA CLINIC 16 OsH 3 16 OsH 3 001 16 OsH 3 023
Estimated sample 253

Surveillance Report of the 2016 National HIV Sentinel Survey
60 Surveillance Report of the 2016 National HIV Sentinel Survey
29 tsAnDI
TSANDI CLINIC 16 tsA 1 16 tsA 1 001 16 tsA 1 141
ONESI HEALTH CENTRE 16 tsA 2 16 tsA 2 001 16 tsA 2 080
IILYATEKO CLINIC 16 tsA 3 16 tsA 3 001 16 tsA 3 020
OKATSEYIDHI CLINIC 16 tsA 4 16 tsA 4 001 16 tsA 4 005
ONGULUMBASHE CLINC 16 tsA 5 16 tsA 5 001 16 tsA 5 022
Estimated sample 268
30 OsHAnA OsHAKAtI
OSHAKATI HC 16 IHO 1 16 IHO 1 001 16 IHO 1 249
Estimated sample 249
31 OsHAnA OnDAnGWA
ONDANGWA HC 16 OnD 1 16 OnD 1 001 16 OnD 1 249
Estimated sample 249
32 OsHIKOtO OnAnDJOKWE
ONANDJOKWE HOSPITAL 16 OnA 1 16 OnA 1 001 16 OnA 1 287
Estimated sample 287
33 OMUtHIYA
OMUTHIYA CLINIC 16 OMU 1 16 OMU 1 001 16 OMU 1 253
Estimated sample 253
34 tsUMEB
LOMBARD CLINIC 16 tsU 1 16 tsU 1 001 16 tsU 1 122
TSUMEB CLINIC 16 tsU 2 16 tsU 2 001 16 tsU 2 055
OSHIVELO CLINIC 16 tsU 3 16 tsU 3 001 16 tsU 3 037
Estimated sample 214
35 OtJOZUnDJUPA OtJIWAROnGO
ORWETOVENI CLINIC 16 OtJ 1 16 OtJ 1 001 16 OtJ 1 209
Estimated sample 209
36 GROOtFOntEIn
POLY CLINIC 16 GRO 1 16 GRO 1 001 16 GRO 1 205
Estimated sample 205
37 OKAHAnDJA
NAU - AIB CLINIC 16 OKH 1 16 OKH 1 001 16 OKH 1 197
Estimated sample 197
38 OKAKARARA
OKAKARARA CLINIC 16 OKK 1 16 OKK 1 001 16 OKK 1 118
OKONDJATU CLINIC 16 OKK 2 16 OKK 2 001 16 OKK 2 028
Estimated sample 146
39 tsUMKWE
TSUMKWE CLINIC 16 tsK 1 16 tsK 1 001 16 tsK 1 032
GAM CLINIC 16 tsK 2 16 tsK 2 001 16 tsK 2 036
MANGETTI DUNE HC 16 tsK 3 16 tsK 3 001 16 tsK 3 034
OMATAKO CLINIC 16 tsK 4 16 tsK 4 001 16 tsK 4 018
Estimated sample 120
Total sample size 8350

Surveillance Report of the 2016 National HIV Sentinel Survey
61Surveillance Report of the 2016 National HIV Sentinel Survey
APPEnDIX 9: 2016 NHSS Technical Working Group
Designation Name Email
Government
MoHSS: DSP Director Ms. Anne-Marie ( Chairperson) [email protected]
MoHSS: DSP Acting DD: ENARC Ms. Julieth Karirao [email protected]
MoHSS: DSP CMO: HIV and STI Dr. Ndapewa Hamunime [email protected]
MoHSS: DSP CHPO: RM&E Mr. Nicholus Mutenda [email protected]
MoHSS: DSP Research & Surveillance Officer Mr. Tuli Nakanyala [email protected]
MoHSS: DSP Statistician Mr. Milner Siboleka [email protected]
MoHSS: DSP CHPO: HIV and STI Ms. Francina Kaindjee - Tjituka [email protected]
MoHSS: DSP SHPO: HIV Mr. Salomo Natanael [email protected]
MoHSS: DSP M&E Officer Mr. Alfons Badi [email protected]
MoHSS: DSP Administrative Officer Mr. Andreas Kapofi [email protected]
MoHSS: DSP Administrative Officer Ms. Veronica Shililifa [email protected]
MoHSS: DSP Administrative Officer Ms. Linea Naango [email protected]
MoHSS: DSP Administrative Officer Mr. Seualt Hangero [email protected]
MoHSS: PHC PMTCT Assistant Coordinator Mr. Neto Likoro [email protected]
Partnering Insitutions
NIP MCA Mr. Johannes Klemens [email protected]
NIP Bench Supervisor: Immunochemistry
Ms. Emma Shitaatala [email protected]
NIP Senior Medical Technologist: Core Lab
Ms. Sylvia [email protected]
NSA Statistician Mr. Ronnie Lutibezi [email protected]
NSA Statistician Ms. Frieda Theofelus [email protected]
Development partners
UCSF/Global Programs
Director Strategic Information: Namibia
Mr. Andrew [email protected]
CDC Associate Deputy Director: Management and Operations
Ms. Anna [email protected]
CDC Strategic Information Lead Mr. Adam Wolkon [email protected]
CDC Laboratory TA Mr. Souleymane Sawadogo [email protected]
CDC Health Information Specialist Mr. Michael De Klerk [email protected]
UNAIDS M&E TA Mohamed Turay [email protected]
WHO Medical Officer Desta Tiruneh [email protected]
UNICEF M&E Advisor Mr. Erwin Mbangula [email protected]
MOHSS-PMU Senior M&E Officer Mr. Dumisani Sibanda [email protected]
CDC Field Officer Mr. Toubed Mbwale [email protected]
CDC Field Officer Ms. Maria Egodhi [email protected]

Surveillance Report of the 2016 National HIV Sentinel Survey
62 Surveillance Report of the 2016 National HIV Sentinel Survey
APPEnDIX 10: 2016 NHSS NIP Specimen Logbook
2016 HIV sEntInEL sURVEILLAnCE sURVEY sPECIMEn nIP RECEIVInG LOGBOOK
LABORAtORY LOCAtIOn ................................... DIstRICt ............................................
DAtEdd/mm/yy
specimen Codes (Individual survey bar codes) in sequential order(E.g. 16AnD-1 001 to 010)
total number of specimens
Recorded by:(surname and Initial)

Surveillance Report of the 2016 National HIV Sentinel Survey
63Surveillance Report of the 2016 National HIV Sentinel Survey
APPENDIX 11: Quality Assurance Form for NIP Laboratories, 2016 NHSS
CHECKLIST FOR QUALITY ASSURANCE OF SURVEILLANCE OPERATIONS
AT NIP LABORATORY
Supervisory staff: Use the following checklist as you monitor the quality of operational activities conducted at the NIP
laboratory during supervisory visits.
Laboratory name:
1. Total number of blood samples received at the lab by the visit date (E.g. KAT1=55, KAT2=100 etc)
(Review the Logbook)
1.1 Total samples collected from each clinic
2. List any problems you have experienced at the laboratory which can affect the Sentinel survey
(Inadequate shipping forms, tubes, received haemolysed specimens. Remind them to always return the
cooler boxes back to the sites).
Laboratory staff (print name): Tel: (signature): Support visit team leader (print name): (signature): Date of support visit:

Surveillance Report of the 2016 National HIV Sentinel Survey
64 Surveillance Report of the 2016 National HIV Sentinel Survey
11. REFEREnCEs
i MOHSS, (2013). Namibia National AIDS Spending Assessment (NASA), 2012/13 and 2013/14
ii Barlow Katrina, Tavares Paul, Perry Keith, Evaluation of the Roche HIV Combi Assay, October 2007.
iii Fifth meeting of the WHO/AFRO technical network on HIV/AIDS and STI surveillance, 2006, Sept 26-28: Harare, Zimbabwe.
v Jonas A, Gutreuter S, Patel S, Maher A, et al A novel analytical approach confirms stabilization of HIV epidemic in pregnant women in Namibia, Presented at CROI, 2013, Boston.
vi Jonas A, Maher AD, Shiraishi R, deKlerk M, et al. National ART Monitoring System Enables Robust Transfer-adjusted Retention Analyses in Namibia, Presented at CROI, 2013, Boston.
vii Fox MP, Rosen S, Patient retention in antiretroviral therapy programs up to three years on treatment in sub-Saharan Africa, 2007–2009: systematic review, Tropical Medicine and International Health, Vol 15, Iss Sup s1, pages 1–15, June 2010.