National Accounts - Statistics South Africa
68
-
Upload
khangminh22 -
Category
Documents
-
view
0 -
download
0
Transcript of National Accounts - Statistics South Africa

Statistics South Africa
Tourism satellite account for South Africa, provisional 2010
Tourism Satellite Account for South Africa, provisional 2010
Pali Lehohla Statistician-General
Report No: 04-05-07 Statistics South Africa March 2012

Statistics South Africa
Tourism satellite account for South Africa, provisional 2010
ii
Published by Statistics South Africa, Private Bag X44, Pretoria 0001 © Statistics South Africa, 2012 Users may apply or process this data, provided Statistics South Africa (Stats SA) is acknowledged as the original source of the data; that it is specified that the application and/or analysis is the result of the user's independent processing of the data; and that neither the basic data nor any reprocessed version or application thereof may be sold or offered for sale in any form whatsoever without prior permission from Stats SA. Report: Tourism Satellite Account for South Africa, provisional 2010 Report no: (04-05-07) Statistics South Africa Pretoria: Statistics South Africa, March 2012 Title continuous in English only A complete set of Stats SA publications is available at the Stats SA Library and the following libraries:
National Library of South Africa, Pretoria Division National Library of South Africa, Cape Town Division Library of Parliament, Cape Town Bloemfontein Public Library Natal Society Library, Pietermaritzburg Johannesburg Public Library Eastern Cape Library Services, King William's Town Central Regional Library, Polokwane Central Reference Library, Nelspruit Central Reference Collection, Kimberley Central Reference Library, Mmabatho
This report is also available on the Stats SA website: www.statssa.gov.za

Statistics South Africa
Tourism satellite account for South Africa, provisional 2010
iii
Contents
Preface .......................................................................................................................................... 1
Key findings.................................................................................................................................... 2
The 2010 FIFA World Cup™ in South Africa ..................................................................................... 4
Chapter 1: Introduction ......................................................................................................... 5
1.1 The importance of a Tourism Satellite Account ....................................................................... 5
1.2 Relationships of the Tourism Satellite Account with the 1993 System of National Accounts ......... 6
Chapter 2: Data sources........................................................................................................ 8
Chapter 3: Tourism Satellite Account for South Africa, provisional 2010 .................................... 13
3.1 Flow of expenditure through the South African economy.......................................................... 13
3.2 Tourism expenditure............................................................................................................. 13
3.3 Production accounts ............................................................................................................ 21
3.4 Domestic supply and internal tourism consumption by product................................................. 22
3.5 Employment in the tourism industries ..................................................................................... 28
Chapter 4: The future development of TSA for South Africa....................................................... 30
Annexures ...................................................................................................................................... 31
Annexure A:Tourism-characteristic products....................................................................................... 31
Annexure B:List of tourism-characteristic activities............................................................................... 35
Annexure C:Tourism Satellite Account tables of South Africa ............................................................... 36
Glossary ........................................................................................................................................ 56
Related Tourism Satellite Account publications................................................................................... 60

Statistics South Africa
Tourism satellite account for South Africa, provisional 2010
iv
List of tables Table 1: Data sources used for compilation of the Tourism Satellite Account for South Africa at
Stats SA ......................................................................................................................................... 9
Table 2: Data sources used for compilation of the Tourism Satellite Account for South Africa at
South African Tourism ..................................................................................................................... 11
Table 3: Tourism expenditure by product, South Africa, 2010 ............................................................. 14
Table 4: Inbound tourism expenditure by type of product, 2010 (R million) .......................................... 15
Table 5: Inbound tourism expenditure by type of product, 2010 (%) .................................................... 15
Table 6: Domestic tourism expenditure by type of product, 2010 (R million) ......................................... 17
Table 7: Domestic tourism expenditure by type of product, 2010 (%) ................................................... 17
Table 8: Internal tourism expenditure by type of product, 2010 (R million)............................................ 19
Table 9: Internal tourism expenditure by type of product, 2010 (%)...................................................... 19
Table 10: Production accounts of the tourism industries and other industries (at basic prices), 2010
(R million)....................................................................................................................................... 21
Table 11: Domestic supply and internal tourism consumption by product, 2010 (R million).................... 23
Table 12: Derivation of tourism industry ratios, 2010 ......................................................................... 24
Table 13: Tourism direct gross value added and tourism direct gross domestic product, 2010............... 26
Table 14: Tourism direct gross value added, 2010 (R million)............................................................. 26
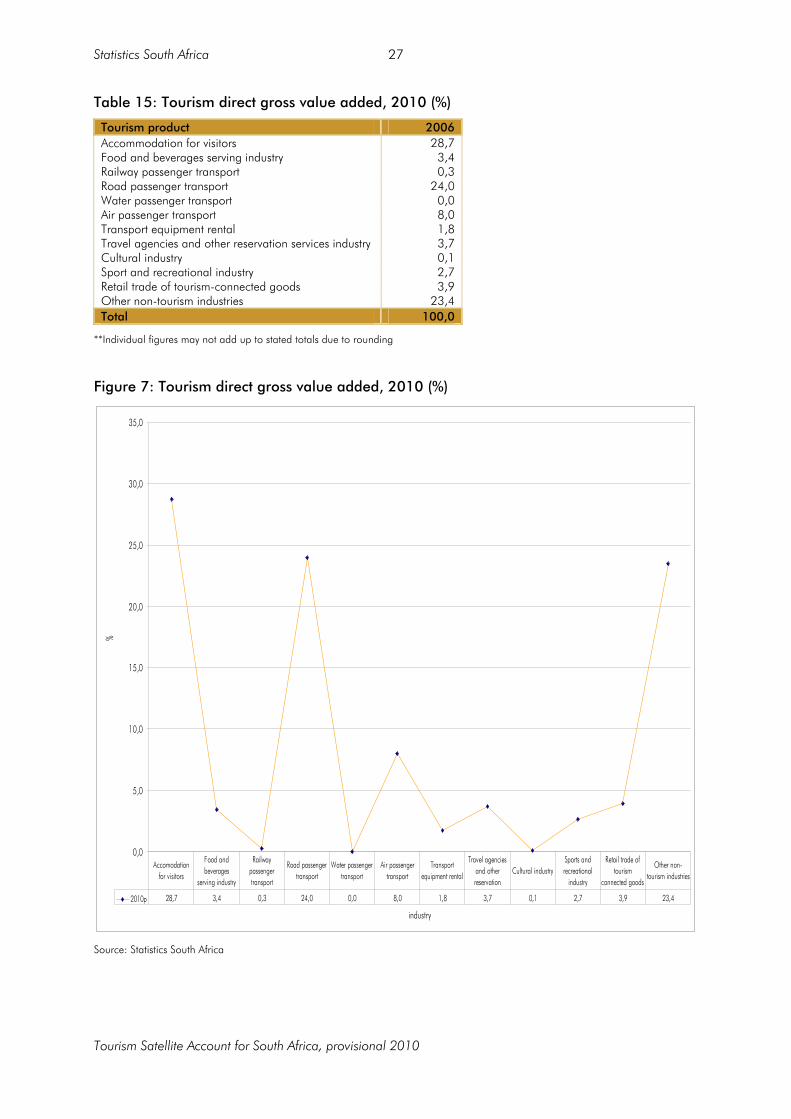
Table 15: Tourism direct gross value added, 2010 (%)....................................................................... 27
Table 16: Employment in the tourism industries by population group, 2010 (No. of persons)................. 29
Table A: List of tourism-characteristic activities ................................................................................... 35
Table B: TSA Table 1 – Inbound tourism expenditure, by product and class of visitor, 2010
(R million)....................................................................................................................................... 37
Table C: TSA Table 2 – Domestic tourism expenditure, by product, class of visitor and type of trip,
2010 (R million).............................................................................................................................. 39
Table D: TSA Table 3 – Outbound tourism expenditure, by product and class of visitor, 2010
(R million)....................................................................................................................................... 41
Table E: TSA Table 4 – Internal tourism consumption by product, 2010 (R million)................................ 43
Table F: TSA Table 5 – Production accounts of tourism industries and other industries, 2010
(R million)....................................................................................................................................... 45
Table G: TSA Table 6 – Total domestic supply and internal tourism consumption (at purchasers'
prices), 2010 (R million) .................................................................................................................. 48
Table H: TSA Table 7 – Employment in the tourism industries (TSA: RMF, 2008)................................... 51
Table I: TSA Table 8 – Tourism gross fixed capital formation of tourism industries and other
industries (TSA: RMF, 2008)............................................................................................................. 52

Statistics South Africa
Tourism satellite account for South Africa, provisional 2010
v
Table J: TSA Table 9 – Tourism collective consumption by product and level of government (TSA:
RMF, 2008).................................................................................................................................... 53
Table K: TSA Table 10a – Number of trips and overnights by form of tourism and class of visitor,
2010 ('000).................................................................................................................................... 53
Table L: TSA Table 10b – Number of and overnights by mode of transport .......................................... 54
Table M: TSA Table 10c – Number of establishments and capacity by type of accommodation,
2010............................................................................................................................................. 54
Table N: TSA Table 10d – Number of establishments in tourism industries classified according to
average number of employed persons .............................................................................................. 55

Statistics South Africa
Tourism satellite account for South Africa, provisional 2010
vi
List of figures
Figure 1: Flow of tourism expenditure through the South African economy, 2010 ................................. 4
Figure 2: The 10 tables of a Tourism Satellite Account ....................................................................... 7
Figure 3: Inbound tourism expenditure by type of product, 2010 (%) ................................................... 16
Figure 4: Domestic tourism expenditure by type of product, 2010 (%) .................................................. 18
Figure 5: Internal tourism expenditure by type of product, 2010 (%)..................................................... 20
Figure 6:Link between gross direct value added of the tourism industries and tourism direct gross
value added ................................................................................................................................... 25
Figure 7: Tourism direct gross value added, 2010 (%)........................................................................ 27

Statistics South Africa
Tourism satellite account for South Africa, provisional 2010
vii
Abbreviations
AFS Annual Financial Statistics
AsgiSA Accelerated and Shared Growth Initiative for South Africa
BoP Balance of Payments
CPC Central Product Classification
EAS Economic Activity Survey
GDP Gross domestic product
GHS General Household Survey
GVA Gross value added
GDVATI Gross direct value added of the tourism industries
IES Income and Expenditure Survey
ISIC International Standard Industrial Classification of all Economic Activities
LFS Labour Force Survey
LSS Large Sample Survey
QLFS Quarterly Labour Force Survey
SARB South African Reserve Bank
SAT South African Tourism
SIC Standard Industrial Classification of all Economic Activities
SICTA Standard International Classification of Tourism Activities
SNA System of National Accounts
Stats SA Statistics South Africa
STS System of Tourism Statistics
SU-tables Supply and use tables
TDGDP Tourism direct gross domestic product
TDGVA Tourism direct gross value added
TFDS Tourism foreign direct spend
TSA Tourism Satellite Account
TSA: RMF Tourism Satellite Account Recommended Methodological Framework
UN United Nations
UNSD United Nations Statistical Division
UNWTO United Nations World Tourism Organisation
VA Value added
VAT Value added tax

Statistics South Africa
Tourism satellite account for South Africa, provisional 2010
1
Preface The Tourism Satellite Account (TSA), provisional 2010 covers provisional figures for the reference year 2010. It provides an overview of the role that tourism plays in South Africa and provides information on tourism's contribution to the South African economy in terms of expenditure and employment. The TSA for South Africa is compiled and published by Statistics South Africa (Stats SA) according to the Tourism Satellite Account: Recommended Methodological Framework (TSA: RMF) developed by the United Nations World Tourism Organization (UNWTO). The TSA is one element of a System of Tourism Statistics (STS) that provides information for the understanding and monitoring of the impact of tourism on the South African economy over time. Other elements of the STS for South Africa include the surveys of international tourists and domestic visitors, visitor arrival statistics, tourist accommodation and food and beverages statistics.

Statistics South Africa
Tourism satellite account for South Africa, provisional 2010
2
Key findings
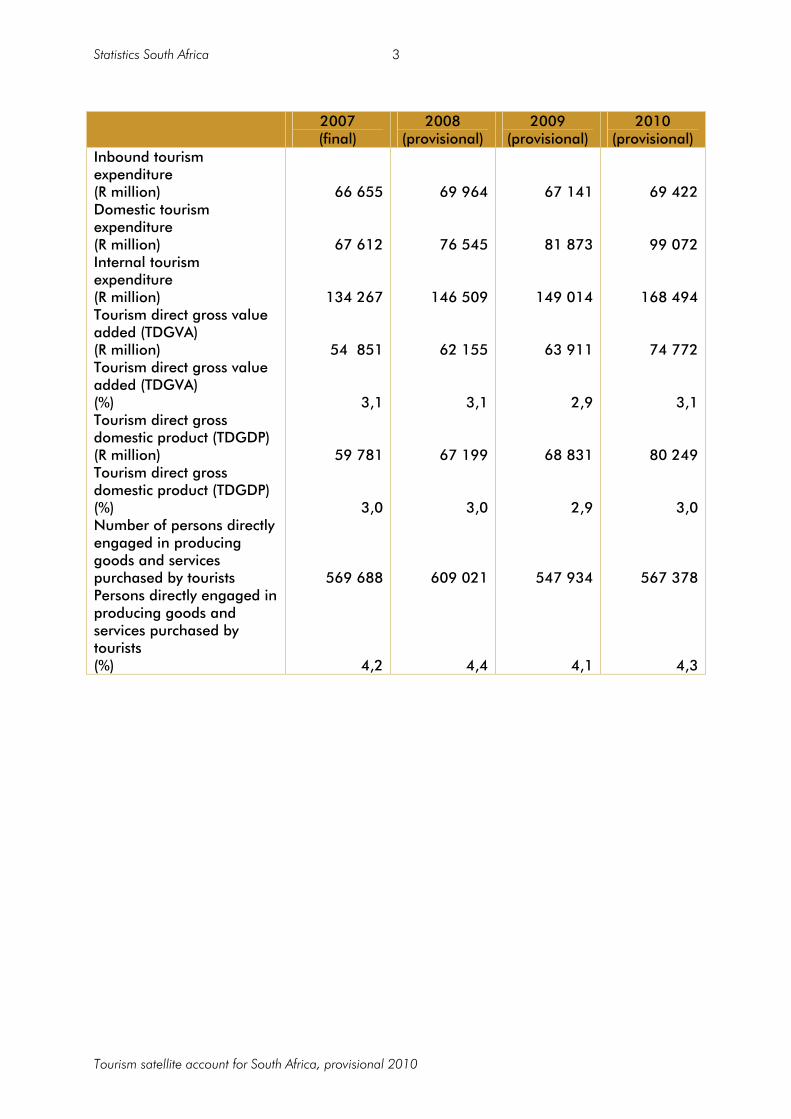
Tourism direct gross domestic product was R80 249 million (or 3,0% of total gross domestic product) for 2010, R68 831 million (or 2,9% of total gross domestic product ) for 2009, R67 199 million (or 3,0% of total gross domestic product) in 2008 and R59 781 million (or 3,0% of total gross domestic product ) in 2007. The year 2010 saw 11 303 087 foreign visitors to South Africa compared with 9 531 615 foreign visitors and 9 407 314 foreign visitors in 2009 and 2008 respectively. There were 567 378 persons (or 4,3% of total employment) directly engaged in producing goods and services purchased by tourists in 2010, 547 934 persons (or 4,1% of total employment) in 2009, 609 021 persons (or 4,4% of total employment) in 2008 and 569 688 (or 4,2% of total employment) in 2007. Inbound tourism expenditure totalling R69 422 million was recorded in 2010. The main expenditure items were 'non-specific products' (19,6%), 'accommodation for visitors' (17,9%), ‘road passenger transport services’ (13,7%) and 'tourism connected products' (12,9%). Inbound tourism expenditure totalling R67 141 million was recorded in 2009. The main expenditure items were 'non-specific products' (26,4%), 'accommodation for visitors' (15,7%), 'road passenger transport services' (13,1%) and 'connected products' (12,7%). Domestic tourism expenditure totalling R99 072 million (including the domestic portion of outbound tourism expenditure) was recorded in 2010. The main expenditure items were 'road passenger transport services' (29,9%), 'accommodation for visitors' (22,9%), 'air passenger transport services' (12,9%) and 'non-specific products' (10,3%). Domestic tourism expenditure totalling R81 873 million (including the domestic portion of outbound tourism expenditure) was recorded in 2009. The main expenditure items were 'road passenger transport services' (32,4%), 'accommodation for visitors' (19,2%), 'air passenger transport services' (13,3%) and 'non-specific products' (11,8%). The total internal tourism consumption in cash for South Africa in 2010 was R168 494 million (inbound tourism consumption R69 422 million (41,2%) and domestic tourism consumption R99 072 million (58,8%)). The main expenditure items for internal tourism were 'road passenger transport services' (23,2%), 'accommodation for visitors' (20,8%), 'non-specific products' (14,2%) and 'tourism connected products' (10,1%). The total internal tourism consumption in cash for South Africa in 2009 was R149 014 million (inbound tourism consumption R67 141 million (45,1%) and domestic tourism consumption R81 873 million (54,9%)). The main expenditure items for internal tourism were 'road passenger transport services' (23,7%), 'non-specific products' (18,4%), 'accommodation for visitors' (17,6%) and 'tourism connected products' (10,8%).
Statistics South Africa
Tourism satellite account for South Africa, provisional 2010
3
2007
(final) 2008
(provisional) 2009
(provisional) 2010
(provisional) Inbound tourism expenditure (R million) 66 655 69 964
67 141 69 422Domestic tourism expenditure (R million) 67 612 76 545
81 873 99 072Internal tourism expenditure (R million) 134 267 146 509
149 014 168 494Tourism direct gross value added (TDGVA) (R million) 54 851 62 155
63 911 74 772Tourism direct gross value added (TDGVA) (%) 3,1 3,1
2,9 3,1Tourism direct gross domestic product (TDGDP) (R million) 59 781 67 199
68 831 80 249Tourism direct gross domestic product (TDGDP) (%) 3,0 3,0
2,9 3,0Number of persons directly engaged in producing goods and services purchased by tourists 569 688 609 021
547 934 567 378Persons directly engaged in producing goods and services purchased by tourists (%) 4,2 4,4
4,1 4,3

Statistics South Africa
Tourism satellite account for South Africa, provisional 2010
4
Figure 1: Flow of tourism expenditure through the South African economy, 2010
The 2010 FIFA World Cup™ in South Africa South Africa became the first African country to host the 2010 FIFA World Cup™ from 11 June to 11 July 2010. The World Cup took place in eight of South Africa's nine provinces, using 10 stadiums in nine host cities. Johannesburg was the only city with two venues for the 2010 FIFA World Cup™, namely Soccer City and Ellis Park. Other host cities were Cape Town, Pretoria, Durban, Port Elizabeth, Polokwane, Nelspruit, Bloemfontein and Rustenburg. According to research by Grant Thornton before the 2010 FIFA World Cup™, the firm estimated that some 483 250 tourists will spend around R8 500 million during their stay in South Africa. In a study conducted by South African Tourism (SAT) on the overall impact of the 2010 FIFA World Cup™ in South Africa, it is stated that a total of 309 554 inbound tourists arrived in South Africa for the primary purpose of attending the 2010 FIFA Soccer World Cup. SAT estimated the total expenditure in South Africa by these tourists who came specifically for the 2010 FIFA World Cup at R3 640 million. The majority of these tourist arrivals were from Europe, followed by African Land Markets and Central and South America. 'Shopping' and 'enjoying the nightlife' were the two most common activities which tourists engaged in apart from 'watching the 2010 FIFA World Cup™'. The tourists indicated that of the total money spent in South Africa during their stay for the 2010 FIFA World Cup, the biggest expenditure item was shopping (31%), followed by paid accommodation (20%), food and beverages (19%) and leisure (16%). According to FIFA, a total of 3 100 000 spectators attended the 64 matches of the 2010 FIFA World Cup™ in South Africa.

Statistics South Africa
Tourism satellite account for South Africa, provisional 2010
5
Chapter 1: Introduction The United Nations World Tourism Organization (UNWTO) defines tourism as 'the activities of persons travelling to and staying in places outside their usual environment for not more than one consecutive year for leisure, business and other purposes not related to the exercise of an activity remunerated from within the place visited'. During the last decades, tourism has become an important economic and social activity in the national and global economy. However, statistical information on the nature, progress and consequences of tourism in South Africa is mainly based on arrivals and overnight stay statistics, Balance of Payments (BoP) information and South African Tourism (SAT) surveys, which do not grasp the whole economic phenomenon of tourism. Consequently, government, businesses and citizens may not receive accurate information that is necessary for effective public policies and efficient business operations. Although tourism is by nature a demand-driven phenomenon, it is necessary, from a macroeconomic point of view, to observe how the match between demand and supply operates, and how the latter affects the basic macroeconomic variables of the country of reference. Within a context of macroeconomic analysis, the relationship between supply and demand is best studied within the general framework of national accounts. The tourism sector is not measured as a sector in its own right in national accounts, because tourism is not a clearly defined industry in the International Standard Industrial Classification of all Economic Activities (ISIC), but rather an amalgamation of industries such as transportation, accommodation, food and beverage services, recreation and entertainment, travel agencies, etc. This is because industries are classified according to the goods and services they produce, while tourism is a consumption-based concept that depends on the status of the consumer. A major reason for the difficulties in measuring the size of tourism is the fact that in the ISIC, industries are created on the basis of their activity or output rather than on data on their customers, whereas tourism is defined by the characteristics of the tourists. Furthermore, tourism consumption includes 'tourism-characteristic' (i.e. accommodation, travel services, cable cars, etc.) and 'non-tourism-related' (i.e. retail trade) goods and services, which deliver their services largely to non-tourists. The key factor to measure tourism, is to relate purchases by tourists to the total supply of these goods and services within a country.
1.1 The importance of a Tourism Satellite Account
The Tourism Satellite Account (TSA) is an accounting framework adopted by the United Nations (UN) and designed to measure goods and services associated with tourism according to international standards, concepts, classifications and definitions. The TSA will provide stakeholders (governments, entrepreneurs and citizens) with reliable data to assist them in the design of public policies and business strategies for tourism and for the evaluation of their efficiency.

Statistics South Africa
Tourism satellite account for South Africa, provisional 2010
6
The development of a TSA framework has been fuelled by the recognition that its implementation will serve to: • Increase and improve knowledge of tourism's importance in relation to overall economic
activity in a given country; • Provide a coherent and credible set of tourism accounts that can also be compared
internationally across countries; • Develop quantitative estimates of tourism value-added and, thus, analyse the importance
of tourism in the economy; • Provide an instrument for designing more efficient policies on tourism and its employment
aspects; • Identify employment generation in tourism industries and the role tourism plays in job
creation for different types of workers; • Create awareness of the economic importance of this activity among players directly and
indirectly involved in tourism; and • Extend the role of tourism in all industries involved in producing the goods and services
demanded by visitors.
1.2 Relationships of the Tourism Satellite Account with the 1993 System of National Accounts
The TSA brings together the diverse aspects of tourism by providing a tourism dimension to the framework of the 1993 System of National Accounts (SNA). It makes it possible to separate and examine the demand and supply side of tourism in an integrated system, which describes the production and demand aspects of the entire economy. The SNA recommends the development of Satellite Accounts for the measurement of economic phenomena that is not explicitly shown in the core set of accounts. The TSA was therefore developed for the explicit study of tourism-connected industries and products. A TSA1 is: • A statistical instrument used to measure the size of the tourism sector's contribution to the
economy of a country according to international standards of concepts, classifications and definitions which will allow for valid comparisons with other industries and, eventually, between individual countries and between groups of countries; and
• Used to analyse all aspects of demand for goods and services which can be associated with tourism within the economy, to observe the operational interface with the supply of such goods and services within the same economy of reference, and to describe how this supply interacts with other economic activities2.
The fundamental structure of a TSA is based on the general relationship existing within an economy between the demand of goods and services generated by tourism on the one hand, and their supply on the other hand, and as such provides a framework for policy analysis of issues related to tourism economics, as well as for model-building, tourism growth analysis and productivity measurements. For South Africa, the TSA will provide a measure of the importance of tourism in terms of gross domestic product (GDP), expenditures and employment which will be comparable with similar measures from the SNA for the overall South African economy (it also allows a comparison with other industries in terms of the abovementioned variables). The TSA for South Africa, provisional 2010 provides a coherent framework to integrate and analyse economic statistics related to tourism activity, both from the supply and demand side. The South African TSA follows the international guidelines as prescribed by the UNWTO.
1 It is important to note that a TSA will only measure the direct impact of tourism on the economy, not the indirect and induced effects 2 TSA: RMF, 2008

Statistics South Africa
Tourism satellite account for South Africa, provisional 2010
7
Figure 2: The 10 tables of a Tourism Satellite Account
A background to the concepts and methodology used in the compilation of the TSA for South Africa can be found in the discussion document 'Draft Tourism Satellite Account for South Africa, 2005 (Discussion document No. D0405.7)' on the Stats SA website (www.statssa.gov.za), as well as from the Printing and Distribution section at Stats SA ([email protected])or (012) 310 8044/8161).

Statistics South Africa
Tourism satellite account for South Africa, provisional 2010
8
Chapter 2: Data sources This section looks at the data sources used in the compilation of the TSA for South Africa.
2.1 Data sources used for compilation of the Tourism Satellite Account
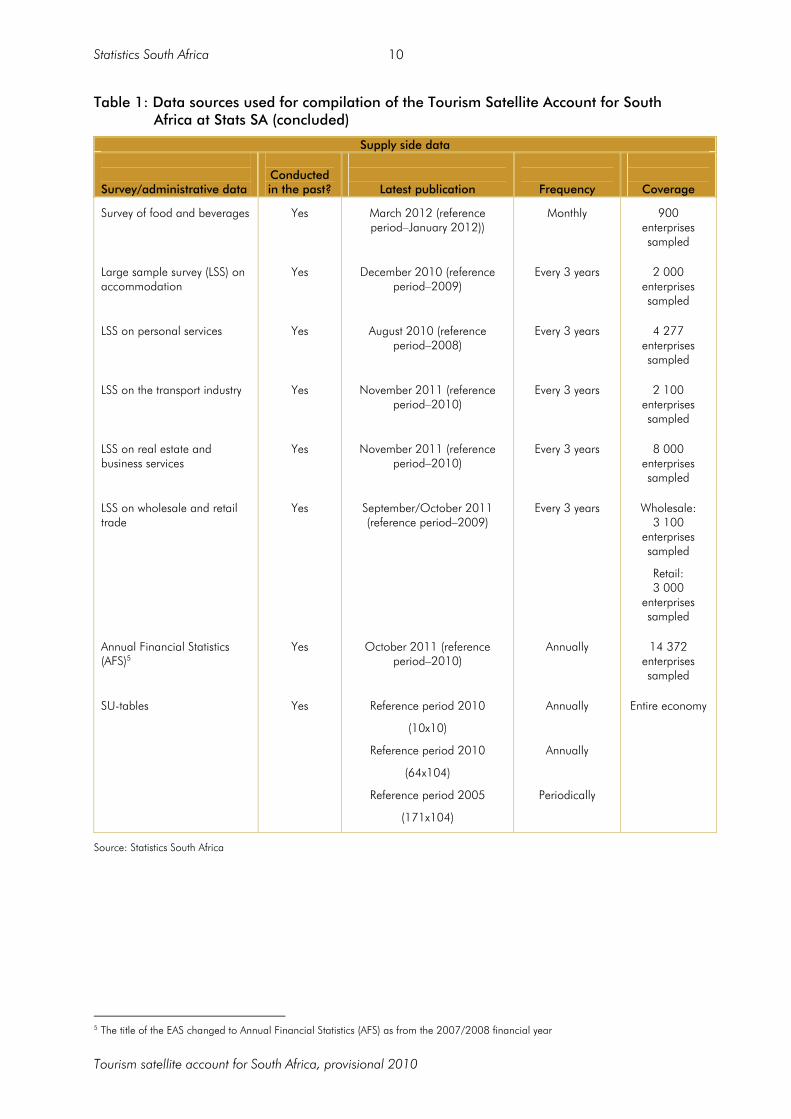
The supply and use tables (SU-tables) of the SNA are the main source of data for the compilation of Table 5 and Table 6 of the TSA (the confrontation between supply and internal tourism demand). The recommended valuation principles are the same as those of the SNA, namely that 'production' should be valuated at basic prices and 'consumption and use' at purchasers' prices3. Several main data sources were used for the compilation of the TSA for South Africa. Stats SA is the official provider of statistics used for policy-making in South Africa. These statistics are obtained from various sources – from annual household surveys to annual, quarterly or monthly industry surveys, as well as administrative data from external sources such as the South African Reserve Bank (SARB) and SAT. The current data collected on tourism are for both the supply side (from industry surveys) and demand side (from household surveys). Table 1 shows a list of the datasets that is published by Stats SA, and which was used for the compilation of the TSA for South Africa.
3 TSA: RMF

Statistics South Africa
Tourism satellite account for South Africa, provisional 2010
9
Table 1: Data sources used for compilation of the Tourism Satellite Account for South Africa at Stats SA
Demand-side data
Survey/administrative data
Conducted in
the past?
Latest publication4
Frequency
Coverage Tourism and migration Yes March 2012 (reference
period–December 2011) Monthly and
annually Movement
control system from DHA
General Household Survey (GHS) Yes March 2012 (reference period–2011)
Annually 25 653 households
Income and Expenditure Survey (IES)
Yes March 2008 (reference period–2005)
Every 5 years 30 000 households
Domestic Tourism Survey (DTS) No March 2012 (reference period–2010)
Annually 31 027 households
SU-tables Yes Reference period 2010 (10x10)
Reference period 2010 (64x104)
Reference period 2005 (171x104)
Annually
Annually
Periodically
Entire economy
Financial statistics of consolidated general government
Yes November 2011 (reference period–2009/2010)
Annually General government
Tourist accommodation survey Yes March 2012 (reference period–January 2012) Monthly
1 000 enterprises sampled
4 Correct in March 2012
Statistics South Africa
Tourism satellite account for South Africa, provisional 2010
10
Table 1: Data sources used for compilation of the Tourism Satellite Account for South Africa at Stats SA (concluded)
Supply side data
Survey/administrative data
Conducted in the past?
Latest publication
Frequency
Coverage
Survey of food and beverages Yes March 2012 (reference period–January 2012))
Monthly
900 enterprises sampled
Large sample survey (LSS) on accommodation
Yes December 2010 (reference period–2009)
Every 3 years 2 000 enterprises sampled
LSS on personal services Yes August 2010 (reference period–2008)
Every 3 years 4 277 enterprises sampled
LSS on the transport industry Yes November 2011 (reference period–2010)
Every 3 years 2 100 enterprises sampled
LSS on real estate and business services
Yes November 2011 (reference period–2010)
Every 3 years 8 000 enterprises sampled
LSS on wholesale and retail trade
Yes September/October 2011 (reference period–2009)
Every 3 years Wholesale: 3 100
enterprises sampled
Retail: 3 000
enterprises sampled
Annual Financial Statistics (AFS)5
Yes October 2011 (reference period–2010)
Annually 14 372 enterprises sampled
SU-tables Yes Reference period 2010
(10x10)
Reference period 2010
(64x104)
Reference period 2005
(171x104)
Annually
Annually
Periodically
Entire economy
Source: Statistics South Africa
5 The title of the EAS changed to Annual Financial Statistics (AFS) as from the 2007/2008 financial year

Statistics South Africa
Tourism satellite account for South Africa, provisional 2010
11
In addition to the data sources compiled by Stats SA, other data sources used include SARB Balance of Payments (BoP)6 for South Africa and the South African Tourism (SAT) domestic and departure surveys. Table 2 provides a brief description of the SAT domestic and departure surveys.
Table 2: Data sources used for compilation of the Tourism Satellite Account for South Africa at South African Tourism
Survey/administrative data Frequency Last reference year Coverage7'8
Departure survey Monthly 2011 44 400 people
Domestic survey Monthly 2011 15 600 adults
Source: SAT
2.1.1 Supply and use tables
The SU-tables are a cornerstone of the SNA. These tables have both a statistical and analytical function. The SU-tables provide a coordinating framework for checking both the accuracy and the consistency of the data contained in national accounts. One of the many other uses of the SU-tables is that these tables can be extended to satellite accounts (accounts linking the 1993 SNA with specific fields of enquiry). The intent of satellite accounts is to make apparent and to describe in more depth aspects that are hidden in the national accounts framework, or surface only in a limited number of points, e.g. tourism. Tourism as such is not an industry and cannot be classified separately. However, specific tourism transactions appear separately only in a few cases. In order to measure and describe tourism in a national accounts framework, satellite accounting must be used. The supply table shows the source or the origin of the goods and services produced within the economy for a given year in a matrix format. The supply of goods and services is measured at basic prices, which is the preferred method of valuing output in the 1993 SNA. The basic price is the amount receivable by the producer from the purchaser for a unit of a good or service produced as output minus any tax payable plus any subsidy receivable on that unit as a consequence of its production or sale. Basic prices exclude any transport charges invoiced separately by the producer. The use table displays the demand of various goods and services, which may be used as intermediate inputs (goods and services that are purchased by an industry from other industries or imported to produce its outputs) or for final consumption by households, government, etc. The SNA recommends that intermediate and final consumption expenditure be valued at purchasers' prices. The purchasers' price is the amount paid by the purchaser, excluding any deductible value added tax (VAT) or similar deductible tax, in order to take delivery of a unit of a good or service at the time and place required by the purchaser. The purchasers' price of a good includes any transport charges paid separately by the purchaser to take delivery at the required time and place.
6 Compiled quarterly with a lag of a quarter 7 Annual coverage 8 Number of individuals covered

Statistics South Africa
Tourism satellite account for South Africa, provisional 2010
12
2.1.2 South African Tourism's tourism foreign direct spend, the Balance of Payments and inbound tourism expenditure in the tourism satellite account
It is important to note that conceptual and methodological differences exist between the tourism foreign direct spend (TFDS) published by SAT, the BoP as compiled by SARB and consequently also the total inbound tourism expenditure in the TSA (Table 1 of the TSA). TFDS includes all expenditure by foreigners in South Africa. From this total, SAT excludes capital expenditure and the shopping expenditure of traders ('shuttle trade'), as this is already included elsewhere in BoP statistics. The BoP is inclusive of concepts such as 'travel' receipts and 'international transportation' receipts. 'Travel' receipts include the domestic spending of seasonal and non-resident workers. The total inbound tourism expenditure as reflected in Table 1 of the TSA therefore includes the 'travel' receipts and 'international transportation' receipts from the BoP as provided by SARB, but excludes the domestic spending of seasonal and non-resident workers.
Statistics South Africa
Tourism Satellite Account for South Africa, provisional 2010
13
Chapter 3: Tourism Satellite Account for South Africa, provisional 20109
This chapter reviews the results of the TSA for South Africa for the reference year 2010 (provisional).
3.1 Flow of expenditure through the South African economy
Tourism is a fast-growing industry which is recognised by the South African government for the role it plays in economic growth and poverty reduction. Tourism plays a significant role in influencing economies' 'generation of value added, employment, personal income and government income'10. Tourism is also one of the two sectors which were identified as special priority in the Accelerated and Shared Growth Initiative for South Africa (AsgiSA). The importance of tourism to both developing and developed nations has created a need to measure its economic and social impact.
3.2 Tourism expenditure
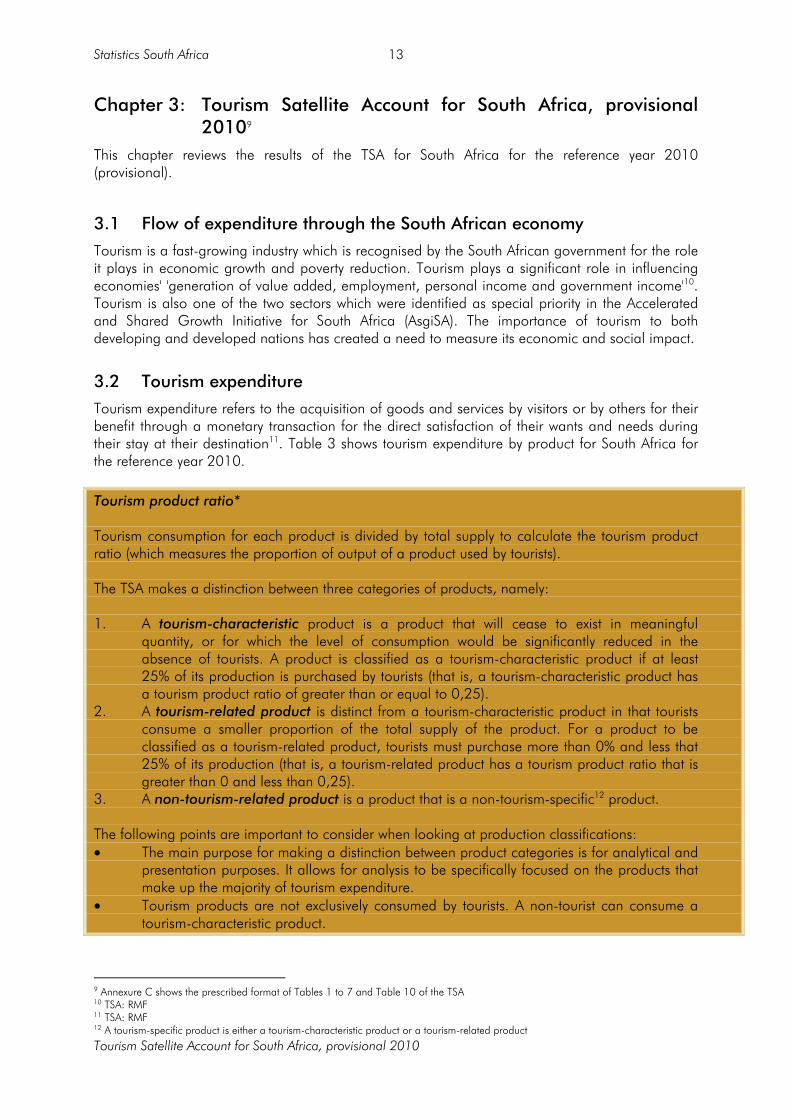
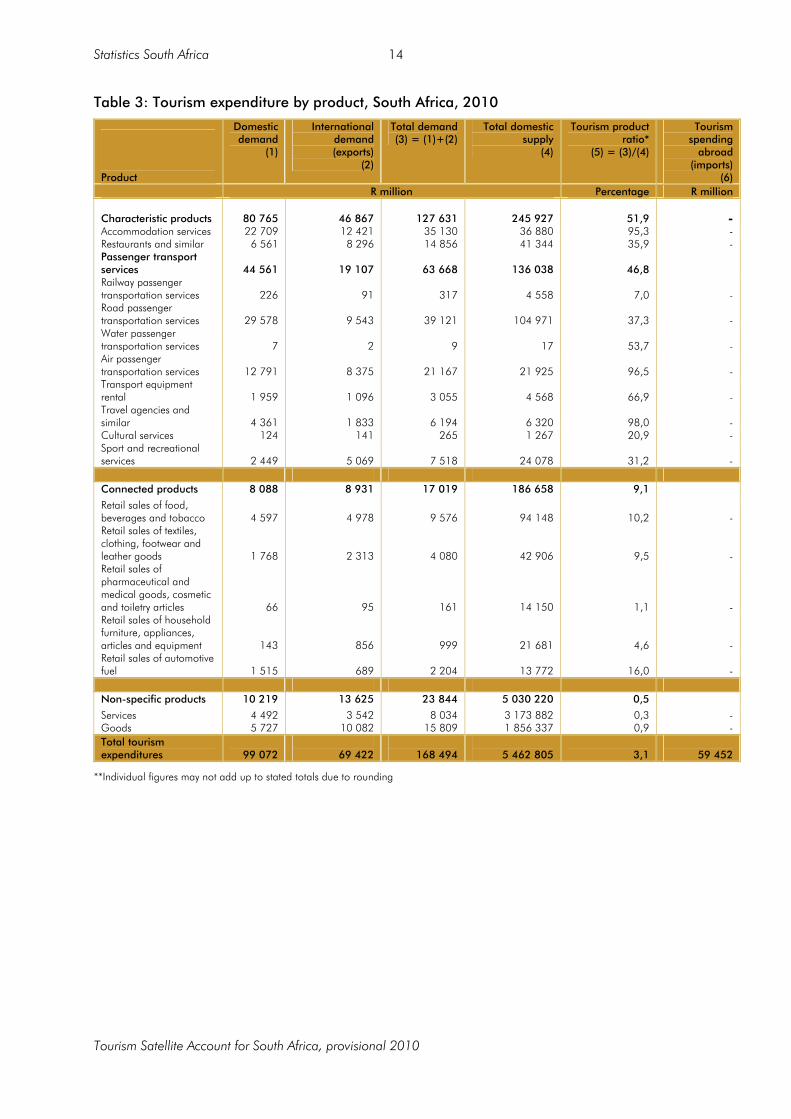
Tourism expenditure refers to the acquisition of goods and services by visitors or by others for their benefit through a monetary transaction for the direct satisfaction of their wants and needs during their stay at their destination11. Table 3 shows tourism expenditure by product for South Africa for the reference year 2010.
Tourism product ratio* Tourism consumption for each product is divided by total supply to calculate the tourism product ratio (which measures the proportion of output of a product used by tourists). The TSA makes a distinction between three categories of products, namely: 1. A tourism-characteristic product is a product that will cease to exist in meaningful
quantity, or for which the level of consumption would be significantly reduced in the absence of tourists. A product is classified as a tourism-characteristic product if at least 25% of its production is purchased by tourists (that is, a tourism-characteristic product has a tourism product ratio of greater than or equal to 0,25).
2. A tourism-related product is distinct from a tourism-characteristic product in that tourists consume a smaller proportion of the total supply of the product. For a product to be classified as a tourism-related product, tourists must purchase more than 0% and less that 25% of its production (that is, a tourism-related product has a tourism product ratio that is greater than 0 and less than 0,25).
3. A non-tourism-related product is a product that is a non-tourism-specific12 product. The following points are important to consider when looking at production classifications: • The main purpose for making a distinction between product categories is for analytical and
presentation purposes. It allows for analysis to be specifically focused on the products that make up the majority of tourism expenditure.
• Tourism products are not exclusively consumed by tourists. A non-tourist can consume a tourism-characteristic product.
9 Annexure C shows the prescribed format of Tables 1 to 7 and Table 10 of the TSA 10 TSA: RMF 11 TSA: RMF 12 A tourism-specific product is either a tourism-characteristic product or a tourism-related product
Statistics South Africa
Tourism Satellite Account for South Africa, provisional 2010
14
Table 3: Tourism expenditure by product, South Africa, 2010
Product
Domestic demand
(1)
International demand (exports)
(2)
Total demand (3) = (1)+(2)
Total domestic supply
(4)
Tourism product ratio*
(5) = (3)/(4)
Tourism spending
abroad (imports)
(6) R million Percentage R million
Characteristic products
80 765
46 867
127 631
245 927
51,9
-
Accommodation services 22 709 12 421 35 130 36 880 95,3 - Restaurants and similar 6 561 8 296 14 856 41 344 35,9 - Passenger transport services
44 561
19 107
63 668
136 038
46,8
Railway passenger transportation services
226
91
317
4 558
7,0
-
Road passenger transportation services
29 578
9 543
39 121
104 971
37,3
-
Water passenger transportation services
7
2
9
17
53,7
-
Air passenger transportation services
12 791
8 375
21 167
21 925
96,5
-
Transport equipment rental
1 959
1 096
3 055
4 568
66,9
-
Travel agencies and similar
4 361
1 833
6 194
6 320
98,0
-
Cultural services 124 141 265 1 267 20,9 - Sport and recreational services 2 449 5 069 7 518 24 078 31,2 - Connected products 8 088 8 931 17 019 186 658 9,1
Retail sales of food, beverages and tobacco
4 597
4 978
9 576
94 148
10,2
-
Retail sales of textiles, clothing, footwear and leather goods
1 768
2 313
4 080
42 906
9,5
- Retail sales of pharmaceutical and medical goods, cosmetic and toiletry articles
66
95
161
14 150
1,1
- Retail sales of household furniture, appliances, articles and equipment
143
856
999
21 681
4,6
- Retail sales of automotive fuel
1 515
689
2 204
13 772
16,0
-
Non-specific products 10 219 13 625 23 844 5 030 220 0,5
Services 4 492 3 542 8 034 3 173 882 0,3 - Goods 5 727 10 082 15 809 1 856 337 0,9 - Total tourism expenditures
99 072
69 422
168 494
5 462 805
3,1
59 452
**Individual figures may not add up to stated totals due to rounding

Statistics South Africa
Tourism Satellite Account for South Africa, provisional 2010
15
3.2.1 Inbound tourism expenditure
Table 4 and Table 5 show inbound tourism expenditure by type of product (R million and percentage contribution). The year 2010 saw 11 303 087 foreign visitors to South Africa compared with 9 531 615 foreign visitors and 9 407 314 foreign visitors in 2009 and 2008 respectively. Inbound tourism expenditure totalling R69 422 million was recorded in 2010. The main expenditure items were 'non-specific products' (19,6%), 'accommodation for visitors' (17,9%), ‘road passenger transport services’ (13,7%) and 'tourism connected products' (12,9%). Inbound tourism expenditure totalling R67 141 million was recorded in 2009. The main expenditure items were 'non-specific products' (26,4%), 'accommodation for visitors' (15,7%), 'road passenger transport services' (13,1%) and 'connected products' (12,7%). Table 4: Inbound tourism expenditure by type of product, 2010 (R million)
Tourism product 2010Accommodation for visitors 12 421Restaurants and similar services 8 296Railway passenger transport services 91Road passenger transport services 9 543Water passenger transport services 2Air passenger transport services 8 375Transport equipment rental 1 096Travel agencies and other reservation services 1 833Cultural services 141Sport and recreational services 5 069Tourism-connected products 8 931Non-specific products 13 625Total 69 422
**Individual figures may not add up to stated totals due to rounding
Table 5: Inbound tourism expenditure by type of product, 2010 (%)
Tourism product 2010Accommodation for visitors 17,9Restaurants and similar services 11,9Railway passenger transport services 0,1Road passenger transport services 13,7Water passenger transport services 0,0Air passenger transport services 12,1Transport equipment rental 1,6Travel agencies and other reservation services 2,6Cultural services 0,2Sport and recreational services 7,3Tourism-connected products 12,9Non-specific products 19,6Total 100,0
**Individual figures may not add up to stated totals due to rounding

Statistics South Africa
Tourism Satellite Account for South Africa, provisional 2010
16
Figure 3: Inbound tourism expenditure by type of product, 2010 (%)
0,0
5,0
10,0
15,0
20,0
25,0
products
%
2010p 17,9 11,9 0,1 13,7 0,0 12,1 1,6 2,6 0,2 7,3 12,9 19,6
Accomodation for visitors
Restaurants and similar services
Railway passenger
transport services
Road passenger transport services
Water passenger transport services
Air passenger transport services
Transport equipment rental
Travel agencies and similar
servicesCultural services
Sport and recreational
services
Tourism connected products
Non-specific products
Source: Statistics South Africa
Statistics South Africa
Tourism Satellite Account for South Africa, provisional 2010
17
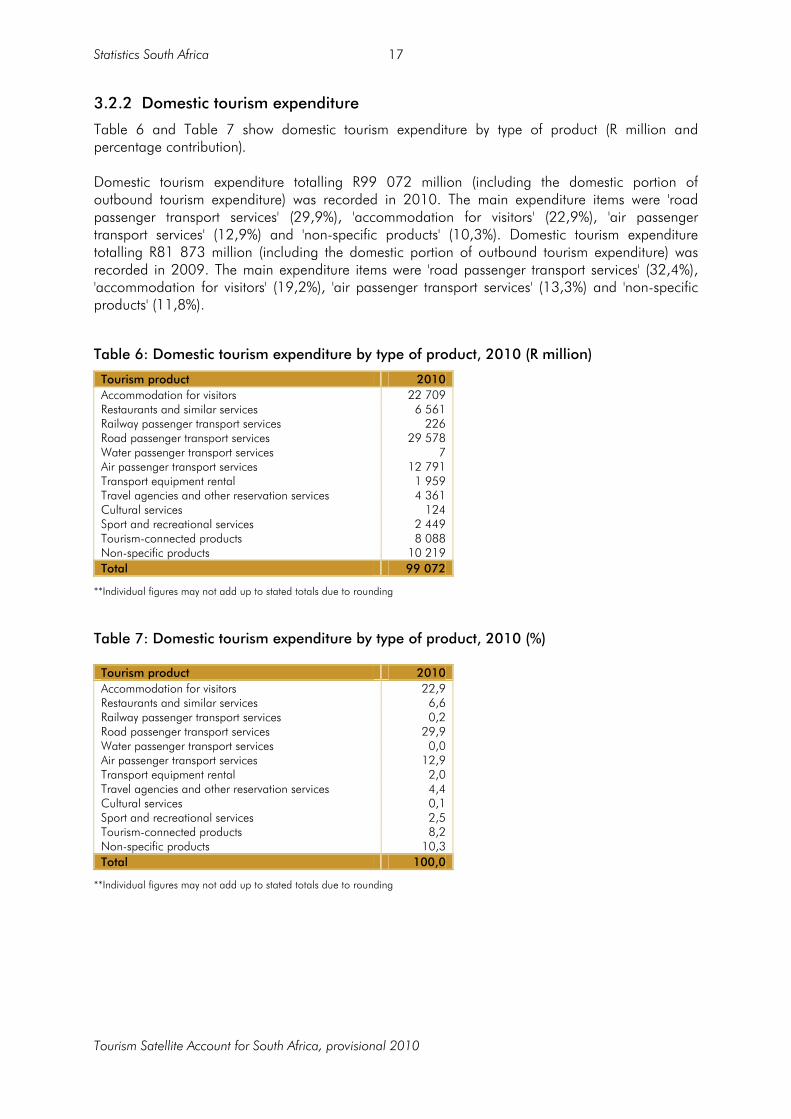
3.2.2 Domestic tourism expenditure
Table 6 and Table 7 show domestic tourism expenditure by type of product (R million and percentage contribution). Domestic tourism expenditure totalling R99 072 million (including the domestic portion of outbound tourism expenditure) was recorded in 2010. The main expenditure items were 'road passenger transport services' (29,9%), 'accommodation for visitors' (22,9%), 'air passenger transport services' (12,9%) and 'non-specific products' (10,3%). Domestic tourism expenditure totalling R81 873 million (including the domestic portion of outbound tourism expenditure) was recorded in 2009. The main expenditure items were 'road passenger transport services' (32,4%), 'accommodation for visitors' (19,2%), 'air passenger transport services' (13,3%) and 'non-specific products' (11,8%).
Table 6: Domestic tourism expenditure by type of product, 2010 (R million)
Tourism product 2010Accommodation for visitors 22 709Restaurants and similar services 6 561Railway passenger transport services 226Road passenger transport services 29 578Water passenger transport services 7Air passenger transport services 12 791Transport equipment rental 1 959Travel agencies and other reservation services 4 361Cultural services 124Sport and recreational services 2 449Tourism-connected products 8 088Non-specific products 10 219Total 99 072
**Individual figures may not add up to stated totals due to rounding
Table 7: Domestic tourism expenditure by type of product, 2010 (%)
Tourism product 2010Accommodation for visitors 22,9Restaurants and similar services 6,6Railway passenger transport services 0,2Road passenger transport services 29,9Water passenger transport services 0,0Air passenger transport services 12,9Transport equipment rental 2,0Travel agencies and other reservation services 4,4Cultural services 0,1Sport and recreational services 2,5Tourism-connected products 8,2Non-specific products 10,3Total 100,0
**Individual figures may not add up to stated totals due to rounding

Statistics South Africa
Tourism Satellite Account for South Africa, provisional 2010
18
Figure 4: Domestic tourism expenditure by type of product, 2010 (%)
0,0
5,0
10,0
15,0
20,0
25,0
30,0
35,0
products
%
2010p 22,9 6,6 0,2 29,9 0,0 12,9 2,0 4,4 0,1 2,5 8,2 10,3
Accomodation for visitors
Restaurants and similar services
Railway passenger transport
Road passenger transport services
Water passenger transport services
Air passenger transport services
Transport equipment rental
Travel agencies and similar
servicesCultural services
Sport and recreational
services
Tourism connected products
Non-specific products
Source: Statistics South Africa
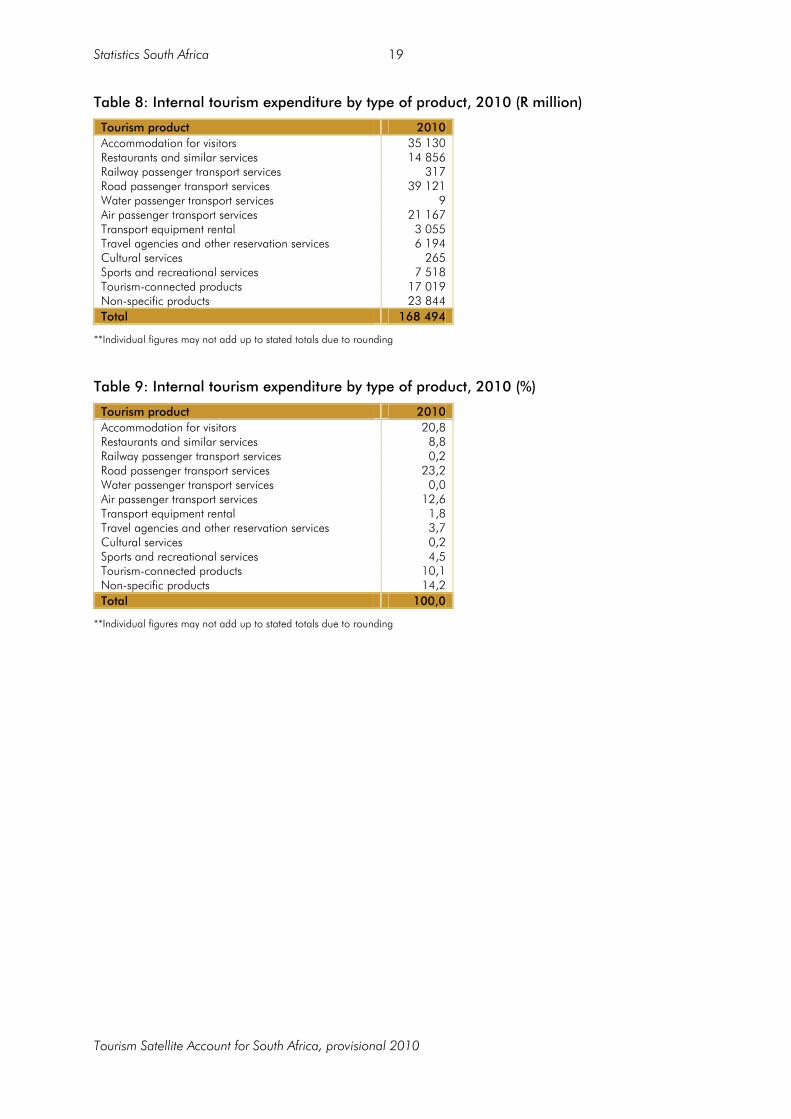
3.2.3. Internal tourism expenditure
Table 8 and Table 9 show internal tourism expenditure by type of product (goods and services). The total internal tourism consumption in cash for South Africa in 2010 was R168 494 million (inbound tourism consumption R69 422 million (41,2%) and domestic tourism consumption R99 072 million (58,8%)). The main expenditure items for internal tourism were 'road passenger transport services' (23,2%), 'accommodation for visitors' (20,8%), 'non-specific products' (14,2%) and 'tourism connected products' (10,1%). The total internal tourism consumption in cash for South Africa in 2009 was R149 014 million (inbound tourism consumption R67 141 million (45,1%) and domestic tourism consumption R81 873 million (54,9%)). The main expenditure items for internal tourism were 'road passenger transport services' (23,7%), 'non-specific products' (18,4%), 'accommodation for visitors' (17,6%) and 'tourism connected products' (10,8%).
Statistics South Africa
Tourism Satellite Account for South Africa, provisional 2010
19
Table 8: Internal tourism expenditure by type of product, 2010 (R million)
Tourism product 2010Accommodation for visitors 35 130Restaurants and similar services 14 856Railway passenger transport services 317Road passenger transport services 39 121Water passenger transport services 9Air passenger transport services 21 167Transport equipment rental 3 055Travel agencies and other reservation services 6 194Cultural services 265Sports and recreational services 7 518Tourism-connected products 17 019Non-specific products 23 844Total 168 494
**Individual figures may not add up to stated totals due to rounding
Table 9: Internal tourism expenditure by type of product, 2010 (%)
Tourism product 2010Accommodation for visitors 20,8Restaurants and similar services 8,8Railway passenger transport services 0,2Road passenger transport services 23,2Water passenger transport services 0,0Air passenger transport services 12,6Transport equipment rental 1,8Travel agencies and other reservation services 3,7Cultural services 0,2Sports and recreational services 4,5Tourism-connected products 10,1Non-specific products 14,2Total 100,0
**Individual figures may not add up to stated totals due to rounding

Statistics South Africa
Tourism Satellite Account for South Africa, provisional 2010
20
Figure 5: Internal tourism expenditure by type of product, 2010 (%)
0,0
5,0
10,0
15,0
20,0
25,0
products
%
2010p 20,8 8,8 0,2 23,2 0,0 12,6 1,8 3,7 0,2 4,5 10,1 14,2
Accomodation for visitors
Restaurants and similar services
Railway passenger transport services
Road passenger transport services
Water passenger transport services
Air passenger transport services
Transport equipment rental
Travel agencies and similar
servicesCultural services
Sport and recreational
services
Tourism connected products
Non-specific products
Source: Statistics South Africa

Statistics South Africa
Tourism Satellite Account for South Africa, provisional 2010
21
3.3 Production accounts Table 5 of the TSA focuses on the production accounts of tourism industries and other industries (at basic prices). It conforms formally to the format established by the 1993 SNA, but the perspective is different from that of the 1993 SNA production accounts (a tool for tourism analysis). Because of the application of the principle of recording reservation services separately, output and intermediate consumption of each industry and the corresponding total for the economy that appears in the last column do not correspond necessarily to the corresponding values found in the national accounts of the country13. For each industry and for the total economy, gross value added (GVA) at basic prices has to equal the GVA of the economy as it appears in the national accounts14. Table 10 shows the production accounts for the tourism industries and other for 2010. The gross direct value added of the tourism industries (GDVATI) is the major economic aggregate derived in the production accounts of the tourism industries and other industries (Table 5 of the TSA). The GDVATI for South Africa amounted to R142 443 (or 5,9% of total GVA generated) in 2010.
Table 10: Production accounts of the tourism industries and other industries (at basic prices), 2010 (R million)
Product
Tourism-characteristic
industries
Tourism-related
industries
Other non-tourism
industries
Total output of domestic producers (at basic
prices) A. Specific products 232 620 70 317 129 649 432 585 A.1 Characteristic products 232 620 13 308 245 927 1. Accommodation services 36 880 36 880 1.1 Hotel and other accommodation for visitors other than 1.2 36 880 36 880 1.2 Accommodation services associated with all types of vacation home ownership - - 2. Restaurants and similar services 31 490 9 854 41 344 3. Passenger transport services 132 584 3 454 136 038 3.1 Railway passenger transport services 4 558 4 558 3.2 Road passenger transport services 101 517 3 454 104 971 3.3 Water passenger transport services 17 17 3.4 Air passenger transport services 21 925 21 925 3.5 Passenger transport equipment rental 4 568 4 568 4. Travel agencies and other reservation services 6 320 6 320 5. Cultural industry 1 267 1 267 6. Sport and recreational industry 24 078 24 078 A.2 Connected products 70 317 116 341 186 658 Retail sales of food, beverages and tobacco 27 110 67 038 94 148 Retail sales of textiles, clothing, footwear and leather products
10 727
32 180
42 906
Retail sales of pharmaceutical and medical goods, cosmetic and toiletry articles
9 732
4 418
14 150
Retail sales of household furniture, appliances, articles and equipment
14 372
7 309
21 681
Retail sales of automotive fuel 8 376 5 396 13 772 B. Non-specific products 3 101 6 646 5 020 473 5 030 220 Services 1 597 6 646 3 165 639 3 173 882 Goods 1 503 1 854 834 1 856 337 Total output (at basic prices) 235 720 76 963 5 150 122 5 462 805 Total intermediate consumption (at purchasers' price) 131 427 38 813 2 880 073 3 050 314 Total gross value added (at basic prices) 104 293 38 150 2 270 049 2 412 491 Compensation of employees 30 773 24 007 1 147 212 1 201 992 Taxes less subsidies on production 798 825 36 112 37 735 Gross operating surplus 72 723 13 318 1 086 723 1 172 764
**Individual figures may not add up to stated totals due to rounding
13 TSA: RMF 14 Adjustments due to the application of the principle of recording reservation services separately have no effect on the VA of any of the
industries
Statistics South Africa
Tourism Satellite Account for South Africa, provisional 2010
22
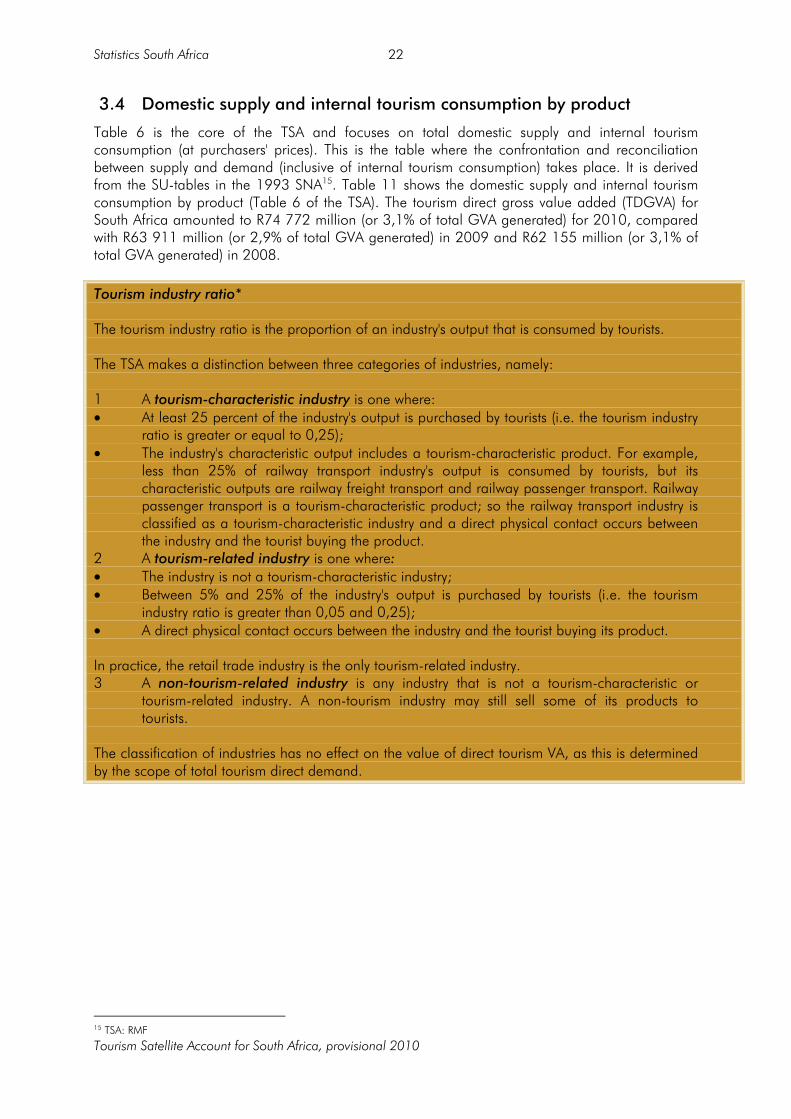
3.4 Domestic supply and internal tourism consumption by product
Table 6 is the core of the TSA and focuses on total domestic supply and internal tourism consumption (at purchasers' prices). This is the table where the confrontation and reconciliation between supply and demand (inclusive of internal tourism consumption) takes place. It is derived from the SU-tables in the 1993 SNA15. Table 11 shows the domestic supply and internal tourism consumption by product (Table 6 of the TSA). The tourism direct gross value added (TDGVA) for South Africa amounted to R74 772 million (or 3,1% of total GVA generated) for 2010, compared with R63 911 million (or 2,9% of total GVA generated) in 2009 and R62 155 million (or 3,1% of total GVA generated) in 2008. Tourism industry ratio* The tourism industry ratio is the proportion of an industry's output that is consumed by tourists. The TSA makes a distinction between three categories of industries, namely: 1 A tourism-characteristic industry is one where: • At least 25 percent of the industry's output is purchased by tourists (i.e. the tourism industry
ratio is greater or equal to 0,25); • The industry's characteristic output includes a tourism-characteristic product. For example,
less than 25% of railway transport industry's output is consumed by tourists, but its characteristic outputs are railway freight transport and railway passenger transport. Railway passenger transport is a tourism-characteristic product; so the railway transport industry is classified as a tourism-characteristic industry and a direct physical contact occurs between the industry and the tourist buying the product.
2 A tourism-related industry is one where: • The industry is not a tourism-characteristic industry; • Between 5% and 25% of the industry's output is purchased by tourists (i.e. the tourism
industry ratio is greater than 0,05 and 0,25); • A direct physical contact occurs between the industry and the tourist buying its product. In practice, the retail trade industry is the only tourism-related industry. 3 A non-tourism-related industry is any industry that is not a tourism-characteristic or
tourism-related industry. A non-tourism industry may still sell some of its products to tourists.
The classification of industries has no effect on the value of direct tourism VA, as this is determined by the scope of total tourism direct demand.
15 TSA: RMF

Statistics South Africa
Tourism Satellite Account for South Africa, provisional 2010
23
Table 11: Domestic supply and internal tourism consumption by product, 2010 (R million)
Tourism-characteristic industries
Tourism-connected
industry
Product
Accom-moda- tion for visitors
Food and beverage
serving industry
Passenger transport industry
Transport equipment
rental
Travel agencies and other
reservation services industry
Cultural and sport and
recreational industry
Total tourism-characteristic
industries
Trade of tourism-
connected goods
Other industries
Total output of domestic
producers at basic prices
Taxes less subsidies
A. Specific products 40 172 6 273 59 327 3 055 6 194 7 783 122 803 5 890 15 957 144 651 A.1 Characteristic products 40 172 6 273 59 327 3 055 6 194 7 783 122 803 4 828 127 631 1. Accommodation services 35 130 35 130 35 130 1.1 Hotel and other accommodation for visitors other than 1.2
35 130
35 130
35 130
1.2 Accommodation services associated with all types of vacation home ownership
2. Restaurants and similar services 5 042 6 273 11 316 3 541 14 856 3. Passenger transport services 59 327 3 055 62 381 1 287 63 668 3.1 Railway passenger transport services 317 317 317 3.2 Road passenger transport services 37 834 37 834 1 287 39 121 3.3 Water passenger transport services 9 9 9 3.4 Air passenger transport services 21 167 21 167 21 167 3.5 Passenger transport equipment rental 3 055 3 055 3 055 4. Travel agencies and other reservation services
6 194
6 194
6 194
5. Cultural industry 265 265 265 6. Sports and recreational industry 7 518 7 518 7 518 A.2 Connected products 5 890 11 129 17 019 Retail sales of food, beverages and tobacco
2 757
6 818
9 576
Retail sales of textiles, clothing, footwear and leather products
1 020
3 060
4 080
Retail sales of pharmaceutical and medical goods, cosmetic and toiletry articles
111
50
161
Retail sales of household furniture, appliances, articles and equipment
662
337
999
Retail sales of automotive fuel 1 340 863 2 204 B. Non-specific products 1 1 14 1 18 17 23 810 23 845 Services 1 1 1 1 5 17 8 014 8 035 Goods 13 13 15 797 15 809 Total output (at basic prices) 40 173 6 274 59 341 3 056 6 195 7 783 122 821 5 907 39 767 168 494 5 477 Total intermediate consumption (at purchasers' price)
18 684
3 722
35 252
1 739
3 408
5 699
68 506
2 979
22 239
93 724
Total gross value added (at basic prices) 21 489 2 552 24 086 1 317 2 786 2 084 54 315 2 928 17 528 74 772
**Individual figures may not add up to stated totals due to rounding

Statistics South Africa
Tourism Satellite Account for South Africa, provisional 2010
24
Table 12: Derivation of tourism industry ratios, 2010
Tourism-characteristic industries Tourism-related
industries
Product
Accom- modation
for visitors
Food and beverage
serving industry
Railway passenger transport
Road passenger transport
Water passenger transport
Air passenger transport
Transport equipment
rental
Travel agencies and other
reservation services industry
Cultural industry
Sport and recreational
industry
Retail trade of tourism-
connected goods
A. Specific products 40 172 6 273 317 37 834 9 21 167 3 055 6 194 265 7 518 5 890 A.1 Characteristic products 40 172 6 273 317 37 834 9 21 167 3 055 6 194 265 7 518 1. Accommodation services 35 130 1.1 Hotel and other accommodation for visitors other than 1.2
35 130
1.2 Accommodation services associated with all types of vacation home ownership
2. Restaurants and similar services 5 042 6 273 3. Passenger transport services 317 37 834 9 21 167 3 055 3.1 Railway passenger transport services 317 3.2 Road passenger transport services 37 834 3.3 Water passenger transport services 9 3.4 Air passenger transport services 21 167 3.5 Passenger transport equipment rental 3 055 4. Travel agencies and other reservation services
6 194
5. Cultural industry 265 6. Sports and recreational industry 7 518 A.2 Connected products 5 890 Retail sales of food, beverages and tobacco 2 757 Retail sales of textiles, clothing, footwear and leather products
1 020
Retail sales of pharmaceutical and medical goods, cosmetic and toiletry articles
111
Retail sales of household furniture, appliances, articles and equipment
662
Retail sales of automotive fuel 1 340 B. Non-specific products 1 1 12 2 17 Services 1 1 0 1 17 Goods 12 1 Total purchased by tourists 40 173 6 274 317 37 846 9 21 169 3 055 6 194 265 7 518 5 907 Total industry output 51 250 17 870 4 558 103 031 17 22 431 4 754 6 321 1 274 24 214 76 963 Tourism industry ratio 0,78 0,35 0,07 0,37 0,53 0,94 0,64 0,98 0,21 0,31 0,08
**Individual figures may not add up to stated totals due to rounding

Statistics South Africa
Tourism Satellite Account for South Africa, provisional 2010
25
Tourism direct gross value added and tourism direct gross domestic product
Table 616 of the TSA presents the reconciliation between internal tourism consumption and domestic supply and it is from this table that TDGVA and tourism direct gross domestic product (TDGDP) can be derived. Part of the aggregate TDGVA can be generated by tourism industries and part of it can also be generated by other industries. Not all GVATI is part of the TDGVA, since these industries may also serve non-visitors in the same way the non-tourism industries may serve visitors, and thus generate part of TDGVA17. The estimates of TDGVA and TDGDP rely on a number of assumptions and implicit modelling procedures, and thus special care must be taken when using or interpreting these aggregates18. Figure 9 explains schematically the link between GVATI and TDGVA. Figure 6: Link between gross direct value added of the tourism industries and tourism
direct gross value added
Table 13 shows the calculation of TDGVA and TDGDP for South Africa for 2010. TDGDP was R80 249 million (or 3,0% of total gross domestic product) for 2010, R68 831 million (or 2,9% of total gross domestic product ) for 2009, R67 199 million (or 3,0% of total gross domestic product) for 2008 and R59 781 million (or 3,0% of total gross domestic product ) for 2007.
16 This table is the core of the TSA 17 TSA: RMF 18 TSA: RMF

Statistics South Africa
Tourism Satellite Account for South Africa, provisional 2010
26
Table 13: Tourism direct gross value added and tourism direct gross domestic product, 2010
2010Total supply of goods and services 6 444 743Less imports of goods and services 732 994Less net taxes (taxes less subsidies) on products 248 944Equals total domestic supply of goods and services (output)
5 462 805
Less intermediate consumption 3 050 314Gross value added of the economy 2 412 491Total tourism output 168 494Less total tourism intermediate consumption 93 724Equals tourism direct gross value added (TDGVA)
74 772
TDGVA (%) 3,1Tourism direct gross value added 74 772Plus tourism share of net taxes on products 5 477Equals tourism direct gross domestic product (TDGDP)
80 249
TDGDP19 (%) 3,0
Table 14 and Table 15 show TDGVA for 2010 (R million and percentage contribution).
Table 14: Tourism direct gross value added, 2010 (R million)
Tourism product 2006Accommodation for visitors 21 489Food and beverages serving industry 2 552Railway passenger transport 192Road passenger transport 17 923Water passenger transport 3Air passenger transport 5 968Transport equipment rental 1 317Travel agencies and other reservation services industry 2 786Cultural industry 71Sport and recreational industry 2 013Retail trade of tourism-connected goods 2 928Other non-tourism industries 17 528Total 74 772
**Individual figures may not add up to stated totals due to rounding
19 Gross domestic product is equal to gross value added plus next taxes on products
Statistics South Africa
Tourism Satellite Account for South Africa, provisional 2010
27
Table 15: Tourism direct gross value added, 2010 (%)
Tourism product 2006Accommodation for visitors 28,7Food and beverages serving industry 3,4Railway passenger transport 0,3Road passenger transport 24,0Water passenger transport 0,0Air passenger transport 8,0Transport equipment rental 1,8Travel agencies and other reservation services industry 3,7Cultural industry 0,1Sport and recreational industry 2,7Retail trade of tourism-connected goods 3,9Other non-tourism industries 23,4Total 100,0
**Individual figures may not add up to stated totals due to rounding
Figure 7: Tourism direct gross value added, 2010 (%)
0,0
5,0
10,0
15,0
20,0
25,0
30,0
35,0
industry
%
2010p 28,7 3,4 0,3 24,0 0,0 8,0 1,8 3,7 0,1 2,7 3,9 23,4
Accomodation for visitors
Food and beverages
serving industry
Railway passenger transport
Road passenger transport
Water passenger transport
Air passenger transport
Transport equipment rental
Travel agencies and other reservation
Cultural industrySports and recreational
industry
Retail trade of tourism
connected goods
Other non-tourism industries
Source: Statistics South Africa

Statistics South Africa
Tourism Satellite Account for South Africa, provisional 2010
28
3.5 Employment in the tourism industries
Tourism employment is a measure of the number of jobs in tourism and non-tourism industries. Tourism employment is the employment strictly related to the goods and services (tourism-connected and non-tourism-connected) acquired by visitors and produced either by tourism industries or other industries that cannot be directly observed20. South Africa does not have a direct measure of tourism employment. Therefore, employment in the tourism industries includes employment that is directly and/or indirectly related to the goods and services acquired by tourists and non-tourists. Table 16 shows employment in the tourism industries by population group for 2010. There were 567 378 persons (or 4,3 % of total employment) directly engaged in producing goods and services purchased by tourists in 2010.
Tourism industry ratios have been used to allocate employment numbers (by industry) to tourism21.
Cautionary note on employment in the tourism industries Revision of the old Labour Force Survey The first Labour Force Survey (LFS) was conducted in 2000 and since then it was undertaken on a six-monthly basis in March and September each year. Starting in 2005, Stats SA undertook a major revision of the LFS. This revision resulted in changes to the survey methodology, the survey questionnaire, the frequency of data collection and data releases and processing systems. The redesigned labour force survey is the Quarterly Labour Force Survey (QLFS) which is now the principal vehicle for collecting labour market information on a quarterly basis. The QLFS was first released in 2008. To allow for historical comparability of the old series (LFS) with the new QLFS, the old series was revised. Revising historical LFS means that the revised data for example September 2002, represent Stats SA's best estimate of what QLFS would have shown, had it been conducted in the third quarter of 2002. The revision was based on link factors computed on the basis of two overlap surveys which were conducted between the old LFS and the new QLFS. The first overlap was between LFS March 2008 and QLFS January–March 2008. The second overlap was between LFS September 2008 and QLFS July–September 2008. It should be noted that for the revised estimates, the cut-off age for inclusion in the working age population is now set at 15–64 years to improve international comparability.
20 TSA: RMF 21 This treatment assumes that, for each industry, a given rand value of output will require a fixed quantity of labour input, regardless of
whether the products are purchased by tourists or non-tourists

Statistics South Africa
Tourism Satellite Account for South Africa, provisional 2010
29
Table 16: Number of persons employment in the tourism industries by population group, 2010
Population group
Accommo- dation for
visitors
Food and beverage
serving industry
Railway passenger transport
Road passenger transport
Water passenger transport
Air passenger transport
Transport equipment
rental
Travel agencies
and other reservation
services industry
Cultural industry
Sport and recreational industry
Retail trade (of tourism-
connected goods) Total
Total employment Black African 99 038 236 090 28 949 368 805 166 9 972 6 607 11 804 34 742 28 429 796 975 1 621 578 Coloured 15 459 33 371 6 686 35 602 382 1 780 1 532 2 330 8 466 8 345 155 787 269 740 Indian/Asian 2 962 6 997 454 15 596 1 839 656 1 953 2 322 2 698 2 277 87 988 125 743 White 26 129 32 041 8 925 44 173 1 022 9 052 1 319 6 192 25 426 10 725 144 458 309 463 Total 143 588 308 500 45 014 464 177 3 408 21461 11 411 22 648 71 333 49 776 1 185 208 2 326 524 Tourism industry ratio 0,78 0,35 0,07 0,37 0,53 0,94 0,64 0,98 0,21 0,31 0,08 Tourism employment Black African 77 631 82 893 2 013 135 470 89 9 411 4 246 11 566 7 229 8 827 61 171 400 548 Coloured 12 117 11 717 465 13 078 205 1 680 984 2 283 1 762 2 591 11 957 58 839 Indian/Asian 2 322 2 457 32 5 729 987 619 1 255 2 275 561 707 6 753 23 698 White 20 482 11 250 621 16 226 549 8 543 847 6 067 5 291 3 330 11 088 84 293 Total 112 553 108 317 3 130 170 503 1 830 20 253 7 333 22 192 14 843 15 455 90 970 567 378
**Individual figures may not add up to stated totals due to rounding Source: Statistics South Africa, Quarterly Labour Force Survey, 2010
Statistics South Africa
Tourism Satellite Account for South Africa, provisional 2010
30
Chapter 4: The future development of TSA for South Africa
In accordance with the recommendations set out by the 2008 TSA: RMF, the South African TSA for 2010 focused on the compilation of Tables 1–7 and Table 10. A number of future developments are being considered. These are articulated below: • Separate the same-day visitors consumption expenditure from the tourists (overnight visitors)
for consumption expenditure for inbound and domestic tourism; • Investigate the possibility of compiling Table 3 of the TSA (outbound tourism). Currently, the
main constraint with the compilation of Table 3 for South Africa is the availability of data; • Further research the treatment of the service charges paid to travel agents, tour operators
and other reservation services; • Research the treatment of housing services provided by second homes on own account or for
free. This imputed rent should be included in the TSA for the calculation of GDVATI, TDGVA and TDGDP. The current constraint is the availability of data and the appropriate instrument to collect the data;
• Measure the fulltime employees (FTE) who are directly engaged in producing goods and services purchased by tourists in South African economy; and
• Investigate the possibility of collecting data on tourism single-purpose consumer durables as a long-term goal by SAT.
The next TSA report for South Africa will be the final results for 2008 and 2009, and the provisional results for 2010 and 2011. This report is scheduled to be published on 29 March 2013. To ensure that future TSAs in South Africa are responsive to user needs and provide an accurate reflection of the tourism industry, as well as its role in the economy, all stakeholders are invited to send comments to: [email protected] .
Statistics South Africa
Tourism Satellite Account for South Africa, provisional 2010
31
Annexures
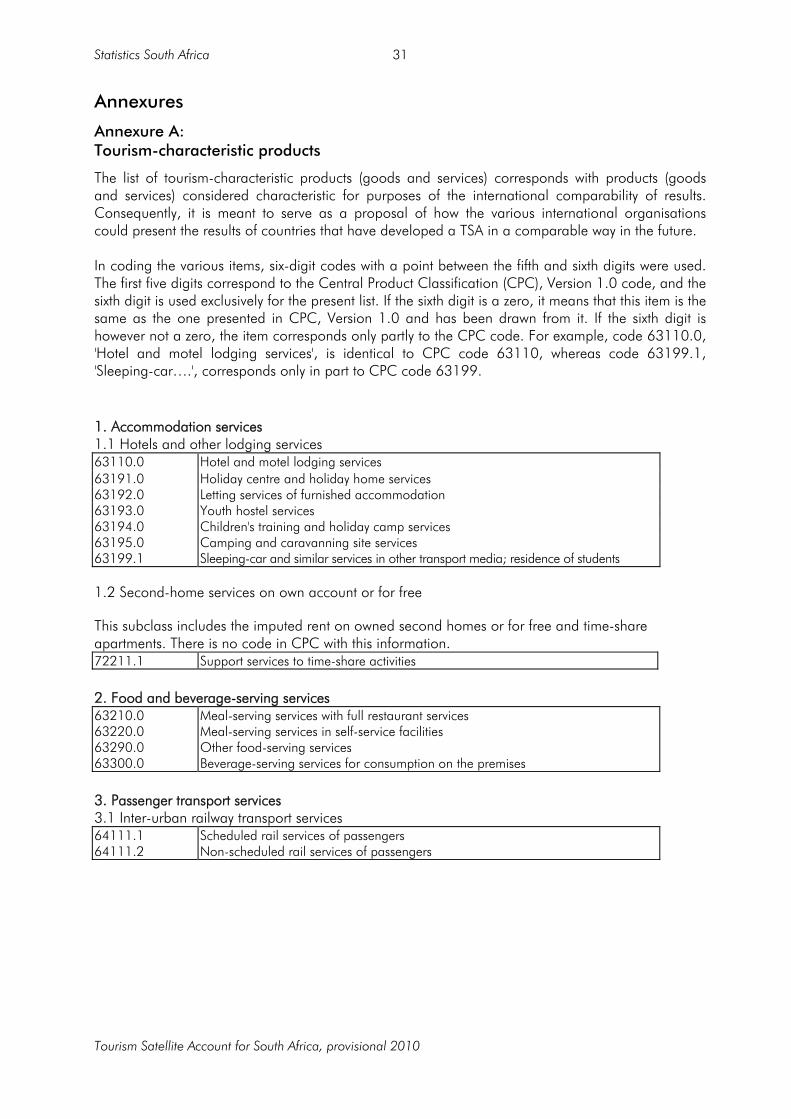
Annexure A: Tourism-characteristic products
The list of tourism-characteristic products (goods and services) corresponds with products (goods and services) considered characteristic for purposes of the international comparability of results. Consequently, it is meant to serve as a proposal of how the various international organisations could present the results of countries that have developed a TSA in a comparable way in the future. In coding the various items, six-digit codes with a point between the fifth and sixth digits were used. The first five digits correspond to the Central Product Classification (CPC), Version 1.0 code, and the sixth digit is used exclusively for the present list. If the sixth digit is a zero, it means that this item is the same as the one presented in CPC, Version 1.0 and has been drawn from it. If the sixth digit is however not a zero, the item corresponds only partly to the CPC code. For example, code 63110.0, 'Hotel and motel lodging services', is identical to CPC code 63110, whereas code 63199.1, 'Sleeping-car….', corresponds only in part to CPC code 63199.
1. Accommodation services 1.1 Hotels and other lodging services 63110.0 Hotel and motel lodging services 63191.0 Holiday centre and holiday home services 63192.0 Letting services of furnished accommodation 63193.0 Youth hostel services 63194.0 Children's training and holiday camp services 63195.0 Camping and caravanning site services 63199.1 Sleeping-car and similar services in other transport media; residence of students 1.2 Second-home services on own account or for free This subclass includes the imputed rent on owned second homes or for free and time-share apartments. There is no code in CPC with this information. 72211.1 Support services to time-share activities 2. Food and beverage-serving services 63210.0 Meal-serving services with full restaurant services 63220.0 Meal-serving services in self-service facilities 63290.0 Other food-serving services 63300.0 Beverage-serving services for consumption on the premises 3. Passenger transport services 3.1 Inter-urban railway transport services 64111.1 Scheduled rail services of passengers 64111.2 Non-scheduled rail services of passengers

Statistics South Africa
Tourism Satellite Account for South Africa, provisional 2010
32
3.2 Road transport services 64213.0 Inter-urban scheduled road transport services of passengers 64214.0 Inter-urban special-purpose scheduled road transport services of passengers 64219.1 Scheduled ski-hills services 64219.2 Teleferic-funicular services 64221.0 Taxi services 64222.0 Rental services of passenger cars with operator 64223.0 Rental services of buses and coaches with operator 3.3 Water transport services 65111.0 Coastal and trans-oceanic water transport services of passengers by ferry 65119.1 Scheduled transport services of passengers 65119.2 Non-scheduled transport services of passengers 65119.3 Cruise ship services 65130.1 Personal passenger vessel services 65211.0 Inland water transport services of passengers by ferries 65219.1 Other scheduled inland water transport services of passengers 65219.2 Sightseeing excursion services 65219.3 Cruise services 65230.0 Rental services of inland water vessels with operator 3.4 Air transport services 66110.0 Scheduled air transport services of passengers 66120.1 Non-scheduled air services of passengers 66120.2 Sightseeing services, aircraft or helicopter 66400.0 Rental services of aircraft with operator 3.5 Supporting passenger transport services 67300.0 Navigational aid services 67400.0 Supporting services for railway transport 67510.0 Bus station services 67530.1 Parking of passenger terminal transport 67610.0 Port and waterway services (excluding cargo handling) 67690.1 Vessel fuelling services 67690.2 Maintenance and upkeep services to private recreation passenger services 67710.0 Airport operation services (excluding cargo handling) 67790.0 Other supporting services for air or space transport 3.6 Passenger transport equipment rental 73111.0 Leasing or rental services concerning cars and light vans without operator 73114.1 Leasing or rental services concerning campers/motor without operator 73115.1 Leasing or rental services concerning passenger vessels without operator 73116.1 Leasing or rental services concerning passenger aircraft without operator 3.7 Maintenance and repair services of passenger transport equipment 87143.0 Maintenance and repair services of trailers, semi-trailers and other motor vehicles
not elsewhere classified 87149.1 Maintenance and repair services of leisure vessel of own use 87149.2 Maintenance and repair services of leisure aircraft of own use
Statistics South Africa
Tourism Satellite Account for South Africa, provisional 2010
33
4. Travel agency, tour operator and tourist guide services 4.1 Travel agency services 67811.0 Travel agency services 4.2 Tour operator services 67812.0 Tour operator services 4.3 Tourist information and tourist guide services 67813.0 Tourist information services 67820.0 Tourist guide services 5. Cultural services 5.1 Performing arts 96230.0 Performing arts facility operation services 96310.0 Services of performing artists 5.2 Museum and other cultural services 96411.0 Museum services except for historical sites and buildings 96412.0 Preservation services of historical sites and buildings 96421.0 Botanical and zoological garden services 96422.0 Nature reserve services including wildlife preservation services 6. Recreation and other entertainment services 6.1 Sports and recreational services 96510.0 Sport and recreational sport event promotion and organisation services 96520.1 Golf course services 96520.2 Ski fields 96520.3 Race circuit 96520.5 Recreation park and beach services 96590.1 Risk sport and adventure 6.2 Other amusement and recreational services 96910.1 Theme park services 96910.2 Amusement park services 96910.3 Fair and carnival services 96920.1 Casino services 96920.2 Slot machine services 7. Miscellaneous tourism services 7.1 Financial and insurance services 71100.1 Travel card services 71100.2 Travel loan services 71311.1 Travel life insurance services 71320.1 Travel accident insurance services 71320.2 Travel health insurance services 71334.1 Passengers' aircraft of own use insurance services 71334.2 Passengers' vessel of own use insurance services 71339.1 Travel insurance services 71552.0 Foreign exchange services
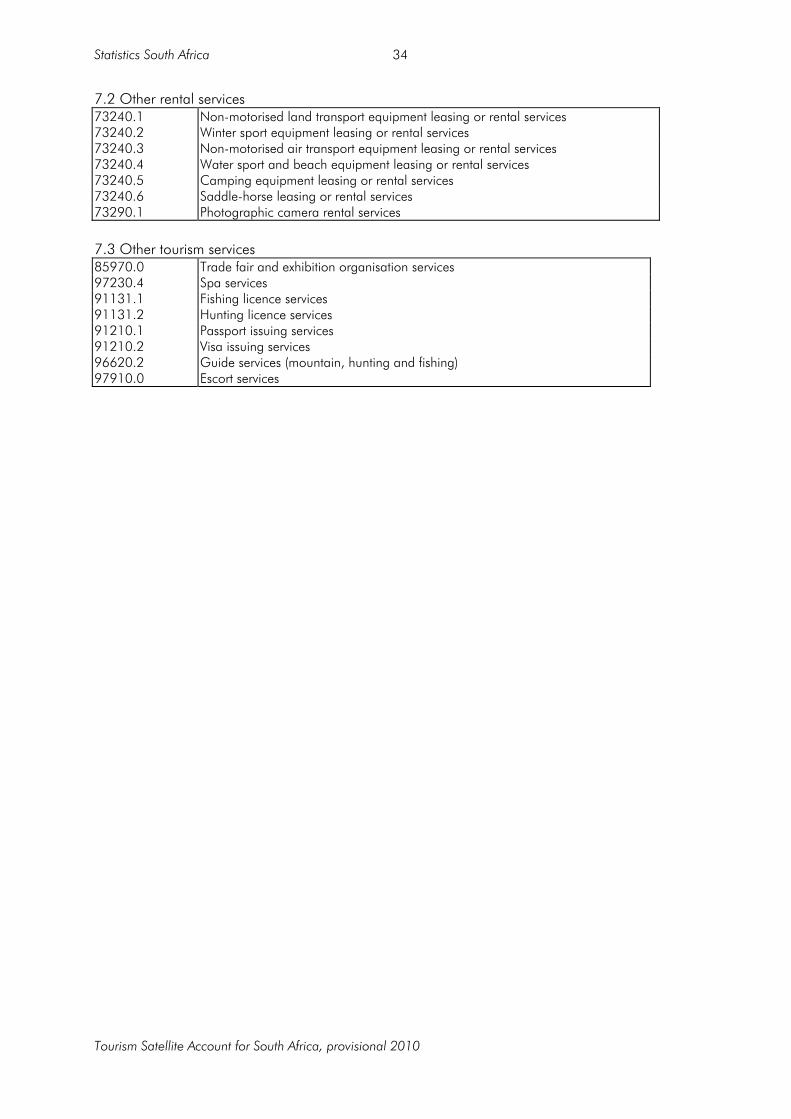
Statistics South Africa
Tourism Satellite Account for South Africa, provisional 2010
34
7.2 Other rental services 73240.1 Non-motorised land transport equipment leasing or rental services 73240.2 Winter sport equipment leasing or rental services 73240.3 Non-motorised air transport equipment leasing or rental services 73240.4 Water sport and beach equipment leasing or rental services 73240.5 Camping equipment leasing or rental services 73240.6 Saddle-horse leasing or rental services 73290.1 Photographic camera rental services 7.3 Other tourism services 85970.0 Trade fair and exhibition organisation services 97230.4 Spa services 91131.1 Fishing licence services 91131.2 Hunting licence services 91210.1 Passport issuing services 91210.2 Visa issuing services 96620.2 Guide services (mountain, hunting and fishing) 97910.0 Escort services

Statistics South Africa
Tourism Satellite Account for South Africa, provisional 2010
35
Annexure B: List of tourism-characteristic activities
Tourism-characteristic activities can be identified as those productive activities whose principal output is characteristic of tourism. As the set of these activities does not comprise a single industry conforming to the 1993 SNA definition, the TSA defines tourism industries as all establishments whose principal productive activity is a tourism-characteristic activity. Table A reveals the similarity between the 12 items of the list used in the TSA tables and their corresponding codes in the International Standard Industrial Classification of all Economic Activities (ISIC), Rev. 3 and SICTA.
Table A: List of tourism-characteristic activities
Activity description ISIC, Rev. 3 SICTA1. Hotels and similar 5510 55102. Second home ownership (imputed) Part of 7010 Part of 70103. Restaurants and similar 5520 55204. Railway passenger transport services Part of 6010 6010-1, 6010-25. Road passenger transport services Part of (6021 and 6022) 6021-1, 6021-2, 6021-3, 6022-1,
6022-2, 6022-3, 6022-46. Water passenger transport services Part of (6110 and 6120) 6110-1, 6110-2, Part of 6110,
6120-1, 6120-2, 6120-3, Part of 61207. Air passenger transport services Part of (6210 and 6220) 6210-1, 6220-1, 6220-28. Transport supporting services Part of 6303 6303-1, 6303-2, 6303-39. Transport equipment rental Part of (7111, 7112 and
7113)7111-1, 7111-2, 7111-3
Part of 7112, 7113-110. Travel agencies and similar 6304 630411. Cultural services 9232, 9233 9232-1, 9232-2, 9233-1, 9233-212. Sporting and other recreational services Part of 9214
Part of 9241Part of 9219Part of 9249
Part of 9214Part of 9241
9219-1Part of 9249

Statistics South Africa
Tourism Satellite Account for South Africa, provisional 2010
36
Annexure C: Tourism Satellite Accounts tables of South Africa
Annexure C provides the TSA tables for South Africa for the reference year 2010. Table 1 of the TSA focuses on inbound tourism expenditure by product and class of visitor22. The main source of data for the compilation of Table 1 of the TSA is the BoP from SARB and the SAT departure survey. Table B shows inbound tourism expenditure by product and class of visitor.
22 Tourists and same-day visitors

Statistics South Africa
Tourism Satellite Account for South Africa, provisional 2010
37
Table B: TSA Table 1 – Inbound tourism expenditure, by product and class of visitor, 2010 (R million)
Product
Tourists
(1.1)
Same-day visitors
(1.2)
Total visitors
(1.3)=(1.1)+(1.2) A. Specific products
A.1 Tourism-characteristic products 1 – Accommodation services for visitors (*) 1.a – Accommodation services for visitors other than 1.b (*) 1.b – Accommodation services associated with all types of vacation home ownership (*) 2 – Food and beverage serving services (*) Total passenger transport services (*) 3 – Railway passenger transport services (*) 4 – Road passenger transport services (*) 5 – Water passenger transport services (*) 6 – Air passenger transport services (*) 7 – Transport equipment rental services (*) 8 – Travel agencies and other reservation services (**) 9 – Cultural services (*) 10 – Sport and recreational services (*)
A.2 Tourism-connected products (*) (a) Retail sales of food, beverages and tobacco Retail sales of textiles, clothing, footwear and leather goods Retail sales of pharmaceutical and medical goods, cosmetic and toiletry articles Retail sales of household furniture, appliances, articles and equipment Retail sales of automotive fuels
B. Non-specific products Services Goods
X X X
55 797 46 867 12 421 12 421
8 296 19 107
91 9 543
2 8 375 1 096 1 833
141 5 069
8 931 4 978 2 313
95 856 689
13 625
3 542 10 082
Total inbound tourism expenditure 69 422 11 303 08723 Number of trips
Number of overnights X 8 073 552 X does not apply (*) The value is net of the gross service charges paid to travel agencies, tour operators and other reservation services (**) Corresponds to the gross service charge of the travel agencies, tour operators and other reservation services and value of other services provided
23 Inbound visitors
Statistics South Africa
Tourism Satellite Account for South Africa, provisional 2010
38
Table 2 of the TSA focuses on domestic tourism expenditure by product, class of visitor and type of trip. The main source of data for the compilation of Table 2 of the TSA is the SU-tables, the SAT domestic survey and the tourism module in the GHS. Table C shows domestic tourism expenditure by product, class of visitor and type of trip for 2010.
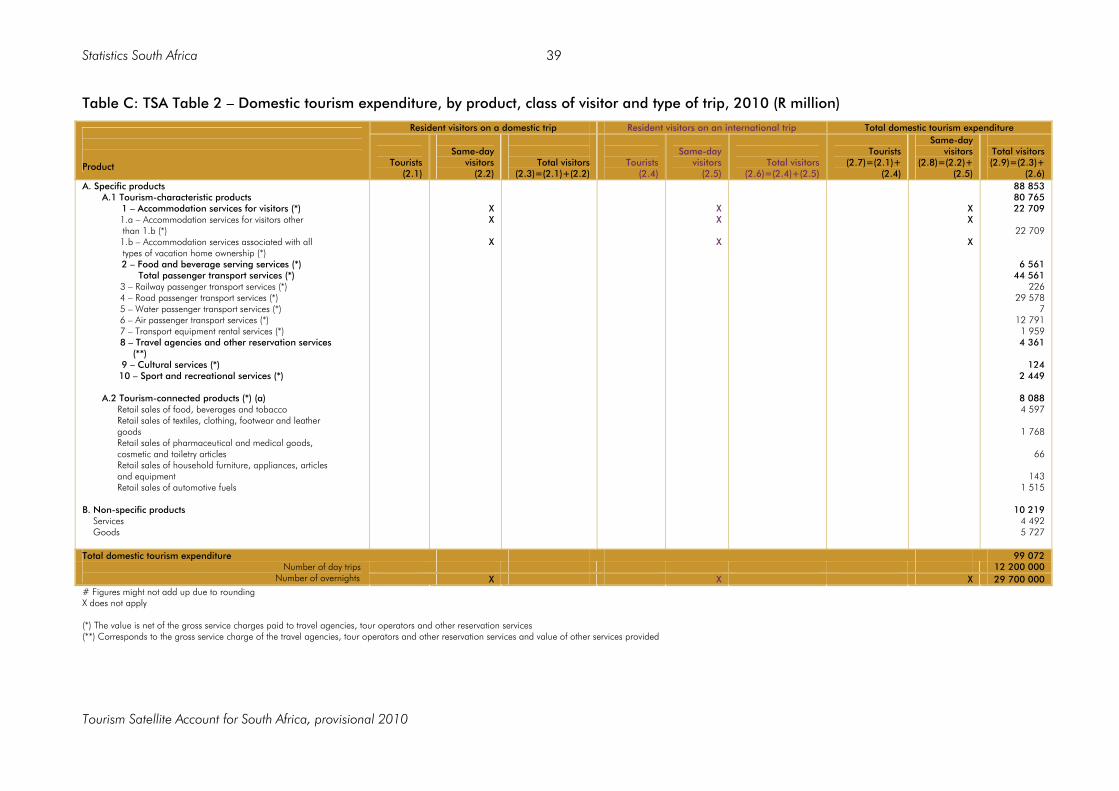
Statistics South Africa
Tourism Satellite Account for South Africa, provisional 2010
39
Table C: TSA Table 2 – Domestic tourism expenditure, by product, class of visitor and type of trip, 2010 (R million)
Resident visitors on a domestic trip Resident visitors on an international trip Total domestic tourism expenditure Product
Tourists (2.1)
Same-day
visitors (2.2)
Total visitors (2.3)=(2.1)+(2.2)
Tourists (2.4)
Same-day
visitors (2.5)
Total visitors (2.6)=(2.4)+(2.5)
Tourists
(2.7)=(2.1)+ (2.4)
Same-day visitors
(2.8)=(2.2)+ (2.5)
Total visitors (2.9)=(2.3)+
(2.6) A. Specific products A.1 Tourism-characteristic products 1 – Accommodation services for visitors (*) 1.a – Accommodation services for visitors other than 1.b (*) 1.b – Accommodation services associated with all types of vacation home ownership (*) 2 – Food and beverage serving services (*) Total passenger transport services (*) 3 – Railway passenger transport services (*) 4 – Road passenger transport services (*) 5 – Water passenger transport services (*) 6 – Air passenger transport services (*) 7 – Transport equipment rental services (*) 8 – Travel agencies and other reservation services (**) 9 – Cultural services (*) 10 – Sport and recreational services (*) A.2 Tourism-connected products (*) (a) Retail sales of food, beverages and tobacco Retail sales of textiles, clothing, footwear and leather goods Retail sales of pharmaceutical and medical goods, cosmetic and toiletry articles Retail sales of household furniture, appliances, articles and equipment Retail sales of automotive fuels B. Non-specific products Services Goods
X X
X
X X
X
X X
X
88 853 80 765 22 709
22 709
6 561 44 561
226 29 578
7 12 791 1 959 4 361
124
2 449
8 088 4 597
1 768
66
143
1 515
10 219 4 492 5 727
Total domestic tourism expenditure 99 072 12 200 000 Number of day trips
Number of overnights X X X 29 700 000 # Figures might not add up due to rounding X does not apply (*) The value is net of the gross service charges paid to travel agencies, tour operators and other reservation services (**) Corresponds to the gross service charge of the travel agencies, tour operators and other reservation services and value of other services provided

Statistics South Africa
Tourism Satellite Account for South Africa, provisional 2010
40
Table 3 of the TSA shows the outbound tourism expenditure of South African residents by product and class of visitor. There is currently limited data on the expenditure of South Africans outside the borders of the country (only the total expenditure of South African residents outside the borders of the country from the BoP from SARB). Table D shows outbound tourism expenditure by product and class of visitor for 2010.

Statistics South Africa
Tourism Satellite Account for South Africa, provisional 2010
41
Table D: TSA Table 3 – Outbound tourism expenditure, by product and class of visitor, 2010 (R million) Tourism expenditure of outbound visitors in other
economies Acquisition from non-residents by visitors on
domestic trips
Total outbound expenditure Product
Tourists (3.1)
Same-day
visitors (3.2)
Total visitors (3.3)=(3.1)+(3.2)
Tourists (3.4)
Same-day
visitors (3.5)
Total visitors (3.6)=(3.4)+(3.5)
Tourists
(3.7)=(3.1)+ (3.4)
Same-day visitors
(3.8)=(3.2)+ (3.5)
Total visitors (3.9)=(3.3)+
(3.6)
A. Specific products A.1 Tourism-characteristic products 1 – Accommodation services for visitors (*) 1.a – Accommodation services for visitors other than 1.b (*) 1.b – Accommodation services associated with all types of vacation home ownership (*) 2 – Food and beverage serving services (*) Total passenger transport services (*) 3 – Railway passenger transport services (*) 4 – Road passenger transport services (*) 5 – Water passenger transport services (*) 6 – Air passenger transport services (*) 7 – Transport equipment rental services (*) 8 – Travel agencies and other reservation services (**) 9 – Cultural services (*) 10 – Sport and recreational services (*) A.2 Tourism-connected products (*) (a) Retail sales of food, beverages and tobacco Retail sales of textiles, clothing, footwear and leather goods Retail sales of pharmaceutical and medical goods, cosmetic and toiletry articles Retail sales of household furniture, appliances, articles and equipment Retail sales of automotive fuels B. Non-specific products Services Goods
X X
X
X X
X
X X
X
Total outbound tourism expenditure 59 452 X does not apply (*) The value is net of the gross service charges paid to travel agencies, tour operators and other reservation services (**) Corresponds to the gross service charge of the travel agencies, tour operators and other reservation services and value of other services provided

Statistics South Africa
Tourism Satellite Account for South Africa, provisional 2010
42
Table 4 of the TSA focuses on internal tourism consumption by product. Table 4 of the TSA combines internal tourism expenditure (Table 1 of the TSA) and domestic tourism expenditure (Table 2 of the TSA) with the other components of tourism consumption. There are four categories24 of 'other components of tourism consumption', and they are:
• Services associated to vacation accommodation on own account – includes all imputed accommodation services related to accommodation units on own account and to all other types of vacation-home ownership;
• Tourism social transfers in kind (except refunds) – includes the value of individual non-market services provided by governments and non-profit institutions serving households (NPISH) that benefit visitors and exceed the values paid by the visitors themselves;
• Other imputed consumption – all other imputed items not previously included; and
• Tourism single-purpose consumer durables purchased outside the context of a trip or for a trip.
Internal tourism consumption is the key aggregate derived from Table 4. The production process by which internal tourism consumption (except imports) is provided will be the basis for the compilation of TDGVA and TDGDP25. Table 4 of the TSA uses the information from Tables 1 and 2 of the TSA, so no additional surveys are used in its compilation. The totals, therefore, have their origins in the SU-tables, SAT inbound and domestic survey, the tourism module of the GHS and the BoP (as in Tables 1 and 2 of the TSA). Table E shows Table 4 of the TSA: Internal tourism consumption by product for 2010.
24 Additional to Table 1 and Table 2 of the TSA 25 TSA: RMF

Statistics South Africa
Tourism Satellite Account for South Africa, provisional 2010
43
Table E: TSA Table 4 – Internal tourism consumption by product, 2010 (R million)
Internal tourism expenditure
Product
Inbound tourism consumption
(1.3)
Domestic tourism consumption
(2.9)
Internal tourism consumption in cash
(4.1)=(1.3)+(2.9)
Other components of tourist consumption (b)
(4.2)
Internal tourism consumption (4.3)=(4.1)+(4.2)
A. Specific products A.1 Tourism-characteristic products 1 – Accommodation services for visitors (*) 1.a – Accommodation services for visitors other than 1.b (*) 1.b – Accommodation services associated with all types of vacation home ownership (*) 2 – Food and beverage serving services (*) Total passenger transport services (*) 3 – Railway passenger transport services (*) 4 – Road passenger transport services (*) 5 – Water passenger transport services (*) 6 – Air passenger transport services (*) 7 – Transport equipment rental services (*) 8 – Travel agencies and other reservation services (**) 9 – Cultural services (*) 10 – Sport and recreational services (*) A.2 Tourism-connected products (*) (a) Retail sales of food, beverages and tobacco Retail sales of textiles, clothing, footwear and leather goods Retail sales of pharmaceutical and medical goods, cosmetic and toiletry articles Retail sales of household furniture, appliances, articles and equipment Retail sales of automotive fuels B. Non-specific products Services Goods
55 797 46 867 12 421
12 421
8 296 19 107
91 9 543
2 8 375 1 096 1 833
141 5 069
8 931 4 978
2 313
95
856 689
13 625
3 542 10 082
88 853 80 765 22 709
22 709
6 561 44 561
226 29 578
7 12 791 1 959 4 361
124 2 449
8 088 4 597
1 768
66
143
1 515
10 219 4 492 5 727
144 651 127 631 35 130
35 130
14 856 63 668
317 39 121
9 21 167 3 055 6 194
265 7 518
17 019
9 576
4 080
161
999 2 204
23 844
8 034 15 809
144 651 127 631 35 130
35 130
14 856 63 668
317 39 121
9 21 167 3 055 6 194
265 7 518
17 019
9 576
4 080
161
999 2 204
23 844
8 034 15 809
Total internal tourism consumption 69 422 99 072 168 494 168 494 # Figures might not add up due to rounding X does not apply (*) The value is net of the gross service charges paid to travel agencies, tour operators and other reservation services (**) Corresponds to the gross service charge of the travel agencies, tour operators and other reservation services and value of other services provided

Statistics South Africa
Tourism Satellite Account for South Africa, provisional 2010
44
Table F shows the prescribed format of Table 5 of the TSA. This table focuses on the production accounts of tourism industries and other industries (at basic prices). It conforms formally to the format established by the 1993 SNA, but the perspective is different from the SNA production accounts (a tool for tourism analysis). Because of the application of the principle of recording reservation services separately, output and intermediate consumption of each industry and the corresponding total for the economy that appears in the last column, do not necessarily correspond to the corresponding values found in the national accounts of the country26. For each industry and for the total economy, GVA at basic prices has to equal to GVA of the economy as it appears in the national accounts27. The first block in Table 5 of the TSA disaggregates output into product types (goods and services) and is valued at basic prices. The second block contains intermediate consumption or input disaggregated into categories based on the CPC classification28 and is valued at purchasers' prices. The difference between the total output (at basic prices) from the first block and total intermediate consumption (at purchasers' prices) in the second block equals total gross value added of industries (at basic prices). The value added refers to industries as a whole and is disaggregated further in the third block to represent specific components of remuneration of employees, net taxes on production, operating surplus and mixed income)29. Table 5 of the TSA is compiled from the SU-tables. Several other surveys like the AFS30 and LSSs are also used to compile this table. Recently, the level of detail that samples are drawn for the AFS has increased31 based on the needs from the tourism industry and more specifically the TSA. This survey collects financial data from enterprises in industries that represent different SIC groups. Several of the LSSs (i.e. accommodation, food and beverages, transport and personal services) are also used to compile this table. Unfortunately, there are several different industries that will need to be covered in the LSS series. This will make it difficult to collect all the required information for one specific year because of the rotation of LSS collection. Adjustments must be done in instances where surveys refer to different years to ensure that the distributions used from the surveys are representative of the same time period32. Stats SA conducts several monthly surveys which are used in the compilation of Table 5 of the TSA. The survey of tourist accommodation was first introduced in April 2004. It is a monthly survey and its results are published on a quarterly basis. The monthly food and beverage survey was also introduced in April 2004 and the results are published on a quarterly basis. In order to compile Table 5 of the TSA, South Africa needs to identify the specific goods and services, as well as industries that are unique to their individual situation. Each country needs to determine industries that they wish to include under 'Country-specific tourism industries'. For goods and services, each country needs to determine 'Other country-specific tourism-characteristic goods', 'Other country-specific tourism-characteristic services', 'Tourism-connected products' and 'Non-consumption products'.
26 TSA: RMF 27 Adjustments due to the application of the principle of recording reservation services separately have no effect on the VA of any of the
industries 28 In the SU-tables, products are currently linked to SIC (and ISIC). In future products will be linked to CPC codes (research work
underway) 29 TSA: RMF 30 The EAS has been renamed to AFS from the reference year 2006 (first published as the AFS on 31 October 2007 31 From 2006. Level of detail changed from 3 digit SIC to 4 digit SIC 32 Use for distributions, not levels
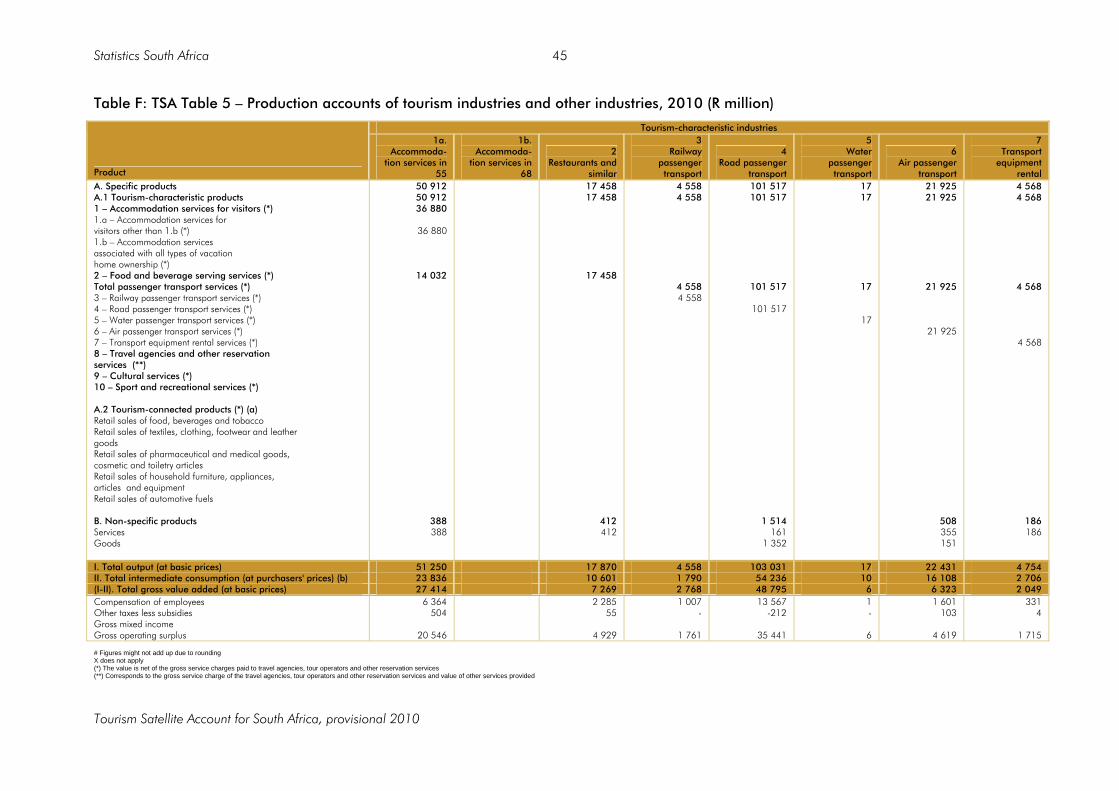
Statistics South Africa
Tourism Satellite Account for South Africa, provisional 2010
45
Table F: TSA Table 5 – Production accounts of tourism industries and other industries, 2010 (R million)
Tourism-characteristic industries
Product
1a. Accommoda-
tion services in 55
1b. Accommoda-
tion services in 68
2 Restaurants and
similar
3 Railway
passenger transport
4 Road passenger
transport
5 Water
passenger transport
6 Air passenger
transport
7 Transport
equipment rental
A. Specific products A.1 Tourism-characteristic products 1 – Accommodation services for visitors (*) 1.a – Accommodation services for visitors other than 1.b (*) 1.b – Accommodation services associated with all types of vacation home ownership (*) 2 – Food and beverage serving services (*) Total passenger transport services (*) 3 – Railway passenger transport services (*) 4 – Road passenger transport services (*) 5 – Water passenger transport services (*) 6 – Air passenger transport services (*) 7 – Transport equipment rental services (*) 8 – Travel agencies and other reservation services (**) 9 – Cultural services (*) 10 – Sport and recreational services (*) A.2 Tourism-connected products (*) (a) Retail sales of food, beverages and tobacco Retail sales of textiles, clothing, footwear and leather goods Retail sales of pharmaceutical and medical goods, cosmetic and toiletry articles Retail sales of household furniture, appliances, articles and equipment Retail sales of automotive fuels B. Non-specific products Services Goods
50 912 50 912 36 880
36 880
14 032
388 388
17 458 17 458
17 458
412 412
4 558 4 558
4 558 4 558
101 517 101 517
101 517
101 517
1 514 161
1 352
17 17
17
17
21 925 21 925
21 925
21 925
508 355 151
4 568 4 568
4 568
4 568
186 186
I. Total output (at basic prices) 51 250 17 870 4 558 103 031 17 22 431 4 754 II. Total intermediate consumption (at purchasers' prices) (b) 23 836 10 601 1 790 54 236 10 16 108 2 706 (I-II). Total gross value added (at basic prices) 27 414 7 269 2 768 48 795 6 6 323 2 049 Compensation of employees 6 364 2 285 1 007 13 567 1 1 601 331 Other taxes less subsidies 504 55 - -212 - 103 4 Gross mixed income Gross operating surplus 20 546 4 929 1 761 35 441 6 4 619 1 715 # Figures might not add up due to rounding X does not apply (*) The value is net of the gross service charges paid to travel agencies, tour operators and other reservation services (**) Corresponds to the gross service charge of the travel agencies, tour operators and other reservation services and value of other services provided

Statistics South Africa
Tourism Satellite Account for South Africa, provisional 2010
46
Table F: TSA Table 5 – Production accounts of tourism industries and other industries, 2010 (R million) (concluded)
Tourism-characteristic industries Tourism-related
industries Product
8 Travel agencies
and similar 9
Cultural services
10 Sport and
recreational services
Total tourism-characteristic
industries
Retail trade of tourism-connected
goods Total non-tourism
industries
Total output of domestic
producers (at basic prices)
A. Specific products A.1 Tourism-characteristic products 1 – Accommodation services for visitors (*) 1.a – Accommodation services for visitors other than 1.b (*) 1.b – Accommodation services associated with all types of vacation home ownership (*) 2 – Food and beverage serving services (*) Total passenger transport services (*) 3 – Railway passenger transport services (*) 4 – Road passenger transport services (*) 5 – Water passenger transport services (*) 6 – Air passenger transport services (*) 7 – Transport equipment rental services (*) 8 – Travel agencies and other reservation services (**) 9 – Cultural services (*) 10 – Sport and recreational services (*) A.2 Tourism-connected products (*) (a) Retail sales of food, beverages and tobacco Retail sales of textiles, clothing, footwear and leather goods Retail sales of pharmaceutical and medical goods, cosmetic and toiletry articles Retail sales of household furniture, appliances, articles and equipment Retail sales of automotive fuels B. Non-specific products Services Goods
6 320 6 320
6 320
1 1
1 267 1 267
1 267
7 7
24 078 24 078
24 078
136 136
232 620 232 620 36 880
36 880
31 490 132 584
4 558 101 517
17 21 925 4 568
6 320 1 267
24 078
3 101 1 597 1 503
70 317
70 317 27 110
10 727
9 732
14 372 8 376
6 646 6 646
129 649 13 308
9 854 3 454
3 454
116 341 67 038
32 180
4 418
7 309 5 396
5 020 473 3 165 639 1 854 834
432 585 245 927 36 880
36 880
41 344 136 038
4 558 104 971
17 21 925 4 568
6 320 1 267
24 078
186 658 94 148
42 906
14 150
21 681 13 772
5 030 220 3 173 882 1 856 337
I. Total output (at basic prices) 6 321 1 274 24 214 235 720 76 963 5 150 122 5 462 805 II. Total intermediate consumption (at purchasers' prices) (b) 3 478 933 17 730 131 427 38 813 2 880 073 3 050 314 (I-II). Total gross value added (at basic prices) 2 843 341 6 485 104 293 38 150 2 270 049 2 412 491 Compensation of employees 2 179 172 3 267 30 773 24 007 1 147 212 1 201 992 Other taxes less subsidies 1 17 326 798 825 36 112 37 735 Gross mixed income Gross operating surplus 663 152 2 892 72 723 13 318 1 086 723 1 172 764 # Figures might not add up due to rounding X does not apply (*) The value is net of the gross service charges paid to travel agencies, tour operators and other reservation services (**) Corresponds to the gross service charge of the travel agencies, tour operators and other reservation services and value of other services provided
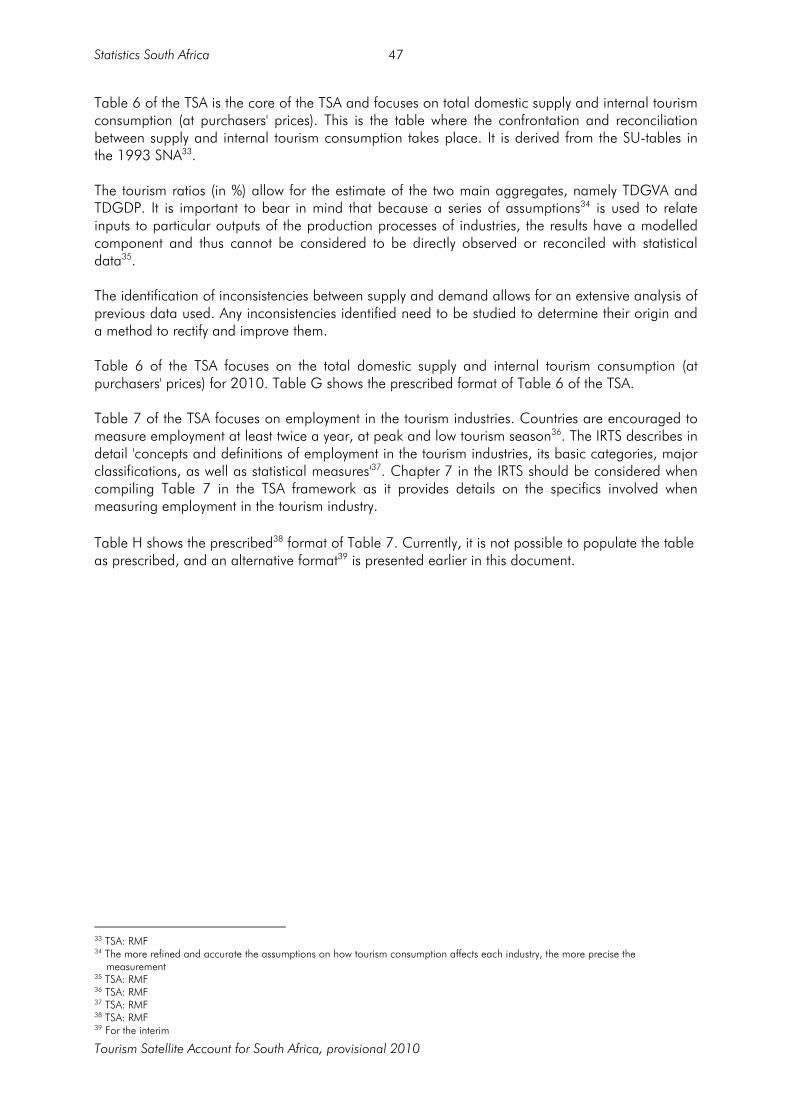
Statistics South Africa
Tourism Satellite Account for South Africa, provisional 2010
47
Table 6 of the TSA is the core of the TSA and focuses on total domestic supply and internal tourism consumption (at purchasers' prices). This is the table where the confrontation and reconciliation between supply and internal tourism consumption takes place. It is derived from the SU-tables in the 1993 SNA33. The tourism ratios (in %) allow for the estimate of the two main aggregates, namely TDGVA and TDGDP. It is important to bear in mind that because a series of assumptions34 is used to relate inputs to particular outputs of the production processes of industries, the results have a modelled component and thus cannot be considered to be directly observed or reconciled with statistical data35. The identification of inconsistencies between supply and demand allows for an extensive analysis of previous data used. Any inconsistencies identified need to be studied to determine their origin and a method to rectify and improve them. Table 6 of the TSA focuses on the total domestic supply and internal tourism consumption (at purchasers' prices) for 2010. Table G shows the prescribed format of Table 6 of the TSA. Table 7 of the TSA focuses on employment in the tourism industries. Countries are encouraged to measure employment at least twice a year, at peak and low tourism season36. The IRTS describes in detail 'concepts and definitions of employment in the tourism industries, its basic categories, major classifications, as well as statistical measures'37. Chapter 7 in the IRTS should be considered when compiling Table 7 in the TSA framework as it provides details on the specifics involved when measuring employment in the tourism industry. Table H shows the prescribed38 format of Table 7. Currently, it is not possible to populate the table as prescribed, and an alternative format39 is presented earlier in this document.
33 TSA: RMF 34 The more refined and accurate the assumptions on how tourism consumption affects each industry, the more precise the
measurement 35 TSA: RMF 36 TSA: RMF 37 TSA: RMF 38 TSA: RMF 39 For the interim

Statistics South Africa
Tourism Satellite Account for South Africa, provisional 2010
48
Table G: TSA Table 6 – Total domestic supply and internal tourism consumption (at purchasers' prices), 2010 (R million)
Tourism-characteristic industries
1.a Accommodation services in
55
2
Restaurants and similar
3
Railway passenger transport
4
Road passenger transport
5 Water passenger transport
6
Air passenger transport
Product
Output
Tourism share (in value)
Output
Tourism share (in value)
Output
Tourism share (in value)
Output
Tourism share (in value)
Output
Tourism share (in value)
Output
Tourism share (in value)
A. Specific products A.1 Tourism-characteristic products 1 – Accommodation services for visitors (*) 1.a – Accommodation services for visitors other than 1.b (*) 1.b – Accommodation services associated with all types of vacation home ownership (*) 2 – Food and beverage serving services (*) Total passenger transport services (*) 3 – Railway passenger transport services (*) 4 – Road passenger transport services (*) 5 – Water passenger transport services (*) 6 – Air passenger transport services (*) 7 – Transport equipment rental services (*) 8 – Travel agencies and other reservation services (**) 9 – Cultural services (*) 10 – Sport and recreational services (*) A.2 Tourism-connected products (*) (a) Retail sales of food, beverages and tobacco Retail sales of textiles, clothing, footwear and leather goods Retail sales of pharmaceutical and medical goods, cosmetic and toiletry articles Retail sales of household furniture, appliances, articles and equipment Retail sales of automotive fuels B. Non-specific products Services Goods
50 912 50 912 36 880
36 880
14 032
338 338
40 172 40 172 35 130
35 130
5 042
1 1
17 458 17 458
17 458
412 412
6 273 6 273
6 273
1 1
4 558 4 558
4 558 4 558
317 317
317 317
101 517 101 517
101 517
101 507
1 514 161
1 352
37 834 37 834
37 834
37 834
12 0
12
17 17
17
17
9 9
9
9
21 925 21 925
21 925
21 925
506 355 151
21 167 21 167
21 167
21 167
2 1 1
I. Total output (at basic prices) 51 250 40 173 17 870 6 274 4 558 317 103 031 37 846 17 9 22 431 21 169 II. Total intermediate consumption (at purchasers' prices) (b) 23 836 18 684 10 601 3 722 1 790 124 54 236 19 922 10 5 16 108 15 201 (I-II). Total gross value added (at basic prices) 27 414 21 489 7 269 2 552 2 768 192 48 795 17 923 6 3 6 323 5 968 # Figures might not add up due to rounding (*) The value is net of the gross service charges paid to travel agencies, tour operators and other reservation services (**) Corresponds to the gross service charge of the travel agencies, tour operators and other reservation services and value of other services provided

Statistics South Africa
Tourism Satellite Account for South Africa, provisional 2010
49
Table G: TSA Table 6 – Total domestic supply and internal tourism consumption (at purchasers' prices), 2010 (R million) (continued)
Tourism-characteristic industries Tourism-related industries
7
Transport equipment rental
8
Travel agencies and similar
9
Cultural services
10 Sport and recreational
services
Total tourism-characteristic industries
Retail trade of tourism-
connected goods
Product
Output
Tourism share (in value)
Output
Tourism share (in value)
Output
Tourism share (in value)
Output
Tourism share (in value)
Output
Tourism share (in value)
Output
Tourism share (in value)
A. Specific products A.1 Tourism-characteristic products 1 – Accommodation services for visitors (*) 1.a – Accommodation services for visitors other than 1.b (*) 1.b – Accommodation services associated with all types of vacation home ownership (*) 2 – Food and beverage serving services (*) Total passenger transport services (*) 3 – Railway passenger transport services (*) 4 – Road passenger transport services (*) 5 – Water passenger transport services (*) 6 – Air passenger transport services (*) 7 – Transport equipment rental services (*) 8 – Travel agencies and other reservation services (**) 9 – Cultural services (*) 10 – Sport and recreational services (*) A.2 Tourism-connected products (*) (a) Retail sales of food, beverages and tobacco Retail sales of textiles, clothing, footwear and leather goods Retail sales of pharmaceutical and medical goods, cosmetic and toiletry articles Retail sales of household furniture, appliances, articles and equipment Retail sales of automotive fuels B. Non-specific products Services Goods
4 568 4 568
4 568
4 568
186 186
3 055 3 055
3 055
3 055
- -
6 320 6 320
6 320
1 1
6 194 6 194
6 194
1 1
1 267 1 267
1 267
7 7
265 265
265
- -
24 078 24 078
24 078
136 136
7 518 7 518
7 518
- -
232 620 232 620
36 880
36 880
31 490 132 584
4 558 101 517
17 21 925
4 568 6 320 1 267
24 078
3 101 1 597 1 503
122 803 122 803
35 130
35 130
11 316 62 381
317 37 834
9 21 167
3 055 6 194
265 7 518
18 5
13
70 317
70 317 27 110
10 727
9 732
14 372
8 376
6 646 6 646
5 890
5 890 2 757
1 020
111
662
1 340
17 17
I. Total output (at basic prices) 4 754 3 056 6 321 6 195 1 274 265 24 214 7 518 235 720 122 821 76 963 5 907 II. Total intermediate consumption (at purchasers' prices) (b) 2 706 1 739 3 478 3 408 933 194 17 730 5 505 131 427 68 506 38 813 2 979 (I-II). Total gross value added (at basic prices) 2 049 1 317 2 843 2 786 341 71 6 485 2 013 104 293 54 315 38 150 2 928 # Figures might not add up due to rounding (*) The value is net of the gross service charges paid to travel agencies, tour operators and other reservation services (**) Corresponds to the gross service charge of the travel agencies, tour operators and other reservation services and value of other services provided
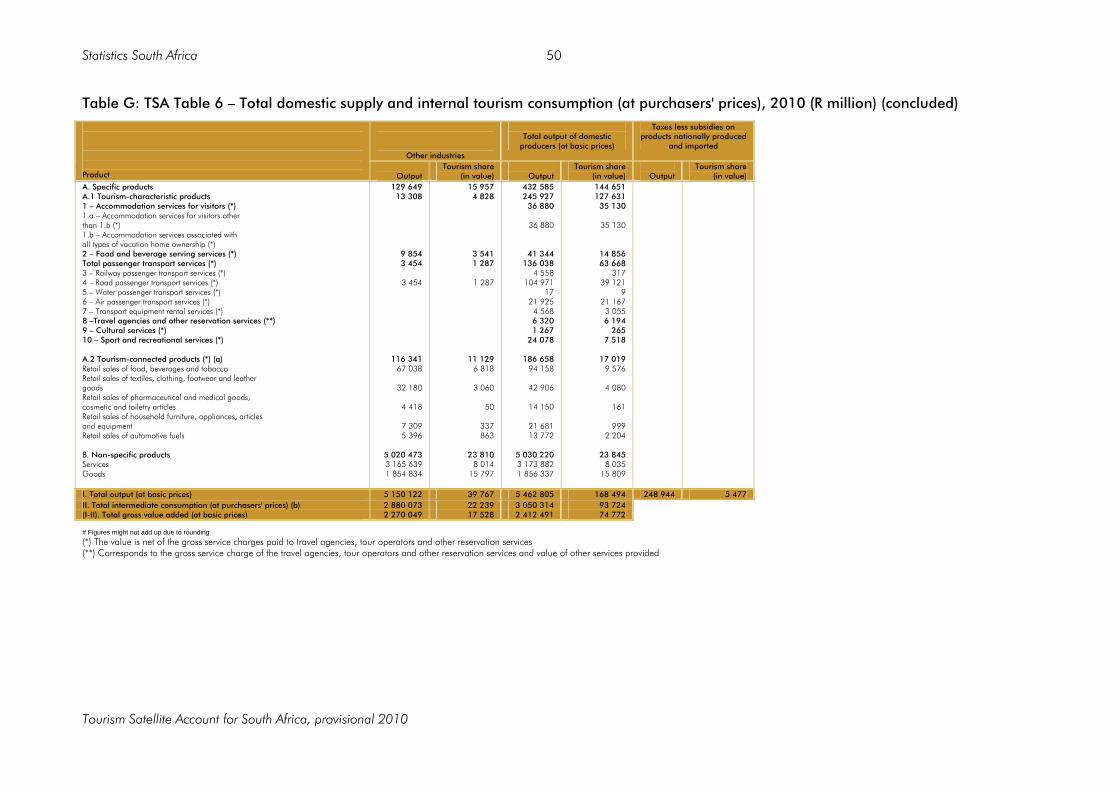
Statistics South Africa
Tourism Satellite Account for South Africa, provisional 2010
50
Table G: TSA Table 6 – Total domestic supply and internal tourism consumption (at purchasers' prices), 2010 (R million) (concluded)
Other industries
Total output of domestic
producers (at basic prices)
Taxes less subsidies on products nationally produced
and imported
Product
Output
Tourism share (in value)
Output
Tourism share (in value)
Output
Tourism share (in value)
A. Specific products A.1 Tourism-characteristic products 1 – Accommodation services for visitors (*) 1.a – Accommodation services for visitors other than 1.b (*) 1.b – Accommodation services associated with all types of vacation home ownership (*) 2 – Food and beverage serving services (*) Total passenger transport services (*) 3 – Railway passenger transport services (*) 4 – Road passenger transport services (*) 5 – Water passenger transport services (*) 6 – Air passenger transport services (*) 7 – Transport equipment rental services (*) 8 –Travel agencies and other reservation services (**) 9 – Cultural services (*) 10 – Sport and recreational services (*) A.2 Tourism-connected products (*) (a) Retail sales of food, beverages and tobacco Retail sales of textiles, clothing, footwear and leather goods Retail sales of pharmaceutical and medical goods, cosmetic and toiletry articles Retail sales of household furniture, appliances, articles and equipment Retail sales of automotive fuels B. Non-specific products Services Goods
129 649 13 308
9 854 3 454
3 454
116 341 67 038
32 180
4 418
7 309 5 396
5 020 473 3 165 639 1 854 834
15 957 4 828
3 541 1 287
1 287
11 129 6 818
3 060
50
337 863
23 810
8 014 15 797
432 585 245 927
36 880
36 880
41 344 136 038
4 558 104 971
17 21 925
4 568 6 320 1 267
24 078
186 658 94 158
42 906
14 150
21 681 13 772
5 030 220 3 173 882 1 856 337
144 651 127 631
35 130
35 130
14 856 63 668
317 39 121
9 21 167
3 055 6 194
265 7 518
17 019
9 576
4 080
161
999 2 204
23 845
8 035 15 809
I. Total output (at basic prices) 5 150 122 39 767 5 462 805 168 494 248 944 5 477 II. Total intermediate consumption (at purchasers' prices) (b) 2 880 073 22 239 3 050 314 93 724 (I-II). Total gross value added (at basic prices) 2 270 049 17 528 2 412 491 74 772 # Figures might not add up due to rounding (*) The value is net of the gross service charges paid to travel agencies, tour operators and other reservation services (**) Corresponds to the gross service charge of the travel agencies, tour operators and other reservation services and value of other services provided

Statistics South Africa
Tourism Satellite Account for South Africa, provisional 2010
51
Table H: TSA Table 7 – Employment in the tourism industries (TSA: RMF, 2008)
Number of jobs by status in employment Number of hours worked by status in employment Full-time equivalent by status in employment Employees Self-employed Employees Self-employed Employees Self-employed
Tourism Industry
Number of
establishments Male Female Total Male Female Total Male Female Total Male Female Total Male Female Total Male Female Total 1 – Accommodation for visitors 1.a – Accommodation services for visitors other than 1.b 1.b – Accommodation services associated with all types of vacation home ownership 2 – Food and beverage serving industry 3 – Railways passenger transport 4 – Road passenger transport 5 – Water passenger transport 6 – Air passenger transport 7 – Transport equipment rental 8 – Travel agencies and other reservation services 9 – Cultural industry 10 – Sport and recreational industry 11 – Retail trade of country-specific tourism-characteristic goods 12 – Country-specific tourism industries
Total

Statistics South Africa
Tourism Satellite Account for South Africa, provisional 2010
52
Table I: TSA Table 8 – Tourism gross fixed capital formation of tourism industries and other industries (TSA: RMF, 2008)
Tourism industries Other industries Product
1
2
3
4
5
6
7
8
9
10
11
12
Total tourism industries
Public administration
Others
Total
Total tourism gross fixed capital formation of
tourism industries and others
A. Produced non-financial assets A1. Tangible fixed assets 1. Tourism accommodation 1.1 Hotels and other collective accommodation 1.2 Dwellings for tourism purposes 2. Other buildings and structures 2.1 Restaurant and similar buildings 2.2 Construction of infrastructure for passenger
transport by road, rail, water and air 2.3 Buildings for cultural services and similar 2.4 Constructions for sport, recreation and
entertainment 2.5 Other construction and structures 3. Passenger transport equipment 3.1 Road and rail 3.2 Water 3.3 Air 4. Machinery and equipment A2. Intangible fixed assets B. Improvement of land used for tourism purposes
x x x x x x x x x x x x x
(1)
(1)
(1) (1)
(1)
(1) (1)
Total Memo: C. Non-produced non-financial assets 1. Tangible non-produced assets 2. Intangible non-produced assets
x x x
TOTAL x x does not apply (1) Only that which is used for tourism purpose
Key to tourism industries columns 1 – Hotels and similar services 2 – Second home ownership (imputed) 3 – Restaurants and similar 4 – Railway passenger transport 5 – Road passenger transport 6 – Water passenger transport
7 – Air passenger transport 8 – Passenger transport supporting services 9 – Passenger transport equipment rental 10 – Travel agencies and similar 11 – Cultural services 12 – Sport and other recreation services
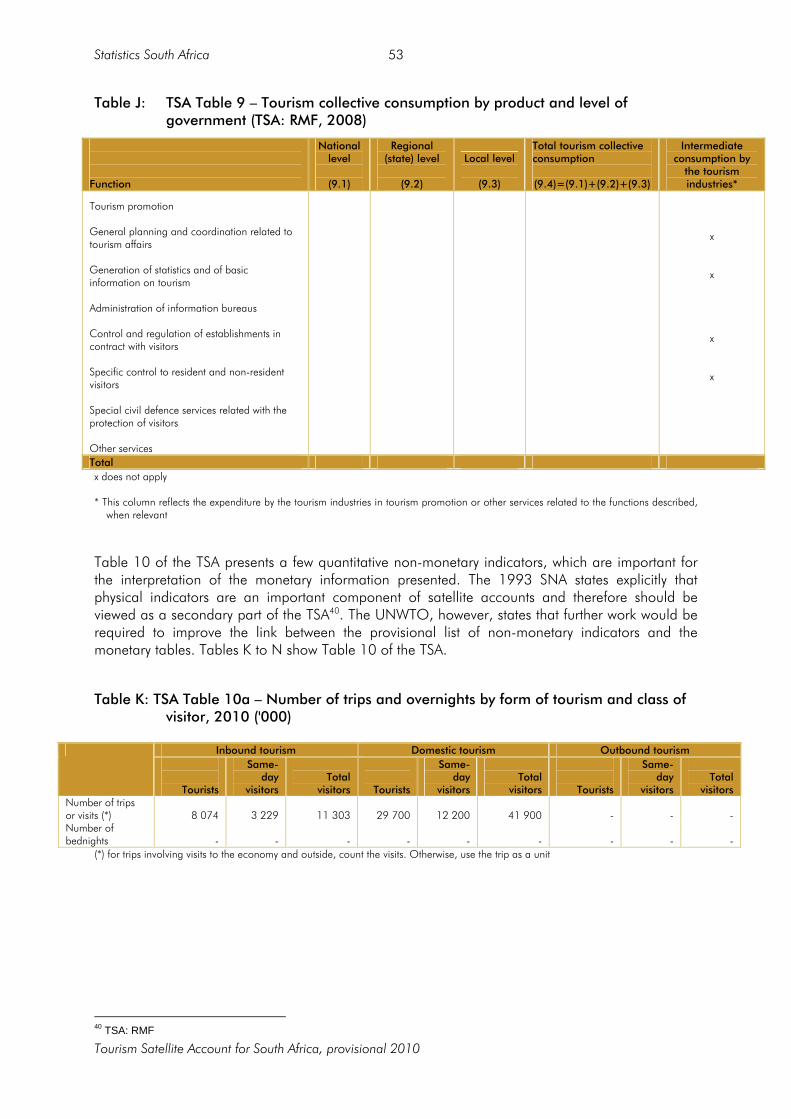
Statistics South Africa
Tourism Satellite Account for South Africa, provisional 2010
53
Table J: TSA Table 9 – Tourism collective consumption by product and level of government (TSA: RMF, 2008)
Function
National level
(9.1)
Regional (state) level
(9.2)
Local level
(9.3)
Total tourism collective consumption (9.4)=(9.1)+(9.2)+(9.3)
Intermediate consumption by
the tourism industries*
Tourism promotion General planning and coordination related to tourism affairs Generation of statistics and of basic information on tourism Administration of information bureaus Control and regulation of establishments in contract with visitors Specific control to resident and non-resident visitors Special civil defence services related with the protection of visitors Other services
x x x x
Total x does not apply * This column reflects the expenditure by the tourism industries in tourism promotion or other services related to the functions described,
when relevant
Table 10 of the TSA presents a few quantitative non-monetary indicators, which are important for the interpretation of the monetary information presented. The 1993 SNA states explicitly that physical indicators are an important component of satellite accounts and therefore should be viewed as a secondary part of the TSA40. The UNWTO, however, states that further work would be required to improve the link between the provisional list of non-monetary indicators and the monetary tables. Tables K to N show Table 10 of the TSA.
Table K: TSA Table 10a – Number of trips and overnights by form of tourism and class of visitor, 2010 ('000)
Inbound tourism Domestic tourism Outbound tourism
Tourists
Same-day
visitors
Total
visitors
Tourists
Same-day
visitors
Total
visitors
Tourists
Same-day
visitors
Total
visitors Number of trips or visits (*) 8 074 3 229 11 303 29 700 12 200 41 900 - - - Number of bednights - - - - - - - - -
(*) for trips involving visits to the economy and outside, count the visits. Otherwise, use the trip as a unit
40 TSA: RMF
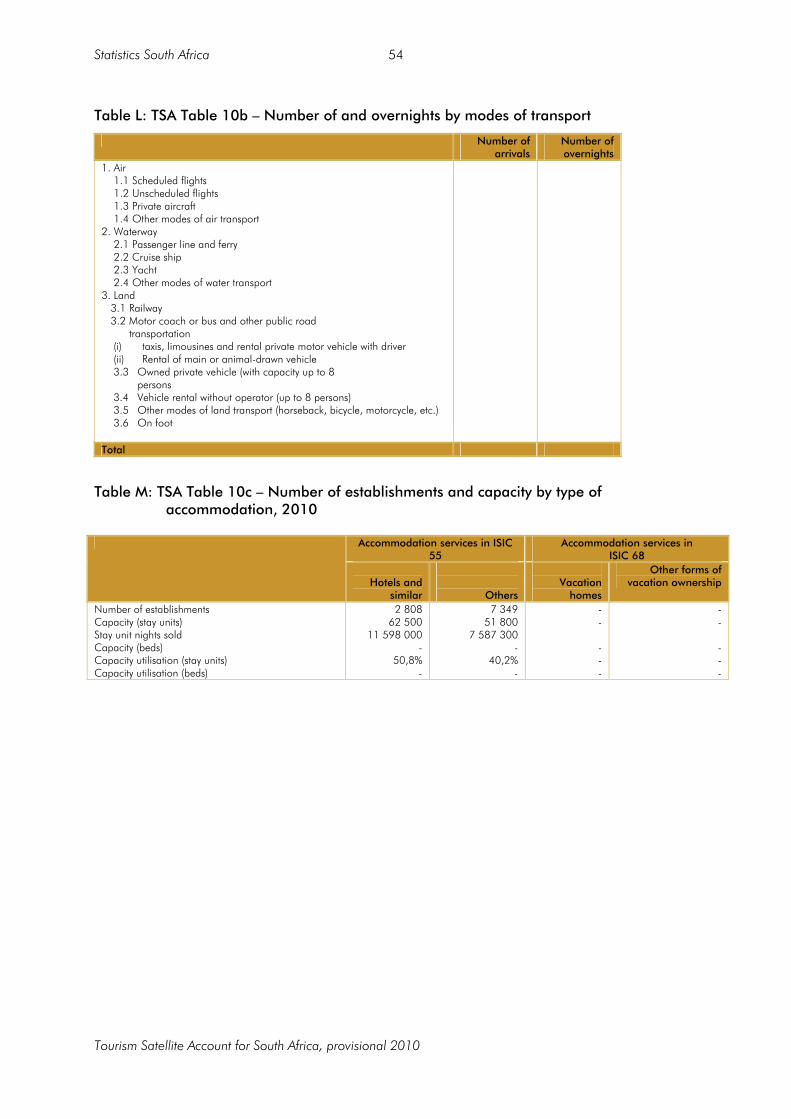
Statistics South Africa
Tourism Satellite Account for South Africa, provisional 2010
54
Table L: TSA Table 10b – Number of and overnights by modes of transport
Number of arrivals
Number of overnights
1. Air 1.1 Scheduled flights 1.2 Unscheduled flights 1.3 Private aircraft 1.4 Other modes of air transport 2. Waterway 2.1 Passenger line and ferry 2.2 Cruise ship 2.3 Yacht 2.4 Other modes of water transport 3. Land 3.1 Railway 3.2 Motor coach or bus and other public road transportation
(i) taxis, limousines and rental private motor vehicle with driver (ii) Rental of main or animal-drawn vehicle 3.3 Owned private vehicle (with capacity up to 8
persons 3.4 Vehicle rental without operator (up to 8 persons) 3.5 Other modes of land transport (horseback, bicycle, motorcycle, etc.) 3.6 On foot
Total
Table M: TSA Table 10c – Number of establishments and capacity by type of accommodation, 2010
Accommodation services in ISIC 55
Accommodation services in ISIC 68
Hotels and
similar
Others
Vacation
homes
Other forms of vacation ownership
Number of establishments 2 808 7 349 - - Capacity (stay units) 62 500 51 800 - - Stay unit nights sold 11 598 000 7 587 300 Capacity (beds) - - - - Capacity utilisation (stay units) 50,8% 40,2% - - Capacity utilisation (beds) - - - -
Statistics South Africa
Tourism Satellite Account for South Africa, provisional 2010
55
Table N: TSA Table 10d – Number of establishments in tourism industries classified according to average number of employed persons
1-4
5-9
10-19
20-49
59-99
100-249
250-499
500-999
>1000
Total
1 – Accommodation for visitors 1.a – Accommodation services for
visitors other than 1.b 1.b – Accommodation services
associated with all types of vacation home ownership
2 – Food and beverage serving industry 3 – Railways passenger transport 4 – Road passenger transport 5 – Water passenger transport 6 – Air passenger transport 7 – Transport equipment rental 8 – Travel agencies and other reservation
services 9 – Cultural industry 10 – Sport and recreational industry 11 – Retail trade of country-specific
tourism characteristic goods 12 – Country-specific tourism industries
Total establishments

Statistics South Africa
Tourism Satellite Account for South Africa, provisional 2010
56
Glossary
Domestic tourism
The tourism of resident visitors within the economic territory of the country of reference.
Domestic tourism consumption
Domestic tourism consumption is the consumption of domestic tourism; that is, the consumption incurred as a direct result of resident visitors travelling within their country of residence. These purchases might include goods or even services produced abroad or by non-residents, but sold within the domestic economy (imported goods and services).
Household final consumption expenditure
Household final consumption expenditure includes all consumption expenditure made by households from their own cash resources (including all income in cash received), as well as all the counterparts of income in kind (except social transfers in kind) that household might have received, such as remuneration in kind and other transfers in kind. It also includes the value of all consumption of output for own final use, such as those provided by second homes on own account used for tourism purposes, or what it can have received through barter transactions.
Inbound tourism Inbound tourism comprises the tourism of non-resident visitors within the economic territory of the country of reference.
Inbound tourism consumption
Inbound tourism consumption is the consumption of inbound tourism; that is, the consumption incurred as a direct result of non-resident visitors travelling to and within the given country. It is limited to purchases from providers resident in the given country. The goods purchased within the given country might have been imported by the given country.
Internal tourism Internal tourism comprises the tourism of visitors, both resident and non-resident, within the economic territory of the country of reference. Internal tourism comprises domestic tourism and inbound tourism.
Internal tourism consumption
Internal tourism consumption is the consumption of internal tourism; that is, it comprises all consumption expenditure of visitors both resident and non-resident visiting the given country (compiling economy). It is the sum of domestic tourism consumption and inbound tourism consumption. It might include goods and services imported into the country and domestically sold to visitors.
International tourism
International tourism comprises inbound tourism and outbound tourism.
Statistics South Africa
Tourism Satellite Account for South Africa, provisional 2010
57
International tourism consumption
International tourism consumption comprises inbound tourism consumption and outbound tourism consumption.
National tourism National tourism comprises the tourism of resident visitors, within and outside the economic territory of the country of reference. National tourism is the tourism by residents; that is, it comprises domestic tourism and outbound tourism.
National tourism consumption
National tourism consumption comprises all tourism consumption by resident visitors regardless of where it occurs. It includes all domestic tourism consumption and outbound tourism consumption by residents of the given country (compiling economy). These purchases may include nationally produced goods and services, imported goods purchased from resident providers, and goods and services purchased from non-resident providers, such as in countries visited.
Outbound tourism
Outbound tourism comprises the tourism of resident visitors outside the economic territory of the country of reference.
Outbound tourism consumption
Outbound tourism consumption is the consumption of outbound tourism; that is, the consumption incurred as a direct result of residents travelling to countries other than the one in which they reside. While most of this consumption happens outside the given country (compiling economy), such purchases might include goods and services produced in the visitor's country of residence and acquired for the trip. Purchases of international transportation are included in their entirety, regardless of the residence of the carrier.
Tourism Tourism comprises the activities of persons travelling to and staying in places outside their usual environment for not more than one consecutive year for leisure, business and other purposes.
Tourism-characteristic activities
Tourism-characteristic activities are those productive activities that have tourism-characteristic products as their principal output. The sum of all tourism-characteristic activities comprises the tourism industries.
Tourism-characteristic products
Tourism-characteristic products are those which, in most countries, would cease to exist in meaningful quantity, or those of which the consumption would be significantly reduced in the absence of tourism, and for which statistical information seems possible to obtain.
Tourism-connected products
Tourism-connected products are those products which are consumed by visitors in volumes which are significant for the visitor and/or the provider, but which are not included in the list of tourism-characteristic products.
Tourism-connected activities
Tourism-connected activities are those productive activities with tourism-connected products as their principal output.
Tourism consumption Tourism consumption is the total consumption expenditure made by a visitor
or on behalf of a visitor for and during his/her trip and stay at their destination.

Statistics South Africa
Tourism Satellite Account for South Africa, provisional 2010
58
Tourism demand Tourism demand is the sum of the tourism consumption, the tourism collective consumption and tourism gross fixed capital formation.
Tourism expenditure Tourism expenditure is the acquisition of goods and services by visitors or by others for their benefit through a monetary transaction for the direct satisfaction of their wants and needs for and during their stay at their destination.
Tourism gross domestic product
Tourism GDP is the GDP generated in the economy by the tourism industries and other industries in response to tourism internal consumption.
Tourism industry A tourism industry consists of a set of establishments whose principal productive activity is a tourism-characteristic activity.
Tourism internal consumption
Tourism internal consumption comprises all tourism consumption expenditure that takes place within the given country (compiling economy). It includes all domestic tourism consumption, inbound tourism consumption, and the part of outbound tourism consumption which corresponds to goods and services provided by residents. It might include goods and services imported into the economy and domestically sold to visitors. It differs from internal tourism consumption by the part of outbound tourism consumption which corresponds to goods and services provided by residents.
Tourism non-specific products
Tourism non-specific products are all other products which are not tourism-specific.
Tourism sector The tourism sector consists of the set of institutional units whose principal economic activity is a tourism-characteristic activity. These units might belong to the following institutional sectors: households, non-financial corporations (private, foreign owned, publicly owned), financial corporations, general government or non-profit institutions serving households.
Tourism-specific products
Tourism-specific products consist of the set of tourism-characteristic products and tourism-connected products.
Tourism Value Added Tourism Value Added is defined as the value added generated in the economy by the tourism industries and other industries in response to tourism internal consumption.
Traveller A traveller is any person on a trip between two or more countries, or
between two or more localities within his country of usual residence.
Usual environment To be outside the 'usual environment' the person should travel more than 40 kilometres from his/her place of residence (one way) AND the place should NOT be visited more than once a week. This includes place of work and place of study. Leisure and recreational trips are included irrespective of frequency.
Visitor A visitor is any person travelling to a place other than his usual environment for less than 12 months and whose main purpose of trip is other than the exercise of an activity remunerated from within the place visited.

Statistics South Africa
Tourism Satellite Account for South Africa, provisional 2010
59
Visitors' expenditure Visitors' expenditure are traditionally used in the analysis of tourism economy. They include expenditure on goods and services consumed by visitors for and during their trips and stay at destination. It corresponds with the monetary transactions component of tourism consumption.
Statistics South Africa
Tourism Satellite Account for South Africa, provisional 2010
60
Related Tourism Satellite Account publications
Statistics South Africa, 2005. Status of the tourism satellite account in South Africa. Discussion document (D0405.3). Pretoria: Statistics South Africa. Statistics South Africa, 2007. Country experience in the compilation of Tourism Satellite Accounts. Discussion document (D0405.4). Pretoria: Statistics South Africa. Statistics South Africa, 2007. Statistics of the Tourism Satellite Account and assessment of data sources related to tourism in South Africa. Discussion document (D0405.5). Pretoria: Statistics South Africa. Statistics South Africa, 2007. Linking Government Strategies and the Tourism Satellite Account in South Africa. Discussion document (D0405.6). Pretoria: Statistics South Africa. Statistics South Africa, 2009. Draft Tourism Satellite Account for South Africa, 2005. Discussion document (D0405.7). Pretoria: Statistics South Africa. Statistics South Africa, 2010. Tourism Satellite Account for South Africa, final 2005 and provisional 2006 to 2008. Report No: 04-05-07. Pretoria: Statistics South Africa. Statistics South Africa, 2011. Tourism Satellite Account for South Africa, provisional 2009. Report No: 04-05-07. Pretoria, Statistics South Africa. Statistics South Africa, 2011. Tourism Satellite Account for South Africa, final 2006 and 2007 and provisional 2008 and 2009. Report No: 04-05-07. Pretoria, Statistics South Africa.