
Nano-scale measurement of biomolecules by optical microscopy and semiconductor nanoparticles
13
REVIEW ARTICLE published: 29 July 2014 doi: 10.3389/fphys.2014.00273 Nano-scale measurement of biomolecules by optical microscopy and semiconductor nanoparticles Taro Ichimura 1 , Takashi Jin 2,3,4 , Hideaki Fujita 1,4 , Hideo Higuchi 5 and Tomonobu M. Watanabe 1,3,4 * 1 Laboratory for Comprehensive Bioimaging, RIKEN Quantitative Biology Center, Suita, Osaka, Japan 2 Laboratory for Nano-Bio Probes, RIKEN Quantitative Biology Center, Suita, Osaka, Japan 3 Graduate School of Frontier Biosciences, Osaka University, Suita, Osaka, Japan 4 WPI, Immunology Frontier Research Center, Osaka University, Suita, Osaka, Japan 5 Department of Physics, School of Science, The University of Tokyo, Bunkyo, Tokyo, Japan Edited by: Rinshi S. Kasai, Institute for Frontier Medical Sciences, Japan Reviewed by: Takahiro Fujiwara, Kyoto University, Japan Yajima Junichiro, Tokyo, Japan *Correspondence: Tomonobu M. Watanabe, Laboratory for Comprehensive Bioimaging, RIKEN Quantitative Biology Center, 6-2-3,Furuie-dai, Suita, Osaka 565-0874, Japan e-mail: [email protected] Over the past decade, great developments in optical microscopy have made this technology increasingly compatible with biological studies. Fluorescence microscopy has especially contributed to investigating the dynamic behaviors of live specimens and can now resolve objects with nanometer precision and resolution due to super-resolution imaging. Additionally, single particle tracking provides information on the dynamics of individual proteins at the nanometer scale both in vitro and in cells. Complementing advances in microscopy technologies has been the development of fluorescent probes. The quantum dot, a semi-conductor fluorescent nanoparticle, is particularly suitable for single particle tracking and super-resolution imaging. This article overviews the principles of single particle tracking and super resolution along with describing their application to the nanometer measurement/observation of biological systems when combined with quantum dot technologies. Keywords: single particle tracking, super-resolution, fluorescent microscopy, quantum dot, nanoparticle INTRODUCTION Fluorescence microscopy has become standard for studying the dynamic behavior of biological phenomena such as the expres- sion, movement, and localization of proteins and other molecules (Ellinger, 1940; Lichtman and Conchello, 2005; Drummen, 2012; Miyawaki, 2013; Peter et al., 2014). Optical diffraction, how- ever, limits the spatial resolution to several 100 nanometers, denying information on many details about these phenomena (Abbe, 1873). Two technologies have since overcome this lim- itation and permit the observation of even smaller nano-scale dynamics: single particle tracking (Ritchie and Kusumi, 2003; Saxton, 2009; Chenouard et al., 2014) and super-resolution microscopy (Schermelleh et al., 2010; Galbraith and Galbraith, 2011; Leung and Chou, 2011). Single particle tracking pur- sues the position of single fluorescent probes conjugated to separate target proteins over a two-dimensional (2D) plane. Super-resolution microscopy, on the other hand, provides highly resolved optical images beyond the aforementioned spatial resolution. To conduct the above imaging techniques, it is often required to label the target protein with a fluorescent probe. Fluorescent proteins are most popular for this purpose because of their sim- ple and easy labeling procedure in live cells (Shimomura and Johnson, 1692; Tsien, 1998; Nifosí et al., 2007). Organic dyes are also common because of their wide application (Wombacher and Cornish, 2011; Wysocki and Lavis, 2011; Terai and Nagano, 2013). Another group of probes gaining attention is inorganic nanopar- ticles made of semiconductors, metals, silicon, etc. (Ruedas-Rama et al., 2012; Chinnathambi et al., 2014; Cupaioli et al., 2014). Although usually larger than fluorescent proteins and organic dyes, inorganic nanoparticles have generally stronger and more stable fluorescence profiles, which makes them applicable not only to basic research, but also to clinical studies (Byers and Hitchman, 2010; Choi and Frangioni, 2010; Saadeh et al., 2014; Wang and Wang, 2014). Furthermore, these same properties make them well suited for single particle tracking methods (Chang et al., 2008; Saxton, 2008; Barroso, 2011; Bruchez, 2011; Clausen and Lagerholm, 2011; Ruthardt et al., 2011; Pierobon and Cappello, 2012; Kairdolf et al., 2013; Petryayeva et al., 2013). This review article focuses on advanced microscopy using quantum dots (Qdots), perhaps the most studied of inorganic nanoparticles for biological application (Pilla et al., 2012). Single particle tracking using Qdots has reached three dimensions (X, Y, Z) (Genovesio et al., 2006; Holtzer et al., 2007; Watanabe and Higuchi, 2007; Watanabe et al., 2007; Ram et al., 2008, 2012; Wells et al., 2008, 2010; Yajima et al., 2008), and more recently has even reached four dimensions (X, Y, Z, θ or X, Y, θ, ϕ) (Ohmachi et al., 2012; Watanabe et al., 2013). For all their ben- efits, Qdots do have drawbacks, however, including high blinking (Nirmal et al., 1996; van Sark et al., 2001; Schlegel et al., 2002; Hohng and Ha, 2004; Ko et al., 2011) and a spectral blue-shift during observation (Nirmal et al., 1996; van Sark et al., 2002; Hoyer et al., 2011), which complicate the continuous tracking of the single particle and emerge due to photo-oxidation while under high-power illumination. These limitations have stimu- lated research into new super-resolution microscopy methods (Lidke et al., 2005; Dertinger et al., 2009; Watanabe et al., 2010; Chien et al., 2011; Hoyer et al., 2011; Deng et al., 2014). www.frontiersin.org July 2014 | Volume 5 | Article 273 | 1
-
Upload
independent -
Category
Documents
-
view
2 -
download
0
Transcript of Nano-scale measurement of biomolecules by optical microscopy and semiconductor nanoparticles
REVIEW ARTICLEpublished: 29 July 2014
doi: 10.3389/fphys.2014.00273
Nano-scale measurement of biomolecules by opticalmicroscopy and semiconductor nanoparticlesTaro Ichimura1, Takashi Jin2,3,4, Hideaki Fujita1,4, Hideo Higuchi5 and Tomonobu M. Watanabe1,3,4*
1 Laboratory for Comprehensive Bioimaging, RIKEN Quantitative Biology Center, Suita, Osaka, Japan2 Laboratory for Nano-Bio Probes, RIKEN Quantitative Biology Center, Suita, Osaka, Japan3 Graduate School of Frontier Biosciences, Osaka University, Suita, Osaka, Japan4 WPI, Immunology Frontier Research Center, Osaka University, Suita, Osaka, Japan5 Department of Physics, School of Science, The University of Tokyo, Bunkyo, Tokyo, Japan
Edited by:
Rinshi S. Kasai, Institute for FrontierMedical Sciences, Japan
Reviewed by:
Takahiro Fujiwara, Kyoto University,JapanYajima Junichiro, Tokyo, Japan
*Correspondence:
Tomonobu M. Watanabe,Laboratory for ComprehensiveBioimaging, RIKEN QuantitativeBiology Center, 6-2-3,Furuie-dai,Suita, Osaka 565-0874, Japane-mail: [email protected]
Over the past decade, great developments in optical microscopy have made thistechnology increasingly compatible with biological studies. Fluorescence microscopy hasespecially contributed to investigating the dynamic behaviors of live specimens and cannow resolve objects with nanometer precision and resolution due to super-resolutionimaging. Additionally, single particle tracking provides information on the dynamics ofindividual proteins at the nanometer scale both in vitro and in cells. Complementingadvances in microscopy technologies has been the development of fluorescent probes.The quantum dot, a semi-conductor fluorescent nanoparticle, is particularly suitable forsingle particle tracking and super-resolution imaging. This article overviews the principlesof single particle tracking and super resolution along with describing their applicationto the nanometer measurement/observation of biological systems when combined withquantum dot technologies.
Keywords: single particle tracking, super-resolution, fluorescent microscopy, quantum dot, nanoparticle
INTRODUCTIONFluorescence microscopy has become standard for studying thedynamic behavior of biological phenomena such as the expres-sion, movement, and localization of proteins and other molecules(Ellinger, 1940; Lichtman and Conchello, 2005; Drummen, 2012;Miyawaki, 2013; Peter et al., 2014). Optical diffraction, how-ever, limits the spatial resolution to several 100 nanometers,denying information on many details about these phenomena(Abbe, 1873). Two technologies have since overcome this lim-itation and permit the observation of even smaller nano-scaledynamics: single particle tracking (Ritchie and Kusumi, 2003;Saxton, 2009; Chenouard et al., 2014) and super-resolutionmicroscopy (Schermelleh et al., 2010; Galbraith and Galbraith,2011; Leung and Chou, 2011). Single particle tracking pur-sues the position of single fluorescent probes conjugated toseparate target proteins over a two-dimensional (2D) plane.Super-resolution microscopy, on the other hand, provides highlyresolved optical images beyond the aforementioned spatialresolution.
To conduct the above imaging techniques, it is often requiredto label the target protein with a fluorescent probe. Fluorescentproteins are most popular for this purpose because of their sim-ple and easy labeling procedure in live cells (Shimomura andJohnson, 1692; Tsien, 1998; Nifosí et al., 2007). Organic dyes arealso common because of their wide application (Wombacher andCornish, 2011; Wysocki and Lavis, 2011; Terai and Nagano, 2013).Another group of probes gaining attention is inorganic nanopar-ticles made of semiconductors, metals, silicon, etc. (Ruedas-Ramaet al., 2012; Chinnathambi et al., 2014; Cupaioli et al., 2014).
Although usually larger than fluorescent proteins and organicdyes, inorganic nanoparticles have generally stronger and morestable fluorescence profiles, which makes them applicable notonly to basic research, but also to clinical studies (Byers andHitchman, 2010; Choi and Frangioni, 2010; Saadeh et al., 2014;Wang and Wang, 2014). Furthermore, these same propertiesmake them well suited for single particle tracking methods(Chang et al., 2008; Saxton, 2008; Barroso, 2011; Bruchez, 2011;Clausen and Lagerholm, 2011; Ruthardt et al., 2011; Pierobon andCappello, 2012; Kairdolf et al., 2013; Petryayeva et al., 2013).
This review article focuses on advanced microscopy usingquantum dots (Qdots), perhaps the most studied of inorganicnanoparticles for biological application (Pilla et al., 2012). Singleparticle tracking using Qdots has reached three dimensions (X,Y, Z) (Genovesio et al., 2006; Holtzer et al., 2007; Watanabe andHiguchi, 2007; Watanabe et al., 2007; Ram et al., 2008, 2012;Wells et al., 2008, 2010; Yajima et al., 2008), and more recentlyhas even reached four dimensions (X, Y, Z, θ or X, Y, θ, ϕ)(Ohmachi et al., 2012; Watanabe et al., 2013). For all their ben-efits, Qdots do have drawbacks, however, including high blinking(Nirmal et al., 1996; van Sark et al., 2001; Schlegel et al., 2002;Hohng and Ha, 2004; Ko et al., 2011) and a spectral blue-shiftduring observation (Nirmal et al., 1996; van Sark et al., 2002;Hoyer et al., 2011), which complicate the continuous trackingof the single particle and emerge due to photo-oxidation whileunder high-power illumination. These limitations have stimu-lated research into new super-resolution microscopy methods(Lidke et al., 2005; Dertinger et al., 2009; Watanabe et al., 2010;Chien et al., 2011; Hoyer et al., 2011; Deng et al., 2014).
www.frontiersin.org July 2014 | Volume 5 | Article 273 | 1
Ichimura et al. Nanometry of biomolecules with quantum dot
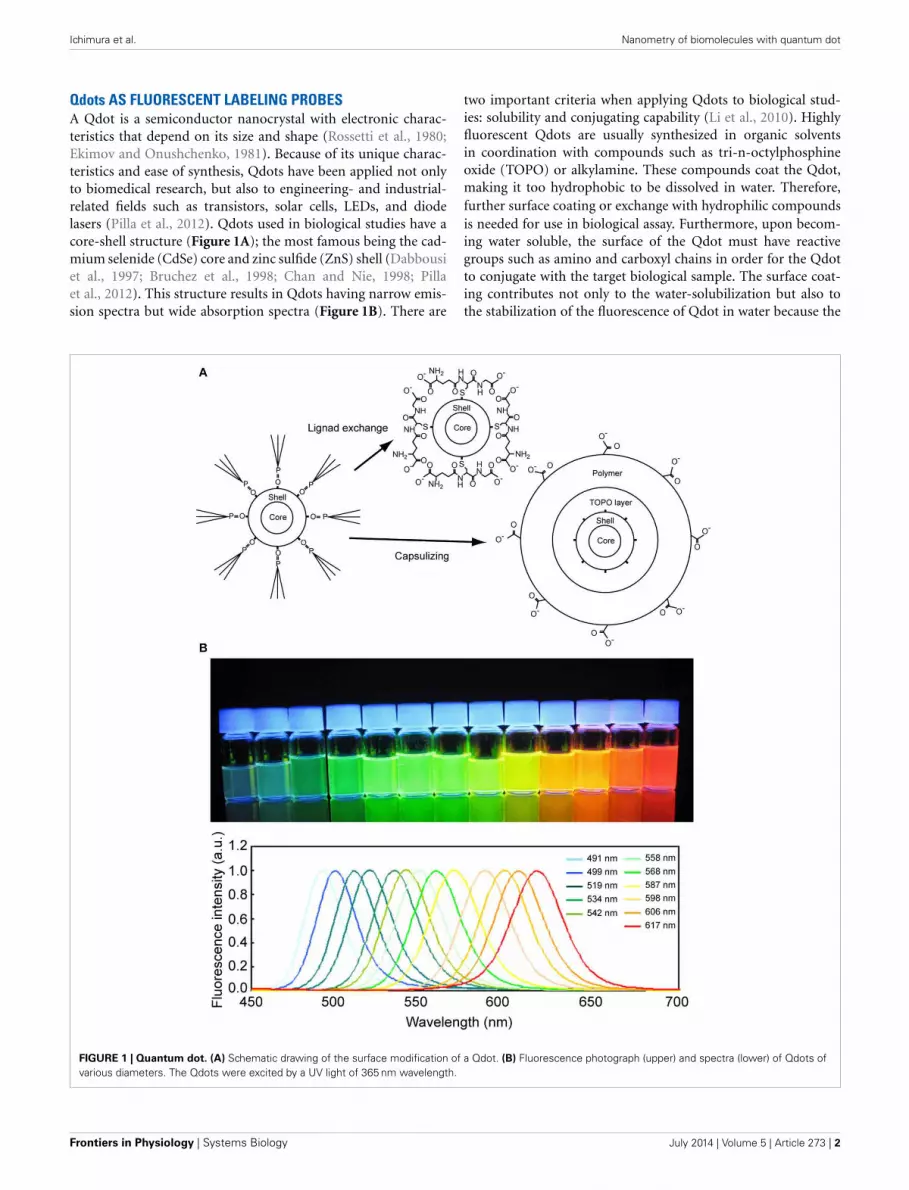
Qdots AS FLUORESCENT LABELING PROBESA Qdot is a semiconductor nanocrystal with electronic charac-teristics that depend on its size and shape (Rossetti et al., 1980;Ekimov and Onushchenko, 1981). Because of its unique charac-teristics and ease of synthesis, Qdots have been applied not onlyto biomedical research, but also to engineering- and industrial-related fields such as transistors, solar cells, LEDs, and diodelasers (Pilla et al., 2012). Qdots used in biological studies have acore-shell structure (Figure 1A); the most famous being the cad-mium selenide (CdSe) core and zinc sulfide (ZnS) shell (Dabbousiet al., 1997; Bruchez et al., 1998; Chan and Nie, 1998; Pillaet al., 2012). This structure results in Qdots having narrow emis-sion spectra but wide absorption spectra (Figure 1B). There are
two important criteria when applying Qdots to biological stud-ies: solubility and conjugating capability (Li et al., 2010). Highlyfluorescent Qdots are usually synthesized in organic solventsin coordination with compounds such as tri-n-octylphosphineoxide (TOPO) or alkylamine. These compounds coat the Qdot,making it too hydrophobic to be dissolved in water. Therefore,further surface coating or exchange with hydrophilic compoundsis needed for use in biological assay. Furthermore, upon becom-ing water soluble, the surface of the Qdot must have reactivegroups such as amino and carboxyl chains in order for the Qdotto conjugate with the target biological sample. The surface coat-ing contributes not only to the water-solubilization but also tothe stabilization of the fluorescence of Qdot in water because the
FIGURE 1 | Quantum dot. (A) Schematic drawing of the surface modification of a Qdot. (B) Fluorescence photograph (upper) and spectra (lower) of Qdots ofvarious diameters. The Qdots were excited by a UV light of 365 nm wavelength.
Frontiers in Physiology | Systems Biology July 2014 | Volume 5 | Article 273 | 2

Ichimura et al. Nanometry of biomolecules with quantum dot
photophysical properties are well affected by the surface coating(Kuno et al., 1997; Kloepfer et al., 2005). Some surface coatingmethods suppress the blinking that is a drawback of Qdot (Hohngand Ha, 2004; Fomenko and Nesbitt, 2008; Mandal and Tamai,2011; Zhang et al., 2013).
There are mainly two ways to prepare water-soluble Qdots(Figure 1A) (Erathodiyil and Ying, 2011; Zhang and Clapp,2011). The first is to encapsulate a hydrophobic Qdot with anamphiphilic polymer or phospholipid (Dubertret et al., 2002; Gaoet al., 2005; Li et al., 2010; Tomczak et al., 2013). The second is aligand-exchange method in which the capping hydrophobic lig-ands are exchanged with hydrophilic ones (Gerion et al., 2001;Guo et al., 2003; Pinaud et al., 2004; Kim et al., 2005; Nann, 2005;Jiang et al., 2006; Dubois et al., 2007). While the water-solubilizedQdot obtained by the first method is more stable and suitable forcommercialization, its size increases to about 20∼40 nm, whichrisks steric hindrance against the function of the target protein(Li et al., 2010). The ligand-exchange method is inferior in sta-bility, but is a simpler synthesis process and produces a smallerQdot. The thin coating layer is another advantage of this method,as it reduces the risk of steric effects that could compromise thefunction of the protein upon conjugation with the Qdot.
Many coating agents exist for the ligand-exchange method.These include mercaptocarboxylic acid (Jiang et al., 2006), car-bon disulfide (Dubois et al., 2007), thiosilanol (Gerion et al.,2001), dendrimer (Guo et al., 2003), peptide (Pinaud et al., 2004),phosphine oxide (Kim et al., 2005), and polyethylenimine (Nann,2005). Coating agents can also sometimes functionalize Qdotsfor specific purposes. Examples include β-cyclodextrin for ion-sensing (Palaniappan et al., 2004), cyclodextrin for redox-activesubstrates (Palaniappan et al., 2006), and cyclodextrin thiol forpH-sensing (Cao et al., 2006). We usually use glutathione asthe coating compound because of its easier preparation, whichrequires only the mixing of hydrophobic Qdots with an aque-ous glutathione solution (Jin et al., 2008; Tiwari et al., 2009).Glutathione-coated Qdots have two reactive groups (amino andcarboxyl) that enable easy conjugation with the target protein andshow no cytotoxity (Tiwari et al., 2009). They can also be keptmono-dispersed in solution for 3 months after solubilization.
FLUORESCENCE MICROSCOPY FOR NANO-SCALEMEASUREMENTS/OBSERVATIONSThe microscopy introduced in this review requires a reg-ular wide-field fluorescence microscope and no complicatedoptical principles nor devices (Figure 2A). However, becausenano-scale measurements require a high signal-to-noise ratio, ahighly photon-sensitive camera, such as an electron multiplyingcharge coupled device (EMCCD) camera, is recommended. Morerecently, complementary metal-oxide-semiconductor (sCMOS)cameras have become available as alternatives (Huang et al., 2011;Long et al., 2012; Ma et al., 2013). The vibration and/or stagedrift of the microscope should also be considered, as these cancause artifacts in the measurement by obscuring the behaviorand structure of the target. Consequently, the microscope shouldbe set on a vibration-isolation table and built with as minimalheight and maximal rigidity as possible to decrease any vibra-tion. Because thermal expansion of the metals composing the
FIGURE 2 | Microscopic system for nanometery. (A) Photograph of atypical microscopy setup. The system is mainly composed of an invertedfluorescent microscope (Olympus IX71), an objective lens (Olympus 60×PlanApo, 1.45 NA, oil immersion) and EMCCD camera (Andor iXon887 or867). (B) The stage and objective revolver are made of duralumin andcustom built. (C) Vibrations caused by different components of themicroscope: all components rigidly fixed (upper), all components except thecamera rigidly fixed (middle), and substitution of the mono-objectiverevolver with a 6-position revolver (lower). Red, X-position. Blue, Y-position.The stage position was determined by measuring the position of a glassbead absorbed on the sample surface.
www.frontiersin.org July 2014 | Volume 5 | Article 273 | 3

Ichimura et al. Nanometry of biomolecules with quantum dot
microscope causes drifts in the stage and focus position, micro-scopes made of metals with lower thermal expansion such as invarare generally preferred (Figure 2B). The drifts can be further sup-pressed by setting the microscopic system in a room with constanttemperature and humidity.
Here we show one strategy for reducing vibrations. The tran-sition images of a silica bead with 1 μm diameter absorbedon a coverslip surface were acquired with excess illumina-tion so that the camera gain could be set to zero. The framerate was 2.0 ms, the images were acquired for 1.0 s, and theprecise position (X, Y) of the bead was calculated by imageanalysis. In our usual setup, the position of the bead waskept stable within 0.7 nm in the X-axis and 0.4 nm in the Y-axis (Figure 2C, upper). When a screw to fix the CCD cam-era was loosened, the vibration increased to 0.8 nm in bothaxes (Figure 2C, middle). Normally, we use a mono-objectiverevolver, but when instead a commercially-available 6-positionrevolver was used, we found the vibration enhanced in the Y-axis to 2 nm (Figure 2C, bottom). Thus, rigid construction ofthe microscope is paramount for nano-scale measurements andobservations.
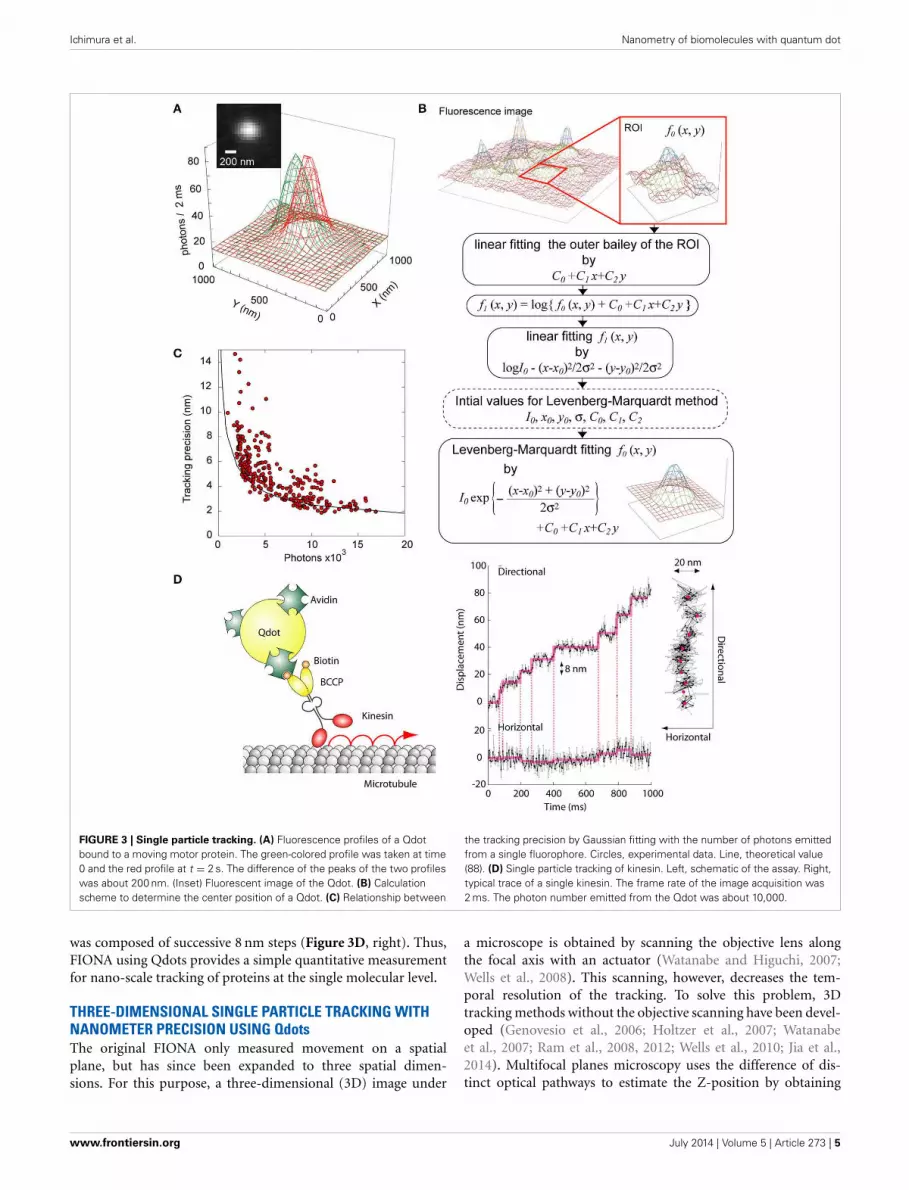
SINGLE PARTICLE TRACKING WITH NANOMETERPRECISION USING QdotsSingle particle tracking is well applied for studies of motorproteins and membrane proteins, because resolving nano-scalemovements is necessary for understanding the protein function(Ritchie and Kusumi, 2003; Park et al., 2007; Toprak and Selvin,2007; Saxton, 2009). Although the resolution of conventionalfluorescence microscopes is constrained by the diffraction limit,the 2D position of a single particle can be determined by cal-culating the weight center of the image of the fluorescent spot(Figure 3A). The fluorescence emitted from a fluorescent probeforms a point spread function (PSF) that can be fitted with aGaussian distribution as
f(x, y
) = I0 · exp
{− (x − x0)2 + (y − y0)2
2 · σ 2
}+ C,
where I0 and (x0, y0) are the fluorescence intensity and theposition of the fluorescing center, respectively, σ is the radialstandard deviation of the Gaussian function, and C is the back-ground fluorescence. This analysis can be used to measure thecenter position of the image (Kubitscheck et al., 2000; Cheezumet al., 2001; Thompson et al., 2002; Small and Stahlheber, 2014).Though there are other common methods for determining thecenter, including cross-correlation, sum-absolute difference, andsimple centroid, Gaussian fitting has the highest robustness atlow signal-to-noise ratios, which is common in biological studies(Thompson et al., 2002). In our case, the actual fitting compu-tation is done by the Levenberg-Marquardt method (Levenberg,1944). A practical example of our fitting is described below(Figure 3B). Because the background baseline is not always uni-form in live-cell observations, we added additional parametersinto the C term to fit the local background fluorescence with atilted plane,
f(x, y
) = I0 · exp
{− (x − x0)
2 + (y − y0
)2 · σ 2
2}
+ C0 + C1x + C2y.
This equation assumes the small area inside the region of interest(ROI) can be approximated by the plane. The initial parameters ofthe fitting are calculated by the linear least-square method for C0,C1, and C2 using only the outer boundary of the ROI. Because thelogarithm of the subtraction between f (x0, y0) and C0 + C1x +C2y is a simple quadratic function, the other initial parameters areobtained by the linear least-square method, too. Setting the ini-tial values close to the true values by these simple pre-calculationsallows us to effectively reduce the number of the loop iterationsin the Levenberg-Marquardt method.
The calculation precision by Gaussian fitting strongly dependson the photon number that the detection device receives fromthe emission of the fluorescent probe and can be as small as afew nanometers (Figure 3C) (Deschout et al., 2014; Small andStahlheber, 2014). The method described above is called fluo-rescence imaging with one-nanometer accuracy (FIONA) andhas quickly become a standard in the field (Yildiz et al., 2003;Yildiz and Selvin, 2005; Park et al., 2007; Hoffman et al., 2011).However, the number of photons emitted by single organic dyesand fluorescent protein molecules before photobleaching, about110,000 (Kubitscheck et al., 2000), is too low for the observa-tion of protein movement over a long time. Since the cause ofphotobleaching is thought to be oxygen collisions with the dyemolecule in its excited state, it can be mitigated by the addition ofoxygen scavengers (Sambongi et al., 1999; Adachi et al., 2000).Thus, the photon number from a single dye molecule can beincreased to 1.4 million photons before photobleaching (Yildizand Selvin, 2005). Meanwhile, Qdots show slight photobleach-ing and strong fluorescence even in the absence of scavengers(Bruchez et al., 1998). Though non-fluorescent nano-particlessuch as gold nano-particles are becoming increasingly popular forprecise and long-term tracking using absorption (Kusumi et al.,2005; Lasne et al., 2006) or scattering (Nishikawa et al., 2010), theQdot is still preferred in biological studies because of its widercolor spectrum.
We investigated the relationship between the tracking preci-sion and the average number of photons emitted from a Qdot(Figure 3C). The tracking precision was defined as the standarddeviation of 100 data obtained with a Qdot immobilized on aglass surface in our case. While the experimental accuracy was alittle lower than the theoretical expectation because of high blink-ing, it was still 2 nm when the photon number from a Qdot was15,000 per exposure. To demonstrate the potential of single par-ticle tracking as a biological tool, we measured the movementof kinesin, a microtubule-mediated motor protein (Figure 3D).The motor domain of the kinesin was fused with biotin careerprotein (BCCP) and conjugated with a Qdot via biotin-avidinaffinity. The Qdot-labeled kinesin were then bound to micro-tubules adsorbed onto a cover slip. Upon adding 1 mM ATP, theQdot was seen to move unidirectionally along the microtubulewithout detaching, which is consistent with kinesin using ATP tomove (Figure 3D, left). The unidirectional movement of kinesin
Frontiers in Physiology | Systems Biology July 2014 | Volume 5 | Article 273 | 4
Ichimura et al. Nanometry of biomolecules with quantum dot
FIGURE 3 | Single particle tracking. (A) Fluorescence profiles of a Qdotbound to a moving motor protein. The green-colored profile was taken at time0 and the red profile at t = 2 s. The difference of the peaks of the two profileswas about 200 nm. (Inset) Fluorescent image of the Qdot. (B) Calculationscheme to determine the center position of a Qdot. (C) Relationship between
the tracking precision by Gaussian fitting with the number of photons emittedfrom a single fluorophore. Circles, experimental data. Line, theoretical value(88). (D) Single particle tracking of kinesin. Left, schematic of the assay. Right,typical trace of a single kinesin. The frame rate of the image acquisition was2 ms. The photon number emitted from the Qdot was about 10,000.
was composed of successive 8 nm steps (Figure 3D, right). Thus,FIONA using Qdots provides a simple quantitative measurementfor nano-scale tracking of proteins at the single molecular level.
THREE-DIMENSIONAL SINGLE PARTICLE TRACKING WITHNANOMETER PRECISION USING QdotsThe original FIONA only measured movement on a spatialplane, but has since been expanded to three spatial dimen-sions. For this purpose, a three-dimensional (3D) image under
a microscope is obtained by scanning the objective lens alongthe focal axis with an actuator (Watanabe and Higuchi, 2007;Wells et al., 2008). This scanning, however, decreases the tem-poral resolution of the tracking. To solve this problem, 3Dtracking methods without the objective scanning have been devel-oped (Genovesio et al., 2006; Holtzer et al., 2007; Watanabeet al., 2007; Ram et al., 2008, 2012; Wells et al., 2010; Jia et al.,2014). Multifocal planes microscopy uses the difference of dis-tinct optical pathways to estimate the Z-position by obtaining
www.frontiersin.org July 2014 | Volume 5 | Article 273 | 5

Ichimura et al. Nanometry of biomolecules with quantum dot
simultaneously the fluorescence intensities of several focal images(Toprak et al., 2007; Watanabe et al., 2007; Dalgarno et al., 2010;Juette and Bewersdorf, 2010; Ram et al., 2012). Similarly, 3Dtracking using a photon-limited double-helix response systemwith a spatial light modulator, which has two twisting lobes alongthe optical axis of the image, results in a single fluorescent probeappearing as two fluorescent spots from which the Z-position canbe determined (Pavani et al., 2009; Lew et al., 2010).
One of the simplest 3D tracking methods intentionally gener-ates astigmatism (Kao and Verkman, 1994; Holtzer et al., 2007;Izeddin et al., 2012). Here, a pair of convex and concave cylindri-cal lenses is inserted into the optical pathway before the detectiondevice (Figure 4A) (Watanabe et al., 2013). These lenses generatedifferent optical path lengths along the X- and Y-axes, resulting ina measurable relationship between the Z-position of the particleand the ellipticity of the PSF (Figure 4B). To calculate the ellip-ticity in addition to the 2D position, the below approximationformula is used
f(x, y
) = I0 · exp
{− (x − x0)
2 · σ 2x
2}
· exp
{−
(y − y0
)2 · σ 2
y
2}
+ C0 + C1x + C2y,
where σx and σy are the radial standard deviations of the Gaussianfunction along the X- and Y-axes respectively. The ellipticity isdefined as the ratio of the full width at half maximum (FWHM)of the 2D Gaussian in the X- and Y- axes due to the differ-ent focal lengths (Figure 4C). Changing the distance betweenthe convex and concave cylindrical lenses permits astigmatismfor optimal tracking resolution (Figure 4D). When the detec-tion device received 15,000 photons from a fluorescent probe,we achieved 3D tracking with precisions of 2 nm in the X andY-axes and 5 nm along the Z-axis (Figure 4E). However, a reli-able range was limited between a field view of −800 and 800 nm(Figure 4D, lower and Figure 4E). This drawback is common inmany 3D tracking methods. A new 3D tracking method basedon Airy beams, however, overcomes this problem. Here, a diffrac-tion free self-bending PSF is applied to a two-channeled detectionsystem (Jia et al., 2014), and the Z-position is translated to thedistance difference of the two X-positions of the two channels.This method elongates the dynamic range of 3D tracking to 3 μm.Regardless of the 3D tracking method, the key is to extract Zinformation from the XY projection.
FOUR-DIMENSIONAL SINGLE PARTICLE USING POLARIZEDQdotsAs significant as acquiring the third spatial dimension is, 3D sin-gle particle tracking ignores any rotational movement made bythe protein. To acquire the orientation, fluorescence anisotropycan be used, because the fluorescence emissions are of unequalintensities along the P and S polar axes (P- and S-polarization),which are defined by the polarizing beam-splitter, as describedbelow (Werver, 1953; Albrecht, 1961; Harms et al., 1999).Anisotropy is defined as (Ip−Is)/(Ip+Is), where Ip and Is arethe intensities in P- and S-polarization, respectively (Harms et al.,1999). Anisotropy measurements have successfully tracked therotatory dynamics of single protein molecules in vitro (Sase et al.,
FIGURE 4 | 3D single particle tracking using a pair of convex and
concave cylindrical lens. (A) Schematic drawing of the optical setup for3D single particle tracking. CvC, convex cylindrical lens; CnC, concavecylindrical lens. (B) Fluorescent images of a single fluorescent bead with adiameter of 100 nm at various Z-positions (−1000 to 1000 nm). (C) Radialvariances in the X-axis (FWx, red in upper panel) and Y-axis (FWy, blue inupper panel) of the Gaussian function, and ellipticity (lower panel) of asingle fluorescent bead as a function of the Z-position (−1600 to 1600 nm).(D) Calculated precision in the X- (red) and Z-directions (green) as a functionof distance between CvC and CnC. (E) Calculated precision in the X-, Y-,and Z-directions (red, blue, and green, respectively) as a function ofZ-position when the camera received 15,000 photons from a fluorophore.The 3D tracking precisions was 2 nm in the X- and Y-axes and 5 nm alongthe Z-axis. Error bars represent standard deviations of 20 data.
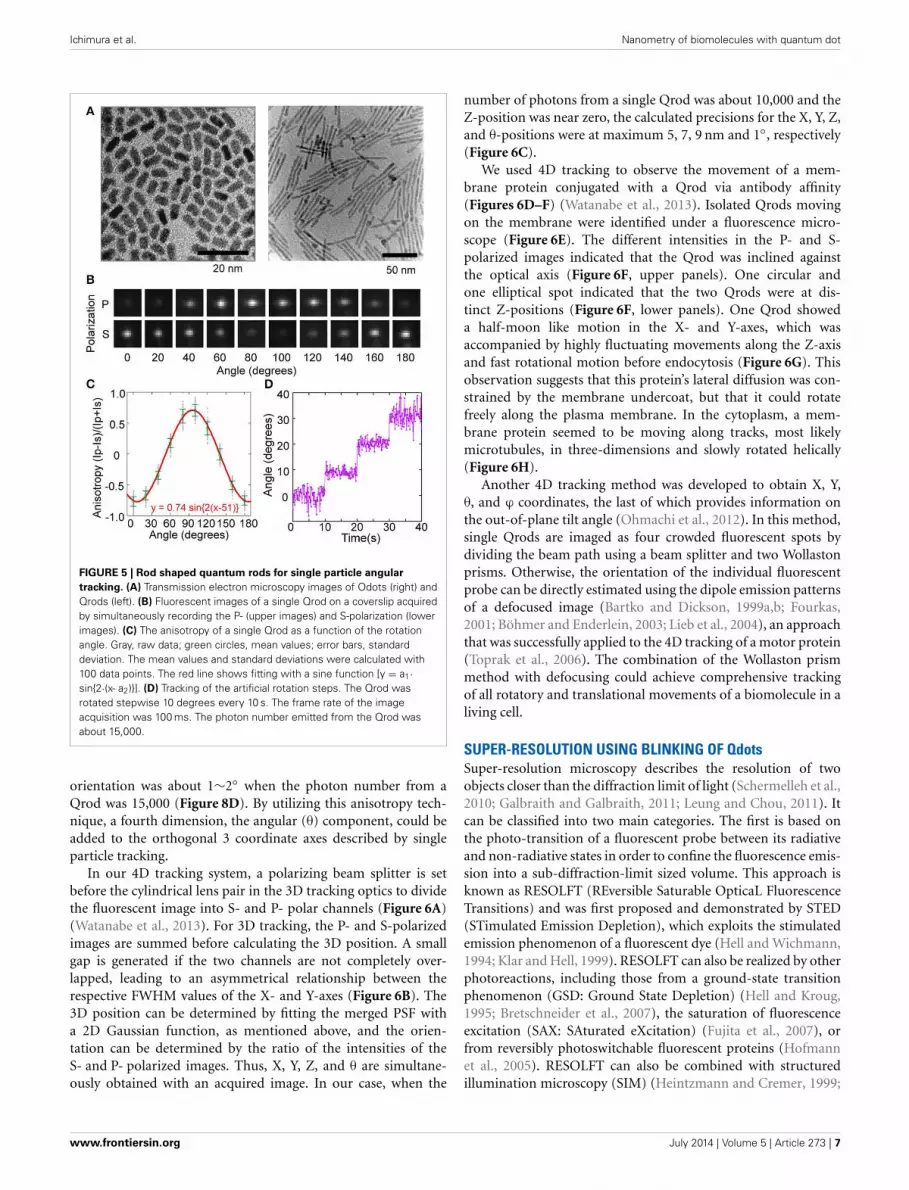
1997; Forkey et al., 2003) and in cells (Mizuno et al., 2011). Thefluorescence anisotropy of a Qdot depends on the aspect ratio ofits shape (Peng et al., 2000; Hu et al., 2001; Deka et al., 2009).Taking advantage of this property, a highly polarized rod-shapedQdot (Qrod) can be synthesized by elongating the CdS shell alongone-axis of the CdSe core (Figure 5A) (Peng et al., 2000; Huet al., 2001). The anisotropy changes in Qrod fluorescence canbe described as a sine function (Figures 5B,C) and the angularposition by the arcsine function. The tracking precision of the
Frontiers in Physiology | Systems Biology July 2014 | Volume 5 | Article 273 | 6
Ichimura et al. Nanometry of biomolecules with quantum dot
FIGURE 5 | Rod shaped quantum rods for single particle angular
tracking. (A) Transmission electron microscopy images of Odots (right) andQrods (left). (B) Fluorescent images of a single Qrod on a coverslip acquiredby simultaneously recording the P- (upper images) and S-polarization (lowerimages). (C) The anisotropy of a single Qrod as a function of the rotationangle. Gray, raw data; green circles, mean values; error bars, standarddeviation. The mean values and standard deviations were calculated with100 data points. The red line shows fitting with a sine function [y = a1·sin{2·(x- a2)}]. (D) Tracking of the artificial rotation steps. The Qrod wasrotated stepwise 10 degrees every 10 s. The frame rate of the imageacquisition was 100 ms. The photon number emitted from the Qrod wasabout 15,000.
orientation was about 1∼2◦ when the photon number from aQrod was 15,000 (Figure 8D). By utilizing this anisotropy tech-nique, a fourth dimension, the angular (θ) component, could beadded to the orthogonal 3 coordinate axes described by singleparticle tracking.
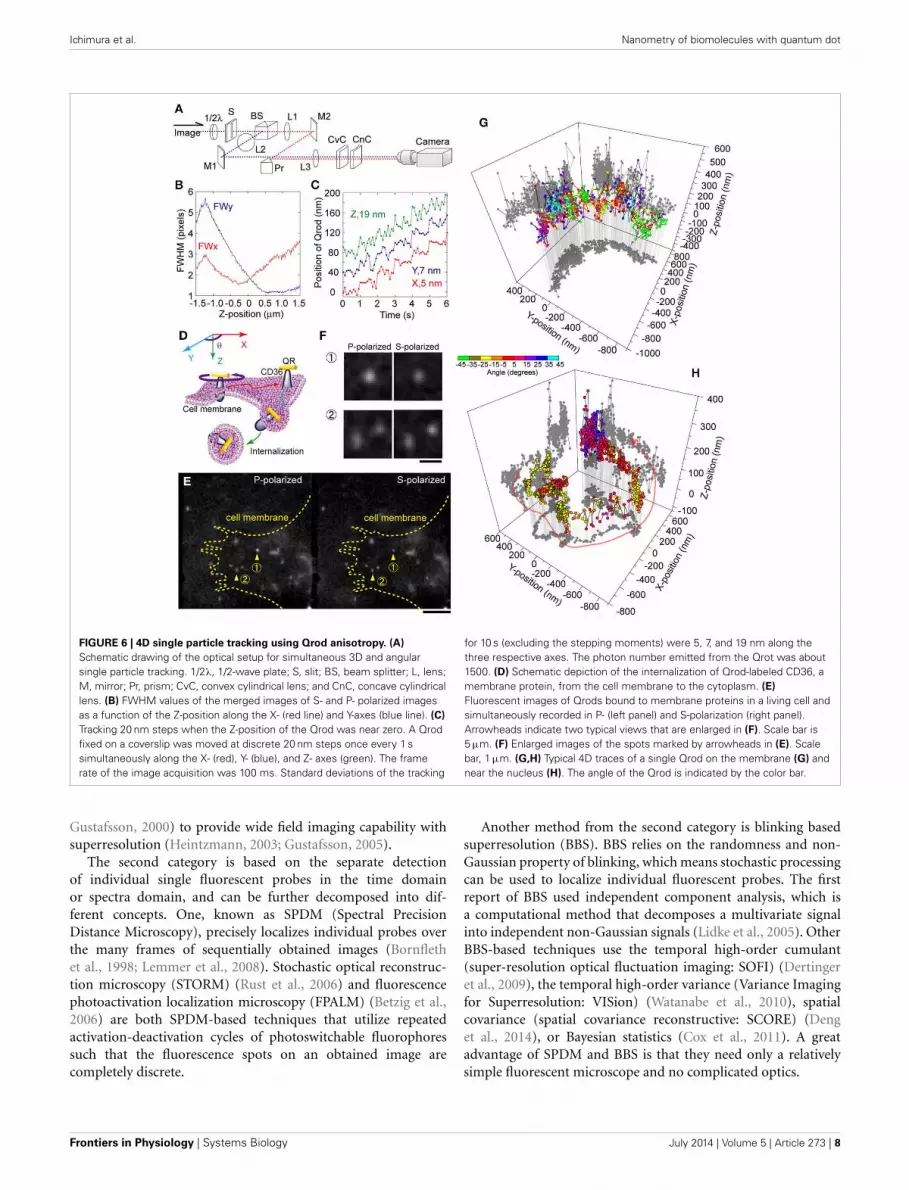
In our 4D tracking system, a polarizing beam splitter is setbefore the cylindrical lens pair in the 3D tracking optics to dividethe fluorescent image into S- and P- polar channels (Figure 6A)(Watanabe et al., 2013). For 3D tracking, the P- and S-polarizedimages are summed before calculating the 3D position. A smallgap is generated if the two channels are not completely over-lapped, leading to an asymmetrical relationship between therespective FWHM values of the X- and Y-axes (Figure 6B). The3D position can be determined by fitting the merged PSF witha 2D Gaussian function, as mentioned above, and the orien-tation can be determined by the ratio of the intensities of theS- and P- polarized images. Thus, X, Y, Z, and θ are simultane-ously obtained with an acquired image. In our case, when the
number of photons from a single Qrod was about 10,000 and theZ-position was near zero, the calculated precisions for the X, Y, Z,and θ-positions were at maximum 5, 7, 9 nm and 1◦, respectively(Figure 6C).
We used 4D tracking to observe the movement of a mem-brane protein conjugated with a Qrod via antibody affinity(Figures 6D–F) (Watanabe et al., 2013). Isolated Qrods movingon the membrane were identified under a fluorescence micro-scope (Figure 6E). The different intensities in the P- and S-polarized images indicated that the Qrod was inclined againstthe optical axis (Figure 6F, upper panels). One circular andone elliptical spot indicated that the two Qrods were at dis-tinct Z-positions (Figure 6F, lower panels). One Qrod showeda half-moon like motion in the X- and Y-axes, which wasaccompanied by highly fluctuating movements along the Z-axisand fast rotational motion before endocytosis (Figure 6G). Thisobservation suggests that this protein’s lateral diffusion was con-strained by the membrane undercoat, but that it could rotatefreely along the plasma membrane. In the cytoplasm, a mem-brane protein seemed to be moving along tracks, most likelymicrotubules, in three-dimensions and slowly rotated helically(Figure 6H).
Another 4D tracking method was developed to obtain X, Y,θ, and ϕ coordinates, the last of which provides information onthe out-of-plane tilt angle (Ohmachi et al., 2012). In this method,single Qrods are imaged as four crowded fluorescent spots bydividing the beam path using a beam splitter and two Wollastonprisms. Otherwise, the orientation of the individual fluorescentprobe can be directly estimated using the dipole emission patternsof a defocused image (Bartko and Dickson, 1999a,b; Fourkas,2001; Böhmer and Enderlein, 2003; Lieb et al., 2004), an approachthat was successfully applied to the 4D tracking of a motor protein(Toprak et al., 2006). The combination of the Wollaston prismmethod with defocusing could achieve comprehensive trackingof all rotatory and translational movements of a biomolecule in aliving cell.
SUPER-RESOLUTION USING BLINKING OF QdotsSuper-resolution microscopy describes the resolution of twoobjects closer than the diffraction limit of light (Schermelleh et al.,2010; Galbraith and Galbraith, 2011; Leung and Chou, 2011). Itcan be classified into two main categories. The first is based onthe photo-transition of a fluorescent probe between its radiativeand non-radiative states in order to confine the fluorescence emis-sion into a sub-diffraction-limit sized volume. This approach isknown as RESOLFT (REversible Saturable OpticaL FluorescenceTransitions) and was first proposed and demonstrated by STED(STimulated Emission Depletion), which exploits the stimulatedemission phenomenon of a fluorescent dye (Hell and Wichmann,1994; Klar and Hell, 1999). RESOLFT can also be realized by otherphotoreactions, including those from a ground-state transitionphenomenon (GSD: Ground State Depletion) (Hell and Kroug,1995; Bretschneider et al., 2007), the saturation of fluorescenceexcitation (SAX: SAturated eXcitation) (Fujita et al., 2007), orfrom reversibly photoswitchable fluorescent proteins (Hofmannet al., 2005). RESOLFT can also be combined with structuredillumination microscopy (SIM) (Heintzmann and Cremer, 1999;
www.frontiersin.org July 2014 | Volume 5 | Article 273 | 7
Ichimura et al. Nanometry of biomolecules with quantum dot
FIGURE 6 | 4D single particle tracking using Qrod anisotropy. (A)
Schematic drawing of the optical setup for simultaneous 3D and angularsingle particle tracking. 1/2λ, 1/2-wave plate; S, slit; BS, beam splitter; L, lens;M, mirror; Pr, prism; CvC, convex cylindrical lens; and CnC, concave cylindricallens. (B) FWHM values of the merged images of S- and P- polarized imagesas a function of the Z-position along the X- (red line) and Y-axes (blue line). (C)
Tracking 20 nm steps when the Z-position of the Qrod was near zero. A Qrodfixed on a coverslip was moved at discrete 20 nm steps once every 1 ssimultaneously along the X- (red), Y- (blue), and Z- axes (green). The framerate of the image acquisition was 100 ms. Standard deviations of the tracking
for 10 s (excluding the stepping moments) were 5, 7, and 19 nm along thethree respective axes. The photon number emitted from the Qrot was about1500. (D) Schematic depiction of the internalization of Qrod-labeled CD36, amembrane protein, from the cell membrane to the cytoplasm. (E)
Fluorescent images of Qrods bound to membrane proteins in a living cell andsimultaneously recorded in P- (left panel) and S-polarization (right panel).Arrowheads indicate two typical views that are enlarged in (F). Scale bar is5 μm. (F) Enlarged images of the spots marked by arrowheads in (E). Scalebar, 1 μm. (G,H) Typical 4D traces of a single Qrod on the membrane (G) andnear the nucleus (H). The angle of the Qrod is indicated by the color bar.
Gustafsson, 2000) to provide wide field imaging capability withsuperresolution (Heintzmann, 2003; Gustafsson, 2005).
The second category is based on the separate detectionof individual single fluorescent probes in the time domainor spectra domain, and can be further decomposed into dif-ferent concepts. One, known as SPDM (Spectral PrecisionDistance Microscopy), precisely localizes individual probes overthe many frames of sequentially obtained images (Bornflethet al., 1998; Lemmer et al., 2008). Stochastic optical reconstruc-tion microscopy (STORM) (Rust et al., 2006) and fluorescencephotoactivation localization microscopy (FPALM) (Betzig et al.,2006) are both SPDM-based techniques that utilize repeatedactivation-deactivation cycles of photoswitchable fluorophoressuch that the fluorescence spots on an obtained image arecompletely discrete.
Another method from the second category is blinking basedsuperresolution (BBS). BBS relies on the randomness and non-Gaussian property of blinking, which means stochastic processingcan be used to localize individual fluorescent probes. The firstreport of BBS used independent component analysis, which isa computational method that decomposes a multivariate signalinto independent non-Gaussian signals (Lidke et al., 2005). OtherBBS-based techniques use the temporal high-order cumulant(super-resolution optical fluctuation imaging: SOFI) (Dertingeret al., 2009), the temporal high-order variance (Variance Imagingfor Superresolution: VISion) (Watanabe et al., 2010), spatialcovariance (spatial covariance reconstructive: SCORE) (Denget al., 2014), or Bayesian statistics (Cox et al., 2011). A greatadvantage of SPDM and BBS is that they need only a relativelysimple fluorescent microscope and no complicated optics.
Frontiers in Physiology | Systems Biology July 2014 | Volume 5 | Article 273 | 8

Ichimura et al. Nanometry of biomolecules with quantum dot
Qdots are the most compatible with BBS owing to their strongblinking phenomenon. Supposing that there are two adjoiningQdots independently and randomly fluctuating, the moment thatone Qdot emits and the other does not is a stochastic event(Figure 7A). As an example, a solution to identifying the Qdot forSOFI and VISion is shown below (Dertinger et al., 2009). A flu-orescent image of Qdots, F(r,t), is expressed by the convolutionof a PSF, U(r), of the optical system and the brightness, εksk(t),where rk, εk, and sk(t) are the position and the time-invariant and-variant components of brightness of the k-th Qdot, respectively.
F (r, t) =∑
k
U(r−rk) · εk · sk(t)
The second-order autocorrelation function, G2(r,τ ), is then givenby F(r,t) as follows,
G2 (r, τ ) = 〈δF (r, t + τ) · tF (r, t)〉t
=∑j,k
U(r − rj
) · U (r − rk) · εj · εk ·
⟨δsj (r, t + τ) · tsk (r, t)
⟩t
=∑
k
U2(r − rk) · εk2 · 〈δsk (r, t + τ) · tsk (r, t)〉t
where <· · ·>t and δ(·) denote a time-averaging operation anddeviation from the time-average, respectively. Because of theindependency of the fluorescence fluctuation of the two distinctQdots (k �= j), the time average of their product is zero. For sim-ple comparison of the raw image, F(r,t), and the auto-correlationimage G2(r,τ ), we here substitute 0 for the delay time, τ , to reduceG2(r,τ ) to G2(r,0).
G2 (r, 0) =∑
k
U2(r − rk) · εk2 · ⟨
δs2k (t)
⟩t
This equation indicates that G2(r,τ ) is given by the convolu-tion of U2(r) and the square of εksk(t). Assuming that U(r) isapproximated by a Gaussian distribution, the spatial resolutionof G2(r,0) is improved v2 times from F(r,t), but at the expenseof temporal information, since the spatial resolution of the opti-cal microscopic image is limited by the sharpness of the PSF(Figures 7B,C). The higher-order autocorrelation contains high-spatial frequency information. However, because this is a momentvalue that contains cross-terms from the lower-order correlationcontributions, the accrual spatial resolution for distinguishingtwo Qdots cannot be improved more than
√2 times. It is there-
fore necessary to transform the nth-order correlation into annth-order cumulant that consists only of terms containing the nthpower of the PSF. While the higher order cumulant gives higherspatial resolution (Figure 7D), a huge number of images are stillneeded.
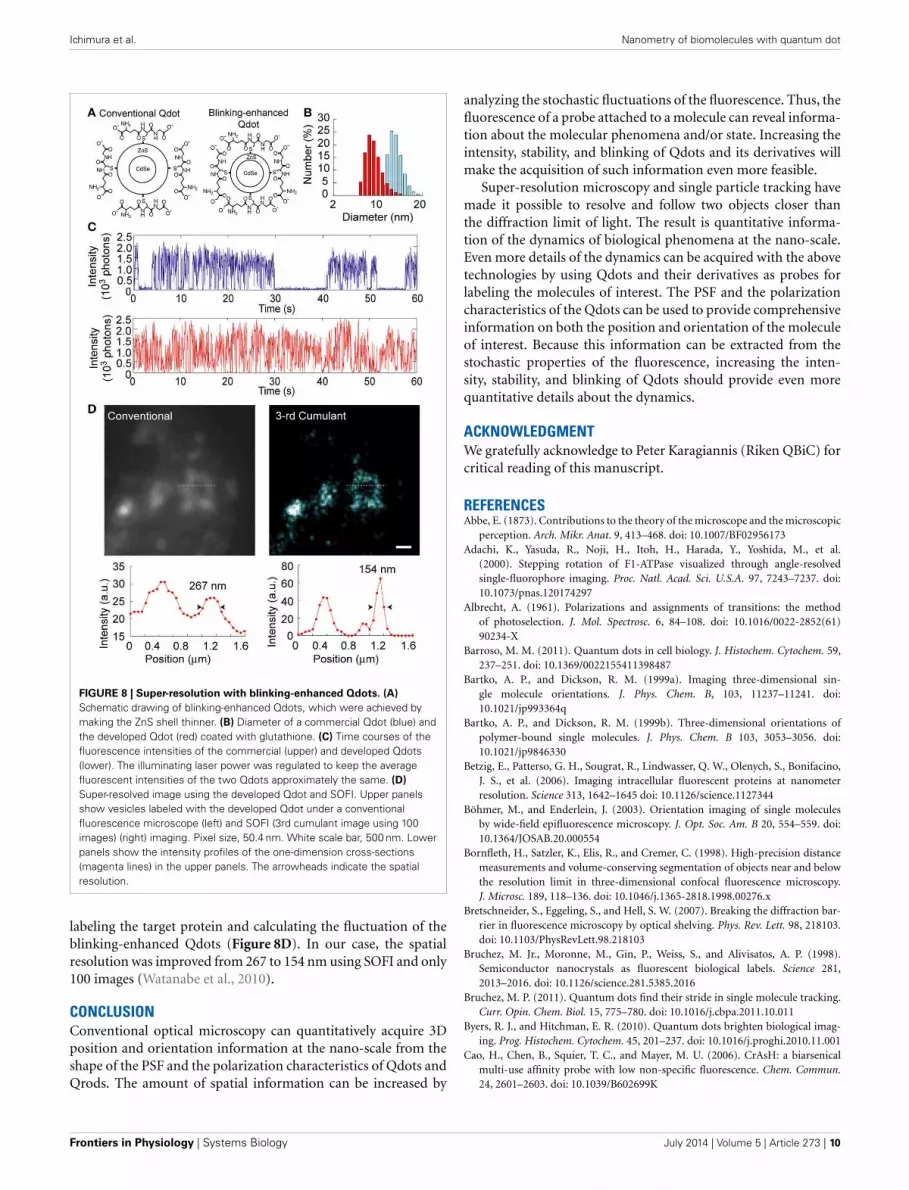
To decrease the required number of images, we developed ahighly fluctuating Qdot in which the switching frequency betweenthe on- and off-state was greatly increased by optimizing the shellthickness to promote more interaction between the CdSe-coreand oxygen atoms in water (Figures 8A,B). Though the quantum
FIGURE 7 | Super-resolution using fluorescence fluctuations of a Qdot.
(A) Conceptual drawing super-resolution microscopy using fluorescencefluctuations of a Qdot. For details, see text. (B) Principle of SOFI. Each pixelcontains a time trace, which is composed of the sum of the fluorescencefrom individual Qdots. Calculating the temporal autocorrelation of each pixelgives a new image whose spatial resolution is improved. (C) Fluorescentimage (upper) and 2nd autocorrelation (equal to variance; lower) image of asingle Qdot. Pixel size, 50.4 nm. (D) Point spread functions inone-dimension of the SOFI simulation results. In the simulation, the twoQdots were set at distance of 4 pixels apart. The FWHM of each Qdot wasalso 4 pixels. 2500 images were used.
yield of this Qdot was less than that of standard Qdots, it stillhad sufficient intensity and stability when exposed to high powerillumination, and no long off-state was observed (Figure 8C).Hence, we could easily obtain a super-resolved image by only
www.frontiersin.org July 2014 | Volume 5 | Article 273 | 9
Ichimura et al. Nanometry of biomolecules with quantum dot
FIGURE 8 | Super-resolution with blinking-enhanced Qdots. (A)
Schematic drawing of blinking-enhanced Qdots, which were achieved bymaking the ZnS shell thinner. (B) Diameter of a commercial Qdot (blue) andthe developed Qdot (red) coated with glutathione. (C) Time courses of thefluorescence intensities of the commercial (upper) and developed Qdots(lower). The illuminating laser power was regulated to keep the averagefluorescent intensities of the two Qdots approximately the same. (D)
Super-resolved image using the developed Qdot and SOFI. Upper panelsshow vesicles labeled with the developed Qdot under a conventionalfluorescence microscope (left) and SOFI (3rd cumulant image using 100images) (right) imaging. Pixel size, 50.4 nm. White scale bar, 500 nm. Lowerpanels show the intensity profiles of the one-dimension cross-sections(magenta lines) in the upper panels. The arrowheads indicate the spatialresolution.
labeling the target protein and calculating the fluctuation of theblinking-enhanced Qdots (Figure 8D). In our case, the spatialresolution was improved from 267 to 154 nm using SOFI and only100 images (Watanabe et al., 2010).
CONCLUSIONConventional optical microscopy can quantitatively acquire 3Dposition and orientation information at the nano-scale from theshape of the PSF and the polarization characteristics of Qdots andQrods. The amount of spatial information can be increased by
analyzing the stochastic fluctuations of the fluorescence. Thus, thefluorescence of a probe attached to a molecule can reveal informa-tion about the molecular phenomena and/or state. Increasing theintensity, stability, and blinking of Qdots and its derivatives willmake the acquisition of such information even more feasible.
Super-resolution microscopy and single particle tracking havemade it possible to resolve and follow two objects closer thanthe diffraction limit of light. The result is quantitative informa-tion of the dynamics of biological phenomena at the nano-scale.Even more details of the dynamics can be acquired with the abovetechnologies by using Qdots and their derivatives as probes forlabeling the molecules of interest. The PSF and the polarizationcharacteristics of the Qdots can be used to provide comprehensiveinformation on both the position and orientation of the moleculeof interest. Because this information can be extracted from thestochastic properties of the fluorescence, increasing the inten-sity, stability, and blinking of Qdots should provide even morequantitative details about the dynamics.
ACKNOWLEDGMENTWe gratefully acknowledge to Peter Karagiannis (Riken QBiC) forcritical reading of this manuscript.
REFERENCESAbbe, E. (1873). Contributions to the theory of the microscope and the microscopic
perception. Arch. Mikr. Anat. 9, 413–468. doi: 10.1007/BF02956173Adachi, K., Yasuda, R., Noji, H., Itoh, H., Harada, Y., Yoshida, M., et al.
(2000). Stepping rotation of F1-ATPase visualized through angle-resolvedsingle-fluorophore imaging. Proc. Natl. Acad. Sci. U.S.A. 97, 7243–7237. doi:10.1073/pnas.120174297
Albrecht, A. (1961). Polarizations and assignments of transitions: the methodof photoselection. J. Mol. Spectrosc. 6, 84–108. doi: 10.1016/0022-2852(61)90234-X
Barroso, M. M. (2011). Quantum dots in cell biology. J. Histochem. Cytochem. 59,237–251. doi: 10.1369/0022155411398487
Bartko, A. P., and Dickson, R. M. (1999a). Imaging three-dimensional sin-gle molecule orientations. J. Phys. Chem. B, 103, 11237–11241. doi:10.1021/jp993364q
Bartko, A. P., and Dickson, R. M. (1999b). Three-dimensional orientations ofpolymer-bound single molecules. J. Phys. Chem. B 103, 3053–3056. doi:10.1021/jp9846330
Betzig, E., Patterso, G. H., Sougrat, R., Lindwasser, Q. W., Olenych, S., Bonifacino,J. S., et al. (2006). Imaging intracellular fluorescent proteins at nanometerresolution. Science 313, 1642–1645 doi: 10.1126/science.1127344
Böhmer, M., and Enderlein, J. (2003). Orientation imaging of single moleculesby wide-field epifluorescence microscopy. J. Opt. Soc. Am. B 20, 554–559. doi:10.1364/JOSAB.20.000554
Bornfleth, H., Satzler, K., Elis, R., and Cremer, C. (1998). High-precision distancemeasurements and volume-conserving segmentation of objects near and belowthe resolution limit in three-dimensional confocal fluorescence microscopy.J. Microsc. 189, 118–136. doi: 10.1046/j.1365-2818.1998.00276.x
Bretschneider, S., Eggeling, S., and Hell, S. W. (2007). Breaking the diffraction bar-rier in fluorescence microscopy by optical shelving. Phys. Rev. Lett. 98, 218103.doi: 10.1103/PhysRevLett.98.218103
Bruchez, M. Jr., Moronne, M., Gin, P., Weiss, S., and Alivisatos, A. P. (1998).Semiconductor nanocrystals as fluorescent biological labels. Science 281,2013–2016. doi: 10.1126/science.281.5385.2016
Bruchez, M. P. (2011). Quantum dots find their stride in single molecule tracking.Curr. Opin. Chem. Biol. 15, 775–780. doi: 10.1016/j.cbpa.2011.10.011
Byers, R. J., and Hitchman, E. R. (2010). Quantum dots brighten biological imag-ing. Prog. Histochem. Cytochem. 45, 201–237. doi: 10.1016/j.proghi.2010.11.001
Cao, H., Chen, B., Squier, T. C., and Mayer, M. U. (2006). CrAsH: a biarsenicalmulti-use affinity probe with low non-specific fluorescence. Chem. Commun.24, 2601–2603. doi: 10.1039/B602699K
Frontiers in Physiology | Systems Biology July 2014 | Volume 5 | Article 273 | 10
Ichimura et al. Nanometry of biomolecules with quantum dot
Chan, W. C. W., and Nie,. S. (1998). Quantum dot bioconjugates for ultrasensitivenonisotopic detection. Science 281, 2016–2018. doi: 10.1126/science.281.5385.2016
Chang, Y. P., Pinaud, F., Antelman, J., and Weiss, S. (2008). Tracking bio-moleculesin live cells using quantum dots. J. Biophotonics 1, 287–298. doi: 10.1002/jbio.200810029
Cheezum, M. K., Walker, W. F., and Guilford, W. H. (2001). Quantitative com-parison of algorithms for tracking single fluorescent particles. Biophys. J. 281,2378–2388. doi: 10.1016/S0006-3495(01)75884-5
Chenouard, N., Smal, I., de Chaumont, F., Maška, M., Sbalzarini, I. F., Gong, Y.,et al. (2014). Objective comparison of particle tracking methods. Nat. Methods.11, 281–289. doi: 10.1038/nmeth.2808
Chien, F. C., Kuo, C. W., and Chen, P. (2011). Localization imaging using blinkingquantum dots. Analyst 136, 1608–1613. doi: 10.1039/c0an00859a
Chinnathambi, S., Chen, S., Ganesan, S., and Hanagata, N. (2014). Silicon quan-tum dots for biological applications. Adv. Healthc. Mater. 3, 10–29. doi:10.1002/adhm.201300157
Choi, H. S., and Frangioni, J. V. (2010). Nanoparticles for biomedical imaging: fun-damentals of clinical translation. Mol. Imaging. 9, 291–310. doi: 10.2310/7290.2010.00031
Clausen, M. P., and Lagerholm, B. C. (2011). The probe rules in single parti-cle tracking. Curr. Protein Pept. Sci. 12, 699–713. doi: 10.2174/138920311798841672
Cox, S., Rosten, E., Monypenny, J., Jovanovic-Talisman, T., Burnette, D. T.,Lippincott-Schwartz,.J., et al. (2011). Bayesian localization microscopy revealsnanoscale podosome dynamics. Nat. Methods 9, 195–200. doi: 10.1038/nmeth.1812
Cupaioli, F. A., Zucca, F. A., Boraschi, D., and Zecca, L. (2014). Engineerednanoparticles. How brain friendly is this new guest? Prog Neurobiol. pii: S0301-0082(14)00051-3. doi: 10.1016/j.pneurobio.2014.05.002.
Dabbousi, B. O., Rodriguez-Viej, O. J., and Bawendi, M. G. (1997). (CdSe)ZnScore-shell Qdots: synthesis and characterization of a size series of highlyluminescent nanocrystallites. J. Phys. Chem. B 101, 9463–9475. doi: 10.1021/jp971091y
Dalgarno, P. A., Dalgarno, H. I., Putoud, A., Lambert, R., Paterson, L., Logan, D.C., et al. (2010). Multiplane imaging and three dimensional nanoscale particletracking in biological microscopy. Opt. Express. 18, 877–884. doi: 10.1364/OE.18.000877
Deka, S., Quarta, A., Lupo, M. G., Falqui, A., Boninelli, S., Giannini, C., et al.(2009). CdSe/CdS/ZnS double shell nanorods with high photoluminescenceefficiency and their exploitation as biolabeling probes. J. Am. Chem. Soc. 131,2948–2958. doi: 10.1021/ja808369e
Deng, Y., Sun, M., Lin, P. H., Ma, J., and Shaevitz, J. W. (2014). Spatial covariancereconstructive (SCORE) super-resolution fluorescence microscopy. PLoS ONE9:e94807. doi: 10.1371/journal.pone.0094807
Dertinger, T., Colyer, R., Iyer, G., Weiss, S., and Enderlein, J. (2009). Fast,background-free, 3D super-resolution optical fluctuation imaging (SOFI). Proc.Natl. Acad. Sci. U.S.A. 106, 22287–22292. doi: 10.1073/pnas.0907866106
Deschout, H., Cella Zanacchi, F., Mlodzianoski, M., Diaspro, A., and Bewersdorf,J. (2014). Precisely and accurately localizing single emitters in fluorescencemicroscopy. Nat. Methods. 11, 253–266. doi: 10.1038/nmeth.2843
Drummen, G. P. (2012). Fluorescent probes and fluorescence (microscopy)techniques-illuminating biological and biomedical research. Molecules 17,14067–11490. doi: 10.3390/molecules171214067
Dubertret, B., Skourides, P., Norris, D. J., Noireaux, V., Brivanlou, A. H., andLibchaber, A. (2002). In vivo imaging of quantum dots encapsulated in phos-pholipid micelles. Science 98, 1759–1762. doi: 10.1126/science.1077194
Dubois, F., Mahler, B., Dubertret, B., Doris, E., and Mioskowski, C. (2007). A versa-tile strategy for quantum dot ligand exchange. J. Am. Chem. Soc. 129, 482–483.doi: 10.1021/ja067742y
Ekimov, A. I., and Onushchenko, A. A. (1981). Quantum size effect in three-dimensional microscopic semiconductor crystals. JETP Lett. 34, 345–349.
Ellinger, P. (1940). Fluorescence microscopy in biology. Biol. Rev. 15, 323–347. doi:10.1111/j.1469-185X.1940.tb00761.x
Erathodiyil, N., and Ying, J. Y. (2011). Functionalization of inorganic nanopar-ticles for bioimaging applications. Acc. Chem. Res. 44, 925–935. doi: 10.1021/ar2000327
Fomenko, V., and Nesbitt, D. J. (2008). Solution control of radiative and nonradia-tive lifetimes: a novel contribution to quantum dot blinking suppression. NanoLett. 8, 287–293. doi: 10.1021/nl0726609
Forkey, J. N., Quinlan, M. E., Shaw, M. A., Corrie, J. E., and Goldman, Y. E.(2003). Three-dimensional structural dynamics of myosin V by single-moleculefluorescence polarization. Nature 422, 399–404. doi: 10.1038/nature01529
Fourkas, J. T. (2001). Rapid determination of the three-dimensional orientation ofsingle molecules. Opt. Lett. 26, 211–213. doi: 10.1364/OL.26.000211
Fujita, K., Kobayashi, M., Kawano, S., Yamanaka, M., and Kawata, S. (2007). High-resolution confocal microscopy by saturated excitation of fluorescence. Phys.Rev. Lett. 99:228105. doi: 10.1103/PhysRevLett.99.228105
Galbraith, C. G., and Galbraith, J. A. (2011). Super-resolution microscopy at aglance. J Cell Sci. 124(Pt 10), 1607–1611. doi: 10.1242/jcs.080085
Gao, X., Yang, L., Petros, J. A., Marshall, F. F., Simons, J. W., and Nie, S. (2005). Invivo molecular and cellular imaging with quantum dots. Curr. Opin. Biotechnol.16, 63–72. doi: 10.1016/j.copbio.2004.11.003
Genovesio, A., Liedl, T., Emiliani, V., Parak, W. J., Coppey-Moisan, M., and Olivo-Marin, J. C. (2006). Multiple particle tracking in 3-D+t microscopy: methodand application to the tracking of endocytosed quantum dots. IEEE Trans. ImageProcess. 15, 1062–1070. doi: 10.1109/TIP.2006.872323
Gerion, D., Pinaud, F., Williams, S., Parak, W., Zanchet, D., Weiss, S., et al.(2001). Synthesis and properties of biocompatible water-soluble silica-coatedCdSe/ZnS semiconductor quantum dots. J. Phys. Chem. B 105, 8861–8871 doi:10.1021/jp0105488
Guo, W., Li, J. J., Wang, Y. A., Peng, X. (2003). Conjugation chemistry and bioap-plications of semiconductor box nanocrystals prepared via dendrimer bridging.Chem. Mater. 15, 3125–3133. doi: 10.1021/cm034341y
Gustafsson, M. G. L. (2000). Surpassing the lateral resolution limit by a factorof two using structured illumination microscopy. J. Microsc. 198, 82–87 doi:10.1046/j.1365-2818.2000.00710.x
Gustafsson, M. G. L. (2005). Nonlinear structured-illumination microscopy: Wide-field fluorescence imaging with theoretically unlimited resolution. Proc. Natl.Acad. Sci. U.S.A. 102, 13081–13086. doi: 10.1073/pnas.0406877102
Harms, G. S., Sonnleitner, M., Schütz, G. J., Gruber, H. J., and Schmidt, T.(1999). Single-molecule anisotropy imaging. Biophys. J. 77, 2864–2870. doi:10.1016/S0006-3495(99)77118-3
Heintzmann, R. (2003). Saturated patterned excitation microscopy with two-dimensional excitation patterns. Micron 34, 283–291. doi: 10.1016/S0968-4328(03)00053-2
Heintzmann, R., and Cremer, C. (1999). “Laterally modulated excitationmicroscopy: improvement of resolution by using a diffraction grating,” inProceedings for the SPIE Vol. 3568, Optical Biopsies and Microscopic TechniquesIII, (Stockholm), 185. doi: 10.1117/12.336833
Hell, S. W., and Kroug, M. (1995). Ground-state-depletion fluorescencemicroscopy: A concept for breaking the diffraction resolution limit. Appl. Phys.B 60, 495–497. doi: 10.1007/BF01081333
Hell, S. W., and Wichmann, J. (1994). Breaking the diffraction resolution limit bystimulated emission: stimulated-emission-depletion fluorescence microscopy.Opt. Lett. 19, 780–782. doi: 10.1364/OL.19.000780
Hoffman, M. T., Sheung, J., and Selvin, P. R. (2011). Fluorescence imaging with onenanometer accuracy: in vitro and in vivo studies of molecular motors. MethodsMol. Biol. 778, 33–56. doi: 10.1007/978-1-61779-261-8_4
Hofmann, M., Eggeling, C., Jakobs, S., and Hell, S. W. (2005). Breaking thediffraction barrier in fluorescence microscopy at low light intensities byusing reversibly photoswitchable proteins. Proc. Natl. Acad. Sci. U.S.A.102,17565–17569. doi: 10.1073/pnas.0506010102
Hohng, S., and Ha, T. (2004). Near-complete suppression of quantum dotblinking in ambient conditions. J. Am. Chem. Soc. 126, 1324–1325. doi:10.1021/ja039686w
Holtzer, L., Meckel, T., and Schmidt, T. (2007). Nanometric three-dimensionaltracking of individual quantum dots in cells. Appl. Phys. Lett. 90, 053902 doi:10.1063/1.2437066
Hoyer, P., Staudt, T., Engelhardt, J., and Hell, S. W. (2011). Quantum dot blue-ing and blinking enables fluorescence nanoscopy. Nano Lett. 11, 245–250. doi:10.1021/nl103639f
Hu, J., Li, L. S., Yang, W., Manna, L., Wang, L. W., and Alivisatos, A. P. (2001).Linearly polarized emission from colloidal semiconductor quantum rods.Science. 292, 2060–2063. doi: 10.1126/science.1060810
Huang, Z. L., Zhu, H., Long, F., Ma, H., Qin, L., Liu, Y., et al. (2011). Localization-based super-resolution microscopy with an sCMOS camera. Opt. Express. 19,19156–19168. doi: 10.1364/OE.19.019156
Izeddin, I., El Beheiry, M., Andilla, J., Ciepielewski, D., Darzacq, X., andDahan, M. (2012). PSF shaping using adaptive optics for three-dimensional
www.frontiersin.org July 2014 | Volume 5 | Article 273 | 11
Ichimura et al. Nanometry of biomolecules with quantum dot
single-molecule super-resolution imaging and tracking. Opt. Express. 20,4957–4967. doi: 10.1364/OE.20.004957
Jia, S., Vaughan, V. C., and Zhuang, Z. (2014). Isotropic three-dimensional super-resolution imaging with a self-bending point spread function. Nat. Photonics 8,302–306. doi: 10.1038/nphoton.2014.13
Jiang, W., Mardyani, S., Fischer, H., and Chan, W. C. W. (2006). Design and char-acterization of lysine cross-linked mercapto-acid biocompatible quantum dots.Chem. Mater. 18, 872–878. doi: 10.1021/cm051393+
Jin, T., Fujii, F., Komai, Y., Seki, J., Seiyama, A., and Yoshioka, Y. (2008). Preparationand characterization of highly fluorescent, glutathione-coated near infraredquantum dots for in vivo fluorescence imaging. Int. J. Mol. Sci. 9, 2044–2061.doi: 10.3390/ijms9102044
Juette, M. F., and Bewersdorf, J. (2010). Three-dimensional tracking of singlefluorescent particles with submillisecond temporal resolution. Nano Lett. 10,4657–4663. doi: 10.1021/nl1028792.
Kairdolf, B. A., Smith, A. M., Stokes, T. H., Wang, M. D., Young, A. N., and Nie, S.(2013). Semiconductor quantum dots for bioimaging and biodiagnostic appli-cations. Annu. Rev. Anal. Chem. 6, 143–162. doi: 10.1146/annurev-anchem-060908-155136
Kao, H. P., and Verkman, A. S. (1994). Tracking of single fluorescent particles inthree dimensions: use of cylindrical optics to encode particle position. Biophys.J. 67, 1291–1300. doi: 10.1016/S0006-3495(94)80601-0
Kim, S. W., Kim, S., Tracy, J. B., Jasanoff, A., and Bawendi, M. G. (2005).Phosphine oxide polymer for water-soluble nanoparticles. J. Am. Chem. Soc.127, 4556–4557. doi: 10.1021/ja043577f
Klar, T. A., and Hell, S. W. (1999). Subdiffraction resolution in far-field fluorescencemicroscopy. Opt. Lett. 24, 954–956. doi: 10.1364/OL.24.000954
Kloepfer, J. A., Bradforth, S. E., and Nadeau, J. L. (2005). Photophysical propertiesof biologically compatible CdSe quantum dot structures. J. Phys. Chem. B 109,9996–10003. doi: 10.1021/jp044581g
Ko, H. C., Yuan, C. T., and Tang, J. (2011). Probing and controlling fluorescenceblinking of single semiconductor nanoparticles. Nano Rev. 2:5895. doi: 10.3402/nano.v2i0.5895
Kubitscheck, U., Kückmann, O., Kues, T., and Peters, R. (2000). Imaging andtracking of single GFP molecules in solution. Biophys. J. 78, 2170–2179. doi:10.1016/S0006-3495(00)76764-6
Kuno, M., Lee, J. K., Dabbousi, B. O., Mikulec, F. V., and Bawendi, M. G. (1997).The band edge luminescence of surface modified CdSe nanocrystallites: probingthe luminescing state. J. Chem. Phys. 106, 9869. doi: 10.1063/1.473875
Kusumi, A., Nakada, C., Ritchie, K., Murase, K., Suzuki, K., Murakoshi, H.,et al. (2005). Paradigm shift of the plasma membrane concept from thetwo-dimensional continuum fluid to the partitioned fluid: high-speed single-molecule tracking of membrane molecules. Annu. Rev. Biophys. Biomol. Struct.34, 351–378. doi: 10.1146/annurev.biophys.34.040204.144637
Lasne, D., Blab, G. A., Berciaud, S., Heine, M., Groc, L., Choquet, D., et al. (2006).Single nanoparticle photothermal tracking (SNaPT) of 5-nm gold beads in livecells. Biophys. J. 91, 4598–4604. doi: 10.1529/biophysj.106.089771
Lemmer, P., Gunkel, M., Baddeley, D., Kaufmann, R., Urich, A., Weiland, Y.,et al. (2008). SPDM: light microscopy with single-molecule resolution at thenanoscale. Appl. Phys. B 93, 1–12. doi: 10.1007/s00340-008-3152-x
Leung, B. O., and Chou, K. C. (2011). Review of super-resolution fluorescencemicroscopy for biology. Appl. Spectrosc. 65, 967–980. doi: 10.1366/11-06398
Levenberg, K. (1944). A method for the solution of certain non-linear problems inleast squares. Q. Appl. Math. 2, 164–168.
Lew, M. D., Thompson, M. A., Badieirostami, M., and Moerner, W. E. (2010). Invivo three-dimensional superresolution fluorescence tracking using a double-helix point spread function. Proc. Soc. Photo Opt. Instrum. Eng. 7571, 75710Z.doi: 10.1117/12.842608
Li, J., Wu, D., Miao, Z., and Zhang, Y. (2010). Preparation of quantum dot bio-conjugates and their applications in bio-imaging. Curr. Pharm. Biotechnol. 11,662–671. doi: 10.2174/138920110792246582
Lichtman, J. W., and Conchello, J. A. (2005). Fluorescence microscopy. Nat.Methods 2, 910–919. doi: 10.1038/nmeth817
Lidke, K., Rieger, B., Jovin, T., and Heintzmann, R. (2005). Superresolutionby localization of quantum dots using blinking statistics. Opt. Express. 13,7052–7062. doi: 10.1364/OPEX.13.007052
Lieb, M. A., Zavislan, J. M., and Novotny, L. (2004). Single-molecule orienta-tions determined by direct emission pattern imaging. J. Opt. Soc. Am. B 21,1210–1215. doi: 10.1364/JOSAB.21.001210
Long, F., Zeng, S., and Huang, Z. L. (2012). Localization-based super-resolutionmicroscopy with an sCMOS camera part II: experimental methodology forcomparing sCMOS with EMCCD cameras. Opt. Express. 20, 17741–17759. doi:10.1364/OE.20.017741
Ma, H., Kawai, H., Toda, E., Zeng, S., and Huang, Z. L. (2013). Localization-based super-resolution microscopy with an sCMOS camera part III: cameraembedded data processing significantly reduces the challenges of massive datahandling. Opt. Lett. 38, 1769–1771. doi: 10.1364/OL.38.001769
Mandal, A., and Tamai, N. (2011). Suppressed blinking behavior of thioglycolicacid capped CdTe quantum dot by amine functionalization. Appl. Phys. Lett. 99,263111. doi: 10.1063/1.3671075
Miyawaki, A. (2013). Fluorescence imaging in the last two decades. Microscopy(Oxf.). 62, 63–68. doi: 10.1093/jmicro/dfs130
Mizuno, H., Higashida, C., Yuan, Y., Ishizaki, T., Narumiya, S., and Watanabe, N.(2011). Rotational movement of the formin mDia1 along the double helicalstrand of an actin filament. Science 331, 80–83. doi: 10.1126/science.1197692
Nann, T. (2005). Phase-transfer of CdSe@ZnS quantum dots using amphiphilichyperbranched polyethylenimine. Chem. Commun. 7, 1735–1736. doi:10.1039/b414807j
Nifosí, R., Amat, P., and Tozzini, V. (2007). Variation of spectral, structural, andvibrational properties within the intrinsically fluorescent proteins family: a den-sity functional study. J. Comput. Chem. 28, 2366–2377. doi: 10.1002/jcc.20764
Nirmal, M., Dabbousi, B. O., and Brus, L. E. (1996). Fluorescence intermit-tency in single cadmium selenide nanocrystals. Nature 383, 802–804. doi:10.1038/383802a0
Nishikawa, S., Arimoto, I., Ikezaki, K., Sugawa, M., Ueno, H., Komori, T., et al.(2010). Switch between large hand-over-hand and small inchworm-like steps inmyosin VI. Cell 42, 879–888. doi: 10.1016/j.cell.2010.08.033
Ohmachi, M., Komori, Y., Iwane, A. H., Fujii, F., Jin, T., and Yanagida, T. (2012).Fluorescence microscopy for simultaneous observation of 3D orientation andmovement and its application to quantum rod-tagged myosin V. Proc. Natl.Acad. Sci. U.S.A. 109, 5294–5298. doi: 10.1073/pnas.1118472109
Palaniappan, K., Hackney, S. A., and Liu, J. (2004). Supramolecular con-trol of complexation-induced fluorescence change of water-soluble, beta-cyclodextrin-modified CdS quantum dots. Chem. Commun., 23, 2704–2705.doi: 10.1039/B409075F
Palaniappan, K.,Xue, C., Arumugam, G., Hackney, S. A., and Liu, J. (2006). Water-soluble, cyclodextrin-modified CdSe-CdS core-shell structured quantum dots.Chem. Mater. 18, 1275–1280. doi: 10.1021/cm051602q
Park, H., Toprak, E., and Selvin, P. R. (2007). Single-molecule fluorescence to studymolecular motors. Q. Rev. Biophys. 40, 87–111. doi: 0.1017/S0033583507004611
Pavani, S. R., Thompson, M. A., Biteen, J. S., Lord, S. J., Liu, N., Twieg, R. J., et al.(2009). Three-dimensional, single-molecule fluorescence imaging beyond thediffraction limit by using a double-helix point spread function. Proc. Natl. Acad.Sci. U.S.A. 106, 2995–2999. doi: 10.1073/pnas.0900245106
Peng, X., Manna, L., Yang, W., Wickham, J., Scher, E., Kadavanich, A., et al. (2000).Shape control of CdSe nanocrystals. Nature 404, 59–61. doi: 10.1038/35003535
Peter, S., Harter, K., and Schleifenbaum, F. (2014). Fluorescence microscopy.Methods Mol. Biol. 1062, 429–452. doi: 10.1007/978-1-62703-580-4_23
Petryayeva, E., Algar, W. R., and Medintz, I. L. (2013). Quantum dots inbioanalysis: a review of applications across various platforms for fluores-cence spectroscopy and imaging. Appl. Spectrosc. 67, 215–252. doi: 10.1366/12-06948
Pierobon, P., and Cappello, G. (2012). Quantum dots to tail single bio-molecules inside living cells. Adv. Drug Deliv. Rev. 64, 167–178. doi:10.1016/j.addr.2011.06.004
Pilla, V., Munin, E., Dantas, N. O., Silva, A. C. A., and Andrade, A. A. (2012).“Photothermal spectroscopic characterization in CdSe/ZnS and CdSe/CdSquantum dots: a review and new applications,” in Quantum Dots - A Varietyof New Applications, ed A. Al-Ahmadi (InTech), 3–22. doi: 10.5772/2645
Pinaud, F., King, D., Moore, H. P., and Weiss, S. (2004). Bioactivation and celltargeting of semiconductor CdSe/ZnS nanocrystals with phytochelatin-relatedpeptides. J. Am. Chem. Soc. 126, 6115–6123. doi: 10.1021/ja031691c
Ram, S., Kim, D., Ober, R. J., and Ward, E. S. (2012). 3D single moleculetracking with multifocal plane microscopy reveals rapid intercellular trans-ferrin transport at epithelial cell barriers. Biophys. J. 103, 1594–1603. doi:10.1016/j.bpj.2012.08.054
Ram, S., Prabhat, P., Chao, J., Ward, E. S., and Ober, R. J. (2008). High accu-racy 3D quantum dot tracking with multifocal plane microscopy for the study
Frontiers in Physiology | Systems Biology July 2014 | Volume 5 | Article 273 | 12
Ichimura et al. Nanometry of biomolecules with quantum dot
of fast intracellular dynamics in live cells. Biophys. J. 95, 6025–6043. doi:10.1529/biophysj.108.140392
Ritchie, K., and Kusumi, A. (2003). Single-particle tracking image microscopy.Meth. Enzymol. 360, 618–634. doi: 10.1016/S0076-6879(03)60131-X
Rossetti, R., Nakahara, S., and Brus, L. E. (1980). Quantum size effects in the redoxpotentials, resonance Raman spectra, and electronic spectra of CdS crystallitesin aqueous solution. J. Chem. Phys. 79, 1086–1088 doi: 10.1063/1.445834
Ruedas-Rama, M. J., Walters, J. D., Orte, A., and Hall, E. A. (2012). Fluorescentnanoparticles for intracellular sensing: a review. Anal. Chim. Acta 751, 1–23.doi: 10.1016/j.aca.2012.09.025
Rust, M. J., Bate, M., and Zhuang, X. (2006). Sub-diffraction-limit imagingby stochastic optical reconstruction microscopy (STORM). Nat. Methods 3,793–796 doi: 10.1038/nmeth929
Ruthardt, N., Lamb, D. C., and Bräuchle, C. (2011). Single-particle tracking asa quantitative microscopy-based approach to unravel cell entry mechanismsof viruses and pharmaceutical nanoparticles. Mol. Ther. 19, 1199–1211. doi:10.1038/mt.2011.102
Saadeh, Y., Leung, T., Vyas, A., Chaturvedi, L. S., Perumal, O., and Vyas, D. (2014).Applications of nanomedicine in breast cancer detection, imaging, and therapy.J. Nanosci. Nanotechnol. 14, 913–923. doi: 10.1166/jnn.2014.8755
Sambongi, Y., Iko, Y., Tanabe, M., Omote, H., Iwamoto-Kihara, A., Ueda, I.,et al. (1999). Mechanical rotation of the c subunit oligomer in ATP synthase(F0F1): direct observation. Science 286, 1722–1724. doi: 10.1126/science.286.5445.1722
Sase, I., Miyata, H., Ishiwata, S., and Kinosita, K. Jr. (1997). Axial rotation of slidingactin filaments revealed by single-fluorophore imaging. Proc. Natl. Acad. Sci.U.S.A. 94, 5646–5650. doi: 10.1073/pnas.94.11.5646
Saxton, M. J. (2008). Single-particle tracking: connecting the dots. Nat. Methods 5,671–672. doi: 10.1038/nmeth0808-671
Saxton, M. J. (2009). “Single particle tracking,” in Fundamental Concepts ofBiophysics, ed T. Jue (New York, NY: Humana Press), 147–169. doi: 10.1007/978-1-59745-397-4_6
Schermelleh, L., Heintzmann, R., and Leonhardt, H. (2010). A guide tosuper-resolution fluorescence microscopy. J. Cell Biol. 190, 165–175. doi:10.1083/jcb.201002018
Schlegel, G., Bohnenberger, J., Potapova, I., and Mews, A. (2002). Fluorescencedecay time of single semiconductor nanocrystals. Phys. Rev. Lett. 88, 137401.doi: 10.1103/PhysRevLett.112.068103
Shimomura, O., and Johnson, F. H. (1692). Extraction, purification and proper-ties of aequorin, a bioluminescent protein from the luminous hydromedusan.Aequorea. J. Cell. Comp. Physiol. 59, 223–239. doi: 10.1002/jcp.1030590302
Small, A., and Stahlheber, S. (2014). Fluorophore localization algorithms for super-resolution microscopy. Nat. Methods. 11, 267–279. doi: 10.1038/nmeth.2844
Terai, T., and Nagano, T. (2013). Small-molecule fluorophores and fluorescentprobes for bioimaging. Pflugers Arch. 465, 347–359. doi: 10.1007/s00424-013-1234-z
Thompson, R. E., Larson, D. R., and Webb, W. W. (2002). Precise nanometer local-ization analysis for individual fluorescent probes. Biophys. J. 82, 2775–2783. doi:10.1016/S0006-3495(02)75618-X
Tiwari, D. K., Tanaka, S., Inouye, Y., Yoshizawa, K., Watanabe, T. M., and Jin,T. (2009). Synthesis and characterization of anti-HER2 antibody conjugatedCdSe/CdZnS quantum dots for fluorescence imaging of breast cancer cells.Sensors 9, 9332–9364. doi: 10.3390/s91109332
Tomczak, N., Liu, R., and Vancso, J. G. (2013). Polymer-coated quantum dots.Nanoscale 5, 12018–12032. doi: 10.1039/c3nr03949h
Toprak, E., Balci, H., Blehm, B. H., and Selvin, P. R. (2007). Three-dimensional particle tracking via bifocal imaging. Nano Lett. 7, 2043–2045. doi:10.1021/nl0709120
Toprak, E., Enderlein, J., Syed, S., McKinney, S. A., Petschek, R. G., Ha, T., et al.(2006). Defocused orientation and position imaging (DOPI) of myosin V. Proc.Natl. Acad. Sci. U.S.A. 103, 6495–6499. doi: 10.1073/pnas.0507134103
Toprak, E., and Selvin, P. R. (2007). New fluorescent tools for watching nanometer-scale conformational changes of single molecules. Annu. Rev. Biophys. Biomol.
Struct. 36, 349–369. doi: 10.1146/annurev.biophys.36.040306.132700Tsien, R. Y. (1998). The green fluorescent protein. Annu. Rev. Biochem. 67, 509–544.
doi: 10.1146/annurev.biochem.67.1.509van Sark, W. G. J. H.M., Frederix, P. L. T. M., Bol, A. A., Gerritsen, H.
C., and Meijerink, A. (2002). Blueing, Bleaching, and Blinking of Single
CdSe/ZnS Quantum Dots. ChemPhysChem 3, 871–879. doi: 10.1002/1439-7641(20021018)3:10<871::AID-CPHC871>3.0.CO;2-T
van Sark, W. G. J. H.M., Frederix, P. L. T. M., den Heuvel, D. J. V., Gerritsen,H. C. J., Bol, A. A., van Lingen, J. N. J., et al. (2001). Letter photooxidationand photobleaching of single CdSe/ZnS Quantum dots probed by room-temperature time-resolved spectroscopy. Phys. Chem. B 105, 8281–8284. doi:10.1021/jp012018h
Wang, E. C., and Wang, A. Z. (2014). Nanoparticles and their applications in celland molecular biology. Integr. Biol. 6, 9–26. doi: 10.1039/c3ib40165k
Watanabe, T. M., Fujii, F., Jin, T., Umemoto, E., Miyasaka, M., Fujita, H.,et al. (2013). Four-dimensional spatial nanometry of single particles inliving cells using polarized quantum rods. Biophys. J. 105, 555–564. doi:10.1016/j.bpj.2013.07.001
Watanabe, T. M., Fukui, S., Jin, T., Fujii, F., and Yanagida, T. (2010). Real-timenanoscopy by using blinking enhanced quantum dots. Biophys. J. 99, L50–L52.doi: 10.1016/j.bpj.2010.07.036
Watanabe, T. M., and Higuchi, H. (2007). Stepwise movements in vesicle trans-port of HER2 by motor proteins in living cells. Biophys. J. 92, 4109–4120. doi:10.1529/biophysj.106.094649
Watanabe, T. M., Sato, T., Gonda, K., and Higuchi, H. (2007). Three-dimensionalnanometry of vesicle transport in living cells using dual-focus imaging optics.Biochem. Biophys. Res. Commun. 359, 1–7. doi: 10.1016/j.bbrc.2007.04.168
Wells, N. P., Lessard, G. A., Goodwin, P. M., Phipps, M. E., Cutler, P. J., Lidke, D. S.,et al. (2010). Time-resolved three-dimensional molecular tracking in live cells.Nano Lett. 10, 4732–4737. doi: 10.1021/nl103247v
Wells, N. P., Lessard, G. A., and Werner, J. H. (2008). Confocal, three-dimensionaltracking of individual quantum dots in high-background environments. Anal.Chem. 80, 9830–9834. doi: 10.1021/ac8021899
Werver, G. (1953). Rotational Brownian motion and polarization of the flu-orescence of solutions. Adv. Protein Chem. 8, 415–459. doi: 10.1016/s0065-3233(08)60096-0
Wombacher, R., and Cornish, V. W. (2011). Chemical tags: applications in live cellfluorescence imaging. J. Biophotonics. 4, 391–402. doi: 10.1002/jbio.201100018
Wysocki, L. M., and Lavis, L. D. (2011). Advances in the chemistry of smallmolecule fluorescent probes. Curr. Opin. Chem. Biol. 15, 752–759. doi:10.1016/j.cbpa.2011.10.013
Yajima, J., Mizutani, K., and Nishizaka, T. (2008). A torque component present inmitotic kinesin Eg5 revealed by three-dimensional tracking. Nat. Struct. Mol.Biol. 15, 1119–1121. doi: 10.1038/nsmb.1491
Yildiz, A., Forkey, J. N., McKinney, S. A., Ha, T., Goldman, Y. E., and Selvin, P.R. (2003). Myosin V walks hand-over-hand: single fluorophore imaging with1.5-nm localization. Science 300, 2061–2065. doi: 10.1126/science.1084398
Yildiz, A., and Selvin, P. R. (2005). Fluorescence imaging with one nanometeraccuracy: application to molecular motors. Acc. Chem. Res. 38, 574–582. doi:10.1021/ar040136s
Zhang, A., Dong, C., Liu, H., and Ren, J. (2013). Blinking behavior of CdSe/CdSquantum dots controlled by alkylthiols as surface trap modifiers. J. Phys. Chem.C, 117, 24592–24600. doi: 10.1021/jp408544x
Zhang, Y., and Clapp, A. (2011). Overview of stabilizing ligands for biocompatible
quantum dot nanocrystals. Sensors 11, 11036–11055. doi: 10.3390/s111211036
Conflict of Interest Statement: The authors declare that the research was con-ducted in the absence of any commercial or financial relationships that could beconstrued as a potential conflict of interest.
Received: 05 June 2014; paper pending published: 18 June 2014; accepted: 05 July 2014;published online: 29 July 2014.Citation: Ichimura T, Jin T, Fujita H, Higuchi H and Watanabe TM (2014) Nano-scalemeasurement of biomolecules by optical microscopy and semiconductor nanoparticles.Front. Physiol. 5:273. doi: 10.3389/fphys.2014.00273This article was submitted to Systems Biology, a section of the journal Frontiers inPhysiology.Copyright © 2014 Ichimura, Jin, Fujita, Higuchi and Watanabe. This is an open-access article distributed under the terms of the Creative Commons Attribution License(CC BY). The use, distribution or reproduction in other forums is permitted, providedthe original author(s) or licensor are credited and that the original publication in thisjournal is cited, in accordance with accepted academic practice. No use, distribution orreproduction is permitted which does not comply with these terms.
www.frontiersin.org July 2014 | Volume 5 | Article 273 | 13