N1FI P A N flFJ_HI a a a aa a - DDA
177
'*rk Sudes Presentation N1FI P A N J- 4 iu flFJ_HI a a a a a a
-
Upload
khangminh22 -
Category
Documents
-
view
1 -
download
0
Transcript of N1FI P A N flFJ_HI a a a aa a - DDA

'*rk SudesPresentation
N1FI
P A NJ-4 iu
flFJ_HI
aaaaaa

1i5
444c
50- 67
6S-79
O-9O
149-165
REGIONAL CoTLXT
SHELTER
MIXED LAND US
EMPLOYMJT -
INDUSTRY
TRADE AND COMMERCE
GOVERNMENT OFFICES
TRAFFIC AND T1WSPORTATIOL
INfRASTRUCTURE PHYSICAL AND SUCIAL
WALLED CITY- 5HAH.TAHAAbAD
ECOLOG'f AND LUNG SPACES
1II

Cordexi
0
00I
r.

S
ra
/ / 1
A?IOAL Lw ..J.!.1IL CUJCZPT) --
For a rational distr1 i. UtiOl of pou1tio r-r
region offid to restrict th' iroi'th of Delhi, the Naticrl..Capital Region was c ciVd at the time of prepof MPD62.A The Natival Capital Region as lin'th173 covers an of .orrodmtelY 30,243
and consists of th Union T'rritory of D1h1 (1485.0(
sq.krrts.),the districts of Far19 hid, Rohtk, Sonepat
nd Patiipat tehsil f th district K.-irn1 and Rewari
Tehsil of district ndrrqarh in !thryann(13412.48 sq.
ks.) districts of 3u1anlshcthr, ticerut and Ghaziabad in
thsi1S of A1wr districts in jn (.492.90 sq.krns.)
namely Bebror, Mar -:r, Tijara Kishang'rh and part of
Aigr tehsil.
I
I
I.
NATIONAL C.' I EL SEGrr(UL\NCflTW.S)
As per the Cnu3.1931 th ' tta1 popuiRtiOfl of thi NC
wa' 190,00 lakhs yith P ri urban ppu1tion of 30.91 lakhs
(42.58%) and ruri 109.0 9 1 k h (57.42). The NCR has a
total number of 93 iirhn nnttlemnnts of which Delhi Unin
Territory and 18 othrs hv b:n identified s prioritytowns. Te tn'nn ni thir r-fl -ti't1 ttciblow:
S14.NO. UR3;tiL r.)Luu.TIoN, 198t In 1.akh
1, Delhi Unin T'ritzry 62.63
2. Merut (Includin? Kan}er Ither) 5,36
3,& 4, Faribad-!3allahTrh Cctplex 3.30
5. qhaiabd (Inclu'iini C!lex) 2.e7
6, Rohtak f3 1.66
7, Aiwar 1.45
S. Pinipat 'I 1.37

i.
I.
I
.S.
0
SSS
SSSS0
0
SI
Sonepat1.091.03
10. Rulan5hehr i•02ii. Mpur 1.0012. Guraofl
U
0.8713. nodinagar
it 0.6714. Kh.rja 0.5115, Re-ari
to 0.4716. palwal
U 0.4317. sA6tndrabad
it 0.3718. Bahadurgarh
it 1519. Khir al
Source * Regional t'lz'fl, 1CR
Census of India, 1901.
"R \TI T 1) E ,I1I- -- .-., - -,---- -
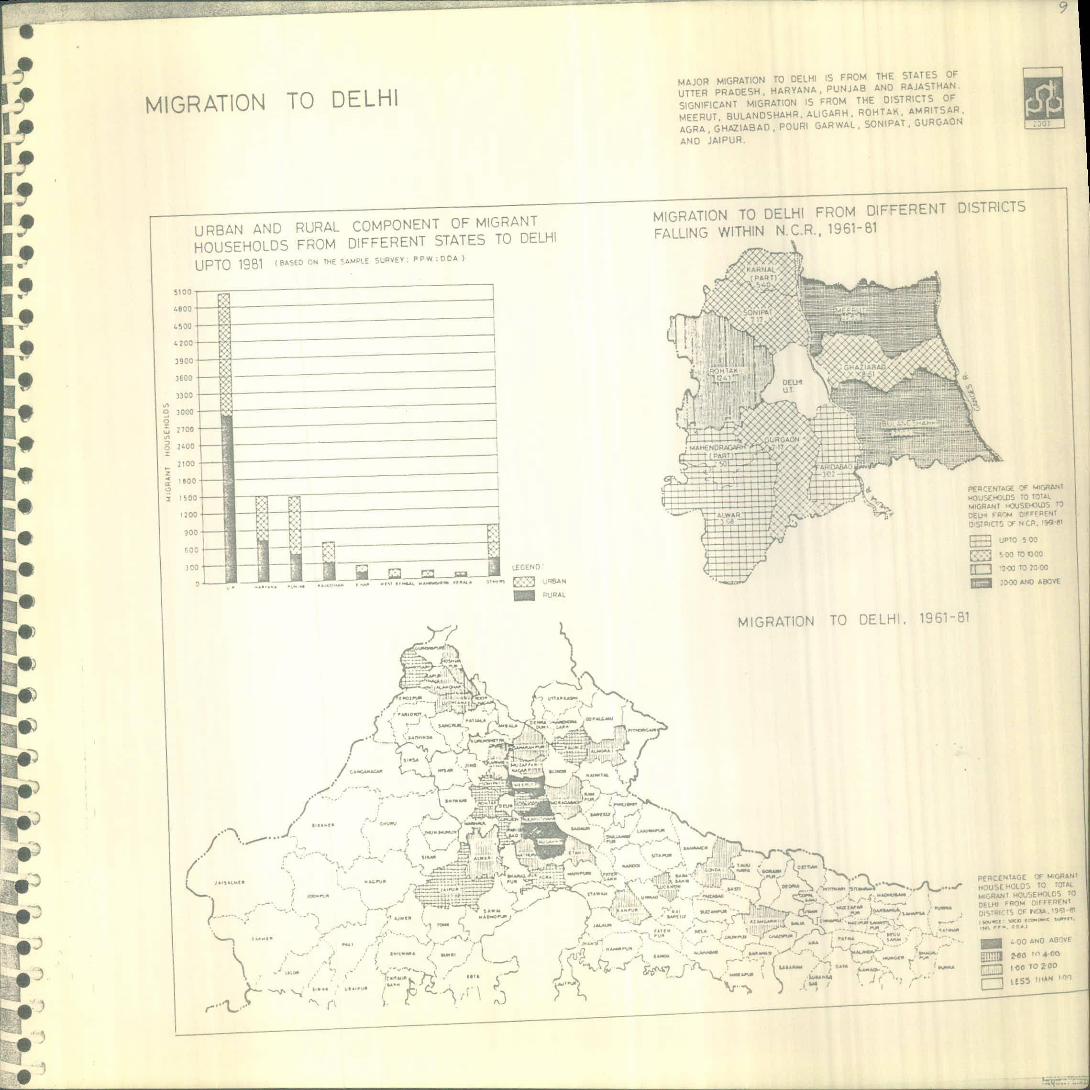
Migration is zn irnpOrt'Ut factor in Delhi urbanisationorocSS. In the dr1 1961fl1 tligration tD Delhi has been
at the rate of 0.96 11hs prsOfl5 per yer and in th sub-
sequent decade it Jws 'o'n timit1 at 1.27 lakhs per year.
The major are-a-, fro, :hich migration tke53 places as
r veated by the S0cio_LcflOmiC SurW?y conducted by the PPW
of the DDA in 19-131 ar's th districts of teerut, Bulandshehr,
Aligarh, Agra, hi-kb. Gr1v1, Almora, Mu ffrflgar an
Iathura of Uttar Pr 111 Ftchtcilz, Gur'ofl, S onepat andKarnal district; of iL-ryn!1 Amritsar, Jullandhar and Ludhiafl
districts of Punjab tnd Jr.iur districts '-f Rajasthan. The
above mentioned districts hv c-mttihUt' rnor than 50%
of the total migrants tD Delhi in the last two decaS. It
is significant th3t the major Co1pOflCflt of the migrants to
Delhi is from the couparatiV-Y well devoloped districts ofUttar Pradesh, H-irya)a, Punjab nd Rajasthan. These statescontributed 53.61. 13.24, 9,73. and 571) of the totalmigrants respeCt!V'lY since 1961.
The study hig1iqhtS that Delhi har, rec'!ived 28.79 percent
of the total migrants only frt the districts f1li-ncj (fully
or partially) within th ttina1 Cpit3l Region and 10.29
or cent frm th districtS fl1inJ (fully or partially)
the Delhi etrpOl.tfl!1 Ara r1urin 1961-81.

-S Z.l\- 200 1 .
patrn of urhafliStiofl has takentwo decades which has necesSit.t the reefinit.t
he Delhi Metropolit'fl o f±nd in the D-62.
Thus, the redefin':d 1111 iitrcplitan areaS wcu'd
cover an area of 3182 sq,krns. which comprises of the Delhi
Union Territory(1485 se.krs.) Ghaziab Complex includingLoni (496 sq.krr.s.), rIcIDA centr Ile-1 area (149,15 sq.krns.)
of U.P. Far!abad - 11Thnh Cmrlx (393.98 sq.}crns.)
Gurgaofl (266.71 sq.k'ns.) fl 4iur1arh (174.03 sq.krns.) the
Proposed township of Lun'li (i7.22 51.kMs.) an th'
cxtnSion of the Delhi R! 1.g in Ilaryana i.e. the portion
in Faridabad Complex an Guron -oinplex as w11 as the
part that lies between Fri)Da -_'TO Gurqaon.Of Haryana.
The fcllowing factors were taJ.en into consideration while
redefining the DMA.1. Towns of the first tir hich -ro in close proximity toDthi Dinn Territory, such 's ciiaid, Loni and NOIDA
in U.P. ridabad_Bal13hrh, Cj'.efl, hadurgarh, in
h1arymna have been inc1i'e as p art of the redefined
These towns arc ident1fIrl a on the basis of their proxlwi-ty. growth of urban p ilatj-cn, rp3A instrt.ali5i0fl,future holding capzeity arv th' expected physical rnwth
of the towns.2. Towns like Sonepat in IIryn' an Modi Nagar in U.P.
have not be-en include' tn th- reftnod D1t4 even thoah
they have strong linken s with D1111 and its surroundnqSThes .. ..towns are no doubt m'jcr aciVity centrr's in ther"gion but are locatol at a riraiter distance nd therefor,are not considered in the These towns can h made
fully self_cOfltiflei !th strsn9 ocorvmic ease and will he
in a position to absor the:Ar-nt repul -tion whichotherwise would have co':l to olhii in the futur.
3. while derr.Qrcating the r)rlht Motr poltan Area th e planne{
areas of each of the te;.ns, the cntrollcd are-a an the
v±llays with their revenue 'nrie3 which follow the-
controlled area fllin9 ithtn or partially outlC thecontrolled area have been c'n o'e3 for a1miniStratiVe
convifllCflce. In most of ths e t. :fl5 the planfl irea in
cot:paritiV0lY small r th-'.n the c ntr,lle-d hch qi
:h eon: rieitv to .tIv9 1eve1enm'flt mthvr± ,os

mder Q4s control in .round each town ithin the UMA.
These authorities will have a comwand over a larger areawithin the towns in t2rrns of the desired physical growth of
the town.4, ExttnsiVe mining and quarrying activities in thportion of the 'Ridge' within th r'. Delhi Union Territory
as well as in the Riçje in 11ryina and to prsrv tho
natural environment approximately 78.85 sq.krns. (beyond the
Delhi Union Territory) have boen identified for control
within the DMA in order to prevent further destructAftand devastation mainly to subsrv environmental consi-
derations,
POPULATI : I:R0JCTI. - 2001.
In the course of the work on population trends thefollowing statistical meth c3c have been considered,
1) Parabola of the second degree fitted to th absolutepopulation of 1961,1971 ani 1961.
2) Parabola of the third deqr e fitters to the absolutepopulation of 1951 0 1971 and. 1981
3) Vital statistics mtho1.4) Sechd deqree curve fitti with 1(--t square method
(Two),5) Third degree curv flttt.no with i f : . n . oqur rnthod6) Logartheinic str.iqht line rnethod.7) Extrapolation of the population projections made by
the Registrar Cenral's xprt Commit --8) Projectlns made by the Re'.ttrr Generls Office for
DDA on special ro uest9) Exponential curve methd.
Statistically sp . king the pvpulation of the UnionTerritory of Delhi n be betwen 118 to 146 lakhs and.115 to 144 lakhs for urbn

n—- -.-----------------.-.------------.--------- .-
1COMPARATIVE PIc'iuR: OF TH .STIMATED FOR DELHIUNION TERRI)RY: 2001 BY VARIOUS STATISTICAL ME1iODS
- --------- s -Sate nnnan e* e flsafl SOrn 0 -i 4-4 Prni - ,-i rn Methodology used for theJ • A* £ ____ ...- - - - - - - - - - - - -
Delhi Union Urban T)elhi Population Estimation.Territory dd in 2001 ( In Lakhs
- ___ n ne2001...__inn.. . n_a _ee* ---------- - -------- - - -- -
1 1145.68 144.04 Exponential Curve Method.
2, 145.12
3, 141.38
4, 137,89
5. 137,08
6, 120,00
7. 127.69
8. 123.58
9. 117.68
141.35 Logrithinic Straight Line
Method.
130.23 Vital Statistics Method,
140,00 ittini of the third degreepar,-bola with least squaremcthod.
1:37,06 Fitting of the third degreeparabola curve.
N.A Projecticns made by the Regis.trr Genal, Census of Indiaby Special Request from DDA.
122.75 Fitting of second cqrebola curve.
.xtrpo1ati'::-n of th proj-ect±rmay be Registrar General'eExert Committee, Census ofIndia.
115,40 Fitting of the nnconddeqrparabolic curve fitting withleast square method as usedby TCPO.
- __ -------------as-- - -- - --- ___ ---------- ------------ -
Source s 8.cioEcono:r1c Policy Unit,Perspectiv- Planning Wing,
Delhi Oev'1opment Authority, 1991.
Lo-oking int-, the praJectI-n3 r bath the Union
Territory of Delhi and Delhi. urban by v-riuo rnt s thpopulation Os tim ted through Lg'rithinic s triqht timoappears to the upper limit to th pop111tion i.e. 146 1khoand 144 1khs respectively with means tht the populationat the turn of century uould h n ny 2.3 times rrre thanth-it of 1901. During the lt three dci'3S the growth c

•.. Hi ycurve has high possibility. This assumes tht the ratenatural growth and miqr it±-Dn may rm.:in unchanged for tco:J.ng two. decades, There is n exception that th'rbe a faster decline in death r t due to b"tter healtfacilities, rises in th litercy 7nr1 income levels,futhre,thezIs a possibility tht the rte of mir.-ti.:to Delhi may not be as hLqh no at present if the policydiversjfjctjon of ecr:n •of the NCR fruct.tfics,
Projections by the ................ .....given an estimate near: te th-it given by the lorithei.straight line. Throuh the birth cry1 de th rates in un:Delhi appear to be dependable they suffer from heavy UfldeL
r:'porting in the rural Delhi aro, Sufficient d-. taQ onrnicjr tion is also lackin-i. The ratio between natural increaseand migration was found to be 11,26. Th" ratio. of Incraseby migration to that by nutural procoss may not remainconstant as assumed, The r.rojocte population by this methodh.s therefore its 01T1
iIth regards to the limitntions of the projections madeby the third degre c piraool (with least squir'-h. while projecting figures for rural Delhi, it was
observed th : t the populat-Lon of rural Delhi In 2001 wouldcome to a negative figur- which was taken to be zero ;is climiting case. Thus, the use of the third degree parabolahas been avoided. There tare about 258 villaqes outside theurhnIsable limits of MPD62 In the Union Territ-:ry of Delhisome of these would b' ?nvlopd in the proess of physicalurban growth by the year 2001, however, a certain flu browould still re,iain outsje th urbin limits.
The projections based on the scnd degree paraboL c1ose1agre' with the intermediate projections of the RegistrarGeneral's Export Cominittic. They are infact almost enuel ancithis strengthensour reliability on the second d 'gre- . parabolacurves fitted t- the absolute nub'r of ooulti(-n for pur-o5es of the 1 . ister Pliir: DrIhI(0 rorcse be rnodifj'r;fl

S ESTL1ATED RURJL URBAN POP 1,J[ATI0 FOR DELHI 1971 - 2001
•Taking into consideration, the vriou5 estimates made by
different ernisation S and also bssed on the average annual
rate of grwth of populat-on over the decades 1951 to 1971,
an attempt has been made to arrive at an approximate an
realistic estimate tf the population of Delhi for planningpurposes for the years 1981 to 2001 that -wil-1 be housed within
S
and outside the urban limits. The concept of urban and rural
does not follow the defination of "Urban" and "Rural" for
Delhi Union Territory defined by the census of India 1981.The terms "within urban limits" is defined as the area for
which the Land Use Plan is to he prepared for 2001."Outside
the Urban Limits", Are the areas which fall outside the
I urban limit but within the Delhi Unin Territory.
The annual growth rates over 'the decade 1951-61, 196171and 1971-81 was 5.24 per cent, 5.29 per cent and 5.3 per cent
rspective1y. Therefore, it is not unreasonable to assume
an annual growth rate of 4.00 pr cent for the decade 1981-91and 3.5 per cent for Urbn Delhi for the subsequent period1981-2001. In case of the ru&al population for the sameperiod.it has been assumed t' have a growth rate of 2.28 per
cent and 2.30 per cent for 1971-81 & 1981-2001 respect-ively.
The assumption of th growth rate of about 4.00 per crit
for the decade 1981-91 and 3.5 per cent for 19912001 for
urban population are comparrble with the average annualgrowth rates of urban p ': pulation of tyeIV countries as
estimated by the U.N.City projections.
Basedon these assump tions the total population for the
Union Territory of Delhi and also the Urban population for
the period 19812001 his been estimated for planning purpose
Given this background and consid2riflq the various factors
governing the urban growth rates in Delhi, it wbuld be
realistic to expect a population growth of 128.00 lakhs fol.-
the Union un4eQ Territory of Delhi by the year 2001 and 122,,ulakhs for urban Delhi. Therefore, these estimates have , been
adopted for the Master Plan for Delhi (as proposed to b
modified). Keeping in view the constraints of, water, v:c'er
and transportation and th techno1og and likely spatialchanges in the coming decades. However, if the growth remainsunrestricted and if the present trends continue Delhi Urban
by 2C01'ould have a 00 0:hs

TTE TN C
Me State Income of J)1ht Union Territory has been ste..rising from R.982,01 crnres in 197071 to P.1791.13croresin 198081 at contnt price. At current price, for the sameperiod it rose from 0.472.34 crores to 0.1791...13 crores andit is indicited that by tho yer2001 0 the state income hasbeen estimated at Ts.10257.00 croros at currence price Qnd0.5060,35 ccores a t constant prices
The state incme in 1961 of thn Union Territory of Delhithi tertiary sector contribital 60.783 of thz total aoAincome, the contribution of seconlary sector was 32,12%and the primary sector contrib,t-cj 7,101 only. In 1971,the contribution has ' ste dly increasing only in tertiary sectojand delening in seconr3.-ry and prim.ry sector.
The per capita, income per work r pr annum at currentPrice was higher in tho trade nd commerce soctor in 1955,followed by inustry, Other s rvico,trans port and communi-cation, construction and primary sector, 1I:ever, in 1931,the contribution of th' rim-iry sector pr cap ita incomeper 'orkervas highest followed by thr services, transportnc5 comiunic,-t.jcn, industry, trde & commerce and construction,
The percapita is also S tnndty increading from 0.118600to 5.2942.00 at curront rrices during 1970-191 and atconstant price it has boon incranned from 0.2465.00 toP. 2942.00 during the sme porird. If the trend COfltiflUiiths per capita Income would ho 0.0034.00 at currentQ priceand 0.3963.00 at coyjtirt nrfr-r of 19n..01
LECENO
.4 RBAM
PUPAL-
540
1.800
4500
4200
3900
3600
3300
3000
7700
2400
2100
'20'
30
30
.. ....,..
Pz.1.1 T)'.
;
3ACN - •'-•-' __.7.____.-._
PER CEUC .oc MIGRANTCL
40-'E&DS 10 104MIORI-,41 ,c)$E4)05 7OEU4 FR(G4 0Fr0EJ1
F -'
UPIO 500
500 rO 1000
EE3 .y3 13 7300
7000 ANO ABOYt
t4.
/
RLI'
.-.
MIGRATION TO DELHIARYANA, PUJA8 AND
SIGNIFICANT MIGRATION IS FROM THE DSTRICTS O
EERUT,ALIGARH. RONTAK AMRITSAR,
Ac,RA,-
MIGRATION TO DELHI FROM DIFFERENT DSTkITFALLING WITHIN N.C.R., 1961-51URBANAND RURAL COMPONENT OF MIGRA NT
HOUSEHOLDS FROM DIFFERENT STATES TO DELHI
UPTO 1981 66S00 CN !HE I.M°05 UPVEV P P W OOA
MIGRATION TO DELHI, 1961-51
r
/
Pa,pst..t C- ................ V6 ..- •----.-
-...-...,. .- 't-.
? •' x L..__ ."'4 (
.-'.f4.—
/4•,'cZ. 1 c \
1 •.j;— '1-
•.a - r -J .. .-.
--: -- -.
( fl1f 7 IdA ,'-,i' 1..
—' - ---- .r----
.. L. -i •........- ç• ---'
:A ..f .... _ç__•
toMK.RAN' H0IJEMOtCS061.1-H FROM oppFrpFN0IR1C" OF
'XC 4 ro.0 1-'
4QOA4-0 AEj.•2-00 TO 4-001,00 To 2,001J

.
.
4

001111 ME1P1ITNARE A - 2001CO." UNICJ TERflI0RYFPRIOAI3AO - BAI1AOGARHGL1flGA0'BAHAC)URGAPH
uuDuC/-IAZIAR/AD - itYiN0rD/.fliOGF: rMiNG WTSIDE WE Afl6/A çjr
c,urlGA1C. 1 1PID,1BA0.IOIAI AREA OF DMA.
10
OPQS5D IAIIEt,IN 50 KMS1455 0019) :9825671174.03
00111)2 22 496 SI149
3151.85
F.LeDELHI METROPOLITAN AREA - 2001
'S

1 '
NATIONAL CAPITAL REGION)URBAN CENTRES ( 1 0,I CENGIJG POFuLATI)
, •
1 100,000 & ABOVE
D so.00 to 00,000- 0 20,000 TO 50,000..) • 0 5.000 10 20000
TI[N.0 0 CO','EPG AN AREA CF A p PRcxIMAcEr' 3C,21 GOSO KMS. AND CON5TS OF THE UNION TERFI1OPY OF DEl II(183'00 SO MMS.). THE DISTRICTS OF FARIDADAD. po-u,5c:JIPAT AND PANIPAT TEHSIL OF DISTRICT RAPHAt. ANDPEWARI TEHSIL OF 1)STRICT MAHENOERGAITH IN HAPYANt.(134124B SO.KMS.), DISTRICTS OF BULLANOSHAHR. MEEPUAND GHAZLABAD IN U. P. (1085309 SQ. KM5.) AND TEHSLS 1
A1WAR DISTRICT IN PAJASTHAN (4 1 9290 SO . 1MS) NAMELBEHROR,MANOAwAR TIJAPA, KJSHANGARH AND PART OFAI.WAJ TEHSLL.
2E
\/\
\ i -) . 'A—' ''•1'fc
\ \ \ ;( N/ \HARYANA \ .._./ \ :'' - . (
\ \-
/ ER 1 PAD Si
DELIII 7. ..\ .> / .•....-•' .__) • I
/ '\. I \\
:T :Al—
N C R BOUNDARYDMA/RAJASTN-1\
STATE B()JMOARY\)
,: / •-..-- UNION DOUNOY
DISTRICT OOUNO.%RYNATIONAL HIGHWAY
STATE HIGHWAY
[] om€ ROADS
RAILWAYS
\
A5 0 0 8 74 )O 76 42 RU
II

AUNAL iAL kEU NSO . MS . WITHA TOTAL POPULATION OF
19192 1_AI IN 1981 N C. IN 1981 HAS 94 SIZE OF POPULATIONCL4SS POPULATION NOS OF URBANURBAN SETTLEMENTS WITH A TOTAL URBAN(SIZE) SETTLEMENTSPOPULATION OF 9090 LAIcI4S.MOPE THAN 1,00,000
II 50.000 99,959III 50.000 49,999 16IV 10.000 19,999 26
60.00V 000 9.999 37VI LESS IIIA1l 5.00.0 03
TO &AWAU
?l
F
N.C.R BOUNDARY
STATE BOUNDARY
UNION TERRITORY
. DISTRICT BOUNDARY
F-7 NATIONAL IIGIiWAY
EEEEI STATE hIGHWAY
RAILWAYSVS
l4 $0141.4
36 SO.KM A
6 D 6 Il 5 V. )) 36 £7 K'

NA11ONAL CAPITAL REGIONCLASS POPULATION NOS CF URBAN
(SIZE) SEE TTLEM ENT 5
• MORE 1I(t.N 1.00.000
. 11 50.000 99.99S Oh
It 00.000 49,99s IS
IV 10-COO 19.99S 20
V -5.000 9199 37
vi LESS 111AM 5.0)0 03
THE N. C ft COVERS AN APEA OF APPROXIMATELY32,01I SQ. KMS, WITH A TOTAL POPULATION OF791.92 LAhE IN l98 N.C.R. IN 1981 HAS 9URBAN SETTLEMENTS WITH A TOTAL URBANPOPULATION OF 9090 LAIO-IS.
URBAN CENTRES (1901 CENSUS POPULATION)
SIZE OF Plo;,ULAIICN
-1)
S
)MAP A 'j-..r A S l A
• \s
SJtJAI
-II • 0- -._- II
P .\J, •\HRYANA
GA
-
P0 4 l A,
A 0A )IulI
• .J.,. n
• / ;:'\/,.r \
f--___
10 1A}.AUI/ \r-i _ r - •...SUA\.\4
\_. ' aw pAI)0I
ow I\
-
ALI
• j .1 / J
/
I,k3 cu.cJ
—
J, A._ STATE 80-ifICARY
UNION lfnPlionV
AV
7 IRAs
STATE H*IIWAY
.1L. AAILWAYS
K4 50 KH I I

SLS
21.9
81 86 91 96 2C1
POPULATION PROJECTIONS - 2001
EXPONENT I ALCURVEVITAL STATISTICS SECOND DEGREE
NATURAL GROWTH PARABOLA
15-
3O
REGISTRAR THIRD DEGREE
GENERAL S OFFICE PARABOLA
1 86 91 9E 2Xl 91 e€ ' :, I -- --
J1
4'—a
NATIONAL CAPITAL REGION LED:
—.TONAL CAPITAL PL
V —A-
L} ME TIY)L
I.NA - 2O1
.jy4 1PcWY
I . --- IXLJ-Y tJPE3AN A€A
.. •. . .- '.4' a.AL GH WAY1 -O—Em
\\/—°lY..'UNE
S V".S CFU TAN AR EA -
.-0 c.a r%tTY T'7wN
0 -
a C
! .
•} 'i'l
POPULATION PPOJECTICNS BY VARIOUS
METHODS
VA 0
______- -Iit 7
71-
DEUP.BAN

POPULAT I ON PROJECTIONS - 2001
^F,
VITAL STATISTICS SECOND DEGREE REGISTRAR THIRD DEGREE EXPON ENT I
NATURAL GROWTH PARABOLA GENERALS OFFICE PARABOLA CURVE
y2&9.D335xi3935X .x.00h5x y622CtOL.3h7
130-1,302
#97.,e 359-
j 729I
8 T H PATE 260
CEATH IP ATF __752
I
NATIONAL CAPITAL REGION.....P4AtCAL .APUA& PGO
pmp ' r' cw EY17L-A -
---0€LMI •J4'c EPQI1TP
cLI'l JARhN PEA
- .AT,4Ai. H'C,H NAT
—O€P- TL.4V L.E
b
U tOS CF EtflU1A AREA -OO1
Q OTIER TJTIY rCwS OF
ACP
-4
Z
1951 66 61 66.
POPULATION PROJECTIONS BY VARIOUSMETHODS

URBANISATCN IN INDIA 1901-81
HTTTII TL P0JL&TKM -*
,',,I ,,•,
0 -'----•-•.•' - .-"---.•. .•.:.
YEAR
ESTIMATED RURAL & URBAN POPI'L-T
1171 1276 1981 15114 1911 1"6 1 D0I
YEAR - , RaN- PURkL
30
20
'ID
Do
ID
aD
cr 7°0
- 10
so
30
20
ID
UEAN a
YEARS
1971
1976
1981
1986
1991
1996
2001
THE TOTAL POPULATION OF DELHI UNIONTERRITORY IS ESTIMATED TO BE 128 LAKHSDURING THE YEAR 2001 WHILE THE URBANPOPULATION IS ESTIMATED TO REACH 122LAKHS APPROXIMATELY.
IT IS ESTIMATED THAT DELHI \ULD BEHAVING A RURAL POPULATION OF 6 LAKHSBY THE TERMINAL YEAR OF THE SECOND
PLAN PERIOD,
TOTAL
4,065.698
4.994,289
6.220,406
7,525,908
9,109,1.07
10,778.824
12.809,999
URBAN
3,647,023
4.544.854
5,805,823
7,070,415
8,608.966
10,234,375
12,217, 671
RURAL
1.18,675
449,1.35
414,583
455,493
500,441
544,449
592.328
czusus of INDIA 1911,1971 1911
PIOiECT&s MALE BY PPW,, D.D.A

If
74
YE AR
STATE INCOME DELHI
TOTAL INCOME 1970-71 TO 2001
11000
-
:::
Li
Cr
I—o I
E003
- _____ -
000868
•300 .' '- 01754
In
Holiq
'3000
409 1S85
'7919-
j
''1
&-s ;',0-e- 2cx-01 YEAR
E5 7 ; 'J A(5 OF 1( F OEI.1II -
PER CAPITA INCOME 1970-71 TO 2001
1030
9000 —
1 7000
a.
Ln
2000 "is
1970-7 •-' 9-9 9-7-31 3S99 20370 YEAR
SOURCE: 970-8': ESTIMATES CF STATE ICCME O OLN' - IUN6.7910813001 PPW
PERCENT.-- G ;-:' DISTRIBUTION OF STATE INCOME BYINDUSTRY OF ORIGIN (AT 1960-61 PRICES)1960-61 TO 1981
00
329
15C 79
LEGEND
Eli:SOURCE: 960-' ES
T IMAIES 3F STATE INCOME O F 0NI- JUNE 79.
9URE.W 09 EC0T40MCS AND STATISTICS
197-1.DPWTET1A3Y
INCOME PER WORKER PER ANNUM ATCURRENT PRICES
4030 lL000::
12000-
7373 1007
_________5000 c e000 I
Z 5000- I
Ix
4030 — 4OoO::
CC Cz
13
ECONOMIC C.3 w ECONOMIC
SECTOR 1z - SECTOR '.
CL1955
9S171.IATES (F S131E PII*E 09 DELI-Il - JUNE. 79 P I' W. -

*

I
'S
:•
'S
S
SS
1 • ---
At the time of L're: 3LLOL &.. ij c:
there was no institutional arrangement for
provision of public housing or developed land togeneral public. Major government housing activity
was by the Ministry of Works & Housing forCentral Government employees. Delhi siate
Administration, Municipal Corporation of Delhiand New Delhi Municipal Committee were alsoproviding housing to their own employees. Ministryof Rehabilitation was responsible for providinghousing to displaced persons who came to Delhi afterpartition.
According to 1951 Census, there were around 3.14lakh households and the number of occupied houseswas 2.55 lakh, The deficit was 66000 houses which
rose to 1.04 lakh In 1956 and was projected to be
1.5 lakh by 1961. Around 43000 families were
squatting on public land and about 100 unauthorised
colonies were existing which were regularised along
with the preparation of MPD-62.
2. MPD-62. Policy and Progawa:
The MPD-62 envisaged the urbanisable area increase
from 42700 acres to 110500 acres. Out of this
47400 acres was allocated for residential develop-
ment. So far acres of land baa ri dvelodfor residential use.The objectives of MPD-62 were framed to meet tha
deficit in housing a development programme, whichor000sed I) to provide tenements for slum dwellersii) to provide developed land ill) to provide hous-ing for employees by public agencies iv) to earma:b
7 ac'aaa aYr-tia

S
S
S
'S
.5
2:;
it was aimed to accelerate the rate of housingconstruction to keep pace with increasing pop-ulation and to narrow down the huge backlog of ho-using with emohasis on low income housing at
low cost.
It was proposed to construct 7,5 lakh dwellingunits by 1981 starting with a modest constructionof 25000 dwellings per year to reach 50000 dwell-ings per year in sixth five year plan. Out ofthis 1,10,000 dwellings were proposed to be cons-tructed for squatters, 4.87 lakh dwellings by theprivate sector, and 1.5 lakh were proposed to beconstructed for public sector.
3.
The r c7, iLt.::. ,. ::n.:; .t:.Ltaro startaciin 1960 on the recommendations of Advisory Cornini-ttee of Govt. of India. Through the schemes ahou;2 lakh sites have been provided to the squattetoin 44 resettlement colonies from time to timeIn this scheme as per the latest modifications. aplot of 21 sq.m. with common services and otherfacilities and amenities have been provided. Nowthe minimum plot size have been changed to 26 sq.mwhich accommodates an independent bath and W.C.As per the estimates there are around 607 unauth-orised colonies existing, covering an area ofabout 3203 Hact an i !LL ti about 2 lcakhfami ii co,,In case of public housing, about 5000 dwellingunits have been Drcvldcd so far for govt,ern?loyaa: .' 00
'I
.i.
:3:
MPD-62.
The private sector uDtill now have constructedaround 1.5 lakh dwellings on regular plots.
About 2.8 lakh families are registered with DDAfor plot or a flat, which gives an idea of thehousing demand in the city. Housin g is being
made available by DDA to general public in the form
of plots, flats in group housing for variousincome groups, land allotment for cooperativegroup housing, upgrading of the housing environ-ment in urban villages, unauthorised colonies andslum rehousing. So far around 3C,000 plots ofdifferent sizes have been prided by DDA togenerate around 65000 dwelling units. More than1,00,000 houses have been allotted to generalpublic and another 1 lakh houses are in various
stages of devc1CpflVflt In 125 residential areas in
different parts of Delhi,
4. Proposed Plan 1981-20014
The objectives and sub objectives for sheltergiven in the proposed plan provide for 1) reorgThIsation of the existing developed areas where0ossible or necessary, ]eening in view the existing
Infrastructure and its possible intensifCati0fland ii) to the extent feasible enlargement of the
urbanisable limits for ctorin q L the needs uf
a growing population4.1 population o1J:i:.
The Delhi Urban area (DUA-31 measUiiflhabout 44780 Hect. as per 1981 census, accommodat354.5 lakh urban population and the balance of7.5 lak resides within 17 settlements, declared
•3 towns and ajnfq:per the

4
projections for the year 2001, the totalpopulation of union territory of Delhi will be128 lakh. Out of this 122 lakh will be in urbanareas and 6 lakh in rural areas.A two pronged strategy has been recommended toaccommodate 122 lakh population; j) to increasethe po p ulation holding capacity of the area withinurbanisable limits declared till 1981 and ii)extension of the present urbanisable limits to theextent necessary.The studies have revealed that by the year 2001the present urban area can accommodate about82 lakh population in its residential developmentsby providing addit-ional infrastructure, restruct-
uring of the emoloyment areas and work centres andsuitable transportation system. The remaining40 lakh shall hv t- I
urban extension-4.2 Rousing L 0-] -0OJ ori'3Urban Dblhi at present accommodates about 11.5lakh households in different housing deve10-]men\::resettlement, squatter settlements, plotted, multif'ni1y, unuthorjsed villages and traditionalareas. In next two decades another 13 lakh hcu:e-holds will be added.Housing shorta ge at present has been estimatedto be about 3.0 lakh which includes 1) squatteroand shelterless ii) families sharing houses incoricyested built up areas, a ...- •.i: '
.t •ij .r]I-.-n'.-r-.
S
S
S

0
0
0
0
0
0
S
S
S
S
S
S
0
S
S
S
S
0
S
S
S
0
a
S
Ia estimated to be 16.2 lakh dwelling unitshas been divided in five yearly intervals.meet the housing requirement by 2001, the avproduction of housing per year sho-"from 1981-86 to 97000 by 74.3 Sin
Thefor residential purposes, in a two storeyed twodwelling unit, and 80 sq.yards for slum rehousin-and low income grou p . Later on the minimum pl
- __.-)S&size was reduced to 40 sq.yards and t.25 sq.yards for squatter resettlement.Densities on slihiriq scale ere also proposed forgrouo housing develolimeot. for achieving intensiveland utilisation. Studies have indicated that mostof the ;-lotted devalo:ment remain single storeyedfor n lcng time(a.comrnodating one or two familiesin oenerl)and grouj' housing in the overall city desi-gn has v'ry marcina1 land utilisation.
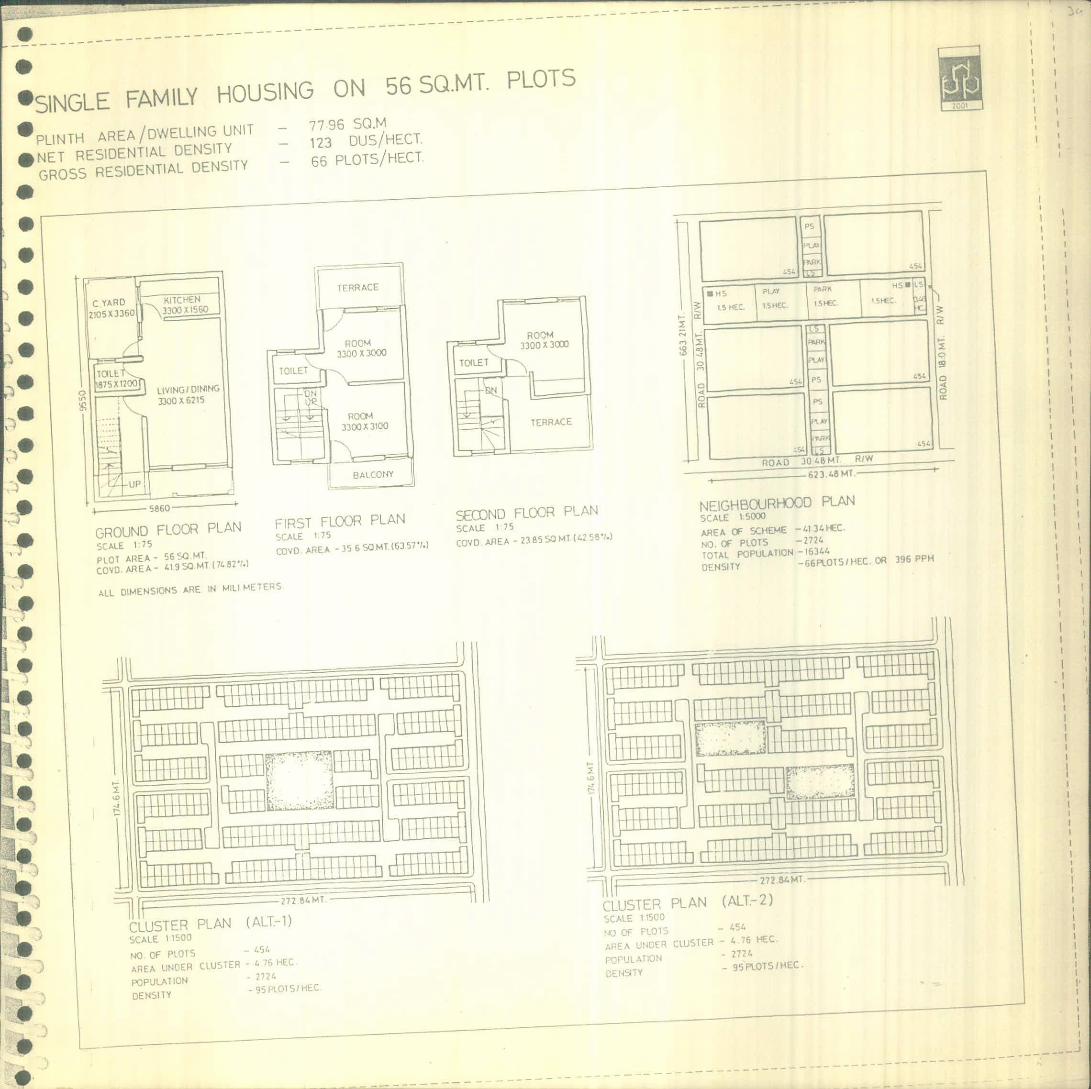
In the pro posed plan, partially built single familyhousing on plots has been envisaged. The rationalefor the incremental type par.ially built housing isthat ccr.idcring the aspects of affordability relat-icnship, effec±encv of land utilisation * equity(social distribution of urban land), and flexibilitycoualderations, the most appropriate type of housingthat can ba provided is partially built housing on 7080 sq.m. plots. Each household in the long rangegets a dwelling unit of about 80-120 sq.m. Plotsof 32 sq.m. size accoinrodating independent bath and.C. are proposed for sites and services and serviceersonnel schemes for economically weaker sections.artiliy built plots of 56 sq.m. size and 72 sq.m.
:ize are proposed for lord income group and middle:[ncoiie grou housing br hiher income aroups,
O
S
S
S
S
S
S
the family plots of size varying from150-250 sq.m. and multi family housing isproposed. Single family housing accommodates1.3 families(Household size 6) per plot.
The densities achieved at net level in caseof 32,56, and 72 sq.m. plotsre 193 DUs/Hect.,123 DUs/Hec. and 107 DUs/Hect. respectively.These densities are comparable to the densitiesachieved in grout; housing develo pment forsimilar, accommodation.4,7 Jt9rn?.tive ovrXall rultin densitymodels:
Model I: 0vra1l density 300 ersons oerhectare. This will enable to accommodate 12million urban population with DUA 62 area of40,000 hectares. This requires housing at veryhigh density, redevelopment of all the residen-tial areas, comolete redevelopment of resettlem-ent colonies and reconstruction of government
housing areas. The work centres required to bedev.eloned at 400 to 500 FAR, average heightvarying from 20 to 25 torey. Thisale requirescomplete redevelopment of water supply, seweragepower and other facilities. In case of transpor-t-tion under ground ra p id transit system, commer-cial areas to go for underground/multi storeyedparking facilities and new cycle tracks.This model requires high level tcchnoloyhigher use of energy and high per capita income0
Model Us Overall density 100 persons perhectare, which will be same as prescribed InMi)D-62. For accommodating a total urban popul-ation of 12 million additional 80000 hectareswould be required which .no i .:nt o 90 per cent
0 Un. on T02:'Ol tor y 1or0

22
9 7
This will require housing at a density of
100 DUs/Hect and the over all dwelling unitsize being 150 sq.mtrs. The resettlement
colonies would be accommodating 50 per centof the present number of families. All the
unauthorised colonies will be remaining assingle storey devlo:ment while the Government
:ousing will remain in present conditions. The
work centres will be required to be developed
it low density of 75 FAR with 80 per cent of thesace to acco!riodate the informal sector. Noradeveloument fcr service lines and telephones
and other facilit1cs would be required in case ofinfrastructure. Sufficient space would be availablefor the required social infrastructure. The openspace would be av3ilable 9 60 sq.mtrs, per person.Mass Transortation through buses would besufficient within the urban area..In urban extension 1.3 million d 1LLic; unitswould be required at an average plot size of ausq.mtrs. in Single family. The Ring Railway andIts spouter mRy bg used for mass transportation.This model will -or1c at present level of technologybut would be high energy corisurrdn and would
rerjJ!re higher per ce:Ita Income.
•odei 0111: Overall density 200 persons per
hectare. Total urban population of 12 millionwill b accommodated in present urbani.sable limits• 20,000 hectare of additional area. This will
require housing at a net density of 130 Du/Ht'•ct0in group housing and single family housing on60 eq.mtrs. olots. Existing resettlement colc.luand residential develo pment will be acceptablealong with develo pment of new resettlementcolonies The unauthorised colonies shallat single otorey. The bunglow area in New DeihJ.
9
0
S
'STo
S
'a
'I
0
11
'I
4
0
0•
0
of 75 persons per acre. In case of existingurban limits it would need cent percent of theholding capacity of housing areas.
Deve1oment of work centres, flatted factoriesgovernment offices and other commercial centresalong the ring railway. The infrastructure wouldrequire remodelin g of trunk lines in part ofurban area while sufficient space would be avail-able for social infrastructure. Multi modeltransportation system consisting of Ring Rail,light rail trains, buses will be required to workin complement to each other. In urban extension0.8 million dwelling units will be required at anav erage size of 60 sq.mtr. in single family.Ccmmercjal areas to b developed at 125 FAR andndustria1 area at 120 FAR. Open space would
be available 10 sq.rntrs. per person.L:vel or tcnology rqu.ired in this cse wu.L2be ];iher than r';ent but not too sophistic2teJ.Tis :noJz1 ensure3 b;: energy c : nsum , eion. co-relation :zith proJctcd per ci;!ta income andvery 11nite1 r1 fc.tioe,,
!tFP,
1•H.Ll
00

Hous ing AffOrddbilIty Ztucy: I
The housing affordability study is based onthe soclo economic survey conducted in 198182,According to survey 47.25 of the population 15earning upto .70)/— per month, 35% earn between2.701-1500 per month, 145 earn Rs. 1501 .3000 Permonth and remaining 40 earn 2.3000 per m.nth.\.
The study is conceived in three ?arts dealingwith 1) Present living conditions, ii) housingprocurem'nt nithods, and iii) pro'osals forfuture housing development.
Surveys have shown that the housing ownership inDelhi is 54%. Urban poor are squatting inpublic/- ^riv atc lands in the absence of properphysical and social infrastructure. In case ofeconomicaflyweaker sections the occupancy 1661 in one roomo6 dwelling and 24% occupy tworoomed dwl11nçs. About 85/. person prefer built
accont'.dation. on an average 45/. people residein cno room, 35% in 2 roomin more than 2 ro--:r housesdousing is provided in the form of unhuiltand built accommodation in the form of flat:for variods income groups by the DD;. T)-.e31ze5 viry from 21 3q.rfltrs. to 150 aq.mtrs. and
MnbuilL. aac"nnown tion varies from 20 sc.mtrs. to250 sq.mtrs. approximately.
wtially built single family,with indivlUul.)iysic&l Ir zustructure have been procosedCar the , incoiw groucs,th 1kt* Qqgwknal.
Tho k dnimwa ;lt size is 32 sontr.rrs ; osed for the ec'.Jnorricilly weaker eectionsFr middle income groups 56 sq.mtrs. and 72 sqmcc,:.artia1ly built clots have been proposed E,higher income grouos, three fin'ily plots havproposed alnq-.iith built a r:J,: :ion iii1rm of multi f - mi 1',' houc

HOLDING CAPACITY - 1
LEVELS OF STUDYWORKERS HOLDING CAPACITY AT DIVISION LEVEL
*ACTCP ArFCTIN( LELSOF IJP______
HOLDING CAPACITY .. . • O5ION CIT \ \ 1/- (jOENrIA IT. !HE P
I •115 X0 a 15. r
POTENT
IF INFRASTRUCTURE•-AVAILABILITY I
ITIYSC/
I / /EPO 4EHT AREAS I CENTERS 000_\
C.AI'ACITV AND POTENALn zsoocx, k
TPA NPTATION NET WORN — I :;71
04, 10
- 800000
Otton 2 50000
a F.xStMG NO OF
0 iPOSED NO wORTERS
• m
HOUSEHOLDS ABSORPTION POTENTIAL IN RESIDENTIAL DEVELOPMENTS — METHODOLOGY
* . C.III,A1ION 'Jr IUING PTN TiAL - LLUSrPATIVE STUDY DIVISION H
r'OF VELCPENS
DENSITY Of "LoFIEFISrINS PIP P . M. w(j,:4,r'C-
IN CENSUS 1981
QNIT
_
-
TRADITIONAL L1N 198%
lid
F115:1NG CENSUS• AONAL
I .. .. 'C4.
IF Fit fG, PCPU I AIION 1 1, 111 1
ALL ______

----...---. ---... .-. -•1
0
HOLDING CAPACITY - 2 Z0NEWSE POPULAIICJ
1. POPULATION DELHI URBAN MASTER PLAN - 5262640
2. POPULATION CENSUS 19B1 - 5453574
3. HOLDING CAPACITY - 8976540
4 PROPOSED 2001 8252145
Ulu
to
: MASTER PLAN
LI1 CENSUS 1981
HOLDING CAPACITY
PROPOSED 2001
A
1 05 0 I 2 3 4 S5M
-\,\ - -1-'5-I
\ ,
I
p \
f /
I\\ L
ROHINI\L
— —
453 I \ . ou
2nco--
84.
995C0 iIy.Ct GKLr P
1-00/ .
\ io \ •* S84WJi —
C) \l55Q . --•I /
tH./ ( \
/'--' f 82200 9c0
- -6
J(:. .:
\ocoo I 12L IJ/ LJ)?O 6 ;: \ 1 I 1 28C
9 3 .
/
/
NANCLOI
IF —\®
N G
NA THL 7I*3P0 / 33 0L 3 I \\ 70000 /1
-- 7T8t '.LI* 2*3832 I -
1/ J
( /'® 9
Ifl IIAL
® (N H 0/ L j- 2253(
I0560
44*34 "•,]
/ \
11)9 ç)99 j4)2- I•*3 .3 I
C0 *, 140)L9 •/ 1
NASHAL 8747?\ \ I H4 .. ...
\ PAI LF
1PGN3
06?7 / \ I 1) 9) -ZFMC0LF8
i06x. :' OJL 1, r'0 25r(Ico
/ 7
\ 3
*3*
H
-'2 38 )cL5 I
-16 73 14130 \
I,
- L0 t '12) -• - -• - 21951) -
C AFJT 0 U F N
19 6
9) 2177
33150 6607C LN
' T N
I3IS0 / 57237) 9CSD I 10795*3 \
lnS 7's
/MS 50117 ( CrFFF.CF
lIT coI; 7*33 y5 \ 2L163
*34.672 -. 1096'.8c 89 15 13'1190 -- 39W
-'
—. —.--.----I *352? /T) s -- . .3'1 / - . -----.
- * - )7-.1 • 37203*33 *3*3952
N 11069-
10l.225 __37*3 IP809 , *9
IlO*3S ' 94*359- - 110010
*- 5SS 540153
/ ; - 8' : ; '• 1 )
--
.. 572(0 *3325 7(0 —18 1 0 17960
21160 1 173 noH]
(/ — 11001
."
755 .-... ..
- /711'iS
CIsISION (ii) c)( C) ) (: ® C)
A 21929 6703 701*30 .-. -- /51*3.0
9 31)56 6526 rICO 2000 14777 / l*3?'7 6542
C 3200C 6000 2000 15 1 XI 33700 :8os
0 32000 *3000 2L0)0 3500 31344 28*3C0 7003
PSUIT £1P1JRI
-
c) ( I)
16500 3907(1 31(10
7100 7*3544 40588 111005 27-00
ecos I13000 '-sccc 4000
*3000 30000 4500) 4000
7337$
D )6*3335 74I('O 5ft7*
S.,75*307 ?1 2:'*3 ,iIl)5 5)01:)
70570 3' Q000 600
30500 3301*1 17000 ¶74:0

RAJLY*Y LlI'
• 1014T RAILWAY
1RAISPRT
:'YCLE TRACKS
TRAUS
ERMNALS
o - 250
5%-375
376 - 500
501 - 750
?5 -1000
- 1001 t ABOVE
TRANSPORTATION NETWORK
7
HI)! DING CAPACITY
• HOLDING CAPACITY-3POPULATION DENSITY 8 TRANSPORTATION NETWORK.
• DENSITIES AT DIVISION LEVEL
MASTER PLAN
• _
•
• '1•
3O •'
CANTONMENT 'X•• /1
0 - 2
751 -
)76 500
501 750
1 1000
lJt ' .IiOF
•
• CENSUS 1981
\43
1• -/ P01-tiNt
v 275
CANTONMENT
¼
• ,1
7 LI
< 215 376 500I /
751-1000
1001 t AO'vE

1591-96 586-91 ITW 'iS
DWELLING UNITS REQUIREMENTAT FIVE YEARLY INTERVAL
HOUSING DEVELOPMENTAT FIVE YEARLY INTERVAL
AFIIIN 1981 URBATI LU S-
NEW URBAN AREA
D.NtLIHG UNITS IN LAPHS35 5 05 (15 15 ?
-- -
SOUPCEREEE SCENARIO I
I
RE%,EAS4Ll' 'I! NO 11 SEMINAR PA?ER
0')
1iL5 FOR DELHI 2001H1L1 IA'
- GENERAL PUBLIC HOUSING9. (:0Cr-CI9AI 15€
NDIVICIJAI. HOUSING
UlIAuTHCNISEO IUFTLI.
- - E '.IPLOYF II HOUSING
hiM HOUSING
- TRADIIICIAL HOUSING
HOUSING PROGRAMME / PROJECTIONDWELLING UNIT REQUIREMENT AT 5 YEARLY INTERVAL
1981-86 1986-91 1991-96 1996WITHIN 1881LIMITS IN LAKHS) 23 15 11
NEW URBAN AREA 09 23 32(LN LARHS)
NEW LPPAH AREA
'1W LIIS
Uri
IS A
1955-7(1(11
991 - 996
I99- 1991
1991 - 1999
1,ET4ERAL PUBLIC HOUSING9. COOPERATIVE
IHOIVIC1JAI HOUSING
IJN#UTHORISEU INFILL
SLUM HOUSING
Esi'to€R HOUSING
HOUSING SITUATION / PROJECTIONS
a-
a
N.
20 - --
io
---
961 1971 1981 IA91 20V0I
GENERAL PUBLIC HOUSING-TYPE & DEVELOPMENT AGENCIES
,IF CiJb4 IV FIE I t ANO DEVELOPMENT CONSTRUCT ION
GROUP )' - —
—_
PIMIfl AGENCY CO "PEIER 119
(11 AGENCY
- .,ROUP -I — —
- — — .-
GROUP -11
-IT A
13POUP -III
Gnou p AV T'IF
• I A 32 O U PLOT i-I I NDIV I DUAL SERVICES
• I TI 56 00 .' €101 .VtTH I NDIVIDUAL SERVICES
•I C 956 50U PLOT WIN ('NE ROOM AND
COPE UN I T -
• IA 5650 U 01.0'wiT P.0GM KITCHEN
PA . .. .S?Itl N C
• II IT :1,.GU P LO T .51111 i.VQ
IC HE N I.A.1Tm ANU N C
I 56 SO H Pt It A'H 5. LL1'A( ON
co BUILDEROPII\
• ITT A LIVING / DINING TWO REQ ROOMS KITCHEN,EAIH AND WC IN GROUP HOUSING
• IN B 56 SO P1(11 WITH LIVING / DINING
'lIE BEll ROOM KITCHEN PATH AND WC.
• III C 159 So P.01 FOR AI,CTIOFI WTTIIOIJ1
CONSTRUCT ION
• VA 158 50 U PILOT FOR tIctION WITHOUT
C Till 51 RU CII CII
• V A UIJTl -SIOfl9EO GROUP HOUSING WITH
75 COVERAGE AND 175 F AR

SINGLE FAMILY HOUSING ON 32 SQ.M. PLOTS
PI - INTH AREA/DWELLING UNIT• NT RESIDENTIAL DENSITY
GROSS RESIDENTIAL DENSITY
-I----------- 4000w
w.c7• __ HCOURT YARD. BATH J255 X
Ix ILUIOQ• -1 ___ H
*ODOXMHIO00X2Oco-J
•
MJLTI PURPOSER(X).l 2560 X 4655
•
ENT.
GROUND FLOOR PLAN FIRST FLOOR PLANSCALE 1 50 SCALE 150PLOT AREA - 4M A3 H COVO. AREA- 19.5 50.MCOYD AREA-24S0.M.
ALL THE DIMENSIONS ARE IN MIU METERS.
•
j (
El______
CLUSTER PLAN (ALT.- 1)SCALE1 15120ROT SIZE-LM . BM - 3250 MTOTAL NO OF PLOTS - 504AREA OF POCKET - 136M.X 192M,2-6112 HA.DENSITY - 193 PLOTS/HA.
Qpqft fwr itw'wwT.r
IPA0_18M.WIDE
LPLAY
PA!lpc
$04 504%2
R H.S. N.H PAPK N.H. PLAY • H5 S
5 NA. 1.5 HA. 15 HA 15 HA. 0.45 4.
PAPK
594 50
PS.
PLAY
PARK
06 cs. 594
N0;L) 30.40 H. fw
NEIGHBOURHOOD PLANSCAI.E 1 3000AREA OF SCHEME - 487k. X 589M -28 68 HA.TOTAL NO.OF PLOTS - 504 X 6 - 3024TOTAL POPULATION 1814.4DENSITY — 05 PLOTSIHAOR 630 Pf1
FfHfH+-1I.1Lth}J 1ffl!TPw-Hfti1: IrnfH•ffl
LiJ J19r ftlE H-+h-E1W7ff [P
;4Jj UJJJUJIU14JJU I
±Uhi 1+1JI1fftflHi [liH-iHFk-
19 III
CLUSTER PLAN (ALT--2)SCALE lISCOPLOT SIZE - AM. X 8k -32 50.M.TOTAL ROOF PLOTS - 504AREA CF POCKET - 26M. X 192k. - 2.6112HA.DENSITY — 193 PLOTS! HA.
H
H
- 43 . 5 5Q.M- 193 DUS/HECT.- 105 P1. 0F5/HECT.
TOILE I::: xN50(
/
'I71 ROOM- 2560X3525
TERRACE
1 272.84 MT
CLUSTER PLAN (ALT-1)SCALE 11500
NO OF PLOTS- 4.51.
AREA UNDER CLUSTER - 4 75 NEC.
POPULATION - 2721.
DENSITY_95PtO151I-IEC-
CLUSTER PLAN (ALT,-2)5CALE 11500
) OF PLOTS- 451.
AREA UNDER CLUSTER - 6 76 NEC.
FOPULADON- 2126
DENSITY-
95pOTSJHEC-
--
SINGLE FAMILY HOUSING ON 56 5Q.MT. PLOTS0 PUNTH AREA /DWELLING UNIT - 77-96 SOM
*NET RESIDENTIAL DENSITY- 123 DUS/HECT.
GROSS RESIDENTIAL DENSITY - 66 PLOTS/HECT.
ps0 -- - - - - - -
TOILL Ed :3\
LAY FYRK
HS 6 LS
X.
675 X 1200LIVING DINING "q 0
ROOM
0X 62l5
TERRACE _
RlW
_______
623.48
GROUND FLOOR PLANSEND FLOOR PLAN
NEIGHBOURHOOD PLAN__
5860
FIRST FLOOR PLAN SCALE 1
SCALE 1 75SCALE 75
SCALE 1755000
ploT AREA - 56 O MTCOVO AREA -356 SOMT (63 57 !.)
COVO. AREA - ?385S0 MT (42 59
TOTAL POPULATION -OF PLOTS -2724).) AREA —61 34C.
COVD AREA- 419.MT (721.)
Q6364
ALL DIMENSIONS ARE N MILl METElS
DENSITY _66aOS!HEC OR 396 PPR
-
-
-
il Am

31
ILI-
P1
SINGLE FAMILY HOUSING ON 72 5Q.M.PLOTS
PLINTH AREA/DWELLING UNIT - 7573 SM
NET RESIDENTIAL DENSITY - 106 DUS/HECT.
GROSS RESIDENTIAL DENSITY - 57 PLOTS/HECT.
I-
EE
COURT VAI1O6COOx385O
5000
GROUND FLOOR PLAN FIRST FLOOR PLANSC A LE 1 75 SCALE I 75COVO AREA /.) 2 5GM COVC) AREA 3150 SO
ALL THE DIMENSIONS ARE IN I.IILIMETERS
L
j ftftfli 1 trtii tt tt ni lL!I uiwi J
CLUSTER PLAN(ALT1)SCALE 1 1500
r..OT SIZE 6 M x 12 M z 72 50 MTAL N0 OF PLOTS
PEA OF POCKET 264 M x 201. M 5 26 HEC
14SITY 2 PLOTS
POCI31.35 x 7C
BATR
I .,IETTE
TERRACE/
/
SECOND FLOOR PLANSCALE 1 75COO AREArZ375SOM
I11111011 ' '"h"iiilluil 'tI" I"mflmilli uluhil1111111111 I'JIIIlluIillIIIillI h111111l1ff110111 11111110! I11I11
r.11bnii 1101111 i:i:oi;1111111111 Milli 11111111 11111111111111111111. Itin 'Ii::iu:iI Ioiinil
_LJ iw
ps
t= 442
HS NHPARK NW-LAY HS. is!
AREA
]
____ 1.42 1.
tA
NEIGHBOURHOOD PLAN rF-
SCALE 1 5000ARF.A OF SCHEME 46 49 HECNO QF PLO T S 25521OTAL POPULATION 15912CENSITY 57 PLOTS/HECI (342 PERSOMS/HECT)
71. 0U/HEtT3 I) 0u/PLOT
TERRACE
N ROOM1 435 x 2670
31.35K 2090
OALCONY
00

C(U FLDOR FIRST FLOOR SECENO aCOR
.31.
COVERED COVERED COVERED
LJ AFFORDABILITYRELATIONSHIP:
1. SINGLE FAMILY HOUSING ROTS WITHNVIOuAL SERVICES WOULD MEANLESS INITIAL INVESTMENT FOR THEHOUSE HOLD AGEICY -
2. WITH N AFFORUABLE LIMITS ANINDIVICUAL CAN ESTABLISH. IMPROVEAND ADO TO THEIR SHELTER ACCO --ROING TO THEIR NEEDS AND MEANSINCREMENTALLY OVER A PERIOD OFTIME
V LVICI L \
PLOTTED DEVELOPMENT
fift:i:: i llll1HItIIllhIIIIIIIIII IIIhllrnllimllhI1mw ZJ!!!!
IIIIIIIII hmImpIllhII -imoii1 knimillir1rniii limmil __
It I I IiCLUSTER PLANT OTAL AREA 5 38tCT.HOOF ROTS- 4.2DENSITY - ? FL E T CSCALE -i.15C
LCLUSTER
FACIA TIES
3 V1 4
AREA OF 5CHEJ€- 4G9I€T.
PLOTS - 2652
TOTAL POPJLAT4- IS92
LU4STTY - S7FLOIS;i'ECT
I-:'.DLISIHECT)
11 INEIGHBOURHOOD PLAN
CA LE - 1:5(3T
EFFICIENCY OF LANDUTILISATION:
I. HEAEF•tAeLV INTENSIVE UTILISATION OF 2, WITH PROPOSED PLOT SIZES IT IS
LAND IS POSSIBLE RESULTING IN LOW POSSIBLE TO ACHIEVE THE NET AND
RISE HIGH DENSITY DEVELOPMENT TO GROSS RESIDENTIAL DENSITIES AS
ON,FRVE LAND AND ENERGY flEUR- GIVEN BELOW. THESE DENSITIES ARE
CES VI T HOUT SACRIFICING THE COMPARABLE WITH THE GROUP HOUSLEVEL OF INFRASTRUCTURE. -'NO DE'ELOPNENT FOR SIMILAR
ACC DM0 DA I ION
ROT AREA I.OT SIZE RESIDENtIAL DENSITYNE T((XJSd}-ECT) GPOSS(11frECT)
32 SUM. 4M. X &M. 193 105
SIT SIlT N. 586M. X 955H. 1391.1111 12,14 FPCT'-T' TBACHJ
SIlT M. M. X 12 M. 107(AIIM 3 MFPC'T
ETUACN)13 DWELLING LUIS HER PLOT
3 AERAGE FAR ACHIEVED IS CC"R- 4. MOST OF THE I 47.kI5EY. FACE ENCLOSEDABLr TO THE C'RCUP HOUSING CCEWP- OF94 SPACE USABLE 13Y THEINHAB4TA-MEN I FOR SIMILAR ACCDMCO&I ION. N TS. Al. SC) PRCTII9DN IS RACE FOR
PLANTATION TO CONTROL THE 1CTE5TLEVEL MICJ1CXLIMATE.
S. aOEEKNIT CLUSTER FD41ATICrS EN-CCULAC)E SOCIAL CON TCTS. SENSE OFITHHHH] t.ONGING'-€SE AND ENSURE PRIVACYAND SEQJRITY
J EQUITY: 2. w.v MAINTENANCE COSTS FOR
1 EC'JAL DISTRFUTT)N CF LANDSERVICES.
2 IITEE[XN TO I3JILO AS PER THE - HIGH DENSITY POSSIBLE IN CASE OF
INDIVIDUALS CHOICES AND FIRE-POPULATION PRESSURES.
4, THE OVERALL TEVELOFMENI CAN
FLEXIBILITY CONSIDERATIONSCCNTRED HAVING SIMILAR PLOT
NS SIZE AND OVERALL ENVIRONMENT1 CREATER FLETIBILIIY SI ACH I EVED DV
T; C CF NCPEMENTAL I-JSIiAr\RT I91 REFlECTING IFE TRAUI-
n IAL LIFE 5IYLE BUT CONTTIONED
I
I

LAYOUT PLAN PRASAD NAGAR
0
0
cc
a
0.
0
a
AIEA Cr SCIFI/E 1 30 HI
NO Cr DWELLING UNITS 7L9
F ir I y
LLllt
NET RESIDENTIAL DENSITY
DWELLING UNIT SIZE -2550. M.(APPX,)
20C1NET RESIDENTIAL DENSITY FOR THE DWELLING UNIT SIZE OF 25 SOM.IN 2 TO 4 STOREYED GROUP HOUSING DEVELOPMENT VARIES FROM119 DUS/HECT TO 249 DUS/HECT
A4FA OF SCJiE,.E 2 349 NcT
CF LWELLING UNITS ;'3
DENSITY
J?///Qr! 4 1III\
77/J
IT 0413 IThI ccw
F)
LAYOUT PLANPANDU NAGAR
low CI 'C IF ElF 1 0 Hct
NO CF E'WETLING UNITS 208
OF lIOTY
_EEHE L-
LAYOUT PLAN SHEIKH SARAI
APFA OF SCHEmr, 7 2 .i
OF DWELLING UNITS 148
CENSITY
H JLAYOUT PLANKATWARIA SARA!
-- - - - - -
IT 0 t o--
I.
'I.
Ft1 Hj
9

— ---::1
! jH L ,i
I 0 1. I) 182P.4 PI.
ç
I
r i'w
Al
0 A 0 304M 111W
NET RESIDENDWELLING UNIT SIZE _45 -48 SQ.M.(APPX.)
WE NET RESIDENTIAL DENSITY FOR 45 TO 48 SOM. DWELLING UJlT,N GROUP HOUSING DEVELOPMENT VARIES FROM 107 DUS/HECTTO 144 DUS/HECI. IN 2 10 4 STOREYED DEVELOPMENT.
7. LW
3•) •J4FA Of ¶CII(MF I 58 1-IFCI
NO (21 (ILUNG UNIT5 IL)
LW DWELLING UNITS I94111 6 OUSIHEC
LAYOUT PLAN RAJOUPI GARDEN
LAYOUT PLAN WAZIRPUR
- ,.-.---
.--,--:•_-
[r
0 0
El
.%I(f A ( • F 2 L' IFCT. I, i CF.'.4E I U HEC1IO OF DWELLING U!I'I';
I II O F DWELLING UNIIS 70e
DENSITY [DlJSTECT
01 I1SIIY [u4 OU/ HECI
LAYOUT PLAN LAWERENCE FAD
L/AOUT PLAN PASCH!MPURI BLOCK 'A'

a
0
a I
35
NET RESIDENTIAL DENSITYDWELLING UNIT SIZE - 85 -100 SQ. M.(APPX.)THE NET RESIDENTIAL DENSITY FOR 85 TO 100 5GM. DWELLING UNHi
IN GROUP HOUSING DEVELOPMENT VARIES FROM 97 [U1JHECT TO123 DUS/HECT.IN L. STOREYED DEVELOPMENT.
--c::--
y'1J
UI
( i'
a
0
a
0a
.I11A flF SCAF 1 14. U'!'0 OF OWLLIN 1)ii 15 :eLAYOUT PLAN PANCHSHEEL MARG
N
a i w-7Tc
1iP L i:I? '\\
c7=_
3L
uC1'.0 01 L'.F.1 772NIV
LAYOUT PLAN PRASAD NAGAR
LUi1iJ L4 Q ill
0a
.ta€:A OF
HEr.TIWELLING '1(' L" )WFI 1.1110 1NI0; EQ
IT -if 71J 0L17,IfY - __i57i H!:cL1
UT PLAN PITAMPURA
LAYOUT PLAN JAHANGIRPURI POCKET C•

.188I DC
0
0
11 A
-0 C30
NET RESIDENTIAL DENSITYDWELLING UNIT SIZE - 95-120 SQ.M.(APFX.)THE NET RESIDENTIAL DENSITY FOR 95 TO 120 5DM, DWELLING UNITS
IN GROUP HOUSING SCHEMES VARIES FROM 65 DUS/HECT. TO lOB DUS/HECT.
IN 4 STOREYED DEVELOPMENT.
PA14 KIWI
Ljdrp
z1? i
_______ - C C)
- J-JAREA Cf ¶Q1EMF 2 Ed
O OF C)WE1LlPG t. ! IS 9I
LAYOUT PLAN SUKHDEV V1HAR
En
OAT UP AREA
AF/FA OF SCuEf. F. 2 64 H(-.
CF CWELLING UNITS 20
Cf 14511 F ________
LAYOUT PLAN YUSAF SAPAI
Jt
7 I!
.REA CF ) I-ICT
10 Cf (iw LUti bus, I,FCI
LAYOUT PLAN ALAK MANDÁ
0'. DYTU-FlIS UNITS
LAYOUT PLAN
I LSS HCT
ISO
PITAMPURA DARSHINIPOCKET'S'

.7 0 '7 I? '/1
PWT SIZE 625751,02 SOM
NO OF PLOYS Th
AREA OF SCHEME T'IT I-4FCT
OENSTY DIJS/ HEC1 US
.I (IV
IT I AC) II1I. R/'.,
TYPICAL LAYOUT — PLOr ZE 26 SQOM(ROHIN! SCHEME)ICALE
IiIHhiIIllFiOhIlIIIFiiipUIII-- --III Iirniirnf 'iII 'IIllllhioiijr,ii
IUI.IIIIIIIUIL IHllluiminiii1070 1351. I 7/y
x
COMPARATIVE STUDY:PLOTTED DEVELOPMENT.
-SOTSIZE X71 71 SQ M
rD OF PLOTS
AITE/,A PP 7'-C.IlF 2'9 HECI
£ISI1Y :7li / 2
ROAO 17/W
I LIFi+ J tEL H+i [iJi'T'F1Phi F fll
I'll c ET0
tI Q H' 11Hffftf
Li] [LLIiJtthEL]1LLEL[] LiI Liii
r4
j
1OAO 5PI1I ' — _______
TYPICAL LAYOUT— PLOT SIZE 21 SOM(RESETTLEMENT SCHEME)5CAt.- I 000
OPAl) I) 5 }.4 P/W
HI I 'ScJT..
jttl T - I LJjjj
:0T::— _ AREA OF SCHEME 2 02 HECT.
musiry DuSimEcT
P OAO j.i P1W
POPOSED LAYOUT—PLOT SIZE 26.M- '':0
LAYOUT - PLOT SIZE 32 SQ.M

NET RESIDENTIAL DENSITY - MULTISTOREY HOUSINGIHE NET RESIDENTIAL DENSITY IN MULTI-STOREYED HOUSING DEVELOPMENT
VARIES FROM 17 TO J123 D'O/ rOT
HLIIIIIIUITI
LQCtJNO
- 101 WS) -
PLAY FT -
•TS
j,pc
PS
1 F;fl V)1U.T II-\:- I --;:- IIj
= —:
.IFA Of 0 06 H€C
O OF OwELLltfl LIFII is tooCEFISIIY 1123 OUS/HECI
LAYOUT PLAN CC.IE EMPLOYEES COOP GROUPHOUSING SOCIETY ROHTAK ROAD
&flA CE !ICIILME .1 rI
io or DWELLI NG UNITE
2)t
)EN,lTY
LAYOUT PLAN R KPURAM (SECTOR-XIII)
II A h4
iI :11:
4P1-A OF ,IHE1
NO or OWEILIN& UNITS
r. iv
LAYOUT PLAN AZAD APARTMENTSMEHRAULI ROAD

0LTERNATIVE OVERALL•OPULATION DENSITY MODELS - 1
MOPL I QV2Y111 dtx 3001oto1 UrI7a oUdf1k1- 12111010o to bz ancdifdwilctivt DU -62 cirj OF 4co,hfcrr
Th1 wfll røruiY
-1ELTE
) Hcu9 a1 very kh dftx;t+ cLIt/ ou/zd oT aI-
1O FA d dWU V uiiif-OF 4ik1 00vcxik'43±eiY
L2). 4I dei4fty C\I9k1 !y OI l k1 WI!2'lJ4' old J2L) ThL cr23 FOUV,yycz -j 3roup i'ousivv oc
øf
,oF a/Lc iv 19YUaUioi z4
(TOi0fli fQt4cJ1f c1 y c?l fo acj-t(2v Lcl dci-
+y A71Of to dCCOOck1h fIVe
c)of- y e ,*vzyit cIo onis -1 r
O1411 I 3 /iiIi 1v
2 Rco hu(ok\ of jov0U5i
WORY o)Vefokvkit of k1OoF1TRL' g CorM2rcta1 c y z cit FA[ oF
100 to 'oo orct 2oy- CoVzv'O3.Ar c 3e Iieft Would
o 25 5oyti1/
5 vg1o'veyui of kdufrk:dc r-r -ci to lit Y I 7 Y7 111)y
r:
NFTU- ci ithle,f- y vbt14e4+ OFCTUE t1hz( U4y, 5'cE,.DF 5PACE -1C!+1Y7 i'-to 1tVe6
vVk (it
). 5o cF Iih cc;idvy2'4 2 -iV -hco1 t /
2k 7EJ 2 1twDk I , co1 ( 3Z5
to V Vc 1 &fr0u9 11 2 V c ki sc
) on civa v5Owould k 351 . 1 t.t1tl. WillFui'lRav b rzducd a 2V1
OF i1- wo u L b req u 1 vi favo c ic I i i frc £ f y LhJ-e f,oHcC f(v ^1+iôi,
1t21Ov1' zxcft-viqs zfc.
1RAN1P0T a)utr9roLivd rPici tr2fr157tATI0t'1 Zk4 i'o cft -b ncr I1½i
01 nU1ivi ±rifr t)7l1b1ii
}) COk1-1j p"CI crea- +0 ,SDuktd vould/nfu!t^IvzxLzdcr4i Faciliff-z.
) t w qvc ig -r1cs wciJ Ldc U+ 15% cyc L
frt75
s0ct0O For U5 t1'(Oc,[ -tt tveNOTvllC. 1-cHvt.olo', 5Y u- oFroLfTtc,4L zvery, 51vlci IiIih Per c(tz4PECT5: !vicovte 6MAJ bz v-qvd
Thouk9 4 lRe C/ WoLiki k'i
i,iic cie't{ 115eof sJ 'ciae, J zzfv -
t1V4,tt1F or tcActL
I
HO

70
70
-O
ALTERNATIVE OVERALLPOPULATION DENSITY MODELS - 2
MO-LX vU d&J,kTh 1QD.tO
Kk1W lR ifevitysr' t1 PD-OZ.
TOI (4YbV\ Iou1 -iOYQ ' 12iflio -f-c b
iv\ 4o000 Crøs uvbir2 -& 000O -fco dàI+VtdI
1cv\dD ThLcOWLOLJYIL5 ftOF CMIv\ tY(1fCY11 100a
Th wl (LiV'2 lo
HELTE IZ, cop f4CLJ5ft\9 ccf 100
o i'c czvd ovyeor i114t uviif OF /'o
i. 4 39c wôu(tncdote ft?v'2e frcLc4
zcci o VA 9rUvtd7 $ctcc1 4- udi de'rH y zvaiki kLz fi,
v!oA- NI Vrfr V(.4ZVvd ZtL C4Q)1y.
71jic, ioiieWP1IC ha PrfI>' cfo1
1)-rz dsif7 WOtAkt VcJUir f-OMC O7 o
ktcF fM1i$c) 4f 1 1'(0- 6lLIj-d /O1tcfc rtv 'St
OFdVOIZ± Rve1otzV
4Co1opi(' rqu
irczd doiz.
of cufo-3 k)IoY oi[-Hcvi LofWtJeJ u(y cd old b1t
cz) The. 9CVcYtVt40 rrc ftt 2E± Oi-rr,
i-ii buw!ow crea fr1z4nc^ z tucFtc fcc r1v-)o iii).AUs3rt cj p 1ofjo'i 'y
ti,i:t cj tL r3i-?11 -CcklIo; c)1d- k}-1 JiMJ Ivifl tO
't-i 50rvKZ wkick doesHo1 feYH 4-017 dr7I2
WORK •) v1crYLfriF of citnerc1CENTRE ccifr c W e1s->' of
FP yt o% OF 5c2 - C?Cco1e /ovnAal S2c+v
b). z Vol oJ'nf OP Kew iducw'^ 5Ffivt3OE cbwxicu,
zQLA 6vi1 cLr IZL'eLsfvid un
C) MO t4OV 9OVt'ø 4C2 'CU1i DU4 -
1NATRU oJ NO deveIo -Fry fe/e-c'fL).E.. - civd ervtcOPEN 4C )U ierf avai½Lt
Fcr Ur ociczL tvfrafrucfuyç)-fl12 OPe4 avcLc'LWOUtc O GOThMJZvYOl.
TAPOT tici; oaic2i lVLLf-ATION b's. OLH b SUiiC7/ft
wi(i Cbivi circb59red cyoi ?Lfcould rovied
cF-f-ofal 1K[ T1 ¶Y(9
URAN tililifovi dweJIi Ukl(hs-.rd 1 QE oi- veraoe?of--5i2z cF 6Oiflr .veee -I
1)oejoe1t of cnmri(7 FAR, did lfrldUSt-
1i1 areas of ^5o FAçfl1z ovt sJ'czc. aVQ!Qtc1ewôuid be )y ZrDk10
The r -lA3 ra' czd ifc' 23Uf-2r +c e Useci 1V ik
'or+cc'Hc-i, iL
-frl4 w((l i low (Mier11tvOY7 U(xv )tl1+
cio ECC -r rio4zI w il l, w a 'rc2nt
Nor4lC % Jvel OF cIOgy Vioui b
PoL1TCAi 1ii,iH e?v Co cindA1 c'oui rcr hT3'h y ev cthit
CoH-i
I.0

ALTERNATIVE OVERALL
POPULATION DENSITY MODELS - 3
.
.
S..
•o.
1
ôvszyôfl dnsdy 200'ha.Ac0h1daf /Ae excj'oU1HOk d vzLofrrnSJK
TcC1. UYtXVI 'oUtc+COY% of 12
i1Iiovt to z flôdcf2d(v 40000
ZZt. ccidi' avz LtZSfiiiv. SO of t,Lfe U:,i wi-foY/-o bz U'c1do
Will reu'-z
£) ticUk Of Ct 1± 15Y ofvO dus/HCt ft -e roQp Pcusrn3cd iti(y kousfy13 c6o E9 . frfl• AWoWLAj O'1(F
5ka1 be 1oo44
-xfi g+fr1Øfr1f iok1c1kic k1hcT( veI'i-tznhfa V u p 1 ,ki 1a g- *oded
d lRoe eIe-Hck1eo Net) r1iOk1IZ. 3U1d be ve(oe
crt low Mzf g5{dtfl evIyç co3Ti2c uiculItôrte4cOlcb1i tc(l r aiI't ci t -5;'1A0109OV2X 5-5Jy built UVt-uFkDr4 ofr1 5.kOUz o''O t
d)øueId rc lv k\ceIL(10 b rd .ve1oi'eL cf c
of 75 5'i ca0Ee4-iG-Ui49 urbnK. 1I AAt+. 0wcutc vid Efr1f rcklt O F1I D1cLt9 c ccTy o r ftou.sidrga. Part o1 ){ goit0 4OU1V3crcs WcuZ rzciuiv'e 1t ke
g IOj7izci .ci 1,ier YLi1/
WQRK i)e!oHef cF tw co11-CiTe.5 ercic( ozL tfre- if FAK
W[! 2c'% cF Area For. !oYkW-1I
1') cz velo' e'rF of wck h-claffc2 riø ecJ1Th oFte
kd oIRv c-c.k[ c.eptfvdlc k 3 Ike- riAg raCIy.
C) DevgiofW41 O F ôvh f-fiCe5Ivi souiFi &i.r hOLSfr
i4 Ile- rS (aHLth1
a.). ieV(vt@ F -fruvt (ivtg
ECe 1w /crt aE Uvh-2'v\OPEN .b) uEii ceif 4'oae wou'd
vc1thLe fz i1 (k1FYvUChJrgcrt j 'Ce WOLLk b cv-kb!e @ lost•vl zy /'e'Orl*
TRANOT ) ML11+)1 0&1 o+-ficrviATCN g J^i'i covi-H
v), 1ih- rafl, ttM hu^e,1-e Wov- K 1k COVVt eevt -tt d'i
rc2d CyCAto bo )7yoL,id e -b --2 vv-
-a1 'to7ô OF Ike cyc Y,J2
(JR5AN ci) Oô t4ldliOn dwfl LA4H
EXTEN4O?' ri Ired to k frov(d iyl 1!
UYk)w\ xfcvi ctø. (5ivvce.f1or O W. fYrI(wu1y.711e Lvi (MIt i2Z
it be 10c.vi1.
h). co +o be dev-f 12, FAR cd lVkJIA-
'-^rjol 12o FARD
WcU1d bv?--i1ab1 1OS9 /'V j7(50fr1D
d)Mu1-fu*1od? wct.1k1reur -fro bLIvbaN' efrcicrt.
0tr
20C1 DECO- a) L V I Of y rzqU I y^"-jNOMc. ft' to be 1i5hV J htakA p re5e-AtiuiPOLYr1CAL Kof -t-ôA59EC75 ry , ccthor1
wi1 i'-a /4Covvie,
-----VZ/ 1M1Fd de-dth'o.
N1OJEL

GROJP-I(i) URBAN POOR (SQUATTERS) p.m Rs. 0- 7001-,
(u) ECONOMICALLY WEAKER SECT)Ct'GROUP-ti INCOME (poi month) Rs. 700-1500)-
GROUP-I1) INCOME (per month). PS 15O0-3000)
GROUP-tV INCOME (per month 1 Rs. 3O00/.Ai
PRESENT LIVING CONDITIONSGROUP L URBAN PCCP
1 SQUATTING ON PUBLIC/PRIVATE LAND IN ABSENCE OFPHYSICAL AND SOOAL NERASTRUCTURE
CI IN RESETTLEMENT CCLDNIES.
GROUP II ECONOMICALLY WEAKER SECTIONSOCCIPANCV ONE PAED 66% TND
ROOM 24
PA1ERSNPIRENTAL OWNED .6!. RENTAL 54 'I.
HOUSEHOLD SIZE BETWEEN . 5 3B 5 R.
GROUP -
GROUP - II
GROUP - III
- GROUP - Iv
HOUSING AFFORDABILITY STUDY -1
1. HOUSING OWNERSHIP - 5 0ie
2. ABOUT 85 01 PEOPLE PREFER BUILT ACCOMODATIONAND 15 0I PREFER UNBUILT ACCOMODATION
3. AVERAGE 45 Of PEOPLE RESIDE IN ONE ROOM ; 35°/a RESIDE INTWO ROOMS; AND REMAINING RESIDE IN MORE THAN TWO ROOM HOUSES.
HOUSE HOLD DISTRIBUTION HOUSE HOLD DISTRIBUTION
PREFERENCE FOR FLAT/PWT PREFERENCE FOR OWNERSHIP
= .. 13=q =
Be EIII
60 60
30 PILOT 30
70 &MT HCLISE -XI YES
10 10
C43I.P I II M iY zdERAGE GROIF I II 31 IV WVVACE
HOUSE HOLD DISTRIBUTION HOUSE HOLD DISTRIBUTION
SIZE OF HOUSE HOLD OCCUPANCY STATUS
:EIGHT
I I II I ftIIJNORESONSE
flEE SQUATTER
50 JGQvTPE)ttO
- F-4 T)1fE EMPLOYEES RENTED1 =1 P(T
I __ 20 -
NO. OFMDR5 ID
GRc*P I a In IV AVERAGE II ff IV NO-RAGEDELHI GEL41
Mwr
Ih1.uI..a.I.IIuIa.MINiwu•U!.• --II--I•i.um.i.:uiI. ONES Uai RR
It.. I
!!!,!1 010100011101011011101-UIUUU
HOUSE HOLD DISTRIBUTIONOWNERSHIP OF HOUSE
NO
I II III IV AVERAGECELHI
- MJ OF ROOMS/HOUSE HOLD
° ri 1111E
:!;
60
NO. CF ROOFAS
II LI Iv AVERAGEDELHI
HOUSE HOLD DISTRIBUTIONFACILITIES : CLUSTER LEVEL
25S.
E9On

UP'JBULT PLOT
i. QvICEU FOAT
Thj 'ci u c.t) Lili 1AF it - I5 N
-i.EE .i1Vq1
UNUILT PLOT.
IH'HPROVIDED cP MFAMILIES IN R0-IISCHEMES
LJo.rE0 FOR MIC
N Rc-Nl
PAR TIALLY BUILT PLOTCOUP il
I
reT.LE FAMLY PLOT SINGLE FAIVISLY PLOT',1TH LNThG OI NIW, WITH LIVING L7IMNGONE BED POC*.I. TWO BED ROOMS
THREE FAA4LY PLOTOF '58 NFOP 1!0A
PROPOSALS,
PARTIALLY BUILT PLOT
S,LE FAMILy PLOTMTII NDI.4XIAL WITH Nl)tUA
isL WRASIRLCTLOC Prh'kAL
S$-Ci FAM&Y PLOTW1114 • 1 Vi004All) COAT Jh
HOUSING
BUILTACCQMODATION GRCUP t
(FLAT) To P700 PM
BUILTCCMOOAT IC N( FL AT )
L1LID
FA 14 ES 4
U PARTIALLY BUILT PLOT.
PER MO H TH
,oUP
TItiCILE '-LY PLOT SII-i3&E FAMI. Y PLOT
O1 P00M UVIT yorM rG P.Y4 -
. HOU1N(3 AH i Uu.
HOUSING PROCUREMENT METHOD.
GROUPUNBUILT PLOT
) • I _______ _______
'0 R5.700 P.M
PPOvED FOR SWATTEP PRcEED op' . SWAITERS FAlPLES ES ANO jANrAI N 0ETTL4ETT -.AMLES IN P4tI
COLCN5
GROLP 11- s 7t- 1500
PER MON TH
:,ouP U\ . Rs 501-7000
rp1 pMONTH
5.
GROUPUNBULT PLOT
m.0l&A:wE
7O10ED F.)irI(CME cP
- AUCTK 4
• I PCNI SCFIEM€
(.
[ciNC1-€ :pcu.F FLUT4F04L.,P 44JUCN NPO.-v1 SD-€MU
%^ - i !
UNBUILT PLOT
BUILT ACCOMcOETCONGROUP ETPs 3001 L A BOVE.
jI
LEE -
.-0EE FAMIlY LOT
" LTl)iCPE"E0 CJ7I)J '4JG
cp7to FOR LC ThOM WITH I. C °3T 75 F A 0
A:40 A C€N9TT .;P 70 =/
6RrXp i_\5r&, PLOT PeO75D FOPALCTOd NA)9414 0; ¶E '.10 BE135 5rm iCLLG
—J
BUILT.COMcOATION ( FLAT)
P0NlOED FORL41GFAMILE5 IN POH NI
HE
BU&TACCOMOOAThJN(F1A7)
PP'.IOEO FCR,-..cME CPCPIN vAF40IZ TEL FaL'A
-E ET DC&.

Mixed Land Use

T2fED LdD TIT]
Pnli-j in ide 4ster Plan for Delhi (1962) 1011,
icsidential areas set off from commercial and other land uec.}d:oerience of the last two decades of olan imlementation shc.--.at mixed use could be acceoted and introduced in some areas,here it is not det:imental to environment and the quality ofi_:e. Trn -n 2 r 1 : red i f1e -c±' commerci .i lc:cvc:
:nenn fron fow toom .2 Lina o a:eLy income, orin.e foUora z Iacns a oout i e e"tsnt of nixed counecc
c: in residenLil areas:-
fda census of mixed Use actirities indicated that tnec'lar;er a enc of' a ma use in eraaltaton plot
housing (including resectlemen housing, village dousin )1 .rjch is to the ex:ent of about 125 as cornoared to ludin Grouo Housing and 2 ir cd ct dcinrees thevelooad after
i•
rvoe of Reside-tial Devel: -
(a) Eloited Housindi) Residential d:ncc
after 1962.Rehabilitation colonies
Unauthorised HousinResettlment Hcusin
(a) Groucj Housing() Vjlla.:e rousing
12.326.71 . 76
12.21
dost of' the faniilies involvd in iixed Use areio...rer and low-middle income rouo. ifl :'ehatYLli
I omea ho s jt is a j I
in reset1ement housin
( a )
(b)(c)(d)(a)
Income ?.ange(R.jTvoe 0.hesi denti al DeveloDment( )
Plotted Housin::i) Residentic1 -:• :.
after 1962.,ii) Rehabjlitcn.i.cUnauthorised Housin;<Resettlement HousingGroup HousingVillage Housing
EtSQI5UL
87.91,.78.85.

Mixed Land Use in case of ioyer income cbmrnunitiesis mnly i the form of retail shcpS for i:mediateneeds of the community while in cas2 of
incomehigher
At S mai. 1YOUP for profeS3i0- consultancY and
cter offiCeS. In rehaoilit lOfl plotted housing, retail
shop s and 5 ervicC shop s are aro-mnd 85 whereas it is
iO1 tn olo :: r hosi dovel oed after 1962.
d H:jSifl
2T of -oc:Lvf7r oitge) DevelP
- p1, 1q2
oail soap 12)
rviceS 7)(Personoel . ep sir)
ofessi onal cons3ks,Guest HousCS andother office S 0.1
:nsituticna1(E0ati0n1 17
:dustry 2
- fl
eho - Li :aTlooCal chi e s
6:5)
72 of ctjvity Unautho- :Reset-- Grout
(in percentoe) rsed lement Housifl. Hous-L
- HouSinr ou si
.etail Shop 5) 65 24) 55
) s si ) 47Servi93S 15) 16 23) 11
(PersonnelRePair)
rnfsSiOfl8l Consul-taicy, banks, :uestHouses and
I0stitUtio(ducational)
iD
Industry 4 10 -
ia:me US 13 rJy fl oVGG houses. The surveyhave revealed tnau erc0nie o rni;ed use in
houses

axec. UseO'ined House:
(a) Plotted Housing) Residential areas develop ed after L6
1 .___) 0
Rehabilitation colonies 82Unauthci-jsed Housinc- 37
(c) Resettleient-Ho usin 61(d) Grouo HOU3iLg
79(e) Village Housing
42
Nixed Use activit y is mainly carried out on GrcndFloor wlui c- i above O9J in a -ne o: 2S_iY - L
deve1op:.:n..
Typ e of ---Develom:ny O. U3e
on G.'.(a) P1ottd Housin:
i) Residentialafter 1962
ii) Rehabilitation colonies(b) Unauthorised Housirr' I 9 IT(c) Rese:tlerient-ousirg 1c:(d) Group Housing(e) Villae Housi- 1 C) C
The surve ys have revealed that mixed use is ver y p romi-nent in the forr of linear rrmerc rl velurent, nic.

LUii
, 38OWNERSHIP PATTERN
RTtD USES
OWN SES
AREAS:O.NCE OF MIXED J3E IS iN
PLOTTED NOUM3.UNAUTQRJSED HOUSING 8.I ON GROUND FLOORT IN LOW tNCC*4E FAMILIES IN THEIR OWN HOUSES
MIXED USE IN DIFFERENT TYPES OF RESIDENTIAL DEVELOPMENTS
viWAGE HOUSI43
Ifl2
U.COuP I-4OU5NG
1•PCTTED HOUSING
-v-.
STUDY SITES
Iptp1
1A
1
' \\
.AP .
• ./N 't5t7..-W\
j— ?O\
- • O
fl2i3/j
J --S.--
\J___ \ 0
- cr j
' I
_?\ \\\ EID4
uQC ". C3 :.•R*.P JJ7
o tort
*=TUNEW 10-60w,•>.1
0 i:j.js,
.?-ALrn<RD I-GJ
v..f.
ROTTED HOUSING U
ThEMENT O.NCj J'&J 1H1i&D -OJSlNG
1 5-1---I---
I . •. -
---T
LMum=
aim
--_k ..
ii11I
INCOME PATTERN
0-700
70)-ISQO
' 501 -30M001 & A"E
NO R.SFVNS
FLOOR PATTERN
= XJ
.'-HERS FuX*
I-J
0
I GROUP HC4JSING
ROTTED 1-)JNG I
PESEflT.E?NT HOUSING
FLCTED HOUSING
VILLAGE HOUSING
UN.AUT)-RI5 HCkJNG
I,

! vi-Pwo,
COMPATIBLE -INCOMPATIBLE RETAIL/SERVICESHOPS INDUSTRIES IN GROUP II OFPLOTTED HOUSING AREAS
RETAIL SHOPS G000WNS
FoRE:E
IWITY
is Isis I s i s 101213 A IS tI 3 IN101 IMIET MINA 1111 Ell 21
^.NCOMF Ias
)R1 • *i
[AT1 j 1 ® TJ®®® ____ I' I H (T T (
FC*PCE I
L _!_' II
pF1F
IMcce 'IIE1IJI
o 0.
SERVICE SHOPS INDUSTRIES
PERFORMANCE
pF1D4&%ME OF TECT1VITY
114COME
FEti NEED CF E50CF Ty
F . 40 tO NOT FERN
f[r FhL cL
,. I! 1:
4I1 0 I
O®®I(Di ®®
PFORMANCE OF THE ACTIVr
• OER NC h4ZRCC'JS
L'IE
C :.INCOME•U 'J•
fl IPOHER 3001 &
FEEt NEED OF THE TYL AY TOOV
DCCSSL
ID NOT roI
PEPMTTED
--

Lj
Q
CCUND FLCCR PLANAL- 2)
PLOT SIZE EM ' IZU s 7 2 SON
:OVEPED AREA 45 SAM
BACC1'JY
PST FLOOR PLAN ECCND RLCR LA\
COVERED AREA 455AM COVERED AREA
__J 36D
LIE 4OI.
5EQQ?33OO
lP 8ALY
/
)6c13X2E03
6ED ROOM3300 1,3300
30.0 R4 LIW
i1iTi1IEL . U]ILInTT.
L JLJ-
TIll nT1JIH
L1T
ROAD 7 1 m PEW
HCLUSTER PLAN
SC.ALEI COO
ALSA OF SCHEPE IZ.AI6M Z H&
TAL PCF n LO T S 72çr SIZE EM A IZ M 77 S0 14
AREA Of PARR 30MAZAEI ,720 SO f"
SHOP I H. KL
n _
NCZ ____
-h-1 1 1 1 cy
SECTION AA'
a
DETAIL OF CLUSTER PLANSCALE I
^OILE T
CO
-
:D F1C1 PtAN RCC4 _C(?
-. 100
ZE • .S0M :O.EREC EA CVLPEC IA3 r (;4
•..•.. $ - 5 AJF LET?S
- -- ----- -S

1 -r Ti

1NDUTR'IM
Prior to the Master Plan for Delhi 1962 an
area of 637 acres (1.6%) was under industrial use.
The elevelopment was sp.raic and the units were
in nature. Out of the 637 acres about 133 acres (29%)
are7t was under small industries employing upt. 9 workers.
About 109 asres (17 y ) the - i - ea ws under Lei1U* size
industries ith 10 to 49 workers and reainin 35 SCFC5
(540/1 ) was under large industris emplo- . . , ing 50 or more
workers. The tot2l no. of industrial units operating wa
3609, with an average of 850 sq. yds.?let area per unit.
In addition to this 2198 industrial units were of secondary
use on their plots. These were not occuping more than 1L
of the land area stated ahov. The total number of inus-
tries thus .perain 're but 5907 units. An area of-
acres (52.5%) was under nuisance industries in
t3 301 acres (47.5%) under non-nuisance industries,
The concentration of industries was in Div. G-an'
A w cress concentration of nuisance industries was in
Div. G & B. Th maximum area was under rubber and chemical
products (25%), stone, clay and lass products (15) rd
metal and eta 1 products (14.1%). The averaze floor
space per xxxx workers was 180 sq. ft. and vera:e floor
arca pr' uruit ws 2936 sq.
2/-

in MP.D-62. The area proposed 4-L,' l-rr
1. Flatte4 fact.ri
2. Wo rk-cu-inustrcentres - U
3. Light andservice
159industries.
4. Special industries 103
5. Extensive industries 3600
64 Extractive industries 106
5761 acres
It is estimatni that b y the 1981 out •
tho total proposed lYn4 s i 5761 acres about 3600 acres
Ass been developed for inustri.s YN the j.revei'
rlt was for extensive inustrIs anlight sery
industries in various industrial schemes. 7824 plots
hve been carved.sut of which about 6300 (C) Plots
have be n Iispesei and a-bout 1546 (200 art vet to be
ispeseC. About 46thousand Industrial units were opersting
in th city in 1981 out of which 8330 (180) were in plannom
arias, 2025 (44%) were in residential areas, 9710 (21%)
came in c.Eerci1 areas and 703 1 (15.2%) case in Intiust:-ia1
clustrs. A stueiy of iniustriil units it surveyed 201 of
the industries -9thusnd).- reveals with the floor space yor x
wrkx is 168 sq. ft. which W2fl hi)ist (325-5 1 5 sq.
•

—; 3
cJfl)fl mitallic mineral preaucts in feed products was
lowest (91 sq.ft.) in textile and leth ' r products.
The average ea p 1.y'nt per unit is highest
(17.7) in textile pro'iucts iond is lowest (5.2) inOLAf)
personal/repair servic's anti cheicai products
Inc average employment in th incutrs at city level
is 9.3 workers. The plot per worker is
highest (59-91 sq.ys.) in chemical pr.ucts ani is
lowest in ?ers.nl/repair services (11 .76 sq.ys.)
in textile products (127 sq.ys.). The average plot
area per unit is 23 1 .64 sq.yds. The high : st F.A.R.
(100.4) has been achieved by the units of eploynt
r.up 50-99 and lowest (63.0) in employment rup
5-9 workers. The highest F.A.R. (117) is in i:
foi products ant is lowest (30 0 17) in chemical products
:i of epint
:Lo L.:: urir-ployment Avera
roup per unitUpt. 4 3.0we rk rs5-9 6.510-19 12.720-49 27.750-99 62.2 -100-499 181.9
500 & 800.0a beve
per unit(sq.yss) p unit ( It.)7L49
237.6 1348.9
59.5 2574.7
560.6 5417.0
973.5 8600.0
C. 17072.9

- 4
Nearly 40%
in size 0 50 sq. yds. or 60% of the units h
size upta 100 sq. ys. 16% of the units were in p
size 100-200 sq. yds. 125 were in range of 200-500
ys. ani only 10% ItInichuxa were in 500 sq.yds. or ab•\
plots. Abut 70 units hv t
5 lakh
int Cancenora LI
A6 to 11, -7, C1-19, D-20, E 1-3-6, F 8-9, G 2-
H 1 to 15. As for as industries classified, by typ
are concernsi more than 10% units are in,electric
and electronic pr.uctsti metal products ani ru
plastic and petroleum products. The concentration
of industries áealing in metal products is in Div.
A, B Y C & H whereas of electrical and electronic
p roducts in Div. B, C & E. The units of rubber,
pastio an6 petroleum products are c,ncentrateà.
in A, G & H wne.e s unt n:.per p r'ducts are
in Div. A.
As per iPD-62 injuiations only 35 of the
intutrial units are in conforming use zone an
reainin 653 are in other areas. About of the
industrial units of employment in, upt. I-i- ;r'k
are in planned areas in comparison to 80% of th
units of employment size 100 and ab:ve workers,
;.f: t.: P ' :i'mnt ut

. r
-. _)
9 werkers arn oprattri in ti-r t:ian planneal areas.Considering tileexisting trend it is estimate
that the industrial units will increa-e upt. 93 thousandi
by the year 2001. Four alternatives were wtrieI. out
it seems tht A1terntive-2 is more practical and hence
recerienaea for the plan.
ALTERNATIVE -1 In this alternative, Proportional ch2nge
of iniustrisl units in each employment rup has been
w.rkei out. For instance, the industrial units h;vecnan-e--d 1.17 times in a Iecae for employment group uL
4 workers. S., to achieve the figure of 1991 the uniH
existing in 1981 have been multiplied by 1.17 an so on.
This has ziven that by the year th ui 1h
nci 76 thousand inciu.triil uflit
ALT, iATI2 In this L .' v 00, em p loyment categories have been considere. I r
with re.)•.IL
4 4L11 S',11:'::
growth both positive or n.gative same In the pr.p.rtieras the trend sh'us that copositin of industrial unil. 3
shows that by the yea r 2001 the Units with ep1.yren:
size upt. 4 workers will decr
of units will Increase uote 9 7) .a:::: ut.ur Tnr
iaxi.rnum (75%) units will he in the epl.yment cate.ry
5 to 19 w rk ' r's
a

of number of industrial units in each employment
between two succ
abs1ute numbers
in the same ratio in 2bslute numbers. For instance,
inàustrial units of emp1eymnt cateery upt. 4 2re 10817
in . 1969 whereas they are 15 1 66 in 1981. The difference is
4349 units or dece.6el di-f - fer'nce is 3591 units. This ,increase
Ls in a ce ien th base fiure is 10817 in 1969 as, the
sa-me proportion has been woi-iced out for the figure 15 1 66 of
1981 to :et the units in 1991. This hs riven that in the
year 2001 the total number of units will be 249000.
ALTUNATIV-4 : In this alternative the 1ncrecs 05
decrease of industrial units has been consiere in per-
h: to Ua]_ uni Us xi sti:i. in rspctive time
j ai c r ne hs ben c; '
in percentage 4irectly to the next decade. This h s
resulted in employment size upt. 4 workers and 100 5T
w::s b'crn n-tive in 2f'fl ipssib
1

IjI5 •:.sSiro
V T
'Co
CHAR ACTERI5TICB OF INDUSTRIAL UNITSIN DELHI.
I
-.
j' .
.'&cn o.o.5.C3; ::Po SOURCEGROUP
031 COcO Ci.C' CAWS 3' I'.',CAL I C. 5 • ,. 1f 0A0 IV
SLVCOA(O '0CC/ 33 COO) C.0T.LL Co ., - p, .1?
oao: ocuc r 5 D f.OASC 'ETo I .OLC.QYS5 ' •.tOJt..AJ. -d 'S
CC , TC0XTr..0.5 )0 o.o1T. ?qCi.,C I ?.J115 N •. i 'rr.-o, rF
,•,_ ic (XC[?T TCC°Ot (QVP. :co,. - •...O.1E t 0.45CC C0
4 0.,:
5 35 ACCICCV I 7C0.L
TE0.1C ,0oois ) ILfCfl0M ".'t 'CCC0 6 S3 r'lCo:
I IC-00occAJCT5
5 V
p l . Es "075
: i •" . O CO3C4T! 07 1P.0000O0fl• £ CoTS IC.TCO I. 0LCTI 0."ct.t pkpts
S-4 •SM00 C C
) 0.13 0 0.i0.S TI: .Ao. 1 01 CCCII C 0115
CI PEPSOIM an-. 0.

I"
S.
0
FACILITIES AVAILABLE TO lNCUSTRE5 - OVI ON Z
34
S.
Ct
IS
A C LII I$
Li
UI - I
CHARACTERISTICS OF INDUSTRIAL UNITS
IN DELHL
I I

CLcflES AVAILABLET3 NJSTtE -
II
- 11z
-
CHARACTERISTICS OF INDUSTRIAL UNITS!l nfl
c.cjrlEs .A'ALA3LE TO INDUSTRIES - OVSCN E
IA.. S
umnm
-It mailI ur
V4.ILITlES AVAa..LL .C_•1iL3 - C' .!SC,.
__

LEGEND
•Icn 0000 JoltS
'0-i $0 35
- 0*1000 00 lOS
01, -OS, 00005
101.000 00 ¶01
0110010 TOO
c-TO SO 001
L1JO IPE- \:.u;.L
lII:
I — "
071
Jo
-
J -.•0
•
CHARACTERISTICS OF INDUSTRIAL UNITE
r.IN DELHI.
Mill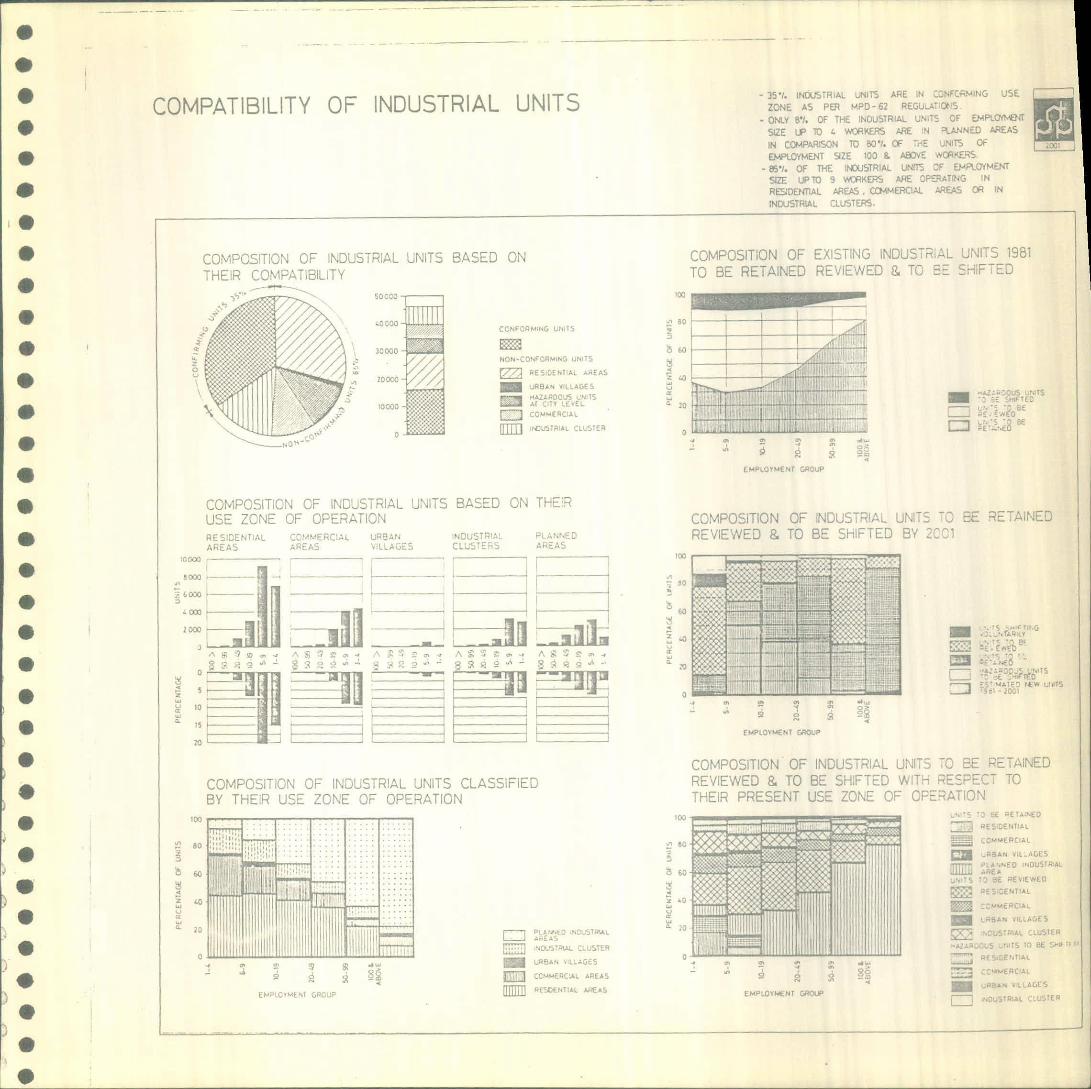
80z
60
Z43
- -OUT, r,TrrVS TIC
1.O••ri L:.iBA
E —'.SO
• .: [i' r
— .'.OVLY
L-r. -
::J CS' '4t.TFT lW I.I,lTi
7r
COMPOSITION OF INDUSTRIAL UNITS TQ BE RETAINEDREVIEWED & TO BE SHIFTED BY 2,-- Cl
9 -4
EMPLOYMENT GROUP
COMPOSITION OF INDUSTRIAL UNITS TO BE RETAINEDREVIEWED & TO BE SHIFTED WITH RESPECT TOTHEIR PRESENT USE ZONE OF OPERATION
7j EE RETAINED
PIDENTIAI.
BAN VII 1.01$i i.'I.'/.ED NOUSIITIA:.
PC—VIEWED
., ç, .'... . .VE IENTlA1
VILLAGE 5
AFSZENTIAL
8a Z'-^MERCIAL
I-'
Mu h
1LALLSEMPLOYMENT C,ROEP
?.DIJ$TP11 r:uSER
CUMPA ILLY uF NUU5 kAL UN
COMPOSITION OF INDUSTRIAL UNITS BASED ONTHEIR COMPATIBILITY
500 0O
Tfl1J\/
CON MNG U1S
// / 3cOC
^-7 7 NON -CONF ORMING UNITS
RESDENT;AL AREAS
JABAN VILLAGES
UI HA2A0CJSAl U V LELCC.4qCA1
- jjJJJj ,rSTrIr Cu-TER
ZONE AS PH N-r t
- ONLY B'!. OF THE INDUSTRIAL UNITS OF EMPLe4T
SIZE LP TO L. WORKERS ARE IN PLAJNNEID AREAS
IN COMPARISON TO 80 14 OF Ti-E UNITS OF
jPLQyIiENT SIZE 100 8. ABOYE wCi'cERS.
- 851. OF THE IU5TRIAL UNITS 3F EYR.OY
SIZE UP 10 9 WORKERS ARE OPERATING IN
RDEiT1AL AREAS, COMMERCIAL AREAS OR U.
INDUSTRIAL CLUSTERS.
COMPOSITION OF EXISTING INOU5T AL UNITS 1981TO BE RETAINED REVIEWED & TO BE SHIFTED
.7,
EM P LOY M ENT GROUP
COMPOSITION OF INDUSTRIAL UNITS BASED ON THERUSE ZONE OF OPERATION
RESICENTIAL CC'MERCiAL UROAN INOUSTPU\ PLNNED
AREAS AREAS LAGES CLUSTERS AREAS
::i.
4 ow
iocJJ
3 1 3131
$? ^"'
LE
- T
HTI]Q 10 I __________ I 1
COMPOSITION OF INDUSTRIAL UNITS CLASSIFIEDBY THEIR USE ZONE OF OPERATION
I77,
-'-'-
0 I'':: .....
OrTTTLU _
CILI!j III -I r
ri PrANV INOL'TN'kL
NOI,STPIII.CLUSTER
LRaAI. \.L'—AGES
c,c,rV EllhlIll FIE'T,C€NTILL 1...'€AS

,lU ERAG-E FLcR 2-..EA F NTBY THE EMPLOYMENT SIZE OF THEAVERAGE FLOOR AREA PER UNIT CASEFED
BY THE TYPE OF ACTIVITY OF THE UNIT
4000 71fiii1^ P171,
Soo
11 L—T
CL
--
PRCOUCTS
4
4
4
4
SPACE STANDARDS OF INDUSTRIAL UNITS - AVERAGE PLOT SIZE IN CASE OF EXISTING
INDUSTRIES IS 1937 SO,MTS.- AVERAGE FLOOR SPACE IN CA CF EMNG
INDUSTRIAL UNITS IS 1462 50
2DCkI I
AVERAGE PLOT AREA PER UNIT CLASSIFIEDBY THE TYPE OF ACTIVITY OF THE UNIT
AVERAGE PLOT AREA PER UNIT CLASSIFIEDBY THE EMPLOYMENT SIZE OF THE UNIT
•.COO - TTfljTTTTTT'.3600.. _hThTTTTTTII1i
• r ---
--
5 :i•-- -
.:
5000 ITTT4600
z 3600
E 1T:i1?I.I1200 1
5OC
- - .
it itI
5 OGO-r.- -
13500 -'----
I --4 50D-
)OOQ --
-
F Lii;;II Ii
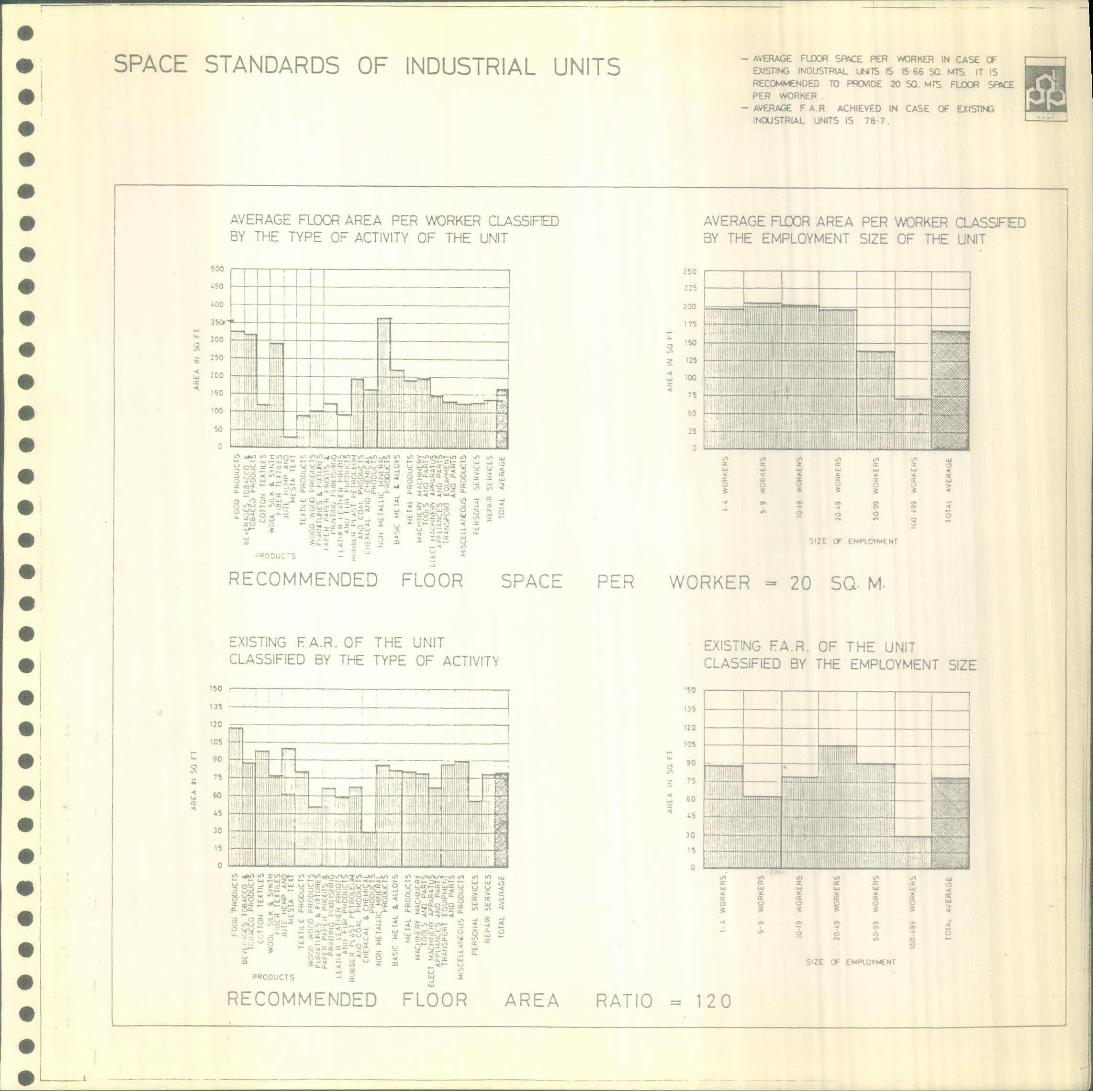
EXISTING FA.R. OF THE UNITCLASSIFIED BY THE EMPLOYMENT SIZE
-
fl fl fl fl M LUZ IX IX crIXLU LU 44 LU LU LU 4x Z X t SccIX IX IX IX
00 0 0 0 (3
4
-- " 0
SIZE OF EI'4Pt0Th€T
35120059075
-41,30
0
RATIO = 120
3AL. 3ANUARL)b OF NDU5TRiAL UNITS ExISTING INDUSTRIAL UNIT5 6 15 66 SO. IT
FEC4MENOEO TO PO.1DE 20 Mrs. F1coiPER WORKER.
- AVER(,E F A R. ACHIEVED IN CASE OF EXISTING EliN1JSTRIAL UNITS IS 7•7
AVERAGE FLOOR AREA PER WORKER CLASSIFIED8Y THE TYPE OF ACTIVITY OF THE UNIT
sco ---
CO
so
rLLI
s .:a
— :-- = -
AVERAGE FU:xJR AREA PER WORKER CLASSIFIEDY THE EMPLOYMENT SIZE OF THE UNIT
:: r !__ I "liii
I H H17S L...—__.............--- -
i 1III
III
t
312E OlI EMPLOYMENT
HL' .1/ENE.i9 _C•CR sii- I-cE
EXISTING FAR. OF THE UNITCLASSIFIED BY THE TYPE OF ACTIVIT
Eli'_____H
EL... ....II I
T I T]1 -z.a 0 Jar.X u
_:--
-. t - .. 0 4 1 ., a
P0DlJCT5
RECOMMENDED FLOOR AREA

k' L_i. vcL—. LJin: -.
Ji!!
PROJECTION OF :NDUSTPIAL UNITS IN-BSOLUTE NOS CONSIDERINGPROPORTIONAL CHANGE 1969-2001
fillc ccc
PERCENTAGE COMPOSITION OF DU5TRL'.UNITS CONSIDERING PROPORTIONALCHANGE 1969-2001
=Q t
)TL..iJI__
FPOJECTION CF INDUSTRIAL UNITSBASED ON THEIR CHANGE INEMPLOYMENT SE CCNSDERG SUCCESSIVEEMPLOYMENT CATEGORY 1969-2001
3r Ccc
___ 'H I I
-LN4VE -2
PERCENTAGE COMPOSTN OF INDUSTRIALUNIT BASED ON THEIR CHANGE INEMPLOYMENT SIZE CONSDERG SUCCESSIVEEMPLOYMENT CATEGORY 1969-2001
E0 -771UIIUI1F- A.._... -........- .JL.........
ILiJ-ATENAf1vE -
:O & ABOVE WORKERS
50-9 WORKERS
O-49 WORKERS
0-9 WORKERS
E- WORKERS
-'. MJRKERS

PROJECTION OF INDUSTRIAL UNITS 1969-2001
21U
PROJECTION OF la%UUSTRIAL UNITS BASEDON THE COMULATIVE GROWTH 1969-2001
50 om
cooco
15000 - ....
'0000
I ^ivw . ... .....
RCENTAGE COMRJSTN OF INDUSTRIAL LNThBASED ON THE CCMJATTVE GROWTH 55_,-2CQ7
:IIUIII
PFCJEC::CN CF iL NITS BASED ONDECA CAL CHANGE N PERCENTAGE 1969 —2C01
too
so 71v j ,, 5
OFF .L NALVE SH9A'NcOF INDUSTRIAL UNITS 1969-2001
c' xo - -
350000I F
320000 I F,
.I0000
.2000
z000w /Go coo
ccc
T17

— 71481. ICLFTRL&L UNITS CAME LPTO BETWEEN1970-80
— 45 46% INOUSTRIAL UNITS ARE OF EMPLOYMENT SIZEU'TO 10 WDRIES.
— 5325 /. INDUSTRIAL UNITS HAVE FLOOR AREA UPTO750 50 MIS
CASE STUDY OF DRUG MANUFACTURING UNITS
COMPOSITION OF INDUSTRIAL UNITS BASEDON THEIR YEAR OF GROWTHI
3 V.
'a
COMPOSITION OF INDUSTRIAL UNITSCLJ\SSiFiED BY THEIR EMPLOYMENT SiZE
EtL HV.' 0 -a C,
a
-I
EMPLOYMENT
EREAK UP OF INDUSTRIAL UNITS BASED ONTHE RANGE OF FLOOR AREA PER WORKER
COMPOSITION OF INDUSTRIAL UNITSBASED ON THEIR PRODUCTS
23
412
to-aa.
V -t 'V V - -------V o w = - -
-
'
COMPOSITION OF INDUSTRIAL UNITS BASEDON THE RANGE OF THEIR PLOT SIZE
'a18 I12 I
-' 2.70-
fl'g
900
AREA IN 5Q..
COMPOSITION OF INDUSTRIAL UNITSBASED ON THEIR ANNUAL TURNOVER
18
ta 'aP S(IN LAPHS)
;

CASE STUDY GE PHUOL BAGHINDUSTRIAL CLUSTER
- b/. THE U5TILAL 'JN1S CAHE BE vJ.
1970-80
- 1351. INDUSTRIAL UNITS ARE OF EJ4PLC.1ENTSIZE UP TO Yi PERSONS.
- 90'/. INDUSTRIAL UNITS HAVE PLOT SIZE UP TO
250 MTS.
COMPOSITION OF INDUSTRIAL UNITS BASEDON THEIR YEAR OF GROWTH
30
2. H--21 ________
YEARS
COMPOSITION OF INDUSTRIAL UNITSCLASSFiED BY THEIR EMPLOYMENT SIZE
0.
_ I H, --I;---- I
I -i
..
.;I,..4
y. iv?.JT SIZE
COMPOSITION OF INDUSTRIAL UNITS BASEDON THEIR TYPE OF ACTIVITY
1 L = ii = ii liE i _ruli:fti=:±:±H-CL 40
>-i'c, co :--
Ex
PROOuCS
COMPOSITION OF INDUSTRIAL UNITS BASEDON THE RANGE OF THEIR PLOT SIZE
40!
26 I
Is
§
o
AREA IN SO. 14, -
BREAK UP OF INDUSTRIAL UNITS BASED ONTHE RANGE OF FLOOR AREA PER WORKER
H
_iIIII*- 10
PEA N 5GM
COMPOSITION OF INDUSTRIAL UNITSBASED ON THEiR ANNUAL TURNOVER
so
H50 -"EH------------
LJ I: .IF. .0
•0 ........ '_ _________________
'C
AS (is 1APIHS

CASE STUDY OF PLASTIC PRODUCTMANUFACTURING UNITS
;-v4iL-
- 5742(. INDUSTRIAL UNITS ARE CF EF-4LOThEN1UPTO 10 WORKERS.
- 9'66i. IIDIJSTRIAL UNITS HAVE PLOT AREA UPTO250 SO. MTh
1
CCMPOSiTCN OF INDUSTRIAL UNITS BASEDON THEIR YEAR OF GROWTH
I I __
lop -1- I
! OI
cc
YEARS -z
COMPOSIT ON OF INDUSTRIAL UNITSCLASSIFED BY THEIR EMPLOYMENT SIZE
I2Q
•--
EPWEl.T 5IZE
BREAK UP OF INDUSTRIAL UNITS BASED ONTHE RANGE OF FLOOR AREA PER WORKER
100 I
80
70
-----i----
:___ I—'a 11
71_1
0 1
AREA IN SaM.
El
COMPOSITION OF INCUSTRAL UNITSBASED ON THEIR PRODUCT
Pi
cc
LL
-pRo0 U C S
COMPOSITION OF INDUSTRIAL UNITS BASEDON THE RANGE OF THEIR PLOT SIZE
20
105
-
3AREA U 50
COMPOSITION OF INDUSTRIAL UNITSBAS E D ON THEIR ANNUAL TURNOVER
ao
IN LA1S)
I I
I I


L1hi, b.
n'i conerc n_-L; ? v c imiox'trit ro1 in the econu.T11 3 ctr i th t ii'd 1 r • t enr.tor oi emp1ovmnt
Th- 1.)roott n of rkr in this sctor hs rmaiin th vicinity a:. bDut 2O, but du' to rapid groth
l]-:s 1 tr cl: Lu.
Ju to its 3puci-1 bc Li i ii r:.-la Li-.n to trnaport netwo-nd vi1ob1 infr: structui-. io1.s1' comnoditis are b
i7rocur cl frrn uJ istrihutd t ubnces simost all over theutiy, J g -tiy by jod tr :, n-oi-t. I-n csa of commoditjjs
iJ..k txt11es, fr'uii;s -td v:rft;b1'o, electricals, c.omicislooci i-r:ins 'nd di": fru 1
;:t uL;iuils uiric: t 19 h . n tur; .nd . nv 20th c'ntur-is . r 'iitd i uto con ian, oocrckimnt an pu1i.:2
I. .1, t'.i.Sbo :o ttl ri..cks nJ :: i:1: proul-•:ns, bsidsxcuosiv, noi.s in th oru, thus r-ducilyr the qu;1ity o
i.if± of tu x'icl nt o '.ui:. 'ion. Durinr t,ick NPD-62 periud[ru! ts ond vL:t -bL .s, ir:n o:d s t 1 ond cc1e 'ic'' ve
ii ruJ •: c.::rc. ectL: i i n:•i1ci cit und .x ::noi:ns, Co ivu'ht. P1a nd Korol
u'ich for:s •:ntr? , 1 i;Uoifl .'3 L jotrjct of Do11 ,, i0 In ord-0 ntr.1.Ls t is I'1ftn district centres and
of cs I : ' rci: I. cootr. )roo5.d in MPD-62y..:• uc:ss of !.:)1 • n :it : Liuj o: c -L c,ntr.s is prtic,t1n
slow ond s rs;;uit cssc: ntrtion of corn rcis1 sctivitCity H H
i: 2

r' bout 1825 rtil ctrn to the needs of1000 persons in urbi DilhI. As comp!rod to this the 1D-62had rcomndd str'rid:xd of only 6.67 shops pr 1000 population;i,inst bbsrvod 16 shoos in 1953. Thus the rcomrnendation oLw'r shopping stndrd hs riven ris'e to the 'growth ofu•uthorjs-d hop in th form of 1iner street shopoing.Th' study siOws t11t out of four formal 8ho p s in Urban Delhi,thr r' in t.1-12 form of un4annd linear shopping.
• Ee proportion of retail shops in rsideritial areas is quite
•
i.gnificant0 The stud y rev2is thct the occuronce of such:noi)_S is mxjmun in un'uthorisd co1onis and minimumin grout) kvusin. On an ever about 10 shops per 1000
• Lion 'r in r'.i:nTJ:J. Ja
Info ri.J scLr
The phcnnon of informal sctor i a psrt of rapidunbonis:Lion exprioncid b: oil tie devolpinp countris InJ.ilhi -lso the iuforil 'ct-r ol y s o very irnoQrtuiLrole which nds to ho roc Th' survey reveI..oI 'vry shop L unito in th
In r::i:• 1.
• 'uy: .................. :H;.: :L. .;'J.Iiiconcontr• c1 in 'll.J ciLv ::r! xt 7nsions duo to bc ic.no mjor •.ehoi in rti1 trod. in Dlhj. In other
prts.iit is oi'srvU thi't t1i:- units strategically ioct• 'iemsTlvO ne2r work c:nLrs, conimrcil or - i onti t 'H
• tr;:nisport nnd':s ?nd within housinF, cluster::
•
Wklv mrkatn, th trdicionol st,l of in: oruL shoppi;:is nou1r in Lelhi, specia liv scnon. :-r the lower nd midliincome group pop-uiion. Tie wits functions in
• systeotic manner,- ciioosin; loc;.tions central to a lroicni :n :1 tin. on dtf'f!r'nt d- y o of th -wol
.
i.
•

1
©)RVACANJ
-•-.-•-1
WHOLESALE MARKETIN OLD DELHI.
I11IIJ11I \ 4
7
\`x,a9
10
CI-FANONI CHOV1KBHAGIRATH PLALE
NAI SARAK
BALLIMARAN
KHARI BACLI
MAYA BAZAR
T ELI WARA
SADAR BAZAR
CHAWRI BA/AR
JAMA MASJD
DIVISION BOUNDARY
EEIEII ZONE BOUNDARY
- WHOLESALE SHOPS! ZD
RETAIL SHOPS / ZONE
WHOLESALE MAFThET
1 4
SHOPS
- LN DELHI HA5 ABJ1 ONE LAII RETAIL SK'PT
- TNE MAXIMUA NUMBER OF WI-CLESALE SHOPS A.
IN OtVISIQ A (.( ANDDIVISION C (22 4%) DUE TO
LOCATION OF MAJOR REGIONAL WI-CLESALL mARAETS
IN .LHI.
-- 20-9 .1. RETAIL SHCPS ARE IN DIVISION A FOLLOWED
BY 1'5 /. IN DIVISION E
• RETAIL AND WHOLESALES
\
I
/ i] ' ll-I ' --- Ci'JtLtlES ,i 0I /"TH WES EF
I
KET
GATE
rEFI A INSET) SH RA
Till
11! Jill,
NARAINA
i (iii' LH
CD0 - -'- , .,NEW DELHI
WET,D
--.------ ;--_ ---•\ _/ ( 0
-- • - t -c0 7fl' \—_'
/ V L_-" 0 •
' .'
' 7'• S 1 /t\
• / ••'\ --' hF,•
o!)TH DELHI - 1J\0
-i o -.j-- I ii1i1----OLD DELHI- A /-- E& NOVELTY CINEMA -• / Q
I H Q
1--_)HANoFYvAL 11
.----___ L_.
•-j
10
S
S
S
S
Sa
S
S
S
S
S
S
S
S
S

FORMAL SHOPS 18.25 RETAIL AND 2 21 WHOLESALE) IN URBAN— REGIONAL AND Cfl't LEVEL SHOPS (LEVEL I AND II)
ARE MOSTLY LOCATED IN DIVISION A AND C
- RECOMMENDED STANDARD ( FORMAL SHOPS PER1000 POP1JLA1N.
RETAIL WHOLESALE TOTAL
0 UA-SI1579 221 lB c
Li EXTN 1579 221 2200
DMON WISE C5 !EUTCN OF 9-10PS AND PDPULATJON DIV1SONWISE [)STRIBJflON OF SHOPS BY TYPES
-, .. JAT u " \
EF
Arx SPS
IA -
Z LAM - —.4 __ CJ 'CP5
- [L AAH (o
DiSTRIBUTCN CF SHOPS BY LEVEL OF MARKETS COMPARATIVE STANDARDS FOR RETAIL SHOPSp3pjAflCr)
- r34
10
5 I_J __________ ____
0 ENC23LIIIIS I
A B C D E F G H L)
opPl
!20 * jJ fI'________
19 .-9
-...-- .
EL.. ..II I &JT1T C-.E0 / - TLj.TCIN
NOC4TCS p-' .
E.iRE .
C'CLE CCCE .VELC1 ET::: LEVEL I
CVEL IVSLI.&:E 4EL ..:iii LEVELIV
C1.S1G-f'S (PI' --0—OS C-&'O '-' —3.0
I LEVEL III -
VL AV.J Ii W}4ELEPS - - -

MORE REGIONAL THAN LOCAL.- MAJOR COMMODITIES MOVEMENT
(80 0!o) IS BYROADS.- NEW MARKETS ARE PROPOSED TO
ENCOURAGE DECENTRALISATIONAND MODERNISATION OF MARKETS.
WHOLESALE GOODS MOVEMENT BY MAJOR ROADS
DELHI N ti,
H CIVILLI
KAROL BAGH C-'AN.CINI SHAHOAi344'
WEST DELHI
./NEW DELHI
i t 'k A , N
L .., SOUTH DELHI - N HA 34 90AOIS
YAILAY LINE
b.4ArEpA,
L - - - -- Q-'JtTS £NJ VEG
CEREALS
RUJ LO
TEILES
PROPOSED WHOLESALE MARKETS - 2001URBAN DELHI
If
L - 5 NDS
I0NAL AMxErS
.iIONAL CUM• CCAL NARPcEI
WHOLESALE iRAD
MAJOR WHOLESALE COMMODITIES
NUMBER CF -OPS 1. EXRIRT(O&JTSIt€ thD95TEXTILE AMJ TTLE
AUTO MOTOR PARTSAND MANERY
858 I AND YE&rA
oI Adt4RDRE AND BUI-E
34
goLf3 MATERIALS
PAPER. STATiCtERYAND BCOS
GENERAL M0JW4TAD IIRYANA
A73IRC AMJ STL
4ii IBCYCLES,AND TUBES
TPCALS AND—1 aaTRONCS3651 Bd
O-IEMCAi.S
3fl1 I 63RUBBER AND PL45-TC GOODS
299 I I 75HOSIERY
2831 I I
12 $00 ACXJ a 0 20 '.ü 60 80 mONUMBER PERCENTAGE
PROPOSED WHOLESALE MARKETS - 2001DELHI METROPOLITAN AREA
RUI
REGIONAL MARKETS
NH. I MAJOR PAOS
RAILWAY LINE
DU,& BOUNDARY
FE U I BOUNDARY

- MOST OF 1HE ESTAJ5+€NTS (43 .) -tA. COME UP EOlPI%I3 1971-91
- WITHIN DELHI, 701. GOODS MOVEMENT 15 BY THELA
AND tEADLQAD.- 591. E5TA8LI *4ENTS KA/E FLOOR AREA I.P
- THE MAXJMJM N '1BER Of ESTABLISHMENTLOCATED IN DIVISION G (60'I.) AND B (32
- MJST OF T%-E ESTA8L!S1+ENT (77 31.) HAV
EH PUYI)€NT IN THE RAt43E CF I TO
- 521. ESTAaLjSHl,,,IiiENTS HAVE FLOOR AREA U
DTRIBUTON OF MATERIALS
/
-,N
I
-
MODE OF TRANSPORTATIONK
L1 :T]eo tooPRCEi1 tAGE S
FLOOR AREA PER ESTABLISHMENT
10 20 30 40
PERETGE:S
AVEPAGE- 55M - [AI1N(,
AEPKGE - Il..i E3 CESIPARLE
SO; -750
25' -500
20% -250
SI -,CO
iOt-5)
5% -100
31- )
2% -
II - 20
0 - 10S0. MT
I-0
PERIOD OF ESTABLISHMENT FLOOR AREA PER ESTABUSHMENt
I '982-632972 -700
I. 1962 -7%
LP 10 19624 2(YEA/5)(P4)
EMPLOYMENT SIZE
501- 00
291-500
51-200
101- 150
51-100
31-SO
2% - 30
Ii -20
0 - 10
(SO 5415
16 -20 lC'.>
::
2104
- 49
I 5 10 IS 20 77
PERCEN1A3S
AVERAGE: - 9833 - EUSTINc,
AVERAGE 8632 IM OESMABLE
WHOLESALE TRADE
® LEATHER. PLASTIC AND P.V.C. CLOTHTRADE IN BALLIMARAN
TYPE OF ACTIVITYOTHERS(7.66'1.)
WhcLEALE
Ui4
W_ES4LLRET RETAIL. i62-93 'I.)8. 40rJ( (l.73h:
GROWTH OF ESTABLSHMENT• I42
I5I lY5 IJl
-----------------
© PET ROLIUM TRADE IN DELHI
D1STRL8UTN OF ESTABLISHMENTS ANDLINKAGES WITHIN DELHI
Fjii H
G
ull'mm E
D
C
B
A60 50 40 30 20 :0 0 0
NUM6ES
1-0 60 50
FFCEI'1TAGE:S
ESTA84J5I-NT5
10CL*E(.NT
cxTR8U1I054

!.ADAR II I iibAZAH
jI(Ni)EWALssN
-I iii hi ii
S
S
S
I
oI
IS
joHDARA
OLD DELHIRE R
WN
El
WEST DEHI
\(NEW DELHi'
1 1'
// tII ' s IKINGSAY CAMP
NORTH WEST CTVr' N
DELHI t.\)
I J",I II 11Tti1Jr - - - - I " •'
/•_•_•_=-llLIIll[ --H4=L_1 / ___
1 ii. 1\ Li!J \IillLi;.!
SECTOR
1
— UHU.AN DELHI HAS 1 33 LA}KH fML ELCkLfr4ITS (WITHOUT RO) AT THE RATE OF 257 PIER000 POPULATION,
- 266'!. UNIIS ARE CONCENTRATED IN DIVSIONAS THE RATE 59'25 PER IWO POPULATIONFOLLOWED BY 129". •N DIVISION E AT THE RATE
67 PER 1000 POPJLATCN.
INFORMAL
/ — •- '-.... o LII11J 0J__.=: /•
LA AT NAC-. -'
LulL'!',' 1]1'[ "a! Ic:'
-S. yTH DELHIcj)2. .._H-S
1iiI S.1_El\\ff---, AP ONI
.ib0WK
REDFORTf
I RHJ
OELHI'' -GATE
'- S
DIVISION BOUNDARY
ZCNE BOUrOARV
LI CASE STUDY LOCATIONffflflfl INFORMAL SECTOR UNILUfflIIIILA PER ZONES
500wos
S.

INFORMAL SECTOR
DIVISIONWISE DISTRIBUTION BY MODE OF OPERATION
- e i. JNIS ARE OPERAI,GFOLLOWED
Y 21j ,!. MIIIIL€ UN115MAXIMUM NIIM(It I 0, (JNI I'.. (iS I6h( I Al S Will(
LA1ABLI5 IOLUJW( U BY 116901, 14 (IIANILJII
- HE UNITS LOCATE THEMSELVES 51RATE6ICALLY NEAR
•WORK CENTRES. L_./__J
COMMERCIAL AREAS.TRANSPORT NODES, AN3
-INSTITUTIONAL AREA
DIVISONWISE DISTRIBUTION BY TYPE OF ACTIVITY
0
0.1
/ r
EU U[J(:131
9F9\h1i3
1—' I Tj1 \\\- / .1 t \ \ 3EL/
SI ''\- •• -V_• _. - -. _, - - •.'
•. t o'l
L) _PVU ECL1I4t
INFORMAL SECDR ENTERPRENEURESSOCIO - ECONOMIC CHARACTER
SNO INDICATORS
AGE (AVERAGE 32 YEARS
2 FAMILY SIZE (AVERAGE ) 5 2
3 SEX MALES - 95(.
FEMALES- 5•f.
4 FAMILY EARNERS (AVERAGE 1 5
5 MIGRATORY STATUS MIGRANTS - 55 8%
RESIDENTS 4421.
6 PLACE OF ORIGIN JTTAR PRADESH -573 /.
BIF1AR -12 81.
RAJASTHAN - 7 51.
OTHER STATES - 226 1.
7 WORKING HOURS (AVERAGE) 10-8
8 REASONS FOR SELECTING THE ACTIVITY ILLITERATE - 36 2 /.
UNSKILLED - 1S61.
LOW NVEST MEN T -123
S DAILY SALE (AVERAGE) PS 78.00
ID DALY ftCCt.IE (AVERAGE ) AS 1700
II TO OWN A MODE OF PAYMENT INSTALLMENT BASISREGULAR PREMISES
PAYINO CAPCITV PS 49 10 PER WIN H
-.0
30
..J A
A
B C U 1.
H iLi 19.29 1561:i6s' Ij4
2)28 2•7)
-c -
Afl''LL.
.OJEAL JILITT ,ECAEAlIOrLt.
AR cxO
DISTRIBUTION OF INFORMAL SECTOR UNITS
ON SELECTED LOCATIONS
OFFICES .INDRAPRASTHA ESTATE
ft'CLUDNG BUS TERMINALS - 7 PER 000 EMRJYEES
EXCLUDING BUS TERMINALS - S PER 1003 EIP.CYEES
•NEHRU PLACE
66 PER 1000 EMPLOYEES
VY(XESALE MARKETS 3-6 PER 10 FORMAL SHOPS
RETAIL MARKETS LEVEL-1,n (CONNAUGHT PLACE)
3-4 PER 10 FORMAL SHOPS
LEVEL - (CENTRAL MARKET, LAJPAT NAGAR)
3-4 PER 10 FORMAL SHOPS
LEVEL - (MALVIYA NAGAR)
4_5 PER 10 FORMAL S15
LEVEL - V (P K PURAM SECTOR Z ) -
4-5 PER TO FORMAL SHOPS
BUS TERMINALS I 1
5 B T - 200 UNITSRAILWAY STATXDNS NEW DELHI RAILWAY STATION - 60 UNITS
CITY BUS MAJOR (CENTRAL SECRETARIATE ) - 5010604,111`5
TERMINALS SECONDARY (REGAL, SUPER BAZAR)- 25 TO 30 UNITS
HOSPITALS RKAL (CO BEDS A.NDVE) - 2-5 PER 00 BEDS
GENERAL (500 BEDS) - 4 PER 100 BEDS
INTERMEDIATE (200 BEDS) - PER ;co BEDS
EXHeITCH GROUND PRAGATI MAIOAN - SOD UNITS.
H

603 1.5 2.0
FAMILY 'OZE
jjjglCHANDNIHOWN
Cct4NAL**4lP1, ACE
7.3.PEA
AMP
A$DAA
ANAGAR
MOTi
DAILY SALE AND INCOME
60 ]0RUPEES
- -!E. M.Y
EARNING AE'A6L
LRT
PLACE
1.1.3.— AREA
CAMP
APIO&RA
LAJTNAGAR
$4011NAOMI
COMRJNEOTOTAL
1•jS
j. FAMILY SIZE EARNING MEMER5
INFORMAL SECTOR
CASE STUDIES- SURVEOF EN1REPRENES1
AGE GROUP
6(1 +
31-60
-
60 40 20 0 GROUP 0 20 0 60
CI4ANONI CHOW.CON14AUI' PLACE
60+
Li 51 — 60
4150
31 —0 H
16 - 30
AGE
O 20 0 GROUP 0 20 .60 60
MN&SWA Y CAMPMOIl NA3AR
60+ 351-60
16 30
c o—'AGE
6(1.0200 GROUP 020 60 60
SHAHOARA(0MI&O TOTAL
REASONS FOR SELECTING ACTIVITY
-AAERAGF--
- 55I. ENTREPEN-5 ME MGRANIS MOSTLI FROM
U.P. B1HR RAJAST}W D AJAA
- THE AVERAGE DAILY SALE ANDINCOME OF AN
INFCMAL UNIT tS R. 78 AND R5k LI RESPECTLY
- WE ENTREPENELS PREFER To OVk4 A FOAL
SPACE BY PAYING RS LB ü (ERAGE) PE MONTH
--.--'.-.-IVIILr',-
irI'.
ACE
AREA
4*u1
IWMJ
I?lf
I00 50 0 25 75 IOU
PERCENTAGE
ESIGENIRA
iJ BIHAR
pp Ar WEEY E1111,161.
HARRANA .1.
PUNJAB OTHER 51A1E3
PAYING CAPACITY PER MONTH
N I
LIGHT
WAY
)ARA
LINEDL
ILL TE RATE
UN9.lLLE0
FAMILY TRADE
LOW TNVESThENT
P- o1IP
UCPITPLACE
WAY
5HGAA
NAGAR
MOTINAGAR
TOTAL-
.00 80 60 22
PERCENTAGERS. PER MGN1H
- UP 10 25
26 - so
00
0 -ISO
s - 200

PL"
\\\ M1143.N¼ • \ J I/i -
)cu7v.Ay4J4".4AD - P¼f?
w
3d S
• ANA P/.ALAP RXP ¼.41¼k¼
E5\//)(JJ
J I W fi 'i .-/ -'----• . •
/ !'f'.9 4-'AJNA
..:
1) /
WEEKLY MARKETS
ZN^^=
AA
- WEEKLY MARKETS , THE TRECffCNALSTYLE OF RETAIL SHOPPING ISPOPULAR IN URBAN DELHI , SPECIALLYAMONG THE LOWER AND MIDDLE 0-0,INCOME GROUP FOPULATRJN.THERE ARE 95 WEEKLY MARKETS ATTHE RATE OF 182 PER LAKHPOPULATION.
zi
.
\1, 0-OTTA• 1.J
G¼YNJ.J.4A 4AP4.AU
•\.
-.
\\\\
.B4cr.AL
*.) I4,•4/44T IrTLA K&EAP.AkJ
• ) / .-P K P1.RW. / LA$I
.
4'.UJP5¼
S/
) R¼41M4 -
l H '3 _L
5--
A. 11 C I) E F ( fi TOTAL
NUMBER OF MARKETS II 6 11 5 .J 8 22 12 95
PER LAKI-I POPLLATION 1 77 1 05 2 07 101 2 20 0 99 2 65 2.65 1 62
TOTAL SHOPS 3,212 3.252 2,321 865 9.820 2.687 8.668 6.120 34.965
SI4YS PER MARKET 292 542 211 177 491 336 394 343 366
SHOPS PER 100) POPULATION 5 16 5 73 4 37 I 78 10 81 3 34 1044 912 671
AVERAGE SHOP SIZE (SC MI) 5 32 6 80 5 22 5 51 515 7 53 1.62 1. 61 5 33
AVERAGE MARKET AREA (HA) 0 31 0 12 0 22 0 19 051 0 51 032 0 32 0 39
TOTAL AREA UNDER MARKETS (HA.) 8 64 1096 598 2 1.1 2496 100 1976 939 91 9
LIII WEEKLY MARKET
U T BOLMARY
-'DIVISION 8OLNOARY
RAIWAYS
MA)OR ROADS
Oil-ER ROADS
F- RIVER
0 -----. ---- -..----.---' -_.
.!/ I
1-

DISTRICT CENTRES (D.UA81)-2001. IBM192cO1
USE I CONTROL OF BUILDINGDETAILS OF DISTRICT CENTRES (D.U.A.81)-2001.LWTHIN_USE PREMISES ACTIVITY
LLIc
I
H cr I
QJ If) 0.> U`) M a- CD LiJU' rj') >. C1. <tC1
- I AREA (HA) 50 '0 0
WHOLE. NOS 610 305 I 0IocwFSI SALE70 00J' IIOJH.L 70 S'rJFS AREA (H2) 5 9. 536 75.768 58. 536
14 . -Pvt NFORMAL NOS. 24 22 244
IF c- SHOPS AREA (H 2 ) . 454 732 7.466
.AREA (H&) 62 39 63 '5 .Q 69 47 20 30 32 25 770 49
51CRY'5 2.51FORMAL NOS. 6)3 576 623 I 807 397 655 680 340 556 574 570 733 765 365
SHOPS AREA (H2) 31,650 37.300 71.150 40.350 9.600 fl. 750 24,000 17000 27,600 30.700 23.500 76.650 250 8.730
30 73 1731-76 40INFORMALI NOS 754 250 70 374 '55 262 192 137 277 766 704 293 746 45
4 M (7MA(5/ Sr-lOPS AREA (H2 ) I . ¶ 500 '.020 9 '.57? 1.152 27 I 322 7,4? S I, 274 7.738 876 575
2356615)I CNEMA (NC)S 1 T C 2 110 I ¶32 1 1 '3 I 'C 2 I 702 I 107 1 10 7 I 707 1 10 7 I1 102 to 7
APEA (HA) 77 20 T'6 20 123 LI 70 55 '0 44 70
IOFFICE SPACE (HZ) 77400 20.000 36000 5000 770 16,000 70.000 23.000 41.400 0 am 55,000 70000 44000 20000
F"of FOR B.&Nl'. J SFp'.' iis '
SrtIE'S'7 (r ETC 5'
' 056 4 946 II 910 946 9I
6.946 " 0 27 I I 3 012 7 320 I" 99? 4 966
INFORMAL NOS 37 9 is 32 9 '9 9 I I I 23 30 I 9
AREA (HZ) ' 92 54 90 197 5.4 33 54 50 lOB 54 135 '80 at 54
AREA (HA) 1 0 1 0 0 I 0 C 6 I 0 10 6 0 5 0 6 0 0
FORMAL I NOS 39 39 r 39 70 3939 73 20 39 . 5 39
AREA (9.42) 1,950 '.950 1.950 1.950 I 000 I g so 1.9so I 7.000 1000 1000 1.550 775 1.950 1951)
75 50 ISO IHi 20 INFCRMAL NOS 5 . i 13 '5 77 13 18 17 11 7 's 15 18
SHOPS AREA (H2) 1 75 '76 115 75 175 175 175 1 775 12$ 775 175 750 I'S 75
PET ROL PUMP (NOS) I I I I I Il I
OFFICE SPACESPE (H 2 ) 7.500 7.500 7.500 2.500 500 2.500 2,500 I 1.500 1.500 7.500 2.51)0 3 700 7.500 7.500
HOTEL 70 '° 50U ?5I'* 0 AREA (RA 2 0 70 1 - 70 2 0 1 2 0 0 - 7 0 1 7 0 17 0 7 0
fl CENJTRE 2$ 1 100 1175p'& 0 AREA (HA) I 3 I 5 1 0) 2 0'
0 5 0 6 03 0 6 I 2 0 I 2 0 7 0
CLITY - - AREA (HA) 2 5 2 5 1 1 5 2 2 17 2 5 2 5 7 5 2 5 - 2 0
BUS TERMINAL (HA) 1 7 I 7 I 2 I 7 0 7 I 7 I 2 I 2 1 2 0 7 12 E"
7 I
73 too 17 71lOOM) SUB FIRE STATION (HA) 0 5 0 li 0 6 0 6 0 6 0 5 0 5 '7 6 0 6 0 6 0 6 Q, 0 6 0 6
ELECTRIC SUB STATONO-4. 035 0 35 0 35 035 035 1 035 035 03$ 035 0 35 1 0 35 0 75 035 0 39
73 700 171.4 '00 P AND T. OFFICE (HA) 0 IS 0 15 0 15 0 15 0 '5 0 IS 075 0 15 0 IS
-L,
0 iS 0 'S 0 73 '7 5
33 70 LU POLICE POST (HA) 0 01 1)1 01 01 07 07 DI DI 01 0' 0' 01 0%
333 100 IL 4.4 OCM DISPENSARY (HA) 0 1 07 a, 0' 0' 01 01 0 I 0 I at 01 0 I, 0 at
SGAPELT1u1_I1OAREA (HA.) 7 5 2 5 I 3 3 ¶ 1 0 2 4 1 I 2 4 1 5 9 0 I
n 2 - 35
TOTAL PLOT AREA (HA) 13 0 26 0 '30 31 '7 10 0 240 71.0 17 0 12 0 9 0 16 0 45 1) 1' 0 '9 1)
POPULATION SERVED -2001 (LAI-j 65 3 4 2 46 4 69 28 3 51 2 791
I 93 325 3 57 7 96 I 717
TOTAL EMPLOYMENT - 7001 1 14 251) 17, 540 6 790 '9.530 6 340 1 15.170 5. 620 3.931) 6.770 5.040 8960 25 17) '.760 I
WHOLEIs ALE
AIL
ICE
ER 'vCEIENTREI

COMMERCIAL CENTRES —2001
RBCNAL CUM LOCAL WHOLESALE MARKET
SNO COMMODITY bRA MARKET SHA MARKET
NO AREA NO O AREASHOPS (N2) SHOPS (HZ)
PAPER. STATIONARY AND BOOKS
2 GENERAL MERCHANTS
:3 BYCYCLE TYPES AND TUBES
4 ELECTRICALS
5 CHEMICALS
6 SCRAP MATERIALS
7 LEATHER, FUR, SKIN AND WOOL
8 ME T EL PRODUCTS
9 FOOD ITEMS
ID PALO, TAPE AND ACCESSORIES
II
COSMETICS AND TILETARIES
12 FURNITURE AND FIXTURES
13 DRY FRUIT AND SPICES
4 CROCKERY AND UTENCILS
IS WATCH AND OPTICALS
6 MED IC INS
.7
SURGICAL AND SCItIF( INST
16 OTHER COMMOOITrES
FORMAL SHOPS TOTAL
INFORMAL SHOPS
OTHER ACTIVITIES
GRAND TOTAL
76 1600 36 3.800
71 5,0 36 2.900
54 2200 27 1.100
53 7200 27 1.100
£6 2900 24 1500
'2 3,400 11 1.700
35 1200 ¶9 I .600
35 4200 6 2.200
10 4,100 IS 2.100
29'.200 4 600
37 1,100 14 , 600
74 2,500 '2 1300
30 7,600 I 0 1.300
19 2300 10 '200
10 '00 S 203
5 700 3 1170
4 100 2 200
16 ''00 ''3 400
510 j 4; oo ;s i 900
'64 '72 732
''316 I
60.000 . 70.0 )
( USE
R ETAIL ANDICOMMERCIALICE N IRE
SERViCEAND RECENTRE
CONTROL OF BLJLCl3 DETAILS OF 'LOCAL SHOPPING
WITHIN USE PREMISES ACTr.'ITY CENTREDUA - Sb 1 UROAN E)TN
I 0 INl'4 MAX NIH MAXIZL.
Lu I ' ' RJP'JLARCP1JLPOPULAIRCPLLAz " z w ric* I TON , TL4 ICR
I Lu15.000 I.O0Q 15000 20.000
I I
-4 & 1 011
AREA (HZ) 275 3660 2975 I 3.300
FORMALNOS 37 49 I 37 L9
1
RETAIL AREA(M2) 766 ¶ 079 I 501 1.069
SI-Cl'S NOS IS 20 1570SlOPE? "FORMAL AREA (M2) 90 '70 I 90 ¶20
35 loo ''csi FRUIT NOS 5AND FORMAL
AREA (N2) 50 50 60 804 '4
ABLE NOSI NOS 9 Il INFORMALSHOPS AREA (m2) Si. 17
j72 96
OFFICE SPACE (M2) - 1785 1 2.379 '907 2535
AREA (Ml) 925 CO'' 990 1.320
NOS 10 13 13 17STOREY FORMAL SHOPS
AREA (M2) 151 152 159 Iis is 705! 20 I -.
5'.'
TD
I11 9
45IINFORMAL SHOPS NOS
S 6 7 I
AREA (M2) 50 60 10 90
ESS PLOT (M2) 750 150 750 290
TOTAL PILOT AREA M2} 370 4 760 3.915 1 5.220
EMPLOYMENT 762 150 796 1 194
CONTROL BJLCI-G DETAILS OF CONVENIENCEWITHIN LE PREMISES ACTIVITY SHOPPING CENTRE
I 0 U A '81 URBAN EXTN
— MIN MAX, 1 MIN I MAXz
CCE
Lu TON TIO' JTJON5.000 6.000 SCUD 6.000
Ln
NOS 15 I 19 3125
I FORMALSTOREY $1 1 RETAIL
AREA (M2) 750 230 321. 381
40 40I1,2F5 9'II'5 -
NOS, a 10 II 13
INFORMAL IAREA(M2)' I
66 78
NOS 2FRUIT FORMALAND AREA (M2 20 30 30 40
VEGET-ABLE
NOS 4 5 6SHOPS
INRPMAL
AREA(M2) 2' 30 16 '5
TOTAL PLOT AREA (H?) 955 076 ¶140 '358
TOTAL EMPLOYMENT 32 3 7 42

Employment - Government Offices

I STEI.CT - Gç. Offiios & Public Un erta]-:iriqs.
:nt:roJuctin: De1ii, being "a ca:iLal of Inia" has large
cncentrntJ-0fl of ermloymeflt various ministries,
their ho rt: nts and ublic undetakings contributes
bc' the Govt. emloyrncflt in adJitiofl to the state
an locil Govt. em;.1oyrflflt.
The 1:-stor In 1961, total 474 acres of land was under variousPlan 1961-81 govt. offices. Ou t of this 474 acres major aea of
201 acres was occupied by central Secretriat cornL,leX.
The D 62 rroposed new 11 sites to be developed
to cove up with the re1octiOfl and expansion of the
Govt. offiCe5. It also recommendc that Central Govt.
offices should e locatc' in 4 Ring Towns of Ghaz-
iah , iri:lah.1 and Norela. During 1961-81 only
tOJO si Ls, one at ?.K.Puraut for Central Govt and second
at lcdhi !'d. for publicsector offices were developed.
GOvt.{fljlo- In Delhi, C entral Govt. is the largest employer and
:ill rornifl so for tivs tn come though tron cveo thrl1rfl t
ye-rs show decline.
T:be.l. Public Sector ErnplQyfllflt(n Lakns)
1961. 1971 1980
Central Govt. 1.44 2.11 2.50
(64.36%) (51.46%) (49.60%)
Delhi Adinn. 0.25 0.53 0.55
(11Q27%) (12.94%) (10.910/0)
cuasi Govt. 0.22 0.56 1.06
( 9.90%) (13.65%) (21.04)
Local Bo3es 0.31 0.90 0.93
(13.97:) (21.95%) (18.45h)
Total
2.22 410 5.04Public Sector iflO fl/) (lflfl 0)
(100 coo') . •-•
S
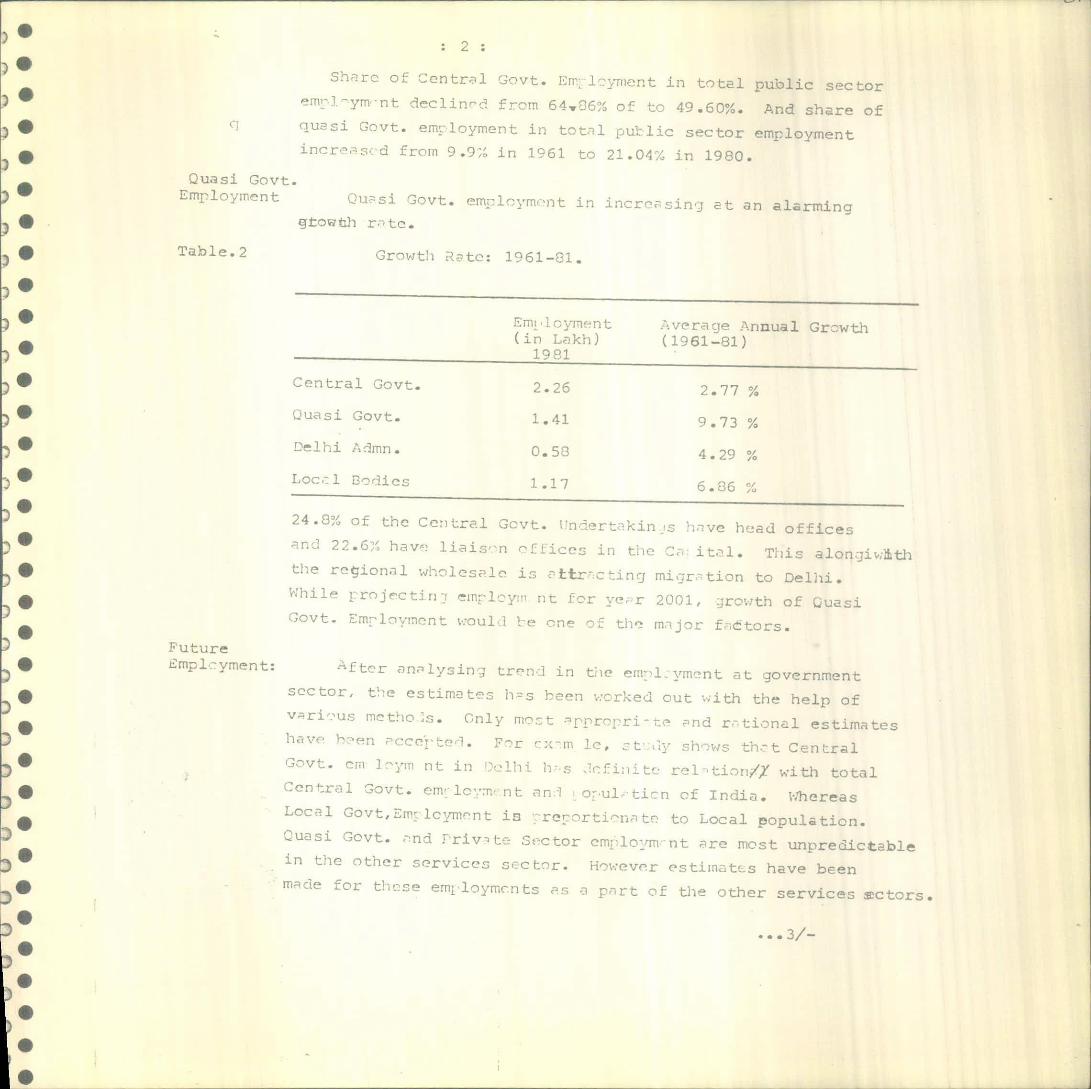
• *
Sh:rc of Central Govt. 1m1•rrient in total public sectoremilym. nt decljnrd from 64O6% of to 49.600%. And s 1h2re ofquasi Govt. employment in total public sector employmentincrarc frc.in 9.9;. in 1961 to 21.04n in 1980.
Quasi Govt.Employment Gusi Govt. ermlcvrnont in incresinJ at an alarming
towth rntc.
Table. 2
Growthnote: 1961-31.
Central Govt.
1J0sj Govt.
L)Jhi Admn.
Locci Oodles
Erni (',yrnntin Lkh)
1981
2.26
1.41
0.5-
1.17
ver.age Annual Grwth(1981.-el)
2.77 ON.
6.86
24.8% of the Central Govt. I.'ndertnkin,s have hUad office::nd 22.6M havo liajsri cffices in the Ca: ital. This alo
the regional wholesale is nttr7cting mi grtion to Delhi.;:hile t:rnjctiri-r employm nt for ver 2001, growth cC
FutureEmplCyron t : LL-Y on3lysjn4 UrWA in t. e eiti m nt at O
sector, the estimates hs been worked out with the help ofvarious mcthos. Only rnot rpronrize and rtional estimthave hen nccete1. For cxm le, =Ay shows tht CentralGovt - era l'vn nt in Delhi h r-s 1f jnto re1tion/% with total;cntra1 Govt. em lo• nt fln:1 oultjn of India. ThereaLocal Gov t, Emylcymrnt is 7regortionsw to Local population.Quasi Govt. and Private Sector crm:1o rm.nt are most Unpreicth]in the other services sector. However estirnnts have beenm T ar for the employmonts ps a rroi
th e ocher services SC
.**3/-

roose'iLoc ti °ns:
For hA1ncei. .vc1orment at regional and sub—regionalic"vel, the ermmoyrncnt in Central Govt & /un .:ertkings should
ne rrntricto. The growth rtc hotween 1981-2001 in public
d octor ': i : vo 4 on s jivon ;n1o;:
i1mr1oym nt Aver, Annual2001(in 1kh) Growth Rate 1981-2001
ThnLri1 Gnvt. 3.16 2.67 %
...U.S1 Govt. 3.04 5.14
.e1ii din. 1.53 4.97 %Loci Bcr9±es 2.41 3.60 V.
InpiLc of Loer •oro-:tn r• tn 1roosccT for •.usi Govt.emp'oymont in Delhi, the bot1 em 1oymnt in this sectorcull nvrtke Ccntr1 Govt. cm 1 ym nt around 1985.
To CCctfl - ci - L ne! 3.16 Lkh CenLt1 Govt.2rnr lcviticrit Fc.11owinj Loc ti r 'ns ?V :n r oni.
Area (in1. I.N.;.. -P. SrFd.rju
1y.St m ti I.3. Saket 70.!
S1t DistrictT'it -- Tnr r Tl
;-h- r.m (curt:)
6. ::ncic-'n of 'uterflcd & : t:
Ymun& Cn I7. -Tr 72stii:T:
in Euth '''nt (u.
major prt t'; LwAi NcQ & Oc ini c iriinLrem lovm':nt wcull in noc orri in the p ublic semi PublicI: :citv 'r5s.
I

Priva te on theF05t tr':n.:, it is c'r rvc that,emp1o'mcnt em 1oimnt in the 1-riv . te sector ':cu1c1 be
to the tune of 3.43 L]:h.
3cci.1 tu'1y
1) Prj r ctinn for other S:.rvicos sectorvarious mcLhci re apf lied to arrive At
tbt j;r.s:1 employment for yor 2C01., which has been
cnverei in er1ier prgr4.2) Unit sp.ce s tnrd.
The study ws cirrir 1, out to find outctuol space rewirel for one workers in Govt. offices
PnQ onisting st•n1ri was also reviewed.It was founi out Qt:, of 12 s.mt.
or ',:;r]or lo

PUBLIC SECTOR E14PtflYMENT IN DELHI IN I9t WAS5-42 LAM AND A't&iAi. GROWTH RATE OF 4-56'1. IN THE
- LAST TWO DECADES. CENTRAL GO/7 EMPLOYMENTACCOUNTED FOR MORE THAN 50/. OF 1tltAL taAPLOYMENTQUSI GOV'T FMPLCNME14T IS INCfASflG AT 973t.PSR ANNUM AND IS LIKELY TO OVER TAKE CENTPAIGOVT AFTER I1. BASED ON PRESENT TREND, OtGOVT E}.IPUYMENT IS LIKELY TO BE 5 $ LAKH IN
It IS PROPOSED io 13E RESTR1Ed To Láj.w-
Enrt LJ4 i? j: -
MAJOR GOVERNMENT OFFICESAND GOVERNMENT HOUSING

ICC
90
60
70
50
) AC4
30
Lu20
a
0
0IS2 o - .- 0 0
6 F-
4
a 7
2U
0 m
PUBLIC SECTOR EMPLOYMENT
:El.l1T .71
Z;ELHI A?STpAltJ,
QUASI GC.ERNMLNI
LCC.L BOQES
1961 -2001
ERNMENT EMPLOYMENTLWAY AND P IL I
clE y lEw 1978CENTRAL GOVT. tl-1PtQEES 19118ABSTAlCT OF U.K.ABSTRACT OF U.S.A. 1991
PUBLIC SECTOR EMPLOYMENT • MORE THAN 50 PERCENT OF CENTRAl. GOERN-E
EMPLOYMENT 15 CONCENTRATED AROUNDCE.';T
VISTA IN 0 DIVISION.
• MA) GOVERNMENT I-$C6JSING IS COFfNE
DIVISION 0 &F WHERE AS F DMSCt CES NOT
HAVE MAJOR OFFICE COMPLEX EXCEPT Ric RRAM
COMPLEX,
DISTRIBUTION OF PUBLIC SECTOR PROJECTIONS BY VARIOUS METHODSEMPLOYEES, DELHI 1961 -81
19 97
1110
8 616
I .•f,4 - - - -
60- f62i
,566
f '4111 / ';14S9eol'
I t_L cl3 I 941 151 1961 1911 1991 1991 2001
.t 1100 I PQ 'wECTlCr;5 eAEO ON °OPULAI,QN 1RE,I)II .VLL
II NI.4C*Y47 BASED ON AQL GRø/1H AAlfA EV-'ECINE ECTCP 0I.3IrA, 961-79
MEIWX II C€CT:O T3A0 ANI&AL ..114' C10 JN3 1978-79
COMPARATIVE FIGURES OF CENTRAL FEDERAL :DVERNMEEMPLOYMENT ND:A . U.K., U.S.A. (ORGANISED 5E'-- C) 1975
91i4
u8E (IF CENTRAL/ NO. wE EA?NIRS ANO C:L.'-ElA4 EI.PLOYMENT ALA6E$ €PSO16 AFC.1AQ CF
() J15.0E £GPICIJ4TLJNE 3
.477 MIL ,l 20.000 MILLIONS -. 18.642 MILL Ql,5 37.375 MILLIONS-020 ILLION5 90.872 MILLIONS li.5 2

5 2 61,PUBLIC UNDETAXING HAVINCOFFICES INO T H ER THANDELHI
4 /. DELHI
2 /. CALCUTTA
o ai. BOMBAY
• NO. OF QUASI GOVT. UNDERTAKINGS ONLY Z9IN 1969 REACHED TO NO.. 225 IN 1982.TOTAL NO. OF EMPLOYEES OF QUASI GOVT.UNDERTAKING ALMOST DOUBLED IN 10 YEARS.N 1972 .TOTAL EMPLOYMENT WAS 11 •16 LAKH
WHICH REACHED TO 20 • 08 L.AKH IN 1982.
IN 1980 55&51 NO. OF PIIJNDER TAKINGS WEREHAVING RQ(24J.)8.LLASlON OFFICES IN DELHIRESPECTIVaY_(TOTAL 106 & 47. 41.OF THE TOTAL).
AS[ GOVERNMENT EMPLOYMENT
S
S
S
NUMBER OF PUBLIC UNDERTAkiNG
CENTRAL QUASI GOVERNMENTIf)
225
200[____
7S
T25
Lu 0 0
1Ra00 °
=U
75.
lxz
50
rNLu Illil25
//
(_ ,
A S r..O c
CONCENTRATION OF CENTRAL QUASI GOVERNMENT
PUBLIC UNDERTAKINGS -HEW) OFFICES IN DELHI
NUMBER OF EMPLOYEES
CENTRAL QUASI GOVERNMENT
0
0
20
16
12
LuLu
IL
ui
kD
YEAR5 m m
CONCENTRATION OF CENTRAL QUASI GOVERNMENT
PUBLIC UNDERTAKINGS - HEAD OFFICES IN MAJOR
CITIES
268 •I.PUBLIC UNDERTAKINGHAVING HEAD OFFICESiN DELHI
OTHER CITIES35 . 61.
226 '1.
PUBLIC UNDERTAKINGHAVING ONLY OFFICES VISAXHAPATNAIN DELHI NAGPUR
HYORABADBANGLOPE
- V
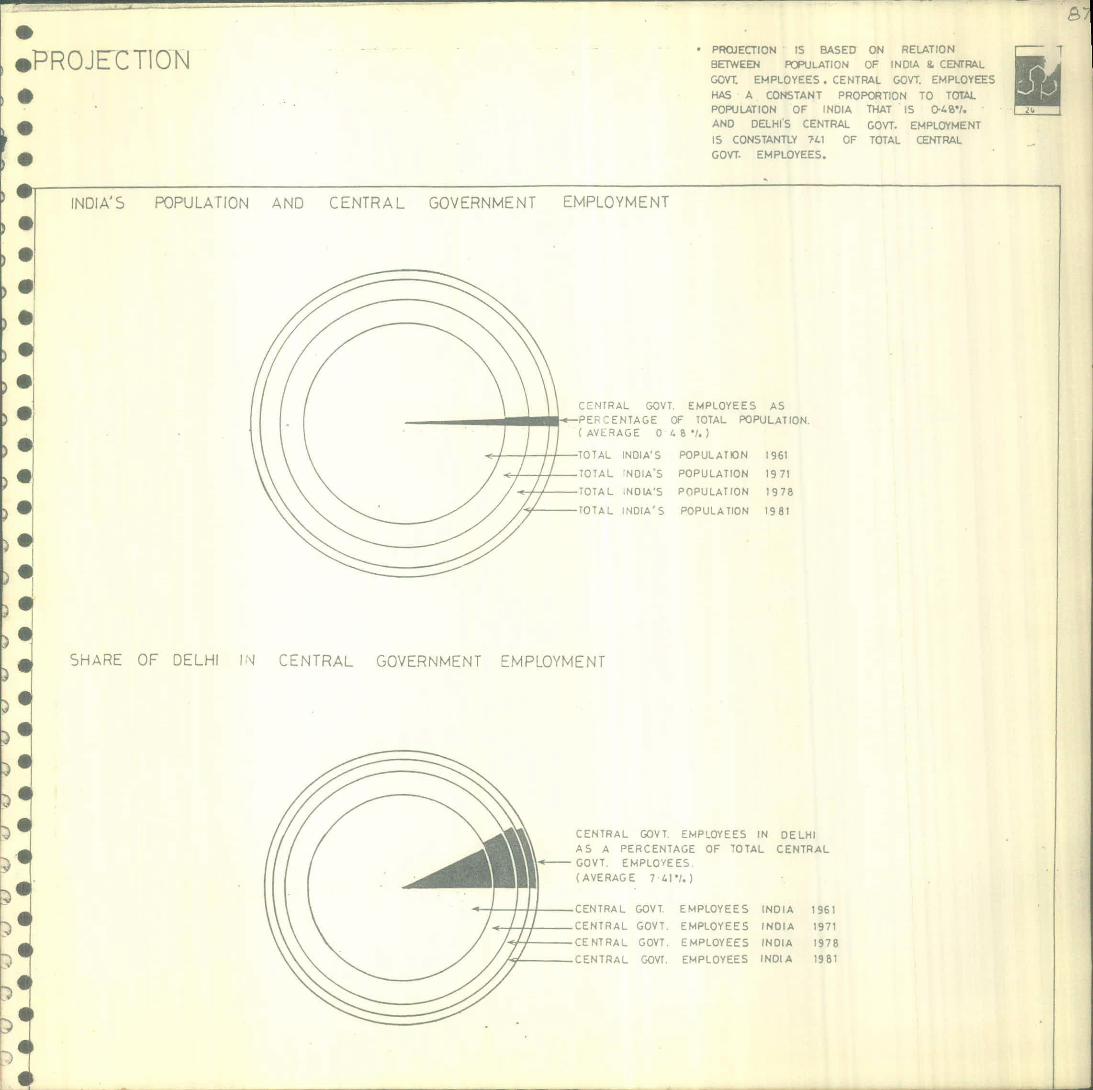
ENTRAL GOVT. EMPLOYEES ASEF:ENTAGE OF TOTAL POPULATION.AVERAGE 0- f. 8 41.)
)TAL INDIA'S POPULATION 1961
DIAL NDIA'S POPULATION 1971
DTAL NOIAS POPULATION 1978
DIAL INDIA'S POPULATION 1981
CENTRAL GOVT. EMPLOYEES IN DELHIAS A PERCENTAGE OF TOTAL CENTRALGOVT. EMPLOYEES.(AVERAGE 74Ii.)
CENTRAL GOVT. EMPLOYEES INDIA 1961
CENTRAL GOVT. EMPLOYEES INDIA 1971
CENTRAL GOVT. EMPLOYEES INDIA 1978
CENTRAL GOVt. EMPLOYEES INDIA 1981
E y EEN FJi.ATft h OF iNLIA & CENTRAL
GOVT EMPLOYEES • CENTRAL GOVT EMPLOYEES
HAS A CONSTANT PROPORTION TO TOTALPOPULATION OF INDIA THAT 15 O/i.AND DELHI'S CENTRAL GOVT. EMPLOYMENTIS CONSTANTLY 741 OF TOTAL CENTRALGOVT EMPLOYEES.
INDIA'S POPULATION AND CENTRAL GOVERNMENT EMPLOYMENT
SHARE OF DELHI 4 CENTRAL GOVERNMENT EMPLOYMENT

I ^
COMMERCIAL OFFICE SPACE
7*DISTRICT CENTRES -2001
I0DU.A_81.
• TOTAL IL, DISTRICT CENTRES IN ADDITION10 EXISTING DISTRICT CENTRES WOULDGENERATE ABOUT 600,000 SO. HTS, OF
OFFICE SPACE.
:\.
AUCHANDI ROAD
UINI BAG
HD A
AS
JEN
CEcIP(JANAK PURI.' ' ( (
MAYUR VHR
XN
// ( /
/ /
I- (/
) \e \\ >
/UKAJI MA \
PLACE--• I H LACE
N
AKEN, / D• LJA ____
NDPY
EXISTING D.C.
PROPOSED D.C.
'UNDERDEVELOPMENT
---3o
FLOOR SPACE---20 IN
10 (1000

T10°•1
w
EMPLOYEE ATLCARPET AREA PER
DIFFERENT LOCATIONS
• CARPET AREA PER EMPLOYEE IN THE
EXISTING FOUR DISTRICT CENTRES VARIESFROM LOCATION tO LOCATION • CARPET
AREA PER EMPLOYEE INCREASES AS ITDISTANCE FROM CITY CENTRE INCREASES.

S
• BASED ON THE STUDIES IT HAS BEENOBSERVED THAT UNIT SPACE STANDARD OF8 SQ . METERS CARPET AREA PER EMPLOYEE,AND AREA OF 12 SO.MTS. PER EMPLOYEE.MAY BE RECOMMANDED AS BUILT UP 2001
AREA PER EMPLOYEE.
UNIT SPACE STANDARD
REGRESSION CO-EFFICIENT URBAN DELHI7RELATIONSHIP BETWEEN EMPLOYMENT)
AND CARPET AREA IN GOVERNMENTOF F ICE S
V ON X
ON Y910
840
770
700
630
560
Z r
- 420
350
280
Lii 210
140
C C 0 0 0 C 0 0 0 0 (-) 0 0C 0 0 C 0 0 0 0 0 0 0 0 00 0 o o 0 0 0 0 o 0 0 0 0D t4 Q -T 0 D r w C4 Q -
.- - C4 ç ifl C
CARPET AREA (SO..FT.)
70
0
REGRESSION y = a-4-bx
CO-EFFICIENT bn.xy)-(x).(Y)
AX ON Y Yz 22+0.01X
AY ON X X 773+90•53Y
CO-RELATION
"I
n = THE SAMPLE SIZE
x SUM OF THE INDIVIDUAL VALUES OF VARIABLE X
y SUM OF THE INDIVIDUAL VALUES OF VARIABLE y
SUM THE INDIVIDUAL VALUE OF VARIABLE xAND SQUARE THE TOTAL
2 SUM THE INDIVIDUAL VALUE OF VARIABLE yAND SQUARE THE TOTAL
2 SQUARE THE INDIVIDUAL VALUES OF VARIABLE xAND SUM THE SQUARES
1 2 SQUARE THE INDIVIDUAL VALUES OF VARIABLE y( Y ): AND SUM THE SQUARES
(E x y SUM OF THE PRODUCT OF EACH PAIR OF x AND y VALUES

I
Traffic and Trrsportation

I L . 3? 9 1VrT :i 'O ) L2II
ore-inn:-, tire orc o tr:;iS-
ort.a oi ror l)L'i1 was •ThTi a ri; oF th prpiratio
n t' 1-st.r p 1 i -i For th City i n 1962. Di the :1-aster
PJ. t ii tro'tatiT wa en.r iag2 n 1 throih a
a id th' r.1ai pro.Tt nl7d i Lctit road et
Fnr th r,'rrt ;I11yr3. The rai1wy 1tV3
a goods avotdt rig 1 me
j'tso- 'I 131JU raiiwriv F ori. T '1V1E' PQ11..
ig\1CT so pro'O$3'1 3
t Th th a, t O 1flTy LC1 s at t' portpery.
rt c T'r i o' coiprhs;T3
'ii ao't -id 3 ro b'n c OL1IUCt 3d. by
?r3nctt r P1 ' -1 - ( P p W) of th3 ')')A.
t'j11 (C)l'l]C47 Y t.i' T)TD j In 1, 1 x 'tic' L I
.JC ' rp -1t 0.1 t'
fl nfl - - ' ' : nrc
•: .............
A 1 Hi r 1L ) I .1 i). HT
• 21 1_och TJrb -VYI -. 'h Rur1 'rJt3ag .
t.h9 n pulat ion for th.
•- • r:_. •-•'- --- - ..... .....•_•i
n.bL 1 :i
Y ::'i •.,.-- - . H • -' i .C!11OL bo'it
±cti oorri1 : t 101 by ji-ILctoi' r'ii1! and s'31-CtC
r:- • t'-3. 'L1r 1+0 1 -h hJ
,-.. 'L• flTh' H ibn -cts0

-2-
E:PiOYI11
As Der the 71 c'ns' s t participation ratio was
0.21 i ri urban ar a nx 2. in rural area. This
hn tncread to 31.93 in urbn area and 28+9% In
rnral :'.ros duri.n 1971-81. As per tre projections
macIn. by PPW of T) --)A the pa"tici patton ratio will be of
th orr of 35,""' in Urbsn Dlht and 335 11 rural areas
o' th Untcn Trrttory of Del"t. This woild generate
a total 'orc forcc o +9.08 lakh including floating
\Jor'cer poo']latirn who kep coming to Delhi for wor1c,
thih not to resi rie in the city.
P -7? -CjI-, n IrII A RtP
The 39.07 lach triter zonal trips male wtthLn
t- Delhi Urba n Arr give a -rh cular trip rate of 0.722
r cot ta ocr day. Th e corr3 po , ldt.nc,j q ire 'Or the
yer 1969 workl out to 0)-f Thus there has bn a
ie iril in (Rfr tahl 1
mA1 TT3JH Yi 1981
1981
19'9* Estimate* Act nal
Actual by CRJU
Val Trips 0.24 0.696
Vehtc'ilnr rP ri p s 0)+66 0.75 0.722
Total Tr i ps 0.71 - 1.18
Source: * C.T.T.S. 1968 - CPLRI
iOCLc) 'I:c :3Iir7n-,T 131 1IPW, l))Jt.
It t stimt' I t. n t . O 3'3 rs p'r capita or
7.')8 m u ch i,.;ic i's-r l triinn1v mt '-zortips.

JAL ;:'
m ab fl i1eas th e chaog io t%' ioda]_ solit in
Th1ht frc 19t7 to 1981. Th following principal cangS
are '1 er're' i'jr fru th' -jo. 1 69.-81
II JL T) 1-r'- 1 ti'D J UP 1i JI
(197_69_8 1 )
Perciae
or Total PercntageD"3 o t-i a'irlUal change
197* 199** 1991* in modal t3piit1969-81
Bicycle
P'rso'l 13dfast mod'
Lri faco ci 9
-r1 310W0. e 53
igs rflrport
3'.00 23.0
1 - io ::.8O
22.90 1H3.80
0 scriptioo 1.40- 9.00 +22.6,2)(197-81)
to I 7.
2. Person trips by prH.f f'ast rnaio$ dcreased
fro 2.80 to
3. Prso:i trtpS by hird f'ast \re'1c1 s dccrasd 1'rii
5.23 to 3 .& ahtl' those 7i] 10ci Lc].
tncr a9'd frmri 2.20 1,-u to 2.
Person trips by bus aod rail çexcJid.1)g CIL
h's) i 'y iD.8O to 50.70. In t? year
1 . Prs tr p . by b c'cl i 'r T'C1?8
1931, i"-rr that )JY Der300 tri9 ar
carrie r b y 1b.cri H
17.30 - 3.18
1 -.
: .
2.60
0.70 + 2.02

iT IL ( I :R A.F Oyu in [ 11) ?.I?G
'rr half o' the e9ntt7l trios or i ma'Ie on foot.
Out mor9al trips, pbLtc transport coprtsng DTC
bases, rat'.:ay nnd s '. bscripion buSs acciplish SO of
ths trios. Bicycles and prS)r1aLiSed fast modes cater to
shout 1% trios r?spcttreiy. About 1.85 are imet together
by 1H re fast
PT! HI 'R[P3 BY pT1Ypr3
Analysing the dtstribti-oii of trips by o'lrpOSe, it is
observed thot in 1)31 r 100 of the trips are made for
'orc pod s'tghtly oTor 3? of trips are made separately
for o4udation puro3 s. It is ana' vsd fran the 1981
srvy that th Dr000rtLOa of work trips has been decltntn
an the nro-o rt, n '' aIc L- i trips has increased ovr
4 f3 tr ps m1e for purpo
at her than work 0n1 eduastiori, 1JCt I 13
he2ith Knd recr 1tton, social e'1tH tnrnjt, Lc
tuna ab'it one q'is.rt.er of the total triri
It is nbsor7el tht. Lr:o nonbor awork jorra'
re mnde on foot (34.7 average) and mass traasrr:'t -iH
Bic ycle aIri persnaliOd Cast modO3 cater to HUIYt
equal n'xiber of trios (12.0 arid 13.3 respectiveiy)
SlLcht1:: . H ;-: H ' ft :bcrtiu
i ft _H:. :o] r'* 1 c rrcs purHaiHi
:or ñicti on pj r pon pro aa f'ot• trips. Trips toethir
by all vehic'.ilIir noIos ft 1/5 or the totl. tr
00- 11pali—;
Is
I. 91
H
P,UCl,-, ,ro 31 b r)1ChCi1 With aTsre moithly
hi tra1.DOft is the predomLnflt
o1' o ti oport for ho1sholdS it i.T13r oth1y
iiC'ri0 r II.1O2/- j rs0olt3 fant moles 1Ue scootrS/
T or c-inlo; e.r b O . 1 '1n1Hs ;: h 0 nnt.hly t of
1 ii r h0 Th'Di fi s t avOrfle tcfleC r
h oxr Lt 'ir on Tr;i1PoI't in
C houO'l.S :ho3O rr.inrik odes 0 transport
O C7C1F ,
11b'5 :or tO n I + respoct -rely.
S\uaid3 'i'i rr i 1 OOeS spent 1 1 f to
i; flni I
OC -cO n''i L L 1 r: U I
1fl)3 Tftt. lore 1 hnlf C
S
iIr' Lonr I I pla1fl Ln:
• '? fl r icreIsS WIH
S 1 tyrlO jS ly '
'aisport :.
t : lT•r ot 1 lb ,iConi ro1P. T
r) 1flr.' r
Ic
r1 1 :
1. :hh:, ;L :'.(S)
• i tt0 C• WO l.0 i (A?), (' )
[iIroprflth5 St.
, JIi1
Ii• ) 1 i ( A- )
'i' Bl) to Coitr.J
t (All ), -

I/) to :ircL .agh(A3)
1• Fri r3nds Cloriy (BI) to
C olin i Pjnc. (A10)
Iflilt. 'f';!r )T';'
U y isibtedly Del. i . in lhn T109t important trade,
ccr c 'narrT tn1Y ril (nit.ra ii ihs Northern Region.
ic' e7er, f uly tions 0r 1)iLL as a major collection and
dLt.rbutton cc it are rich more pronoanced. With the
exoa-r 15 on & cO'rlerc t-1 and tn'',trtal activities in
the DeihL i'Ie1o polttan Area, the ts'ie of freight
1o r ei-1olt hn; bci •ry sortois and formidable. The
f'nil.oWtn' rt_Le]1' n' i'' 'L V1(t
by FP1 of t_n prohlem,
kbo , it 20 per c ent c h? hoss atinial fraOht in.'
i .'i f'rcy i al':av n'-id 80 or ce L.
b y ro:in. i .li it Lci level, $1 1.2 oar cnn'
I're iht io'e r13n In by rn d Pnd 17.6% is by roa
it) ')i an a'ere i e na' 1 ,000 to 1,050 loaded wn':n
O1T e' 1 50 loa'ed wg 'n ' learre Delloi
1 2t '0 1' fl hlt:i'-i A v 7a • totA L freight hnn'-ll1 by
ratl-.';-- j -' nr...: 1 t bo H thn rny o
f.2,000 onnnn u
itt) It ha g U Yn. 0 per cnit K gonU
rr-n rla' stationj hare their destination H
t.hn all cit y all its ext'1nu.r:nn c.r. Y•bir Dh7ary
Matta Mai, Jha r1ewalari etc
iv) It hashne-i entah.1tho that, i ,5 n0 trucks
anrl lea- r e the 1e1ii 'Ictropolitan Area on an
average w ei ray. or this total truck voliiin''
t )
. i(.•. •. -....., ....: ':

97Highwair.2 (Thandara 'ctroL post). About 1/3 of
t i -r, total freight rionent by road c h-ndled jointly
National Highway 'H.1 (hainghu CctrL post) and
Jattonal Highwar No-10 (Kapaseera Octrot post).
RemainLng 1/ o lF, the freight by road is ha-idled by
road Is hind1ed by NatinaI Highway (troi post)
3nharnnpir ( L'et Cktrot ot)
V )The 3r\T ey h- r T'JH t.r3 was a ver he -i
noVement o" r inty trucks on the Natiouai. Highways-
Of a total truck rnoremcnt or 11279, on all roads at
the six point 72 were recor'td to be empty.
lTj) This surve r established thet the 25 of the total
truc 1 c forid thu byeu(q,stnic tra"fic. Of the
r'naLader, +1 percent trafLc , 0 .Teme r1t origina ted "ron
sutsijic . 11: 1 • 1 -d r1 n3t j r1t i on wthLn the 1)elht Urban
Area and 34 o' the tra 'ri c ortgtnate't f'ri th c]: L
T Jrhau Ar a for 'ettnatLon out.sio the 1), TJ
vii) tm ho trckin J 1 nu'1 trails porter3 are ;it
in r- j T)Ihj ri—'Y nuia area (Pelbi-UP Borde:
S rc 'i' ci Thd oht;. Road and Rohanar
DO:$J_i 1'nt :- 1
c' th e ctt.r f'nr theer-lectel enn'1at n'- of' 120 lakhs ar
1. ne.;re tr. niport :3y3te514
2. Enlargemen: ' j •- rfrv rail svstrn
and buses.
3. Ligtt rail -H•1 :L a l
i ItrcI'it 'j Q ' 1 rflJfl I rai'i ran tnrt 3y3t.ir
art r Li :)rt yst.em is likely perpetuate
ce t -peta' 1 jt- c ¶"ili towarcLs the central. area.
Thi.s g',stei is ri htrh co jetre-'irhufl t.ranispol't systeni.

91
Thus th e centre wo,lid be inviting more activities hro
chan; n lnfl u.e •hcrie or 1na1thortsed.
3tuies conduC f e by MetroOittafl Tran3polt Project
(ilay3) tndtcats that the approximate rate of return
'4Lh tho network propo sed b- planning CnmisiOfl in 1973
'o']ld work o't to be 2.7 which is fir below justiable
rate a" 10%.
ThtS system LS a 1 ltkel:r to defeat the objective
o c''otì :iolt and wouil activate centraltsattn andtncra
tTe1 IOm[l?ld. F1rther introductiOn of such syst ni oj1d
elo u lines.
:nd b'yes
L
1)
ri
The ei+e"orttJi '; 1 b eeler,y3m'3nt of traT12POIt jrfl
h r omJ;h rt'Y rn ii ay introduction o eder services
by buses.
The uie; eo'iduCte eby PPW re7alS that obc
30 0' ' th wor Dl('1 re t1n a distanCe of 3 uns. fr-:i
the r: lir'i line. Iiovi th'ro 13 a exc3s3tbtlttY probien
rr th3 work area to th rir rail. As the system is no
rr1ial in th cental nra, this will encourage th e cent:-
petal nO7? t t the decentralisatto
centren.
ts ring W3 0Ctit0 i S:-Oi 'e
vb o land u e along th r -r rail indicates ti:
low density develOflefl an-t to 1.1;4Ke it more e
hs been 511 este'I that the follOtfl sree:i nv b
t.uro 7 '.,rrkers .

1. Anand Parhat
2. LTA Colony
3. Pusa Institute
:irti Nagar
The ring rail spurs needs to be electrified on the
athura rail line ? )pto Palual and anDur Railway line upto
Gha-ilaba-1 by addition of aemate in'rastracture.
3. Lihtr-il svr-t. alwLth rail and buses
At ores.it , there are c-rttn crri r1ors which are oversaturated and have a higher de-land for nublic transportsvste. T 1 i5 deman. is likel y to tncreae in future becauseof increa.e in future becaue of tncrese in ooilatiowithin the exigt1n 'rbp n ara an al-)-) because o the? ane --i f h nodal-)-)!it fr-n o% to 75.study 'evsflis that few of he c rr i o rs Would need
cu-c Ltv trarort, to efftcj,t-rk
tL 5 in
corridors ha-.,e been.denti'i f the light railvt h is ' can ss transport s rste. It hacary.city unto 20 7 0 1Y 3-3r Der lane r hoar.C -n- iniex is -,, bout 1/10th if pryid on S'1rfac ad/5 when Drovted overrund ' ni. 1/3 when provided unr-rrund. The light rail system has the ability to shar2 ai
utilise all types of ri ght of way on the same route and yet
hsve the advantage of guided technology, high capacttv, hirh
ihur Prnizctivity and Cofortb1e ride. Its per fo:i:
c hac?ristics like lower noise, absence L' exhaust fiei a:mi.
better safety record maces the LRT more comoftable tt' tpedestrian environment within the bu-es. In the existing
urban area and in the urban extension, about flO
or lLght rail wold hR renred btr 2001. Th

cc\rrLior
a) 7tve< ithar to N; ml .rb Road along Vikas itarg, ITO
Prnchcutfl Road, Pusa Road, Rndra Place, Patel Road.
CorrilorS along :ew :htak T)Loal from Faiz Road to
ZachLra nd from Panchcuin Road, Ln' Road, Pusa Road,
Patel Road and Lin l ci rigp Road sh ]-1 have very trit'risity
of orement towards l ater part of the plan period and
st'iy to provtde un'ler ground rapid transit syst em along
thH prt may be co1(tn'm.
(b) Frcn 1ehrau1i_BaarD'ir Ro1 to G.T. Road (Hew $ubzi
Z'ndt) aion Lal Bahartn r 3hastr. Harg, Mathura Road,
xtttOa i : L .., hOihib isth
i( •1a1I Rond0
(c) FRrcri 1 JtIL FLoe- I
ttton a00.i.
) ri Pali troor t -) yb2r Fe- is aL rig Gurgao i
aul-i (uari, C P. l-1ari, 'e Lz Road e- nur Road.
( ) T1 i.(IGarden to R..t. it am io Lat3rfl Yatnuria Ce-i
Jo dr Ige at "i1 ae-I eoi • o*1 l t i1.:i o
- r
ro are C•ie the prob1 C
o ycl to pro'Ti'O a Se- re r ri.TtTOflJie it forrnoremeflt.
(j) Fully segregt3' cycle traCk3 to be protded by
:d iittn the exi ttne- rO:day sctons and mai1g ui C a
te 'iallahS'. Tht full er' ited ylC trao 1 S tnt.::-
COrIiOCt n i ia or CyCTC t Lp nrod'ictiOn arid attract ice- -
are s. It is oostb10 t o r 'ioe spIce for cycl Cl 1 ern
in tha cenr of tho rond ie-d by aeq'iat appllcation cH
H •---1.- t.n t.'e-r000 r 0.
too

- 11 -
pedestrian tra'ftc, n' provision of space for shifting
roadside vendors/petty tral rs along the cycle tracks.
:n the long range the grade separated facility could be
used for othsr modes like rail transit, or a tramway or
even for vehicular movement.
(ii) Partially se;rgated cycle routss ae proposed along
t'tc corridnrs where the exi ,3'ting physal condttLoris
poe dtfficultts.
(iii) New routes to he prOPo3ed in areas where heavy
cjC trat'fc is ntictatd.
(iv) In ot.h' exist tny n.ra li'ce t he Willed city, Sadar
a jr r H n. . cjcle io reri l. to b

A B C 0 £ r
PLANNING 0ITSION
101
90
- 60
'S
U,3-
30
a
(3U$E1t.0 INCOME RS/ MONTH
HIR0 FASTHIREO '1'Dw
PC RSONAI 1 !; F r.
lFAS I 4X>MASS PAJ"
rzi
{ PE0 SLOW
FAST AOCE -
TRAVEL CHARACTERISTICS EI; ^--
1 THE USE CF CYCLE C€CRLACi NCO4E OFHOUSEHOLD I(?EAS€S
2 THE USE OF FJ TRAJSP NCPEASES ASlMO€ N WE LCMEP &NQ1E 1ICO IE COPCLP TOPS JPM) fl-EN I T C1'EA5€S AS ri)y!€
CF HOUSE IKID N3AES
3 USE CF PERSONALISED FAST OE ' 4C PE*E5 ASl X .€ CF H()J5ENDID
SELF CONTAINMENT- OVERALL TRIPS
MODAL DISTRIBUTION OF TRIPS
//1)
1 5 1.SIACS
6 LAC
- -
)AC'O N
-
NrER c'iIcK:p4AL r-.S
C'AlP*D TPp
WA(A
-. *IISE0ASI MODES
CYCLE
MASS TPA4SPc
4PE0 FAST M')(
-
MODAL SPLIT - HOUSEHO LD INCOMA
w 50
nt
•. . •A
<:.w
20 ) • !
I IHousE'cLo INCOME 145IAIONT,4
MODAL SPLIT
_j PlEaSONAUSED FA

AT t1V!'4 LEVEL THE HQT 1INTU.FJ41 (9 9!)SNA DMSKN CTA)'?NTU.31./IrS
B I9N
:a,
M.000 IP
60.000 'm#s30.000 TFWS
I
0.000 TS
:rqi' BOUNDARY
TAVF1C ZONE
ZONE UNtFV
:€u-iiu.r 13OUNDAFZY
f—TRIPS GENERATEDT5 CONTAINED A
iTLTILi
//
/
1-TI:
TRIP GENERATION AND CONTAINMENT•WORK TRIPS
DIVISION WISE CONTAINMENTOF WORK TRIPS
'r
-JON
12T2 ssm 434
/ N i :: :::/
/ •\ /'S.' \/.. / r---•-•-•--------•--•---'\ E M130a 18.6
14 N / r 196M2647 .3\f•\
V - . 'I -- ----- - ---C
'A06.'
35___
—- --2.2}\ - \ /))Ø•
A 07
A Al
NJ
A 09 A 06
0/
/ • 19
16
IC .- •\ / \ / .' ----. * '
( )cj/ \ __O-_, \ —
•0••0
.....•
- 'Al2..AU.
1
V.
-f -
BC)
3 06
_-.--------. —LI -- -----' .31-1.
0• /
•1 2.
I B0_j_/ •-••
0
"• I-- j .
0
/
/
,0
S
S
S
S
S
S
S
0
S
0
S
S
S
S
S
S
S

tO
AT VTS- LEVEE THE HOI6T COMAWENT (0631)
IS IN E civsica LOWEST CC4T4NT(821.)6F DIVTS1NTRIP GENERATION AND CONTAINMENT
EDUCATION TRIPS
DM93N WISE CT.AJtv1O'ffOF EDX1U'4 TRPS
- __\FIS Cc?W#t!
( / A I!7 I0i
13
—9X 40 852
09677 VIM
8 75 Q __1:_
'-..Iri 144345
-\
EF -- - 117747 30A 0410 06
al l -0 I
/ --'- 01-----_._. : ' I
A
Q — 08 Q ç - - - -
iA
— -A 14
-
60.-
Q :0 rc'
69% ( (,-f
711.771. 1060) T
--.-
JS —
I/
//
U I 6J'CRcrvt BuoAp
EE TPAFFr, ZONE 8Ou'1WY
rP5 OE1€RJE0RU'S cowAvED
050A

IH11 -1O LILd 3U2 ri
TOTM A'0i&_E
7`11AL PRSENI
60
Lo
a
20
CAR
132 - - - - -
80 - - -
----a
ISnx*D
20 - - - - •
: .
10 /
c1
4CcR,4€ cLP5
SCOOTER
NC0.E GROPS(F?SJl4YTH)
CAP SCOOTER
VTAL AVERAa CAR
MODAL SPLIT - 2001
ADOPTED DIVERSION
PERSONAL FAST MODE 4091
CYCLE 368!
HIRED FAST MODE 3331
I•".
HIRED SJ C7, KAE 4 2 5'
MODAL SPLIT
DIVERSION TO PUBLIC TPANSPCRT CHARACTERISTICS OF BUS USERS
10-57-969-19B1
BY VARIOUS MODE USERS
loo 100 100 -
III I'° I / 1 00
t
II I 90
1 .3 80 80H I
—--
70
, ,ov
so
C ,
!O T10 11.0
=
-
a II '
20 ii --
t0 ,
] ::
B •
YEARS i'co cu'
DIVERSION TO PUSUC T RANSPORT CHARACTERISTICS OF PESiDNAL FA5T CDE USERS
ANTICIPATED IMPROVEMENTIN CASE OF OWERSION
BY CAR USERSim
fl.4PPOVTJ.€NTh RANIJNG
CO1IFORT 1
BETTER2RJTtZ
BETTER
AcEsSøJTy
cosT S
YR'SH1
9 I II I I I I . COMFCRI BErG MAJOR WAP-0I
240- TtM AAG€ A43CP7tD L 5JI204G 7K INCUK
I - SCOOTER kG EVEICITUSE PAtTFAN OF
- I USS CRSEr4 FROM ZX
I ABOVE )X HG, BEEN C1E?E0
-. II •A'ED tXYERS*DNlVW. AVERAGE PJC
- - - I CAR USERS 12 0 •f.
ii SCCC7ER USERS 51- IT7IM = I
-I 'C)R a *OY1ED
0 - = D•Ttfl rEP,AL c*1 "OM 9810017 ED
IN c€ o.ps (Rs/ 1w) - -

100SO
HH/90 U
50H
70 ftY ___
CH LGO NH
INkI4 ____ 10
0 IALi LD
0
I ;Lfl TOTAL
O ((4_4
0-0LkLFEU
NCOMF GPOL%(OTilMORT NCc-E c0LP (Psd.oiiH)
DIVERSION TO PUBLIC AN5PORT a-iApAcrEpISllCS
OF HIRED MODE USl!;pO5E OF
NG MODE
+ ?5_Y LDC.A9JAL TPf-,. MO-RE
s onr mw
fl:90EPVC, T4ESE
CF THE 13TAL 0€RS4 HAS BE04
•APTEDCrYE AS"
TAM 10,4.1I:
MJ )7ICR?.HWi 4001
ACOPTEDMCCAL SJT
)-OES
R( -i'TEO T&O
Lan-CAI-Il
mOOE TYPE
I,— •- -. -
MODAL SPLIT 7 200PUBLIC TRANSPORTPERSONAL FAST MODECYCLEHIRED FAST MODEHIRED SLOW MODE
751$
9 310624 QC'J
1 6
DIVERSION TO PUBLICNSPT CHARACTERISTICS OF CYCLE USERS
40TOTAL
35- -- - - - AVEAOE
AGE 1.A.NSPET
(_(I o'EHomPE I HcE PATTERN
CYCLE USERS BEING LOWERTW4 PUC TRANSPORT LSri i&s awi As5I.o THAT OF
TOTAL R5IC1 FR(94 INCOME GROLP BE-
- - - - - - AYE.RjC,E -LW 5W MAY NOT BE P0B4ECYI1E -' COMPLETELY, SO 9YOT THE CILERS-
Q4 F4 iWOW CJ' BELOW
'SH&S BEEN CEYI1EO
0
R AGE
70-CYCLE USERS 1551
I, ACXTPTEO MODAL
I CYCLE
8
INODW CZP
CHANGE IN MODAL SPLIT 1981 - 2001
£
We MMAL 5R.tT
AL SKIT
3LL;
-s ADDED TO P'LIC
Q TO
zz
4! USERS -

(07
LIGHT RAIL TRANSIT MAN CHARACTERISTICS OF L R TI I-I1RY CAPIRYM CAPATJTV 2QEXXI (LS
3 FUEL SQPCE CTREJTY TRACTION
2MMiA 5 80
4 F1.EYJJTY FIXED ROUTE
S ElNIAC MCTSAIR REkIUDcIN NON POLLUTANT
OSE LEVI— AUN"-t-JG NOISE
LIGHT RAIL TRANSIT IN VARIOJS POSITIONS
LR.T—Tq ACA IN STREET ROADWAY
H _ _'111 ri n
SUITAB I LITY OF LIGHT RAiL TRANSIT FOR DELHI
METRO4UTIAN SELF CTAN- I
CPCITH PENT POLICY
SEA5E IN
INCREASE IN
MJ OF TRIPS
TR IP LE13TH
L R I —IJJTO
rl -----a,
-'
NEED OF EFF'C. NMSE WOOF
lENT MASS TRT
TRIPS AND TRI
SYSTEM
LE3TI1
1.
Lcw CAPA(: ry ,cECl,JM CAPACITY I I1GH CAPACITY
- RECA J5 - 5T(J. CAASI1OAM .APV RU IP.AP,91
M -Po ais A UGJ-C! RAI. AND RtAI. RAIL- u'5 C.APCtrr tRAp11 •.L.4€ C.ApCIrr
- % :4E CAPACiTY •- pçj1= Ppsc^61w
I R I - AERIAL
1IL
__1 tlJT[[E5OIPCE AND-i L P T - SUBWAY I
TECHNICAL
• ll__.i -
DELAY IN MPL-
IJ111ED CAPA- EWENTAT ION
-ClTY
FTHER NC-
PEASE IN IRA-
WEED -FFIC FEMS
-HER CAPACITY I
MOOE
NEED OF
APUCA1ON•1
L P t -TRACK SEPARATED L. RI - k4ED 802.NOT FEASIBLE
s or
LJMINTIISE
FOR HIGH CAP)C -- •- - •- j I -. ........
IIS
Social

0
0
aa
J;'r ]Dfl1V S''± C.'t(' i.rtid i 1 titr .;or. To rr cjr
.,r p1 y 1fl ge i i. on VC it, j /r1ny. Tnlil 'iti1i rm f' fttcrict
T v '? t 1ftr Plan for •. ._ -c'cit.a s'cnly of 50 g/c/d. for domestic, irtriustrL'-'tib].ic '? s'rnt -cub-'ic ties hoevor it wn "o'nd t
p't r ita 60 g//d. woulrl be an ideal goal. Oi the0 r tii st i 1 r4, the ter r 1 irct1e1t o' Urban Drlht
ii 1T1 for a o'ojct d ooiLtifl o mi'.1. Ion s ost1-
to b' 2cc) 'nctd.
'-e Th1 hi Trhai a 0 t -' b3si o' t.000graoh. wsy j'1 to f'j'r orts n old a'YI n )elhL, W -t Drtl h, South
i , nr' 1 rt Pe l hi 3bhv'a i mor or Lo eqith].t -tr L 1Tlti oo s vt'i d tn c' iMVc.I dtTlrt'?62-el as given beet'
Zone
Old & New Delhi
4eS tSouthNorth WestShandaia
250.00
The orogramrflet for augmenttiofl of water supply
.is divided into to phases j•e, in first phase augmentationof 112.5 rtgd through th sources; Tubewells in Sonepat-70
cusec, Tuhewells in South Delhi - 15 cusec, Tubewell inu.P. - 20 cusec & In second phase augmentation was reconatinded
thrugh Lo'ni Tulr:.':-ill-2 9 :, [1CY..IrCE. -200 cuc,
P.rnaanga-30 cusecAbout 20 acres of additional lend wis earmarked for It
of Chandrawal purific.bion ulant and about 40 acr
was reserv d for the Wazira:'ad headworks. The land requirerfler
for Shandara pumping station and reservior .....suI::Tco 9 t
ir+fromrrsjc]entjl areas 2fl1
t
IaaaaS
S
a
a
S
S
a
S
0
a
a
Total
Pcpult.i ti
(in million.1.701.45
0.65
0.40
0.80
500
nantity (In od)
85.072 .o
32.--()
20.00
40.00
a
S

S
Existing Water Supply.The overall treated water supply in theyear 1981-82 for
Delhi is 303 mgd i.e. about 53 g/c/d. The sources of 303 rngdsupply are; River Yamuna at Waziraad, 80 mgd, River Yarnuna
at Chandrawal-90 mgd, River Yamuna at Okhla - 6rngd, WesternYamuna Canal at Haiderpur-100 mgd, Renriy Wells 8 nos.-20 mgdTubewells 70 nos,... 7 rngdThe actual availability of water supply
Leaago & per capita per day is less than 53 g/c/d gallons because oflosses. i t1 water is also not uniformly .. dributed throughout the city.
A large section of population living in resettlement colonies,colonies regularises after 1977 (Unauthorised colonies), urbanvillages and new hosing development at peri phery have a
C
lim1tedaees to treated water supply.River Yamuna .i.s main source of water suuply. The e:iting
water supply from Yarn.ma for Delhi at Tajewala and betweenTejawala & Okhla is as follows'
(1) At Tajewala(HaiderpUr Plant) 0.026 maf
(ii) Between Tajewala & Okhl3(a) At Wazirabad 0.251 rnaf
(b) at Okhla 0.009 rnaf
(c) CPWD Water Supply 0.24 ma
0.284 rnaf
Pressuring that the supply would be available atintake works at Okhla, Wazirabad, Chandrawal & Haiderp.ii:& plant under construction at Shandara the total avai1a:ilitywould he:(j) Eom western Yamuna Canal 0.036 maf
(ii) From Bhakara 0,20 maE
(iii) Ram Ganga 0.146 ma-,_(iv) prom Ymuna 0.26 maf
0.642 rr's 1:
water Supply for the year 2001
In view of the typical character of City of Delhi, therequirement of water for the year 2001 has been worknd out en
thu iais of Ph q/:/d ftP . the br ' uk as. \f1lQws:
0
0
S
0
S
SS
S
SS
S
SS
S
S

110
K
Due to non-availability of sufficient quantity of water
(in Delhi, the standarof 80 g/c/d could be taken up as theultimate standartbe attained in phases, whereas the immediate
objective would be to make treated water available to all at
least at the rate of 35 gallons per capita per day.
The requirement of 1024 mgd water supply has been estimated
by the year 2001. To provide additional water supply of 671 rngd.
The existing water treatment plants would require augmentation
and th construction of a new treatment plant In North West ofcanacity 300 magd.

--I
SEWERAGE -
Sewerage facility, prior to preparation ofMFD-62 plan were available in £ragmenteà way. Thefirst regular sewerage treatment plant in Delhi wasset up at Okhla in 1 938 with caPacity o f 18 ig. Allthe trunk sewers in New Delhi Area were c•nnecteà toOkhla Treatment Plant by puaing the sewerage acrossthe high ridge. Besides this Karol Bach anS Ani.ha Mugalarea has a-Ise ta pump their se erae across the riSeinto the trunk sewer in New Delhi. The colonies in SouthNorth & West Delhi, Shahiara haal no sewerage facilities atall. Civil lines area was served by coronation plant.
SWLRAG TR•TMNT PLANTS EF0RO TH2PRLPARATION OF ASTR PLAN.
L.cati.n Primary Only Tat1& Priiari
SecsnSr'y
1. Qkkila 24 MCD 42 MCD 86 NOD
2. Coronation 10 MCD 10 MCD 20 MOD
3. Kesh.ur 12 MCD - 12 MCD
Total 46 MC.) 22 MCD 68 MCD
Policy if MPJJ-62
In MPD-62 a cø.epreherisive sewerage plan with fourself contained effectively serveS blocks for urban Delhiupt. year 1981 was pr..seS. The treataent plants wersuggestS to carry a laaS by 200 igi. if sewage an the basisof 40 g/c/S (i.e. 80% of water su p 1y) for a pi!ulati•n f
mi l Jj(Jin

S
S
Prrsme ut. 19-S1.No. Bl.ck Pip. (in Cap
rilli.n).
1. South Delhi 2.176
2. North Delhi 0.751 30-1,3. West Delhi 1.273
4. Shaháara 0.80
5.00 200.L
The plan further laid. own the ir!rsvement as weLthe augmentation programmes in thn trunk seweragewith a view to create hlthv, clear 2nd safe 17vie nv irs nze r
ix!stin
The existing ccity te sewere tretie.em.plant is crossly ina.eq—uate with a capacity if abut '1
(in year 1981-81), wit], the details as; Okhla 66Cr.nati.n plant 20 mC4, Kesn.pur 32 ig, B , sides thabout 12 m. if sestic sewerage is treatment thr.u.•riati.n ponds, ani to lttle extent through iniviGsepti:
the resettlement colonies, c.l.nis regularised after 1squatter settlements, urban villas trans yaRuna artogether cover about 40 lakh if population if
SiWLRAGE TRiATMNT CAPACITY FOR YEAR 20C
Based in the studies conducted by PPW in respectif existing sewerage system, the following issues have beenidentified for consideration:
. . . -.31—.3/-
C]
II1
S
S

I.
S
S
S
SSSSSSSS
S
S
•• _1 •
(1) Staniar: 80 all.n/capit/1ay has beelr.p.seà for water supply an
therefore sewerage system isto be worked. out based on 65g/c/ó of sewerage (80% of watersupply.
To t)r.vile 100% population inDelhi with inivi4iu21 sanitationby 2001, the sewerage systemrequires upgrading b y about 6tires. Further the treatmentof increasing industrial wasteneeàs iaeIiate attention.
With a view to maintain equityin prvisien of infrastructure,the rquirement of E.W.S. areasuch a. resettlakt colonies,colonies regu12rise by aáw.(unauthriseI- c.lonis), urbanvillag's, needpriority. Asan iae.iate measure low costs2-nita ion system couI4 be tknurp f ear .-ne tar,veent in vIren!!nt.
A ccnsiaerable amount .1pollu-tion could be controlledthr,ucprvióng regular sewerage systin all areas as well as by tre2t-ing tie waste prooiuced by thein.ustries before discharging itinto river yamuna. The feasibi-lity of ieep shalt aeration pro-cess for treating the waste entr-ing into river yauna through •pnárains, as recommended by c.ntrpollution beard, needs to beaMifle.
To take care of sewerage of urban Delhi by year 20the augmentation in the capacity of existing sewerage tre4went plants, as well as construction of new sewerage p1ant
one in North Delhi and.the-Capacity have been suggeste
(ii) Magnitude ofupraing
(iii) cauity in oruvisioriof sewrage systeu
(iv) Pollution centrel;

1;141
Sewerage treat- Existing Rectumenievi Rec.mveniemnt plant capacity capacity in capacity in
in Mgá. ago. 1 985 R. 20011981 -
Okhla 66 128 150
Kesh.pur 32 70 170
Coronation 20 20 20
Rithala - 75 150
Shahiara - 60 160
New plant in North - - 125Delhi.
New plant in West - 125Delhi.
Total 118 353 900

-11
I' 1 r L i. -, 1 v j , n D T. 1 P .: , n 1 7 In n -
n H.n'.y b D:Ihi r lcric 1 -u'nn.y undcrkikinq unrr Ln
:on L . rr,J of MCD. Th2 sources f no'.mr worn both thrnunh
1'.(bfl iri]ri . or fl' w q11 -'. Frain 1—her'-irc
Tp-:I 1 ric- l y irr1.r-1r'.1 nrjiJ r, 1-17-'--
. e ii nojor .-, tnri, 1:br n--'- I 1i-'n T r - ij- 1 (
fl I . n1 111 11.0. on ThI n'.j,,in;it'
- ''-j!l in 1 C. 1 -. 1,07n
r' P F'' '.. 1 1 • ' ' '-
r_I • in C o r Hit'. 1fl ).:;L:'__
I i-or for I ll , 'nt,'r rrinhlirimonI. for un1n''
!)c1Hi 1rr -i rin'' vi-; T_61 "Prn Work
'r '. dflfl 117 1 tntil.i_fl', )iY
V'7 p i 1 1 Il . hp -h -'- no '.1 , liihtip-
in ".''.i; r'Cj''' ' n lt;iHI.''.
1 I 1- n ni
17 A '. -
,, Ir•i, , .., . ., ',
or y-r 5.39 1 Ih 1..9.
I' . 1t'n r?tJir r rn Jn H Cry -Hi H u' -H
'' j' C i-i r Lu - i n ri • n 1 0 61_ fl 1, 1*'
[)/1 -''7-! t 171'OrlflflO qi -in-,'r -' -; • i --
1 7 * fl 1 --'-h I'J jii 17 , • 1fl, 1-:h VU in 1 fl'i
nn','r
-- •l--r.1 .1. 1 IJ• .............. -. :', . I'

j5
-1.' yr-Irn notjnr
0.4n 1 • 1.00 1.20up1y rrnrn
2,Th2rn;li 1 1.,jr1.5 fi 1.flfl 6fl 3.9rrnm nror--jr1 ()fl
r--
?(1 TEH1 I1lU\TION
Power in nnerf ? DE'' mnnt )y by if-.!-1nr3r•Rffln In rlrijton Lnhnrj tn'
47i nn cnnrj j:' in now-'r nrjrnt jp fl ji I
II h Fu in in 1.1r1 rirjty of 33A,3 i11J
(H nrnj y oF 3fl 5 I U h! F rm nncity of 176.(1 n';
Tlir pouJr rIOIflri p rI For hi ih 00c 4 lqOO, w ris 563.76 riia3H1 0. II npij?l 7 • flfl IJ no';rr. ThorForo 0I1
l:n TLFC'n, 't1)f[ 1LJ nr mr fr n n ri:1rr(II- Tr--
'r U'r ih n:nr in l)'(jn ',urch-ij from flhH L
.jhnm Rtl ym k>u<, RXXNX conr.ict ',-i.' tormin in 1/-r 17l.rmr, Ir Jpj 219J.
I ih i ( °TtJ) Im
Li J "500 Nnn I ittn, De [hi m-?y bo hle to orirj only a,1.ifllpnjty Lj i1 nx.Lnjnq pow r qnnr tiori, b'cur3o o f inc
'jr no I u jnp r-ircity of wntnr •n 'I proh i nj -1 c co,
:inn. It wcud havo> to b-nh Unon nournon of' upr
From ' . )Iii, Up ) o 1fl1, r r' '1 1r
li o !.ipjjp.1 th ii) -
1) F

7m
Firm Capacity1982-83 1989-90(Mw) (Mw)
4P
I,
&
or&
II)II
f)
d
_tl
J.
L'SU Local Generation 176 236Badarpur Thermal Power Station 500 500Singrauli Super Thermal Power Station(MP) 15 150Raira Suil (u.P) 17 45New Super Thermal Power Station to beprovided in Murad Nagar (U. r)) .. 500
Total 708 1431
Source of power for Delhi beyond 1991 are to be identifiedcommensurate with theprojected power demand. Delhi could get
benefits from the following centre sector schemes presentlyundertaking construction consderat1on:
PowerPlant Installed Capacity Statusin MW
Rihand U.P. (thermal)
N:irora tJ.P(Nucjear) 470 -dc -Nothpa Jhankarj (H.p) cleared by CJ (prop-
sed to be taken unJointly by Haryan
Himch Pradoh &Central GovtF.
Duihasti (Jiycro Electric) (d!}) 390Un flvdro-Electric Prcjcct (J ....) 0 -• -Chimera Hy :: ro_Electnjc Prcjcct(lr.I') 540 -dc-i:r-:l-rur h dro_1 p c-j- V .P) 120 -do-
Total 3,000 Ir,i
To meet th targeti:ecl demand of 25.000 MW by the year
2001, the power dthtrithjtjon network would be reauired to H-'then ver to 400 kilo vats (k.v.) grid from existing 220 VTh cater to this, a power network has been worked out providinothree major 400 1KV electric sub station in the North of Waz1rah.Hirroe in trans-yamuna area (ii) near Bawana in West Delhi an
iii) near Barthal in South West Delhi. This would be fed from
H'e Norther Grid and further power distribution S'ctnm in Delhi.d bc fr-ni;i t: inn- rH . nn
1000
Under constructi0 fl

20
1 3
Health facilities is an indicator of qualityof life in a settlement. Health facilities ricto the first Master Plan or F0711A can brief ihe described as followin g :-
(i) Delhi was having only five general/publichospitals an:3hreo soeciol has.i-.a1s ofT.B. & Infectious 'iseases.
(ii) The entire ':astern part of Deli ws nccovered by any public hospital except aprivate hospi : 1 c c :l) inRajind:r Nagar,
(iii) Even at th2 ti ................. 1 j iie ce:rci.health faciliior of all t^pes were mostlycovered in res10rntinl buildings in differentparts of the city.
(iv) There was concentration of health facilitisat a particular part of the cit y . The hoitcisexisting nearer to the thickly populated areaswere mostly over loadedIn absolute terms Delhi \'i:: too far behind
in providing sufficient health faci.lit:es tothe then existing population.
II. POLICY OF MASTER FL'N-62.In Nast,-?r Plan for Delhi-.l2, health facilities
were recommended at two level General Hospitalof 500 beds for every 1.25 lakh population toprovide health facilities of higher order at city
level andprimary health centre with 15 beds for
22-25 thousand population to provide immediate
health care at neighbourhood level. Based on
these recommendations 20 additional hospital
sites in different planr.!ng division were sugested:
Division
Hospitalexistingprior toIt PD 62
HospitalsitesproposedinMPD - 62
A B C D II F
G I! Total
In the year 1981-82, for Delhi Urban Populationof 54.54 la}th, 14543 beds were available out of
these hospitals beds 13163 were available in 63

1. I
hospital, 1053 in 89 Nursing Homes, 247 in 149
maternity & Child welfare centres and 80 beds in
8 primary health centres The ratio of hospital
beds available to Delhi population has decreased
from 2.83 beds per thousand population in the
year 1971 to 2.64 beds per thousand population.
I'(r nct':c.politan city of Delhi the Government
of IncJia has suggested a norm of 5 beds per 10CC
< i 1Jatiri . The nri standard has been incorporated
in liE stor Plan for De1PI (as prop sed to be modified).
Keeping In vi-w of past a experience and need ic
of smaller hospital a six tier system has beenproposed as given below-
N:.. of beds No. of unit1.Genoral Hospital 500 1 for 3 lath pop.
2.Intermediate 200 1 for 1 lakh pop.Hospital 'A'
3.Intermediate HospitalF3 80 1 for 1 lakh pop.4. Poly clinic - I frv I R
5. Nursing Home, ChildWelfare & Maternity Centre
i.nrrv
The r'qu,'::o of vari.:.ws typsof health facilities
to be provided in different planning divisions accordinto proposed ratio of 5.06 b1000 pop is indicated
in the table given be1w:Health A B C D 0
faciliti'-
1 .General
11ate Fiaspit(A) 200 bedE
3. Inter dint•-Hospit :.J. ()80 beds
4.Nursing Homo - 2b
.flthpénsary - - 1 - 10 2 8 7 2
A. a-'._.• a. S • l .&'jJ I
1 for 0.5 lakh poi..
1 17r 0, 1" !a Ph

HOSPITALS BEDS:
Out of exising 14543 hospital beds,
contribution of allopathic hospital is max
i.e. 14032 (96.48%) followed by Al1opthic ho.
)xccu Ayurvedic Hospital 215 (1.48%) AyurvediHospital 100 (0.69%) Homeophatic Hospital 100 (0,6:,
Ayurvedic Unani 96(0.66%)
Number of agencies are responsible for providinghealth facilities in Delhi. The contribution of
hospital beds by different agencies is as MCD 3462
beds, Central Govt. - 001 Delhi Admn. 2439 beds,
v m luntary organisaion 2264 beds, statutory bodies
1543 beds private bodies 1053 beds, Railways- 380
beds NDMC - 171 becs; cantonment boa - 30 beds.
Based on number of beds in various hospital,the existing hospital have been categoriesed infour groups; hospital witho.80 buds, 80-200 beds,
201-500 beds, 501 & aJove beds. The numberof
hosoital located in v rious planning divisions isas follows
3
2 2
2
Categoryof hospital
0-80
81-200
201-500
501 & above
C 2)
7 8
2 3
1 2
3 3
E F C Total
1 45 1 33
- 1- - 10
1 21 - 10
1 2 -
Availabilit y ofHospital bed:
Number ofbeds
Beds per lT)UflPopulat
AVAILABILITY OF HOSPLAL BEDS IN PLANNING DIVISIONS.
There exists geographical imbalance with regard
to availability of hospital beds within various
planning divisions. In planning division C & D the:r:
is an excess of beds as compared to other division.,The maximum deficiency in availability of beds per
thousand popu1&l'n is in Division E followed L:
Divisions G & H.
H -. H
320 244 22
223 114 (' C 50 07

F_*
0
0
0
0
Education uoto Sec'odary Lev'l
Educationis the basic primarr requirement of the communityand a powerful tool for social transformtion, economic growth,modernisation and national integration. According to Govt,policy eduction uoto age of 14 years should be providedfree and compulsory. The responsibility for providingeducation in Delhi is shar d by Delhi Administrati..n, CentralGovt., vol n ary organisation.
Prior to Master Plan-62, the schools were evwitydistributed d there was shortage of school. There wasinidequat2 area for schools, on an average area 0.27 acre/1000 poputatin as available for these schools.
tIPD .-62 Policy & jproposals
Taking De1i Administration policy to provide educationcompulsory from grade I to VIII, strategy of the populationand variouseconomic limitetions,into considerition MPD-62
h's recommended; 1 higher secondory school, 3 primory nchools,10 nursery schools for 15,000 ponu1tior.
Existing Situ-ition
In Delhi, presently the p re p'imr': ecucnti-n is provided
through 561 school' whbh re run by loc-'l Agenciespriv-te sector on cornrnerctl bnsis out of 561 schools, 8.737re exciusi o nursery schools, 90,93, Nursery schools s
p'rt of primr r schools, 10347 nurerv 's prt of them t dd:Ie or second ry schools.I her2 .'iete 1 3?5 orimnry schools, 279 middle schools, 167
secord ry schools .. 452 senior secondry schools for providingeducotion upto secondnry schools. On on overrge 50 prschools re incre.sing per ye-r for
increose of bout 2 lkh populationSurvey conducted in PPW reve-ls thn
() On nn averge there rre3.48 schools per 15 9 000 populntAlmost all the schools were running in residentialbuildings/plots by private -people.
I.P.
A
/(il) On n verge 3.28 schools for whic
re exis:
division'
(iii)On an ••u uj
existing for 15,000 populotie
obout 2.21 sites

U pto tie year99
330
226IS
As
tJto 2001
1060
725
143
1 . Prirnar', Schools2. Sr. Secondary Schools3, Integrated Schools
- -.-_- -122-
PDP -2001 Policy,-
To provide adequate educational faclitties norms have beenwork4d out. The comparison between MPD-62 and PDP-2001norms is as below:
School facilities for 15,000 population.
M PD -62
Area2-10 acres6-16 acres
5-12 acres
PD P-2001
Nos, Area6 0.3 to3 0.48 H
1.2 Ha2 3.2 Ha
Nos.
Pre-primary school 10
Primary school 4
Secondary School 1
One integrated sch-01 for 90,000 to 130000 population withan area for 2.2 to 2.6 Ha has b zn proposed in PDP-2001.
On the basis of above standard requirement of educationalfaciljtj .-s has boen worked out.
The additional req ire:aent of sc ools for the year 1990ond up-to 2001 is ns follows
Technic .1 iduct n
The higher edocntbon in Delhi is provided throughnumber of universities deemed to be universities, institutionsPrior to MPD-62, there were four locations where most of thenolleges and research institutions were concentrated:;
1. University of Delhi with on area of 153,7 Ha; 2.Institute with an ar'a 526 ha; 3. AIMS with an aren
61 Ha, 4, Jamia iliulia with an area 48.5 Ha.
The availability of higher educ-tion in De hi w-s r:ctsatisfactory at the time as ag inni the reqvirement of Ohcolleg s only 21 worn exinPliciea of MPD-62
The IPD-62 pro posed the provision o.'Hfcilitfes through (ij colleges (ii) Univeri- ' cer:trs(iii) other hi gher education facilities..
One college for every 1.5 lakh pooiotion, on
.niversity centre for four to five colleges with an arof 12 to 16 Ho. -

FöDistribution of colleges and UniversityCentres by Planning Divisions:
Division
Colleges Jniversi-tv centresExisting Proposed Total Existing Proposed Totl
A 2 - 2 - -B 2 3 5 - -
• C 12 1 13 1 - I• D 9 2 11 - I I
E - 4 4 - 2 2F 1 4 5 - 1 1
• G - 5 5 - I I• H - 3 3 - 1 1
The MPD-62 proposed a new engineerin g college in South Delhi,also expansion of Pusa Institute and Jamia Millia was suggested.Existing Situntion
The age group of 17-22 veers .s considered to be enrolmentfor highe education. The soda economic surirey conducted byPR!, re\eals thths ge grou p constituted nbout 10.66 11 of thetotal pOD1atofl. The overall enrolrn-n.t for hi gher ducatjoduring J.st decade i fl dicates that the trend is decreasingfrom the ve-ir 1978-7 9 onwerd.
In yer 1Q80-81, higher eductic'r fncili f ies .ihich werem'll1 n b1 to Delhi population is as follows:
((Of totalios. Enrolment enromerit
1 • U Jversity 5 19556 22.842. InstU-utes for 3 521t 4.10Research & Higher
Educ-tion3. Colleges 76 6283 73.06
The distribution of Co eges in different parts cityShows a geogr-iphical i. imbalance as mos of the collegesare concntreted i- Plan-ing Div1sir D,E&C. The deficiancyexists in Div. G,
Divis Lou 'Q of colleges Population percolleges Lakhs)
MrA 2.07U I 89
0
0
0
0
•
0
0
S
0
•
•
SS•
•
•
•

Populatin rer co1ler
C 15 'Jo
D
7 0
E 3F 1/+ 0.
G 3
2.
II 1 5.
S
S
)•
S
S
The review Of existt colleges indicates that the
stndnrds proposed in the Master Pln fo Delhi-62 t for colleges
have not been irnpleme ted. Out of pr000sed sites for different
V64 r-
dilsions. One site in div 'C' sites in d! ,/ 'E', four sites
in Div. 'G' and one site in Div. ' are lying vacant.
The Master Plan did not Propose land for cenrtres of higher
educati on offering job orierted. courses ,like computer journalismfP1 c4 ôvmanagement etc. survey institute is running on commercial basis
for every 8000 population. '/1th the changing technologies,
emerging new disciplines of specialisatiO1 nd areas of krowledg
relevant to national developme nt objective s suitable locati0fl3
for there objective s are
I.. PDP-2001, Norms & Standards
Depending : r higher educqOfl facilities bas0
on the &perience of the past two decades. The following rcrrn:5
for hUTher d'.icetIOn facilities hae hen sugsted.
DUA-81
1 for Ilkh opuJatiofl
strength of the college 1 0: tuint-
Area per college .00 HP
Within Urban Extension
I for 1.00 lalch popuatPr
Strength of the college — I
Area for co l 1ege — /4.C fl 10
University CamDuS within DUA-8
1 wach in Plnniflg Di'L'lsion E 0
I in the urbnr re
I:w university
1 in the urban xtnsic
LC 11-
a Technical EducatY.
1215'
One Industrial Trnining Institute 2nd one polytechnic
Strength of ITI 400 trainees
Strength of polytechnic 500 students.3 Area per centre 4.00 H-
Area for ITI 1.60 H
Area for Polytchnic 2.40 ft
-I
(b) Tchri C21 Education Cent(B)1 provided for 10 lakh popuition to include
I ITI, 1 Technic,,-, Centre rid 1 coching Cntr
Area fer centre /.00 fl
Ar for Technic Centre 2.10 H
Area for ITI 1.60 ft
Arei'for coaching, C fl
Centre
Professional Edijcat
() Nw Engineering Coiie:e
2 nos to be provided In uro'n xtenston
Strength of the collec Te 1'00 to 1700 rtu:1.3
Area per college T0 ft
b) New Nedic21 colleg
2 sites of 15 ha ec u: teS1'
space for spec111sed gener ' l hospital.
The adjitional facilities for higher education which
would requird upto the year 2001 have been worke out
an on, vn here.
- I
H
H'

Ii1\
1 MORE THAN 50 G;cjo
flN43 AYt.IU.I3LE
---;: ,) :T/
0Ir-.- -
EXISUNG PRO$ED
1._. [II] [El] WATER TREATMENT LANT55- 1•
iiiI LI] WATER RESERVOIERS
OVER HEAD TANKS5---
'S . •1 RAINY WELLS
BOOSTER PUMPING SINS
WATER MAINS
Xx] MCC20MGD £Xr1ING CAPACITY00 MOOo MGI] ooso Ox-PACifY
0 M:
1Lc1
wl
WATER SUPPLYP-CED NS 1S1E
OF CAPACITY 300 MGD IN WEST DELHI ANO
ANOTHER OF CAPACITY 200 MOD IN S-tAJ-I0AJA
2
j•_.,-- \ -
NARE LA __ ;•--
-- 300 MG
N. (j) \ (- NEW PLANT NORTH WEST
DELHI ALONO WITH WESTERN N/ YAM&JNA CAL
^Di- -_(-
I150 MCI Mo MGO-/ 100MG id moo -: ._- HOC
IAZIRAAAD
I)
-
\
/
/AVAILABILITY OF MJNICIPAL WATER SUPPLY
i_
V
/ -
/ —S.- •_1
/.-i --- --7 /
OUTH
•1I-
\9
*HA
p/ -----------
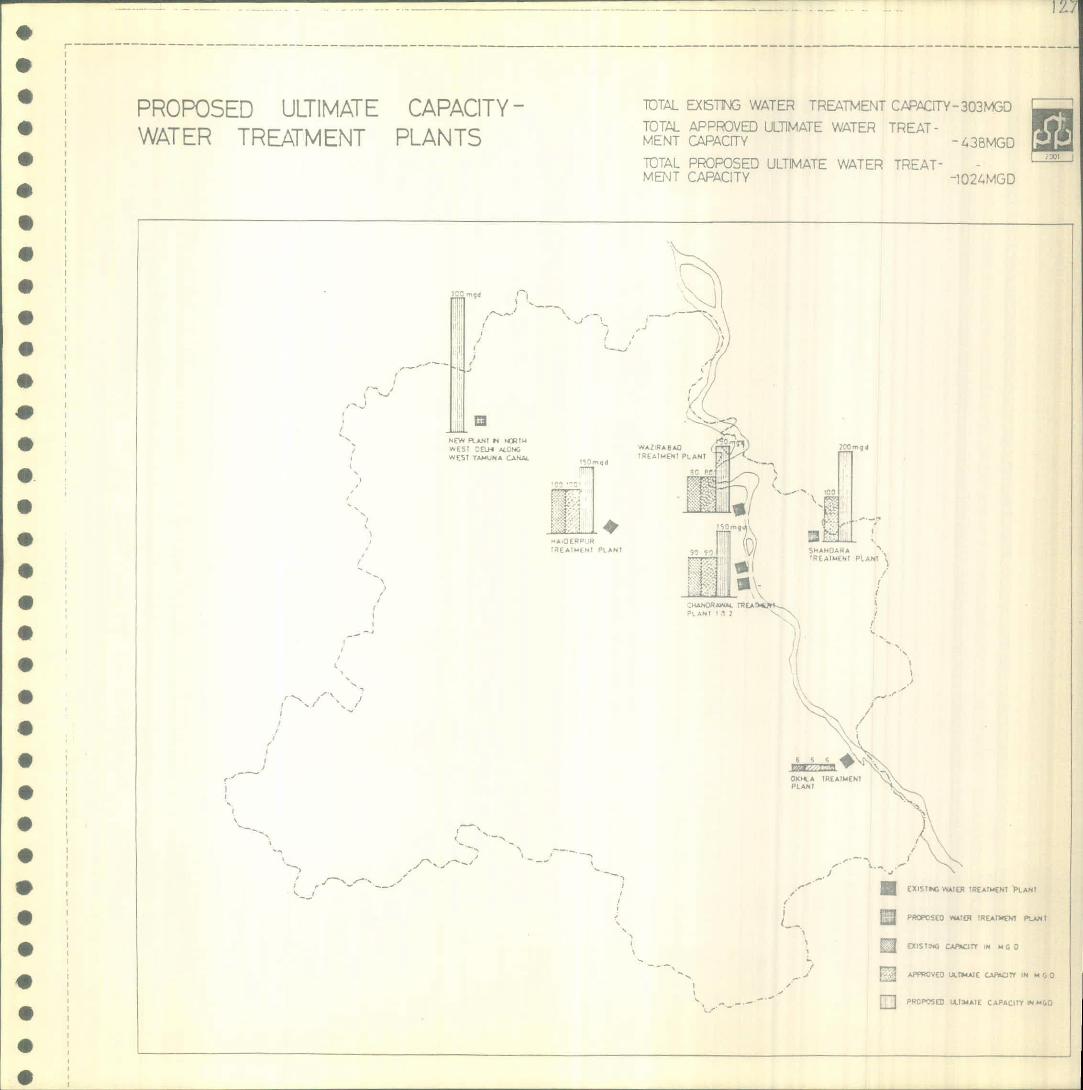
- - ------------------ ---------—------———----1
PROPOSED ULTIMATE CAPACITY -WATER TREATMENT PLANTS
TOTAL EXI5TThG WATER TREATMENT CAPCiTY-303MGD I
TOTAL APPROVED ULTIMATE WATER TREAT-MENT CAPACITY -43MGO
TOTAL PROPOSED ULTIMATE WATER TREAT- -MENT CAPACITY -1024MGD
fl\gd
j_I..-.----\
I I S -
\
C--
IIN rW Pt. A.NT IN HM 14W5 Li-I MC4G WAtR*.LQ (W1 YAM IJNA CANAL lREM.ENC PH1
-wlIC -
T °IAHC Vi AhIhi..
kCICT PLANT
:H.RNN.
I 1.
J =
1• OICItA IREAIMENTPLANT
55
—_; - J_
j_ ,.• ,. S - —.
C a CXTSTIG AMER TREArl. N1 PLAN!
PROPOSED %lEl REAThIfl PLAN I
ECSTNG CAOTY CM
IPROPOSED (LT'ATE CPACT'r NM(,O

I
--.
\ -.
( NARELA
1
\ I •/I\)
-.
'.7NORT
) /
\
lo0:€:\cr!
Ri'f/I
I T HALA
,' \
S
/_
/-
- 25D
-
-
W CELD
NAJAFGAJQm
;-.v \I4 'w -I L I-/.., I_•'...i
63 ,1. SO MOO
c- .----
4'W OELh,
SHAJ-IDARA
- \-i- s'., •'I0MGO
. / --- 661.100
SOUTH
OL H
AVAILABILITY CF SEWERAGE11 Is_ p..-.'.
I
),
.-EING PROPOSED
SEWAGE TREATMENT p-
i. EJ SEWER MAINS
LI] PUMPING STATIONS
SEPTIC TANKS
2 [ 7A OXIDATION PONDS
RISING MAIN
GRA' trY DUCT
ISO UIQ200 G0
')0 .iGO E.xIS1G C'lcTY
50 ::
4 I._E
-l
--
AVILAELC
1E
SEWERAGE PROPOSED FOUR NEW TREATMENT PLANTSS FALLOWS-
1 NORTH DELHI 125 MGO
Z PITHALA 150 MGD
3 WEST DELHI 125 MGD
1O Mi5E

r - - - 19--------------- --------- ------- - ---------------- --- - ------------
PROPOSED ULTIMATE CAPACITYSEWAGE TREATMENT PLANTS
TOTAL EYISTING SEWAGE EATE-1 CAPACITY-11BMC
TOTAL APPROVED ULTIMATE SEWAGE TREAT-MENT CAPACITY - 350M0-O
TOTAL PROPOSED ULTIMATE SEWAGE TREAT- —a--- -
ME'4T OTPACITY - Ey::oMC,D
ESoPLlJE! PIAN -
WEST DELHI
/ -S•\ I 1RMEIIT PtA.i ,
I,ri
- I
rIREA3MENT plANT
LEGEN -(S
y:'. ;:• ./_'/
poPED I" ', •k
_j!EX5TI CAP
- _-_ -•--'Ti
AppE),TrJ n2C V
IN p.i:
PPOPcr LL'i
I---'
i-- - - -'
/ /:.'-..
/S•S.._.)

2POWERJJ f11fl FOR I81
2 E5ENT PEQUIRENNT
fl ciEfl PT:2U'Er;r
650 Mw
MW
S
S
S
SSS
1
r'
/ PL( /
Ft
, I
I '-•• -
\
__\ •1
F
IF-
/
/
c
1'S
-I
/
RA.DARPLIR
E,XI5TjG PRPOSEO
LIII [DI] 600 KV SUB STATION
LSJ Ll] 220KV SUB 57TI0N
[jj]66 KV SUB STATION
[] 33 K SUB STATION
L0 RV LINES
EE1 220 Ky LINES
66 KY LINES
VN'O
INSTAL..
00 M
MW FIRM CACT
S
SS
S
S
SS
L'o

4)HEALTH FACILITIES
)S
I AVAILABILITY C HOSPITAL BEDS IN DIFFERENTPLANNING DIVIONS
[Jrv!5OI, (I - A N 5 YAMUN A A :''sorVST OP r- AND DIVISION - NOi-.i- WEL1
A IIGHLY DEFICIENT IN T
NLMBEP O -OSPITAL E[
AGENY AND SYSTEM W5E DISTRIBUTION OFHOSPITAL BEDS
1000
eOO.3
L 1: 14-EXCESS 01 BEDS
•• STANOA OFW-0 -1967
cc
0 co
IA I B I C I Ll I EIPLANNING DIVISIONS (AREAI
1000 IC. -:
I I 4?- MUNICIPAL CORPORATION DELHi
3C01 •- CENTRAL GOVERNMENT
139i DELHI ADMINISTRATION
IVOLUNTARY ORGANISATI
I—'!
510-m STATUTARY BODIES
--- —iIO* PRIVATE GANI5ATIC:uj
I IRAILWAYS
C --77I- NEW DELHI MUN&
O 1 --- - ---3r- C/NTCNF i -Z
V
_OATICN OF HO
:O5HTL
I-'• 'S \
soE STING PROJECTED
I 7ç')çfL9
70
5\A>
!
HOSPITAL BEDS
0 8 1 — 200 1971 1976 1^81
5---,
Cl) N -
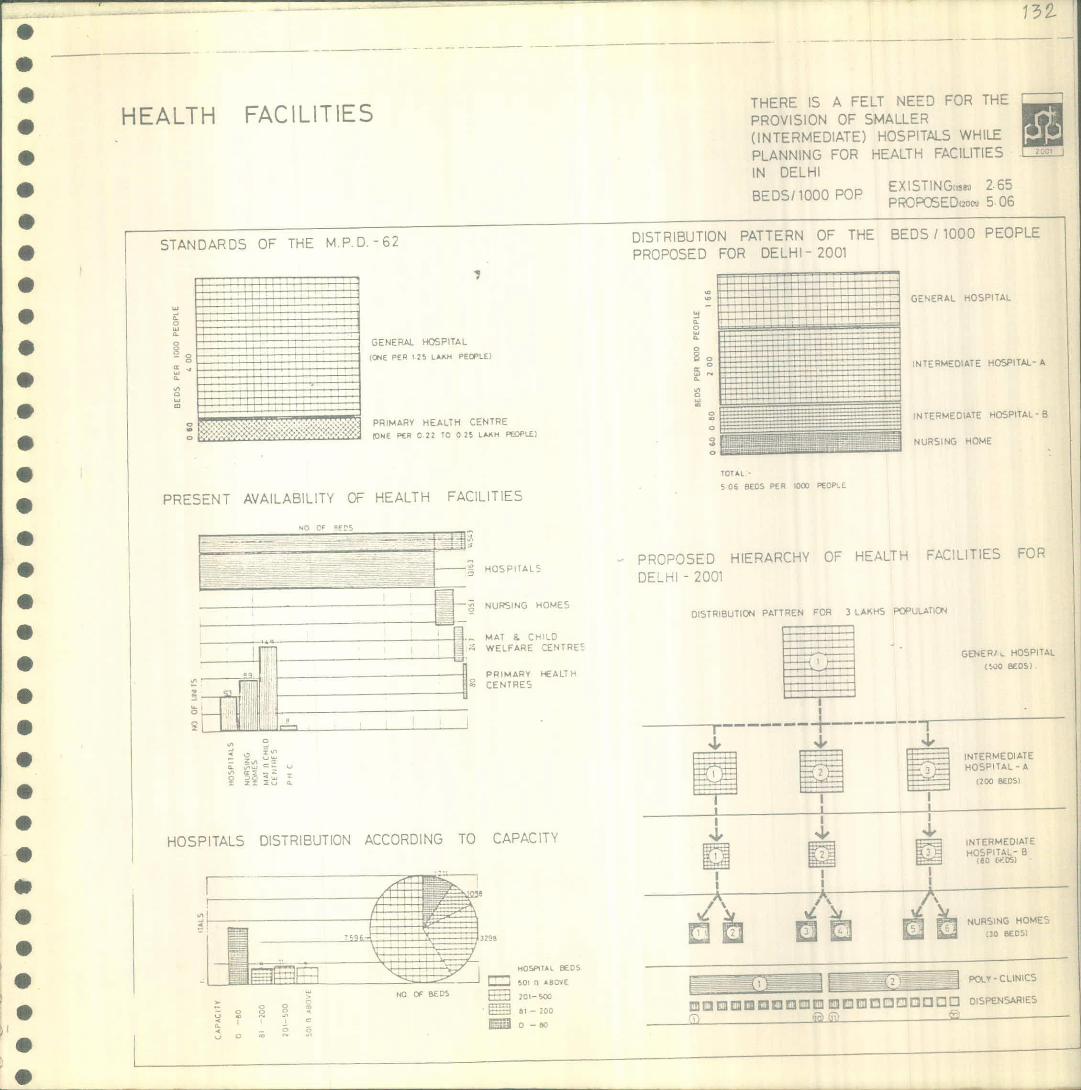
GENERAL HOSPITAL
(ONE PER 125 LAIcN PEOPLE)
PRIMARY HEALTH CENTREONE PER 022 10 0 25 LAIUIPEOPLE)
*0
a-08.
0
C
8.
CUi
0
0
0
I"
0uJ
CD
GELLAL
LECATE HOSPITAL - A
INTERMEDIATE HOSPITAL -B
NURSING HOME
HO OF 5E CS
0 0- 0 0 0
I. C
298
HOSPIIAL CS= 01 11
701— SM81 - 200
0-
U
3 2
HEALTH FACILITIES
STANDARDS OF THE M.P.D.-62
THERE IS A FELT NEED FOR THE
PROVISION OF SMALLER(INTERMEDIATE) HOSPITALS WHILEPLANNING FOR HEALTH FACILITIESIN DELHI
EXISTINGIl 2.65BEDS! 1000 POP PEDoou 5 0
DISTRIBUTION PATTERN OF THE BEDS I 1000 PEOPLE
PROPOSED FOR DELHI-2001
PRESENT AVAILABILITY OF HEALTH FACILITIES
- 1- :-H-- HOSPITAL
NURSING HOMES
MAT & CHILDWELFARE
PRIMARY HEA0^-4; CENTRES
HOSPITALS DISTRIBUTION ACCORDING TO CAPACITY
ICIAL
06 BECS ?i . P 10W PECPL
PROPOSED HIERARCHY OF HEALTH FACILITIES FOR
DELHI - 2001
DISTRIBUTION PATIREN FOR 3 LAF45 PO PULATION
GENERA. HOSPITAL
I
IiJ0
4,INTERMEDIATE
2. HOSPITAL - A
1200 8D5I
I I4, , 4,
INTERMEDIATE1.
2 - Id HOSPITAL B
I I II I
NURSING HOMES20 8E0$1
POLY -CLINICS
DISPENSARIES
--

IMARY EO-100LS
AGENCY-WISE DISTRIBUTION OF SCHOOLS 19B0-81
6
233
SENtOR SECONDARY
DELHI
MCD
NOMC
C€t.HI CANTI
ETI CENTRAL C,OiT
qrATE UNAIDED
EDUCATIONAL FACILITIES:1. p TO SENIOR SECONDARY LEVEL)
NUM8ER OF SCHOOLS FCR
15.0 PULATION
EDUCATIONAL FUTY MeD -62 PROPcED P1JNFOR 2001
SR. SEC SCHOOL 1 2
;PIMARY SCHOOL 4 3
NURSARY SCHOOL 10
NTEGRATED SCHOOL 0
GOVERNMENT POLICY AND PROVISIONSpp,Fc -tE EC1MEN' BY 2O0-4 pC
HLn
LLI
mlli
1 t( c-ro -3QT PCY.1Y
IP'IM-I
RASIC PRIMARY SEC0NO*m I4.
STANDARDS FOR PDP- 2001TEC'AJED 4CCt5
_________ _________ • CACLTY HOC S!U
I 2 ALL 220P4A
:i LttTYLI c
260 MA
SENIOR SECONDARY1 * 2 .P2I1Y OCO TU
I 50 HA
. T- 8A54C PRIMARY
8 mo m CAPACITY 00 STU
9 AREA
4 44. ______4. 4. 4. PR -PRIMARYHrq
STANDARDS OF THE M.P.D.- 62
—0
C, L)
'V
C0C
---a-
n_,,
k 02J, 6A
AVAILABILITY OF EDUCATIONAL FACILITIES - 1981
I-
16 7
-
U'0
UI>
SCHOOLS REQUIREMENT FOR ADDITIONAL POPULATION
DELHI 2001
Ln
LL
Z I1EC,ATEC 5—COLS
10
-PP PRIMARY1986 I991 *296
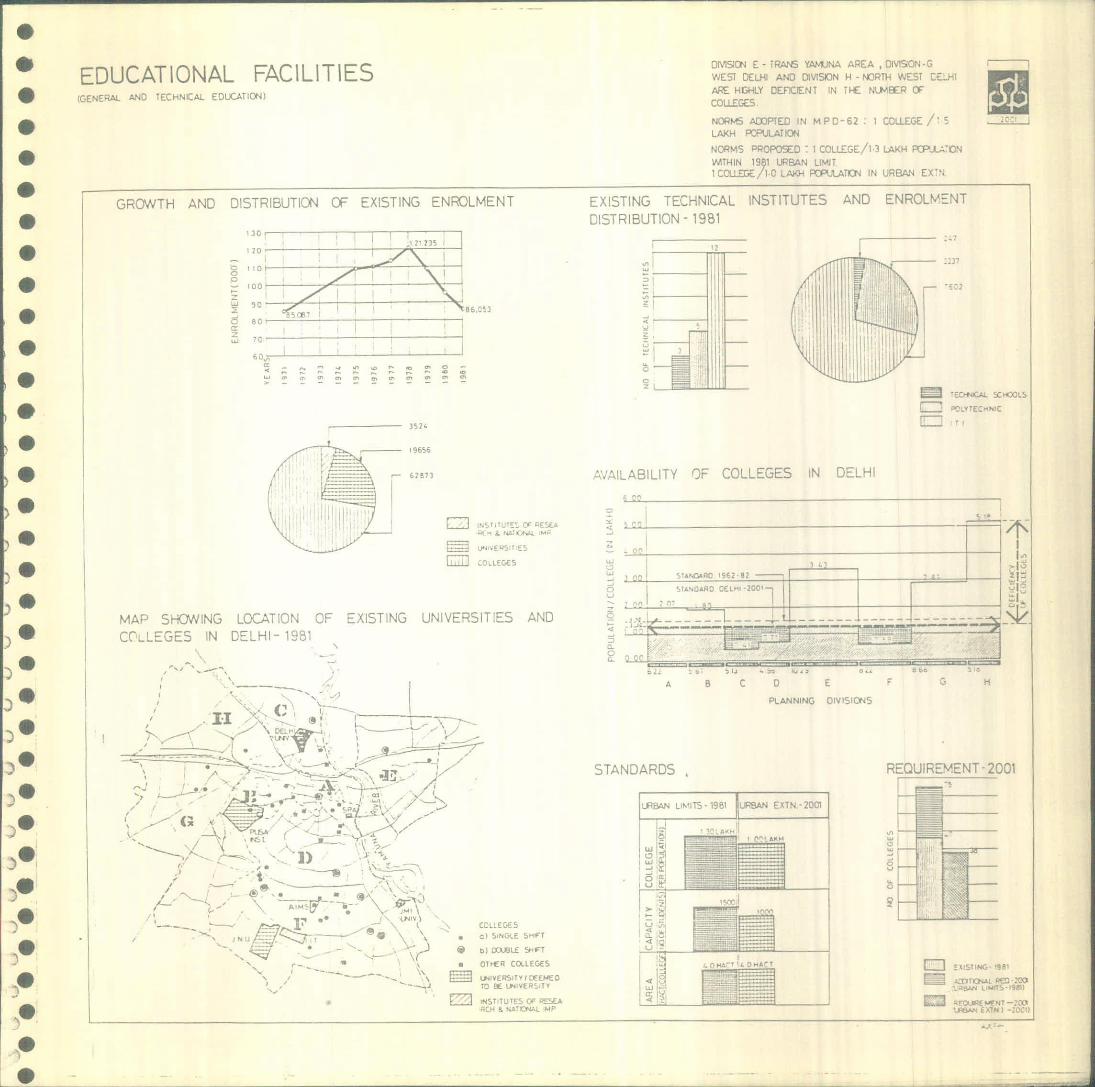
EN
— --*
AVAILABILITY OF COLLEGES IN DELHI
mm
SC -COL,
LV TEC III C
rI
D
hrz
'I
C
"-I
-'U
AP&0RC 19E2-82
S1A400R CCLIII •2CQ'
o. QL_r
A S C
Yto
0 £ F 3 H
PLANNING DIVISITS
cl
I '----f -
I
.OH4' ).-IAT
H
REQUIREMENT-2001
hr
U'
0
0
E;ISTING- 1981
IITVNAL P-'• _I L;MITS- I9L
JL E1N1 JI
STANDARDS
URBAN LIMITS 1981 URBAN EXTN- 2001
uj
EDUCATIONAL FACILITIES(GENE RAL ANC TECHNICAL EDL(AflcY'1)
GROWTH AND DISTRIBUTION OF EXISTING ENROLMENT
- I1IJ135 11 20
too-
Er''
CLU O C. C a, a, a, a, a, a, 0, 0'
1965 6
Df^ISXNE - IRA! 'AMJNA AREA , OIVION-C'
WEST DELHI AND DIVISCN H - NORTH WEST EEt-n
ARE H3NLY DEflCEN I IN THE NUMBER (Y
COLLEGES.
NORMS ADOPTED N M PD -62: i COLLEGE /LA}H FJLAT)ON
NORMS PROPOSED: I COLLEGE/1 -3 LAKH PLCN
WITHIN 191 URBAN UM1I1 couE/1 . 0 LA-4 JLAT IN URBAN EX
EXISTING TECHNICAL INSTITUTES AND ENROLMENTDISTRIBUTION - 1981
1TL'T. cc•." . J(A. M
COLE&S
MAP SHGV!NG LOCAT;cN CF EXISTING UNIVERSITIES ANDCCLLEGES IN DELHI- 19S1
W.
T.T•. ______
- h--'-----\ -
.]- , '- ----
-,
't • -
I •'-• -.--- .-.-----.--------------------- --
. N -- 'S a \, -
J N a) SINGLE 5H"
I r\ LILlY)
\ \ •LE *'FT
S OTHER COLLEGESI •---- -__. l\ =
" / •---.. ,_ % J LYERSITY1[ELAEOTO BE 1IVER$LTY
,NTlTtJ T ES C. PLATc' I.4P
3—,
H
H

*
S
S
Shahiahaflabad

F._7 N
I
Nurjhal e-eror ibjhafl, in 1628, dccie to shift Lh
c:it l from Ara to Pew1tl City n the Western bank
Yun3, S hji nii is the seventh SUCCCSSIVC city of
ihi dCsCCnt:1flJ froin 1 .Likot, 2.Siri, 3.TuJh1akab..Jhinanah, 5.Firzihi, nd 6.furan Kila.
rflYifl1 2:o.2
t the first instric, t2 :' Frt al'ng the Yamuna River and
•Jme isji on to ,,, f Ehojia rhri wcrn strteic.flY located
t GccOmfl':e tr re ctiv'ly, th nministrative an1 religiousnctin3. 'rho cit' 's11 iss cnstrctC. at the enI of the
17th century n1t in th iniirig. U2l1c city c :elhi
ne flL LhL ir: I 2 th' ri.
i1y str1eyiC icc: tion, t:h: Ji i;cSJ1J ws tne 11ii-rK
j,jfl5flC( o this city unmatched in scale nc
i jht. This 'r r :emn.flt c.turo ws highli iheJ by Edwur'. Ltyec
t: the time oE I1innin Delhi when he estalDlisheJ a vjsuni c::is
inhin; - -
It is :orth'cThil rcr in that prt from the
-nometry of Rc r ort-intcrr. l & e:.:t:ernal' and the formally lais
2hflflfli Chowk other streets ueve informally, providing visua
'nclesurcs ari 5C:UOnCC of snc 5. Apnrt from the function
.1 street s a corn -r, it: also utilised as ectension spceEon van us activiti'SS. The junction of the crossing of twocr mono trets invan±hly ave rise to a spce known as tL'
I
)

1361
SSSSSSS
S
S
S
Drawing No.4 & 5
In Shahjahanabad, hct-;ccn 1003 & 1920 British establishmentsstarted coming U2 in the form of business houses and military
sottleonts in and grcuhd Red Fort, I-Zashmere Gate and Darya Ganj.The first war of indeendnce in 157 brought untild miseries on thecity aod its res . le. Along with tho evacuation of the localopulatin mssi''e structic•:i of the traditional town tookLico. Thc arca hetw2n ei Fort & Jama t4asji'd u;:to Daribalan war cleord off 'u1 bui1ings to facilitate the military
;iovement. A cruicb army movement and also the civil administrationrequire adequate physical communication linkages. As a resultt though-'ughfaro latwccn Kashmore Gate and Darya Ganj remainedoart of the grand Truck Road. In 1867, railway station, close
to th• square of chandni Chow)-, was introduced which distnrbedhe basic fabric of sr:cial an6 structural framework of the
:,i.5-1 city.
rior to the enc Lnrt tr:c Siii Act trere w-.re ccrtincloarance schemes undertaken the Delhi Improvement Trust.[)ndcr the act, Lhere u-crc or•cv1scns to idcntify declare, do::md r?dcvelop areas which aualliied to he defined as slum
areas under the act as i-er cnditicns given thcre in. Such ct -:
areas ihich were not fit for imrrovement were declared as
clearance areas with the main objective for subsequent reconst:ctionor re.icveloniont. 1-. cu-1e of reevcicpment sbhemes like DojanaHouse, D.A.C. Sbheme have been carri-3 out, tocjether coveringof approximately 5.3 Hectares. In those re'3eveloment :chemi:716 flats have been constructcd kne.n as Slum Tenaments.
--.notner prograrrue of the 51cm Department has been t:oof i:iqht Shelters in and ar'un'i the Walled City.
within al1o. City thcr- or-: three ermanent ight Sheltersacco:m'Jating about 1500 persons on locations ;i11
•r:rr T'i: r i. i-'-''-i 'F ?
S

Drwir hoO
out 51% house units rc singi: room with only about i6 with:inre then two rooms. Th:ujh e andnd wtersUpply proViSi(
is cx±stin, n1 u1 77 :buses have wtcr suily connection.
As high -s briut 582 nn:s are ping a rent of less than
25 u p:s with less then 2% ng a rent of more than Rs.200.
17o.9
The cntir com'le;dty ;n'l sensitivity with which the -Xallecli.-3 as. is t1i character o.E its residential areasthc resulant soci1 lifc- it yrevii1cs. Even today, the Walled
City has 144.65 ftctres under tr]itiOflal housing. In the total
housing stck of the 11 City, the other major housing area is
the new de 7e1oment in Darya Gsnj.
Trie and Idustrv
The traCe and commerce establishments today in the Walled city
are about 1.5 la]ch. They have risen from 22,000 in 1961 to
55.600 in 1971. There are bout 7,000 industries working in
Wallc2 City. Employnvnt in this sector in 1961 was 62.035 which
rose to 1,30,640 in 1972. To'Jy it is estimated that there is an
er1cym'nt of qheut 3.5 lakhs in this sector. Another example insup ort of commercial activities is that of Kashere Gate area
' etw'en 1952-61 the grc:th c commercial units was 11.26 between
1962-66 it rew by 19.63 a7_7 (O'! T5 22. Sh
s 'Cn c.10
The stn'ly of the :;11 ciL lo.Hs to the ollo-ing rnan roc
rT.irr1T
a) Shifting of noxious and hazardous
delimitation of non-residential nctivit.The industrial units using, acids, c.----
like plastic, aervices etc and who1•-sale godowris should be shift
areas specifically earmarJzd for the purpose. The dcisiOn shou
e shifte to rural use Zone and the wholesale fruit and vege
mirket should also he chiftod. It is also necess
I.
S
S
S

Lhe conservation.
b) Upgrading of Thysical ri social Infrastructure.It would be absolutely essential to make water supply and sewerage
connection compulsory for all houses in Walled city. The provisionof social infrastructure could be made by re-development of Katras.c) Traffic and Transportation, Management and Regulation.
An integrated transport system of Buses and Trains woube required with automovile parking terminals at specific pointTwo goods terminal- v*: '•ii.are also propose(d.d) Conservation
rN
The Historical monuments, sites and buildinicentiiici by Archacoicqical survey of India with in Wal1ecdIring reconstructir' /. .,., . . ... '. .
tre to] sui toble) Revitalisation
nut-K a total area of 568 ha, arrnjc growth is un'Ic-r rointial use. This area may )revitali-ed keeping in vie.: th traditional character an.The i<atras should be re vlc.rH to rov
I

-
flcc r:n ! MT flTE fl fl1 LJ

•' . --
_'---:-!
.,-
t:cc
•_
r
1.
•-: :-i-. —4i - '__•o • - -
IL
- • ;•
,
I
j.
I
PEOPLE-CITY GOD-JAMA MASJID KING RED FORT
—••\\ -..-'--- 2 •\I - -
I -

nii L
TYPICAL STREET PATTERN
. 7

CIVIL ccuTSMGR SATE
- T. AME CHUr2H
VASUL GfE
IJME2I GzTE.
L14I 'ATE
SHAHJAHANABAD 1 157 c 00 TANNIINNONEW
-

7 Li- j
CIVIL LINES
I 3a;
Li
Ic
w -r L1i f _____
r-
I •' 'Y V'7 :
\
,
/--
IIj
LL1
Lj_1
Vryy-•_ - -- .- ft_
w>
\ •: .\ \.\\t1t ,
FK
NEW DELHI
_, --

Fif
14-4-
791
0
t.:J
x
cn
I
Cv;L LINES
*1
-- - -- S5
S '7 - 1.S\
I
IT r E
0 R TLj
rwAL
- -
- r\
-
/ 1, :_1
cA S5 :
^.-
IlJILATE,0 s'L- - L -/-/
:Ew DELHI
TEMPORARY NIGHT SHELTER
PERMANET NIGHT SHELTER
REDEVELOPMENT SCHEME
U
e-e

CIVIL LINES
S
S
S
S
S
S
S
S
S
S
S
f
)' - -i. h! - --z. -. •.
/ \
I' \ tE1 j\ : r-iIhEi
\ ' T \I1
\ \ - \ L
tt3O\\\'
\\
'_,,' = I L -
Jr ,
i
I
30
' 25
(• //
NEW DELHI
Oe PARKING SPACES WITH AVERAGE CAPACITYOF AUTOMOBILES
•1 _!=i
- _LJ
S
1•

I SINCLE I00M
2 TWO ROOMS
3 THREE ROOMS
FC :.JP. ROOMS
FACILITY
I KITCHEN
2 BATH ROOM
3 WC. LATERINE
6 STORE
5 COURTYARDN Dlvi DUAL
5 WATER SUPPLY
PERCENTAGE OF HOUSE UNITS0 tO 20 3040 50 60 70 80 .90i00/
PERCENTAGE OF HOUSE HOLDS
I RENT.L L ___ _____'6.o
2 OWNER1H1 _____
RS- 0-25
2 26-50
3 51-100
4 00-200
5 ABOVE-200
1ONTHLY RENT
I.11 57.3
3 kg__ LLTENANT HOUSE HOLDS PERCENTAGE
HOUSING CONDITIONS

wm
I
\N
/-
- I
U
N- ---)---
-I
I
F'
-
/7 A TYPICAL STREET IN A-1JAkNBAD
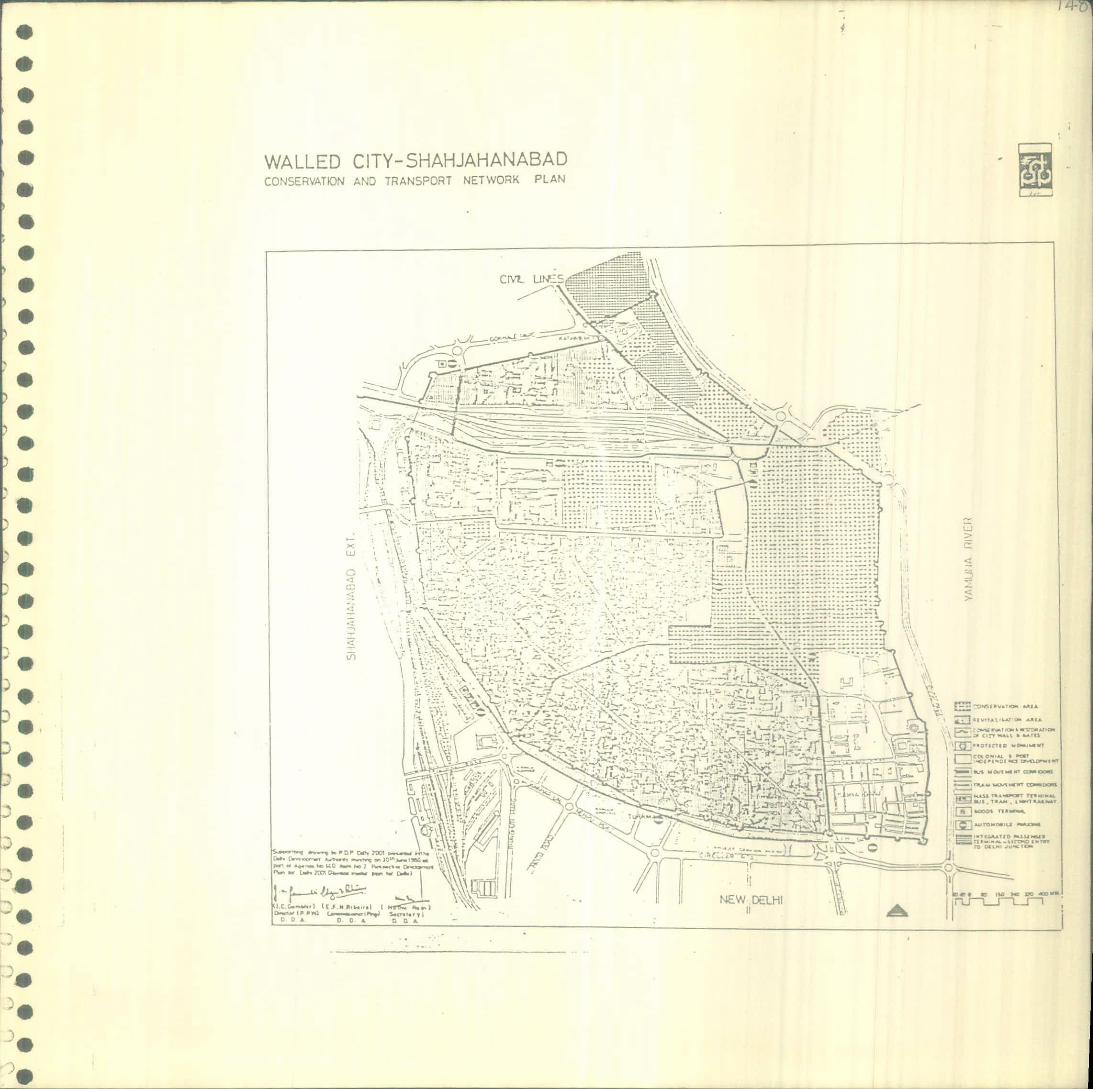
•—q P c
* •VV * J VVV
I *
P P I
:,A a o.& n&
boat w 1w SC
A
WALLED CITY- SHAHJAHANABADCON5ERVATON AND TRANSPORT NETWORK PLAN
E::Th \CP1 UN'_E41
=- NzHL
V V
N
I L -
V
- - -
--- \
- -
V '-_:- -- _tj -
-- -V\\_:V..•_ L: V1 ::::V:V:LV
IL
al
L-----==\ -
i -_J- V V - V - VV
LLJ
C
In
>1
>-
It*,L&L SI
vz-
EE7 As C TV flVflh S S.0 TO
sO.fl.M1
bJt WD.I Cd WI CO
VtA - 50.1 SCWI --
ICSSC TC? TT*U
V t SAM V I Tea LJ*,.C.
D tI*
AU rawTnuJ -o
;,,5flt"&AIIo-VI"-1pr1s-UAI-,Ic- £51.,I, rCOCLTJTAsCI

I:
*

1
d vI.oNM2NTI
Lung Spaces:
MPD-.62 proposed green areas to oe developed
in Delhi. A detail survey Was carried out and as
per the survey the green areas developed upto 81
are shown in the plan having title Parks and open
Space 1980-81. Presently within DUA,81, 4335 ziact of are
area has been developed into park anl about 1677 hact.
is available for development. The city has 20 major
Distt. Park from different period of History.
oshanara garuen and UUCtC.iâ garuen of Mughal
period. Talkatora yerden of British perioi and
Budha Jayant.i Par-, or ost independence.
lb ascertain the open standards in different zories ne
at city levei studies h .ve been made for three
divisions fo1iow 5 UL
•••* •t— •e .t— • .. . 4. 0a
Statcsnent Division Division DiV1i..cinC D F
— ._.—._ ._ . .-• . _._._ ._._ ._.—.— .—._ ._._._•_ 0 o
Area under developed 348.18 Ha. 804.18 Ha. 111740part.
Population 5,30,547 4,96,058 8,22, 220
Open area/persons 6.56 Sqm. 16.22 sqm. 130505qi.
Vacant area under 37570Ha. NIL 2591.10 fti,O ) efl space.
nin - . iasods the omu
of the open spaces have ocen studied interms of trleiL
intensive use.
Intensive Use oL O;.Xu spacesTwelve District Park out ot J DiSLrict Parks have
t.Lns
ctiv tn s-nce t: 2 — T sn n - tii tJ." of dffrn.

r 1 i1it1es available a1orWith clist.ance Lave1leJ to
cectaifl tI e4u1Ecnflt-3 tb? users. Th distric
parks studied ar as
Neta Ji :ubtash ParK
Ajmai Khan ParK
3 Rosflflara Garc11
• 4. G-.B Rahouri G
• S. Ashok Vjn&, Picnic
6. Ram Lila GCcurid
uciesia
S. Buana JaynLi
1 9. Hauz Ka.
I - 12.. dJ.LJ
carai.r;.y .C2CJ.J:LL
)
ot rnainin 1371 r1LerrI at Live a paSaiVe
tacili.ties to be provided within DiM 81 the tol.Lowing
spia1 activity area tor recreation prct ase-1.
) a. Cniiaren park 4 h3. each 7 Ncr..
b. Children traft ii-
r4 llut 4

--
as wood land by planting sdecli es of the trees cons:
the natural potentil to sait the local cxnditions
In new developments the neighbour hood park of cJ
1.5 c. fc 15J3 pojulLLon shj1d be p1anLd W'
f1cwcLr: Le - - cclourL
pleasant environment th±r4 through out the year.
For active . recreation (sports) existing stadias location
has oeen iaen€ied anu to pronote active recreation
activities sport centres at District Level, LJiVisioflal
level and Neighbourhooa leve:. nave been worked out and
recorrendeci fc i:veic):!t t d11fL&'J!1t
:'.v.ton 81 sport centre
Population site 13 to 12 Lakhs
iJJ..strict orL Centre
Population 6ize
Area
Neighburt-ucI Play area
Population size
Area
I to 15 La pals,
4 ha.
1530
1.5 Ha.
Residential Unit Play area
Population 530C)
Area Flex ib i.e

A city is an at1j oi bu!l2itIF:i1 sLret;
5CJT ( r-r ur.c . L ' P 1 ULi 7 Y; et
transportation, leisure and meetirj places. The
process of arranging these elrn'3nts both fountionally
and beautiful .i LhQ cs;ence of UEb3fl design. The
metropolitan City of Delhi in the cuorse of time is
becoming amorphous byorwgnt J A mas7eb and voids except
the definite urban form of 17 t century onahjahanbad and
Ltyen's NW Delhi.
The Wa.Lieu ity of shahiahanaoaa has certain urban
norm characteritics; the Jama Nasjid is a dominaLilig
tc lOt Ld un hill :1 is •i'.rerent, both, in
form and scale from the othr developments of trie ciLj.
I'ha vista or Mandni Chow}: w s planned to act as corn,erci
spine, as well as, to have a certain cisual ch.- ;h
inric1nt a.Ll linj af .d Fort and Faten Purl MosL1e
at its t.o en'.
In ce oiE Luty2n' s Nei DMi, p1jInning of central vista
was conceived as a landscaped stretch to torm coritinuit
b21Oe1 LAY i1j -nil Ui fT(' Y-r'uz'a This S _eLch
i :dal points of the aashtrapati Bhawan and India Gate
has trnendous Visual quality and is one of the finest
examble oi wbn - Usijn in the world. ZVen whiJ. Nc
Delni w as segregated from the Old Citj physicalLy wii
a barriaw
WJ.LL1 GarlinhanL F-iaas2. :_:11L -Lace and dalI!
Masjid in the same axis.. =
In developments carried ucbaa ow;-
nor visual characteristics were given due considerati.
The new :(JV1O){flc.. -:± :::':-.--:_::•: W Lh
Plan is more on ta: a
difent uses and it licks in spatial 4ualiti .?s. AJ.

the roads wtar at (the cit/ level or local level are
mere plot, dividers and fail to achieve the continuity
of harrtony of space. '-L!, present. urban form is the
outcome of :Dning and Sub-division regulations. An
illustration in su p .)ort of this point is that of
Connaught Place extension where undesirable changes
took place in th absence of urban design frarneirk.
Justifiably these changes in the form are in tube with
SPirit of time and technological development, however,
the new bui1d1nj and space fior are in direct centract
inJifiterent Skjlinc.
TO ar;ive at a cC3c1L oasla for policies which effect
the fabric, a study has been made for
i) Areas of significance in natural ariaa;
VisucJ.. iIj_: a:
11L) Conservat on yJ preservation oh urban herita:e; and
iv Policy for tall bui.LJ!njs and large scale a±b:1n
pro Jects-resid2ntialcom!narcia1, industrial, et-c
Significant areac. njtural and built environmeriL
The important feat a: : 1 T:' arc n:nei t. afi
a) Yarnuna R!va
b) The Ridge-.
For the built environment, the area:; have hau i.1e: as
a) Shah jahanabad-..h.
b) Lutyens New DelL.
a) 1Je1L :3t.icucc,L.,iistcaacal :'LL:::L:r:
e) Designed environment like exhJiiti.on rounio, o
Areasin Dlhe.,
i) Republic 00,r
) VIP route £-r-i j

i- 6 —:
iii) Road entry routes
(g) Aerial view.
Visual Inte
Delhi has a tremendous diversity of form, colour, scale
and texture with a heterogeneous and prOduct from
aesthec.ic paint of vi(--,'. Visual integration can
Possible be ach,ieved by identifying features which
integrate the city physically. There are two portal-It
mass move-met corridors; RirKj Road and Ring Rail, which
are used by ridenc-s of all Plannirij bV1sion3 'flr t
t movement corriuors have joteritid t a:quJr a
additional dimension of visual quality and interatJ-on
The stuuisarid proposals f c Rng r?oad and Rirxj Raj..lwaj
could be formulated for rca i geomcri.cs, landscaping, XJ
streat furniture, introductiun of urban forms at
selected points and cleara:ce of unsightly d/e1opnt:..
Ta other imoctant eleTnnLs for the integration ot
dif€ert Parts of the city, planned at different
are (1) flora i.e. tree plantal:ions- continuance o
I Nw Delhi' character to other parts of the metrop.ii3
arid linking opi space (ii) harmonious treatment for t
major ecological features i.e. the Ridge and the River
Yamuna and a1:c h mc xiarin j
i4

Conservation of Archaeological Heritage:
The Historical monuments have been identified and
located as per survey conducted by Archaeological
Survey of India - 1916. Out oh 1321 monuments 81
monuments under the Archaeologival survey of India
Act. There have been indicated on the plan; so
thdt while preparing tne layout plan could be
planned for suitable incorporation. There is r
building cont.rol around them. To propose building
ontroj in relation to heiiit, material and spread
of the monument a SCLdy has o:n ciie nase upon the
Hight olE •:o11drronL -=
Ldinit of control zone=ut:i uruiio rt:
No :UtiCjjr
Permissible controlled=Cc fl:;t
iJflUTh heightp.miss lb le
Height permissIblwithin controlledconstruction zsne
H x 7,5 to H x 9.375 =
H x 9.375 to H x1125=
H x 11.25 th H x 15 H=
a-,
H x 7.3 cc H x 1
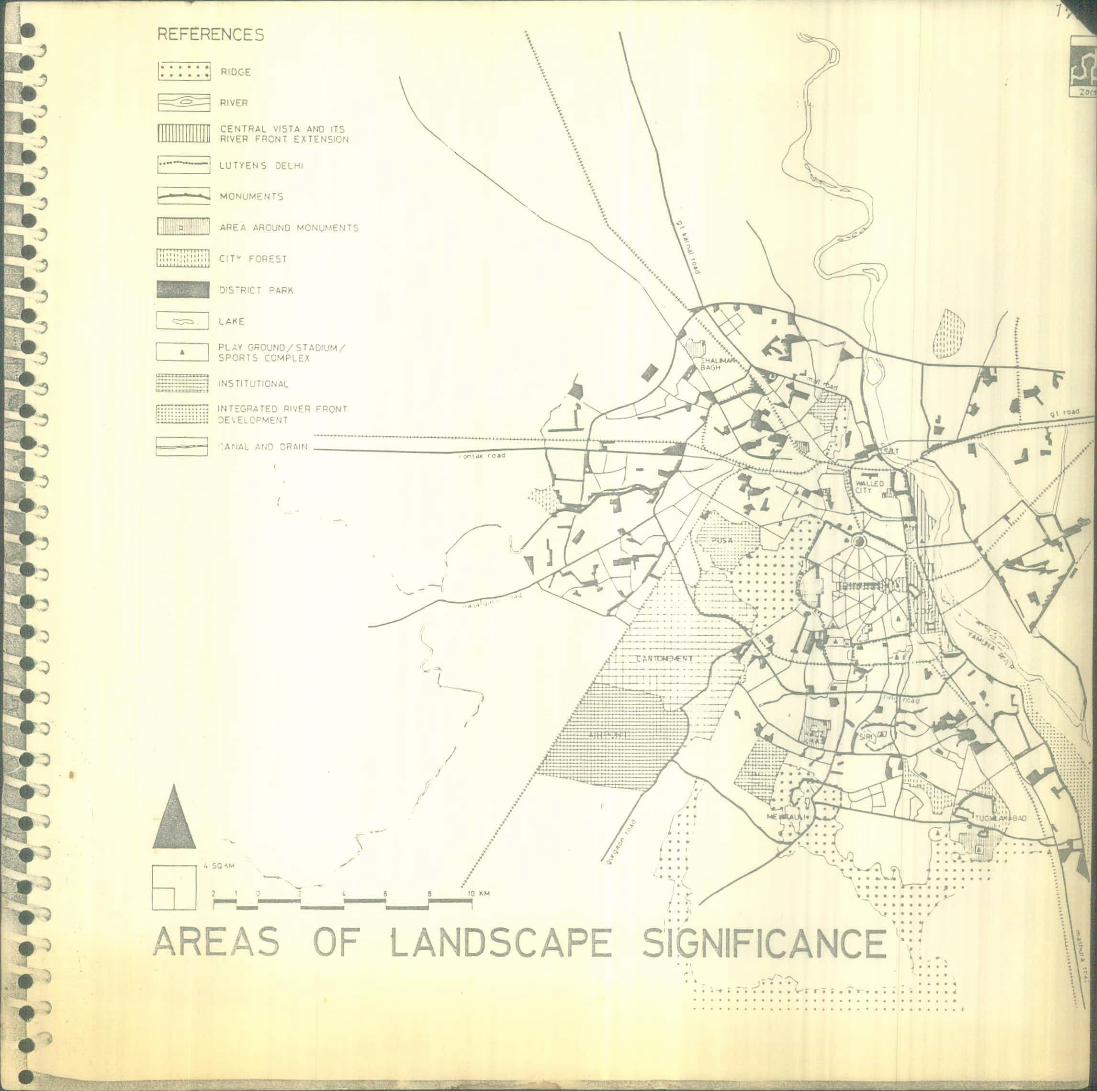
REFERENCES
RIDGE
---.----' RIVER
FTITTTTTTrTnTII CENTRAL VISTA AND ITSt1IIh1IIII.W.LII RIVER FRONT EXTENSION
LUT(EN S DELHI
MONUMENTS
j AREA AROUND MCN'.,^J E!l S
C:T v FOREST
- O!5R1(T=ARK
-= LAKE
1 PU.Y GROUND/STADIUM/L SPORTS COMPLEX
INSTITUTIONAL
INT:GPATED RIVER FRONTDEECPMENT
AIAL CRAIN
2r1
2 5 10 mm
AREAS OF LANDSCAPE SIGNIFICANCE.
a
• r ...............

• ?:11 ,X> PUSA
/ c;V
T:s
QOZA
REFERENCES
RIDGE
RIVER
AREAS OF 1.&N FERJAGE
-LIVING LJISAR -ETLE WALLEDCITY CF HjAD REGULATEDDEVELOF€NT MTh .
-REMAINS OF rERITAGEAt'CIENt CITIES - RENJLATEDOEVELOFEN1 jurC• LUTYEN'S CE..H' The çaraen city)
IMRTNT HISTCAL MNLEN7SE.RESTORATCN,PREEE.TiON,
CCiSERYATION& REGULATED CE\ELC.NTAROUND
: HISTCRAL E DTR IMPORT-NTCENTRAL VISTA TNAL iALS
ASIAN GAMES A
1 AA)R &C.T. CFFCES
___••_•••fl C'C CENTRE. 5LE CENTRAL BUSINESS IYSiT.'... ..J AND DISTG
REPUEL:C c'i R€ OLETO
L - - - YIP ROUTE FROM P LAM 13 RSTPATI BHAMN
& PASTAPATI TO RAJGh/.T
HPO.[) ENTRY MA,3R 1.li5
AL ENTR y R4TE: RAILV(
r, PAL—-..-.,........
SIR'
Alh
AREAS OF VISUAL IGNIFCT ANCE1
TL
.............. ......I I ...... .. .......
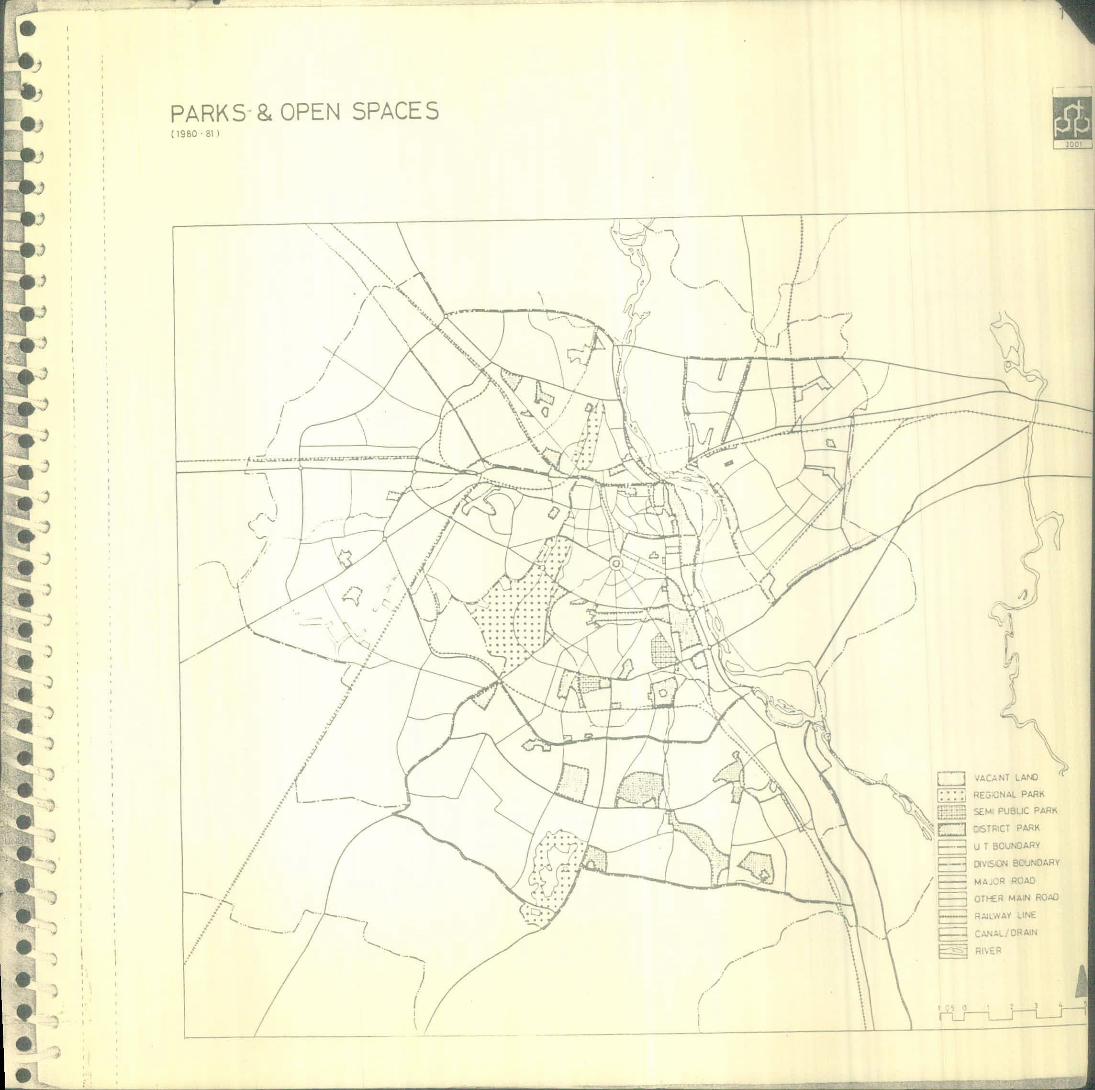
PARK S & OPEN SPACES(1980 ai
'i21

I
p.
S
OPEN SPACE STANDARDS STATEMENT
-AREA OF OMSONAREA uNcERCE. FPK
Fcc . xi
-POFULATON 9B1-OPEN SPACES/ PERSON-VACANT AREA UNDEROPEN SPACE
•-/\\- t--*--r :v
- \—.-\'. - \ L0'rr /
i---/Z ?
j -:-
/ \ /
DIVISION C DIVIGN - D LIVtSKDN F
434818 HECT. SOL. 82 HECT. 1117.40 -ECT.
530547 495058 B222)
656 scm. 6-22 sq.m. 1358 sqrn.
31570 I-€CT. NIL 259110 HECT.
.1/
,77/T( \k
\<W -- -E 1 .) \\NDIVISION - 7

LOCATION OF 12 D1STRiCT PARKS
- -i 12 1
INTENSIVE USE OF OPEN SPACES(STUDY OF 12 DISTRICT PARKS)
.ABOUT 701. vISTc*S COME FROM uPQ 21',:i FOOT.
.ONLY 23''. PEOPtE CE THE TOTAL POPULATION 00 TO THE PARKS.
&ND MAXi.1UM VISITORS ARE N THE .'.C€ GROUP OF 26-.5 YEARS.
.ABOUT 54% VISITORS CONE EVERY DAY IN THIE MORNING.
.A.CRITV OF VISITORS STAY IN 11€ PS FROM I 10 2 1J31RS.
.AXATICI4 AND EXERCISE ARE THE MAIN CAUSES OF
ATTRACTION TO ThE PARKS.
DISTANCE TRAVELLED TOVISIT THE PARKS -
-ILA _PXk4
I. 'U
:fl'c
MODE OF CONVEYANCE
OJRATICN CF 5TAY N THE COMPOTIC*N CF PERSC MAN CAL5ES OF ATTRACT:ON CLNC .r J5iT N ThE
PAR5 IN THE PARSS IN THE PARKS PARKS
25 32
4.033 F U
OF
_____1,IIfII
!
!
L

IN
-<0
DISTANCE TRAVE±D TO
N1CT EVI5T THE PAPJ
..
I
I,-5
r.
INTENSIVE USE OF OPEN SPACES(STUDY OF HAUZ HASPAR)
VJTCRS COMING FROM DIFFERENT AREASOF DELHI
I'
T:.
\./
DURATION OF STAY IN THEPARK
COMPOSITION OF PEJN S IN iR:. - Il-f
IN THE PARK IN THE
OLD
32 -I
ZZ
It
l 2 l I 'ttH _0 0 20 32 0 0 ID ID
.1 I
2&i2%
:
- RL
CAJSES 'c1-r- - :-20 -
OF
ATTRACTIONt II \\ 8T ,-7

UINTENSIVE USE OF OPEN SPACES(STUD" C,7 PAK
••1/
1
j
-- r, ,-
-
I(.J7._;:j
ON MONDAY• MAXIMUM AREA UNDER J5E 501.• MAXIPU.1 M). cc PERSONS 289 PER.
IJS3 T RNN
• 1t4sto OF uTi.IZAflN 6AM-7PM.
• DEN1TY OFMAX. 02 CS1M;N. o7i
• DEAD MTjJR5 N THE PARKNL
ON TUESDAY• MAMUM AREA UNDER USE 1.0
• MAAMUM NO. CF PERSONS 152 PER.USING THE PARK
• biAU.1 PERM OF UTTLIZATN AM2PM.• CEN&TY OF PARK
MAX. 01.31 XSJMIN. 0.15IPER.
• DEAD HOURS IN THE PARK NIL
ON WEDNESDAY• MAR.1J.i AREA UCE2 USE 201.• MAAI.11J.I NO. OF PERSONS i68 PEP,
UT' E WK• MAX'..M PEXJ OF UTILIZATION 74M.-7P'M.• CENSTY OF PARR
MAX.MIN. 0•21.L
• DEAD HOURS iN THE PARK NIL
2O ...................................................-
- -.
' ................: ....
::.:::_..
AWA
.. ---•-
Poo- , fl T"Tl 1T ;T;1 TI '- ...........- ..........',...., ......Id..............
F'o -. L
.: :._:-
': ....: :..' ::::::: , -- p' .................. -
— H
..._... ................" 91 '.t" --'T).
_11ft.000 LLLi -
• ARcA r. (R USE• MAx:.'Jv to. c r ;sc5 •.E
USING T-E AP'.
• t'AM.' 0..- 'J L IZA,ON 5P'P\4.•DE .&t 'c PARR
tX.MIN. O.PER.
• DEAD CURS N ThE PARR. NIL
•t.&A.XMUM ;EA LND€R USE 20.'.
• MA.X'JM to. cc PERSONS 28 PEP.IJSI'O THE PARK
• MAXIMUH PERIOD OF UTL!ZAI ON 5DM.-6'.
• DENSITY OF PARRMAX. O'28AC54'MN. 0.1OIF.
• DEAD I-O..S IN THE PARN NIL
a MAAM,JN AREA UNDER USE 501.• .1&4J I l OF PERSONS 319 PER.
US15 ThE PARK
• MAXMLt.1 PERM OF 1JUZATION EAM9AM.9DE 145TTY OF PARR
MAX. 011/CS1MIN, 0•021 PER,
a DEAD HOURS IN ThE PARK NIL
• . 2:"T -USi5 THE
•1`41axr,.j'.1 PEPOO OF JTUZATON SAM,'9A
• DENST F PARKMAX. 0MIN,
• DEAD DURSIN ThE PARK
-
N
:::,:::::.::;:::::,::::::',::::::::::::;:::::::;r ..
................................
III','.,
— II
rcLII
................... ...... liyll-
E
.... 14
!ç
USE
I.


![@aa WfV]Z_X R_eZ 422 R_RcTYj+ A> - Daily Pioneer](https://static.fdokumen.com/doc/165x107/6337b9a7a5ba10dda701b56d/aa-wfvzx-rez-422-rrctyj-a-daily-pioneer.jpg)