N100 cortical potentials accompanying disrupted auditory nerve activity in auditory neuropathy (AN):...
25
N100 cortical potentials accompanying disrupted auditory nerve activity in auditory neuropathy (AN): Effects of signal intensity and continuous noise Henry J. Michalewski, Arnold Starr, Fan-Gang Zeng, and Andrew Dimitrijevic Abstract Objective—Auditory temporal processes in quiet are impaired in Auditory Neuropathy (AN) similar to normal hearing subjects tested in noise. N100 latencies were measured from AN subjects at several tone intensities in quiet and noise for comparison with a group of normal hearing individuals. Methods—Subjects were tested with brief 100 ms tones (1.0 kHz 100 dB to 40 dB SPL) in quiet and in continuous noise (90 dB SPL). N100 latency and amplitude were analyzed as a function of signal intensity and audibility. Results—N100 latency in AN in quiet was delayed and amplitude was reduced compared to the normal group; the extent of latency delay was related to psychoacoustic measures of gap detection threshold and speech recognition scores, but not to audibility. Noise in normal hearing subjects was accompanied by N100 latency delays and amplitude reductions paralleling those found in AN tested in quiet. Additional N100 latency delays and amplitude reductions occurred in AN with noise. Conclusions—N100 latency to tones and performance on auditory temporal tasks were related in AN subjects. Noise masking in normal hearing subjects affected N100 latency to resemble AN in quiet. Significance—N100 latency to tones may serve as an objective measure of the efficiency of auditory temporal processes. Keywords Temporal processes; Dys-synchrony; Deafferentation; Noise masking; Psychoacoustics; Hearing impairment 1. Introduction Auditory neuropathy (AN) describes patients with dysfunction of the auditory nerve in the presence of preserved cochlear outer hair-cell receptor functions (Starr et al., 1996). The sites of involvement in the auditory periphery include auditory nerve (Starr al., 2003), or the inner hair cells and their synapses with auditory nerve fibers (Rodríquez-Ballesteros et al., 2008; © 2009 International Federation of Clinical Neurophysiology. Published by Elsevier Ireland Ltd. All rights reserved Corresponding author: Henry J. Michalewski, Department of Neurology, Med. Surge I, Room 150, University of California, Irvine Irvine, California 92697 USA. Telephone: 949-824-7604; FAX: 949-824-2132 [email protected]. Publisher's Disclaimer: This is a PDF file of an unedited manuscript that has been accepted for publication. As a service to our customers we are providing this early version of the manuscript. The manuscript will undergo copyediting, typesetting, and review of the resulting proof before it is published in its final citable form. Please note that during the production process errors may be discovered which could affect the content, and all legal disclaimers that apply to the journal pertain. NIH Public Access Author Manuscript Clin Neurophysiol. Author manuscript; available in PMC 2010 July 1. Published in final edited form as: Clin Neurophysiol. 2009 July ; 120(7): 1352–1363. doi:10.1016/j.clinph.2009.05.013. NIH-PA Author Manuscript NIH-PA Author Manuscript NIH-PA Author Manuscript
Transcript of N100 cortical potentials accompanying disrupted auditory nerve activity in auditory neuropathy (AN):...
N100 cortical potentials accompanying disrupted auditory nerveactivity in auditory neuropathy (AN): Effects of signal intensity andcontinuous noise
Henry J. Michalewski, Arnold Starr, Fan-Gang Zeng, and Andrew Dimitrijevic
AbstractObjective—Auditory temporal processes in quiet are impaired in Auditory Neuropathy (AN)similar to normal hearing subjects tested in noise. N100 latencies were measured from AN subjectsat several tone intensities in quiet and noise for comparison with a group of normal hearingindividuals.
Methods—Subjects were tested with brief 100 ms tones (1.0 kHz 100 dB to 40 dB SPL) in quietand in continuous noise (90 dB SPL). N100 latency and amplitude were analyzed as a function ofsignal intensity and audibility.
Results—N100 latency in AN in quiet was delayed and amplitude was reduced compared to thenormal group; the extent of latency delay was related to psychoacoustic measures of gap detectionthreshold and speech recognition scores, but not to audibility. Noise in normal hearing subjects wasaccompanied by N100 latency delays and amplitude reductions paralleling those found in AN testedin quiet. Additional N100 latency delays and amplitude reductions occurred in AN with noise.
Conclusions—N100 latency to tones and performance on auditory temporal tasks were related inAN subjects. Noise masking in normal hearing subjects affected N100 latency to resemble AN inquiet.
Significance—N100 latency to tones may serve as an objective measure of the efficiency ofauditory temporal processes.
KeywordsTemporal processes; Dys-synchrony; Deafferentation; Noise masking; Psychoacoustics; Hearingimpairment
1. IntroductionAuditory neuropathy (AN) describes patients with dysfunction of the auditory nerve in thepresence of preserved cochlear outer hair-cell receptor functions (Starr et al., 1996). The sitesof involvement in the auditory periphery include auditory nerve (Starr al., 2003), or the innerhair cells and their synapses with auditory nerve fibers (Rodríquez-Ballesteros et al., 2008;
© 2009 International Federation of Clinical Neurophysiology. Published by Elsevier Ireland Ltd. All rights reservedCorresponding author: Henry J. Michalewski, Department of Neurology, Med. Surge I, Room 150, University of California, IrvineIrvine, California 92697 USA. Telephone: 949-824-7604; FAX: 949-824-2132 [email protected]'s Disclaimer: This is a PDF file of an unedited manuscript that has been accepted for publication. As a service to our customerswe are providing this early version of the manuscript. The manuscript will undergo copyediting, typesetting, and review of the resultingproof before it is published in its final citable form. Please note that during the production process errors may be discovered which couldaffect the content, and all legal disclaimers that apply to the journal pertain.
NIH Public AccessAuthor ManuscriptClin Neurophysiol. Author manuscript; available in PMC 2010 July 1.
Published in final edited form as:Clin Neurophysiol. 2009 July ; 120(7): 1352–1363. doi:10.1016/j.clinph.2009.05.013.
NIH
-PA Author Manuscript
NIH
-PA Author Manuscript
NIH
-PA Author Manuscript

Roux et al., 2006). The diagnosis of AN is based primarily on physiological measures offunction of auditory nerve and brainstem pathways, cochlear outer hair cells, and auditorymiddle-ear muscles. The criteria include: (1) absence or marked abnormalities of auditorybrainstem responses (ABRs) beyond that expected for the degree of hearing loss; (2) preservedouter hair-cell activity including otoacoustic emissions (OAEs) and/or cochlear microphonics(CMs); and (3) absence of acoustic and preserved, non-acoustic middle-ear muscle reflexes(Berlin et al., 2003; Starr et al., 1996; 2001).
Adult AN patients typically complain of an impaired ability to understand speech especiallyin the presence of noise (Rance et al., 2004; Sininger and Oba, 2001; Zeng and Liu 2006). Theauditory processes that contribute to the speech perceptual deficits appear related to abnormaltemporal and masking functions (Vinay and Moore, 2007; Zeng et al., 1999; 2005). Rance etal. (2008) identified in some Freidreich's ataxia, a mitochondrial disorder affectingdegeneration of auditory nerves but not outer hair cells (Spoendlin, 1976), that speechperceptual errors involve stop consonants (e.g., /t/ vs. /d/) distinguished by voice onset times,a temporal cue, but not fricatives (e.g., /s/ vs. /f/) distinguished by spectral cues. Speechperception in other etiologies of AN are necessary to define if these defects are also present.
Our understanding of AN will benefit from a knowledge based on etiology, such as specificgene mutations, and the relationship of the auditory nerve disorder to other clinical findings.For instance, temporal bone studies of adult AN patients have shown loss of auditory nervefibers, demyelination of remaining fibers, and normal numbers and morphology of both outer-and inner-hair cells (Bahmad et al., 2007; Hallpike et al., 1980; Spoendlin, 1974; Starr et al.,2003). These findings are consistent with some post-synaptic disorders of auditory nerve asbeing part of generalized disorders affecting both peripheral and other cranial nerves. A pre-synaptic form of AN is now identified due to mutations of the OTOF (otoferlin) gene affectingneuro-transmitter release (Rodríguez-Ballesteros et al., 2003; 2008; Roux et al., 2006, Vargaet al., 2003; 2006). Temporal bones in this condition have not yet been examined to determinewhether there are long-term effects of pre-synaptic disorders on the viability of either innerhair cells or auditory nerve fibers.
AN subjects, in spite of abnormal or absent ABRs, show auditory N100 and P200 corticalsensory potentials to tones (Kraus et al., 1993; Rance et al., 2002; Satya-Murti et al., 1983;Starr et al., 1996; 2003; 2004), speech signals (Kraus et al., 2000; Narne and Vanaja, 2008),and to silent gaps in continuous noise (Michalewski et al., 2005). These cortical potentialstypically were delayed in latency sometimes by as much as 60 ms or more compared to normalhearing subjects. In contrast, Rance et al., (2002) showed cortical potentials were absent in50% of young children with AN and the absence of these potentials was related to impairedspeech perception. Early studies of auditory cortical potentials to tones in normal hearingsubjects showed that N100 latency was remarkably stable over a wide range of intensities (e.g.,70 - 30 dB SL, Rapin et al., 1966) whereas changes of rise time, a temporal cue, resulted instriking delays of N100 latency (Onishi and Davis, 1968). Moreover, auditory cortical singleunit data in experimental animals reveal that the latency of response is sensitive to temporalrather than intensity cues (Phillips, 1990). These human and animal results suggest that theN100 latency delays observed in AN subjects may reflect altered auditory nerve activityencoding temporal cues.
In the study reported below, tones were presented in quiet and in continuous noise to evokecortical potentials. The quiet mode served as a “favorable” listening condition whereas thenoise mode served as a “difficult” listening condition. The ability of AN subjects to understandspeech as mentioned earlier is abnormally affected by background noise. Noise activatesauditory neurons and reduces their responsiveness to other signals, a phenomenon knowncommonly as “the line-busy effect” (Derbyshire and Davis, 1935; Powers et al., 1995). In
Michalewski et al. Page 2
Clin Neurophysiol. Author manuscript; available in PMC 2010 July 1.
NIH
-PA Author Manuscript
NIH
-PA Author Manuscript
NIH
-PA Author Manuscript

addition, noise can specifically interfere with neural synchrony independent of a change ofresponsiveness (Miller et al., 1987).
Of the many potentials that can be recorded from the scalp to acoustic stimuli (see Picton etal., 1977), we focused here on the N100 cortical potential for testing AN subjects. Our workinghypotheses included that: (1) in quiet, N100 in AN would be delayed in latency and reducedin amplitude reflecting disruption of auditory nerve activity sensitive to temporal cues, (2) innoise, AN would show additional effects on N100 latency and amplitude measures, and (3) innormal hearing subjects, N100 potentials to tones in noise would be delayed in latency andattenuated in amplitude to resemble N100 measures in AN.
2. Methods2.1. Normal subjects
Twelve normal individuals equally divided by sex and ranging between 18 and 22 years of age(mean = 19.8) were tested. A pure-tone hearing test using a MAICO 790 audiometer was usedto screen each subject. Average hearing thresholds (between 0.5 - 8.0 kHz) were within normalranges (<10 dB) for both left and right ears.
2.2. AN subjectsEight AN subjects (3 males, 5 females) were tested, seven ranged from 18 to 33 years (mean= 25.3), and one older female subject 60 years of age. Each AN subject was assigned anidentification number (ID#), #1 through #8. Audiological, psychophysical, neurophysiologicaltest results, and clinical details for the AN group are summarized in Table 1. Four of the eightAN individuals were participants in other published studies and their subject ID# is includedin Table 1 for reference.
The results of diagnostic physiological tests were entirely consistent with the diagnosis of AN(Starr et al., 1996). Neural components of the ABRs were absent in six subjects, or abnormalin two subjects consisting of only a Wave V of delayed latency beyond that expected for thedegree hearing loss. Outer hair cell receptor measures including otoacoustic emissions (OAEs)and cochlear microphonics (CMs) were normal in all subjects. Brainstem acoustic reflexesinvolving middle ear muscles were absent in all of the AN subjects.
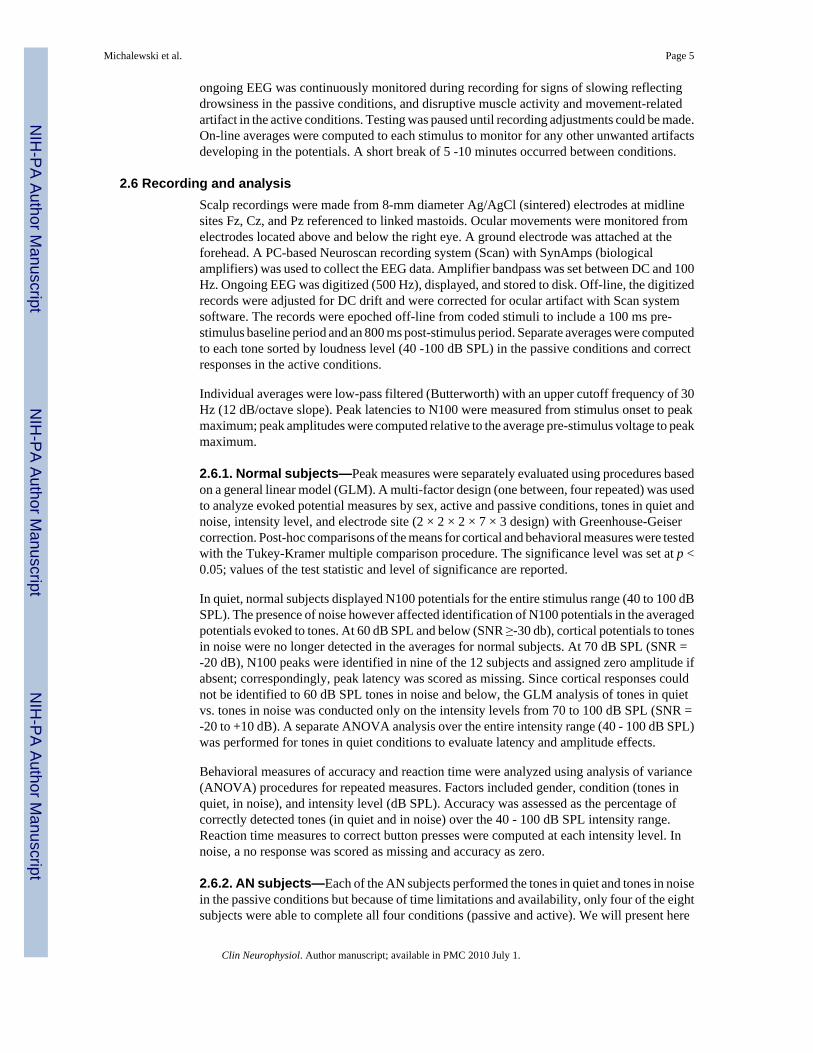
Audiograms for each AN subject are provided in Fig. 1. Audiometric thresholds were normal(20 dB or less) for three subjects (#6, #7, and #8) and were mildly- to moderately-elevated forthe lower frequencies for five subjects (#1 through #5). The average threshold for the ANsubjects at 1.0 kHz was elevated to 31.3 dB nHL compared to 5.6 dB nHL for the normalhearing group.
Psychoacoustic gap detection thresholds were moderately elevated (mean = 8.6 ms) comparedto normal hearing subjects (approximately 3 ms at high sensation levels, Zeng et al., 2005).
Speech perception scores were measured in seven of the eight AN subjects by the percent ofcorrectly identified keywords in daily sentences (refer to Zeng and Liu, 2006 for testing details)and in one subject (#7) by results from the referring audiologist to spondee words in quiet.Normal hearing listeners typically score close to 100% in quiet but hearing-impaired listenerstend to score lower and are particularly susceptible to noise (e.g., Bench et al., 1979; Giffordet al., 2008). There was a moderate impairment in seven of the eight AN subjects tested in quiet(mean = 58.8%; normal 100%). For AN subjects, accuracy for speech recognition scores inquiet was associated with gap detection thresholds (r = -0.73, p < 0.05).
Michalewski et al. Page 3
Clin Neurophysiol. Author manuscript; available in PMC 2010 July 1.
NIH
-PA Author Manuscript
NIH
-PA Author Manuscript
NIH
-PA Author Manuscript

We classified the disruption of auditory nerve function to a disorder of the auditory nerve (post-synaptic AN) in three subjects (#3, #6, and #7); #3 had accompanying peripheral and vestibularneuropathies due to MPZ gene mutation (Starr et al., 2003); subjects #6 and #7 were twins withaccompanying optic neuropathies. The disorder is pre-synaptic in #8 who had a temperaturesensitive hearing loss (see Starr et al., 1998) due to compound heterozygous mutation ofOTOF (Varga et al., 2003, 2006). This subject was tested when afebrile. The remaining fourAN subjects (#1, #2, #4, and #5) did not have peripheral or cranial nerve abnormalities andthey were classified as unspecified for site of the disorder. Details of the procedures used tocharacterize neurological, audiological, and physiological measures of the AN subjects aremore fully described in Starr et al. (1996) and Zeng et al. (2005).
2.3. Subject recruitmentNormal subjects were young adults recruited from the university community. AN subjects arepart of a research cohort either self-referred or referred by professional colleagues (seeAcknowledgments). Internal review board (IRB) approval for the study was obtained prior totesting. Each subject signed an informed consent following university IRB guidelines fortesting human subjects and each subject was paid for participating in the study.
2.4. Auditory stimuliAuditory stimuli consisted of tones in quiet and tones mixed in a background of continuousnoise. Pure 1.0 kHz tones of 100 ms duration were generated (16-bit, 44.1 kHz sampling rate)for seven intensity levels in 10 dB steps from 40 to 100 dB SPL. Audiometric thresholdsmeasured at 1.0 kHz for normal hearing subjects in our laboratory average approximately 35dB SPL in quiet. Individual tones were windowed (10 ms Hamming) at onset and offset toreduce spectral splatter. Tones were separately mixed with broadband “white” noise (within ±0.3 dB from 30.0 Hz to 20.0 kHz) at 90 dB SPL. This noise level was relatively loud (90 dBSPL) but not uncomfortable and accommodated the wide range of hearing loss anticipated forthe AN subjects. All subjects could detect the 1.0 kHz tone even at negative signal-to-noiseratios (SNRs) since only noise energies within the 1.0 kHz critical band affected the detectionof the tone. Adding brief tones to continuous noise instead of noise bursts was used to avoidpossible component overlap of brain potentials to bursts and tone onsets. Sound stimuli weregenerated with Cool Edit Pro (Syntrillium) and were converted from .wav-to-.snd files forplayback on a PC-based Neuroscan stimulation system. Sounds were delivered monaurallyfrom a shielded-transducer (Etymotic Type ER-3A MN) connected through a 25 cm plastictube to a foam insert within the ear canal. In the normal subjects, only the right ear was testedsince there were no threshold differences between the ears; for AN subjects, the ear with thelower threshold at 1.0 kHz was tested. Tones in quiet and tones in noise were presented at aregular 1.4 sec interval; the order of tone presentation was randomly determined in quiet andin noise. Periodic measurements of stimulus output levels delivered from the transducer werechecked with a B&K 2260 sound level meter.
2.5. Experimental conditionsTones in quiet and tones in noise were presented in separate passive and active listeningconditions in a sound-attenuating electrically-shielded chamber. In the passive conditions,subjects fixated a point on a CRT monitor directly ahead; in the active conditions, subjectsagain fixated their gaze, but also pressed a reaction time (RT) button as quickly as they couldwhenever a tone was detected. Thus, there were four conditions randomly ordered amongsubjects: tones in quiet (passive, active) and tones in noise (passive, active). A testing conditionwas completed when at least 50 stimuli at each tone level were presented (approximately 10min). A practice sequence for each condition was presented to the subject before recordingwas started to verify that the instructions for each stimulus condition were understood. The
Michalewski et al. Page 4
Clin Neurophysiol. Author manuscript; available in PMC 2010 July 1.
NIH
-PA Author Manuscript
NIH
-PA Author Manuscript
NIH
-PA Author Manuscript
ongoing EEG was continuously monitored during recording for signs of slowing reflectingdrowsiness in the passive conditions, and disruptive muscle activity and movement-relatedartifact in the active conditions. Testing was paused until recording adjustments could be made.On-line averages were computed to each stimulus to monitor for any other unwanted artifactsdeveloping in the potentials. A short break of 5 -10 minutes occurred between conditions.
2.6 Recording and analysisScalp recordings were made from 8-mm diameter Ag/AgCl (sintered) electrodes at midlinesites Fz, Cz, and Pz referenced to linked mastoids. Ocular movements were monitored fromelectrodes located above and below the right eye. A ground electrode was attached at theforehead. A PC-based Neuroscan recording system (Scan) with SynAmps (biologicalamplifiers) was used to collect the EEG data. Amplifier bandpass was set between DC and 100Hz. Ongoing EEG was digitized (500 Hz), displayed, and stored to disk. Off-line, the digitizedrecords were adjusted for DC drift and were corrected for ocular artifact with Scan systemsoftware. The records were epoched off-line from coded stimuli to include a 100 ms pre-stimulus baseline period and an 800 ms post-stimulus period. Separate averages were computedto each tone sorted by loudness level (40 -100 dB SPL) in the passive conditions and correctresponses in the active conditions.
Individual averages were low-pass filtered (Butterworth) with an upper cutoff frequency of 30Hz (12 dB/octave slope). Peak latencies to N100 were measured from stimulus onset to peakmaximum; peak amplitudes were computed relative to the average pre-stimulus voltage to peakmaximum.
2.6.1. Normal subjects—Peak measures were separately evaluated using procedures basedon a general linear model (GLM). A multi-factor design (one between, four repeated) was usedto analyze evoked potential measures by sex, active and passive conditions, tones in quiet andnoise, intensity level, and electrode site (2 × 2 × 2 × 7 × 3 design) with Greenhouse-Geisercorrection. Post-hoc comparisons of the means for cortical and behavioral measures were testedwith the Tukey-Kramer multiple comparison procedure. The significance level was set at p <0.05; values of the test statistic and level of significance are reported.
In quiet, normal subjects displayed N100 potentials for the entire stimulus range (40 to 100 dBSPL). The presence of noise however affected identification of N100 potentials in the averagedpotentials evoked to tones. At 60 dB SPL and below (SNR ≥-30 db), cortical potentials to tonesin noise were no longer detected in the averages for normal subjects. At 70 dB SPL (SNR =-20 dB), N100 peaks were identified in nine of the 12 subjects and assigned zero amplitude ifabsent; correspondingly, peak latency was scored as missing. Since cortical responses couldnot be identified to 60 dB SPL tones in noise and below, the GLM analysis of tones in quietvs. tones in noise was conducted only on the intensity levels from 70 to 100 dB SPL (SNR =-20 to +10 dB). A separate ANOVA analysis over the entire intensity range (40 - 100 dB SPL)was performed for tones in quiet conditions to evaluate latency and amplitude effects.
Behavioral measures of accuracy and reaction time were analyzed using analysis of variance(ANOVA) procedures for repeated measures. Factors included gender, condition (tones inquiet, in noise), and intensity level (dB SPL). Accuracy was assessed as the percentage ofcorrectly detected tones (in quiet and in noise) over the 40 - 100 dB SPL intensity range.Reaction time measures to correct button presses were computed at each intensity level. Innoise, a no response was scored as missing and accuracy as zero.
2.6.2. AN subjects—Each of the AN subjects performed the tones in quiet and tones in noisein the passive conditions but because of time limitations and availability, only four of the eightsubjects were able to complete all four conditions (passive and active). We will present here
Michalewski et al. Page 5
Clin Neurophysiol. Author manuscript; available in PMC 2010 July 1.
NIH
-PA Author Manuscript
NIH
-PA Author Manuscript
NIH
-PA Author Manuscript
only the evoked potential results from the passive conditions with the single exception of thebehavioral results (accuracy and reaction time) from the normal hearing subjects in quiet andnoise. The order of the conditions was random whether two or four conditions were tested.Group comparisons between AN (n = 8) and normal hearing group (n = 12) to tones in quietand tones in noise (passive conditions) were evaluated using independent t-tests (for unequaln) at separate intensity levels, and dependent t-tests for measures within the AN group. Falsediscovery rate (FDR) procedures (Curran-Everett, 2000) were used in the evaluation of themultiple comparisons based on t-values; the FDR was set at 0.05. At least five AN subjectswere required for group comparisons with the normal hearing subjects. Group tests in noiseresulted in comparing only the intensities at 80, 90, and 100 dB SPL. Linear fit procedureswere used to evaluate slope measures of mean latency and amplitude as a function of intensity.Correlation procedures were used to examine the relationship in AN between psychoacousticmeasures of gap detection, speech, PTA for lower frequencies (0.5, 1.0 and 2.0 kHz), PTA forhigher frequencies (4.0, 6.0, and 8.0 kHz), threshold at 1.0 kHz, and N100 latency andamplitude (Table 1). N100 latency and amplitude to thresholds at 1.0 KHz tones were adjustedfor audibility differences between subjects. Recordings from the Cz electrode site are shownin the figures and graphs involving evoked potentials.
3. Results3.1. Grand averages
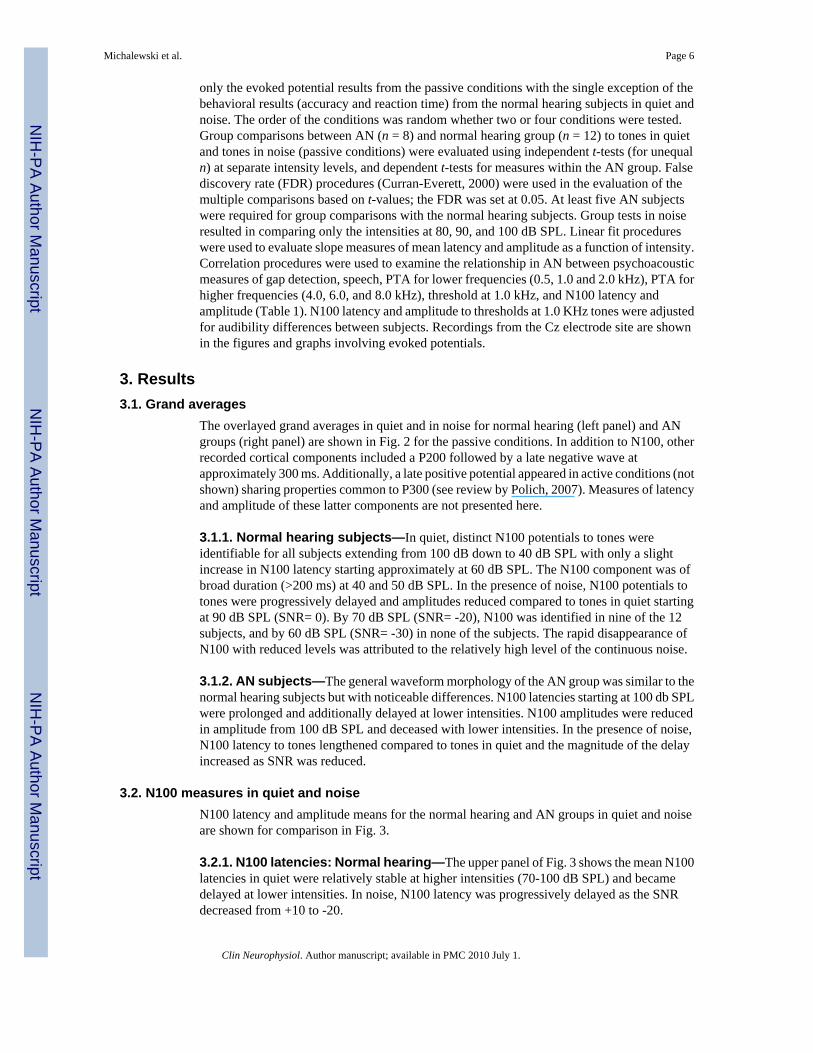
The overlayed grand averages in quiet and in noise for normal hearing (left panel) and ANgroups (right panel) are shown in Fig. 2 for the passive conditions. In addition to N100, otherrecorded cortical components included a P200 followed by a late negative wave atapproximately 300 ms. Additionally, a late positive potential appeared in active conditions (notshown) sharing properties common to P300 (see review by Polich, 2007). Measures of latencyand amplitude of these latter components are not presented here.
3.1.1. Normal hearing subjects—In quiet, distinct N100 potentials to tones wereidentifiable for all subjects extending from 100 dB down to 40 dB SPL with only a slightincrease in N100 latency starting approximately at 60 dB SPL. The N100 component was ofbroad duration (>200 ms) at 40 and 50 dB SPL. In the presence of noise, N100 potentials totones were progressively delayed and amplitudes reduced compared to tones in quiet startingat 90 dB SPL (SNR= 0). By 70 dB SPL (SNR= -20), N100 was identified in nine of the 12subjects, and by 60 dB SPL (SNR= -30) in none of the subjects. The rapid disappearance ofN100 with reduced levels was attributed to the relatively high level of the continuous noise.
3.1.2. AN subjects—The general waveform morphology of the AN group was similar to thenormal hearing subjects but with noticeable differences. N100 latencies starting at 100 db SPLwere prolonged and additionally delayed at lower intensities. N100 amplitudes were reducedin amplitude from 100 dB SPL and deceased with lower intensities. In the presence of noise,N100 latency to tones lengthened compared to tones in quiet and the magnitude of the delayincreased as SNR was reduced.
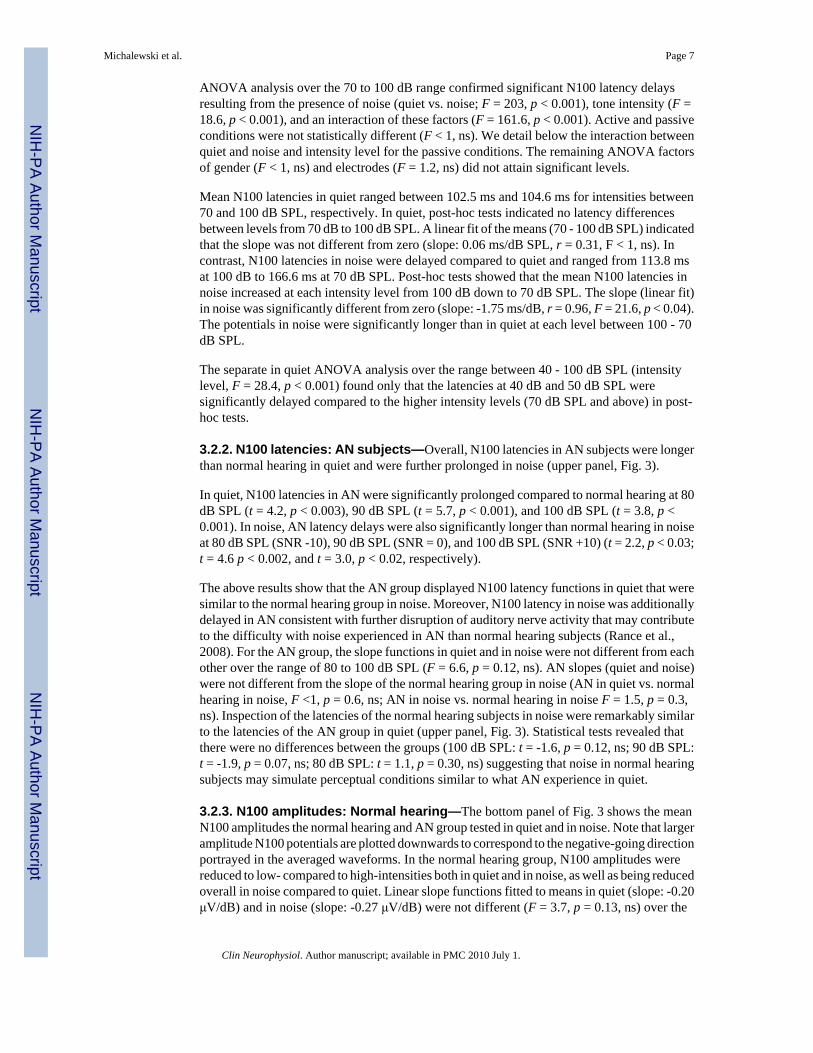
3.2. N100 measures in quiet and noiseN100 latency and amplitude means for the normal hearing and AN groups in quiet and noiseare shown for comparison in Fig. 3.
3.2.1. N100 latencies: Normal hearing—The upper panel of Fig. 3 shows the mean N100latencies in quiet were relatively stable at higher intensities (70-100 dB SPL) and becamedelayed at lower intensities. In noise, N100 latency was progressively delayed as the SNRdecreased from +10 to -20.
Michalewski et al. Page 6
Clin Neurophysiol. Author manuscript; available in PMC 2010 July 1.
NIH
-PA Author Manuscript
NIH
-PA Author Manuscript
NIH
-PA Author Manuscript
ANOVA analysis over the 70 to 100 dB range confirmed significant N100 latency delaysresulting from the presence of noise (quiet vs. noise; F = 203, p < 0.001), tone intensity (F =18.6, p < 0.001), and an interaction of these factors (F = 161.6, p < 0.001). Active and passiveconditions were not statistically different (F < 1, ns). We detail below the interaction betweenquiet and noise and intensity level for the passive conditions. The remaining ANOVA factorsof gender (F < 1, ns) and electrodes (F = 1.2, ns) did not attain significant levels.
Mean N100 latencies in quiet ranged between 102.5 ms and 104.6 ms for intensities between70 and 100 dB SPL, respectively. In quiet, post-hoc tests indicated no latency differencesbetween levels from 70 dB to 100 dB SPL. A linear fit of the means (70 - 100 dB SPL) indicatedthat the slope was not different from zero (slope: 0.06 ms/dB SPL, r = 0.31, F < 1, ns). Incontrast, N100 latencies in noise were delayed compared to quiet and ranged from 113.8 msat 100 dB to 166.6 ms at 70 dB SPL. Post-hoc tests showed that the mean N100 latencies innoise increased at each intensity level from 100 dB down to 70 dB SPL. The slope (linear fit)in noise was significantly different from zero (slope: -1.75 ms/dB, r = 0.96, F = 21.6, p < 0.04).The potentials in noise were significantly longer than in quiet at each level between 100 - 70dB SPL.
The separate in quiet ANOVA analysis over the range between 40 - 100 dB SPL (intensitylevel, F = 28.4, p < 0.001) found only that the latencies at 40 dB and 50 dB SPL weresignificantly delayed compared to the higher intensity levels (70 dB SPL and above) in post-hoc tests.
3.2.2. N100 latencies: AN subjects—Overall, N100 latencies in AN subjects were longerthan normal hearing in quiet and were further prolonged in noise (upper panel, Fig. 3).
In quiet, N100 latencies in AN were significantly prolonged compared to normal hearing at 80dB SPL (t = 4.2, p < 0.003), 90 dB SPL (t = 5.7, p < 0.001), and 100 dB SPL (t = 3.8, p <0.001). In noise, AN latency delays were also significantly longer than normal hearing in noiseat 80 dB SPL (SNR -10), 90 dB SPL (SNR = 0), and 100 dB SPL (SNR +10) (t = 2.2, p < 0.03;t = 4.6 p < 0.002, and t = 3.0, p < 0.02, respectively).
The above results show that the AN group displayed N100 latency functions in quiet that weresimilar to the normal hearing group in noise. Moreover, N100 latency in noise was additionallydelayed in AN consistent with further disruption of auditory nerve activity that may contributeto the difficulty with noise experienced in AN than normal hearing subjects (Rance et al.,2008). For the AN group, the slope functions in quiet and in noise were not different from eachother over the range of 80 to 100 dB SPL (F = 6.6, p = 0.12, ns). AN slopes (quiet and noise)were not different from the slope of the normal hearing group in noise (AN in quiet vs. normalhearing in noise, F <1, p = 0.6, ns; AN in noise vs. normal hearing in noise F = 1.5, p = 0.3,ns). Inspection of the latencies of the normal hearing subjects in noise were remarkably similarto the latencies of the AN group in quiet (upper panel, Fig. 3). Statistical tests revealed thatthere were no differences between the groups (100 dB SPL: t = -1.6, p = 0.12, ns; 90 dB SPL:t = -1.9, p = 0.07, ns; 80 dB SPL: t = 1.1, p = 0.30, ns) suggesting that noise in normal hearingsubjects may simulate perceptual conditions similar to what AN experience in quiet.
3.2.3. N100 amplitudes: Normal hearing—The bottom panel of Fig. 3 shows the meanN100 amplitudes the normal hearing and AN group tested in quiet and in noise. Note that largeramplitude N100 potentials are plotted downwards to correspond to the negative-going directionportrayed in the averaged waveforms. In the normal hearing group, N100 amplitudes werereduced to low- compared to high-intensities both in quiet and in noise, as well as being reducedoverall in noise compared to quiet. Linear slope functions fitted to means in quiet (slope: -0.20μV/dB) and in noise (slope: -0.27 μV/dB) were not different (F = 3.7, p = 0.13, ns) over the
Michalewski et al. Page 7
Clin Neurophysiol. Author manuscript; available in PMC 2010 July 1.
NIH
-PA Author Manuscript
NIH
-PA Author Manuscript
NIH
-PA Author Manuscript
70 to 100 dB SPL range. ANOVA amplitude differences were found between tones in quietand tones in noise (F = 16.8, p < 0.002), intensity level (F = 90.0, p < 0.001), and electrode(F = 45.3, p < 0.001). In quiet, amplitudes were significantly reduced at each level from 100to 80 dB SPL; in noise, amplitudes were reduced significantly at each level between 100 to 70dB SPL. The electrode effect indicated N100 potentials were larger over the Fz and Cz sitesthan for Pz, with no differences between Fz and Cz. Further, a sex effect (F = 5.4, p < 0.04)showed that amplitudes for females were overall larger, by approximately 1.7 μV, than formales. Amplitude differences between passive and active conditions (not shown) were withoutsignificant effect (F = 1.5, ns).
For the separate in quiet ANOVA analysis, N100 amplitudes (intensity level, F = 36.1, p <0.001) between 40 - 60 dB SPL were significantly smaller than at the higher 90 and 100 dBSPL intensity levels in post-hoc tests.
3.2.4. N100 amplitudes: AN subjects—Overall the AN group had smaller N100amplitudes in quiet than the normal hearing subjects which were further reduced in amplitudein the presence of noise (bottom panel, Fig. 3). In quiet, the AN group had smaller potentialsthan normal hearing but only the difference at 90 dB SPL (SNR = 0) attained significance (t =2.4, p = 0.03). In noise, N100 amplitudes were smaller in AN than normal hearing subjectswith significant differences at 100 dB SPL (SNR +10) and 90 dB SPL (SNR = 0) intensitylevels (t = 3.6, p < 0.002; t = 3.2, p < 0.004, respectively).
The slopes in quiet and noise were not different for either the AN group (all F-values < 1, ns;80 to 100 dB SPL), or the normal hearing group (all F-values < 1, ns; 70 to 100 dB SPL). Therewere also no differences in slopes comparing the AN group to the normal hearing group inquiet, or in noise (all F-values < 1, ns, over the 80 - 100 dB SPL range).
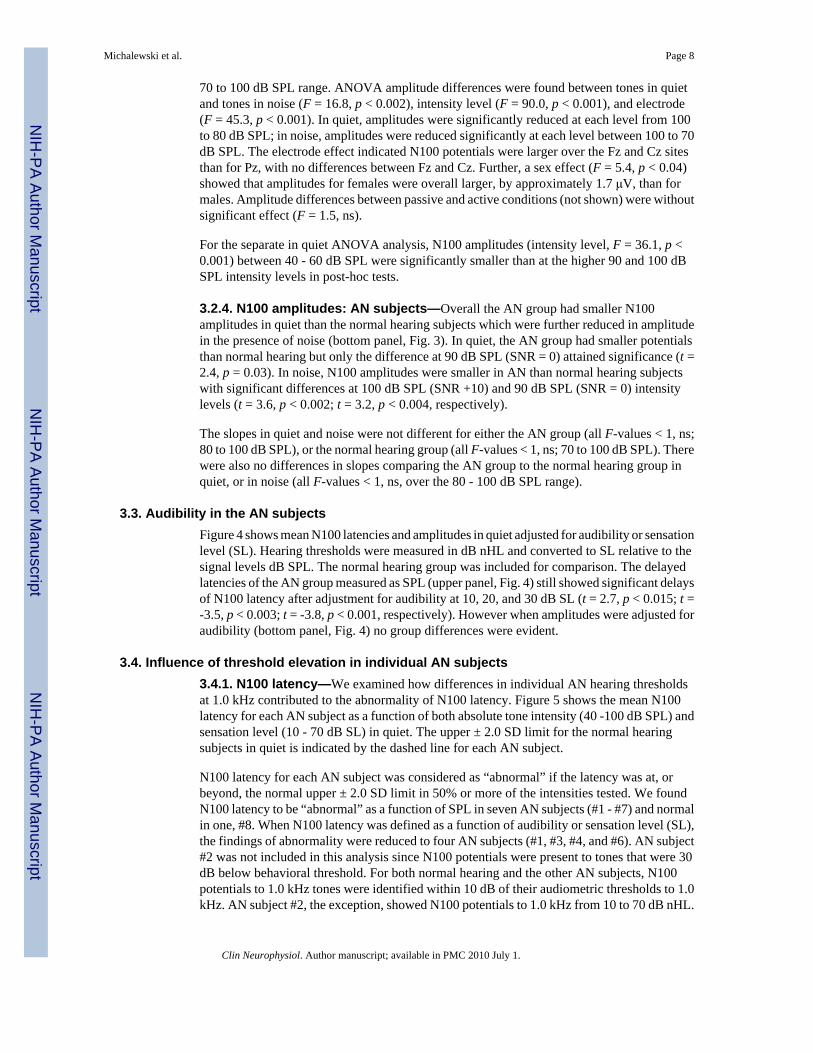
3.3. Audibility in the AN subjectsFigure 4 shows mean N100 latencies and amplitudes in quiet adjusted for audibility or sensationlevel (SL). Hearing thresholds were measured in dB nHL and converted to SL relative to thesignal levels dB SPL. The normal hearing group was included for comparison. The delayedlatencies of the AN group measured as SPL (upper panel, Fig. 4) still showed significant delaysof N100 latency after adjustment for audibility at 10, 20, and 30 dB SL (t = 2.7, p < 0.015; t =-3.5, p < 0.003; t = -3.8, p < 0.001, respectively). However when amplitudes were adjusted foraudibility (bottom panel, Fig. 4) no group differences were evident.
3.4. Influence of threshold elevation in individual AN subjects3.4.1. N100 latency—We examined how differences in individual AN hearing thresholdsat 1.0 kHz contributed to the abnormality of N100 latency. Figure 5 shows the mean N100latency for each AN subject as a function of both absolute tone intensity (40 -100 dB SPL) andsensation level (10 - 70 dB SL) in quiet. The upper ± 2.0 SD limit for the normal hearingsubjects in quiet is indicated by the dashed line for each AN subject.
N100 latency for each AN subject was considered as “abnormal” if the latency was at, orbeyond, the normal upper ± 2.0 SD limit in 50% or more of the intensities tested. We foundN100 latency to be “abnormal” as a function of SPL in seven AN subjects (#1 - #7) and normalin one, #8. When N100 latency was defined as a function of audibility or sensation level (SL),the findings of abnormality were reduced to four AN subjects (#1, #3, #4, and #6). AN subject#2 was not included in this analysis since N100 potentials were present to tones that were 30dB below behavioral threshold. For both normal hearing and the other AN subjects, N100potentials to 1.0 kHz tones were identified within 10 dB of their audiometric thresholds to 1.0kHz. AN subject #2, the exception, showed N100 potentials to 1.0 kHz from 10 to 70 dB nHL.
Michalewski et al. Page 8
Clin Neurophysiol. Author manuscript; available in PMC 2010 July 1.
NIH
-PA Author Manuscript
NIH
-PA Author Manuscript
NIH
-PA Author Manuscript
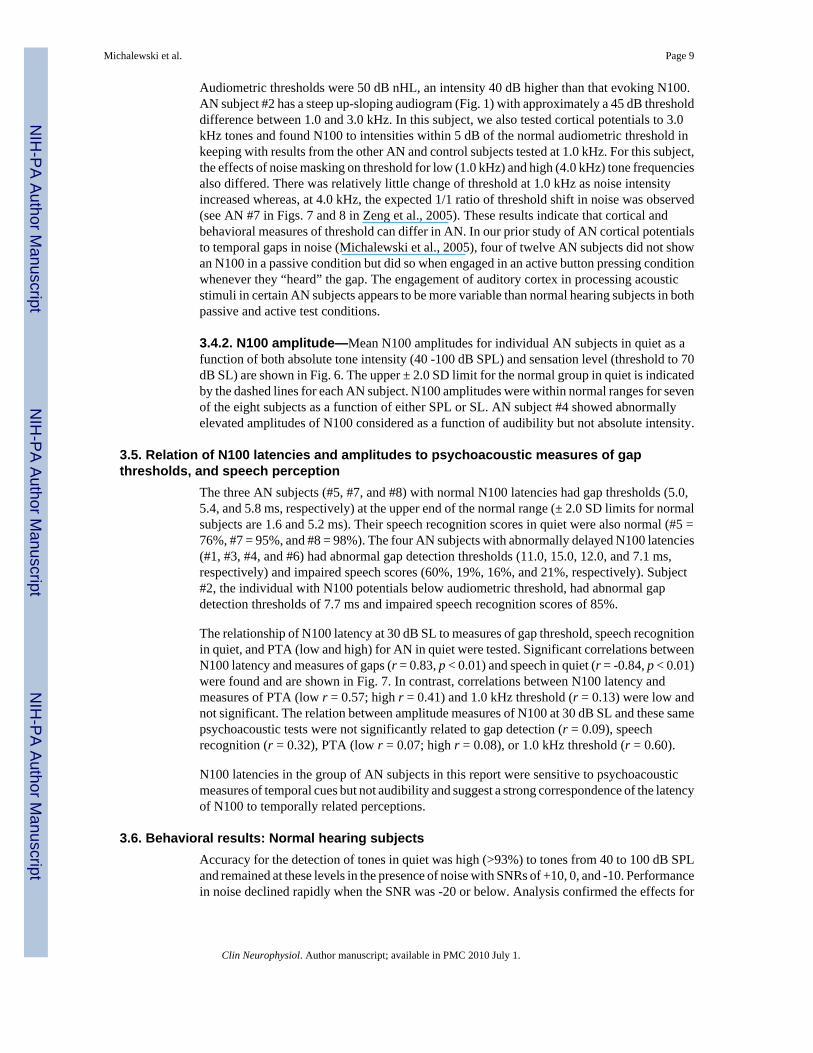
Audiometric thresholds were 50 dB nHL, an intensity 40 dB higher than that evoking N100.AN subject #2 has a steep up-sloping audiogram (Fig. 1) with approximately a 45 dB thresholddifference between 1.0 and 3.0 kHz. In this subject, we also tested cortical potentials to 3.0kHz tones and found N100 to intensities within 5 dB of the normal audiometric threshold inkeeping with results from the other AN and control subjects tested at 1.0 kHz. For this subject,the effects of noise masking on threshold for low (1.0 kHz) and high (4.0 kHz) tone frequenciesalso differed. There was relatively little change of threshold at 1.0 kHz as noise intensityincreased whereas, at 4.0 kHz, the expected 1/1 ratio of threshold shift in noise was observed(see AN #7 in Figs. 7 and 8 in Zeng et al., 2005). These results indicate that cortical andbehavioral measures of threshold can differ in AN. In our prior study of AN cortical potentialsto temporal gaps in noise (Michalewski et al., 2005), four of twelve AN subjects did not showan N100 in a passive condition but did so when engaged in an active button pressing conditionwhenever they “heard” the gap. The engagement of auditory cortex in processing acousticstimuli in certain AN subjects appears to be more variable than normal hearing subjects in bothpassive and active test conditions.
3.4.2. N100 amplitude—Mean N100 amplitudes for individual AN subjects in quiet as afunction of both absolute tone intensity (40 -100 dB SPL) and sensation level (threshold to 70dB SL) are shown in Fig. 6. The upper ± 2.0 SD limit for the normal group in quiet is indicatedby the dashed lines for each AN subject. N100 amplitudes were within normal ranges for sevenof the eight subjects as a function of either SPL or SL. AN subject #4 showed abnormallyelevated amplitudes of N100 considered as a function of audibility but not absolute intensity.
3.5. Relation of N100 latencies and amplitudes to psychoacoustic measures of gapthresholds, and speech perception
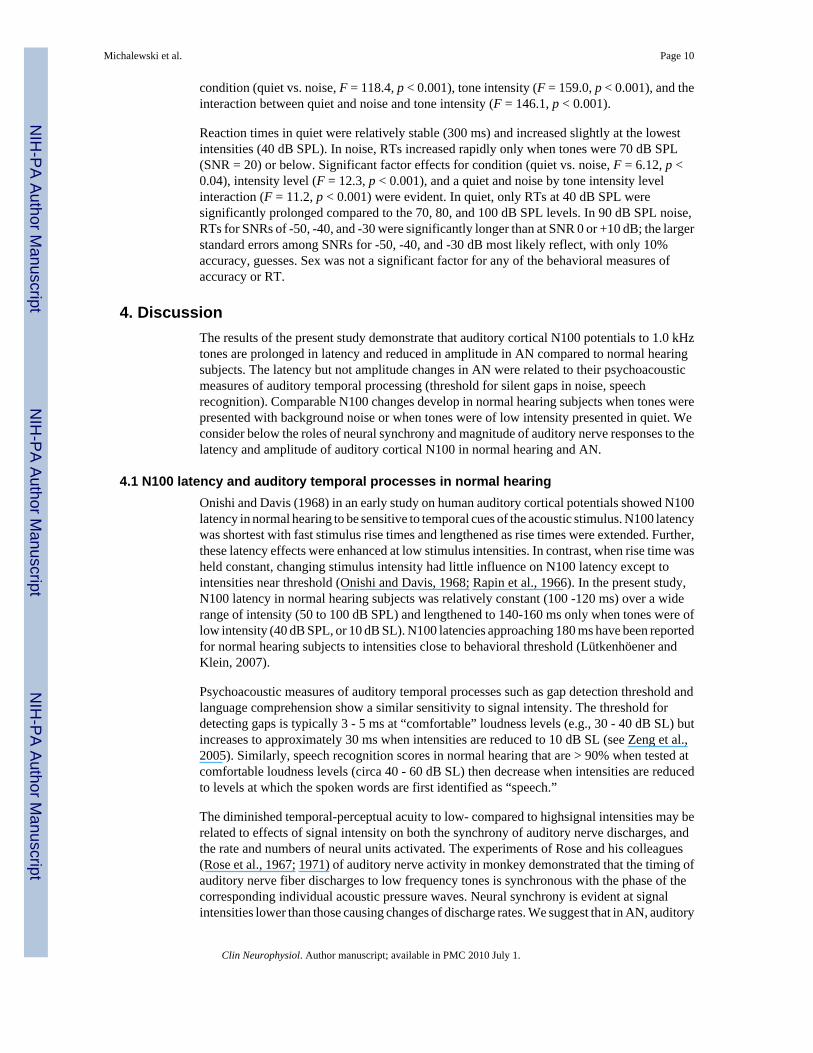
The three AN subjects (#5, #7, and #8) with normal N100 latencies had gap thresholds (5.0,5.4, and 5.8 ms, respectively) at the upper end of the normal range (± 2.0 SD limits for normalsubjects are 1.6 and 5.2 ms). Their speech recognition scores in quiet were also normal (#5 =76%, #7 = 95%, and #8 = 98%). The four AN subjects with abnormally delayed N100 latencies(#1, #3, #4, and #6) had abnormal gap detection thresholds (11.0, 15.0, 12.0, and 7.1 ms,respectively) and impaired speech scores (60%, 19%, 16%, and 21%, respectively). Subject#2, the individual with N100 potentials below audiometric threshold, had abnormal gapdetection thresholds of 7.7 ms and impaired speech recognition scores of 85%.
The relationship of N100 latency at 30 dB SL to measures of gap threshold, speech recognitionin quiet, and PTA (low and high) for AN in quiet were tested. Significant correlations betweenN100 latency and measures of gaps (r = 0.83, p < 0.01) and speech in quiet (r = -0.84, p < 0.01)were found and are shown in Fig. 7. In contrast, correlations between N100 latency andmeasures of PTA (low r = 0.57; high r = 0.41) and 1.0 kHz threshold (r = 0.13) were low andnot significant. The relation between amplitude measures of N100 at 30 dB SL and these samepsychoacoustic tests were not significantly related to gap detection (r = 0.09), speechrecognition (r = 0.32), PTA (low r = 0.07; high r = 0.08), or 1.0 kHz threshold (r = 0.60).
N100 latencies in the group of AN subjects in this report were sensitive to psychoacousticmeasures of temporal cues but not audibility and suggest a strong correspondence of the latencyof N100 to temporally related perceptions.
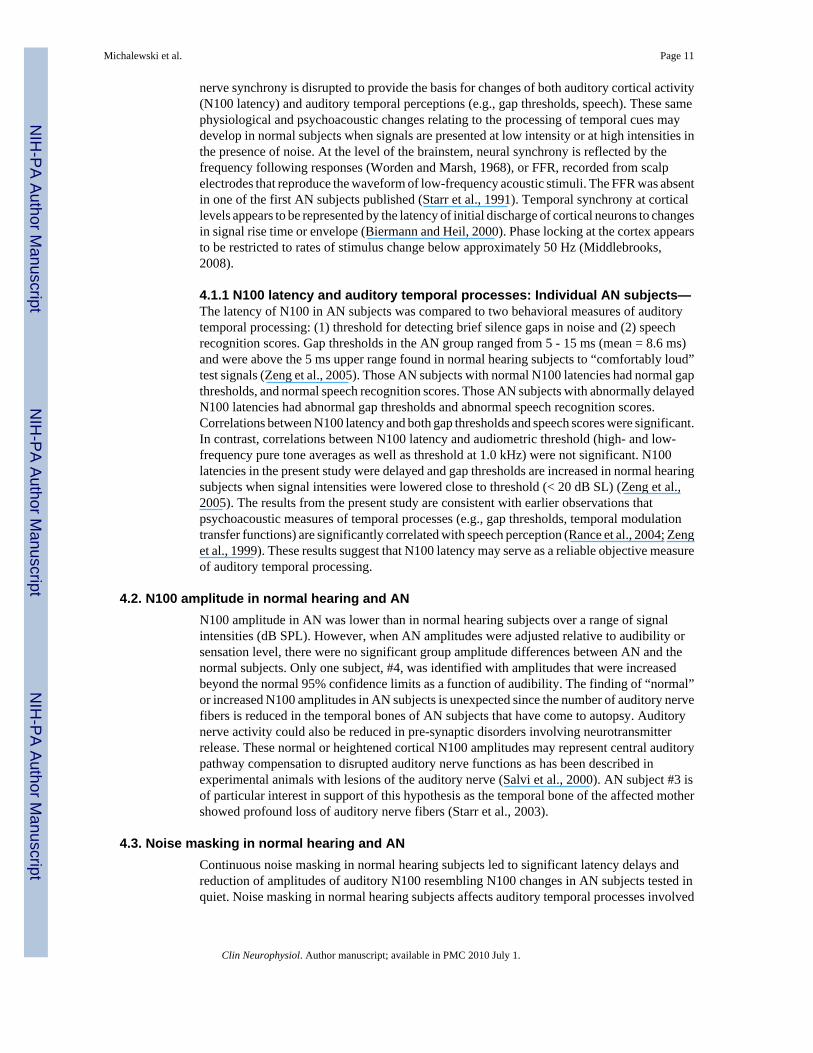
3.6. Behavioral results: Normal hearing subjectsAccuracy for the detection of tones in quiet was high (>93%) to tones from 40 to 100 dB SPLand remained at these levels in the presence of noise with SNRs of +10, 0, and -10. Performancein noise declined rapidly when the SNR was -20 or below. Analysis confirmed the effects for
Michalewski et al. Page 9
Clin Neurophysiol. Author manuscript; available in PMC 2010 July 1.
NIH
-PA Author Manuscript
NIH
-PA Author Manuscript
NIH
-PA Author Manuscript
condition (quiet vs. noise, F = 118.4, p < 0.001), tone intensity (F = 159.0, p < 0.001), and theinteraction between quiet and noise and tone intensity (F = 146.1, p < 0.001).
Reaction times in quiet were relatively stable (300 ms) and increased slightly at the lowestintensities (40 dB SPL). In noise, RTs increased rapidly only when tones were 70 dB SPL(SNR = 20) or below. Significant factor effects for condition (quiet vs. noise, F = 6.12, p <0.04), intensity level (F = 12.3, p < 0.001), and a quiet and noise by tone intensity levelinteraction (F = 11.2, p < 0.001) were evident. In quiet, only RTs at 40 dB SPL weresignificantly prolonged compared to the 70, 80, and 100 dB SPL levels. In 90 dB SPL noise,RTs for SNRs of -50, -40, and -30 were significantly longer than at SNR 0 or +10 dB; the largerstandard errors among SNRs for -50, -40, and -30 dB most likely reflect, with only 10%accuracy, guesses. Sex was not a significant factor for any of the behavioral measures ofaccuracy or RT.
4. DiscussionThe results of the present study demonstrate that auditory cortical N100 potentials to 1.0 kHztones are prolonged in latency and reduced in amplitude in AN compared to normal hearingsubjects. The latency but not amplitude changes in AN were related to their psychoacousticmeasures of auditory temporal processing (threshold for silent gaps in noise, speechrecognition). Comparable N100 changes develop in normal hearing subjects when tones werepresented with background noise or when tones were of low intensity presented in quiet. Weconsider below the roles of neural synchrony and magnitude of auditory nerve responses to thelatency and amplitude of auditory cortical N100 in normal hearing and AN.
4.1 N100 latency and auditory temporal processes in normal hearingOnishi and Davis (1968) in an early study on human auditory cortical potentials showed N100latency in normal hearing to be sensitive to temporal cues of the acoustic stimulus. N100 latencywas shortest with fast stimulus rise times and lengthened as rise times were extended. Further,these latency effects were enhanced at low stimulus intensities. In contrast, when rise time washeld constant, changing stimulus intensity had little influence on N100 latency except tointensities near threshold (Onishi and Davis, 1968; Rapin et al., 1966). In the present study,N100 latency in normal hearing subjects was relatively constant (100 -120 ms) over a widerange of intensity (50 to 100 dB SPL) and lengthened to 140-160 ms only when tones were oflow intensity (40 dB SPL, or 10 dB SL). N100 latencies approaching 180 ms have been reportedfor normal hearing subjects to intensities close to behavioral threshold (Lütkenhöener andKlein, 2007).
Psychoacoustic measures of auditory temporal processes such as gap detection threshold andlanguage comprehension show a similar sensitivity to signal intensity. The threshold fordetecting gaps is typically 3 - 5 ms at “comfortable” loudness levels (e.g., 30 - 40 dB SL) butincreases to approximately 30 ms when intensities are reduced to 10 dB SL (see Zeng et al.,2005). Similarly, speech recognition scores in normal hearing that are > 90% when tested atcomfortable loudness levels (circa 40 - 60 dB SL) then decrease when intensities are reducedto levels at which the spoken words are first identified as “speech.”
The diminished temporal-perceptual acuity to low- compared to highsignal intensities may berelated to effects of signal intensity on both the synchrony of auditory nerve discharges, andthe rate and numbers of neural units activated. The experiments of Rose and his colleagues(Rose et al., 1967; 1971) of auditory nerve activity in monkey demonstrated that the timing ofauditory nerve fiber discharges to low frequency tones is synchronous with the phase of thecorresponding individual acoustic pressure waves. Neural synchrony is evident at signalintensities lower than those causing changes of discharge rates. We suggest that in AN, auditory
Michalewski et al. Page 10
Clin Neurophysiol. Author manuscript; available in PMC 2010 July 1.
NIH
-PA Author Manuscript
NIH
-PA Author Manuscript
NIH
-PA Author Manuscript
nerve synchrony is disrupted to provide the basis for changes of both auditory cortical activity(N100 latency) and auditory temporal perceptions (e.g., gap thresholds, speech). These samephysiological and psychoacoustic changes relating to the processing of temporal cues maydevelop in normal subjects when signals are presented at low intensity or at high intensities inthe presence of noise. At the level of the brainstem, neural synchrony is reflected by thefrequency following responses (Worden and Marsh, 1968), or FFR, recorded from scalpelectrodes that reproduce the waveform of low-frequency acoustic stimuli. The FFR was absentin one of the first AN subjects published (Starr et al., 1991). Temporal synchrony at corticallevels appears to be represented by the latency of initial discharge of cortical neurons to changesin signal rise time or envelope (Biermann and Heil, 2000). Phase locking at the cortex appearsto be restricted to rates of stimulus change below approximately 50 Hz (Middlebrooks,2008).
4.1.1 N100 latency and auditory temporal processes: Individual AN subjects—The latency of N100 in AN subjects was compared to two behavioral measures of auditorytemporal processing: (1) threshold for detecting brief silence gaps in noise and (2) speechrecognition scores. Gap thresholds in the AN group ranged from 5 - 15 ms (mean = 8.6 ms)and were above the 5 ms upper range found in normal hearing subjects to “comfortably loud”test signals (Zeng et al., 2005). Those AN subjects with normal N100 latencies had normal gapthresholds, and normal speech recognition scores. Those AN subjects with abnormally delayedN100 latencies had abnormal gap thresholds and abnormal speech recognition scores.Correlations between N100 latency and both gap thresholds and speech scores were significant.In contrast, correlations between N100 latency and audiometric threshold (high- and low-frequency pure tone averages as well as threshold at 1.0 kHz) were not significant. N100latencies in the present study were delayed and gap thresholds are increased in normal hearingsubjects when signal intensities were lowered close to threshold (< 20 dB SL) (Zeng et al.,2005). The results from the present study are consistent with earlier observations thatpsychoacoustic measures of temporal processes (e.g., gap thresholds, temporal modulationtransfer functions) are significantly correlated with speech perception (Rance et al., 2004; Zenget al., 1999). These results suggest that N100 latency may serve as a reliable objective measureof auditory temporal processing.
4.2. N100 amplitude in normal hearing and ANN100 amplitude in AN was lower than in normal hearing subjects over a range of signalintensities (dB SPL). However, when AN amplitudes were adjusted relative to audibility orsensation level, there were no significant group amplitude differences between AN and thenormal subjects. Only one subject, #4, was identified with amplitudes that were increasedbeyond the normal 95% confidence limits as a function of audibility. The finding of “normal”or increased N100 amplitudes in AN subjects is unexpected since the number of auditory nervefibers is reduced in the temporal bones of AN subjects that have come to autopsy. Auditorynerve activity could also be reduced in pre-synaptic disorders involving neurotransmitterrelease. These normal or heightened cortical N100 amplitudes may represent central auditorypathway compensation to disrupted auditory nerve functions as has been described inexperimental animals with lesions of the auditory nerve (Salvi et al., 2000). AN subject #3 isof particular interest in support of this hypothesis as the temporal bone of the affected mothershowed profound loss of auditory nerve fibers (Starr et al., 2003).
4.3. Noise masking in normal hearing and ANContinuous noise masking in normal hearing subjects led to significant latency delays andreduction of amplitudes of auditory N100 resembling N100 changes in AN subjects tested inquiet. Noise masking in normal hearing subjects affects auditory temporal processes involved
Michalewski et al. Page 11
Clin Neurophysiol. Author manuscript; available in PMC 2010 July 1.
NIH
-PA Author Manuscript
NIH
-PA Author Manuscript
NIH
-PA Author Manuscript
in speech recognition and thresholds for gap detection resembling the impairments experiencedby AN tested in quiet (see Whiting et al., 1998).
One of the peripheral mechanisms involved in noise masking is its effect in activating auditorynerve fibers to interfere with synchronous responses to other signals, a phenomenon commonlyreferred to as “the line-busy effect.” The interference has been shown to be enhanced forauditory nerve fibers with “best” frequencies distant from the stimulus tone's frequencyresulting in an overall decrease in the numbers of auditory nerve fibers that respondsynchronously (Miller et al., 1987).
Auditory neuropathy subjects tested in quiet behave as if they were in a “noisy” environment.Compared to normal hearing subjects, AN thresholds for 1.0 kHz tones are elevated byapproximately 20 dB over a wide range of background noise levels (Zeng et al., 2005).Moreover, identification of spondees in noise for AN subjects requires a higher SNR(approximately 10 dB) compared to normal hearing subjects (Rance et al., 2007). The maskingfunctions in both of these studies showed marked individual variability between AN subjectsand may account for clinical reports that the ability of AN subjects to understand speech bothin quiet and in noise vary widely (Sinninger and Oba, 2001).
The concept of “noise” as a factor relating auditory temporal processing disorders in AN tothose accompanying noise masking in normal hearing is superficially attractive but difficult tosubstantiate. We favor the idea that the disrupted auditory nerve activity in AN actuallyprovides “background neural noise” that competes with those nerves that still respondsomewhat synchronously.
We suggest that the desynchronous auditory nerve activity in AN is a likely source of “neuralnoise” that, in effect, competes with activity from those nerves that still respond somewhatsynchronously. This model suggests that for AN subjects, acoustic signals presented in quiet,would be represented centrally similarly to that found in normal hearing subjects to acousticsignals presented in noise. The finding that the latency delays of N100 in AN to signalspresented in quiet were similar to N100 delays recorded from normal hearing subjects in noiselends support to this possibility. Moreover, for AN, the addition of environmental noise isaccompanied by further N100 delays and increasing difficulty to discriminate temporal cuescompared to normal hearing subjects presented with the same degree of noise masking.
5. Translational ImplicationsThe results from the present study provide evidence that auditory nerve synchrony may bereflected by the latency of auditory cortical N100. The latency of auditory N100 in AN wasrelated to perceptual measures of impaired auditory temporal processes including speechperception and threshold for detecting silent gaps in noise but not to audibility measures. Wesuggest that the definition of N100 latency could provide objective measures of disruptedauditory nerve activity in infants, children, and those adults whose auditory temporalprocessing abilities may be difficult to assess by behavioral measures.
AcknowledgementsWe would like to thank Drs. Jon Shallop, Mayo Clinic Rochester, Chuck Berlin, Kresge Hearing Research Laboratory,and Yvonne Sininger, University of California, Los Angeles for referring candidate subjects with auditory neuropathy.We also thank Tin T. Nguyen for assisting in testing the normal hearing subjects.
The authors appreciate the comments of Drs. Hillel Pratt and Lenny Kitzes on early versions of the manuscript. Thisresearch was supported by grant DC-02618 from the National Institutes of Health.
This research was supported by grant DC-02618 from the National Institutes of Health
Michalewski et al. Page 12
Clin Neurophysiol. Author manuscript; available in PMC 2010 July 1.
NIH
-PA Author Manuscript
NIH
-PA Author Manuscript
NIH
-PA Author Manuscript

ReferencesBahmad F Jr, Merchant SN, Nadol JB Jr, Tranebjaerg L. Otopathology in Mohr-Tranebjaerg syndrome.
Laryngoscope 2007;117:1202–1208. [PubMed: 17471106]Bench J, Kowal A, Bamford J. The BKB (Bamford-Kowal-Bench) sentence lists for partially-hearing
children. Br J Audiol 1979;13:108–112. [PubMed: 486816]Biermann S, Heil P. Parallels between timing of onset responses of single neurons in cat and of evoked
magnetic fields in human auditory cortex. J Neurophysiol 2000;84:2426–2439. [PubMed: 11067985]Berlin CI, Hood L, Morlet T, Rose K, Brashears S. Auditory neuropathy/dys-synchrony: Diagnosis and
Management. Ment Retard Dev Disabil Res Rev 2003;9:225–231. [PubMed: 14648814]Curran-Everett D. Multiple comparisons: philosophies and illustrations. Am J Physiol Regul Integr Comp
Physiol 2000;279:1–8.Davis H, Bowers C, Hirsh SK. Relations of the human vertex potential to acoustic input: Loudness and
masking. J Acoust Soc Am 1968;43:431–438. [PubMed: 5640948]Derbyshire AJ, Davis H. The action potentials of the auditory nerve. Am J Physiol 1935;113:476–504.Gifford RH, Shallop JK, Peterson AM. Speech recognition materials and ceiling effects: Considerations
for cochlear implant programs. Audiol Neurootol 2008;13:193–205. [PubMed: 18212519]Hallpike CS, Harriman DG, Wells E. A case of afferent neuropathy and deafness. J Laryngol Otol
1980;94:945–964. [PubMed: 7430804]Hellstrom LI, Schmiedt RA. Rate/level functions of auditory-nerve fibers in young and quiet-aged gerbils.
Hear Res 1991;53:217–222. [PubMed: 1880076]Kraus N, McGee T, Ferre J, Hoeppner J, Carrell T, Sharma A, Nicol T. Mismatch negativity in the
neurophysiologic/behavioral evaluation of auditory processing deficits: A case study. Ear Hear1993;14:223–234. [PubMed: 8405727]
Kraus N, Bradlow AR, Cheatham MA, Cunningham J, Kind CD, Koch DB, Nicol TG, Mcgee TJ, SteinLK, Wright BA. Consequences of neural asynchrony: A case of auditory neuropathy. J Assoc ResOtolaryngol 2000;1:33–45. [PubMed: 11548236]
Lütkenhöener B, Klein JS. Auditory evoked field at threshold. Hear Res 2007;228:188–200. [PubMed:17434696]
Michalewski HJ, Starr A, Nguyen TT, Kong Y-Y, Zeng FG. Auditory temporal processes in normal-hearing individuals and in patients with auditory neuropathy. Clin Neurophysiol 2005;116:669–680.[PubMed: 15721081]
Middlebrooks JC. Auditory cortex phase locking to amplitude-modulated cochlear implant pulse trains.J Neurophysiol 2008;100:76–91. [PubMed: 18367697]
Miller MI, Barta PE, Sachs MB. Strategies for the representation of a tone in background noise in thetemporal aspects of the discharge patterns of auditory-nerve fibers. J Acoust Soc Am 1987;81:665–679. [PubMed: 3584674]
Narne VK, Vanaja CS. Speech identification and cortical potentials in individuals with auditoryneuropathy. Behav Brain Functions 2008;4:15.
Onishi S, Davis H. Effects of duration and rise time of tone bursts on evoked V potentials. J Acoust SocAm 1968;44:582–591. [PubMed: 5665530]
Phillips DP. Neural representation of sound amplitude in the auditory cortex: Effects of noise masking.Behav Brain Res 1990;37:197–214. [PubMed: 2340096]
Picton TW, Woods DL, Baribeau-Braun J, Healey TMG. Evoked potential audiometry. J Otolaryngol1977;2:90–119.
Polich J. Updating P300: An integrative theory of P3a and P3b. Clin Neurophysiol 2007;118:2128–2148.[PubMed: 17573239]
Powers NL, Salvi RJ, Wang J, Spongr V, Qiu CX. Elevation of auditory threshold by spontaneouscochlear oscillations. Nature 1995;375:585–587. [PubMed: 7791874]
Rance G. Auditory neuropathy/dys-synchrony and its perceptual consequences. Trends Amplif 2005;9:1–43. [PubMed: 15920648]
Rance G, Cone-Wesson B, Wunderlich J, Dowell R. Speech perception and cortical evoked potentials inchildren with auditory neuropathy. Ear Hear 2002;23:239–253. [PubMed: 12072616]
Michalewski et al. Page 13
Clin Neurophysiol. Author manuscript; available in PMC 2010 July 1.
NIH
-PA Author Manuscript
NIH
-PA Author Manuscript
NIH
-PA Author Manuscript
Rance G, McKay C, Grayden D. Perceptual characterization of children with auditory neuropathy. EarHear 2004;25:34–46. [PubMed: 14770016]
Rance G, Barke E, Mook M, Dowell R, Rincon A, Garratt R. Speech perception in noise for childrenwith auditory neuropathy/dys-synchrony type hearing loss. Ear Hear 2007;28:351–360. [PubMed:17485984]
Rance G, Fava R, Baldock H, Chong A, Barker E, Corben L, Delatycki MB. Speech perception abilityin individuals with Freidreich ataxia. Brain 2008;131:2002–2012. [PubMed: 18515321]
Rapin I, Schimmel H, Tourk LM, Krasnegor NA, Pollak C. Evoked responses to clicks and tones ofvarying intensity in waking adults. Electroencephalogr Clin Neurophysiol 1966;21:335–344.[PubMed: 4162205]
Rodríguez-Ballesteros M, del Castillo FJ, Martín Y, Moreno-Pelayo MA, Morera C, Prieto F, Marco J,Morant A, Gallo-Terán J, Morales-Angulo C, Navas C, Trinidad G, Tapia MC, Moreno F, del CastilloI. Auditory neuropathy in patients carrying mutations in the otoferlin gene (OTOF). Hum Mutat2003;22:451–456. [PubMed: 14635104]
Rodríguez-Ballesteros M, Reynoso R, Olarte M, Villamar M, Morera C, Santarelli R, Arslan E, Medá C,Curet C, Völter C, Sainz-Quevedo M, Castorina P, Ambrosetti U, Berrettini S, Frei K, Tedín S, SmithJ, Cruz Tapia M, Cavallé L, Gelvez N, Primignani P, Gómez-Rosas E, Martín M, Moreno-PelayoMA, Tamayo M, Moreno-Barral J, Moreno F, del Castillo I. A multicenter study on the prevalenceand spectrum of mutations in the otoferlin gene (OTOF) in subjects with nonsyndromic hearingimpairment and auditory neuropathy. Hum Mutat 2008;29:823–831. [PubMed: 18381613]
Roux I, Safieddine S, Nouvian R, Grati M, Simmler MC, Bahloul A, Perfettini I, Le Gall M, Rostaing P,Hamard G, Triller A, Avan P, Moser T, Petit C. Otoferline, defective in human deafness form, isessential for exocytosis at the auditory ribbon synapse. Cell 2006;127:277–289. [PubMed: 17055430]
Rose JE, Hind JE, Anderson DJ, Brugge JF. Some effects of stimulus intensity on response of auditorynerve fibers in the squirrel monkey. J Neurophysiol 1967;30:769–793. [PubMed: 4962851]
Rose JE, Hind JE, Anderson DJ, Brugge JF. Phase-locked response to low-frequency tones in singleauditory nerve fibers of the squirrel monkey. J Neurophysiol 1971;34:685–699. [PubMed: 5000366]
Salvi RJ, Wang J, Ding D. Auditory plasticity and hyperactivity following cochlear damage. Hear Res2000;147:261–274. [PubMed: 10962190]
Sininger, Y.; Oba, S. Patients with auditory neuropathy: Who are they and what can they hear?. In:Sininger, Y.; Starr, A., editors. Auditory Neuropathy: A new Perspective on Hearing Disorders.Singular; San Diego, CA: 2001. p. 15-35.
Satya-Murti S, Wolpaw JR, Cacace AT, Schaffer CA. Late auditory evoked potentials can occur withoutbrain stem potentials. Electroencephalogr Clin Neurophysiol 1983;56:304–308. [PubMed: 6193943]
Spoendlin H. Optic and cochleovestibular degenerations in hereditary ataxias. II. Temporal bonepathology in two cases of Freidreich's ataxia with vestibule-cochlear disorders. Brain 1974;97:41–48. [PubMed: 4434170]
Starr, A. A classification of auditory neuropathy: Lessons from patients, physiology, and genetics. In:Kaga, K.; Starr, A., editors. Neuropathies of the auditory and vestibular eighth cranial nerves.Springer; Japan: 2009. p. 3-9.
Starr A, McPherson D, Patterson JV, Don M, Luxford WM, Shannon R, Sininger Y, Tonokawa LT,Waring M. Absence of both auditory evoked potentials and auditory percepts dependent on timingcues. Brain 1991;114:1157–1180. [PubMed: 2065245]
Starr A, Picton T, Sininger Y, Hood LJ, Berlin CI. Auditory neuropathy. Brain 1996;119:741–753.[PubMed: 8673487]
Starr A, Sininger Y, Winter M, Dereberry MJ, Oba S, Michalewski HJ. Transient deafness due totemperature-sensitive auditory neuropathy. Ear Hear 1998;19:169–179. [PubMed: 9657592]
Starr A, Michalewski HJ, Zeng F-G, Fujikawa-Brooks S, Linthicum F, Kim CS, Winnier D, Keats B.Pathology and physiology of auditory neuropathy with a novel mutation in the MPZ gene(tyr145→Ser). Brain 2003;126:1604–1619. [PubMed: 12805115]
Starr A, Sininger Y, Nguyen T, Michalewski HJ, Oba S, Abdala C. Cochlear receptor (microphonic andsummating potentials, otoacoustic emissions) and auditory pathway (auditory brainstem potentialsactivity) in auditory neuropathy. Ear Hear 2001;22:91–99. [PubMed: 11324847]
Michalewski et al. Page 14
Clin Neurophysiol. Author manuscript; available in PMC 2010 July 1.
NIH
-PA Author Manuscript
NIH
-PA Author Manuscript
NIH
-PA Author Manuscript
Starr A, Michalewski HJ, Zeng FG, Fujikawa-Brooks S, Linthicum F, Kim CS, Winnier D, Keats B.Pathology and physiology of auditory neuropathy with a novel mutation in the MPZ gene (Tyr145->Ser). Brain 2003;126:1604–1619. [PubMed: 12805115]
Starr A, Isaacson B, Michalewski HJ, Zeng FG, Kong YY, Beale P, Paulson GW, Keats B, LesperanceMM. A dominantly inherited progressive deafness affecting distal auditory nerve and hair cells. JAssoc Res Otolaryngol 2004;5:411–426. [PubMed: 15675004]
Starr, A.; Zeng, FG.; Michalewski, HJ.; Moser, T. Perspectives on auditory neuropathy: Disorders ofinner hair cell, auditory nerve, and their synapse. In: Dallos, P.; Oertel, D., editors. The Senses: Acomprehensive reference. Vol. Vol 3. Elsevier; Amsterdam: 2008. p. 397-412.
Varga R, Kelley PM, Keats BJ, Starr A, Leal SM, Cohn E, Kimberling WJ. Nonsyndromic recessiveauditory neuropathy is the result of mutations in the otoferlin (OTOF) gene. J Med Genet 2003;40:45–50. [PubMed: 12525542]
Varga R, Avenarius MR, Kelley PM, Keats BJ, Berlin CI, Hood LJ, Morlet TG, Brashears SM, Starr A,Cohn ES, Smith RJ, Kimberling WJ. OTOF mutations revealed by genetic analysis of hearing lossfamilies including a potential temperature sensitive auditory neuropathy allele. J Med Genet2006;43:576–581. [PubMed: 16371502]
Vinay, Moore BC. Ten(HL)-test results and psychophysical tuning curves for subjects with auditoryneuropathy. Int J Audiol 2007;46:39–46. [PubMed: 17365054]
Warden FG, Marsh JT. Frequency-following (microphonic-like) neural responses evoked by sound.Electroencephalogr Clin Neurophysiol 1968;25:42–52. [PubMed: 4174782]
Werner LA, Folsom RC, Mancl LR, Syapin CL. Hunan auditory brainstem response to temporal gaps innoise. J Speech Lang Hear Res 2001;44:737–750. [PubMed: 11521768]
Whiting KA, Martin BA, Stapells DR. The effects of broadbran noise masking on cortical event-relatedpotentials to speech sounds /ba/ and /da/. Ear Hear 1998;19:218–231. [PubMed: 9657596]
Zeng FG, Oba S, Garde S, Sininger YS, Starr A. Temporal and speech processing deficits in auditoryneuropathy. Neuroreport 1999;10:3429–3435. [PubMed: 10599857]
Zeng FG, Kong YY, Michalewski HJ, Starr A. Perceptual consequences of disrupted auditory nerveactivity. J Neurophysiol 2005;93:3050–3063. [PubMed: 15615831]
Zeng FG, Liu S. Speech perception in individuals with auditory neuropathy. J Speech Lang Hear Res2006;49:367–380. [PubMed: 16671850]
Michalewski et al. Page 15
Clin Neurophysiol. Author manuscript; available in PMC 2010 July 1.
NIH
-PA Author Manuscript
NIH
-PA Author Manuscript
NIH
-PA Author Manuscript

Figure 1.Pure tone audiograms are shown for each auditory neuropathy subject. The audiogramscorrespond to the ear used (Table 1) for testing auditory evoked potentials.
Michalewski et al. Page 16
Clin Neurophysiol. Author manuscript; available in PMC 2010 July 1.
NIH
-PA Author Manuscript
NIH
-PA Author Manuscript
NIH
-PA Author Manuscript
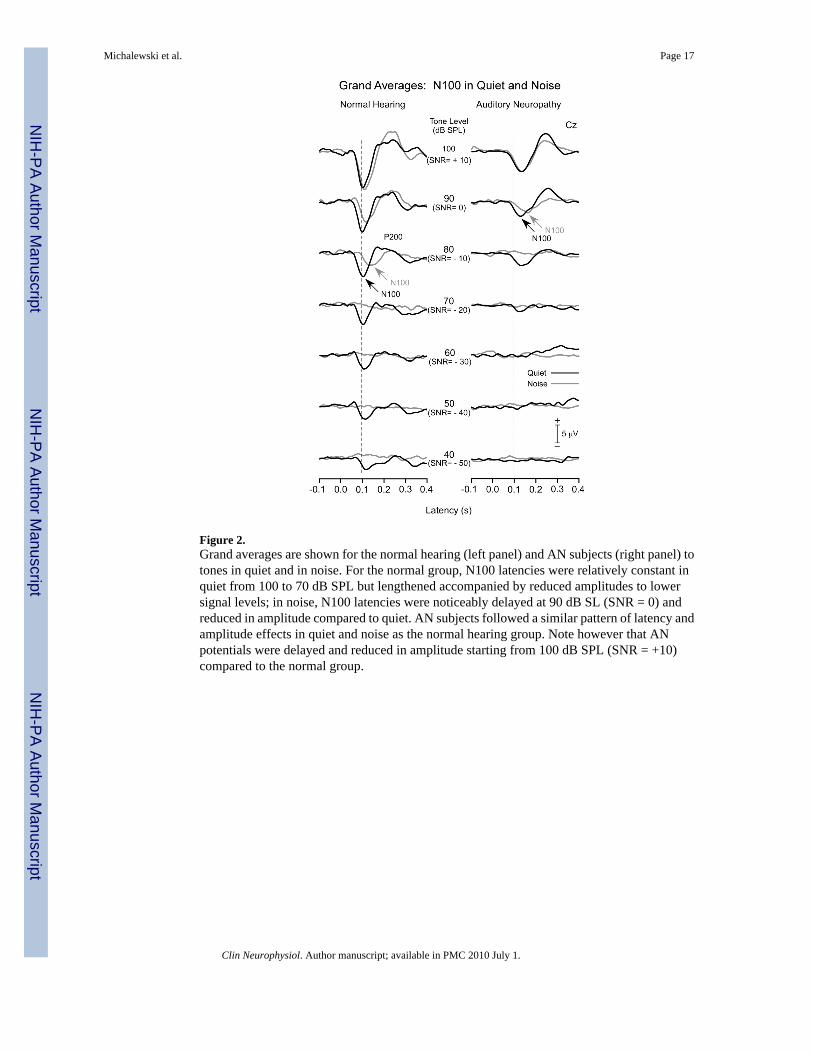
Figure 2.Grand averages are shown for the normal hearing (left panel) and AN subjects (right panel) totones in quiet and in noise. For the normal group, N100 latencies were relatively constant inquiet from 100 to 70 dB SPL but lengthened accompanied by reduced amplitudes to lowersignal levels; in noise, N100 latencies were noticeably delayed at 90 dB SL (SNR = 0) andreduced in amplitude compared to quiet. AN subjects followed a similar pattern of latency andamplitude effects in quiet and noise as the normal hearing group. Note however that ANpotentials were delayed and reduced in amplitude starting from 100 dB SPL (SNR = +10)compared to the normal group.
Michalewski et al. Page 17
Clin Neurophysiol. Author manuscript; available in PMC 2010 July 1.
NIH
-PA Author Manuscript
NIH
-PA Author Manuscript
NIH
-PA Author Manuscript
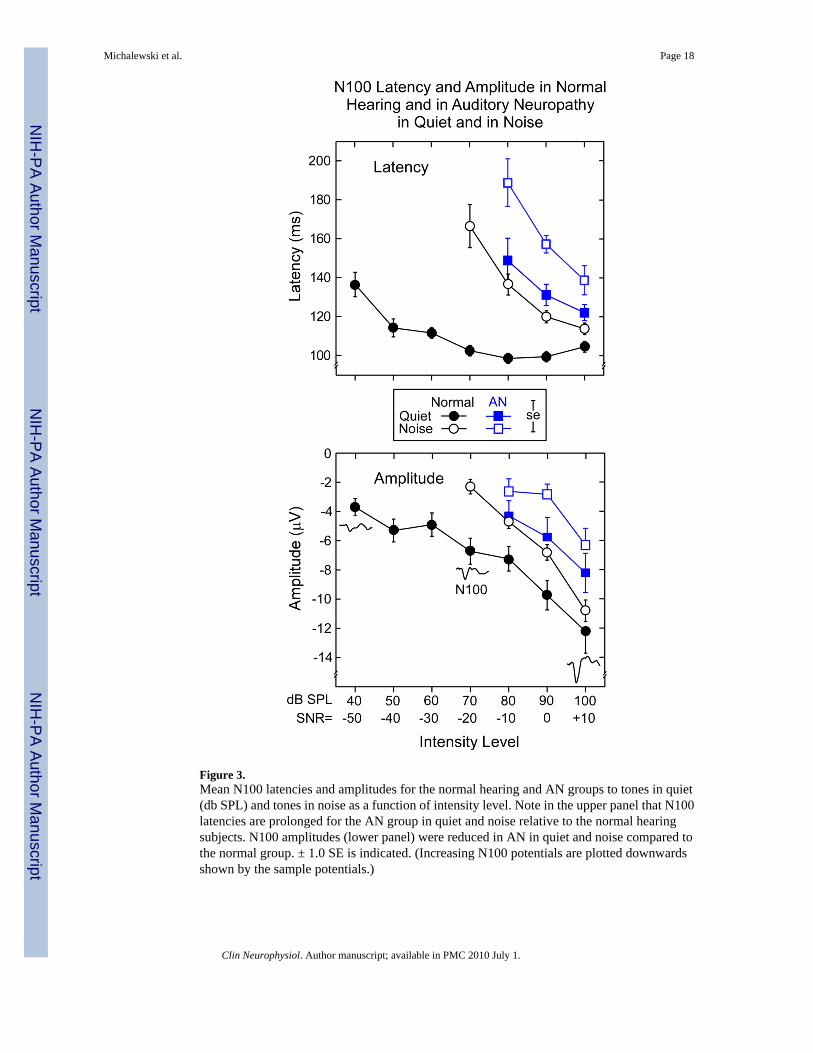
Figure 3.Mean N100 latencies and amplitudes for the normal hearing and AN groups to tones in quiet(db SPL) and tones in noise as a function of intensity level. Note in the upper panel that N100latencies are prolonged for the AN group in quiet and noise relative to the normal hearingsubjects. N100 amplitudes (lower panel) were reduced in AN in quiet and noise compared tothe normal group. ± 1.0 SE is indicated. (Increasing N100 potentials are plotted downwardsshown by the sample potentials.)
Michalewski et al. Page 18
Clin Neurophysiol. Author manuscript; available in PMC 2010 July 1.
NIH
-PA Author Manuscript
NIH
-PA Author Manuscript
NIH
-PA Author Manuscript
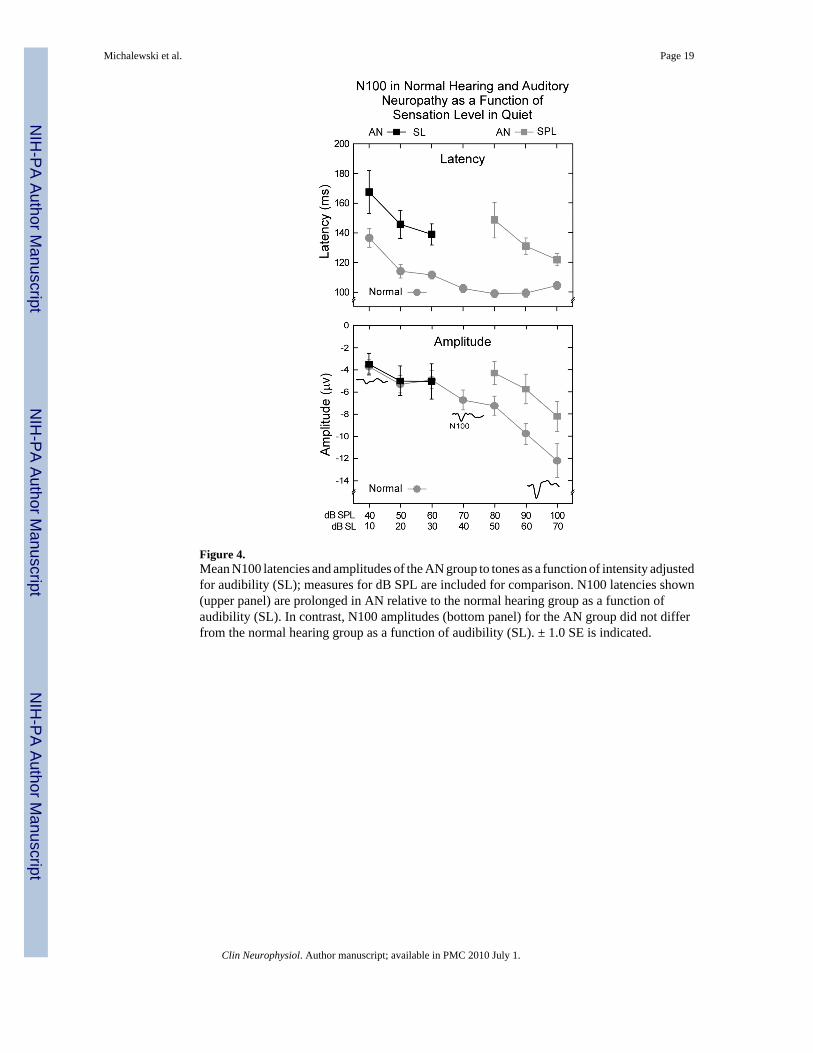
Figure 4.Mean N100 latencies and amplitudes of the AN group to tones as a function of intensity adjustedfor audibility (SL); measures for dB SPL are included for comparison. N100 latencies shown(upper panel) are prolonged in AN relative to the normal hearing group as a function ofaudibility (SL). In contrast, N100 amplitudes (bottom panel) for the AN group did not differfrom the normal hearing group as a function of audibility (SL). ± 1.0 SE is indicated.
Michalewski et al. Page 19
Clin Neurophysiol. Author manuscript; available in PMC 2010 July 1.
NIH
-PA Author Manuscript
NIH
-PA Author Manuscript
NIH
-PA Author Manuscript
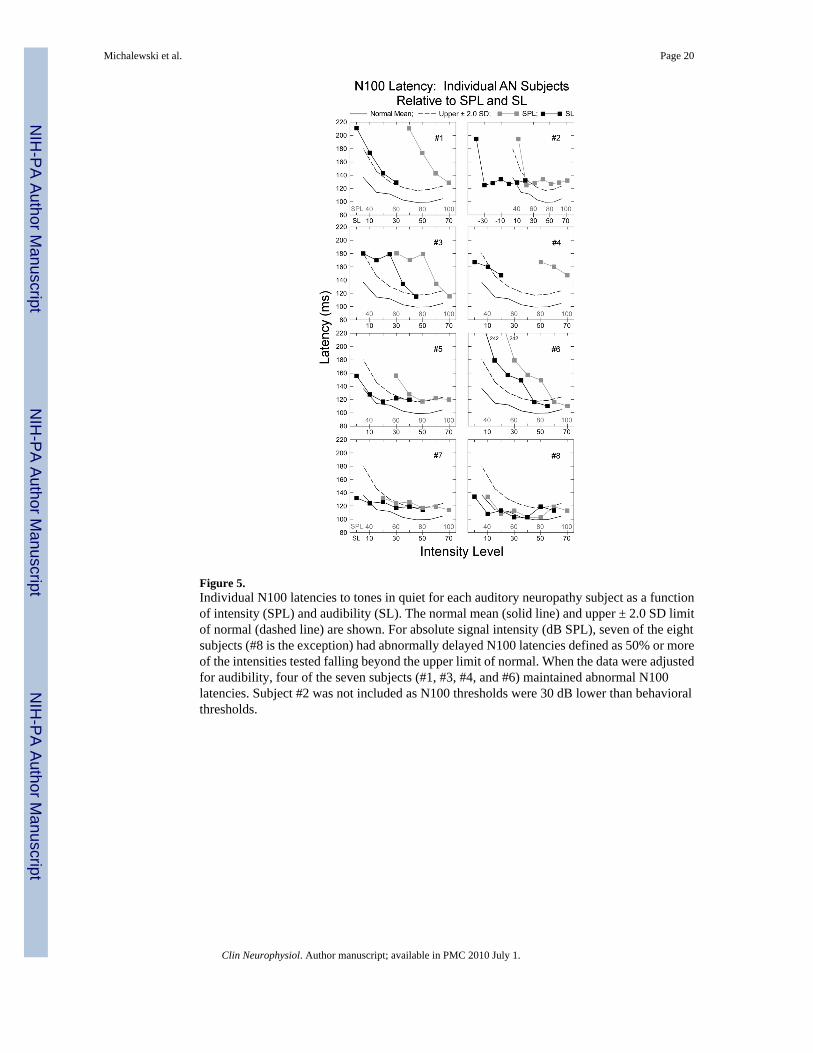
Figure 5.Individual N100 latencies to tones in quiet for each auditory neuropathy subject as a functionof intensity (SPL) and audibility (SL). The normal mean (solid line) and upper ± 2.0 SD limitof normal (dashed line) are shown. For absolute signal intensity (dB SPL), seven of the eightsubjects (#8 is the exception) had abnormally delayed N100 latencies defined as 50% or moreof the intensities tested falling beyond the upper limit of normal. When the data were adjustedfor audibility, four of the seven subjects (#1, #3, #4, and #6) maintained abnormal N100latencies. Subject #2 was not included as N100 thresholds were 30 dB lower than behavioralthresholds.
Michalewski et al. Page 20
Clin Neurophysiol. Author manuscript; available in PMC 2010 July 1.
NIH
-PA Author Manuscript
NIH
-PA Author Manuscript
NIH
-PA Author Manuscript

Figure 6.Individual mean amplitudes for each auditory neuropathy subject for tones in quiet as a functionof intensity (SPL) and audibility (SL). The normal mean (solid line) and upper ± 2.0 SD limitof normal (dashed line) are shown. All but one AN subject had amplitudes that were withinthe normal range. The exception, #4, had amplitudes that exceeded normal limits as a functionof audibility (SL); upper and lower ±2.0 SD limits are included for this subject.
Michalewski et al. Page 21
Clin Neurophysiol. Author manuscript; available in PMC 2010 July 1.
NIH
-PA Author Manuscript
NIH
-PA Author Manuscript
NIH
-PA Author Manuscript
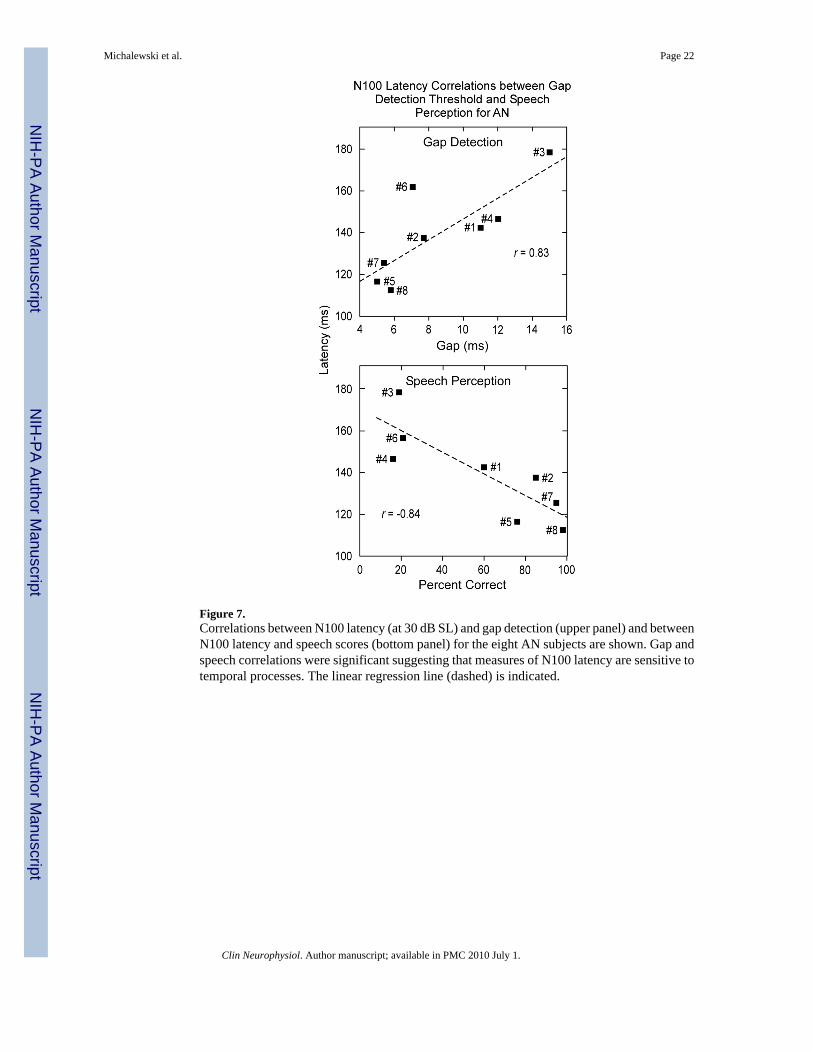
Figure 7.Correlations between N100 latency (at 30 dB SL) and gap detection (upper panel) and betweenN100 latency and speech scores (bottom panel) for the eight AN subjects are shown. Gap andspeech correlations were significant suggesting that measures of N100 latency are sensitive totemporal processes. The linear regression line (dashed) is indicated.
Michalewski et al. Page 22
Clin Neurophysiol. Author manuscript; available in PMC 2010 July 1.
NIH
-PA Author Manuscript
NIH
-PA Author Manuscript
NIH
-PA Author Manuscript
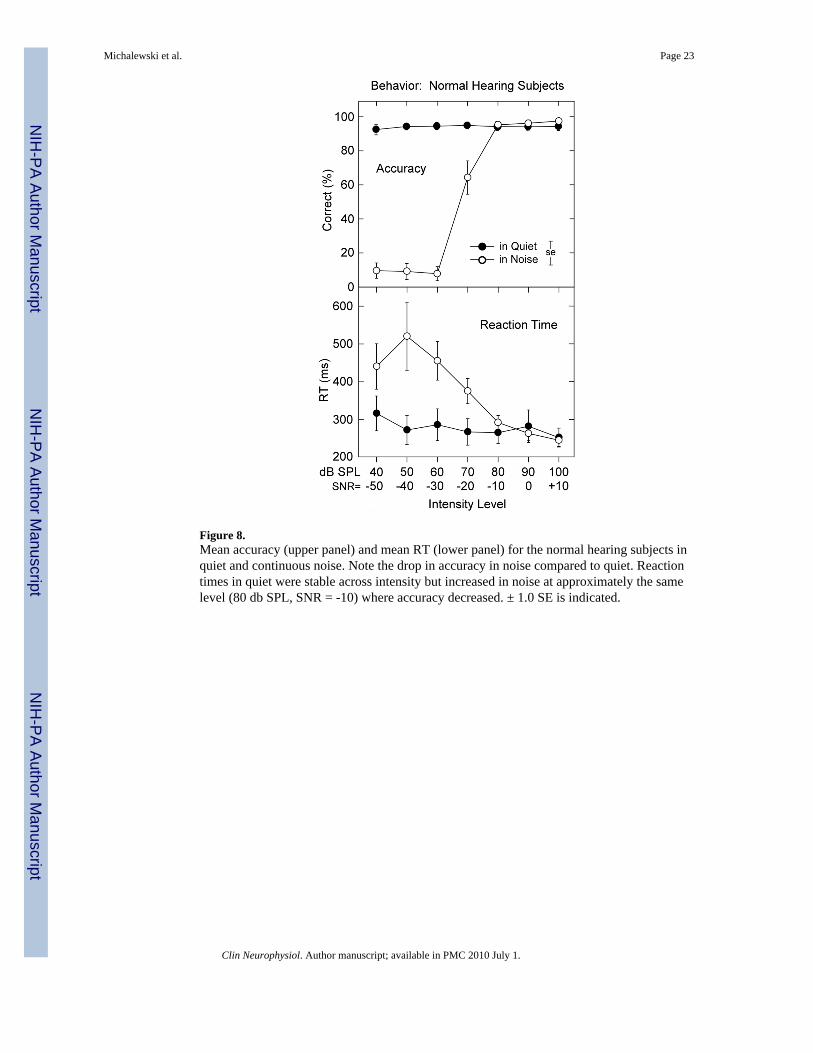
Figure 8.Mean accuracy (upper panel) and mean RT (lower panel) for the normal hearing subjects inquiet and continuous noise. Note the drop in accuracy in noise compared to quiet. Reactiontimes in quiet were stable across intensity but increased in noise at approximately the samelevel (80 db SPL, SNR = -10) where accuracy decreased. ± 1.0 SE is indicated.
Michalewski et al. Page 23
Clin Neurophysiol. Author manuscript; available in PMC 2010 July 1.
NIH
-PA Author Manuscript
NIH
-PA Author Manuscript
NIH
-PA Author Manuscript

NIH
-PA Author Manuscript
NIH
-PA Author Manuscript
NIH
-PA Author Manuscript
Michalewski et al. Page 24Ta
ble
1A
udito
ry n
euro
path
y su
bjec
t Inf
orm
atio
n
AN
Subj
ect
ID
AN
Cod
e1A
geSe
xE
arT
este
dPT
AL
owPT
AH
igh
1.0
kHz
Thr
esho
ld n
HL
N10
0D
etec
tion
nHL
#1A
N13
33F
Left
5210
4040
#2A
N7
27M
Left
4518
5010
#3A
N2
60F
Rig
ht45
3025
30
#4A
N16
18F
Left
3520
5050
#5A
N10
26M
Left
305
3030
#6A
N29
26F
Rig
ht27
515
20
#7A
N28
26F
Left
1225
2020
#8A
N30
21M
Rig
ht15
1310
10
Mea
n or
Cou
nt29
.65F
-3M
5L-3
R32
.615
.830
.026
.3
Subj
ect I
DA
N C
ode1
Psyc
ho-a
cous
tic G
ap (m
s)Sp
eech
Qui
et/N
oise
N10
0L
aten
cy(m
s) a
t 30
dB S
L
N10
0A
mpl
itude
(μV
) at 3
0 dB
SL
AB
R (W
ave
V)
Aud
itory
Neu
ropa
thy2
Spec
ial F
eatu
res
#1A
N13
11.0
60/3
8 SN
R=1
514
3-5
.9A
bsen
tU
nspe
cifie
d
#2A
N7
7.7
85/D
NT
138
-3.6
Abn
orm
al (6
.6 m
s)U
nspe
cifie
d
#3A
N2
15.0
19/3
SN
R=1
517
9-1
.8A
bsen
tTy
pe I
Ves
tibul
ar
#4A
N16
12.0
16/D
NT
147
-15.
7A
bsen
tU
nspe
cifie
d
#5A
N10
5.0
76/5
1 SN
R=1
011
7-3
.7A
bsen
tU
nspe
cifie
d
#6A
N29
7.1
21/D
NT
157
-1.7
Abs
ent
Type
IO
ptic
#7A
N28
5.4
95/D
NT
126
-2.7
Abs
ent
Type
IO
ptic
#8A
N30
5.8
98/4
0 SN
R=0
113
-3.5
Abn
orm
al (6
.4 m
s)Ty
pe II
Tem
pera
ture
Sen
sitiv
e
Mea
n or
Cou
nt8.
658
.8/3
3.0
140
-4.8
6 A
bsen
tTy
pe I:
3
2 A
bnor
mal
Type
II: 1
Uns
peci
fied:
4
AB
R =
aud
itory
bra
inst
em re
spon
se. T
he A
BR
s wer
e te
sted
on
sepa
rate
occ
asio
ns w
here
as p
sych
oaco
ustic
mea
sure
s wer
e pe
rfor
med
on
the
sam
e da
y as
evo
ked
pote
ntia
l tes
ting.
PTA
= p
ure
tone
ave
rage
. SN
R =
sign
al-to
-noi
se ra
tio.
1 AN
iden
tific
atio
n co
des f
or su
bjec
ts te
sted
pre
viou
sly
from
pub
lishe
d st
udie
s in
our l
abor
ator
y ar
e in
clud
ed fo
r cro
ss re
fere
nce.
(Not
e th
e ex
cept
ion
to th
e su
bjec
t cro
ss-r
efer
ence
cod
es in
Mic
hale
wsk
i, et
al.,
200
5; su
bjec
ts 2
, 3, 4
, and
5 in
that
stud
y co
rres
pond
to A
N7,
AN
2, A
N16
, and
AN
10, r
espe
ctiv
ely.
)
Clin Neurophysiol. Author manuscript; available in PMC 2010 July 1.

NIH
-PA Author Manuscript
NIH
-PA Author Manuscript
NIH
-PA Author Manuscript
Michalewski et al. Page 252 Ty
pe I
AN
= p
ost-s
ynap
tic; T
ype
II A
N =
pre
-syn
aptic
; Uns
peci
fied
= ty
pe n
ot d
efin
ed. D
NT
= di
d no
t tes
t.
Clin Neurophysiol. Author manuscript; available in PMC 2010 July 1.