AIMs-fair-pricing-model-Accompanying-paper-to ... - AIM mutual
7
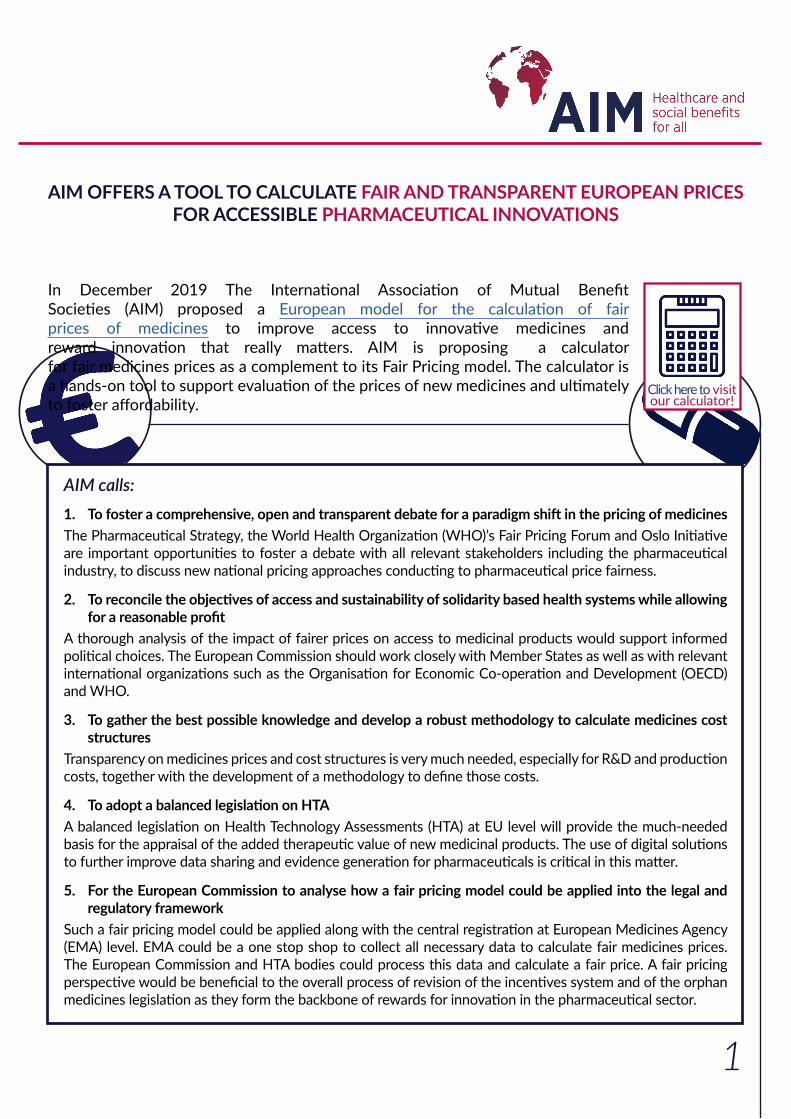
1 AIM OFFERS A TOOL TO CALCULATE FAIR AND TRANSPARENT EUROPEAN PRICES FOR ACCESSIBLE PHARMACEUTICAL INNOVATIONS In December 2019 The Internaonal Associaon of Mutual Benefit Sociees (AIM) proposed a European model for the calculaon of fair prices of medicines to improve access to innovave medicines and reward innovaon that really maers. AIM is proposing a calculator for fair medicines prices as a complement to its Fair Pricing model. The calculator is a hands-on tool to support evaluaon of the prices of new medicines and ulmately to foster affordability. 1. To foster a comprehensive, open and transparent debate for a paradigm shiſt in the pricing of medicines The Pharmaceucal Strategy, the World Health Organizaon (WHO)’s Fair Pricing Forum and Oslo Iniave are important opportunies to foster a debate with all relevant stakeholders including the pharmaceucal industry, to discuss new naonal pricing approaches conducng to pharmaceucal price fairness. 2. To reconcile the objecves of access and sustainability of solidarity based health systems while allowing for a reasonable profit A thorough analysis of the impact of fairer prices on access to medicinal products would support informed polical choices. The European Commission should work closely with Member States as well as with relevant internaonal organizaons such as the Organisaon for Economic Co-operaon and Development (OECD) and WHO. 3. To gather the best possible knowledge and develop a robust methodology to calculate medicines cost structures Transparency on medicines prices and cost structures is very much needed, especially for R&D and producon costs, together with the development of a methodology to define those costs. 4. To adopt a balanced legislaon on HTA A balanced legislaon on Health Technology Assessments (HTA) at EU level will provide the much-needed basis for the appraisal of the added therapeuc value of new medicinal products. The use of digital soluons to further improve data sharing and evidence generaon for pharmaceucals is crical in this maer. 5. For the European Commission to analyse how a fair pricing model could be applied into the legal and regulatory framework Such a fair pricing model could be applied along with the central registraon at European Medicines Agency (EMA) level. EMA could be a one stop shop to collect all necessary data to calculate fair medicines prices. The European Commission and HTA bodies could process this data and calculate a fair price. A fair pricing perspecve would be beneficial to the overall process of revision of the incenves system and of the orphan medicines legislaon as they form the backbone of rewards for innovaon in the pharmaceucal sector. AIM calls: Click here to visit our calculator!
-
Upload
khangminh22 -
Category
Documents
-
view
0 -
download
0
Transcript of AIMs-fair-pricing-model-Accompanying-paper-to ... - AIM mutual
1
AIM OFFERS A TOOL TO CALCULATE FAIR AND TRANSPARENT EUROPEAN PRICES FOR ACCESSIBLE PHARMACEUTICAL INNOVATIONS
In December 2019 The International Association of Mutual Benefit Societies (AIM) proposed a European model for the calculation of fair prices of medicines to improve access to innovative medicines and reward innovation that really matters. AIM is proposing a calculator for fair medicines prices as a complement to its Fair Pricing model. The calculator is a hands-on tool to support evaluation of the prices of new medicines and ultimately to foster affordability.
1. To foster a comprehensive, open and transparent debate for a paradigm shift in the pricing of medicinesThe Pharmaceutical Strategy, the World Health Organization (WHO)’s Fair Pricing Forum and Oslo Initiative are important opportunities to foster a debate with all relevant stakeholders including the pharmaceutical industry, to discuss new national pricing approaches conducting to pharmaceutical price fairness.
2. To reconcile the objectives of access and sustainability of solidarity based health systems while allowing for a reasonable profit
A thorough analysis of the impact of fairer prices on access to medicinal products would support informed political choices. The European Commission should work closely with Member States as well as with relevant international organizations such as the Organisation for Economic Co-operation and Development (OECD) and WHO.
3. To gather the best possible knowledge and develop a robust methodology to calculate medicines cost structures
Transparency on medicines prices and cost structures is very much needed, especially for R&D and production costs, together with the development of a methodology to define those costs.
4. To adopt a balanced legislation on HTAA balanced legislation on Health Technology Assessments (HTA) at EU level will provide the much-needed basis for the appraisal of the added therapeutic value of new medicinal products. The use of digital solutions to further improve data sharing and evidence generation for pharmaceuticals is critical in this matter.
5. For the European Commission to analyse how a fair pricing model could be applied into the legal and regulatory framework
Such a fair pricing model could be applied along with the central registration at European Medicines Agency (EMA) level. EMA could be a one stop shop to collect all necessary data to calculate fair medicines prices. The European Commission and HTA bodies could process this data and calculate a fair price. A fair pricing perspective would be beneficial to the overall process of revision of the incentives system and of the orphan medicines legislation as they form the backbone of rewards for innovation in the pharmaceutical sector.
AIM calls:
Click here to visit our calculator!
2
Introduction
R&D/number of patients
Production & overheads+
Sales &medical
information + Basicprofit + + Innovation
bonus_ Fair Price _
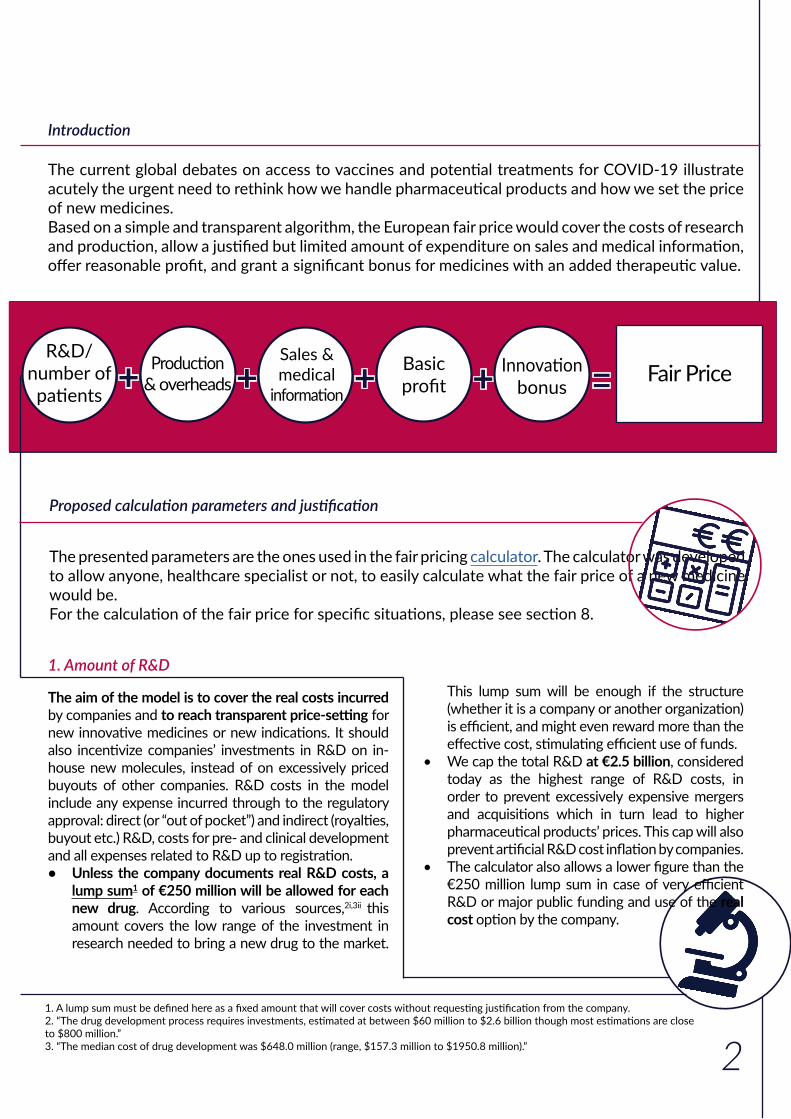
The current global debates on access to vaccines and potential treatments for COVID-19 illustrate acutely the urgent need to rethink how we handle pharmaceutical products and how we set the price of new medicines.Based on a simple and transparent algorithm, the European fair price would cover the costs of research and production, allow a justified but limited amount of expenditure on sales and medical information, offer reasonable profit, and grant a significant bonus for medicines with an added therapeutic value.
Proposed calculation parameters and justification
The aim of the model is to cover the real costs incurred by companies and to reach transparent price-setting for new innovative medicines or new indications. It should also incentivize companies’ investments in R&D on in-house new molecules, instead of on excessively priced buyouts of other companies. R&D costs in the model include any expense incurred through to the regulatory approval: direct (or “out of pocket”) and indirect (royalties, buyout etc.) R&D, costs for pre- and clinical development and all expenses related to R&D up to registration.• Unless the company documents real R&D costs, a
lump sum1 of €250 million will be allowed for each new drug. According to various sources,2i,3ii this amount covers the low range of the investment in research needed to bring a new drug to the market.
1. Amount of R&D
The presented parameters are the ones used in the fair pricing calculator. The calculator was developed to allow anyone, healthcare specialist or not, to easily calculate what the fair price of a new medicine would be. For the calculation of the fair price for specific situations, please see section 8.
This lump sum will be enough if the structure (whether it is a company or another organization) is efficient, and might even reward more than the effective cost, stimulating efficient use of funds.
• We cap the total R&D at €2.5 billion, considered today as the highest range of R&D costs, in order to prevent excessively expensive mergers and acquisitions which in turn lead to higher pharmaceutical products’ prices. This cap will also prevent artificial R&D cost inflation by companies.
• The calculator also allows a lower figure than the €250 million lump sum in case of very efficient R&D or major public funding and use of the real cost option by the company.
1. A lump sum must be defined here as a fixed amount that will cover costs without requesting justification from the company.2. “The drug development process requires investments, estimated at between $60 million to $2.6 billion though most estimations are close to $800 million.”3. “The median cost of drug development was $648.0 million (range, $157.3 million to $1950.8 million).”
3
A specific methodology for reporting and auditing will have to be developed to give full transparency if “real cost” is chosen by the company. Specifically, accounting expenses not really paid by the sponsors (use of publicly funded research, tax savings and opportunity costs), allocation of costs of failure (only once), as well as value of buyouts and excessive executive salaries must be addressed. Criteria of research efficiency could be added in the requirements to make sure companies do not inflate costs.
2. Amount of R&D allocated to Europe (EU 27)
The European population (447,5 million) representing 35,85% of the population of main developed markets for the innovative drugs,4 we propose that this will be the corresponding share of R&D for Europe. Even if other regions of the world such as “pharmerging” countries have better access to innovative treatments in the future, this percentage can be maintained, in order to secure global solidarity.
3. Number of patients for the indication
3.1. Target populationThe target population is the theoretical number of patients that are affected by the disease in the European Union over a 10 years period (i.e. the average patent protection period remaining after gaining marketing authorization). A theoretical target population according to the prevalence or the incidence of the disease, or of a smaller indication, will be used. Prevalence will vary substantially depending on the type of disease, from ≤2/100 000 people for an ultra-rare disease to over 5% of the population for very frequent chronic diseases.
3.2. Treatment rateA “treatment rate” is applied to the theoretical target population. This reflects the national guidelines with specific access conditions, misdiagnosis, the lack of infrastructure in some Member States or the death of some patients before they have access to the treatment. The model considers that only 50% of the target population will be treated in average in the EU27 for the calculation of the price.
4. Global potential population : EU 27 + UK + Norway + Switzerland + US + Canada + Japan + Russia + Turkey = 1,248 billion. Source: World Bank
3.3. Market shareAs is often the case, the new medicine might not be the only one targeting the indication. Horizon scanning will be needed to assess the short- or medium-term arrival of competing substances to the market. The model allows up to two other competitors for each new drug. Even if there might in some cases be more, the model assumes that the first pharmaceutical company to reach the market will not have less than a third of the European market. The market will be divided into equal parts between competitors. In case of markets with mono- and combination therapies such as antiviral hepatitis C or in many oncology fields, the competitor and related market share should be considered at company level, not at individual product level.
Number of patients for the indication = target population x 50% / (number of competitors +1)
3.4. Duration of treatmentThe R&D will be split over the theoretical duration of the treatment. For chronic life-long treatments, the model assumes a 10-year duration, in line with products’ on-market patent protection.
4. Production and overhead costs
The production costs include the costs of manufacturing: cost of goods, production including investment in factories and packaging, as well as costs of distribution including warehousing and transport, taxes and in-/direct general costs such as bookkeeping, order management or insurances. The production costs will be related to the complexity of the drug’s production based on real costs or on lump sums and on the duration of the treatment expressed in months of treatment. Costs for orphan drugs are multiplied by 5 in order to consider the limited production volume. Cost for high prevalence diseases might be limited manually in the calculator to a lower amount, if more realistic.

4
Composition of the drug per month of treatmentChemical €50Chemical orphan €250Biological €150Biological orphan €750
5. Sales and medical information
A flat 20% of the costs of R&D will be allocated to the costs related to the sales of the medicine, including registration in different countries, their administration, and post-approval surveillance for adverse effects, as well as to the needed medical information provided to the healthcare practitioners.
6. Basic profitA basic gross profit of 8% of the total costs is added. This seems reasonable as it is in line with the upper range of return in risky industries.iv
7. Innovation bonusA Health Technology Assessment (HTA) may be proposed by the company. Depending on the expected therapeutic value of the drug an innovation bonus ranging from 5 to 40% of the costs will be allocated to the company for this indication. Aiming at decreasing duplication in research, it will be given according to following criteria:
For oncology, the ESMO Magnitude of Clinical Benefit Scale (ESMO- MCBS) could also be used.The HTA will be analyzed for each new indication and allocated by indication. A drug may therefore have a higher innovation bonus for its second indication.The genuine addition of these various components of the price gives the fair price per patient for a full treatment (for the first indication of a new drug, with a new substance or for a repurposed one). This is an “ex-factory” price, meaning the national wholesaler and pharmacist mark-ups still have to be added.
For gene therapies, the real production can be used, or a lump sum of €60 000, the upper limit of the cost of production of CAR-T cell therapies in an academic nonprofit setting in Germany.iii
Figure 1 – Screenshot from AIM’s calculator
5. Unless a price per indication is easily calculated and implemented (i.e. in case of different routes of administration, such as oral and intravenous).6. We can suppose that the costs of acquisition and the cost of failure was also already included in the price of the first indication, leaving only in-house development costs. As preclinical research and phase I trials have already been paid for, the additional costs should be very limited compared to the first indication.
8. Specific calculations
The following situations are a bit more complex and require additional choices of parameters or methodology.
8.1 Fair prices for new indications
For the second and third indication of an innovative drug, a new unique transparent price for the drug should be calculated5. The new unique price is the weighted average of the price of each indication. This price is for a month of treatment.The calculator will be used separately to calculate the fair price for each indication (i). For R&D, for the second and third indication, either real R&D or a lump sum of 10% of the initial R&D costs could be chosen6. For the production costs, real costs or the usual monthly lump sum can also be used. The innovation bonus may vary according to the therapeutic value of each indication. The fair price in the calculator is given per treatment but also per month.The weighted average of the fair prices per patient per month (mprice) according to the number of patients (#patients) and the duration of treatment in months (#months) should be calculated manually using following formula (for 2 indications):
New unique price per month =(mprice i1 x #months i1 x #patients i1) + (mprice i2 x #months i2 x #patients i2)
(#months i1 x #patients i1) + (#months i2 x #patients i2)
5
The objective is to discourage opportunistic “salami slicing” strategies. Therefore, if the second indication has a larger patient population than the first one, the amount of R&D per patient will decrease significantly and the price per treatment might therefore drop, depending on the other components of the price. The motivation to introduce a second and third innovative indication will be strong though as a higher innovation bonus can be granted for the new indication.From the fourth indication onwards, the price will no longer be recalculated to avoid excessive price changes.
8.2. Fair prices for combination therapiesMore and more often, especially in oncology, an existing drug (X) will apply for registration for a combination therapy: the drug X is added to another molecule (Y), with often either one or both already being used separately in the indication. Usually, only one pharmaceutical company (sponsor for drug X) will do the clinical trial and apply for the registration and reimbursement of the new indication.7 The price of drug X will be based on the regular calculation of a new indication in the calculator. Similarly, to any new indication up to the third one, a new unique price covering both the initial and new indication, based on the weighted average price per patient per month, will be calculated using the manual formula for drug X.The price of drug Y will not be affected by the new indication.
8.3. Fair price levels of alternatives for the same indications
In case a competitor (drug B) to an existing drug A applies for the same indication, the regular calculation applies. Still the result might be very different as both the costs and the innovation bonus linked to therapeutic added value might be very different between drugs A and B.The price of the first-in-line (drug A) should not be affected as the horizon scanning was supposed to anticipate the reduced market share due to the arrival of drug B. If it was not the case though, a revision of the price of drug A could be accepted. Still, price competition between the 2 drugs at the level of the payer might prevent drug A from requesting a price raise.
7. Example : Brystol-Myer Squibb’s Revlimid (lenalidomide) in combination with rituximab (anti-CD20 antibody) is indicated for the treatment of adult patients with previously treated follicular lymphoma (Grade 1 – 3a). But Roche’s Mabthera (rituximab) does’nt have the indication.
8.4. Differential costsThe price will be unique for the EU27 but some real cost differentiation according to the wealth of the Member State could be put in place through a kind of “compensation fund” (according to a specific methodology to be developed). Starting from this unique price at European level, the calculator shows how the price per country could be theoretically adapted according to the purchasing power parity (PPP) of each country so that the share of GDP spent on innovative drugs would be equal in all member states. This would further facilitate access in less wealthy Member States and increase the total European sales volume, making the model more attractive to both health systems and the pharmaceutical sector. For an average price of €10 000 per treatment, the net cost supported by each country would range from €5 300 in Bulgaria to €19 300 in Ireland (and €26 000 in Luxembourg).
8.5. From a fair price per treatment to a fair price per package
The fair price per patient per treatment is generally a good benchmark to compare the prices of different product alternatives. Dividing the price per treatment by the duration of treatment also gives insights into more granular fair price levels as the standard package often covers a month of treatment. The calculator gives the price per treatment, per month and per year. Different dosages should have very similar prices or even a flat price, as the amount of active substance generally affects the production costs in a very marginal way.
6
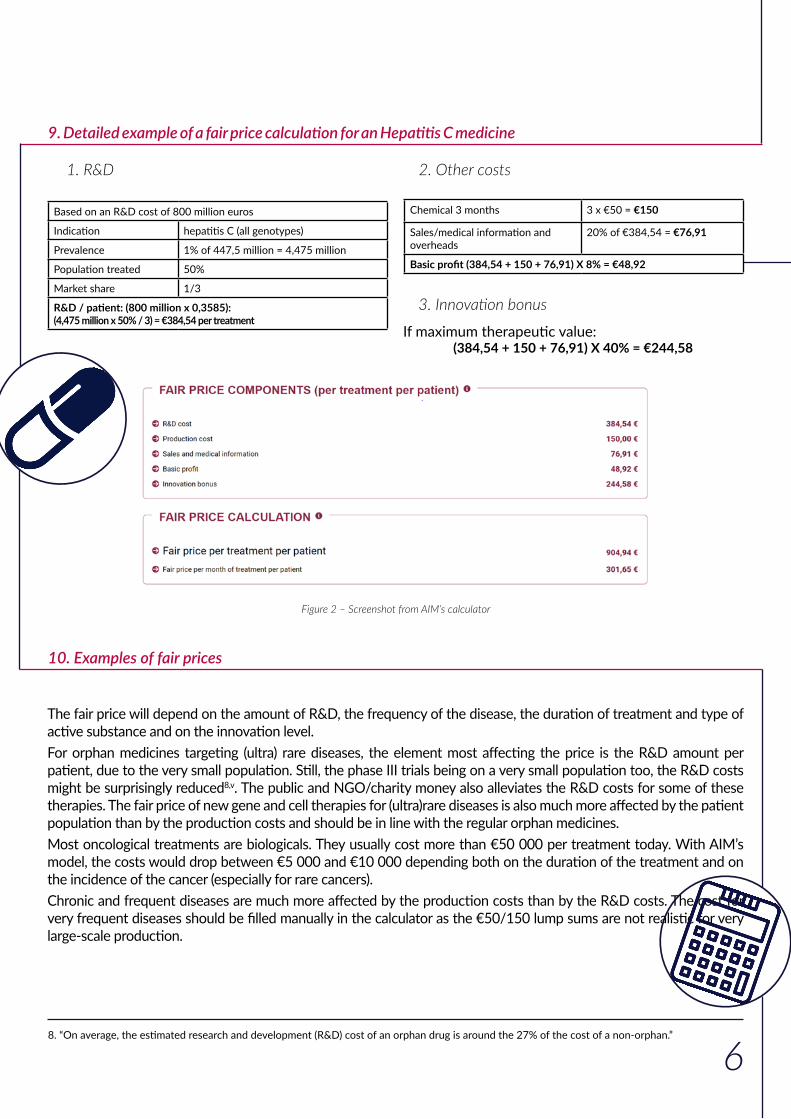
9. Detailed example of a fair price calculation for an Hepatitis C medicine
1. R&D
Based on an R&D cost of 800 million euros
Indication hepatitis C (all genotypes)
Prevalence 1% of 447,5 million = 4,475 million
Population treated 50%
Market share 1/3
R&D / patient: (800 million x 0,3585): (4,475 million x 50% / 3) = €384,54 per treatment
2. Other costs
Chemical 3 months 3 x €50 = €150
Sales/medical information and overheads
20% of €384,54 = €76,91
Basic profit (384,54 + 150 + 76,91) X 8% = €48,92
3. Innovation bonus
If maximum therapeutic value: (384,54 + 150 + 76,91) X 40% = €244,58
Figure 2 – Screenshot from AIM’s calculator
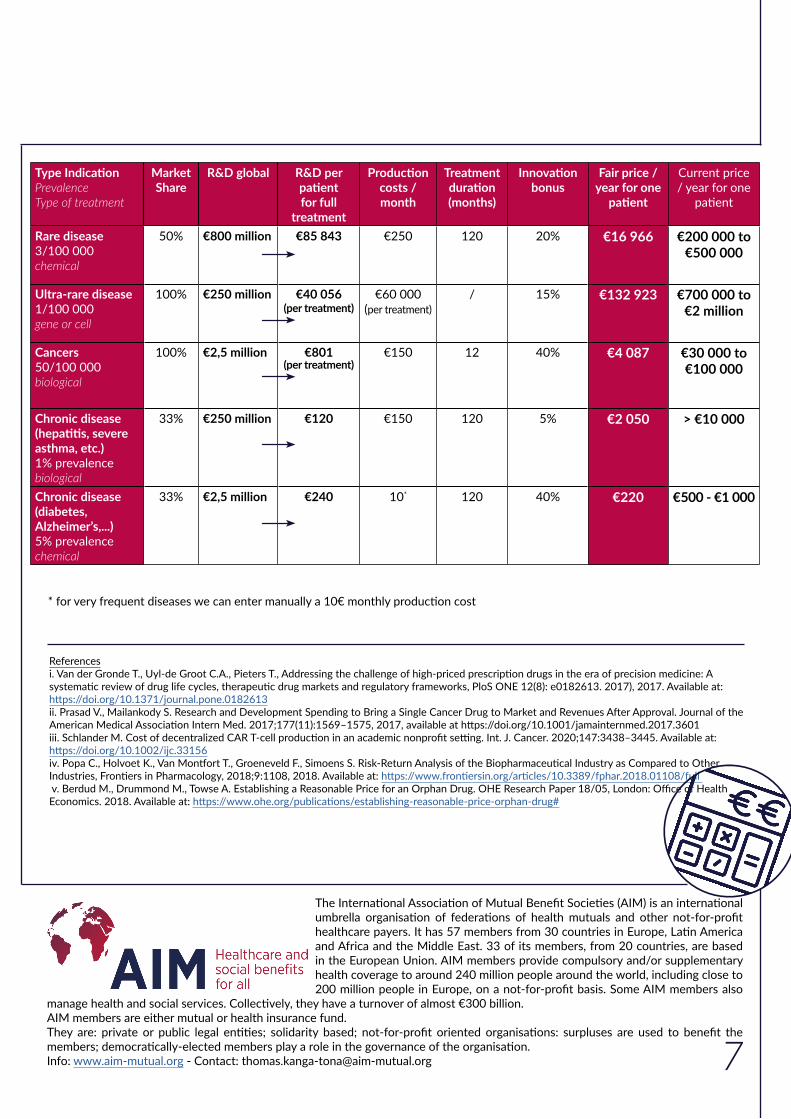
10. Examples of fair prices
The fair price will depend on the amount of R&D, the frequency of the disease, the duration of treatment and type of active substance and on the innovation level.For orphan medicines targeting (ultra) rare diseases, the element most affecting the price is the R&D amount per patient, due to the very small population. Still, the phase III trials being on a very small population too, the R&D costs might be surprisingly reduced8,v. The public and NGO/charity money also alleviates the R&D costs for some of these therapies. The fair price of new gene and cell therapies for (ultra)rare diseases is also much more affected by the patient population than by the production costs and should be in line with the regular orphan medicines.Most oncological treatments are biologicals. They usually cost more than €50 000 per treatment today. With AIM’s model, the costs would drop between €5 000 and €10 000 depending both on the duration of the treatment and on the incidence of the cancer (especially for rare cancers).Chronic and frequent diseases are much more affected by the production costs than by the R&D costs. The cost for very frequent diseases should be filled manually in the calculator as the €50/150 lump sums are not realistic for very large-scale production.
8. “On average, the estimated research and development (R&D) cost of an orphan drug is around the 27% of the cost of a non-orphan.”
7
Type IndicationPrevalenceType of treatment
Market Share
R&D global R&D per patient for full
treatment
Production costs / month
Treatment duration (months)
Innovation bonus
Fair price / year for one
patient
Current price / year for one
patient
Rare disease3/100 000chemical
50% €800 million €85 843 €250 120 20% €16 966 €200 000 to €500 000
Ultra-rare disease1/100 000gene or cell
100% €250 million €40 056(per treatment)
€60 000(per treatment)
/ 15% €132 923 €700 000 to €2 million
Cancers50/100 000 biological
100% €2,5 million €801(per treatment)
€150 12 40% €4 087 €30 000 to €100 000
Chronic disease (hepatitis, severe asthma, etc.)1% prevalencebiological
33% €250 million €120 €150 120 5% €2 050 > €10 000
Chronic disease (diabetes, Alzheimer’s,...)5% prevalencechemical
33% €2,5 million €240 10* 120 40% €220 €500 - €1 000
The International Association of Mutual Benefit Societies (AIM) is an international umbrella organisation of federations of health mutuals and other not-for-profit healthcare payers. It has 57 members from 30 countries in Europe, Latin America and Africa and the Middle East. 33 of its members, from 20 countries, are based in the European Union. AIM members provide compulsory and/or supplementary health coverage to around 240 million people around the world, including close to 200 million people in Europe, on a not-for-profit basis. Some AIM members also
manage health and social services. Collectively, they have a turnover of almost €300 billion. AIM members are either mutual or health insurance fund. They are: private or public legal entities; solidarity based; not-for-profit oriented organisations: surpluses are used to benefit the members; democratically-elected members play a role in the governance of the organisation. Info: www.aim-mutual.org - Contact: [email protected]
* for very frequent diseases we can enter manually a 10€ monthly production cost
Referencesi. Van der Gronde T., Uyl-de Groot C.A., Pieters T., Addressing the challenge of high-priced prescription drugs in the era of precision medicine: A systematic review of drug life cycles, therapeutic drug markets and regulatory frameworks, PloS ONE 12(8): e0182613. 2017), 2017. Available at: https://doi.org/10.1371/journal.pone.0182613ii. Prasad V., Mailankody S. Research and Development Spending to Bring a Single Cancer Drug to Market and Revenues After Approval. Journal of the American Medical Association Intern Med. 2017;177(11):1569–1575, 2017, available at https://doi.org/10.1001/jamainternmed.2017.3601iii. Schlander M. Cost of decentralized CAR T-cell production in an academic nonprofit setting. Int. J. Cancer. 2020;147:3438–3445. Available at: https://doi.org/10.1002/ijc.33156iv. Popa C., Holvoet K., Van Montfort T., Groeneveld F., Simoens S. Risk-Return Analysis of the Biopharmaceutical Industry as Compared to Other Industries, Frontiers in Pharmacology, 2018;9:1108, 2018. Available at: https://www.frontiersin.org/articles/10.3389/fphar.2018.01108/full v. Berdud M., Drummond M., Towse A. Establishing a Reasonable Price for an Orphan Drug. OHE Research Paper 18/05, London: Office of Health Economics. 2018. Available at: https://www.ohe.org/publications/establishing-reasonable-price-orphan-drug#