
MyHVnet Newsletter 2020 - Universiti Teknologi Malaysia
56
KAJANG, 1 July 2019 – On Wednesday 26th June 2019, IEEE Dielectrics and Electrical In- sulation Society (DEIS) Malaysia Chapter, in collaboration with the Institute of Power En- gineering UNITEN and the Malaysian High Voltage Network (MyHVnet) had organised a half-day seminar entitled “Electrifying the Fu- ture: An Industry-Academic Knowledge Sharing Session”. This programme aimed to gather industry professionals and experts, as well as prominent researchers and academi- cians in the field of electrical engineering, to discuss the future of the electricity industry. (continued on page 4…) MyHVnet INSIDE THIS ISSUE Page 2 MyHVnet Chairman’s Remarks Page 3 Promoting IEEE DEIS Malaysia Chapter Page 5 High Voltage Seminar Page 7 High Voltage Postgrad- uate Studies Page 12 Message from Chairs of 2020 PTeC and MyHVnet Colloquium Page 13 Discussion Corner Page 14 2020 PTeC and MyHVnet Colloquium JANUARY 2020 MyHVnet is the abbreviated name for Malaysian High Voltage Network – a networking group for high voltage engi- neering in Malaysia. Technical Visit to Janamanjung 500 kV Gas Insulated Transmission Line Substation Newsletter ISSUE 5 SERI MANJUNG, 18 April 2019 – On 16th April 2019, IEEE Dielectrics and Electrical Insu- laon Society (DEIS) Malaysia Chapter, in col- laboraon with Malaysian High Voltage Net- work (MyHVnet), had organized an industrial visit to Janamanjung Main Intake Substaon, Perak. The main objecve of this visit was to learn about the implementaon of Ma- laysia’s first and only gas insulated trans- mission line (GIL) system. The system, which operates at 50Hz 500kV/4000A, was (continued on page 5…) Group photo at Janamanjung GIL substation. Group photo with Ir. Dr. Mohd Fadzil Mohd Siam (middle right) and Professor Paul Lewin (middle left). ISSN 2462-1994 Electrifying the Future: An Industry- Academic Knowledge Sharing Session
-
Upload
khangminh22 -
Category
Documents
-
view
0 -
download
0
Transcript of MyHVnet Newsletter 2020 - Universiti Teknologi Malaysia

KAJANG, 1 July 2019 – On Wednesday 26th
June 2019, IEEE Dielectrics and Electrical In-
sulation Society (DEIS) Malaysia Chapter, in
collaboration with the Institute of Power En-
gineering UNITEN and the Malaysian High
Voltage Network (MyHVnet) had organised a
half-day seminar entitled “Electrifying the Fu-
ture: An Industry-Academic Knowledge
Sharing Session”. This programme aimed to
gather industry professionals and experts, as
well as prominent researchers and academi-
cians in the field of electrical engineering, to
discuss the future of the electricity industry.
(continued on page 4…)
MyHVnet
INS IDE THIS
I SSUE
Page 2
MyHVnet Chairman’s
Remarks
Page 3
Promoting IEEE DEIS
Malaysia Chapter
Page 5
High Voltage Seminar
Page 7
High Voltage Postgrad-
uate Studies
Page 12
Message from Chairs of
2020 PTeC and
MyHVnet Colloquium
Page 13
Discussion Corner
Page 14
2020 PTeC and
MyHVnet Colloquium
J A N U A R Y 2 0 2 0
MyHVnet
is the abbreviated
name for Malaysian
High Voltage Network
– a networking group
for high voltage engi-
neering in Malaysia.
Technical Visit to Janamanjung 500 kV Gas Insulated Transmission Line Substation
Newsletter I S S U E 5
SERI MANJUNG, 18 April 2019 – On 16th
April 2019, IEEE Dielectrics and Electrical Insu-
la*on Society (DEIS) Malaysia Chapter, in col-
labora*on with Malaysian High Voltage Net-
work (MyHVnet), had organized an industrial
visit to Janamanjung Main Intake Substa*on,
Perak. The main objec*ve of this visit was
to learn about the implementa*on of Ma-
laysia’s first and only gas insulated trans-
mission line (GIL) system. The system,
which operates at 50Hz 500kV/4000A, was
(continued on page 5…)
Group photo at Janamanjung GIL substation.
Group photo with Ir. Dr. Mohd Fadzil Mohd Siam (middle right) and Professor Paul Lewin (middle left).
I S S N 2 4 6 2 - 1 9 9 4
Electrifying the Future: An Industry-Academic Knowledge Sharing Session

P A G E 2 MyHVnet Newsletter ISSUE 5 JANUARY 2020
MyHVnet Chairman’s Remarks One year has past since I have been
the Chairman of MyHVnet. Throughout
the year, MyHVnet, in collaboration
with IEEE Dielectrics and Electrical Insu-
lation Society (DEIS) Malaysia Chapter,
has successfully conducted numerous
activities, such as industrial visit to Jana-
manjung gas insulated transmission line
(GIL) substation, seminars, workshops
and technical talks. Such activities may
provide networking between industries
and higher education institutions, and knowledge of the re-
cent technology development in high voltage related re-
search and applications. Furthermore, MyHVnet and DEIS
Malaysia have recently collaborated with UiTM Bukit
Mertajam to organise the 2020 PTeC and MyHVnet Collo-
quium, which will be held on 3rd Feb 2020 at UiTM Bukit
Mertajam, Pulau Pinang. We expected that the joint colloqui-
um would provide a platform for researchers from various
academic and industrial backgrounds to develop their net-
work and exchange their knowledge, ideas and expertise on
Mr. Quek (fourth from left) with participants .
Johor Bahru, 10 December 2019 – The IEEE
Dielectrics and Electrical Insulation Society
(DEIS) Malaysia Chapter technically support-
ed a technical talk on “Protection Devices:
Miniature Circuit Breakers and Residual
Current Circuit Breakers” organised by the
Institute of High Voltage and High Current
(IVAT), Universiti Teknologi Malaysia
(UTM), on 21 August 2019 at IVAT, UTM
Johor Bahru.
During the talk, Mr. Geoffrey Quek, from
Hager Engineering (M) Sdn. Bhd., shared his
experience on the importance of protection
devices and different categories of protec-
tion devices. In addition, the principles be-
hind the operation of miniature circuit
breakers and residual current circuit break-
Technical Talk on Protection Devices
a wide range of high voltage engineering research and appli-
cations as well as in the field of power systems. We hope
that this key event of MyHVnet would be continuously
organised in the future and receive full support from
MyHVnet members from universities and industries across
Malaysia. Perhaps, this event can attract international par-
ticipations in the future.
There is still one more year left for me to drive
MyHVnet, and I hope that MyHVnet can continue to
strengthen its presence and be a key platform for high volt-
age research and development in Malaysia and overseas.
With the commitment of MyHVnet committee members, I
believe more activities can be conducted in 2020. I would
like to take this opportunity to thank all the members of
MyHVnet for their tremendous support and effort in mak-
ing MyHVnet activities a success. Lastly, I wish MyHVnet
members all the best and success in your professionalism
and look forward to
meeting you in next
events.
Assoc. Prof. Ir. Dr. Mohamad Kamarol Mohamad Jamil, Uni-versiti Sains Malaysia.
MyHVnet Newsletter Editorial Board
Advisors:
Prof. Dr. Zulkurnain Abdul Malek
(Universiti Teknologi Malaysia)
Assoc. Prof. Ir. Dr. Mohamad
Kamarol Mohd Jamil
(Universiti Sains Malaysia)
Editor-in-Chief:
Ir. Dr. Lau Kwan Yiew
(Universiti Teknologi Malaysia)
Editors:
Assoc. Prof. Ts. Dr. Muzamir Isa
(Universiti Malaysia Perlis)
Ms. Siti Salwa Mat Isa
(Universiti Teknologi MARA)
Contributors:
Members of MyHVnet
ers were explained to the audience.
Appropriate selections of protection
devices, especially for residential
buildings, were also highlighted. The
talk later ended with a question-and-
answer session between Mr. Quek
and the audience, which allowed the
audience to obtain further clarifica-
tion regarding the topic.
DEIS and IVAT sincerely thank Mr.
Quek for his kindness to share his
expertise in the field of protection
devices and hope to have more
events like this in the future.
# Ir. Dr. Lau Kwan Yiew, Universiti
Teknologi Malaysia.

About IEEE DEIS Malaysia Chapter
MALAYSIA, 10 December 2019 – The IEEE Dielectrics
and Electrical Insulation Society (DEIS) Malaysia Chapter
was established in Malaysia in May 2015 with the aims to
enhance networking and stimulate research and develop-
ment in the field of dielectrics and electrical insulation in
Malaysia. Its field of interest is in line with that of DEIS,
i.e., the study and application of dielectric phenomena and
behavior and the development, characterization and appli-
cation of all gaseous, liquid and solid electrical insulating
materials and systems utilized in electrical and electronic
equipment. Through committees, IEEE DEIS Malaysia
Chapter hopes to promote the close cooperation and
exchange of technical information among its members.
Those joining DEIS will have the possibility of network-
ing with a large number of experts worldwide, including
Malaysia (through IEEE DEIS Malaysia Chapter), to show
the results of their research activity or remain informed in
the latest developments in their field. For more infor-
mation, please visit:
http://deis.ieeemy.org/ (IEEE DEIS Malaysia Chapter)
http://www.ieeedeis.org/ (IEEE DEIS)
P A G E 3 I S S N 2 4 6 2 - 1 9 9 4
News on MyHVnet
In case you missed the previous news on Malaysian High
Voltage Network (MyHVnet), Issues 1 to 4 of MyHVnet
Newsletter (an initiative for the dissemination of high volt-
age related news, with particular emphasis on MyHVnet’s
activities) can be downloaded from the following link:
http://ivat.utm.my/myhvnet/news/

(….continued from page 1)
Two distinguished speakers were invited to present their
lecture at this seminar. The first speaker was Ir Dr Mohd
Fadzil Mohd Siam, the Chief Strategy Officer of TNB Re-
search Sdn Bhd. His lecture entitled “Reimagining Grid of
the Future – Our Roles and Perspective” focuses on the
changing energy industry landscape in Malaysia, and TNB’s
roles to support the Malaysia Electricity Supply Industry
through its ‘Reimagining TNB’ strategic initiatives. The sec-
ond lecture was given by Professor Paul Lewin, Head of
Electronics and Computer Science, University of Southamp-
ton. His presentation entitled “Future Electricity Networks
– Ensuring Reliable Electrical Transmission and Distribu-
tion” discusses the evolution of UK transmission networks
and the challenges in ensuring the delivery of a reliable and
sustainable electricity network.
Around 30 participants from various universities and in-
dustries attended the seminar. Throughout this pro-
gramme, valuable experiences were exchanged and fruitful
discussions were made between the industry and academia
within the electrical engineering domain. The committee
members of the IEEE DEIS Malaysia Chapter would like to
express their sincere thanks to the Institute of Power Engi-
neering UNITEN and the Malaysian High Voltage Network
(MyHVnet) for their commitment and support in making
this seminar a success.
# Assoc. Prof. Dr. Azrul Mohd Ariffin, Universiti Tenaga Nasional.
Various scenes during the sharing session.
Sharing Session on the Future of Electricity Industry
P A G E 4 MyHVnet Newsletter ISSUE 5 JANUARY 2020

P A G E 5 I S S N 2 4 6 2 - 1 9 9 4
(….continued from page 1)
commissioned in 2015 to enable the connection between
the Janamanjung substation to the 500 kV overhead lines.
There were 20 participants from various academic insti-
tutions in Malaysia, including Universiti Tenaga Nasional
(UNITEN), Universiti Malaysia Perlis (UNIMAP), Universiti
Teknikal Malaysia Melaka (UTEM), Universiti Tun Hussein
Onn Malaysia (UTHM), Universiti Teknologi Malaysia
(UTM), Universiti Sains Malaysia (USM) and Tunku Abdul
Rahman University College (TARC), as well as industry
representatives from Tenaga Nasional Berhad (TNB)
LABS, who joined the visit. The half-day programme start-
ed off with a presentation by Ir. Dr. Iryani Mohamed Rawi,
who was part of the team deploying the GIL system, shar-
ing some background about the project and her valuable
first-hand experience undertaking it. After the presentation,
a site visit was conducted, giving the participants clearer
insight and exposure on the system. Then, a visit to the
control room that monitors the performance of the GIL
system concluded the programme.
The committee members of the IEEE DEIS Malaysia
Chapter would like to express their sincere thanks to Grid
Maintenance Department, TNB for allowing and accommo-
dating the visit to Janamanjung Main Intake Substation. The
support from the members of MyHVnet were also
acknowledged for making the industrial visit a successful
event.
# Assoc. Prof. Dr. Azrul Mohd Ariffin, Universiti Tenaga Nasional.
Ms. Hidayah delivering her talk.
Exposure on 500 kV GIL Substation
The IEEE Dielectrics and Electrical Insulation Society (DEIS)
Malaysia Chapter, in collaboration with the School of Elec-
trical Engineering (SKE), Universiti Teknologi Malaysia
(UTM), successfully organised High Voltage Seminar on 18
April 2019 at SKE, UTM Johor Bahru. About 100 under-
graduate students undertaking the High Voltage Technology
course attended the seminar delivered by Ms. Nor Hidayah
Rahim, a PhD candidate of the Institute of High Voltage and
High Current (IVAT), UTM. Various interesting insights on
dielectrics and electrical insulation, especially those related
to nanodielectrics, were delivered by Ms. Hidayah during
the seminar. Ms. Hidayah also shared with the students
about research life at IVAT, high voltage research activities
carried out at IVAT, and potential research areas that ones
can explore for research purposes.
At the end of the seminar, an educational video about the
IEEE DEIS was broadcasted to the students. Through the
seminar, it is hoped that the students are aware of the lat-
est research and networking relevant to high voltage engi-
neering apart from obtaining their knowledge through class-
room lectures and textbooks. This would allow the stu-
dents to enhance learning through research information, in
line with UTM’s effort to enrich the nexus between re-
search, learning and teaching. Course Coordinator Dr.
Noor Azlinda Ahmad and Seminar Coordinator Ir. Dr. Lau
Kwan Yiew sincerely thank Ms. Hidayah for voluntarily de-
livering the seminar to the students.
# Ir. Dr. Lau Kwan Yiew, Universiti Teknologi Malaysia.
High Voltage Seminar at Universiti Teknologi Malaysia
P A G E 6
Caption describing
picture or graphic.
MyHVnet Newsletter ISSUE 5 JANUARY 2020
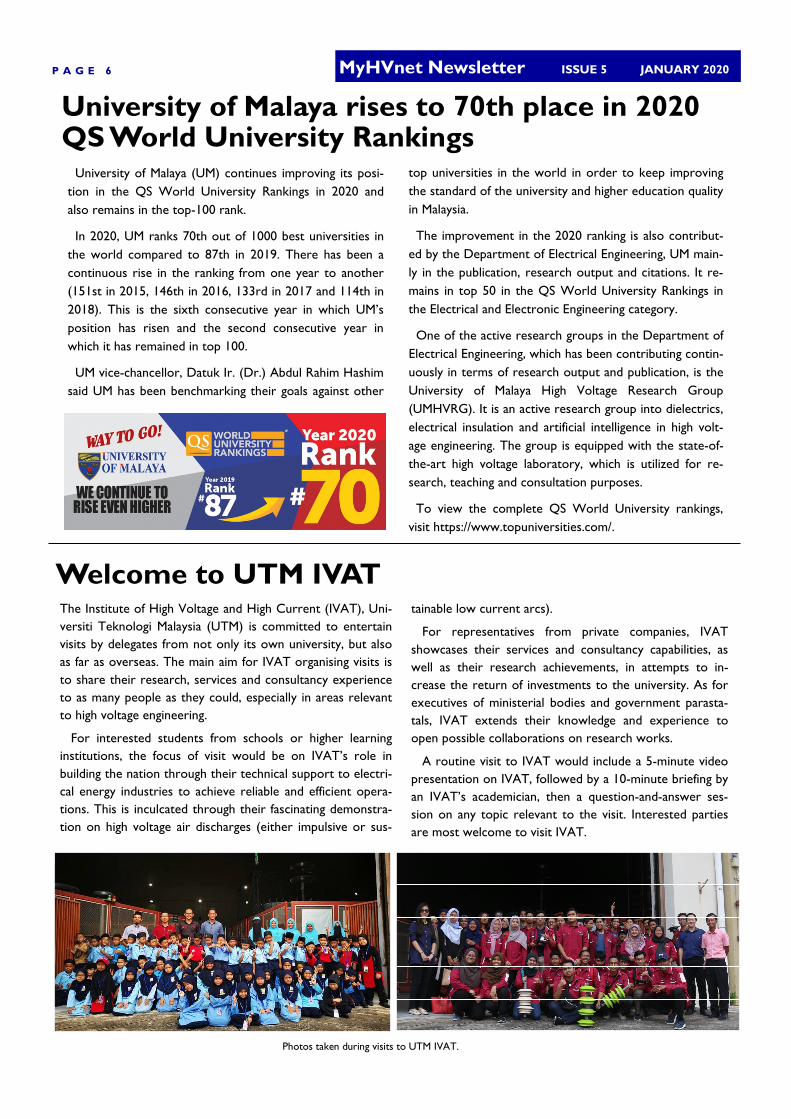
University of Malaya rises to 70th place in 2020 QS World University Rankings
University of Malaya (UM) continues improving its posi-
tion in the QS World University Rankings in 2020 and
also remains in the top-100 rank.
In 2020, UM ranks 70th out of 1000 best universities in
the world compared to 87th in 2019. There has been a
continuous rise in the ranking from one year to another
(151st in 2015, 146th in 2016, 133rd in 2017 and 114th in
2018). This is the sixth consecutive year in which UM’s
position has risen and the second consecutive year in
which it has remained in top 100.
UM vice-chancellor, Datuk Ir. (Dr.) Abdul Rahim Hashim
said UM has been benchmarking their goals against other
top universities in the world in order to keep improving
the standard of the university and higher education quality
in Malaysia.
The improvement in the 2020 ranking is also contribut-
ed by the Department of Electrical Engineering, UM main-
ly in the publication, research output and citations. It re-
mains in top 50 in the QS World University Rankings in
the Electrical and Electronic Engineering category.
One of the active research groups in the Department of
Electrical Engineering, which has been contributing contin-
uously in terms of research output and publication, is the
University of Malaya High Voltage Research Group
(UMHVRG). It is an active research group into dielectrics,
electrical insulation and artificial intelligence in high volt-
age engineering. The group is equipped with the state-of-
the-art high voltage laboratory, which is utilized for re-
search, teaching and consultation purposes.
To view the complete QS World University rankings,
visit https://www.topuniversities.com/.
Welcome to UTM IVAT tainable low current arcs).
For representatives from private companies, IVAT
showcases their services and consultancy capabilities, as
well as their research achievements, in attempts to in-
crease the return of investments to the university. As for
executives of ministerial bodies and government parasta-
tals, IVAT extends their knowledge and experience to
open possible collaborations on research works.
A routine visit to IVAT would include a 5-minute video
presentation on IVAT, followed by a 10-minute briefing by
an IVAT’s academician, then a question-and-answer ses-
sion on any topic relevant to the visit. Interested parties
are most welcome to visit IVAT.
The Institute of High Voltage and High Current (IVAT), Uni-
versiti Teknologi Malaysia (UTM) is committed to entertain
visits by delegates from not only its own university, but also
as far as overseas. The main aim for IVAT organising visits is
to share their research, services and consultancy experience
to as many people as they could, especially in areas relevant
to high voltage engineering.
For interested students from schools or higher learning
institutions, the focus of visit would be on IVAT’s role in
building the nation through their technical support to electri-
cal energy industries to achieve reliable and efficient opera-
tions. This is inculcated through their fascinating demonstra-
tion on high voltage air discharges (either impulsive or sus-
Photos taken during visits to UTM IVAT.
P A G E 7 I S S N 2 4 6 2 - 1 9 9 4
Pursue Your Postgraduate Studies at UTM IVAT
The Institute of High Voltage and High Current (IVAT), Universiti Teknologi
Malaysia (UTM), welcomes applications for Doctor of Philosophy (PhD) and
Master of Philosophy (MPhil) studies to undertake research projects at IVAT.
The themes of the projects include:
• Lightning characterisation, monitoring and detection
• Electromagnetic compatibility and interference
• Partial discharge detection and measurements
• Plasma and ozone generation applications
• Supercapacitors in high voltage applications
• Dielectrics and electrical insulating materials
Admission Requirements:
• PhD:
Entry to the programme requires a Master degree in Electrical Engineering
or equivalent from UTM or other Institution of Higher Learning recognised
by UTM. First-class Bachelor graduates (CGPA ≥ 3.67/4.00) may apply for a
fast-track PhD (terms & conditions apply)
• MPhil:
Entry to the programme requires a Bachelor degree in Electrical Engineer-
ing or equivalent from a tertiary institution recognised by UTM, with a min-
imum CGPA of 3.00/4.00 for fresh graduates, or a minimum of 2.50/4.00
with four (4) years experience as an Electrical Engineering practitioner
• English Requirement for International Students:
All international students must have a valid two-year old TOEFL or IELTS
certificate with a TOEFL score of 550 (or 79 IBT) or an IELTS Band 6
Why Study at IVAT?
• Our field of electrical and electronic engineering is ranked Top 100 in the
world (according to QS World Ranking by Faculty 2017)
• Our high voltage laboratory is the largest in Malaysia
• We have well-equipped high voltage facilities
• We have widely experienced supervisors working on a variety of high voltage related research and development
• We have dedicated student working areas for office and laboratory work
To Apply:
• Please send your resume with academic qualifications, transcripts and research proposal to the Director of IVAT, Prof.
Dr. Zulkurnain Abdul Malek at [email protected] anytime throughout the year. You may also directly contact the
respective project supervisors at IVAT.
For more information about IVAT, please visit: http://ivat.utm.my/
For more information about UTM’s postgraduate programmes, please visit: http://admission.utm.my/
PhD studies at University of Malaya High Voltage Research Group (UMHVRG) Greetings,
We would like to invite applications for Doctor of Philosophy (PhD) studies for projects in University of Malaya High Volt-age Research Group (UMHVRG). The scopes of the projects include but are not limited to:
• Partial discharge measurement and simulation • Dielectric material characterisations • Artificial intelligence techniques in condition monitoring • Optimisation techniques in high voltage equipment parameters’ estimation • Other high voltage engineering studies
STUDY MODE: Full-time research (Minimum 2 years, maximum 4 years)
REQUIREMENT: • Academic qualification:
♦ [Bachelor’s Degree in Electrical Engineering with CGPA ≥ 3.7 or equivalent] OR;
♦ [Bachelor’s Degree in Electrical Engineering with CGPA ≥ 3.0 or equivalent] AND [Master by research in Engi-neering OR Master by Coursework in Engineering with CGPA ≥ 3.00]
• Self-funded or having scholarship • Proficient in English language (written and spoken) • Pleasant personality, hardworking and self-motivated • Ability to carry out research work independently, quickly and efficiently • Willing to write review and research papers
Advantages of pursuing PhD in UMHVRG: • Widely experienced supervisors • Great high voltage laboratory facilities • Excellent working environment • Friendly and helpful colleagues • Top-class facilities in University of Malaya
Interested candidate please send your resume with academic qualifications, transcripts and research proposal to Associate Professor Ir. Dr. Hazlee Illias at [email protected] anytime throughout the year.
For more information on University of Malaya High Voltage Research Group, please visit http://umhvl.um.edu.my
For more information on application of PhD in University of Malaya, please visit https://pgadmission.um.edu.my/
Thank you.
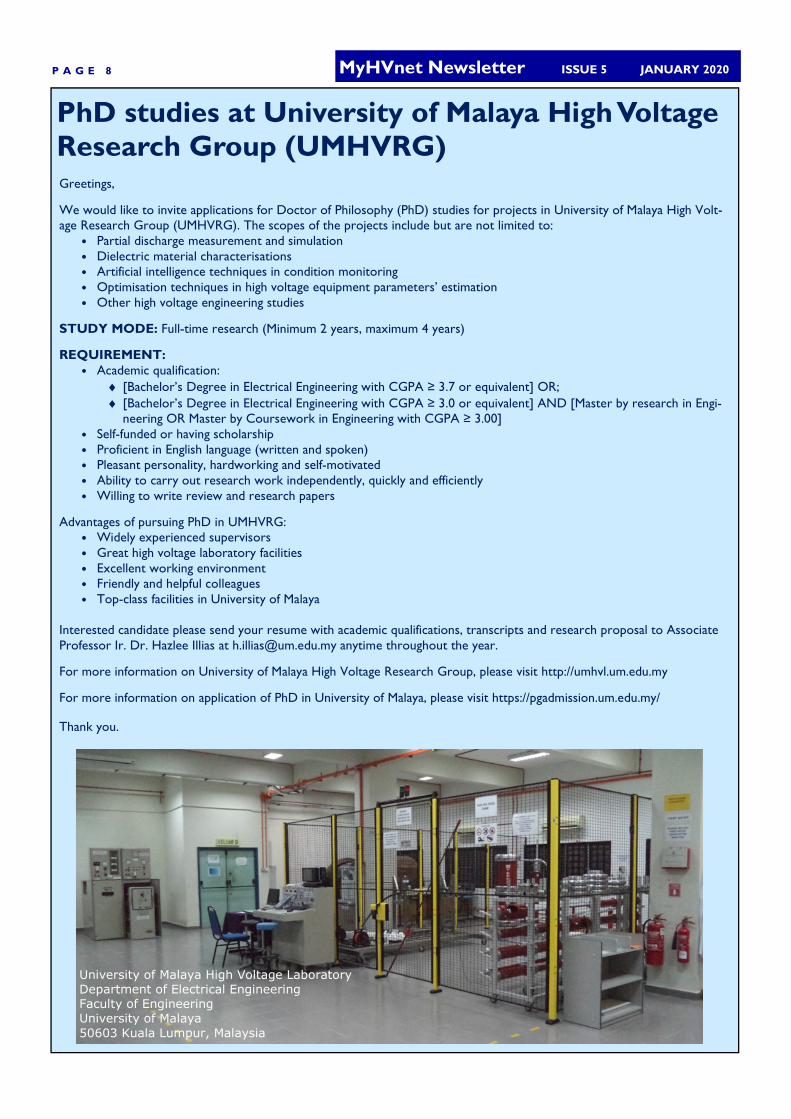
University of Malaya High Voltage Laboratory
Department of Electrical Engineering
Faculty of Engineering
University of Malaya
50603 Kuala Lumpur, Malaysia
P A G E 8 MyHVnet Newsletter ISSUE 5 JANUARY 2020

The Bachelor of Engineering (Electrical) pro-
gramme, codenamed SEEE, is one of the under-
graduate programmes offered by the Division of
Electrical Power Engineering (POWER), School of
Electrical Engineering, Faculty of Engineering, Uni-
versiti Teknologi Malaysia, to prepare graduates
for positions as electrical engineers. The SEEE
programme has been designed to emphasise not
only on the understanding and acquisition of basic
principles and skills in the field of electrical engi-
neering, but also on a wide range of subareas
including electronics, control systems, instrumen-
tation, signal processing, telecommunications and
power systems. The division also offers the Master
of Engineering (Electrical Power) programme,
codenamed MKEP, for those interested to pursue
a postgraduate degree (by taught course). For
more information, please visit POWER’s webpage
at https://engineering.utm.my/electrical/power/
[Picture courtesy of the Division of Electrical Pow-
er Engineering, Universiti Teknologi Malaysia]
SEEE MKEP
Universiti Teknologi Malaysia Improves to #17 in the QS Top 50 under 50 Ranking 2020
Universiti Teknologi Malaysia (UTM) has improved its rank-
ing in Quacquarelly Symonds (QS) World University Rank-
ings by moving up to #17 in the QS Top 50 under 50 Rank-
ing 2020 and is now in the top 20 list of young outstanding
universities. This significant performance is largely attribut-
ed to the strong commitment by UTM faculty members to
provide the best support in facilitating students’ learning
experience, while harnessing potential talent among stu-
dents to strive for excellence. UTM is also set to engage in
more impactful research collaborations that can ultimately
lead to improved performance through joint publications
and increased citations. UTM will also continue its efforts
in enhancing research collaborations with partners across
the globe, especially in areas of mutual interests. This
would help UTM researchers to leap forward and stay
relevant and visible among peers at the global level. UTM
would like to congratulate and thank all staff and students
who contributed and put effort into this achievement. To
view the complete QS World University rankings, please
visit https://www.topuniversities.com/university-rankings/
world-university-rankings/2020
P A G E 9 I S S N 2 4 6 2 - 1 9 9 4

P A G E 1 0 MyHVnet Newsletter ISSUE 5 JANUARY 2020

P A G E 1 1 I S S N 2 4 6 2 - 1 9 9 4
Messages from Advisors of 2020 PTeC and MyHVnet Colloquium
Advisor 1I
MyHVnet with IEEE Dielectrics and
Electrica Insulation Society (DEIS) Malay-
sia Chapter have collaborated with Uni-
versiti Teknologi MARA (UiTM), Bukit
Mertajam, Pulau Pinang to organise the
2020 PTeC and MyHVnet colloquium,
which will be held on 3rd February 2020
at UiTM Bukit Mertajam, Pulau Pinang.
This 3rd MyHVnet colloquium is the key
event for MHVnet, which is the 1st joint
colloquium with PTeC this year. We ex-
pect that this joint colloquium would provide a platform for
researches especially postgraduate students from various aca-
demic backgrounds and industrial partners to develop the
networking and exchange knowledge, ideas and expertise on
wide ranges of high voltage engineering research and their
Advisor 1
Assalamualaikum Wa Rahmatullahi Wa
Barakatuh,
In the Name of Allah, the Most Benefi-
cent, the Most Merciful. May the peace,
the mercy, and the blessings of Allah be
upon you.
Dear colleagues, professors, lecturers,
researchers, graduate students, ladies
and gentlemen. On behalf of the Faculty of
Electrical Engineering, UiTM Cawangan Pulau Pinang, Malaysia,
I would like to express my sincere gratitude and welcome you
to the 1st Power Technology and Research (PTeC2020) Col-
loquium and 3rd Malaysian High Voltage Network (MyHVnet)
Colloquium. The 1st PTeC Colloquium and 3rd MyHVnet
Colloquium is supported and co-organized by Malaysian High
Voltage Network (MyHVnet) and IEEE Dielectrics and Electri-
cal Insulation Society (DEIS) Malaysia Chapter. Thus, I would
be glad to express my sincere appreciation for their collabo-
ration and support to the colloquium.
I hope the 1st PTeC2020 Colloquium and 3rd MyHVnet
Colloquium would be able to achieve its objective in providing
an active forum for academician, novice researchers, and
practitioners to developing intelligent devices and technology
related to power engineering for accelerating industry 4.0 and
enriching smart societies. A smart society is the people who
have found ways to maximise these opportunities. A smart
society leverages the power and the potential of technology
Ts. Dr Zainal Hisham Che Soh, Universiti Teknologi MARA Cawangan Pulau Pinang
to make human beings more productive; to allow us to
focus our resources on activities and relationships that
matter; and ultimately to improve health, wellbeing and
the quality of life. Therefore, the focal drive of this collo-
quium is to exchange ideas, and by participating in this
exchange, it is hoped that all parties may benefit from
the colloquium, and to collaborate and to be a part of
the latest technological developments in power engi-
neering and science community.
Last but not the least, my deepest gratitude goes to the
Advisory Board, Organising Committee, Technical Pro-
gramme Committee (TPC) members, institutions, com-
panies, and volunteers who have directly and indirectly
supported the well-running of this colloquium. The com-
mittee has organised a vibrant scientific programme and
is working hard to present highly respected speakers to
lead it. Although we try our finest to be professional, on
behalf of Universiti Teknologi MARA Cawangan Pulau
Pinang, please accept our sincere apologies should there
be inconveniences that occur before, during, or after the
event. I wish you a very productive colloquium with ex-
citing and encouraging discussions and exchange of
knowledge so that together we can anticipate a future of
groundbreaking knowledge, research, and technology
accelerating industry 4.0 and enriching smart societies.
May God bless us all with good health to make this
event a successful and enjoyable one!
applications as well as in power systems and their appli-
cations. I am very pleased to realise that the joint collo-
quium received an encouraging response from the partic-
ipants all over Malaysia. Perhaps in the future this event
can be opened for international participation.
I would like to extend my sincere thanks to the PTeC
and MyHVnet colloquium Chairman and Co-Chairman,
Dr Saodah Omar (PTeC) and Assoc. Prof. Ts. Dr Muza-
mir Isa (MyHVnet) as well as with their team for putting
full effort and voluntary contribution for making the col-
loquium a success. As the colloquium is organised at the
northern region of Malaysia, beside gaining a memorable
experience at the colloquium, don’t forget to take this
opportunity to try the best Nasi Kandar in Penang.
Assoc. Prof. Ir. Dr. Mohamad Kamarol Mohamad Jamil, Uni-versiti Sains Malaysia.

Messages from Chairs of 2020 PTeC and MyHVnet Colloquium
Co-Chairman
Welcome!
It is my great pleasure to welcome you
to the 2020 PTeC and MyHVnet collo-
quium here in Universiti Teknologi MA-
RA (UiTM), Penang. We are very grate-
ful to UiTM Penang for their tremen-
dous support they have provided as the
host and to the colloquium Organising
Committee who has given their relenetless effort to en-
sure all the planned activities go smoothly. We are also fortu-
nate to have the support of a number of attendees who we
will get to meet during the colloquium. See you all!
Chairman
‘Together we strong’ is the suitable word
can we describe for this first collabora-
tion of PTeC and MyHVnet Colloquium.
An officially meeting between PTeC,
MyHVnet and IEEE DEIS Malaysia Chapter
was successfully held at Universiti
Teknologi MARA Cawangan Pulau Pinang
(UiTMPP) on July 2019 with 20 members
from both committees. This is the 1st
colloquium for Power Technology and Research Colloquium
(PTeC) and 3rd colloquium for Malaysia High Voltage Network
(MyHVnet). It was a great opportunity for PTeC to work to-
gether with MyHVnet and IEEE Dielectrics and Electrical Insu-
lation Society (DEIS) Malaysia Chapter committees as a team
with different field. MyHVnet and PTeC focusing on High Volt-
age and Power Engineering research respectively. This is a
great path for researcher to be united in one colloquium with
different field and the sharing knowledge can become more
abroad.
In the middle of 2019, PTeC was formed by lecturers from
Power Department Faculty of Electrical Engineering UiTM
Cawangan Pulau Pinang and focusing on Power Engineering
field. The idea of the collaboration began because few of the
Dr. Saodah Omar, Universiti Teknologi MARA Cawangan Pulau Pinang
lecturers from UiTMPP also members of MyHVnet com-
mittee. This colloquium will be a platform for all re-
searchers, academia and related industry to exchange
their knowledge and new findings, besides increases the
opportunity for the novice researcher to broaden their
knowledge and expertise.
I would like to take this opportunity to express my
thankful to the MyHVnet Chairman, Assoc. Prof. Ir. Dr.
Mohamad Kamarol Mohamad Jamil of Universiti Sains
Malaysia and Co-chairman of this 1st PTeC and 3rd
MyHVnet colloquium, Assoc. Prof. Ts Dr. Muzamir Isa of
Universiti Malaysia Perlis for their support, guidance,
commitment and assistance towards achieving the col-
laboration objective. It was a wonderful and fruitful ex-
perience for me to bring two committee in one collo-
quium. Hopefully this is the beginning of the new era of
researcher to engage and make PTeC and MyHVnet
visible.
Finally, my trust and confidence among committees’
members from both PTeC and MyHVnet will never end
on strengthening and promoting the colloquium.
Assoc. Prof. Ts. Dr. Muzamir Isa, Universi-ti Malaysia Perlis.
P A G E 1 2 MyHVnet Newsletter ISSUE 5 JANUARY 2020

Discussion Corner 1—Large Scale Solar Photovoltaic Power Plant System Implementations, Trends, Future Development and Challenges in Malaysia
Large Scale Solar Photovoltaic (PV), also known as LSSPV
Power Plant are designed from a huge solar PV array for the
supply of merchant power into the electricity grid connected
systems. In Malaysia, most LSSPVs are typically developed at a
scale of at least 1 MWp up to Multi-MWp solar systems. The
LSS programme in Malaysia was first introduced as LSS1 by
the Energy Commission (EC) of Malaysia in 2016 with the
capacity packages ranging from 1 MWac up to a maximum of
50 MWac. This was followed by LSS2 which was launched in
2017 with the capacity packages ranging from 1 MWac up to
a maximum of 30 MWac. The third round of the Large-Scale
Solar (LSS3) scheme was launched for bidding on August
2019, which aimed for 500 MWp quota with a maximum
capacity of 100 MWac for commissioning target in 2021.
With the implementation and launch of such a large scale
renewable energy project by the Malaysian government, a
more lucrative job opportunities in several engineering disci-
plines should be offered. This will drastically increase studies
and research on system implementations which would con-
tribute to trends and future developments of LSSPV systems
for improvement in terms of efficiency, timeframe and cost
effectiveness of the overall projects. Besides that, issues
and challenges on LSSPV to grid interconnection and
environment should also be highlighted.
Discussion Corner I1—Grounding in Electrical Power Systems
The most important part of an electrical power system is
its grounding system. A grounding system is functioned to
reduce the risk and provide safety to electrical shock from
current leakages into uninsulated metal parts of appliances,
power equipment or other electronic devices. A lightning
protection system is also very important in order to guard
against direct lightning strikes to buildings and divert the en-
ergy of the lightning strike to the earth without affecting the
structure of the buildings. An efficient grounding system
should have low resistance to limit the potential differences
at ground surface during the occurrence of fault current.
Two factors that could affect the performance of a grounding
system are the type of grounding electrode used and the
characteristics of the soil. Although a grounding electrode is
commonly a very good conductor, ageing or life expectancy
of the grounding electrode can be a major problem. Regard-
less of the material itself, a thick coating to the ground elec-
Dr. Mohd Najib Mohd Hussain is a Senior Lecturer in Faculty of Electrical
Engineering at Universiti Teknologi MARA
(UiTM), Pulau Pinang. He completed his
doctoral study (PhD) in 2016 from Univer-
siti Teknologi MARA (UiTM) Shah Alam
and Master in Engineering (MEng) of Elec-
trical Energy and Power System in 2006
from University of Malaya (UM). He also
granted a few National Funded of Funda-
mental Research Grant Scheme and ScienceFund for research
projects. He was appointed as a technical expert for Green Tech-
nology Financing Scheme from GreenTech Malaysia Corporation
from 2015 to 2018 and is currently assigned as Associate Consult-
ant for Large Scale Photovoltaic Solar (LSSPV) Power Plant for
Kuala Ketil 50 MW Edra Solar Project with Total Power Solutions
Sdn Bhd. His current research interests include power electronics
converter studies, renewable energy (LSSPV) applications and
power quality. Mohd Najib Mohd Hussain is a Member of Board
of Engineers Malaysia (BEM) and Institution of Engineers Malaysia
(IEM). He is also a Professional Technologist of Malaysia Board of
Technologists (MBOT).
Ts. Ir. Dr. Syahrun Nizam Md Arshad @ Hashim is a Senior Lecturer in School of Electrical
System Engineering at Universiti Malaysia
Perlis (UniMAP). He received PhD degree
in Electrical Engineering from Universiti
Putra Malaysia (UPM) and Master’s and
Bachelor’s degrees in Electrical Engineer-
ing from Universiti Teknologi Malaysia (UTM), in 2008 and 2011,
respectively. Previously, he was an Electrical Engineer at Mincon-
sult Sdn. Bhd. and involved in many project developments. His
current research interests include lightning protection systems
and renewable energy. Syahrun Nizam is a Senior Member of the
Institute of Electrical and Electronics Engineers (IEEE) and Mem-
ber of the Institution of Engineering and Technology (IET) and
Institution of Engineers Malaysia (IEM). He is also a Professional
Engineer of the Board of Engineers Malaysia (BEM).
trode would provide better corrosion protection,
therefore increasing the life expectancy of the material.
P A G E 1 3 I S S N 2 4 6 2 - 1 9 9 4

P A G E 1 4 MyHVnet Newsletter ISSUE 5 JANUARY 2020
2020 PTeC and MyHVnet Colloquium In 2020, Malaysian High Voltage Network (MyHVnet) Collo-
quium will be held in conjunction with Power Technology and
Research Colloquium (PTeC). The colloquium, namely 2020
PTeC and MyHVnet Colloquium, will be jointly organised by
Universiti Teknologi MARA, Malaysian High Voltage Network
(MyHVnet) and IEEE Dielectrics and Electrical Insulation Society
(DEIS) Malaysia Chapter at Universiti Teknologi MARA on 3
February 2020. This will be the third colloquium organised by
MyHVnet since its informal inception in 2015 by members from
various Malaysian organisations, including TNB Research Sdn.
Bhd., AM SGB Sdn. Bhd., Universiti Sains Malaysia, Universiti
Malaya, Universiti Putra Malaysia, Universiti Teknologi
Malaysia, Universiti Malaysia Pahang, Universiti Malaysia
Perlis, Universiti Malaysia Sabah, Universiti Teknikal
Malaysia Melaka, Universiti Tun Hussein Onn Malaysia,
Universiti Tenaga Nasional, and Universiti Kuala Lum-
pur. In the 2020 PTeC and MyHVnet Colloquium, the
topics of interest have been expanded to include high
voltage, power systems, power electronics and renew-
ables. The list of extended abstracts is on page 15.
Details of the abstracts can be found on the pages that
follow.
2020 PTEC AND MYHVNET COMMITTEE MEMBERS
Advisor I Ts. Dr. Zainal Hisham Che Soh
Advisor II Assoc. Prof. Ir. Dr. Mohamad Kamarol Mohd Jamil
Chairman Dr. Saodah Omar Dr. Rosheila Darus
Co-Chairman Assoc. Prof. Ts. Dr. Muzamir Isa
Secretary I/II Siti Solehah Md Ramli
Ir. Dr. Nor Asiah Muhamad Nurul Huda Ishak
Treasurer I/II Nur Darina Ahmad Nor Adni Mat Leh
Dr. Amir Izzani Mohamed Ts. Dr. Kamarulazhar Daud
Protocol, Technical and Event Manager Dr. Ahmad Asri Abd Samat
Ts. Abdul Malek Saidina Omar Assoc. Prof. Ir. Dr. Hazlee Azil Illias
Publication Siti Salwa Mat Isa
Nur Fadhilah Jamaludin Ir. Dr. Lau Kwan Yiew
Promotion and Website Aimi Idzwan Tajudin
Ts. Mohd Affandi Shafie Ts. Dr. Syahrun Nizam Md Arshad@Hashim
Certificate, Food and Location Siti Sarah Bt Mat Isa Noor Azila Ismail
Ts. Mohamad Adha Mohamad Idin

P A G E 1 5 I S S N 2 4 6 2 - 1 9 9 4
NO. TITLE MAIN ORGANISATIONAL AFFILIATION
A001 PERFORMANCE ANALYSIS OF 48 V BOOST CONVERTER DESIGNED FOR TELCO MINI TOWER’S
UPS
UNIVERSITI SAINS MALAYSIA
A002 GENERATOR PROTECTION WITH REVERSE POWER RELAY UNIVERSITI MALAYSIA PERLIS
A003 THERMAL AGING INFLUENCE ON KRAFT PAPER IMPREGNATED IN DIELECTRIC FLUIDS UNIVERSITI TEKNIKAL MALAYSIA MELAKA
A004 HIGH VOLTAGE ARCING FAULT MEASUREMENT SETUP UNIVERSITI MALAYSIA PERLIS
A005 THE EFFECT OF ELECTRIC FIELD OF INSULATION IN POWER TRANSFORMER UNDER DIFFERENT
GAP DISTANCE
UNIVERSITI TEKNOLOGI MARA
A006 A STUDY ON OIL CONDUCTIVITY USING POLARIZATION CURRENT TEST UNIVERSITI TEKNOLOGI MARA
A007 EFFECT ON ELECTRICAL TREE PROPAGATION IN XLPE CONTAINING UNTREATED AND TREATED
SILICA NANOFILLER
UNIVERSITI SAINS MALAYSIA
A008 ANALYSIS OF FOOT STEPS VOLTAGE GENERATION SYSTEM BASED ON PIEZOELECTRIC UNIVERSITI TEKNOLOGI MARA
A009 LLDPE-BASED INSULATION MATERIAL FIR HVDC CABLE APPLICATION UNIVERSITI SAINS MALAYSIA
A010 COMPARISON OF PD PATTERNIN MINERAL OIL AND PFAE UNDER INFLUENCE OF METAL PARTI-
CLES IN QUASI-UNIFORM FIELD
UNIVERSITI SAINS MALAYSIA
A011 IDENTIFICATION OF DISCHARGE INTENSITY LEVEL USING UV PULSE HARMONIC SIGNAL TENAGA NASIONAL BERHAD
A012 CHARACTERISTIC OF PARTIAL DISCHARGE ON MEDIUM VOLTAGE POWER CABLE WITH POLY-
NOMIAL REGRESSION
UNIVERSITI MALAYSIA PERLIS
A013 THE EFFECT OF DIFFERENT NOISE LEVELS ON DE-NOISING TECHNIQUE IN PARTIAL DISCHARGE
MEASUREMENT
UNIVERSITI MALAYSIA PERLIS
A014 EFFECT OF RTV COATING ON CERAMIC INSULATOR UNIVERSITI MALAYSIA PERLIS
A015 CURRENT STUDIES ON ULTRA HIGH FREQUENCY AND VERY HIGH FREQUENCY RADIATION
RELATIONSHIP WITH INITIAL ELECTRIC FIELD CHANGE IN TROPICAL STORMS
UNIVERSITI TENAGA NASIONAL
A016 RADAR ANALYSIS OF A TROPICAL HAILSTORM ASSOCIATED WITH LIGHTNING FLASH RATE
BASED ON LIGHTNING MEASUREMENT SYSTEM USING PARALLEL PLATE ANTENNA
UNIVERSITI TEKNOLOGI MALAYSIA
A017 DESIGN DAN DEVELOPMENT OF HIGH PERFORMANCE RF FRONT END INTERFEROMETER SYS-
TEM
UNIVERSITI TEKNIKAL MALAYSIA MELAKA
A018 EFFECT OF SUBSTATION GROUNDING GRID SIZES UNDER LIGHTNING TRANSIENT FAULTS UNIVERSITI TENAGA NASIONAL
A019 TEMPORAL ANALYSIS OF VERY HIGH FREQUENCY AND MICROWAVE RADIATION EMITTED BY
CLOUD-TO-GROUND LIGHTNING FLASH
UNIVERSITI TEKNIKAL MALAYSIA MELAKA
A020 MODELLING THE HOT-SPOT TEMPERATURE AND LOSS-OF-LIFE OF ONAN TRANSFORMER
BASED ON IEC 60076-7
UNIVERSITI PUTRA MALAYSIA
A021 MODELLING INDIVIDUAL FAILURE RATES OF TRANSFORMER POPULATION BASED ON HEALTH
INDEX
UNIVERSITI PUTRA MALAYSIA
A022 DEVELOPMENT OF LOW POWER DC-AC CONVERTER USING ATMEGA328P UNIVERSITI TEKNOLOGI MARA
A023 A COMPARATIVE STUDY ON ELECTRICAL PROPERTIES OF VIRGIN COCONUT OIL UNDER ACCEL-
ERATED THERMAL AGING
UNIVERSITI TEKNOLOGI MARA
A024 STRUCTURE AND DIELECTRIC PROPERTIES OF POLYPROPYLENE/CALCIUM CARBONATE NANO-
COMPOSITES
UNIVERSITI TEKNOLOGI MALAYSIA
A025 INFLUENCE OF NON-BRIDGE AND BRIDGE CONTAMINATED TRANSFORMER OIL ON LIGHTNING
IMPULSE BREAKDOWN VOLTAGE
UNIVERSITI SAINS MALAYSIA
A026 TREE INCEPTION VOLTAGE IN XLPE CONTAINING ALUMINA NANOFILLER UNIVERSITI SAINS MALAYSIA
A027 WIRELESS SF6 GAS DISTRIBUTION MONITORING SYSTEM UNIVERSITI TEKNIKAL MALAYSIA MELAKA
A028 ANALYSIS OF NATURAL ESTER TRANSFORMER OIL UNDER THERMAL AGING CONDITIONS US-
ING UV-VIS SPECTROSCOPY
UNIVERSITI TEKNIKAL MALAYSIA MELAKA
A029 RELATIONSHIP BETWEEN REFRACTIVE INDEX AND TOTAL ACID NUMBER AND WATER LEVEL IN
THERMALLY AGED NATURAL ESTER TRANSFORMER OIL
UNIVERSITI TEKNIKAL MALAYSIA MELAKA
A030 FAULT CLASSIFICATION IN TRANSMISSION LINES USING ANN. UNIVERSITI TEKNOLOGI MARA
A031 A STUDY ON HEAT TRANSFER DISTRIBUTION OF DIFFERENT LENGTH OF GROUNDING ELEC-
TRODE
UNIVERSITI TEKNOLOGI MARA
A032 AN EXPERIMENTAL STUDY ON ULTRAVIOLET SENSOR SIGNAL PATTERN OF DIFFERENT TYPES
OF INSULATOR MATERIAL
UNIVERSITI SAINS MALAYSIA
A033 OPTIMIZATION OF CORONA RING DESIGN FOR PORCELAIN INSULATOR STRING UNIVERSITI MALAYA
A034 MODELLING OF THREE-PHASE VOLTAGE SOURCE INVERTER (VSI) FOR GRID-CONNECTED PHO-
TOVOLTAIC (PV) GENERATION SYSTEM
UNIVERSITI SAINS MALAYSIA
A035 OPTIMAL PLACEMENT OF PMU FOR COMPLETE OBSERVABILITY OF POWER SYSTEM CONSIDER-
ING ZERO INJECTION AND ISLANDING CONDITION
UNIVERSITI PUTRA MALAYSIA
A036 IMPROVEMENT OF WIND TURBINE LIGHTNING RECEPTOR UNIVERSITI MALAYSIA PAHANG
A037 CLASSIFICATION OF CABLE JOINT DEFECTS USING OPTIMIZED ARTIFICIAL INTELLIGENCE UNIVERSITI MALAYA
Extended Abstract for 2020 PTeC and MyHVnet Colloquium A001
PAGE 16
PERFORMANCE ANALYSIS OF 48V BOOST CONVERTER
DESIGNED FOR TELCO MINI TOWER’S UPS
M.N. Mamat1,*, S. Kaharuddin1 1School of Electrical and Electronic Engineering, Universiti Sains Malaysia, 14300, Pulau Pinang, Malaysia.
*E-mail: [email protected]
Abstract – This paper presents performance analysis of
48V boost converter designed for uninterruptible power
supply (UPS) for telco mini tower based on duty cycle
variations. The converter uses 12V battery bank as its
main input supply and it is designed based on boost
topology switched mode power supply with a simple
voltage control mode scheme. This converter is set to
operate at 30kHz switching frequency with a very low
ripple voltage in the output stage. Duty cycle in the
voltage mode controller is varies from 0.6 to 0.9 in order
to observe the effect and performance at the output stage.
Simulation and experimental results show that the
proposed converter works very well with the 375µH
fabricated choke and it produces a stable 48V output
voltage with 20mVp-p ripple voltage at duty cycle of 0.8,
which is considered good for a regulated DC output.
Keywords – Boost Converter, Duty Cycle, UPS
INTRODUCTION
Nowadays, we witness an increasing number of telco
providers with huge amount of subscribers daily. Thus, a
reliable uninterruptable power supply for telco mini tower
is very critical in order to maintain an interruptible and
continuous transmission. Typically, the main power
supply for the mini tower is delivered from the national
grid and backed up by the fossil fuel generator. With the
higher cost of electricity and unpredictable fossil fuel
market price, there is higher demand to integrate
alternative sources as stable backup power supply while
at the same time reducing the operation cost. In this design,
solar power has been chosen as the alternative renewable
source to charge the battery bank storage rated at 12VDC.
The battery bank will then become the main input supply
to power the UPS for the mini tower. Finally, the DC-DC
converter will convert the 12V to 48V for the transceiver
system to operate in interruptible and continuous
operation.
METHODOLOGY
In this design, boost topology is chosen as the best
topology to be used because it is highly practical for the
application with output power less than 150W.
Furthermore, the construction can be made simple
because no isolation is needed to isolate the input and
output. The typical efficiency is also good which is more
than 80% and it is also the cheapest to manufacture
compared to other topologies [1-3]. SG3524 is selected as
the driver circuit to control the power switch using PWM
scheme. This controller IC is able to produce switching
frequency up to 300kHz and 0.9 maximum duty cycle and
it is a perfect choice for the proposed design.
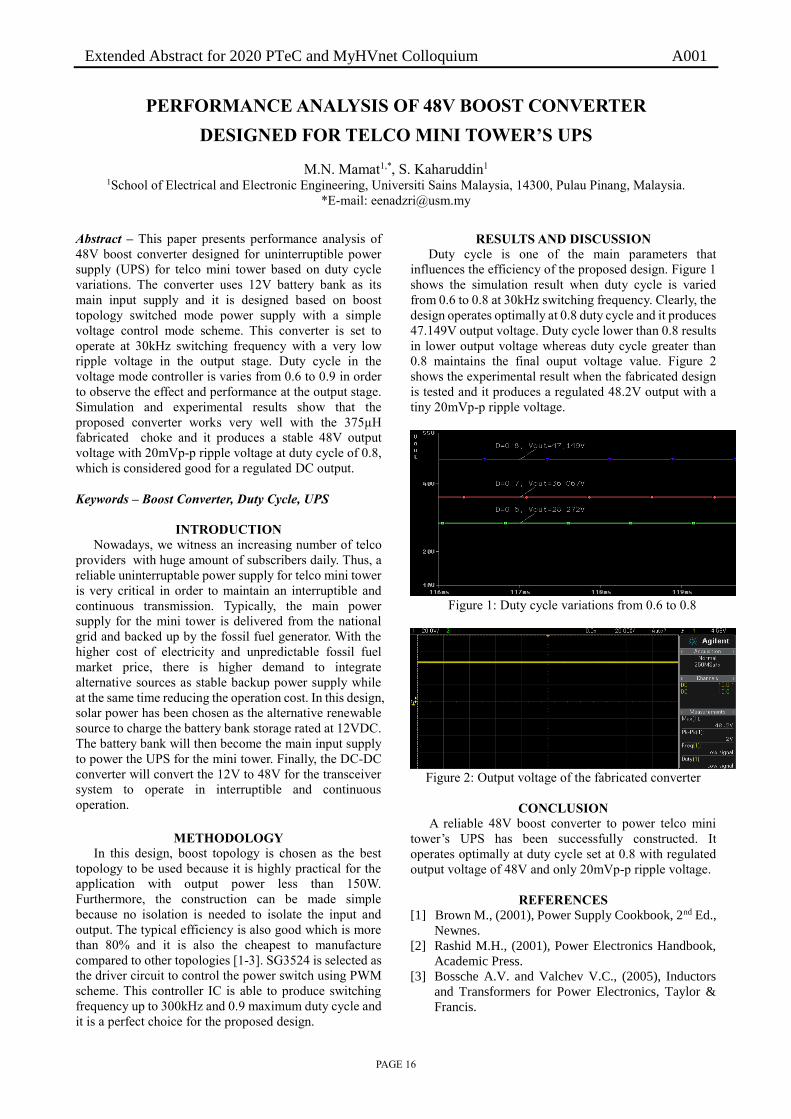
RESULTS AND DISCUSSION
Duty cycle is one of the main parameters that
influences the efficiency of the proposed design. Figure 1
shows the simulation result when duty cycle is varied
from 0.6 to 0.8 at 30kHz switching frequency. Clearly, the
design operates optimally at 0.8 duty cycle and it produces
47.149V output voltage. Duty cycle lower than 0.8 results
in lower output voltage whereas duty cycle greater than
0.8 maintains the final ouput voltage value. Figure 2
shows the experimental result when the fabricated design
is tested and it produces a regulated 48.2V output with a
tiny 20mVp-p ripple voltage.
Figure 1: Duty cycle variations from 0.6 to 0.8
Figure 2: Output voltage of the fabricated converter
CONCLUSION
A reliable 48V boost converter to power telco mini
tower’s UPS has been successfully constructed. It
operates optimally at duty cycle set at 0.8 with regulated
output voltage of 48V and only 20mVp-p ripple voltage.
REFERENCES
[1] Brown M., (2001), Power Supply Cookbook, 2nd Ed.,
Newnes.
[2] Rashid M.H., (2001), Power Electronics Handbook,
Academic Press.
[3] Bossche A.V. and Valchev V.C., (2005), Inductors
and Transformers for Power Electronics, Taylor &
Francis.

Extended Abstract for 2020 PTeC and MyHVnet Colloquium A002
PAGE 17
GENERATOR PROTECTION WITH REVERSE POWER RELAY
C.L.Wooi1,*, Y.Y. Lee1, S N M Arshad1
1Centre of Excellence for Renewable Energy, School of Electrical Systems Engineering,
Universiti Malaysia Perlis, Pauh Putra Campus, 02600 Arau, Perlis.
*E-mail: [email protected]
Abstract – This paper proposes the modeling and
simulation of generator protection for power system using
digital reverse power relay. This generator protection
considered different examples with two different source
synchronous generators 11kV, connected with 220kV
through a step-up transformer. The reverse power relay
discussed in this paper is high accuracy and high speed
digital relays. Several cases based on various types of
mechanical inputs to generator were studied. The
simulation result done using Matlab/Simulink shows that
output of the modelling for 11 kV generator protection is
successful and shown a similar results compared to the
theory result.
Keywords – Power Protection System; Reverse Power
Relay; Reverse Power Protection;
INTRODUCTION
Generators in an electrical power system can be
affected not only by electrical and mechanical faults but
also internal and external faults. Any fault occurred in the
power system should also be cleared automatically and
tripping as soon as possible, otherwise it may cause
permanent damage to the generator[1]. Hence, preventive
measures must be taken to ensure smooth operation and to
minimize the fault effect[2]. One of the faults that can
occur is the generator reverse flow condition which is
caused by the prime mover failure. Prime mover is the
mechanical system that turns the generator. If the prime
mover fails to supply mechanical energy to the generator,
the generator will continue to rotate in motoring mode
which means it takes electrical energy from the system
instead of supplying it to the system [3]. The reverse
power relay is a directional protective relay that is used
for the protection of the generating stations to avoid power
from flowing in the reverse direction (reverse power flow).
This paper proposes the modeling and simulation of
generator protection for power system using digital
reverse power relay.
METHODOLOGY
The modelling and simulation of generator protection
using digital reverse power relay was done by using
MATLAB. For testing and simulation of the designed
relay, a 200 MVA 11 kV synchronous machine is used,
connected with 220 kV network through a step-up
transformer 11/220 kV as shown in Figure 1.
Figure 1: Modelling of Reverse Power Relay in Power
System
RESULTS AND DISCUSSION
The relay is tested under three different scenarios.
The test conditions and results are given in table 1.
Table 1: Simulation Results for 11 kV Synchronous Machine
CONCLUSIONS
The result shows that output of the modelling for 11
kV generator protection is similar to theory explanation.
As compared to other power relay model in existing
power system software, MATLAB offers advantage in
terms of their flexibility which allow researchers to
modify the testing parameters as well as the design of the
relay.
ACKNOWLEDGEMENTS
The authors would like to thank Centre of Excellence
for Renewable Energy, School of Electrical System
Engineering, Universiti Malaysia Perlis, UniMAP for
facilities and financial support.
REFERENCES
[1] O. A. Youssef, “A wavelet-based approach for
protection of generators against unbalanced
currents,” Electr. Power Syst. Res., vol. 63, no. 1, pp.
73–80, Aug. 2002.
[2] M. Geidl, Protection of Power Systems with
Distributed Generation - State of the Art. 2005.
[3] S. Taşkin, “POWER PLANTS MONITORING FOR
REVERSE POWER FLOW EVALUATION.”
emitted from metre-scale negative discharges in air,”
J. Phys. D. Appl. Phys., vol. 48, no. 2, 2015.

Extended Abstract for 2020 PTeC and MyHVnet Colloquium A003
PAGE 18
THERMAL AGING INFLUENCE ON KRAFT PAPER
IMPREGNATED IN DIELECTRIC FLUIDS
I. S. Chairul1,*, N.A. Bakar1, S.A. Ghani1 M.N.H.A. Hamid1
1High Voltage Engineering Research Laboratory, Centre for Robotics and Industrial Automation, Fakulti Kejuruteraan
Elektrik, Universiti Teknikal Malaysia Melaka, Hang Tuah Jaya, 76100 Durian Tunggal, Melaka, Malaysia.
*E-mail: [email protected]
Abstract –This work compared the condition of oil-
papers subjected to thermal aging conducted at 130°C
for 750 hours. Results indicate that kraft papers
impregnated in palm oil (PO) have better tensile
strength after 750 h of aging, compared to kraft papers
impregnated in mineral oil (MO). It is concluded that
PO is better than MO in delaying the degradation of
kraft papers.
Keywords – Mineral oil, Palm oil, Tensile strength
INTRODUCTION
Insulating oil is used as an insulant and cooling
medium while paper insulates conductors between
turns, windings , and phases. Over time, oil-paper
degraded as transformers subjected to stresses (i.e.
electrical, ambient, mechanical and thermal), resulting
in the remnant life of a transformer to be shortened.
One way to prolong a transformer life is by choosing a
good insulating oil that could slow down the paper
degradation. In this regard, this work seeks to provide
pieces of information on the condition of thermally
aged oil and paper of different oil-paper combinations.
METHODOLOGY
Two oil-paper combination samples were prepared
in this work: (i) mineral oil-kraft paper (MO-KP) and
(ii) palm oil-kraft paper (PO-KP). Each sample is
inclusive of oil, paper and metal catalysts (i.e. copper,
iron, aluminium, and zinc). The weight of the paper is
1:10 of the oil [1]. The accelerated thermal aging
process was conducted in a laboratory at 130°C with
the absence of air for 750 h. Prior to the aging process,
the insulating oils and papers were dried so that it
fulfills the requirement for insulating oil and paper in
accordance with standards. Next, the paper and metal
catalysts were immersed in the insulating oils for 24 h
at room temperature. After aging process, samples
were taken out from the oven and left at room
temperature for 24 h prior to measurement on
properties of the oil (i.e. moisture, acidity) and paper
(i.e. tensile strength, structure image).
RESULTS AND DISCUSSION
Table 1 tabulated the properties of MO-KP and PO-
KP samples. It can be observed that moisture and
acidity of both oils are increased after 750 h of thermal
aging. Aged oil of PO-KP has higher moisture
compared to aged oil of MO-KP. In contras, the acidity
of aged oil of MO-KP is higher than aged oil of PO-KP,
As for kraft paper, tensile strength was decreased to
3.546 MPa (aged MO-KP) and 8.779 MPa (aged PO-
KP), a decrement of 96 % and 90 % respectively,
relative to the initial values. Additionally, it is shown
that kraft paper samples are darker than their original
colour as tensile strength decreased (see Figure 1). The
findings might be explained in-term of the ability of
insulating oil to absorb moisture. Palm oil; a natural
ester has greater affinity towards moisture compared to
mineral oil. Therefore, hydrolytic degradation
mechanism experienced by kraft paper of PO-KP is
lesser than of MO-KP, resulting in slower degradation
of kraft paper.
Table 1: Comparison of the properties of thermally aged
MO-KP and PO-KP samples MO-KP PO-KP
Property New Aged New Aged
Oil
Moisture (ppm) 18.30 105.10 185.62 714.30 Acidity (mg KOH/g) 0.0442 0.8116 0.0500 0.6652
Kraft paper
Tensile strength (MPa) 86.485 3.546 86.485 8.779
(a) (b) (c)
Figure 1: Structure image of kraft paper (KP): (a) new KP,
(b) KP of aged PO-KP and (c) KP of aged MO-KP
CONCLUSIONS
A natural ester such as palm oil is known to have
higher moisture absorption levels compared to mineral
oil. As palm oil absorbs more moisture, kraft papers
become drier, thus delaying its degradation, resulting
in tensile strength and colour preservation.
ACKNOWLEDGEMENTS
Financial support provided by the Universiti
Teknikal Malaysia Melaka under the Short Term Grant
(PJP/2019/FKE(5A)/S01670).
REFERENCES [1] S. Tenbohlen and M. Koch, “Aging Performance and Moisture
Solubility of Vegetable Oils for Power Transformers,” IEEE
Trans. Power Deliv., vol. 25, no. 2, pp. 825–830, Apr. 2010.
Figure'3.8:'Structure'paper'for'PFAE'130C'
Figure'3.10:'Structure'paper'for'Gemini<X'130C'
Figure'3.8:'Structure'paper'for'PFAE'130C'
Figure'3.10:'Structure'paper'for'Gemini<X'130C'
Figure'3.8:'Structure'paper'for'PFAE'130C'
Figure'3.10:'Structure'paper'for'Gemini<X'130C'

Extended Abstract for 2020 PTeC and MyHVnet Colloquium A004
PAGE 19
HIGH VOLTAGE ARCING FAULT MEASUREMENT SETUP
A.N.Nanyan,1*,M.Isa1,M.N.K.H.Rohani1, H.A.Hamid1, A.Z.Abdullah1, A.Nazifah Abdullah1 1School of Electrical System Engineering, Universiti Malaysia Perlis (UniMAP), 02600 Pauh Putra Campus, Arau,
Perlis Malaysia.
*E-mail: [email protected]
Abstract – The occurencence of arc fault or arc flash in
the power system may results the interruption of power
supply to the electricity user; damage the equipment itself
incurs maintenance and interuption cost. The objective of
this experiment is to demonstrate the breakdown voltage
of the indoor air-gaps (arc fault). The laboratory
measurement were performed on the typical indoor air
gaps under typical indoor atmosphere conditions.The
indicated result shows that the temperature also influence
the dielectric strength of air or breakdown voltage of air.
As a conclusion, this air gaps or arc generator set up is
suitable for modelling arcing fault measurement in the
power system network.
Keywords –Air Breakdown voltage, Arc fault, Arc
generator
INTRODUCTION
An arc fault is a gas-free discharge anomaly induced
by an air breakdown due to the deterioration of the
electrical lines or equipment insulation, the loosening of
electrical connections, air pressure and/or a sharp increase
in voltage or current. The arc is formed due to air gap
between energised conductor and a high impedance object.
Arc fault can be divided into two categories; series Arc
fault and parallel. Series arc fault is the condition where
fault current is limited by the load such as poor cable
jointing of the same phase, loose cable lugs, bad
termination cables etc. In order to study the effect of
temperature on the breakdown voltage of the indoor air-
gaps, the series circuit of arc generator was setup in the
labarotary. The IEEE Standard 1584-2002 provides
techniques in determining arc flash hazard due to an arc
event in 3-phase ac systems. In standard conditions, the
dielectric strength of air is about 3kV/mm [1]. The indoor
temperature and humidity effect to the dielectric strength
of the air is discussed roughly.
METHODOLOGY
Figure 1 shows the series arc fault set up diagram that
been done in this experiement. The BAUR-PGK70HB
was used for the high voltage signal injection while
Keysight digital oscilloscope DSO-X3024A used for
recording the data captured from Rogowski Coil as arc
fault sensor. The load represented by 1kΩ resistor.
Primary Rod
Digital Oscilloscope
Arc Generator
Air Gap
AC
240VAC/50Hz
Secondary rod
Tested RC s
Sensor
Keysight
DXO-X 3024
BAUR PGK
70HB
AC Transformer
Load
Figure 1: The measurement setup of series arc fault circuit
In this measurement, the series arc geneator model was
setup using two (2) copper conductor rod (diameter 10
mm2); primary and secondary rod. These rod presenting
the power cable which is arc fault signal travel along the
secondary rod until the end. Figure 2 shows the real
measurement setup of series arc fault measurement that
been done in the lab.
Figure 2: Indoor Modelling of Series Arcing Fault and Setup in
the High voltage lab
RESULTS AND DISCUSSION
The arc fault measurement setup is shown in Table 1.
As can be seen that, the temperature was effected the
dielectric strength of air. At 28.20 °C, the air breakdown
was fullfill the theory of dielectric strength 3kV/mm. How
ever, with the same distance of air gaps, the breakdown
voltage in the air increased significantly when the
temperature dropped. The same condition happen to the
2.50mm air gap where the breakdown voltage slightly
changed when the temperature changed.
Table 1. The effect of indoor temperature to the
dielectric strength (kV) of Arc Generator
Gap Distance
(cm)
Dielectric
Strength (kV)
Temperature
(°C)
0.10 3.00 28.20
0.10 5.00 16.00
2.50 16.0 27.00
2.50 17.00 16.30
CONCLUSIONS
In this paper, the temperature effect due to the arc fault
measurement was discussed. It can say that, the changing
of the temperature and gap distance could effect the
dielectric strength of the air. However, the conductor tip, and
insulating material also influced the air breakdown of
voltage.
REFERENCES
[1] J. C. Kim, D. O. Neacsu, B. Lehman, and R. Ball,
“Series AC Arc Fault Detection Using Only Voltage
Waveforms,” in 2019 IEEE Applied Power
Electronics Conference and Exposition (APEC), 2019,
pp. 2385–2389.

PAGE 20
Extended Abstract for 2020 PTeC and MyHVnet Colloquium A005
THE EFFECT OF ELECTRIC FIELD OF INSULATOR IN POWER
TRANSFORMER UNDER DIFFERENT GAP DISTANCE
N. R. Ruzlee1, S. S. M. Ramli1*, N.D. Ahmad1, N.H. Ishak1, MKM Jamil2, 1Faculty of Electrical Engineering, Universiti Teknologi Mara Pulau Pinang, 13500 Permatang Pauh, P. Pinang, Malaysia.
2School of Electrical and Electronic Engineering, Universiti Sains Malaysia. *E-mail:
Abstract – This paper investigates the effect of the electric
field under different gap distances. The electrodes that were used in this study are uniform and non-uniform. The
electric field was obtained by simulating all types of
electrodes by using COMSOL software. The electrodes were drawn by using AutoCAD software and the gap
distance ranges from 1 mm to 6 mm. The result obtained was sphere-sphere electrode has a higher trend compared
to other uniform electrodes, while non-uniform electrodes
have the same trend.
Keywords – Electric field, gap distance, mineral oil,
uniform and non-uniform electrodes
INTRODUCTION
Insulator is defined as any material that keeps energy
such as electricity, heat or cold from easily transferring
through. Insulation in power transformers are divided into three types which are liquid, gas or solid. In this study,
mineral oil was chosen as an insulator. The electrodes that
were used in this study are uniform electrodes which are sphere-sphere, mushroommushroom and plane-plane.
While the non-uniform electrodes are sphere-mushroom, sphere-plane and mushroom-plane electrodes. This study
is to investigate the electric field between two electrodes
under the influence of different gap distances.
METHODOLOGY
The project was done by using two different software.
AutoCAD was used to draw all of the electrodes in different gap distances range from 1 mm to 6 mm.
COMSOL software was used to simulate the electrodes to
obtain the result for the electric field in different gap distances. The electrodes that were used in this study
imitates the conductor parts of the power transformer. The dimension of the electrodes is according to the IEC 60156
standard. The voltage was set to 33 kV and the current is
660 A. The insulator for this study is mineral oil. The material that was used for the electrode in this study is
brass.
RESULTS AND DISCUSSION
Figure 1 shows the comparison between 6 types of
electrodes under different gap distance. The electric field
indicates that it is decreases and will remain constant as the gap distance increases. The graph shows that
spheresphere electrode has a higher trend compared to
other uniform electrodes. Meanwhile for the non-uniform electrodes, the trend almost similar. The percentage of
different electric field for sphere-sphere electrode for each gap distance range from approximately 6.25% until
31.65%. While non-uniform electrodes, the percentage
difference of electric field for the mushroom-plane electrode range from 9.56 % to 31.33 %. Electric field is
the highest in 1 mm gap distance for all electrodes. The electric field was highest for sphere-sphere in 1 mm is
33.95x10^6 V/m. In 6 mm gap distance for sphere-sphere
electrode, the electric field recorded was low which is 7.10 x10^6 V/m. In 2.5 mm, the electric field recorded was
14.46 x10^6 V/m.
Fig. 1:
CONCLUSIONS
It is found out that the further the distance between two
electrodes, the electric field distribution will be evenly
distributed but the connection bridge will be less. The voltage and the current across the electrode surface
remains the same. The distance between two electrodes increase, the electric field decreases. In uniform electrode,
sphere-sphere electrode has higher trend compared to the
other two, hence when the gap distance is 2.5 mm, the difference between the three electrode are 1.4 x10^6 V/m.
While non-uniform electrodes, there is not much of
difference in terms of electric field among the electrodes.
ACKNOWLEDGEMENTS
The author would like to thank the Faculty of Electrical
Engineering of UiTM Pulau Pinang and University Sains Malaysia for guiding this study and provide technical
support.
REFERENCES
[1] R. Turcotte, “Transformer Oil Testing The Value Of
Transformer Oil Testing Dissolved Gas-In-Oil Analysis,” pp. 1–6, 2011.
[2] Mohammad R. Meshkatoddini, “Aging Study and
Lifetime Estimation of Transformer Mineral Oil,” Power and Water University of Technology, 2008.

Extended Abstract for 2020 PTeC and MyHVnet Colloquium A006
PAGE 21
A STUDY ON OIL CONDUCTIVITY USING POLARIZATION CURRENT
TEST
M Azzulddin M Aznam1, Nur Darina Ahmad2, Nor Asiah Muhamad3 1,2Faculty of Electrical Enginering, Universiti Teknologi MARA, 13500 Pematang Pauh, Penang, Malaysia.
3Centre of study of Electrical and Electronic Engineering, Universiti Sains Malaysia,14300 Nibong Tebal, Pulau
Pinang.
E-mail: [email protected], [email protected], [email protected]
Abstract – This research is conducted to study the result of
polarization and depolarization current test on petroleum based
and natural ester insulating oil. Besides, the result of the
polarization current test on the petroleum based and natural
esters will be analysed. This research conducted on mineral oil,
palm kernel oil, virgin coconut oil and corn oil using
polarization and depolarization test. 1 kV has been charged on
the insulating oil that placed in a test cell. The small current
that pass through the insulating oils will be measured and
recorded using Keithley meter. The recorded current has been
analysed and conclusions has been made.
Keywords – polarization current test, natural esters,
conductivity.
INTRODUCTION
Corn oil (CO) and virgin coconut oil (VCO) are tested
in this study. The conductivity corn oil will be study and
will be analysed for insulate the transformer. These
insulating oils will be tested using PDC test. PDC test is
a non-destructive test that can be performed to observe
the dielectric properties of liquid insulating materials [1],
[2].
METHODOLOGY
The first step is to prepare the insulating oil sample.
The capacitance value of the sample has been measured
and record. Then, set the connection of the test
instrument. Polarization current and has been measured
and recorded. After gaining the reading of polarization,
the result has been analysed.
RESULTS AND DISCUSSION
After measuring and recording polarization current of
the sample, the result has been tabulated and analysed.
The lowest polarization current is corn oil and virgin
coconut oil polarization conductivity is higher.
Figure 1: average polariztion current of Corn Oil and Virgin
Coconut Oil.
CONCLUSIONS
As a conclusion, from all the data that has been
recorded and analysed, polarization current reading of
corn oil is lower than virgin coconut oil. this shows that
the conductivity of corn oil is lower and can be consider
for become good insulator.
ACKNOWLEDGEMENTS
The authors gratefully acknowledge UiTM Pulau
Pinang for lab facilities, and USM of Engineering
Campus for lab facilities.
REFERENCES
[1] N. . Muhamad, B. T. Phung, and T. R. Blackburn,
“Polarization and Depolarization Current (PDC)
Tests on Biodegradable and Mineral Transformer
Oils,” in Proceedings of the 16th International
Symposium on High Voltage Engineering, 2009.
[2] I. Fofana, H. Hemmatjou, M. Farzaneh, E.
Gockenbach, and H. Borsi, “Polarization and
depolarization current measurements of oil
impregnated paper insulation system under
thermal runaway,” in Proceedings of the 2010
IEEE International Conference on Solid
Dielectrics, ICSD 2010, 2010.

Extended Abstract for 2020 PTeC and MyHVnet Colloquium A007
PAGE 22
EFFECT ON ELECTRICAL TREE PROPAGATION IN XLPE CONTAINING
UNTREATED AND TREATED SILICA NANOFILLER
N.S.M.Nazar1,2*, N. S. Mansor1, A. I. Mohamed4, N. A. Muhamad1, M. Mariatti3 and M. Kamarol1 1School of Electrical and Electronic Engineering, Universiti Sains Malaysia
2Department of Electrical and Electronic Engineering, Universiti Pertahanan Nasional Malaysia 3School of Material and Mineral Resources Engineering, Universiti Sains Malaysia
4Faculty of Electrical and Electronics Engineering, University Malaysia Pahang
*E-mail: [email protected],
corresponding author: M. Kamarol
Abstract – This paper presents a study on electrical tree
propagation in XLPE containing untreated and KH550
treated silica nanofiller. The concentration of silica
nanofillers in XLPE was 1 wt%. The result of electrical
tree propagation in XLPE filled with untreated and treated
nanofiller was compared with pure XLPE composite. The
treated silica nanofiller exhibit slower growth of electrical
tree in the XLPE nanocomposite.
Keywords – XLPE, Silica nanofiller, Electrical tree
INTRODUCTION
Electrical treeing is the pre-breakdown mechanisms
in high voltage cross-linked polyethylene (XLPE) cable
insulation. It is expected that by adding nanofiller in
XLPE composite can improve the cable insulation
performance. The XLPE filled with nanofiller could
inhibit the rapid tree growth in the nanocomposite.
According to [1,2], polymer containing the inorganic
nanofillers can improve the electrical treeing resistance.
Thus, this paper investigates the electrical tree growth in
pure XLPE and, XLPE filled with untreated and KH550
treated silica nanofiller.
METHODOLOGY
The experimental setup consist of a 50 Hz 240V/
100kV high voltage transformer, a 10 MΩ limiting
resistor and a 1000:1 capacitive divider. The voltage with
the rate of 1 kV/sec was applied until the electrical tree
inception voltage (TIV) been observed. The TIV was
defined when the treeing initiation length has reached
10µm. Then the applied voltage was kept constant at TIV
for each sample to investigate the electrical treeing
propagation. The propagation of electrical tree was
analyzed from needle tip electrode until the electrical tree
reaches 1 mm. The concentrations of both silica nanofiller
in XLPE was 1.0 wt% with 96% - 99% purity. The size of
the silica nanofiller is 20-30 nm. The silica nanofiller are
in spherical shape.
RESULTS AND DISCUSSION
Figure 1 shows the images of electrical tree
propagation for pure XLPE, untreated silica/XLPE and
KH550 treated silica/XLPE after the electrical tree reach
1mm length from the needle tip. The images of electrical
tree show the similar bush tree type in pure XLPE,
untreated silica/XLPE and KH550 treated silica /XLPE.
The result shows that the electrical tree growth takes 75
minutes to propagate in pure XLPE to reach 1mm length
from the needle tip. The XLPE containing 1wt% untreated
and treated silica nanofiller exhibit slower electrical tree
propagation compare to pure XLPE. Furthermore, the 1
wt% KH550 treated nanofiller in XLPE takes 153 minutes
to reach 1mm from the needle tip compare to untreated
silica nanofiller in XLPE, which was 112 minutes.
(a) (b) (c)
Figure 1: Electrical Tree Propagation
(a) Pure XLPE (b) 1.0wt% Untreated Silica/XLPE
(c) 1.0wt% KH550 Silica/XLPE
CONCLUSIONS
The effect of silica nanofiller in XLPE on electrical
treeing propagation has been investigated. The XLPE
containing silica nanofiller has inhibited the rapid tree
growth in the XLPE nanocomposites. The XLPE filled
with 1 wt% KH550 treated silica nanofiller has slower
down the tree propagation time compare to pure XLPE
and untreated silica nanofiller in XLPE nanocomposites.
ACKNOWLEDGEMENTS
The authors are grateful to Universiti Sains Malaysia
(USM) and Ministry of Higher Education Malaysia
(MOHE) for financial support under the Fundamental
Grant Scheme (FRGS: 6071372). The author would also
like to thank Universiti Pertahanan Nasional Malaysia
(UPNM) and Ministry of Higher Education Malaysia
(MOHE) for sponsoring the scholarship.
REFERENCES
[1] S. Alapati, M.J. Thomas, “Electrical Treeing and the
Associated PD Characteristics in LDPE
Nanocomposites”, IEEE Trans. on Dielectrics and
Electrical Insulation, Vol. 19, No. 2, pp. 697-704,
2012.
[2] J.K. Nelson, Y. Hu, “The Impact of Nanocomposite
Formation on Electrical Voltage Endurance”, IEEE
International Conference Solid Dielectric, Toulouse,
France, pp. 832-835, 2004.

Extended Abstract for 2020 PTeC and MyHVnet Colloquium A008
PAGE 23
ANALYSIS OF FOOT STEPS VOLTAGE GENERATION SYSTEM
BASED ON PIEZOELECTRIC
A.M.S Omar1,, S.S.M Isa2* , N.F Jamaludin2 and S.S.M Isa2 1Faculty of Electrical Enginering, Universiti Teknologi MARA, 13500 Pematang Pauh, Penang, Malaysia.
*E-mail: [email protected]
Abstract – This paper presents the analysis of converting
force produced by foot steps to generate voltage
naturally. The piezoelectric generator is designed using
piezoelectric discs, connected to a regulator, DC
amplifier and will be stored in 12V rechargeable battery.
The output voltages are taken by letting four people of
different weight to step on the piezoelectric generator
with 0 to 2400 steps. Experiment results show the
heaviest people with 2400 steps has produced the highest
output volatge which is 12.94V, that considered can light
a bulb up.
Keywords – steps, piezoelectric, force
INTRODUCTION
Fossil fuels like coal, petroleum, and natural gas have
been world-widely utilized for over one and a half
century in human history [1] which substantially harm to
environment, wildlife and damage public health. In this
studies, analysis of foot step force has been conducted by
chosen piezoelectric effect as an alternative method to
produce voltage then will save electricity in term of cost.
Among the energy harvesters, piezoelectric generators is
starting to attract a lot of attention since they can convert
the widely available mechanical energy into electricity
[2]. Piezoelectric acts as an energy generator, then the
produced charge from piezoelectric will stored in the
battery. During the testing performed, 2400 foot steps
have been experimented with different weight of human
body. Finally, inverted circuit is designed to convert
generated 12V to AC voltage and light up a bulb. Thus, it
could contribute to a more green energy for the public
use and create a next step further in innovation instead of
continuously depending on the conventional energy
source.
METHODOLOGY
The 16 piezoelectric discs are constructing in parallel
and connected with the regulator circuit. The discs are
used to develop this prototype is piezoelectric disc 20mm
with two wires (+ VE and – VE). Force will be applied
on the piezoelectric generator by stepping on it. The
gained voltage will be connected to the regulator circuit
as to let the volatge more stable. Then, it will be
amplified by DC amplifier circuit and stored to 12V
rechargeable battery. Inverter is used to convert from DC
to AC.
RESULTS AND DISCUSSION
Four people with different weight, 28kg, 43kg, 58kg
and 70kg have stepped on the piezoelectric generator.
The steps are within 0 to 2400 steps, and the output
voltages have recorded as shown in Figure 1
Figure 1: Generated voltage vs foot steps upon four different
human body weight
From the Figure 2, the bulb is ON, indicates that there
is sufficient generated voltage stored to light up it.
Figure 2: The bulb is ON
CONCLUSIONS
The voltage generation system by applying
piezoelectric effect has been constructed and produced
optimum generated output voltage of 12.94V. in
conclusion, the piezoelectricis an inexhaustible,
pollution-free and most importantly, it is renewable
energy device. It can be applied at anywhere that need
force from foot step such as pavement or house.
REFERENCES
[1] B. Xu, P. Li, C. Chan, “Application of phase change
materials for thermal energy storage in concentrated
solar thermal power plants: a review to recent
developments”, Appl. Energy, 160 (2015), pp. 286-
307
[2] Z.L. Wang, “Triboelectric nanogenerators as new
energy technology for self-powered systems and as
active mechanical and chemical sensors”, ACS
Nano, 7 (2013), pp. 9533-9557

Extended Abstract for 2020 PTeC and MyHVnet Colloquium A009
PAGE 24
LLDPE-BASED INSULATION MATERIAL FOR HVDC CABLE
APPLICATION M.N Syatirah1,2* and Muhamad N.A1
1School of Electrical and Electronic Engineering, Universiti Sains Malaysia(USM), Engineering Campus, Seberang
Perai Selatan, nibong Tebal, Penang 14300 Malaysia. 2Department of Electrical, Faculty of Engineering Technology, Universiti Malaysia Perlis (UniMAP), Campus Uniciti
Alam, Sg.Chuchuh, 02100 Padang Besar, Perlis, Malaysia
*E-mail: [email protected]
Abstract –Nowdays, the use of polymer-based as
insulation material for HVDC (High voltage direct
current) became increased when there are an increased in
demand for using renewable energy such as solar energy
This paper presents a review the used of linear low
density polyethylene (LLDPE)-based material for HVDC
cable application. Comparison and discussion from
previous researcher and manufacturer was done in term
of performance. The review found, LLDPE based
material with additional of nano filler or mixed blanded
can improve the properties of HVDC cable insulator.
This is because these material have very good indication
of the conductivity and dielectric strength of high voltage
insulation for HVDC application.
Keywords–HVDC Cables, Polymer Insulation, LLDPE
INTRODUCTION
The influence of the thermal properties of the
insulating material is one of the biggest problem in
HVDC cable. The operating temperature and thermal
conductivity stands out to be the important factor in
designing the HVDC cable.
LDPE is linear low density polyethylene that blended
form of low density polyethylene (LDPE) where the film
has much more flexibility, tensile strength, and more
conformability. It is more pliable and softer. LLDPE is
used for pond liners or blended into other films to give
them more flexibility and extra strength. The difference
between LLDPE with LDPE is the thermal resistance
and melting point of LLDPE is higher more than 20°C,
higher mechanical properties such as elongation break
and tensile strength. As LDPE, most researcher try to
improve this material dielectric properties by adding or
mixed with other material.
THE PERFORMANCE OF LLDPE
Researcher [1] had stated that the addition of
nanofiller exhibits the significant reduction in DC
conductivity with certain amount, it is not varying with
the other fillers to the others materials and give the
implication to the movement of charge in the bulk of the
material. The researcher [2] found that LLDPE-NR/SiO2
at 5 wt% to be the best composition for HV insulation in
terms of the lowest polarization and depolarization
current values as well as the lowest conductivity level.
The DC breakdown strength decreases when the
dicumyl peroxide(DCP) content increases in LLDPE-
based material at the temperature of 30oC. But when the
temperature reaches 70oC and 90oC, the content of DCP
obviously has a good impact on the performance of DC
breakdown strength in figure 1[3].
The 30HDPE/70LLDPE blend produce higher
breakdown strength than XLPE, the breakdown strength
is nearly two fold higher than XLPE. For cables service
temperature is about 70-90°C, dielectric behaviours of
insulation materials at high temperature are of
significantly importance. 30HDPE-70LLDPE blends
exhibits good properties and stability at high temperature
[4].
Figure 1: Breakdown strength of LLDPE with DCP content[3]
Figure 2: Breakdown strength of HDPE/LLDPE BLEND with
temperature[4]
CONCLUSIONS
From the review, the summarize can be made that the
performance is determined by the intrinsic of the of the
polymer matrix, the composite of the polymer,
percentage filler loading, filler size, filler aspect ratio,
filler shape and many other factor. One cannot conclude
that the thermal conductivity of a several composite
depends on a specific parameter without taking into
examination on all other parameter also percentage of
weightage include.
REFERENCES [1] G Chen et al. “Conduction in Linear Low Density
Polyethylene Nanodielectric Materials” Proc of the 9th
Inter. Conf on Properties and Applications of Dielectric
Materials Harbin, China 2009
[2] Nor Akmal et al. “DC Conductivity of Polymer
Nanocomposites for Different Types and Amount of
Nanofiller” Int Journal on Electrical Eng and Informatics -
Volume 5, Number 2, June 2013
[3] Yinge lee et al. “DC Breakdown Characteristics of
LLDPE-based XLPE with Different Crosslinking
Degrees” IEEE Condition Monitoring and Diagnosis 2018
[4] Kai Zhang et al. “Temperature Dependence of Crystalline
Structure and DC Performance in LLDPE/HDPE Blending
Material” IEEE Transac on Dielectrics and Electrical
Insulation Vol. 26, No. 3; June 2019

Extended Abstract for 2020 PTeC and MyHVnet Colloquium A010
PAGE 25
COMPARISON OF PD PATTERN IN MINERAL OIL AND PFAE UNDER
INFLUENCE OF METAL PARTICLES IN QUASI-UNIFORM FIELD
Kiasatina Azmi1, Dahaman Ishak1, Nor Asiah Muhamad1, Ahmad Zuhairi2 and Mohamad Kamarol1,* 1School of Electrical & Electronic Engineering, Universiti Sains Malaysia, 14300 Nibong Tebal, Pulau Pinang,
Malaysia 2School of Chemical Engineering, Universiti Sains Malaysia, 14300 Nibong Tebal, Pulau Pinang, Malaysia
E-mail: [email protected], [email protected]
*Corresponding Author: M. Kamarol
Abstract – This paper reports the comparison of PD
(partial discharge) in mineral oil and PFAE (Palm Fatty
Acid Ester Oil) under influence of three metal particles
under quasi-uniform field of AC applied voltage. PDIV
(PD Inception Voltage) of three metal particles at 5mm
gap distance was measured to be 3.3kV and 4.1kV for
PFAE and mineral oil, respectively. The PRPD (Phase-
Resolved PD) pattern for each oil appeared to have a
distinctive characteristics at 23kV.
Keywords – PD, Metal Particles, Mineral Oil, PFAE
INTRODUCTION
In order to have better understanding on PD activity
of metal particle in PFAE, the PD measurement of three
spherical metal particles at three gap distances has been
conducted. The PD in mineral oil is also measured and
compared with PFAE. The results are expected to
provide preliminary information for the oil insulation
diagnostic in power transformer.
PD MEASUREMENT SETUP
Figure 1 shows the experimental setup used in this
study. The AC test voltage is generated by step up
transformer rated at 50Hz, 5kVA, 240V/100kV. The
supplied voltage was gradually increased in the rate of
500V/s. The PD current pulse was observed and
recorded by using 600MHz, 2.5GSamples/s of LeCroy
Wavesurfer 64Xs oscilloscope. The PD signals were
measured by using a wideband 50Ω impedance matching
circuit (IMC) which was designed with a bandwidth of
up to 1GHz. The generated PD signals were calibrated
by using Haefely Charge Calibrator. A Nikon DSLR
Camera was used to record the metal particle movement
[1].
Figure 1: PD measurement circuit diagram.
RESULTS AND DISCUSSION
The PDIV of PFAE was measured to be 3.3kV, 5kV
and 6.8kV at 5mm, 7mm and 9mm gap distance,
respectively. Meanwhile, the PDIV of mineral oil were
around 4.1kV, 6.2kV and 8.5kV at 5mm, 7mm and 9mm
gap distance, respectively. Table 1 depicts the PRPD
pattern of three spherical metal particles in mineral oil
and PFAE at three gap distances at 23kV. The PRPD
pattern for both oils was obtained within 150 cycles of
applied voltage. The number of PD and PD magnitude
for both oils are decreased with the increment of the gap
distance. In mineral oil, the PDs distributed all over the
phases where the distribution peak is near to 90° in
positive half cycle and 270° in negative half cycle.
Meanwhile, the PDs in PFAE are scattered all over the
phases with the scattering peak around 120° in positive
half cycle and 320° in negative half cycle.
Table 1: PRPD pattern of three spherical metal particles in
mineral oil and PFAE from 5mm until 9mm gap distances at
23kV.
Gap
(mm)
Types of oil
Mineral Oil PFAE
5
7
9
CONCLUSIONS
The PD under influence of three metal particles in
mineral oil and PFAE under AC voltage have been
compared and investigated. The PRPD pattern is
revealed to have a significant different between both oils.
ACKNOWLEDGEMENTS
The author is deeply indebted to Malaysia Ministry of
Higher Education and Universiti Sains Malaysia for
financially support this work under MyPhD scholarship
and Research University Grant (1001/PELECT/814232).
REFERENCES
[1] K. Azmi, A. Zuhairi, D. Ishak, N. A. Muhamad and
M. Kamarol, “Partial discharge characteristics of
spherical metal particle in mineral oil and PFAE
under AC voltage”, IEEE TENCON 2017, Penang,
pp. 2588-2593, 2017.

Extended Abstract for 2020 PTeC and MyHVnet Colloquium A011
PAGE 26
Identification of Discharge Intensity Level using UV Pulse Harmonic Signal
Saiful Mohammad Iezham Suhaimi1,*, Nor Asiah Muhamad2 1Tenaga Nasional Berhad, Bahagian Pembahagian, 14000 Bukit Mertajam, Pulau Pinang, Malaysia.
2School of Electrical & Electronic Engineering, Engineering Campus , 14300 Nibong Tebal Pulau Pinang.
*E-mail: [email protected]
Abstract – Line insulator must be monitor regularly by
power utilities company to avoid flashover. There are
various method use to identify the insulator condition
during operation. Ultra Violet (UV) Pulse method is one
of the method use to monitor the insulator surface
discharge condition. In this study, harmonic signal of the
sensor are discussed. Thus, result shows that, second
harmonic can be use to identify the discharge intensity
level.
Keywords – Ultra Violet (UV), Flashover, Harmonic,
Discharge intensity level
INTRODUCTION
Line insulator contamination and flashover are often
relate to one another. Flashover mostly would occur as
time goes if the insulator surface condition worsen or
contaminated. Thus, condition of the insulator must be
monitor and diagnose regularly to avoid future flashover
incident. Nowadays, there are many ways of monitoring
the conditions of the insulators. Status of the
transmission line insulators can be determined by using
various method [1]. In this study, by using Ultra Violet
(UV) pulse method, the level of insulator surface
discharge are being categorized and analyzed [2]. Signal
harmonic produced by UV pulse sensor was analyze to
identify the discharge intensity level on the insulator
surfaces. Additionally, Fourier transform analysis also
used to obtain the signal harmonic. The harmonic of the
signal produce by the sensor at different level of
contamination are then discussed.
METHODOLOGY
RESULTS AND DISCUSSION
Figure 1: Harmonic signal at 0g/L ESDD
Figure 2: Harmonic signal at 30g/L ESDD
Figure 1 and Figure 2 shows the harmonic signal
produced by UV sensor at 0g/L and 30g/L ESDD each.
As shown in both figure, as the intensity of the insulator
surface discharge increasing from Hissing to Severe, the
sixth harmonic of the signal also increased. The second
harmonic signal shows highest value for each level of
discharge intensity with increasing value from Hissing to
Severe level of discharge except for Figure 1. As for
other harmonic, it shows increasing value from Hissing
to Discharge at Pin for both condition. Same goes to
Discharge at Pin to Discharge at Cap level in figure 2.
However, it show otherwise for the same level
(Discharge at Pin to Discharge at Cap) in figure 1. From
these figure, it can be conclude that, second and sixth
harmonic of the UV Signal might be a potential variable
to identify the discharge intensity level.
CONCLUSIONS
Second and sixth harmonic signal produce by the UV
Pulse Sensor can be use to differentiate the discharge
intensity level base on the greater changes and linearity
for each discharge level. As for others harmonic, it does
not seem to be precisely identify the differences for each
intencity level. However, combination of UV Pulse
method and another method might be able to identify the
discharge intensity level precisely.
ACKNOWLEDGEMENTS
This research was supported by USM short term
grant (304/pelect/6315032) and RUI(1001/PELECT
/8014054);UTM Research University Grant vot no.
0H77.
REFERENCES
[1] Tian, Y.; Lewin, P.; Davies, A. Comparison of on-
line partial discharge detection methods for HV
cable joints. IEEE Trans. Dielectr. Electr. Insul.
2002, 9, 604–615
[2] Suhaimi, Saiful & Bashir, Nouruddeen & Muhamad,
N.A. & Rahim, Nurun & Ahmad, Azlinda & Abdul
Rahman, Mohd Nazri. (2019). Surface Discharge
Analysis of High Voltage Glass Insulators Using
Ultraviolet Pulse Voltage. Energies. 12. 204.
10.3390/en12020204.
0.000
0.100
0.200
0.300
0.400
0.500
0.600
0.700
Hissing Discharge atPin
Discharge atCap
Severe
Har
mo
nic
Discharge Intensity Level
2nd
3rd
4th
5th
6th
7th
0.000
0.100
0.200
0.300
0.400
0.500
0.600
0.700
Hissing Discharge atPin
Discharge atCap
Severe
Har
mo
nic
Discharge Intensity Level
2nd
3rd
4th
5th
6th
7th
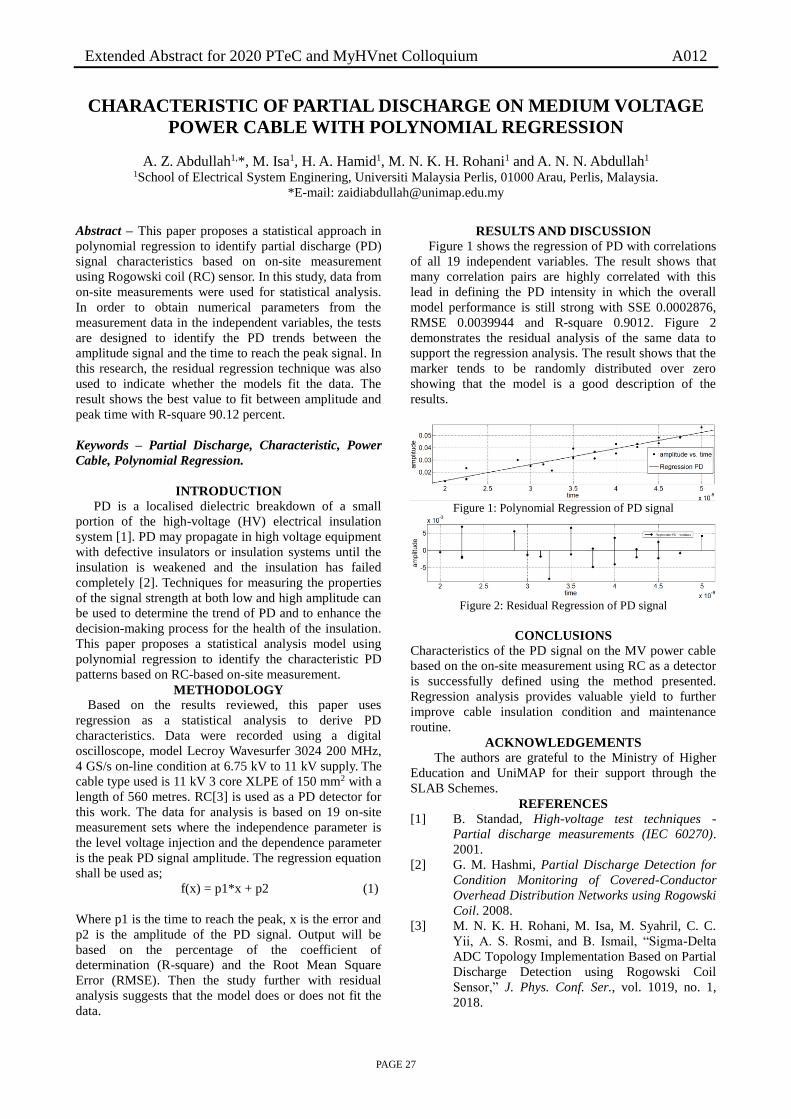
Extended Abstract for 2020 PTeC and MyHVnet Colloquium A012
PAGE 27
CHARACTERISTIC OF PARTIAL DISCHARGE ON MEDIUM VOLTAGE
POWER CABLE WITH POLYNOMIAL REGRESSION
A. Z. Abdullah1,*, M. Isa1, H. A. Hamid1, M. N. K. H. Rohani1 and A. N. N. Abdullah1 1School of Electrical System Enginering, Universiti Malaysia Perlis, 01000 Arau, Perlis, Malaysia.
*E-mail: [email protected]
Abstract – This paper proposes a statistical approach in
polynomial regression to identify partial discharge (PD)
signal characteristics based on on-site measurement
using Rogowski coil (RC) sensor. In this study, data from
on-site measurements were used for statistical analysis.
In order to obtain numerical parameters from the
measurement data in the independent variables, the tests
are designed to identify the PD trends between the
amplitude signal and the time to reach the peak signal. In
this research, the residual regression technique was also
used to indicate whether the models fit the data. The
result shows the best value to fit between amplitude and
peak time with R-square 90.12 percent.
Keywords – Partial Discharge, Characteristic, Power
Cable, Polynomial Regression.
INTRODUCTION
PD is a localised dielectric breakdown of a small
portion of the high-voltage (HV) electrical insulation
system [1]. PD may propagate in high voltage equipment
with defective insulators or insulation systems until the
insulation is weakened and the insulation has failed
completely [2]. Techniques for measuring the properties
of the signal strength at both low and high amplitude can
be used to determine the trend of PD and to enhance the
decision-making process for the health of the insulation. This paper proposes a statistical analysis model using
polynomial regression to identify the characteristic PD
patterns based on RC-based on-site measurement.
METHODOLOGY
Based on the results reviewed, this paper uses
regression as a statistical analysis to derive PD
characteristics. Data were recorded using a digital
oscilloscope, model Lecroy Wavesurfer 3024 200 MHz,
4 GS/s on-line condition at 6.75 kV to 11 kV supply. The
cable type used is 11 kV 3 core XLPE of 150 mm2 with a
length of 560 metres. RC[3] is used as a PD detector for
this work. The data for analysis is based on 19 on-site
measurement sets where the independence parameter is
the level voltage injection and the dependence parameter
is the peak PD signal amplitude. The regression equation
shall be used as;
f(x) = p1*x + p2 (1)
Where p1 is the time to reach the peak, x is the error and
p2 is the amplitude of the PD signal. Output will be
based on the percentage of the coefficient of
determination (R-square) and the Root Mean Square
Error (RMSE). Then the study further with residual
analysis suggests that the model does or does not fit the
data.
RESULTS AND DISCUSSION
Figure 1 shows the regression of PD with correlations
of all 19 independent variables. The result shows that
many correlation pairs are highly correlated with this
lead in defining the PD intensity in which the overall
model performance is still strong with SSE 0.0002876,
RMSE 0.0039944 and R-square 0.9012. Figure 2
demonstrates the residual analysis of the same data to
support the regression analysis. The result shows that the
marker tends to be randomly distributed over zero
showing that the model is a good description of the
results.
Figure 1: Polynomial Regression of PD signal
Figure 2: Residual Regression of PD signal
CONCLUSIONS
Characteristics of the PD signal on the MV power cable
based on the on-site measurement using RC as a detector
is successfully defined using the method presented.
Regression analysis provides valuable yield to further
improve cable insulation condition and maintenance
routine.
ACKNOWLEDGEMENTS
The authors are grateful to the Ministry of Higher
Education and UniMAP for their support through the
SLAB Schemes.
REFERENCES
[1] B. Standad, High-voltage test techniques -
Partial discharge measurements (IEC 60270).
2001.
[2] G. M. Hashmi, Partial Discharge Detection for
Condition Monitoring of Covered-Conductor
Overhead Distribution Networks using Rogowski
Coil. 2008.
[3] M. N. K. H. Rohani, M. Isa, M. Syahril, C. C.
Yii, A. S. Rosmi, and B. Ismail, “Sigma-Delta
ADC Topology Implementation Based on Partial
Discharge Detection using Rogowski Coil
Sensor,” J. Phys. Conf. Ser., vol. 1019, no. 1,
2018.

Extended Abstract for 2020 PTeC and MyHVnet Colloquium A013
PAGE 28
THE EFFECT OF DIFFERENT NOISE LEVELS ON DE-NOISING
TECHNIQUE IN PARTIAL DISCHARGE MEASUREMENT
A. Nazifah Abdullah 1*, M. Isa1, S. H. K. Hamadi1, M.Othman1, B. Ismail1, A. Z. Abdullah1, A. N. Nanyan1 1 High Voltage Transients & Insulation Health (HVTrans) Group, Centre of Excellent Renewable Energy (CERE), School of
Electrical System Engineering, Universiti Malaysia Perlis (UniMAP).
*E-mail: [email protected]
Abstract – This paper presents an effect of different
noise levels in Partial Discharge (PD) measurement by
analyzing its de-noising performance based on Mean
Square Error (MSE) value for five different mother
wavelets. The mother wavelets are Haar, Daubechies
(db), Coiflets (coif), Symlets (sym) and Biorthogonal
(bior) wavelet. The analysis are carried out for three
conditions of noise amplitude levels which are noise
lower than, equal to and higher than PD amplitude level.
Highest noise level has highest MSE value which
indicates that the effectiveness to remove noise in PD
measurement will be lesser.
Keywords – Partial Discharge, De-noising, Noise, DWT
INTRODUCTION
In the PD measurements, the measured signal that
captured by the PD sensor is suppressed by noise.
Compared to the traditional Fourier transform, it more
appropriate to use wavelet transform as de-noising
technique since it can works in both domains of time and
frequency [1]. The ability to discriminate noise, required
knowledge of both the PDs and the noise. Thus, analysis
study of the effect of different noise levels on the de-
noising technique in PD measurement is essential [2].
METHODOLOGY
The amplitude of PD signal is kept constant at 0.008V.
The MSE value is calculated using designated system via
LabVIEW software. Table 1 shows the samples of the
data collection.
Table 1: MSE value data collection sample for five
wavelet families with different noise level.
Mother
wavelet
No. of
order
Result of MSE value (×10-6)
Lower
noise
Noise
equal to
Higher
noise
0.004 V 0.008 V 0.012 V
haar 1 0.7542 2.9405 6.3664
RESULTS AND DISCUSSION
Figures 1(a) to 1(d) show the bar chart of MSE value
for five different mother wavelets. It can be seen that the
the higher the noise level as compared to the PD signal,
the higher the MSE value. This means the difficulty to
remove noise from measured PD signal is also increased.
CONCLUSIONS
Even the mother wavelet that had most minimum MSE
value is chosen as the optimum de-noising technique, the
noise level of the PD signal also could affect the
effectiveness of de-noising processed.
(a)
(b)
(c)
(d) Figure 1: MSE value of (a) Haar and Daubechies, (b)
Coiflets, (c) Symlets, and (d) Biorthogonal wavelets.
ACKNOWLEDGEMENTS
Thanks to MoE and UniMAP through SLAB scheme.
REFERENCES
[1] A. N. Abdullah, S. H. K. Hamadi, M. Isa, B.
Ismail, and A. Z. Abdullah, “Modelling of Partial
Discharge Analysis System using Wavelet
Transform Technique in Environment,” J. Teknol.,
vol. 81, no. 6, pp. 1–11, 2019.
[2] M. N. K. H. Rohani, M. Isa, M. Syahril, C. C. Yii,
A. S. Rosmi, and B. Ismail, “Sigma-Delta ADC
Topology Implementation Based on Partial
Discharge Detection using Rogowski Coil Sensor,”
J. Phys. Conf. Ser., vol. 1019, no. 1, pp. 1–8, 2018.

Extended Abstract for 2020 PTeC and MyHVnet Colloquium A014
PAGE 29
Effect of RTV Coating on ceramic Insulator
M.Othman1,*, M.Isa2, A. Nazifah Abdullah2, M. N. Mazlee3 and M.A.M. Piah4
1Faculty of Engineering Technology, Universiti Malaysia Perlis
2Centre of Excellence for Renewable Energy, School of Electrical System Engineering, Universiti Malaysia Perlis 3School of Materials Engineering, Universiti Malaysia Perlis
4School of Electrical Engineering, Universiti Teknologi Malaysia
*E-mail: [email protected]
Abstract – The percentage of pollution on transmission
line insulators at one of cement industrial company
located near the Southern Region of Peninsular Malaysia
are getting worse due to cement production in large scale
and heavy salt pollution with relatively low humidity and
dry climate. Presence of pollutants on porcelain insulator
surface will contribute to a serious hazard and leads to
system outages. This research presents a study on effect
of Room Temperature Vulcanize (RTV) coating to
improve electrical performances of a porcelain insulator
string and its effect towards environmental pollution. For
experimental works, porcelain insulator is tested and
flashover voltage was evaluated under clean and
contaminated conditions. 2-D model of porcelain
insulator string were simulated using Finite Element
Method (FEM) and voltage and electric field distribution
were evaluated.
Keywords – Porcelain insulator,Room Temperature
Vulcanize, Flashover voltage.
INTRODUCTION
Room Temperature Vulcanize (RTV) coating have
been selected as the most alternative way to recover
electrical power insulation performances in ceramic
insulator due excellent hydrophobicity, excellent
electrical insulation properties, excellent self-cleaning
and water resistance and excellent arc resistance for
preventing insulator surface from pollution. The coating
have been proven to decrease the number of flashover
voltage and lengthen the ceramic insulator lifespan that
can achieve up to 15 years based on the manufacturing
material [1].
METHODOLOGY
RTV coating contains of hydroxyl end-blocked
polydimethylsiloxane, reinforcing filler, crosslinking
agent and catalyst[2]. Insulator should be dried and
cleaned before coated procedure has been applied due to
avoid water from destroying the coating on the insulator
surface. Spraying method is priority compared to dipping
and brushing where the number of layer required two or
three layer for thickness from 0.3 mm to 0.5 mm.
RESULTS AND DISCUSSION
Figure 1 shows the effect of RTV for the electric
distribution. From simulation, it shows that the electric
stress close to pin or high voltage input are highest
compared to other surface of the insulator. The bottom
insulator represent in red color has a “hot” temperature
due to resistance heating along the insulator surface. The
second upper insulator are “cold” represented as blue and
green color with a low resistance though the insulator
surface and the upper insulator is the best insulator
represented with all blue color and has lowest surface
heating as a result of surface leakage currents created by
strong electrical field.
Figure 1: Voltage distribution
CONCLUSIONS
RTV Coating can be used for ceramic insulator string
especially nearby the coastal areas which having heavy
contamination and wet weather environment. It can
significantly improve insulation protection level, prevent
from flashover and increase power system reliability.
ACKNOWLEDGEMENTS
The authors would like to thank Centre of Excellent
for Renewable Energy, School of Electrical Systems
Engineering, Institut Voltan Arus Tinggi (IVAT),
Universiti Teknologi Malaysia, Tenaga Nasional Berhad
(TNB), Alor Setar for supporting this research and to
acknowledge the support from the Fundamental Research
Grant Scheme (FRGS) from the Ministry of Education
Malaysia.
REFERENCES
[1] F. A. Jamaludin, M. Z. A. Ab-Kadir, M. Izadi, N.
Azis, J. Jasni, and M. S. Abd Rahman,
“Considering the effects of a RTV coating to
improve electrical insulation against lightning,” in
2016 33rd International Conference on Lightning
Protection, ICLP 2016, 2016.
[2] X. Zhang, L. Liu, and R. Zhu, “Analysis on
Operating Performance of RTV Coated Insulators
Used in Dry Area,” 2014 IEEE Electr. Insul.
Conf., no. June, pp. 223–226, 2014.

Extended Abstract for 2020 PTeC and MyHVnet Colloquium A015
PAGE 30
Current Studies on Ultra High Frequency and Very High Frequency Radiation
Relationship with Initial Electric Field Change in Tropical Storms
M.H.M. Sabri1,*, A.A. Al-Kahtani1, M.R. Ahmad2 and M.Z.A. Ab-Kadir1 1Institute of Power Engineering, Universiti Tenaga Nasional (UNITEN), Jalan IKRAM-UNITEN, 43000 Kajang,
Selangor, Malaysia. 2Atmospheric and Lightning Research Laboratory, Centre for Telecommunication Research and Innovation (CeTRI),
Fakulti Kejuruteraan Elektronik dan Kejuruteraan Komputer, Universiti Teknikal Malaysia Melaka, Hang Tuah Jaya,
76100 Durian Tunggal, Melaka, Malaysia
*E-mail: [email protected] ; [email protected]
Abstract – The full mechanism of lightning flashes is
still not clear. To observe the lightning process several
sensors were used to capture the electromagnetic wave
from lightning flashes. The key findings in this research
is to see that is the initiation of lightning flashes were
started with microwave radiation burst or VHF pulse
vice versa in associated with initial e-change (IEC)
process. Previous has shown that, strong VHF burst
related to fast positive breakdown (FPB) [1] was the first
event that initiated lightning. However, other school of
taught believe that, the initiation of lightning is peak at
microwave radiation. This research will provide and help
us to understand the initiation process of lightning
flashes.
Keywords – Initial Electric Field Change, Lightning
Initiation, Fast breakdown
INTRODUCTION
Initial electric field changes (IECs) is a small
amplitude, short duration, slow developing E-field
change that occurs just before the first initial breakdown
(IB) pulse in a lightning flash [2-4]. The duration of IEC
process can be determined when there are slow E-field
changes starting at zero moving upwards for negative
CG (-CG) flash or downwards for Intra-cloud (IC) flash
and ended at the first IB pulse.
METHODOLOGY
The results of measurements were obtained from a
single station consists of a broadband electric field (E-
field) change system with decay time constant of 13 ms
and 1s, a Very High Frequency (VHF) E-field system
centre frequency of 60 MHz, a Microwave sensor
operating around 1 GHz and a pair of orthogonal
wideband B field system [4]. The output from antennas
is digitized at rates of 5 MS/s, 125 MS/s and 2.5 GS/s
with resolution of 12 and 8 bit. Data records were event
triggered and were 1 s long for Fast Antenna and 200 ms
for both VHF and MW systems. The timing for each
event was provided by a Global Positioning System
(GPS) with accuracy of ±6 ns. Additional details of the
E-field instrumentation are given in [4].
RESULTS AND DISCUSSION
Figure 1 shows one of measurement data recorded
during close lightning in UTeM, Malacca. Clearly, the
microwave and VHF radiation was detected along with
fast antenna system.
Figure 1: Negative cloud-to-ground (–CG) flash (within
reversal distance) captured at 2:18:55 AM l on October 25th,
2019 (Diagram based on atmospheric sign convention).
CONCLUSIONS
The IEC process from tropical storms in Malaysia
has been observed. The IECs was preceded by an IB
process in all cases. In this research, the additional
systems will be provided that believe will give us more
information regarding the lightning initiation process.
REFERENCES
[1] W. Rison, P.R. Krehbiel, M.G. Stock, H.E. Edens,
X.M. Shao, R.J. Thomas, M.A. Stanley and Y.
Zhang. Observations of narrow bipolar events reveal
how lightning is initiated in thunderstorms. Nature
communications, 7, p.10721, 2016.
[2] T. Marshall, M. Stolzenburg, N. Karunarathna and
S. Karunarathne. Electromagnetic activity before
initial breakdown pulses of lightning. Journal of
Geophysical Research: Atmospheres, 119(22),
pp.12-558. 2014.
[3] R. Chapman, T. Marshall, S. Karunarathne, and M.
Stolzenburg. Initial electric field changes of
lightning flashes in two thunderstorms. Journal of
Geophysical Research: Atmospheres, 122(7),
pp.3718-3732. 2017.
[4] M.H.M. Sabri, M.R. Ahmad, M.R.M. Esa, D.
Periannan, G. Lu, H. Zhang, V. Cooray, E.
Williams, M.Z.A.A. Aziz, Z. Abdul-Malek,A.A.
Alkahtani, and M.Z.A. A-Kadir. Initial electric field
changes of lightning flashes in tropical
thunderstorms and their relationship to the lightning
initiation mechanism. Atmospheric research, 226,
pp.138-151, 2019.

Extended Abstract for 2020 PTeC and MyHVnet Colloquium A016
PAGE 31
RADAR ANALYSIS OF A TROPICAL HAILSTORM ASSOCIATED WITH
LIGHTNING FLASH RATE BASED ON LIGHTNING MEASUREMENT
SYSTEM USING PARALLEL PLATE ANTENNA
S. A. Mohammad1,*, M. R. M. Esa1 and M. R. Ahmad2 . 1Institut Voltan and Arus Tinggi (IVAT), School of Electrical Engineering, Faculty of Engineering, Universiti
Teknologi Malaysia, 81310 UTM Skudai, Johor, Malaysia 2Fakulti Kejuruteraan Elektronik dan Kejuruteraan Komputer (FKEKK), Universiti Teknikal Malaysia Melaka, Jalan
Hang Tuah Jaya, 76100 Durian Tunggal, Melaka,Malaysia.
*E-mail: [email protected]
Abstract – Study of electric field measurement by
differentiating the design of antenna based on its air
gaps and areas were conducted. Using cross
correlation method, result were obseved to find a
suitable antenna desgin. Then, a study of a hailstorm
event were observed based on its flash rates,
reflectivity and present of strikes were conducted.
Keywords – Electric field, cross correlation method,
INTRODUCTION
When lightning strikes occur, one of the components
that were generated is vertical electric field. This field
can be observed with a field mill, or a flat plate antenna
[1-3]. Based on previous studies, a new comparative
study of four main designs were tested that compared by
its gaps between the parallel plate and the area of the
antenna. The waveforms of the captured signals were
applied with a cross correlation method that compares
the shape of the waveforms. It is observed that an
increment of precipitation in the clouds have gradual
increment of lightning activities. Combining the data of
flash rates obtain from the lightning measurement system
that were deployed in UTeM, Melaka, radar data was
observed together with WWLLN for their strike location.
METHODOLOGY
Captured electric field signal from lightning flashes
were observed by varying air gaps and area of the
antennas. Four antennas follow by gap size; Antenna A
(3cm), Antenna B (5cm), Antenna C (10cm) and
Antenna D (10cm with smaller area). To ensure all
signals captured by the antennas were the same, cross
correlation method was applied to selected waveform
which compares the shape of the waveform. Observation
was made based on the value of leading or lagging of the
waveforms compared to the reference antenna. Hailstorm
was observed in Melaka for its flash rates, composite
reflectivity and Plan Position Indicator (PPI) from radar
and WWLLN on 14 September 2016. Radar data were
observed for cross section of active region of
thundercloud and movement tracking. WWLLN data
was used for location based on latitude and longitude
which can be pinpointed in Google Maps.
RESULTS AND DISCUSSION Antenna A captured the lowest amplitude, followed by
antenna B, D and C. Antenna C had the highest
amplitude as it was fabricated with the largest area and
largest air gap. Based on all the targeted waveforms, the
leading and lagging value were acceptable with the
highest value of 4.
Figure 1(a)(left) shows CAPPI and WWLLN data overlaid together, 1(b)(right) Cross section of the highest reflectivity value of CAPPI
Based on that figure 1(a)(b), CAPPI data shows a high
precipitation which was observed based on its
reflectivity value indicated by the intensity on its colour
gauge. The active region covered the area where the
severe thunderstorm was reported to occur. It was also
observed that lightning strikes captured by WWLLN
were concentrated at the active region. Upon further
investigation, PPI data that shows the cross section of the
thundercloud such in Figure 1 (b) observed a high
reflectivity value of 55 to 60 dBz indicated in red.
CONCLUSIONS
The increment of air gaps and area of antenna will
increase the amplitude captured thus increasing the
measurement sensitivity of the antenna. The active
region of the thunderstorms shows a concentration of
lightning strike and a high reflectivity value when it was
observed at its cross section.
ACKNOWLEDGEMENTS
Authors express acknowledgement and gratitude for
the support given by Universiti Teknologi Malaysia
(UTM) under Q04G19 and R4F966 research grants
(FRGS) for this project.
REFERENCES
[1] Cooray V. “Lightning Electromagnetics”. United
Kingdom: Institution of Engineering and
Technology; 2012.
[2] Galvan A. and Fernando M., “Operative
characteristics of a parallel-plate antenna to measure
vertical electric fields from lightning fields from
lightning flashes”. Report UURIE 2000: 285-00.
[3] Sharma SR, Cooray V, Fernando M., “Unique
lightning activities pertinent to tropical and
temperate thunderstorms”. Journal of Atmospheric
and Solar-Terrestrial Physics, 2011; 73(4):483-

Extended Abstract for 2020 PTeC and MyHVnet Colloquium A017
PAGE 32
DESIGN AND DEVELOPMENT OF HIGH PERFORMANCE RF FRONT
END INTERFEROMETER SYSTEM
Taha Raad Al-Shaikhli*, Mohd Riduan Ahmad Fakulti Kejuruteraan Elektronik dan Kejuruteraan Komputer, Universiti Teknikal Malaysia Melaka (UTeM), Hang Tuah
Jaya, 76100 Durian Tunggal, Melaka, Malaysia.
*E-mail: [email protected]
Abstract – Microwave admission from lightning has
been detected recently, this study will design frontend
interferometer to detect the location of the lightning by
using antenna, low noise amplifier and band pass filter
respectively. The design specification of the antenna is
operating on 1GHz frequency and most be almost omni
directional with good gain to cover high range distance.
The low Noise Amplifier (LNA) is also operating on
1GHz and we had achieved it with operating frequency
from (800 - 1.2) GHz with gain of 14.69dB at 1GHz. The
Band Pass Filter had achieved to filtering the signal
within frequency of (950 – 1050) MHz and damping all
the undesired frequency. Interferometer for lightning
remote sensing contents of three Systems of antenna,
LNA and BPF to be placed one in the centre and two as
perpendiculars with distance λ = 0.3m.
Keywords –Antenna, Low Noise Amplifier, Band Pass
Filter, Lightning Remot Sensing.
INTRODUCTION
It is known that lightning dischargesn ormally radiate
broadbande lectromagneticw aves in the frequency range
from ELF/VLF through VHF/UHF [1]. There are two
main thechniques to locate the lightning discharge which
are Time of Arival (TOA) and Interferometer [2][3]. The
amplitude of the microwave signal is very small that’s
why the microwave admissions are believed to be
associated with the electron avalanche break down
process[4] , so in order to detect the microwave radiation
with higher magnitude we need to design BPF with more
efficient which mean more flatting for passing the
frequency from (950 – 1050) MHz only to avoid the
interfering with GSM frequency in Malaysia which is
operating at 900MHz.
METHODOLOGY
The antenna designed by CST as parallel plate air gab
and its spicifications are more than 15MHz band width
within (0.9-1.2)GHz for the center frequency of 0.99GHz
with return loss S11 less than -30dB. The design of the
low noise amplifier done by ADS softwar and the
spicification are gain above 10dB within the range of
(0.97-1.02)GHz with return loss S11 less than -20dB at
1GHz. The design of BPF done by ADS with
scpicification of good and flat band width from (950-
1050)MHz with returne loss S11 less than -20dB at
1GHz. All the previous designs fabricated by using FR-4
substrate.
RESULTS AND DISCUSSION
The antenna mesurement results are 29.12MHz band
width within (0.7-1.2)GHZ for the center frequency of
1GHz with return loss S11 -21.6dB. as shown in Figure 1.
Figure 1: Parallel antenna Air Gab Fabrication results
The LNA achevemnt mesurements results are high gain
with S21 about 14dB for the range of (0.97-1.02)GHz
with return loss S11 -33dB at 1GHz with 45MHz band
width. Finally, The BPF mesurment shows good results
of 86MHz band width from (950-1050)MHz with returne
loss S11 -28 at 1GHz.as shown in figure 2.
(a) (b)
Figure 2: (a) fabrication results of the LNA, (b) BPF
fabrication results
CONCLUSIONS
All the Scpicification results has been achevied with
a very good response for the whole system to impliment
them for studying the lightning phisecs by using
telecommunication system as lightning remot sensing.
ACKNOWLEDGEMENTS
The authors would like to thank UniversitiTeknikal
Malaysia Melaka (UTeM) for sponsoring this work
under (UTeM Zamalah Scheme).
REFERENCES
[1] Z. Kawasaki, R. Mardiana, and T. Ushio, “Broadband
and narrowband RF interferometers for lightning
observations,” Geophys. Res. Lett., vol. 27, no. 19, pp.
3189–3192, 2000.
[2] C. O. Hayenga and J. W. Warwick, “Two-
dimensional interferometric positions of VHF
lightning sources,” J. Geophys. Res., vol. 86, no. C8,
p. 7451, 1981.
[3] J. W. Warwick, C. O. Hayenga, and J. W. Brosnahan,
“Interferometric directions of lightning sources at 34
MHz,” J. Geophys. Res., vol. 84, no. C5, p. 2457,
1979.
[4] V. Cooray and G. Cooray, “Electromagnetic radiation
field of an electron avalanche,” Atmos. Res., vol. 117,
pp. 18–27, 2012.
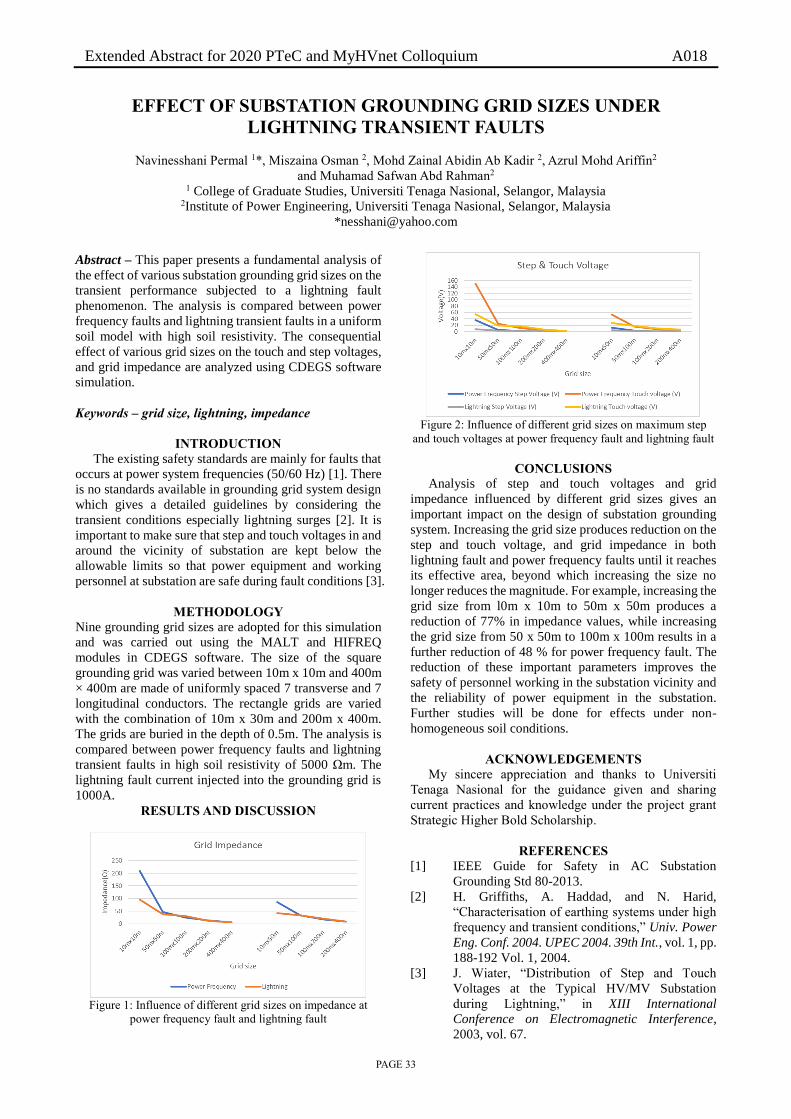
Extended Abstract for 2020 PTeC and MyHVnet Colloquium A018
PAGE 33
EFFECT OF SUBSTATION GROUNDING GRID SIZES UNDER
LIGHTNING TRANSIENT FAULTS
Navinesshani Permal 1*, Miszaina Osman 2, Mohd Zainal Abidin Ab Kadir 2, Azrul Mohd Ariffin2
and Muhamad Safwan Abd Rahman2 1 College of Graduate Studies, Universiti Tenaga Nasional, Selangor, Malaysia
2Institute of Power Engineering, Universiti Tenaga Nasional, Selangor, Malaysia
Abstract – This paper presents a fundamental analysis of
the effect of various substation grounding grid sizes on the
transient performance subjected to a lightning fault
phenomenon. The analysis is compared between power
frequency faults and lightning transient faults in a uniform
soil model with high soil resistivity. The consequential
effect of various grid sizes on the touch and step voltages,
and grid impedance are analyzed using CDEGS software
simulation.
Keywords – grid size, lightning, impedance
INTRODUCTION
The existing safety standards are mainly for faults that
occurs at power system frequencies (50/60 Hz) [1]. There
is no standards available in grounding grid system design
which gives a detailed guidelines by considering the
transient conditions especially lightning surges [2]. It is
important to make sure that step and touch voltages in and
around the vicinity of substation are kept below the
allowable limits so that power equipment and working
personnel at substation are safe during fault conditions [3].
METHODOLOGY
Nine grounding grid sizes are adopted for this simulation
and was carried out using the MALT and HIFREQ
modules in CDEGS software. The size of the square
grounding grid was varied between 10m x 10m and 400m
× 400m are made of uniformly spaced 7 transverse and 7
longitudinal conductors. The rectangle grids are varied
with the combination of 10m x 30m and 200m x 400m.
The grids are buried in the depth of 0.5m. The analysis is
compared between power frequency faults and lightning
transient faults in high soil resistivity of 5000 Ωm. The
lightning fault current injected into the grounding grid is
1000A.
RESULTS AND DISCUSSION
Figure 1: Influence of different grid sizes on impedance at
power frequency fault and lightning fault
Figure 2: Influence of different grid sizes on maximum step
and touch voltages at power frequency fault and lightning fault
CONCLUSIONS
Analysis of step and touch voltages and grid
impedance influenced by different grid sizes gives an
important impact on the design of substation grounding
system. Increasing the grid size produces reduction on the
step and touch voltage, and grid impedance in both
lightning fault and power frequency faults until it reaches
its effective area, beyond which increasing the size no
longer reduces the magnitude. For example, increasing the
grid size from l0m x 10m to 50m x 50m produces a
reduction of 77% in impedance values, while increasing
the grid size from 50 x 50m to 100m x 100m results in a
further reduction of 48 % for power frequency fault. The
reduction of these important parameters improves the
safety of personnel working in the substation vicinity and
the reliability of power equipment in the substation.
Further studies will be done for effects under non-
homogeneous soil conditions.
ACKNOWLEDGEMENTS
My sincere appreciation and thanks to Universiti
Tenaga Nasional for the guidance given and sharing
current practices and knowledge under the project grant
Strategic Higher Bold Scholarship.
REFERENCES
[1] IEEE Guide for Safety in AC Substation
Grounding Std 80-2013.
[2] H. Griffiths, A. Haddad, and N. Harid,
“Characterisation of earthing systems under high
frequency and transient conditions,” Univ. Power
Eng. Conf. 2004. UPEC 2004. 39th Int., vol. 1, pp.
188-192 Vol. 1, 2004.
[3] J. Wiater, “Distribution of Step and Touch
Voltages at the Typical HV/MV Substation
during Lightning,” in XIII International
Conference on Electromagnetic Interference,
2003, vol. 67.

Extended Abstract for 2020 PTeC and MyHVnet Colloquium A019
PAGE 34
TEMPORAL ANALYSIS OF VERY HIGH FREQUENCY AND MICROWAVE
RADIATION EMITTED BY CLOUD-TO-GROUND LIGHTNING FLASH
S. A. S. Baharin1,*, M. R. Ahmad1, 1Faculty of Electronic and Computer Engineering, Universiti Teknikal Malaysia Melaka, Jalan Hang Tuah Jaya, 76100
Durian Tunggal, Melaka
*E-mail: [email protected]
Abstract – Lightning flash produce electromagnetic
waves that radiates at various frequency spectrum band.
In this paper, we determined to report observational study
of characterization of microwave and VHF radiation
emitted by lightning discharge process specifically
stepped leader and return strokes using parallel plate
antenna that act as remote sensing application with
resonant frequency around 1 GHz.
Keywords – Cloud-Flash; Lightning; Microwave
Emission; Stepped Leader
INTRODUCTION
Electrical breakdown process is the process that
initiate lightning [1-2]. It starts with electron avalanche
that will eventually grows into streamer and streamer will
keep growing and turns into leader. Leader is the
conducting channel which is the lightning flash form that
could be observed with our naked eyes. Electron
avalanche was found to associate with microwave as the
peak electromagnetic spectrum generated by electron
avalanche is around 109 Hz [3] while streamer process
associates with VHF band. The latest significant study by
[4] reported a lighting measurement at 1.63 GHz with a 2
MHz bandwidth using circularly polarized ceramic patch
antenna and observes impulses from return strokes were
seen to generate high amplitude impulses with continuous
burst-noise like bursts while stepped leader generate an
oscillating resolvable impulse. Thus, we motivated to
observe identical microwave and VHF radiation by using
wider bandwidth of antenna.
METHODOLOGY
The lightning measurement is conducted by using an
air-gap parallel plate antenna that resonate at around 1
GHz with a bandwidth of 20 MHz for remote sensing
application. The specifications of the radio system are
between 50-70 MHz and between 800-1050 MHz for
VHF and microwave respectively.
RESULTS AND DISCUSSION
Figure 1: a) Magnified view of FA & microwave records
of stepped leaders and quiet periods b) FA, VHF and
microwave radiation plots with peak amplitude in each RT
and DT for subsidiary pulses A, B & C.
The percentage ratio of the peak amplitudes of the
microwave bursts during QP is between 34.3% and 49.5%
larger than the amplitude of the microwave bursts during
stepped leaders. The pulse duration of the subsidiary
pulses is between 11.991 µs and 16.253 µs. The peak
amplitude of VHF radiation impulse is between 59.14%
and 75.34% larger than the peak amplitude of the
microwave radiation impulses. The highest peak
amplitude of VHF and microwave radiation impulses is
during the subsidiary pulse C.
CONCLUSIONS
The quiet periods which we believe associates with
electron avalanche and streamer is seen to initiate the
leader process. Characteristics of VHF and microwave
waveforms are noise-like bursts and oscillating individual
pulses. During return strokes, subsidiary pulses has the
highest peak amplitude of VHF and microwave bursts.
ACKNOWLEDGEMENTS
This project is funded by Short Term Grant (Projek
Jangka Pendek PJP/2018/FKEKK/(3B)/S01615) and
Fundamental Research Grant Scheme (FRGS)
(FRGS/2018/FKEKK-CETRI/F00361).
REFERENCES
[1] V. Cooray, “An Introduction to Lightning,” Springer
Science and Business Media, Dordrecht, 2015.
[2] V. Cooray, “The Lightning Flash, Institution of
Engineering and Technology,” London, United
Kingdom, 2003.
[3] V. Cooray and G. Cooray, “Electromagnetic
radiation field of an electron avalanche,”
Atmospheric research, vol. 117, pp. 18–27, 2012.
[4] D. Petersen and W. Beasley, “Microwave radio
emissions of negative cloud-to-ground lightning
flashes,” Atmos. Res., vol. 135–136, pp. 314–321,
2014.
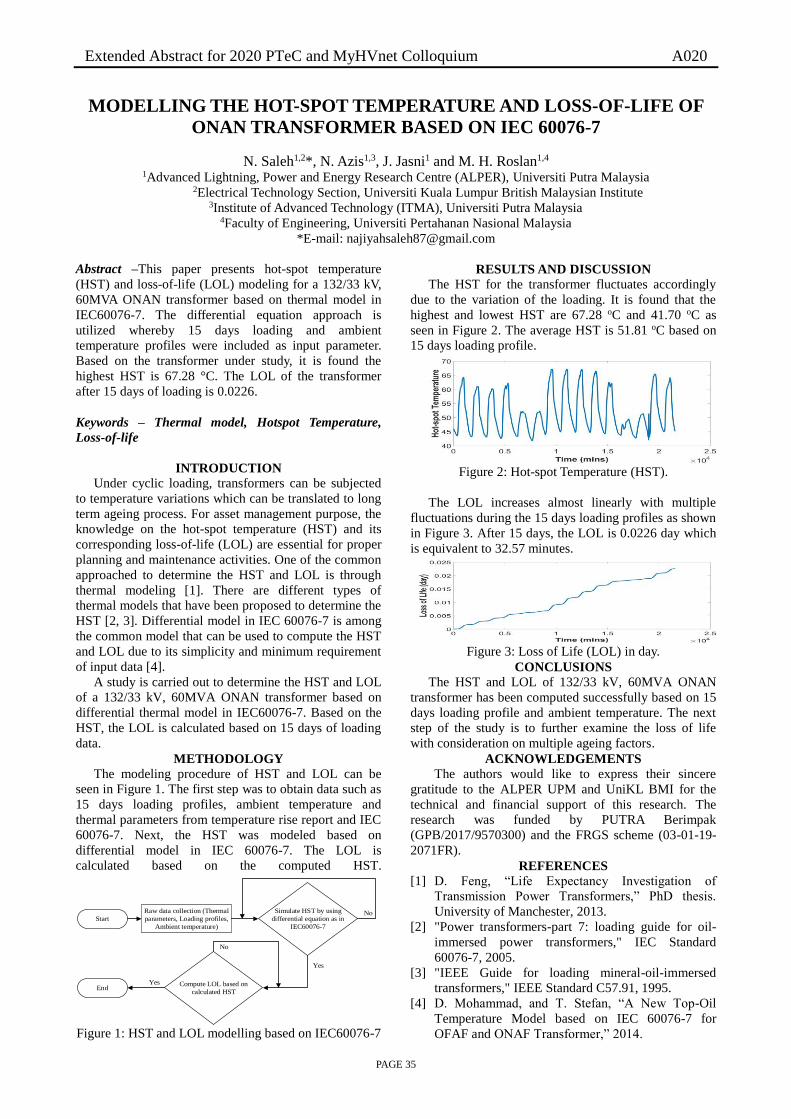
Extended Abstract for 2020 PTeC and MyHVnet Colloquium A020
PAGE 35
MODELLING THE HOT-SPOT TEMPERATURE AND LOSS-OF-LIFE OF
ONAN TRANSFORMER BASED ON IEC 60076-7
N. Saleh1,2*, N. Azis1,3, J. Jasni1 and M. H. Roslan1,4 1Advanced Lightning, Power and Energy Research Centre (ALPER), Universiti Putra Malaysia
2Electrical Technology Section, Universiti Kuala Lumpur British Malaysian Institute 3Institute of Advanced Technology (ITMA), Universiti Putra Malaysia
4Faculty of Engineering, Universiti Pertahanan Nasional Malaysia
*E-mail: [email protected]
Abstract –This paper presents hot-spot temperature
(HST) and loss-of-life (LOL) modeling for a 132/33 kV,
60MVA ONAN transformer based on thermal model in
IEC60076-7. The differential equation approach is
utilized whereby 15 days loading and ambient
temperature profiles were included as input parameter.
Based on the transformer under study, it is found the
highest HST is 67.28 °C. The LOL of the transformer
after 15 days of loading is 0.0226.
Keywords – Thermal model, Hotspot Temperature,
Loss-of-life
INTRODUCTION
Under cyclic loading, transformers can be subjected
to temperature variations which can be translated to long
term ageing process. For asset management purpose, the
knowledge on the hot-spot temperature (HST) and its
corresponding loss-of-life (LOL) are essential for proper
planning and maintenance activities. One of the common
approached to determine the HST and LOL is through
thermal modeling [1]. There are different types of
thermal models that have been proposed to determine the
HST [2, 3]. Differential model in IEC 60076-7 is among
the common model that can be used to compute the HST
and LOL due to its simplicity and minimum requirement
of input data [4].
A study is carried out to determine the HST and LOL
of a 132/33 kV, 60MVA ONAN transformer based on
differential thermal model in IEC60076-7. Based on the
HST, the LOL is calculated based on 15 days of loading
data.
METHODOLOGY
The modeling procedure of HST and LOL can be
seen in Figure 1. The first step was to obtain data such as
15 days loading profiles, ambient temperature and
thermal parameters from temperature rise report and IEC
60076-7. Next, the HST was modeled based on
differential model in IEC 60076-7. The LOL is
calculated based on the computed HST.
Start
Raw data collection (Thermal
parameters, Loading profiles,
Ambient temperature)
Simulate HST by using
differential equation as in
IEC60076-7
Compute LOL based on
calculated HSTEnd
Yes
No
No
Yes
Figure 1: HST and LOL modelling based on IEC60076-7
RESULTS AND DISCUSSION
The HST for the transformer fluctuates accordingly
due to the variation of the loading. It is found that the
highest and lowest HST are 67.28 oC and 41.70 oC as
seen in Figure 2. The average HST is 51.81 oC based on
15 days loading profile.
Figure 2: Hot-spot Temperature (HST).
The LOL increases almost linearly with multiple
fluctuations during the 15 days loading profiles as shown
in Figure 3. After 15 days, the LOL is 0.0226 day which
is equivalent to 32.57 minutes.
Figure 3: Loss of Life (LOL) in day.
CONCLUSIONS
The HST and LOL of 132/33 kV, 60MVA ONAN
transformer has been computed successfully based on 15
days loading profile and ambient temperature. The next
step of the study is to further examine the loss of life
with consideration on multiple ageing factors.
ACKNOWLEDGEMENTS
The authors would like to express their sincere
gratitude to the ALPER UPM and UniKL BMI for the
technical and financial support of this research. The
research was funded by PUTRA Berimpak
(GPB/2017/9570300) and the FRGS scheme (03-01-19-
2071FR).
REFERENCES
[1] D. Feng, “Life Expectancy Investigation of
Transmission Power Transformers,” PhD thesis.
University of Manchester, 2013.
[2] "Power transformers-part 7: loading guide for oil-
immersed power transformers," IEC Standard
60076-7, 2005.
[3] "IEEE Guide for loading mineral-oil-immersed
transformers," IEEE Standard C57.91, 1995.
[4] D. Mohammad, and T. Stefan, “A New Top-Oil
Temperature Model based on IEC 60076-7 for
OFAF and ONAF Transformer,” 2014.

Extended Abstract for 2020 PTeC and MyHVnet Colloquium A021
PAGE 36
MODELLING INDIVIDUAL FAILURE RATES OF TRANSFORMER
POPULATION BASED ON HEALTH INDEX
N. S. Shariffuddin1,2*, N. Azis1,3, M. S. Yahaya1,4 J. Jasni1 and A. Mohd Selva1 1 Advanced Lightning, Power and Energy Research Centre (ALPER), Universiti Putra Malaysia
2Electrical Technology Section, Universiti Kuala Lumpur British Malaysian Institute 3 Institute of Advanced Technology (ITMA), Universiti Putra Malaysia
4Faculty of Engineering Technology, Universiti Teknikal Melaka
*E-mail: [email protected]
Abstract – This paper presents a study on modelling the
individual failure rate based on Health Index (HI). In total,
148 oil samples from 33/11 kV transformers with age
ranging from 1 to 20 years were analysed in this study.
The HI of tranformers was determined based on the
condition monitoring data of the oil samples. Next, the
individual failure rate was determined based on the
relative risk approach. It is found that, the relationship
between failure rate and HI of the transformer population
is almost exponential. Majority of the failure rate of the
transformer population exceed the average failure rate
obtained from global survey at HI lower than 80%.
Keywords – Transformer, Individual failure rate, Asset
management
INTRODUCTION
Nowadays, utilities have started to adopt condition-
based management for optimizing the maintenance and
capital investments of transformers. Historical data is one
of the key components for this scheme. Failures data is
essential for future planning of networks for the utilities
[1]. However, in-service failures data is quite difficult to
be obtained due to various reasons [2]. A number of
studies have been carried out to estimate the failures data
based on available information [3]. One of the unique
approaches to determine failure rates is based on condition
of the assets [1].
This paper presents the approach to determine the
failure rates based on health index (HI) concept of
transformers. In total, 148 oil samples from 33/11 kV
transformers are analysed.
METHODOLOGY
The workflow of this study is shown in Figure 1. The
first step was to obtain the condition monitoring data from
the transformer population. The health index was
determined based on scoring and weighting method [4].
The failure rate of individual transformer was determined
based on relative risk method [1].
Figure 1: The workflow of the study
RESULTS AND DISCUSSION
The relationship between failure rate and HI can be
seen in Figure 2. The failure rate increases almost
exponentially as the HI decreases to around 45%. Since
the transformer population is quite young, not much data
can be obtained at HI region between 45% and below. It
is found that the failure rate of the transformer population
mainly exceed the global average failure rate once HI
decreases lower than 80%.
Figure 2: Graph of failure rate versus HI
CONCLUSIONS
Failure rate has an exponential relationship with HI.
High failure rate is found as HI decreases lower than 50%.
Further study will be carried out to examine the
progression of individual failure rate as the age increases.
ACKNOWLEDGEMENTS
The authors would like to express their sincere
gratitude to the ALPER UPM and UniKL for the technical
and financial support of this research. The research was
funded by PUTRA Berimpak (GPB/2017/9570300) and
the FRGS scheme (03-01-19-2071FR).
REFERENCES
[1] J. H. Jürgensen, L. Nordström, and P. Hilber,
“Individual failure rates for transformers within a
population based on diagnostic measures,” Electr.
Power Syst. Res., vol. 141, pp. 354–362, 2016.
[2] Y. Zaidey, Y. Ghazali, and A. M. Soosai, “Paper
1572 TNB Approach On Managing Asset Retirement
For Distribution,” June, pp. 15–18, 2015.
[3] R. E. Brown, S. Member, G. Frimpong, S. Member,
and H. L. Willis, “Failure Rate Modeling Using
Equipment Inspection Data,” in Power Engineering
Society General Meeting. IEEE vol.1, 2004, pp.693-
700.
[4] A. Jahromi, R. Piercy, S. Cress, J. Service, and W.
Fan, “An approach to power transformer asset
management using health index,” IEEE Electr. Insul.
Mag., vol. 25, no. 2, pp. 20–34, 2009.
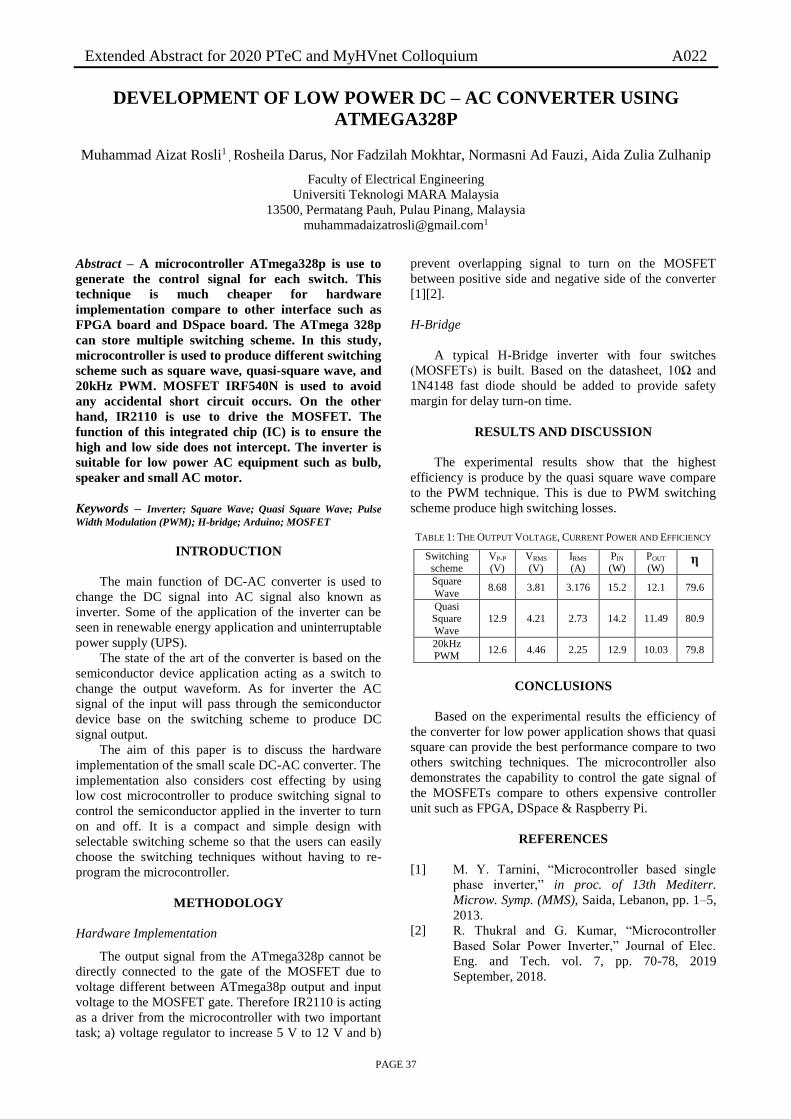
Extended Abstract for 2020 PTeC and MyHVnet Colloquium A022
PAGE 37
DEVELOPMENT OF LOW POWER DC – AC CONVERTER USING
ATMEGA328P
Muhammad Aizat Rosli1 , Rosheila Darus, Nor Fadzilah Mokhtar, Normasni Ad Fauzi, Aida Zulia Zulhanip
Faculty of Electrical Engineering
Universiti Teknologi MARA Malaysia
13500, Permatang Pauh, Pulau Pinang, Malaysia
Abstract – A microcontroller ATmega328p is use to
generate the control signal for each switch. This
technique is much cheaper for hardware
implementation compare to other interface such as
FPGA board and DSpace board. The ATmega 328p
can store multiple switching scheme. In this study,
microcontroller is used to produce different switching
scheme such as square wave, quasi-square wave, and
20kHz PWM. MOSFET IRF540N is used to avoid
any accidental short circuit occurs. On the other
hand, IR2110 is use to drive the MOSFET. The
function of this integrated chip (IC) is to ensure the
high and low side does not intercept. The inverter is
suitable for low power AC equipment such as bulb,
speaker and small AC motor.
Keywords – Inverter; Square Wave; Quasi Square Wave; Pulse
Width Modulation (PWM); H-bridge; Arduino; MOSFET
INTRODUCTION
The main function of DC-AC converter is used to
change the DC signal into AC signal also known as
inverter. Some of the application of the inverter can be
seen in renewable energy application and uninterruptable
power supply (UPS).
The state of the art of the converter is based on the
semiconductor device application acting as a switch to
change the output waveform. As for inverter the AC
signal of the input will pass through the semiconductor
device base on the switching scheme to produce DC
signal output.
The aim of this paper is to discuss the hardware
implementation of the small scale DC-AC converter. The
implementation also considers cost effecting by using
low cost microcontroller to produce switching signal to
control the semiconductor applied in the inverter to turn
on and off. It is a compact and simple design with
selectable switching scheme so that the users can easily
choose the switching techniques without having to re-
program the microcontroller.
METHODOLOGY
Hardware Implementation
The output signal from the ATmega328p cannot be
directly connected to the gate of the MOSFET due to
voltage different between ATmega38p output and input
voltage to the MOSFET gate. Therefore IR2110 is acting
as a driver from the microcontroller with two important
task; a) voltage regulator to increase 5 V to 12 V and b)
prevent overlapping signal to turn on the MOSFET
between positive side and negative side of the converter
[1][2].
H-Bridge
A typical H-Bridge inverter with four switches
(MOSFETs) is built. Based on the datasheet, 10Ω and
1N4148 fast diode should be added to provide safety
margin for delay turn-on time.
RESULTS AND DISCUSSION
The experimental results show that the highest
efficiency is produce by the quasi square wave compare
to the PWM technique. This is due to PWM switching
scheme produce high switching losses.
TABLE 1: THE OUTPUT VOLTAGE, CURRENT POWER AND EFFICIENCY
Switching scheme
VP-P
(V) VRMS
(V) IRMS
(A) PIN
(W) POUT
(W) η
Square
Wave 8.68 3.81 3.176 15.2 12.1 79.6
Quasi Square
Wave
12.9 4.21 2.73 14.2 11.49 80.9
20kHz PWM
12.6 4.46 2.25 12.9 10.03 79.8
CONCLUSIONS
Based on the experimental results the efficiency of
the converter for low power application shows that quasi
square can provide the best performance compare to two
others switching techniques. The microcontroller also
demonstrates the capability to control the gate signal of
the MOSFETs compare to others expensive controller
unit such as FPGA, DSpace & Raspberry Pi.
REFERENCES
[1] M. Y. Tarnini, “Microcontroller based single
phase inverter,” in proc. of 13th Mediterr.
Microw. Symp. (MMS), Saida, Lebanon, pp. 1–5,
2013.
[2] R. Thukral and G. Kumar, “Microcontroller
Based Solar Power Inverter,” Journal of Elec.
Eng. and Tech. vol. 7, pp. 70-78, 2019
September, 2018.

Extended Abstract for 2020 PTeC and MyHVnet Colloquium A023
PAGE 38
A COMPARATIVE STUDY ON ELECTRICAL PROPERTIES OF VIRGIN
COCONUT OIL UNDER ACCELERATED THERMAL AGING
Mimi Asmida Saidi1,*, Nur Darina Ahmad1, M. Kamarol2 1Faculty of Electrical Enginering, Universiti Teknologi MARA, 13500 Pematang Pauh, Penang, Malaysia.
2 School of Electrical and Electronic Engineering,Universiti Sains Malaysia,14300 Nibong Tebal, Pulau Pinang,
Malaysia.
*E-mail: [email protected], [email protected]
Abstract – This paper about a comparative study on
electrical properties of virgin coconut under accelerated
thermal aging. The main purpose of this project is to
study the suitability of virgin coconut oil as transformer
oil under accelerated thermal aging. The result will
compared to IEC 60156 standard for a breakdown
voltage while, for the accelerated thermal aging will
compared to ASTM D1934.
Keywords – Transformer, insulating oil, virgin coconut
oil, mineral oil, Breakdown voltage, Thermal aging.
INTRODUCTION
Transformers are unit devices used in electrical
circuits to vary the voltage of electricity flowing within
the circuit. Transformer also is the crucial thing in the
power system world so that is important to protect it
from any course failure. Insulating oil is an oil that is
stable at high temperatures and has wonderful electrical
insulating properties. The main functions are to insulate,
suppress corona discharge and an arcing, and to serve as
a coolant. Mineral oil (MO) is the most common used for
transformer as insulating and cooling oil. Even though it
is viable, and low cost [1], it also has their own
drawback, for example, it has a high flammability, lead
to environmental pollution and its insulating properties
easily reduce with small amount of water [2]. Hence,
vegetable oil is the best alternative to replace and
improve this problem. As a vegetable oil base, it is more
environmentally friendly, high fire point, renewable and
slower ageing rate [2] [1].
METHODOLOGY
There are two type of oil involved in the project
which is pure virgin coconut oil (100% VCO) and pure
mineral oil (100% MO). The sample will be categorized
into 2 parts which is before aging and after aging. Before
aging sample is when the sample do not undergo any
process before tested. While, “after aging” sample is
when the oils are heated in oven for a certain time. In
this project sample will exposed to four different periods
which 100 hours, 150 hours, 200 hours, 250 hours and
300 hours before they were tested on the breakdown
voltage.
RESULTS AND DISCUSSION
Figure 1 illustrates the relationship between breakdown
voltage of VCO when was exposed under accelerated
thermal aging. Found that, the breakdown of vegetable
oil was increased from 0 to 200 hours, breakdown
voltage was increased significantly until it drastically
rises to the higher value which is 95.9 kV at 250 hours of
aging after that it slightly decrease into 79.9 kV at 300
hours different from the mineral oil results which shows
the opposite patern. The breakdown voltage of VCO is
higher than mineral oil because, as a vegetable oil their
chemical structure contains more saturation compare
mineral oil.
Figure 1: Graph relationship between breakdown voltages With
Accelerated Thermal Aging of VCO and MO
CONCLUSIONS
VCO has a higher breakdown voltage when it was
exposed under accelerated thermal stress compared to
mineral oil. Based on the result, VCO show the positive
result, which the breakdown voltage keeps increasing
and high probability of being considered as a transformer
oil, but the oil still needs to go through a variety of other
tests such as acidity, viscosity, moisture and others in
order to identify either it is really suitable as transformer
oil.
ACKNOWLEDGEMENTS
This study was successful done supported by Faculty
of Electrical Engineering, University Teknologi MARA
Cawangan Pulau Pinang and not forget special thanks for
Universiti Sains Malaysia, Engineering Campus for
contributing some help during completing this study by
providing the equipments in High Voltage Laboratory
and also much appreciation to Universiti Pertahanan
Nasional Malaysia for providing insulating oil which is
VCO.
REFERENCES [1] Y. Xu and S. Qian, “Oxidation Stability Assessment of a
Vegetable Transformer Oil under Thermal Aging,” IEEE
Trans. Dielectr. Electr. Insul., vol. 21, no. 2, pp. 683–692,
2014.
[2] M. Martins, “Vegetable oils, an alternative to mineral oil
for power transformers- experimental study of paper aging
in vegetable oil versus mineral oil,” IEEE Electr. Insul.
Mag., vol. 26, no. 6, pp. 7– 13, 2010.

Extended Abstract for 2020 PTeC and MyHVnet Colloquium A024
PAGE 39
STRUCTURE AND DIELECTRIC PROPERTIES OF
POLYPROPYLENE/CALCIUM CARBONATE NANOCOMPOSITES
A. Azmi1,*, K. Y. Lau1, N. A. Ahmad1 and Z. Abdul-Malek1 1Institut of High Voltage and High Current, School of Electrical Engineering, Universiti Teknologi Malaysia,
Johor, Malaysia
*E-mail: [email protected]
Abstract – This paper reports on an investigation of the
effects of multi-element oxide nanoparticles, namely,
surface modified calcium carbonate (CaCO3) on the
structure and dielectric properties of polypropylene (PP).
The morphology and dielectric response analysis were
carried out by means of SEM Hitachi TM3000 and Gamry
Instruments Interface 1000 with Tettex’s 2914 test cell for
solid insulations, respectively. The nanocomposites were
prepared based on a melt blending technique. Hydraulic
laboratory press was used to obtain 100 µm thick sample.
The experimental results show that, surface modified
CaCO3 nanoparticles were homogeneously dispersed in
PP. Meanwhile, the real permittivity of PP/CaCO3
nanocomposites was lower than that of unfilled PP.
Keywords – Polypropylene, nanocomposites, calcium
carbonate, dielectric
INTRODUCTION
Nanoparticles are widely used to enhace the dielectric
properties of polymer based insulation. By introducing
few weight percentage (wt%) of nanoparticles, polymer
nanocomposites demonstrate different dielectric
properties. Previous studies showed unique dielectric
properties, e.g., real and complex permittivity, through the
use of nanocomposites, such as epoxy/zinc oxide [1] and
epoxy/silicate nanocomposites [2]. Thefore, this research
was conducted to further investigate the dielectric
property of polypropylene (PP) with 1 wt% of surface
modified CaCO3.
METHODOLOGY
The based polymer used was PP blend composed of
50% PP homopolymer and 50% PP impact copolymer.
The nanofiller used was surface modified CaCO3 with an
ammount of 1 wt%. The sample was melt blend using a
brabender mixer. The thin film sample was prepared by
means of hydraulic laboritory press to obtain 100 µm thick
sample. The sample was subjected to Hitachi TM3000 and
Gamry instrument interface 1000 for SEM and dielectric
response measurements.
RESULTS AND DISCUSSION
Figure 1a and 1b show the micrograph of unfilled PP
and PP/CaCO3 nanocomposites, respectively. The SEM
micrograph of unfilled PP reveals the structure of PP
blends witout having any nanoparticles. the detailed
morphology of the unfilled PP blend is not well revealed
in this fracture surface. Meanwhile, SEM micrograph of
PP/CaCO3 nanocomposites shows that surface modified
CaCO3 nanoparticles were well dispersed in PP. In
additions, CaCO3 with ~100 nm sizes (as indicated by red
colored arrows) could be seen.
(a) (b)
Figure 1: SEM micrograph of (a) unfilled PP and (b) PP/CaCO3
nanocomposites.
Figure 2: Real permittivity comparing unfilled PP and
PP/CaCO3 nanocomposites.
Figure 2 demonstrates the real permittivity comparing
unfilled PP and PP/CaCO3 nanocomposites. In is noted
that the real permittivity of unfilled PP and PP/CaCO3
nanocomposites are almost independent of frequency over
the frequency range of 100 Hz to 100 kHz. The
permittivity of unfilled PP was 2.68 throughout the
measured frequency range. Meanwhile, PP/CaCO3
nanocomposites had a lower permittivity than unfilled PP.
This result is in line with the research in [1]. This is
attributed to the interaction between nanofiller and
polymer matrix that would restrict the movement of
polymer molecular chains, thus reducing the polarisation
of the polymer matrix [2].
CONCLUSIONS
This research shows that surface modified CaCO3
nanoparticles have been well distributed in PP polymer.
Besides that, the introduction of CaCO3 in PP reduces the
permittivity of PP/CaCO3 nanocomposites. This is due to
restriction of polymer molecular chain by CaCO3
nanofillers.
ACKNOWLEDGEMENTS
The authors thank the Ministry of Education Malaysia,
Universiti Teknologi Malaysia, and Nippon Sheet Glass
Foundation for Materials Science and Engineering for
FRGS (FRGS/1/2019/TK04/UTM/02/1), RUG (16J55),
and NSG (4B373) grants, UTM Zamalah PhD scholarship,
and financial sponsorship.
REFERENCES
[1] S. Singha and M. Thomas, “Influence of Filler
Loading on Dielectric Properties of Epoxy-Zno
Nanocomposites,” IEEE Trans. Dielectr. Electr.
Insul., vol. 16, no. 2, pp. 531–542, 2009.
[2] T. Tanaka, “Dielectric Nanocomposites with
Insulating Properties,” IEEE Trans. Dielectr. Electr.
Insul., vol. 12, no. 5, pp. 914–928, 2005.
2.5
2.6
2.6
2.7
2.7
2.8
100 1000 10000 100000
Rea
l
Per
mit
tivit
y, ε
PP/CaCO₃ nanocompositesUnfilled PP

Extended Abstract for 2020 PTeC and MyHVnet Colloquium A025
PAGE 40
INFLUENCE OF NON-BRIDGE AND BRIDGE CONTAMINATED
TRANSFORMER OIL ON LIGHTNING IMPULSE BREAKDOWN
VOLTAGE
*S.Saaidon1,2 and M.Kamarol1 1 School of Electrical and Electronic Engineering, Universiti Sains Malaysia, Nibong Tebal, Pulau Pinang
2Center of Instructor and Advanced Skills Traning (CIAST), Shah Alam Selangor
*E-mail: [email protected]
Corresponding Author: M. Kamarol
Abstract – This study investigates the influence of
bridging formation of impuritiy in a transformer oil on the
lightning impulse breakdown voltage. An impulse
generator of 280kV was used to provide a positive
lightning impulse waveforms of 1.2/50 µs. The rising
voltage method of IEC60897 was applied to measure the
breakdown voltages. Cellulose Powder of 20µm size were
dispersed into oil as contaminant with 0.004%
concentration level of fibers by weight. The results
revealed that, the contaminant reduces the breakdown
voltage nearly 10% and further 14% the bridges formed.
Keywords – Breakdown, Impulse, Contamination
INTRODUCTION
Pressboards are major insulation used in power
transformer. During normal operation, pressboard
continuously exposed to thermal, electrical and
mechanical stresses. Under the influence of these stresses
the pressboard may undergo a process of degradation,
resulting in the formation fiber dust dispersed into mineral
oil as contamination. These fibres particles presence as oil
contamination effected the dielectric strength of oil by
reduce the breakdown voltage of the liquids[1][2] .
METHODOLOGY
Firstly, a bulk quantity of mineral oil was collected
from a sealed barrel and the oil was degassed in a vacuum
oven set at 105°C for more than 48 h. Next, the oil was
left to cool down to room temperature (15-30˚C) for 24 h
under vacuum. The pre-treated oil sample is denoted as
clean oil (CO). Commercial microcrystalline cellulose
powder with a size of 20 µm was chosen as the
contaminant for the tests. The contaminant was
dehydrated in a vacuum oven set at 105°C for 8 h in order
to remove moisture. The cellulose powder was left to cool
to room temperature for 6 h under vacuum condition. Next,
a magnetic stirrer was used to disperse the contaminant
uniformly in the mineral oil in order to prevent the
formation of cloud-like clusters of fiber in the oil. The
contaminated mineral oil samples are labelled as non-
bridging contaminated processed oil sample (NB_CPS)
and bridging contaminated processed oil sample (B_CPS)
with fiber particles of 0.004wt%. The lightning impulse
breakdown voltages (LIBV) were measured using the
rising voltage method (1 shot/step) of IEC60897.
RESULTS AND DISCUSSION
Figure 1 shows the Weibull distribution parameter and
50% breakdown probability of the Clean Oil (CO), Non-
Bridge Contaminated Oil (NB_CPS) and Bridge
Contaminated Oil (B_CPS). The dielectric breakdown
voltage (BDV) of these samples was illustrated in Table 1.
The results revealed that the BDV was reduced
significantly by 9.84% due to the attendance of cellulosic
fibers and the fibers effect become more prominent when
the bridge was formed. The fibers accumulated were
contributed by a low BDV of contaminated oil up to
23.37% in the bridge formation.
Figure 1: Weibull distribution plot for the Clean Oil,
Contaminated and Bridging influence to the breakdown
strength
Table 1. Weibull parameters of breakdown results for
the Clean Oil, Contaminated and Bridging
CONCLUSIONS
As a conclusion, the fiber dust and bridge formed in
the oil, absolutely reduced the dielectric strength of the oil.
The contaminated oil slightly alters the oil features from
insulative to conductive behavior, thus, reducing the
insulation performance of the oil.
REFERENCES
[1] P. Wedin, “Electrical breakdown in dielectric
liquids-a short overview,” IEEE Electr. Insul. Mag.,
vol. 30, no. 6, pp. 20–25, 2014.
[2] W. Lu and Q. Liu, “Effect of cellulose particles on
streamer initiation and propagation in dielectric
liquids,” Proc. IEEE Int. Conf. Prop. Appl. Dielectr.
Mater., vol. 2015-Octob, pp. 939–942, 2015.
Parameter B_CPS NNB_CPS CO
Moisture Content (ppm) 7.67 6.08
Mean LIBV (kV) 76.03 90.47 100.68
50% Breakdown Voltage (kV) 77.82 91.97 102.01
Shape Parameter (α) 16.85 16.01 22.61
Scale Parameter (β) 78.24 93.80 103.35

Extended Abstract for 2020 PTeC and MyHVnet Colloquium A026
PAGE 41
TREE INCEPTION VOLTAGE IN XLPE CONTAINING ALUMINA
NANOFILLER
N. S. Mansor1*, N. S. M Nazar,D. Ishak 1,M. Mariatti2 , H. S. A. Halim3, A. B. A. Basri3 and M. Kamarol1
1School of Electrical and Electronic Engineering, Universiti Sains Malaysia, Penang, Malaysia. 2School of Material and Mineral Resources Engineering, Universiti Sains Malaysia, Penang, Malaysia.
3TNB Research
*E-mail: [email protected]
Corresponding Author: M. Kamarol
Abstract – Currently, XLPE is widely used in
underground high voltage cable. Recently, a few
nanofillers have been selected by numerous researchers to
enhance the electrical tree resistance in polymer matrix. In
this paper, the influence Al2O3 nanofillers on the tree
inception voltage (TIV) in XLPE have been investigated.
The concentration of nanofillers loading are varies from
0.5 wt%, 1 wt% and 1.5 wt%. The needle-plane electrodes
are used in this investigation and the gap between the
electrodes is 2 mm.. The results show that the XLPE
containing 1wt% Al2O3 has higher tree inception voltage
(TIV) compared with unfilled XLPE.
INTRODUCTION
The presence of nanofillers in polymer matrix has been
paid much attention as polymer nanocomposites have
possibility to improve the mechanical properties such as
tensile strength, toughness, bending strength and greater
heat and chemical resistance [1-3]. Furthermore, it also
has capability to improve the electrical properties such
resistance to the electrical tree and breakdown
phenomenon [4]. Therefore, in this paper, the
investigation on the characteristics of electrical tree of
XLPE containing various concentrations of Al2O3
nanofiller has been performed. The concentrations of
Al2O3 nanofiller in XLPE were varied from 0.5wt% ,1
wt% and 1.5 wt%. The result of electrical tree
characteristics for XLPE/Al2O3 nanocomposite were
compared with the unfilled XLPE.
METHODOLOGY
The XLPE containing with Al2O3 nanofillers was
prepared in the form of rectangular-shaped test sample.
The size of the sample was 15mm x 25mm x 2mm,
respectively. The needle-plane electrodes geometry were
used in the experiments. The tungsten needle electrode of
1mm diameter with the tip radius 5±1 μm and tip angle
30° was inserted slowly into each test sample. Aluminum
tape was used as a plane electrode and the gap of needle-
plane electrodes is 2±2 mm.
RESULTS AND DISCUSSION
The result of (TIV) with respect to filler concentration
of Al2O3 nanofillers in XLPE is shown in Fig. 1. The result
shows that the TIV for Al2O3 nanofillers are increased
with the filler concentration up to 1wt%. The TIV start to
decrease as the filler concentration exceeded 1wt% but
still higher than unfilled XLPE. The addition of 1 wt%
Al2O3 nanofiller in XLPE may reduce the interparticles
distance in nanocomposite. According to the dual model,
a tightly bound region of nano particles will be achieved
with optimal existence of filler (reduction of interparticles
distance) in XLPE nanocomposites without
agglomeration. The homogeneous dispersion of filler
causes the TIV increases as the concentration of the filler
increased up to 1 wt% [5].
Fig. 1. Variation in tree inception voltage with respect to
filler concentration in XLPE with Al2O3 nanofillers
CONCLUSIONS
The effect of Al2O3 nanofiller in XLPE on TIV has been
investigated. It can be concluded that the addition of 1
wt% of Al2O3 nanofiller in XLPE had improved the TIV
of the nanocomposite. The TIV for 1.0wt% and 1.5wt% Al2O3
nanofiller in XLPE are 9.56% and 3.2% higher than the unfilled
XLPE.
ACKNOWLEDGEMENTS
The authors would like to thank TNB Research and USM
for financial support under the Fundamental Grant Scheme
(FRGS: 6071372) and also USM Fellowship Sceme for
supporting this research.
REFERENCES
[1] G. Danikas and T. Tanaka, “Nanocomposites – A
review of electrical treeing and breakdown,” IEEE Electr.
Insul. Mag., vol. 25, no. 4, pp. 19–25, 2009.
[2] S. Raetzke, Y. Ohki, T. Imai, T. Tanaka, and J.
Kindersberger, “Tree initiation characteristics of epoxy
resin and epoxy/clay nanocomoposite,” IEEE Trans.
Dielectr. Electr. Insul., vol. 16, no. 5, pp. 1473–1480, 2009.
[3] J. Densley, T. Kalicki, and Z. Nadolny,
“Characteristics of PD pulses in electrical trees and
interfaces in extruded cables,” IEEE Trans. Dielectr.
Electr. Insul., vol. 8, no. 1, pp. 48–57, 2001.
[4] R. Sarathi, S. Das, C. Venkataseshaiah and N.
Yoshimura, “ Investigation of growth of electrical treesin
XLPE cable insulation under different voltage profiles”
IEEE Conf. Electrical Insulation Dielectric Phenomena
(CEIDP), pp. 666-669, 2003.
[5] Liu Ying and Cao Xiaolong, “A novel method for the
insulation thickness design of HV XLPE cable based on
electrical treeing tests”, IEEE Trans. on Dielectrics and
Electrical Insulation, Vol. 21, No. 4, pp. 1540-1546, 2014.

Extended Abstract for 2020 PTeC and MyHVnet Colloquium A027
PAGE 42
WIRELESS SF6 GAS DISTRIBUTION MONITORING SYSTEM
M.D. Armail1, H. Zainuddin1,*, M.A. Hasbullah1, N.F. Ambo1, M.S. Kamarudin2 and J.M. Wari3
1Research Laboratory of High Voltage Engineering, Center for Robotics and Industrial Automation,
Faculty of Electrical Engineering, Universiti Teknikal Malaysia Melaka 2 Faculty of Electrical Engineering, Universiti Tun Hussein Onn Malaysia
3Indkom Engineering Sdn. Bhd.
*E-mail: [email protected]
Abstract – This paper presents the preliminary study on
the behavior of 𝑆𝐹6 gas in the gas mixture by developing
a gas monitoring system. The monitoring system consists
of SF6 gas sensor, Arduino Uno microcontroller and radio
frequency module to monitor wirelessly the distribution
of SF6 gas mixed with N2 in the high voltage test vessel.
The results showed that the 𝑆𝐹6 gas concentration varies
over time, suggesting there is a need to examine the
homogeneity of mixed gases in the research of alternative
insulating gas for SF6 before any high voltage test is done.
Keywords – Gas insulation, SF6 gas mixtures, SF6 gas
sensor
INTRODUCTION
Enormous efforts have been carried out by researchers
to find the alternative of SF6 gas for high voltage
switchgear, including SF6/N2 gas mixtures [1]. However,
the distribution of these gases in a gas vessel is not clear.
Typically, the gas mixture is left for a few hours with
assumption it will fairly distributed in the vessel before
any high voltage test is performed. Hence, this project
develops a wireless monitoring system to investigate the
distribution of the gas mixtures by monitoring the
concentration of SF6 gas over a certain period of time.
METHODOLOGY
Figure 1 shows the process flow of the gas monitoring
system. It consists of SF6 gas sensors that are placed at the
top and bottom of gas vessel and the data will be stored on
the laptop. In order to study the homogeneity of gas
mixtures, SF6/N6 gas mixture was used. In this work, the
gas insertion sequence is as follows: the SF6 gas was
inserted first, then followed by N2.
Figure 1: Process flow of the gas monitoring system.
RESULTS AND DISCUSSION
Figure 2 shows the voltage levels measured from the SF6
gas sensor representing the concentration of SF6 gas when
mixed with N2. To note, the sensor is characterized with
output voltage from 0.4 V to 2.0 V, to represent the SF6
gas concentration from 0 ppm to 1000 ppm. Based on the
figure, as SF6 gas in inserted, there is a sharp rise in the
SF6 measured by the sensor placed at the bottom. This
shows that the SF6 gas is immediately detected by the
sensor due to the movement of gas particle that spread out
to fill the vessel. Then, the insertion of N2 gas about 5
minutes later has caused a sudden drop in the SF6
concentration at the bottom of the vessel. This shows that
some of N2 particle has immediately replaced the SF6
particle. Then, the replacement process starts to slow
down, in which this perhaps due to the significant
difference in the molecular weight between SF6 and N2
gases. To note, the density of SF6 gas is 6.139 g/l, whilst
N2 is 1.165 g/liter.
Figure 2: SF6 gas concentration measured by sensor at the
bottom of the gas vessel.
CONCLUSIONS
In conclusion, a wireless monitoring system that is able
to monitor the concentration of SF6 gas has been
developed. Preliminary experimental work has been
undertaken to investigate the homogeneity of gas
distribution in SF6/N2 mixture. The results suggest that
there is a need to monitor the SF6 gas concentration in the
research of alternative insulating gas for SF6 before any
high voltage test is conducted to obtain a valid data of gas
mixture.
ACKNOWLEDGEMENTS
The authors wish to thank Ministry of Education
(MOE) Malaysia and Universiti Teknikal Malaysia
Melaka (UTeM) for funding this study. This work is
funded under Fundamental Research Grant Scheme
(FRGS/1/2016/TK04/FKE-CERIA/F00304). An
appreciation also goes to Indkom Engineering Sdn. Bhd.
for providing certain research materials throughout this
study.
REFERENCES
[1] N.F. Ambo, H. Zainuddin, M.S. Kamarudin and J.M.
Wari, “AC breakdown performance analysis of
SF6/N2 and SF6/CO2 gas mixtures for ring main unit
(RMU) switchgear application,” in 2019 IEEE 20th
International Conference on Dielectric Liquids
(ICDL), Rome, 23-27 June 2019.
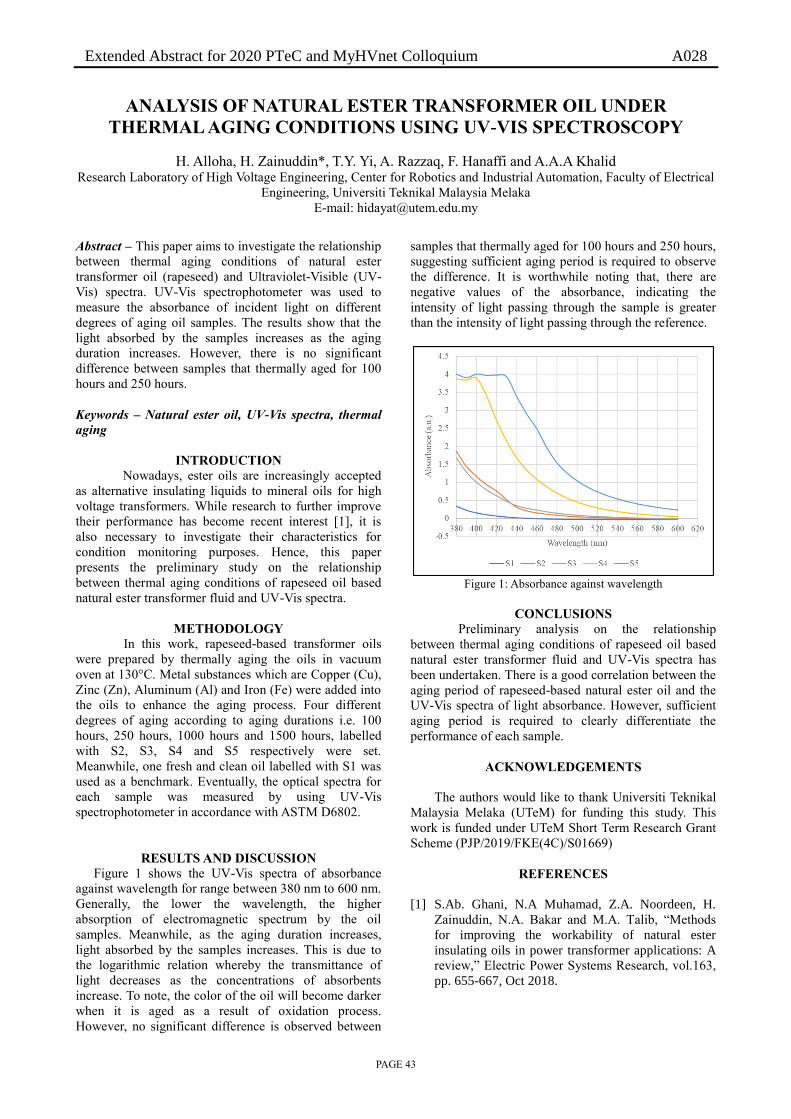
Extended Abstract for 2020 PTeC and MyHVnet Colloquium A028
PAGE 43
ANALYSIS OF NATURAL ESTER TRANSFORMER OIL UNDER
THERMAL AGING CONDITIONS USING UV-VIS SPECTROSCOPY
H. Alloha, H. Zainuddin*, T.Y. Yi, A. Razzaq, F. Hanaffi and A.A.A Khalid Research Laboratory of High Voltage Engineering, Center for Robotics and Industrial Automation, Faculty of Electrical
Engineering, Universiti Teknikal Malaysia Melaka
E-mail: [email protected]
Abstract – This paper aims to investigate the relationship
between thermal aging conditions of natural ester
transformer oil (rapeseed) and Ultraviolet-Visible (UV-
Vis) spectra. UV-Vis spectrophotometer was used to
measure the absorbance of incident light on different
degrees of aging oil samples. The results show that the
light absorbed by the samples increases as the aging
duration increases. However, there is no significant
difference between samples that thermally aged for 100
hours and 250 hours.
Keywords – Natural ester oil, UV-Vis spectra, thermal
aging
INTRODUCTION
Nowadays, ester oils are increasingly accepted
as alternative insulating liquids to mineral oils for high
voltage transformers. While research to further improve
their performance has become recent interest [1], it is
also necessary to investigate their characteristics for
condition monitoring purposes. Hence, this paper
presents the preliminary study on the relationship
between thermal aging conditions of rapeseed oil based
natural ester transformer fluid and UV-Vis spectra.
METHODOLOGY
In this work, rapeseed-based transformer oils
were prepared by thermally aging the oils in vacuum
oven at 130°C. Metal substances which are Copper (Cu),
Zinc (Zn), Aluminum (Al) and Iron (Fe) were added into
the oils to enhance the aging process. Four different
degrees of aging according to aging durations i.e. 100
hours, 250 hours, 1000 hours and 1500 hours, labelled
with S2, S3, S4 and S5 respectively were set.
Meanwhile, one fresh and clean oil labelled with S1 was
used as a benchmark. Eventually, the optical spectra for
each sample was measured by using UV-Vis
spectrophotometer in accordance with ASTM D6802.
RESULTS AND DISCUSSION
Figure 1 shows the UV-Vis spectra of absorbance
against wavelength for range between 380 nm to 600 nm.
Generally, the lower the wavelength, the higher
absorption of electromagnetic spectrum by the oil
samples. Meanwhile, as the aging duration increases,
light absorbed by the samples increases. This is due to
the logarithmic relation whereby the transmittance of
light decreases as the concentrations of absorbents
increase. To note, the color of the oil will become darker
when it is aged as a result of oxidation process.
However, no significant difference is observed between
samples that thermally aged for 100 hours and 250 hours,
suggesting sufficient aging period is required to observe
the difference. It is worthwhile noting that, there are
negative values of the absorbance, indicating the
intensity of light passing through the sample is greater
than the intensity of light passing through the reference.
Figure 1: Absorbance against wavelength
CONCLUSIONS
Preliminary analysis on the relationship
between thermal aging conditions of rapeseed oil based
natural ester transformer fluid and UV-Vis spectra has
been undertaken. There is a good correlation between the
aging period of rapeseed-based natural ester oil and the
UV-Vis spectra of light absorbance. However, sufficient
aging period is required to clearly differentiate the
performance of each sample.
ACKNOWLEDGEMENTS
The authors would like to thank Universiti Teknikal
Malaysia Melaka (UTeM) for funding this study. This
work is funded under UTeM Short Term Research Grant
Scheme (PJP/2019/FKE(4C)/S01669)
REFERENCES
[1] S.Ab. Ghani, N.A Muhamad, Z.A. Noordeen, H.
Zainuddin, N.A. Bakar and M.A. Talib, “Methods
for improving the workability of natural ester
insulating oils in power transformer applications: A
review,” Electric Power Systems Research, vol.163,
pp. 655-667, Oct 2018.

Extended Abstract for 2020 PTeC and MyHVnet Colloquium A029
PAGE 44
RELATIONSHIP BETWEEN REFRACTIVE INDEX AND TOTAL ACID
NUMBER AND WATER LEVEL IN THERMALLY AGED NATURAL ESTER
TRANSFORMER OIL
A.A.A Khalid, H. Zainuddin*, T.Y. Yi, A. Razzaq, F. Hanaffi and H. Alloha
Research Laboratory of High Voltage Engineering, Center for Robotics and Industrial Automation, Faculty
of Electrical Engineering, Universiti Teknikal Malaysia Melaka
E-mail: [email protected] Abstract – This paper presents the relationship between
the refractive index (RI) of thermally aged rapeseed oil
based natural ester fluid and two common dielectric
properties of insulating fluid, which are the average total
acid number (TAN) and moisture content. Different
thermally aged oil samples based on aging period were
prepared for analysis purpose. The RI values were
measured using a digital refractometer, whilst the TAN
and water contents were measured in accordance with
ASTM D974 and ASTM D1533 correspondingly. The
results show that, to certain extent the RI has significant
correlation with TAN, whilst there is no correlation
between RI and water content.
Keywords – Natural ester oil, refractive index, total acid
number, water content
INTRODUCTION
At present, several diagnostic techniques have been
applied to transformer condition monitoring. However,
utility companies are still looking for more cost effective
methods that can reliably monitor their equipment. This
has led numerous attempts by researchers to develop
precise and low-cost sensors for detecting faults and
aging in high-voltage transformers. One of the efforts is
using refractive index to monitor the quality of mineral
oil in high voltage transformers [1]. This paper, on the
other hand, presents the relationship between the
refractive index (RI) and two common dielectric
properties of insulating fluid, which are the average total
acid number (TAN) and moisture content for thermally
aged natural ester transformer oil.
METHODOLOGY
In this work, rapeseed-based transformer oil was used
as the oil samples. The oils were thermally aged in
vacuum oven at 130°C along with metals that are usually
used in transformer parts, i.e. Copper (Cu), Zinc (Zn),
Aluminum (Al) and Iron (Fe). Four different degrees of
aging were set according to aging durations i.e. 100
hours, 250 hours, 1000 hours and 1500 hours. These
samples are labelled with S2, S3, S4 and S5 respectively.
Meanwhile, one fresh and clean oil labelled with S1 was
used as a reference. The TAN and water contents in the
oil samples were measured in accordance with ASTM
D974 and ASTM D1533 correspondingly. Meanwhile,
the RI of the oil samples were measured by using the
digital refractometer. It is worthwhile noting that the RI
increases with ageing period.
RESULTS AND DISCUSSION
Figure 1 shows the relationship between the RI and
two insulation properties of the oil samples, i.e. TAN and
moisture contents. In general, the RI increases as TAN is
increased. There is a significant increase in the RI until
the TAN in the oil sample reaches a knee point at about 6
mgKOH/g. Then, there is no obvious change in the RI as
the TAN is further increased, indicating RI cannot give
good indication of aging due to excessive formation of
acids the rapeseed-based transformer oil. On the other
hand, it is obvious that there is no significant correlation
between the RI and water contents.
Figure 1: Refractive index against total acid number and water
content
CONCLUSIONS
In conclusion, the relationships between RI and two
common insulating properties of transformer oil, i.e.
TAN and water content have been investigated.
Correlating the RI with TAN perhaps possible at the
early stage of aging. However, the presence of water
cannot be detected using RI.
ACKNOWLEDGEMENTS
The authors would like to thank Universiti Teknikal
Malaysia Melaka (UTeM) for funding this work. This
work is funded under UTeM Short Term Research Grant
Scheme (PJP/2019/FKE(4C)/S01669).
REFERENCES
[1] Ryan John Kisch, “Using Refractive Index to
Monitor Oil Quality in High Voltage Transformers”,
Master Thesis, The University of British Columbia,
2008.

Extended Abstract for 2020 PTeC and MyHVnet Colloquium A030
PAGE 45
FAULT CLASSIFICATION IN TRANSMISSION LINES USING ANN.
A. S. Azizan, N. H. Ishak, S. Omar, S. Setumin and I. S. Isa. Faculty of Electrical Enginering, Universiti Teknologi MARA, 13500 Pematang Pauh, Penang, Malaysia.
E-mail: [email protected]
Abstract – In power systems, faults can happen and the
supply to the users are interrupted and this could effects
by damaging the load as it can cause high current (I)
flow. Transmission line used in this research is 138kV
and 230kV. In this project, a study about the lines after
the fault happened such as the magnitude of the voltage
(V) and current at ground (Ig). After that, an analysis of
the types of fault in transmission lines is going to be
classified by using Artificial Neural Network (ANN).
The feed-forward neural network is used to analyze the
type of fault in this study. At the end of this project, the
type of fault are able to be recognize and classified by
100% accuracy at 3 hidden layer.
Keywords – fault, classified, Artificial Neural Network
(ANN), transmission lines
INTRODUCTION
Faults is an abnormal V or I reading that occurs in
transmission lines. Most of the faults in power systems
happened in transmission line since it is exposed to the
atmosphere [1]. There are four faults that happens in
power system which is three-phase (3-ø), single-line to
ground (SLG), line-to-line (LL), and double-line to
ground (DLG) faults. These faults can cause severe
damage to the systems. Whenever faults happens, the
effected lines or phase V will be zero or almost no
reading and there will be an excessive I readings as there
is no load connected that break by the protection
systems. This study is to classify the types of faults that
occurs in transmission lines. In order to solve this, the
ANN [2] coding for fault classification by pattern
recognition is develop. The application of “nntraintool”
in feed-forward neural network used to get the best result
and used for the analysis of this fault study, the problem
in classifying fault in power system can be solved.
METHODOLOGY
A 24-bus of transmission line power system used in
this study. It is a transmission network consist of 24-bus
locations connected by 38 lines and four transformers.
Newton Raphson method used to study the magnitude of
V and Ig by using MATLAB. After the data of V and Ig
is observed, the input data is intrepreted into binary
number. For the faulted phase, the V will be ‘0’ and if
the phase is not faulted, V will be ‘1’. As for Ig, if there
is reading of I, the condition set is ‘1’ while if there is no
reading, the condition set is ‘0’. There are 16
possibilities of condition that might happens. So the
input data is varied for 16x38. For target data, there are
five outputs which includes the four types of fault and
also normal condition also uses binary code [1]. The
input dataset and output dataset are loaded into the
programming of ANN of ‘network pattern recognition
tool’ or ‘nprtool’.
RESULTS AND DISCUSSION
The data set trained by using the “nntraintool” and the
best result obtain with an accuracy of 100%. The best
validation performance is at 9.3116e-07 at epoch 102
which shows better result compared to the system that
had only 1 hidden layer. As mention before, the
validation performance for 3 hidden layer is much better
as the epoch value obtain is much greater than the result
at 1 hidden layer. Start the hidden layer with a small
amount of hidden layer can be good as if the ANN
architecture cannot learn the problem, increase the
hidden layer [3]. As for this study, the hidden layer is set
for various amount but the best result is at 3 hidden layer.
Figure 1: Validation Performance Graph.
CONCLUSIONS
The results obtain assure that the objectives of this
study is achieved. The system can classify the faults that
occurs in power system based on the pattern set in the
input and targeted data. The types of fault can also be
validate by the ANN as the V is set according to its phase
on every line and Ig is stated in the input for its present
and absent. However, the faults might be misclassified
due to certain factor such as the data for output is not
following the binary rules of 2x. As for future
recommendation, the researcher can improve this study
by using different method of ANN.
REFERENCES [1] S. Upadhyay, Dr. S.R. Kapoor. R. Choudry, “Fault
Classification and Detection in Transmission Lines Using ANN.” in Proceeding of the International Conference on Inventive Research in Computing Application (ICIRCA 2018), pp. 1029-1034.
[2] E. B. M. Tayeb and O. A. A. A. Rhim, “Transmission line faults detection, classification and location using artificial neural network,” in Proceedings of the International Conference and Utility Exhibition on Power and Energy Systems: Issues and Prospects for Asia (ICUE ’11), pp. –5, September 2011.
[3] S. Sarkar, “Root Cause Analysis of Incidents Using Text Clustering and Classification Algorithm”, Institute of Technology Kharagpur. Department of Industrial and System Egneering (Sept 2019)

Extended Abstract for 2020 PTeC and MyHVnet Colloquium A031
PAGE 46
A STUDY ON HEAT TRANSFER DISTRIBUTION OF DIFFERENT
LENGTH OF GROUNDING ELECTRODE
N.A.A.Mohammad1, N.H.Ishak2, N.D.Ahmad3, S.S.M.Ramli4, M.Kamarol5 1,2,3,4Faculty of Electrical Enginering, Universiti Teknologi MARA Cawangan Pulau Pinang, 13500 Pematang Pauh,
Penang, Malaysia. 5Centre of study of Electrical and Electronic Engineering, Universiti Sains Malaysia.14300 Nibong Tebal, Pulau
Pinang.
E-mail: [email protected], [email protected] , [email protected],
[email protected], [email protected]
Abstract –In this paper, the heat transfer distribution was
studied in terms of different lengths of the rod electrode.
To maintain the grounding system efficiency, it is
necessary to deviate energy and heat to the ground. The
Finite Element Method (FEM) are used to compare the
heat transfer distribution of these different lengths of rod
electrode. Modeling and simulation of the grounding
system are in 3 Dimension (3D) by using COMSOL
Multiphysics software. The result show the longer rod
electrode produce the efficient grounding electrode in
grounding system.
Keywords- heat transfer, electrode, FEM, COMSOl
INTRODUCTION
Grounding is known as the process of metal objects
electrically connected to earth through a system of earth
electrodes to reduce risk of electric shock. Having a low
value of resistance can limit potential ground surface
differences when the occurrence of fault current. The
National Electric Code (NEC) requires the grounding
electrodes to be tested to ensure that the electrodes are
below 25 ohms of ground resistance (Earth) [1]. In other
hand, the electrode must have high electricity conducting
properties which can allow the huge amount of current to
flow in low resistance condition.
METHODOLOGY
In this project, the simulation of heat transfer
distribution of electrode grounding is by using the FEM
software package which is COMSOL Multiphysics. FEM
is the best method for observe the heat transfer
distribution and provides more reliable results than basic
engineering formulas[2]. The variety input set up which is
rod grounding electrode with different lengths are used to
observe the heat transfer on grounding system.
RESULTS AND DISCUSSION
Fig.1 depicts the result for heat transfer of rod
grounding electrode with particular length of electrode
which are 1.5 m, 2.5 m and 3.5 m. Temperature value for
1.5 m is represented by blue colour, while red colour
represents 2.5 m and the green colour represents for 3.5 m.
Fig. 1: Temperature of surrounding soil with different length
of rod electrode.
The temperature distributed to the soil was rapidly
increased at time between 0 second and 0.1 second. After
that, the temperature was slowly decreased until 1 second.
The maximum temperature is dispersed by 1.5 m length
of rod electrode which is 53ᵒC. It was the highest
temperature dispersed to the soil among three different
length of copper electrode. While, 2.5 m dispersed second
highest maximum temperature which is 44ᵒC and the
lowest of all is 25ᵒC devoted by 3.5 m.
CONCLUSIONS
According to the result gained, the heat transfer
distribution of grounding system with different types of
electrode, length and width of electrode was successfully
analysed in COMSOL Multhiphysics software. The result
indicate that the used of longer rod electrode will lower
the value of resistance in electrode. Thus, current can
easily flow through the electrode and heat distributed in
short time.
ACKNOWLEDGEMENTS
The author would like to thank Faculty of Electrical
Engineering, Universiti Teknologi Mara Pulau Pinang
(UiTM) and Centre of study of Electrical and Electronic
Engineering Universiti Sains Malaysia (USM) for the
support on this project.
REFERENCES
[1] D. Stockin, McGraw-Hill’s NEC 2014 Grounding
and Earthing Handbook. McGraw-Hll Education,
2014.
[2] M. Trlep, A. Hamler, and B. Hribernik, “The
analysis of complex grounding systems by FEM,”
IEEE Transactions on Magnetics, vol. 34, no. 5
PART 1, pp. 2521–2524, 1998.

Extended Abstract for 2020 PTeC and MyHVnet Colloquium A032
PAGE 47
AN EXPERIMENTAL STUDY ON ULTRAVIOLET SENSOR SIGNAL
PATTERN OF DIFFERENT TYPES OF INSULATOR MATERIAL
Nurun Najah binti Abdul Rahim1, Nor Asiah binti Muhamad2, * and Mohamad Kamarol Mohd Jamil3 School of Electrical and Electronic Enginering, Universiti Sains Malaysia, 14300 Nibong Tebal, Penang, Malaysia.
*E-mail: [email protected], [email protected]
Abstract – Measurements on the ultraviolet signals
emitted during insulators surface discharges have shown
to be a good method to detect surface discharge from
insulator transmission line. Laboratory investigations
were carried out where UVTRON R2868 Flame Sensor
was used to detect the ultraviolet signal emitted from
insulator during discharge activities from glass and
ceramic type of pin insulators. Various discharge
intensities were generated in order to study the
correlation between the ultraviolet signals of various
discharge level with type of insulator material. At the end
of study, the result shows that flame sensor could detect
the ultraviolet pulse emitted from both type of pin
insulators. This study illustrates that ultraviolet pulse
method using flame sensor is a potential tool to monitor
the insulator surface condition during service
Keywords – UVTRON Flame Sensor, Ultraviolet Pulse,
Insulator Surface Condition
INTRODUCTION
The reliable and uninterrupted operation in power
system depends on reliable insulation [1]. From time to
time, defective insulators have been found on
transmission lines which lead to flashover during service
[2]. There are so many causes that can trigger the surface
discharge and almost all of them will eventually lead to
flashover and breakdown in the transmission line system.
Early detection can help in preventing such damage from
developing into a disruptive fault [3]. There has been
increasing interest in recent years in implementing
measurement on the ultraviolet signals emitted during
insulators surface discharge from insulator. Ultraviolet
radiation is periodically emitted during the discharges.
The wavelength ranges from 10nm to 400nm. This study
aims to detect and measure the ultraviolet signals during
UV emission due to discharge activities on the surface of
insulators
METHODOLOGY
This study was carried out in High Voltage
Laboratory. Generally, the experimental setup consists of
test chamber, high voltage transformer, UVTRON
R2868 flame sensor, Picoscope and computer. The
UVTRON R2868 was used together with its driving
circuit manufactured by Hamamatsu Company. It
detected the ultraviolet radiation emitted during
discharge activities. The output of the sensor was
connected to computer via Picoscope. The signal data
were saved in Picoscope files before being transferred
into Microsoft Excel for further analysis.The insulator
samples used were glass and ceramic pin insulators that
were naturally aged while in service.
RESULTS AND DISCUSSION
Fig. 1 Ultraviolet signal for glass insulator
Fig. 2 Ultraviolet signal for ceramic insulator
CONCLUSIONS
Based on experimental results, correlation between
components of the ultraviolet signals and discharge
intensity levels under different insulator materials is
exists using the ultraviolet pulse detection method. This
proved that flame sensor is a potential tool in near future
when applying UV pulse method
REFERENCES
[1] A. A. Khan, A. Masood and E. Husain, “A Study of
Flashover Voltage of Artficially Polluted Porcelain
Disc Insulator under Natural Fog Conditions., 2008
International Conference on Condition Monitoring
and Diagnosis., Beijing, China., April 21-24, 2008
[2] D. A. Swift., “Insulators for Outdoor Application,”
Advance in High Voltage Engineering., pp. 257–
305, Jan. 2004.
[3] F. A. Nugraha, N. Harid, H. Griffiths, B. Barkat
and N. Alsayari, “Study of The AC Surface
Discharge Characteristics of Insulation Samples
using the UHF Method,” The 20th International
Symposium on High Voltage Engineering., Buenos
Aires, Argentina, August 27 – September 01, 2017.

Extended Abstract for 2020 PTeC and MyHVnet Colloquium A033
PAGE 48
OPTIMIZATION OF CORONA RING DESIGN FOR PORCELAIN
INSULATOR STRING
H.A. Illias1,*, Y.L. Liong1, H. Mokhlis1 and N.N. Mansor1 1Department of Electrical Engineering, Faculty of Engineering, University of Malaya, 50603 Kuala Lumpur, Malaysia.
*E-mail: [email protected]
Abstract – Design of optimum corona ring dimensions
on a porcelain insulator string was obtained in this work.
From the relationship between the corona ring
dimensions and the electric field magnitude, a non-linear
mathematical objective function was established. The
objective function was used in Imperialist Competitive
Algorithm (ICA) to obtain the optimum design of corona
ring on the insulator string. The results were compared
with Genetic Algorithm (GA) and Particles Swarm
Optimization (PSO).
Keywords – Insulators, Corona Ring, Optimization,
Finite element analysis
INTRODUCTION
Insulator strings support the high voltage conductor
and insulate the conductor from the ground. Due to the
high electric field between the conductor and air
surrounding the conductor, corona discharges can occur
and cause degradation of the insulator string. Installing a
corona ring on the insulator string can reduce the electric
field along the insulator string [1]. However, to reduce
the electric field significantly, an optimized design of
corona ring needs to be obtained.
METHODOLOGY
Figure 1 shows the model geometry of insulator
string with corona ring that was developed using finite
element analysis software [2]. The corona ring tube
radius, corona ring radius and the position of the corona
ring along the insulator string were varied by the
optimization methods, which include ICA, GA and PSO.
Optimization of corona ring design for porcelain insulator string using imperialist competitive algorithmLiong Yu Ling950905-06-5132, [email protected]
2019 IEEE Malaysia Final Year Project CompetitionInsert
your
picture
here
To design an optimum corona ring dimension for
porcelain insulator string using Imperialist Competitive
Algorithm (ICA)
To evaluate the electric field distribution on the insulator
string using various corona ring dimensions
To compare the results between using ICA and other
optimisation methods to validate the results
Objectives
Fig. 1 shows the model geometry of insulator string
with corona ring that was developed using finite
element analysis software.
The corona ring tube radius, corona ring radius and the
position of the corona ring along the insulator string
were varied by the optimization methods, which include
ICA, GA and PSO.
Fig. 1. Model geometry of insulator string with corona ring
Methodology
Fig. 2 shows the electric potential and field distribution on
the insulator string with corona ring geometry under 33kV
applied voltage.
Table 2 shows the corona ring dimensions and the electric
field magnitude on the insulator string obtained using
different optimization techniques.
Results
[1] H. Terrab, A. Kara, “Parameters design optimization of 230kV corona
ring based on electric field analysis and response surface
methodology,” Electric Power Systems Research, 163(B), pp. 782-
788, 2018.
[2] M. NageswaraRao, V.S.N.K. Chaitanya, R. Praveena Rani, “Electric
Field Analysis of Polymer Insulators for Various Geometrical
Configurations,” IEEE International Conference on Power, Control,
Signals and Instrumentation Engineering, pp. 1722-1727, 2017.
References
Table 2. Results obtained using different optimization techniques
Fig. 2. (a) Electric potential and (b) electric field distribution on the
model geometry
Design of optimum corona ring dimensions on aporcelain insulator string was obtained in this work.
From the relationship between the corona ringdimensions and the electric field magnitude, a non-linearmathematical objective function was established.
The objective function was used in ImperialistCompetitive Algorithm (ICA) to obtain the optimumdesign of corona ring on the insulator string.
The results were compared with Genetic Algorithm (GA)and Particles Swarm Optimization (PSO).
The electric field near the high voltage terminal of the
insulator string strongly depends on the corona ring
radius, tube radius and the position of the corona ring
along the insulator string.
ICA yields lower electric field magnitude on the insulator
string compared to PSO and GA.
Thus, using optimization methods, it can assist
manufacturers in designing optimum dimensions of
corona ring to reduce the electric field magnitude along
the insulator string surface.
Abstract
Insulator strings support the high voltage conductor and
insulate the conductor from the ground.
Due to the high electric field between the conductor and
air surrounding the conductor, corona discharges can
occur and cause degradation of the insulator string.
Installing a corona ring on the insulator string can
reduce the electric field along the insulator string.
However, to reduce the electric field significantly, an
optimized design of corona ring needs to be obtained.
Conclusions
Problem Statement
Optimization
method
Ring
radius
(m)
Tube
radius
(m)
Ring
position
(m)
Electric field
magnitude
(x104 V/m)
Unoptimized 0.29 0.018 0.20 4.05
ICA 0.33 0.013 0.48 3.20
GA 0.35 0.014 0.43 3.76
PSO 0.33 0.015 0.40 3.46
(a) (b)
Insulator string
(front view)
Corona ring
Porcelain
Cap
Pin255 mm
146 mm
Insulator string
(bottom view)
Figure 1: Project methodology
RESULTS AND DISCUSSION
Figure 2 shows the electric potential and field
distribution on the insulator string with corona ring
geometry under 33kV applied voltage. Table 2 shows the
corona ring dimensions and the electric field magnitude
on the insulator string obtained using different
optimization techniques.
(a) (b)
Figure 2. (a) Electric potential and (b) electric field
distribution on the model geometry
Table 1: Results obtained using different optimization
techniques
Optimization
method
Ring
radius
(m)
Tube
radius
(m)
Ring
position
(m)
Electric field
magnitude
(x104 V/m)
Unoptimized 0.29 0.018 0.20 4.05
ICA 0.33 0.013 0.48 3.20
GA 0.35 0.014 0.43 3.76
PSO 0.33 0.015 0.40 3.46
CONCLUSIONS
The electric field near the high voltage terminal of
the insulator string strongly depends on the corona ring
radius, tube radius and the position of the corona ring
along the insulator string. ICA yields lower electric field
magnitude on the insulator string compared to PSO and
GA. Thus, using optimization methods, it can assist
manufacturers in designing optimum dimensions of
corona ring to reduce the electric field magnitude along
the insulator string surface.
ACKNOWLEDGEMENTS
The authors thanked the Faculty of Engineering,
University of Malaya for supporting this work through
Faculty Research Grant (GPF077A-2018).
REFERENCES
[1] H. Terrab, A. Kara, “Parameters design optimization
of 230kV corona ring based on electric field analysis
and response surface methodology,” Electric Power
Systems Research, 163, pp. 782-788, 2018.
[2] M. NageswaraRao, V.S.N.K. Chaitanya, R.
Praveena Rani, “Electric Field Analysis of Polymer
Insulators for Various Geometrical Configurations,”
IEEE International Conference on Power, Control,
Signals and Instrumentation Engineering, pp. 1722-
1727, 2017.

Extended Abstract for 2020 PTeC and MyHVnet Colloquium A034
PAGE 49
MODELLING OF THREE-PHASE VOLTAGE SOURCE INVERTER (VSI)
FOR GRID-CONNECTED PHOTOVOLTAIC (PV) GENERATION SYSTEMS
M.H.Mohamed Hariri*, S. Masri, M.K. Mat Desa and M.A.A. Mohd Zainuri
School of Electrical & Electronic Engineering, Universiti Sains Malaysia, USM 14300 Nibong Tebal,
Penang, Malaysia.
*E-mail: [email protected]
Abstract – The photovoltaic (PV) system becomes a focal
interest nowadays as one of promising renewable energy
to be integrated with the utility grid. The voltage
magnitude, line frequency, phase angle as well as phase
sequence are vital synchronization parameters for
effective power-transfer mechanism between the PV
system and the grid. DC-DC boost converter incorporates
with three-phase inverter works as intermediate. Based on
the result, it clearly shows that the proposed system able
to achieve IEEE grid-code standards and requirements.
Keywords - Photovoltaic, Three-phase inverter,
Synchronization
INTRODUCTION
Recently, the photovoltaic (PV) systems play a significant
role as an alternative electrical supply source as well as an
integral part of the national grid generation [1]. The grid-
connected PV generation system poses some notable
challenges to researchers. The increasing penetrations
level of PV systems into the utility grid have risen several
potential problems relating to power quality together with
safety issues. Due to these concerns, IEEE standard 929-
2000 which intends for the utility interface of PV systems
becomes a reference source for energy producers in
integrating PV systems with the utility grid [2]. This paper
presents the modeling of the three-phase voltage source
inverter (VSI) for a grid-connected photovoltaic (PV)
generation system focusing solely on the level of total
harmonic distortion (THD) of the generated signal
waveforms.
METHODOLOGY
The proposed system consists of several PV modules,
DC-DC boost converter together with maximum power
tracking technique (MPPT), three-phase voltage-source
inverter (VSI), filtering system and the utility grid [3]. The
components configuration is illustrated in Figure 1.
PV
MPPT Controller Voltage & Current Controller
+
-
+
-
PV Module 3Ø InverterDC - DC
Converter AC Utility
Grid
VPV VDCVAC
IPVVPV ∆D VDCref PWM Iabc
IPV
C
Vabc
Iinject
Coupling
Transformer
Figure 1: Three-phase grid-connected PV generation systems.
A PV module is made up of multiple connections of
PV cells in series and parallel configurations. By referring
to equation (1), the magnitude of DC-DC Boost
converter’s output voltage can be calculated as follows,
𝑉𝑂 =𝑉𝐼
1 − 𝐷 (1)
where 𝑉𝑂 , 𝑉𝐼 and 𝐷 are DC-DC boost input voltage,
output voltage and value of duty cycle respectively [4].
Meanwhile, the RMS line voltage of the three-phase
inverter is given by equation (2),
𝑉𝐿 = 𝑚√3
2√2𝑉𝑂 (2)
where 𝑚 is the modulation index and 𝑉𝐿 is the RMS
value of line voltage for three-phase voltage source
inverter (VSI). The introduction of a step-up coupling
transformer in a grid-connected PV generation system is
to power-up the line voltage level according to grid
standard and also to works as galvanic isolation between
the PV system and the utility grid [5]. Equation (3) shows
the relationship between the primary, 𝑉𝑃 and secondary,
𝑉𝑆 voltage windings of the three-phase wye-delta (𝑌 − ∆)
coupling transformer [6].
𝑉𝑃
𝑉𝑆=
1
√3 (3)
RESULTS AND DISCUSSION
Based on the calculated value as in the previous
section, the simulation of the designed models is carried
out in Matlab/Simulink environments version R2014a. In
this model, sinusoidal pulse width modulation (SPWM) is
implemented as modulation control technique for the
three-phase VSI. The detailed specifications and list of
parameters of the proposed model are given in Table 1.
Table 1: List of Parameters
Parameter Value
Input PV Supply, 𝑉𝑖 𝑑𝑐 180𝑉𝑑𝑐
Switching frequency, 𝑓𝑠 10𝑘𝐻𝑧
Coupling Transformer 240𝑉𝐿𝐿/415𝑉𝐿𝐿
Passive Filter 𝐿 = 90𝑚𝐻 & 𝐶 = 14𝑢𝐹
Line Voltage, 𝑉𝐿 415𝑉𝐿𝐿
Line Frequency, 𝑓𝐿 50𝐻𝑧
The simulation result shown in Fig. 2 is the three-

Extended Abstract for 2020 PTeC and MyHVnet Colloquium A034
PAGE 50
phase line voltage waveform of the VSI inverter. The
voltage waveforms are purely sinusoidal, separated by
120o degree between each phase. The RMS value each of
the line voltage waveform is 415V and the operating line
frequency is 50Hz. One of the main criteria for grid
synchronization is to have low total harmonic distortion
(THD) both for voltage and current waveforms.
Fig. 2 Line voltage waveform of the three-phase VSI.
As displayed in Fig. 3 and Fig. 4 respectively, the total
harmonic distortion (THD) for line voltage waveform is
around 0.48% whereas the total harmonic distortion
(THD) for line current waveform is approximately 0.49%
which is less than 5% of the fundamental frequency at the
rated inverter output as required by IEEE Std 929-2000. It
clearly proved that the proposed system able to achieve
the IEEE grid-code standards and requirements.
Fig. 3 THD for line voltage waveform.
Fig. 4 THD for line current waveform.
CONCLUSIONS
Based on the result, it clearly shows that the proposed
model system is able to generate a symmetrical three-
phase ac line voltage of 415V with 50Hz operating line
frequency. In addition, the total harmonic distortion
(THD) for both voltage and current waveforms has
complied with the IEEE standards which is less than 5%
of the fundamental frequency at the rated inverter output.
Therefore, the proposed model system is well-suited for a
grid-connected PV generation system.
ACKNOWLEDGEMENTS
The authors wish to thank Research University Grant
(RUI) –RCMO Universiti Sains Malaysia, (USM) with
No. Account: 1001/PELECT/8014028 for providing
financial support as well as computational facilities to
carry out this research at the School of Electrical &
Electronic Engineering USM.
REFERENCES
[1] World Energy Outlook 2018: “The Future is
Electrifying,” 2018.
[2] IEEE Recommended Practice for Utility Interface of
Photovoltaic (PV) Systems, vol. 2000, p. 32, 2000.
[3] M.H. Rashid, Power Electronics: Circuits, Devices,
and Applications, Third Edit. Pearson Prentice Hall,
2004.
[4] B.M. Hasaneen and A.A.E. Mohammed, “Design and
Simulation of DC-DC Boost converter,” Power
System Conference Middle East, pp. 335-340, 2008.
[5] D. J. Sundar and M. S. Kumaran, “Common-mode
behavior in grid-connected DC and AC decoupled PV
Inverter topologies,” Arch. Electr. Eng., vol. 65, no.
3, pp. 481–493, 2016.
[6] M. Shayestegan, “Overview of grid-connected two-
stage transformer-less inverter design,” J. Mod.
Power Syst. Clean Energy, vol. 6, no. 4, pp. 642–655,
2018.

Extended Abstract for 2020 PTeC and MyHVnet Colloquium A035
PAGE 51
OPTIMAL PLACEMENT OF PMU FOR COMPLETE OBSERVABILITY OF
POWER SYSTEM CONSIDERING ZERO INJECTION AND ISLANDING
CONDITION
Vidhya Sagar Devendran1*, Jasronita Jasni1, Mohd Amran Mohd Radzi1, Norhafiz Azis1,2
1Advanced Lightning and Power Energy Research (ALPER), 2 Institute of Advanced Technology (ITMA),
Department of Electrical and Electronics Engineering, Faculty of Engineering,
Universiti Putra Malaysia, Serdang, Selangor, Malaysia.
*Email: [email protected]
Abstract: This paper presents the methodology for
Optimal Placement of Phasor measurement unit (OPP)
using Binary Linear Integer Programming (BLIP) with
binary decision variables (0, 1) for minimizing the cost of
installation to provide complete observability of the
power system under normal and islanding condition. In
this paper, the placement of PMU is realized with several
cases namely conventional flow measurement, with zero
injection and without zero injection. The best optimal
location is one, a bus with maximum BOI, SORI and
redundancy index. The results obtained using MATLAB
have shown, the proffered method of PMU placement is
fast and more accurate with excellent computational
efficiency.
Keywords: Binary Linear Integer Programming (BLIP),
Optimal Placement of PMU, Bus Observability Index
(BOI).
INTRODUCTION
A Phasor Measurement Unit (PMU) is a most
important power system tool which measures the time
synchronized voltage and current phasor using a common
synchronizing signal from global positioning system
(GPS)[1]. Placing of PMU at every bus of a power system
results in complete observability of the system but it
increases the cost of installation. To overcome this
problem, optimal placement of PMU (OPP) in a power
grid gives the optimal cost of installation by reducing the
number PMU in the grid [2]. The PMU prompted the
utilities to locate the fault in system [2], state estimation
[3] and system observability [4,5,6]. The binary integer
linear programming approach was applied for placement
and which uses the conventional flow measurement
method [7]. In this paper the optimal placement of PMU
is done using BLIP considering the cases of conventional
power flow measurement, zero injection and islanding.
The optimal placement of PMU by ranking the solution
obtained using redundancy of the system.
BINARY LINEAR INTEGER PROGRAMMING
(BLIP)
Binary Integer Linear Programming (BILP) is an
optimization approach, in which all the variables are
either 0 or 1. In power system network, the variable xij is
representing the connection between any two buses (i and
j are buses) and it is given in Eq. (1) as below,
xij = 1, if i = j1, if i and j are connected0, otherwise.
(1)
Considering the above assumptions, the objective
function for placement of PMU in the power system
network using binary decision variable and is
represented using Eq. (2)
N
K
KX1
min
(2)
where
Subject to:
pmuKpmu bXT (3)
Where,
𝑇𝑝𝑚𝑢 = 1 if PMU is placed at the bus 0 otherwise
bpmu =
[ 111⋮1]
NX1
SOLUTION METHODS
The presented method of BILP is tested in IEEE 7 bus,
9 bus, 14bus and 30 bus system using Matlab software
One of the test case system (IEEE-14 bus system) is
analysed for various cases such as with and without
conventional measurement, with and without zero
injection for better clarity. The single diagram of IEEE -
14 bus system is shown in Fig.1
Figure.1 IEEE 14 Bus System
RESULTS AND DISCUSSIONS
In this paper binary integer programming has been
used to solve the OPP problem. The Results for all the test
systems with and without zero injections are shown in
Table 1.
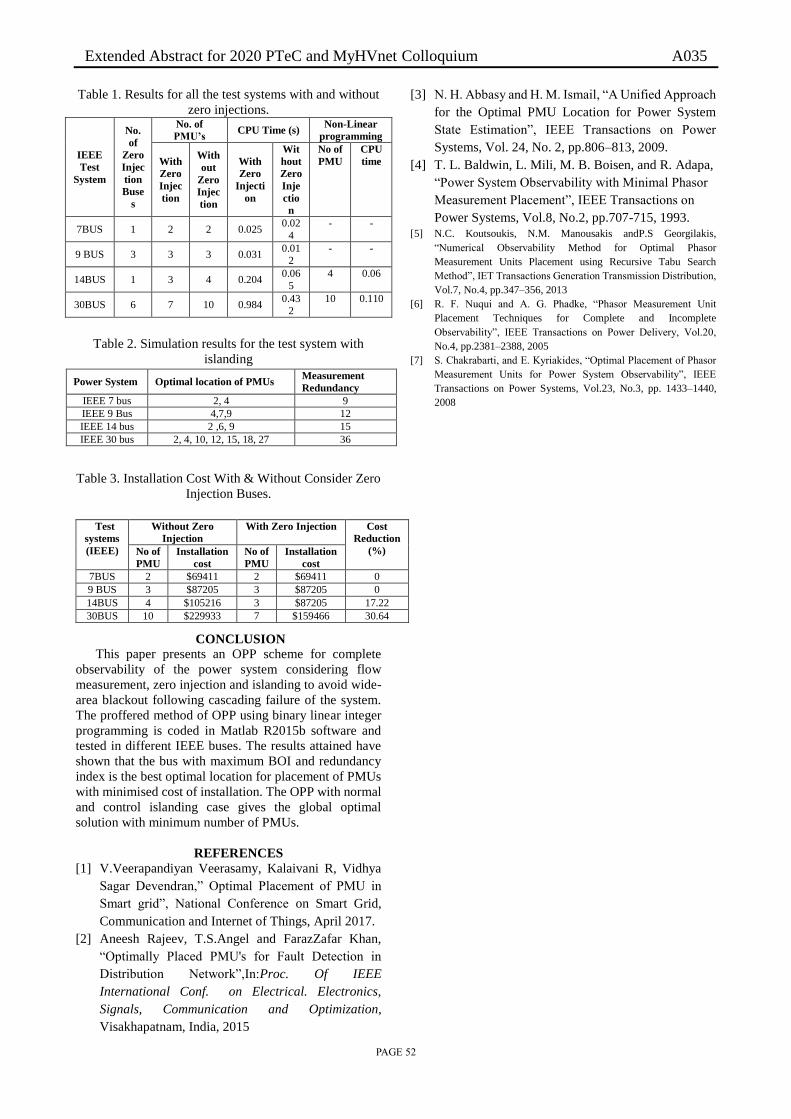
Extended Abstract for 2020 PTeC and MyHVnet Colloquium A035
PAGE 52
Table 1. Results for all the test systems with and without
zero injections.
IEEE
Test
System
No.
of
Zero
Injec
tion
Buse
s
No. of
PMU’s CPU Time (s)
Non-Linear
programming
With
Zero
Injec
tion
With
out
Zero
Injec
tion
With
Zero
Injecti
on
Wit
hout
Zero
Inje
ctio
n
No of
PMU
CPU
time
7BUS 1 2 2 0.025 0.02
4
- -
9 BUS 3 3 3 0.031 0.01
2 - -
14BUS 1 3 4 0.204 0.06
5
4 0.06
30BUS 6 7 10 0.984 0.43
2
10 0.110
Table 2. Simulation results for the test system with
islanding
Table 3. Installation Cost With & Without Consider Zero
Injection Buses.
CONCLUSION
This paper presents an OPP scheme for complete
observability of the power system considering flow
measurement, zero injection and islanding to avoid wide-
area blackout following cascading failure of the system.
The proffered method of OPP using binary linear integer
programming is coded in Matlab R2015b software and
tested in different IEEE buses. The results attained have
shown that the bus with maximum BOI and redundancy
index is the best optimal location for placement of PMUs
with minimised cost of installation. The OPP with normal
and control islanding case gives the global optimal
solution with minimum number of PMUs.
REFERENCES
[1] V.Veerapandiyan Veerasamy, Kalaivani R, Vidhya
Sagar Devendran,” Optimal Placement of PMU in
Smart grid”, National Conference on Smart Grid,
Communication and Internet of Things, April 2017.
[2] Aneesh Rajeev, T.S.Angel and FarazZafar Khan,
“Optimally Placed PMU's for Fault Detection in
Distribution Network”,In:Proc. Of IEEE
International Conf. on Electrical. Electronics,
Signals, Communication and Optimization,
Visakhapatnam, India, 2015
[3] N. H. Abbasy and H. M. Ismail, “A Unified Approach
for the Optimal PMU Location for Power System
State Estimation”, IEEE Transactions on Power
Systems, Vol. 24, No. 2, pp.806–813, 2009.
[4] T. L. Baldwin, L. Mili, M. B. Boisen, and R. Adapa,
“Power System Observability with Minimal Phasor
Measurement Placement”, IEEE Transactions on
Power Systems, Vol.8, No.2, pp.707-715, 1993.
[5] N.C. Koutsoukis, N.M. Manousakis andP.S Georgilakis,
“Numerical Observability Method for Optimal Phasor
Measurement Units Placement using Recursive Tabu Search
Method”, IET Transactions Generation Transmission Distribution,
Vol.7, No.4, pp.347–356, 2013
[6] R. F. Nuqui and A. G. Phadke, “Phasor Measurement Unit
Placement Techniques for Complete and Incomplete
Observability”, IEEE Transactions on Power Delivery, Vol.20,
No.4, pp.2381–2388, 2005
[7] S. Chakrabarti, and E. Kyriakides, “Optimal Placement of Phasor
Measurement Units for Power System Observability”, IEEE
Transactions on Power Systems, Vol.23, No.3, pp. 1433–1440,
2008
Power System Optimal location of PMUs Measurement
Redundancy
IEEE 7 bus 2, 4 9
IEEE 9 Bus 4,7,9 12
IEEE 14 bus 2 ,6, 9 15
IEEE 30 bus 2, 4, 10, 12, 15, 18, 27 36
Test
systems
(IEEE)
Without Zero
Injection
With Zero Injection Cost
Reduction
(%) No of
PMU
Installation
cost
No of
PMU
Installation
cost
7BUS 2 $69411 2 $69411 0
9 BUS 3 $87205 3 $87205 0
14BUS 4 $105216 3 $87205 17.22
30BUS 10 $229933 7 $159466 30.64

Extended Abstract for 2020 PTeC and MyHVnet Colloquium A036
PAGE 53
IMPROVEMENT OF WIND TURBINE LIGHTNING RECEPTOR Samer S. S. Wahdain and A. I. Mohamed
Faculty of Electrical and Electronic Engineering, University Malaysia Pahang, Pekan Pahang
E-mail: [email protected]
Abstract – This project focuses on the study of
lightning protection theory, knowledge and basis.
Knowledge of cloud to ground lightning, lightning
protection system (LPS), electric field relation, receptors
configuration are elaborated. This project is aimed to
study the practical parameters of LPS, including the
relation between receptor size and electric field strength.
Other than that, this project aimed to test three different
diameters of receptors 0.2m, 0.5m and 0.8m with
different needles numbers and lengths. This paper is
aimed to develop a new shape of wind turbine receptors
with different needles number and length also to suggest
the parameters for receptor diameter and needles. Finite
Element Method (FEM) has used for this research, the
proper dimensions and shapes of receptors simulated by
suggesting the minimum and maximum electric field that
accumulates around receptors.
Keywords – Lightning Protection System (LPS),
Electrical Field, Receptors.
INTRODUCTION
Wind energy (or wind power) refers to the process of
creating electricity using the wind or air flows that occur
naturally in the earth’s atmosphere. Modern wind
turbines are used to capture kinetic energy from the wind
and generate electricity. Wind turbines rotate with 12mph
speed and face strong wind and lightning [1]. Wind
turbines can be exposed to the effects of lightning strikes
due to their height and plain location such as their typical
installation in mountains, off-shores and some other
places. Therefore, these locations are more vulnerable to
lightning [2].
Receptors varies as a major role in distributing
voltage on wind turbine blades by different configuration.
These receptors are connected to the ground (e.g. high
voltage cables), which are installed in the blade through
the hole onside blade sandwich directly to the earthing
system. The latest studies have shown that the blades are
still not protected, although there is a lightning receptor
installed on both sides of the blade [3,4].
METHODOLOGY
Table 1: receptors parameters
This paper is evaluating the protection device shape and
size to obtain the lightning strike methodology and the
performance of receptors. Moreover, the fabrication of
LPS using selected shape and size. The receptors with
sharp needles are developed by different configurations
that made on three receptor diameters 0.2m, 0.5m and
0.8m. These improvements took place in the number and
length of needles shown in Table 1.
RESULTS AND DISCUSSION
The result of wind turbine lighting effect following the
methodology stated. After computing different
configurations of receptors, 0.2m receptor diameter with
32 number and 0.3m length of needle as shown in Figure
1. It can be observed that the electrical field strength
around the receptor needles is high with the shortest
needle length (0.3m) whereas the other two-length 0.5m
and 0.9m have the lower field strength are plotted in
Figure 2.
Figure 1: Electrical field simulation for 32 needles
Figure 2: Electrical field plot graph for 32 needles
CONCLUSIONS
In conclusion, results show that receptor with 0.2m
diameter provides higher protection efficiency than other
sizes. Therefore is recommended for efficient lightning
protection of modern wind turbines.
In 0.2m receptor diameter, the comparison between the
numbers and length of needles presents that 32 number
of needles and 0.3m length of needle can attract a higher
electrical field than others.
ACKNOWLEDGEMENTS
First, I wish to express my gratitude to my project
supervisor, Dr. Amir Izzani bin Mohamed. I also wish to
thank my parents, wife and siblings.
REFERENCES [1] T. S. Sorensen et al., “the Update of Iec 61400-24 Lightning
Protection of Wind Turbines,” 29th Int. Conf. Light. Prot., no. June, pp. 1–16, 2008.
[2] H. Bagherian and H. Kazemi Karegar, “Effects of location, size
and number of wind turbine receptors on blade lightning protection by voltage distribution analysis,” APAP 2011 - Proc. 2011 Int.
Conf. Adv. Power Syst. Autom. Prot., vol. 2, pp. 1343–1348, 2011.
[3] G. I. Ikhazuangbe, K. M. Begam, C. Gomes, and A. Shanmugam, “Receptor sizes and its effect on lightning protection of modern
wind turbines,” J. Green Eng., vol. 7, no. 3, pp. 401–420, 2017. [4] Y. Wang and W. Hu, “Investigation of the Effects of Receptors on
the Lightning Strike Protection of Wind Turbine Blades,” IEEE
Trans. Electromagn. Compat., vol. 59, no. 4, pp. 1180–1187, 2017.

Extended Abstract for 2020 PTeC and MyHVnet Colloquium A037
PAGE 54
CLASSIFICATION OF CABLE JOINT DEFECTS USING OPTIMIZED
ARTIFICIAL INTELLIGENCE
H.A. Illias1,*, Z.Y. Ong1, H. Mokhlis1 and N.N. Mansor1 1Department of Electrical Engineering, Faculty of Engineering, University of Malaya, 50603 Kuala Lumpur, Malaysia.
*E-mail: [email protected]
Abstract – In this work, classification of cable joint
defect types based on partial discharge (PD) data using
optimized artificial intelligence was performed. After
denoising the PD signals, feature extractions were
performed from the signals. The artificial intelligence
(AI) techniques used to classify the cable joint defect
types include artificial neural network (ANN), support
vector machine. (SVM) and adaptive neuro-fuzzy
inference system (ANFIS). The performance of each AI
performance was optimized using certain optimization
techniques.
Keywords – Partial discharge, Cable joint, Artificial
intelligence, Optimization
INTRODUCTION
In power cable joints, defect types can be recognized
by PD measurement data because each PD type has its
own unique characteristics. The existing technique to
identify defect types is based on personnel experience.
This can result in variation of the outcomes between
different personnel. Hence, it is useful to develop a
method or tool that can automatically classify the type of
defect within power cable joint with high accuracy. Also,
it can minimize the time and cost of repair, maintenance
and diagnosis.
METHODOLOGY
The methodology of the work is shown in Figure 1.
First, PD measurement was performed on four power
cable joints with different defect types. The PD signals
were denoised using discrete wavelet transformer (DWT)
and wavelet packet transform (WPT). Feature extractions
based on the signal parameters were performed from the
denoised signals. The data were used to train and test
ANN, SVM and ANFIS combined with optimization
techniques, which are imperialist competitive algorithm
(ICA), particle swarm optimization (PSO) and genetic
algorithm (GA).
Classification of cable joint defects based on partial discharge data using optimized artificial intelligenceOng Zhen Yu 950425-06-5141, [email protected]
2019 IEEE Malaysia Final Year Project CompetitionInsert
your
picture
here
In this work, classification of cable joint defect types
based on partial discharge (PD) data using optimized
artificial intelligence was performed.
After denoising the PD signals, feature extractions were
performed from the signals.
The artificial intelligence (AI) techniques used to classify
the cable joint defect types include artificial neural
network (ANN), support vector machine. (SVM) and
adaptive neuro-fuzzy inference system (ANFIS).
The performance of each AI performance was optimized
using certain optimization techniques.
Abstract
To perform measurement of PD in power cable joints with
different defect types
To classify defect types in power cable joints using
artificial intelligence combined with optimization
techniques
To identify the most suitable technique for classification of
defect types in power cable joints
Objectives
In power cable joints, defect types can be recognized byPD measurement data because each PD type has its ownunique characteristics.
The existing technique to identify defect types is based onpersonnel experience. This can result in variation of theoutcomes between different personnel.
Hence, it is useful to develop a method or tool that canautomatically classify the type of defect within powercable joint with high accuracy. Also, it can minimize thetime and cost of repair, maintenance and diagnosis.
Problem Statement
The methodology of the work is shown in Fig. 1. First, PD
measurement was performed on four power cable joints
with different defect types.
The PD signals were denoised using discrete wavelet
transformer (DWT) and wavelet packet transform (WPT).
Feature extractions based on the signal parameters were
performed from the denoised signals.
The data were used to train and test ANN, SVM and
ANFIS combined with optimization techniques, which are
imperialist competitive algorithm (ICA), particle swarm
optimization (PSO) and genetic algorithm (GA).
Methodology
Fig. 1. Project methodology
PD measurement on power
cable joints with defects
Optimize AI using ICA, PSO, GA
Classify
defect types
The phase resolved partial discharge (PRPD) patterns
obtained from the PD measurement are shown in Fig. 2.
The classification accuracy of every method that was
tested is shown in Table 1.
Results
When the performance of SVM, ANN and ANFIS is
optimized, the classification accuracy becomes higher than
the unoptimized classifiers.
SVM combined with ICA achieved higher classification
accuracy compared to ANN and ANFIS.
Thus, it can be recommended to industries that defect
classification in underground power cable joints can be
performed by hybrid artificial intelligence-optimization
algorithm.
Conclusions
TechniqueAccuracy
(%)
DWT-ANN 77.67
DWT-ANN-ICA 87.33
DWT-SVM 77.67
DWT-SVM-ICA 98.67
DWT-ANFIS 76.00
DWT-ANFIS-ICA 82.00
WPT-ANN 87.33
WPT-ANN-ICA 96.67
Table 1. Classification accuracy of the tested methods
TechniqueAccuracy
(%)
WPT-SVM 87.33
WPT-SVM-ICA 96.67
WPT-ANFIS 76.00
WPT-ANFIS-ICA 82.67
SVM-PCA [1] 85.00
ANN-PCA [1] 85.00
SVM with RBF [2] 94.05
ENN-fractal [3] 97.80
[1] J.K. Wong, H.A. Illias, A.H.A. Bakar, "A Novel High Noise Tolerance
Feature," IEEE Transactions on Dielectrics and Electrical Insulation,
24(1), pp. 66-74, 2017.
[2] H. Yang, O. Zong-Ying, G. Hao, "A Method of Fingerprint Identification
based on Space Invariant Transforms and Support Vector Machines,"
Inter. Conf. Machine Learning Cybernetics, pp. 1322-1327, 2003.
[3] H. C. Chen, F. C. Gu, & W. H. Wang, “A novel extension neural
network based partial discharge pattern recognition method for high-
voltage power apparatus.” Expert Systems with Applications, 39(3),
3423-3431, 2012.
References
Fig. 2. PRPD patterns for defects of (a) metal particle on XLPE, (b)
semiconductor layer air gap, (c) insulation incision and (d) axial
direction shift
Denoise PD
signals
Train and test ANN,
SVM, ANFIS
Feature
extraction
(a) (b)
(c) (d)
Figure 1: Project methodology
RESULTS AND DISCUSSION
The classification accuracy of every method that was
tested is shown in Table 1. From this table, it can be seen
that the classification accuracy is the highest for DWT-
SVM-ICA (98.67%) compared to the other methods that
have been tested in this work.
Table 1: Classification accuracy of the tested methods
Technique Accuracy (%)
DWT-ANN 77.67
DWT-ANN-ICA 87.33
DWT-SVM 77.67
DWT-SVM-ICA 98.67
DWT-ANFIS 76.00
DWT-ANFIS-ICA 82.00
WPT-ANN 87.33
WPT-ANN-ICA 96.67
WPT-SVM 87.33
WPT-SVM-ICA 96.67
WPT-ANFIS 76.00
WPT-ANFIS-ICA 82.67
SVM-PCA [1] 85.00
ANN-PCA [1] 85.00
SVM with RBF [2] 94.05
ENN-fractal [3] 97.80
CONCLUSIONS
When the performance of SVM, ANN and ANFIS is
optimized, the classification accuracy becomes higher
than the unoptimized classifiers. SVM combined with
ICA achieved higher classification accuracy compared to
ANN and ANFIS. Thus, it can be recommended to
industries that defect classification in underground power
cable joints can be performed by hybrid artificial
intelligence-optimization algorithm.
ACKNOWLEDGEMENTS
The authors thanked the Faculty of Engineering,
University of Malaya for supporting this work through
Faculty Research Grant (GPF077A-2018).
REFERENCES
[1] J.K. Wong, H.A. Illias, A.H.A. Bakar, "A Novel
High Noise Tolerance Feature," IEEE Transactions
on Dielectrics and Electrical Insulation, 24(1), pp.
66-74, 2017.
[2] H. Yang, O. Zong-Ying, G. Hao, "A Method of
Fingerprint Identification based on Space Invariant
Transforms and Support Vector Machines," Inter.
Conf. Machine Learning Cybernetics, pp. 1322-
1327, 2003.
[3] H. C. Chen, F. C. Gu, & W. H. Wang, “A novel
extension neural network based partial discharge
pattern recognition method for high voltage power
apparatus.” Expert Systems with Applications,
39(3), 3423-3431, 2012.

P A G E 5 5 I S S N 2 4 6 2 - 1 9 9 4
Copyright of contents in MyHVnet Newsletter belongs exclusively to Malaysian High Voltage Network and the Institute of High Voltage and High Current. The copyright covers the rights to reproduce the newsletter, including reprints, electronic reproductions or any other reproductions of similar nature.

P A G E 5 6 MyHVnet Newsletter ISSUE 5 JANUARY 2020
MyHVnet Newsletter is an annual newsletter published
by the Institute of High Voltage and High Current
(IVAT), Universiti Teknologi Malaysia (UTM) and Malaysi-
an High Voltage Network (MyHVnet), with ISSN no.
2462-1994. The newsletter is an initiative by IVAT and
MyHVnet for the dissemination of high voltage related
news, with particular emphasis on MyHVnet’s activities.
The newsletter aims to comprehend the objectives of
MyHVnet, i.e., to serve as a platform for the discussion
of high voltage related research and development among
member organisations; to raise the awareness of the
research and development capabilities of member organi-
sations to high voltage related industries; and to lobby
for high voltage related research funding.
Published by:
Malaysian High Voltage Network (MyHVnet)
and
Institute of High Voltage and High Current (IVAT)
Block P06
Universiti Teknologi Malaysia (UTM)
81310 Johor Bahru, Johor
Malaysia
Phone: +60 7 553 5615
Fax: +60 7 557 8150
E-mail: [email protected]
Website: ivat.utm.my/myhvnet
About MyHVnet ing has been looked into. This leads to the idea of the
establishment of Malaysian High Voltage Network
(MyHVnet) in 2014. MyHVnet will hopefully serve as a
“one-stop” platform for members from various organisa-
tions (universities and industries) across Malaysia for the
effective communication of high voltage related research
and development.
The main objectives of the establishment of MyHVnet
are:
i) To serve as a platform for the discussion of high
voltage related research and development among mem-
ber organisations.
ii) To raise the awareness of the research and develop-
ment capabilities of member organisations to high voltage
related industries.
High voltage research and development activities continue
to prosper in Malaysia due to rapid urbanisation across the
country. Each year, an enormous amount of expenditure is
allocated for the development of high voltage infrastructure
and its relevant expertise to ensure its sustainability. This
indirectly leads to an increasing number of players, both at
the university and industry levels. While this certainly brings
positive impact to the field of high voltage engineering, it can,
sometimes, be difficult for interested parties to approach the
right experts in a specific high voltage related area, e.g., light-
ning protection, condition monitoring and diagnosis, and in-
sulation design. Consequently, more effective research and
development activities related to high voltage engineering
may have been hindered.
To address the above issue, the possibility of setting up an
informal networking group relevant to high voltage engineer-
Photo session during 2019 MyHVnet’s Annual General Meeting.
Copyright of contents in MyHVnet Newsletter belongs exclusively to Malaysian High Voltage Network and the Institute of High Voltage and High Current. The copyright covers the rights to reproduce the newsletter, including reprints, electronic reproductions or any other reproductions of similar nature.