
MY IIP REPORT
76
1.PROFILE OF THE COMPANY 1.1 Corporate History: SNEHA CONSULTANCY SERVICES is a firm set-up in the year 2001 by retired officers of ANDHRA BANK with considerable service in credit department. Sneha Consultancy Services is presently engaged in providing support services in the area of project appraisal, financial analysis and viability study of the projects that approach banks for financial assistance which include term loans and working capital limits. The firm is engaged in preparation of Bank credit appraisal of various borrowers. The firm prepares project report consisting of project details and financials of various borrowers according to their credit requirements. The project report would be prepared in such a way that it helps the banks for preparation of appraisal of credit requirements of their borrower very easily in their structured formats. 1.2 Vision and Mission: There is no Vision and Mission for this organization. This organization is listed in “Financial Planning Personal” page. 1.3 Products and Services offered by company: 1. Company engaged in project appraisal & Techno Economic Viability Study (TEV) of Industrial Manufacturing units, assessment of finance requirement and capacity to service 1
Transcript of MY IIP REPORT

1.PROFILE OF THE COMPANY1.1 Corporate History:
SNEHA CONSULTANCY SERVICES is a firm set-up in the year
2001 by retired officers of ANDHRA BANK with considerable
service in credit department. Sneha Consultancy Services is
presently engaged in providing support services in the area of
project appraisal, financial analysis and viability study of the
projects that approach banks for financial assistance which
include term loans and working capital limits. The firm is
engaged in preparation of Bank credit appraisal of various
borrowers. The firm prepares project report consisting of project
details and financials of various borrowers according to their
credit requirements. The project report would be prepared in such
a way that it helps the banks for preparation of appraisal of
credit requirements of their borrower very easily in their
structured formats.
1.2 Vision and Mission:
There is no Vision and Mission for this organization.
This organization is listed in “Financial Planning Personal”
page.
1.3 Products and Services offered by company:
1. Company engaged in project appraisal & Techno Economic
Viability Study (TEV) of Industrial Manufacturing units,
assessment of finance requirement and capacity to service
1

debt, market study/research, assessment of potential
viability in sick units and their rehabilitation.
2. Preparation of Detailed Project Reports: Company prepares
detailed project reports for some of the following
industries. The report covers EIC Analysis for the specific
unit - Economic environment, Industry analysis and company
analysis. EIC analysis encompasses macro-economic factors of
the economy and how these factors influence industry in
particular. Then covers the particular activity and provides
SWOT analysis of the company; financial analysis covering
the justification of the project cost and capex requirement;
and does thorough check of the capital expenditure
requirement and evaluate the cost of project. Profitability
analysis; DSCR; IRR; Cost Benefit Analysis; and Sensitivity
Analysis.
3. Company prepares loan applications along with financial
statements for customers of various banks which include both
public sector and private sector banks.
4. CDR Proposals: Company worked on corporate debt
restructuring proposal of many units for customers of
different banks.
1.4 About Company:
The prime activity of Sneha Consultancy Services is preparation
of project reports, financial appraisals and viability studies
for financial analysis for customers of various Banks.
2

The areas include:
Automobile Ancillary Industry
Agriculture & Related Industries
Horticulture
Poultry
Hatcheries Broilers Layers Poultry Feed
manufacturing Warehouses(Rural Godowns)
Sheep units
Dairy
Farming Milk chilling plants
Cold storages
Integrated Rice Mills
Ginning Mills
Godowns (Rural)
Granite Industry
Hospitality Industry
Star Hotels Bar Restaurants Resorts
Healthcare – Multi -Specialty Hospitals
Educational Institutions
Engineering Colleges Medical Colleges
Fertilizer & Pesticide units
Foundry units
Infrastructure
Civil&Electrical Contractors
BOT operators Manufacturing industry
Pharmaceutical units
Bulk Drugs Formulations 100% EOUs
Power Plants
Solar Power units Thermal units Bio Diesel units Hydro power units Wind Mills
Readymade Garment units
Retail Trade
Textile Units
Quarry units
The client base covers very big ticket loan facilities. Some of
the focused areas are Hospitality, Shopping Malls, Poultry Farms&
3

Hatcheries, Plastic Industries, and Power Generation Units up to
20 MW, Solvent Extraction Plants, Steel Mills, Rice Mills, Real
estate development and plantation advances. The core team
consists of three people who have more than two decades of rich
experience in the Credit Management in Banking Industry.
1.5 Infrastructure:
Office is located at RTC Cross Roads - Hyderabad, is fully
furnished in a spacious office with 6 work stations and 24x7
power supply. Wi-Fi facility is also available at office.
1.6 Customers: Customers of Sneha Consultancy services are all the typesof business firm members who approaches the various banks forsecuring loan applications along with financial statements.
1.7 Competition: Competitive company for the products and servicesprovided by Sneha Consultancy services is Zubeda consultancyservices.
1.8 SWOT analysis of the company: Strengths:
14 years of experience
Listed in “Financial Planning Personnel” page
Helps Banks in preparation of proposal forms
Preparation of many proposals than any other consultancy
does
Preparation of a proposal of any business firm.
4

Weakness:
More Competition
Less Infrastructure
Few Consultants
Opportunities:
Business expansion
Significant Opportunity in platform segment
Threats:
Increase the workforce
Emerging Technology
1.9 Organizational structure:
Sneha Consultancy is a partnership firm. It consists of total
6members i.e., 3 employees, 2 partners and supporting staff.
Managing Director is Mr.M.Venkateswarlu
Mr. T.Krishna Prasad and Mr. M.Venkateshwarlu are Partners
Mr. K.Seethapathi is supporting consultant with more than
two decades experience in credit and FOREX in Andhra Bank.
Mr. A. Ramakrishna Rao is Company Secretary with MBA and is
a support consultant.
Mr. Harinarayana Sharma and ,Mr. P.Venkat Rao are the
employees
5

Key Persons Profile:
Mr. M. Venkateswarlu (B. Tech, MBA; CAIIB; PGDCMP)
Mr. Venkateswarlu is an engineer by profession. After spending 7
years in the telecom industry he moved to Banking Industry in the
year 1980 as Technical Officer and worked in key positions in
Credit Department of Andhra Bank Central Office for 20 years. He
handled big ticket Loan accounts during his stay in Andhra Bank.
He worked as Manger in two very large branches and handled big
ticket loan accounts. He took VRS in the year 2001 March and
started Consultancy Services along with his colleagues. He is
providing consultancy services in the areas of credit management,
financial services and Project finance and Restructuring of
loans.
Mr. T. Krishna Prasad (M.Com; CAIIB)
Mr. Krishna Prasad joined Andhra Bank as Probationary Officer in
the Year 1978. Having worked as manager in many branches for
about 22 years, he took VRS in the year 2001 January and started
consultancy services along with his other senior colleagues. He
is providing consultancy services in the areas of Credit
management and general management.
Mr. K. Seethapathi (MSc, CAIIB; CTM)
Mr. Seethapathi joined the Andhra Bank in the year 1976 and
worked till 1998. He worked at International Division Bombay as
6

Forex Dealer and also manager, was exposed to foreign exchange
management including credit management of export & import
accounts. He also worked in Export Import Credit Department in
the Head office of Andhra Bank and handled very big ticket loan
accounts. Having been exposed to ALM in the Banks he moved to
Academics and contributed to research related work in Credit
Management, Foreign Exchange Management and Risk management in a
leading Academic Institute at Hyderabad. He is extending
consultancy services in the area of Foreign Exchange, Credit
Management and Risk management.
Sri N.Harinarayana Sarma
Sri N.Harinarayana Sarma who worked in Andhra Bank for more than
two and a half decades and held different positions including
Managerial -provide support services in credit appraisal and
reports preparation and Mr. A. Ramakrishna Rao, a qualified
Company Secretary who had worked in the industry for more than
two decades provide support services related to company law and
statutory compliance for our detailed project reports
respectively.
Mr. P.Venkat Rao
Mr. P.Venkat Rao who worked in the industry provides support
services in credit analysis and report preparation. Mr. N.
Harinarayana Sarma and Mr. Venkat Rao who has rich experience in
the areas of credit and analysis provide support services for
various analytical assignments.
7

Mr. A Ramakrishna Rao (M.Com; MBA; ACS)
Mr. A. Ramakrishna Rao started his career in the year 1976 as
Accounts assistant in VST Industries Hyderabad and worked in
accounts / exports department till 1998. He moved to manage
secretarial administrative work of a Hyderabad based Software
Industry. Having worked for 4 years since 1999 in the software
industry he moved to academics and consulting in the year 2002
and has been pursuing the same since then. He is extending
consultancy services in the area of Foreign Exchange, statutory
compliance and company affairs related work.
8

2. OBJECTIVES OF THE STUDY
To learn the theoretical aspects of Project Appraisal and
Project Financing.
To understand the role of financial statements in Project
Appraisal.
To analyze the importance of various financial tools in
preparing a project report.
To prepare a project report for an Industry Unit.
9
3. AN OVERVIEW OF IIP
The IIP was spread over a period of 45-60 days. During this
period I was involved in processing project reports relating to
various segments of the industry on the job Training mainly in
respect of FINANCIAL ANALYSIS. With the knowledge I have gained
in 45 days I have prepared a PROJECT REPORT for WOOD PECKER PVT
LTD. This report was appreciated by the officials of the company.
10

4. PROJECT APPRAISAL OVERVIEW
4.1 Project Appraisal Definition:
11

The assessment of the viability of proposed long-term investments
in terms of shareholder’s wealth.
1. WHEN it is done: After preparation and design of the
project.
2. WHAT is Project Appraisal: Provides a comprehensive review
of all aspects of the project.
3. WHY does the Bank appraise projects:
As a development institution: significant impact on
economic and social.
As a borrowing institution: maintain WB standing in
financial markets.
The first step in Project Appraisal is to find out whether the
project is prima facie acceptable by examining salient features
such as:
The background and experience of the applicants,
particularly in the proposed line of activity
The potential demand for the product
The availability of the required inputs, utilities and other
infrastructural facilities
Whether the project is in keeping with the priorities, if
any, laid down by the Government.
Project Appraisal should contain the following essential
information, such as:
12

Particulars of the project along with a copy of the Project
Feasibility Report furnishing details of the technology,
manufacturing process, availability of construction /
production facilities, etc.
Estimates of Cost of the project detailing the itemized
assets acquired / to be acquired, inclusive of Preliminary /
Pre-operative Expenses and WC margin requirements.
Details of the proposed means of financing indicating the
extent of promoters’ contribution, the quantum of Share
Capital to be raised by public issue, the composition of the
borrowed capital portion with particulars of Term Loans,
Foreign Currency Loans, etc.
WC requirements at the peak level (i.e., when the level of
Gross Current Assets is at the peak) during the first year
of operations after the commencement of commercial
production and the banking arrangements to be made for
financing the WC requirements.
Project Implementation Schedule review in the light of
actual implementation; Main stages in the project
implementation and whether the time schedule for
construction, erection/installation of P&M, start-up/trial
run, commencement of commercial production is reasonable
&acceptable
Organizational set up along with a list of Board of
Directors and indicating the qualifications, experience and
competence of
13

i) The key personnel to be in charge of implementation of
the project during the construction period and
ii) The executives to be in charge of the functional areas
of purchase, production, marketing and finance after commencement
of commercial production.
– Demand projection based on the overall market prospects
together with a copy of the market survey report.
– Details of the nature and value of the securities
offered.
– Regulatory Consents from the Government / other
authorities and any other relevant information.
– Interactive Financial Model Containing detailed
Projections with assumptions including following at a
minimum
• Estimates of sales, CoP and profitability.
• Projected P&L Account and Balance Sheet for the
operating years during the currency of the Bank’s
term assistance.
• Proposed amortization schedule, i.e., repayment
program.
• Projected Funds Flow Statement covering both the
construction period and the subsequent operating
years during the currency of the Term Loan.
14
4.2 Credit Appraisal:
Credit Appraisal means an investigation/assessment done by
the banks before providing any Loans & advances/project finance &
also checks the commercial, financial & technical viability of
the project proposed, its funding pattern & further checks the
primary & collateral security cover available for recovery of
such funds.
Credit Appraisal is a process to ascertain the risks
associated with the extension of the credit facility. It is
generally carried by the financial institutions, which are
involved in providing financial funding to its customers. Credit
risk is a risk related to non-repayment of the credit obtained by
the customer of a bank. Thus it is necessary to appraise the
credibility of the customer in order to mitigate the credit risk.
Proper evaluation of the customer is performed this measures the
financial condition and the ability of the customer to repay back
the Loan in future. Generally the credits facilities are extended
against the security know as collateral. But even though the
Loans are backed by the collateral, banks are normally interested
in the actual Loan amount to be repaid along with the interest.
15

Thus, the customer's cash flows are ascertained to ensure the
timely payment of principal and the interest.
It is the process of appraising the credit worthiness of a
Loan applicant. Factors like age, income, number of dependents,
nature of employment, continuity of employment, repayment
capacity, previous Loans, credit cards, etc. are taken into
account while appraising the credit worthiness of a person. Every
bank or lending institution has its own panel of officials for
this purpose.
4.3 Credit Appraisal Standards
Qualitative:
At the outset, the proposition is examined from the angle of
viability & also from the Bank's prudential levels of exposure to
the borrower, Group & Industry. Thereafter, a view is taken about
our past experience with the promoters, if there is a track
record to go by. Where it is a new connection for the bank but
the entrepreneurs are already in business, opinion reports from
existing bankers & published data if available are carefully
pursued. In case of a maiden venture, in addition to the drill
mentioned heretofore, an element of subjectively has to be
perforce introduced as scant historical data weightage to be
placed on impressions gained out of the serious dialogues with
the promoter & his business contacts.
16

Liquidity:
Current Ratio (CR) of 1.33 will generally be considered as a
benchmark level of liquidity. However the approach has to be
flexible. CR of 1.33 is only indicative & may not be deemed
mandatory. In cases where the CR is projected at a lower than the
benchmark or a slippage in the CR is proposed, it alone will not
be a reason for rejection for the loan proposal or for the
sanction of the loan at a lower level. In such cases, the reason
for low CR or slippage should be carefully examined & in
deserving cases the CR as projected may be accepted. In cases
where projected CR is found acceptable, working capital finance
as requested may be sanctioned. In specific cases where
warranted, such sanction can be with the condition that the
borrower should bring in additional long-term funds to a specific
extent by a given future date. Where it is felt that the
projected CR is not acceptable but the borrower deserves
assistance subject to certain conditions, suitable written
commitment should be obtained from the borrower to the effect
that he would be bringing in required amounts within a mutually
agreed time frame.
Net Working Capital:
Although this is a corollary of current ratio, the movements
in Net Working Capital are watched to ascertain whether there is
a mismatch of long term sources vis-à-vis long term uses for
17

purposes which may not be readily acceptable to the Bank so that
corrective measures can be suggested.
Financial Soundness:
This will be dependent upon the owner's stake or the
leverage. Here again the benchmark will be different for
manufacturing, trading, hire-purchase & leasing concerns. For
industrial ventures a Total Outside Liability/ Tangible Net worth
ratio of 3.0 is reasonable but deviations in selective cases for
understandable reasons may be accepted by the sanctioning
authority.
Turn-Over:
The trend in turnover is carefully gone into both in terms
of quantity & valve as also market share wherever such data are
available. What is more important to establish a steady output if
not a rising trend in quantitative terms because sales
realization may be varying on account of price fluctuations.
Profits:
While net profit is ultimate yardstick, cash accruals, i.e.,
profit before depreciation & taxation conveys the more comparable
picture in view of changes in rate of depreciation & taxation,
which have taken place in the intervening years. However, for the
sake of proper assessment, the non-operating income is excluded,
18

as these are usually one time or extraordinary income. Companies
incurring net losses consistently over 2 or more years will be
given special attention, their accounts closely monitored, and if
necessary, exit options explored.
Credit Rating:
Wherever the company has been rated by a Credit Rating
Agency for any instrument such as CP / FD this will be taken into
account while arriving at the final decision. However as the
credit rating involves additional expenditure, we would not
normally insist on this and only use this tool if such an agency
had already looked into the company finances.
Credit Appraisal Techniques:
Credit Appraisal Techniques act as a tool for credit
portfolio managers to take right decisions. It is a first and
prime most function performed by the Credit Appraisal cell before
providing any sort loans and advances. The appraisal technique
for each type of loan is separate from each other. Each type of
loan whether secured or unsecured has to be analyzed in a
different way. The different techniques of credit analysis or
credit appraisal are discussed below:
19

4.4 Process of Credit Appraisal for Term Loans:
Term loans are repayable in not less than 36months are
referred as Term Loan. In the interest of sound risk management
practices, banks monitor the percentage of Term Loans in their
credit portfolio with a view to keeping the term loan component
within a predetermined stage.
Requirements to obtain with a proposal:
Copies of project report
Where loan is on participation basis, a copy of the
appraisal note of the lead institution/ bank should be
obtained.
Scrutiny of Proposals.
Scope of the project
Background of the promoters
Government consents
The Technical appraisal
Cost of the project
Sources of Finance
The schedule of Implementation
The financial projections and profitability
Cash flow statements
Calculation of debt service coverage ratio(DSCR)
Breakeven analysis
20
Disbursement
Follow up(post sanction)
Assessment:
Term loan is provided for medium & long term (3 to 15 years)
periods for new / existing projects for expansion /
diversification. Its repayment is for specific period with
initial holiday period and secured by fixed assets such as land/
building/ plant / machinery/ other fixed assets. Basic aspect in
Term loan is that the borrower should repay the amount with
interest from the anticipated income earned from the assets
acquired. Technical & economic viability of the project is a must
for considering the term loan. In India, the commercial banks
extend term loan along with other banks & F I’s in the Consortium
/ multiple banking modes.
For assessment purposes, the forms prescribed are used and
debt-equity ratio and average DSCR, BEP payback period, etc. are
taken into consideration. The following minimum financial
parameters are required to be satisfied for a Term loan proposal
to merit consideration:
Debt Equity Ratio Not more than 2.33:1(1.71:1
may be accepted in the case of
real estate sector and
generally for different type
of industry different level of
21

DER is acceptable)Average DSCR Not less than 1.5 to 2 (ratio
lower than this is to be
looked into)
4.4.1 Ratios for appraising term loans:
Debt Equity Ratio: long term debt
Tangible Net
worth
Average DSCR: PAT + Depreciation + Interest on Term
Loans
Interest on term
Loan + Term Loan installments
Breakeven point: Fixed cost
Sales-Variable
cost (Contribution)
It should be noted that the banks generally consider only term
loans repayable within 5 to 7 years.
Term loans with maturity beyond 7yeras are normally not
experienced except infrastructure loans.
22

Debt-equity ratio:
A measure of a company’s financial leverage calculated by
dividing it’s to liabilities by stockholders’ equity. It
indicates what proportion of equity and debt the company is using
to finance its assets. Also known as the Personal Debt/Equity
Ratio, this ratio can be applied to personal financial statements
as well as companies.
A high debt/equity ratio generally means that a company has
been aggressive in financing its growth with debt. This can
result in volatile earnings as a result of the additional
interest expense. If a lot of debt is used to finance increased
operations (high debt to equity), the company could potentially
generate more earnings than it would have without this outside
financing. If this were to increase earnings than it would have
without this outside financing. If this were to increase earnings
by a greater amount than the debt cost (interest), then the
shareholders benefit as more earnings are being spread among the
same amount of shareholders. However, the cost of this debt
financing may overweigh the return that the company generates on
the debt through investment and business activities and become
too much for the company to handle. This can lead to bankruptcy,
which would leave shareholders with nothing.
Debt-Service coverage Ratio (DSCR):
23

The ultimate purpose of project appraisal is to ascertain
the viability of a project which has a direct bearing on the
repayment of the installments under the proposed term loan /
deferred payment guarantee. While the repayment program will
depend upon the profitability of a project, the quantum of annual
instalments has to be related to the size of the annual each
servicing by the debt service coverage ratio.
The debt service coverage ratio is the core test ratio in
project financing. This ratio indicates the degree of viability
of a project and influences in fixing the repayment period, and
quantum of annual installments. For the purpose of this ratio,
“debt” means maturing obligations viz., installments payable
during a year under all the term loans/deferred payment
guarantees and ‘service’ means cash accruals (service) available
to cover the maturity obligation (debt) during each year.
The debt service coverage ratio indicates the ability of the
firm to generate car accruals for repayment of instalment and
interest. For example, a DSCR of 3:1 indicates that for each
Re.1/- long term debt including interest to be paid the business
generates cash accrual of Rs.3/- to be utilized for repayment of
debt. The difference accrual and debt is known as margin of
safety (Rs.2/- in this case).
The ratio of 1.5 to 2 is considered reasonable. Ratio lower
than this should be further looked into. A very high ratio may
24

indicate the need for lower moratorium period/repayment of loan
in shorter schedule. This ratio provides a measure of the ability
of an enterprise to service its debts i.e. ‘interest’ and
‘principal’ repayment besides indicating the margin of safety.
The ratio may vary from industry from to industry but has to be
viewed with circumspection when it is less than 1.5.
4.4.2 Term loan Appraisal consists of:
No item to be ignored in project financing.
Costs shown should be true & not overstated.
Three sets of quotation from various suppliers to be
obtained.
Supplier’s details and credibility need to be verified.
Building construction estimates to be properly vetted.
Funds to be released based on progress of the work.
Security coverage is to be assessed.
4.4.3 Techniques of Term Loan Appraisal are:The purpose of Project Appraisal is to ascertain whether the
project will be sound – technically, economically, financially
and managerially – and ultimately viable as a commercial
proposition. The ultimate objective of the appraisal exercise is
to ascertain the viability of a project with a view to ensuring
the repayment of the borrower’s obligations.
1. Technical feasibility
2. Commercial viability
25

3. Managerial competence
4. Financial feasibility
Technical Feasibility
Its objective is to determine the suitability of the
technology selected and the adequacy of the technical
investigation, and design.
It consists of:
Technology / process
Indian/ foreign/Collaboration
Back up arrangement
Infrastructure
Availability of land /R M / transport/ power / water
Pollution/ Project implementation
Commercial viability
Its objective is to ascertain the extent of profitability of
the project and its sufficiency in relation to the repayment
obligations pertaining to term finance.
It consists of:
E I C analysis
Demand/ supply of the product
Competition/ market
Marketing abilities
Product / service differentiation
Managerial competence
26

Its objective is to ascertain that competent men are behind
the project to ensure its successful implementation and efficient
management after commencement of commercial production.
It consists of:
Organization set up
CCC of the borrower
finance
management
Operations
H R
Qualified technical persons
Financial feasibility
Its objective is to determine the accuracy of cost
estimates, suitability of the envisaged pattern of financing and
general soundness of the capital structure.
It consists of:
Cost of the project & means of finance
Production/Profitability
Cash flow/ funds flow
Projected balance sheet
profitability statements
B E P / CMA
4.4.4 Written Down Value Method of Depreciation (WDV) Under the Written Down Value Method, depreciation according
to a fixed percentage calculated upon the original cost (in the
first year) and written down value, (in subsequent years) of an
27

asset, is written off during each accounting period over the
expected useful life of the asset. Under this method, the rate of
depreciation remains constant year after year whereas the amount
goes on decreasing.
Calculation of Rate of Depreciation under WDV Method:
R= (1 - n s/c) x 100 (or)
WDV=Cost of assets -Depreciation
Where R = Rate of Depreciation (in %),
n = Useful life of the asset (in years)
s = Scrap value at the end of useful life of the asset
4.4.5 Cost of Project and Means of Finance:
Project financing is an innovative and timely financing
technique that has been used on many high-profile corporate
projects, including Euro Disneyland and the Eurotunnel. Employing
a carefully engineered financing mix, it has long been used to
fund large-scale natural resource projects, from pipelines and
refineries to electric-generating facilities and hydro-electric
projects. Increasingly, project financing is emerging as the
preferred alternative to conventional methods of financing
infrastructure and other large-scale projects worldwide.
Project Financing discipline includes understanding the
rationale for project financing, how to prepare the financial
plan, assess the risks, design the financing mix, and raise the
funds. In addition, one must understand the cogent analyses of
why some project financing plans have succeeded while others have
28

failed. A knowledge-base is required regarding the design of
contractual arrangements to support project financing; issues for
the host government legislative provisions, public/private
infrastructure partnerships, public/private financing structures;
credit requirements of lenders, and how to determine the
project's borrowing capacity; how to analyze cash flow
projections and use them to measure expected rates of return; tax
and accounting considerations; and analytical techniques to
validate the project's feasibility
Project finance is different from traditional forms of
finance because the credit risk associated with the borrower is
not as important as in an ordinary loan transaction; what is most
important is the identification, analysis, allocation and
management of every risk associated with the project. The purpose
of this project is to explain, in a brief and general way, the
manner in which risks are approached by financiers in a project
finance transaction. Such risk minimization lies at the heart of
project finance.
In a no recourse or limited recourse project financing, the
risks for a financier are great. Since the loan can only be
repaid when the project is operational, if a major part of the
project fails, the financiers are likely to lose a substantial
amount of money. The assets that remain are usually highly
specialized and possibly in a remote location. If saleable, they
may have little value outside the project. Therefore, it is not
29

surprising that financiers, and their advisers, go to substantial
efforts to ensure that the risks associated with the project are
reduced or eliminated as far as possible. It is also not
surprising that because of the risks involved, the cost of such
finance is generally higher and it is more time consuming for
such finance to be provided.
Project finance is the financing of long-term infrastructure
and industrial projects based upon a complex financial structure
where project debt and equity are used to finance the project.
Usually, a project financing scheme involves a number of equity
investors, known as sponsors, as well as a syndicate of banks
which provide loans to the operation. The loans are most commonly
non-recourse loans, which are secured by the project itself and
paid entirely from its cash flow, rather than from the general
assets or creditworthiness of the project sponsors. The financing
is typically secured by all of the project assets, including the
revenue-producing contracts. Project lenders are given a lien on
all of these assets, and are able to assume control of a project
if the project company has difficulties complying with the loan
terms.
Generally, a special purpose entity is created for each
project, thereby shielding other assets owned by a project
sponsor from the detrimental effects of a project failure. As a
special purpose entity, the project company has no assets other
than the project. Capital contribution commitments by the owners
30

of the project company are sometimes necessary to ensure that the
project is financially sound. Project finance is often more
complicated than alternative financing methods. It is most
commonly used in the mining, transportation, telecommunication
and public utility industries.
Cost of project
Land (Inc dev charges)
Building / Machinery
(Inc fright / transp. erection charges)
Other fixed assets
Technical Know- how
Consultancy charges
Preliminary expenses
Contingent expenses
Working capital margin
Means of Finance
Total Capital (equity)
USL from others
Term loan from bank/s
Term loan from F I’s
Subsidy from Government (if any)
Total
4.4.6 Financial Evaluation Techniques:
31

Some common techniques of evaluating viability of projects are
given below:
• Pay-Back Period Method
• Accounting Rate of Return Method
• NPV (Net Present Value) Method
• Profitability Index Method
• IRR (Internal Rate of Return) Method
Pay-Back Period Method:
The Pay-Back Period is the length of time required to
recover the initial outlay on the project Or It is the time
required to recover the original investment through income
generated from the project.
Pay-Back Period =OriginalCostofInvestmentAnnualCashInflows∨Savings
Pros: - a) It is easy to operate and simple to understand.
b) It is best suited where the project has shorter gestation
period and project cost is also less.
c) It is best suited for high risk category projects. Which
are prone to rapid technological changes.
d) It enables entrepreneur to select an investment which
yields quick return of funds.
32

Cons: - a) It emphasizes more on liquidity rather than
profitability.
b) It does not cover the earnings beyond the payback
period, which may result in wrong selection of investment
projects.
c) It is suitable for only small projects requiring
less investment and time
d) This method ignores the cost of capital which is
very important factor in making sound investment decision.
Decision Rule: - A project which gives the shortest pay-back
period, is considered to be the most ACCEPTABLE
Accounting Rate of Return (ARR):
This method is considered better than pay-back period method
because it considers earnings of the project during its full
economic life. This method is also known as Return on Investment
(ROI). It is mainly expressed in terms of percentage.
ARR or ROI = Average Annual Earnings after Tax_____
* 100
Average Book Investment after Depreciation
Here, Average Investment = (Initial Cost –
Salvage Value) * 1 / 2
Decision Rule
In the ARR, A project is to be ACCEPTED when (If Actual ARR
is higher or greater than the rate of return) otherwise it is
33

rejected and In case of alternate projects, one with the highest
ARR is to be selected.
Pros: - a) It is simple to calculate and easy to understand.
b) It considers earning of the project during the entire
operative life.
c) It helps in comparing the projects which differ
widely.
d) This method considers net earnings after depreciation and
taxes.
Cons: - a) It ignores time value of money.
b) It lays more emphasis on profit and less on cash flows.
c) It does not consider re-investment of profit over years.
d) It does not differentiate between the size of
investments required for different projects.
Net Present Value (NPV):
This method mainly considers the time value of money. It is
the sum of the aggregate present values of all the cash flows –
positive as well as negative – that are expected to occur over
the operating life of the project.
NPV = PV of Net Cash Inflows – Initial Outlay (Cash outflows)
Decision Rule: -
• If NPV is positive, ACCEPT
• If NPV is negative, REJECT
• If NPV is 0, then apply Payback Period Method
34

The standard NPV method is based on the assumption that the
intermediate cash flows are reinvested at a rate of return equal
to the cost of capital. When this assumption is not valid, the
investment rates applicable to the intermediate cash flows need
to be defined for calculating the modified NPV.
Pros: - a) This method introduces the element of time value of
money and as such is a scientific method of evaluating the
project.
b) It covers the whole project from start to finish
and gives more accurate figures
c) It indicates all future flows in today’s value.
This makes possible comparisons between two mutually
exclusive projects.
d) It takes into account the objective of maximum
profitability
Cons: -a) It is difficult method to calculate and use.
b) It is biased towards shot run projects.
c) In this method profitability is not linked to capital
employed.
d) It does not consider Non-Financial data like the
marketability of a product.
Profitability Index Method:
Profitability Index is the ratio of present value of
expected future cash inflows and Initial cash outflows or cash
outlay. It is also used for ranking the projects in order of
35
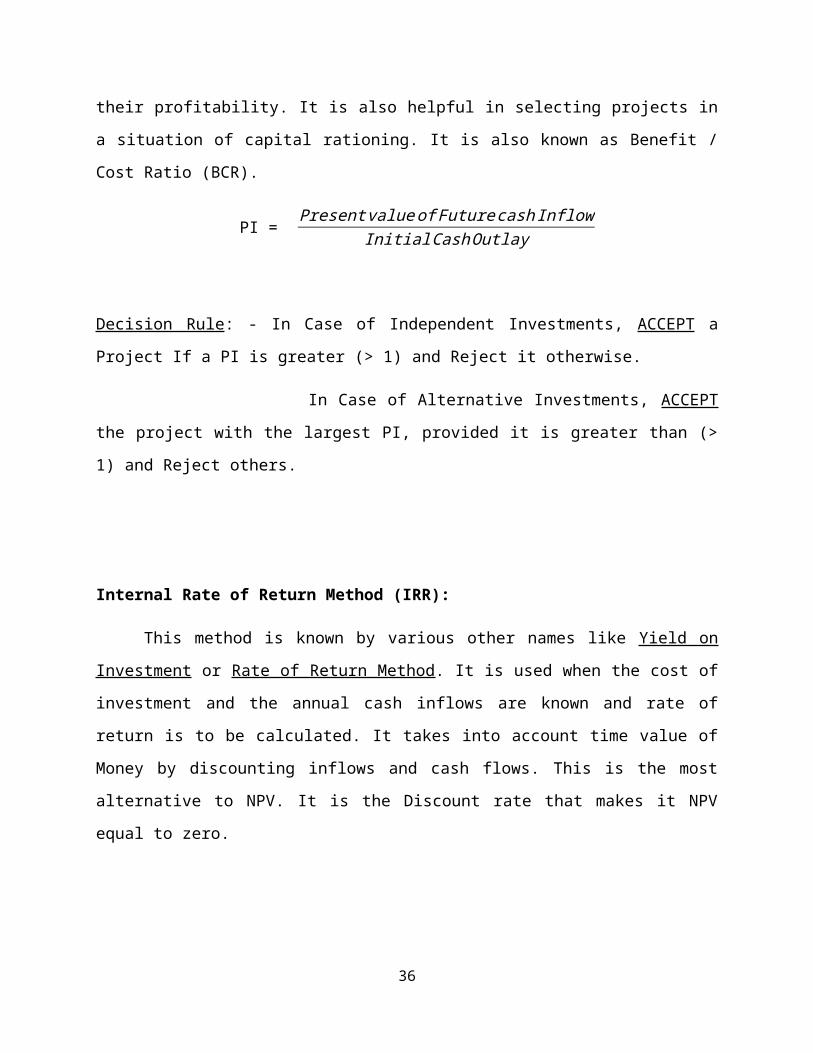
their profitability. It is also helpful in selecting projects in
a situation of capital rationing. It is also known as Benefit /
Cost Ratio (BCR).
PI = PresentvalueofFuturecashInflowInitialCashOutlay
Decision Rule: - In Case of Independent Investments, ACCEPT a
Project If a PI is greater (> 1) and Reject it otherwise.
In Case of Alternative Investments, ACCEPT
the project with the largest PI, provided it is greater than (>
1) and Reject others.
Internal Rate of Return Method (IRR):
This method is known by various other names like Yield on
Investment or Rate of Return Method. It is used when the cost of
investment and the annual cash inflows are known and rate of
return is to be calculated. It takes into account time value of
Money by discounting inflows and cash flows. This is the most
alternative to NPV. It is the Discount rate that makes it NPV
equal to zero.
36

In this Method, the IRR can be ascertained by the Trial & Error
Yield Method, Whose the objective is to find out the expected
yield from the investment.
IRR= Smaller discount rate +NPV@Smallerrate
∑ oftheabsolutevaluesoftheNPV@smaller∧thebiggerdiscountrates
Pros: - a) It is conceptually sound.
b) It considers time value of money.
c) It Facilitates ranking of projects which help in the
selection of projects.
Cons: - a) It is vulnerable to different interpretations.
b) Its computation Process is complex
4.5 Process of Credit Appraisal for providing Cash
Credit/Working Capital:Working Capital for any unit means the total amount of
circulating funds required for meeting day to day requirements of
the unit. For proper working a manufacturing unit needs a
specific level of current assets such as Raw Material, Stock in
process, Finished Goods, Receivables and Other current assets
such as Cash in Hand/Bank and advances etc. So the working
capital means the funds invested in current assets. The trading
units need the working capital for storing the goods and allowing
the credit to its customers.
37

Types of working capital provided by Indian Banks are cash
credit (Open/ Key) / overdraft / Bills discounting or purchase
and STL .Cash credit / bills limits are assessed based on the
production/ projected sales/inventory holdings/ past credit
limits. Customer allowed to draw the amount from the cash credit
account as per his requirement & also deposit the amount based on
the surplus funds available. Cash credit / overdrafts are running
accounts & the credits in the account should reflect the sales of
the company.
There are three methods of working capital assessment.
The turn over method (Nayak committee),
The inventory method &
II method of lending (Chore committee)
4.5.1 Working Capital Cycle for Manufacturing and Non-
Manufacturing firm:
38

4.5.2 Factors affecting the Requirement of Working
Capital: Nature of business
Size of the business
Production cycle process
Production policy
Terms of purchase & sales(policies)
Business cycle ( Upward/ downward)
Growth & expansion
Availability of R M
Profit level
Operating efficiency
Availability of credit
Nature of Activity: Manufacturing units need more working capital
as compared to trading and service units.
39

The length of operating cycle: More the length of operating
cycle, more the requirement of working capital. Lengthy the
process of manufacture, more the need of working capital due to
increase of length of working capital cycle.
Market trend: The market trend of allowing credit to customers
also varies from industry to industry and city to city. More the
credit allowed to customers, more the need of working capital.
Availability of Raw Materials: When the availability of raw
materials is assured and comfortable, lower the stock maintenance
is required .when there is expectation of shortage or expectation
of rise prices, more amounts is blocked in raw materials.
Location of unit: When the unit is located near the source of raw
material, lower stock maintenance is required.
Type of customers: When there are regular customers, low stock of
finished products is needed. When there are sales are to be made
walk-in customers more level of stock of finished products is
required.
Seasonality factor: When the raw material required is available
in a particular season, the stock for the whole of year is to be
purchased in the particular season. E.g., Sugarcane, Cotton,
Paddy, etc. Similarly the woolen products and products required
in a particular season such as ACs for keeping the production
running, higher level of finished stocks have to be kept.
4.5.3 Parameters for various stages in computation of
Working Capital:
40

S.No Stage Time ValueI Raw Material Holding period Value of RM
consumed during
the periodIi SIP Time taken in
converting the
RM into FG
RM+Mfg Exp.
during the
period (Cost of
production)Iii FG Holding period
of FG before
being sold
RM+Mfg.Exp+Adm
Overheads for
the period (Cost
of sales)Iv Receivables Credit allowed
to Buyer
RM+Mfg.Exp+Adm.E
xp
+Profit for the
period (sales)
4.5.4 Methods of Working Capital Assessment:
1. Turn Over Method:
It is also known as Nayak Committee. Its operating cycle is
less than or equal to three months.
Assessment is:
25% of the projected turn over
41

Minimum working capital margin ( NWC) - 5% of the
projected sales
Borrower has to bring additional margin if it is less
than the prescribed limit
Working capital eligibility = (25 % of projected
turn over – min NWC or actual NWC ) whichever is less
NWC = Current assets - current liability
2. Inventory Method:
Its operating cycle is more than three months. The minimum
stipulated margins can vary from banks to banks based on the
credit policy guidelines.
Assessment is:
1 Build up of current assets
2 Buildup of current liabilities
(other than Bank borrowings for W C)
3 Working capital gap ( 1-2)
4 Actual NWC
5 Required NWC ( min 15% of current
assets )
6 Maximum permissible bank borrowings ( 3-4
) or
42
( 3-5) whichever is less
7 Margin to be brought in ( 5-4)
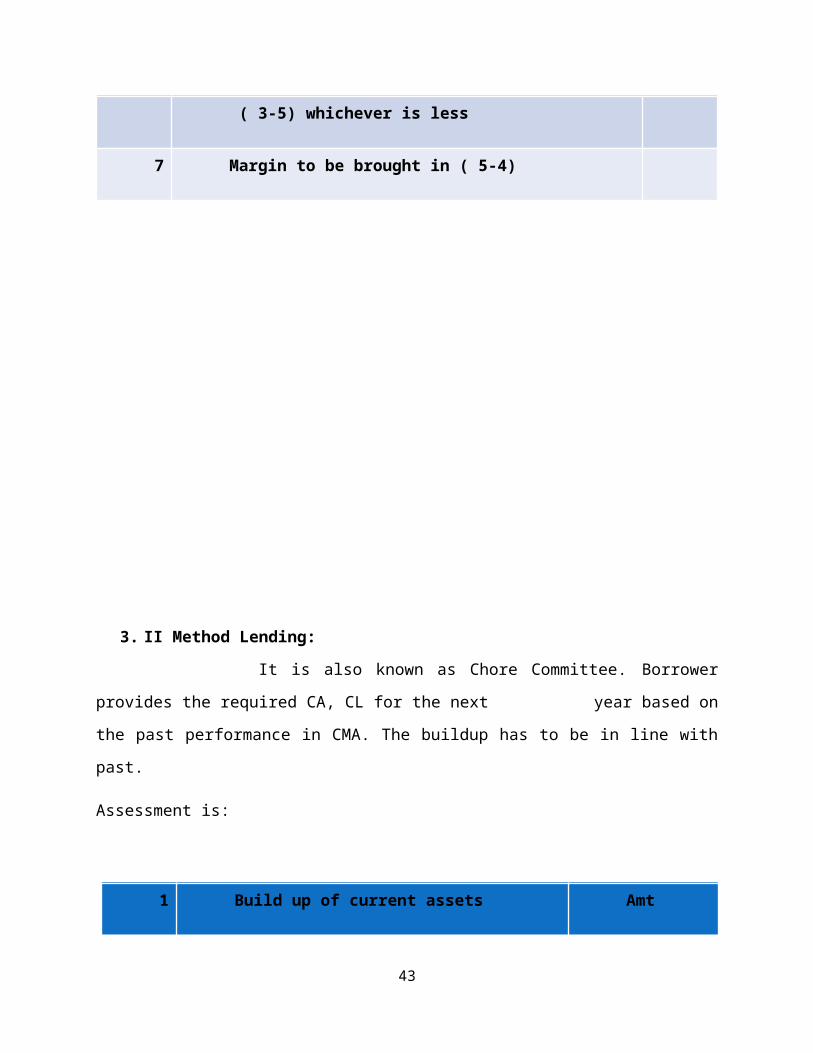
3. II Method Lending:
It is also known as Chore Committee. Borrower
provides the required CA, CL for the next year based on
the past performance in CMA. The buildup has to be in line with
past.
Assessment is:
1 Build up of current assets Amt
43

2 Buildup of current liabilities
(other than Bank borrowings for
W C)
3 Working capital gap ( 1-2)
4 Actual NWC
5 Required NWC ( min 25% of
current assets )(excluding export
receivables)
6 Maximum permissible bank
borrowings ( 3-4 ) or ( 3-5)
whichever is less
7 Margin to be brought in ( 5-4)
44

5.0 LEARNINGS FROM THE IIP
1. Preparation of financial statements.
2. An overview and understanding of financial analysis process.
3. Understanding the Loan Processing in a bank
4. Estimates & Projections.
45

6.0 STRUCTURE OF THE REPORT
1) Overview of PHARMACEUTICAL INDUSTRY
2) Project at a glance
3) Executive summary
4) Infrastructure
5) Cost of the project & Means of Finance
6) Assumptions
7) Implementation Schedule
8) SWOT analysis
9) Conclusion
46
7.0 OVERVIEW OF PHARMACEUTICAL INDUSTRY
The Indian pharmaceutical industry currently tops the chart
amongst India’s science-based industries with wide ranging
capabilities in the complex field of drug manufacture and
technology. A highly organized sector, the Indian pharmaceutical
industry is estimated to be worth $ 4.5 billion, growing at about
8 to 9 percent annually. It ranks very high amongst all the third
world countries, in terms of technology, quality and the vast
range of medicines that are manufactured. It ranges from simple
headache pills to sophisticated antibiotics and complex cardiac
compounds, almost every type of medicine is now made in the
Indian pharmaceutical industry.
The Indian pharmaceutical sector is highly fragmented with
more than 20,000 registered units. It has expanded drastically in
the last two decades. The Pharmaceutical and Chemical industry in
India is an extremely fragmented market with severe price
47
competition and government price control. The Pharmaceutical
industry in India meets around 70% of the country’s demand for
bulk drugs, drug intermediates, pharmaceutical formulations,
chemicals, tablets, capsules, orals and injectable. There are
approximately 250 large units and about 8000 Small Scale Units,
which form the core of the pharmaceutical industry in India
(including 5 Central Public Sector Units).
The Government has also played a vital role in the
development of the India Software Industry. In 1986, the Indian
government announced a new software policy which was designed to
serve as a catalyst for the software industry. This was followed
in 1988 with the World Market Policy and the establishment of the
Software Technology Parks of India (STP) scheme. In addition, to
attract foreign direct investment, the Indian Government
permitted foreign equity of up to 100 percent and duty free
import on all inputs and products.1.2 Current Scenario India’s
pharmaceutical industry is now the third largest in the world in
terms of volume and stands 14th in terms of value.
According to data published by the Department of
Pharmaceuticals, Ministry of Chemicals and Fertilizers, the total
turnover of India’s pharmaceuticals industry between September
2008 and September 2009 was US$ 21.04 billion. Of this the
domestic market was worth US$ 12.26 billion. The Indian
pharmaceuticals market is expected to reach US$ 55 billion in
2020 from US$ 12.6 billion in 2009.
48

The market has the further potential to reach US$ 70 billion
by 2020 in an aggressive growth scenario. Moreover, the
increasing population of the higher-income group in the country,
will open a potential US$ 8 billion market for multinational
companies selling costly drugs by 2015. Besides, the domestic
pharma market is estimated to touch US$ 20 billion by 2015,
making India a lucrative destination for clinical trials for
global giants. Further estimates the healthcare market in India
to reach US$ 31.59 billion by 2020.
About the firm project & Promoters
Vision: To be a leading active pharmaceutical company by
providing high quality, affordable and innovative solutions
through continuous research.
Mission: ABC Pharmaceuticals goal is to create world class
facilities for manufacturing of complex active pharmaceuticals
for generic industry. The company is committed to innovative
research to develop active pharmaceutical ingredients. The
company will strive for continuous in everything that they do,
through active involvement of their employees, promoters,
customers and to the society.
Goal: Ability to develop products for complex active
pharmaceuticals.
Excellent team of skilled professional in all areas
related to research, production and business development.
49

A strong commitment towards society on safety and
environment.
Transparency and open communications.
Excellent quality system to produce active
pharmaceuticals to meet customer specifications.
PROJECT
M/s ABC Pharma Limited was constituted on 03.07.2012 with an
objective to set up a manufacturing industry to manufacture
bulk drugs and intermediaries.
The company purchased land measuring 5.09 acres at Plot
No.23 D, APIIC Achtapuram, APSEZ, and Visakhapatnam
The present proposal of the company is to set up industry to
manufacture bulk drugs and intermediates with a total
capacity of 204 tons per annum.
The proposed industry will have the plant and machinery to
manufacture the following products.
Famotidine
Itraconazole
Ketoconazole
Lopinavir
Emtricitabine
Acelovir/Acyclovir
The company is in the process of obtaining necessary approvals
and permissions from various authorities for the proposed
50

industry. Some of important approvals are already obtained. The
industry is expected to commence production 01.01.2016.
PROJECT OUT LAY
The project cost is estimated at Rs.2737.04 lakhs which is
inclusive of working capital margin.
The land cost is estimated at Rs.244.57 lakhs which include
cost of land, registration charges and land development cost
inclusive of internal roads and land scaping.
Total volume of the civil works in the finished structure
stands at Rs 619.79 lacs and is arrived based on estimates
made by engineers.
The estimates for the civil works are as per the approved
plan of the factory.
The main plant and machinery is estimated to cost Rs.990.76
lakhs which will be utilized for processing.
Auxiliary equipment is provided at Rs. 574.36 lacs. This
includes provision made for Quality Control Equipment &
Glassware, Power, Safety, AHU, Maintenance and Ware House
Deposits are provided at Rs 22.00 lacs for making deposits
with the Government Departments
The preliminary expenses are estimated at Rs.217.04 lakhs
which include interest during construction period amounting
to Rs.201.60 lakhs
The working capital margin is estimated at Rs.68.52 lakhs
8.0 PROJECT AT A GLANCE
51

Name of the Company
M/s ABC Pharma Limited
Constitution Limited Company
Date of Incorporation
03.07.2012
Registered Office H.No.8-372/F1/1/3, Subhash Nagar
Yellareddyguda, Ameerpet, Hyderabad - 500073
Directors Sri A.Hari Babu Director
Sri M.Koteswara Rao Director
Unit Location (Proposed)
Plot No.23 D, APIIC, Achtapuram, APSEZ, Visakhapatnam
Line of activity Manufacturing of bulk drugs & intermediaries
End User Segment Pharmaceutical industries
Project Cost Particulars Cost (Rs in lakhs)
Land 244.57
Buildings 619.79
Plant & Machinery 990.76
Other machinery 574.36
Deposits 22.00
Preliminary expenses 217.04
Margin for working capital
68.52
Total 2737.04
Means of Finance Particulars Cost (Rs in lakhs)
Promoters 900.00
Term Loan 1800.00
Unsecured loans 37.04
52

Total 2737.04
Working capital CC Rs.200.00 lakhs
ILC/FLC Rs.100.00 lakhs
9.0 EXECUTIVE SUMMARY
THE GLOBAL PHARMACEUTICAL INDUSTRY The pharmaceutical industry, which includes the development,
production and marketing of pharmaceutical products, is
characterized by its large size, growth, globalization and
significant investment in research and development (“R&D”). The
global pharmaceutical industry is driven by a continuing need for
medicines for the treatment of disease, demographic shifts that
strengthen this underlying demand and improved healthcare
infrastructures that are providing people with greater access to
medicines.
According to IMS, sales in the global pharmaceutical
industry exceeded U.S.$845 billion in 2011 with a 7% positive
growth rate. The global pharmaceutical industry has historically
been dominated by the United States, European and Japanese
markets. In 2011, the United States market was the largest market
accounting for sales of U.S. $320 billion. However, it is now
believed that China, India, Brazil and Russia are very attractive
nations for growth in the pharmaceutical industry. These markets
offer a high growth potential due to their rising GDPs, expanding
53

access to healthcare, improving intellectual property and
regulatory environments.
The Chart set forth below gives a breakdown of the
contribution to sales of various major markets to the global
pharmaceuticals industry in 2011.
THE INDIAN PHARMACEUTICAL INDUSTRY The size of the Indian pharmaceutical industry was estimated
at U.S.$29.1 billion (including exports) in 2011-2012. Of this,
the domestic formulations market was valued at U.S.$11.6 billion
(or ` 556.6 billion). Exports to semi-regulated markets, which
have grown at 16% over the same period, also supported growth in
overall exports. Over the next few years, formulations exports
are expected to continue to grow at a CAGR of 14-16%, driven by
54

the growing opportunity from off-patent drugs in regulated
markets and a favorable growth in semi-regulated markets.
Bulk Drugs
Bulk drug exports too are expected to grow at a similar pace
of 14-16% CAGR, as the growing generics market and rising cost
pressures faced by innovators provide a significant opportunity.
Additionally, India's key strengths such as low-cost
manufacturing, high process chemistry skills, manufacturing
facilities and increasing number of drug master filings (“DMFs”)
are expected to drive growth in bulk drug exports.
THE INDIAN BIOTECHNOLOGY SECTOR
The biotechnology industry in India, comprising
approximately 380 companies, has grown threefold in the last five
years, to reach U.S. $4 billion in fiscal 2011. India’s
biotechnology sector is benefitting from several advantages such
as cost effectiveness, R&D, expertise and personnel skills. India
is widely recognized as an ideal location for manufacturing
biotechnology products and for conducting high-level research
programs in the field. The Indian biotechnology industry has seen
good growth with a CAGR in excess of 20%. Of all the sectors, the
Indian biotechnology industry is primarily dominated by
biopharma, which includes vaccines and biosimilars.
India is also making major strides in agri-bio, which is
the fastest growing sub-sector in the biotechnology industry.
With up to U.S. $25 billion worth of innovator biologics losing
patent protection by 2016, companies from the developed markets
55

of the United States and Europe are looking to diversify into
generics and biosimilars by partnering with Indian companies,
given their industry’s well-developed leadership in this segment.
Further, increased focus on disease prevention, rising incomes
and government participation are key drivers of the sector’s
domestic growth. Indian biotechnology companies are gaining large
orders for vaccines from the Governments under various health
care initiatives for immunization. All these factors have poised
the industry for doubling in size in five years’ time to reach a
size of U.S. $8 billion by 2015. Financial indicators:
Parameter 31.03.16
31.03.17
31.03.18
31.03.19
Net Sales 852.92 5228.02
5687.19
7159.46PBDITA 134.71 705.21 776.02 908.01
Operating Profit (before interest)
108.87 601.87 672.68 804.67PBT 40.93 419.09 471.70 649.50PAT 34.19 343.59 372.12 481.11Cash Accruals 60.02 446.93 475.45 584.45Paid up Capital 900.00 900.00 900.00 900.00NW 934.19 1,277.
781,649.
892,131.
00TNW 934.19 1,277.78
1,649.89
2,131.00NWC 133.97 275.33 445.21 724.10
Total Current Liabilities 364.81 394.35 402.01 430.70Total Funded Debt 1837.0
41509.7
71182.5
0855.23
Other Current Liabilities 64.81 94.35 102.01 130.70Total Outside Liabilities (TOL) 2201.8
61904.1
21584.5
11285.9
3Total long term sources 2771.23
2787.55
2832.39
2986.23Total Current Assets (TCA) 498.78 669.67 847.22 1154.79
56

Fixed Assets (Net Block) 2403.65
2300.31
2196.97
2093.63Total Tangible Assets 2924.4
22991.9
83066.1
93270.4
2Total Assets 3136.04
3181.90
3234.40
3416.93Depreciation 25.83 103.34 103.34 103.34
Interest 67.94 182.78 200.98 155.16RM (incl.stores etc.) 208.50 325.68 353.03 460.23Stock-in-process 0.00 0.00 0.00 0.00Finished goods 56.08 87.07 93.88 119.42Inventory 264.58 412.74 446.91 579.65Receivables (domestic + export) 199.01 217.83 355.45 536.96Receivables over 6 months 0.00 0.00 0.00 0.00RM+stores & spares consumed 441.36 2751.0
62982.0
33883.8
0Cost of production 771.72 4543.05
4900.16
6239.34
BASE DATA 31.03.16
31.03.17
31.03.18
31.03.19
Cost of sales 715.64 4512.07 4893.34 6213.80
Power & Fuel 63.92 273.99 292.30 310.61
Direct Labour 36.43 142.45 143.94 145.45
Other Mfg. Expenses 20.03 115.17 124.22 157.25
Selling, Gen. and Admin. Exp. 22.98 92.37 99.46 119.28
Bank Finance 300.00 300.00 300.00 300.00
Sundry Creditors 51.15 80.35 87.11 113.81
Gross Sales 895.09 5486.49 5968.36 7513.42
Raw Material Purchases (Indigen.) 547.56 2809.84 2995.87 3937.58
Opening Stock 0.00 106.20 164.98 178.82
Consumption 441.36 2751.06 2982.03 3883.80
Closing Stock 106.20 164.98 178.82 232.60
57

Raw Material Purchases (Import.) 286.44 1215.44 1267.84 1692.31
Opening Stock 0.00 102.30 160.70 174.21
Consumption 184.14 1157.04 1254.33 1638.90
Closing Stock 102.30 160.70 174.21 227.63
Total (Imp.+Indig.) R.M Purch. 834.00 4025.28 4263.72 5629.90
RATIOSYear --> 31.03.1
631.03.17
31.03.18
31.03.19Current Ratio 1.37 1.70 2.11 2.68
TOL/TNW 2.36 1.49 0.96 0.60D/E 1.97 1.18 0.72 0.40OP/Net Sales % 12.76 11.51 11.83 11.24PBT/Net Sales % 4.80 8.02 8.29 9.07PBDITA/Net Sales % 15.79 13.49 13.65 12.68OP/TTA % 3.72 20.12 21.94 24.60PBT/TTA % 1.40 14.01 15.38 19.86PBDITA/TTA % 4.61 23.57 25.31 27.76NetProfit/NW (ROE) 3.66 26.89 22.55 22.58PBDITA/Interest 1.98 3.86 3.86 5.85TTA/NWC 21.83 10.87 6.89 4.52Net Sales/Current Assets 1.71 7.81 6.71 6.20Net Sales/FA 0.35 2.27 2.59 3.42
58

Net Sales / Total Tangible Assets
0.29 1.75 1.85 2.19Net Sales/TNW 0.91 4.09 3.45 3.36NWC to TCA (%) 26.86 41.11 52.55 62.70Bk.Finance to TCA(%) 60.15 44.80 35.41 25.98Sundry Cred.to TCA (%) 10.26 12.00 10.28 9.86Other CL (exc.sund.cred) to TCA (%)
12.99 14.09 12.04 11.32Fixed Assets/Long Term Sources % 86.74 82.52 77.57 70.11RM & Stores,Spares/ RM & Stores,spares consumed
172 43 43 43S-I-P/Cost of Production 0 0 0 0Finished Goods/Cost of Sales 29 7 7 7Inventories to Net Sales(days) 113 29 29 30Receivables to Gross Sales (days) 81 14 22 26Sundry Creditors to Purchases (days)
22 7 7 7RM+Stores & Spares consumed/Net Sales %
51.75 52.62 52.43 54.25Power & Fuel/Net Sales % 7.49 5.24 5.14 4.34Direct Labour/Net Sales % 4.27 2.72 2.53 2.03OME/Net Sales % 2.35 2.20 2.18 2.20Selling, General & Adm. Expenses/Net Sales %
2.69 1.77 1.75 1.67Interest/Net Sales % 7.97 3.50 3.53 2.17PBT/Net Sales % 4.80 8.02 8.29 9.07
10.0 INFRASTRUCTURE
Management:
The company will be managed by the board of directors comprising
eminent persons in the field of production and marketing of bulk
drugs and intermediates. They shall be assisted by competent and
experienced staff in all the areas of production, marketing,
finance, quality control, research and development.
Location:
The unit is located at Visakhapatnam which has several
59

advantages.
- There are no civic restrictions for establishing
pharmaceutical manufacturing industries
- The Government is providing incentives in the form of income
tax rebate
- The place has manpower pool and there is no problem of drawing
people of all disciplines.
- The power supply position is satisfactory
- The place has industrial atmosphere and no labour problems are
envisaged
- There is enormous growth in pharma industry in the area and
the fortunes are expected high
- Supplies treated water
- Common effluent treatment plant
- Road network connecting the NH-5
- Hazardous waste management facility
- Common security & surveillance
60
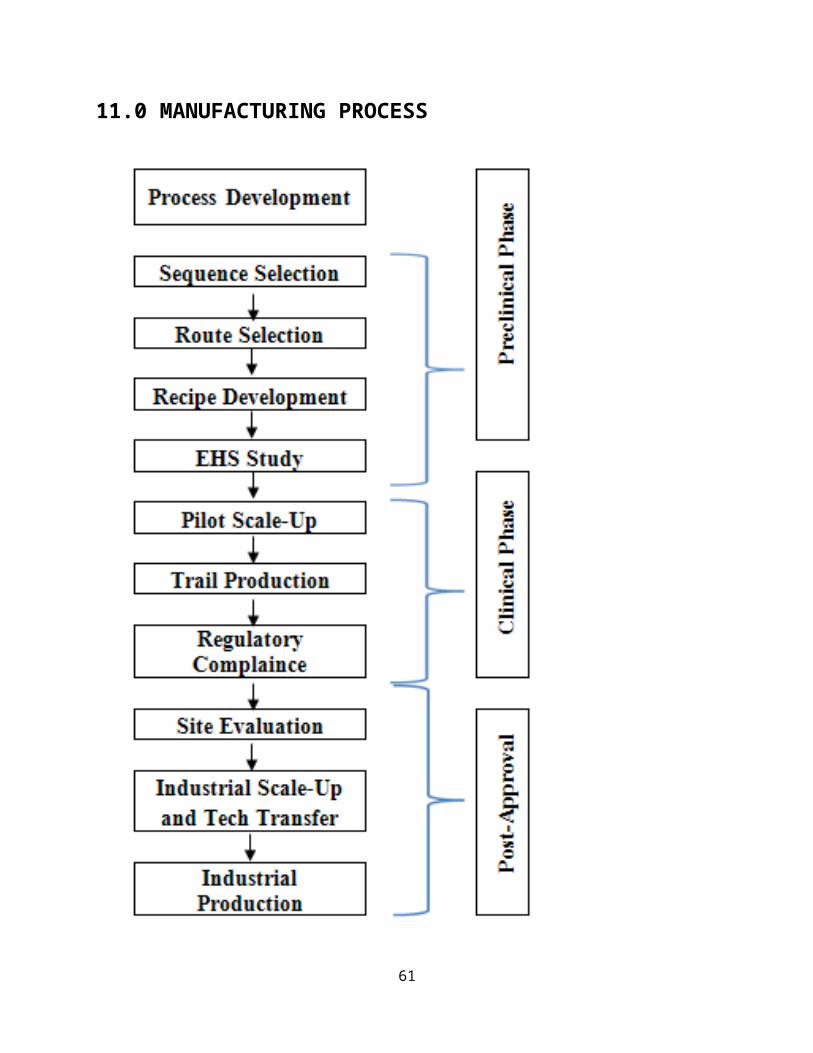
11.0 MANUFACTURING PROCESS
61

12.0 COST OF THE PROJECT & MEANS OF FINANCE
PROJECT COST
Land & Land Development 244.57
Building 619.79
Plant & Machinery (Indigenous) 990.76
Other machinery/equipment 574.36
Deposits 22.00
Preliminary & Pre-operative Expenses 217.04
Working Capital Margin 68.52
TOTAL 2737.04
MEANS OF FINANCE
Rs. Lacs
Item Amount
Equity Capital 900.00
Term loan 1800.00
Unsecured Loans 37.04
Total 2737.04
62
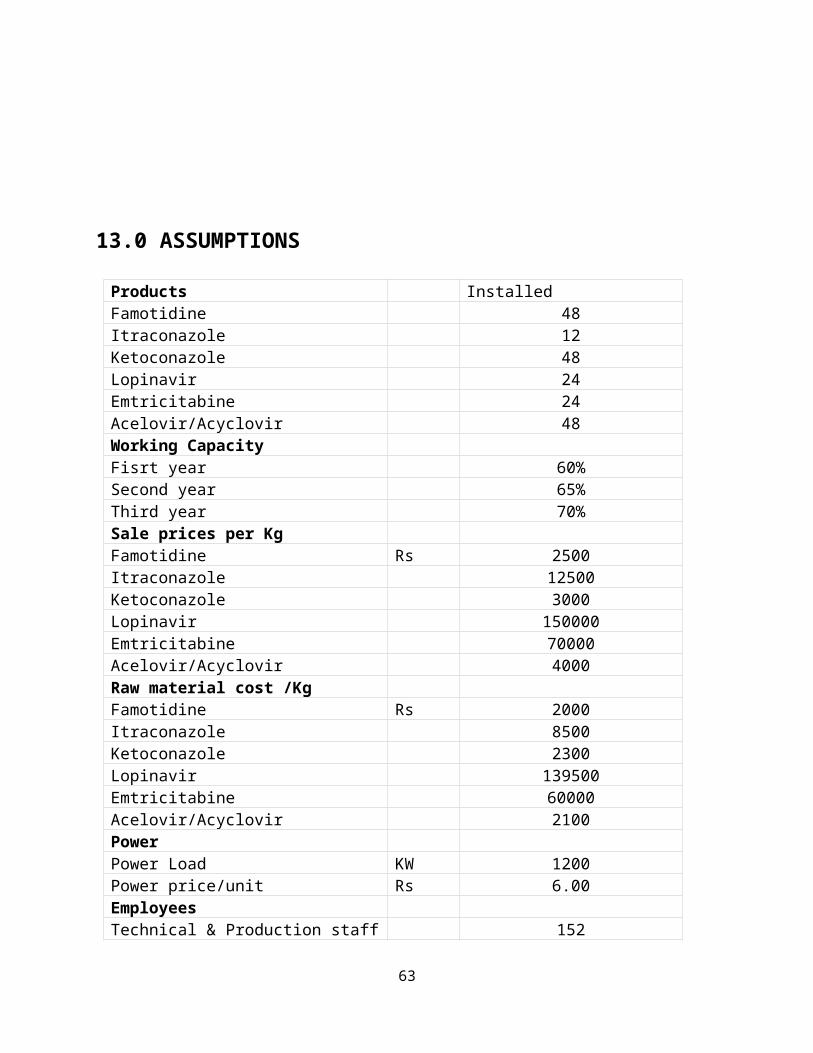
13.0 ASSUMPTIONS
Products Installed Famotidine 48Itraconazole 12Ketoconazole 48Lopinavir 24Emtricitabine 24Acelovir/Acyclovir 48Working CapacityFisrt year 60%Second year 65%Third year 70%Sale prices per KgFamotidine Rs 2500Itraconazole 12500Ketoconazole 3000Lopinavir 150000Emtricitabine 70000Acelovir/Acyclovir 4000Raw material cost /KgFamotidine Rs 2000Itraconazole 8500Ketoconazole 2300Lopinavir 139500Emtricitabine 60000Acelovir/Acyclovir 2100PowerPower Load KW 1200Power price/unit Rs 6.00EmployeesTechnical & Production staff 152
63

Administrative staff 24Repairs & Maintenance to talBuildings 0.50%Plant & Machinery 1.00%Annual increase 5%
14.0 IMPLEMENTATION SCHEDULE
Total construction period for the project is proposed to be 18 months from 1st January, 2014 thereafter 6 months exclusively fortrial run and validation of products.
The schedule of implementation of the project is summarized below:
Sr.No.
ActivityDate of Commencement
Expected Date of Completion
Land & Land Development
1 Land Acquired --
2 Preliminary Studies/Surveys
Completed --
3 Land leveling Completed June 2014
4 Statutory Approvals All Critical Approvals already Obtained
June 2014
Facilities
5 Architectural Drawings December 2013 April 2014
6 Detailed Engineering December 2013 April 2014
64
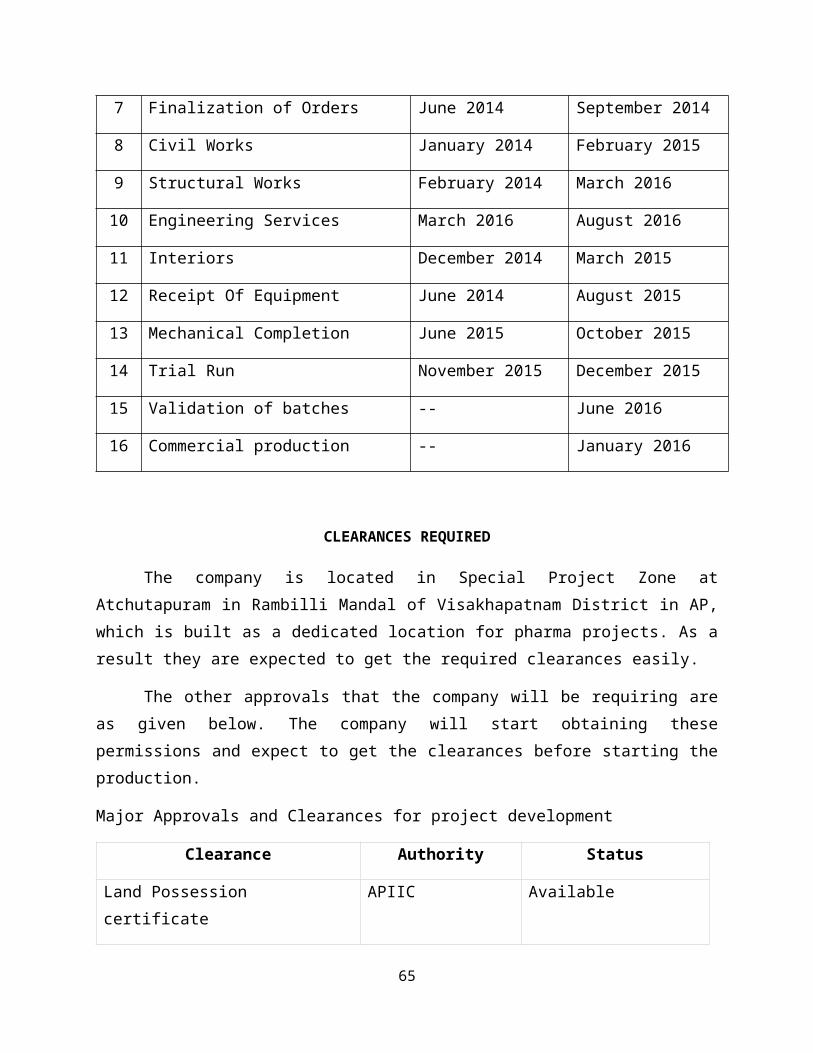
7 Finalization of Orders June 2014 September 2014
8 Civil Works January 2014 February 2015
9 Structural Works February 2014 March 2016
10 Engineering Services March 2016 August 2016
11 Interiors December 2014 March 2015
12 Receipt Of Equipment June 2014 August 2015
13 Mechanical Completion June 2015 October 2015
14 Trial Run November 2015 December 2015
15 Validation of batches -- June 2016
16 Commercial production -- January 2016
CLEARANCES REQUIRED
The company is located in Special Project Zone atAtchutapuram in Rambilli Mandal of Visakhapatnam District in AP,which is built as a dedicated location for pharma projects. As aresult they are expected to get the required clearances easily.
The other approvals that the company will be requiring areas given below. The company will start obtaining thesepermissions and expect to get the clearances before starting theproduction.
Major Approvals and Clearances for project development
Clearance Authority Status
Land Possession certificate
APIIC Available
65

Land Registration APIIC Completed
Plan Approval IDA Approved
Electricity Eastern Power Distribution
Company of A.P.Ltd
Approved
Environment Clearance Ministry of Forest &
Environment
Pollution control board
clearance – Consent for
Establishment
APPCB
Permission for EOU’s status
DC, VSEZ Approved
Other Permissions & Clearances for operation
Administration level
S.No Details Name of Department
1 TDS Account Income Tax Department
2 VAT & CST Commercial Tax Dept.
66

3 Shops and Establishments Registration
Labour Department
4 Professional Tax Regn. Commercial Tax Department
5 Service Tax Registration Central Excise
6 Provident Fund PF dept.
Operational level
1 Pollution Control Board Clearance - Consent for Operation
The company has completed the formalities and obtained consent to set up industrial unit
2 Registration with inspector of Boilers
Dept for factories and boilers and will be obtained
3 Registration with labor inspector
Labor Department – will be registered
4 Registration with Electrical department
Electrical Dept- In principle letter is being obtained. The feasibility certificate will be obtained shortly
5 Explosive license Dy./ Asst. Director of explosives
6 License from the inspector of weights and measurements
Dept of weights and measurements – will be obtained
7 Registration with state excise dept.
State Excise Dept.
8 Registration with Central Central Excise Dept.
67

excise dept.
9 ESIC Registration Regional Director, ECIC
10 PF Register Inspector of PF
11 Registration with district Industries Centre
GM, DIC- IND. Dept.
12 Drug manufacturing/ Test License
Drug Control Administration
Quality:
Company will be following the international quality norms: In
the first phase of operations company will develop ISO 9002
Quality systems, also having plans to implement the Safety, Health
& Environment (SHE) policy. In Coming Future company will
implement the Occupational Safety & Health Administration (OSHA)
as well as ISO14000 Systems. All these standards are applicable
for the company products. From the beginning of operations,
Company will also follow 21 CFR regulations. Title 21 is the
portion of the Code of Federal Regulations that governs food and
drugs within the United States for the Food and Drug
Administration (FDA), the Drug Enforcement Administration (DEA),
and the Office of National Drug Control Policy (ONDCP).
Company will develop QC standards & systems that suit the
requirements of International standards & regulatory markets. The
main focus will be in the regulatory markets; mainly USA & EUROPE.
68
The company is planning to get the approvals of US FDA and the
European drug authorities before the commercial operations.
15.0 SWOT ANALYSIS
Strengths
Experience of the promoters for about three decades in the
same industry/activity.
High value of expected orders on hand from domestic and
export market
69

Tie up arrangements for job work with companies having
production facilities
Structured organization to meet challenges consisting of
experience and expertise
Reputation of the company’s promoters in the industry at
Hyderabad.
Largest facility with state of art technology bulk drug
manufacturing
Availability of Manpower (both skilled & unskilled) at
cheaper cost.
Inbuilt safety and housekeeping practices ensure better
productivity.
The value of Pharma Industry is growing from strength to
strength and India occupies the fourth position in the world
in manufacture of bulk drugs.
India has a large pool of skilled technical manpower.
Increasing liberalization of Government Policies.
Indian Pharmaceuticals Industry possesses excellent
chemistry and process reengineering skills. This adds to
the competitive advantage of the Indian companies.
Weaknesses
Sudden infrastructure breakdown.
Labour intensive industry.
Number of supplying units at different locations
Distance and logistic problems
70

Even after 55 years of our nation’s independence, pharmacy
has not been able to get proper recognition on par with the
profession of medicine, engineering, veterinary, agriculture
and science.
Non-availability of major intermediaries for bulk drugs.
Lack of experience to exploit efficiency of the new patent
regime.
Very low key Research & Development.
Very low level of Biotechnology in India and also for New
Drug Discovery Systems.
Low level of strategic planning for future and also for
technology forecasting.
Opportunities
Huge opportunities in this industry and scope for promotion
of industries in a big way.
Subsidies, Incentives from State & Central Governments for
Export sales
Ageing of the world population.
Growing Incomes.
Growing attention for health.
New diagnoses and new social diseases.
Spreading prophylactic approaches.
New therapy approaches.
Spreading attitude for soft medication (OTC drugs).
Spreading use of Generic Drugs.
Threats
71

Natural calamities like floods, drought, economic recession
and earthquake affect any business/industry.
Change in government policies.
Price and exchange fluctuations.
The profession of pharmacy is around six-decade old in the
country but it is very unfortunate that it could not have a
University of its own in many states of the country.
Containment of rising health-care cost.
High cost of discovering new products and fewer discoveries.
High entry cost into new markets.
High cost of sales and marketing.
Competition, particularly from generic products.
16.0 CONCLUSION
The project is viewed technically feasible and economically
viable subject to our observations mentioned in the overview and
the effect of the adverse factors as indicated under sensitivity
analysis.
72

17.0 REFERENCES
[1] “Indian Pharmaceutical Industry Vision 2015” A report by
73

Organization of Pharmaceutical Producers of India,
[2] Bell, M and K.Pavitt (1993) “Technological accumulation and
industrial growth: contrasts between developed world and
developing countries”, Industrial and corporate change,
Vol.2, no.2, pp157-210
[3] Chadda, A. (2006) “Destination India - the right choice
for the pharmaceutical industry”, Delhi Business Review Vol.
7, No. 1 (January - June 2006) pp 1-8
[4] Chaturvedi, K. and Chataway, J., (2006) , “ Innovation In
The Post-Trips Regime In Indian Pharmaceutical Firms:
Implications For Pharmaceutical Innovation Model”,
International Journal of Business Innovation and Research,
Volume 1, Number 1-2 , pp 27-50.
[5] Gupta, Desh Bandhu, (2007), “Exciting Opportunities for
the Indian Pharmaceutical Industry”, Indian Chemical Engineer,
Vol. 49 No. 2 April-June 2007, pp. 154-157
[6] Lanjouw, J.O., and Cockburn, I.M. (2001) “New pills for
poor people? Empirical evidence after GATT”, World
Development, 29(2) February, 265-289.
[7] Neeraj Dixit “A study of change in marketing strategies
of Indian Pharmaceutical Companies under the WTO regime”.
[8]http://www.freepatentsonline.com/article/International-
Journal-Business-Research/190616992.html.
[9] Demosthenes Lorandos, P.C, “Changes in India's Patent Law
and its Repercussions on the Global Drug Industry”
[10]
74

http://www.lorandoslaw.com/Publications/Changes
-in-Indias-atent-Law.shtml
[11] M. Qaiser, and P. Mohan Chandran, “What is Indian
Pharma's Next Move?”
http://www.ipfrontline.com/depts/article.aspx?id=6775&deptid=6
[12] Sahana Ghosh, “Outsourcing
Clinical Research”
[13]http://www.hindu.com/biz/
2004/01/19/stories/2004011900261500.htm
[16] Mishra P., and Chandra T. (2010) “Mergers, Acquisitions
and Firm’s Performance: Experience of Indian Pharmaceutical
Industry”, Eurasian Journal of Business and Economics 3(5),
111-126.
[17] Ravi Kiran and Mishra, Sunita (2010) “New IPR Regime and
Challenges of the Small Pharma Industry”, Interdisciplinary
journal of Contemporary Research in Business, Vol.1, No 10.
pp 42-60.
75

76