reading the periodical essay in - RUcore - Rutgers University
Upload
khangminh22Category
view
0download
0
RECORDED JUSTICE: A RANDOMIZED CONTROLLED TRIAL OF THE EFFECT
OF BODY-WORN CAMERAS (BWCs) ON POLICE AND CITIZENS
By
MUSTAFA DEMIR
A Dissertation submitted to the
Graduate School-Newark
Rutgers, The State University of New Jersey
In partial fulfillment of the requirements
For the degree of
Doctor of Philosophy
Graduate Program in Criminal Justice
written under the direction of
Dr. Robert Apel
and approved by
________________________
Dr. Robert Apel
________________________ Dr. Anthony Braga
________________________
Dr. Rod K. Brunson
________________________ Dr. Barak Ariel
Newark, New Jersey
May 2016

Copyright page:
© 2016
Mustafa Demir
ALL RIGHTS RESERVED

ii
ABSTRACT OF THE DISSERTATION Recorded Justice: A Randomized Controlled Trial of the Effect of Body-Worn Cameras
(BWCs) on Police and Citizens
By MUSTAFA DEMIR
Dissertation Director Dr. Robert Apel
The perceived benefits of body-worn cameras (BWCs) are grounded in self-
awareness theory, which argues that when people are aware that they are being watched,
they modify their behavior, exhibit more socially-acceptable behavior, and cooperate
more fully with the rules (Duval & Wicklund, 1972). BWCs also increase certainty
(Ariel, 2013). Thus, BWCs have deterrent effect on those being watched since everything
is recorded and can be used as evidence against them.
It is argued that the use of BWCs is an excellent tool to help improve police and
citizen behavior (Ramirez, 2014). However, so far, a rigorous study has not been
conducted to investigate the effect of BWCs on police legitimacy, procedurally just
policing, citizen behavior (compliance and cooperation) (White, 2014), trust and
confidence in police, and satisfaction (Roy, 2014).
This study, believed to be the first study of its kind in the literature, investigated
the effect of using BWCs on police and citizens during traffic stops. More specifically,

iii
this study experimentally tested the impact of BWCs on police legitimacy, traffic police
legitimacy, procedural justice, general compliance, specific compliance, cooperation,
satisfaction, and citizen perceptions of police.
A randomized controlled trial (RCT) was conducted. Drivers assigned randomly
to the experimental group encountered traffic police officers wearing BWCs, whereas
those assigned to the control group encountered traffic police officers not wearing a
BWC. After the initial encounter, drivers were asked to participate in a survey. The
sample size was 299 for the experimental group and 325 for the control group, with 624
participants in total. In addition, the data on complaints about traffic tickets were
collected as external data.
Both bivariate and multivariate analyses indicated that BWCs had a statistically
significant positive impact on all outcomes. In addition, no complaints about traffic
tickets were received from the drivers in the experimental group, whereas six complaints
about traffic tickets were received from drivers in the control group during the study
period. To conclude, BWCs have positive impact on the behavior of both police and
drivers. Thus, a new policing strategy, “Recorded Just Policing,” should be implemented
by police departments.

iv
Acknowledgements I would like to express my gratitude to many people who provided support and
assistance in completing my doctoral program. There are many heroes behind this
success, and they deserve to be acknowledged.
I would like to start with my distinguished and respected dissertation committee
members, Dr. Robert Apel, Dr. Anthony Braga, Dr. Rod Brunson, and Dr. Barak Ariel. I
am honored and proud to have been the student of such a great committee. I thank them
all for their on-going support, encouragement, patience, understanding, tolerance, and
expertise, and for encouraging me to undertake such a unique study. Dr. Apel, Dr. Braga,
and Dr. Brunson’s doors were always open when I needed them, and this was greatly
appreciated. The contributions of Dr. Ariel, Professor at Cambridge University in the
U.K., were also much valued. Most especially, I would like to acknowledge my gratitude
to my advisor, Dr. Robert Apel, whose support and guidance on the dissertation was
unrivaled.
Next I would like to express my deep gratitude to the Turkish National Police for
providing me with the opportunity to complete a doctorate.
I would also like to thank Rutgers University Criminal Justice faculty members,
Jody Miller, Dr. Joel Miller, Dr. Ronald V. Clarke, Dr. Elizabeth Griffiths, Dr. Andres F.
Rengifo, Dr. Bonita Veysey, Dr. Norman Samuels, Dr. Leslie Kennedy, and Dr. Joel
Kaplan, for their support, as well as administration staff members Jimmy Camacho, Edith
Laurancin, Lawanda Thomas, Jane Balbek, and Dr. Sandra Wright for their kindness and
assistance with any issue.

v
I thank my friends, Marin Kurti, Kazim Ciris, Erkan Cicek, Murat Yelkovan,
Suray Duygulu, Ismail Onat, Fatih Bastug, Isa Karasioglu, and Ersan Emeksiz.
Most importantly, I would like to thank for my mom, late dad, and siblings for
their support in my life. In addition, I would like to thank my wife, Zahir, and lovely
children, Sena and Neva, for providing love, patience, support, and remarkable joy in my
life.
Last but not least, I beg forgiveness of all those whose names I have failed to
mention.
vi
Dedication
This dissertation is dedicated to my mother, late father, siblings, wife, and my wonderful
daughters, Sena and Neva.

vii
TABLE OF CONTENTS
ABSTRACT OF THE DISSERTATION ........................................................................... ii
Acknowledgements ............................................................................................................ iv
CHAPTER 1: INTRODUCTION ....................................................................................... 1
1.1 Background of the Study .......................................................................................... 2
1.2 Statement of Problem ................................................................................................ 4
1.3 Significance of the Study ........................................................................................ 10
1.4 Contribution to Existing Literature ......................................................................... 14
CHAPTER 2: LITERATURE REVIEW .......................................................................... 17
2.1 Traffic Police in Turkey .......................................................................................... 17
2.2 The History of Camera Use in Policing .................................................................. 20
2.3 Theoretical Background .......................................................................................... 24
2.3.1 Self-Awareness Theory .................................................................................... 25
2.3.2 Deterrence Theory ........................................................................................... 26
2.4 Eye Images: The Effect of Being Watched ............................................................. 28
2.4.1 Studies in Laboratory Settings ......................................................................... 29
2.4.2 Studies in Real-World Settings ........................................................................ 29
2.5.1 Closed Circuit Television (CCTV) and Speed Cameras ...................................... 31
2.5.2 In-car Cameras ................................................................................................. 32
2.5.3 Body-Worn Cameras (BWCs) ......................................................................... 34
2.6 The Effects of Body Worn Cameras (BWCs) ......................................................... 35
2.6.1 Compliance and Cooperation ........................................................................... 35
2.6.2 Procedural Justice and Legitimacy .................................................................. 37

viii
2.6.3 Satisfaction ....................................................................................................... 40
2.6.4 Citizen Complaints ........................................................................................... 41
2.6.5 Use of Force ..................................................................................................... 45
2.7 Summary, Research Questions, and Hypotheses .................................................... 45
CHAPTER 3: METHOD .................................................................................................. 49
3.1 Research Setting ...................................................................................................... 49
3.2 Apparatus ................................................................................................................ 50
3.3. Research Design ..................................................................................................... 51
3.4 Random Assignment ............................................................................................... 51
3.5 Procedures ............................................................................................................... 54
3.6 Sample ..................................................................................................................... 57
3.7 Data ......................................................................................................................... 58
3.8 Measures ................................................................................................................. 59
CHAPTER 4: ANALYSIS AND RESULTS ................................................................... 63
4.1 Analytical Strategy .................................................................................................. 63
4.2 Analysis of Delivering the Experimental Condition with Fidelity ......................... 65
4.3 Comparison of Demographic Characteristics Between Traffic Police Officers in the
Study and Traffic Police Officers Not in the Study ...................................................... 66
4.4 Equivalence between the Experimental Group and the Control Group .................. 67
4.5 Principal Components Analysis and Scale Reliability ............................................ 69
4.6 Univariate Analysis ................................................................................................. 70
4.7 Bivariate Analysis ................................................................................................... 71
4.8 Multivariate Analysis .............................................................................................. 72

ix
4.8.1 Assumption Tests for OLS Regression ............................................................ 73
4.8.2 Model 1: Procedural Justice ............................................................................. 75
4.8.3 Model 2: Traffic Police Legitimacy ................................................................. 75
4.8.4 Model 3: Police Legitimacy ............................................................................. 76
4.8.5 Model 4: Cooperation ...................................................................................... 76
4.8.6 Model 5: General Compliance ......................................................................... 76
4.8.7 Model 6: Specific Compliance ......................................................................... 77
4.8.8 Model 7: Satisfaction ....................................................................................... 77
4.8.9 Model 8: Perception of Police .......................................................................... 77
4.9 Mediation Analysis ................................................................................................. 78
4.10 Citizen Complaints about Traffic Tickets ............................................................. 80
CHAPTER 5: DISCUSSION AND CONCLUSION ....................................................... 82
5.1 Summary of Findings .............................................................................................. 82
5.2 Policy Implications ................................................................................................. 88
5.3 Limitations of the Study and Suggestions for Future Research .............................. 96
5.4 Conclusion .............................................................................................................. 98
REFERENCES ............................................................................................................... 100
APPENDIX A: Survey on the Effect of Body Worn Camera (BWC) on Police and
Citizen ............................................................................................................................. 121
LIST OF FIGURES ........................................................................................................ 129
Figure 1: Unusual Data ............................................................................................... 129
Figure 2: Histograms of Residuals .............................................................................. 130
Figure 3: Heteroskedasticity ....................................................................................... 131

x
Figure 4: Linearity between Income and Dependent Variables .................................. 132
Figure 5: Linearity between Years of Driving and Dependent Variables .................. 133
LIST OF TABLES .......................................................................................................... 134
Table 1: Response Rate and Reasons for Rejection to Participate in the Survey ....... 134
Table 2: Comparison of Demographic Characteristics of Traffic Police Officers ..... 135
Table 3: Comparison of Experimental Group with Control Group ............................ 136
Table 4: Principal Component Analysis: Correlation Matrices .................................. 137
Table 5: Principal Component Analysis: Factor Loading, Cronbach’s Alpha, and
Eigenvalue for Latent Variables (N=624) .................................................................. 138
Table 6: Descriptive Statistics (N=624) ...................................................................... 139
Table 7: Results of the Independent Samples t-Tests (N=624) .................................. 140
Table 8: Bivariate Correlations among the 14 independent variables (N=624) ......... 141
Table 9: VIF Table for Multicollinearity (N=624) ..................................................... 142
Table 10:Numerical tests for Normality, Heteroskedasticity, and Model Specification
..................................................................................................................................... 143
Table 11: Results of Regression Tests for Model 1: Procedural Justice ..................... 144
Table 12: Results of Regression Tests for Model 2: Traffic Police Legitimacy ........ 145
Table 13: Results of Regression Tests for Model 3: Police Legitimacy ..................... 146
Table 14: Results of Regression Tests for Model 4: Cooperation .............................. 147
Table 15: Results of Regression Tests for Model 5: General Compliance ................. 148
Table 16: Results of Regression Tests for Model 6: Specific Compliance ................ 149
Table 17: Results of Regression Tests for Model 7: Satisfaction ............................... 150
Table 18: Results of Regression Tests for Model 8: Perception of Police ................. 151

xi
Table 19: The effects of BWCs on the Intervening Variables .................................... 152
Table 20: VIF table for Collinearity for Mediation Analyses ..................................... 153
Table 21: The effect of BWCs on the Distal Outcomes ............................................. 154
Table 22: The Effect of BWCs on Police (Traffic) Legitimacy when Controlling for
Procedural Justice ....................................................................................................... 155
Table 23: Results of Regression with Robust Standard Error Test for All Models .... 156

1
CHAPTER 1: INTRODUCTION
The primary goal of police organizations is to provide safety to citizens. Since the
1970s, police departments in the United States (U.S.) have attempted to accomplish this
significant goal by adopting new innovative police practices, including community
policing, problem oriented policing, hot spots policing, and focused deterrence policing,
among others (Weisburd & Braga, 2006). Compared to their predecessors, the police in
the 21st century are more professional, better educated, and more successful at providing
quality safety service for citizens (Braga & Weisburd, 2010; Skogan & Frydl, 2004;
Weisburd & Braga, 2006).
To enhance the quality of safety service, technological innovations such as
License Plate Readers (LPR), DNA testing, and Automated Fingerprint Identification
Systems (AFIS) have been introduced to police agencies (IACP, 2004; Koper, Sluder, &
Alpert, 2014; PERF, 2012). Among the technological innovations, video surveillance
technology has been popular and includes the use of cameras such as in-car cameras and
body-worn cameras (IACP, 2014). The available empirical research suggests that in-car
cameras and BWCs have similar effects. More specifically, the use of cameras increases
transparency, police legitimacy, accountability, and professionalism. Camera use has also
demonstrated benefits with respect to the collection of evidence for arrest and
prosecution, the volume of citizen complaints about police misconduct, police use of
force, and assaults on police officers (Howland, 2011; IACP, 2004; Schultz, 2008; White,
2014).
The purpose of this research is to test the impact of body-worn cameras (hereafter
BWCs) on police behavior and driver behavior during traffic stops in Turkey. More

2
specifically, the research focuses on whether the use of BWCs has a measurable impact
on driver perceptions of police legitimacy, procedurally just policing, and satisfaction
with police. The research also investigates whether BWCs alter driver behavior toward
police officers. More specifically, the research tests whether BWCs increase driver
compliance with police commands during traffic stops as well as cooperation with police
and compliance with traffic laws in the long run.
1.1 Background of the Study
The literature contends that BWCs enhance legitimacy and procedurally just
policing (White, 2014). Legitimacy refers to a belief that the person enforcing the law has
the right to dictate behavior; thus, s/he is willing to comply with directives of the
authority figure and the law in general (Tyler, 1990). Legitimacy is grounded in
procedural justice, which focuses on the fairness of procedures and the fairness of
outcomes (Tyler, 1990). Namely, when police treat citizens with dignity and respect, and
do so politely and fairly, allowing citizens to explain their side of the story and explaining
the reason and importance of police activity, citizens are more likely to follow the rules
and cooperate with directives (Tyler, 2007; Tyler & Fagan, 2008; Sunshine & Tyler,
2003). If police are viewed as legitimate, the public is more likely to comply with the
directives of police officers and the law (Tyler, 1990). If people do not view police as
legitimate, they are less likely to abide by the law and directives of police officers (Tyler,
1990). Empirical studies show that procedural justice shapes views of police legitimacy,
and in turn, police legitimacy promotes citizen cooperation with police and compliance
with police directives (Tyler, 1990, 2007; Tyler & Fagan, 2008; Sunshine & Tyler, 2003).
Police legitimacy is important for police–citizen encounters because successful

3
and effective policing relies on the ability of police to obtain compliance and cooperation
from the public (Sunshine & Tyler, 2003; Tyler, 1990). For police to successfully
maintain order, they expect citizens to comply with both their directives and the law in
general (Sargeant, Murphy, Davis, & Mazerolle, 2012). BWCs lead police officers to
behave in a procedurally just way and lead citizens to comply and cooperate with police
(White, 2014). As a result, compliance and cooperation with police increase.
The perceived benefits of BWCs are grounded in self-awareness theory, which
argues that when human beings are under observation, they modify their behavior, exhibit
more socially-acceptable behavior, and cooperate more fully with the rules (Duval &
Wicklund, 1972). Thus, BWCs increase self-awareness and certainty, and they also make
people conscious that they are being watched and that their actions are recorded (Farrar &
Ariel, 2013). Hence, people are more likely to follow social norms and rules (Farrar &
Ariel, 2013).
It is argued that BWCs are an excellent tool to help improve police and citizen
behavior (Ramirez, 2014). However, so far, rigorous studies have not been conducted to
investigate the effect of BWCs on police legitimacy, procedural justice, and citizen
compliance and cooperation (White, 2014). To fill the gap in the literature, randomized
controlled trial was conducted in this study to test whether using BWCs ensures that
police officers behave in a procedurally-just way, increases police legitimacy, traffic
police legitimacy and satisfaction with police, and alters citizen behavior (compliance
and cooperation) and citizen perceptions of police during traffic stops.

4
1.2 Statement of Problem
Traffic safety is a very serious problem in Turkey. In the recent past, more than
one million traffic accidents have occurred on an annual basis (Trafik Hizmetleri
Baskanligi, 2014). Moreover, on average, each year 4,000 people are killed and 200,000
people are injured in traffic accidents (Trafik Hizmetleri Baskanligi, 2014). Research
suggests that 90% of traffic accidents result from human error (Peden et al., 2004). Thus,
to reduce traffic accidents, law enforcement initiatives are the most common means used
to modify driver behavior and promote traffic safety (Bates, Soole, & Watson, 2012;
OECD, 1997; Zaal, 1994). As in other countries, the Turkish National Police rely heavily
on effective traffic enforcement methods to prevent and reduce traffic accidents, injuries,
and fatalities. One such method, introduced in 2012, is the enforcement of traffic law
through BWCs. Yet doing so successfully requires that the public perceive police
authority to be legitimate and that it be willing to comply with police directives.
This is made difficult by the fact that police officers generally possess a bad
image in the eyes of the public in Turkey, and this is particularly the case for traffic
police officers (Dönmezer, 2011). Citizens are less likely to perceive that traffic police
officers treat people politely and follow the rules. However, traffic police officers are
expected to follow the law and departmental procedures and treat all citizens fairly,
politely, and respectfully (Dönmezer, 2011). Furthermore, studies on citizen attitudes
towards police in Turkey revealed that police were not respected by citizens and police–
community relations were unsatisfactory (Dönmezer, 2011).
Another fact that makes it difficult to modify driver behavior is that corruption is
viewed as widespread, particularly in traffic services (Cerrah, Çevik, Göksu, &

5
Balcıoglu, 2009; Prenzler, 2006). Police corruption is defined as the misuse of authority
to obtain a personal gain (Goldstein, 1977), taking bribes to provide a service to someone
(Kappeler, Sluder, & Alpert, 1998), or abusing authority physically or psychologically
(Carter, 1985). Traffic police officers are more exposed to temptations to be involved in
street corruption because they are the ones who are most frequently in contact with
citizens (Cerrah et al., 2009). Street or routine corruption refers to corruption that takes
place between police officers and citizens during daily and routine contact (Cerrah et al.,
2009). Public perceptions of police corruption undermine the integrity of police
departments (Cerrah et al., 2009) and the willingness of citizens to comply with the law
(Levi, Sacks, & Tyler, 2009). The reason for this is that citizens do not trust corrupt
police and do not view their authority as legitimate.
Police officers work virtually without direct supervision at the street level (Frydl
& Skogan, 2004). In the field, for instance, police officers in the U.S., particularly state
police and highway patrol officers, generally perform their work without supervision by
their superiors (IACP, 2004). This is generally the same for traffic police officers in
Turkey. In some instances, they return to traffic unit facilities. Insufficient or lack of
supervision may lead some police officers to abuse their power and authority. Video
evidence allows supervisors to monitor their personnel, especially police officers working
in remote areas (IACP, 2004).
Police are viewed as the gatekeepers to criminal justice (Gottfredson &
Gottfredson, 1988) and have wide discretion to exercise at the street level because of the
nature of police work (Brown & Frank, 2005; Frydl & Skogan, 2004). Police have
authority and power to issue citations, use force, and make arrests in encounters with

6
citizens (Frydl & Skogan, 2004). The abuse of discretion leads to police misconduct,
which refers to “when police do not adhere to the legal rules and thus violate the
established boundaries of acceptable behavior” (Ivkovic, 2005, p.547), 1 and such
behavior includes police corruption, police deviance, and excessive force (Lofca, 2002).
The perception of misconduct has been a major issue in policing (Porter & Prenzler,
2012; Walker, Archbold, & Herbst, 2002). However, it is difficult to supervise how
police officers exercise their discretion and to ensure whether they are lawful or fair in
dealing with citizens every day (Frydl & Skogan, 2004). Although most encounters
between police and citizens do not result in trouble, there are still a significant number of
people dissatisfied with the way police treat citizens (Frydl & Skogan, 2004). The more
lawful police are, the more citizens are likely to accept and embrace police actions,
support police work, and cooperate with police, all of which result in enhanced
community safety (Frydl & Skogan, 2004).
Particularly, traffic police officers are accused of abusing their broad discretion in
traffic enforcement (Lichtenberg, 2002). They have the authority to issue citations,
summons, arrest the motorist, give a written or verbal warning, or do nothing at all
(Lichtenberg, 2002). Even if a motorist violates a traffic rule, police may overlook or
may not enforce the law (Lichtenberg, 2002). According to studies in the U.S., 43% of all
stops resulted in a ticket (Bayley, 1994), and 54.2% of stops resulted in a summon
(Lichtenberg, 2002). Another study found that of the drivers stopped in 2008, 55% were
ticketed, 17% were issued a written warning, 15% were allowed to proceed with no
enforcement action, and 9.7% were given a verbal warning (Eith & Durose, 2011).
1 Champion (2001, p. 3) defined police misconduct as “committing a crime and/or not following police department policy guidelines and regulations in the course of one’s officer duties.”

7
Similarly, in Eskisehir, Turkey, between 2009 and 2013, one-third of all traffic stops
resulted in tickets. Citizen demeanor has an important influence on a traffic police
officer’s decision about whether to write a ticket or not (Lichtenberg, 2002). If a driver is
aggressive or disrespectful (Martinelli, 2006), impolite, abusive, or uncooperative, s/he is
more likely to receive a ticket (Lichtenberg, 2002). This suggests that traffic police
officers may abuse their power and authority according to citizen behavior. The public
may perceive the police as not treating people fairly and equally, and this lack of fairness
and uniformity in traffic enforcement might lead citizens to distrust the police. Part of the
problem stems from the inadequate of control mechanisms to help traffic police officers
understand whether they follow the rules or treat people fairly.
Police are regarded as the most visible face of government, and they are the ones
who encounter citizens most frequently (Frydl & Skogan, 2004; Mastrofski, Snipes, &
Supina, 1996). Particularly, traffic police officers encounter citizens daily, stop them, and
issue citations for violation of traffic law. Thus, a vehicle stop is the most frequent
contact that occurs between police and citizen (Hoover, Dowling, & Fenske, 1998). It is
estimated that there are over one hundred million traffic stops each year in the United
States (Lichtenberg, 2002). The data from a national survey suggested that of the 21% of
residents who had contact with police, about half were due to traffic stops (Greenfeld,
Smith, Durose, & Levin, 2001). Another study indicated that vehicle stops accounted for
59% of all public contact with police in 2008 (Eith & Durose, 2011).
Being a driver is also the most common reason for contact with police in Turkey.
In Turkey, about 32% of people over the age of 18 years have a driver license, which
means that one-third of the public has an opportunity to make contact with traffic police

8
officers (Trafik Hizmetleri Baskanligi, 2014; TUIK, 2014). In total, more than 85 million
traffic tickets were issued between 2004 and 2013 in Turkey (Trafik Hizmetleri
Baskanligi, 2014). Over the past five years, the number of tickets has increased by about
64% (Trafik Hizmetleri Baskanligi, 2014). However, studies show that there are more
traffic-related stops than recorded traffic tickets (Lichtenberg, 2002; Lichtenberg &
Smith, 2001). In other words, the number of motorists who make contact with traffic
police officers is between two (Bayley, 1994) or three times (Brown, 1981) as many as
the number of recorded tickets. The obvious challenge is that traffic police officers
perform many of their duties independently and not under direct supervision.
Traffic stops have a significant impact on how the public views police (Roberg,
Novak, Cordner, & Smith, 2015). In light of their volume, these police–citizen
encounters may promote or damage public perceptions of police legitimacy (Frydl &
Skogan, 2004), depending on how individual traffic officers carry out their duties during
encounters (Tyler & Darley, 1999). Thus, public views of police legitimacy are mostly
shaped by the behavior and actions of individual police officers during specific
encounters with citizens rather than the public’s general perception of police legitimacy
(Tyler & Darley, 1999). In addition, traffic police officers are expected to behave based
on procedural justice policing principles (Johnson, 2004). However, there is no control
mechanism to make sure they follow the principles of procedural justice.
The public’s perception of police use of force continues to be a concern (IACP,
2004). As pointed out by Mastrofski, Snipes, and Supina (1996), “Police are among the
most visible officials seeking compliance” (p. 270). There are two types of compliance:
specific compliance and general compliance (Mastrofski et al., 1996). Specific

9
compliance refers to following police requests during face-to-face encounters, whereas
general compliance refers citizens obeying laws such as traffic laws and tax laws
(Mastrofski et al., 1996). When police fail to secure compliance, they use force to compel
a person to comply with a request (IACP, 2004; Mastrofski et al., 1996). Using force may
escalate confrontational situations between police and citizens. Thus, police departments
seek alternative enforcement practices that can produce compliance rather than deterring
people by using force (Mastrofski et al., 1996). BWCs can make police–citizen
interactions conducive to compliance strategies.
A large number of complaints against police officers is another issue that needs to
be addressed (IACP, 2004). Police officers have wide discretion that may lead them to
bend or break the rules if they want (Wagner & Decker, 1997). Police officers expect
people to follow their directives and they use force to secure compliance when needed.
When force is used, citizens become dissatisfied with the interaction and are more likely
to file complaints. Thus, citizen complaints against police officers are inevitable because
of the result of the often confrontational nature of police–citizen interactions (Walker et
al., 2002). In the U.S., the majority of complaints include rudeness, lack of courtesy, or
failure to provide adequate service (Walker et al., 2002), as well as excessive force,
improper procedures, and prejudicial conduct (Proctor, Rosenthal, Monitor, &
Clemmons, 2009), and there is a widespread perception among racial and ethnic
minorities that police departments do not effectively address citizen complaints (Walker
et al., 2002). Lack of corroborating and concrete evidence, such as video evidence, may
lead most complaints to be sustained, which results in dissatisfaction among both the
complainant and police officers (Walker et al., 2002). The complainant is not satisfied

10
because the complaints have not been taken seriously and addressed thoroughly or fairly
(Walker et al., 2002). For instance, in England and Wales, the percentage of the
complainants who were not satisfied with the way their complaint was handled was
between 70% and 90% (Porter & Prenzler, 2012). Dissatisfaction with the process of
handling complaints undermines public trust and confidence in police (Porter & Prenzler,
2012). The police officer also feels that s/he has been under investigation for groundless
allegations (Walker et al., 2002), which demotivates police officers from performing their
job passionately.
Traffic police officers are frequently assaulted and involved in traffic accidents
while on duty (IACP, 2004; NLECTC & United States of America, 2012). Traffic stops
are assumed to be a danger to police officers by the United States Supreme Court,
although the relative risk of traffic police officer homicides and assaults were found to be
very low compared to those involving other types of police officers (Lichtenberg &
Smith, 2001). However, between 2004 and 2013, 122 police officers were killed during
traffic stops, whereas 520 law enforcement officers were killed by guns (ODMP, 2014).
This suggests that traffic stops are dangerous for traffic police officers, which needs to be
addressed.
1.3 Significance of the Study
The study is important for several reasons. BWC technology received significant
media attention in 2013 in the United States (Fangman, 2013). For example, in August
2013, the Federal District Court in Manhattan ruled that the New York Police
Department’s (NYPD) stop, question, and frisk (SQF) program was unconstitutional, and
as part of the ruling, the judge ordered police officers in the highest volume SQF

11
precincts to wear cameras to prevent racial profiling (Floyd v. City of New York, 2013).
Additionally, in the wake of tragic police shooting of Michael Brown in 2014 in
Ferguson, Missouri, many citizens have taken to protesting what they regard as unjust
police practices (Justin & Jacob, 2014). What actually transpired during the lethal
encounter remains unknown.
In response to public opinion, a federal bill has been proposed that would require
all state and local police departments to use BWCs (Waters, 2014). And President Barack
Obama, in December 2014, launched a “Community Policing Initiative” to build, fortify,
and maintain trust between communities and law enforcement agencies (The White
House, 2014). As a part of this initiative, a new “Body Worn Camera Partnership
Program” has been initiated. Over three years, the program will provide $75 million to
law enforcement agencies to purchase 50,000 body-worn cameras (The White House,
2014). It is therefore crucial to investigate the effect of BWCs on police and citizen
behavior as the results of the study can lead decision makers to develop new policies
about the use of BWCs.
In Turkey, BWCs have been used in traffic enforcement units since 2012. The use
of BWCs was initiated as a pilot study and later spread with the introduction of a project
called “The Transparency and Safety in Traffic Project” by the Turkish National Police
(Adana Emniyet Mudurlugu, 2014). One of the purposes of the project is to reduce and
impede the problems, complaints, and allegations that transpire between police and
citizens during traffic enforcement (Adana Emniyet Mudurlugu, 2014). Another purpose
of the project is to create a transparent and effective traffic enforcement environment
(Adana Emniyet Mudurlugu, 2014). The records of the encounters may be able to be used

12
as evidence for internal and judicial investigations when requested (Adana Emniyet
Mudurlugu, 2014). However, the impact or effectiveness of the project for traffic police
has not been tested so far in any way, despite the expense of deploying and maintaining
BWCs. Therefore, it is worthwhile to investigate its impact on police and driver behavior.
Finally, the investment and interest in using BWCs has dramatically increased in
more recent years. Thus, the need for BWCs should be evaluated quantitatively so that
evidence-based policy decisions can be made (Ramirez, 2014). By using randomized
experiments, the effectiveness of the intervention can be established and compared
(Ramirez, 2014).
Thus, the findings of the present are expected to have great impact on policy
implications. First of all, as previously mentioned, traffic police officers are the ones who
make contact with citizens most frequently compared to other type of police officers.
Police officers have power and authority to use force when dealing with citizens, and
they may abuse their authority and behave improperly in a way that increases the number
of complaints against police officers. However, citizens expect police to be impartial,
fair, effective, and restrained in their use of authority (Frydl & Skogan, 2004). A study
conducted in Virginia suggested that police officers who showed disrespect were less
likely to obtain compliance (Mastrofski et al., 1996). Thus, police behavior towards
drivers and driver behavior towards traffic police officers play crucial roles for escalating
or deescalating encounters that transpire every day. BWCs can possibly change police
and driver behavior when they are aware that their actions are being recorded. The
camera system can also help prevent the abuse of police discretion (IACP, 2004).
Second, the use of BWCs assists police departments in being more accountable

13
and transparent (Ramirez, 2014). Transparency protects the public image of police
departments (Martinelli, 2006) by increasing confidence, which is crucial for the police to
function effectively (Cao & Burton, 2006). The camera system also helps increase the
integrity of police departments (IACP, 2004).
Third, the use of BWCs requires investment. Thus, cost/benefit analysis of BWCs
should be conducted to determine the technology in which money should be invested
(Koper et al., 2014). In other words, whether BWCs produce the desired effects should be
investigated compared to its costs.
Fourth, citizens expect traffic police officers to behave in a procedurally just way
(Engel, 2005). Procedural justice promotes legitimacy, in turn, increasing compliance and
cooperation (Sunshine & Tyler, 2003; Tyler, 1990). BWCs are assumed to increase
procedurally just policing, police legitimacy, and compliance and cooperation with
police. When traffic police officers are aware that their behavior is recorded, they are
more likely to treat drivers politely, fairly, respectfully, and follow the rules. Daily
police–citizen encounters may be an opportunity to improve the perception of procedural
justice (Engel, 2005; Sargeant et al., 2012). If citizens view police as legitimate during
police–citizen encounters, they are more likely to comply with police directives and, in
the long run, they are more likely to follow the law and cooperate with police (Sargeant
et al., 2012). The use of BWCs increases procedurally just policing, legitimacy,
cooperation between police and citizens, and compliance. As a result, effective and
successful policing can be achieved.
Fifth, BWCs may be effective for combatting police corruption (Sahin, 2010). A
study on police corruption in Turkey showed that, to prevent corruption among traffic

14
police officers, 57.9% of the respondents reported that technological devices should be
used and 74.4% reported that traffic police officers should issue citations to everyone
involved in a traffic violation (Cerrah et al., 2009). BWCs lead traffic police officers to
treat people fairly and equally and abide by the rules and laws.
Sixth, the use of BWCs may promote police officer safety because they can deter
potential offenders from attacking police officers and provide video evidence that may
help convict offenders (Draisin, 2011; NLECTC & United States of America, 2012).
Finally, studies have shown that most citizens form their opinion of police based
on police behavior during a 10-minute traffic stop (Calahan & Kersten, 2005; Woodhull,
1994). A traffic stop may be the only form of interaction that some citizens have with
police (Woodhull, 1994). These short-lived encounters are an opportunity for police to
build trust and confidence (Goodman-Delahunty, 2010). It was found that the initial
presentation during an encounter between police and citizen(s) is a key determinant of
what will transpire (Bayley, 1986; Fyfe, 1986), and policing style determines the quality
of interactions between police and citizens (Birgden & Julio, 2011). Thus, the use of
BWCs is a good tool to improve police and citizen behavior (Ramirez, 2014).
1.4 Contribution to Existing Literature
This research makes a distinct contribution to existing literature. First of all, this
study is the first of its kind to be conducted in Turkey, as well as the first study in the
literature (to author’s knowledge) that experimentally tests the impact of BWCs on police
legitimacy, procedural justice, satisfaction with police, driver compliance and
cooperation, and citizen perceptions of police. To date, empirical studies of BWCs have
investigated their impact on the use of force, citizen complaints, the speed of resolutions

15
to complaints, concrete evidence for arrest and prosecution, and police officer safety
(Farrar & Ariel, 2013; Goodall, 2007; MPD, 2013; ODS Consulting, 2011; Roy, 2014;
White, 2013). Although almost all of these studies claim that BWCs enhance
transparency, citizen views of police legitimacy, and procedural justice, none has actually
tested the effect of BWCs on these outcomes (White, 2014). In addition, as White (2014)
points out, “there have been virtually no studies of citizens’ views of the technology” (p.
6). Thus, in his assessment of BWCs in policing, White (2014) suggested that research on
the impact of BWCs should include citizen surveys that measure perceptions of the
technology, particularly with regard to satisfaction, trust, transparency, and legitimacy.
Second, this study also will be the first to investigate the impact of BWCs on
citizen behavior in order to understand the dynamics of police–citizen interactions. Prior
studies found that BWCs reduce use of force and citizen complaints, suggesting that
BWCs improve police behavior (Farrar & Ariel, 2013; Goodall, 2007; MPD, 2013; ODS
Consulting, 2011; White, 2013). However, BWCs are also theorized to improve citizen
behavior (Farrar & Ariel, 2013; White, 2014). Thus, the behavior dynamics that explain
the decline in the number of complaints and the use of force remain unknown (Farrar &
Ariel, 2013; White, 2014). The drop in use of force and complaints may be the result of
improved police behavior (e.g., officers tend to use less force or treat people politely and
respectfully), improved citizen behavior (e.g., citizens are less aggressive), or both
(Farrar & Ariel, 2013; White, 2014). This is an important avenue for investigation. The
drop in the number of complaints may also be due to the video evidence provided by
BWCs because evidence suggests that BWCs reduce frivolous complaints by citizens
against police officers wearing BWCs (Ariel, Farrar, & Sutherland, 2014; Coppola, 2010;

16
Farrar & Ariel, 2013; Goodall 2007; White, 2014). Citizens are more likely to cooperate
with police when they are aware that their actions are recorded (Farrar & Ariel, 2013).
Thus, Farrar and Ariel (2013) proposed that the impact of BWCs on citizen behavior
should also be tested empirically. However, available research does not sufficiently
explain the decline in the number of complaints and the number incidences in which
force was used (Farrar & Ariel, 2013). Thus, this study will unravel these effects, identify
the underlying dynamics of behavior, and fill this gap in the research.
Third, there is a lack of research that investigates whether BWCs have an impact
on routine police–citizen interactions and whether BWCs increase trust and confidence in
police and satisfaction (Roy, 2014). This study experimentally tests the impact of BWCs
on these very outcomes in the context of traffic stops.
Finally, unlike previous studies of BWCs, this study is designed to conduct a
randomized controlled trial, which is the most rigorous design and is frequently
considered to be the “gold standard” in evaluation (Lanier & Briggs, 2014; Shadish,
Cook, & Campbell, 2002; Trochim & Donnelly, 2006). Without a controlled experiment,
alternative explanations will always be present. Most of the previous studies possess
significant methodological limitations. Either some of them do not have a comparison
group (Goodall, 2007; ODS Consulting, 2011) or some of them are not independent
studies (Farrar & Ariel, 2013; MPD, 2013). The lack of rigorous, independent studies that
employ experimental methods has limited overall understanding of the real impacts of
BWCs (White, 2014).

17
CHAPTER 2: LITERATURE REVIEW
In order to situate this study in the existing scholarship, this chapter provides a
detailed review of the literature pertaining to the use of BWCs on police and citizen
behavior and citizen perceptions, the subject of this dissertation. In particular, it first
explores the existing scholarship on traffic police and traffic stops in Turkey. It then turns
to the scholarship on the historical development of the use of cameras in policing,
theoretical explanation of the effects of the use of camera, and the effects of being
watched including eye images, CCTV and speed cameras, and BWCs on people. It closes
with a brief discussion of the research questions and hypotheses tested in the study.
2.1 Traffic Police in Turkey
The Turkish National Police has specific, designated traffic police units whose
primary responsibility is the enforcing of traffic laws. There are two different traffic
enforcement units in Turkey: the Regional Traffic Enforcement Unit and the Traffic
Enforcement Unit. The Regional Traffic Enforcement Unit is responsible for the
highways/motorways, while the Traffic Enforcement Unit is in charge of residential
roads. Both units are responsible for preventing and investigating traffic accidents;
enforcing traffic laws; regulating traffic; checking documents such as registration,
insurance, driver license, and vehicle ownership; and issuing tickets to the drivers who
violate traffic rules (Eskisehir Emniyet Mudurlugu, 2014).
In Turkey, in business-as-usual traffic stops, traffic police officers use cones
along the highway to mark checkpoints and direct drivers where to stop. One police
officer pulls over, stops vehicles, and asks for the documents including registration,
insurance, title, and driver’s license. This officer gives the documents to a second police

18
officer waiting in the police vehicle, who then calls the dispatch center and provides the
necessary information about the driver and the vehicle. The police officer in the dispatch
center informs the on-site officers about all the documents in the system, including traffic
stops. If a ticket is to be issued, this fact is transmitted to the dispatch center so that it can
be recorded in the database. The driver signs the ticket and the documents are returned to
the driver, after which the driver is free to leave.
In the eyes of the public, corruption is viewed as widespread among traffic police
officers in Turkey. According to a study conducted in Turkey’s three largest cities
(Istanbul, Ankara, and Izmir), street/routine corruption is perceived to be prevalent
among traffic police officers (Cerrah et al., 2009). The researchers found that it was very
difficult to detect minor corruption among traffic police officers, and either citizens or
police prepared the grounds for corruption to occur. They also found that out of 481
citizen survey respondents, 3% of them reported that they offered bribes to traffic police
officers, 7% reported that traffic police officers asked for bribes, and, of the latter, 81%
reported that they consented to the bribery. In addition, 27% of the respondents reported
that illegal or unethical demands were made of them by the traffic police officers. The
study also revealed that 11% of respondents would offer money or goods if they violated
a traffic rule in order not to pay for traffic tickets.
A study of citizen attitudes towards police in Turkey involving 500 respondents
revealed that the public perception of police was negative (Dönmezer, 2011). More
specifically, the respondents reported that they did not respect police (24%), did not trust
police (58%), and their attitudes towards police changed negatively over the last decade
(91%). Furthermore, the respondents believed that police were ineffective (58%) and

19
police community relations were unsatisfactory (66%). The same study also suggested
that public perceptions of traffic police legitimacy were very low (Dönmezer, 2011).
A vehicle stop is the most frequent form of contact between police and citizens
(Hoover et al., 1998), and this is true in Turkey as well. As shown in Exhibit 1, more than
85 million traffic tickets were issued by traffic police officers between 2004 and 2013 in
Turkey (Trafik Hizmetleri Baskanligi, 2014). The number of tickets issued has also
dramatically increased by about 64% over the past five years (Trafik Hizmetleri
Baskanligi, 2014). When the number of traffic-related stops that did not result in ticket is
considered, the number of vehicle stops is even higher in Turkey.
The number of licensed drivers in Turkey has soared to almost 25 million in 2013,
representing about 32% of the Turkish population (Trafik Hizmetleri Baskanligi, 2014;
TUIK, 2014). That suggests that about one of every three citizens has an opportunity to
Exhibit 1. Number of Traffic Tickets Issued by Traffic Police Officers in Turkey
Data source: Adapted from Denetleme Faaliyetleri, by Trafik Hizmetleri Baskanligi, 2014, available online <http://www.trafik.gov.tr/Sayfalar/Istatistikler/denetim1.aspx>.

20
interact with a traffic police officer as a licensed driver. If passengers that witness the
interaction between driver and police are included in the number, it is estimated that
about half of the Turkish population has some likelihood of experiencing police
interaction directly or vicariously.
Traffic stops have a significant impact on citizen perceptions of police (Roberg et
al., 2015). In light of their volume, these police–citizen encounters may promote or
damage public perceptions of police legitimacy (Frydl & Skogan, 2004), depending on
how individual traffic officers carry out their duties during encounters (Tyler & Darley,
1999). The interaction between citizens and police should be satisfactory and traffic stops
may be an opportunity to enhance the relationship between police and citizens. The
obvious challenge is that traffic police officers perform many of their duties
independently and not under direct supervision.
2.2 The History of Camera Use in Policing
Technological advancements have shaped policing in many important ways over
the years. In the 13th century, the “hue and cry” was used to summon all males to assist
the constable when a serious disturbance took place (Uchida, 2004). In the 17th and 18th
centuries, the hue and cry was also used by the night watch in larger cities such as New
York, Boston, and Philadelphia (Uchida, 2004). In the 1850s, telegraph lines were used to
link district stations to headquarters and call boxes on the beat were introduced in the late
19th century (Lane, 1980). In the 1900s, two-way radio communications and computer
aided dispatch system were introduced (Douthit, 1975; Koper et al., 2014; Lane, 1980).
In recent decades, many new technological innovations have been introduced in
policing. Information technology (IT) and analytic systems have been used to predict and

21
prevent crime (PERF, 2012). License plate readers (LPR) have been used to scan and tag
cars that have been stolen or have parking violations (Koper et al., 2014; PERF, 2012;
Roman et al., 2008). DNA testing (Koper et al., 2014; Roman et al., 2008; Wilson,
Weisburd, & McClure, 2011) and Automated Fingerprint Identification Systems (AFIS)
(IACP, 2004) have been used to identify the perpetrator of a crime. Wireless Video
Streaming to transmit the video from the scene of an incident and Global Positioning
System (GPS) to track suspects and police vehicles have been used (PERF, 2012). Report
Management Systems (RMS) have been initiated for taking reports, retrieving
information, and crime mapping (IACP, 2004). Mobile Data Terminals (MDTs) enable
police officers to access the National Crime Information Center, state, and local data
from their vehicles (IACP, 2004). TASER has been adopted as a device in use of force
(Sousa, Ready, & Ault, 2010). Police departments use social media, including Facebook,
Twitter, Nixle, Youtube, and MySpace, to share information with the public or receive
crime tips or other information from the public for investigations (PERF, 2014). Other
technological innovations, such as mechanisms for improving their efficiency and
effectiveness, hot spot analysis, and COMPSTAT, have also been used by police
agencies (Braga, Papchristos, & Hureau 2012; Braga & Weisburd, 2010; Weisburd et al.,
2003).
Advances in technology have also enabled police departments to use video
surveillance system for several decades. In Britain, CCTVs were introduced to regulate
behavior at traffic lights in 1956, and pan-tilt cameras were used to monitor crowds
during visits to Parliament in Trafalgar Square in 1960 (Norris, McCahill, & Wood,
2004). During the 1970s and 1980s, the use of CCTV in Britain was used just to monitor

22
marginal groups such as football hooligans and political demonstrators. In 1985, the first
large-scale public space surveillance system was established (Norris et al., 2004).
In the U.S., videotape-recording systems first appeared in the early 1960s (IACP,
2004). However, at this time, video technology was not conducive to mount cameras in
police vehicles because of its large size (IACP, 2004). In the late 1960s, the Connecticut
State Police was the first police department to attempt to use a video camera and recorder
in a patrol car (IACP, 2004). Technology in the field of audio/visual recordings advanced
rapidly (Newburn & Hayman, 2012; Nichols, International Association of Chiefs of
Police, & United States of America, 2001). By the early 1980s, a self-contained Beta
audio/visual recording system was developed, which was regarded as a revolution in the
recording industry (IACP, 2004). The introduction of the VHS recorder and tape was the
next evolution of the mobile video recorder system, followed by the introduction of 8 mm
camcorders (IACP, 2004).
Cameras have been increasingly used as a video surveillance mechanism and
observation both by citizens and police (Nichols et al., 2001; White, 2014). They are an
important tool used in policing for crime prevention, investigation, and monitoring
interactions between police and citizens (PERF, 2012). In-car cameras are the most
frequently used video surveillance and observation tools within police agencies. There
are several motivations for using in-car cameras, but racial bias and racial profiling are
the most important ones (IACP, 2004). State police agencies became the hub of
complaints of racial profiling due to the allegations of racial profiling in traffic stops. The
verdicts of the courts proved that racial profiling did occur in some cases and this
increased public perceptions of racial profiling by police (IACP, 2004). Another

23
important motivation concerned assaults on police officers. The Department of Justice,
Office of Community Oriented Policing Services (COPS), recognized that in-car cameras
would be effective for officer safety and in addressing allegations of racial profiling
while enhancing the public trust (IACP, 2004; Westphal, 2004).
In response to successful use of in-car cameras in the prosecution of drunk driving
and drug possession, state and federal legislative bodies required all police agencies to
capture encounters between police and citizens during all traffic stops to prevent racial
profiling and to protect police officers from being assaulted (IACP, 2004). The COPS
Office initiated the “In-Car Camera Initiative Program” to state police and highway patrol
agencies throughout the U.S. and provided funds for them as of 2000 (IACP, 2004). As
of 2004, 72% of state patrol vehicles mostly working in traffic-related incidents were
equipped with in-car cameras (IACP, 2004), and by 2007, 61% of police departments had
followed suit (Reaves, 2010).
BWCs are the latest technological development in the area of surveillance for
police agencies (Roy, 2014). BWCs are mobile audio and video capture devices, which
can be attached to various areas of the body and uniform, such as the head, helmet,
glasses, pockets, badge, etc. (Draisin, 2011). Cheap BWCs with long-running batteries
became available on the market around 2010 (Sherman, 2013). BWCs received
significant media attention in 2013 upon the decision of Judge Shira Scheindlin of the
Federal District Court in Manhattan in New York City, which required police officers to
wear cameras in the precincts where SQFs were highest to prevent racial profiling
(Goldstein, 2013).
Recently, in 2014 in Ferguson, Missouri, police shot to death an unarmed

24
teenager named Michael Brown, and civil unrest took place to protest the police for days
(Ready & Young, 2014). What actually happened has remained unknown because of a
lack of video evidence. Upon public pressure to maintain accountability and
transparency, the Ferguson Police Department has begun to use BWCs (Ready & Young,
2014). The incident in Ferguson also has prompted lawmakers to require all state and
local police departments to use BWCs (Waters, 2014).
There are several reasons for adopting BWCs. The limitation of in-car cameras is
that police officers are unable to record the interactions when they leave the vehicle (Roy,
2014). Unlike in-car cameras, BWCs are not placed inside a vehicle; thus, BWCs have
the ability to record encounters between police and citizens outside of the patrol vehicle
(NLECTC & United States of America, 2012). In addition, BWCs allow police officers to
record what they see and hear (Coppola, 2010; Draisin, 2011). Furthermore, the
widespread of use of smartphones has increased the ability of third parties to record
police–citizen interactions (Harris, 2010). This has increased the need for police
departments to record encounters from the police point of view and use as evidence when
necessary.
Like many police agencies around the world, the Turkish National Police has
started using BWCs in traffic enforcement units since 2012. The use of BWCs was
initiated as a pilot study and later spread with the introduction of the project called “The
Project of Transparency and Safety in Traffic” (Adana Emniyet Mudurlugu, 2014).
2.3 Theoretical Background
There are two theories that are capable of explaining the theoretical background
of this research: Self-awareness theory and deterrence theory.

25
2.3.1 Self-Awareness Theory
Self-awareness theory, also called Objective Self Awareness theory, was
developed by Shelley Duval and Robert Wicklund (Duval & Wicklund, 1972). Objective
self-awareness occurs when attention is directed inward or focused on the self, meaning
that an individual becomes the object of his/her own consciousness (Duval & Wicklund,
1972). Subjective self-awareness occurs when attention is directed away from the self
and the person “experiences himself as the source of perception and action” (Duval &
Wicklund, 1972, p. 2-3).
Self-awareness theory focuses on three concepts: self, awareness, and objective
standards. When people focus their attention on the self, they become self-aware and
evaluate the self (Duval & Wicklund, 1972; Wicklund & Duval, 1971). They compare the
self to standards of correctness that specify how they should think, feel, and behave, or
how they personally would like to be (Silvia & Duval, 2001). The process of comparing
the self with standards allows people to change their behavior and to experience pride and
dissatisfaction with the self (Duval & Wicklund, 1972). If there is discrepancy between
the self and standards, people try to reduce discrepancies by changing the self to achieve
standards (Duval & Lalwani, 1999; Duval & Wicklund, 1972). Thus, they try to alter
their behavior and behave according to the standards of correctness or they could avoid
the self-focusing stimuli and circumstances (Duval & Wicklund, 1972).
According to the theory, anything that makes people focus attention on the self
increases self-awareness (Duval & Wicklund, 1972). Thus, to increase self-awareness,
researchers have used various stimuli such as mirrors, tape recordings of the person’s
voice, videotaping, and writing passages (Buss, 1980; Carver & Scheier, 1978), as well as

26
the use of relative group size to manipulate self-focus (Duval, 1976). When people are
aware that they are being watched, they often change their conduct and adhere to social
norms, rules, or directions (Duval & Wicklund, 1972; Scheier & Carver, 1983). Thus,
people who are aware of being watched or observed exhibit more socially-acceptable and
desirable behaviors and obey rules.
BWCs also increase the awareness of the person who is watched. The person
focuses on the self and compares his/her behavior with the objective standards, which are
socially-desirable behaviors. If the person notices that there is a discrepancy between
his/her behavior and the socially-desirable behaviors, s/he alters the behavior and tries to
behave in a socially-desirable way. Procedurally just behavior requires people to behave
in a socially-desirable manner. More specifically, a typical person treats people with
respect and politely allows the other person to voice his/her opinions and concerns during
a conversation. In addition, a typical person assumes that what police do is for their own
safety. As a result, BWCs increase the self-awareness of police officers and lead them to
behave in a procedurally just way.
2.3.2 Deterrence Theory
The second theory that explains the background of the research is deterrence
theory, which is based on the idea that people are rational and thus try to avoid pain and
seek pleasure. Individuals make a choice between pain and pleasure or between costs and
benefits before committing crime and are more likely to commit crime if the benefits or
pleasures of offending outweigh the pains or costs of committing crime (Nagin, 2012).
Conversely, if the pains or costs of committing crime outweigh the benefits or pleasures
of committing the crime, people tend to avoid committing the crime. This same

27
theoretical logic applies to the use of BWCs.
Deterrence theory relies on three components: severity, certainty, and celerity. As
Nagin (2013) explains, “Certainty refers to the probability of punishment given
commission of crime, severity refers to the onerousness of legal consequences given a
sanction is impose, and celerity refers to the lapse in time between commission of crime
and its punishment” (p. 85). Certainty and celerity of punishment appear to have the
largest deterrent effect in comparison to the severity of punishment, as people are less
concerned about the severity of punishment if they believe that the probability of arrest
and sanction is low (Nagin, 2012). However, if people are certain that they will be
apprehended for their wrongdoing, they will be less likely to commit a crime or be
involved in socially and morally undesirable and unacceptable acts.
An extensive body of recent rigorous research across several categories of human
behavior has shown that when certainty of apprehension for wrongdoing is high, socially
and morally-unacceptable acts are dramatically less likely to occur (Von Hirsch,
Bottoms, Burney, & Wikstrom, 1999). Braga, Papachristos and Hureau (2011) have
shown that police presence in high-crime areas specifically, which increases the
perceived certainty of apprehension, can significantly reduce crime incidents at these hot
spots compared to control conditions. In addition, a focused deterrence strategy also
stresses the severity, certainty, and swiftness of the sanction, which is important for
effective deterrence (Papachristos, Meares, & Fagan, 2007). A comprehensive systematic
review of 10 quasi-experimental and 1 randomized controlled trial evaluations of focused
deterrence strategies conducted by Campbell Collaboration revealed that of the 11
studies, 10 were associated with an overall statistically significant, medium-sized crime

28
reduction effect (Braga, 2013; Braga & Weisburd, 2012). Thus, physical presence of
other people, especially rule-enforcers, either produces cooperative behavior or deters
away non-cooperative or noncompliant behavior (Dawes, McTavish, & Shaklee, 1977;
Hoffman, McCabe, Shachat, & Smith, 1994).
Self-awareness theory and deterrence theory share commonality in that deterrence
theory relies heavily on the notion that self-awareness and being watched leads to
socially desirable behaviors (Farrar & Ariel, 2013). Because BWCs capture the actions of
those who are “watched,” using them increases the likelihood of punishment of those
who do not follow rules since everything is recorded and can be used as evidence against
those who are being watched. Thus, BWCs deter people from non-cooperative or
noncompliant behavior and make them comply with police commands. BWCs also
increase self-awareness and make people conscious that they are watched and their
actions are recorded.
2.4 Eye Images: The Effect of Being Watched
Theoretically, it is contended that being watched has a positive impact on human
behavior (Burnham, 2003). This has been the focus of many investigations. Human
decision-making can be influenced by the appearance of the environment (Dolan et al.,
2012; Thaler & Sunstein, 2008). According to Burnham (2003), changes in situations
lead to changes in behavior, and putting “watching eyes” in an environment is a good
example. Eye images are more likely to induce the feeling of being watched and thus
have a greater impact on prosocial and cooperative behavior (Burnham, 2003). The effect
of being watched has been investigated in laboratory setting and real-world settings.

29
2.4.1 Studies in Laboratory Settings
Empirically, the impact of being watched on prosocial behavior was first tested in
laboratory settings. Eye images were displayed to the participants in laboratory contexts
and it was then observed whether their behavior changed prosocially. Generally, these
studies focused on whether the eye images had an impact on generosity. The results of
one experimental study suggested that photographs reduced anonymity and in turn
significantly increased generosity compared to control conditions with no photo
(Burnham, 2003). Another study also showed that participants who were watched by the
images of a robot with human eyes presented on their computer screen contributed 29%
more to the public good than those participants who were not watched by the image of
the robot in the same settings (Burnham & Hare, 2007). Another similar experiment
indicated that the presence of eye-like shapes on the computer screen substantially
increased generosity; more specifically, a large majority (79%) of the participants in the
eyespots conditions allocated money, while only about half (53%) of the participants in
the control group without eyespots allocated money (Haley & Fessler, 2005).
Being watched also has a positive impact on cooperative behaviors. An
experimental study conducted in France suggested that participants in the conditions
where eyes were displayed were more in favor of cooperative behavior compared to the
participants in the conditions where flower images were displayed (Bourrat, Baumard, &
McKay, 2011).
2.4.2 Studies in Real-World Settings
The effect of watching eyes has also been demonstrated in real-world settings. It
is argued that when observed, people tailor their acts to be more socially desirable

30
(Nettle, Nott, & Bateson, 2012). For instance, eyelike images and non-eye like images
displayed on charity collection buckets have different effects on people’s generosity
(Powell, Roberts, Nettle, & Fusani, 2012). The results of an experiment conducted in a
supermarket in England suggested that the display of eye images in experimental buckets
increased donations by 48% compared to control buckets without eye images (Powell,
Roberts, Nettle, & Fusani, 2012). Another experiment conducted at Newcastle University
concluded that eye images (versus flowers) placed above an honesty box for
contributions to the coffee fund yielded mean contributions that were almost three times
as high (Bateson, Nettle, & Roberts, 2006).
In real-world settings, eye images also have a significant impact on changing the
behavior of individuals. In a month-long field experiment in a large cafeteria on the
campus of Newcastle University, Ernest-Jones et al. (2011) displayed posters featuring
either eyes or flowers in a university cafeteria, finding that people were more likely to
clear up their litter on days when eyes were displayed. In addition, the result of an
experiment conducted at 14 randomly selected bus stops in Switzerland showed that
displaying eye images in bus shelters made people invest more time removing garbage
compared to controls with flower images (Francey & Bergmuller, 2012). In a field
experiment conducted at six bicycle racks on the campus of Newcastle University,
Bateson, Callow, Holmes, Redmond, and Nettle (2013) showed that images of eyes
reduced littering and induced more prosocial behavior, independent of local norms.
Finally, Gervais and Norenzayan (2012) argued that even thoughts of God increase
feelings of being under surveillance, in turn increasing self-awareness and socially
desirable responding among believers. They found that thinking of other peoples’ social

31
evaluations and thinking about God similarly increased self-awareness for believers,
whereas thinking of God reduced public self-awareness for non-believers relative to both
to the control prime and the people prime.
In addition to the studies on the impact of watching eye images on prosocial
behavior and compliance with social norms in laboratory and natural settings, the impact
of images of watching eyes on crimes was also investigated. For instance, a randomized
controlled trial was conducted to examine the effect of displaying images of “watching
eyes” and a verbal message on bicycle thefts on a university campus in Northern England
(Nettle et al., 2012). The eye images were installed at three locations where a high level
of bicycle thefts occurred, and the rest of the university campus was used as a control
location. The study suggested that the “watchful eyes” had an impact on preventing
crimes, but displaced thefts to the locations without the images. More specifically,
bicycle thefts decreased by 62% at the experimental locations, but increased by 65% in
the control locations.
2.5 Cameras: The Effect of Being Watched 2.5.1 Closed Circuit Television (CCTV) and Speed Cameras Unlike the images of eyes, closed circuit television (CCTV) and speed cameras
can observe and record incidents. CCTV, a “formal surveillance” technique (Cornish &
Clarke, 2003), is used in private and public settings to prevent violent and property
crimes because potential offenders are deterred due to the increased probability of being
detected and apprehended (Welsh & Farrington, 2009). Forty-four evaluations of the
effectiveness of CCTV suggested that it caused a significant but modest decrease (16%)
in crime in experimental areas compared with control areas (Welsh & Farrington, 2009).

32
Its impact may vary depending on the place. The largest decreases in crime were in car
parks (51%); however, there was no significant decrease in crime rates in city and town
centers (7%) and public transport schemes (23%) (Welsh & Farrington, 2009). The
impact of CCTV is apparently low in these areas because the level of certainty of being
apprehended necessary for self-awareness is not high (Welsh & Farrington, 2009).
Studies have investigated the effect of speed cameras on speeding, road traffic
crashes, injuries, and deaths by comparing traffic-related incidents before and after the
introduction of speed cameras and also by comparing road areas where speed cameras
were available with road areas where no speed cameras were introduced (Wilson, Willis,
Hendrikz, Le Brocque, & Bellamy, 2010). The results of 35 studies showed that in the
vicinity of camera sites, after the introduction of speed cameras, a decrease in speeding
was observed ranging from 1% to 15%, the proportion of drivers speeding between 14%
and 65%, all crashes ranging from 8% to 49%, fatal and serious injury crashes ranging
from 11% to 44%, and crashes resulting in injury ranging from 8% to 50% (Wilson et al.,
2010).
2.5.2 In-car Cameras
In-car cameras are also used as effective surveillance tools and influence police
and citizen behavior. To investigate the effects of in-car cameras, in 2002, the
Community Oriented Policing Services (COPS) Office along with the International
Association of Chiefs of Police (IACP) conducted an 18-month evaluation on the use of
in-car video cameras by state agencies (IACP, 2004). The researchers conducted surveys,
worked with research groups, and completed interviews of 21 state agencies. According
to the report, in-car cameras provided many benefits for police agencies, one being that

33
in-car cameras improved police behavior. More specifically, in most instances, police
officers followed law and departmental guidelines, and they treated people more politely
and professionally (IACP, 2004).
The use of in-car cameras reduced the number of complaints against police
officers (IACP, 2004). In instances where in-car cameras were used, half of the
complaints were withdrawn, and 8% of the responding police officers reported a
reduction in the number of complaints filed against them. Almost half (48%) of surveyed
citizens reported that the presence of the in-car camera would make them less likely to
file a complaint, whereas 34% reported that the use of the cameras made them more
likely to file a complaint. The use of in-car cameras had no impact on decisions of police
officers about use of force and performing their duties (IACP, 2004). The COPS study
also revealed that the presence of an in-car camera had no effect on police discretion in
handling situations (86%) and no effect on their decision to use force in a situation (89%)
(IACP, 2004).
In-car cameras not only impact police behavior, but they also modify the behavior
of the citizens being stopped (IACP, 2004). Half (51%) of the respondent citizens
reported that their behavior would change if they were aware that they were being
watched. The use of in-car cameras also deescalated confrontational situations with
citizens, a finding supported by both citizens and police officers. One-quarter (26%) of
respondent police officers reported that citizens became more courteous during their
contact. This is important because a systematic observational study found that in nearly
50% of the observed excessive force incidents, police used excessive forces when the
victims verbally resisted police authority (Reiss, 1968).

34
The use of in-car cameras provides concrete evidence for trial (IACP, 2004). The
study found that out of the prosecutors who were surveyed, 91% stated that they used
video recordings in court, adding that the presence of video evidence enhanced their
ability to obtain convictions. The types of cases in which video evidence is most
successful include driving under the influence, traffic violations, vehicular pursuits,
assaults on officers, narcotics enforcement, domestic violence, and complaints against
police departments.
2.5.3 Body-Worn Cameras (BWCs)
One of the latest technological innovations in policing is the use of BWCs, which
may be used by police on a daily basis for such activities as traffic stops, service calls,
interactions with the public during patrol in foot and vehicle, searches, or other police
activities (NLECTC & United States of America, 2012). BWCs are more feasible than
CCTV’s or in-car cameras because they can be deployed at any position within the
incident (Goodall, 2007). Used properly, BWCs can record anything police officers see.
The effects of BWCs have been investigated in the U.S. and in the U.K. British
police agencies were among the first to experiment and test the effect of BWCs (White,
2014). BWCs were first used in Plymouth, England, against domestic violence in 2005
and 2006 (Goodall, 2007). Due to the positive results from the early pilot studies, the
“Plymouth Head Camera Project” was initiated to fully test the effect of BWCs for the
Police Service nationally in 2006, with the pilot ending in 2007 (Goodall, 2007). The
study was evaluated independently; however, it did not use a comparative research
design. Several police agencies in Scotland also evaluated BWC technology in 2011
(ODS Consulting, 2011). Police deployed 38 BWCs for 8 months in Renfrewshire and 18

35
BWCs for 3 months in Aberdeen. Both studies did not have a control group. The
evaluations focused on the impact of BWCs on citizen attitudes, criminal justice
processing (guilty pleas), citizen complaints, and assaults on police officers (ODS
Consulting, 2011).
There have been three studies on BWCs in the Unites States as of 2013 (White,
2014). The first study was conducted in Rialto, California, involving a randomized
controlled trial in which 54 patrol officers were randomly assigned to wear BWCs and 54
patrol officers were assigned not to wear BWCs (Farrar & Ariel, 2013). The study tested
the impact of BWCs on citizen complaints and police use of force incidents. The second
evaluation study in the U.S. was conducted by the Mesa (Arizona) Police Department
between October 2012 and September 2013 (MPD, 2013). The 50 BWC-wearing police
officers were compared to a group of demographically similar officers who were not
wearing BWCs. The evaluation focused on the impact of BWCs on civil liability,
complaints against department, and criminal prosecution (MPD, 2013). The third and last
evaluation in the U.S. was conducted by the Phoenix (Arizona) Police Department and
Arizona State University (White, 2014). The study had a comparative research design and
involved 56 police officers wearing BWCs and 50 comparison police officers. The
Phoenix study tested the impact of BWCs on unprofessional police behavior, citizen
complaints, citizen resistance, and response to domestic violence cases, as well as police
officers’ perceptions of BWCs (White, 2014).
2.6 The Effects of Body Worn Cameras (BWCs) 2.6.1 Compliance and Cooperation
The literature on BWCs suggests that they promote citizen compliance with law

36
and police commands (Vorndran, Burke, Chavez, Fraser, & Moore, 2014), which is a
goal of all policing strategies (Gau, 2011; Tyler, 2006). There are two types of
compliance: specific compliance and general compliance. Specific compliance refers to
citizen conformance to police requests during face-to-face encounters, whereas general
compliance refers to obedience of citizens to laws such as traffic and other laws
(Mastrofski et al., 1996).
Disobedience is a frequent occurrence in police–citizen encounters. For example,
Mastrofski et al. (1996) examined 364 police-citizen encounters in Virginia and found
that 22% of police-citizen encounters resulted in noncompliance. The use of BWCs may
be one of the most effective alternative strategies to the use of force to obtain compliance
with police directives (Vorndran et al., 2014). For example, citizens are more respectful,
compliant, less abusive, and less troublesome in front of police officers wearing BWCs.
The Plymouth Camera Project study suggested that a quarter of surveyed police officers
stated that people, particularly youth, showed more respect when using the BWCs and
calmed the situation down (Goodall, 2007). It was also found that large groups were less
confrontational when the officer was wearing a head camera (Goodall, 2007). In the
Mesa study, 45% of surveyed police officers stated that the cameras would lead citizens
to be more respectful to police officers wearing them (MPD 2013). Finally, the Phoenix
evaluation suggested the BWCs appeared to improve citizen behavior once citizens were
aware that their behavior was recorded (White, 2013).
Improved citizen behavior is important because the demeanor of citizens is one of
the most important factors that determine how police behave toward and treat citizens.
Police officers are more likely to disrespectfully treat those who are disrespectful,

37
physically resist, or refuse to follow police directives (Mastrofski, Reisig, & McCluskey,
2002). The results of the Plymouth Camera Project suggested that at anti-social hotspots,
citizens behave less aggressively against police officers with BWCs compared to police
officers without them (Goodall, 2007). The Renfrewshire/Aberdeen studies indicated that
in both sites, only 4 out of 5,000 recorded encounters resulted in assaults on police
officers wearing BWCs (ODS Consulting, 2011). The results of the Aberdeen study
revealed that a single assault took place against police officers wearing BWCs, while 61
assaults took place against police officers not wearing BWCs (ODS Consulting, 2011).
BWCs also increase cooperation between citizens and police (Farrar & Ariel,
2013; Vorndran et al., 2014). Effective and successful policing requires the ongoing
support and voluntary cooperation of the public (Tyler, 1990). As police are not
omnipresent, their ability to detect and deal with social disorder and crime is dependent
on the willingness of citizens to assist and cooperate with the police by reporting crimes
and passing on information (Sargeant et al., 2012; Tyler, 2006). Due to the deterrent and
self-awareness effect of BWCs, people are more likely to act cooperatively (Farrar &
Ariel, 2013).
2.6.2 Procedural Justice and Legitimacy
It is argued that BWCs promote police legitimacy and a sense of procedurally just
policing among citizens (Howland, 2010; Koper et al., 2014; Mazerolle, Bennett, Davis,
Sargeant, & Manning, 2013; Miller, Toliver, & PERF, 2014; Ramirez, 2014; Roy, 2014;
White, 2014). Legitimacy refers to a situation in which one feels that an authority has the
right to enforce the law and thus the person should be deferred and obeyed (Levi, Sacks,
& Tyler, 2009; Sunshine & Tyler, 2003; Tyler, 2004, 2006). Legitimacy is based on

38
one’s own internal values rather than rewards or sanctions; in other words, people obey
the law because they believe that they should follow the law (Hinds & Murphy, 2007, p.
30; Tyler, 2001, 2006; Weber, 1968). If people view police as legitimate, they are more
likely to comply with the law and cooperate with police voluntarily (Sunshine & Tyler,
2003; Tyler, 2006).
Police can build legitimacy through both instrumental and normative factors
(Hinds & Murphy, 2007, p.28; Sunshine & Tyler, 2003; Tyler, 2006). According to the
instrumental perspective, police can develop their legitimacy by effectively controlling,
preventing, and responding to crime and disorder; that is, increasing the probability of
apprehension and punishment (Hinds & Murphy, 2007; Sunshine & Tyler, 2003; Tyler,
2006). By contrast, the normative perspective suggests that citizen conceptions of justice
are based on perceptions of fairness and equity (Tyler, 2006). According to the normative
perspective, citizens are concerned with two types of justice: distributive justice and
procedural justice (Tyler, 2006). Distributive justice implies that citizens care about the
fairness of outcomes, whereas procedural justice proposes that people are concerned
about the fairness of procedures used to achieve outcomes independent from whether or
not the outcomes are favorable (Tyler, 2006).
Police legitimacy results from the principles of procedural justice rather than
instrumental factors (Sunshine & Tyler, 2003). Procedural justice is composed of 4
principles: neutrality, respect, trust, and voice (Goodman-Delahunty, 2010; Levi et al.,
2009; Tyler, 2004, 2006; Tyler, 2007, p. 30; Tyler & Huo, 2002; Tyler & Murphy, 2011).
Neutrality refers to the belief that decision-making should be impartial, neutral, and
consistent across cases, as well as be based on facts, legal rules, and principles rather than

39
personal opinions or biases. Respectful treatment involves treating people with dignity,
respectfully, politely, and courteously during police–citizen encounters and showing
respect for citizen rights. Trustworthiness involves sincerity and care on the part of police
for citizens; that is, police should be honest and transparent and demonstrate that they
consider the benefits of the citizens and work for them. Finally, voice involves providing
citizens with the opportunity to explain their side of the story in a conflict, or in other
interactions with police, before making decisions. In short, police should treat people
fairly, respectfully, politely, and make their decisions based on the rules; allow citizens to
explain their side of story before making decisions; and communicate trustworthiness to
citizens (Sargeant et al., 2012; Sunshine & Tyler, 2003; Tyler, 2007).
Empirical support for the benefits of procedurally just policing for police
legitimacy is widespread (Engel, 2005; Levi et al., 2009; Mastrofski et al., 1996;
Mazerolle et al., 2013; McCluskey, Mastrofski, & Parks, 1999; Murphy, Hinds, &
Fleming, 2008; Paternoster, Brame, Bachman, & Sherman, 1997; Sherman, 1997;
Sunshine & Tyler, 2003; Tyler, 1990, 2006, 2007; Tyler & Degoey, 1996; Tyler & Huo,
2002; Tyler & Fagan, 2008, 2012; Vorndran et al., 2014). The results of experimental
studies also show similar effects. The first experimental study of legitimacy, which was
conducted in Queensland, Australia, suggested that even during a short traffic encounter
with citizens, traffic encounters considered to be procedurally just increased perceptions
that police are fair and respectful, improved satisfaction with police, and had a positive
impact on police legitimacy and cooperation when compared to a “business as usual”
traffic stop (Mazerolle, Antrobus, Bennett, & Tyler, 2013). The second experimental
study of legitimacy conducted in Adana, Turkey, indicated that relative to control group,

40
procedurally justice encounters positively shaped citizen views of police and increased
citizen satisfaction (Sahin, 2014).
BWCs can have a civilizing effect, resulting in improved police behavior (Farrar
& Ariel, 2013; Harris, 2010; Koper et al., 2014; Miller et al., 2014; Rieken, 2013; White,
2014), and altering how police officers verbally communicate with citizens (Tyler, 2001;
Tyler, Boeckmann, Smith, & Huo, 1997). In other words, BWCs can directly impact the
principles of procedural justice. Neutrality can be achieved when police are transparent or
open in the decision-making process (Goodman-Delahunty, 2010; Tyler, 2007), and
BWCs make police officers more likely to comply with proper legal and constitutional
standards as well as internal departmental regulations (Harris, 2010; Rieken, 2013).
Furthermore, BWCs can increase professional police behavior (White, 2014). For
instance, the study of the Mesa Police Department suggested that 77% of police officers
surveyed believed that BWCs would lead officers to behave more professionally (MPD,
2013). BWCs can also hold police departments accountable to citizens (Koper et al.,
2014; Miller et al., 2014; Ramirez, 2014; Wain & Ariel, 2014) since a police officer’s
actions can be monitored during an interaction (Roy, 2014). Thus, transparency and
accountability can actually increase public trust in police (Clark, 2013; Miller et al.,
2014).
2.6.3 Satisfaction
BWCs also increase satisfaction with police in two ways. First, citizens have
expectations concerning the behavior of police during encounters. Citizens expect police
officers to behave in a procedurally just way during traffic stops (Johnson, 2004;
Woodhull, 1998). Prior studies support this argument. For instance, Johnson (2004)

41
conducted a survey involving 245 college students to determine what kinds of
expectations citizens had of police officers during traffic stops. He found that 69% of
respondents agreed that how a police officer behaves during a traffic stop is more
important than whether or not they receive a ticket.
Another way that BWCs increase satisfaction with police is that technology may
enhance transparency in police departments by providing video evidence (Howland,
2011; Koper et al., 2014; Mazerolle et al., 2013; Ramirez, 2014; Roy, 2014; White,
2014). BWCs enable police agencies to demonstrate transparency and openness in their
interactions with citizens (Miller et al., 2014). Transparency can lead citizens to become
satisfied with interactions because they are aware that everything is recorded.
BWCs can also promote feelings of safety among citizens, and through that,
citizen satisfaction can improve. The results of citizen surveys of 97 respondents in
Renfrewshire and 701 respondents in Aberdeen, and an additional 36 crime victim
respondents in Plymouth, suggested that of the survey respondents, 49% in Renfrewshire,
37% in Aberdeen (ODS Consulting, 2011), and 81% in Plymouth (Goodall, 2007)
reported that they felt safer as a result of the deployment of BWCs. In addition, BWCs
make residents feel that their community is safer. More specifically, of the respondents,
64% in Renfrewshire and 57% in Aberdeen reported that they believed BWCs would
make their community safer (ODS Consulting, 2011).
2.6.4 Citizen Complaints
Citizen-initiated complaints refer to being dissatisfied and displeased with an
encounter with a police officer (Lersch & Mieczkowski, 2000). Given the nature of
police work, citizen complaints against police officers are inevitable (Haberfeld, 2004;

42
Wagner & Decker, 1997). Police officers are responsible for enforcing the laws and
arresting those who violate the rules (Lersch & Mieczkowski, 2000). The nature of their
work puts them in situations in which they are likely to be in conflict with citizens
(Lersch & Mieczkowski, 2000). As a result, citizens file complaints against police
officers in order to express their displeasure about the police officers with whom they
were in contact (Lersch & Mieczkowski, 2000).
There are five categories of complaints against police officers: use of demeanor or
tone that is insulting, demeaning, or humiliating; issuing a bad ticket; using threats; using
profanity; and unlawfully stopping a vehicle (Vorndran et al., 2014). Other allegations
involve using excessive or unnecessary force; unlawful stop, searches, and frisks; and
unlawful arrests (Vorndran et al., 2014). It is estimated that just one-third of all incidents
of alleged police misconduct are reported as a complaint (Walker & Bumphus, 1992).
According to the study on complaints against police officers involving 854
misconduct that were examined between 1995 and 1997 in the Southeast, police officers
were more likely to receive performance-related complaints (32%), followed by
complaints about demeanor (30%) and the use of unnecessary force (22%) (Lersch &
Mieczkowski, 2000). Other research demonstrated similar findings (Lersch, 2002).
Another study on complaints in a large police department in the Northeastern U.S.
suggested that police departments were more likely to receive complaints related to
service (46%), followed by administrative matters (30%) and the use of force (18%)
(Harris, 2014).
Problematic police behavior is the source of many citizen complaints (Porter &
Prenzler, 2012). The perceived unfair, disrespectful, and impolite treatment process can

43
result in a formal citizen complaint against police officers (Johnson, 2004). In other
words, if citizens perceive that they are treated disrespectfully and unfairly, they are more
likely to file a complaint, and in turn, the number of citizen complaints increases
(Johnson, 2004). Prior studies suggest that citizen perceptions of verbal disrespect of
police officers account for the majority of the complaints against police officers. Reiss
(1971) found that more than 60% of the complaints in Boston, Chicago, and the District
of Colombia resulted from inappropriate verbal conduct by an officer. The complaints
often included disrespectful, impolite talks with citizens and rude behavior (Reiss, 1971).
Most of the complaints were filed because of the manner in which police officers spoke
rather than the specific words used (Reiss, 1971). Other studies in Philadelphia (Hudson,
1970), Washington State (Dugan & Breda, 1991), St Louis (Wagner & Decker, 1993),
and Florida (Lersch, 1998) consistently found that the most common type of citizen
complaint against police officers was the allegation of disrespectful communication with
citizens on the part of the officers.
It is important for police agencies to avoid complaints and promote relationships
with the public (Johnson, 2004). Police misconduct undermines citizen trust and respect
with police; in turn, citizens are less willing to cooperate with police and compliance
decreases (Lersch & Mieczkowski, 2000). When police officers engage in procedurally
just behavior, this promotes high-quality interactions between police and citizen and
leads to fewer complaints against police officers (Vorndran et al., 2014). If citizens feel
that they are treated politely, respectfully, and fairly by a police officer, they are less
likely to file a complaint against police officer, and, in turn, the number of citizen
complaints against police officers declines (Johnson, 2004).

44
Like videotapes, audiotapes, and CCTVs (Porter & Prenzler, 2012), BWCs may
also reduce socially undesirable behavior, such as use of offensive language or the
excessive use of force (Floyd v. City of New York, 2013). Both citizens and police
officers are more likely to conform to code of conduct and exhibit socially desirable
behavior, ultimately acting cooperatively when they are under BWC surveillance (Farrar
& Ariel, 2013). Thus, using BWCs can reduce the chances of conflict in citizen
encounters and prevent negative interactions by influencing officer and citizen behavior
(Farrar & Ariel, 2013; Koper et al., 2014; Ramirez, 2014).
BWCs reduce citizen complaints against police officers (Draisin, 2011; Koper et
al., 2014; Miller et al., 2014; Ramirez, 2014; Roy, 2014). More specifically, the reported
percentage of reduction in citizen complaints was 87% in the Rialto study (Farrar &
Ariel, 2013); 40% of total complaints and 75% of excessive use of force complaints in
the Mesa study (Miller et al., 2014; MPD, 2013; Roy, 2014); 14% (specifically for
incivility and excessive use of force) in the Plymouth Head Camera Project; and only 5
out of more than 5,000 police–citizen encounters resulted in complaints against police
officers wearing BWCs in the Renfrewshire/Aberdeen studies after the introduction of
BWCs (Goodall, 2007). The results of interviews with police executives conducted by
PERF also revealed that police executives contended that BWCs reduced the number of
complaints against police officers (Miller et al., 2014). Furthermore, there is evidence
that citizens are less likely to file frivolous complaints against officers wearing BWCs
because they are aware that video evidence can instantly refute their claims (Coppola,
2010; Goodall, 2007; Harris, 2010; Vorndran et al., 2014).

45
2.6.5 Use of Force
BWCs also reduce use of force. It is evident that the use of BWCs has an impact
by altering the behavior of citizens as well as police officers (White, 2014). Positive
behaviors of both police officers and citizens affect each other in a positive way. Both
behave well, and as a result, police officers do not use force. The Rialto study
documented a 59% drop in the total number of use of force incidents in the experimental
group compared to the control group (Farrar & Ariel, 2013). In addition, content analysis
of the footage of use of force incidents indicated that police officers wearing BWCs were
less likely to use force unless they were physically threatened or assaulted, and they used
less severe force (Farrar & Ariel, 2013). Lastly, citizens first initiated physical contact
with the police officers wearing BWCs, while police officers without BWCs first initiated
the physical contact (Farrar & Ariel, 2013).
2.7 Summary, Research Questions, and Hypotheses Exhibit 2 illustrates the path model for the effects of BWCs on outcomes in the
current study. It shows the relationships between BWCs and the outcomes, with all
hypothesized direct and indirect pathways possessing positive coefficients. Taken
altogether, BWCs are hypothesized to have both direct and indirect effects on the
outcomes. Directly, BWCs may have an impact on procedural justice, cooperation,
specific compliance, general compliance, satisfaction, police legitimacy, traffic police
legitimacy, and perception of police. Indirectly, BWCs also affect satisfaction,
cooperation, specific compliance, general compliance, police legitimacy, traffic police
legitimacy, and perception of police through procedural justice. Finally, both traffic and
police legitimacy mediates the effect of BWCs on cooperation, general compliance,

46
specific compliance, satisfaction, and perception of police.
Exhibit 2. Path Model of the Effects of BWCs on Outcomes for Current Study
Both drivers and traffic police officers exhibit socially desirable behavior when
they are watched through a BWC. They are more likely to comply with rules while under
observation. More specifically, traffic police officers are more likely to behave in a
procedurally just way. Drivers are more likely to follow traffic police officers’ directives,
Notes: 1- Thick solid line shows that BWC has direct effect on the outcome variables. 2- Thin solid lines shows that BWC has NO direct effect on the outcome variables. 3- The intervening variables are procedural justice, traffic police legitimacy, and police legitimacy.
Sa#sfac#on
BWC ProceduralJus#ce
TrafficPolice
Legi#macy
SpecificCompliance
GeneralCompliance
Coopera#on
Percep#onofPolice
PoliceLegi#macy
+
+
+
+
+
+
+
+
+
++
+
+
++
++
++
+
+
+
+
++

47
comply with laws in general, and cooperate with police. BWCs have a deterrent effect;
thus, police officers are more likely to behave in a procedurally just way because they
think that their supervisors will watch the recordings, and if they violate the rules, they
are more likely to be exposed to disciplinary procedures. In addition, BWCs provide
video evidence if citizen complaints are filed against them. Drivers are also more likely
to comply with police directives and to obey the rules because everything is recorded
through a BWC, and video footage can be used as evidence against drivers. Furthermore,
BWCs have an indirect positive impact on cooperation, satisfaction, and compliance
(general and specific); perceptions of police; and legitimacy (traffic police and police)
through procedural justice. Research suggests that procedural justice has an impact on
legitimacy and satisfaction, and legitimacy has impact on cooperation and compliance.
Thus, overall, BWCs alter behaviors of traffic police officers and drivers.
Based on the literature, this research study is guided by the following two
research questions concerning the use of BWCs:
1. What is the impact of BWCs on police behavior toward drivers during traffic
stops, as perceived by drivers?
2. What is the impact of BWCs on drivers’ self-reported behavior toward traffic
police officers during traffic stops?
The following nine specific hypotheses will be tested:
H 1: BWCs will lead police officers to behave in a procedurally just way.
H 2: BWCs will increase traffic police legitimacy.
H 3: BWCs will increase police legitimacy.
H 4: BWCs will increase cooperation between police and citizens.

48
H 5: BWCs will increase driver compliance with traffic laws in general.
H 6: BWCs will increase driver compliance with police commands.
H 7: BWCs will promote driver satisfaction with the police.
H 8: BWCs will have a positive impact on driver perceptions of police in general.
H 9: The effects of BWC on distal outcomes (satisfaction, perception of police,
cooperation, and general and specific compliance) will be mediated by procedural
justice and legitimacy.

49
CHAPTER 3: METHOD
This chapter provides details about the method used to conduct the study. It
begins by describing the research setting, apparatus, and research design. It continues by
providing more information about how the experiment was conducted, including how
study participants were assigned to the experimental group and the control group,
procedures followed, and the sample. Finally, the chapter closes with a discussion of the
sources of collected data used in the study and specific measures of the variables.
3.1 Research Setting
This study was conducted in 2014 in the province of Eskisehir in Turkey. The
Eskisehir Police Department has 3,000 police officers and serves a population of almost
800,000, 86% of whom live in the city center of the province (TURKSAT, 2014). The
study site was the area of responsibility of the Regional Traffic Enforcement Unit
(RTEU), which is responsible for enforcing traffic law on the highways/motorways. The
RTEU is responsible for about 139 miles (223 km) of highway patrolled by 16 vehicles
(Eskisehir Emniyet Mudurlugu, 2014).
Traffic police officers work in shifts called 8/24 – that is, 8 hours on and 24 hours
off. They work in one of three shifts: 7:00 a.m. to 3:00 p.m., 3:00 p.m. to 11:00 p.m., or
11:00 p.m. to 7:00 a.m. For each shift there are three teams responsible for carrying out
traffic enforcement, with each team consisting of two traffic police officers. One officer
pulls over and stops vehicle, asks for documents, and inspects the car while the other
officer stays in the patrol car to record traffic stops in the system and issue a ticket, if
necessary.

50
At the time of this study, there were eight traffic checkpoints where the traffic
police officers stopped vehicles. Each team was responsible for different checkpoints. In
terms of the selected checkpoints for the study, Team 4543 was responsible for the
checkpoint called Bursa 3 km (B-3), and Team 4545 was responsible for the checkpoint
called Ankara 8 km (A-8). The dispatch codes were fixed. However, the officers working
on the teams changed depending on their shifts. That is, traffic police officers using the
same dispatch code were changed according to the shift they worked.
In addition, there were another three teams responsible for identifying drivers who
violated speed limits. These teams consisted of two or three traffic police officers. These
teams detected the speed limit violators and informed the other traffic teams to stop the
violators. Those police officers were not involved in making contact with drivers; thus,
they were not included in the study.
3.2 Apparatus
BWCs were used in the study. BWCs are small audio/video cameras attached to
an officer’s clothing. From an officer’s point of view, BWCs have the ability to capture
police activities and record them audio-visually. The type of BWC used in the study is
called “AEE” whose model is “PD77G HD DV.” BWCs are designed to work in any
weather conditions and to make a non-stop audio-video recording for eight hours,
featuring a 12-mega-pixel camera (Adana Emniyet Mudurlugu, 2014). Four BWCs were
used in the study. Two cameras were provided for each police officer in the experimental
group. The second camera was made available as a backup to avoid and overcome a
battery problem or any defect in the camera.

51
3.3. Research Design
In this study, a Randomized Controlled Trial (RCT) was conducted. An RCT is an
experimental design, which is the most rigorous, strongest research design with respect to
internal validity, and thus it is regarded as the gold standard compared to other research
designs (Lanier & Briggs, 2014; Shadish et al., 2002; Trochim & Donnelly, 2006).
Drivers were randomly assigned to either encounter traffic police officers wearing
a BWC (experimental condition) or traffic police officers not wearing a BWC (control
condition). The intervention was the use of a BWC during traffic stops, which was briefly
pointed out to the driver. BWCs were activated before the start of traffic stops and kept
on until traffic stops ended. Police officers in the experimental group wore a BWC. The
police officer who pulled over and stopped vehicles showed the BWC and notified
drivers by saying “the encounter today will be recorded using a BWC by my colleague
and me” once the interaction started. In addition, there was another BWC in the police
vehicle that recorded the interaction between the driver(s) and police officer in the police
car. By contrast, police officers in the control team did not wear any BWCs and carried
out business-as-usual traffic stops. After the initial encounter, drivers were asked to
participate in a survey, which involved the measures of procedural justice, legitimacy,
compliance, cooperation, and satisfaction, as well as several socio-demographic
variables.
3.4 Random Assignment Exhibit 3 illustrates how drivers were assigned to the experimental group and the
control group. Following the random start, assignment of drivers to the experimental
group was carried out according to the day and time of traffic stops. More specifically,

52
drivers stopped on the morning of Day 1 were assigned to the experimental group and
those stopped in the afternoon of Day 1 were assigned to the control group. This
arrangement was then switched every day throughout the remainder of the study.
Each traffic team has its own dispatch code and is responsible for different traffic
checkpoints and a certain length of highway. For the study, two teams out of three were
randomly selected. The dispatch codes of traffic teams were written on a piece of paper
and put on a table. Afterwards, these papers were shuffled and two of them were picked
randomly. The dispatch codes of the two selected teams were 4545 and 4543. These two
selected teams worked the day shift (between 7:00 a.m. and 3:00 p.m.) and were
randomly assigned by the toss of a coin to deliver either the experimental or control
condition. The team that took the heads side of the coin was assigned to deliver the
experimental condition, and the other team was assigned to deliver the control condition.
More specifically, the team whose dispatch code was 4543 was randomly assigned for the
Exhibit 3. Sample of Random Assignment of Drivers and the Traffic Team

53
experimental condition and the team whose dispatch code was 4545 was assigned to the
control condition. Following this random start, the two teams assigned to the
experimental and control conditions were switched every other day based on working
hours. That is, as already shown in Exhibit 3, a “random start” was employed to ascertain
the assignment of the first traffic team and stop location, after which the teams and
locations were systematically rotated in order to achieve balance of stop times, stop
locations, and traffic police officer teams over the treatment conditions.
The advantage of randomization is that it ensures equivalence (in expectation)
between the experimental group and the control group. In the study, shifts were assigned
by rotation with a random start. All drivers encountered by the traffic police officers
during a given shift received the same treatment. Randomization eliminates many threats
to the internal validity of study estimates, including history, maturation, regression to the
mean, and selection bias. With designs of this kind, even with randomization, internal
validity may also be threatened when respondents in the two groups have an opportunity
to interact with each other. However, this was controlled by assigning the experimental
and control conditions at different times and at different checkpoints. Therefore, the
drivers in the two groups were isolated from each other and unaware of each other.
Furthermore, the time and location of traffic stops might affect the drivers, and in turn
their responses to survey questions. For instance, drivers might be more stressed in the
afternoon or in the morning and this might affect their behavior. Thus, time and location
of traffic stops were switched between the experimental group and the control group.
The study design also built in a control for potential confounding influences of the
traffic police officers themselves with the treatment. The officers who delivered the

54
experimental and control conditions did not have an opportunity to interact with each
other because they delivered the treatment at different checkpoints and during different
time periods. Also, the officers who delivered the experimental condition and the control
condition were switched every other day, depending on their working hours. Therefore,
they performed traffic stops under the same conditions, neutralizing potential differences
such as personality, experience, and age, which might possibly confound the treatment
conditions. Finally, the officers were not aware of the content of the driver survey.
3.5 Procedures
Accompanied by the deputy chief of the traffic unit, the researcher went to see the
traffic checkpoints where the study could be conducted. In the beginning, out of eight
traffic checkpoints, three of them were selected because they were convenient and
appropriate for the study in terms of their length. More specifically, the selected
checkpoints were called Inonu 8 km (I-8), Ankara Yolu 8 km (A-8), and Bursa 3 km (B-
3). The checkpoint at Inonu 8 km (I-8) was later excluded because it was a bit far away
from the residential area and there was a transportation problem. The two selected
checkpoints were long enough to be able to conduct the study appropriately. The length
between the location of traffic stops and possible location of the surveyors was about 200
feet.
At the researcher’s request, the chief of the traffic unit and his deputy agreed to
remind the traffic police officers in the experimental group that they should inform
stopped drivers that the encounter would be recorded. The supervisors also agreed to
watch the recordings of the encounters in front of the police officers in order to send a
message to the officers that supervisors were prioritizing the recordings and following

55
what was going on during traffic stops. This increased the certainty of the traffic police
officers in the study that they were being watched.
Four cameras were made available to the police officers in the experimental
condition – two cameras for each police officer, with the second available as a backup in
case of a battery problem or any defect. The researcher also asked the deputy chief of the
traffic unit to record every kind of complaint, not just official records but a record of any
other kind of complaint made, for example, in person or by phone.
Two surveyors were hired to assist the researcher in conducting the survey. The
surveyors were two undergraduate students. They were contacted by a friend of the
researcher and were asked whether they were interested in participating as a surveyor in
the study. Both accepted the offer to participate in the study. They were paid for
conducting the surveys. The researcher provided training for the surveyors. The training
included the purpose of the study, time schedule, expected sample size, information about
the questions in the survey, how to conduct the survey, how to approach the car, what to
say, and possible problems that they might face during the study. The researcher provided
the survey to the surveyors, and made sure that they understood the questions and
answers correctly. They were warned about not arguing with the respondents. The
surveyors/researcher wore picture IDs with a photo, displaying the name of the
surveyors/researcher, and the title of “interviewer.” They wore the picture ID before the
start of traffic stops and carried it with them until traffic stops ended. This allowed the
drivers who were stopped to identify who they were.
A pilot study was conducted to troubleshoot potential implementation problems
prior to carrying out the full study. This was very useful for quantifying response rates by

56
assigned group, timing the length of the interviews in the field, discussing operational
challenges experienced by the surveyors and the researcher, and performing an initial
comparison of key variables. During the pilot study, the researcher collected 86
completed surveys. The response rate for the experimental group and the control group in
the pilot study was 60% and 65%, respectively. This sufficed to devise solutions to
potential problems and modify the research plan accordingly.
The response time to the driver survey was between 7 and 10 minutes. The
surveyors did not have any problem with the respondents concerning the length of the
survey. The only complication was the weather. On some days, the weather was very
cold or rainy, and the researcher was forced to cancel the study since traffic stops were
not carried out under these conditions.
The researcher was always in the field to administer the survey along with the
hired and trained surveyors, supervising the administration of the surveys and ensuring
that the study was conducted as it was designed, and with as much fidelity as possible. If
needed, the researcher intervened and addressed any challenges.
After the traffic police officers performed their duties during the traffic stops and
drivers left the location of the traffic stop, drivers were approached by the
surveyors/researcher to conduct the survey. The surveyors/researcher made sure that the
survey was administered with drivers at least 50 feet away from the traffic checkpoint.
This distance was sufficient to ensure that drivers could not be seen or heard by the traffic
police officers. Drivers who volunteered to participate in the survey were not asked to
answer questions in front of traffic police officers and the surveys were not conducted at
the exact location of traffic checkpoint.

57
If the respondent asked how long the survey would take, the surveyors said, “It
will take between 5 and 10 minutes depending on your responses.” Then, they
administered the survey provided in Appendix A. There was nothing that would inhibit
voluntary participation or force drivers to feel obliged to participate, and consent was
obtained before conducting the survey. Since survey responses were anonymous, there
was no way to detect the connection between the responses and the respondents. Each
day after the study ended, the researcher collected the questionnaires and entered the data
in a spreadsheet. Then, the researcher destroyed the questionnaires.
3.6 Sample
The unit of analysis was the interaction between the traffic police officers and
drivers during a traffic stop. An interaction is defined as face-to-face communication
between police officers and citizens rather than a just greeting (Paoline & Terrill, 2005).
The study population was comprised of drivers using highways in the research site, the
vicinity of Eskisehir. Convenience and purposive sampling methods were used. The
drivers who were available or stopped for violating the speed limit were asked to
participate in the survey after the initial encounter with the traffic police officers.
Table 1 shows the sample size, the response rate, and the reason for refusing to
participate in the survey. The number of drivers who were asked to participate in the
survey was 437 for the control group, 423 for the experimental group, with 860 in total.
Of the 860 drivers, 27% did not want to respond to the survey. Thus, the analytical
sample size was 299 for the experimental group, 325 for the control group, with 624 in
total. These represented response rates of about 74% and 71% for the control and
experimental groups, respectively, or an overall response rate of 73%. Generally, the

58
most common reasons for unwillingness to participate in the survey included having an
appointment (25.0%), being late for work (19.9%), or not having time (18.2%).
< Insert Table 1 >
Out of 84 traffic police officers, 58 of them were working on patrols. Thirty-one
of 58 traffic police officers participated in the delivery of either the experimental
condition or control condition.
3.7 Data
There were four different sources of data used in this study. The first source
provided information about the traffic police officers working in the Regional Traffic
Enforcement Unit, obtained from the Regional Traffic Police Unit. This involved gender,
marital status, years of service in the Turkish National Police, years of service in
Eskisehir Police Department, years of service in Traffic Enforcement Unit, rank, highest
level of education, place of birth, and age. These data were used to provide a comparison
of traffic police officers who took part in the study with those who did not take part in the
study. The second source of data was from the survey questionnaire (see Appendix A)
administered to a total of 624 drivers. These data were the primary source of information
used to test the hypotheses outlined in the previous chapter concerning the impact of
BWCs on the behavior of police and citizens. Third, data concerning the frequency and
nature of complaints about traffic tickets were obtained from the Regional Traffic Police
Unit. Because the traffic surveys were subjective (and from the perspective of drivers),
complaint data were included to supplement the study with “objective” information about
dissatisfaction in encounters with traffic police officers. The fourth and final source of
data was from the open-ended question in the survey. The responses to the open-ended

59
question were coded by identifying themes and classified accordingly. Quotes were
selected based on the themes. Five hundred responses out of 624 were analyzed since
they included sufficient responses. The rest of them did not involve sufficient information
for the analyses.
3.8 Measures
The key independent variable for the study was the group assignment, which is a
dummy variable for assignment to the experimental condition versus the control
condition. There were also eight different dependent variables: procedural justice, police
legitimacy, traffic police legitimacy, specific compliance, general compliance,
cooperation, perception of police, and satisfaction. There were thirteen control variables.
Each will be described in more detail below.
Procedural justice involves four key elements: respect, neutrality/fairness, voice,
and trustworthiness (Tyler, 2006, 2007). Accordingly, driver perceptions of procedural
justice was measured using seven items. Namely, respondents were asked how much they
agree or disagree with the following statements:
1. “Overall, the police officer was polite and treated me with respect during the
interaction” (Sahin, 2014).
2. “The police officer was fair when making the decision to stop me” (Mazerolle et
al., 2013).
3. “Overall, what police did was based on the rules” (Tyler, 2004; Reisig Tankebe,
& Meško, 2012).
4. “I felt the police officer would do the same to anyone in my situation irrespective
of his/her status” (Sahin, 2014).

60
5. “The police officer gave me opportunity to express my views during the
interaction” (Mazerolle et al., 2013).
6. “The police officer listened to me during interaction” (Mazerolle et al., 2013).
7. “I believe that what the police did is for my own safety” (see Tyler, 2007).
Perceptions of police were measured as the level of agreement with the following
statement: “The specific encounter with police today does have positive impact on my
perception of police in general.”
Satisfaction was measured as the level of agreement with the following statement:
“Overall, I was satisfied with police behavior and how I was treated during this
encounter” (Sahin, 2014).
Police legitimacy and traffic police legitimacy were both measured as the level of
agreement with the following three statements, modified as shown parenthetically to also
refer to traffic police:
1. “I have respect for (traffic) police officers” (Tyler, 2006).
2. “I have confidence in (traffic) police officers” (Tyler, 2006; Mazerolle et al.,
2013).
3. “I trust (traffic) police officers” (Mazerolle et al., 2013; Sahin, 2014).
Specific compliance was measured as the level of agreement with the following
statement: “I did as I was told by the police officer” (Mazerolle et al., 2013). General
compliance was measured by modifying a measure of compliance identified by Tyler
(2006). General compliance was operationalized as the level of agreement with the
following two statements:
1. “I would obey the traffic rules.”

61
2. “This interaction would have positive impact on my future compliance with the
traffic rules.”
Finally, cooperation was measured as the level of agreement with the following
two statements:
1. “I am willing to assist police if asked” (Tyler, 2006).
2. “I am willing to work with police to try to solve problems in my community”
(Paoline & Terrill, 2005).
Note that all responses to the above-mentioned statements were measured by
using a 5-point Likert scale with responses ranging from “strongly agree” to “strongly
disagree.” For purposes of analysis, these response categories were reverse coded, so that
a higher value indicates stronger agreement with each of the statements. The five
dependent variables composed of multiple items (procedural justice, police legitimacy,
traffic police legitimacy, general compliance, and cooperation) were also factor analyzed
to obtain single measures, the results of which are described in the next chapter.
The control variables included the following items:
• Gender (1=male; 0=female).
• Marital status (1=never married; 2=married; 3=separated; 4=divorced;
5=widowed).
• Employment status (1=employed; 2=unemployed; 3=other).
• Income (actual amount).
• Education level (1=literate; 2=elementary school [grades 1-5]; 3=middle school
[grades 6-8]; 4=primary school [grades 1-8]; 5=high school [grades 9-12];
6=higher school [2 years after high school]; 7=college degree [BA, BS];

62
8=graduate degree [MA, MS]; 9=professional degree [PhD., J.D., M.D.];
10=other).
• Age (date of birth).
• Place of birth (actual province).
• Place of residence (1=city center of province; 2= district; 3=town; 4=village).
• Relational ties with police (0=none; 1=spouse, son, daughter, father, mother;
2=close relative [uncle, aunt, their children]; 3=close friend).
• Prior contact with police (1=yes; 0=no).
• Years of driving (actual number).
• Stopped by traffic police (1=yes; 0=no).
• Ticketed during the encounter (1=yes; 0=no).
With the exception of income, age, and years of driving, all other control
variables were multinomial and were therefore dummy coded for the analysis. For ease of
analysis and interpretation, the response categories of many of them were collapsed (e.g.,
marital status, employment status, place of birth, place of residence, and relational ties
with police).

63
CHAPTER 4: ANALYSIS AND RESULTS
Thischapterisfocusedondataanalysis.Itfirstpresentsthestrategyusedto
analyzethecollecteddata.It isthenfollowedbyadiscussionoftheresultsofdata
analysis.
4.1 Analytical Strategy The strategy employed for data analysis proceeding according to the following
series of steps:
1. Analysis was conducted to make sure the experimental condition was delivered with
fidelity.
2. The demographic characteristics of the traffic police officers who participated in the
study and the traffic police officers who did not participate in the study were
compared.
3. Analysis was carried out to assess whether the experimental group and the control
group were balanced.
4. Principal components analysis was used to obtain composite measures from multiple
items. Procedural justice, traffic police legitimacy, police legitimacy, cooperation,
and general compliance were conceptualized as latent variables underlying more than
one survey item. Each item was an ordinal variable measured by a 5-point Likert
scale. The factor scores resulting from this analysis were measured in equal-interval
metric and could therefore be treated as continuous dependent variables suitable for
least squares regression (Remler & Van Ryzin, 2014; Scott Long, 1997).
5. Descriptive statistics was performed.

64
6. Independent-samples t-test was performed for bivariate analysis. The t-test was
appropriate for bivariate analysis since the key independent variable was binary
(experimental versus control group) and the dependent variables were continuous.
7. The OLS regression model was used for multivariate analysis, which allowed for the
inclusion of the control variables. Numerical and graphical methods were performed
to detect potential violations of the standard regression assumptions, which involve
linearity, normality, homoscedasticity, collinearity, outlier and influential data (Fox,
1991; Tabachnick & Fidell, 2013), as well as independence, measurement error, and
model specification (Tabachnick & Fidell, 2013; IDRE, 2015). Then, a number of
sensitivity analyses were performed to ensure that the key results were robust to
deviations from the standard regression assumptions. For example, robust standard
errors are used to address non-normality, heteroscedasticity, or some observations
with large residuals, leverage or influence (IDRE, 2015). Robust regression, which is
an iterative procedure that reweights downward potentially influential observations
(IDRE, 2015), was employed. Quantile regression, which is a model of the
conditional median as opposed to the conditional mean (IDRE, 2015), was also
estimated. Regression with measurement error was performed to take into account the
measurement errors in the regressors when estimating the coefficients for the model
(IDRE, 2015). With respect to the key regressor (BWC treatment assignment), the
findings from these sensitivity analyses confirmed the conclusions from standard
OLS regression, and in fact, the coefficients are always larger than OLS.
Consequently, the sensitivity analysis results will be tabulated without further
comment.

65
8. Mediation analysis was conducted as a supplementary analysis.
9. Data on complaints about traffic tickets were compared between the experimental
group and the control group.
4.2 Analysis of Delivering the Experimental Condition with Fidelity
In a randomized controlled trial, it is also important to control the experimental
condition. In other words, whether the experimental condition was delivered with fidelity
should be tested empirically. Two questions on the survey checked whether the police
officers in the experimental group stated that the encounter between them and citizens
would be recorded and whether the drivers were aware that the encounter was recorded
through BWC: The first question was, “Were you notified that the encounter would be
recorded through BWC?” and the second question was, “Were you aware that the
encounter was recorded through BWC?”.
The results indicated that only 3 out of 299 participants in the experimental group
reported that they were not notified that the encounter would be recorded through BWC.
Those three participants also reported that they were not aware that the encounter was
recorded through BWC. In addition, the participants in the control group were asked the
same questions. The results indicated that the participants in the control group reported
that they were not notified that the encounter would be recorded through BWC and were
not aware that the encounter was recorded through BWC. The results showed that the
treatment condition was delivered with high fidelity. This allowed the researcher to make
sure that BWCs were activated during the study and police officers delivered both
condition as intended.

66
4.3 Comparison of Demographic Characteristics Between Traffic Police Officers in the Study and Traffic Police Officers Not in the Study
There were 84 traffic police officers working in the Regional Traffic Enforcement
Unit, of whom 58 were working on patrols and the rest either working in the
administrative offices or on the speed radar team. Out of these 58 traffic police officers,
just 31 officers were involved in the study. Independent samples t-test and chi-square
tests were computed to test whether there were any significant differences between the 31
traffic police officers in the study and the 27 traffic police officers not in the study. Table
2 shows a comparison of demographic characteristics between traffic police officers who
participated in the study and traffic police officers who did not participate in the study.
The results showed that there was no statistically significant difference between them. All
of the police officers were male and married, with the vast majority having more than a
high school degree (92.6% vs. 87.1%), born in provinces other than Eskisehir (85.2% vs.
93.6%), and had the rank of police officer (88.9% vs. 83.9%). On average, the police
officers were older than 40 years (42.3 vs. 44.1), had more than 18 years of service (18.3
vs. 20.7), had been working in Eskisehir for more than 5 years (4.9 vs. 6.0), and had more
than 14 years of experience in the traffic unit (14.3 vs. 14.3).
< Insert Table 2 >
The results suggest that the differences between the experimental group and the
control group can be attributed to the intervention with confidence because the
demographic characteristics between the traffic police officers in the study and traffic
police officers not in the study are very similar. That is, the differences in the results are
not due to the differences between the officers in the study and the officers not in the
study.

67
4.4 Equivalence between the Experimental Group and the Control Group
In theory, randomization makes the experimental group and the control group
equivalent or similar. Randomization rules out or eliminates known differences and
unknown differences between the two groups. With regard to this study, the only
difference between the experimental and the control group should be the experience of an
encounter with a BWC. In order to ensure that drivers in the experimental and control
groups were successfully “balanced,” a number of comparisons between the two groups
were carried out.
First, a chi-square test was performed to test whether there was a statistically
significant difference between the two groups in terms of response rate. The results
shown in Table 1 indicated that the difference between the groups was not statistically
significant (X2 (6) = 1.47; p = 0.226).
< Insert Table 1 >
Second, a chi-square test was carried out to test whether there was a statistically
significant difference between the two groups in terms of the reasons for rejection to
participate in the survey provided by drivers. As shown in Table 1, importantly, the
experimental group did not statistically differ from the control group in the reasons for
rejection to participate in the survey (X2 (6) = 0.83; p = 0.991).
< Insert Table 1 >
Third, a number of sample characteristics measured from the driver survey were
statistically compared using t-tests and chi-square tests. These comparisons are shown in
Table 3.
< Insert Table 3 >

68
The comparisons indicated that there was no statistically significant difference
between the experimental and control groups. More specifically, the vast majority of the
participants in both groups were male (95.7% control [C] vs. 96.7% experimental [E]),
married (78.2% C vs. 78.9% E), employed (83.1% C vs. 83.3% E), not born in Eskisehir
(69.5% C vs. 74.9% E), living in the city center (64.9% C vs. 68.9% E), were stopped by
traffic police (82.8% C vs. 77.3% E), were not ticketed during the encounter (92.9% C
vs. 91.6% E), had less than high school degree or equivalent (65.8% C vs. 62.5% E),
relational ties with police (58.2% C vs. 59.9% E), and prior contact with police (66.5% C
vs. 61.2% E). In addition, the participants in both groups were older than 40 years of age
(40.3 C vs. 41.3 E), had more than 17 years driving experience (17.2 C vs. 17.7 E), and
earned more than 2,000 TL income (2,478 C vs. 2,619 E). Across the 13 variables shown
in Table 3, then, any differences were trivial and attributable to chance.
Finally, a chi-square test was performed to test whether there was a statistically
significant difference between the two groups in terms of time of traffic stops and
location of traffic stops. The results shown in Table 3 indicated that there was no
statistically significant difference between the experimental and control groups. More
specifically, the participants in the control group and in the experimental group were
stopped mostly in the morning (56.9% C vs. 56.5% E) and at the checkpoint called Bursa
3 km (52.0% C vs. 51.2% E).
< Insert Table 3 >
Overall, the results of the comparison analyses between the two groups showed
that any differences between the two groups were trivial and attributable to chance.
Therefore, the two groups can be considered statistically equivalent.

69
4.5 Principal Components Analysis and Scale Reliability
Variables, including procedural justice, traffic police legitimacy, police
legitimacy, general compliance, and cooperation with police, are latent variables
composed of multiple measured items. Principal Components Analysis (hereafter PCA)
was performed for data reduction and to confirm that the items reliably measure the
hypothesized latent variables. PCA produces components (also called factors), which are
simply aggregates of highly correlated variables (Tabachnick & Fidell, 2013). The
principal components are ordered, in such a way that “the first component extracts the
most variance whereas the last component extracts the least variance” (Tabachnick &
Fidell, 2013, p. 640). The analysis is performed from polychoric correlation matrices
rather than Pearson correlation matrices because polychoric correlations better
accommodate ordinal response coding like that used here (Holgado-Tello, Chacon-
Moscoso, Barbero-Garcia, & Vila-Abad, 2010; Maguire & Mastrofski, 2000).
The results from the PCA are shown in Tables 4 and 5. The correlations among
variables grouped together were all greater than .50 (except for the two general
compliance items) and most of them were at least 0.60, which suggests that there was
good factor structure to the items. Each PCA yielded just one factor with an eigenvalue
greater than 1.0, which exceeds the Kaiser criterion, and all factor loadings were well in
excess of 0.70. Moreover, the Cronbach’s alpha for each grouping was large (except for
the two general compliance items), indicating that the scales are highly reliable. The
Cronbach’s alpha level for general compliance (.64) indicated that the scale reliability
was acceptable. The use of PCA for data reduction thus yielded five dependent variables,

70
each having very desirable statistical properties, namely, large factor loadings and high
internal consistency.
< Insert Tables 4 and 5 >
4.6 Univariate Analysis
The results of the sample descriptive statistics are shown in Table 6. Roughly,
half of the participants were in the control group (52.1%), while around 48% of the
participants were in the experimental group. The majority of the participants in the study
were male (96.2%), married (78.5%), employed (83.2), born in provinces (72.1%) other
than Eskisehir, living in the city center (66.8%), had less than high school degree or
equivalent (64.3%), and had relational ties with police (59.0%). In addition, on average,
the participants were about 41 years old (SD=11.73), spanning from 19 to 75 years old,
and had 17 years (SD=10.81) driving experience, ranging from 1 to 51 years. The
average individual monthly income of the participants was 2,545 Turkish Lira ($1,130)
(SD=2248.54).2 In addition, the vast majority of the participants were stopped by traffic
police in the past 12 months (80.1%); one-third of the participants had prior contact with
police (36.1%); and just about 8% of the participants were ticketed during the encounter.
< Insert Table 6 >
The table also provides descriptive statistics about the dependent variables. The
means were 5.27 for procedural justice (SD= .78), 4.46 for traffic police legitimacy (SD=
1.00), 4.31 for police legitimacy (SD= 1.05), 4.80 for general compliance (SD= .84), and
4.74 for cooperation with police (SD= .81). Three additional dependent variables were
2 Note that US$1 was worth 2.25 Turkish Lira at the time of the study.

71
measured with single items, with means of 4.54 for specific compliance (SD= .64), 4.38
for satisfaction (SD= .72), and 4.21 for perception of police (SD= .87).
4.7 Bivariate Analysis
For the bivariate analyses, independent samples t-test were performed to
investigate whether there was a statistically significant difference between the means of
the experimental group and control group. These were supplemented with estimates of
the effect size, which provided a diagnostic for the substantive significance of the mean
difference, rather than its statistical significance. The effect size shown is Cohen’s d, for
which 0.19 or smaller is generally regarded as not worth mentioning (even if the
difference is statistically significant), 0.20-0.49 is “small,” 0.50-0.79 is medium,” and
0.80 or higher is “large” (Cohen, 1988). The t-tests and effect sizes are provided in Table
7.
< Insert Table 7 >
The results indicate that the means of all of the dependent variables differ
significantly between the experimental group and the control group. Close inspection
shows that the experimental group mean was always higher than the control group mean,
indicating that the mean level of agreement concerning opinions about the police was
higher when the traffic officer was wearing a BWC than when s/he was not. The effect
size coefficients indicate that, of the eight dependent variables, three differences were
“small,” one difference was “medium,” and three differences were “large.” Only one
effect size was not large enough to be considered noteworthy (police legitimacy), despite
the fact it was statistically significant.

72
The three effect sizes within the “small” range include traffic police legitimacy (d
= 0.26), general compliance (d = 0.35), and cooperation (d = 0.33). In other words, the
participants in the experimental group reported that they perceived the traffic police as
more legitimate, would comply more with traffic rules in the future, and that they would
be more willing to cooperate with police. The single effect size within the “medium”
range concerns perceptions of police (d = 0.56), suggesting that the participants in the
experimental group reported more positive perceptions of the police in general.
The three effect sizes within the “large” range include procedural justice (d =
1.03), specific compliance (d = 0.94), and satisfaction (d = 1.12). In other words, the
participants in the experimental group reported that the traffic police officers treated them
in a more procedurally just way, that they would comply more with traffic police
officers’ commands, and that they were more satisfied with the encounter.
In sum, the bivariate results indicate that the experimental intervention was highly
effective in improving driver perceptions of the behavior of the traffic police during the
encounter and their perceptions of the legitimacy of the traffic police (although not
necessarily the police generally, at least as judged by the effect size), as well as their
willingness to comply with police directives and with traffic laws.
4.8 Multivariate Analysis
To ensure that the bivariate results reported in the previous section were not
artifacts of excluded variables, multiple regression models were estimated to control for a
number of other driver characteristics. These include sociodemographic variables
(gender, age, and marital status), socioeconomic variables (employment status, education
level, and income), residential variables (province of birth and place of residence), past

73
interactions with police (relational ties, prior contact, and prior traffic stops), the number
of years driving, and the outcome of the traffic encounter (ticketed). Note that because of
a large skew in the distribution of income, which is characteristic of this kind of variable,
the natural logarithm of income is included in place of the measure in its original metric.
For the multivariate analysis, eight different OLS regression models were estimated – one
for each dependent variable. The regressors were the same in all models.
4.8.1 Assumption Tests for OLS Regression Before running the OLS regression, numerical and/or graphical methods were
employed for each model to test whether the data met the assumptions of OLS regression.
The results showed that all models failed to meet the OLS assumptions, including
normality, non-collinearity, and homoscedasticity (except for perception of police),
whereas the assumptions, including linearity and model specification, were met.
< Insert Figures 1-5 and Table 8-10>
A correlation matrix including the regressors is provided in Table 8. Note that,
because of a high correlation between age and the number of years driving (r = 0.82), and
variance inflation factors in excess of 3.0, age was excluded from the regression models
(see Table 8).
The leverage versus squared residuals are shown in Figure 1. As illustrated in this
figure, there might be potential unusual and influential observations in all models. Robust
regression is designed to adjust for these types of influential cases and does so by
systematically down-weighting those potentially problematic observations. It is
noteworthy that the robust regression models shown for all of the dependent variables

74
yielded results that were virtually identical. This increases confidence that the influential
observations flagged in Figure 1 do not distort the findings.
The distributions of the eight dependent variables are shown in Figure 2. No
distribution resembled a perfectly symmetrical or even roughly normal distribution.
Indeed, Shapiro-Wilk tests for the normality of each distribution were easily rejected (see
Table 9), indicating that the distributions departed significantly and substantially from
normality. That being said, non-normality does not introduce bias in OLS regression
coefficients and will only distort standard errors and p-values.
The errors around the regression lines are shown in Figure 3. Plotting the
residuals against the fitted values illustrated that the error variances were not constant
around the regression line (except for Model 8: Perception of Police). In addition,
Breusch-Pagan tests for heteroskedasticity were easily rejected (see Table 9), indicating
that the error variances were heteroskedastic (except for Model 8: Perception of Police).
Note that the use of robust standard errors was a convenient solution for
heteroskedasticity.
Linearity between income and outcome variables and years of driving and
outcome variables are provided in Figure 4 and Figure 5, respectively. The scatter plots
illustrate that the relationship between log income and the outcome variables and the
relationship between years of driving and the outcome variables are sufficiently linear.
Note that linearity was just examined between continuous regressors (income and years
of driving) and the outcome variables because “the dichotomous dummy variables can
only have a linear relationship with other variables” (Tabachnick & Fidell, 2013, p. 83).

75
Finally, the results of regression specification error tests (RESET) indicated that
all models were specified correctly (see Table 9). Sensitivity analyses will consider the
robustness of the empirical results to violations of the regression assumptions. However,
it should be mentioned that such violations will only bias the standard errors and p-values
of the usual statistical tests. The coefficients themselves are unbiased. The results of OLS
regression, robust standard error, robust regression, quantile regression, and regression
with measurement error are shown in the tables. However, just the results of robust
standard errors will be reported in the text.
4.8.2 Model 1: Procedural Justice Table 11 displays the regression results for Model 1, which explains 23.1% of the
variation in procedural justice perceptions. The coefficient for the experimental group
indicates that the BWC intervention significantly improved procedural justice perceptions
(b=0.69; t=12.72; p < .001). None of the other regressors was statistically significant.
< Insert Table 11 >
4.8.3 Model 2: Traffic Police Legitimacy Table 12 displays the regression results for Model 2, which explains about 5.5%
of the variation in traffic police legitimacy perceptions. The coefficient for the
experimental group indicates that the BWC intervention significantly improved police
legitimacy perceptions (b=0.24; t=3.06; p< .001). The results also indicate that drivers
who have been stopped before reported significantly lower traffic police legitimacy (b=-
.021; t=-2.29; p=< .05).
< Insert Table 12 >

76
4.8.4 Model 3: Police Legitimacy Table 13 displays the regression results for Model 3, which explains 6% of the
variation in police legitimacy perceptions. The coefficient for the experimental group
indicates that the BWC intervention significantly improved police legitimacy perceptions
(b=0.21; t=2.49; p<.01). The results also indicate that married drivers reported
significantly more police legitimacy (b=0.29; t=2.31; p<.05), whereas drivers who have
had prior contact with the police reported significantly lower traffic police legitimacy
(b=-.026; t=-2.81; p<.01).
< Insert Table 13 >
4.8.5 Model 4: Cooperation Table 14 displays the regression results for Model 4, which explains 5.1% of the
variation in cooperation perceptions. The coefficient for the experimental group indicates
that the BWC intervention significantly improved cooperation perceptions (b=0.24;
t=3.73; p<.001). The results also indicate that married drivers reported significantly
higher cooperation perceptions (b=0.25; t=2.54; p<.01).
< Insert Table 14 >
4.8.6 Model 5: General Compliance Table 15 displays the regression results for Model 5, which explains 8% of the
variation in general compliance perceptions. The coefficient for the experimental group
indicates that the BWC intervention significantly improved general compliance
perceptions (b=0.28; t=4.37; p<.001). The results also indicate that married drivers
reported significantly higher compliance perceptions (b=0.23; t=2.35; p<.05), whereas
drivers who have been stopped before (b=-0.18; t=-2.38; p<.05) and employed drivers

77
(b=-0.19; t=-2.31; p<.05) reported significantly lower compliance perceptions.
< Insert Table 15 >
4.8.7 Model 6: Specific Compliance Table 16 displays the regression results for Model 6, which explains 20% of the
variation in specific compliance perceptions. The coefficient for the experimental group
indicates that the BWC intervention significantly improved specific compliance
perceptions (b=0.51; t=11.20; p<.001). The results also indicate that drivers who are
better educated reported significantly higher compliance perceptions (b=0.12; t= 2.45;
p<.01).
< Insert Table 16 >
4.8.8 Model 7: Satisfaction Table 17 displays the regression results for Model 7, which explains 26% of the
variation in satisfaction perceptions. The coefficient for the experimental group indicates
that the BWC intervention significantly improved satisfaction perceptions (b=0.68;
t=14.05; p<.001). None of other repressors was statistically significant.
< Insert Table 17 >
4.8.9 Model 8: Perception of Police Table 18 displays the regression results for Model 8, which explains 9% of the
variation in perceptions about the police. The coefficient for the experimental group
indicates that the BWC intervention significantly improved police perceptions (b=0.47;
t=6.99; p<.001). None of the other regressors was statistically significant.
< Insert Table 18>

78
4.9 Mediation Analysis Mediation analysis was conducted as a supplementary analysis. Recall that a path
model was hypothesized and shown in Exhibit 2 above. Three of the dependent variables
examined in the previous section, procedural justice, traffic police legitimacy, and police
legitimacy, are actually intervening variables. Therefore, the direct effect of BWCs on the
remaining five distal outcome variables, including satisfaction, perception of police,
cooperation, general compliance, and specific compliance, was examined in separate
regression models supplemented with the control variables, net of the intervening
variables. The results of mediation analysis are shown in Exhibit 4.
Exhibit 4. Results of Mediation Analyses
Notes:
1-ThicksolidlineshowsthatBWChasdirecteffectontheoutcomevariables.
2-ThinsolidlinesshowsthatBWChasNOdirecteffectontheoutcomevariables.
3-Allpathesarehypothesizedtobepositive.
4-Theinterveningvariablesareproceduraljustice,trafficpolicelegitimacy,andpolicelegitimacy.
SaJsfacJon
BWCProceduralJusJce
TrafficPolice
LegiJmacy
SpecificCompliance
GeneralCompliance
CooperaJon
PercepJonofPolice
PoliceLegiJmacy

79
The results of the effects of BWCs on the intervening variables are provided in
Table 19. The results show that using BWCs has a statistically significant positive effect
on the intervening variables, including procedural justice (b=0.69; t=12.72; p<.001),
traffic police legitimacy (b=0.24; t=3.06; p<.001), and police legitimacy (b=0.21; t=2.49;
p<.01).
< Insert Table 19>
The VIF values are provided in Table 20. Table 21 shows the results of the direct
effect of BWC on the distal outcomes controlling for the control variables including the
intervening variables. Note that all pathways are hypothesized to be positive. Table 22
displays the results of the direct effect of BWC on legitimacy when controlling for
procedurally just policing.
< Insert Table 20-21-22>
Table 20 for VIF values indicates that there is no colliniearity problem. Then OLS
regression was performed to investigate whether BWC has direct effect on the distal
outcomes net of the intervening variables and the other control variables.
The results shown in Table 21 indicate that procedural justice and traffic police
legitimacy fully mediate the effect of BWCs on general compliance and cooperation,
whereas the effect of BWCs on perceptions of police is fully mediated by procedural
justice, traffic police legitimacy, and police legitimacy. However, procedural justice
partially mediated the effect of BWCs on specific compliance and satisfaction. In other
words, BWCs have a direct and statistically significant positive impact on specific
compliance and satisfaction.

80
Furthermore, the results shown in Table 22 indicate that BWCs have a direct,
statistically significant negative impact on traffic police legitimacy when controlling for
procedural justice. Note that the indirect effect of BWCs on traffic police legitimacy was
found to be about twice that of its direct effect and positive. However, the effect of
BWCs on police legitimacy was fully mediated by procedural justice.
4.10 Citizen Complaints about Traffic Tickets
Police agency data on the number of complaints filed about traffic tickets were
collected. These were the only complaints received from the citizens in the control group
and the experimental group during the course of the study. The data about the complaints
were gathered from two different sources. One source was complaints made in person to
the Regional Traffic Police Unit. In Turkey, if a person has complaint about traffic ticket,
s/he can directly apply in person to the relevant traffic unit. Such requests/complaints are
recorded. A second source was complaints about traffic tickets received from the court.
The court sends complaints made by citizens about traffic tickets to the Regional Traffic
Police Unit if traffic tickets were issued in its area of responsibility. These complaints are
also recorded by the unit.
After the complaints were obtained, the data were linked to the time, date, and
location in which the study was being conducted. In that way, the complaints could be
linked to the experimental group and the control group. Then, the data were used to
compare the number of citizen complaints between the control group and experimental
group based on the date, location of traffic tickets, and approximate time specified in the
complaint. This provided an objective basis for comparison between the experimental and
the control group.

81
The results indicated that during the course of the study, only six complaints
about traffic tickets were received from the control group, whereas no complaints were
received from the experimental group. That is, there was a 100% reduction in complaints
about traffic tickets in the experimental group compared to the control group. These
external data confirm the effectiveness of BWCs on complaints about traffic tickets, since
the only complaints received were from the control group. It is noteworthy that seven
complaints were received from drivers who interacted with police officers at the other
two checkpoints where the study was not conducted during the study hours throughout
the course of the study. This shows the normal number of complaints received during the
course of the study.

82
CHAPTER 5: DISCUSSION AND CONCLUSION This final chapter first reiterates the key findings of this study and incorporates
the responses to open-ended questions obtained from the surveys completed by study
participants to provide additional support for the results. The discussion then turns to the
implications of this study for policy on BWCs. The chapter closes with a discussion of
the limitations of the study and suggestions for future research.
5.1 Summary of Findings
This study investigated the effect of BWCs on the self-reported behavior of
citizens toward traffic police officers and police behavior toward drivers during traffic
stops. More specifically, the research focused on whether the use of BWCs had a
measurable impact on driver perceptions of police legitimacy and traffic police
legitimacy, perceptions of procedurally just policing, and satisfaction with police. The
research also investigated whether BWCs altered driver behavior toward police officers.
More specifically, the research tested whether BWCs increase driver compliance with
police commands during traffic stops as well as cooperation with police and compliance
with traffic laws in the long run.
The findings from independent sample t tests indicated that BWCs elicited
significantly improved perceptions concerning all eight dependent variables. With respect
to substantive significance, BWCs had a large-sized effect on procedural justice,
satisfaction, and specific compliance; a medium-sized effect on perception of police; and
a small-sized effect on traffic police legitimacy, general compliance, and cooperation. By
comparison, while it was statistically significant, the impact of BWCs on police
legitimacy was too substantively small to be noteworthy.

83
The findings from all of the multivariate analysis, including OLS regression,
regression with robust standard errors, robust regression for unusually influential
observations, quantile regression, and regression with measurement error also indicated
that BWCs had a positive and significant effect on all dependent variables. Table 23
displays a summary of the results of regression with robust standard error test for all
models. More specifically, controlling for other variables, BWCs had the largest
standardized effect on satisfaction (B= .49), followed by procedural justice (B= .46),
specific compliance (B= .41), perception of police (B= .27), general compliance (B= .17),
cooperation (B= .15), and traffic police legitimacy (B= .12), with the smallest
standardized effect on police legitimacy (B= .10).
<Insert table 23>
The findings confirmed all of the hypotheses tested. The first hypothesis was that
BWCs would compel traffic police officers to behave in a procedurally just way. This
finding is consistent with the literature. The literature contends that BWCs increase
procedurally just policing (Farrar & Ariel, 2013; Harris, 2010; Rieken, 2013; White,
2014). In addition, the descriptive studies about the effect of in-car cameras found that
they also improve police behavior by encouraging compliance with departmental
guidelines and more polite and professional treatment of people (IACP, 2004).
Furthermore, the study of the Mesa Police Department suggested that the majority of
police officers that participated in the study believed that BWCs would lead officers to
behave more professionally (MPD, 2013).
In the present study, the participants’ responses to open-ended questions also
support the hypothesis about procedural justice. The participants reported that BWCs

84
increase quality of treatment (32%), prevent corruption (14%), and increase compliance
(8.5%). In other words, more than 50% of the participants overall reported that BWCs
lead police officers to behave in a procedurally just way. One of the participants stated,
“Police behave well when they use BWCs because everything is recorded.” Another
respondent reported, “BWCs make police obey the rules, be polite, and treat people
fairly, politely, neutrally, and objectively.”
The second hypothesis was that BWCs would increase traffic police legitimacy,
and the third was that BWCs would increase police legitimacy. The findings are
consistent with the literature. BWCs promote police legitimacy among citizens
(Howland, 2010; Koper et al., 2014; Mazerolle et al., 2013; Miller et al., 2014; Ramirez,
2014; Roy, 2014; White, 2014). Prior research also suggests that BWCs increase the
public’s trust in police (Clark, 2013; Miller et al., 2014) as well as accountability (Koper
et al., 2014; Miller et al., 2014; Ramirez, 2014; Roy, 2014; Wain & Ariel, 2014). This is
attributable, in part, to the enhancement of police legitimacy and the sense of procedural
justice policing among citizens (Howland, 2010; Koper et al., 2014; Mazerolle et al.,
2013; Miller et al., 2014; Ramirez, 2014; Roy, 2014; White, 2014). Because of BWCs,
police officers should be more likely to comply with proper legal and constitutional
standards as well as internal departmental regulations (Harris, 2010; Rieken, 2013), as
well as act more professionally (White, 2014), for example, by treating people fairly,
respectfully, and politely (Harris, 2010; Koper et al., 2014; Rieken, 2013).
Examination of open-ended responses from this study also indicates that
respondents think BWCs increase legitimacy by increasing trust and transparency. The
participants reported that BWCs provide evidence (55.4%), enhance transparency (51%),

85
and reduce complaints (4.4%). One of the respondents said, “BWCs prevent false
allegations against police.” Another respondent reported, “BWCs increase trust with
police because everything is recorded.” A further respondent said, “BWCs reveal the
facts for both parties, and people can see who is right and who is wrong in the case of a
complaint.” Another respondent said, “BWCs enhance transparency.”
The fourth hypothesis was that BWCs would increase cooperation between police
and citizens. Several past studies also found that being watched had a positive impact on
cooperative behaviors (Bourrat et al., 2011). BWCs also appear to increase cooperation
between citizens and police (Farrar & Ariel, 2013; Vorndran et al., 2014). Furthermore,
the respondents also emphasized that BWCs increase cooperation. For instance, one of
the respondents said, “I would do anything whatever police ask me to do if they treat me
as well as they treated me today.” This results from procedurally just behavior.
The fifth hypothesis was that BWCs would increase driver compliance with
traffic laws/rules. Some past studies and the respondents’ answers to the open-ended
questions support the finding. One study of in-car cameras indicated that citizens reported
the presence of a camera would make them less likely to drive aggressively (IACP,
2004). Finally, many respondents in the current study believe BWCs increase compliance
with traffic laws/rules in the future. This is supported by the responses of the participants.
Procedurally just behavior increases compliance. One of the respondents who
experienced the experimental condition said, “If police treat me well, like in the
encounter today, I would always obey the rules.” Another respondent said, “BWCs lead
drivers to obey the rules.”

86
The sixth hypothesis was that BWCs would increase driver compliance with
police commands. The literature and several past studies support the finding. The
literature argues that the use of BWCs alters the behavior of citizens (White, 2014), with
citizens treating officers wearing BWCs more respectfully and acting more compliant and
cooperative (Farrar & Ariel, 2013). The descriptive study about in-car cameras found that
when citizens were watched, they would change their behavior, become less aggressive,
and be more courteous (IACP, 2004). In addition, the Plymouth Camera Project study
and the Mesa study suggested that BWCs would lead citizens to be more respectful
toward police officers (Goodall, 2007; MPD, 2013).
The respondents in this study also emphasized the impact of BWCs on
compliance in their open-ended responses. Specific compliance is a result of procedurally
just behavior and the availability of evidence obtained through BWC. More than 50% of
the respondents reported that BWCs increase procedurally just behavior and provide
evidence. One of the respondents said, “When the police officer said that the encounter
would be recorded, I could not do anything, I could not even move. I could do nothing
more but to comply with police commands.” Another respondent said, “BWCs make a
disrespectful person more respectful.”
The seventh hypothesis was that BWCs would promote driver satisfaction with
the police. The respondents expressed their satisfaction with the use of BWCs. The
respondents agree that BWCs ensure that the encounter is transparent (51%). One of the
participants said, “Everything is transparent with BWCs.” Another participant reported,
“Since everything is recorded, BWCs reveal the facts that transpire during the encounter.
They provide evidence.” A further respondent said, “I am very satisfied. This is the first

87
time a police officer shook my hands (shaking hand indicates the sincerity and friendship
in Turkey) and the officer was surprisingly polite and respectful.” The quotes showed
how satisfied respondents were with the use of BWCs.
The eighth hypothesis was that BWCs would have a positive impact on driver
perceptions of police in general. Prior literature suggested that BWCs increase
transparency and thus enhance the public’s trust in police (Clark, 2013; Miller et al.,
2014) as well as accountability (Koper et al., 2014; Miller et al., 2014; Ramirez, 2014;
Roy, 2014; Wain & Ariel, 2014). In addition, many respondents in this study believed
that BWCs make police officers more transparent, provide evidence, and prevent
corruption (51%, 55.4%, and 14%, respectively). One of them said, “BWCs provide
evidence and prevent frivolous allegations about police.” Another respondent said,
“BWCs prevent corruption and provide external oversight of police.”
The ninth and final hypothesis was that the effect of BWCs on distal outcomes
(perceptions of police, general and specific compliance, satisfaction, and cooperation)
would be mediated by procedural justice, traffic police legitimacy, and police legitimacy.
The finding is consistent with the literature. BWCs can increase procedurally just
policing and legitimacy (Farrar & Ariel, 2013; Harris, 2010; Koper et al., 2014; Miller et
al., 2014; Rieken, 2013; White, 2014), and procedural justice and legitimacy increase
compliance, cooperation, satisfaction, and perception of police (Engel, 2005; Levi et al.,
2009; Mastrofski et al., 1996; Mazerolle et al., 2013; McCluskey et al., 1999; Murphy et
al., 2008; Paternoster et al., 1997; Sahin, 2014; Sherman, 1997; Sunshine & Tyler, 2003;
Tyler, 1990, 2006; Tyler & Degoey, 1996; Tyler & Huo, 2002; Tyler & Fagan, 2008,
2012; Tyler et al., 2007; Vorndran et al., 2014). It is noteworthy that independent of

88
procedurally just policing and legitimacy, BWCs still increase specific compliance and
satisfaction, whereas BWCs have no direct effect on cooperation, general compliance,
and perception of police. Furthermore, when controlling for procedurally just policing,
BWCs have a negative effect on traffic police legitimacy, but the indirect effect of BWCs
on traffic police legitimacy is about twice that of its direct effect and positive. However,
BWCs have no statistically significant impact on police legitimacy when procedurally
just policing is held constant.
The external data also support the effectiveness of BWCs. The external data on
complaints about traffic tickets indicated that drivers in the experimental group did not
file a single complaint, whereas drivers in the control group filed six complaints.
5.2 Policy Implications
The research findings are important because the results shed light on the
implications of the use of BWCs as a matter of law enforcement policy. A new
contemporary policing strategy, which might be called “Recorded Just Policing,” should
be implemented department wide. “Recorded Just Policing” is predicated on two theories:
self-awareness theory and deterrence theory. As discussed in previous chapters, self-
awareness theory argues that when human beings are under observation, they modify
their behavior, exhibit more socially acceptable behavior, and cooperate more fully with
the rules (Duval & Wicklund, 1972). Deterrence theory argues that people calculate the
benefits and the costs of wrongdoing, and they are less likely to do wrong when its costs
outweigh its benefits (Nagin, 2012). By magnifying the certainty of punishment for
inappropriate behavior (Nagin, 2013), BWCs have the potential for the largest deterrent
effects on police–citizen encounters. Simply put, BWCs capture the actions of those who

89
are being watched – both police officers and citizens. This increases the likelihood of
punishing those who do not follow rules, thereby deterring people from non-cooperative
or noncompliant behavior. BWCs also increase self-awareness and make people
conscious that they are being watched and their actions are being recorded (Farrar &
Ariel, 2013). Hence, people are more likely to follow social norms and rules (Farrar &
Ariel, 2013). Overall, the use of BWCs increases both self-awareness and certainty, and
thus impacts those who are under observation.
The present findings have a number of practical policy implications. First, all
traffic police officers working on patrol would be well advised to employ the use of
BWCs in their interactions with civilians and to make that fact known during their
encounters. However, other police units, such as patrols and investigation units that have
frequent contact with citizen may also benefit from the use of BWCs. The use of a
camera leads police officers and citizens to behave well and increases transparency since
everything is recorded. BWCs also expedite solutions to problems because they are
capable of providing tangible evidence. Particularly in instances in which police officers
interact with suspects, the use of BWCs might help prevent police misconduct.
Second, supervisors of police officers should routinely view the recorded
interactions and provide necessary warnings for officers when needed. As a practical
matter, it should be possible to select recordings at random and watch them along with
police officers. This would send a clear message to police officers that the recordings are
checked by their supervisors. Otherwise, if police officers are aware that the recordings
are not checked by their supervisors, they may disregard the use of BWCs, and as a
result, the effect of BWCs on their behavior may diminish.
90
Third, BWCs should be activated before the start of an encounter and be kept
turned on until the encounter ends. Finally, the recorded data, which may involve
encounters that did not result in a ticket, arrest, or problem, should be stored in the
database for 30 days. However, other recordings, which involve encounters that resulted
in any issue should be stored in the database for at least six months to be used as evidence
in case of any complaint. Only then should the recorded data be deleted from the
database.
The routine use of BWCs has the potential for many benefits. The use of BWCs
has the potential to meet citizen expectations of police (procedurally just policing,
legitimacy, and satisfaction) and police expectations of citizen (specific and general
compliance, cooperation, and citizen perception of police). First and foremost, the current
study in Turkey suggests that BWCs increase the likelihood of procedural justice during
traffic stops and are an effective tool to promote legitimacy as well as compliant and
cooperative behavior. Specifically, drivers perceive that traffic police officers wearing
BWCs treat people more politely and follow the rules. This is very important because
surveys conducted in Turkey find that traffic police are less respected by citizens and
police–community relations are unsatisfactory (Dönmezer, 2011). Thus, daily police–
citizen encounters can be used an opportunity to improve perceptions of police legitimacy
by changing the nature of the interaction between citizens and police (Engel, 2005;
Sargeant et al., 2012), as well as to build trust and confidence (Goodman-Delahunty,
2010). Everyday encounters are important because public views of police legitimacy are
mostly shaped by police officer behavior and actions in specific encounters with citizens
rather than the public’s general perception of police legitimacy (Tyler & Darley, 1999).

91
The current study shows that BWCs alter police officer and citizen behavior positively,
which harmonizes with research findings that the initial presentation during police–
citizen encounters is a key determinant of what will transpire (Bayley, 1986; Fyfe, 1986)
and that police officers who show disrespect are less likely to obtain compliance
(Mastrofski, Snipes, & Supina, 1996). Thus, police behavior towards citizens and citizen
behavior towards police officers play crucial roles in escalating or deescalating
encounters that transpire every day. Simply, BWCs can achieve compliance without the
use of force.
Second, BWCs may also be useful to change citizens’ overall perceptions of the
police and traffic laws. The current study showed that BWCs have a significant positive
impact on perceptions even during a very brief encounter like that of a vehicle stop.
Vehicle stops are the most frequent contact that citizens have with police and may be the
only contact some citizens have with the police (Hoover et al., 1998; Woodhull, 1994).
Studies have shown that most citizens form their opinions of police based on their
experience during a 10-minute traffic stop (Calahan & Kersten, 2005; Woodhull, 1994).
In light of their volume, these police–citizen encounters may promote or damage public
perceptions of police legitimacy without changing the frequency and nature of the police
encounter with citizens (Frydl & Skogan, 2004), depending on how individual traffic
officers carry out their duties during encounters (Tyler & Darley, 1999). Prior research
also suggests that people follow the law in the long run if they view police authority as
legitimate (Sargeant et al., 2012). In light of the current findings with respect to general
compliance, these brief encounters might even decrease the number of traffic accidents in
the long run.

92
Third, BWCs may be effective in combatting police corruption and citizen
involvement in corruption (Sahin, 2010). Police corruption is viewed as widespread in
policing, particularly in traffic services (Cerrah et al., 2009; Prenzler, 2006). Prior studies
suggest that a transparent and accountable system should be established to fight against
corruption effectively (Martinelli, 2006), and technological devices should be used
(Cerrah et al., 2009). Moreover, by providing external oversight of police officers during
traffic stops, officers are likely to be motivated to use their discretion lawfully and fairly
(Brown & Frank, 2005; Frydl & Skogan, 2004). Another implication of BWCs is that
they can decrease complaints against police officers. For instance, in the U.S., the
majority of complaints against police officers include rudeness, lack of courtesy, or a
failure to provide adequate service (Walker et al., 2002), as well as excessive force, use
of improper procedures, and prejudicial conduct (Proctor et al., 2009). And indeed, a
prior study suggests that BWCs decrease the number of complaints against police officers
(Farrar & Ariel, 2013).
Fourth, BWC recordings may be used as an aid for training and for the early
identification of problem officers. In the U.S., a PERF survey found that 94% of the
respondents reported that they used BWC video footage when training police officers
(Miller et al., 2014). BWCs capture real-life examples of interactions with citizens and
they are thus more objective and useful compared to simulations (Vorndran et al., 2014).
BWCs might also enable police departments to identify police officers who abuse their
authority and correct them (Miller et al., 2014). For instance, in Phoenix, video footage
revealed that one police officer repeatedly abused citizens verbally, used profane
language, and threatened members of the public (Miller et al., 2014). As a result, the

93
officer was fired.
Fifth, BWCs have potential benefits because of their evidentiary value. For
example, BWCs can improve evidence for arrest and prosecution because they capture
the details of incidents (Goodall, 2007; Miller et al., 2014) and encounters between police
and citizens (Ramirez, 2014). The probability of arrest for a crime is nearly five times
higher in the incidents where BWCs are used and video evidence obtained from BWCs
encourage reluctant witnesses of domestic violence (Goodall, 2007). Similarly, BWCs
expedite the resolution of citizen complaints by providing objective and accurate
evidence, and the video evidence enables cases to be resolved at an early stage (Miller et
al., 2014; Vorndran et al., 2014). At the same time, they can be used to protect police
officers from false accusations (Draisin, 2011; Porter & Prenzler, 2012; Roy, 2014) and
to exonerate police officers who are targets of citizen complaints (Miller et al., 2014;
Ramirez, 2014). They can also be helpful in resolving cases quickly through guilty pleas
rather than criminal trials (Goodall 2007), thereby reducing court-related costs (Howland,
2011).
Sixth, BWCs can reduce the amount of time spent by police officers on
paperwork and file preparation (Goodall, 2007; Miller et al., 2014) and in court
(Howland, 2011). This was supported by the findings of both quantitative and qualitative
studies (Goodall, 2007). More specifically, the results from the U.K. studies suggest that
the use of BWCs resulted in a 22% reduction in the time officers devoted to paperwork
and file preparation in incidents compared to the incidents where BWCs were not used
(Goodall, 2007). As a result, the amount of time spent on mobile and foot patrol
increased by 9% (Goodall, 2007).

94
Finally, the use of BWCs may promote police officer safety. Their use can deter
potential offenders from attacking police officers and provide video evidence that may
help convict offenders (Draisin, 2011; NLECTC & United States of America, 2012).
The benefits of “recorded justice” described in the preceding paragraphs do not
come without costs. For one, the implementation of BWCs requires financial investment,
which will typically require some kind of government support. Yet existing evidence
suggests that citizens support the use of BWCs. For example, 64% of surveyed citizens in
Renfrewshire, 76% in Aberdeen (ODS Consulting, 2011), and 72 % in Plymouth
(Goodall, 2007) supported the use of BWCs. The current study also showed that almost
all of the respondents (99.5%) reported that they support the use of BWCs during traffic
stops – just 3 out of 624 respondents opposed them. One of them said, “I do not believe
that BWCs will have impact on police or citizens.” Another stated, “There is no need to
use BWCs. Police should always treat people well. Police should not treat people well
due to the presence of BWCs.” The third respondent said, “BWCs should not be used
because they provide evidence. Sometimes we curse, sometimes police curse. If BWCs
are used, we can’t do that. Because of this, there is no need to use BWCs.” Aside from
these three instances, the findings overwhelmingly suggest that citizens support the use of
BWCs.
The use of BWCs also raises privacy concerns because some people may react to
the recording of the encounter. They may think that BWCs intrude upon their privacy,
thereby violating their privacy rights. Thus, citizens should be notified that the encounter
will be recorded in advance.

95
The study findings are more likely to be applicable in other countries. There are a
couple of reasons for this. First, although theories, including self-awareness and
deterrence theory, were not developed in Turkey, their tenets are applicable in Turkey. In
turn, the results obtained from the study in Turkey may also be applicable in other
countries as well.
Second, the study focused on outcomes that may be considered universal,
including enhanced procedural justice, legitimacy (traffic police and police), compliance
(specific and general), satisfaction, and citizen perception of police. Treating people
politely and respectfully, following the rules, and allowing citizens to express themselves
are generally universally accepted behaviors. Respect, trust, and being confident with
police are the components of legitimacy. If citizens in any country have relationships
with police characterized by respect, trust, and confidence, they are more likely to view
police as legitimate. People in any country are more likely to be satisfied if they are
treated well and, furthermore, they are more likely to comply with police commands
when the encounter is recorded using BWCs, since BWC footage can be used as evidence
against those under observation and BWC increases self-awareness of those who are
watched. Thus, BWCs are more likely to have similar effects across different countries.
Third, police functions and police–citizen encounters are very similar in every
country. They may be considered as universal issues in terms of policing. As a result,
police and citizen behavior in encounters are more or less the same. The only difference
may be some cultural issues and ethnicity and race. The study outcomes are not related to
cultural issues, which may lead to the questioning of the applicability of the results in
other countries.

96
Fourth, empirical studies on the effect of BWCs in the U.K. (Goodall, 2007; ODS
Consulting, 2011) and in the U.S. (Farrar & Ariel, 2013; MPD, 2013; White, 2014) found
that, although the studies were conducted in different countries, BWCs have an impact on
police and citizens. Thus, the results obtained from the study in Turkey are more likely to
be relevant in the U.S. or other countries.
Finally, experimental studies on procedural justice conducted in Australia
(Mazerolle et al., 2013) and in Turkey (Sahin, 2014) found similar results even though
the studies were conducted in totally two different countries and procedurally just
policing was developed in the U.S. (Tyler, 1990). This suggests that although theory was
developed in a different country, its effects are more likely to be similar in other
countries. This also indicates that the results of BWC experimental study in Turkey are
more likely to be relevant in other countries.
5.3 Limitations of the Study and Suggestions for Future Research
The study has limitations. First, this study was conducted during routine traffic
stops, meaning that the results and conclusions may not be generalized to other types of
police–citizen encounters, such as pedestrian stops, crime investigations, and arrests.
However, it is worth emphasizing that traffic encounters are the most frequent and, for
many citizens, only interactions they may have with police.
Second, self-reported data were used. The presence of BWCs may have affected
the responses of the participants in the experimental group because the encounter was
recorded. Thus, the participants might have been overly optimistic in their stated
perceptions about the police. In other words, they may not have responded to the
questions honestly. Unfortunately, the complaint data were too infrequent to validate the

97
survey responses with independent behavioral measures. It is therefore not possible to
completely rule out this limitation.
Third, with respect to the mediation analysis, although the path model was created
based on the empirical findings of the previous studies, the survey in the study does not
allow resolution of temporal order, which is one of the causality criteria. In other words,
there may be other forms of directionality among the variables except for the
intervention.
Fourth, since the collected data is based on the self-report, the perceived effects of
BWCs on police and citizen behavior were measured. Thus, it is difficult to claim that
police and citizen behavior were measured objectively.
Finally, most of the responses to open-ended questions were short, involving one
or two sentences. This did not allow the researcher to conduct more in-depth analysis.
In the future, more empirical research should be conducted to investigate the
effects of BWCs on police and citizens. First, similar studies should be conducted for
different types of police–citizen encounters, including arrests, riots, protests, and
encounters between patrol officers and citizens since patrol officers also have more
frequent contact with citizens. Such studies would provide information about the
generalizability of the findings of the current study. Thus, the evaluation of the use of
BWCs in other types of police–citizen encounters, and as a tool used by other police
units, should be a high priority. Second, the literature claims that BWCs enhance
transparency and police accountability. These should be tested empirically. Third, the
effects of BWCs on crime, such as domestic violence and assaults on police (which
involves a police–citizen encounter) should be investigated empirically. Fourth, more

98
diverse data sources should be built into the evaluation of BWCs. This study
implemented a driver survey and attempted to collect complaint data. Other objective
measures such as complaints about police misdemeanor and citizen resistance should be
used to claim the effect of BWCs on police and citizen behavior. Furthermore, content
analysis of recordings can be conducted to examine the impact of BWCs on police and
citizen behavior. Finally, it would be beneficial to have data capable of directly
measuring the impact of BWCs on citizen cooperation in police–citizen encounters. The
current study measured cooperation indirectly, with general statements such as “I am
willing to assist police if asked,” and “I am willing to work with police to try to solve
problems in my community.”
5.4 Conclusion
Prior studies suggest that being watched has an impact on the behavior of those
who are watched, and this is true for largely trivial behaviors such as financial donations
but also more serious behaviors such as crime. Evidence concerning a different form of
being watched is accumulating and now suggests that they reduce citizen complaints
against police officers, as well as increase transparency and the level of the public trust
toward police. This is attributable, in part, to the enhancement of police legitimacy and
sense of procedural justice policing among citizens.
This study is the first of its kind in the literature, experimentally testing the effect
of BWCs on police and citizen behavior during traffic encounters. The current study
confirmed that BWCs have a positive impact on procedural justice, legitimacy (police
and traffic police), compliance (general and specific), citizen perceptions of police,

99
satisfaction, and cooperation. It is clear that the use of BWCs has the potential to
positively impact the behavior of citizens as well as police.

100
REFERENCES Abdi, H., & Williams, L. J. (2010). Principal component analysis. Wiley Interdisciplinary Reviews: Computational Statistics, 2(4), 433-459 ADSTEA (American Driver and Traffic Safety Education Association) (2014). The traffic stop. Retrieved on October 16, 2014 from http://www.adtsea.org/ADTSEA%20Documents%20Pages/The%20Traffic%20St op .html?ArticleID=7b876663-3cfe-4254-a946-dbc38805d8c6
Adana Emniyet Mudurlugu (2014). Trafik Hizmetlerinde Seffaflik ve Guven Projesi. Retrieved on September 18, 2014 from http://www.adana.pol.tr/Haberler/Sayfalar/TRAFIK-HIZMETLERINDE- SEFFAFLIK-VE-GUVEN-PROJESI-.aspx
Ariel, B., Farrar, W. A., & Sutherland, A. (2014). The Effect of Police Body-Worn Cameras on Use of Force and Citizens’ Complaints Against the Police: A Randomized Controlled Trial. Journal of Quantitative Criminology, 1-27. Bacon-Shone, J., & Fung, W. K. (1987). A new graphical method for detecting single and multiple outliers in univariate and multivariate data. Applied Statistics, 153-162.
Bateson, M., Nettle, D., & Roberts, G. (2006). Cues of being watched enhance cooperation in a real-world setting. Biology letters, 2(3), 412-414.
Bates, L., Soole, D., & Watson, B. (2012). The effectiveness of traffic policing in reducing traffic crashes. In Policing and security in practice: Challenges and achievements, edited by Tim Prenzler, p. 90-109
Bateson, M., Callow, L., Holmes, J. R., Redmond Roche, M. L., & Nettle, D. (2013). Do Images of ‘Watching Eyes’ Induce Behaviour That Is More Pro-Social or More Normative? A Field Experiment on Littering. Plos ONE, 8(12), 1.
Bayley, D.H. (1986). The tactical choices of police patrol officers. journal of Criminal Justice 14:329-48
Bayley, D. H. (1994). Police for the future. New York: Oxford University Press.

101
Beccaria, C. (1963). On crimes and punishments (introduction by H. Paolucci, Trans.). New York: Macmillan. (Original work published 1764)
Bentham, J. (1948). An introduction to the principles of morals and legislation (with an introduction by W. Harrison, Ed.). New York: Macmillan.
Birgden, A., & Julio, M. (2011). Community-Police Complaint Mediation Project: A review Paper.
Bourrat, P., Baumard, N., & McKay, R. (2011). Surveillance Cues Enhance Moral Condemnation. Evolutionary Psychology, 9(2), 193-199.
Burnham, T. C. (2003). Engineering altruism: a theoretical and experimental investigation of anonymity and gift giving. Journal Of Economic Behavior & Organization, 50(1), 133.
Burnham, T., & Hare, B. (2007). Engineering Human Cooperation. Human Nature, 18(2), 88-108.
Buss, A. H. (1980). Self-consciousness and social anxiety. San Francisco: Freeman.
Braga, A. A., Papachristos, A. V., & Hureau, D.M. (2011). The Effects of Hot Spots Policing on Crime: An Updated Systematic Review and Meta-Analysis. Unpublished manuscript. Cambridge, MA: Harvard University. Braga, A. A., & Weisburd, D. L. (2010). Policing Problem Places: Crime Hot Spots and Effective Prevention. USA: Oxford University Press.
Braga, A. A. & Weisburd, D. L. (2012). “The Effects of Focused Deterrence Strategies on Crime: A Systematic Review and Meta-Analysis of the Empirical Evidence.” Journal of Research in Crime and Delinquency, 49: 323 – 358. Braga, A. A., Papachristos, A. V., & Hureau, D. M. (2012). The effects of hot spots policing on crime: An updated systematic review and meta-analysis. Justice Quarterly, (ahead-of- print), 1-31.

102
Braga, A. A. (2013). “Problem-Oriented Policing: Principles, Practice, and Crime Prevention Effects.” In The Oxford Handbook of Police and Policing, edited by Michael D. Reisig and Robert J. Kane. New York: Oxford University Press. Brief, A. P., Dukericii, J. M., & Doran, L. I. (1991). Resolving ethical dilemmas in management: Experimental investigations of values, accountability, and choice. Journal of Applied Social Psychology, 21, 380-396.
Brown, M. K. (1981). Working the street: police discretion and the dilemmas of reform. New York: Russell Sage Foundation.
Brown, R. A., & Frank, J. (2005). Police-citizen encounters and field citations: Do encounter characteristics influence ticketing?. Policing: An International Journal of Police Strategies & Management, 28(3), 435-454.
Calahan, S., & Kersten, K. (2005). The Traffic Stop. The Chronicle, 53(4).
Cao, L., & Burton Jr, V. S. (2006). Spanning the continents: assessing the Turkish public confidence in the police. Policing: An International Journal of Police Strategies & Management, 29(3), 451-463.
Carter, D. L. (1985). Police brutality: A model for definition, perspective, and control. The ambivalent force: perspectives on the police, 3rd ed. CBS College Publishing, New York, 321-330.
Carver, C. S., & Scheier, M. F. (1978). Self-focusing effects of dispositional self- consciousness, mirror presence, and audience presence. Journal of Personality and Social Psychology, 36, 324-332.
Cerrah, I., Çevik, H., Göksu, T., & Balcıoglu, E. (2009). Ethical Conduct in Law Enforcement.
Champion, D. J. (2001). Police misconduct in America: A reference handbook. California: ABC-Clio Inc.
Clark, M. (2013). “On-Body Video: Eye Witness or Big Brother?” Police Magazine, July 8, 2013. Retrieved on September 8, 2014 http://www.policemag.com/channel/technology/articles/2013/07/on-body-video- eye-witness-or-big-brother.aspx

103
Cohen, J. (1988). Statistical power analysis for the behavioral sciences (2nd ed.). Hillsdale, NJ: Lawrence Earlbaum Associates. Comrey, A. L., & Lee, H. B. (1992). A first course in factor analysis (2nd. ed.). Hillsdale, NJ: Erlbaum. Coppola, M. (2010). Officer-Worn Cameras Expand Point of View. TechBeat Dated, 6.
Cornish, D. B., & Clarke, R. V. (2003). Opportunities, precipitators and criminal decisions: A reply to Wortley's critique of situational crime prevention. Crime prevention studies, 16, 41-96. Cortina, J. M. (1993). What is coefficient alpha? An examination of theory and applications. Journal of Applied Psychology, 78, 98–104. Cullen, F. T., Agnew, R., & Wilcox, P. (2014). Criminological theory. Past to present. Oxford University Press. (5th Edition). Dawes, R. M., McTavish, J., & Shaklee, H. (1977). Behavior, communication, and assumptions about other people's behavior in a commons dilemma situation. Journal of Personality and Social Psychology, 35(1), 1
Dolan P, Hallsworth M, Halpern D, King D, Metcalfe R, et al. (2012). Influencing behaviour: The mindspace way. Journal of Economic Psychology 33: 264– 277.
Dönmezer, S. (2011). Trafikte Polis-Halk İlişkileri. İstanbul Üniversitesi Hukuk Fakültesi Mecmuası, 45(1-4), 571-583.
Dugan, J.R. and Breda, D.R. (1991), “Complaints about police officers: a comparison among agency types and agencies”, Journal of Criminal Justice, Vol. 19 No. 1, pp. 165-71.
Duval, T. S., & Wicklund, R. A. (1972). A theory of objective self-awareness. New York: Academic.

104
Duval, T. S. (1976). Conformity on a visual task as a function of personal novelty on attitudinal dimensions and being reminded of object status of self. Journal of Experimental Social Psychology, 12,87-98.
Duval, T. S., & Lalwani, N. (1999). Objective self-awareness and causal attributions for self-standard discrepancies: Changing self or changing standards of correctness. Personality and Social Psychology Bulletin, 25, 1220-1229.
Douthit, N. (1975). "August Vollmer: Berkeley's First Chief of Police and the Emergence of Police Professionalism," California Historical Quarterly 54 Spring: 101- 124.
Draisin, L. (2011). Police Technology an Analysis of in Car Cameras and Body Worn Cameras. Retrieved on 19 August, 2014 from http://www.scribd.com/doc/133946815/Police-Technology-an-Analysis-of- in-Car- Cameras-and-Body-Worn-Cameras-Lillian-Draisin- Spring-2011
Eith, C., & Durose, M. R. (October 2011). Contacts between police and the public, 2008. Washington, DC: Department of Justice, Office of Justice Programs, Bureau of Justice Statistics. Retrieved on January 5, 2015 from http://www.bjs.gov/content/pub/pdf/cpp08.pdf
Engel, R. S. (2005). Citizens' perceptions of distributive and procedural injustice during traffic stops with police. Journal of Research in Crime and Delinquency, 42(4), 445-481.
Ernest-Jones, M., Nettle, D. & Bateson, M. (2011). Effects of eye images on everyday cooperative behavior: a field experiment. Evol. Hum. Behav. 32, 172—178.
Eskisehir Emniyet Mudurlugu (2014). Bolge Trafik Denetleme Sube Mudurlugu. Retrieved on August 11, 2014 from http://www.eskisehir.pol.tr/Sayfalar/bolgetrafik.aspx
Fangman, J. L. (2013). Stop the" Stop and Frisk?" How Floyd v. City of New York Will Limit the Power of Law Enforcement Across the Nation. Public Interest Law Reporter, 19(1), 50.
Farrar, W. & Ariel, B. (2013). Self-awareness to being watched and socially desirable behavior: A field experiment on the effect of body-worn cameras and police use of force. Washington, DC: Police Foundation.

105
F.B.I. Department of Justice. (2000) Policy or pattern. [On-line]. Available: http://www.fbi.gov/programs/civilrights/statutes.html. (11/28/2000).
Field, A. (2009). Discovering statistics using SPSS. Sage publications.
Floyd v. City of New York. 2013. 08 Civ. 1034 (SAS). Case 1:08-cv-01034-SAS-HBP. Retrieved on September 24, 2014 from http://www.justice.gov/crt/about/spl/documents/floyd_soi_6-12-13.pdf
Fox, J. (1991). Regression diagnostics. Newbury Park, CA: Sage.
Francey D, Bergmu ̈ller R. (2012). Images of Eyes Enhance Investments in a Real-Life Public Good. PLoS ONE 7(5): e37397.
Frydl, K., & Skogan, W. (Eds.). (2004). Fairness and Effectiveness in Policing: The Evidence. National Academies Press.
Fyfe, J.J. (1986). The Split Second Syndrome and Other Determinants of Police Violence. pp. 207-23 in Violent Transactions, edited by A. Campbell and J.J. Gibbs.Oxford, England: Basil Blackwell.
Gau, J. M. & Brunson, R.K. (2009). Procedural justice and order maintenance policing: A study of inner-city young men’s perceptions of police legitimacy. Justice Quarterly, 27: 255-279. Gau, J. M. (2011). The convergent and discriminant validity of procedural justice and police legitimacy: An empirical test of core theoretical propositions. Journal of Criminal Justice, 39(6), 489-498.
Gervais, W. M., & Norenzayan, A. (2012). Like a camera in the sky? Thinking about God increases public self-awareness and socially desirable responding. Journal of Experimental Social Psychology, 48(1), 298-302.
Greenfeld, L. A., Smith, S. K., Durose, M. R., & Levin, D. J. (2001). Contacts between police and the public: Findings from the 1999 national survey (pp. 5-6). Washington, DC: US Department of Justice, Bureau of Justice Statistics.

106
Goldstein, H. (1977). Policing a free society (p. 259). Cambridge, MA: Ballinger Publishing Company.
Goldstein, J. (2013). Judge rejects New York’s stop-and-frisk policy. New York Times. Retrieved on January 8, 2015 from http://www.nytimes.com/2013/08/13/nyregion/stop-and- frisk-practice- violated-rights-judge-rules.html?emc=edit_na_20130812&_r=2 Goodall, M. (2007). Guidance for the Police Use of Body-Worn Video Devices. London: Home Office. http://revealmedia.com/wp-content/uploads/2013/09/guidance- body-worn-devices.pdf.
Goodman-Delahunty, J. (2010). Four ingredients: new recipes for procedural justice in Australian policing. Policing, 4(4), 403-410.
Gottfredson, M. R., & Gottfredson, D. M. (1988). Decision making in criminal justice (Vol. 3). Springer.
Haberfeld, M.R. (2004). The Heritage of Police Misconduct. In The Contours Of Police Integrity, by Carl B. Klockars, Sanja Kutnjak Ivkovic, M. R. Haberfeld (Eds.). p.195- 211
Hair, J. F., Black, W.C., Babin, B.J., Anderson, R. E. (2009). Multivariate Data Analysis: A Global Perspective (7th ed). Upper Saddle River: Prentice Hall. Print. Harris, D. A. (2010). Picture This: Body Worn Video Devices ('Head Cams') as Tools for Ensuring Fourth Amendment Compliance by Police. Texas Tech Law Review, Forthcoming.
Harris, C. (2014). The onset of police misconduct. Policing: An International Journal of Police Strategies & Management, 37(2), 285-304.
Haley, K. J., & Fessler, D. M. (2005). Nobody's watching?: Subtle cues affect generosity in an anonymous economic game. Evolution and Human behavior, 26(3), 245-256.

107
Hinds, L., & Murphy, K. (2007). Public satisfaction with police: using procedural justice to improve police legitimacy. Australian & New Zealand Journal of Criminology, 40(1), 27-42.
Hobbes, T. (1968). 1651. Leviathan. Classics of moral and political theory, ed. M. Morgan, 581- 735. Retrieved on November 1, 2014 from http://oregonstate.edu/instruct/phl302/texts/hobbes/leviathan-contents.html
Hoffman, E., McCabe, K., Shachat, K., & Smith, V. (1994). Preferences, property rights, and anonymity in bargaining games. Games and Economic Behavior, 7(3), 346-380.
Holgado–Tello, F. P., Chacón–Moscoso, S., Barbero–García, I., & Vila–Abad, E. (2010). Polychoric versus Pearson correlations in exploratory and confirmatory factor analysis of ordinal variables. Quality & Quantity, 44(1), 153-166. Hoover, L.T., Dowling, J.L. & Fenske, J.W. (1998). “Extent of citizen contact with the police”. Police Quarterly, Vol. 1 No. 3, pp. 1-18.
Howland, L. (2010, May 11). Two Urban Police Departments Test Officer-Mounted Mini-Cams. Publicceo.com. Retrieved on November 6, 2014 from http://www.publicceo.com/2010/05/two-urban-police-departments-test-officer- mounted-mini-cams/
Hudson, J.R. (1970), “Police-citizen encounters that lead to citizen complaints”, Social Problems, Vol. 18 No. 2, pp. 179-95.
IACP (International Association of Chiefs of Police). (2004). The Impact of Video Evidence on Modern Policing: Research and Best Practices from the IACP Study on In-Car Cameras. Alexandria, VA: International Association of Chiefs of Police.
IDRE (2015a). Chapter 2 - Regression Diagnostics. Retrieved on April 1, 2015 from http://www.ats.ucla.edu/stat/stata/webbooks/reg/chapter2/statareg2.htm IDRE (2015b). Chapter 4 - Beyond OLS. Retrieved on April 7, 2015 from http://www.ats.ucla.edu/stat/stata/webbooks/reg/chapter4/statareg4.htm

108
IDRE (2015c). Robust Regression. Retrieved on May 2, 2015 from http://www.ats.ucla.edu/stat/stata/dae/rreg.htm Ivkovic, S. K. (2005). Police (mis) behavior: a cross-cultural study of corruption seriousness. Policing: An International Journal of Police Strategies & Management, 28(3), 546-566. Johnson, R. R. (2004). Citizen expectations of police traffic stop behavior. Policing: An International Journal of Police Strategies & Management, 27(4), 487-497.
Justin, T. R. & Jacob, T.N. Y. (2014, September 2). Three Myths About Police Body Cams. Retrieved on November 6, 2014 from http://www.slate.com/articles/technology/future_tense/2014/09/fergusonbody_ cams_myths_about_police_body_worn_recorders.html. Kaiser, H. F. (1960). The application of electronic computers to factor analysis. Educational and psychological measurement. Kappeler, V. E., Sluder, R. D., & Alpert, G. P. (1998). Forces of deviance: Understanding the dark side of policing. Waveland Press.
Koper, C. S., Lum, C., & Willis, J. J. (2014). Optimizing the Use of Technology in Policing: Results and Implications from a Multi-Site Study of the Social, Organizational, and Behavioural Aspects of Implementing Police Technologies. Policing, pau015.
Kopstein, J. (August 2014). Police Cameras are No Cure-all After Ferguson. Retrieved on October 22, 2014 from http://america.aljazeera.com/opinions/2014/8/ferguson-race- policesurveillancetechnology.html.
Lachman, P., La Vigne, N. & Matthews, A. (2012). “Examining Law Enforcement Use of Pedestrian Stops and Searches”. In La Vigne, N., Lachman, P., Matthews, A., and Neusteter, S.R. (Eds.). Key Issues in the Police Use of Pedestrian Stops and Searches. Washington, DC: Justice Policy Center, Urban Institute, pp. 1-12.

109
Lane, R. (1980). "Urban Police and Crime in the Nineteenth-Century America," in Michael Tonry and Norval Morris, eds., Crime and Justice: An Annual Review of Research, Volume 2. Chicago: University of Chicago Press.
Lanier, M.M. & Briggs, L.T. (2014). Research Methods in Criminal Justice and Criminology. Oxford University Press. Lersch, K. M. (1998). Police misconduct and malpractice: a critical analysis of citizens’ complaints. Policing: An International Journal of Police Strategies & Management, 21(1), 80-96.
Lersch, K.M. and Mieczkowski, T. (2000). “An examination of the convergence and divergence of internal and external allegations of misconduct filed against police officers.” Policing, Vol. 23, pp. 54–68.
Lersch, K.M. (2002), “Are citizen complaints just another measure of officer productivity? An analysis of citizen complaints and officer activity measures”, Police Practice and Research, Vol. 3 No. 2, pp. 135-147.
Levi, M., Sacks, A., & Tyler, T. (2009). Conceptualizing legitimacy, measuring legitimating beliefs. American Behavioral Scientist, 53(3), 354-375. Lichtenberg, I. D., & Smith, A. (2001). How dangerous are routine police–citizen traffic stops?: A research note. Journal of Criminal Justice, 29(5), 419-428.
Lichtenberg, I. (2002). Police discretion and traffic enforcement: A government of men. Clev. St. L. Rev., 50, 425.
Lofca, I. (2002). A Case Study on Police Misconduct in the United States of America and an Applicable Model for the Turkish National Police (Doctoral dissertation, University of North Texas).
Lovett, I. (August 13). In California, a champion for police cameras. New York Times. Available at: http://www.nytimes.com/2013/08/22/us/in-california-a- champion- for-police- cameras.html?pagewanted=all&_r=0.
Maguire, E.R. & Mastrosfki, S.D. (2000). Patterns of Community Policing in the United States. Police Quarterly, 3 (1), 4-45.

110
Martinelli, T. J. (2006). Unconstitutional policing: The ethical challenges in dealing with noble cause corruption. Police Chief, 73(10), 148.
Mastrofski, S. D., Snipes, J. B., & Supina, A. E. (1996). Compliance on demand: The public's response to specific police requests. Journal of research in Crime and delinquency, 33(3), 269-305.
Mastrofski, S. D., Reisig, M. D., & McCluskey, J. D. (2002). Police Disrespect Toward The Public: An Encounter‐Based Analysis. Criminology, 40(3), 519- 552. Mazerolle, L., Antrobus, E., Bennett, S., & Tyler, T. R. (2013). Shaping citizen perceptions of police legitimacy: A randomized field trial of procedural justice. Criminology, 51(1), 33-63.
Mazerolle, L., Bennett, S., Davis, J., Sargeant, E., & Manning, M. (2013). Legitimacy in policing: a systematic review. Campbell systematic reviews, 9(1). McCarthy, G. (2012). Using Stop and Search Powers Responsibly: The Law Enforcement Executive’s Perspective. In La Vigne, N., Lachman, P., Matthews, A., and Neusteter, S.R. (Eds.). Key Issues in the Police Use of Pedestrian Stops and Searches. Washington, DC: Justice Policy Center, Urban Institute, pp. 37-44. McCluskey, J. D., Mastrofski, S. D., & Parks, R. B. (1999). To acquiesce or rebel: Predicting citizen compliance with police requests. Police Quarterly, 2(4), 389- 416.
Miller, L., Toliver, J. & Police Executive Research Forum (PERF). (2014). Implementing a Body-Worn Camera Program: Recommendations and Lessons Learned. Washington, DC: Office of Community Oriented Policing Services. Retrieved on October 12, 2014 from http://www.policeforum.org/assets/docs/Free_Online_Documents/Technology/im plementing%20a%20body-worn%20camera%20program.pdf
Moore, M. H., & Braga, A. (2003). The “Bottom Line” of policing: What citizens should value (and measure!) in police performance. In Washington, DC: Police Executive Research Forum http://www.policeforum. org/library/policeevaluation/BottomLineofPolicing. pdf.

111
MPD (Mesa Police Department). (2013). On-Officer Body Camera System: Program Evaluation and Recommendations. Mesa, AZ: Mesa Police Department.
Murphy, K., Hinds, L., & Fleming, J. (2008). Encouraging public cooperation and support for police. Policing & Society, 18(2), 136-155. Nagin, D. (2012). Deterrence. Scaring Offenders Straight. In Francis T. Cullen, and Cheryl Lero Jonson (Eds.). Correctional Theory: Context and Consequences. SAGE publications. Nagin, D. S. (2013). Deterrence: A Review of the Evidence by a Criminologist for Economists. Annu. Rev. Econ., 5(1), 83-105. NLECTC (National Law Enforcement and Corrections Technology Center), & United States of America. (2012). Primer on Body-Worn Cameras for Law Enforcement.
Nettle, D., Nott, K., & Bateson, M. (2012). ‘Cycle Thieves, We Are Watching You’: Impact of a Simple Signage Intervention against Bicycle Theft. PloS one, 7(12), e51738.
Newburn, T., & Hayman, S. (2012). Policing, Surveillance Social Control. Routledge.
Nichols, L. J., International Assoc of Chiefs of Police, & United States of America. (2001). Use of CCTV/Video Cameras in Law Enforcement, Executive Brief. Alexandria, VA: International Association of Chiefs of Police.
Norris, C., McCahill, M., & Wood, D. (2004). Editorial. The Growth of CCTV: a global perspective on the international diffusion of video surveillance in publicly accessible space. Surveillance & Society, 2.
Novak, K. J., Frank, J., Smith, B. W., & Engel, R. S. (2002). Revisiting the decision to arrest: comparing beat and community officers. Crime & Delinquency, 48(1), 70- 98. ODMP (Officer Down Memorial Page). (2014). Retrieved on September 21, 2014 from http://www.odmp.org/search?name=&agency=&state=&from=2004&to=2013&c ause=Vehicular+assault&filter=nok9

112
ODS Consulting. (2011). Body Worn Video Projects in Paisley and Aberdeen, Self Evaluation. Glasgow: ODS Consulting.
OECD. (1997). Road safety principles and models: Review of descriptive, predictive, risk and accident consequence models. Paris: Organization for Economic Co- operation and Development. Paoline III, E. A., & Terrill, W. (2005). The impact of police culture on traffic stop searches: an analysis of attitudes and behavior. Policing: An International Journal of Police Strategies & Management, 28(3), 455-472. Papachristos, A. V., Meares, T. & Fagan, J. (2007). “Attention Felons: Evaluating Project Safe Neighborhoods in Chicago.” Journal of Empirical Legal Studies, 4: 223 – 272. Paternoster, R., Brame, R., Bachman, R., & Sherman, L. W. (1997). Do fair procedures matter? The effect of procedural justice on spouse assault. Law and Society Review, 163-204.
Peden, M., Scurfield, R., Sleet, D., Mohan, D., Hyder, A. A., Jarawan, E., et al. (2004). World report on road traffic injury prevention. Geneva: World Health Organization. PERF (2012). How are Innovations in Technology Transforming Policing. Retrieved on October 18, 2014 from http://www.policeforum.org/assets/docs/Critical_Issues_Series/how%20are%20in novations%20in%20technology%20transforming%20policing%202012.pdf
Porter, L., & Prenzler, T. (2012). Corruption Prevention and Complaint Management. Policing and Security in Practice: Challenges and Achievements, 130.
Powell, K. L., Roberts, G., Nettle, D., & Fusani, L. L. (2012). Eye Images Increase Charitable Donations: Evidence From an Opportunistic Field Experiment in a Supermarket. Ethology, 118(11), 1096-1101.
Prenzler, T. (2006). Senior police managers' views on integrity testing, and drug and alcohol testing. Policing: An International Journal of Police Strategies & Management, 29(3), 394-407.

113
Proctor, J. L., Rosenthal, R., Monitor, I., & Clemmons, A. J. (2009). Denver’s Citizen/Police Complaint Mediation Program: A Comprehensive Evaluation.
Ramirez, E. P. (April, 2014). A Report on body worn cameras. Retrieved on August 19, 2014 from http://www.parsac.org/parsac-www/pdf/Bulletins/14- 005_Report_BODY_WORN_CAMERAS.pdf
Ready, J.T. & Young, T.N. (September 2014). Three myths about police Body Cams. Retrieved on October 22, 2014 from http://www.slate.com/articles/technology/future_tense/2014/09/ferguson_body_ca ms_my ths_about_police_body_worn_recorders.html Reaves, B.A. (2010). Local Police Departments 2007. U.S. Department of Justice:BJC Statistician. Retrieved on January 8, 2015 from http://www.bjs.gov/content/pub/pdf/lpd07.pdf
Reisig, M. D., Tankebe, J., & Meško, G. (2012). Procedural Justice, Police Legitimacy, and Public Cooperation with the Police Among Young Slovene Adults. Varstvoslovje: Journal Of Criminal Justice & Security, 14(2), 147. Reiss, A. J. (1968). Police brutality-answers to key questions. Society, 5(8), 10-19.
Reiss, A.J. (1971). The Police and the Public, Yale University Press, New Haven, CT.
Remler, D. K., & Van Ryzin, G. G. (2014). Research methods in practice: Strategies for description and causation. Sage Publications. Ridgeway, G. (2007). Analysis of Racial Disparities in the New York Police Department’s Stop, Question, and Frisk Practices. Santa Monica, CA: RAND Corporation. Rieken, J. (2013). Making situated police practice visible: a study examining professional activity for the maintenance of social control with video data from the field (Doctoral dissertation, London School of Economics and Political Science (University of London)).

114
Roberg, R., Novak, K., Cordner, G., & Smith, B. (2015). Police & Society (6th ed.). New York: Oxford University Press.
Roman, J. K., Reid, S., Reid, J., Chalfin, A., Adams, W., & Knight, C. (2008). DNA Field Experiment: Cost-Effectiveness Analysis of the Use of DNA in the Investigation of High- Volume Crimes. Washington, DC: The Urban Institute. (NCJ 244318)
Roy, A. (2014). On-‐Officer Video Cameras: Examining the Effects of Police Department Policy and Assignment on Camera Use and Activation (Doctoral dissertation, ARIZONA STATE UNIVERSITY).
Sahin, N. M. (2010). Reducing Police Corruption: The Use of Technology to Reduce Police Corruption. John Jay College of Criminal Justice, New York City, NY. Sahin, N. M. (2014). Legitimacy, procedural justice, and police-citizen encounters: a randomized controlled trial of the impact of procedural justice on citizen perceptions of the police during traffic stops in Turkey (Doctoral dissertation, Rutgers University- Graduate School-Newark).
Sargeant, E., Murphy, K., Davis, J., & Mazerolle, L. (2012). Legitimacy and Policing. Policing and Security in Practice: Challenges and Achievements, 20.
Scheier, M. F., & Carver, C. S. (l983). Private and public aspects of the self. In L. Wheeler (Ed.), Review of personality and social psychology (Vol. 2, pp. 189-216). Beverly Hills, CA: Sage.
Schultz, P. D. (2008). The future is here: Technology in police departments. POLICE CHIEF, 75(6), 20. Scott Long, J. (1997). Regression models for categorical and limited dependent variables. Advanced quantitative techniques in the social sciences, 7. Shadish, W. R., Cook, T.D. & Campbell, D. T. (2002) Experimental and Quasi- Experimental Designs for Generalized Causal Inference. Houghton Mifflin Company, Boston New York

115
Sherman, L. W. (1997). Policing for prevention. In Preventing crime: What works, what doesn’t, what’s promising—A report to the attorney general of the United States, edited by Lawrence W. Sherman, Denise Gottfredson, Doris MacKenzie, John Eck, Peter Reuter, and Shawn Bushway. Washington, DC: United States Department of Justice, Office of Justice Programs.
Sherman, L. W. (2013). The rise of evidence-based policing: Targeting, testing, and tracking. Crime and justice, 42(1), 377-451.
Silvia, P. J., & Duval, T. S. (2001). Objective self-awareness theory: Recent progress and enduring problems. Personality and Social Psychology Review, 5, 230-241.
Skogan, W. G., & Frydl, K. (Eds.). (2004). Fairness and Effectiveness in Policing: The Evidence. Washington, D.C.: The National Academies Press.
Spector, P. E. (1992). Summated Rating Scale Construction: An Introduction Sage. Newbury Park, CA. Sousa, W., Ready, J., & Ault, M. (2010). The impact of TASERs on police use-of-force decisions: Findings from a randomized field-training experiment. Journal of experimental criminology, 6(1), 35-55. Sunshine, J., & Tyler, T.R. (2003). The role of procedural justice and legitimacy in shaping public support for policing. Law and Society Review, 37: 513-547. Tabachnick, B. G., & Fidell, L. S. (2013). Using multivariate statistics (6th Edition). Pearson Education. Tetlock, P. E. (1983). Accountability and complexity of thought. Journal of Personality and Social Psychology, 45, 74-83.
Thaler RH, Sunstein CR (2008). Nudge: Improving Decisions about Health, Wealth and Happiness. New Haven, CT: Yale University Press.
The White House. (December 01, 2014). Fact Sheet: Strengthening Community Policing. Retrieved on January 7, 2015 from http://www.whitehouse.gov/the-press- office/2014/12/01/fact-sheet- strengthening-community-policing

116
Trafik Hizmetleri Baskanligi (2014). Denetleme Faaliyetleri. Retrieved on August 25, 2014 from http://www.trafik.gov.tr/Sayfalar/Istatistikler/denetim1.aspx Trafik Hizmetleri Baskanligi (2014). Uygulanan Trafik Cezalari. Retrieved on August 25, 2014 fromhttp://www.trafik.gov.tr/Sayfalar/Istatistikler/denetim1.aspx Trafik Hizmetleri Baskanligi (2014). Genel Kaza Istatistikleri. Retrieved on August 25, 2014 from http://www.trafik.gov.tr/Sayfalar/Istatistikler/Genel-Kaza.aspx Trafik Hizmetleri Baskanligi (2014). Surucu Sayilarinin Illere gore Dagilimi. Retrieved on August 25, 2014 from http://www.trafik.gov.tr/Sayfalar/Istatistikler/aracSurucu1.aspx Trochim, W. M., & Donnelly, J. P. (2006). The Research Methods Knowledge Base, 3rd Edition. Atomic Dog Pub. Trochim, W. M., & Donnelly, J. P. (2008). The research methods knowledge base. Atomic Dog Publishing. TUIK (2014). Motorlu Kara Taşıtları. Retrieved on August 25, 2014 from http://www.tuik.gov.tr/PreHaberBultenleri.do?id=15894 TUIK (2014). Haber Bulteni. Retrieved on September 16, 2014 from http://www.tuik.gov.tr/PreHaberBultenleri.do?id=15974 TURKSAT (2014). Population Statistics. Retrieved on November 4, 2014 from http://www.turkstat.gov.tr/UstMenu.do?metod=temelist Tyler, T. R. (1990). Why people obey the law. New Haven, CT: Yale University Press. Tyler, T. R., & Degoey, P. (1996). Trust in organizational authorities. Trust in organizations: Frontiers of theory and research, 331-56. Tyler, T.R., Boeckmann, R.J., Smith, H.J. and Huo, Y.J. (1997), Social Justice in a Diverse Society, Westview Press, Boulder, CO.

117
Tyler, T. R., & Darley, J. M. (1999). Building a law-abiding society: Taking public views about morality and the legitimacy of legal authorities into account when formulating substantive law. Hofstra L. Rev., 28, 707.
Tyler, T.R. (2001), “Public trust and confidence in legal authorities: what do majority and minority group members want from the law and legal institutions?”, Behavioral Sciences and the Law, Vol. 19 No. 2, pp. 215-35.
Tyler, T. R. & Huo, Y.J. (2002). Trust in the Law: Encouraging Public Cooperation with the Police and Courts. New York: Russell Sage Foundation. Tyler, T. R. (2004). ‘‘Enhancing Police Legitimacy.’’ Annals of the American Academy of Political and Social Science, 593:84-99. Tyler, T. R. (2006). Why People Obey the Law: Procedural Justice, Legitimacy, and Compliance. New Haven, CT: Yale University Press. Tyler, T. R., Sherman, L., Strang, H., Barnes, G. C., & Woods, D. (2007). Reintegrative Shaming, Procedural Justice, and Recidivism: The Engagement of Offenders' Psychological Mechanisms in the Canberra RISE Drinking‐ and‐Driving Experiment. Law & Society Review, 41(3), 553-586.
Tyler, T. R. (2007). Procedural justice and the courts. Court Review, 44, 26-164. Tyler, T.R. & Fagan, J. (2008). Legitimacy and Cooperation: Why Do People Help the Police Fight Crime in Their Communities? Ohio State Journal of Criminal Law, 6:231:231-275. Tyler, T.R. & Fagan, J. (2012). The Impact of Stop and Frisk Policies upon Police Legitimacy. In La Vigne, N., Lachman, P., Matthews, A., and Neusteter, S.R. (Eds.). Key Issues in the Police Use of Pedestrian Stops and Searches. Washington, DC: Justice Policy Center, Urban Institute, pp. 30-37 Uchida, C. D. (2004). The development of the American police: An historical overview. Critical issues in policing, 20-40.
Von Hirsch, A., Bottoms, A. E., Burney, E., & Wikstrom, P. O. (1999). Criminal deterrence and sentence severity: An analysis of recent research. Hart.

118
Vorndran, K., Burke, P.A., Chavez, I.M., Fraser, K.M., & Moore, M.A. (2014). Enhancing Police Accountability Through An Effective On-Body Camera Program for MPD Officers. Retrieved on September 6, 2014 from http://policecomplaints.dc.gov/node/828122
Wagner, A. E., & Decker, S. H. (1993). Evaluating citizen complaints against the police. Critical issues in policing: Contemporary readings, 2, 275-291.
Wagner, A.E., and Decker, S.H. (1997). “Evaluating Citizen Complaints against the Police.” In R.G. Dunham and G.P. Alpert (eds.), Critical Issues in Policing: Contemporary Readings, 3rd ed. Prospect Heights, IL: Waveland Press, 302-318.
Wain, N., & Ariel, B. (2014). Tracking of Police Patrol. Policing, pau017.
Walker, S., Archbold, C., & Herbst, L. (2002). Mediating citizen complaints against police officers: A guide for police and community leaders (p. 30). Washington, DC: US Department of Justice, Office of Community Oriented Policing Services.
Walker, S. & Bumphus, V. (1992) "The effectiveness of civilian review: observations on recent trends and new issues regarding the civilian review of the police", American Journal of Police,Vol. 11, pp. 1-26.
Walker, S., & Katz, C. M. (2012). Police in America. McGraw-Hill. Waters, E. (September 2014). Transparency in Law Enforcement: The Trend Towards Officer Body Cameras. Retrieved on October 22, 2014 from http://jolt.richmond.edu/index.php/transparency-in-law-enforcement-the-trend- towards-officer-body-cameras/ Weber, M. (1978). Basic sociological terms. Economy and society. G. Roth and C. Wittich. Berkeley, University of California Press. 3-62. Weisburd, D., Mastrofski, S. D., McNally, A., Greenspan, R., & Willis, J. J. (2003). Reforming To Preserve: Compstat And Strategic Problem Solving In American Policing. Criminology & Public Policy, 2(3), 421-456.
Weisburd, D., & Braga, A. A. (Eds.). (2006). Police Innovation: Contrasting Perspectives. Cambridge University Press.

119
Welsh, B. C., & Farrington, D. P. (2009). Public Area CCTV and Crime Prevention: An Updated Systematic Review and Meta-Analysis. JQ: Justice Quarterly, 26(4), 716-745.
Westphal, L. J. (2004, August). The in-car camera: value and impact. The Police Chief, vol 71, no 8. Retrieved on February 2, 2011 from: http://www.policechiefmagazine.org/magazine/index
White, M. (2013). Personal interview with Commander Michael Kurtenbach of the Phoenix (Arizona) Police Department and Professor Charles Katz of Arizona State University about the Phoenix body-worn camera project. September 5, 2013. White, M. D. (2014). Police Officer Body-Worn Cameras: Assessing the Evidence. Washington, DC: Office of Community Oriented Policing Services.
Wilson, C., Willis, C., Hendrikz, J. K., Le Brocque, R., & Bellamy, N. (2010). Speed cameras for the prevention of road traffic injuries and deaths. Cochrane Database of Systematic Reviews, 11(10 Article CD004607).
Wilson, D., Weisburd, D., & McClure, D. (2011). Use of DNA Testing in Police Investigative Work for Increasing Offender Identification, Arrest, Conviction, and Case Clearance: A Systematic Review. Campbell Systematic Reviews, 7(7).
Wicklund, R. A., & Duval, S. (1971). Opinion change and performance facilitation as a result of objective self-awareness. Journal of Experimental Social Psychology, 7, 319–342.
Wicklund, R. A. (1979). The influence of self-awareness on human behavior: The person who becomes self-aware is more likely to act consistently, be faithful to societal norms, and give accurate reports about himself. American Scientist, 187-193.
Worden, R. E. (1989). Situational and attitudinal explanations of police behavior: A theoretical reappraisal and empirical assessment. Law and Society Review, 667- 711.
Woodhull, A. V. (July 1994) Effective police communication in traffic stops. The Police Journal, 237-242.

120
Woodhull, A. V. (1998). Traffic stops and the emotional driver. Police J., 71, 375.
Zaal, D. (1994). Traffic law enforcement: A review of the literature (Report No. 53). Melbourne: MUARC

121
APPENDIX A: Survey on the Effect of Body Worn Camera (BWC) on Police and Citizen Dear respondent, The following survey has been designed to measure the effectiveness of body
worn camera (BWC) on behaviors of traffic police officers. Therefore, your answers to
the questions will help us to understand how effective BWC is during the traffic stops.
(This phrase will be stated in just experimental group). Thus, I cordially encourage you to
participate in the survey. I want you to make sure that the survey is anonymous,
confidential, and voluntary based. The results of the survey will be used for just academic
work. Thanks for your participation in advance.
SOCIO-DEMOGRAPHICS
1. What is your gender? a) Male b) Female
2. What is your current marital status?
a) Never married b) Married c) Separated d) Divorced e) Widowed
3. What is your current employment status?
a) Employed b) Unemployed c) Other (Specify) ……………………………………..
IF YES, PROCEED TO THE FOLLOWING QUESTION. IF NO, SKIP THE FOLLOWING QUESTION
4. What is your occupation?
a) Teacher b) Private security officer c) Medical doctor d) Nurse e) Engineer

122
f) Worker g) Faculty member h) Public servant i) Police j) Soldier k) Merchant l) Vendor m) Student n) Driver o) Other (Specify)……………………………………..
5. How much is your monthly individual income (Turkish currency)?
a) 0-750 b) 751-1500 c) 1551-2250 d) 2251-3000 e) 3001-3750 f) 3751-4500 g) 4551-5250 h) 5251-6000 i) 6001-6750 j) 6751-7500 k) 7551 and above
6. What is your highest level of education completed?
a) Literate b) Elementary school (1st -5th grade) c) Middle School (6th -8th grade) d) Primary School (1st -8th grade) e) High School (9th-12th grade) f) Higher school (2 years after high school) g) College degree (BA, BS) (4 years after high school) h) Graduate degree (MA, MS) i) Professional Degree (Ph.D., J.D., M.D) j) Other (specify) ……………………………………..
7. What is your DOB? ________
8. In which province were you born? …………………………………….. 9. Where do you reside?
a) City center of province b) District c) Town d) Village

123
INTERACTION WITH POLICE
10. Do you have any member of your relatives or close friends work/worked in the police service? a) No b) Spouse, son, daughter, father, mother c) Close relative (uncle, aunt) d) Close friend
11. Other than traffic police officer, did you have any contact with police before?
a) Yes b) No
IF YES, PROCEED TO THE FOLLOWING QUESTION. IF NO, SKIP THE FOLLOWING QUESTIONS 12 AND 13.
12. Other than traffic police officer, how many times did you make contact with
police in the last 12 months?
…………………………………………………….
13. What were the most common three reasons for your contact with police in the last 12 months? a) Witness b) Victim c) Suspect d) Administrative issues (passport, gun certificate, driver’s license etc) e) Other (specify)…………………………………………………….
BACKGROUND AS A DRIVER
14. How long have you been driving a vehicle?
…………………months …………………years 15. Have you ever been stopped by any traffic police officer in the last 12 months?
a) Yes b) No
IF YES, PROCEED TO THE FOLLOWING QUESTION. IF NO, SKIP THE FOLLOWING QUESTION
16. How many times have you been stopped by traffic police officer in the past 12
months? ……………………………………..

124
17. Have you ever been ticketed by traffic police officer in the past 12 months? a) Yes b) No
IF YES, PROCEED TO THE FOLLOWING QUESTION. IF NO, SKIP THE FOLLOWING QUESTION 18. How many times have you been ticketed by traffic police officer in the last 12
months? …………………………………….. 19. What were the reasons for being ticketed by traffic police officer in the last 12
months? a) Speed limit violation b) Safety belt c) Documents d) Lights e) Problems or defect with the car f) Other…………….
PROCEDURAL JUSTICE PRINCIPLES Please indicate how much you agree or disagree with the following statements.
Respect 20. Overall, the police officer was polite and treated me with respect during the
interaction. a) Strongly agree b) Agree c) Neutral d) Disagree e) Strongly disagree
Neutrality/fairness
21. The police officer was fair when making the decision to stop me. a) Strongly agree b) Agree c) Neutral d) Disagree e) Strongly disagree
22. Overall, what police did was based on the rules.
a) Strongly agree b) Agree c) Neutral d) Disagree e) Strongly disagree

125
23. I felt the police officer would do the same to anyone in my situation irrespective of his/her status. a) Strongly agree b) Agree c) Neutral d) Disagree e) Strongly disagree
Voice
24. The police officer gave me opportunity to express my views during the interaction. a) Strongly agree b) Agree c) Neutral d) Disagree e) Strongly disagree
25. The police officer listened to me during interaction. a) Strongly agree b) Agree c) Neutral d) Disagree e) Strongly disagree
Trustworthiness 26. Police explained the importance of the traffic stop for my and others’ safety
a) Strongly agree b) Agree c) Neutral d) Disagree e) Strongly disagree
27. I believe that what the police did is for my own safety. a) Strongly agree b) Agree c) Neutral d) Disagree e) Strongly disagree

126
THE IMPACT OF BWC ON DRIVERS’ GENERAL PERCEPTION ABOUT POLICE
28. The specific encounter with police today does have positive impact on my perception of police in general.
a) Strongly agree b) Agree c) Neutral d) Disagree e) Strongly disagree
SATISFACTION
29. Overall, I was satisfied with police behavior and how I was treated during this encounter. a) Strongly Agree b) Agree c) Neutral d) Disagree e) Strongly Disagree
LEGITIMACY OF TRAFFIC POLICE OFFICERS
30. I respect for traffic police officers. a) Strongly agree b) Agree c) Neutral d) Disagree e) Strongly disagree
31. I have confidence in traffic police officers.
a. Strongly agree a) Strongly agree b) Agree c) Neutral d) Disagree e) Strongly disagree
32. I trust traffic police officers.
a) Strongly agree b) Agree c) Neutral d) Disagree e) Strongly disagree

127
LEGITIMACY OF POLICE IN GENERAL
33. I respect for police. a) Strongly agree b) Agree c) Neutral d) Disagree e) Strongly disagree
34. I have confidence in police.
a) Strongly agree b) Agree c) Neutral d) Disagree e) Strongly disagree
35. I trust police.
a) Strongly agree b) Agree c) Neutral d) Disagree e) Strongly disagree
COMPLIANCE
Specific Compliance 36. I did as I was told by the police officer.
a) Strongly agree b) Agree c) Neutral d) Disagree e) Strongly disagree
General Compliance
37. I would obey the traffic rules. a) Strongly agree b) Agree c) Neutral d) Disagree e) Strongly disagree

128
38. This interaction would have positive impact on my future compliance with traffic rules.
a) Strongly agree b) Agree c) Neutral d) Disagree e) Strongly disagree
Cooperation
39. I am willing to assist police if asked a) Strongly agree b) Agree c) Neutral d) Disagree e) Strongly disagree
40. I am willing to work with police to try to solve problems in my community.
a) Strongly agree b) Agree c) Neutral d) Disagree e) Strongly disagree
NOTIFICATION
41. Were you notified by the police that the encounter was going to be recorded through BWC? a) Yes b) No
42. Were you aware that your encounter with police was being recorded through body
worn camera? a) Yes
b) No GENERAL PERCEPTION ABOUT THE SEPECIFIC ENCOUNTER
43. Would like to share any other comments or ideas about your encounter today?
……………………………………………………………
GENERAL PERCEPTION ABOUT BWC
44. What do you think about the use of BWCs during traffic stops?
…………………………………………………………

129
LIST OF FIGURES
Figure 1: Unusual Data
37393
520353
313
604
592311 270355
199342
15
33521922
46
285621
33189
384 61
35947
220
327
507490229320
376152
52302
254
340
444401
39
605 127
58736455209221499
262
519
343
176
4851629
437 541271150 418
516
81
165
239
166
170
276582
584
35
190438505595
617606317
214371
351
337
522
442
4334
249
567512441
338382523
15442
331
156488
575613
23
44
111377383
27
34
4849106
324
339
346
347
402500518
599
167
387348179
395
109
93171
623392
141
496314
28561116267
1
5
10
11
243238
40
4145 82
104
105131
168
183211218222225 256
259
260
288
301305
315
321
322
323
341
357
391
397
404405 419436
453466
482
484
486
487
492494
498503509510515517
521
579583586
589594597
598601602603
610619
316
385
448457
207
258
421
449
310
325
612
439495
208
133
194
231381
461
48111731
224
132
226
560
155115
298
386506
563
570223
590
593292588
607622
169174180
344350235
362306543
6225
48312360479
394
124
356
616230
265
97
546
21698
491
181349
203
263
620
303
533528
3043
158
425
557
497
307502
624184434242
54796614
134
238
175
2
297
363
278
20455
26473
191
365
366
389
489566
585
173568
440540
304
14300
446
460
508
511
553
538308615
390
172293
608571
137
312
379
410
146
247
56425159
177572
364
539
237
157
361
281
550
388
406
464
103
59165
333
443318178
368
122
380
45026
84
129
255
261
3545135492578
6097295328
67 60
145147
153
13
99107
162163
206
309
372
373
416
463
215
423
596
212
369
422
429430
94562
577
188244
367
414
192
531
3
69
128
234456
7140
142143144
149
151
291
396
413417
45968113 136
148
159161
200
213236
241
266
277
286
287289
299
411
424471
529
544554
559 9282
336431
470
480
504
5146
817
18
19
20
215051 53
56575863
66
7071
74
75
767778
808386
87
88
89
9091
100
101
108110
112
114118
119120121123
125
126
130
135
138139
160
164 182185186
187
193195
196
197
198201
205
210217
227228 233240
243
246248
250252
253257268269
272
273274
275
279
280283
284
290294
295
296
329
330352358
370
374375378
398
407
409412
420
426
427428432
445451
452462465
467
468469
472473
474
475476
477478
493501
524
525
526
527
530532534535536537
542
545551
552
555
556
558565
569573574576
581600
0.0
2.0
4.0
6.0
8.1
Leve
rage
0 .01 .02 .03 .04Normalized residual squared
Unusual Data (Model 1: Procedural Justice)
37393
520353
313
604
592311 270355
199342
15
335219 22
46
285621
33189
38461
35947
220
327
507 490229320
376152
52302
254
340
444401
39
605127
58736455
209 221499
262
519
343
176
4851629
437541271150418
516
81
165
239
166
170
276582
584
35
190438505595617606317
214 371
351
337
522
442
4334
249
567512
441338
382523
15442
331
156488
575613
23
44
111377383
27
34
4849106
324
339
346
347
402500518
599
167
387348179
395
109
93171
623392
141
496314
28561 116267
1
5
10
11
243238
40
414582
104
105131
168
183211218222225256259
260
288
301 305
315
321
322
323
341
357
391
397
404405419436
453466
482
484
486
487
492494
498503509
510 515517
521
579583586
589594
597
598601602603
610619
316
385
448457
207
258
421
449
310
325
612
439495
208
133
194
231381
461
48111731
224
132
226
560
155115
298
386506563
570223
590
593292588
607622
169174180
344350 235
362306543
6225
48312360479
394
124
356
616230
265
97
546
21698
491
181349
203
263
620
303
533528
3043
158
425
557
497
307502624184
434242
54796614
134
238
175
2
297
363
278
20455
26473
191
365
366
389
489 566
585
173568
440540
304
14300
446
460
508
511
553
538308615
390
172293608 571
137
312
379
410
146
247
56425159
177572
364
539
237
157
361
281
550
388
406
464
103
59165
333
443318178
368
122
380
45026
84
129
255
261
3545135492 578
6097295
328
67 60
145147
153
13
99 107
162163
206
309
372
373
416
463
215
423
596
212
369
422
429430
94562
577
188244
367
414
192
531
3
69
128
234456
7140
142143
144
149
151
291
396
413417
45968113 136
148
159161
200
213236
241
266
277
286
287289
299
411
424471
529
544554
559 9282
336 431
470
480
504
5146817
18
19
20
21505153
56575863
66
7071
74
75
767778
80838687
88
89
9091
100
101
108110
112
114118
119120121123
125
126
130
135
138139
160
164 182185186
187
193195
196
197
198201
205
210217
227228 233240243
246248250
252
253 257268269
272
273274
275
279
280283
284
290294
295
296
329
330352 358
370
374 375378
398
407
409412
420
426
427428432
445451
452462
465
467
468469
472473
474
475476
477478
493501
524
525
526
527
530532534535536537
542
545551
552
555
556
558565
569573 574
576
581600
0.0
2.0
4.0
6.0
8.1
Leve
rage
0 .005 .01 .015 .02 .025Normalized residual squared
Unusual Data (Model 2: Traffic Police Legitimacy)
37393
520353
313
604
592311270 355
199342
15
33521922
46
285621
33189
38461
35947
220
327
507 490229320
37615252302
254
340
444401
39
605127
58736455
209221499
262
519
343
176
48516 29
437541 271150418
516
81
165
239
166
170
276582
584
35
190438505
595617606
317
214 371
351
337
522
442
4334
249
567512
441338382 523
15442
331
156488
57561323
44
111377383
27
34
4849106
324
339
346
347
402500518
599
167
387348179
395
109
93171
623 392
141
496314
28561116267
1
5
10
11
2432
38
40
414582
104
105131
168
183211218222225256259
260
288
301 305
315
321
322
323
341
357
391
397
404405419436
453466
482
484
486
487
492494
498503509
510 515517
521
579583586
589594
597
598601602
603
610619
316
385
448457
207
258
421
449
310
325
612
439495
208
133
194
231381
461
48111731
224
132
226
560
155115
298
386506
563
570223
590
593292588
607622
169174180
344350 235
36230654362
25
48312360 479
394
124
356
616230
265
97
546
21698
491
181349
203
263
620
303
533528
30 43
158
425
557
497
307502
624184
434242
547 96614
134
238
175
2
297
363
278
20455
26473
191
365
366
389
489566
585
173568
440540
304
14300
446
460
508
511
553
538308 615
390
172293608571
137
312
379
410
146
247
56425159
177572
364
539
237
157
361
281
550
388
406
464
103
59165
333
443 318178
368
122
380
45026
84
129
255
261
3545135492578
6097295
328
67 60
145147
153
13
99107
162163
206
309
372
373
416
463
215
423
596
212
369
422
429430
94562
577
188244
367
414
192
531
3
69
128
234456
7140
142143
144
149
151
291
396
413417
45968 113136
148
159161
200
213236
241
266
277
286
287289
299
411
424471
529
544554
559 9282
336431
470
480
504
5146
8 17
18
19
20
2150 5153
56575863
66
7071
74
75
767778
80 838687
88
89
9091
100
101
108110
112
114 118
119 120121123
125
126
130
135
138139
160
164182 185186
187
193195
196
197
198201
205
210217
227228 233240
243
246248250252
253257268269
272
273274
275
279
280283
284
290294
295
296
329
330352358
370
374 375378
398
407
409412
420
426
427 428432
445451
452462
465
467
468469
472473
474
475476
477478
493501
524
525
526
527
530532534
535536537542
545551
552
555
556
558565
569573574
576
581 600
0.0
2.0
4.0
6.0
8.1
Leve
rage
0 .005 .01 .015 .02Normalized residual squared
Unusual Data (Model 3: Police Legitimacy)
37393
520353
313
604
592311270355
199342
15
33521922
46
285621
33189
38461
35947
220
327
507490229320
376152
52302
254
340
444401
39
605127
58736455209 221
499262
519
343
176
4851629
437541271150418516
81
165
239
166
170
276582
584
35
190438505595
617606317
214371
351
337
522
442
4334
249
567512441
338382523
15442
331
156488
57561323
44
111377383
27
34
4849106
324
339
346
347
402500518
599
167
387348179
395
109
93171
623392
141
496314
28561116267
1
5
10
11
2432
38
40
414582
104
105131
168
183211218222225256259
260
288
301305
315
321
322
323
341
357
391
397
404405419436
453466
482
484
486
487
492494
498503509
510515517
521
579583586
589594
597
598601602603
610619
316
385
448457
207
258
421
449
310
325
612
439495
208
133
194
231381
461
48111731
224
132
226
560
155115
298
386506
563
570223
590
593292588
607622
169174180
344350235362306543
6225
48312360 479394
124
356
616230
265
97
546
21698
491
181349
203
263
620
303
533528
3043
158
425
557
497
307502624
184434
242
54796614
134
238
175
2
297
363
278
20455
26473
191
365
366
389
489566
585
173568
440540
304
14300
446
460
508
511
553
538308 615
390
172293
608571
137
312
379
410
146
247
56425159
177572
364
539
237
157
361
281
550
388
406
464
103
59165
333
443318178
368
122
380
45026
84
129
255
261
3545135492578
6097295328
6760
145147153
13
99107
162163
206
309
372
373
416
463
215
423
596
212
369
422
429430
94 562
577
188244
367
414
192
531
3
69
128
234456
7140
142143144
149
151
291
396
413417
45968113136
148
159161
200
213236
241
266
277
286
287289
299
411
424471
529
544554
5599282336 431
470
480
504
5146817
18
19
20
21505153565758
63
66
7071
74
75
767778
80838687
88
89
9091
100
101
108110
112
114118
119120121123
125
126
130
135
138139
160
164182185186
187
193195
196
197
198201
205
210217
227228233240
243
246248250
252
253257268 269
272
273274
275
279
280283
284
290294
295
296
329
330352 358
370
374375378
398
407
409412
420
426
427428432445451
452462465
467
468469
472473
474
475476
477478493
501
524
525
526
527
530532534535536537
542
545551
552
555
556
558565
569573574576
581600
0.0
2.0
4.0
6.0
8.1
Leve
rage
0 .01 .02 .03 .04Normalized residual squared
Unusual Data (Model 4: Cooperation)
37393
520353
313
604
592311270 355
199342
15
33521922
46
285621
33189
384 61
35947
220
327
507490229320
376152
52302
254
340
444401
39
605127
58736455209221
499262
519
343
176
48516 29
437 541271150418516
81
165
239
166
170
276582
584
35
190438505
595617606
317
214371
351
337
522
442
4334
249
567512
441338382523
15442
331
156488
57561323
44
111377383
27
34
4849106
324
339
346
347
402500518
599
167
387348179
395
109
93171
623392
141
496314
28561116 267
1
5
10
11
243238
40
414582
104
105131
168
183211218222225256259
260
288
301 305
315
321
322
323
341
357
391
397
404405419436
453466
482
484
486
487
492494
498503509
510 515517
521
579583586
589594597
598601602603
610619
316
385
448457
207
258
421
449
310
325
612
439 495
208
133
194
231381
461
48111731
224
132
226
560
155115
298
386506
563
570223
590
593292588
607622
169174180
344350 235
362306543
6225
48312360479
394
124
356
616230
265
97
546
21698
491
181349
203
263
620
303
5335283043
158
425
557
497
307502
624184
434242
54796614
134
238
175
2
297
363
278
20455
26473
191
365
366
389
489566
585
173568
440 540
304
14300
446
460
508
511
553
538308 615
390
172293
608571
137
312
379
410
146
247
56425159
177572
364
539
237
157
361
281
550
388
406
464
103
59165
333
443318178
368
122
380
45026
84
129
255
261
354 5135492 578
60972 95
328
67 60
145147
153
13
99 107
162163
206
309
372
373
416
463
215
423
596
212
369
422
429430
94 562
577
188244
367
414
192
531
3
69
128
234456
7140
142143
144
149
151
291
396
413417
45968113136
148
159161
200
213236
241
266
277
286
287289
299
411
424471
529
544554
559 9282336 431
470
480
504
5146817
18
19
20
2150 5153
56575863
66
7071
74
75
76 7778
80838687
88
89
9091
100
101
108110
112
114118
119120121123
125
126
130
135
138139
160
164 182185186
187
193195
196
197
198201
205
210217
227228 233240
243
246248250
252
253257268 269
272
273274
275
279
280283
284
290294
295
296
329
330352 358
370
374375378
398
407
409412
420
426
427428432445
451
452462
465
467
468469
472473
474
475476
477478493
501
524
525
526
527
530532534
535536537542
545551
552
555
556
558565
569573 574
576
581 600
0.0
2.0
4.0
6.0
8.1
Leve
rage
0 .01 .02 .03 .04Normalized residual squared
Unusual Data (Model 5: General Compliance)
37393
520 353
313
604
592311270 355
199342
15
33521922
46
285621
33189
38461
35947220
327
507490229 320
376152
52302
254
340
444401
39
605127
58736455209221
499262
519
343
176
4851629
437 541271150 418516
81
165
239
166
170
276582
584
35
190438505595
617606317
214371
351
337
522
442
4334
249
567512441338382523
15442
331
156488
57561323
44
111 377383
27
34
4849106
324
339
346
347
402500518
599
167
387348179
395
109
93171
623392
141
496314
28561116267
1
5
10
11
2432
38
40
4145 82
104
105131
168
183211218222225256
259
260
288
301305
315
321
322
323
341
357
391
397
404405419436
453466
482
484
486
487
492494
498503509510515517
521
579583586
589594
597
598601602603
610619
316
385
448457
207
258
421
449
310
325
612
439495
208
133
194
231381
461
48111731
224
132
226
560
155115
298
386506563
570223
590
593292588
607622
169174180
344350235362306543
6225
48312360479
394
124
356
616230
265
97
546
21698
491
181349
203
263
620
303
5335283043
158
425
557
497
307502624
184434242
54796614
134
238
175
2
297
363
278
20455
26473
191
365
366
389
489566
585
173568440540
304
14300
446
460
508
511
553
538308615
390
172293
608571
137
312
379
410
146
247
56425159
177572
364
539
237
157
361
281
550
388
406
464
103
59165
333
443318178
368
122
380
45026
84
129
255
261
3545135492578
6097295328
6760
145147
153
13
99107
162163
206
309
372
373
416
463
215
423
596
212
369
422
429430
94562
577
188244
367
414
192
531
3
69
128
234456
7140142143
144
149
151
291
396
413417
45968113136
148
159161
200
213236
241
266
277
286
287289
299
411
424471
529
544554
5599282
336431
470
480
504
5146817
18
19
20
2150515356575863
66
7071
74
75
767778
80838687
88
89
9091
100
101
108110
112
114118
119120121123
125
126
130
135
138139
160
164 182185186
187
193 195
196
197
198201
205
210217
227228233240243
246248250252
253257268269
272
273274
275
279
280283
284
290294
295
296
329
330352358
370
374375378
398
407
409412
420
426
427428432
445451
452462465
467
468469
472473
474
475476
477478
493501
524
525
526
527
530532534535536537542
545551
552
555
556
558565
569573574576
581600
0.0
2.0
4.0
6.0
8.1
Leve
rage
0 .02 .04 .06 .08Normalized residual squared
Unusual Data (Model 6: Specific Compliance)
37393
520 353
313
604
592311270355
199342
15
33521922
46
285621
33189
38461
35947220
327
507 490229 320
376152
52302
254
340
444401
39
605127
58736455209 221
499262
519
343
176
4851629
437541271150418
516
81
165
239
166
170
276582
584
35
190438505595
617606317
214371
351
337
522
442
4334
249
567512441338382 523
15442
331
156488
57561323
44
111377383
27
34
4849106
324
339
346
347
402500518
599
167
387348179
395
109
93171
623392
141
496314
28561116267
1
5
10
11
243238
40
4145 82
104
105131
168
183211218222225256
259
260
288
301305
315
321
322
323
341
357
391
397
404405419436
453466
482
484
486
487
492494
498503509510515517
521
579583586
589594597
598601 602603
610619
316
385
448457
207
258
421
449
310
325
612
439495
208
133
194
231381
461
48111731
224
132
226
560
155115
298
386506
563
570223
590
593292588
607622
169174180
344350235362306 54362
25
48312360479
394
124
356
616230
265
97
546
21698
491
181349
203
263
620
303
533528
3043
158
425
557
497
307502624184434242
54796614
134
238
175
2
297
363
278
20455
26473
191
365
366
389
489566
585
173568440540
304
14 300
446
460
508
511
553
538308615
390
172293
608571
137
312
379
410
146
247
56425159177572
364
539
237
157
361
281
550
388
406
464
103
59165
333
443318178
368
122
380
45026
84
129
255
261
3545135492578
60972 95328
6760
145147
153
13
99107
162163
206
309
372
373
416
463
215
423
596
212
369
422
429430
94562
577
188244
367
414
192
531
3
69
128
234456
7140
142143
144
149
151
291
396
413417
45968113 136
148
159161
200
213236
241
266
277
286
287289
299
411
424471
529
544554
559 9282
336431
470
480
504
5146817
18
19
20
215051 5356575863
66
7071
74
75
767778
80838687
88
89
9091
100
101
108110
112
114118
119120121123
125
126
130
135
138139
160
164 182185186
187
193195
196
197
198201
205
210217
227228 233240243
246248250252
253257268269
272
273274
275
279
280283
284
290294
295
296
329
330352358
370
374375378
398
407
409412
420
426
427428432
445451
452462465
467
468469
472473
474
475476
477478
493501
524
525
526
527
530532534535536537542
545551
552
555
556
558565
569573574576
581600
0.0
2.0
4.0
6.0
8.1
Leve
rage
0 .02 .04 .06Normalized residual squared
Unusual Data (Model 7: Satisfaction)
37393
520 353
313
604
592311270355
199342
15
33521922
46
285621
33189
384 61
35947220
327
507 490229320
37615252
302
254
340
444401
39
605127
58736455209 221499
262
519
343
176
4851629
437541271150418
516
81
165
239
166
170
276582
584
35
190438505595617 606
317
214371
351
337
522
442
4334
249
567512441
338382523
154 42
331
156488
57561323
44
111377383
27
34
4849106
324
339
346
347
402500518
599
167
387348179
395
109
93171
623 392
141
496314
28561 116267
1
5
10
11
243238
40
414582
104
105131
168
183211218222225256
259
260
288
301305
315
321
322
323
341
357
391
397
404405419436
453466
482
484
486
487
492494
498503509510515517
521
579583586
589594
597
598601 602
603
610619
316
385
448457
207
258
421
449
310
325
612
439495
208
133
194
231381
461
48111731
224
132
226
560
155115
298
386506
563
570223
590
593292588
607622
169174180
344350 235
362306543
6225
483 12360479
394
124
356
616230
265
97
546
216 98
491
181349
203
263
620
303
533528
30 43
158
425
557
497
307502624184
434242
54796 614
134
238
175
2
297
363
278
20455
26473
191
365
366
389
489566
585
173568
440540
304
14 300
446
460
508
511
553
538308615
390
172293
608571
137
312
379
410
146
247
56425159
177572
364
539
237
157
361
281
550
388
406
464
103
59165
333
443 318178
368
122
380
45026
84
129
255
261
3545135492578
6097295
328
67 60
145147
153
13
99107
162163
206
309
372
373
416
463
215
423
596
212
369
422
429430
94562
577
188244
367
414
192
531
3
69
128
234456
7140
142143144
149
151
291
396
413417
45968113 136
148
159161
200
213236
241
266
277
286
287289
299
411
424471
529
544554
559 9282
336431
470
480
504
5146
817
18
19
20
215051 5356 5758
63
66
7071
74
75
767778
80838687
88
89
9091
100
101
108110
112
114118
119120121123
125
126
130
135
138139
160
164 182185186
187
193195
196
197
198201
205
210217
227228 233240
243
246248250252
253257268269
272
273274
275
279
280283
284
290294
295
296
329
330352358
370
374375378
398
407
409412
420
426
427428432
445451
452462
465
467
468469
472473
474
475476
477478
493501
524
525
526
527
530532534535536537542
545551
552
555
556
558565
569573574576
581 600
0.0
2.0
4.0
6.0
8.1
Leve
rage
0 .01 .02 .03Normalized residual squared
Unusual Data (Model 8: Perception of Police)

130
Figure 2: Histograms of Residuals
0.2
.4.6
.81
Dens
ity
-3 -2 -1 0 1Residuals
Histogram of Residuals (Model 1: Procedural Justice)
0.1
.2.3
.4.5
Dens
ity
-4 -2 0 2Residuals
Histogram of Residuals (Model 2: Traffic Police Legitimacy)
020
4060
8010
0Fr
eque
ncy
-4 -2 0 2Residuals
Histogram of Residuals (Model 3: Police Legitimacy)
050
100
150
200
Freq
uenc
y
-4 -3 -2 -1 0 1Residuals
Histogram of Residuals (Model 4: Cooperation)
020
4060
8010
0Fr
eque
ncy
-4 -3 -2 -1 0 1Residuals
Histogram of Residuals (Model 5: General Compliance)
050
100
150
Freq
uenc
y
-4 -3 -2 -1 0 1Residuals
Histogram of Residuals (Model 6: Specific Compliance)
050
100
150
200
Freq
uenc
y
-4 -3 -2 -1 0 1Residuals
Histogram of Residuals (Model 7: Satisfaction)
050
100
150
Freq
uenc
y
-4 -3 -2 -1 0 1Residuals
Histogram of Residuals (Model 8: Perception of Police)

131
Figure 3: Heteroskedasticity
37393520353313
604592
311
270
355
199
342
15
33521922
46
285
62133
189384
61359
47220327507
490229320
376
152
52
302
254
34044440139605
127
587 36455 209221
499
262
519343176485
16
29 437
541
271150
418
516
81
165
239
166170
276
582584
35190438 505595
617606 317214 371
351337522
442433 4
249567
512441338 38252315442
331
156488
575613
23 44
111377
383273448
49106
324339346347
402500518599167387
348179
395
10993
171623392 141
49631428
561116267
15
1011 24 32 3840 4145
82
104105
131
168 183211
218222 225
256259260 288
301 305315321322323341357391
397404
405
419
436
453466
482484486487
492494498 503509510515517
521
579
583586589594 597
598601602
603610
619316 385448
457207258421
449 310325612
439495
208133194
231
381461
481
117
31224
132
226
560
155
115
298 386506
563570
223590593
292
588607622
169174180344 350235
362
306
54362
25 483
12360479
394124 356616230
26597
546
216 98491181349
203263 620303
533528
3043
158 425557
497307
502
624184
434242 547
96 614
134238
1752
297
363
278
204
55264 73191
365
366
389
489
566
585173
568
440
540
304
14
300446460508511
553538
308
615390 172
293
608
571
137
312379
410
146
247564251
59177
572
364
539237
157361
281550
388
406
464
103591
65
333 443318178
368122
380
45026
84129
255261
354513
5492
578
609
7295
32867
60
145147 153
13
99
107162 163
206
309372
373416463
215
423
596212
369422
429 430
94562577
188244367414
192531
3 69
128
234
456
7140
142143144
149151
291
396
413417459
68113
136148
159161200
213
236
241
266277286287289
299
411424
471529
544554559
9
282
336
431470
480
5045146 8
1718
1920
2150 51
53
56 575863
667071 7475
7677 7880
83 8687
888990
91100
101
108110 112114118119120
121
123125126
130
135
138139
160164
182
185186187 193195 196197198
201205210
217 227228
233
240243
246
248 250252253257
268269 272273
274275279
280
283284
290294
295296329
330352
358370
374375
378
398407
409412420
426427428
432
445451
452462465 467468 469
472
473474475
476477478
493501
524525
526
527530532534535536
537542 545551
552
555556558
565569573574576
581
600
-3-2
-10
1Re
sidua
ls
4.5 5 5.5 6Fitted values
Heteroskedasticity (Model 1: Procedural Justice)
37393520
353
313
604
592
311
270355
199342
15335
219
22
46
285
62133
189
384
61
359
47
220
327
507
490
229
320 376
152
52302
254
340
444
401
39605127
58736
455
209
221
499
262
519
343176485
16
29437
541
271150418
516
81165
239
166
170276
582
58435
190438
505595
617
606
317214
371 351
337
522442
433
4
249
567
512
441
338
382
523
154
42
331
156
488
575613
2344
111377
383
27
34
4849106
324
339
346
347 402
500
518
599
167387348
179
395 109
93
171
623
392
141
496
31428
561
116
267
15
10
11
243238
40
41
45
82
104
105
131
168
183
211218
222225
256259260
288
301
305
315
321
322
323
341357391
397
404
405
419436
453466
482
484
486487
492
494 498503509
510
515
517
521
579
583586
589
594
597598
601602
603
610619
316
385
448
457
207258
421
449
310
325
612
439495
208
133
194231
381
461
481
117
31
224132
226
560
155
115
298
386
506
563570
223
590593292
588
607
622
169174
180
344 350
235
362
306
543
6225
483
12
360
479 394
124
356
616
23026597
546
216
98
491
181
349203
263620
303
533 528
3043 158
425
557
497
307
502624184
434
242
54796
614
134
238175 2297
363
278
204
5526473191
365
366
389
489
566
585
173
568440
540304
14300446
460
508
511553
538
308615 390 172
293608
571
137 312
379
410146
247564
25159
177572
364539
237
157
361
281
550
388
406464
103
591
65333
443318
178
368
122
380
45026
84129
255261
354
513
54
92
578609
7295 328
6760
145147153
1399
107
162
163
206
309
372
373
416
463
215
423596
212
369
422429430
94
562
577
188
244
367 414
192531
3
69
128
234
456
7
140
142 143
144149
151
291396
41341745968
113
136
148159
161
200
213236
241
266 277
286 287
289
299 411
424
471529544
554
5599
282
336
431
470
480
504514
6 8
17
18
19
20
21
50
51
5356
57586366
70
71 74 757677
78
80
838687888990
91
100101
108
110
112114118
119120
121
123125126
130
135
138
139 160
164
182
185
186187
193
195
196197
198
201205
210
217227
228
233
240 243
246248250
252
253257
268
269
272
273274
275
279
280283
284
290
294
295
296
329
330352
358
370374
375
378398407
409
412
420
426
427428
432
445
451452462465
467
468
469
472
473
474
475
476
477478
493501
524525526
527530532534
535536
537542
545551552
555
556558
565
569
573
574576
581
600
-4-2
02
Resid
uals
3.5 4 4.5 5 5.5Fitted values
Heteroscedasticity (Model 2:Traffic Police Legitimacy)
37
393520
353
313
604
592
311270
355
199
342
15335
2192246
285
621
33
189
384
61359
47
220327507
490
229320
376
15252 302254
340444
401
39
605127
587
36455
209
221
499
262
519
343
176
485
16
29
437541
271150
418516
81
165
239
166170
276
582
584 35
190
438
505595
617
606317
214
371
351337
522
442
433
4
249
567
512
441
338
382
523154
42
331
156
488
575
61323
44
111
377
383
273448
49106
324339
346347
402500
518599
167 387348
179
395
10993
171
623
392
141
496 31428
561116
267
1 510
11
24
32
3840
41
45
82
104
105
131
168
183
211218 222225 256259
260
288301
305315
321
322323341
357
391
397 404
405
419436453466
482
484
486487
492
494
498
503
509
510
515517521
579
583
586
589
594
597
598
601602
603 610619
316
385
448
457
207258
421449
310
325
612439
495208
133
194
231
381
461481
117
31
224
132
226
560
155
115
298
386
506
563
570223
590
593
292588
607
622
169
174
180
344 350
235 362
306
543
62
25
483
12
360
479
394
124
356616
230265
97
546
216
98491
181349
203
263620
303
533
528
30
43
158
425
557497
307
502
624184
434
242
547
96 614
134
238
175
2
297 363
278 204 55
264
73
191
365
366
389
489
566585 173
568
440 540
304
14
300446
460
508
511
553
538
308
615
390
172
293608
571137
312
379410146
247
564251
59
177 572
364
539
237
157361
281 550
388
406 464103
591
65333
443
318
178
368
122
380
45026
84129
255
261
354
513
54
92
578
609
72
95
328
6760
145147153
13
99107 162 163
206309
372
373416
463
215
423
596
212 369422
429
430
94562
577 188
244367 414 192
531
369
128
234
456
7140
142143144
149
151
291
396 413 417
459
68
113136
148159161
200
213
236
241
266
277
286287289
299
411
424
471529
544
554
559
9
282
336
431
470
480
504514
6 817
18
19
20
2150
51
53
56
57586366
70
71
74
75 7677
78
80
83
86878889
9091
100101
108
110
112
114118
119
120
121
123
125126
130
135
138
139160164
182
185
186 187193
195
196 197
198
201
205
210
217227228
233
240
243
246248250
252
253257 268
269
272
273
274
275
279
280283
284 290
294295
296
329
330352
358370
374
375378 398407
409412
420 426427
428
432
445
451
452
462465467
468
469
472
473474
475
476
477
478493
501
524525
526
527530532
534
535
536537
542545
551
552555
556
558
565
569573574
576
581
600
-4-2
02
Resid
uals
3.5 4 4.5 5Fitted values
Heteroscedasticity (Model 3: Police Legitimacy)
37
393
520
353
313
604
592
311
270
355
199342
15
33521922
46285
62133
189
384
61
359
47
220
327
507
490
229320
376152
52
302
254
340444401
39605127
58736455209
221
499
262
519
343176
485
16
29437
541
271
150
418 516
81
165239
166
170276
582
584
35190
438
505595
617 606
317
214 371
351337522
442
433
4
249
567512441338
382
523154 42
331156
488
5756132344111
377
383
273448
49
106
324
339346347
402
500518599
167387348179395
109
93
171
623
392
141
496
314
28
561
116
26715
10
11
24
3238
4041
45
82
104
105 131
168183
211
218222
225 256259 260288301
305315
321
322
323
341
357
391
397404
405
419436453
466482484
486
487
492
494
498
503 509
510
515
517 521
579
583
586589
594597
598
601
602603610
619
316
385448
457
207
258
421
449
310325
612439495
208
133
194231
381
461481117
31
224
132
226
560
155
115298386
506
563
570223 590593
292
588
607622
169
174
180344
350235 362
306
543
62
25
483 12360
479
394124
356616
230
265
97546
216
98491
181
349
203263
620303 533
528
30
43158
425
557
497307
502624
184
434
242
54796
614
134
2381752
297363
278
20455
264
73191
365
366389
489
566
585
173568
440
540
304
14
300 446
460
508
511553538
308
615
390
172
293608
571
137
312
379
410
146
247
564251
59
177572
364
539
237
157
361281550
388406464 103
591
65
333443
318
178368
122380
45026
84129
255261354
513
5492578609
7295
328 67
60
145147153
13
99
107162163206309
372
373416
463215
423
596
212369
422429
430
94
562
577188 244
367
414
1925313
69
128
234
4567
140 142 143144149151291
396
413417 459
68 113136 148 159 161
200
213
236
241
266 277286
287289 299 411
424
471529
544554
5599
282
336
431
470480
504
5146 817 1819
20215051
5356
57
5863
667071 74757677 78
80838687
8889 9091100
101108
110
112114 118119120
121
123 125126 130135
138139160164
182
185186
187
193
195
196197
198
201205210
217227 228
233
240243
246
248250
252
253257
268
269
272
273
274275 279
280283
284290
294295
296
329330352
358
370374375
378398 407 409
412
420 426427
428
432445451
452462465467468 469
472
473474 475
476477478493
501
524
525 526527 530532534535536 537
542
545551552
555
556 558 565569
573
574 576581600
-4-3
-2-1
01
Resid
uals
4.2 4.4 4.6 4.8 5 5.2Fitted values
Heteroscedasticity (Model 4: Cooperation)
37
393
520
353
313
604
592
311
270
355199
342
15
33521922
46
285
621
33
189
38461
359
47
220
327
507
490
229
320
376
152
52
302
254
340
444
401
39605127
58736 455209
221
499
262
519
343
176
485
16
29
437
541
271150
418
516
81165
239
166
170
276
582
584
35190
438
505595
617
606
317
214
371
351
337522
442
433
4
249
567512
441
338382
523154
42331156
488
575613
23 44
111
377
383
2734
48
49
106
324
339
346
347402 500518599167
387
348179395
109
93
171
623
392
141496
31428
561
116
267
15
1011
24
32 3840
41
45
82
104105 131168
183
211218
222225256259
260
288
301
305
315
321322
323
341
357
391397
404
405
419436
453
466482
484
486
487
492
494
498
503509
510
515
517
521
579
583
586589
594597
598
601602
603
610
619316
385448 457207
258
421
449
310
325612
439
495
208
133
194
231
381
461
481
11731
224
132
226
560
155
115298
386
506563
570223
590
593
292 588
607
622169174
180
344 350
235
362
306
543
6225
483
12
360
479394
124356
616
23026597
546
216
98
491181349
203263
620303
533 52830
43
158425
557497
307
502
624
184
434
242
54796
614
134
238
175
2 297363
278
204
55
264
73
191365
366
389
489566
585
173
568
440
540
304
14300
446
460
508
511
553538
308
615
390
172293
608
571
137312379
410
146 247
564
251
59
177
572364
539
237
157
361 281
550
388
406
464
103
591
65333
443318
178
368
122
380
450
26
84129
255261
354
513
54
92
578609
72
95
328
6760
145147
15313
99
107162163206
309
372
373
416
463
215
423
596
212
369
422429430
94
562
577
188
244
367414
192
531
3
69
128
234
4567
140142
143144149
151
291
396
413
417
45968
113
136
148159161
200
213236
241
266
277286
287
289299
411
424
471
529
544
554559
9
282
336
431
470
480
504514
6817
18
1920 2150
51
5356
57
58
636670 71
74 7576
7778
80
838687 888990
91100101
108110
112114
118
119 120
121
123125
126130
135
138139160
164
182
185186187193
195
196
197
198
201205
210
217227
228
233240
243
246248250 252
253
257
268
269272273 274
275
279
280283
284
290
294295
296329
330
352
358
370
374
375378
398407
409
412
420
426
427428 432445
451
452
462465
467
468
469472 473
474
475
476
477
478493501
524
525526
527
530
532534
535536537
542
545
551552
555
556
558565569
573
574
576
581
600
-4-3
-2-1
01
Resid
uals
4 4.5 5 5.5Fitted values
Heteroscedasticity (Model 5: General Compliance)
37
393
520
353313
604
592311270
355199
342
15
335
2192246
285
621
33
189384
61
359
47220327
507
490229
320
376
152
52
302
254
340444
401
39605
127
58736
455209
221499
262
519343176485
16
29437
541
271
150
418
51681
165
239
166170
276
582584
35190438 505595
617606317
214371
351
337
522442433
4
249
567
512441338382
523
15442331
156
488
575
61323 44
111
377
383
27 344849 106
324339346
347
402 500518599167
387
348179 395
10993
171 623392
141496
31428
561
116 267
1 510
11
24
32
38404145
82
104105131
168183211
218222 225
256259260288
301305 315321322
323341 357391397
404405
419
436
453466
482 484486487492 494
498503
509510515 517
521
579
583 586
589
594
597
598601602 603
610
619
316385
448
457
207
258
421
449310325 612
439
495
208
133 194
231
381461481
117
31224
132
226
560
155
115
298386
506
563 570
223
590593
292
588
607622
169174
180
344350
235
362
306
543
62
25
483
12 360479
394
124
356
616230
265
97
546
21698
491
181
349203263
620
303533
528
3043
158425
557497
307
502624
184
434242 547
96 614134238
1752
297
363
278
20455
26473 191
365
366
389
489
566585
173
568
440
540
304
14
300 446
460
508
511553
538
308
615
390172
293
608
571
137
312
379
410
146
247 564251
59177
572364
539
237
157361
281550
388
406
464
103
59165
333
443
318
178
368 122380
45026
84129
255261
354513
5492578
609
7295328 6760
145147
15313
99
107162163206
309372373416463
215
423
596
212
369422
429
43094562577
188244367
414
192531
3 69128
234
456
7 140142143 144149151
291
396
413417 45968113
136
148
159 161 200
213
236241
266 277286 287289
299
411424471
529
544 554559
9
282
336
431470
480
50451468
171819202150 51
5356 5758 63
66 707174757677 78 808386
8788 8990
91100
101
108110112
114 118119120121 123125126 130 135
138139
160 164
182
185186187193
195196
197198201205210
217
227228233
240243
246
248250 252
253257 268269272273
274
275 279 280283 284 290294
295296329
330352
358 370 374375 378
398407
409412 420426427
428
432445
451
452462 465467
468469
472473474
475476477
478
493501
524525
526527530532534 535536537
542545551552
555556 558
565569
573574
576
581600
-4-3
-2-1
01
Resid
uals
4 4.2 4.4 4.6 4.8 5Fitted values
Heteroscedasticity (Model 6: Specific Compliance)
37393
520
353313
604
592
311
270
355
199
342
15
335
2192246
285621
33 189
384
61
359
47220
327507
490
229
320
376152
52
302254
340 44440139605127
587
36455 209
221
499
262
519343 176485
16
29437
541
271
150
418
516
81165
239
166170
276582
58435190438505595
617
606
317
214
371351
337
522442
433
4
249
567
512 441338
382
523
154
42331
156488
575
61323 44
111
377
383
273448
49106324339346347402500518599
167387348
179
395109
93
171623392
141496
314 28
561
116267
1 510
112432 38
40 4145
82
104105 131
168183 211218
222225
256 259260288
301305315
321322
323341357391397404
405
419
436
453466
482484486 487492 494498503509510515517 521
579
583586589
594 597598
601
602
603610619316 385
448
457
207
258
421
449310325612
439
495208
133 194
231
381461
481117
31 224132226 560155
115
298 386506
563570
223590593
292
588
607
622169174 180344 350235 362
306
543
62
25
483
12360479
394
124356616 230
26597
546
216
98491181349203263620
303533
528
3043
158
425
557
497307
502624 184
434242547
96614
134
238
1752
297
363
278
204
5526473
191
365 366
389
489566585
173568
440
540
304
14
300
446460508511
553
538
308615 390
172
293
608
571
137312
379
410
146247564251
59 177
572
364
539
237
157
361
281 550
388406
464
103 591
65333
443318 178
368122380
4502684
129
255261
354513
54 92578609
72
95
3286760
145147
15313
99
107162163206
309 372
373
416
463
215
423
596212
369
422
429
43094562577188244367
414
192531
369
128
234
456
7140142
143
144
149
151
291
396
41341745968 113
136148
159161200
213
236241266 277286287289
299
411424471 529544
554559
9
282
336
431 470
480
504514
68
1718
19202150 51
53
56575863
66 7071 74 757677 7880838687 88899091100
101
108110112114118119120121
123 125126 130135
138
139
160164
182
185186187193
195
196197198 201205210
217
227
228
233
240243
246
248250252253257
268269
272273 274275
279 280283 284 290294 295
296
329
330352
358 370374375
378
398 407
409412420 426427428 432
445451
452462465467468 469
472473474 475
476 477478
493501
524525 526
527530532
534535536537 542 545551552555556 558565
569573574576
581
600
-4-3
-2-1
01
Resid
uals
3.5 4 4.5 5Fitted values
Heteroscedasticity (Model 7: Satisfaction)
37393
520
353313
604
592
311270
355
199
342
15
335
219
22
46285
62133
189
384
61
35947
220
327
507
490
229320 376152
52302
254
340
444
401
39605
127
587
36455 209
221
499
262
519
343
176485
16
29437
541
271
150
418
51681
165239
166170
276
582584
35 190438505595617
606
317
214
371351337522
442
433
4
249567
512441
338
382
523
154
42
331
156488
575613
2344
111
377
383
27 34
48
49106324339
346
347402 500518599167387
348179
395
109
93
171623
392
141496
314
28
561
116
267
151011
2432 38 4041
45
82
104105
131
168183211218
222225256259260288
301305315
321
322
323341357391397
404
405
419
436
453466
482
484
486487492494
498
503 509510515 517521
579
583586
589594
597
598601
602
603
610619 316
385
448
457
207
258
421
449310
325
612
439
495
208
133194
231
381
461
481
117
31 224
132
226
560
155
115
298386506
563570
223
590593
292
588607
622169174180344350
235
362
306
543
62
25483
12
360
479
394124
356616
230265
97
546
216
98491
181
349203263
620
303533528
30
43
158
425
557
497307502624184
434
242
547
96
614
134238
175
2
297 363
278
204
55
264 73
191
365 366389489
566
585
173
568
440
540304
14
300
446
460
508511
553
538
308
615390
172
293
608571
137312
379
410146
247
564 251
59177
572
364
539
237
157
361
281 550
388406
464
103
591
65
333
443318 178
368
122380
450 26
84129
255261
354513
5492578
609
7295
328
67
60
145147
153
13
99
107162163206309372
373416
463
215
423596212
369 422429430
94562577
188244
367
414
192
531
369 128
234
456
7
140 142143144149
151
291
396
41341745968 113
136 148159 161
200
213
236
241
266
277
286
287
289
299
411424471 529544554559
9
282
336
431470
480
504514
6 8
17
181920 2150 51
5356
57
58636670 71 7475
76
77 78 808386878889 9091
100
101
108110 112114118 119120121 123125 126 130135
138139
160
164
182
185186
187
193
195
196197198201
205210
217
227
228
233
240 243
246
248250252253
257
268269272
273
274275
279
280
283
284 290294
295
296
329
330352
358370 374375 378
398 407
409 412420426427
428432
445451
452462465467
468 469472
473474
475
476 477478
493501
524
525
526527530532534535
536
537 542545 551
552555
556
558
565569
573574 576
581
600
-4-3
-2-1
01
Resid
uals
3.5 4 4.5 5Fitted values
Heteroscedasticity (Model 8: Perception of Police)

132
Figure 4: Linearity between Income and Dependent Variables
23
45
6
6 7 8 9 10logINCOME
Procedural Justice Fitted valueslowess Procedural Justice logIncome
Linearity (Income and Procedural Justice)
12
34
56
6 7 8 9 10logINCOME
Traffic Police Legitimacy Fitted valueslowess Traffic Police Legitimacy logIncome
Linearity (Income and Traffic Police Legitimacy)1
23
45
6 7 8 9 10logINCOME
Police Legitimacy Fitted valueslowess Police Legitimacy logIncome
Linearity (Income and Police Legitimacy)
12
34
5
6 7 8 9 10logINCOME
Cooperation Fitted valueslowess Cooperation logIncome
Linearity (Income and Cooperation)
12
34
56
6 7 8 9 10logINCOME
General Compliance Fitted valueslowess General Compliance logIncome
Linearity (Income and General Compliance)
12
34
5
6 7 8 9 10logINCOME
Specific Compliance Fitted valueslowess Specific Compliance logIncome
Linearity (Income and Specific Compliance)
12
34
5
6 7 8 9 10logINCOME
Satisfaction Fitted valueslowess Satisfaction logIncome
Linearity (Income and Satisfaction)
12
34
5
6 7 8 9 10logINCOME
Perception of Police Fitted valueslowess Perception of Police logINCOME
Linearity (Income and Perception of Police)

133
Figure 5: Linearity between Years of Driving and Dependent Variables
23
45
6
0 10 20 30 40 50Number of Years of Driving
Procedural Justice Fitted valueslowess Procedural Justice Years of Driving
Linearity (Years of Driving and Procedural Justice)
12
34
56
0 10 20 30 40 50Number of Years of Driving
Traffic Police Legitimacy Fitted valueslowess Traffic Police Legitimacy Years of Driving
Linearity (Years of Driving and Traffic Police Legitimacy)1
23
45
0 10 20 30 40 50Number of Years of Driving
Police Legitimacy Fitted valueslowess Police Legitimacy Years of Driving
Linearity (Years of Driving and Police Legitimacy)
12
34
5
0 10 20 30 40 50Number of Years of Driving
Cooperation Fitted valueslowess Cooperation Years of Driving
Linearity (Years of Driving and Cooperation)
12
34
56
0 10 20 30 40 50Number of Years of Driving
General Compliance Fitted valueslowess General Compliance Years of Driving
Linearity (Years of Driving and General Compliance)
12
34
5
0 10 20 30 40 50Number of Years of Driving
Specific Compliance Fitted valueslowess Specific Compliance Years of Driving
Linearity (Years of Driving and Specific Compliance)
12
34
5
0 10 20 30 40 50Number of Years of Driving
Satisfaction Fitted valueslowess Satisfaction Years of Driving
Linearity (Years of Driving and Satisfaction)
12
34
5
0 10 20 30 40 50Number of Years of Driving
Perception of Police Fitted valueslowess Perception of Police Years of Driving
Linearity (Years of Driving and Perception of Police)

134
LIST OF TABLES
Table 1: Response Rate and Reasons for Rejection to Participate in the Survey
Response Rate Control group Experimental group Total
Respondents rejecting to participate in the survey 112 (25.6%) 124 (29.3%) 236 (27.4%)
Respondents participated in the survey 325 (74.4%) 299 (70.7%) 624 (72.6%)
Total number of respondents asked to participate in the survey 437 423 860
X2 (6) = 1.47 p = 0.226
Reasons for Rejection Control group Experimental group Total
Having appointment with someone or doctor 28 (25.0%) 31 (25.0%) 59 (25.0%)
Being late for work 23 (20.5%) 24 (19.4%) 47 (19.9%)
No time to participate in the survey 20 (17.9%) 23 (18.6%) 43 (18.2%)
Rejected politely 17 (15.2%) 21 (16.9%) 38 (16.1%)
Rejected without reason 13 (11.6%) 15 (12.1%) 28 (11.9%)
Rejected in an aggressive manner 5 (4.5%) 6 (4.8%) 11 (4.7%)
Rejected because of the traffic ticket 6 (5.4%) 4 (3.2%) 10 (4.2%)
X2 (6) = 0.83 p = 0.991

135
Table 2: Comparison of Demographic Characteristics of Traffic Police Officers
Traffic Police Officers NOT in the
Study (N=27)
Traffic Police Officers in the Study
(N=31)
Variable Attributes % or Mean (S.D.) % or Mean (S.D.) X2 or t p
Gender
Male 100 100
Marital Status
Married 100 100
Education Level 0.47 0.493
High School or less 7.41 12.9
More than high school 92.59 87.1
Birth of Province 1.09 0.297
Born in Eskisehir 14.81 6.45
Other 85.19 93.55
Rank 0.31 0.580
Police Officer 88.89 83.87
Sergeant 11.11 16.13
Age* 42.30&(6.24) 44.13&(5.13) 1.23 0.113
Years of Service* 18.26&(6.17) 20.68&(5.22) 1.62 0.056
Years of Service in Eskisehir* 4.93&(4.93) 5.97&(6.15) 0.70 0.242
Years of Service in Traffic* 14.26&(7.64) 14.29&(7.15) 0.02 0.494
*The values of Mean (S.D.) and t were reported.

136
Table 3: Comparison of Experimental Group with Control Group
Control Group (N=325)
Experimental Group (N=299)
Independent Variables % or Mean (S.D.) % or Mean (S.D.) X2 or t p0.391 0.532
Female 4.3 3.3Male 95.7 96.7
0.056 0.814Married 78.2 78.9Not Married 21.8 21.1
0.005 0.947Employed 83.1 83.3Not employed 16.9 16.7
0.740 0.39More than high school 34.2 37.5Less than High school or equevalent 65.8 62.5
2.240 0.134Born in Eskisehir 30.46 25.08Other 69.54 74.92
1.109 0.292City center 64.92 68.9Other 35.08 31.1
0.189 0.664Yes 58.15 59.87No 41.85 40.13
1.867 0.172Yes 33.54 38.8No 66.46 61.2
2.971 0.085Yes 82.77 77.26No 17.23 22.74
0.362 0.548Yes 7.08 8.36No 92.92 91.64
Income* 2477.65 (2293.82) 2618.64(2200.08) -0.77 0.444Years of driving* 17.22(10.76) 17.69(10.87) -0.55 0.582Age* 40.31 (11.37 ) 41.25 (12.11) -0.99 0.321
0.010 0.9199:00-11:30 56.92 56.5212:30-14:30 43.08 43.48
0.043 0.836Bursa 3 km 52 51.17Ankara 8 km 48 48.83
*The values of Mean (S.D.) and t were reported.
Location of traffic stop
Place of residence
Relational ties with police
Prior contact with police
Stopped by traffic police
Ticketed during the encounter
Time of traffic stop
Birth of Province
Gender
Marital Status
Employment status
Education Level

137
Table 4: Principal Component Analysis: Correlation Matrices
Variable (Procedural Justice) 1 2 3 4 5 6 71. Respectful treatment 12. Fair treatment 0.78 13. Rule based treatment 0.70 0.82 14. Equal treatment 0.53 0.61 0.69 15. Voicing views 0.55 0.59 0.58 0.60 16. Listening to driver 0.52 0.58 0.60 0.60 0.84 17. Trustworthiness 0.54 0.60 0.57 0.53 0.56 0.58 1
Variable (Traffic Police Legitimacy) 1 2 31. Respect for traffic police 12. Confidence in traffic police 0.70 13. Trust with traffic police 0.71 0.81 1
Variable (Police Legitimacy) 1 2 31. Respect for police 12. Confidence in police 0.80 13. Trust with police 0.80 0.86 1
Variable (Cooperation) 1 21. Willingness to assist police 12. Willingness to work with police 0.68 1
Variable (General Compliance) 1 21. Obeying traffic rules 12. Impact of the encounter on compliance with traffic rules 0.47 1
Correlation Matrices (N=624)

138
Table 5: Principal Component Analysis: Factor Loading, Cronbach’s Alpha, and Eigenvalue for Latent Variables (N=624)
Latent Variables Items Factor loading
Cronbach's alpha Eigenvalue
Procedural Justice --------- 0.87 4.721. Overall, the police officer was polite and treated me with respect during the interaction. 0.81 --------- ---------2. The police officer was fair when making the decision to stop me. 0.87 --------- ---------3. Overall, what police did was based on the rules. 0.87 --------- ---------4. I felt the police officer would do the same to anyone in my situation irrespective of his/her status. 0.79 --------- ---------5. The police officer gave me opportunity to express my views during the interaction. 0.82 --------- ---------6. The police officer listened to me during interaction. 0.82 --------- ---------7. I believe that what the police did is for my own safety. 0.75 --------- ---------
Traffic Police Legitimacy --------- 0.86 2.481. I respect for traffic police officers. 0.88 --------- ---------2. I have confidence in traffic police officers. 0.92 --------- ---------3. I trust traffic police officers. 0.93 --------- ---------
Police Legitimacy --------- 0.89 2.641. I respect for police. 0.92 --------- ---------2. I have confidence in police. 0.95 --------- ---------3. I trust police. 0.95 --------- ---------
Cooperation --------- 0.80 1.811. I am willingly to assist police if asked 0.95 --------- ---------2. I am willing to work with police to try to solve problems in my community. 0.95 --------- ---------
General Compliance --------- 0.64 1.571. I would obey the traffic rules. 0.89 --------- ---------2. This interaction would have positive impact on my future compliance with traffic rules. 0.89 --------- ---------

139
Table 6: Descriptive Statistics (N=624)
Variable Attributes % Mean (SD) Min Max
Group 0 1
Experimental Group 47.9 -------------
Control Group 52.1 -------------
Gender 0 1
Male 96.2 -------------
Female 3.8 -------------
Marital Status 0 1
Married 78.5 -------------
Not Married 21.5 -------------
Employment Status 0 1
Employed 83.2 -------------
Unemployed 16.8 -------------
Education Level 0 1
More than High School 35.7 -------------
High School or less 64.3 -------------
Birth of Province 0 1
Born in Eskisehir 27.9 -------------
Other 72.1 -------------
Place of Residence 0 1
City Center 66.8 -------------
Other 33.2 -------------
Relational Ties with Police 0 1
Yes 59.0 -------------No 41.0 -------------
Prior Contact with Police 0 1
Yes 36.1 -------------
No 63.9 -------------
Stopped by Traffic Police 0 1
Yes 80.1 -------------
No 19.9 -------------
Ticketed During the Encounter 0 1
Yes 7.7 -------------
No 92.3 -------------
Income* ------- 2545.3 (2248.54) 700 20,000
Age ------- 40.8 (11.73) 19 75
Years of Driving ------- 17.4 (10.81) 1 51
Procedural Justice ------- 5.27 (0.78) 1.93 6.08
Traffic Police Legitimacy ------- 4.46 (1.00) 1.1 5.5
Police Legitimacy ------- 4.31 (1.05) 1.06 5.32
Cooperation ------- 4.74 (0.81) 1.05 5.26
General Compliance ------- 4.80 (0.84) 1.13 5.65
Specific Compliance ------- 4.54 (0.64) 1 5
Satisfaction ------- 4.38 (0.72) 1 5Perception of Police ------- 4.21 (0.87) 1 5*N=598

140
Table 7: Results of the Independent Samples t-Tests (N=624)
Dependent Variable Mean S.D. S.E. Mean S.D. S.E. Mean Diff. t p Cohen's d
Procedural Justice 4.93 0.77 0.04 5.65 0.60 0.04 -0.72 -12.90 0.000 1.03
Traffic Police Legitimacy 4.34 0.96 0.05 4.60 1.04 0.60 -0.25 -3.19 0.002 0.26
Police Legitimacy 4.22 1.04 0.06 4.41 1.05 0.06 -0.19 -2.30 0.022 0.18
General Compliance 4.66 0.86 0.05 4.95 0.80 0.05 -0.29 -4.42 0.000 0.35
Specific Compliance 4.27 0.69 0.04 4.82 0.45 0.03 -0.55 -11.73 0.000 0.94
Cooperation 4.62 0.79 0.04 4.88 0.80 0.05 -0.26 -4.08 0.000 0.33
Satisfaction 4.04 0.68 0.04 4.74 0.56 0.03 -0.71 -14.04 0.000 1.12
Perception of Police 3.98 0.86 0.05 4.46 0.82 0.05 -0.47 -7.02 0.000 0.56
Note: 1- df (degree of freedom)=622
2- A Cohen’s d of 0.20 to 0.49 is a small effect, 0.50 to 0.79 is a medium effect, and over 0.80 is a large effect.
Control Group Experimental Group(n=325) (n=299)

141
Table 8: Bivariate Correlations among the 14 independent variables (N=624)
Variables 1 2 3 4 5 6 7 8 9 10 11 12 13 14
1. Group 1
2. Gender 0.02 1
3. Marital status 0.01 0.20 1
4. Employment status 0.01 0.08 -0.08 1
5. logIncome 0.06 -0.05 0.001 0.19 1
6. Education level 0.03 -0.17 -0.13 0.10 0.32 1
7. Age 0.04 0.06 0.39 -0.49 0.01 -0.15 1
8. Birth of province -0.06 -0.03 -0.04 -0.09 -0.09 0.01 0.004 1
9. Place of residence 0.05 -0.07 -0.05 0.07 0.19 0.23 0.01 0.002 1
10. Relational ties with police 0.01 0.04 0.01 0.01 0.00 -0.05 0.02 -0.05 0.01 1
11. Prior contact with police 0.05 0.01 -0.07 0.09 0.13 0.11 -0.11 -0.09 0.07 0.20 1
12. Years of Driving 0.02 0.12 0.33 -0.36 0.05 -0.14 0.82 -0.02 0.04 0.04 -0.04 1
13. Stopped by traffic police -0.06 0.01 0.02 0.21 0.08 0.06 -0.18 -0.03 0.02 0.05 0.09 -0.11 1
14. Ticketed during the encounter 0.03 0.02 0.03 0.05 0.04 -0.04 -0.03 -0.06 0.05 -0.004 0.004 -0.03 -0.12 1

142
Table 9: VIF Table for Multicollinearity (N=624)
Variables VIF1/VIF
(Tolerance)
Age 3.84 0.26
Years of Driving 3.16 0.32
Employment status 1.44 0.69
logIncome 1.36 0.73
Education level 1.35 0.74
Marital status 1.26 0.79
Prior contact with police 1.10 0.91
Place of residence 1.10 0.91
Stopped by traffic police 1.10 0.91
Gender 1.10 0.91
Relational ties with police 1.05 0.95
Ticketed during the encounter 1.04 0.97
Birth of province 1.03 0.97
Group 1.02 0.98
Mean VIF: 1.50

143
Table 10:Numerical tests for Normality, Heteroskedasticity, and Model Specification
Dependent Variable W V z p Chi2 p F p
Procedural Justice 0.92 32.77 8.46 0.000 19.31 0.000 0.03 0.994
Traffic Police Legitimacy 0.91 33.78 8.53 0.000 10.14 0.001 0.29 0.834
Police Legitimacy 0.92 33.07 8.48 0.000 5.11 0.024 0.41 0.745
Cooperation 0.79 83.92 10.73 0.000 22.33 0.000 1.05 0.369
General Compliance 0.93 27.18 8.00 0.000 21.99 0.000 0.24 0.866
Specific Compliance 0.86 57.33 9.81 0.000 42.11 0.000 2.00 0.114
Satisfaction 0.84 61.35 9.98 0.000 24.27 0.000 0.48 0.697
Perception of Police 0.88 47.77 9.37 0.000 3.36 0.067 0.40 0.750
N=598 Ho: Normally distributed Ho: Constant variance Ho: No omitted variables
Shapiro-Wilk W test for Normal Data
Breusch-Pagan / Cook-Weisberg test for
Heteroskedasticity Ramsey RESET test for
Model Specification

144
Table 11: Results of Regression Tests for Model 1: Procedural Justice
Variable b Std. Err. t b Robust Std. Err. t b Std. Err. t b Std. Err. t b Std. Err. t
Experimental Group 0.69 0.06*** 12.46 0.69 0.05*** 12.72 0.72 0.05*** 15.23 0.98 0.05*** 20.50 0.77 0.06*** 12.65
Male -0.14 0.15 -0.96 -0.14 0.13 -1.10 0.00 0.13 0.00 0.13 0.13 1.02 -0.17 0.17 -1.02
Married 0.05 0.07 0.70 0.05 0.08 0.67 0.02 0.06 0.32 0.01 0.06 0.14 0.05 0.08 0.62
Employed -0.04 0.08 -0.52 -0.04 0.08 -0.57 -0.04 0.07 -0.62 -0.05 0.07 -0.68 -0.04 0.10 -0.42
LogIncome 0.09 0.05 1.81 0.09 0.05 1.86 0.07 0.04 1.59 0.04 0.04 0.97 0.11 0.06 1.76
More than high school -0.02 0.07 -0.36 -0.02 0.07 -0.34 0.02 0.06 0.42 0.04 0.06 0.68 -0.04 0.08 -0.45
Born in Eskisehir 0.06 0.06 0.94 0.06 0.06 0.93 0.06 0.05 1.10 0.01 0.05 0.25 0.07 0.07 1.03
City center resident -0.02 0.06 -0.31 -0.02 0.06 -0.31 0.01 0.05 0.14 0.05 0.05 0.96 -0.03 0.07 -0.41
Relational ties with police 0.00 0.06 0.02 0.00 0.06 0.02 -0.02 0.05 -0.32 -0.03 0.05 -0.61 0.00 0.06 0.06
Prior contact with police -0.09 0.06 -1.44 -0.09 0.06 -1.39 -0.10 0.05* -2.05 -0.03 0.05 -0.60 -0.10 0.07 -1.50
Years of Driving 0.00 0.00 1.64 0.00 0.00 1.76 0.00 0.00 0.73 0.00 0.00 -0.07 0.01 0.00 1.51
Stopped by traffic police -0.09 0.07 -1.28 -0.09 0.07 -1.28 -0.09 0.06 -1.53 -0.11 0.06 -1.77 -0.10 0.08 -1.20
Ticketed during the encounter -0.16 0.11 -1.47 -0.16 0.11 -1.49 -0.20 0.09* -2.14 -0.16 0.09 -1.70 -0.18 0.12 -1.52
Constant 4.40 4.40 4.58 4.58 4.28
*p< .05, **p< .01, ***p< .001
Dependent variable: Procedural Justice F( 13, 584) = 13.52 F( 13, 584) = 15.40 F( 13, 584) = 19.55 Pseudo R2 = 0.2395 F( 13, 584) = 13.99
N=598 Prob > F = 0.000 Prob > F = 0.000 Prob > F = 0.000 Prob > F = 0.000
R-squared = 0.2313 R-squared = 0.2313 R-squared = 0.257
Regression with Robust Standard ErrorOLS Regression Robust Regression Quantile Regression
Regression with Measurement Error

145
Table 12: Results of Regression Tests for Model 2: Traffic Police Legitimacy
Variable b Std. Err. t b Robust Std. Err. t b Std. Err. t b Std. Err. t b Std. Err. t
Experimental Group 0.24 0.08*** 3.04 0.24 0.08*** 3.06 0.32 0.07*** 4.48 0.38 0.09*** 4.12 0.27 0.09*** 3.06
Male -0.002 0.22 -0.01 -0.002 0.20 -0.01 0.04 0.19 0.19 0.03 0.25 0.11 -0.005 0.25 -0.02
Married 0.21 0.11* 1.99 0.21 0.12 1.86 0.17 0.10 1.76 0.09 0.12 0.70 0.25 0.12* 1.97
Employed -0.13 0.12 -1.07 -0.13 0.11 -1.15 -0.13 0.11 -1.20 -0.10 0.14 -0.70 -0.13 0.15 -0.93
LogIncome -0.13 0.08 -1.69 -0.13 0.08 -1.63 -0.07 0.07 -1.02 -0.02 0.09 -0.19 -0.15 0.09 -1.65
More than high school 0.09 0.10 0.96 0.09 0.10 0.95 -0.04 0.09 -0.47 -0.06 0.11 -0.54 0.12 0.12 1.05
Born in Eskisehir 0.15 0.09 1.69 0.15 0.08 1.81 0.13 0.08 1.66 0.12 0.10 1.13 0.17 0.10 1.66
City center resident -0.04 0.09 -0.46 -0.04 0.09 -0.45 -0.04 0.08 -0.53 -0.05 0.10 -0.46 -0.04 0.10 -0.43
Relational ties with police -0.02 0.08 -0.22 -0.02 0.08 -0.22 0.004 0.07 0.05 0.06 0.09 0.62 -0.02 0.09 -0.17
Prior contact with police -0.11 0.09 -1.26 -0.11 0.09 -1.22 -0.09 0.08 -1.23 -0.04 0.10 -0.42 -0.12 0.10 -1.19
Years of Driving 0.001 0.004 0.31 0.001 0.004 0.33 0.002 0.004 0.39 0.01 0.005 1.13 0.001 0.01 0.22
Stopped by traffic police -0.21 0.10* -2.01 -0.21 0.09* -2.29 -0.17 0.09 -1.84 -0.16 0.12 -1.30 -0.23 0.12 -1.94
Ticketed during the encounter 0.02 0.16 0.10 0.02 0.15 0.11 -0.07 0.14 -0.47 -0.05 0.18 -0.27 0.02 0.18 0.09
Constant 5.43 5.43 5.05 4.59 5.57
*p< .05, **p< .01, ***p< .001
Dependent variable: Traffic Police Legitimacy F( 13, 584) = 2.59 F( 13, 584) = 3.04 F( 13, 584) = 3.34 Pseudo R2 = 0.0456 F( 13, 584) = 2.61
N=598 Prob > F = 0.002 Prob > F = 0.000 Prob > F = 0.000 Prob > F = 0.002
R-squared = 0.0546 R-squared = 0.0546 R-squared = 0.0601
Regression with Robust Standard Error Robust Regression Quantile Regression
Regression with Measurement ErrorOLS Regression

146
Table 13: Results of Regression Tests for Model 3: Police Legitimacy
Variable b Std. Err. t b Robust Std. Err. t b Std. Err. t b Std. Err. t b Std. Err. t
Experimental Group 0.21 0.08** 2.47 0.21 0.08** 2.49 0.24 0.08** 3.09 0.33 0.11** 3.03 0.24 0.09** 2.49
Male -0.08 0.23 -0.35 -0.08 0.21 -0.39 0.02 0.21 0.11 0.02 0.30 0.07 -0.11 0.26 -0.41
Married 0.29 0.11** 2.54 0.29 0.12* 2.31 0.23 0.10* 2.23 0.25 0.15 1.72 0.33 0.13** 2.51
Employed -0.05 0.13 -0.38 -0.05 0.13 -0.38 -0.12 0.12 -0.99 -0.09 0.17 -0.55 -0.05 0.15 -0.33
LogIncome -0.02 0.08 -0.25 -0.02 0.08 -0.26 -0.01 0.07 -0.12 0.07 0.10 0.66 -0.01 0.10 -0.12
More than high school -0.07 0.10 -0.71 -0.07 0.10 -0.73 -0.17 0.09 -1.84 -0.29 0.13* -2.20 -0.08 0.12 -0.64
Born in Eskisehir 0.15 0.10 1.56 0.15 0.09 1.67 0.09 0.09 1.05 0.17 0.12 1.40 0.17 0.11 1.56
City center resident -0.18 0.09 -1.93 -0.18 0.09 -1.96 -0.19 0.09* -2.21 -0.21 0.12 -1.74 -0.20 0.11 -1.88
Relational ties with police 0.07 0.09 0.84 0.07 0.09 0.85 0.09 0.08 1.10 0.19 0.11 1.70 0.09 0.10 0.92
Prior contact with police -0.26 0.09** -2.84 -0.26 0.09** -2.81 -0.25 0.08** -2.93 -0.29 0.12** -2.46 -0.29 0.10** -2.80
Years of Driving -0.002 0.005 -0.48 -0.002 0.004 -0.49 -0.001 0.004 -0.28 -0.003 0.01 -0.50 -0.003 0.01 -0.57
Stopped by traffic police -0.15 0.11 -1.35 -0.15 0.11 -1.39 -0.15 0.10 -1.47 -0.21 0.14 -1.47 -0.17 0.13 -1.33
Ticketed during the encounter -0.14 0.17 -0.84 -0.14 0.15 -0.91 -0.23 0.15 -1.54 -0.21 0.21 -0.99 -0.16 0.19 -0.86
Constant 4.58 4.58 4.66 4.13 0.79 5.21 4.54
*p< .05, **p< .01, ***p< .001
Dependent variable: Police Legitimacy F( 13, 584) = 2.83 F( 13, 584) = 3.23 F( 13, 584) = 3.95 Pseudo R2 = 0.0570 F( 13, 584) = 2.85
N=598 Prob > F = 0.001 Prob > F = 0.000 Prob > F = 0.000 Prob > F = 0.001
R-squared = 0.0593 R-squared = 0.0593 R-squared = 0.0655
OLS RegressionRegression with
Robust Standard Error Robust Regression Quantile RegressionRegression with
Measurement Error
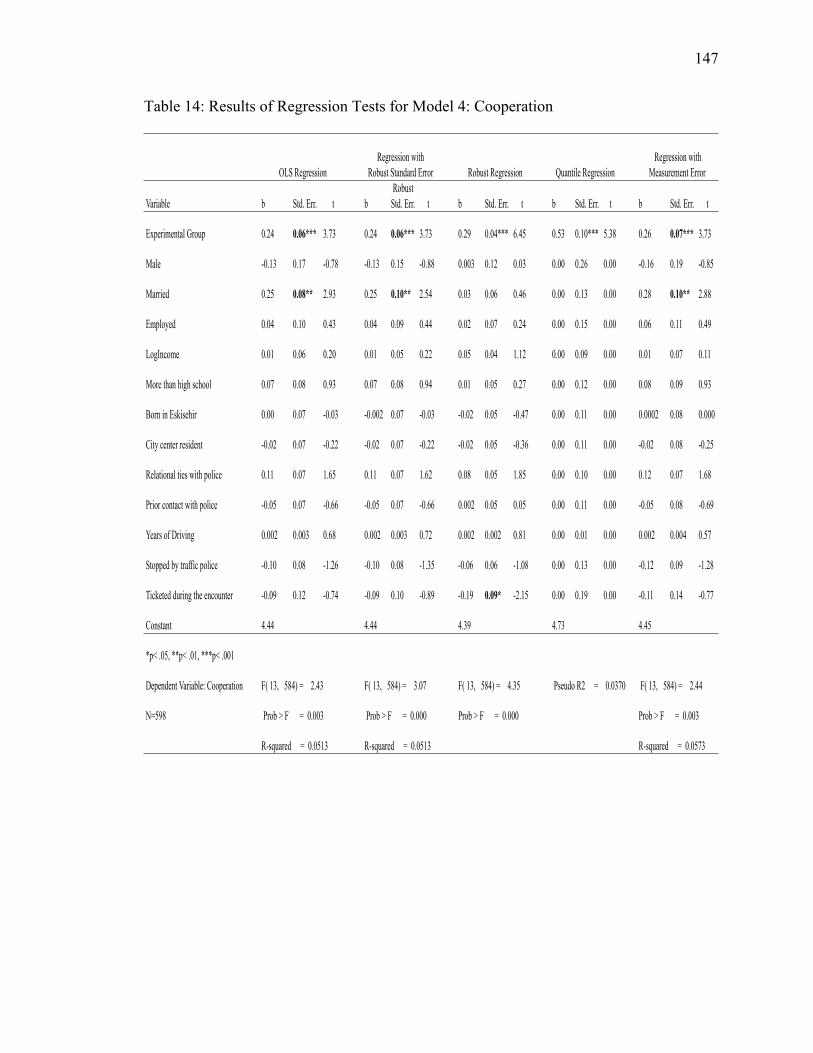
147
Table 14: Results of Regression Tests for Model 4: Cooperation
Variable b Std. Err. t b Robust Std. Err. t b Std. Err. t b Std. Err. t b Std. Err. t
Experimental Group 0.24 0.06*** 3.73 0.24 0.06*** 3.73 0.29 0.04*** 6.45 0.53 0.10*** 5.38 0.26 0.07*** 3.73
Male -0.13 0.17 -0.78 -0.13 0.15 -0.88 0.003 0.12 0.03 0.00 0.26 0.00 -0.16 0.19 -0.85
Married 0.25 0.08** 2.93 0.25 0.10** 2.54 0.03 0.06 0.46 0.00 0.13 0.00 0.28 0.10** 2.88
Employed 0.04 0.10 0.43 0.04 0.09 0.44 0.02 0.07 0.24 0.00 0.15 0.00 0.06 0.11 0.49
LogIncome 0.01 0.06 0.20 0.01 0.05 0.22 0.05 0.04 1.12 0.00 0.09 0.00 0.01 0.07 0.11
More than high school 0.07 0.08 0.93 0.07 0.08 0.94 0.01 0.05 0.27 0.00 0.12 0.00 0.08 0.09 0.93
Born in Eskisehir 0.00 0.07 -0.03 -0.002 0.07 -0.03 -0.02 0.05 -0.47 0.00 0.11 0.00 0.0002 0.08 0.000
City center resident -0.02 0.07 -0.22 -0.02 0.07 -0.22 -0.02 0.05 -0.36 0.00 0.11 0.00 -0.02 0.08 -0.25
Relational ties with police 0.11 0.07 1.65 0.11 0.07 1.62 0.08 0.05 1.85 0.00 0.10 0.00 0.12 0.07 1.68
Prior contact with police -0.05 0.07 -0.66 -0.05 0.07 -0.66 0.002 0.05 0.05 0.00 0.11 0.00 -0.05 0.08 -0.69
Years of Driving 0.002 0.003 0.68 0.002 0.003 0.72 0.002 0.002 0.81 0.00 0.01 0.00 0.002 0.004 0.57
Stopped by traffic police -0.10 0.08 -1.26 -0.10 0.08 -1.35 -0.06 0.06 -1.08 0.00 0.13 0.00 -0.12 0.09 -1.28
Ticketed during the encounter -0.09 0.12 -0.74 -0.09 0.10 -0.89 -0.19 0.09* -2.15 0.00 0.19 0.00 -0.11 0.14 -0.77
Constant 4.44 4.44 4.39 4.73 4.45
*p< .05, **p< .01, ***p< .001
Dependent Variable: Cooperation F( 13, 584) = 2.43 F( 13, 584) = 3.07 F( 13, 584) = 4.35 Pseudo R2 = 0.0370 F( 13, 584) = 2.44
N=598 Prob > F = 0.003 Prob > F = 0.000 Prob > F = 0.000 Prob > F = 0.003
R-squared = 0.0513 R-squared = 0.0513 R-squared = 0.0573
Regression with Measurement ErrorQuantile RegressionOLS Regression
Regression with Robust Standard Error Robust Regression

148
Table 15: Results of Regression Tests for Model 5: General Compliance
Variable b Std. Err. t b Robust Std. Err. t b Std. Err. t b Std. Err. t b Std. Err. t
Experimental Group 0.28 0.06*** 4.34 0.28 0.06*** 4.37 0.30 0.06*** 4.90 0.56 0.10*** 5.94 0.31 0.07*** 4.35
Male -0.22 0.17 -1.27 -0.22 0.15 -1.46 -0.13 0.16 -0.83 0.00 0.26 0.00 -0.25 0.20 -1.26
Married 0.23 0.09** 2.66 0.23 0.10* 2.35 0.14 0.08 1.69 0.00 0.13 0.00 0.27 0.10** 2.67
Employed -0.19 0.10 -1.92 -0.19 0.08* -2.31 -0.15 0.09 -1.59 -0.56 0.15*** -3.89 -0.21 0.12 -1.76
LogIncome -0.05 0.06 -0.90 -0.05 0.06 -0.93 -0.05 0.06 -0.84 0.00 0.09 0.00 -0.07 0.07 -0.90
More than high school 0.09 0.08 1.14 0.09 0.08 1.13 0.09 0.07 1.20 0.00 0.11 0.00 0.11 0.09 1.15
Born in Eskisehir 0.01 0.07 0.17 0.01 0.07 0.18 -0.003 0.07 -0.04 0.00 0.11 0.00 0.01 0.08 0.14
City center resident -0.01 0.07 -0.10 -0.01 0.07 -0.10 0.003 0.07 0.04 0.00 0.11 0.00 -0.01 0.08 -0.08
Relational ties with police -0.01 0.07 -0.10 -0.01 0.07 -0.10 0.01 0.06 0.10 0.00 0.10 0.00 -0.005 0.07 -0.07
Prior contact with police -0.04 0.07 -0.51 -0.04 0.07 -0.51 -0.07 0.06 -1.03 0.00 0.10 0.00 -0.04 0.08 -0.47
Years of Driving 0.001 0.003 0.21 0.001 0.003 0.22 0.001 0.003 0.17 0.00 0.01 0.00 0.0001 0.004 0.02
Stopped by traffic police -0.18 0.08* -2.13 -0.18 0.08* -2.38 -0.17 0.08* -2.22 0.00 0.12 0.00 -0.20 0.10* -2.10
Ticketed during the encounter -0.26 0.13* -2.08 -0.26 0.14 -1.86 -0.21 0.12 -1.74 0.00 0.19 0.00 -0.30 0.14* -2.11
Constant 5.42 5.42 5.38 5.08 5.53
*p< .05, **p< .01, ***p< .001
Dependent variable: General Compliance F( 13, 584) = 3.69 F( 13, 584) = 4.62 F( 13, 584) = 3.51 Pseudo R2 = 0.0788 F( 13, 584) = 3.72
N=598 Prob > F = 0.000 Prob > F = 0.000 Prob > F = 0.000 Prob > F = 0.000
R-squared = 0.0758 R-squared = 0.0758 R-squared = 0.0841
OLS RegressionRegression with
Robust Standard Error Robust Regression Quantile RegressionRegression with
Measurement Error

149
Table 16: Results of Regression Tests for Model 6: Specific Compliance
Variable b Std. Err. t b Robust Std. Err. t b Std. Err. t b Std. Err. t
Experimental Group 0.51 0.05*** 11.00 0.51 0.05*** 11.20 0.54 0.04*** 13.96 0.57 0.05*** 11.12
Male -0.10 0.13 -0.83 -0.10 0.10 -1.00 -0.03 0.10 -0.32 -0.12 0.14 -0.83
Married 0.08 0.06 1.24 0.08 0.06 1.20 0.03 0.05 0.56 0.09 0.07 1.25
Employed -0.05 0.07 -0.64 -0.05 0.06 -0.74 -0.03 0.06 -0.57 -0.05 0.08 -0.62
LogIncome 0.06 0.04 1.33 0.06 0.04 1.55 0.06 0.04 1.68 0.06 0.05 1.14
More than high school 0.12 0.06* 2.22 0.12 0.05** 2.45 0.11 0.05* 2.35 0.14 0.07* 2.10
Born in Eskisehir -0.05 0.05 -0.96 -0.05 0.06 -0.84 0.02 0.04 0.41 -0.05 0.06 -0.93
City center resident -0.01 0.05 -0.22 -0.01 0.05 -0.22 -0.03 0.04 -0.67 -0.02 0.06 -0.32
Relational ties with police 0.05 0.05 1.00 0.05 0.05 0.94 0.05 0.04 1.16 0.06 0.05 1.05
Prior contact with police -0.05 0.05 -0.95 -0.05 0.05 -0.99 -0.07 0.04 -1.75 -0.06 0.06 -1.04
Years of Driving 0.0002 0.002 0.07 0.0002 0.003 0.07 -0.0005 0.002 -0.25 -0.00002 0.003 -0.01
Stopped by traffic police -0.05 0.06 -0.84 -0.05 0.06 -0.80 -0.08 0.05 -1.66 -0.05 0.07 -0.78
Ticketed during the encounter -0.08 0.09 -0.83 -0.08 0.07 -1.13 -0.11 0.08 -1.45 -0.09 0.10 -0.86
Constant 3.94 3.94 3.97 3.92
*p< .05, **p< .01, ***p< .001
Dependent variable: Specific Compliance F( 13, 584) = 11.07 F( 13, 584) = 13.45 F( 13, 584) = 17.08 F( 13, 584) = 11.37
N=598 Prob > F = 0.000 Prob > F = 0.000 Prob > F = 0.000 Prob > F = 0.000
R-squared = 0.1977 R-squared = 0.1977 R-squared = 0.2190Note: Quantile regression did not produce results.
OLS RegressionRegression with
Robust Standard Error Robust RegressionRegression with
Measurement Error

150
Table 17: Results of Regression Tests for Model 7: Satisfaction
Variable b Std. Err. t b Robust Std. Err. t b Std. Err. t
Experimental Group 0.68 0.05*** 13.60 0.68 0.05*** 14.05 0.76 0.06*** 13.84
Male -0.15 0.14 -1.08 -0.15 0.14 -1.08 -0.17 0.15 -1.15
Married 0.14 0.07* 2.03 0.14 0.08 1.77 0.15 0.08* 1.99
Employed -0.06 0.08 -0.72 -0.06 0.07 -0.85 -0.06 0.09 -0.66
LogIncome 0.01 0.05 0.27 0.01 0.05 0.25 0.01 0.06 0.21
More than high school 0.0003 0.06 0.00 0.0003 0.06 0.00 0.0008 0.07 0.01
Born in Eskisehir -0.08 0.06 -1.46 -0.08 0.06 -1.31 -0.09 0.06 -1.41
City center resident 0.003 0.06 0.06 0.003 0.06 0.06 0.001 0.06 0.01
Relational ties with police -0.01 0.05 -0.10 -0.01 0.05 -0.10 -0.004 0.06 -0.07
Prior contact with police -0.09 0.05 -1.66 -0.09 0.05 -1.67 -0.10 0.06 -1.72
Years of Driving 0.002 0.003 0.89 0.002 0.002 1.06 0.002 0.003 0.75
Stopped by traffic police -0.04 0.07 -0.63 -0.04 0.06 -0.67 -0.04 0.07 -0.51
Ticketed during the encounter 0.005 0.10 0.05 0.005 0.08 0.06 0.001 0.11 0.01
Constant 4.09 4.09 4.08
*p< .05, **p< .01, ***p< .001
Dependent variable: Satsisfaction F( 13, 584) = 15.79 F( 13, 584) = 18.86 F( 13, 584) = 16.42
N=598 Prob > F = 0.000 Prob > F = 0.000 Prob > F = 0.000
R-squared = 0.2600 R-squared = 0.2600 R-squared = 0.2884
Note: Robust regression and quantile regression did not produce any results.
In robust regression, all weights went to zero.
In quantile regresion, VCE computation failed.
OLS RegressionRegression with
Robust Standard ErrorRegression with
Measurement Error

151
Table 18: Results of Regression Tests for Model 8: Perception of Police
Variable b Std. Err. t b Robust Std. Err. t b Std. Err. t b Std. Err. t b Std. Err. t
Experimental Group 0.47 0.07*** 6.89 0.47 0.07*** 6.99 0.49 0.05*** 9.14 1.00 0.01*** 77.80 0.53 0.08*** 6.92
Male -0.15 0.19 -0.83 -0.15 0.13 -1.15 0.02 0.15 0.17 0.00 0.03 0.00 -0.17 0.21 -0.82
Married 0.12 0.09 1.34 0.12 0.10 1.20 0.01 0.07 0.09 0.00 0.02 0.00 0.14 0.11 1.36
Employed -0.13 0.10 -1.19 -0.13 0.10 -1.29 -0.06 0.08 -0.70 0.00 0.02 0.00 -0.15 0.12 -1.18
LogIncome 0.03 0.06 0.53 0.03 0.06 0.53 0.12 0.05* 2.34 0.00 0.01 0.00 0.04 0.08 0.52
More than high school 0.04 0.08 0.52 0.04 0.08 0.52 0.02 0.06 0.29 0.00 0.02 0.00 0.05 0.10 0.47
Born in Eskisehir -0.04 0.08 -0.53 -0.04 0.08 -0.51 0.04 0.06 0.64 0.00 0.01 0.00 -0.04 0.09 -0.52
City center resident -0.06 0.08 -0.79 -0.06 0.08 -0.79 -0.10 0.06 -1.71 0.00 0.01 0.00 -0.07 0.09 -0.80
Relational ties with police 0.03 0.07 0.39 0.03 0.07 0.38 0.02 0.06 0.43 0.00 0.01 0.00 0.03 0.08 0.42
Prior contact with police -0.08 0.07 -1.06 -0.08 0.08 -1.03 -0.05 0.06 -0.79 0.00 0.01 0.00 -0.09 0.08 -1.09
Years of Driving -0.002 0.004 -0.66 -0.002 0.003 -0.75 0.001 0.003 0.32 0.000 0.001 0.00 -0.003 0.004 -0.75
Stopped by traffic police -0.04 0.09 -0.47 -0.04 0.08 -0.50 0.01 0.07 0.08 0.00 0.02 0.00 -0.04 0.10 -0.43
Ticketed during the encounter -0.20 0.13 -1.46 -0.20 0.12 -1.59 -0.25 0.11* -2.35 0.00 0.03 0.00 -0.22 0.15 -1.48
Constant 4.03 4.03 3.29 4.00 4.00
*p< .05, **p< .01, ***p< .001
Dependent variable: Perception of Police F( 13, 584) = 4.35 F( 13, 584) = 5.10 F( 13, 584) = 7.66 Pseudo R2 = 0.1796 F( 13, 584) = 4.40
N=598 Prob > F = 0.000 Prob > F = 0.000 Prob > F = 0.000 Prob > F = 0.000
R-squared = 0.0882 R-squared = 0.0882 R-squared = 0.0986
Regression with Measurement ErrorOLS Regression
Regression with Robust Standard Error Robust Regression Quantile Regression

152
Table 19: The effects of BWCs on the Intervening Variables
Variable b Robust Std. Err. t b
Robust Std. Err. t b
Robust Std. Err. t
Experimental Group 0.69 0.05*** 12.72 0.24 0.08*** 3.06 0.21 0.08** 2.49
Male -0.14 0.13 -1.10 -0.002 0.20 -0.01 -0.08 0.21 -0.39
Married 0.05 0.08 0.67 0.21 0.12 1.86 0.29 0.12* 2.31
Employed -0.04 0.08 -0.57 -0.13 0.11 -1.15 -0.05 0.13 -0.38
LogIncome 0.09 0.05 1.86 -0.13 0.08 -1.63 -0.02 0.08 -0.26
More than high school -0.02 0.07 -0.34 0.09 0.10 0.95 -0.07 0.10 -0.73
Born in Eskisehir 0.06 0.06 0.93 0.15 0.08 1.81 0.15 0.09 1.67
City center resident -0.02 0.06 -0.31 -0.04 0.09 -0.45 -0.18 0.09 -1.96
Relational ties with police 0.00 0.06 0.02 -0.02 0.08 -0.22 0.07 0.09 0.85
Prior contact with police -0.09 0.06 -1.39 -0.11 0.09 -1.22 -0.26 0.09** -2.81
Years of Driving 0.005 0.003 1.76 0.001 0.004 0.33 -0.002 0.004 -0.49
Stopped by traffic police -0.09 0.07 -1.28 -0.21 0.09* -2.29 -0.15 0.11 -1.39
Ticketed during the encounter -0.16 0.11 -1.49 0.02 0.15 0.11 -0.14 0.15 -0.91
Constant 4.40 5.43 4.58
*p< .05, **p< .01, ***p< .001 DV: Procedural Justice DV: Traffic Police Legitimacy DV: Police Legitimacy
N= 598 F( 13, 584) =15.40 F( 13, 584) = 3.04 F( 13, 584) = 3.23
Prob > F = 0.000 Prob > F = 0.000 Prob > F = 0.000
R-squared = 0.2313 R-squared = 0.0546 R-squared = 0.0593
Note: DV is dependent variable.

153
Table 20: VIF table for Collinearity for Mediation Analyses
Variables VIF 1/VIF
Traffic Police Legitimacy 1.84 0.54
Police Legitimacy 1.68 0.59
Procedural Justice 1.60 0.63
LogIncome 1.39 0.72
More than high school 1.35 0.74
Years of Driving 1.35 0.74
Experimental Group 1.28 0.78
Employed 1.28 0.78
Married 1.19 0.84
City center resident 1.11 0.90
Prior contact with police 1.11 0.90
Stopped by traffic police 1.10 0.91
Male 1.10 0.91
Relational ties with police 1.05 0.95
Born in Eskisehir 1.04 0.96
Ticketed during the encounter 1.04 0.96
Mean VIF 1.28

154
Table 21: The effect of BWCs on the Distal Outcomes
Variable b Robust Std. Err. t b
Robust Std. Err. t b
Robust Std. Err. t b
Robust Std. Err. t b
Robust Std. Err. t
Experimental Group 0.04 0.06 0.72 0.22 0.05*** 4.22 -0.01 0.06 -0.17 0.09 0.07 1.38 0.31 0.05*** 6.18
Procedural Justice 0.22 0.06*** 3.66 0.43 0.05*** 8.17 0.23 0.06*** 3.77 0.46 0.06*** 8.11 0.52 0.05*** 10.97
TrafficPoliceLegitimacy 0.29 0.06*** 4.99 -0.03 0.02 -1.34 0.28 0.07*** 4.21 0.12 0.05** 2.55 0.00 0.03 -0.07
Police Legitimacy 0.06 0.05 1.32 0.01 0.02 0.66 0.09 0.05 1.59 0.16 0.04*** 3.67 0.04 0.03 1.63
Male -0.18 0.12 -1.50 -0.04 0.08 -0.45 -0.09 0.13 -0.67 -0.07 0.12 -0.58 -0.06 0.11 -0.55
Married 0.14 0.08 1.77 0.06 0.05 1.04 0.15 0.08 1.95 0.03 0.08 0.32 0.09 0.06 1.55
Employed -0.14 0.08 -1.72 -0.03 0.06 -0.54 0.09 0.08 1.12 -0.08 0.09 -0.87 -0.03 0.06 -0.53
LogIncome -0.04 0.05 -0.68 0.02 0.04 0.40 0.03 0.05 0.58 0.01 0.05 0.19 -0.03 0.04 -0.82
More than high school 0.07 0.07 1.10 0.14 0.05** 3.05 0.06 0.06 0.92 0.06 0.07 0.83 0.02 0.05 0.40
Born in Eskisehir -0.05 0.05 -0.98 -0.07 0.05 -1.41 -0.07 0.06 -1.26 -0.11 0.06 -1.66 -0.12 0.05* -2.54
City center resident 0.02 0.06 0.34 -0.003 0.04 -0.06 0.02 0.06 0.28 -0.02 0.06 -0.30 0.02 0.04 0.48
Relational ties with police -0.01 0.06 -0.09 0.05 0.04 1.09 0.11 0.06 1.95 0.02 0.06 0.32 -0.01 0.04 -0.18
Prior contact with police 0.03 0.06 0.49 -0.01 0.04 -0.31 0.03 0.06 0.40 0.01 0.06 0.20 -0.04 0.04 -0.84
Years of Driving -0.001 0.003 -0.24 -0.002 0.002 -0.83 0.0009 0.003 0.36 -0.005 0.003 -1.66 -0.0002 0.002 -0.08
Stopped by traffic police -0.09 0.07 -1.34 -0.02 0.05 -0.28 -0.01 0.07 -0.17 0.05 0.07 0.74 0.01 0.05 0.29
Ticketed during the encounter -0.23 0.12 -1.87 -0.01 0.07 -0.10 -0.05 0.10 -0.50 -0.10 0.11 -0.95 0.09 0.08 1.22
Constant 2.60 2.17 1.52 0.65 1.60
*p<.05, **p< .01, ***p< .001 DV: General Compliance DV: Specific Compliance DV: Cooperation DV: Perception of Police DV:Satisfaction
F( 17, 580) = 12.00 F( 16, 581) = 18.83 F( 16, 581) = 9.98 F( 16, 581) = 20.33 F(16,581)=34.02
Prob>F=0.000 Prob>F=0.000 Prob>F=0.000 Prob>F=0.000 Prob>F=0.000
R-squared = 0.3356 R-squared = 0.4071 R-squared = 0.3444 R-squared = 0.3891 R-squared=0.5463
Notes: 1- DV is dependent variable.
2-Theinterveningvariablesareproceduraljustice,trafficpolicelegitimacy,andpolicelegitimacy.

155
Table 22: The Effect of BWCs on Police (Traffic) Legitimacy when Controlling for Procedural Justice
Variable b Robust Std. Err. t b
Robust Std. Err. t
Experimental Group -0.18 0.08* -2.22 -0.14 0.09 -1.49
Procedural Justice 0.62 0.06*** 10.04 0.50 0.07*** 7.08
Male 0.09 0.21 0.42 -0.01 0.20 -0.05
Married 0.18 0.10 1.79 0.26 0.11* 2.29
Employed -0.10 0.10 -1.02 -0.03 0.12 -0.22
LogIncome -0.19 0.07** -2.54 -0.07 0.07 -0.90
More than high school 0.11 0.09 1.24 -0.06 0.09 -0.64
Born in Eskisehir 0.12 0.07 1.57 0.12 0.08 1.43
City center resident -0.03 0.08 -0.35 -0.17 0.09 -1.96
Relational ties with police -0.02 0.07 -0.26 0.07 0.08 0.91
Prior contact with police -0.06 0.08 -0.69 -0.22 0.09* -2.44
Years of Driving -0.002 0.004 -0.45 -0.005 0.004 -1.08
Stopped by traffic police -0.15 0.08 -1.81 -0.10 0.10 -1.02
Ticketed during the encounter 0.11 0.14 0.81 -0.06 0.16 -0.38
Constant 2.71 2.40
*p<.05, **p< .01, ***p< .001 DV: Traffic Police Legitimacy DV: Police Legitimacy
F( 14, 583) = 12.06 F( 14, 583) = 7.66
Prob > F = 0.000 Prob > F = 0.000
R-squared = 0.2278 R-squared = 0.1594
Notes: 1- DV is dependent variable.
2-Theinterveningvariableisproceduraljustice.

156
Table 23: Results of Regression with Robust Standard Error Test for All Models
Variab
le b
Robus
t Std
. Err.
tB
b Ro
bust
Std. Er
r.t
Bb
Robus
t Std
. Err.
tB
b Ro
bust
Std. Er
r.t
Bb
Robus
t Std
. Err.
tB
b Ro
bust
Std. Er
r.t
Bb
Robus
t Std
. Err.
tB
b Ro
bust
Std. Er
r.t
B
Experim
ental G
roup
0.69
0.05***
12.72
0.460.2
40.08
***3.06
0.120.2
10.08
**2.4
90.10
0.24
0.06***
3.730.15
0.28
0.06***
4.37
0.170.5
10.05
***11.
200.41
0.68
0.05***
14.05
0.490.4
70.07
***6.9
90.27
Male
-0.14
0.13
-1.10
-0.04
-0.002
0.20
-0.01
0.00
-0.08
0.21
-0.39-
0.01
-0.13
0.15
-0.88-
0.03
-0.22
0.15
-1.46
-0.05
-0.10
0.10
-1.00
-0.03
-0.15
0.14
-1.08
-0.04
-0.15
0.13
-1.15-
0.03
Marrie
d0.0
50.0
80.6
70.0
30.2
10.1
21.8
60.0
90.2
90.12
*2.3
10.1
10.2
50.10
**2.5
40.1
30.2
30.10
*2.3
50.1
10.0
80.0
61.2
00.0
50.1
40.0
81.7
70.0
80.1
20.1
01.2
00.0
6
Emplo
yed-0.0
40.0
8-0.5
7-0.0
2-0.1
30.1
1-1.1
5-0.0
5-0.0
50.1
3-0.3
8-0.0
20.0
40.0
90.4
40.0
2-0.1
90.08
*-2.3
1-0.0
9-0.0
50.0
6-0.7
4-0.0
3-0.0
60.0
7-0.8
5-0.0
3-0.1
30.1
0-1.2
9-0.0
5
LogInc
ome
0.09
0.05
1.86
0.08
-0.13
0.08
-1.63
-0.08
-0.02
0.08
-0.26-
0.01
0.01
0.05
0.22
0.01
-0.05
0.06
-0.93
-0.04
0.06
0.04
1.55
0.06
0.01
0.05
0.25
0.01
0.03
0.06
0.53
0.02
More t
han hig
h schoo
l-0.0
20.0
7-0.3
4-0.0
10.0
90.1
00.9
50.0
4-0.0
70.1
0-0.7
3-0.0
30.0
70.0
80.9
40.0
40.0
90.0
81.1
30.0
50.1
20.05
**2.4
50.1
00.0
0030.0
60.0
00.0
0020.0
40.0
80.5
20.0
2
Born in
Eskise
hir0.0
60.0
60.9
30.0
30.1
50.0
81.8
10.0
70.1
50.0
91.6
70.0
6-0.0
020.0
7-0.0
30.00
0.01
0.07
0.18
0.01
-0.05
0.06
-0.84
-0.04
-0.08
0.06
-1.31
-0.05
-0.04
0.08
-0.51-
0.02
City c
enter r
esident
-0.02
0.06
-0.31
-0.01
-0.04
0.09
-0.45
-0.02
-0.18
0.09
-1.96-
0.08
-0.02
0.07
-0.22-
0.01
-0.01
0.07
-0.10
0.00
-0.01
0.05
-0.22
-0.01
0.003
0.06
0.06
0.002
-0.06
0.08
-0.79-
0.03
Relatio
nal tie
s with
police
0.00
0.06
0.02
0.00
-0.02
0.08
-0.22
-0.01
0.07
0.09
0.85
0.03
0.11
0.07
1.62
0.07
-0.01
0.07
-0.10
0.00
0.05
0.05
0.94
0.04
-0.01
0.05
-0.10
-0.004
0.03
0.07
0.38
0.02
Prior co
ntact w
ith pol
ice-0.0
90.0
6-1.3
9-0.0
5-0.1
10.0
9-1.2
2-0.0
5-0.2
60.09
**-2.8
1-0.1
2-0.0
50.0
7-0.6
6-0.0
3-0.0
40.0
7-0.5
1-0.0
2-0.0
50.0
5-0.9
9-0.0
4-0.0
90.0
5-1.6
7-0.0
04-0.0
80.0
8-1.0
3-0.0
4
Years o
f Drivi
ng0.0
050.0
031.7
60.0
70.0
010.0
040.3
30.0
1-0.0
020.0
04-0.4
9-0.0
20.0
020.0
030.7
20.0
30.0
010.0
030.2
20.0
10.0
0020.0
030.0
70.0
00.0
020.0
021.0
60.0
4-0.0
020.0
03-0.7
5-0.0
3
Stoppe
d by tr
affic p
olice
-0.09
0.07
-1.28
-0.05
-0.21
0.09*
-2.29
-0.08
-0.15
0.11
-1.39-
0.06
-0.10
0.08
-1.35-
0.05
-0.18
0.08*
-2.38
-0.09
-0.05
0.06
-0.80
-0.03
-0.04
0.06
-0.67
-0.02
-0.04
0.08
-0.50-
0.02
Ticket
ed dur
ing the
encou
nter
-0.16
0.11
-1.49
-0.05
0.02
0.15
0.11
0.00
-0.14
0.15
-0.91-
0.03
-0.09
0.10
-0.89-
0.03
-0.26
0.14
-1.86
-0.08
-0.08
0.07
-1.13
-0.03
0.005
0.08
0.06
0.002
-0.20
0.12
-1.59-
0.06
Constan
t4.4
05.4
34.5
84.4
45.4
23.9
44.0
94.0
3
*p< .05
, **p<
.01, **
*p< .00
1DV
: Proce
dural J
ustice
DV: Tr
affic P
olice L
egitim
acyDV
: Police
Legiti
macy
DV: C
oopera
tionDV
: Gene
ral Com
pliance
DV: Sp
ecific C
omplia
nceDV
: Satisf
action
DV: Pe
rceptio
n of Po
lice
N= 59
8F( 1
3, 584)
=15.4
0F( 1
3, 584)
= 3.04
F( 13, 5
84) = 3
.23F( 1
3, 584)
=3.07
F( 13,
584) =
4.62
F( 13, 5
84) =1
3.45
F( 13, 5
84) =1
8.86
F( 13, 5
84) =5
.10
Prob >
F = 0.
000Pro
b > F =
0.000
Prob >
F = 0.
000Pro
b > F =
0.000
Prob >
F = 0.
000Pro
b > F =
0.000
Prob >
F = 0.
000Pro
b > F =
0.000
R-squa
red = 0
.2313
R-squa
red = 0
.0546
R-squa
red = 0
.0593
R-squa
red= 0
.0513
R-squa
red = 0
.0758
R-squa
red= 0
.1977
R-squa
red =0
.2600
R-squa
red = 0
.0882
Note:
DV is d
epende
nt varia
ble.
Copyright © 2022 FDOKUMEN