Multistep value-at-risk and expected shortfall forecasting using copula-GARCH models
23
Multistep value-at-risk and expected shortfall forecasting using copula-GARCH models Eugene Levin October 12, 2012 Eugene Levin Multistep value-at-risk and expected shortfall forecasting using copula-GARCH models October 12, 2012 1 / 23
-
Upload
independent -
Category
Documents
-
view
0 -
download
0
Transcript of Multistep value-at-risk and expected shortfall forecasting using copula-GARCH models

Multistep value-at-risk and expected shortfallforecasting using copula-GARCH models
Eugene Levin
October 12, 2012
Eugene Levin Multistep value-at-risk and expected shortfall forecasting using copula-GARCH modelsOctober 12, 2012 1 / 23

Presentation Structure
1. Motivation
2. Models
3. Model evaluation
4. Data and results
5. Conclusion
Eugene Levin Multistep value-at-risk and expected shortfall forecasting using copula-GARCH modelsOctober 12, 2012 2 / 23
Motivation
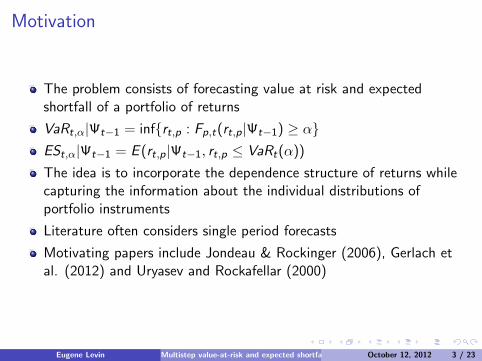
The problem consists of forecasting value at risk and expectedshortfall of a portfolio of returns
VaRt,α|Ψt−1 = inf{rt,p : Fp,t(rt,p|Ψt−1) ≥ α}ESt,α|Ψt−1 = E (rt,p|Ψt−1, rt,p ≤ VaRt(α))
The idea is to incorporate the dependence structure of returns whilecapturing the information about the individual distributions ofportfolio instruments
Literature often considers single period forecasts
Motivating papers include Jondeau & Rockinger (2006), Gerlach etal. (2012) and Uryasev and Rockafellar (2000)
Eugene Levin Multistep value-at-risk and expected shortfall forecasting using copula-GARCH modelsOctober 12, 2012 3 / 23

Motivation
Value at risk vs Expected shortfall
Figure : VaR vs ES
Eugene Levin Multistep value-at-risk and expected shortfall forecasting using copula-GARCH modelsOctober 12, 2012 4 / 23
Copula-GARCH models
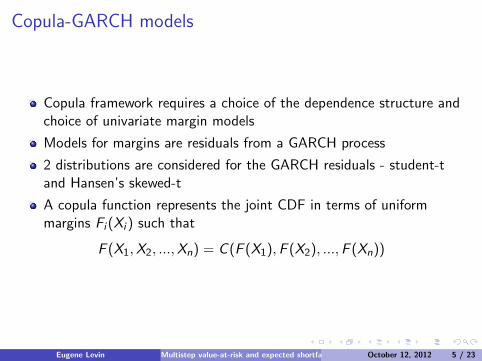
Copula framework requires a choice of the dependence structure andchoice of univariate margin models
Models for margins are residuals from a GARCH process
2 distributions are considered for the GARCH residuals - student-tand Hansen’s skewed-t
A copula function represents the joint CDF in terms of uniformmargins Fi (Xi ) such that
F (X1,X2, ...,Xn) = C (F (X1),F (X2), ...,F (Xn))
Eugene Levin Multistep value-at-risk and expected shortfall forecasting using copula-GARCH modelsOctober 12, 2012 5 / 23

Copula-GARCH models
Two copula models are considered - Gaussian copula and t-copula
Why no asymmetric dependence?
Time-varying correlations are examined using the dynamic of aDCC(1, 1) model (Engle (2002))
Rt is the correlation matrix that is being forecasted
Rt−1 is estimated using IFM method - either from a Gaussian copulaor a t-copula
Qt = (1−M∑
m=1
αm −N∑
n=1
βn)Q̄ +M∑
m=1
αm(εt−mε′t−m) +
N∑n=1
βnQt−n
Rt = Q ∗−1t QtQ∗−1t
where Q∗t contains diagonal elements of Q where the typical element isqij = σij
Eugene Levin Multistep value-at-risk and expected shortfall forecasting using copula-GARCH modelsOctober 12, 2012 6 / 23

Models summary
Table : Models’ summary
(G-t-c) Gaussian copula with student-t margins (constant)(G-sk-t-c) Gaussian copula with Hansen’ skewed-t margins (constant)(T-t-c) t-copula with student-t margins (constant)(T-sk-t-c) t-copula with Hansen’s skewed-t margins (constant)(G-t-DCC) Gaussian copula with student-t margins (DCC)(G-sk-t-DCC) Gaussian copula with Hansen’ skewed-t margins (DCC)(T-t-DCC) t-copula with student-t margins (DCC)(T-sk-t-DCC) t-copula with Hansen’s skewed-t margins (DCC)
Estimation of copula parameters is done using the IFM methodproposed by Joe & Xu (1996)
Estimation of DCC and GARCH parameters is done using QMLE
Eugene Levin Multistep value-at-risk and expected shortfall forecasting using copula-GARCH modelsOctober 12, 2012 7 / 23

Model evaluation
Model evaluation is done in terms of how often the value at risk isgreater than the actual portfolio return or rp,t < VaRt,α - in this caseIt = 1, otherwise It = 0
Proportion of violations (vRate) should be close to α in a model thataccurately forecasts VaR
For each step ahead forecasts we get a vector I consisting of 0’s and1’s - now we can test for statistical validity of the unconditional andconditional coverage - Christoffersen (1998)
An alternative test is used as well - out-sample dynamic quantile testproposed by Engle and Manganelli (2004) - to test for no correlationin lagged values of I and the VaR forecasts themselves
Eugene Levin Multistep value-at-risk and expected shortfall forecasting using copula-GARCH modelsOctober 12, 2012 8 / 23
Model evaluation
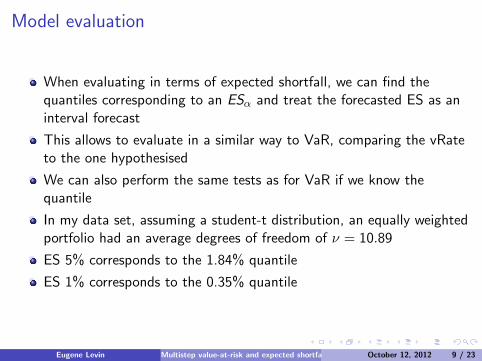
When evaluating in terms of expected shortfall, we can find thequantiles corresponding to an ESα and treat the forecasted ES as aninterval forecast
This allows to evaluate in a similar way to VaR, comparing the vRateto the one hypothesised
We can also perform the same tests as for VaR if we know thequantile
In my data set, assuming a student-t distribution, an equally weightedportfolio had an average degrees of freedom of ν = 10.89
ES 5% corresponds to the 1.84% quantile
ES 1% corresponds to the 0.35% quantile
Eugene Levin Multistep value-at-risk and expected shortfall forecasting using copula-GARCH modelsOctober 12, 2012 9 / 23

Data and results
Data consists of returns for international stock indices - ASX200,HSI, DAX, FTSE 100, NASDAQ, NEIKEI 225
The total data time frame used → from 17/10/2001 to 27/08/2012 -total of 2777 observations (adjusted for public holidays)
In sample estimation was done using a rolling window of 1765observations
Total out of sample forecasts = 1012
Why this data set? Potential problems?
Eugene Levin Multistep value-at-risk and expected shortfall forecasting using copula-GARCH modelsOctober 12, 2012 10 / 23

Data and results
NASDAQ prices
0 500 1000 1500 2000 2500 3000800
1000
1200
1400
1600
1800
2000
2200
2400
2600
2800NASDAQ in and out−of−sample periods
NASDAQ in−sample periodNASDAQ out−of−sample period
Figure : NASDAQ prices
Eugene Levin Multistep value-at-risk and expected shortfall forecasting using copula-GARCH modelsOctober 12, 2012 11 / 23

Table : 1 step ahead vRate under equal weights
Equal weights, 5% VaR Equal weights 1% VaR
G-t-c 0.0731 0.0208G-sk-t-c 0.0692 0.0148
T-t-c 0.0652 0.0158T-sk-t-c 0.0692 0.0138
G-t-DCC 0.0731 0.0198G-sk-t-DCC 0.0692 0.0158
T-t-DCC 0.0741 0.0168T-sk-t-DCC 0.0648 0.0158
Eugene Levin Multistep value-at-risk and expected shortfall forecasting using copula-GARCH modelsOctober 12, 2012 12 / 23
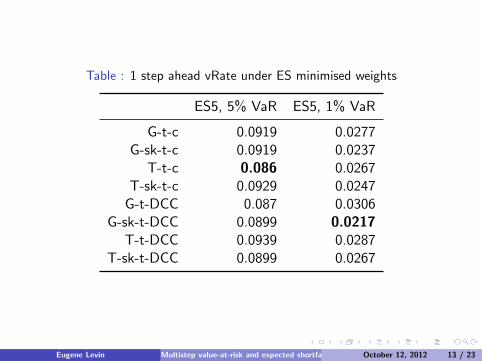
Table : 1 step ahead vRate under ES minimised weights
ES5, 5% VaR ES5, 1% VaR
G-t-c 0.0919 0.0277G-sk-t-c 0.0919 0.0237
T-t-c 0.086 0.0267T-sk-t-c 0.0929 0.0247
G-t-DCC 0.087 0.0306G-sk-t-DCC 0.0899 0.0217
T-t-DCC 0.0939 0.0287T-sk-t-DCC 0.0899 0.0267
Eugene Levin Multistep value-at-risk and expected shortfall forecasting using copula-GARCH modelsOctober 12, 2012 13 / 23

Table : 1 step ahead vRate under MVP weights
MVP 5% VaR MVP, 1% VaR
G-t-c 0.087 0.0287G-sk-t-c 0.084 0.0237
T-t-c 0.0899 0.0287T-sk-t-c 0.087 0.0237
G-t-DCC 0.086 0.0277G-sk-t-DCC 0.0879 0.0237
T-t-DCC 0.0879 0.0267T-sk-t-DCC 0.0868 0.0237
Eugene Levin Multistep value-at-risk and expected shortfall forecasting using copula-GARCH modelsOctober 12, 2012 14 / 23

Equal weights, 5% VaR vRate
1 2 3 4 5 6 7 8 9 100.04
0.05
0.06
0.07
0.08
0.09
0.1
0.11
0.12
Steps ahead forecast
vR
ate
5% vRate − Equal weights
G−t−cG−sk−t−cT−t−cT−sk−t−cG−t−DCCG−sk−t−DCCT−t−DCCT−sk−t−DCCExpected vRate
Figure : VaR vs ESEugene Levin Multistep value-at-risk and expected shortfall forecasting using copula-GARCH modelsOctober 12, 2012 15 / 23

Equal weights, 1% VaR vRate
1 2 3 4 5 6 7 8 9 100
0.01
0.02
0.03
0.04
0.05
0.06
Steps ahead forecast
vR
ate
1% vRate − Equal weights
G−t−c
G−sk−t−c
T−t−c
T−sk−t−c
G−t−DCC
G−sk−t−DCC
T−t−DCC
T−sk−t−DCC
Expected vRate
Figure : VaR vs ESEugene Levin Multistep value-at-risk and expected shortfall forecasting using copula-GARCH modelsOctober 12, 2012 16 / 23

ES minimised weights, 5% VaR vRate
1 2 3 4 5 6 7 8 9 100
0.02
0.04
0.06
0.08
0.1
0.12
0.14
0.16
0.18
Steps
vR
ate
5% vRate − ES minimised weights
G−t−c
G−sk−t−c
T−t−c
T−sk−t−c
G−t−DCC
G−sk−t−DCC
T−t−DCC
T−sk−t−DCC
Expected vRate
Figure : VaR vs ESEugene Levin Multistep value-at-risk and expected shortfall forecasting using copula-GARCH modelsOctober 12, 2012 17 / 23
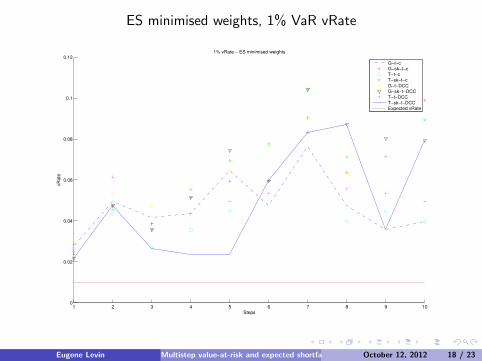
ES minimised weights, 1% VaR vRate
1 2 3 4 5 6 7 8 9 100
0.02
0.04
0.06
0.08
0.1
0.12
Steps
vR
ate
1% vRate − ES minimised weights
G−t−c
G−sk−t−c
T−t−c
T−sk−t−c
G−t−DCC
G−sk−t−DCC
T−t−DCC
T−sk−t−DCC
Expected vRate
Figure : VaR vs ESEugene Levin Multistep value-at-risk and expected shortfall forecasting using copula-GARCH modelsOctober 12, 2012 18 / 23

MVP weights, 5% VaR vRate
1 2 3 4 5 6 7 8 9 100.04
0.06
0.08
0.1
0.12
0.14
0.16
0.18
Steps
vR
ate
5% vRate − MVP minimised weights
G−t−c
G−sk−t−c
T−t−c
T−sk−t−c
G−t−DCC
G−sk−t−DCC
T−t−DCC
T−sk−t−DCC
Expected vRate
Figure : VaR vs ESEugene Levin Multistep value-at-risk and expected shortfall forecasting using copula-GARCH modelsOctober 12, 2012 19 / 23

Table : ES forecast evaluation
EQ weights 5% ES quantile level 1% ES quantile level
G-t-c 0.0326 0.0069G-sk-t-c 0.0237 0.003
T-t-c 0.0247 0.003T-sk-t-c 0.0217 0.001
G-t-DCC 0.0346 0.0079G-sk-t-DCC 0.0247 0.004
T-t-DCC 0.0336 0.0044T-sk-t-DCC 0.033 0.0043
Correct level 0.0184 0.0035
Eugene Levin Multistep value-at-risk and expected shortfall forecasting using copula-GARCH modelsOctober 12, 2012 20 / 23

Table : ES evaluation - ES minimised weights
ES weights 5% ES quantile level 1% ES quantile level
G-t-c 0.0435 0.0158G-sk-t-c 0.0385 0.0089
T-t-c 0.0415 0.0119T-sk-t-c 0.0415 0.0089
G-t-DCC 0.0435 0.0168G-sk-t-DCC 0.0425 0.0109
T-t-DCC 0.0415 0.0099T-sk-t-DCC 0.0405 0.0089
Correct level 0.0184 0.0035
Eugene Levin Multistep value-at-risk and expected shortfall forecasting using copula-GARCH modelsOctober 12, 2012 21 / 23

Table : MVP weights - ES forecast evaluation
MVP weights 5% ES quantile level 1% ES quantile level
G-t-c 0.0425 0.0158G-sk-t-c 0.0385 0.0099
T-t-c 0.0405 0.0109T-sk-t-c 0.0375 0.0079
G-t-DCC 0.0435 0.0188G-sk-t-DCC 0.0385 0.0109
T-t-DCC 0.0415 0.0099T-sk-t-DCC 0.0405 0.089
Correct level 0.0184 0.0035
Eugene Levin Multistep value-at-risk and expected shortfall forecasting using copula-GARCH modelsOctober 12, 2012 22 / 23
Conclusion
In this presentation I did not include:
Risk-vs-return properties of the portfolio
Whether or not the ES forecasts correspond to the realised ES
How the models performed in the non-crisis period
Eugene Levin Multistep value-at-risk and expected shortfall forecasting using copula-GARCH modelsOctober 12, 2012 23 / 23