Multiple board appointments and firm performance in emerging economies: Evidence from India
34
Multiple Board Appointments and Firm Performance in Emerging Economies: Evidence from India ∗ Jayati Sarkar and Subrata Sarkar Indira Gandhi Institute of Development Research Working Paper Series No. WP-2005-001 January 2005 Abstract The relation between multiple directorships, busy directors and firm performance has been researched predominantly in the context of developed economies, notably the US. This paper extends the existing literature on multiple directorships in two ways; first, by providing additional evidence on its effect on firm performance, but with respect to an emerging economy, India, and secondly, by suggesting an alternative measure of directorial “busyness” that is more general in its applicability compared to those that have been applied in the existing literature. Using a sample of 500 large firms from the Indian corporate sector for the year 2002-03, the paper finds multiple directorships by independent directors to correlate positively with firm value thereby supporting the “quality hypothesis” that busy directors are likely to be better directors, a result that is different from the existing evidence on busy directors. Multiple directorships by insider directors are, however, negatively related to firm performance. Estimation of group and non-group companies separately reveals that the quality effect of independent directors persists for the former but disappears for the latter. In general, the results suggest that the relation between “busy” directors and firm performance may depend on the institutional context and on the type of director. Keywords: Multiple Directorships, Busy Directors, Firm Performance JEL Classification: G30, G39, K22 ∗ Preliminary Draft: Not to be quoted, comments welcome. We thank the participants at the Workshop on Law and Economics at IGIDR, September 2004 for their helpful comments and suggestions on an earlier version of this draft. We also thank B. K. Chandra Kiran, Tirthankar Choudhuri, Arijit Ghosh, Jayashree Saha, Ekta Selarka and S. Sangeetha for excellent assistance in preparing the dataset. The usual disclaimer applies. Address for correspondence: IGIDR, Gen.A.K.Vaidya Marg, Goregaon (E), Mumbai 400065, India. E-mail: [email protected] , [email protected]
-
Upload
independent -
Category
Documents
-
view
2 -
download
0
Transcript of Multiple board appointments and firm performance in emerging economies: Evidence from India

Multiple Board Appointments and Firm Performance in
Emerging Economies: Evidence from India∗
Jayati Sarkar and Subrata Sarkar
Indira Gandhi Institute of Development Research
Working Paper Series No. WP-2005-001
January 2005
Abstract The relation between multiple directorships, busy directors and firm performance has been researched predominantly in the context of developed economies, notably the US. This paper extends the existing literature on multiple directorships in two ways; first, by providing additional evidence on its effect on firm performance, but with respect to an emerging economy, India, and secondly, by suggesting an alternative measure of directorial “busyness” that is more general in its applicability compared to those that have been applied in the existing literature. Using a sample of 500 large firms from the Indian corporate sector for the year 2002-03, the paper finds multiple directorships by independent directors to correlate positively with firm value thereby supporting the “quality hypothesis” that busy directors are likely to be better directors, a result that is different from the existing evidence on busy directors. Multiple directorships by insider directors are, however, negatively related to firm performance. Estimation of group and non-group companies separately reveals that the quality effect of independent directors persists for the former but disappears for the latter. In general, the results suggest that the relation between “busy” directors and firm performance may depend on the institutional context and on the type of director. Keywords: Multiple Directorships, Busy Directors, Firm Performance JEL Classification: G30, G39, K22
∗ Preliminary Draft: Not to be quoted, comments welcome. We thank the participants at the Workshop on Law and Economics at IGIDR, September 2004 for their helpful comments and suggestions on an earlier version of this draft. We also thank B. K. Chandra Kiran, Tirthankar Choudhuri, Arijit Ghosh, Jayashree Saha, Ekta Selarka and S. Sangeetha for excellent assistance in preparing the dataset. The usual disclaimer applies. Address for correspondence: IGIDR, Gen.A.K.Vaidya Marg, Goregaon (E), Mumbai 400065, India. E-mail: [email protected], [email protected]

1. Introduction
The number of positions that directors can accept on company boards has been a contentious
corporate governance issue in countries around the world. Consequently, reform initiatives have
focused on the need to limit the number of positions that a director can accept on company boards.
The argument for limiting such multiple directorships can be stated in terms of the “busyness
hypothesis” (Ferris et al., 2003), which postulates that a substantial number of directorial
appointments can make directors over-committed and thereby compromise on their ability to
monitor company management effectively on behalf of the shareholders. Several countries, like
India, Malaysia and South Korea, have factored in such concerns by formally imposing regulatory
limits on the number of boards on which an individual director can serve. However, several others,
including developed countries like the US and UK are still debating the pros and cons of imposing
such mandatory limits. In the US while some shareholder advocacy groups like the Council of
Institutional Investors (CII) have explicitly recommended imposing such limits, the regulator has
left the determination of the extent to which a director can have multiple appointments largely to
the discretion of the corporations.
While the costs associated with multiple directorships seem to be obvious, the existing theoretical
literature also highlights potential benefits from such directorships. For one, given the presence of a
well functioning market for outside directors, the number of multiple directorships can signal a
director’s reputational capital so that a director with multiple directorships may proxy for high
director quality (Fama, 1980, Fama and Jensen, 1983). Thus, having directors on board with
multiple directorships can lead to better monitoring and thereby positively impact company
performance. Second, from a resource dependency perspective it is argued that directors with
multiple appointments, by virtue of being more networked, can generate benefits by helping to
bring in needed resources, suppliers and customers to a company (Pfeffer, 1972; Booth and Deli,
1995).
Given differing theoretical viewpoints on the impact of multiple directorships on corporate
governance and performance, it is not surprising that empirical evidence on the effect of such
directorships along with that on the “busyness hypothesis” is somewhat mixed. On the one hand,
some studies have found that busyness of directors can have a statistically adverse effect on
2

performance, lower the sensitivity of CEO turnover to performance, manifest in a positive market
reaction following the departure of a busy director (Fich and Shivdasani, 2004), lead to excess
remuneration of CEOs (Core et al., 1999; Shivdasani and Yermack, 1999), and increase the
probability of committing accounting fraud (Beasley, 1996). On the other hand, however, there are
studies which show that directors with multiple appointments can serve shareholder interests by
positively impacting company performance (Miwa and Ramseyer, 2000), can benefit shareholders
through offering them larger premiums in tender offers (Cotter et al., 1997), and can generate
superior returns from acquisitions. Finally, selected evidence, also with respect to the US suggests
that multiple directorships do not have any significant negative effect on company value, nor do
such directorships lead to directors shirking their responsibilities to serve on board committees or
are associated with greater likelihood of securities fraud litigation (Ferris et al., 2003).
The objective of this paper is to extend the existing literature on multiple directorships in two ways.
First, this paper seeks to provide additional evidence on the “Busyness Hypothesis,” but based on
evidence from an emerging economy, India. Secondly, the paper seeks to contribute to the relevant
literature by suggesting an alternative measure of busyness that is more general in its applicability
compared to those that have been applied in the existing literature.
With regard to the first objective, the reasons for choosing an emerging economy to analyze the
busyness hypothesis are the following. One, we believe that an emerging economy like India form
a more appropriate laboratory for analyzing the impact of multiple directorships on corporate
performance. In contrast to the scenario in the US or other developed countries where there is a
relatively long history of institutional investor organizations actively seeking to influence corporate
governance policies of individual companies by publishing codes and best practices, such
influences have been relatively uncommon in developing and emerging economies. It can thus be
reasonably expected that the possibility of endogenizing (with a downward bias) the level of
busyness of directors where company boards may need to consciously employ less busy directors in
order to positively signal the market, is unlikely to be strong in such countries. While in some of
these countries, mandatory limits have been placed on the number of directorships that can be
accepted, such limits have been set at levels as high as ranging between ten (Malaysia) and twenty
(India). The presence of such high limits, make such limits largely non-binding for many
3

companies, yet keeps them free to hire directors with significantly high number of multiple
directorships. This automatically is reflected in a higher average level of busyness as well as a
greater variation in the extent of busyness of directors, and hence an ideal setting for analyzing the
impact of multiple directorships on the effectiveness of monitoring in a cross-section of companies.
Basic analysis of Indian data and a comparison with corresponding US data show that the mean
number of directorships per director in India is at least as much as that obtained in US studies, but
with the variation of busyness seemingly being more in the Indian context.1
An additional motivation for analyzing the impact of multiple directorships with respect to an
emerging economy is that there is very little empirical evidence with respect to such countries that
would help policy makers evolve best practices that are in consonance with the institutional
context. It also provides one with an opportunity to examine the extent to which the impact of
multiple directorships on company performance is institution-specific. The possibility that best
practices on multiple directorships may be sensitive to the institutional context arises from our
observation that the limits on such directorships that are in place in several of the emerging
economies are significantly higher than the best practices that are in vogue in many of the
developed countries (Table 1). While in the US, less than three multiple directorships is often
considered best practice so much so that many of the empirical studies with respect to US define a
busy director as one holding three of more directorships, the suggested or existing limit on multiple
directorships in countries like India, Malaysia and Pakistan are much higher, between ten and
twenty, with several exclusions permitted. Additionally, the limits set for executive or whole-time
directors are sometimes significantly liberal compared to best practices adhered to in developed
countries; in India, for instance, a whole time director can hold additional directorships in ten
companies as compared to the suggested best practice limit in the Combined Code in UK whereby
an executive director is recommended to not sit in more than one other board of a large listed
company.
1 While mean busyness of outside directors for US companies stand approximately between 1.6 (Ferris et al. 2003) and 3 (Fich and Shivdasani, 2004), with corresponding estimates of the percentage of busy directors ranging from as low as 14.97 per cent to 52 per cent, the estimates of mean busyness and percentage of busy directors for companies belonging to the top 500 in India stands around 4 and 57 per cent respectively. More importantly, compared to the US sample for which estimates are available, the variation of busyness as well as its range, are significantly more in India. While estimates with regard to US suggests that while only 0.33 per cent of directors in the sample have 6 board seats or more, the corresponding estimates for the top Indian companies is as high as 25 per cent.
4

One explanation for such differences could be that the higher permissible limits on multiple
directorships are driven by supply constraints in managerial labor markets characteristic of many
developing countries, and in fact would negatively impact corporate performance. An alternative or
complementary hypothesis could be that institutional specificities of these countries make it
possible for a larger number of multiple directorships to be sustained without impairing the quality
of corporate governance and performance and best practices in developed countries in this regard
would be unnecessarily stringent. One can argue, normalizing for quality, that the demands of the
job of a director, i.e., the nature of tasks that a director is required to perform on company boards,
could be much less in a developing and emerging economies as compared to that in developed
countries. In developed economies like the US where companies are much bigger in size and many
of them have complex operations cutting across nations, the demands of the job may be very high.
Accordingly, even three directorships may make a director over committed notwithstanding their
ability. In contrast, in emerging economies like India, where companies are much smaller and
relatively few of them are transnational in nature, the level at which over-commitment sets in may
be much higher. This would be all the more so given the possibility that multiple directorships in
developing economies where business groups typically dominate the corporate landscape, could be
largely group specific, i.e., emanate mostly from within a particular group and thereby create
synergies between different directorial responsibilities, both for executive and outside directors.
The second aspect in which this paper seeks to contribute to the literature is with respect to the
important issue of how busyness associated with multiple directorships is measured in the first
place. As Fich and Shivdasani (2004) purposefully argue, inferences regarding the effect of
multiple directorships on firm performance could be sensitive to how busy directors are identified,
and what in particular constitutes busy boards. A common feature of many of the existing studies
(see for example, Core et al., 1999; Ferris et al., 2003; Fich and Shivdasani, 2004;) is that a busy
director is defined exogenously as one who holds three or more directorships. The rationale for this
definition seems to be derived from the “rule of thumb” limit on multiple directorships proposed by
the Council of Institutional Investors in the US. Using this definition, the conclusions arrived by
Ferris et al (2003) and Fich and Shivdasani (2004) are at odds, with the former finding no
systematic relationship between firm performance and the extent of busyness, and the latter finding
5

a statistically significant negative relationship between busy boards and firm performance.
According to Fich and Shivdasani (2004), the differences in these results have stemmed from the
differences in the “metric of busyness” that the respective studies have employed. For instance, in
estimating the relationship between multiple directorships and firm performance, Ferris et al.
(2003) proxy the business of the board by the average number of board seats held by outside
directors. However, as Fich and Shivdasani (2004) illustrate with several examples, the average
number of directorships may not be a good measure in this context, because the board often
contains only a few individuals with extremely high number of multiple directorships that influence
the average. Thus while a board might appear busy based on average directorships, it may be the
case that a majority of the directorships are not busy. To address this problem, Fich and Shivdasani
(2004) identify a busy board as one in which at least 50 percent of the outside directors are busy,
where a busy director is taken as one who holds three or more directorships. Using this metric, the
study finds that a busy board correlates with lower market value of the firm.
In defining our measure of board busyness we conform to the idea of Fich and Shivdasani (2004)
that a measure of board busyness should not be driven by extreme observations but should reflect
the busyness of a majority of the directors on the board. However, at the same time we do not
impose any a priori definition of busyness, and instead attempt to endogenously determine the
level of where a busy board has a negative effect on performance. Our contention is that the impact
of busyness on performance is not only sensitive to the metric of busyness defined at the board
level, but to the definition of a busy director per se. Busyness of a director as measured by the
number of multiple directorships can be considered as a threshold level of multiple directorships
beyond which “excessive” directorial commitments impinge on the director’s ability to effectively
monitor.2 In all of the existing studies, a rather conservative definition of a busy director, one
having at least three multiple directorships, is assumed. However, as stated above, a review of
proposed limits on multiple directorships across countries show that limits of as high as ten or
twenty multiple directorships are in vogue as also ones as low as two or three. Even within the US,
while CII has come up with a proposal of three, Calpers has kept the limit open while highlighting
its concern on the effects of “too many” directorships. In view of this, one can therefore argue that
2 Such a threshold concept is also implicit in titles like “Too Busy to Mind the Business.?”
6
by exogenously imposing a measure of a busy director, an examination of whether a multiple
directorship of three at all can be construed as busyness in the first place, is precluded.
While unarguably, a larger number of directorial appointments impinge on the ability to monitor, it
is not clear at which level of the individual can we consider one to be “busy.” Such a determination,
we argue, is as critical to the results that one obtains as the metric of busyness one uses at the board
level. While Fich and Shivdasani (2004) prove that a board with at least half of busy outside
directors will negatively affect company performance, their results do not conclusively prove that
such a negative relationship would not have been obtained had busyness been defined as directors
holding two directorships with a busy board constituting of at least fifty per cent of such directors.
In that case, should one consider directors holding as low as two directorships also too busy to be
effective? Would this then not render the entire debate on busyness trivial? Additionally, a
demonstration of a negative impact on busyness does not provide insights into whether “high
levels” of busyness are driving the statistically significant results. If alternatively, one breaks the
sample of busy directors into less busy and more busy categories (3 – 7) and greater than 7,
provided of course the data exhibits enough variation in busyness, it is theoretically possible that
the relationship between busyness and performance becomes statistically significant only beyond
seven, and with a board which has a majority of such directors. In that case, the policy implications
would be very different and would be at odds with the CII proposal. Else, if statistical significance
holds for the entire range, then the findings of the study can be considered to independently
corroborate the proposed limit rather than exogenously imposing the proposed limit on the analysis.
In similar vein, had Ferris et al., (2003) lowered the bar on the definition of busyness defining
directors with a larger number of multiple directorships as “busy”, it is theoretically possible that a
negative and significant relation could have been captured between busyness and firm performance
even by keeping their metric of board busyness the same.
In keeping with the above ideas we use the median directorships by directors as the measure of
board busyness in our regression. Using the median accomplishes two things. First, it ensures, by
construction, that majority of the directors hold any specified value of multiple directorships.
Second, since the median enters the regression as a variable, we are able to examine the
incremental effect as a board gets busier. Our measure encompasses the “busy board” variable of
7

Fich and Shivdasani (2004). According to our definition all boards where the median directorships
is three or more are the “busy boards” of Fich and Shivdasani (2004). Having selected the median
as the measure of board busyness, we then fit a spline or piecewise linear regression between firm
performance and board busyness. We set alternative turning points or spline nodes and estimate
several regressions. The node at which we observe the relation between firm performance and
board busyness to turn negative can then be identified the level of multiple directorships that makes
a board busy. Thus our methodology determines endogenously as to what constitutes a busy board.
This flexibility is important because the level at which busy boards have a negative effect on
performance is likely to be different for different institutional contexts. Indeed, as we shall see
below, our empirical analysis indicates that observed multiple directorships in India seems to more
an indication of directorial quality rather than directorial busyness.
Using a sample of 500 large Indian companies and applying the above methodology we find
multiple directorships by independent directors to correlate positively with market-to-book ratio
once such directorships cross a particular threshold. Below the threshold we do not find any
significant relation between multiple directorships and market-to-book ratio. In contrast to the
results for independent directors, we find multiple directorships by executive directors to correlate
negatively with firm performance. These findings are robust to alternative measures of firm
performance based on accounting indicators like return to assets and net value added to assets.
When we allow the effect of multiple directorships of independent directors to differ between non-
group and group companies, we find the positive relation to persist for the non-group companies,
but this effect disappears for the group companies. A part of our results support the view that
multiple directorships by independent directors may be a proxy of director quality and hence have a
positive effect with firm value. However, other parts of our results indicate that such directorships
could, in certain contexts, be driven by control motives of family owned business groups that are
prevalent in emerging economies. In either case, though, we are unable to detect any negative
effect of multiple directorships by independent directors on firm value. In contrast, multiple
directorships by executive directors are found to correlate almost always negatively with firm
performance.
8

The rest of the paper is organized as follows. Section 2 outlines the institutional context governing
the evolution of multiple directorships in India. Section 3 contains a description of the sample and
the data used in the analysis and documents the incidence of multiple directorships in large Indian
companies. The empirical analysis is reported in Section 4 and Section 5 concludes the paper.
2. Multiple Directorships in India: The Institutional Context
The phenomenon of multiple directorships in India can be traced back to the early stages of
corporate sector development in the country. As Mehta (1955) observes, multiple directorships
evolved in India in the initial stages of its industrial development due to a combination of various
factors, namely a dearth of industrial leadership with ample commercial and industrial experience
to serve on a company’s board of directors, and due to the institution of managing agents under the
Managing Agency System, who floated new companies and sought to control the management of
these companies by being on their boards. The extent of multiple directorships in the early years of
industrialization is apparent from the fact that as of 1949-50, individual directors held as high as 50
directorships spread across a wide variety of industries. Specifically, in the cotton industry, 25
eminent industrialists held as many as 150 directorships among them and 10 industrialists held
about 82 directorships among them (Mehta, 1955). As the Company Law Committee (the Bhabha
Committee) observed in 1950 in the context of amending the extant Companies Act, 1913, while
multiple directorships in the UK and US rarely exceeded ten and in fact two to three directorships
was the common pattern, a holding of 15 to 20 directorships in India around that time was most
common and a holding of 30 was not unusual (Kust, 1964). It is in the context of such
pervasiveness of multiple directorships in India and the associated concentration of managerial
power that the Bhabha Committee strongly recommended setting legal limits through the
Companies Act, 1956 on the number of directorships a director can accept. The limit was set at a
relatively high level of 20 along with provisions for excluding from this number the directorships
of private companies, which are neither a subsidiary, nor a holding company of a public company,
unlimited companies or non-profit associations. The proposed limit was considered to be
“desirable” by the Committee in view of the “paucity of high-grade business ability in the country”
at that time.
9
The recommendation of the Bhabha Committee was incorporated in Section 275 of the Companies
Act, 1956 and has been in effect till present. In addition to this provision, a separate provision
applied to the managing agents till the time the Managing Agency System was in vogue, i.e., April
1970. Since managing agents essentially managed the day to day operations of the company
similar to the responsibilities of a modern day CEO (or managing director), in order to ensure that
the affairs of the company received due and proper attention, Section 332 of the Companies Act,
1956 prohibited, with effect from August 15th, 1960, any managing agent to hold office as a
managing agent in more than 10 companies. After the discontinuation of the managing agency
system, a comparable provision was made in the Company Law applying to managing directors of
companies whereby a managing director was prohibited from holding more than 10 directorial
positions.
Since the nineties, as India joined a growing number of developed and developing countries in
reforming existing corporate governance practices, several proposals on reducing the limit on
multiple directorships have been made. While the consensus in this regard among the different
corporate governance committees and working groups set up through government and private
initiatives has been to reduce the existing limit on multiple appointments to reflect the changes in
the underlying institutional conditions as well as current best practices, there are differences in
opinion on what this limit would be. Among the competing proposals doing the rounds currently
are those made (i) by the Committee on Corporate Governance set up by the Confederation of
Indian Industry in 1998 which recommends within the overall limit of 20, no more than ten
directorships in listed companies, (ii) by the Study Group on Corporate Governance set up by the
Department of Company Affairs (DCA) which recommended not more than two other directorships
in listed companies for a managing director and not more than 10 directorships in listed companies
for other directors, and finally (iii) the Concept Paper of the Draft Companies Bill with
comprehensive proposals to overhaul the existing Companies Act, 1956 and drawn up by the DCA
which recommends bringing down the overall limit on multiple directorships to 15, while keeping
unchanged the maximum limit of 10 for managing directors. It should be noted that the Listing
Agreements of major stock exchanges in India, including that of the Bombay Stock Exchange and
National Stock Exchange, do not have any explicit provisions regarding total number of
directorships that listed companies should have.
10

3. The Sample, Data and Incidence of Multiple Directorships
3.1. The Sample and the Data
The sample for our analysis consists of 500 top private sector companies listed in the Bombay
Stock Exchange and covers the financial year 2003. These companies accounted for about 90
percent of market capitalization as on March 2003. Both domestic and foreign private sector
companies are represented in the sample, with domestic companies further classified into those
belonging to business groups (group-affiliated) and those which are non-affiliated (standalones).
Of the 500 companies, sixty eight per cent (388) of the sample companies are group affiliated, and
the rest are split almost equally between Indian standalones (84) and foreign companies (78).
The data for our analysis is sourced from the Prowess database created by the Center for
Monitoring the Indian economy (CMIE). We utilize the corporate governance (CG) reports
contained in this database to collate the details of board membership by directors. According to
Clause 49 of the Listing Agreement that came into effect from February 2000, all listed companies
in India are required to file a CG report disclosing the details of board functioning. This report
contains among other things, (i) the name of each director and his/her type i.e. promoter,
executive, non-executive affiliated, non-executive independent, nominee director of financial
institutions, (ii) the number of directorships and committee memberships held by the director in
other listed companies, (iii) the number of board meetings held by the company in the financial
year and dates on which they were held, (iv) and the attendance record of each director at the board
meetings and in particular at the Annual General Meeting (AGM). Companies are required to file
the CG report every quarter so that four such reports are available for a typical financial year.
However, since in our empirical analysis we are going to relate the busyness of directors to firm
performance for the financial year 2003 we are careful to consider only those companies for which
the CG reports are available for the quarter ending March 2003. Accordingly, to pick our sample
we ranked the private sector companies in terms of their sales in 2003 and then selected the first
500 companies for which the CG report was available for the above-mentioned date.
In addition to the data on multiple directorships we need information on accounting indicators,
equity ownership, stock market variables, and other firm characteristics for our analysis. These data
11

were sourced from the Profit and Loss Accounts, Balance Sheet, and stock price details of the
companies contained in the Prowess database.
3.2. Incidence of Multiple Directorships
3.2.1 At the director level
The distribution of directors according to the number of directorships held as reported in the CG
reports is presented in Table 2a. There are 3,891 directors in our sample companies holding 17,115
directorial positions. As Table 2a reveals, multiple directorships are quite pervasive in India with
71.6 per cent of directors in our sample holding more one directorial position. If one adopts the
benchmark of three directorships to define a busy director as has been done in the US studies, one
can see from Table 2a that as many as 56 per cent of directors hold 3 or more directorial positions.
Available estimates of distribution with regard to US based on a sample of 3190, though not strictly
comparable, show that only 15 per cent of directors hold 3 or more board seats (Ferris et al., 2003).
Further, as can be noted from Table 2a, notwithstanding the regulatory ceiling of 20 in India, there
exists considerable variation in directorships across directors in the sample companies even within
the limit, which makes it feasible to study the relation between varying degrees of busyness on
company value.
As stated earlier, the number of directorships held by directors of the sample companies has been
disclosed by the directors themselves in the corporate governance reports and include directorships
held in companies outside the sample. This is in contrast to some studies where the incidence of
multiple directorships is calculated from within the sample companies which is likely to give an
under estimate of such incidence (for example, Ferris et al., 2003). This is a great strength of our
data in which the main variable of interest, i.e. the number of multiple directorships, is not subject
to measurement error as it would be if it were to be calculated within the sample.
Table 2b highlights this point. If one were to calculate the incidence of multiple directorships from
within the sample, then the 3,891 directors hold only 5,045 directorial positions. In this case, one
may note that as high as 81 per cent of directors hold single positions (compared to 28.4 in Table
2a) and only half a percent of directors hold six or more positions (compared to 14 per cent in
Table 2a). The other key point that comes out from comparing Tables 2a and 2b is that since the
12

number of directorships held within the sample companies is very low, one can conclude that while
directors in large listed companies on the average have 4.4 directorial positions, most of these are
held in smaller companies.
Table 3 presents summary statistics on multiple directorships, based on both reported and in-sample
data. As can be seen from the Table, the mean directorships held per director as reported is greater
than the median, implying that the distribution is skewed to the right. This means that that there are
some directors holding large number of directorships, and exceeding the ceiling of 20. However, as
stated earlier, there are several exclusionary clauses in the Company Law that allows directors to
exceed the ceiling.
3.2.2 At the board level
How does the incidence of multiple directorships at the individual level translate into multiple
directorships at the board level? Is the incidence of multiple directorships different between insider
and outsider directors? How busy are the promoter directors who sit on company boards? To
answer these questions we first need to look at the size and composition of a typical board of the
sample companies that is given in Table 4.
Comparable estimates available for a sample of US companies are also shown in the Table. As is
evident from the Table, while mean board size is somewhat larger in the US compared to that in
India, the proportion of inside directors is almost equal (26 and 25 per cent respectively). It is in
the composition of non-executive directors that there exists some striking differences between the
two countries; the percentage of gray directors in India is significantly higher at 20 per cent
compared to 14 per cent for US companies. The other difference arises from the fact that a fair
proportion of independent directors in India comprise of nominees of financial institutions like
development banks and mutual funds who are not elected to the board by shareholders but are
nominated by financial institutions to monitor the companies on their behalf.
Looking at board size and composition by ownership groups, one finds that there is some
noticeable variation across these groups. Compared to the group-affiliated and foreign companies,
standalone companies have smaller boards, possibly because they are smaller companies on the
13

average, and have more inside directors than the overall average on their boards. With regard to the
composition of non-executive directors, foreign companies have the highest proportion of such
directors identified as gray or affiliated directors compared to the domestic companies. Among the
domestic companies, the proportion of affiliated directors is understandably higher in group firms
than that of standalones given that the former are often family controlled with the promoter or close
relatives of the promoter having presence on company boards. Finally, the presence of nominee
directors is the most in group affiliated firms possibly on account of the fact that the exposure of
financial institutions to these companies is usually higher and at the same time the need for
monitoring is higher owing to concerns such as diversion of funds to group affiliates through
practices like tunneling.
Table 5 below shows for the directors of our sample companies, the proportion of busy directors by
type across ownership groups for two levels of busyness. The first level, Busyness 1 shows the
percentage of directors of different types holding three or more directorships. This measure
corresponds to the measure of busyness that has been adopted as a standard for a busy director in
existing studies. The second level of busyness, Busyness 2, is defined as the percentage of
different types of directors holding six or more directorships, where six is the upper quartile in the
distribution of directors according to the number of directorships.
As Table 5 shows, for the entire sample, around 52 per cent of executive directors (EDs) hold three
or more directorships and around 22 per cent of such directors hold six or more directorships. With
respect to the promoter executive directors (PEDs), both Busyness 1 and Busyness 2 are
significantly higher than that of EDs (73.27 and 34.81 per cent respectively). With respect to non-
executive (outside) directors (NEDs) too, it is the promoter non-executive directors (PNEDs) who
are busier on the average than an independent non-executive director, for both the measures,
Busyness 1 and Busyness 2. Several basic observations on multiple directorships in countries like
India can be made from these estimates. First, busyness of a director is as much of an insider
director phenomenon as an outside director phenomenon. Secondly, promoter directors are busier
than professional (non-promoter) directors, both in the capacity of EDs and NEDs. Combining the
busyness of directors of different types, Table 6 gives several measures of busyness of a typical
board in a large Indian company.
14

4. Empirical Analysis
4.1 Empirical Methodology
Our discussion at the beginning suggests that multiple directorships per se do not render a director
“busy”. Directors with large number of multiple appointments may be better quality directors and
hence more effective monitors. If such individuals dominate the board, then firm value might
increase. However, even for better quality directors, additional directorships beyond a certain point
will make them over-committed. If such individuals dominate the board then firm value might
decrease. In either case, however, we do not know the threshold at which we can take multiple
directorships to be a signal of quality or a signal of over commitment or “busyness”. This suggests
that the regression specification that we choose for our empirical analysis should be such that it
allows the relation between busyness and firm performance to change at some level of busyness
that is unknown to us. In keeping with this idea we felt that the spline formulation is an appropriate
specification of our regression equation. Spline is a commonly used technique in empirical analysis
to estimate a piecewise relation between two variables that allows the slope of the relation to
change at specific points known as spline knots or spline nodes. The number of spline nodes and
their specific values are to be determined from theory and/or data.
Our empirical analysis relates busyness to performance at the firm level. We therefore need a
measure that translates the busyness of the directors from the individual level to busyness at the
board level. One straightforward measure is the mean number of directorships held by the directors
on the board as is used by Ferris et al. (2003) However, as Fich and Shivdasani (2004) note, and as
our data supports, the mean is not an appropriate measure in this case, since the distribution of
directorships is generally positively skewed so that a high mean is driven by the presence of one or
two directors with a large number of multiple appointments whereas the rest may not be busy. In
this case a better measure is the median that ensures that at least majority (i.e.. 50 percent) of the
directors hold the specified number of directorships. In keeping with this idea we use the median
value to proxy the busyness of the board. However, unlike Fich and Shivdasani (2004), we do not
identify busy boards with those where 50 percent of the directors hold three or more directorships,
i.e., the median is three or more. Rather we use the median as a variable in our regression. Thus in
our analysis we essentially have a range of busy boards starting from one where more than 50 per
cent of directors hold two or more directorships, followed by a busy board where more than 50 per
15

cent hold three or more directorships and so on and then estimate the relationship between different
levels of board busyness and company performance using the spline formulation.
In estimating the relation between busyness and firm performance we consider both executive
directors as well as independent directors. Most studies with respect to the US focus on
independent directors perhaps because multiple directorships by executive directors are not very
common. However, as we have seen earlier, multiple directorships by insider directors in India is
pervasive and calls for closer scrutiny. In specifying the regression, we make a distinction between
executive directors and independent directors, because we believe that the factors that determine
multiple directorships for these two groups are likely to be different as would be the effect on firm
value. Executive directors are full time employees of the company and are entrusted with its day-to-
day operation. Additional directorships even at low levels may make them over-committed and
have negative effect on firm value. Also, the managerial market and the reputation argument that
we have discussed earlier regarding multiple directorships are more likely to apply for the
independent directors rather than the executive directors. This is particularly true in economies like
India where the corporate sector is dominated by business group companies and where we have
documented that promoters often sit on company boards as executive members. Their multiple
directorships are likely to be driven more by institutional reasons rather than the managerial market
story. For the same reasons, we exclude the affiliated non-executive directors and consider only the
independent directors in the regression.
Finally, we control our regression for other factors that might affect company value. Important
among these are corporate governance variables that have been documented in earlier studies to
influence company value. We include log of board size, proportion of independent directors, share
ownership by promoters, and share ownership by foreign institutional investors in the regression. In
addition, since a company’s current profitability might influence its market value, we include return
on assets as a control variable. Return on assets is calculated as profit before interest and tax
divided by total assets. Further, we introduce the ratio of R&D expenditure to sales and the ratio of
advertising expenditure to sales as proxies for company’s growth opportunities. Finally, we control
for firm size by introducing the log of total assets into the regression. Thus, the relation that we
estimate takes the form:
16

Company performance = f (spline(executive directors), spline(independent directors), other
corporate governance and control variables) + error
To begin with we use market-to- book ratio as a measure of company performance. We calculate
market-to-book ratio by multiplying the number of shares outstanding at the end of the year by the
mean of the closing prices observed on each trading day of the year, and dividing it by the book
value of equity at the end of the year. Later we re-estimate our regression with Tobin’s-Q, an
alternative measure of a company’s market performance, and well as return to assets and net-value-
added to assets, both of which are measures of a company’s operating performance.
4.2 Empirical Findings
Table 7 reports the results of the market-to-book regression where we have adopted a linear
specification for the median directorships of independent directors and executive directors. This
can be looked as a special case of the spline formulation where the spline node is set at the lowest
values of the corresponding variables in the sample. The linear specification is of interest because if
the quality effect is very strong or the negative effect of busyness sets in at very low levels of
multiple directorships, then we expect the linear specification to capture this. From Table 7 we
observe that the coefficient of median directorships by independent directors is positive but not
significant at the usual levels of significance. Its p-value is 0.23. In contrast, the coefficient of
median directorships by executive directors is negative and highly significant with a p-value of
0.02. Thus our initial market-to-book regression detects a strong negative effect of busyness of
executive directors but does not detect any negative effect of busyness of independent directors. If
at all, the effect for the latter appears to be weakly positive suggesting that the quality argument
may be at work.
We investigate our initial results further by estimating the market-to-book regression using the
spline formulation. We choose only one spline node for both multiple directorships by independent
directors and executive directors because this seems to be the obvious specification given our
discussion above. Since we have one spline node, there are two spline variables, spline1 and
spline2, for each type of multiple directorships. Suppose we set the node to three with respect to
17
median directorships by independent directors. Then the coefficient on the spline1 variable shows
the relation between multiple directorships and company performance up to the point where
majority of the independent directors on the board hold less than three directorships, while the
coefficient on the spline2 variable shows the relation between company performance and multiple
directorships from the point where majority of the independent directors hold three or more
directorships. If we exogenously define the median of three as the level which constitute busy
boards, then spline2 shows the relation between company performance and busy boards as is
envisaged in Fich and Shivdasani (2004), except that their analysis uses a dummy variable
formulation while the spline specification implies a linear relation. When we allow the spline node
to change, we allow the threshold that constitutes busy boards, to change. In this way, the spline
specification is a more flexible formulation.
Table 8 reports the results of the spline regressions for different nodes starting with three. With
respect to multiple directorships by independent directors we observe that for nodes equal to three
the coefficients on both the spline variables, spline1 and spline2, are statistically insignificant with
very high p-values of 0.77 and 0.36 respectively. Thus, if we use the median of three to define busy
boards, we are unable to uncover any effect of busy boards on company performance. When we set
the spline node to four, we reach the same conclusion with the p-values being 0.84 and 0.22
respectively. However, when we set the node to five we observe that while the coefficient of the
spline1 variable remains to statistically insignificant (p-value 0.32), the co-efficient on the spline2
variable is positive and highly significant with a p-value of 0.0552. When we change the node to
six, the p-value on the spline1 co-efficient is 0.23 while that on the spline2 coefficient is 0.02. This
insignificance of the spline1 variable and the positive and significant coefficient on the spline2
variable remains robust as we change the spline nodes to values beyond six and up to ten for which
there is some minimum number of observations to meaningfully estimate the effect of the spline2
variable, though, for brevity, we report the results for nodes up to eight in the table. Thus, with our
spline specification we do not find any negative relation between busyness of independent directors
and company performance. Rather we find a strong positive relation once busyness crosses a
particular threshold. This finding tends to support the view that multiple directorships can be
reflection of the quality of independent directors where the more able directors are successful in
18

attracting more directorships. This interpretation seems particularly probable because we have
uncovered the positive relation to hold only above a certain level of multiple directorships.
In sharp contrast to the results for independent directors, the co-efficient on the spline1 variable for
the executive directors is negative and highly significant while the co-efficient on the spline2
variable remains insignificant in all the regressions displayed in Table 8. For example for node
equal to three, the p-value for the spline1 variable is 0.03 (with a coefficient estimate of –0.17)
while the p-value for the spline2 variable is 0.47. Similarly for node equal to four the p-value for
the spline1 variable is 0.02 (with a co-efficient estimate of –0.12) while the p-value for the spline2
variable is 0.83. The regression results suggest that the implications of multiple directorships by
executive directors are very different from those by independent directors. Multiple directorships
by executive directors seem consistent with the busyness hypothesis with even low levels of
multiple directorships correlating negatively with company value. The insignificance of the spline2
variables is consistent with the argument that the effect of even low levels of multiple directorships
is so strong that additional directorships beyond those levels do not have any further negative effect
on company value.
The coefficients of most of the control variables are along expected lines. We find a positive and
statistically significant relation between promoters’ share and market-to-book ratio which is
consistent with the findings by earlier studies that ownership tends to correlate positively with
company value once it crosses a particular thresholds (Morck et al. (1988), McConnell and Servaes
(1990), Sarkar and Sarkar (2000)). In our sample, the mean promoters’ holding is as high as 53.58
percent. We also find shareholdings by foreign institutional investors to be positively and
significantly correlated with company performance. A company’s current profitability has a
positive and significant association with its market value. Advertising intensity is positively and
significantly related to market-to-book ratio, while R&D expenditure is not significant at the usual
levels of significance. Since both these variables are taken as proxies for a firms’ investment
opportunities, R&D expenditure does not seem to add any extra information beyond that contained
in advertising expenditure. The co-efficient of firm size is positive in all regressions though it
attends significance only at the 15 percent level. However, coefficients of two variables related to
board characteristics offer some contrast to earlier studies. First, unlike Yermack (1996), we do not
19
find board size to have any significant relation with company value and second we, find the
proportion of independent directors to correlate negatively with company value.
4.3 Robustness Checks
Our results above are obtained using market-to-book ratio as the measure of firm’s market
performance. This is a clean and well-understood measure by investors. Many studies use Tobin’s-
Q as an alternative measure of a firm’s market performance. Tobin’s-Q is defined as the ratio of
market value of equity and debt divided by the replacement cost of assets. We try to verify our
results using Tobin’s-Q as the dependent variable. Since in India a large part of debt is institutional
debt which is not traded in the capital market and companies report value of their assets at
historical costs, we proxy Tobin’s-Q with the market value of equity plus the book value of debt
divided by the book value of assets. Both market-to-book ratio and Tobin’s-Q are influenced by a
company’s growth opportunities. Our regressions control for this effect through the inclusion of
advertising expenditure and R&D expenditure as explanatory variables. However as both Yermack
(1996) and Fich and Shivdasani (2004) note, such controls may be imperfect and can confound the
statistical inferences regarding the effect of multiple directorships. Therefore, it is instructive to
verify our regressions using accounting measures that are unlikely to be driven by a firm’s
investment opportunities. We use two accounting measures namely return on assets and net-value-
added to assets. We calculate return to assets by dividing earnings before interest and tax by total
assets. In each of these regressions we set the spline node for independent directors to five as it is
at this node that spline2 variable first becomes significant, but enter the median directorships of
executive directors in a linear fashion because our earlier results indicate a strong negative effect
from very low levels of multiple directorships for these directors.
Columns A, B, and C of Table 9 reports the results of the regressions with Tobin’s-Q, return-on-
assets, and net-value-added to assets, respectively. In all of these regressions, the coefficient of the
spline1 variable for independent directors continues to be insignificant, while the co-efficient on the
spline2 is significant in the two regressions involving the accounting indicators (p-values of 0.01
and 0.0). However, in the regression involving the Tobin’s-Q, the co-efficient though positive, is
not significant at the usual levels (p-value 0.18). With respect to executive directors, the coefficient
of median directorships is negative and significant (p-value of 0.01) in the regression with Tobin’s-
20

Q. However, in the regression with return-on-assets the co-efficient is insignificant (p-value 0.23)
while in the net-value-added to assets regression the coefficient is negative and significant at the 10
percent level. Thus our additional regressions, in general tend to support the quality argument
advanced for independent directors. However, with respect to the executive directors while our
earlier conclusion regarding the negative association between market indicators and multiple
directorships is further strengthened, this conclusion is somewhat weakened when we use
accounting indicators. One possible explanation of this result could be that while firms with busy
executive directors do not experience any deterioration in their short-term performance, the market
expects such deterioration to eventually occur in the future.
4.4 Difference between Group and Non-group Companies
Till now our results have been obtained by treating group companies symmetrically with
standalone and foreign companies. However, multiple directorships in group companies raises an
additional important question namely that of appointing a same individual on the boards of multiple
companies within the same group. Such appointments need not be value reducing. Directors who
work on boards of multiple member companies may be able to co-ordinate the aims of the group in
a better way. Group companies are often vertically integrated and knowledge about future projects
of upstream and downstream companies can be highly valuable for directors in evaluating strategic
planning of companies on which they act as board members. However, multiple directorships in
group companies may also be a way by promoters of rewarding directors who have been loyal to
them in the past or indeed the initial appointment itself could be based on loyalty so as to minimize
the chance of losing control over the group in case of conflicts among owners. Anecdotal evidence
in India abounds of such family conflicts and instances of the same person being on boards of
multiple companies in the group. In the later case, multiple directorships are not driven by market
conditions and its effect on company value could go either way.
In order to address this important issue we interact the two spline variables spline1 and spline2
based on median directorships by independent directors with a dummy variable called “group”
which equals one when the company is an affiliated to a business group and zero otherwise. The
coefficient on the variable “spline1 * group” then gives the difference in effect between group
companies and non-group companies (foreign and standalone companies) of multiple directorships
21

below a threshold level, while the coefficient of the variable “spline2 * group” gives this difference
above the threshold level. We set the threshold level to five and introduce the median directorships
by executive directors in the linear fashion based on the logic outlined earlier.
Columns A, B, C, D, of Table 10 reports the results of this regression based on the four alternative
measures of company performance, namely MBVR, Q-Ratio, return to assets, and net value added
to assets. In each of these four regressions the coefficient of the two spline variables namely spline1
and spline2 are qualitatively as same as before. The coefficient on the spline1 variable is never
significant while the coefficient on the spline2 variable is positive and highly significant. However,
these coefficients are now applicable only to standalone companies and foreign companies. For
group companies, we need to refer to the coefficients of the interaction terms. We observe that in
each of these four regressions the coefficient of the first interaction term is negative but attends
significance only in the net value added regression. In contrast, the coefficient on the second
interaction variable is negative and significant in the first three regressions, while in the net value
added regression it is negative but not significant at the conventional levels. Thus, our results
suggest that there is a remarkable difference in the effect of multiple directorships between group
and non-group companies. Compared to non-group companies, the effect of multiple directorships
above the threshold is significantly lower for the group companies. The total effect of for group
companies of course is the sum of the coefficient of the spline variable and the coefficient of the
corresponding interaction variable. The coefficients associated with “spline2” and “spline2 *
group” are opposite in sign but similar in magnitude in the first three regressions suggesting that the
total effect is small. A Wald test on the null hypothesis that the sum of these coefficients is equal to
zero fails to reject the null hypothesis even at the 10 percent level. Thus our regressions suggest
that the quality hypothesis that we had advanced earlier is applicable largely to the non-group
companies. For group companies this conclusion is supported by only one of the four regressions
i.e., net value added to assets regression, while the remaining three regressions indicate no such
positive effect. However, a point to note is that even for group companies our regressions fail to
detect any negative effect of multiple directorships by independent directors.
22
5. Conclusions
In this paper we have examined the effect of multiple directorships on company performance in an
emerging economy. Our regressions support that idea that busyness may sometimes proxy for
director quality. The fact that we have been unable to detect any negative effect of busyness in our
sample even when a significant proportion of independent directors hold directorships much in
excess of three directorships should not come as a surprise. As we have outlined in the beginning,
the level beyond which multiple directorships have a negative effect on company performance is
dependent on two things. First the demands of the job i.e., the nature of tasks directors are required
to perform on company boards, which in turn depends on the characteristics of the company, and
two, the ability of the directors. In the US where companies are much bigger in size and many of
them have complex operations cutting across nations, the demands of the job may be very high.
Accordingly, even three directorships may make a director over-committed notwithstanding their
ability. In contrast, in countries like India, where companies are much smaller and relatively few of
them are transnational in nature, the level at which over commitment sets in may be much higher.
In the same spirit, the effect of multiple directorships by executive directors may be different than
that by independent directors, because the demands of the formers’ job are different. Finally, our
analysis suggests that there is a difference between group and non-group companies. The quality
argument does not seem to hold for busy directors of group companies. Multiple directorships in
group companies may be driven by more complex reasons. One possibility that we have outlined is
that promoters may appoint same directors on the boards of member firms. This can force these
directors to align their interests with that of the promoters as doing otherwise may be costly.
Unfortunately we are unable to verify this because our current sample is inadequate to track all the
companies in which independent directors hold their directorships. But this is an interesting area of
work that we plan to investigate in the future.
23

References
Beasley, Mark, 1996, An empirical analysis of the relation between board of director composition and financial statement fraud, The Accounting Review 71, 443-465.
Bhagat, Sanjai and Bernard Black, 2002, The Non-Correlation between Board Independence and Long-Term Firm Performance, The Journal of Corporation Law, 27, 231-273. Booth, James and Daniel Deli, 1995, Factors affecting the number of outside directors held by CEOs, Journal of Financial Economics, 40, 81-104. Core, James Robert Holthausen and David Larcker, 1999, Corporate governance, chief executive officer compensation, and firm performance, Journal of Financial Economics 51, 371-406. Cotter, James, Anil Shivdasani and Marc Zenner, 1997, Do independent directors enhance target shareholder wealth during tender offers? Journal of Financial Economics 43, 195-218.
European Corporate Governance Institute, Codes and Principles, http://www.ecgi.org/codes/index.php
Fama, Eugene, 1980, Agency Problems and the Theory of the Firm, Journal of Political Economy, 88, 288-307.
Fama, Eugene and Michael Jensen, 1983, Separation of ownership and control, Journal of Law and Economics 26, 301-326. Ferris, Stephen, Murali Jagannathan and A. C. Pritchard, 2003, Too busy to mind business? Monitoring by Directors with Multiple Board Appointments, Journal of Finance, LVIII 3, 1087-1111. Fich, Eliezer and Anil Shivdasani, 2004, Are busy boards effective monitors?, Working Paper, Kenan-Flagler Business School, University of North Carolina. Kust, Mathew, 1964, Foreign enterprises in India: Laws and Policies, Chapel Hill: The University of North Carolina Press. McConnell, John and Henri Servaes, 1990, Additional evidence on equity ownership and corporate value, Journal of Financial Economics, 27, 595-612. Mehta, M. M., 1955, The structure of Indian industries, Bombay, Popular Book Depot. Miwa, Yoshiro, and J. Mark Ramseyer, 2000, Corporate governance in transitional economies: Lessons from the pre-war Japanese cotton textile industry, Journal of Legal Studies 29, 171- 204. Morck, Randall, Andrei Shleifer and Robert W. Vishny, 1988, Management ownership and market
24

valuation: An empirical analysis, Journal of Financial Economics, 20, 293-315. Organisation for Economic Co-operation and Development, 2003, White Paper on Corporate Governance in Asia. www.oecd.org/dataoecd/4/12/2956774.pdf Pfeffer, J. ,1972, Interorganizational influence and managerial attitudes, Academy of Management Journal, 15, 317-330. Sarkar, Jayati and Subrata Sarkar, 2000, Large Shareholder Activism in Corporate Governance in Developing Countries: Evidence from India, International Review of Finance, Vol. 1, No.3, 161-194. Shivdasani, Anil and David Yermack, 1999, CEO involvement in the selection of new board members: An empirical analysis, Journal of Finance 54, 1829-1853. Yermack, David, 1996, A higher market valuation of companies with a small board of directors, Journal of Financial Economics 40, 185-205.
25

Table 1: Multiple Directorships: Limits on Directorial Positions China India Indonesia Malaysia Pakistan Philippines Singapore South Korea Thailand UK USA
None Yes; Not more than 10 for managing director; Not more than 20 for others; exclusions; penalties for violation; Recommended : Not more than 15 (maximum 10 listed companies), 1+2 for managing director. None Yes; 10 listed companies; 15 otherwise. Yes; Maximum 10. None None Yes; Maximum 2 for non-executive directors None; except for bank directors; maximum 5. None; executive director recommended to not sit in more than one other board of a large listed company. None; No limit: Recommended: not more than 2 (CII Core Principles)
Source: White Paper on Corporate Governance in Asia, (OECD 2003); Codes and Principles, European Corporate Governance Institute, http://www.ecgi.org/codes/index.php
26

Table 2a: Distribution of Directors in Terms of Directorships Held As Reported in the Corporate Governance Report
No. of Cumulative Cumulative
directorships Frequency Percent Frequency Percent 1 1104 28.37 1104 28.37 2 613 15.75 1717 44.13 3 454 11.67 2171 55.80 4 349 8.97 2520 64.76 5 238 6.12 2758 70.88 6 233 5.99 2991 76.87 7 167 4.29 3158 81.16 8 148 3.80 3306 84.97 9 123 3.16 3429 88.13 10 103 2.65 3532 90.77 11 80 2.06 3612 92.83 12 64 1.64 3676 94.47 13 61 1.57 3737 96.04 14 55 1.41 3792 97.46 15 40 1.03 3832 98.48 16+ 52 1.52 3891 100.00
Table 2b: Distribution of Directors in Terms of Directorships Held In the 500 Sample Companies
No. of Cumulative Cumulative directorships Frequency Percent Frequency Percent 1 3174 81.57 3174 81.57 2 474 12.18 3648 93.75 3 136 3.50 3784 97.25 4 57 1.46 3841 98.71 5 30 0.77 3871 99.49 6+ 20 0.51 3891 100.00
27
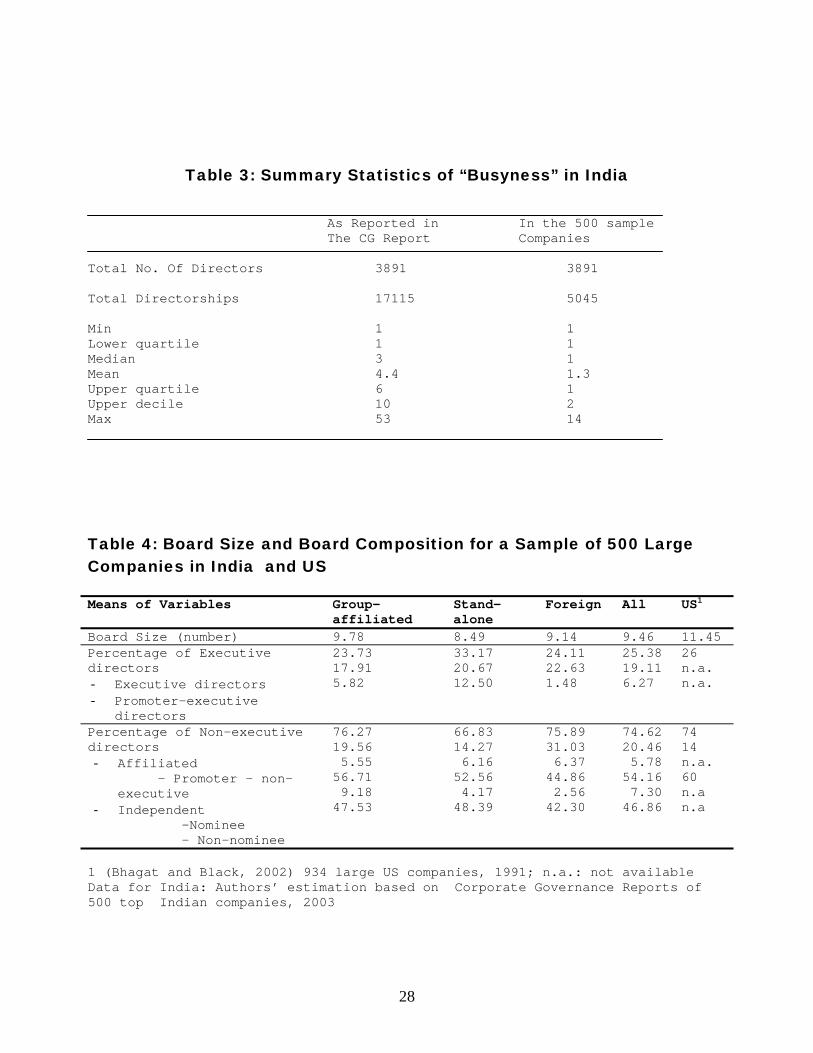
Table 3: Summary Statistics of “Busyness” in India As Reported in In the 500 sample The CG Report Companies Total No. Of Directors 3891 3891 Total Directorships 17115 5045 Min 1 1 Lower quartile 1 1 Median 3 1 Mean 4.4 1.3 Upper quartile 6 1 Upper decile 10 2 Max 53 14
Table 4: Board Size and Board Composition for a Sample of 500 Large Companies in India and US Means of Variables Group-
affiliated Stand-alone
Foreign All US1
Board Size (number) 9.78 8.49 9.14 9.46 11.45 Percentage of Executive directors - Executive directors - Promoter-executive
directors
23.73 17.91 5.82
33.17 20.67 12.50
24.11 22.63 1.48
25.38 19.11 6.27
26 n.a. n.a.
Percentage of Non-executive directors - Affiliated
- Promoter – non-executive
- Independent -Nominee - Non-nominee
76.27 19.56 5.55 56.71 9.18 47.53
66.83 14.27 6.16 52.56 4.17 48.39
75.89 31.03 6.37 44.86 2.56 42.30
74.62 20.46 5.78 54.16 7.30 46.86
74 14 n.a. 60 n.a n.a
1 (Bhagat and Black, 2002) 934 large US companies, 1991; n.a.: not available Data for India: Authors’ estimation based on Corporate Governance Reports of 500 top Indian companies, 2003
28
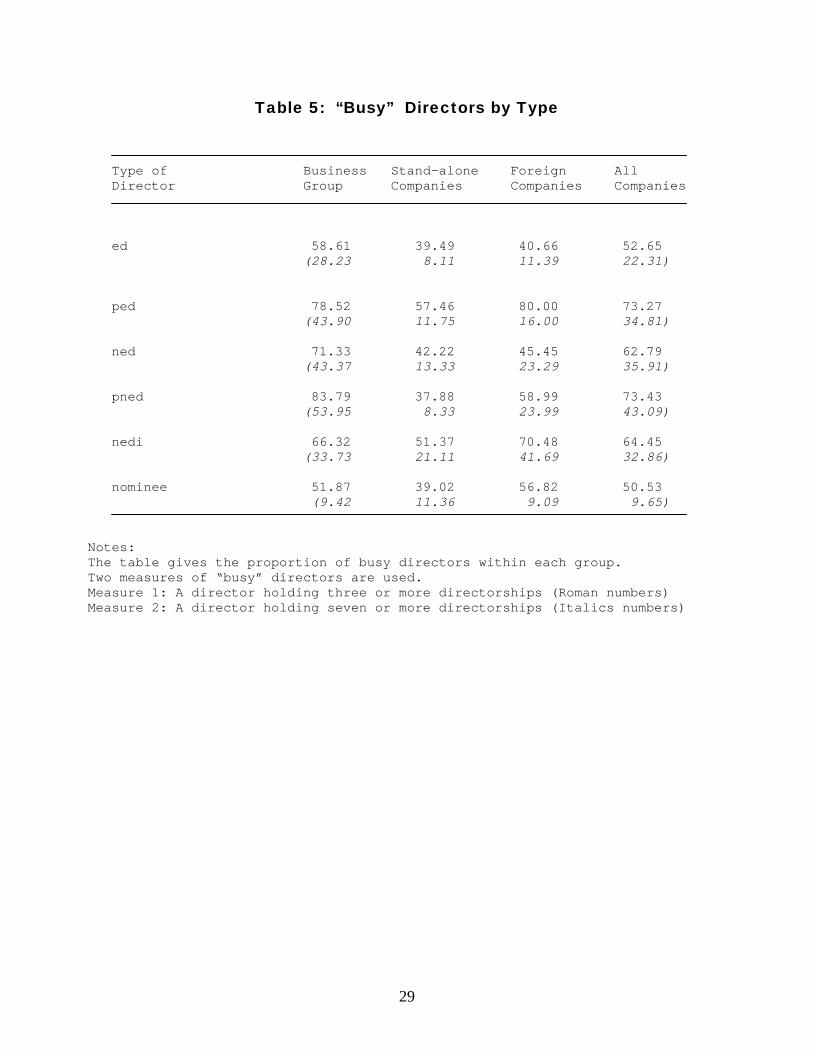
Table 5: “Busy” Directors by Type
Type of Business Stand-alone Foreign All Director Group Companies Companies Companies ed 58.61 39.49 40.66 52.65 (28.23 8.11 11.39 22.31) ped 78.52 57.46 80.00 73.27 (43.90 11.75 16.00 34.81) ned 71.33 42.22 45.45 62.79 (43.37 13.33 23.29 35.91) pned 83.79 37.88 58.99 73.43 (53.95 8.33 23.99 43.09) nedi 66.32 51.37 70.48 64.45 (33.73 21.11 41.69 32.86) nominee 51.87 39.02 56.82 50.53 (9.42 11.36 9.09 9.65) Notes: The table gives the proportion of busy directors within each group. Two measures of “busy” directors are used. Measure 1: A director holding three or more directorships (Roman numbers) Measure 2: A director holding seven or more directorships (Italics numbers)
29

Table 6: “Busyness” of a Typical Board in India
Business Stand-alone Foreign All Group Companies Companies Companies Companies Mean directorship 5.49 3.60 4.80 5.06 per director Median directorship 4.85 2.94 3.24 4.28 per director Max. directorship 11.94 8.81 13.10 11.60 by a director on the board Percentage of busy 67.04 47.17 53.13 61.53 Directors (busy = 3+ directorships)
30
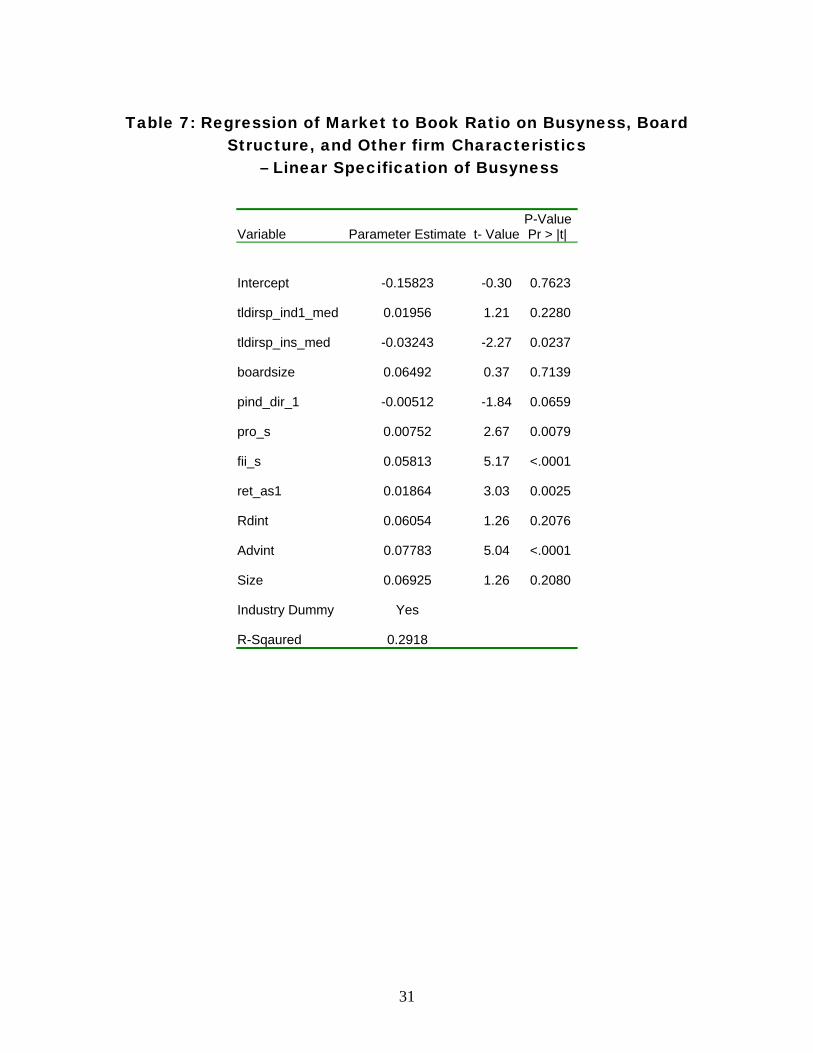
Table 7: Regression of Market to Book Ratio on Busyness, Board Structure, and Other firm Characteristics
– Linear Specification of Busyness
Variable Parameter Estimate t- ValueP-Value Pr > |t|
Intercept -0.15823 -0.30 0.7623
tldirsp_ind1_med 0.01956 1.21 0.2280
tldirsp_ins_med -0.03243 -2.27 0.0237
boardsize 0.06492 0.37 0.7139
pind_dir_1 -0.00512 -1.84 0.0659
pro_s 0.00752 2.67 0.0079
fii_s 0.05813 5.17 <.0001
ret_as1 0.01864 3.03 0.0025
Rdint 0.06054 1.26 0.2076
Advint 0.07783 5.04 <.0001
Size 0.06925 1.26 0.2080
Industry Dummy Yes
R-Sqaured 0.2918
31

Table 8: Regression of Market to Book Ratio on Busyness, Board Structure, and Other Firm Characteristics
– Spline Specification of Busyness Spline Node 3 4 5 6 7 8
Estimate P-value Estimate
P-value Estimate P-value Estimate
P-value Estimate
P-value Estimate P-value
Intercept 0.02680 0.9616 0.01071 0.9840 -0.00388 0.9941 -0.03359 0.9487 -0.06502 0.9006 -0.09902 0.8491spline1 0.03107 0.7698 -0.01246 0.8401 -0.04385 0.3167 -0.04083 0.2357 -0.03696 0.1979 -0.02610 0.2969spline2 0.01770 0.3611 0.02632 0.2276 0.04751 0.0552 0.06459 0.0238 0.08677 0.0093 0.10328 0.0088spline1_I -0.17071 0.0345 -0.12450 0.0181 -0.10172 0.0093 -0.08277 0.0082 -0.06495 0.0140 -0.05525 0.0171spline2_I -0.01314 0.4694 -0.00431 0.8347 0.00667 0.7767 0.01485 0.5829 0.01686 0.5932 0.02035 0.5863Boardsize 0.08101 0.6478 0.08605 0.6271 0.09625 0.5860 0.09337 0.5965 0.08425 0.6324 0.07660 0.6637pind_dir_1 -0.00557 0.0464 -0.00539 0.0536 -0.00513 0.065 -0.00491 0.0770 -0.00470 0.0902 -0.00464 0.0945pro_s 0.00739 0.009 0.00753 0.0077 0.00758 0.0072 0.00760 0.0070 0.00769 0.0063 0.00766 0.0065fii_s 0.05921 <.0001 0.05975 <.0001 0.06042 <.0001 0.06083 <.0001 0.06060 <.0001 0.05976 <.0001ret_as1 0.01865 0.0025 0.01838 0.003 0.01787 0.0038 0.01760 0.0042 0.01746 0.0045 0.01771 0.0040Rdint 0.06300 0.1894 0.06275 0.1909 0.06165 0.1976 0.06235 0.1919 0.06452 0.1767 0.06717 0.1602Advint 0.07861 <.0001 0.07949 <.0001 0.08095 <.0001 0.08071 <.0001 0.07980 <.0001 0.07907 <.0001Size 0.07296 0.185 0.07990
0.1481 0.08672 0.1163 0.08759 0.1120 0.08848
0.1083 0.08771 0.1116
Industry Dummy
Yes Yes Yes Yes Yes YesR-squared 0.2963 0.2973 0.3011 0.3029 0.3038 0.3029
32

Table 9: Regression of Alternative Measures of Firm Performance on Busyness, Board Structure, and Other Firm Characteristics
Column A Column B Column C Q-ratio Return-to assets Net Value Added to Assets Estimate P-Value Estimate P-Value Estimate P-Value Intercept 0.25435 0.2723 -0.24430 0.9503 16.83406 0.0011spline1 -0.03054 0.1151 -0.26841 0.4122 -0.30610 0.4763spline2 0.01460 0.1821 0.49019 0.0078 0.89320 0.0002tldirsp_ins_med -0.01685 0.0080 -0.12716 0.2346 -0.22930 0.1028boardsize -0.03003 0.7002 0.53500 0.6851 1.42477 0.4109pind_dir_1 -0.00130 0.2904 -0.00679 0.7432 0.00101 0.9705pro_s 0.00137 0.2701 0.08451 <.0001 0.10941 <.0001fii_s 0.02992 <.0001 0.35004 <.0001 0.58892 <.0001ret_as1 0.02077 <.0001 Rdint 0.02888 0.1721 1.14113 0.0013 1.82575 <.0001Advint 0.03616 <.0001 0.26835 0.0195 0.75074 <.0001Size 0.06759 0.0055 0.33785 0.4101 -1.71138 0.0016 Industry Dummy Yes Yes Yes R-squared 0.4041 0.2973 0.3011
33
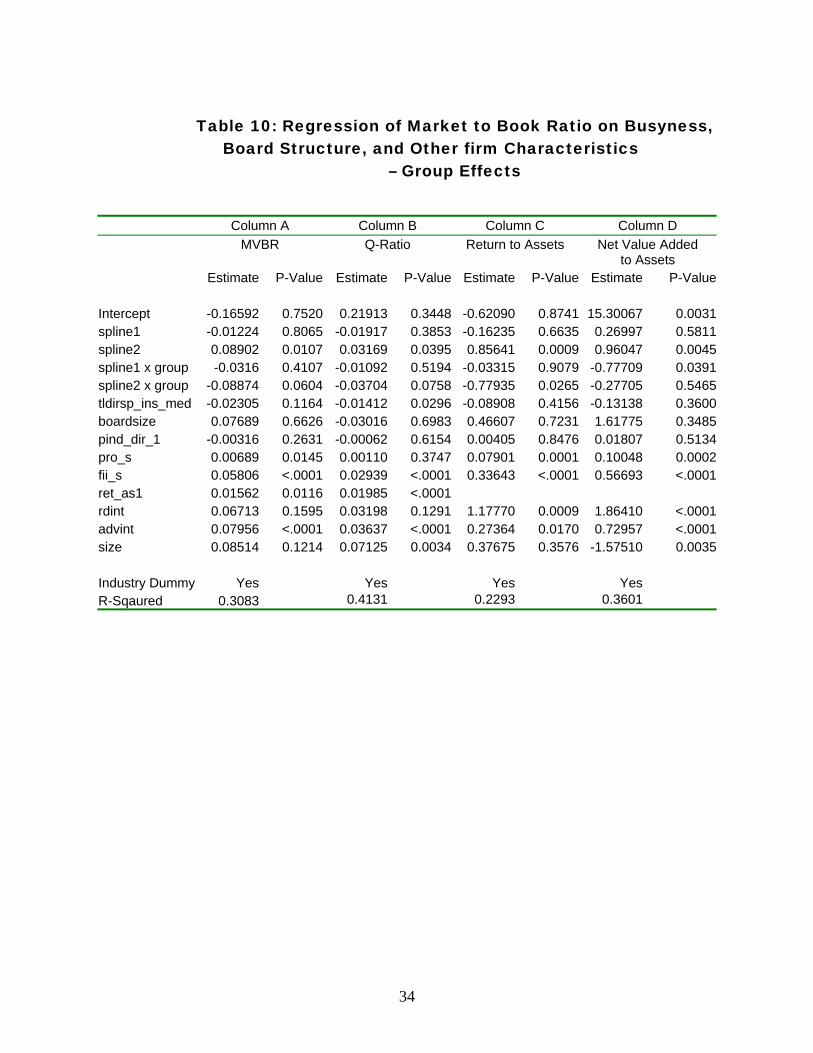
Table 10: Regression of Market to Book Ratio on Busyness,
Board Structure, and Other firm Characteristics – Group Effects
Column A Column B Column C Column D
MVBR Q-Ratio Return to Assets Net Value Added
to Assets Estimate P-Value Estimate P-Value Estimate P-Value Estimate P-Value
Intercept -0.16592 0.7520 0.21913 0.3448 -0.62090 0.8741 15.30067 0.0031spline1 -0.01224 0.8065 -0.01917 0.3853 -0.16235 0.6635 0.26997 0.5811spline2 0.08902 0.0107 0.03169 0.0395 0.85641 0.0009 0.96047 0.0045spline1 x group -0.0316 0.4107 -0.01092 0.5194 -0.03315 0.9079 -0.77709 0.0391spline2 x group -0.08874 0.0604 -0.03704 0.0758 -0.77935 0.0265 -0.27705 0.5465tldirsp_ins_med -0.02305 0.1164 -0.01412 0.0296 -0.08908 0.4156 -0.13138 0.3600boardsize 0.07689 0.6626 -0.03016 0.6983 0.46607 0.7231 1.61775 0.3485pind_dir_1 -0.00316 0.2631 -0.00062 0.6154 0.00405 0.8476 0.01807 0.5134pro_s 0.00689 0.0145 0.00110 0.3747 0.07901 0.0001 0.10048 0.0002fii_s 0.05806 <.0001 0.02939 <.0001 0.33643 <.0001 0.56693 <.0001ret_as1 0.01562 0.0116 0.01985 <.0001 rdint 0.06713 0.1595 0.03198 0.1291 1.17770 0.0009 1.86410 <.0001advint 0.07956 <.0001 0.03637 <.0001 0.27364 0.0170 0.72957 <.0001size 0.08514 0.1214 0.07125 0.0034 0.37675 0.3576 -1.57510 0.0035 Industry Dummy Yes Yes Yes YesR-Sqaured 0.3083 0.4131 0.2293 0.3601
34