Multimodality Imaging of Anatomy and Function in Coronary ...
393
Multimodality Imaging of Anatomy and Function in Coronary Artery Disease Schuijf, J.D. Citation Schuijf, J. D. (2007, October 18). Multimodality Imaging of Anatomy and Function in Coronary Artery Disease. Retrieved from https://hdl.handle.net/1887/12423 Version: Corrected Publisher’s Version License: Licence agreement concerning inclusion of doctoral thesis in the Institutional Repository of the University of Leiden Downloaded from: https://hdl.handle.net/1887/12423 Note: To cite this publication please use the final published version (if applicable).
-
Upload
khangminh22 -
Category
Documents
-
view
3 -
download
0
Transcript of Multimodality Imaging of Anatomy and Function in Coronary ...

Multimodality Imaging of Anatomy and Function inCoronary Artery DiseaseSchuijf, J.D.
CitationSchuijf, J. D. (2007, October 18). Multimodality Imaging of Anatomy andFunction in Coronary Artery Disease. Retrieved fromhttps://hdl.handle.net/1887/12423 Version: Corrected Publisher’s Version
License:Licence agreement concerning inclusion of doctoralthesis in the Institutional Repository of the Universityof Leiden
Downloaded from: https://hdl.handle.net/1887/12423 Note: To cite this publication please use the final published version (ifapplicable).

Multimodality Imaging of Anatomy and
Function in Coronary Artery Disease
Joanne D. Schuijf

The research described in this thesis was performed at the departments of Cardiology and Radiology of the Leiden University Medical Center, Leiden, the Netherlands.
Cover: Joanne D. Schuijf
Lay-out: Buijten en Schipperheijn
Printed by: Buijten en Schipperheijn
ISBN: 978-90-9022196-0
Copyright © 2007 Joanne D Schuijf, Leiden, The Netherlands. All rights reserved. No parts of this book may be reproduced or transmitted, in any form or by any means, without prior permission of the author.
Financial support to the costs associated with this thesis from Toshiba Medical Systems BV, Vital Images BV, Biotronik BV, Stichting EMEX, Foundation Imago, J.E. Jurriaanse Stichting, Medtronic BV, Astellas Pharma BV, St Jude Medical BV, Tyco Healthcare BV, Amgen BV (Breda), Boehringer Ingelheim BV, GE Healthcare Medical Diagnostics (Eindhoven), Pfizer BV, Siemens BV, Bristol-Myers Squibb, Boston Scientific Benelux BV, Merck Sharp & Dohme BV is gratefully acknowledged.

Multimodality Imaging
of
Anatomy and Function
in
Coronary Artery Disease
Proefschrift
ter verkrijging van
de graad van Doctor aan de Universiteit Leiden,op gezag van Rector Magnificus prof.mr. P.F. van der Heijden,
volgens besluit van het College voor Promotieste verdedigen op Donderdag 18 oktober 2007
klokke 16.15 uur
door
Joanne Désirée Schuijf
geboren te Rotterdamin 1980

Promotiecommissie
Promotores: Prof. Dr. E. E. van der Wall
Prof. Dr. J. J. Bax
Prof. Dr. A. de Roos
Referent: Dr. W. Wijns (Cardiovascular Center, Aalst, België)
Overige leden: Prof. Dr. P. J. de Feyter (Erasmus Universiteit, Rotterdam)
Prof. Dr. J. W. Jukema
Prof. Dr. J. H. C. Reiber
Prof. Dr. M. J. Schalij
The research described in this thesis was supported by a grant of the Netherlands Heart
Foundation (grant nr. NHF-2002B105) and the Interuniversity Cardiology Institute of the
Netherlands.
Financial support by the Netherlands Heart Foundation and the Interuniversity Cardiology
Institute of the Netherlands for the publication of this thesis is gratefully acknowledged.

Voor mijn ouders
en Roeland

Table of Contents
General Introduction
Chapter 1 Introduction to Non-Invasive Imaging in Coronary Artery Disease
Based on:
Cardiac Imaging in Coronary Artery Disease: Differing Modalities
Heart 2005; 91: 1110-1117
Part I Non-Invasive Coronary Angiography with Multi-Slice
Computed Tomography; Introduction and Diagnostic Accuracy
Chapter 2 Multi-Slice CT Coronary Angiography: How to do it and What is the
Current Clinical Performance?
Eur J Nucl Med Mol Imaging 2005; 32: 1337-1347
Chapter 3 Non-Invasive Coronary Imaging and Assessment of Left Ventricular
Function Using 16-slice Computed Tomography
Am J Cardiol2005; 95: 571-574
Chapter 4 Diagnostic Accuracy of 64-slice Multi-Slice Computed Tomography
in the Non-Invasive Evaluation of Significant Coronary Artery Disease
Am J Cardiol2006; 98: 145-148.
Chapter 5 Meta-Analysis of Comparative Diagnostic Performance of Magnetic
Resonance Imaging and Multi-Slice Computed Tomography for
Non-Invasive Coronary Angiography
Am Heart J 2006; 151: 404-411
Part II Defining Patient Populations
A Coronary Risk Factors
Chapter 6 Non-Invasive Angiography and Assessment of Left Ventricular
Function using Multi-Slice Computed Tomography in Patients with
Type 2 Diabetes
Diabetes Care 2004; 27: 2905-2910
1
11
28
31
51
61
71
86
86
89

Chapter 7 Non-Invasive Evaluation of the Coronary Arteries with Multi-Slice
Computed Tomography in Hypertensive Patients
Hypertension 2005; 45: 227-232
Chapter 8 Do Risk Factors influence the Diagnostic Accuracy of Non-Invasive
Coronary Angiography with Multi-Slice Computed Tomography?
J Nucl Cardiol 2006;13: 635-641.
B After Revascularization
Chapter 9 Feasibility of Assessment of Coronary Stent Patency using 16-slice
Multi-Slice Computed Tomography
Am J Cardiol 2004; 94: 427-430
Chapter 10 Usefulness of 64-slice Multi-Slice Computed Tomography Coronary
Angiography to assess In-stent Restenosis
J Am Coll Cardiol 2007; 49: 2204-10
Chapter 11 Evaluation of Patients with Previous Coronary Stent Implantation
using 64-slice Multi-Slice Computed Tomography
Radiology 2007
Chapter 12 Validation of a High-Resolution, Phase Contrast Cardiovascular
Magnetic Resonance Sequence for Evaluation of Flow in Coronary
Artery Bypass Grafts
J Cardiovasc Magn Reson 2007; 9: 557-563
Part III Anatomical versus Functional Imaging in the Evaluation of
Coronary Artery Disease
Chapter 13 Diagnostic and Prognostic Value of Non-Invasive Imaging in Known
or Suspected Coronary Artery Disease.
Eur J Nucl Med Mol Imaging 2006; 33: 93-104
Chapter 14 Relationship between Non-Invasive Coronary Angiography with
Multi-Slice Computed Tomography and Myocardial Perfusion Imaging
J Am Coll Cardiol2006; 48: 2508-2514.
103
117
130
133
145
159
175
190
193
215

Chapter 15 Editorial: Changing Paradigm: Atherosclerosis versus Ischemia
Eur J Nucl Med Mol Imaging2007; 34: 1-3.
Chapter 16 Comparative Regional Analysis of Coronary Atherosclerosis and
Calcium Score on Multi-Slice Computed Tomography versus
Myocardial Perfusion on SPECT
J Nucl Med 2006; 47: 1749-1755.
Chapter 17 Evaluation of Coronary Artery Disease: Implications of Invasive
versus Non-Invasive Imaging
Submitted
Part IV Coronary Plaque Imaging and Prognostification
Chapter 18 Differences in Plaque Composition and Distribution in Stable
Coronary Artery Disease versus Acute Coronary Syndromes; Non-
Invasive Evaluation with Multi-Slice Computed Tomography.
Acute Cardiac Care 2007; 9: 48-53
Chapter 19 Non-Invasive Assessment of Plaque Characteristics with Multi-
Slice Computed Tomography Coronary Angiography in
Symptomatic Diabetic Patients.
Diabetes Care 2007; 30: 1113-1139.
Chapter 20 Prognostic Value of multi-slice Computed Tomography Coronary
Angiography in Patients with Known or Suspected CAD.
J Am Coll Cardiol 2007; 49: 62-70
Part V Non-Coronary Imaging
Chapter 21 Quantification of Myocardial Infarct Size and Transmurality by
Contrast-enhanced Magnetic Resonance Imaging in Men.
Am J Cardiol 2004; 94: 284-288
Chapter 22 Comprehensive Cardiac Assessment with Multi-Slice Computed
Tomography: Evaluation of Left Ventricular Function and Perfusion
in addition to Coronary Anatomy in Patients with Previous
Myocardial Infarction.
Heart 2006; 92: 1779-1783
231
237
253
268
270
283
295
312
315
327

Chapter 23 Assessment of Left Ventricular Volumes and Ejection Fraction with
16-slice Multi-Slice Computed Tomography; Comparison with 2D-
Echocardiography.
Int J Cardiol 2006; 13: 480-487.
Chapter 24 Non-Invasive Visualization of the Cardiac Venous System in
Coronary Artery Disease Patients using 64-slice Computed Tomography.
J Am Coll Cardiol 2006; 48: 1832-1838.
Summary and Conclusions
Samenvatting en Conclusies
List of Publications
Dankwoord
Curriculum Vitae
341
351
365
375
385
393
397


Cardiac Imaging in Coronary Artery Disease:
DifferingModalities
Based on
Heart 2005; 91: 1110-1117
Joanne D. Schuijf, Leslee J. Shaw, William Wijns, Hildo J. Lamb, Don Poldermans, Albert de Roos, Ernst E. van der Wall, Jeroen J. Bax
1Chapter


13Cardiac Imaging in Coronary Artery Disease: Differing Modalities
Introduction
Coronary artery disease (CAD) remains one of the leading causes of morbidity and mortality worldwide.
Moreover, the disease is reaching endemic proportions and will put an enormous strain on health care eco-
nomics in the near future. Non-invasive testing is important to exclude CAD with a high certainty on the one
hand, and to detect CAD with its functional consequences at an early stage, to guide optimal patient man-
agement, on the other hand. For these purposes, non-invasive imaging techniques have been developed
and used extensively over the last years. Currently, the main focus of non-invasive imaging for diagnosis of
CAD is twofold: 1. functionalimaging, assessing the hemodynamic consequences of obstructive CAD, and
2. anatomicalimaging, visualizing non-invasively, the coronary artery tree. For functional imaging, nuclear
cardiology, stress echocardiography and magnetic resonance imaging (MRI) are used, whereas for anatomi-
cal imaging or non-invasive angiography, MRI, multi-slice CT (MSCT) and electron beam CT (EBCT) are used.
The aim of this chapter is to update the reader on the current status of non-invasive imaging, with a special
focus on functional imaging versus anatomical imaging for the detection of CAD. The accuracies of the
different imaging modalities are illustrated using pooled analyses of the available literature data when
available.
Functional Imaging
What information does functional imaging provide?
The hallmark of functional imaging is the detection of CAD by assessing the hemodynamical consequences
of CAD rather than by direct visualization of the coronary arteries. For this purpose, regional perfusion
or wall motion abnormalities are induced (or worsened) during stress, reflecting the presence of stress-
induced ischemia. Ischemia induction is based on the principle that although resting myocardial blood
flow in regions supplied by stenotic coronary arteries is preserved, the increased flow demand during stress
cannot be met, resulting in a sequence of events referred to as “the ischemic cascade” 1. Initially perfusion
abnormalities are induced, followed by diastolic and (at a later stage) systolic dysfunction; only at the very
end of the cascade, ECG changes and angina occur (Figure 1).
Accordingly, the occurrence of perfusion abnormalities during stress may be more sensitive for the
detection of CAD than the induction of systolic dysfunction (wall motion abnormalities).
Currently, functional imaging can be performed using (gated) SPECT or PET, (contrast) stress
echocardiography and MRI; all techniques allow integrated assessment of perfusion and function, at rest
and after stress and are used clinically according to local availability and expertise.
Types of stress
An increased demand can be achieved through physical (bicycle or treadmill) exercise, or (in
patients unable to exercise), pharmacological stress can be applied including adrenergic stimulation

14 Chapter 1
and vasodilation. Dobutamine (a beta-1-specific agonist) increases heart-rate, contractility and
arterial blood pressure, resulting in increased myocardial oxygen demand. The vasodilators include
dipyridamole and adenosine. Adenosine is a direct vasodilator, while dipyridamole inhibits cellular
uptake and breakdown of adenosine. Dipyridamole therefore has a slower onset, while its effect lasts
longer. Aminophylline can be used as antidote.
Safety of all pharmacological stressors has been investigated extensively and although continuous
patient monitoring is required, severe complications are rare 2;3.
Which modalities are available for functional imaging?
SPECT,assessmentofperfusion
Most experience for assessment of perfusion in daily clinical practice has been obtained with SPECT.
Three radiopharmaceuticals are used: thallium-201, technetium-99m sestamibi and technetium-99m
Figure 2. Example of a reversible defect on technetium-99m tetrofosmin SPECT. Panels A and B show short-axis slices following stress and at rest, respectively. A reversible defect is present in the anterior and antero-lateral regions (white arrows), illustrating stress-inducible ischemia. A fixed perfusion defect, most likely representing scar tissue is present in the postero-lateral and inferior region.
Figure 1. The ischemic cascade represents the sequence of pathophysiological events following ischemia.

15Cardiac Imaging in Coronary Artery Disease: Differing Modalities
tetrofosmin. Currently, the technetium-99m labeled tracers are preferred for their higher photon energy
resulting in less attenuation artefacts. Two sets of images are obtained: after stress and at rest. In general,
reversible and irreversible defects are considered indicative of CAD. While reversible (stress-induced)
defects reflect ischemia, irreversible (fixed) defects mainly represent infarcted myocardium (Figure 2).
Images are interpreted visually or using automated quantification. For segmentation of the left
ventricle (LV), a 17-segment model is developed, that can be applied to all functional imaging
modalities4. To assess the diagnostic accuracy of SPECT for detection of CAD, Underwood et al
pooled 79 studies (n=8964 patients) showing a weighted mean sensitivity and specificity of 86%
and 74% (Figure 3) 5. The lower specificity of SPECT may be (partially) attributable to referral bias, i.e.
among patients with normal SPECT studies, only those with a high suspicion for CAD are referred for
coronary angiography. To overcome this problem, the normalcy rate has been introduced, which is
the percentage of normal SPECT studies in a population with a low likelihood of CAD. Pooled analysis
of 10 studies (n=543 patients) showed a normalcy rate of 89%.5
Figure 3. Sensitivities and specificities of SPECT imaging for the detection of CAD, using different stressors (Based on reference 5).
SPECT,assessmentofsystolicfunction
The introduction of ECG-gated SPECT imaging, has allowed assessment of global and regional
LV function in addition to perfusion. Direct comparisons between gated SPECT and MRI (or
echocardiography) showed excellent correlations for assessment of LV ejection fraction, volumes
and regional wall motion6;7. Addition of these systolic function parameters has improved diagnostic
accuracy. In particular, artefacts caused by soft tissue attenuation, could be unmasked by the
demonstration of normal wall motion. This resulted in a substantial reduction of false-positive test
results 8. Integration of perfusion and systolic function by SPECT resulted in a significant reduction
(from 31% to 10%) of inconclusive tests, with in an increase in normalcy rate from 74% to 93% 9.
87
73
908585
79
89
66
86
74
0
20
40
60
80
100
Sensitivity Specificity
%
Exercise
Adenosine
Dobutamine
Dipyridamole
Combined

16 Chapter 1
Echocardiography,assessmentofsystolicfunction
Stress echocardiography is readily available for the routine evaluation of (stress-inducible) wall
motion abnormalities (Figure 4); both resting and stress-induced (or worsened) wall motion
abnormalities are indicative of CAD. While stress-induced (or worsened) wall motion abnormalities
reflect ischemia, resting wall motion abnormalities mainly represent infarcted myocardium.
Figure 4. Example of a stress-induced wall motion abnormality on dobutamine echocardiography. Panels A, B, C and D are obtained during rest, low- (10 μg/kg/min) and high-dose dobutamine (40 μg/kg/min) and recovery. In the septal region (white arrow), normal wall motion is present at rest and during low-dose dobutamine infusion, whereas dyskinesia is induced at high-dose dobutamine.
A total of 15 studies (n=1849 patients) used exercise echocardiography to detect CAD, with a
weighted mean sensitivity and specificity of 84% and 82%.10 Pooled data from 28 dobutamine
echocardiography studies (n=2246 patients), showed a weighted mean sensitivity and specificity
of 80% and 84% to detect CAD.10 The accuracies for the different forms of stress echocardiography
are summarized in Figure 5. It has been demonstrated that continuation of beta-blockers reduced
sensitivity, which could be improved by addition of atropine. Also, sensitivity increased in parallel
to the number of diseased vessels, from 74% for 1-vessel disease to 92% for 3-vessel disease.
Disadvantages of stress echocardiography in general include a suboptimal acoustic window in up
to 25% of patients and drop-out of the anterior and lateral walls. Improved endocardial border
delineation can be obtained by using second harmonic imaging and administration of intravenous
contrast agents.

17Cardiac Imaging in Coronary Artery Disease: Differing Modalities
Figure 5. Diagnostic accuracy of stress (exercise and dobutamine) echocardiography (data based on reference 10).
Echocardiography,assessmentofperfusion
At the same time the use of contrast agents has allowed the assessment of myocardial perfusion.
After contrast injection, the micro-bubbles remain in the vascular space until they dissolve, and thus
reflect the microvascular circulation. Accordingly, their relative concentrations in different regions
of the myocardium (as measured by signal intensity) reflect the relative myocardial blood volume in
those regions. Similar to SPECT, resting perfusion defects suggest infarcted myocardium, whereas
stress-induced perfusion defects indicate ischemia. Currently, many modifications of the technology
have been introduced and real-time assessment of perfusion by contrast echocardiography is now
possible 11.
Recent studies from experienced centers showed an excellent agreement between SPECT and
myocardial contrast echocardiography for detection of perfusion abnormalities, with a comparable
sensitivity/specificity for the detection of CAD 12;13. In a head-to-head comparison, Jucquois et al 14
demonstrated an agreement of 62% between SPECT and contrast echocardiography for detection of
perfusion defects; the disagreement between the 2 techniques was related to attenuation artefacts
and when these segments were excluded, the concordance improved to 82%.
The integration of assessment of perfusion and function by contrast echocardiography performed at
rest and after stress should provide optimal information on the detection of CAD. Moir et al recently
performed myocardial contrast echocardiography in addition to combined dipyridamole-exercise
echocardiography in 85 patients 15. In 70 of these patients, data could be compared to conventional
coronary angiography. Sensitivity for the detection of CAD was significantly improved by the addition
of contrast from 74% to 91%; specificity on the other had showed a (non-significant) decrease from
81% to 70%. Pooled analysis of the 7 currently available studies (n=245 patients) on the additive
value of perfusion imaging with contrast to standard wall motion imaging showed similar results:
the weighted mean sensitivity for detection of CAD was 89% with a specificity of 63% 15-21.
84 8082 84
0
20
40
60
80
100
Exercise Dobutamine
%
Sensitivity
Specificity

18 Chapter 1
MRI,assessmentofperfusion
A relatively new technique to evaluate myocardial perfusion is MRI. For this purpose, 5-8 slices in
the short-axis orientation are imaged during the first pass of a bolus of a contrast agent. Imaging
is repeated during pharmacological stress. The applied contrast agent, gadolinium, temporarily
changes the T1-relaxation time and thereby increases the signal intensity of the perfused
myocardium. In contrast, ischemic regions are identified as areas with little or reduced signal
intensity (Figure 6).
Figure 6. MR perfusion images in respectively rest (Panel A) and stress (Panel B) showing a fixed perfusion defect in the inferior wall (white arrows). Images were acquired using a breath hold sensitivity encoding imaging technique during the first pass of an intravenously administered bolus of Gadolinium contrast agent.
Pooling of 17 MRI perfusion studies (n=502 patients, using either dipyridamole or adenosine stress)
revealed a weighted mean sensitivity and specificity of 84% and 85% (Figure 7) 10;22-24. The high spatial
resolution (approximately 2 mm), enables distinction between subendocardial and transmural
perfusion defects. This is an important advantage over SPECT imaging, since the occurrence of
subendocardial perfusion defects may indicate compromised blood flow at an early stage.
For clinical routine, images are evaluated visually, although semi-quantitative assessment is possible
by calculation of the myocardial perfusion reserve index 25;26. In the future, absolute quantification
of myocardial perfusion may be allowed by the use of new intravascular contrast agents. At present
however, quantitative analysis is still time-consuming and in order to fully exploit this modality in
standard clinical routine, automated quantification algorithms are needed.
MRI,assessmentofsystolicfunction
In addition to myocardial perfusion, global and regional systolic LV function can also be obtained
with MRI. The most widely used steady-state free precession technique allows clear identification of
endocardial borders due to a high blood pool signal. In addition, the tomographic approach allows
measurement of volumes without geometric assumptions, resulting in accurate measurements
in severely distorted ventricles as well. Global and regional LV function can be obtained at rest
and during stress (mainly using dobutamine). Pooled data of 10 dobutamine MRI studies (n=654
patients) revealed a weighted mean sensitivity and specificity of 89% and 84% (Figure 7) 10;22.
The excellent endocardial-blood pool contrast is in particular beneficial for patients with poor
echocardiographic windows. Unfortunately, MRI is still limited to highly specialized centers and

19Cardiac Imaging in Coronary Artery Disease: Differing Modalities
acquisition protocols are still time consuming, making the technique currently unsuitable for
evaluation of larger populations. No MRI studies with integration of systolic wall motion and
perfusion to detect CAD are currently available.
Figure 7. Diagnostic accuracy of perfusion and wall motion imaging MRI (data are based on references 10;22-24). For the perfusion studies, adenosine or dipyridamole was used, while dobutamine was administered during the wall motion studies.
Anatomical Imaging
Why is anatomical imaging needed?
Although a safe and accurate evaluation of patients with known or suspected CAD is offered by
functional imaging, in a substantial number of patients anatomical imaging is needed. First, in
patients with abnormal stress tests, direct visualization of the coronary tree is still required for the
definite diagnosis of CAD. Moreover, decisions on treatment strategy, e.g. whether the observed
coronary lesions will be treated conservatively (medically) or more aggressively by means of PCI
or CABG are based to a large extent on the findings of conventional coronary angiography. Also,
in certain subpopulations, e.g. diabetes, functional imaging may be less reliable. In these patients,
diffuse atherosclerosis in all major epicardial vessels is frequently present, resulting in the absence
of detectable perfusion abnormalities. Considering the fact that if CAD is present, prognosis is
substantially worse compared to non-diabetic individuals, knowledge of coronary anatomy is
needed. Thus, besides detection of hemodynamical consequences, direct visualization of the
coronary anatomy is frequently needed.
848985 84
0
20
40
60
80
100
MR perfusion MR wallmotion
%
Sensitivity
Specificity

20 Chapter 1
What is the current gold standard for anatomical imaging?
At present, conventional X-ray angiography with selective contrast injection through cardiac
catheterization remains the reference standard for the evaluation of the coronary arteries. Both
spatial (0.2 mm) and temporal resolution (5 ms) of the technique are extremely high. In addition, the
degree of luminal narrowing can be precisely measured using quantitative coronary angiography.
Also, when during the diagnostic procedure the presence of one or more significant lesions is
confirmed, direct intervention is possible.
Currently, approximately 3000 invasive diagnostic procedures per million inhabitants have been
performed in Europe in 2001, which resulted in PTCA in only one out of three 27. The development of
non-invasive imaging of the coronary arteries would potentially facilitate the access to anatomical
imaging and expand the indications for revascularization.
What are the available modalities for non-invasive anatomical imaging?
Currently, 3 techniques are being developed for non-invasive angiography, MRI, MSCT and EBCT.
Although results are promising, all techniques still have shortcomings and limitations, hampering
implementation in routine clinical practice. Since the coronary arteries are small, tortuous and show
rapid movement during cardiac cycle, demands on spatial and temporal resolution of the techniques
are tremendous. However, all techniques are developing at a rapid pace and as a result, image quality
and diagnostic accuracy are continuously improving.
Non-invasiveangiographywithMRI
More than 10 years ago, the first results of non-invasive angiography were reported by Manning
and colleagues 28. The authors performed a comparison between 2D MRI and conventional
angiography in 39 patients and observed a sensitivity and specificity of 90% and 92%, respectively.
With these first generation techniques, data were acquired during consecutive breath holds,
requiring substantial patient cooperation. To enable free breathing, navigator techniques, that
allow real-time monitoring of diaphragm motion, have been developed. In combination with the
development of 3-dimensional acquisition techniques, superior visualization of coronary anatomy
was achieved. In Figure 8, examples of non-invasive coronary angiography with 3D MR acquisition
techniques are provided.
Pooled data from 28 studies (n=903 patients) directly comparing MRI with invasive angiography
showed a weighted mean sensitivity of 72% with a specificity of 87% (Figure 9). 29 However, the
percentage of interpretable segments is still insufficient and exclusion of up to 30% of all segments
has been reported, even with newer acquisition techniques. Thus, full coverage of the coronary
arteries within a reasonable amount of time still cannot be achieved. Future developments in the
area of coronary MRA, including higher field strengths (3T) and improved contrast techniques,
such as balanced steady-state-free-precession techniques and the development of blood pool

21Cardiac Imaging in Coronary Artery Disease: Differing Modalities
contrast agents, will improve diagnostic accuracy. Moreover, extensive research is directed towards
assessment of plaque composition as well as assessment of coronary flow, which may potentially
enable the technique to provide a comprehensive evaluation of both the presence and extent, as
well as the functional significance of CAD.
Figure 9. Diagnostic accuracy of non-invasive coronary angiography with MRI in the detection of significant stenoses (data based on reference 29).
Figure 8. Non-invasive coronary angiography with MRI. In Panel A, a native right coronary artery (black arrow) and a venous coronary bypass (white arrow) on the left anterior descending coronary artery can be observed. In contrast, Panel B depicts the right coronary artery (white arrows) of a healthy volunteer. Images were acquired with a 1.5 T system, using T2-preparation for background suppression during respiratory gating.

22 Chapter 1
Non-invasiveangiographywithMSCT
More recently, MSCT has emerged as a potential modality for non-invasive angiography. Initial
studies with 4-slice technology showed promising results, with sensitivities and specificities ranging
from 66% to 90% and from 71% to 99%, respectively 29. However, the technique was still hampered by
the high percentage of segments (approximately 25%) with non-diagnostic quality. Modern systems
have an X-ray gantry rotation time of 400 ms or less while data are acquired using 16 or more parallel
detectors with sub-millimeter collimation. At present, 11 studies with 16-slice technology have been
reported 29. As expected, considerably more segments were available for evaluation, approximately
96% of segments. Furthermore, an increase in sensitivity from (on average) 80% to 88% could also
be observed with no loss in specificity (Figure 10). With 64-slice systems that have recently become
available, both the percentage evaluable segments and sensitivity are expected to improve further.
Figure 10. Diagnostic accuracy of non-invasive coronary angiography with 4- and 16-slice MSCT in the detection of significant stenoses (data based on reference 29).
Since data are acquired during consecutive heartbeats, a stable heart rate is important in order to
obtain good image quality. Similar to MRI, the technique has therefore limited value in patients
with atrial fibrillation or frequent extra-systolic contractions, although for the latter raw data can
sometimes be manually corrected. Other contra-indications to MSCT include renal failure or
pregnancy due to the administration of contrast agent and the use of ionizing radiation, respectively.
Moreover, the radiation dose associated with a MSCT examination is still considerably high and
remains an important limitation of the technique. To reduce radiation dose, prospective X-ray tube
modulation or more dedicated filtering may be applied while other dose reduction strategies are
currently investigated.
78 80
949688
96
0
20
40
60
80
100
120
% Assessable Sensitivity Specificity
%
4-slice
16-slice

23Cardiac Imaging in Coronary Artery Disease: Differing Modalities
Non-invasiveangiographywithEBCT
The first experiences with coronary angiography with EBCT were described in 1995 30. Instead of a
mechanically rotating tube, X-rays are created through an electron beam that is guided along a 210°
tungsten target ring in the gantry. As a result, a high-resolution image is acquired in 50 -100 ms. The
acquisition of serial overlapping cross-sectional images with a 1.5 or 3.0 mm slice thickness is performed
during the administration of an iodinated contrast agent, using prospective ECG triggering. To cover the
whole heart, 40 to 50 slices are necessary, typically requiring a breath hold of 30 to 40 seconds, depending
on the heart rate. Pooled analysis of the 10 available studies (n=583 patients) comparing contrast-
enhanced EBCT angiography with conventional angiography demonstrated a weighted mean sensitivity
and specificity of 87% and 91% respectively 31; 16% of the coronary arteries were non-interpretable (Figure
11). Similar to other non-invasive coronary angiography techniques, distal coronary segments are relatively
more difficult to image, while coronary artery motion and breathing artifacts also frequently occur.
Figure 11. Image quality and diagnostic accuracy of EBCT (Data based on reference 31).
Coronaryarterycalciumscoring
Another, more frequently performed application of EBCT is the quantification of calcium in the
coronary arteries. The presence of calcium serves as a marker of atherosclerosis. The absence
of calcium virtually excludes atherosclerosis, and no further analysis is needed. This is also
supported by the very low rate of cardiac events in patients without calcium on EBCT; Raggi et al 32
demonstrated in 4800 patients without diabetes and no coronary calcium that the 5-year survival
was 99.4%. By multivariate analysis, the presence of coronary calcium contributed to the prediction
of all cause mortality in 9474 asymptomatic and non-diabetic subjects to the same extent as age,
hyperlipidemia, hypertension and active smoking. Moreover, Berman et al 33 showed that <1% of
patients with minimal coronary calcium had ischemia on SPECT imaging.
However, the presence of coronary calcium only indicates atherosclerosis in general and requires
additional evaluation. In particular, no relation between the extent of coronary calcium and stenosis
severity has been shown. 31
84 8791
0
20
40
60
80
100
Assessable Sensitivity Specificity
%

24 Chapter 1
Keypoints
1. In the presence of a significant coronary artery stenosis, a sequence of events called the “ischemic
cascade” occurs during stress: first perfusion abnormalities occur, followed by wall motion
abnormalities, while ECG changes and angina occur at a later stage.
2. Non-invasive imaging to assess CAD can be divided into functional imaging and anatomical
imaging.
3. Functional imaging aims at assessment of the hemodynamic consequences of obstructive CAD;
the available techniques are nuclear imaging (mainly SPECT), stress echocardiography (with the
optional use of intravenous contrast agents) and MRI.
4. Currently, all three functional imaging modalities allow comprehensive evaluation including
assessment of both perfusion and wall motion.
5. For non-invasive anatomical imaging, or non-invasive coronary angiography, MRI, MSCT and
EBCT are used. These modalities do not yet assess the hemodynamic consequences of CAD.
Conclusion and outline of the thesis
As discussed in this chapter, the emphasis of non-invasive imaging has traditionally been on
functional imaging (assessing the hemodynamic consequences of obstructive CAD, i.e. ischemia).
Over the past decades, non-invasive imaging for the detection of CAD has mainly relied on SPECT
and stress echocardiography, functional imaging techniques to assess perfusion or wall motion
abnormalities (as markers of CAD) respectively. Over time, these techniques were considered
complementary, rather than competitive, since they provided different information. At present
however, both SPECT and echocardiography have developed into comprehensive imaging
techniques, and each can assess both perfusion and wall motion. Similarly, MRI can also assess both
perfusion and wall motion. Still, for proper patient management, knowledge on coronary anatomy
is frequently needed and patients are subsequently referred for invasive angiography.
With the more recent introduction of non-invasive coronary angiography, emphasis has shifted to
anatomic imaging. In particular, initial results with MSCT have been promising. However, prior to optimal
integration of this novel technique within daily clinical practice, several issues need to be considered.
The aim of this thesis was to describe the value and potential role of MSCT within the multiple
modalities that are available for evaluation of patients with suspected CAD.
Initially, this new technique, allowing non-invasive coronary angiography, has been validated against
conventional coronary angiography, as described in Chapters 2-4 in Part I. In Chapter 2, data acquisition,
post-processing and potential applications of MSCT are outlined. The diagnostic accuracy of 16- and
64-slice MSCT in detecting significant coronary stenoses is evaluated in Chapters 3 and 4, respectively.

25Cardiac Imaging in Coronary Artery Disease: Differing Modalities
In Chapter 5 the diagnostic accuracy of MSCT was compared to MRI based on a meta-analysis of the
available literature. Subsequently, in Part II, the potential value of non-invasive imaging with MSCT
and MRI was investigated in certain subset of patients, in order to define potential candidates for MSCT
in more detail. Populations that were studied included patients with risk factors (Chapters 6-8) and
patients with previous revascularization (Chapters 9-12).
While MSCT coronary angiography has been suggested as an alternative first-line imaging modality to
rule out CAD prior to more invasive procedures, comparisons to the traditionally used non-invasive first-
line techniques were not available. The purpose of Part III therefore, was to evaluate the relationship
between anatomical observations on MSCT, namely atherosclerosis, and functional consequences
on MPI, namely ischemia. In Chapter 13, an update of the various non-invasive modalities, including
both anatomical as well as functional modalities, is provided. In addition, a potential algorithm for
integration of these modalities is proposed, which is further discussed in Chapter 15. The relation
between MSCT and functional imaging is investigated in Chapters 14,16, and 17.
In Part IV, the potential of atherosclerosis imaging with MSCT was further explored. First, differences
in plaque patterns between various clinical presentations were evaluated in Chapters 18 and 19. The
potential prognostic value of MSCT plaque observations was tested in Chapter 20.
Finally, in Part V, non-coronary applications are evaluated, including quantification of infarct
transmurality (Chapter 21), analysis of resting LV function and perfusion (Chapters 22 and 23) and
imaging of the cardiac venous system (Chapter 24).

26 Chapter 1
References 1. Nesto RW, Kowalchuk GJ. The ischemic cascade: temporal sequence of hemodynamic, electrocardio-
graphic and symptomatic expressions of ischemia. Am J Cardiol. 1987;59:23C-30C. 2. Picano E, Mathias W, Jr., Pingitore A, Bigi R, Previtali M. Safety and tolerability of dobutamine-atropine
stress echocardiography: a prospective, multicentre study. Echo Dobutamine International Cooperative Study Group. Lancet. 1994;344:1190-1192.
3. Secknus MA, Marwick TH. Evolution of dobutamine echocardiography protocols and indications: safety and side effects in 3,011 studies over 5 years. J Am Coll Cardiol. 1997;29:1234-1240.
4. Cerqueira MD, Weissman NJ, Dilsizian V, Jacobs AK, Kaul S, Laskey WK, Pennell DJ, Rumberger JA, Ryan T, Verani MS. Standardized myocardial segmentation and nomenclature for tomographic imaging of the heart: a statement for healthcare professionals from the Cardiac Imaging Committee of the Council on Clinical Cardiology of the American Heart Association. Circulation. 2002;105:539-542.
5. Underwood SR, Anagnostopoulos C, Cerqueira M, Ell PJ, Flint EJ, Harbinson M, Kelion AD, Al Mohammad A, Prvulovich EM, Shaw LJ, Tweddel AC. Myocardial perfusion scintigraphy: the evidence. Eur J Nucl Med Mol Imaging. 2004;31:261-291.
6. Wahba FF, Lamb HJ, Bax JJ, Dibbets-Schneider P, Bavelaar-Croon CD, Zwinderman AH, Pauwels EK, Van Der Wall EE. Assessment of regional myocardial wall motion and thickening by gated 99Tcm-tetrofosmin SPECT: a comparison with magnetic resonance imaging. Nucl Med Commun. 2001;22:663-671.
7. Ioannidis JP, Trikalinos TA, Danias PG. Electrocardiogram-gated single-photon emission computed to-mography versus cardiac magnetic resonance imaging for the assessment of left ventricular volumes and ejection fraction: a meta-analysis. J Am Coll Cardiol. 2002;39:2059-2068.
8. DePuey EG, Rozanski A. Using gated technetium-99m-sestamibi SPECT to characterize fixed myocardial defects as infarct or artifact. J Nucl Med. 1995;36:952-955.
9. Smanio PE, Watson DD, Segalla DL, Vinson EL, Smith WH, Beller GA. Value of gating of technetium-99m ses-tamibi single-photon emission computed tomographic imaging. J Am Coll Cardiol. 1997;30:1687-1692.
10. Bax JJ, Van der Wall EE, De Roos A, Poldermans D. In: Clinical nuclear cardiology. State of the art and future directions. Zaret Bl, Beller GA, eds. 2005. Mosby, Philadelphia.
11. Elhendy A, O’Leary EL, Xie F, McGrain AC, Anderson JR, Porter TR. Comparative accuracy of real-time myo-cardial contrast perfusion imaging and wall motion analysis during dobutamine stress echocardiogra-phy for the diagnosis of coronary artery disease. J Am Coll Cardiol. 2004;44:2185-2191.
12. Porter TR, Xie F, Silver M, Kricsfeld D, Oleary E. Real-time perfusion imaging with low mechanical index pulse inversion Doppler imaging. J Am Coll Cardiol. 2001;37:748-753.
13. Kaul S, Senior R, Dittrich H, Raval U, Khattar R, Lahiri A. Detection of coronary artery disease with myocar-dial contrast echocardiography: comparison with 99mTc-sestamibi single-photon emission computed tomography. Circulation. 1997;96:785-792.
14. Jucquois I, Nihoyannopoulos P, D’Hondt AM, Roelants V, Robert A, Melin JA, Glass D, Vanoverschelde JL. Comparison of myocardial contrast echocardiography with NC100100 and (99m)Tc sestamibi SPECT for detection of resting myocardial perfusion abnormalities in patients with previous myocardial infarction. Heart. 2000;83:518-524.
15. Moir S, Haluska BA, Jenkins C, Fathi R, Marwick TH. Incremental benefit of myocardial contrast to com-bined dipyridamole-exercise stress echocardiography for the assessment of coronary artery disease. Circulation. 2004;110:1108-1113.
16. Cwajg J, Xie F, O’Leary E, Kricsfeld D, Dittrich H, Porter TR. Detection of angiographically significant coro-nary artery disease with accelerated intermittent imaging after intravenous administration of ultrasound contrast material. Am Heart J. 2000;139:675-683.
17. Heinle SK, Noblin J, Goree-Best P, Mello A, Ravad G, Mull S, Mammen P, Grayburn PA. Assessment of myo-cardial perfusion by harmonic power Doppler imaging at rest and during adenosine stress: comparison with (99m)Tc-sestamibi SPECT imaging. Circulation. 2000;102:55-60.
18. Olszowska M, Kostkiewicz M, Tracz W, Przewlocki T. Assessment of myocardial perfusion in patients with coronary artery disease. Comparison of myocardial contrast echocardiography and 99mTc MIBI single photon emission computed tomography. Int J Cardiol. 2003;90:49-55.
19. Rocchi G, Fallani F, Bracchetti G, Rapezzi C, Ferlito M, Levorato M, Reggiani LB, Branzi A. Non-invasive de-tection of coronary artery stenosis: a comparison among power-Doppler contrast echo, 99Tc-Sestamibi SPECT and echo wall-motion analysis. Coron Artery Dis. 2003;14:239-245.

27Cardiac Imaging in Coronary Artery Disease: Differing Modalities
20. Shimoni S, Zoghbi WA, Xie F, Kricsfeld D, Iskander S, Gobar L, Mikati IA, Abukhalil J, Verani MS, O’Leary EL, Porter TR. Real-time assessment of myocardial perfusion and wall motion during bicycle and treadmill exercise echocardiography: comparison with single photon emission computed tomography. J Am Coll Cardiol. 2001;37:741-747.
21. Wei K, Crouse L, Weiss J, Villanueva F, Schiller NB, Naqvi TZ, Siegel R, Monaghan M, Goldman J, Aggarwal P, Feigenbaum H, DeMaria A. Comparison of usefulness of dipyridamole stress myocardial contrast echocar-diography to technetium-99m sestamibi single-photon emission computed tomography for detection of coronary artery disease (PB127 Multicenter Phase 2 Trial results). Am J Cardiol. 2003;91:1293-1298.
22. Paetsch I, Jahnke C, Wahl A, Gebker R, Neuss M, Fleck E, Nagel E. Comparison of dobutamine stress mag-netic resonance, adenosine stress magnetic resonance, and adenosine stress magnetic resonance perfu-sion. Circulation. 2004;110:835-842.
23. Wolff SD, Schwitter J, Coulden R, Friedrich MG, Bluemke DA, Biederman RW, Martin ET, Lansky AJ, Kasha-nian F, Foo TK, Licato PE, Comeau CR. Myocardial first-pass perfusion magnetic resonance imaging: a multicenter dose-ranging study. Circulation. 2004;110:732-737.
24. Giang TH, Nanz D, Coulden R, Friedrich M, Graves M, Al Saadi N, Luscher TF, von Schulthess GK, Schwitter J. Detection of coronary artery disease by magnetic resonance myocardial perfusion imaging with vari-ous contrast medium doses: first European multi-centre experience. Eur Heart J. 2004;25:1657-1665.
25. Al Saadi N, Nagel E, Gross M, Bornstedt A, Schnackenburg B, Klein C, Klimek W, Oswald H, Fleck E. Nonin-vasive detection of myocardial ischemia from perfusion reserve based on cardiovascular magnetic reso-nance. Circulation. 2000;101:1379-1383.
26. Al Saadi N, Nagel E, Gross M, Schnackenburg B, Paetsch I, Klein C, Fleck E. Improvement of myocardial perfusion reserve early after coronary intervention: assessment with cardiac magnetic resonance imag-ing. J Am Coll Cardiol. 2000;36:1557-1564.
27. Togni M, Balmer F, Pfiffner D, Maier W, Zeiher AM, Meier B. Percutaneous coronary interventions in Europe 1992-2001. Eur Heart J. 2004;25:1208-1213.
28. Manning WJ, Li W, Edelman RR. A preliminary report comparing magnetic resonance coronary angiogra-phy with conventional angiography. N Engl J Med. 1993;328:828-832.
29. Schuijf JD, Bax JJ, Shaw LJ, de Roos A, Lamb HJ, van der Wall EE, Wijns W. Meta-analysis of comparative diagnostic performance of magnetic resonance imaging and multislice computed tomography for non-invasive coronary angiography. Am Heart J. 2006;151:404-411.
30. Moshage WE, Achenbach S, Seese B, Bachmann K, Kirchgeorg M. Coronary artery stenoses: three-dimen-sional imaging with electrocardiographically triggered, contrast agent-enhanced, electron-beam CT. Radiology. 1995;196:707-714.
31. Budoff MJ, Achenbach S, Duerinckx A. Clinical utility of computed tomography and magnetic resonance techniques for noninvasive coronary angiography. J Am Coll Cardiol. 2003;42:1867-1878.
32. Raggi P, Shaw LJ, Berman DS, Callister TQ. Prognostic value of coronary artery calcium screening in sub-jects with and without diabetes. J Am Coll Cardiol. 2004;43:1663-1669.
33. Berman DS, Wong ND, Gransar H, Miranda-Peats R, Dahlbeck J, Hayes SW, Friedman JD, Kang X, Polk D, Hachamovitch R, Shaw L, Rozanski A. Relationship between stress-induced myocardial ischemia and ath-erosclerosis measured by coronary calcium tomography. J Am Coll Cardiol. 2004;44:923-930.

Non-Invasive Coronary Angiography
with Multi-Slice Computed Tomography;
Introduction and Diagnostic Accuracy
Part I


Multi-Slice CT Coronary Angiography:
How to do it and What is
the Current Clinical Performance?
Eur J Nucl Med Mol Imaging 2005; 32: 1337-1347
Filippo Cademartiri, Joanne D. Schuijf, Nico R. Mollet, Patrizia Malagutti, Giuseppe Runza, Jeroen J. Bax, Pim J. de Feyter
2Chapter

Abstract
The introduction of multi-slice computed tomography (MSCT) has allowed non-invasive coro-
nary angiography. Although widely applied, extensive information on technical details of the
technique is lacking. In this manuscript, detailed information is provided on patient prepara-
tion, data acquisition, reconstruction and interpretation is provided. In addition, a summary on
the available studies using MSCT for non-invasive angiography is provided. Based on pooled
analysis of direct comparisons between MSCT and invasive angiography, the weighted mean
sensitivity and specificity of current 16-slice MSCT to detect coronary artery disease are 88%
and 96% respectively. At present, the technique is particularly well-suited to reliably exclude
coronary artery disease. It is important to emphasize that MSCT only provides anatomical im-
ages, visualizing the presence of atherosclerosis, but information on the hemodynamic signifi-
cance of these lesions (i.e. ischemia) can not be derived.

33Multi-Slice CT Coronary Angiography: How to do it and What is the Current Clinical Performance?
Introduction
Multi-slice computed tomography (MSCT) has attracted a lot of attention recently. This technique al-
lows non-invasive visualization of the coronary arteries and comparison with invasive coronary angi-
ography has yielded good results 1-3. In particular, many studies have recently been published on the
accuracy of MSCT to detect (or exclude) coronary artery disease. Currently, comprehensive information
on the technique and its clinical value is lacking. In this manuscript, a summary is provided on the data
acquisition, reconstruction and analysis with MSCT; also, a summary on the accuracy of the technique
to assess coronary artery disease, based on the available studies, is provided.
How to perform MSCT, data acquisition
Various issues are of importance in data acquisition with MSCT. High heart rates influence image
quality and patients with heart rates ≥65 bpm should receive beta-blockers orally before the scan,
unless contra-indicated. Patients with (supra-)ventricular arrhythmias should not undergo MSCT un-
less software that allows the editing of the ECG is available (see below) 4.
The contrast agent should be administered through an antecubital vein to allow high flow rates 5.
High intravascular attenuation and low beam-hardening artefacts in the right heart are recommend-
ed for an optimal MSCT coronary angiogram (CA). On average a bolus of 100 ml of iodine contrast
material (350-400 mgl/ml) administered at 3-5 ml/s, immediately followed by 40 ml saline, provides
optimal arterial enhancement 6;7. To synchronize the arrival of contrast material in the coronary arter-
ies and the scan, a test bolus or bolus tracking can be used 5;8.
The optimal scan protocol results in high spatial resolution (thinner collimation), a high temporal
resolution (faster gantry rotation) with low radiation exposure (prospectively ECG-triggered tube
current modulation 9) compatible with a good signal to noise ratio (Figure 1).
Figure 1. Three-dimensional volume rendering using 64-slice MSCT. Small diagonal branches of the LAD (Panel A, arrowhead), the obtuse marginal branches of the LCX (Panels A, arrow and B, arrowhead), the acute marginal branches of the RCA (Panel B, arrow), and the PDA are clearly visible.
Abbreviations: Ao= ascending aorta; LA= left atrium; LV= left ven-tricle; LAD= left anterior descend-ing; LCX= left circumflex; RA= right atrium; RV= right ven-tricle; RCA= right coronary artery; PDA= posterior descending artery.

34 Chapter 2
How to perform MSCT, data reconstruction
Since the ECG is simultaneously registered during the examination, the acquired raw data can be
reconstructed at any time point during the cardiac cycle. When performing these reconstructions,
several approaches can be used, which are depicted in Figure 2 10;11. During the most widely used ap-
proach, data are reconstructed at a fixed percentage delay based on the R wave. However, data can
also be reconstructed using an absolute prospective delay based on the previous R wave, although
this technique is more sensitive to minimal variations in heart rate and therefore may result in data
inconsistencies. The third approach, which is also frequently applied, utilizes an absolute reverse
delay based on the upcoming R wave. As a result, data are reconstructed during end-diastole regard-
less of the absolute heart rate or potential variations in heart rate. Finally, the temporal window can
theoretically also be positioned on the top of the P wave. Although this approach allows accurate re-
construction of data in end-diastole, it is not commonly performed due to the current unavailability
of software that recognizes P waves.
Figure 2. Retrospective reconstruction of MSCT image data sets. Several different methods are available to de-fine the temporal window in which the image data set is reconstructed. In Panel A, data are reconstructed using a fixed percentage delay, in this case at every 60% of the cardiac interval. In Panel B, an absolute prospective delay is used, resulting in the reconstruction of images at 650 ms after every R-peak. The same temporal window is achieved in Panel C however, by reconstructing at an absolute reverse delay, which is in this case 350 ms be-fore every R-peak. In Panel D, the temporal window for data reconstruction is set with its end on the top of the P wave in order to allow reconstruction of images during the very last moment of limited cardiac motion before systolic contraction.
35Multi-Slice CT Coronary Angiography: How to do it and What is the Current Clinical Performance?
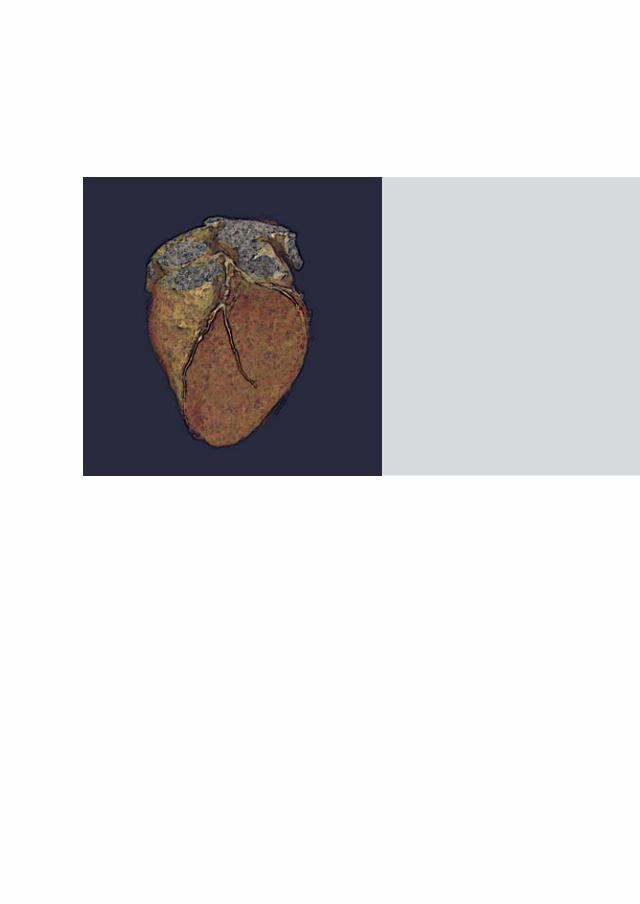
At present, no consensus has been established concerning which protocol provides the most opti-
mal results, and frequently a mixture of the available approaches is used. The phase of the cardiac
cycle providing most of the information is the mid-to-end diastole, when the heart is in the iso-volu-
metric filling phase and motion is minimal. In some cases, including patients with higher heart rates
during data acquisition, the tele-systolic phase can also provide relevant information since at the
end of myocardial contraction, the motion of the coronary arteries is also reduced (Figure 3).
Figure 3. The position of the temporal reconstruction window. Three main areas in the cardiac cycle are relevant for MSCT image reconstruction. The tele-diastolic phase (a), which typically occurs at 55% to 70% of the R-R inter-val, represents the cardiac phase without contraction and thus minimal motion. During the tele-systolic phase (c, typically 25% to 40% of the R-R interval) isovolumetric contraction occurs, resulting in reduced coronary motion as well. In between lies the early-to-mid diastolic phase (b) during which some residual motion is present.

36 Chapter 2
An important feature of some ECG-gating software is the possibility to edit the position of the tem-
poral windows within the cardiac cycle, and to exclude ECG irregularities such as pre-mature ventric-
ular beats (or extra-systoles) (Figure 4) 4. Another relevant reconstruction parameter is the effective
slice width that is usually slightly thicker than the minimal collimation in order to improve the signal
to noise ratio. The reconstruction increment should be around 50% of the effective slice thickness to
improve the spatial resolution and the oversampling along the z-axis. The field of view should be as
small as possible including the entire heart in order to fully exploit the constant image matrix (512 x
512 pixels). The filtering should be a trade-off between the noise and the quality of the image. Usu-
ally medium convolution filters are applied for coronary imaging. Higher filters improve visualization
of calcified vessel walls or stent struts and the lumen within the stents (Figure 5).
Figure 4. Editing of the ECG in the presence of premature ventricular beats.The presence of a premature beat can result in motion artifacts on MSCT. The explanation for this is related to the mis-alignment of the temporal window in the diastolic pause before the premature beat (Panel A, arrow in ECG tracing). This results in motion artifacts that worsen the image quality (Panel A, arrowhead). The operator should delete the temporal window during the premature beat and fill the following long diastolic pause with addi-tional temporal windows (Panel B, arrow in the ECG tracing) until the minimum heart rate interval is achieved. Accordingly, recovery of data is possible and diagnostic image quality can be obtained (Panel B, arrowhead).

37Multi-Slice CT Coronary Angiography: How to do it and What is the Current Clinical Performance?
Figure 5. Effect of convolution filters on stent visualization. In Panel A, the 3D volume rendered image shows a left coronary artery with two stents in the LAD and in the first diagonal branch (D1). The stent in the LAD is displayed in curved multiplanar reconstructions in panels B, C, and D using progressively sharper convolution filters. The visualization of the stents and the differentiation between the struts and the lumen is improved by sharp convolution filters.Abbreviations: Ao= ascending aorta; LAD= left anterior descending; LCX= left circumflex.
How to perform MSCT, data interpretation
To date, the studies reported have used semi-quantitative detection of significant stenosis (defined as
≥50% lumen reduction) 12-14, no studies with quantitative MSCT-CA have been reported yet. The coro-
nary arteries are evaluated according to scoring systems used for invasive CA and include a 15- or 16-
segment model suggested by the American Heart Association 15 (Figure 6). Axial images should always
be reviewed first, in order to detect possible morphological abnormalities or non-coronary findings
e.g. pulmonary nodules.
Figure 6. Classification of coronary segments can be performed by dividing the coronary tree into 15 segments (modified from the American Heart Association 15). This classification includes most of the segments with a di-ameter larger than 1.5 mm. Abbreviations: LCA= left coronary artery; CX= left circumflex; LAD= left anterior descending; LM= left main; MO= marginal branch; RCA= right coronary artery; D1= first diagonal branch; D2= second diagonal branch; PL= postero-lateral branch; PDA= posterior descending artery.

38 Chapter 2
Figure 7. Planes adopted on MSCT for the visualization of coronary ar-teries. Using the 3D volume rendered image as a reference (Panel A) the three main planes for visualization of the coronary arteries are displayed. The atrio-ventricular plane with vol-ume rendering (Panel B) and the cor-responding cross-section with maxi-mum intensity projection (Panel C) allow visualization of the RCA and CX. The inter-ventricular plane (Pan-els D and E) allows the visualization of the LAD along the anterior wall of the left ventricle. The para-axial plane parallel to the LAD (Panels F and G) allows the visualization of the LAD and the diagonal branches. Abbreviations: CX= left circumflex; D1= first diagonal branch; LAD= left anterior descending coronary artery; LV= left ventricle; RCA= right coronary artery; RV= right ventricle; RVOT= right ventricle outflow tract.

39Multi-Slice CT Coronary Angiography: How to do it and What is the Current Clinical Performance?
The multiplanar reconstructions (MPR) are employed for the evaluation of coronary arteries. The
main planes useful are: 1) plane parallel to the atrio-ventricular groove (allows the longitudinal vi-
sualization of the right coronary artery and of the left circumflex coronary artery) 2) plane parallel
to the inter-ventricular groove (allows visualization of the left anterior descending coronary artery)
(see Figures 7 and 8).
On these planes a maximum intensity projection algorithm can be useful (from 5-8 mm to 3 mm of
thickness, depending on extent and severity of calcifications). When the vessel is displayed within
one plane, dedicated software permits to perform a central-lumen line reconstruction and the re-
sulting image can be rotated 360° around its axis (Figure 8).
In parallel, an orthogonal view of the same vessel is displayed, allowing a better evaluation of ste-
nosis. In general, 3D volume rendering is performed to provide an overview (and variations) of the
coronary anatomy (total occlusions, aberrant coronary arteries) and should not be used for assess-
ment of stenotic lesions (Figure 7).
Figure 8. Curved central-lumen-line re-constructions on MSCT. The conventional coronary angiogram and the curved re-constructions are displayed for the RCA (Panels A-C), the LAD (Panels D-F), and for the CX (Panels G-I). For each vessel an orthogonal cross section performed in a region close to the ostium is displayed.Abbreviations: CX= left circumflex; LAD= left anterior descending coronary artery; RCA= right coronary artery.

40 Chapter 2
Artifacts
Artifacts are mainly related to 8 issues (Table 1). Motion is commonly observed in MSCT-CA, and is
mainly caused by (supra-)ventricular arrhythmias or breathing. Image noise can be related to obesity
or to insufficient vascular contrast enhancement. Beam hardening is usually associated with high-
attenuation objects such as surgical clips, stents and severe calcifications. Volume averaging is due
to contamination by attenuation of high-attenuation objects surrounded by tissue with lower at-
tenuation. Incorrect positioning of the temporal window can generate artifacts because there are
only a few moments during the cardiac cycle when the heart stands still for a reasonable amount of
milliseconds. Data can be missing because of irregularities in heart rate. Poor vascular enhancement
is a result of low injection rate, low contrast volume, or iodine concentration. Images can be blurred
because of several of the aforementioned issues.
Table 1. Classification and cause of artifacts.
Artifact Description CauseMotion High or irregular heart rate Insufficient temporal resolution
(Supra-)ventricular arrhythmiasPatient breathing
Image contrast/noise Insufficient vascular enhancement
Inadequate contrast administration
Obesity High tissue absorption throughout the dataset
Beam hardening Streak artifacts Extensive calcifications, coronary artery stents, arterial clips
Volume averaging “Blooming” Extensive calcifications, coronary artery stents, arterial clips
Temporal window Motion artifacts (HR independent)
Sub-optimal selection of temporal window
Premature heart beatsIrregular ECG-wave
Missing data Lack of information Irregular ECG baselineMis-triggering
Vessel enhancement Poor enhancement Low injection rate, low volume, low iodine content
Image quality Blurred images See MotionBlurred vessels See Vessel enhancement

41Multi-Slice CT Coronary Angiography: How to do it and What is the Current Clinical Performance?
Accuracy to assess coronary artery disease
Figure 9. Bar graph showing the diagnostic accuracy of 4- and 16-slice MSCT for the evaluation of significant coronary artery stenoses (data based on reference 16). Assessable = the average percentage of coronary segments that were of sufficient image quality to include in the analyses concerning diagnostic accuracy.
During the past few years, extensive research has been invested in the development of non-invasive
CA with MSCT, resulting in a considerable number of publications on the diagnostic accuracy of this
technique. In 1998, the first generation of multi-slice scanners was introduced, allowing the simulta-
neous acquisition of 4 slices, thereby enabling MSCT systems to visualize the coronary arteries. Re-
ported sensitivities and specificities ranged from 66% to 99%, with weighted means of respectively
80% and 94% 16. To obtain these results however, more than 20% of the available segments were on
average excluded, representing an important limitation of the technique at that stage.
More recently, results of the newer generation of 16-slice systems have become available. With these
systems, sections as thin as 0.5 mm and a temporal resolution of 105-250 ms can be obtained. As a
result, a considerable improvement in assessability (approximately 96%) as well as sensitivity (ap-
proximately 88%) could be observed, with no loss in specificity, as shown in Figure 9 16. Further re-
finement is anticipated by the introduction of 64-slice scanners that have been recently introduced,
although currently no studies are available regarding the diagnostic accuracy of these systems. Ex-
amples of 64-slice MSCT-CA in patients with respectively normal and abnormal coronary arteries are
provided in Figures 10 and 11.
78
96
8088
94 96
0
20
40
60
80
100
4-slice 16-slice
Per
cen
tag
e %
Assessable
Sensitivity
Specificity
n=11 studies n=11 studies

42 Chapter 2
Figure 10. An example of normal coronary arteries obtained with 64-slice MSCT. An intra-myocardial course of the LAD can be observed (Panels B and H-arrows).Abbreviations: LAD= left anterior descending coronary artery; D1= first diagonal branch; LCx= left circumflex coro-nary artery; MO= marginal branch.
Figure 11. An example of a patient with a total occlusion of the LAD, obtained with 64-slice MSCT. The LAD is occluded (Panels A, B, D, E, arrows), whereas the first diagonal branch and the LCx are diffusely diseased. Conven-tional coronary angiography showed comparable findings (Panels C and F).Abbreviations: LAD= left anterior descending coronary artery; D1= first diagonal branch; LCx= left circumflex coro-nary artery.

43Multi-Slice CT Coronary Angiography: How to do it and What is the Current Clinical Performance?
In patients presenting with recurrent angina after surgical or percutaneous revascularization, MSCT
may be applied to assess patency of either coronary bypass grafts or stents. The axial course, large
diameter and relative immobility of coronary bypass grafts during the cardiac cycle facilitate evalu-
ation with MSCT. In Figure 12, an example is provided of 64-slice MSCT imaging of a patient with
previous coronary bypass grafting. Several studies have explored the accuracy of MSCT to evalu-
ate graft patency in comparison to conventional CA. In these 7 studies, with a total of 257 patients
included, virtually all grafts were of sufficient image quality to assess patency 17-22. Pooled analysis of
these studies showed a weighted mean sensitivity of MSCT to detect graft occlusion of 88%, while
the weighted mean specificity was 98%. In 5 studies, assessment of graft stenosis was undertaken 18-20;23;24. In these studies, with 267 patients included, 80% of grafts were eligible for evaluation, with a
weighted mean sensitivity and specificity of 84% and 95%, respectively. Data are summarized in Fig-
ure 13. Despite these encouraging results, still several important limitations remain. Metal artefacts
resulting from surgical clips frequently obscure assessment, while difficulties are also encountered
frequently in the evaluation of distal anastomoses and distal parts of sequential grafts.
Figure 12. An example of a patient with previous coronary bypass surgery, obtained with 64-slice MSCT. As shown in Panels A and B, the LIMA is patent, while one of the 2 saphenous vein grafts is occluded (Panel A, left arrow). Conventional coronary angiography confirmed patency of the left internal mammary artery graft (Panel C). Abbreviations: LAD= left anterior descending coronary artery; SVG= saphenous vein graft; LIMA= left internal mam-mary artery; RCA= right coronary artery.

44 Chapter 2
Figure 13. Bar graph showing the diagnostic accuracy of MSCT in the evaluation of patients after coronary by-pass surgery (data based on references 17-24). Assessable = the average percentage of bypass grafts that were of sufficient image quality to include in the analyses concerning diagnostic accuracy.
Another application of MSCT that is currently under investigation is the assessment of coronary
stents, which are difficult to image with MSCT. Their metal content leads to high-density artifacts,
and subsequent obscuring of a considerable part of the stent lumen. In many studies regarding the
diagnostic accuracy of MSCT therefore, stented segments are still excluded from analysis. However,
substantial progress has been obtained with the increased image quality of the newer generation of
MSCT scanners. With 4-slice systems, the stent lumen was virtually invisible, whereas with 16-slice
systems improved visualization has been reported, in particular in stents with either a large diameter
or thinner struts 25. With the recently introduced 64-slice systems (Figure 14) as well as the previously
discussed dedicated filters (Figure 5), an even higher percentage of stents will be eligible for assess-
ment of patency. Still, artificial narrowing of the stent lumen will currently remain to some extent,
thereby hampering detection of subtle neo-intima hyperplasia.
99
80
8884
9895
0
20
40
60
80
100
Graft occlusion Graft stenosis
Pe
rce
nta
ge
%
Assessable
Sensitivity
Specificity
n= 7 studies n= 5 studies

45Multi-Slice CT Coronary Angiography: How to do it and What is the Current Clinical Performance?
Figure 14. Coronary stent imaging with 64-slice MSCT. In Panels A and B, the patency of the stented LAD is demonstrated. In Panels D and E, absence of in-stent restenosis in the stented RCA is demonstrated. The MSCT findings were confirmed by conventional coronary angiography (Panels C and F). Abbreviations: LAD= left anterior descending coronary artery; D1= first diagonal branch; D2= second diagonal branch; RCA= right coronary artery; LM= left main.
Additional applications of MSCT
Besides the assessment of coronary artery disease, MSCT can also be used for evaluation of left
ventricular (LV) function; LV function (and LV volumes) are important prognostic parameters. Since
MSCT data are acquired throughout the entire cardiac cycle, during continuous registration of the
ECG, images can be reconstructed at any cardiac phase. As a result, information on LV function can
be derived from the same data set as used for the evaluation of the coronary arteries.
In the assessment of LV ejection fraction, initial studies have shown good correlations between
MSCT and either MRI or echocardiography 26-30. In addition to global function, regional contractile
function can be assessed (Figure 15). A recent comparison between MSCT and 2D echocardiogra-
phy revealed an overall agreement of 91% in 493 segments evaluated for the presence of regional
wall motion abnormalities 31. Preferably, systolic wall thickening should be assessed during stress as
well as resting conditions. However, with regard to the radiation dose associated with MSCT, such a
protocol remains at present unattractive.

46 Chapter 2
Figure 15. Regional wall motion analysis with 64-slice MSCT. In Panels A and B, short-axis left ventricular recon-structions in respectively end-diastole and end-systole are shown of a patient with normal wall motion; the left ventricular ejection fraction was 55%. In Panels C and D, similar reconstructions are shown of a patient with a previous anterior myocardial infarction. In the corresponding region (arrows), abnormal wall motion can be ap-preciated; the ventricular ejection fraction was 38%.
In addition to LV function, MSCT has been used for the evaluation of pulmonary vein anatomy in
patients with atrial fibrillation considered for pulmonary vein ablation. Ectopic foci located within
the pulmonary veins have been linked to the induction of atrial fibrillation and/or tachycardia 32.
As a result, different percutaneous ablation strategies have been developed to either eliminate the
pulmonary venous foci or encircle and electrically isolate the pulmonary veins from the left atrium.
Despite a good success rate of these strategies, the procedure and fluoroscopy times are still consid-
erable due to several reasons. The veno-atrial junctions and the pulmonary veins or their ostia are
not easily visualized using fluoroscopy, while the pulmonary venous anatomy itself is highly variable 33. Knowledge of pulmonary venous anatomy, including potential anomalies in number and inser-
tion of pulmonary veins as well as ostial shape, prior to the ablation procedure, therefore, would be

47Multi-Slice CT Coronary Angiography: How to do it and What is the Current Clinical Performance?
of great benefit and potentially facilitate procedures. Preliminary studies have demonstrated that
this information can be provided by MSCT 34. In Figure 16, an example of visualization of different
variants of pulmonary vein anatomy by MSCT is provided. Jongbloed et al recently performed a
head-to-head comparison between MSCT and intracardiac echocardiography in 42 patients prior
to pulmonary vein ablation 35. The authors observed a higher sensitivity for MSCT in the detection of
additional branches and right-sided early branching. In addition, an underestimation of ostial size
by intracardiac echocardiography was demonstrated. These findings underline the superiority of 3D
imaging techniques to demonstrate asymmetrical shape of pulmonary vein ostia. Further investiga-
tions however are needed to evaluate how MSCT data can be used or integrated with other data for
optimization of pulmonary vein ablation strategies.
Figure 16. Different variants of pulmonary vein anatomy, as visualized by 3D volume rendered 64-slice MSCT reconstructions. In Panel A, early branching (arrow) of the right inferior pulmonary vein can be observed. An ad-ditional right pulmonary vein can be observed in Panel B (arrow).Abbreviations: LA= left atrium; LIPV= left inferior pulmonary vein; LSPV= left superior pulmonary vein; RIPV= right inferior pulmonary vein; RSPV= right superior pulmonary vein.
Conclusion
MSCT has been demonstrated to allow non-invasive coronary angiography. To improve this imag-
ing modality technique, optimization of patient preparation, data acquisition and reconstruction is
required. Standardized data analysis and reporting is also needed. Several issues that are important
related to these issues are summarized in this article.
When the currently available data are pooled, a high sensitivity with an excellent specificity is ob-
tained. In particular, the specificity of 96% is an indicator that MSCT can adequately rule out coro-
nary artery disease. It is important to keep in mind that this technique visualizes atherosclerosis and
not ischemia. Therefore, the technique can not be compared directly with the currently available
imaging modalities to non-invasively assess coronary artery disease, such as nuclear myocardial per-
fusion imaging and stress echocardiography. Rather, these techniques visualize the consequences

48 Chapter 2
of atherosclerosis and indicate whether ischemia is present or not. The precise role of these imaging
modalities (MSCT to assess atherosclerosis and myocardial perfusion imaging or stress echocardiog-
raphy to assess ischemia) is to be established. A potential scenario could be to use these techniques
mainly in patients with an intermediate likelihood of coronary artery disease in a sequential manner.
MSCT could first be applied to rule out coronary artery disease; if present, myocardial perfusion im-
aging could be used to refine the consequences of the atherosclerosis: ischemia or not.

49Multi-Slice CT Coronary Angiography: How to do it and What is the Current Clinical Performance?
References 1. Achenbach S, Giesler T, Ropers D, Ulzheimer S, Derlien H, Schulte C, Wenkel E, Moshage W, Bautz W,
Daniel WG, Kalender WA, Baum U. Detection of coronary artery stenoses by contrast-enhanced, ret-rospectively electrocardiographically-gated, multi-slice spiral computed tomography. Circulation. 2001;103:2535-2538.
2. Nieman K, Oudkerk M, Rensing BJ, van Ooijen P, Munne A, van Geuns RJ, de Feyter PJ. Coronary angiog-raphy with multi-slice computed tomography. Lancet. 2001;357:599-603.
3. Schuijf JD, Bax JJ, Shaw LJ, de Roos A, Lamb HJ, van der Wall EE, Wijns W. Meta-analysis of compara-tive diagnostic performance of magnetic resonance imaging and multi-slice computed tomography for noninvasive coronary angiography. Am Heart J. 2006;151:404-411.
4. Cademartiri F, Mollet NR, Runza G, Baks T, Midiri M, McFadden EP, Flohr TG, Ohnesorge B, de Feyter PJ, Krestin GP. Improving diagnostic accuracy of MDCT coronary angiography in patients with mild heart rhythm irregularities using ECG editing. AJR Am J Roentgenol. 2006;186:634-638.
5. Cademartiri F, van der LA, Luccichenti G, Pavone P, Krestin GP. Parameters affecting bolus geometry in CTA: a review. J Comput Assist Tomogr. 2002;26:598-607.
6. Cademartiri F, Mollet N, van der LA, Nieman K, Pattynama PM, de Feyter PJ, Krestin GP. Non-invasive 16-row multi-slice CT coronary angiography: usefulness of saline chaser. Eur Radiol. 2004;14:178-183.
7. Cademartiri F, Luccichenti G, Marano R, Gualerzi M, Brambilla L, Coruzzi P. Comparison of monophasic vs biphasic administration of contrast material in non-invasive coronary angiography using a 16-row multi-slice Computed Tomography. Radiol Med (Torino). 2004;107:489-496.
8. Cademartiri F, Nieman K, van der LA, Raaijmakers RH, Mollet N, Pattynama PM, de Feyter PJ, Krestin GP. Intravenous contrast material administration at 16-detector row helical CT coronary angiography: test bolus versus bolus-tracking technique. Radiology. 2004;233:817-823.
9. Jakobs TF, Becker CR, Ohnesorge B, Flohr T, Suess C, Schoepf UJ, Reiser MF. Multi-slice helical CT of the heart with retrospective ECG gating: reduction of radiation exposure by ECG-controlled tube current modulation. Eur Radiol. 2002;12:1081-1086.
10. Cademartiri F, Luccichenti G, Marano R, Nieman K, Mollet N, de Feyter P, Krestin GP, Pavone P, Bonomo L. Non-invasive angiography of the coronary arteries with multi-slice computed tomography: state of the art and future prospects. Radiol Med (Torino). 2003;106:284-296.
11. Sato Y, Matsumoto N, Kato M, Inoue F, Horie T, Kusama J, Yoshimura A, Imazeki T, Fukui T, Furuhashi S, Takahashi M, Kanmatsuse K. Noninvasive assessment of coronary artery disease by multi-slice spiral computed tomography using a new retrospectively ECG-gated image reconstruction technique. Circ J. 2003;67:401-405.
12. Mollet NR, Cademartiri F, Nieman K, Saia F, Lemos PA, McFadden EP, Pattynama PM, Serruys PW, Krestin GP, de Feyter PJ. Multi-slice spiral computed tomography coronary angiography in patients with stable angina pectoris. J Am Coll Cardiol. 2004;43:2265-2270.
13. Nieman K, Cademartiri F, Lemos PA, Raaijmakers R, Pattynama PM, de Feyter PJ. Reliable noninvasive coronary angiography with fast submillimeter multi-slice spiral computed tomography. Circulation. 2002;106:2051-2054.
14. Ropers D, Baum U, Pohle K, Anders K, Ulzheimer S, Ohnesorge B, Schlundt C, Bautz W, Daniel WG, Achen-bach S. Detection of coronary artery stenoses with thin-slice multi-detector row spiral computed to-mography and multiplanar reconstruction. Circulation. 2003;107:664-666.
15. Austen WG, Edwards JE, Frye RL, Gensini GG, Gott VL, Griffith LS, McGoon DC, Murphy ML, Roe BB. A reporting system on patients evaluated for coronary artery disease. Report of the Ad Hoc Committee for Grading of Coronary Artery Disease, Council on Cardiovascular Surgery, American Heart Association. Circulation. 1975;51:5-40.
16. Schuijf JD, Bax JJ, Shaw LJ, de Roos A, Lamb HJ, van der Wall EE, Wijns W. Meta-analysis of compara-tive diagnostic performance of magnetic resonance imaging and multi-slice computed tomography for noninvasive coronary angiography. Am Heart J. 2006;151:404-411.
17. Ko YG, Choi DH, Jang YS, Chung NS, Shim WH, Cho SY, Yoo KJ, Chang BC, Choi BW. Assessment of coro-nary artery bypass graft patency by multi-slice computed tomography. Yonsei Med J. 2003;44:438-444.
18. Marano R, Storto ML, Maddestra N, Bonomo L. Non-invasive assessment of coronary artery bypass graft with retrospectively ECG-gated four-row multi-detector spiral computed tomography. Eur Radiol. 2004;14:1353-1362.

50 Chapter 2
19. Nieman K, Pattynama PM, Rensing BJ, van Geuns RJ, de Feyter PJ. Evaluation of patients after coro-nary artery bypass surgery: CT angiographic assessment of grafts and coronary arteries. Radiology. 2003;229:749-756.
20. Ropers D, Ulzheimer S, Wenkel E, Baum U, Giesler T, Derlien H, Moshage W, Bautz WA, Daniel WG, Kalen-der WA, Achenbach S. Investigation of aortocoronary artery bypass grafts by multi-slice spiral computed tomography with electrocardiographic-gated image reconstruction. Am J Cardiol. 2001;88:792-795.
21. Willmann JK, Weishaupt D, Kobza R, Verdun FR, Seifert B, Marincek B, Boehm T. Coronary artery bypass grafts: ECG-gated multi-detector row CT angiography--influence of image reconstruction interval on graft visibility. Radiology. 2004;232:568-577.
22. Yoo KJ, Choi D, Choi BW, Lim SH, Chang BC. The comparison of the graft patency after coronary artery bypass grafting using coronary angiography and multi-slice computed tomography. Eur J Cardiothorac Surg. 2003;24:86-91.
23. Martuscelli E, Romagnoli A, D’Eliseo A, Tomassini M, Razzini C, Sperandio M, Simonetti G, Romeo F, Mehta JL. Evaluation of venous and arterial conduit patency by 16-slice spiral computed tomography. Circulation. 2004;110:3234-3238.
24. Salm LP, Bax JJ, Jukema JW, Schuijf JD, Vliegen HW, Lamb HJ, van der Wall EE, de Roos A. Comprehensive assessment of patients after coronary artery bypass grafting by 16-detector-row computed tomogra-phy. Am Heart J. 2005;150:775-781.
25. Schuijf JD, Bax JJ, Jukema JW, Lamb HJ, Warda HM, Vliegen HW, de Roos A, van der Wall EE. Feasibility of assessment of coronary stent patency using 16-slice computed tomography. Am J Cardiol. 2004;94:427-430.
26. Dirksen MS, Bax JJ, de Roos A, Jukema JW, van der Geest RJ, Geleijns K, Boersma E, van der Wall EE, Lamb HJ. Usefulness of dynamic multi-slice computed tomography of left ventricular function in unstable angina pectoris and comparison with echocardiography. Am J Cardiol. 2002;90:1157-1160.
27. Schuijf JD, Bax JJ, Salm LP, Jukema JW, Lamb HJ, van der Wall EE, de Roos A. Noninvasive coronary im-aging and assessment of left ventricular function using 16-slice computed tomography. Am J Cardiol. 2005;95:571-574.
28. Grude M, Juergens KU, Wichter T, Paul M, Fallenberg EM, Muller JG, Heindel W, Breithardt G, Fischbach R. Evaluation of global left ventricular myocardial function with electrocardiogram-gated multidetector computed tomography: comparison with magnetic resonance imaging. Invest Radiol. 2003;38:653-661.
29. Juergens KU, Grude M, Maintz D, Fallenberg EM, Wichter T, Heindel W, Fischbach R. Multi-detector row CT of left ventricular function with dedicated analysis software versus MR imaging: initial experience. Radiology. 2004;230:403-410.
30. Mahnken AH, Spuentrup E, Niethammer M, Buecker A, Boese J, Wildberger JE, Flohr T, Sinha AM, Krom-bach GA, Gunther RW. Quantitative and qualitative assessment of left ventricular volume with ECG-gated multi-slice spiral CT: value of different image reconstruction algorithms in comparison to MRI. Acta Radiol. 2003;44:604-611.
31. Schuijf JD, Bax JJ, Jukema JW, Lamb HJ, Vliegen HW, Salm LP, de Roos A, van der Wall EE. Noninvasive angiography and assessment of left ventricular function using multi-slice computed tomography in patients with type 2 diabetes. Diabetes Care. 2004;27:2905-2910.
32. Haissaguerre M, Jais P, Shah DC, Takahashi A, Hocini M, Quiniou G, Garrigue S, Le Mouroux A, Le Metayer P, Clementy J. Spontaneous initiation of atrial fibrillation by ectopic beats originating in the pulmonary veins. N Engl J Med. 1998;339:659-666.
33. Ho SY, Cabrera JA, Tran VH, Farre J, Anderson RH, Sanchez-Quintana D. Architecture of the pulmonary veins: relevance to radiofrequency ablation. Heart. 2001;86:265-270.
34. Jongbloed MR, Dirksen MS, Bax JJ, Boersma E, Geleijns K, Lamb HJ, Van Der Wall EE, de Roos A, Schalij MJ. Atrial fibrillation: multi-detector row CT of pulmonary vein anatomy prior to radiofrequency catheter ablation--initial experience. Radiology. 2005;234:702-709.
35. Jongbloed MR, Bax JJ, Lamb HJ, Dirksen MS, Zeppenfeld K, Van Der Wall EE, de Roos A, Schalij MJ. Multi-slice computed tomography versus intracardiac echocardiography to evaluate the pulmonary veins be-fore radiofrequency catheter ablation of atrial fibrillation: a head-to-head comparison. J Am Coll Cardiol. 2005;45:343-350.

Non-Invasive Coronary Imaging and
Assessment of Left Ventricular Function
using 16-slice Computed Tomography
Am J Cardiol2005; 95: 571-574
Joanne D. Schuijf, Jeroen J. Bax, Liesbeth P. Salm , J. Wouter Jukema, Hildo J. Lamb, Ernst E. van der Wall, Albert de Roos
3Chapter

Abstract
Background
In recent years, multi-slice computed tomography (MSCT) has been demonstrated as a feasible
imaging modality for non-invasive coronary angiography and left ventricular (LV) function
analysis. The present study evaluates the overall performance of 16-slice MSCT in the detection
of significant coronary artery disease (CAD), stent or bypass graft stenosis in combination with
global LV function analysis.
Methods
In 45 patients, 16-slice MSCT was performed. From the MSCT images, the presence of signifi-
cant coronary artery stenoses (≥50% luminal diameter reduction) in native coronary segments,
bypass grafts and coronary stents were evaluated and compared with conventional coronary
angiography. In addition, LV ejection fraction was calculated and compared to 2-dimensional
echocardiography.
Results
MSCT was performed successfully in all patients. A close correlation between MSCT and 2-
dimensional echocardiography was demonstrated for the assessment of LV ejection fraction
(y = 0.93x + 3.33, r=0.96, p<0.001). A total of 298 (94%) of native coronary artery segments
could be evaluated on the MSCT images, whereas 81 of 94 (85%) grafts and 41 of 52 (79%)
coronary stents were evaluable. Including all segments, overall sensitivity, specificity, positive
and negative predictive values were 85%, 89%, 71% and 95%, respectively.
Conclusion
16-slice MSCT is a feasible modality for the non-invasive evaluation and exclusion of CAD in
patients presenting with chest pain.

53Non-Invasive Coronary Imaging and Assessment of Left Ventricular Function with 16-slice CT
Introduction
The introduction of 16-slice scanners has led to improved image quality in combination with shorter
acquisition times and preliminary results show indeed a substantial improvement in terms of inter-
pretability and accuracy in the evaluation of coronary arteries 1-3. However, data are still scarce and
have been obtained predominantly in carefully selected patient groups 1-3. In these initial studies,
simultaneous LV function analysis has not been performed, thus not taking full benefit of the ac-
quired data. The present study evaluates the overall performance of 16-slice MSCT in the detection
of significant coronary artery, stent or bypass graft stenosis in combination with global LV function
analysis. Conventional coronary angiography and 2D-echocardiography served as the standards of
reference.
Methods
Patients and study protocol
A total of 45 patients presenting with known or suspected CAD and scheduled for invasive coronary
angiography due to chest pain complaints were included as part of ongoing protocols at our institu-
tion. Only patients in sinus rhythm and without contraindications to the administration of iodinated
contrast media were included. All patients gave written informed consent to the study protocol,
which was approved by the local ethics committee.
MSCT; Data acquisition
All MSCT examinations were performed with a 16-slice Toshiba Multi-slice Aquilion 16 system (Toshi-
ba Medical Systems, Otawara, Japan). Collimation was 16 x 0.5 mm. If arterial grafts were present
however, a collimation of 16 x 1.0 mm was used to reduce scan time. Rotation time was 400, 500 or
600 ms, depending on the heart rate, while the tube current and tube voltage were 250 mA and 120
kV, respectively. The total contrast dose for the scan ranged from 120 to 150 ml depending on the
total scan time, with an injection rate of 4 ml/s through the antecubital vein (Xenetix 300®, Guerbet,
Aulnay S. Bois, France). Automated detection of peak enhancement in the aortic root was used for
timing of the scan. All images were acquired during an inspiratory breath hold with simultaneous
registration of the patient’s electrocardiogram. With the aid of a segmental reconstruction algo-
rithm, data of two or three consecutive heartbeats were used to generate a single image.
For the assessment of LV ejection fraction, 2.0 mm slices were reconstructed in the short-axis ori-
entation at 20 time points, starting at early systole (0% of the cardiac cycle) to the end of diastole
(95% of the cardiac cycle) in steps of 5%. Images were transferred to a remote workstation with dedi-
cated cardiac function analysis software (MR Analytical Software System [MASS], Medis, Leiden, the
Netherlands).

54 Chapter 3
To evaluate the presence of coronary artery stenoses, separate reconstructions in diastole (typically
75% or 80% of the cardiac cycle) were generated with a reconstructed section thickness of either 0.4
mm or 0.8 mm. If motion artifacts were present, additional reconstructions were made at 40, 45, and
50% of the R-R range. Axial data sets were transferred to a remote workstation (Vitrea2, Vital Images,
Plymouth, Minn. USA) for post-processing and subsequent evaluation.
MSCT; Data analysis
Endocardial borders were outlined manually by an independent observer on the short-axis cine images.
Papillary muscles were regarded as being part of the ventricular cavity. After calculation of LV end-sys-
tolic and LV end-diastolic volumes, the related LV ejection fraction was derived by subtracting the end-
systolic volume from the volume at end-diastole and dividing the result by the end-diastolic volume.
MSCT angiograms were evaluated by 2 experienced observers, who were blinded to the results of
coronary angiography. The following protocol was applied in the evaluation of the MSCT coronary
angiograms: Of each patient, the 3-dimensional volume rendered reconstruction was inspected first
to obtain general information of the status and course of the coronary arteries, and if present, coro-
nary bypass grafts and stents. In patients without coronary bypass grafts, native coronary arteries
were divided in segments according to the American Heart Association-American College of Cardi-
ology guidelines and classified as evaluable or not by visual estimation. Subsequently, the interpre-
table segments were evaluated for the presence of significant narrowing (≥50% reduction of lumen
diameter) using both the original axial slices and curved multiplanar reconstructions. In stented seg-
ments, the presence of restenosis was defined reduced run-off of contrast distally, whereas stent
occlusion was defined as the absence of contrast within the stent in combination with the absence
of run-off of contrast distally.
In patients with previous coronary bypass grafting, grafts and the distal course of the recipient ves-
sels were evaluated first. Sequential grafts were considered as separate graft segments. Although
patency was assessed in all grafts, the presence of luminal narrowing of 50% or more was deter-
mined only in grafts with sufficient image quality. If a graft demonstrated significant narrowing or
total occlusion, native segments prior to the graft anastomosis were also evaluated. Remaining na-
tive vessels, e.g. vessels not supplied by coronary bypass grafts, were evaluated afterwards.
2D-echocardiography
For the comparison of LV ejection fraction, 2D-echocardiography was performed prior or after the
MSCT examination within 3 days. Patients were imaged in the left lateral decubitus position using
a commercially available system (Vingmed System FiVe/Vivid-7, GE-Vingmed, Milwaukee, WI, USA).
Images were acquired using a 3.5 MHz transducer at a depth of 16 cm in the parasternal and apical 2-,
4- and 5-chamber views. LV ejection fractions were calculated by an independent observer without
knowledge of the angiographic or MSCT data from the 2- and 4 chamber images using the biplane
Simpson’s rule 4-6.

55Non-Invasive Coronary Imaging and Assessment of Left Ventricular Function with 16-slice CT
Conventional coronary angiography
Conventional coronary angiography was performed according to standard techniques. The femo-
ral approach with the Seldinger technique was applied to obtain vascular access. Average interval
between conventional coronary angiography and MSCT was 18 ± 26 days. Angiograms were visu-
ally evaluated by consensus reading of two experienced observers without knowledge of the MSCT
data.
Statistical analysis
Sensitivity, specificity, positive and negative predictive values for the detection of ≥50% luminal
narrowing in respectively native coronary artery segments, bypass graft segments and stented seg-
ments were calculated. Coronary segments supplied by coronary bypass grafts were included in the
native vessel analysis. For linear regression analysis of LV ejection fractions, the Pearson correlation
coefficient r was computed. Bland-Altman analysis was performed for each pair of values of LV ejec-
tion fraction to calculate limits of agreement and systematic error between the two modalities 7. A
p-value <0.05 was considered to indicate statistical significance.
Results
MSCT was performed successfully in all 45 patients. Main clinical characteristics of the study popula-
tion are listed in Table 1.
Table 1. Characteristics of the study population (n= 45).
n (%)Male/Female 42/3Age (years) 63 ± 10Heart rate during data acquisition 65 ± 10Beta blocker medication 35 (78%)Previous myocardial infarction 29 (64%)Previous percutaneous coronary intervention 30 (67%)Previous coronary bypass grafting 22 (49%)Number of coronary vessels narrowed 1 4 (9%) 2 10 (22%) 3 30 (67%)Angina Pectoris Canadian Cardiovascular Society class 1/2 10 (22%) Canadian Cardiovascular Society class 3/4 35 (78%)Heart Failure New York Heart Association class 1/2 34 (75%) New York Heart Association class 3/4 11 (24%)

56 Chapter 3
LV ejection fraction
Average LV ejection fraction as determined by MSCT was 47 ± 13% (range 15% to 72%) and 47 ± 14%
(range 16% to 75%) with 2D-echocardiography. Linear regression analysis (Figure 1A) demonstrated
an excellent correlation (r=0.96, p<0.001) between both modalities. A mean difference of -0.02 ±
3.9% was demonstrated by Bland-Altman analysis (Figure 1B), not statistically different from zero.
Figure 1. Comparison of MSCT and echocardiography in the assessment of LV function. Panel A represents a linear regression plot showing the correlation between the LV ejection fraction as determined by 2D-echocar-diography and MSCT. In panel B, a Bland-Altman plot of LV ejection fraction is shown. The difference between each pair is plotted against the average value of the same pair (solid line= mean value of differences and dotted lines = mean value of differences ± 2SDs). Abbreviation: LVEF: left ventricular ejection fraction.
Coronary angiography
Conventional coronary angiography, which was performed in 317 native segments, revealed nar-
rowing of ≥50% of luminal diameter in 64 segments. A total of 298 (94%) of these segments could
be evaluated on the MSCT images. Causes of uninterpretability were small size of the vessel (n=9),
ectopic heartbeats (n=1), motion artifacts (n=4), vascular clips (n=1) and insufficient contrast (n=4).
Significant stenoses were correctly identified in 59 segments, while the presence of significant ste-
nosis was correctly ruled out in 231 of 253 segments, resulting in a sensitivity and specificity of 93%
and 91%. Considering only the interpretable segments, sensitivity and specificity were 98% and
97%, respectively.
A total of 62 grafts (arterial grafts: 13, venous grafts: 49) of which 31 sequential grafts, were present,
resulting in 94 graft segments. Total occlusion was correctly identified in 23 of 24 occluded grafts,
whereas patency was correctly determined in all 70 patent grafts. Thirteen graft segments (all arte-
rial grafts) were of insufficient quality to assess the presence of ≥50% stenosis. In the remaining 81
grafts, the presence of significant stenosis was correctly identified in all 27 grafts with 50% or more
y = 0.93x + 3.33r= 0.96, p<0.001
0
20
40
60
80
0 20 40 60 80
LVEF Echo (%)
LV
EF
CT
(%
)
A B
-10
-8
-6
-4
-2
0
2
4
6
8
10
15 25 35 45 55 65
Average LVEF (%) CT-Echo
LV
EF
CT
-Ec
ho
(%)

57Non-Invasive Coronary Imaging and Assessment of Left Ventricular Function with 16-slice CT
narrowing. In 2 of 54 graft segments without significant stenosis however, the presence of stenosis
was incorrectly observed on the MSCT images, resulting in a specificity of 96%.
Of the 52 stented segments that were present in the study population, a total of 41 (79%) was judged
interpretable by MSCT. In the interpretable stents, 7 of 8 stented segments with significant in-stent
restenosis and all patent stented segments (n=33, 100%) were correctly identified on the MSCT im-
ages. However, when uninterpretable stents were included in the analysis, sensitivity and specificity
were 54% and 85%, respectively.
Details of all analyses including positive and negative predictive values are summarized in Table 2.
Examples of MSCT images and corresponding conventional angiograms are depicted in Figure 2.
Figure 2. Non-invasive coronary angiography with MSCT
A: A curved multiplanar reconstruction of a right coronary artery with small calcifications (arrowheads) but no significant stenosis is shown. C: An example of a coronary stent (arrowhead) with no significant in-stent resteno-sis, placed in the proximal left anterior descending coronary artery. However, distal to the stent, both soft and calcified plaque can be observed (arrows). E: An example of an intermediate stenosis in the left anterior descend-ing coronary artery is shown in panel E, while panels E1-3 represent cross-sectional images. G,H: An example of a venous bypass graft supplying an obtuse marginal branch is provided. On both MSCT images, a curved multipla-nar reconstruction (panel G) and a 3D volume rendered reconstruction (panel H), narrowing of more than 50% lumen diameter is demonstrated. B,D,F,I: Corresponding coronary angiograms confrimed findings.

58 Chapter 3
Table 2. Diagnostic accuracy of M
SCT.
Native segm
ents (≥50%
stenosis)G
raft segments
(occlusion)G
raft segments (≥50%
stenosis)
Stented segments (≥50%
in-stent stenosis)
All segm
ents(≥50%
stenosis)
Evaluation possible298/317 (94%
)94/94 (99%
)81/94 (85%
)41/52 (79%
)420/463 (91%
)
Sensitivity 59/60 (98%
)23/24 (96%
)27/27 (100%
)7/8 (88%
)93/95 (98%
)
Specificity231/238 (97%
)70/70 (100%
)52/54 (96%
)33/33 (100%
)316/325 (97%
)
Positive predictive value59/66 (89%
)22/22 (100%
)27/29 (93%
)7/7 (100%
)93/102 (91%
)
Negative predictive value
231/232 (100%)
70/71 (99%)
52/52 (100%)
33/34 (97%)
316/318 (99%)
Diagnostic Accuracy
290/298 (97%)
93/94 (99%)
79/81 (98%)
40/41 (98%)
409/420 (97%)
Including uninterpretable segments
Sensitivity 59/64 (93%
)23/24 (96%
)27/32 (84%
)7/13 (54%
)93/109 (85%
)
Specificity231/253 (91%
)70/70 (100%
)52/62 (84%
)33/39 (85%
)316/354 (89%
)
Positive predictive value59/81 (73%
)22/22 (100%
)27/36 (75%
)7/13 (54%
)93/131 (71%
)
Negative predictive value
231/236 (98%)
70/71 (99%)
52/57 (91%)
33/39 (85%)
316/332 (95%)
Diagnostic Accuracy
290/317 (91%)
93/94 (99%)
79/94 (84%)
40/52 (77%)
409/463 (88%)

59Non-Invasive Coronary Imaging and Assessment of Left Ventricular Function with 16-slice CT
Discussion
The results of the present study demonstrate that non-invasive assessment of the presence of CAD in
patients presenting with chest pain is feasible with 16-slice MSCT. In 317 native coronary artery seg-
ments, a sensitivity and specificity of 93% and 91%, respectively, were demonstrated without exclu-
sion of the 6% segments that were uninterpretable. These findings are in line with results of previous
16-slice MSCT studies 1-3;8. Although in the individual studies observed sensitivities and specificities
ranged from 89% to 95% and 86% to 98%, negative predictive values were consistently above 97%,
similar to our results (98%). Thus, the current findings emphasize the potential of MSCT to serve as
a first-line diagnostic modality to rule out the presence of CAD. This is an important finding since
approximately 20% of invasive catheterizations are performed for purely diagnostic purposes and
are not followed by any interventions. Therefore, MSCT may be particularly valuable to avoid the
discomfort, risks and costs of invasive angiography in a considerable number of patients.
In all coronary bypass grafts, patency could be assessed with a high accuracy (99%). More subtle de-
tection of graft stenosis, however, could be performed in only 85% of grafts, resulting in a sensitivity
and specificity of 84%. Considering only interpretable bypass grafts, sensitivity and specificity were
100% and 96%, respectively.
Slightly lower results were observed in the evaluation of stented segments. Only 41 of 52 available
stented segments could be evaluated for the presence of significant in-stent stenosis. In the inter-
pretable stented segments, resulting sensitivity and specificity were 88% and 100%, respectively.
Thus, although patients with suspected in-stent stenosis may still benefit more from direct referral
to invasive coronary angiography, MSCT may be particularly useful to evaluate patients with known
or suspected CAD or with recurrent chest pain after coronary artery bypass grafting. In addition,
information on LV function can be derived.

60 Chapter 3
References 1. Martuscelli E, Romagnoli A, D’Eliseo A, Razzini C, Tomassini M, Sperandio M, Simonetti G, Romeo
F. Accuracy of thin-slice computed tomography in the detection of coronary stenoses. Eur Heart J. 2004;25:1043-1048.
2. Mollet NR, Cademartiri F, Nieman K, Saia F, Lemos PA, McFadden EP, Pattynama PM, Serruys PW, Krestin GP, de Feyter PJ. Multi-slice spiral computed tomography coronary angiography in patients with stable angina pectoris. J Am Coll Cardiol. 2004;43:2265-2270.
3. Nieman K, Cademartiri F, Lemos PA, Raaijmakers R, Pattynama PM, de Feyter PJ. Reliable noninvasive coronary angiography with fast submillimeter multi-slice spiral computed tomography. Circulation. 2002;106:2051-2054.
4. Schiller NB, Acquatella H, Ports TA, Drew D, Goerke J, Ringertz H, Silverman NH, Brundage B, Botvinick EH, Boswell R, Carlsson E, Parmley WW. Left ventricular volume from paired biplane two-dimensional echocardiography. Circulation. 1979;60:547-555.
5. Gordon EP, Schnittger I, Fitzgerald PJ, Williams P, Popp RL. Reproducibility of left ventricular volumes by two-dimensional echocardiography. J Am Coll Cardiol. 1983;2:506-513.
6. Otterstad JE, Froeland G, St John SM, Holme I. Accuracy and reproducibility of biplane two-dimen-sional echocardiographic measurements of left ventricular dimensions and function. Eur Heart J. 1997;18:507-513.
7. Bland JM, Altman DG. Statistical methods for assessing agreement between two methods of clinical measurement. Lancet. 1986;1:307-310.
8. Ropers D, Baum U, Pohle K, Anders K, Ulzheimer S, Ohnesorge B, Schlundt C, Bautz W, Daniel WG, Achenbach S. Detection of coronary artery stenoses with thin-slice multi-detector row spiral com-puted tomography and multiplanar reconstruction. Circulation. 2003;107:664-666.

Diagnostic Accuracy of 64-slice Multi-Slice
Computed Tomography in
the Non-Invasive Evaluation of Significant
Coronary Artery Disease
Am J Cardiol2006;98:145-148
Joanne D. Schuijf, Gabija Pundziute, J. Wouter Jukema, Hildo J. Lamb, Barend L. van der Hoeven, Albert de Roos, Ernst E. van der Wall,
Jeroen J. Bax
4Chapter

Abstract
Background
The purpose of the present study was to determine the diagnostic accuracy of current 64-slice
multi-slice computed tomography (MSCT) in the detection of significant coronary artery dis-
ease (CAD) using conventional coronary angiography as the gold standard.
Methods
In 61 patients scheduled for conventional coronary angiography, 64-slice MSCT was per-
formed and evaluated for the presence of significant (≥50% luminal narrowing) stenoses.
Results
One patient had to be excluded due to a heart rate above 90 beats per minute during data
acquisition. In the remaining 60 patients (46 men/14 women, average age 60 ± 11 years) 854
segments were available for evaluation. Of these segments 842 (99%) were of sufficient image
quality. Conventional coronary angiography identified 73 lesions, of which 62 were detected
by MSCT. Corresponding sensitivity and specificity were 85% and 97%, respectively. On a pa-
tient-per-patient analysis, sensitivity, specificity, and positive and negative predictive values
were 94%, 97%, 97%, and 93%, respectively.
Conclusion
The present study confirms that 64-slice MSCT enables accurate and non-invasive evaluation
of significant coronary artery stenoses.

63Diagnostic Accuracy of 64-slice Multi-Slice Computed Tomography
Introduction
In a short period of time, spiral multi-slice computed tomography (MSCT) has rapidly matured into
a technique that is on the verge of being used as an alternative modality in the clinical evaluation of
patients suspected of having coronary artery stenoses. While thorough assessment of the entire cor-
onary tree was still problematic with the original 4-slice systems, substantial improvement was ob-
tained with the introduction of 16-slice scanners 1. In addition, results of numerous studies compar-
ing MSCT to conventional coronary angiography suggested enhanced sensitivity of the technique
as well, with no loss in specificity 2. Currently, 64-slice MSCT systems are rapidly installed, offering
further improved image quality while acquiring data in even shorter periods of time 3;4. Accordingly,
the purpose of the present study was to determine the diagnostic accuracy of current 64-slice MSCT
in the detection of significant coronary artery disease (CAD) using conventional coronary angiogra-
phy as the gold standard.
Methods
Patients and study protocol
The study group consisted of 61 patients who were scheduled for conventional coronary angiog-
raphy. In addition, MSCT coronary angiography was performed. Patients with contraindications to
MSCT were excluded 5. Conventional catheter-based coronary angiography was performed prior
or after MSCT and served as reference standard. All patients gave written informed consent to the
study protocol, which was approved by the local ethics committee.
Data acquisition
MSCT was performed using a Toshiba Multi-slice Aquilion 64 system (Toshiba Medical Systems, To-
kyo, Japan) with a collimation of 64 x 0.5 mm and a rotation time of 0.4 s. The tube current was 300
mA, at 120 kV. In obese patients (BMI ≥ 30 kg/m2), parameters were adjusted to 350 mA at 135 kV
in order to improve image quality. Non-ionic contrast material was administered in the antecubital
vein with an amount of 80-110 ml, depending on the total scan time, and a flow rate of 5.0 ml/sec
(Iomeron 400 ®). Automated peak enhancement detection in the descending aorta was used for tim-
ing of the bolus using a threshold of +100 Hounsfield Units. Data acquisition was performed during
an inspiratory breath hold of approximately 8 to 10s.
During the MSCT examination, ECG was recorded simultaneously for retrospective gating of the
data. An initial data set was reconstructed at 75% of the R-R interval with a slice thickness of 0.5 mm
and a reconstruction interval of 0.3 mm. In 17 patients, additional reconstructions were explored
to obtain more optimal reconstruction phases. Similarly, in case of high-density artefacts, sharper
reconstruction kernels were explored to improve image quality. Finally, images were transferred to a

64 Chapter 4
remote workstation (Vitrea2, Vital Images, Plymouth, Minn. USA) for post-processing and evaluation.
Conventional diagnostic coronary angiography was performed according to standard techniques.
Data analysis
MSCT angiograms were evaluated by an invasive cardiologist with several years of experience of scor-
ing MSCT coronary angiograms. Image analysis was performed blinded to the results of coronary
angiography. 3D volume rendered reconstructions were used to obtain general information of the
status and course of the coronary arteries. Then, the original transaxial slices were inspected for the
presence of significant (≥50% reduction of lumen diameter) narrowing, assisted by curved multiplanar
reconstructions. Segmentation of the coronary arteries was performed based on the American Heart
Association-American College of Cardiology guidelines 6. Segments containing coronary stents were
included in the analysis; the presence of restenosis in a stented segment was identified by reduced or
complete absence of contrast within the stent as well as reduced or absent run-off of contrast distally.
Conventional angiograms were evaluated by an experienced observer without knowledge of the
MSCT data who identified the available coronary segments based the American Heart Association-
American College of Cardiology guidelines 6. Each segment was then evaluated for the presence of
≥50% diameter stenosis, based on evaluation of 2 orthogonal views.
Statistical analysis
Obstructive CAD was defined as luminal narrowing of 50% or more. Accordingly, sensitivity, specific-
ity, positive and negative predictive values (including 95% confidence intervals) for the detection
of stenosis ≥50% on conventional angiography, were calculated on a patient, vessel and segmental
basis. A patient or vessel was classified as correct positive if the presence of any stenosis was identi-
fied correctly. In the per vessel analysis, the intermediate branch was considered as part of the left
circumflex. All statistical analyses were performed using SPSS software (version 12.0, SPSS Inc, Chi-
cago, Il, USA). A value of P<0.05 was considered statistically significant.
Results
Patient characteristics
In total, 61 consecutive patients (46 men/15 women, age 60 ± 11 years) were included. The average
interval between MSCT and conventional angiography was 49 ± 61 days. In one patient, the heart
rate rose above 90 bpm during MSCT, rendering the complete data set uninterpretable. The patient
characteristics of the remaining 60 patients are summarized in Table 1. In total, CAD was suspected
in 25 (42%) patients, whereas it was known in 35 (58%) patients. A total of 44 stented segments was
included in the analysis.

65Diagnostic Accuracy of 64-slice Multi-Slice Computed Tomography
Table 1. Clinical characteristics of the study population (n=60).
n (%)Male/Female 46/14Age (years) 60 ± 11 (range) 38-80Heart Rate (beats per minute) 60 ± 11 (range) 44 - 83Average calcium score (Agatston) 423 ± 868 (range) 0 - 6264Beta-Blocking medication 43 (72%)Diabetes Mellitus 6 (10%)Hypertension a 26 (43%)Hypercholesterolemia b 27 (45%)Positive family history 22 (37%)Current smoking 33 (55%)Body Mass Index ≥ 30 kg/m2 15 (25%)History of CAD No history 25 (42%) Previous coronary angioplasty 33 (55%) Previous coronary bypass grafting 0 Previous myocardial infarction 33 (55%) Anterior wall 26 (79%) Inferior wall 7 (21%)Number of coronary arteries narrowed as determined on angiography None 14 (23%) 1 26 (43%) >1 20 (33%)
a defined as systolic blood pressure ≥140 mm Hg and/or diastolic blood pressure ≥90 mm Hg, and/or use of anti-hypertensive medication. b defined as total serum cholesterol ≥230 mg/dl and/or serum triglycerides ≥200 mg/dl or use of a lipid-lowering agent.
MSCT coronary angiography
In 854 segments evaluated on conventional coronary angiography, a total of 74 significant stenoses
was identified. MSCT image quality was insufficient in 12 (1.4%) segments to allow further evalua-
tion. Reasons for uninterpretability were low contrast-to-noise due to a high BMI (n=2), extensive
calcifications (n=5) and small vessel size (n=5). A total of 6 uninterpretable segments were located
in the left circumflex coronary artery (segment 10, n=3, segment 12, n=1, and segment 17, n=2),
whereas 4 uninterpretable segments were located in the distal RCA (segment 4, n=2 and segment
16, n=2) and 1 in the first diagonal branch. In the remaining 842 segments, the presence of stenosis
was correctly ruled out by MSCT in 755 of 769 segments, while 62 of 73 segments were correctly
identified as having a significant lesion on MSCT. A total of 14 lesions that were non-significant
on conventional coronary angiograpy were overestimated on MSCT, while 11 lesions were falsely

66 Chapter 4
deemed to be insignificant. Accordingly, resulting sensitivity and specificity for the detection of sig-
nificant lesions were 85% and 98% on a segmental level. In the 44 stented segments, 3 of 3 segments
with significant in-stent restenosis were correctly detected, whereas the absence of significant le-
sions was correctly identified in 41 patent stented segments.
Figure 1. Example of a patient with significant coronary artery disease.
In Panel A, a 3D volume rendered reconstruction is shown, providing an overview of the left anterior descending (LAD) and left circumflex (LCx). An enlargement of the section indicated by the black arrowhead (Panel B) dem-onstrates a significant narrowing in the LAD (black arrowhead) and, more distally, a small coronary calcification (white arrowhead) that can also be observed on the curved multiplanar reconstruction (Panel D). Cross-sectional images (Panel E) confirm the presence of a significant non-calcified lesion. In Panel F, a curved multiplanar recon-struction of the LCx without significant lesions is provided. In the right coronary artery (Panel G, 3D volume ren-dered reconstruction and Panel H, curved multiplanar reconstruction), no significant narrowings were observed as well. Findings were confirmed by conventional coronary angiography (Panels C and I).

67Diagnostic Accuracy of 64-slice Multi-Slice Computed Tomography
Vessel analysis
Due to extensive calcifications, 1 left circumflex was deemed uninterpretable. In the remaining 239
coronary arteries, 46 of 53 coronary arteries were correctly identified as having one or more signifi-
cant lesions whereas the absence of any stenosis was correctly identified in 179 of 186 vessels, result-
ing in a sensitivity and specificity of 87% and 96%, respectively.
Patient analysis
Conventional coronary angiography identified 31 patients with one or more significant lesions. On
MSCT, 29 (94%) of these patients were correctly identified. In one of these patients however, a lesion
in the left anterior descending coronary artery was misjudged to be significant on MSCT, whereas
in fact a lesion in the right coronary artery proved to be significant during conventional coronary
angiography. In the remaining patients, the correct lesion was identified on MSCT. An example of a
patient with a significant stenosis is provided in Figure 1. MSCT correctly ruled out the presence of
any significant lesion in 28 of 29 (97%) patients. Only 3 patients were incorrectly diagnosed by MSCT.
In one patient, a significant lesion in origin of the second diagonal was missed due to the small size
of the coronary side-branch. In the other patient with false negative MSCT results, a significantly dis-
eased left anterior descending and left circumflex were incorrectly classified as having non-obstruc-
tive disease. Finally, in one patient who was incorrectly classified positive, a lesion of approximately
40% located in the left anterior descending was overestimated by MSCT.
Results of all analyses including positive and negative predictive values with 95% confidence inter-
vals are summarized in Table 2.
Table 2. Diagnostic accuracy of Multi-Slice Computed Tomography (n=60).
Segmental analysis Vessel analysis Patient analysis
Excluded 12/854, 1.4% 1/240, 0.4% 0%
Sensitivity 62/73 (85%, 77% - 93%) 46/53 (87%, 78% - 96%) 29/31 (94%, 86% - 100%)
Specificity 755/769 (98%, 97% - 99%) 179/186 (96%, 93% - 99%) 28/29 (97%, 91% - 100%)
Positive Predictive Value
62/76 (82%, 73% - 91%) 46/53 (87%, 78% - 96%) 29/30 (97%, 91% - 100%)
Negative Predictive Value
755/766 (99%, 98% - 100%) 179/186 (96%, 93% - 99%) 28/30 (93%, 84% - 100%)
Diagnostic accuracy
817/842 (97%, 96 % - 98%) 225/239 (94%, 91% - 97%) 57/60 (95%, 89% - 100%)
68 Chapter 4
Discussion
On a segmental level, a diagnostic accuracy of 97% was observed. Importantly, only 12 (1%) seg-
ments could not be evaluated for the presence or absence of significant lesions due to insufficient
image quality. In addition, an excellent specificity of 98% was observed with a somewhat lower
sensitivity of 85% on a segmental basis. Nonetheless, from a clinical point of view, data regarding
the performance on a patient rather than segmental basis are preferred, since selection of patients
needing further invasive evaluation or intervention will be based on these findings. In the present
study, a sensitivity of 94% was noted with a corresponding specificity of 97% in the detection of
patients with obstructive CAD. Thus, in contrast to several previous studies 4;7, no loss in specificity
was observed when shifting from a segmental to a patient analysis. The current observations are in
line with the few initial investigations with 64-slice MSCT that have been published thus far 3;4;8. Simi-
lar sensitivity and specificity of 86% and 95% on segmental basis were reported by Raff et al, who
performed 64-slice MSCT in 70 patients 7. More recently, results in 52 patients presenting with a wide
range of clinical conditions were reported by Mollet and colleagues 4. As a result of the highly symp-
tomatic population included, a higher sensitivity (100%) with somewhat lower specificity (92%) was
obtained.
Since the purpose of the present study was to compare the diagnostic accuracy of MSCT to invasive
coronary angiography, only patients with a relatively high likelihood of having significant stenoses
were included. As a result, only 42% of included patients presented without known CAD. Although
this percentage still compares favourably to most of the other available data on MSCT coronary an-
giography, it stipulates the current lack of data in lower CAD prevalence populations. Considering
that non-invasive coronary angiography is most likely to be used in these particular populations to
allow definite exclusion of significant CAD, data on the performance of MSCT in these populations
are needed.
Despite rapid technological advancements, several limitations inherent to MSCT remain. First, a sta-
ble and preferably low heart rate remains essential for high-quality MSCT images and administration
of beta-blockers prior to the examination is often needed. Secondly, the current lack of validated
quantification algorithms for MSCT represents another important issue. Although visual evaluation
will be sufficient in most segments, more precise assessment of the degree of luminal narrowing will
be needed in a considerable number of examinations. However, as shown by Leber and colleagues,
the ability to visually quantify the grade of luminal obstruction on MSCT remains limited, even with
64-slice technology 3. Indeed, also in the present study, the degree of stenosis was incorrectly esti-
mated as either more or less than 50% diameter narrowing in 2 patients, resulting in false diagnosis
although in fact the presence of lesions was correctly identified. Accordingly, quantification of MSCT
coronary angiography is likely to provide enhanced diagnostic accuracy while also improving re-
producibility of the technique and further investments in the development of such algorithms are
needed. Finally, the radiation burden of MSCT remains of concern.

69Diagnostic Accuracy of 64-slice Multi-Slice Computed Tomography
References 1. Ropers D, Baum U, Pohle K, Anders K, Ulzheimer S, Ohnesorge B, Schlundt C, Bautz W, Daniel WG,
Achenbach S. Detection of coronary artery stenoses with thin-slice multi-detector row spiral com-puted tomography and multiplanar reconstruction. Circulation. 2003;107:664-666.
2. Schuijf JD, Bax JJ, Shaw LJ, de Roos A, Lamb HJ, van der Wall EE, Wijns W. Meta-analysis of comparative diagnostic performance of magnetic resonance imaging and multislice computed tomography for noninvasive coronary angiography. Am Heart J. 2006;151:404-411.
3. Leber AW, Knez A, von Ziegler F, Becker A, Nikolaou K, Paul S, Wintersperger B, Reiser M, Becker CR, Steinbeck G, Boekstegers P. Quantification of obstructive and nonobstructive coronary lesions by 64-slice computed tomography: a comparative study with quantitative coronary angiography and intravascular ultrasound. J Am Coll Cardiol. 2005;46:147-154.
4. Mollet NR, Cademartiri F, van Mieghem CA, Runza G, McFadden EP, Baks T, Serruys PW, Krestin GP, de Feyter PJ. High-resolution spiral computed tomography coronary angiography in patients referred for diagnostic conventional coronary angiography. Circulation. 2005;112:2318-2323.
5. Schuijf JD, Bax JJ, Salm LP, Jukema JW, Lamb HJ, van der Wall EE, de Roos A. Noninvasive coronary im-aging and assessment of left ventricular function using 16-slice computed tomography. Am J Cardiol. 2005;95:571-574.
6. Austen WG, Edwards JE, Frye RL, Gensini GG, Gott VL, Griffith LS, McGoon DC, Murphy ML, Roe BB. A reporting system on patients evaluated for coronary artery disease. Report of the Ad Hoc Committee for Grading of Coronary Artery Disease, Council on Cardiovascular Surgery, American Heart Associa-tion. Circulation. 1975;51:5-40.
7. Raff GL, Gallagher MJ, O’Neill WW, Goldstein JA. Diagnostic accuracy of noninvasive coronary angiog-raphy using 64-slice spiral computed tomography. J Am Coll Cardiol. 2005;46:552-557.
8. Leschka S, Alkadhi H, Plass A, Desbiolles L, Grunenfelder J, Marincek B, Wildermuth S. Accuracy of MSCT coronary angiography with 64-slice technology: first experience. Eur Heart J. 2005;26:1482-1487.


Meta-Analysis of Comparative Diagnostic
Performance of Magnetic Resonance Imaging
and Multi-Slice Computed Tomography for
Non-Invasive Coronary Angiography
Am Heart J 2006; 151: 404-411
Joanne D. Schuijf, Jeroen J. Bax, Leslee J. Shaw, Albert de Roos, Hildo J. Lamb, Ernst E. van der Wall, William Wijns
5Chapter

Abstract
Background
Magnetic Resonance Imaging (MRI) and Multi-Slice Computed Tomography (MSCT) have
emerged as potential non-invasive coronary imaging techniques. The objective of the present
study was to clarify the current accuracy of both modalities in the detection of significant cor-
onary artery lesions (compared to conventional angiography as the gold standard) by means
of a comprehensive meta-analysis of the presently available literature.
Methods
A total of 51 studies on the detection of significant coronary artery stenoses (50% diameter
stenosis or more) and comparing results to conventional angiography were identified by
means of a MEDLINE search. Weighted sensitivities, specificities, predictive values, all with 95%
confidence intervals (CIs), as well as summary odds ratios were calculated for both techniques.
In addition, the relationship between diagnostic specificity and disease prevalence was deter-
mined using meta-regression analysis.
Results
A comparison of sensitivities and specificities revealed significantly higher values for MSCT
(weighted average: 85%, 95% CI: 86%-88% and 95%, 95% CI: 95%) as compared with MRI
(weighted average: 72%, 95% CI: 69%-75% and 87%, 95% CI: 86-88%). A significantly higher
odds ratio (16.9-fold) for the presence of significant stenosis was observed for MSCT as com-
pared to MRI (6.4-fold) (p<0.0001). Linear-regression analysis revealed a better specificity for
MSCT versus MRI in lower disease prevalence populations (p=0.056).
Conclusion
Meta-analysis of the available studies with MRI and MSCT for non-invasive coronary angiog-
raphy indicates that MSCT has currently a significantly higher accuracy to detect or exclude
significant CAD.
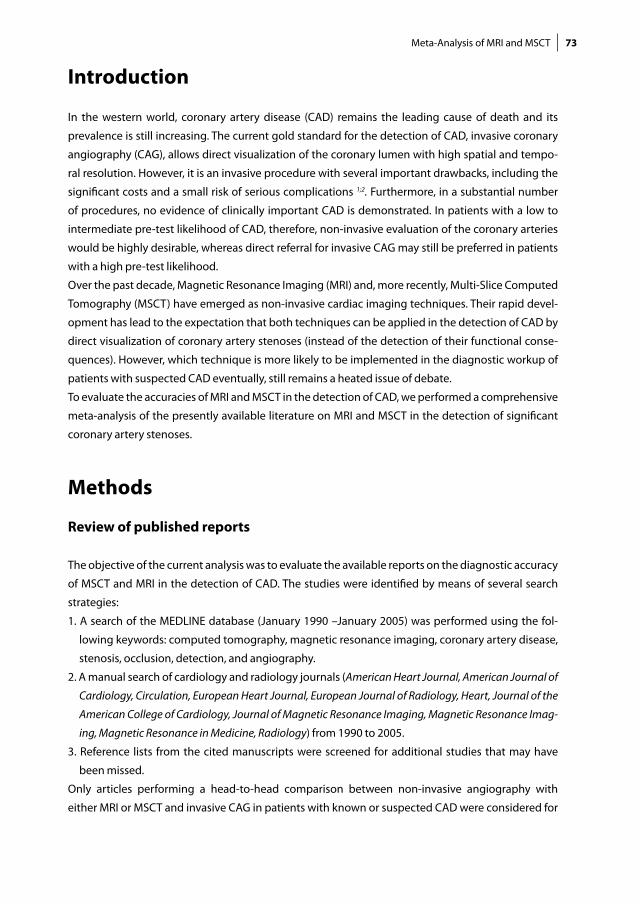
73Meta-Analysis of MRI and MSCT
Introduction
In the western world, coronary artery disease (CAD) remains the leading cause of death and its
prevalence is still increasing. The current gold standard for the detection of CAD, invasive coronary
angiography (CAG), allows direct visualization of the coronary lumen with high spatial and tempo-
ral resolution. However, it is an invasive procedure with several important drawbacks, including the
significant costs and a small risk of serious complications 1;2. Furthermore, in a substantial number
of procedures, no evidence of clinically important CAD is demonstrated. In patients with a low to
intermediate pre-test likelihood of CAD, therefore, non-invasive evaluation of the coronary arteries
would be highly desirable, whereas direct referral for invasive CAG may still be preferred in patients
with a high pre-test likelihood.
Over the past decade, Magnetic Resonance Imaging (MRI) and, more recently, Multi-Slice Computed
Tomography (MSCT) have emerged as non-invasive cardiac imaging techniques. Their rapid devel-
opment has lead to the expectation that both techniques can be applied in the detection of CAD by
direct visualization of coronary artery stenoses (instead of the detection of their functional conse-
quences). However, which technique is more likely to be implemented in the diagnostic workup of
patients with suspected CAD eventually, still remains a heated issue of debate.
To evaluate the accuracies of MRI and MSCT in the detection of CAD, we performed a comprehensive
meta-analysis of the presently available literature on MRI and MSCT in the detection of significant
coronary artery stenoses.
Methods
Review of published reports
The objective of the current analysis was to evaluate the available reports on the diagnostic accuracy
of MSCT and MRI in the detection of CAD. The studies were identified by means of several search
strategies:
1. A search of the MEDLINE database (January 1990 –January 2005) was performed using the fol-
lowing keywords: computed tomography, magnetic resonance imaging, coronary artery disease,
stenosis, occlusion, detection, and angiography.
2. A manual search of cardiology and radiology journals (American Heart Journal, American Journal of
Cardiology, Circulation, European Heart Journal, European Journal of Radiology, Heart, Journal of the
American College of Cardiology, Journal of Magnetic Resonance Imaging, Magnetic Resonance Imag-
ing, Magnetic Resonance in Medicine, Radiology) from 1990 to 2005.
3. Reference lists from the cited manuscripts were screened for additional studies that may have
been missed.
Only articles performing a head-to-head comparison between non-invasive angiography with
either MRI or MSCT and invasive CAG in patients with known or suspected CAD were considered for

74 Chapter 5
Table 1. Diagnostic accuracy of M
RI to detect coronary artery stenoses in 28 studies with 903 patients.
YearA
uthorPts (n)
Mean age (yrs)
Male
(%)
Prevalence of CA
D (%
)CA
G
criteriumTechnique
Assessable (%
) (nr segm
ents)Sensitivity (%
)(nr segm
ents)Specificity (%
)(nr segm
ents)
2D Breath H
old1993
Manning et al. 24
3954
9074
> 50, V*G
E98 (147/150)
90 (47/52)92 (87/95)
1993Pennell et al. 26
7N
AN
A71
#, V*G
EN
A83 (5/6)
NA
1996M
ohiaddin et al. 2516
57N
AN
A> 50, V*
GE
90 (43/48)56 (5/9)
82 (28/34)1996
Pennell et al. 2739
5592
NA
> 50, VG
EN
A85 (47/55)
NA
1997Post et al. 28
3558
77N
A> 50, V*
GE
89 (125/140)63 (22/35)
89 (80/90)
Weighted m
ean93 (315/338)
80 (126/157)89 (195/219)
3D Breath H
old1999
Kessler et al. 10†6
NA
NA
NA
> 50, VG
EN
A60 (3/5)
NA
2000Van G
euns et al. 3038
NA
7168
> 50, VG
E69 (187/272)
68 (21/31)97 (151/156)
2000Regenfus et al. 29
5061
8072
> 50, VG
E77 (268/350)
86 (48/56)91 (193/212)
2002Regenfus et al. 15†
3258
7269
> 50, VG
E76 (171/224)
87 (26/30)91 (129/141)
2004Jahnke et al. 7†
4062
6063
> 50, VSSFP
45 (143/320)63 (12/19)
82 (102/124)
Weighted m
ean66 (769/1166)
78 (110/141)91 (575/633)
3D N
avigator1996
Post et al. 1420
5880
75 > 50, V
GE
96 (77/80)38 (8/21)
95 (53/56)1997
Müller et al. 12
3561
7186
> 50, VSE
NA
83 (45/54)94 (115/122)
1997Kessler et al. 9
7360
75N
A> 50, V
GE
52 (236/455)65 (28/43)
88 (169/193)1998
Woodard et al. 22
1060
50N
A> 30, V*
GE
NA
70 (7/10)N
A1999
Sandstede et al. 1630
6377
100> 50, V*
SE77 (92/120)
81 (30/37)89 (49/55)
1999Van G
euns et al. 1832
NA
62N
A> 50, V
GE
74 (151/203)50 (13/26)
91 (114/125)1999
Kessler et al. 10†6
NA
NA
NA
> 50, VG
EN
A60 (3/5)
NA
2000Sardanelli et al. 17
4265
7987
> 50, VG
E86 (234/273)
82 (55/67)89 (149/167)
2001Kim
et al. 11109
5969
59 > 50, Q
V*G
E86 (374/434)
83 (78/94)73 (204/280)
2002Plein et al. 13
1061
80100
> 50, V*G
E93 (37/40)
88 (15/17)85 (17/20)
2002W
eber et al. 2011
61N
AN
A> 50, V
TFE70 (62/88)
88 (14/16)93 (43/46)
2002W
ittlinger et al. 21 25
6280
NA
#, VSE
85 (102/120)75 (18/24)
100 (78/78)2002
Regenfus et al. 15†32
5872
69 > 50, V
GE
69 (155/224)60 (15/25)
88 (115/130)2002
Watanabe et al. 19
1271
75100
> 50, VTFE
70 (49/70)80 (12/15)
85 (29/34)2002
Van Geuns et al. 23
2759
NA
70>50, V
GE
69 (139/201)46 (12/26)
90 (102/113)2003
Bogaert et al. 321
6271
68 > 50, Q
TFE72 (134/186)
56 (15/27)83 (89/107)
2003Ikonen et al. 8
6958
63 68
> 50, Q*
GE
84 (233/276)75 (64/85)
62 (92/148)2004
Jahnke et al. 7†40
6260
63> 50, V
SSFP79 (254/320)
72 (26/36)92 (200/218)
2005G
erber et al. 627
6589
81>50, Q
TFFE100 (294/294)
62 (36/58)84 (198/236)
2004M
üller et al. 530
6083
100>50, N
AG
E100 (221/221)
85 (35/41)84 (151/180)
2005Som
mer et al. 4
1863
6161
>50, QTFE
87 (109/126)82 (14/17)
88 (80/91)
Weighted m
ean82 (2953/3731)
73 (543/744)85 (2047/2399)
3T2005 Som
mer et al. 4
1863
6161
>50, QTFE
86 (108/126)82 (14/17)
89 (80/90)
Weighted m
ean 1.5 T83 (3441/4147)
72 (749/1043) 87 (2600/2997)
* Only vessels available, no segm
ental analysis, † Sam
e study group. In case of study comparing 2 techniques, results of technique w
ith best results were included in the overall w
eighted mean.
Abbreviations: CAG: conventional angiography, G
E: gradient echo; NA: not available, Q
: quantitative analysis, SE: spin-echo, SSFP: steady-state free precession, TFE: turbo flash echo, TFFE: turbo flash field echo, V: visual analysis

75Meta-Analysis of MRI and MSCT
evaluation, while abstracts, reviews and articles written in another language than English were dis-
regarded. Finally, reports indicating that the patients included were subsets of previously published
studies (n=1) or reports with insufficient data to calculate sensitivity and specificity on a segmental
basis (n=9) were also excluded. When papers reported results of multiple observers, data from the
observer with the highest accuracy were used for further analysis.
Statistical Methods
From each publication, a 2 x 2 frequency table was constructed based upon true negative and posi-
tives and false negative and positives. Diagnostic sensitivity (= true positives / [true positive + false
negatives]) and specificity (= true negatives / [true negatives + false positives]) were calculated.
Pooled calculations for diagnostic accuracy of MRI and MSCT techniques were performed based
upon the proportional sample size of each report. The 95% confidence intervals (CIs) of the weighted
sensitivities and specificities were calculated using the following formula: p ± 1.96*√{(p*(100-p))/n},
where p = weighted sensitivity or specificity (%) and n = the total number of segments.
Summary odds ratios were calculated using the Comprehensive Meta AnalysisTM program (www.
meta-analysis.com, access date: February 2004). The odds ratio and summary odds ratio, with 95%
CIs, for angiographic CAD was defined for positive MSCT and MRI studies. For this analysis, only data
with negative and positive study findings were included. Pooled summary data for CAD incident
cases/denominators of negative and positive studies were also calculated. A chi-square test for het-
erogeneity was calculated. The summary odds ratio was calculated using a random effects inverse
variance approach. Analysis of variance techniques were also applied to compare the effect size for
MSCT versus MRI.
To compare the relationship between accuracy and disease prevalence, a meta-regression analysis
was performed. For MSCT, a univariable meta-regression was performed estimating the influence of
diagnostic specificity on CAD prevalence. Use of multivariable regression analyses did not alter the
univariable relationship but were performed and included the prevalence of males and average age
of the population. From this model, a linear regression model was employed to calculate the correla-
tion and beta coefficients.
Diagnostic sensitivity and specificity was compared for intermediate and high-risk groups by em-
ploying analysis of variance techniques. Using a general linear model, the average diagnostic sensi-
tivity and specificity for intermediate and high-risk groups was compared for MSCT and MRI; weight-
ed by average sample size. A p-value <0.05 was considered statistically significant.

76 Chapter 5
Table 2. Diagnostic accuracy of M
SCT to detect coronary artery stenoses in 24 studies w
ith 1300 patients. Year
Author
Pts (n)M
ean age (yrs)
Male (%
)Prevalence of CA
D (%
)CA
G
criteriumBB-use
Assessable (%
) (nr segm
ents)Sensitivity (%
)(nr segm
ents)Specificity (%
)(nr segm
ents)
4-slice2001
Achenbach et al. 3164
6375
NA
> 50, Q*
NA
68 (174)85 (40/47)
76 (96/127)2001
Knez et al. 3344
NA
86 70
> 50, VN
o93 (358)
78 (39/50)98 (301/308)
2002N
ieman et al. 38
5356
75 62
> 50, QN
o70 (358)
82 (42/51)93 (285/307)
2002Becker et al. 32
2864
96 64
> 50, VN
o†
95 (187)81 (21/26)
90 (145/161)2002
Vogl et al. 4064
5656
NA
> 50, VYes
100 (1039)75 (59/79)
99 (955/960)2002
Niem
an et al. 3778
5773
75 > 50, Q
No
68 (505)84 (48/57)
95 (424/448)2003
Niem
an et al. 3924
6483
100 > 50, Q
NA
69 (146)90 (71/79)
75 (50/67)2003
Morgan-H
ughes et al. 3630
5680
NA
> 70, QN
o†
68 (140)72 (18/25)
86 (99/115)2003
Leber et al. 35 91
6279
67 > 50, V
Yes80 (653)
81 (72/88)95 (539/565)
2004Kuettner et al. 34
6661
74100
> 70, QN
o57 (487/858)
66 (39/59)98 (420/428)
2004G
erber et al. 627
6589
81> 50, Q
Yes100 (294/294)
79 (46/58)71 (168/236)
Weighted m
ean78 (4877/6243)
80 (495/619)94 (3482/3722)
8-slice2004
Maruyam
a et al. 4125
6368
64> 50, Q
No
74 (258/348)90 (27/30)
99 (226/228)2004
Matsuo et al. 42
2565
7676
> 50, QYes
94 (94/100) *75 (45/60)
96 (177/185)
Weighted m
ean79 (352/448)
80 (72/90)98 (403/413)
16-slice2003
Ropers et al. 5377
5865
53 > 50, Q
*Yes
88 (270/308)91 (51/56)
93 (200/214)
2002N
ieman et al. 43
5958
9086
> 50, Q*
Yes100 (231/231)
95 (82/86)86 (125/145)
2004Kuettner et al. 45
60‡
5873
60> 50, Q
Yes100 (728/728)
70 (39/56)97 (655/672)
True 16-slice 2004
Dew
ey et al. 4434
6479
NA
> 50, Q*
No
98 (133/136) 88 (37/42)
94 (86/94)2004
Mollet et al. 47
12859
8883
> 50, QYes
100 (1384/1384)92 (216/234)
95 (1092/1150)2004
Martuscelli et al. 49
6458
9267
> 50, QYes
84 (613/729)89 (83/93)
98 (511/520)2004
Hoffm
ann et al. 5033
5782
67> 50, Q
Yes83 (438/530)
70 (30/43)94 (371/393)
2005Kuettner et al. 46
7264
5850
> 50, QYes
100 (936/936)82 (96/117)
98 (805/819)2005
Mollet et al. 52
5159
7363
> 50, QYes
100 (610/610)95 (61/64)
98 (537/546)2005
Schuijf et al. 4845
6393
98> 50, V
No
94 (298/317)98 (59/60)
97 (231/238)2005
Morgan-H
ughes et al. 5158
6181
56> 50,V
No
100 (675/675)83 (75/90)
97 (566/585)
Weighted m
ean 96 (6316/6584)
88 (829/941)96 (5179/ /5376)
Weighted m
ean overall 87 (11545/13275)
85 (1396/1650)95 (9064/9511)
BB-use: additional administration of BB m
edication prior to data acquisition to reduce heart rates.* O
nly vessels available, no segmental analysis.
† Exclusion of patients with heart rates higher than 75 bpm
‡ Of these 60 patients, 4 had previous bypass grafting, sensitivity and specificity data are w
ithout these 4 patients.Abbreviations: BB: beta-blocking m
edication, CAG: conventional angiography, N
A: not available, Q; quantitative analysis, V: visual analysis.

77Meta-Analysis of MRI and MSCT
Results
Accuracy of MRI
A total of 28 studies comparing MRI to invasive CAG were analyzed and are summarized in Table 1.
In 21 studies, the 3D navigator technique was used 3-23, whereas data were acquired during breath-
holds in 10 studies 10;15;24-30. Analysis of the original data resulted in weighted means for sensitivity
and specificity of respectively 72% (95% CI: 69% to 75%) and 87% (86% to 88%) for 1.5 T MRI. Average
percentage assessable coronary segments was 83% with a 95% CI of 82% to 84%.
Accuracy of MSCT
The results of the studies that compared either 4-slice MSCT 6;31-40, 8-slice 41;42 or 16-slice MSCT 43-53 to
invasive CAG are summarized in Table 2. For all MSCT studies combined, weighted sensitivities and
specificities were 85% (95% CI: 83-87 and 95% (95% CI: 95%). Average percentage segments with di-
agnostic image quality was 87% (95% CI: 86% to 88%), while a significant increase could be observed
from 78% with 4-slice systems to 96% with the more recent 16-slice systems.
Figure 1. Comparison of sensitivities and specificities of MRI and MSCT in the detection of significant CAD.
Comparison between the 2 techniques
The results of the pooled analysis with the corresponding 95% CIs are summarized in Table 3. In
the detection of significant CAD, weighted means for sensitivity, specificity, positive and negative
predictive values were higher for MSCT as compared to MRI, without overlap of 95% CIs. Also, the
percentage evaluable segments was significantly higher with MSCT as compared to MRI. In Figure 1,
sensitivities and specificities of both MRI and MSCT in the detection of coronary artery stenosis are
shown.
In a subset analysis of MSCT and MRI, the summary odds ratios and the 95% CIs for the different
techniques are plotted in Figure 2. Based upon a combined analysis, the summary odds ratio was
elevated 16.9-fold (95% CI: 11.0-26.1) for an abnormal MSCT (p<0.0001), indicating that an abnormal
0
20
40
60
80
100
Sensitivity Specificity
Pe
rce
nta
ge
MRI MSCT

78 Chapter 5
segment had 16.9-fold increased odds of significant CAD at cardiac catheterization. In contrast, the
summary odds ratio was increased 6.4-fold (95% CI: 5.0-8.3) for MRI (p<0.0001). The analysis of vari-
ance analysis noted a significantly higher odds of CAD with MSCT (p<0.0001).
Figure 2. Forest plot of summary odds ratio (OR) comparing MSCT with MRI for the diagnosis of CAD stenosis >50%. (n) = number of included studies. Positive = number with CAD/number of positives; Negative = number without CAD/number of normals.
The relationships between the diagnostic specificities of MRI and MSCT and the prevalence of CAD
were plotted between 50-100% and predicted for 10-50% prevalence of CAD in the study population
(Figure 3). Using meta-regression techniques, an inverse relationship between diagnostic specificity
and CAD prevalence for MSCT was observed (p=0.056). The amount of explanatory variance was
–0.37 for MSCT. When examining these results for MRI, no relationship for MRI and CAD prevalence
was observed (r2=0.25, p=0.55). For MSCT, this relationship remained consistent even when control-
ling for the average age and the frequency of men enrolled in each study.
MSCT (n of studies)
Positivesegmentsw/ CAD
Negativesegments w/ CAD
Decreased OR Increased OR
Total Nof Segments
p<0.0001 for each comparison.
16 Slice* (2) 998 90 / 112 31 / 886
8 Slice (2) 503 72 / 90 10 / 413
4 Slice (11) 4,341 495 / 619 240 / 3,722
Summary (22) 10,794 419 / 9,272 1,201 / 1,522
16 Slice Collimation (7) 4,952 545 / 701 138 / 4,251
0.01
0.01
0.1
0.1
1
1
10
10
100
100
MRI (n of studies)
PositiveSegmentsw/ CAD
NegativeSegments w/ CAD
Decreased OR Increased OR
Total Nof Segments
p<0.0001 for each comparison.
3D Navigator (18) 2,754 455 / 635 276 / 2,119
3D Breathhold (4) 769 107 / 136 58 / 633
2D Breathhold (3) 312 74 / 96 21 / 216
Summary MRI (26) 3,942 650 / 884 365 / 3,058
3T (1) 107 14 / 17 10 / 90
0.01
0.01
0.1
0.1
1
1
10
10
100
100
* 12 inner rings applied
79Meta-Analysis of MRI and MSCT
Table 3. Diagnostic accuracy for the different imaging techniques.
Technique
Sens
(%)
95%
CI (%)
Spec
(%)
95%
CI (%)
PPV
(%)
95%
CI (%)
NPV
(%)
95%
CI (%)
MRI 2D BH (n = 5) 80 74-86 89 85-93 84 78-90 86 82-91
MRI 3D BH (n = 5) 78 71-85 91 89-93 65 58-72 95 93-97
MRI 3D Navigator
(n = 21)
73 70-76 85 84-86 61 58-64 91 90-92
MRI Overall (n = 28) 72 69-75 87 86-88 65 62-68 90 89-91
MSCT 4-slice (n = 11) 80 77-83 94 93-95 67 64-70 97 96-98
MSCT 8-slice (n = 2) 80 72-88 98 97-99 88 81-95 96 94-98
MSCT 16-slice (n = 11) 88 86-90 96 95-97 81 79-83 98 98
MSCT Overall (n = 24) 85 83-87 95 95 76 74-78 97 97
Diagnostic accuracy including uninterpretable segments
MRI 3D Navigator (n = 8) 59 54-63 71 68-74 40 36-44 84 82-86
MRI Overall (n = 9) 58 53-63 70 68-72 37 33-41 85 83-87
MSCT 4-slice (n = 8) 66 62-70 76 75-77 32 29-35 93 92-94
MSCT 16-slice (n = 10) 85 83-87 94 93-95 71 68-74 97 97
MSCT Overall (n = 18) 77 75-79 94 93-95 51 49-53 96 96
BH: breath hold; CI: confidence interval; PPV: positive predictive value; NPV: negative predictive valueNumber in parentheses represents number of studies.
Discussion
Analysis of the available literature on MRI and MSCT revealed a considerable advantage for MSCT
compared to MRI in the detection of CAD. A significant higher overall accuracy in the detection of
coronary artery stenoses was demonstrated for MSCT as compared to MRI. In addition, an almost
17-fold elevated odds ratio was observed for an abnormal test result with MSCT, significantly higher
than MRI (P<0.0001). Linear-regression analysis revealed a better specificity for MSCT versus MRI in
lower disease prevalence populations (p=0.056). This is an important observation, since non-invasive
imaging of the coronary arteries is most likely to be implemented as diagnostic tool to exclude CAD
in patients with a low to intermediate likelihood of CAD, and thus to avoid the risks and expenses of
invasive CAG in this particular patient group.
Although MRI has become an established modality in the non-invasive evaluation of many cardiac
parameters, including ventricular function, myocardial perfusion and mass, our analysis suggests
that concerning coronary imaging the technique is currently outperformed by MSCT. Despite initial
promising results, diagnostic accuracy was significantly less compared to MSCT studies. However,
it should be taken into account that both technologies are in a constant evolutionary state. For in-
stance, the introduction of 3 Tesla systems may increase the resolution of MRI sufficiently to allow

80 Chapter 5
improved detection of CAD 54. With MSCT on the other hand, the number of detector rows has
increased from 4 to 64 and further expansion to 128 will soon be realized. This will result in faster
acquisition times, enabling the coverage of the whole heart in less than 10 seconds. With these sys-
tems, breathing artefacts or breath-hold associated increases in heart rate during acquisition are less
likely to occur. Indeed, studies performed with 16-slice technology show an increase in the number
of evaluable segments as well as diagnostic accuracy as compared to results obtained with 4-slice
systems (Table 3). Still, several important limitations exist, including the relatively high radiation ex-
posure (which will increase slightly with more detector rows) and the limited value in patients with
heart rates above 65 37 or with tachy-arrhythmias (for which reasons beta-blockers are frequently ad-
ministered). The use of multi-segmented reconstruction algorithms, which are available on certain
MSCT systems, may allow the inclusion of patients with higher heart rates without loss in temporal
resolution or need for beta-blockade 44;55.
Another limitation of MSCT is that currently the technique does not allow quantification of stenosis
severity. Eventually reliable absolute measurements of vessel diameter and lesion severity, similar
to quantitative coronary angiography, will be needed. Nevertheless, a reliable estimate of overall
coronary plaque burden can already be derived from MSCT. Indeed, the technique shows a clear po-
tential for plaque characterization 56;57. Several studies comparing MSCT to intravascular ultrasound
imaging, have shown a relation between the average Hounsfield Unit of the coronary plaque and its
echogenicity, suggesting that MSCT can distinguish between soft, intermediate and calcified plaque 56;57.
Figure 3. Relationship between CAD prevalence and diagnostic specificity for MSCT and MRI. Diagnostic speci-ficity is plotted with a line of best fit within a range from >50% to 100% and predicted across a range of CAD prevalence rates from 10% to 50%.
0
20
40
60
80
100
0 20 40 60 80 100
CAD Prevalence (%)
Dia
gnos
tic S
peci
ficity
(%
)
∆=22%∆=20% ∆=14% ∆=8% ∆=0%
89
MSCT
MRI

81Meta-Analysis of MRI and MSCT
Clinical implications
Because of its invasive nature and cost, indications for catheter-based diagnostic CAG have been
restricted to a small fraction of high-risk patients with high pre-test likelihood of CAD. These
patients are usually selected by risk-stratification and prior non-invasive imaging. Therefore, in
current practice, coronary anatomy remains unknown in the majority of patients with CAD as well
as in all asymptomatic subjects with a high-risk profile, frequently resulting in suboptimal therapy.
The emergence of non-invasive diagnostic angiography by MSCT will grant the opportunity to
obtain anatomic information about the coronary atherosclerotic process at a pre-clinical stage on
a large scale. This is likely to have a profound impact on the practice of cardiology, in particular in
the fields of revascularization on the one end, and prevention on the other end of the spectrum.
Limited information is currently available on the accuracy of MSCT in low- and intermediate-
prevalence populations, although extrapolation of the available data (Figure 3) suggests no loss
in specificity of MSCT with decreasing disease prevalence. This observation suggests that the
presence of CAD can be excluded with high accuracy such that the use of MSCT as a first-line
evaluation tool could now be tested prospectively in selected subgroups.
Conclusion
Meta-analysis of available studies with MRI and MSCT for non-invasive coronary angiography in-
dicates that MSCT has currently a significantly higher accuracy to detect or exclude significant
CAD. MSCT may be considered the technique of choice to non-invasively evaluate coronary artery
anatomy.

82 Chapter 5
References 1. Krone RJ, Johnson L, Noto T. Five year trends in cardiac catheterization: a report from the Registry of
the Society for Cardiac Angiography and Interventions. Cathet Cardiovasc Diagn. 1996;39:31-35. 2. Scanlon PJ, Faxon DP, Audet AM, Carabello B, Dehmer GJ, Eagle KA, Legako RD, Leon DF, Murray JA,
Nissen SE, Pepine CJ, Watson RM, Ritchie JL, Gibbons RJ, Cheitlin MD, Gardner TJ, Garson A, Jr., Russell RO, Jr., Ryan TJ, Smith SC, Jr. ACC/AHA guidelines for coronary angiography. A report of the American College of Cardiology/American Heart Association Task Force on practice guidelines (Committee on Coronary Angiography). Developed in collaboration with the Society for Cardiac Angiography and Interventions. J Am Coll Cardiol. 1999;33:1756-1824.
3. Bogaert J, Kuzo R, Dymarkowski S, Beckers R, Piessens J, Rademakers FE. Coronary artery imaging with real-time navigator three-dimensional turbo-field-echo MR coronary angiography: initial experience. Radiology. 2003;226:707-716.
4. Sommer T, Hackenbroch M, Hofer U, Schmiedel A, Willinek WA, Flacke S, Gieseke J, Traber F, Fimmers R, Litt H, Schild H. Coronary MR Angiography at 3.0 T versus That at 1.5 T: Initial Results in Patients Suspected of Having Coronary Artery Disease. Radiology. 2005.
5. Muller MF, Fleisch M. Recurrent coronary artery stenosis: assessment with three-dimensional MR imag-ing. J Magn Reson Imaging. 2004;20:383-389.
6. Gerber BL, Coche E, Pasquet A, Ketelslegers E, Vancraeynest D, Grandin C, Van Beers BE, Vanover-schelde JL. Coronary artery stenosis: direct comparison of four-section multi-detector row CT and 3D navigator MR imaging for detection--initial results. Radiology. 2005;234:98-108.
7. Jahnke C, Paetsch I, Schnackenburg B, Bornstedt A, Gebker R, Fleck E, Nagel E. Coronary MR angiogra-phy with steady-state free precession: individually adapted breath-hold technique versus free-breath-ing technique. Radiology. 2004;232:669-676.
8. Ikonen AE, Manninen HI, Vainio P, Hirvonen TP, Vanninen RL, Matsi PJ, Soimakallio S, Hartikainen JE. Three-dimensional respiratory-gated coronary MR angiography with reference to X-ray coronary angi-ography. Acta Radiol. 2003;44:583-589.
9. Kessler W, Achenbach S, Moshage W, Zink D, Kroeker R, Nitz W, Laub G, Bachmann K. Usefulness of respiratory gated magnetic resonance coronary angiography in assessing narrowings > or = 50% in diameter in native coronary arteries and in aortocoronary bypass conduits. Am J Cardiol. 1997;80:989-993.
10. Kessler W, Laub G, Achenbach S, Ropers D, Moshage W, Daniel WG. Coronary arteries: MR angiography with fast contrast-enhanced three-dimensional breath-hold imaging--initial experience. Radiology. 1999;210:566-572.
11. Kim WY, Danias PG, Stuber M, Flamm SD, Plein S, Nagel E, Langerak SE, Weber OM, Pedersen EM, Schmidt M, Botnar RM, Manning WJ. Coronary magnetic resonance angiography for the detection of coronary stenoses. N Engl J Med. 2001;345:1863-1869.
12. Muller MF, Fleisch M, Kroeker R, Chatterjee T, Meier B, Vock P. Proximal coronary artery stenosis: three-dimensional MRI with fat saturation and navigator echo. J Magn Reson Imaging. 1997;7:644-651.
13. Plein S, Ridgway JP, Jones TR, Bloomer TN, Sivananthan MU. Coronary artery disease: assessment with a comprehensive MR imaging protocol--initial results. Radiology. 2002;225:300-307.
14. Post JC, van Rossum AC, Hofman MB, Valk J, Visser CA. Three-dimensional respiratory-gated MR angiography of coronary arteries: comparison with conventional coronary angiography. AJR Am J Roentgenol. 1996;166:1399-1404.
15. Regenfus M, Ropers D, Achenbach S, Schlundt C, Kessler W, Laub G, Moshage W, Daniel WG. Compari-son of contrast-enhanced breath-hold and free-breathing respiratory-gated imaging in three-dimen-sional magnetic resonance coronary angiography. Am J Cardiol. 2002;90:725-730.
16. Sandstede JJ, Pabst T, Beer M, Geis N, Kenn W, Neubauer S, Hahn D. Three-dimensional MR coronary angiography using the navigator technique compared with conventional coronary angiography. AJR Am J Roentgenol. 1999;172:135-139.
17. Sardanelli F, Molinari G, Zandrino F, Balbi M. Three-dimensional, navigator-echo MR coronary angiogra-phy in detecting stenoses of the major epicardial vessels, with conventional coronary angiography as the standard of reference. Radiology. 2000;214:808-814.

83Meta-Analysis of MRI and MSCT
18. van Geuns RJ, de Bruin HG, Rensing BJ, Wielopolski PA, Hulshoff MD, van Ooijen PM, Oudkerk M, de Feyter PJ. Magnetic resonance imaging of the coronary arteries: clinical results from three dimensional evaluation of a respiratory gated technique. Heart. 1999;82:515-519.
19. Watanabe Y, Nagayama M, Amoh Y, Fujii M, Fuku Y, Okumura A, Van Cauteren M, Stuber M, Dodo Y. High-resolution selective three-dimensional magnetic resonance coronary angiography with naviga-tor-echo technique: segment-by-segment evaluation of coronary artery stenosis. J Magn Reson Imag-ing. 2002;16:238-245.
20. Weber C, Steiner P, Sinkus R, Dill T, Bornert P, Adam G. Correlation of 3D MR coronary angiography with selective coronary angiography: feasibility of the motion-adapted gating technique. Eur Radiol. 2002;12:718-726.
21. Wittlinger T, Voigtlander T, Rohr M, Meyer J, Thelen M, Kreitner KF, Kalden P. Magnetic resonance imag-ing of coronary artery occlusions in the navigator technique. Int J Cardiovasc Imaging. 2002;18:203-211.
22. Woodard PK, Li D, Haacke EM, Dhawale PJ, Kaushikkar S, Barzilai B, Braverman AC, Ludbrook PA, Weiss AN, Brown JJ, Mirowitz SA, Pilgram TK, Gutierrez FR. Detection of coronary stenoses on source and projection images using three-dimensional MR angiography with retrospective respiratory gating: preliminary experience. AJR Am J Roentgenol. 1998;170:883-888.
23. van Geuns RJ, Oudkerk M, Rensing BJ, Bongaerts AH, de Bruin HG, Wielopolski PA, van Ooijen P, de Feyter PJ, Serruys PW. Comparison of coronary imaging between magnetic resonance imaging and electron beam computed tomography. Am J Cardiol. 2002;90:58-63.
24. Manning WJ, Li W, Edelman RR. A preliminary report comparing magnetic resonance coronary angiog-raphy with conventional angiography. N Engl J Med. 1993;328:828-832.
25. Mohiaddin RH, Bogren HG, Lazim F, Keegan J, Gatehouse PD, Barbir M, Firmin DN, Yacoub MH. Mag-netic resonance coronary angiography in heart transplant recipients. Coron Artery Dis. 1996;7:591-597.
26. Pennell DJ, Keegan J, Firmin DN, Gatehouse PD, Underwood SR, Longmore DB. Magnetic resonance imaging of coronary arteries: technique and preliminary results. Br Heart J. 1993;70:315-326.
27. Pennell DJ, Bogren HG, Keegan J, Firmin DN, Underwood SR. Assessment of coronary artery stenosis by magnetic resonance imaging. Heart. 1996;75:127-133.
28. Post JC, van Rossum AC, Hofman MB, de Cock CC, Valk J, Visser CA. Clinical utility of two-dimensional magnetic resonance angiography in detecting coronary artery disease. Eur Heart J. 1997;18:426-433.
29. Regenfus M, Ropers D, Achenbach S, Kessler W, Laub G, Daniel WG, Moshage W. Noninvasive detection of coronary artery stenosis using contrast-enhanced three-dimensional breath-hold magnetic reso-nance coronary angiography. J Am Coll Cardiol. 2000;36:44-50.
30. van Geuns RJ, Wielopolski PA, de Bruin HG, Rensing BJ, Hulshoff M, van Ooijen PM, de Feyter PJ, Oudkerk M. MR coronary angiography with breath-hold targeted volumes: preliminary clinical results. Radiology. 2000;217:270-277.
31. Achenbach S, Giesler T, Ropers D, Ulzheimer S, Derlien H, Schulte C, Wenkel E, Moshage W, Bautz W, Daniel WG, Kalender WA, Baum U. Detection of coronary artery stenoses by contrast-enhanced, retrospectively electrocardiographically-gated, multislice spiral computed tomography. Circulation. 2001;103:2535-2538.
32. Becker CR, Knez A, Leber A, Treede H, Ohnesorge B, Schoepf UJ, Reiser MF. Detection of coronary artery stenoses with multislice helical CT angiography. J Comput Assist Tomogr. 2002;26:750-755.
33. Knez A, Becker CR, Leber A, Ohnesorge B, Becker A, White C, Haberl R, Reiser MF, Steinbeck G. Useful-ness of multislice spiral computed tomography angiography for determination of coronary artery stenoses. Am J Cardiol. 2001;88:1191-1194.
34. Kuettner A, Kopp AF, Schroeder S, Rieger T, Brunn J, Meisner C, Heuschmid M, Trabold T, Burgstahler C, Martensen J, Schoebel W, Selbmann HK, Claussen CD. Diagnostic accuracy of multidetector computed tomography coronary angiography in patients with angiographically proven coronary artery disease. J Am Coll Cardiol. 2004;43:831-839.
35. Leber AW, Knez A, Becker C, Becker A, White C, Thilo C, Reiser M, Haberl R, Steinbeck G. Non-Invasive intravenous coronary angiography using electron beam tomography and multislice computed tomog-raphy. Heart. 2003;89:633-639.
36. Morgan-Hughes GJ, Marshall AJ, Roobottom CA. Multislice Computed Tomographic Coronary Angiog-raphy: Experience in a UK Centre. Clin Radiol. 2003;58:378-383.
37. Nieman K, Rensing BJ, van Geuns RJ, Vos J, Pattynama PM, Krestin GP, Serruys PW, de Feyter PJ. Non-In-vasive coronary angiography with multislice spiral computed tomography: impact of heart rate. Heart. 2002;88:470-474.

84 Chapter 5
38. Nieman K, Rensing BJ, van Geuns RJ, Munne A, Ligthart JM, Pattynama PM, Krestin GP, Serruys PW, de Feyter PJ. Usefulness of multislice computed tomography for detecting obstructive coronary artery disease. Am J Cardiol. 2002;89:913-918.
39. Nieman K, Pattynama PM, Rensing BJ, van Geuns RJ, de Feyter PJ. Evaluation of patients after coro-nary artery bypass surgery: CT angiographic assessment of grafts and coronary arteries. Radiology. 2003;229:749-756.
40. Vogl TJ, Abolmaali ND, Diebold T, Engelmann K, Ay M, Dogan S, Wimmer-Greinecker G, Moritz A, Herzog C. Techniques for the detection of coronary atherosclerosis: multi-detector row CT coronary angiography. Radiology. 2002;223:212-220.
41. Maruyama T, Yoshizumi T, Tamura R, Takashima S, Toyoshima H, Konishi I, Yamashita S, Yamasaki K. Comparison of visibility and diagnostic capability of noninvasive coronary angiography by eight-slice multidetector-row computed tomography versus conventional coronary angiography. Am J Cardiol. 2004;93:537-542.
42. Matsuo S, Nakamura Y, Matsumoto T, Nakae I, Nagatani Y, Takazakura R, Takahashi M, Murata K, Horie M. Visual assessment of coronary artery stenosis with electrocardiographically-gated multislice com-puted tomography. Int J Cardiovasc Imaging. 2004;20:61-66.
43. Nieman K, Cademartiri F, Lemos PA, Raaijmakers R, Pattynama PM, de Feyter PJ. Reliable noninvasive coronary angiography with fast submillimeter multislice spiral computed tomography. Circulation. 2002;106:2051-2054.
44. Dewey M, Laule M, Krug L, Schnapauff D, Rogalla P, Rutsch W, Hamm B, Lembcke A. Multisegment and halfscan reconstruction of 16-slice computed tomography for detection of coronary artery stenoses. Invest Radiol. 2004;39:223-229.
45. Kuettner A, Trabold T, Schroeder S, Feyer A, Beck T, Brueckner A, Heuschmid M, Burgstahler C, Kopp AF, Claussen CD. Noninvasive detection of coronary lesions using 16-detector multislice spiral computed tomography technology: initial clinical results. J Am Coll Cardiol. 2004;44:1230-1237.
46. Kuettner A, Beck T, Drosch T, Kettering K, Heuschmid M, Burgstahler C, Claussen CD, Kopp AF, Schro-eder S. Diagnostic accuracy of noninvasive coronary imaging using 16-detector slice spiral computed tomography with 188 ms temporal resolution. J Am Coll Cardiol. 2005;45:123-127.
47. Mollet NR, Cademartiri F, Nieman K, Saia F, Lemos PA, McFadden EP, Pattynama PM, Serruys PW, Krestin GP, de Feyter PJ. Multislice spiral computed tomography coronary angiography in patients with stable angina pectoris. J Am Coll Cardiol. 2004;43:2265-2270.
48. Schuijf JD, Bax JJ, Salm LP, Jukema JW, Lamb HJ, van der Wall EE, de Roos A. Noninvasive coronary im-aging and assessment of left ventricular function using 16-slice computed tomography. Am J Cardiol. 2005;95:571-574.
49. Martuscelli E, Romagnoli A, D’Eliseo A, Razzini C, Tomassini M, Sperandio M, Simonetti G, Romeo F. Accuracy of thin-slice computed tomography in the detection of coronary stenoses. Eur Heart J. 2004;25:1043-1048.
50. Hoffmann U, Moselewski F, Cury RC, Ferencik M, Jang IK, Diaz LJ, Abbara S, Brady TJ, Achenbach S. Pre-dictive value of 16-slice multidetector spiral computed tomography to detect significant obstructive coronary artery disease in patients at high risk for coronary artery disease: patient-versus segment-based analysis. Circulation. 2004;110:2638-2643.
51. Morgan-Hughes GJ, Roobottom CA, Owens PE, Marshall AJ. Highly accurate coronary angiography with submillimetre, 16 slice computed tomography. Heart. 2005;91:308-313.
52. Mollet NR, Cademartiri F, Krestin GP, McFadden EP, Arampatzis CA, Serruys PW, de Feyter PJ. Improved diagnostic accuracy with 16-row multi-slice computed tomography coronary angiography. J Am Coll Cardiol. 2005;45:128-132.
53. Ropers D, Baum U, Pohle K, Anders K, Ulzheimer S, Ohnesorge B, Schlundt C, Bautz W, Daniel WG, Achenbach S. Detection of coronary artery stenoses with thin-slice multi-detector row spiral com-puted tomography and multiplanar reconstruction. Circulation. 2003;107:664-666.
54. Nayak KS, Cunningham CH, Santos JM, Pauly JM. Real-time cardiac MRI at 3 tesla. Magn Reson Med. 2004;51:655-660.
55. Kachelriess M, Ulzheimer S, Kalender WA. ECG-correlated image reconstruction from subsecond multi-slice spiral CT scans of the heart. Med Phys. 2000;27:1881-1902.

85Meta-Analysis of MRI and MSCT
56. Achenbach S, Moselewski F, Ropers D, Ferencik M, Hoffmann U, MacNeill B, Pohle K, Baum U, Anders K, Jang IK, Daniel WG, Brady TJ. Detection of calcified and noncalcified coronary atherosclerotic plaque by contrast-enhanced, submillimeter multidetector spiral computed tomography: a segment-based comparison with intravascular ultrasound. Circulation. 2004;109:14-17.
57. Schroeder S, Kopp AF, Baumbach A, Meisner C, Kuettner A, Georg C, Ohnesorge B, Herdeg C, Claussen CD, Karsch KR. Noninvasive detection and evaluation of atherosclerotic coronary plaques with mul-tislice computed tomography. J Am Coll Cardiol. 2001;37:1430-1435.
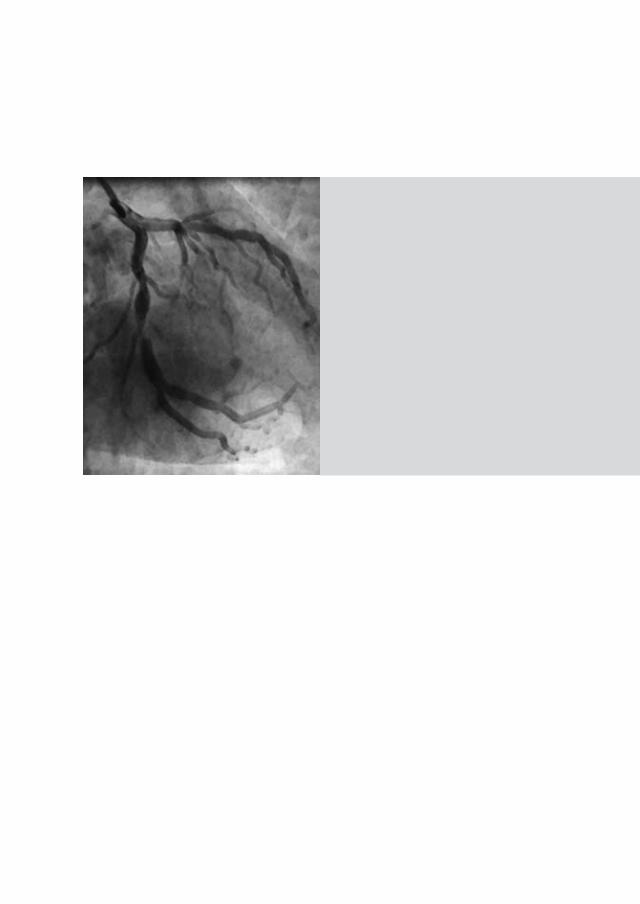

Defining Patient Populations
IIA
CoronaryRiskFactors
Part II


Non-Invasive Angiography and Assessment
of Left Ventricular Function using Multi-slice
Computed Tomography in Patients
with Type 2 Diabetes
Diabetes Care 2004; 27: 2905-2910
Joanne D. Schuijf, Jeroen J. Bax, J. Wouter Jukema, Hildo J. Lamb, Hubert W. Vliegen, Liesbeth P. Salm, Albert de Roos,
Ernst E. van der Wall
6Chapter

Abstract
Background
Early identification of coronary artery disease (CAD) in patients with diabetes is important,
since these patients are at elevated risk for developing CAD and have worse outcome as com-
pared to non-diabetic patients, once diagnosed with CAD. Recently, non-invasive coronary
angiography and assessment of left ventricular (LV) function has been demonstrated with
multi-slice computed tomography (MSCT). The purpose of the present study was to validate
this approach in patients with type 2 diabetes.
Methods
MSCT was performed in 30 patients with confirmed type 2 diabetes. From the MSCT images,
coronary artery stenoses (≥ 50% luminal narrowing) and LV function (LV ejection fraction,
regional wall motion) were evaluated and compared with conventional angiography and
2D-echocardiography.
Results
A total of 220 (86%) of 256 coronary artery segments were interpretable with MSCT. In these
segments, sensitivity and specificity for the detection of coronary artery stenoses were 95%.
Including the uninterpretable segments, sensitivity and specificity were 81% and 82%, respec-
tively. Bland-Altman analysis in the comparison of LV ejection fractions demonstrated a mean
difference of –0.48% ± 3.8% for MSCT and echocardiography, not significantly different from
zero. Agreement between the 2 modalities for assessment of regional contractile function was
excellent (91%, kappa statistic 0.81).
Conclusion
Accurate non-invasive evaluation of both the coronary arteries and LV function with MSCT is
feasible in patients with type 2 diabetes. This non-invasive approach may allow optimal iden-
tification of high-risk patients.
91MSCT in Diabetes
Introduction
Type 2 diabetes is a major risk factor for coronary artery disease (CAD) and is associated with a 2- to
4- fold increase in the risk of developing CAD 1. Furthermore, prognosis of patients with type 2 diabe-
tes and confirmed CAD has been demonstrated to be worse than in non-diabetic patients with CAD.
For example, the likelihood of developing myocardial infarction is significantly higher in diabetic
patients with unstable angina compared to non-diabetic individuals. Moreover, mortality rate after
myocardial infarction has also been shown to be doubled 2. Early identification of CAD is therefore of
paramount importance in patients with diabetes.
Non-invasive testing including myocardial perfusion scintigraphy and dobutamine stress echocar-
diography have been used to detect CAD 3;4. However, direct visualization of the coronary arteries
may be preferred since patients with diabetes frequently have diffuse, multi-vessel CAD. Currently,
conventional angiography is performed to evaluate the presence and extent of CAD. However, this
is an invasive approach associated with a minimal but definitive risk of complications, and a non-
invasive technique that is capable of direct visualization of the coronary arteries would be preferred.
A promising new imaging technique for the non-invasive detection of CAD is multi-slice computed
tomography (MSCT), which allows the acquisition of high quality images of the entire heart within
a single breath-hold. Several studies have demonstrated the technique to be useful in the detection
of coronary artery stenoses with sensitivities and specificities ranging from 72% to 95% and 75% to
99%, respectively 5-11.
In addition, MSCT allows simultaneous assessment of left ventricular (LV) function, which also is an
important prognostic parameter 4. Although the studies on assessment of LV function with MSCT
are scarce, the initial results demonstrated a good relation between LV ejection fraction assessed by
MSCT and 2D-echocardiography or Magnetic Resonance Imaging (MRI) 12-14.
Combined assessment of LV function and the coronary artery status with MSCT may allow optimal
non-invasive evaluation of patients with diabetes with suspected CAD. Thus far, the value of MSCT
has not been evaluated in patients with diabetes. Accordingly, the purpose of the present study was
to perform a combined assessment of coronary arteries and LV function in patients with type 2 dia-
betes using MSCT; the results were compared to conventional angiography and 2D-echocardiogra-
phy, respectively.

92 Chapter 6
Methods
Patients and study protocol
The study group consisted of 30 patients with known type 2 diabetes who were scheduled for con-
ventional angiography because of anginal complaints. Criteria for the diagnosis of diabetes were, as
recommended by the American Diabetes Association 15:
1. symptoms of diabetes plus casual plasma glucose concentration ≥ 200 mg/dl (11.1 mmmol/l) or
2. fasting plasma glucose level ≥ 126 mg/dl (7.0 mmol/l).
Exclusion criteria were: atrial fibrillation, renal insufficiency (serum creatinine >120 mmol/L),
known allergy to iodine contrast media, severe claustrophobia and pregnancy.
The average interval between conventional angiography and MSCT was 17 ± 27 days, whereas
2D-echocardiography was performed prior or after the CT examination within two weeks. All pa-
tients gave written informed consent to the study protocol, which was approved by the local ethics
committee.
MSCT; Data acquisition
In the initial 12 patients, MSCT was performed using a Toshiba Multi-Slice Aquilion 0.5 (collimation
4 x 2.0 mm) system and in the remaining 18 patients using a Toshiba Multi-slice Aquilion 16 system
(collimation 16 x 0.5 mm) (Toshiba Medical Systems, Otawara, Japan). Rotation time was 0.4s or 0.5s,
depending on the heart rate, while the tube current was 250 mA, at 120 kV. A bolus of 140 ml con-
trast (Xenetix 300®, Guerbet, Aulnay S. Bois, France) was administered with an injection rate of 4 ml/s
in the antecubital vein. To time the scan, automated peak enhancement detection in the aortic root
was used. The heart was imaged from the aortic root to the cardiac apex during inspiratory breath
hold, while the ECG was recorded simultaneously for retrospective gating of the data. To assess LV
function, 20 cardiac phases were reconstructed in the short-axis orientation with a slice thickness of
2.00 mm and subsequently transferred to a remote workstation with dedicated cardiac software (MR
Analytical Software System [MASS], Medis, Leiden, the Netherlands).
To evaluate the coronary arteries, 5 reconstructions covering diastole (65% - 85% of the R-R range)
were generated with a slice thickness of either 1.0 mm (4-slice system) or 0.5 mm (16-slice system).
If motion artifacts were present, additional reconstructions were made at 40%, 45% and 50% of the
cardiac cycle. Images were transferred to a remote workstation (Vitrea2, Vital Images, Plymouth,
Minn. USA) for post-processing.
MSCT; Data analysis
Stenosis assessment was performed using a modified AHA-ACC segmentation model: the left main
coronary artery (segment 5), the right coronary artery (segments 1, 2, 3, and if present 4 and 16),
the left anterior descending coronary artery (segments 6,7, 8, and 9), and the left circumflex artery

93MSCT in Diabetes
(segment 11, 13, and if present 12, 14, 15, and 17). Only side-branches of ≥1.5 mm as determined by
quantitative coronary angiography or supplied by coronary bypass grafts were evaluated. Images
were evaluated by an experienced observer blinded to the catheterization results, using both the
original axial MSCT images and curved multiplanar reconstructions. Each segment was first evalu-
ated as interpretable or not. Subsequently, the presence of significant narrowing (≥50% reduction of
lumen diameter) was determined in the assessable segments. In addition, coronary bypass grafts, if
present, were evaluated for the presence of ≥50% luminal narrowing or not. In those patients, native
coronary segments prior to the anastomosis of a patent graft, were not evaluated.
Regional wall motion was assessed visually using the short-axis slices (displayed in cine-loop format)
by one observer blinded to all other data using a previously described 17-segment model 16. Each
segment was assigned a wall motion score using a 4-point scale (1=normokinesia, 2=hypokinesia,
3=akinesia, and 4=dyskinesia). LV ejection fraction was calculated using semi-automated endocar-
dial contour detection, with manual correction when necessary. Papillary muscles were regarded as
being part of the LV cavity.
Conventional angiography
Conventional angiography was performed according to standard techniques. Vascular access was
obtained by using the femoral approach with the Seldinger technique.
Coronary angiograms were visually evaluated by an experienced observer blinded to the MSCT
data.
2D-echocardiography
Patients were imaged in the left lateral decubitus position using a commercially available system
(Vingmed System FiVe/Vivid-7, GE-Vingmed, Milwaukee, WI, USA). Images were acquired using a 3.5
MHz transducer at a depth of 16 cm in the parasternal and apical views.
Regional wall motion was analyzed using the same 17- segment model and 4-point scale as de-
scribed above. LV ejection fractions were calculated from the 2- and 4-chamber images using the
biplane Simpson’s rule 17.
Statistical analysis
Sensitivity, specificity, positive and negative predictive values for the detection of significant coro-
nary artery stenoses were calculated. In addition, a patient based analysis was performed. MSCT was
considered correct in the individual patient analysis if at least one significant stenosis was detected
on the MSCT images or if MSCT ruled out the presence of any significant stenosis. Pre-test likeli-
hood of CAD in patients without previous myocardial infarction or coronary bypass grafting was es-
timated using the Diamond-Forrester method 18. Bland-Altman analysis was performed for each pair
of values of LV ejection fraction to calculate limits of agreement and systematic error between the

94 Chapter 6
two modalities 19. Agreement for regional wall motion was expressed in a 4x4 table using weighted
kappa statistics. A kappa value of <0.4 represents poor agreement, a kappa value between 0.4 and
0.75 fair to good agreement, and a kappa value of >0.75 is considered an excellent agreement, based
on the Fleiss’ classification 20. A p-value <0.05 was considered to indicate statistical significance.
Results
Patient characteristics
The patient characteristics are summarized in Table 1. The study group consisted of 30 patients (26
men, mean age 62 ± 10 years) with type 2 diabetes. The average duration of diabetes mellitus was
2.9 ± 4.4 years at the time of MSCT. A total of 11 patients received oral hypoglycaemic medication or
insulin (n=5). Cardiac medication was continued during the study period. A total of 16 (53%) patients
used beta-blocking agents, and no additional beta-blocking agents were administered in prepara-
tion of the scan.
Table 1. Clinical characteristics of the study population (n=30).n (%)
Gender (M/F) 26/4Age (years) 62 ± 10Beta-blocking medication 16 (53)Heart rate during acquisition 69 ± 13Diabetes type 2 30 (100)Average HbA1c 6.9% ± 1.4%Other risk factors for CAD Hypertension 16 (73) Smoking 12 (56) Hypercholesterolemia 21 (95) Family with CAD 12 (56)History Previous MI 20 (67) Previous PCI/CABG 21 (70)/11 (37) Vessel disease 1-vessel 6 (20) 2-vessel 6 (20) 3-vessel 16 (53)Angina Pectoris CCS class 1/2 7 (23) CCS class 3/4 23 (77)Heart Failure NYHA class 1/2 25 (83) NYHA class 3/4 5 (17)
CABG: coronary artery bypass grafting; CCS: Canadian Cardiovascular Society; MI: myocardial infarction; NYHA: New York Heart Association; PCI: percutaneous coronary intervention.

95MSCT in Diabetes
Coronary artery stenoses
A total of 256 coronary segments were present for evaluation by both MSCT and conventional an-
giography. Of the 99 segments studied with 4-slice MSCT, 18 (18%) were uninterpretable, whereas
also 18 (11%) of 157 segments acquired with 16-slice MSCT were of non-diagnostic quality. Thus,
36 (14%) segments were classified uninterpretable. In the remaining 220 segments, conventional
angiography revealed 59 significant (≥50% diameter reduction) lesions. Evaluation of the MSCT im-
ages resulted in the correct identification of 56 (95%) stenoses. In 153 of 161 (95%) segments, the
presence of significant stenosis was correctly ruled out. Thus, resulting sensitivity and specificity
were 95%. When the uninterpretable segments were included in the analysis, resulting sensitivity
and specificity were 81% and 82%, respectively.
Figure 1. In panel A, a curved multiplanar reconstruction of a left circumflex coronary artery (LCx) with severe narrowing of the lumen is depicted. No abnormalities however were observed in the left anterior descending coronary artery (LAD) of this patient (panel B). Also, in the 3D volume rendered reconstruction (panel C), steno-ses in the LCx as well as patency of the LAD are clearly visible. Findings were confirmed by conventional X-ray angiography (panel D).

96 Chapter 6
A total of 21 grafts were present (arterial=5, venous=16). Conventional angiography revealed the
presence of ≥ 50% luminal narrowing in 9 grafts. MSCT correctly identified all 9 grafts with signifi-
cant stenosis, whereas 9 of 12 grafts without significant stenosis were correctly identified on the
MSCT images. In the 3 remaining grafts however the presence of significant narrowing could not be
evaluated, although patency of the graft could be assessed correctly.
On a per patient basis, MSCT was accurate in 26 (87%) of 30 patients. In 7 patients, no significant ab-
normalities were observed during conventional angiography, and 5 (71%) of these patients were cor-
rectly identified as having no significant lesions using the MSCT images. Of the remaining 23 patients
with significant lesions on conventional angiography, 21 (91%) were correctly identified using MSCT.
In 23 patients CAD was known. In the remaining 7 patients with suspected CAD, the pre-test likeli-
hood according to Diamond-Forrester was intermediate in 2 and high in 5 patients. Conventional
angiography demonstrated the presence of significant lesions in 5 patients, of which 4 (80%) were
correctly identified with MSCT. Of the 2 patients without significant CAD, 1 (50%) was correctly as-
sessed with MSCT.
Examples of MSCT images of both a stenotic and non-stenotic coronary artery with the correspond-
ing angiographic images are shown in Figure 1.
LV function
From one patient, MSCT data were lost (due to technical errors) after successful acquisition, and
therefore data from 29 patients were available for LV function analysis.
Figure 2. Bland-Altman plot in the comparison of MSCT and echocardiography in the assessment of LV ejection fraction. The difference between each pair is plotted against the average value of the same pair (solid line= mean value of differences and dotted lines = mean value of differences ± 2SDs).
-10
-8
-6
-4
-2
0
2
4
6
8
15 25 35 45 55 65
Average LVEF CT - Echo
∆L
VE
F C
T -
Ech
o (
%)

97MSCT in Diabetes
Globalfunction
Mean LV ejection fraction, as determined by echocardiography and MSCT, was 43% ± 14% (range:
19% - 75%) and 43% ± 14% (range: 15% - 72%, ns), respectively. Bland-Altman analysis in the com-
parison of CT and echo LV ejection fraction demonstrated a mean difference of -0.48% ± 3.8%, not
significantly different from zero (Figure 2).
Regionalfunction
Echocardiography revealed contractile dysfunction in 157 (32%) of 493 segments, with 71 (45%)
showing hypokinesia, 74 (47%) akinesia and 12 (8%) dyskinesia. In 149 (95%) of the dysfunctional
segments, decreased systolic wall thickening was also observed on the MSCT images. An excellent
agreement was shown between the two techniques, with 91% of segments scored identically on
both modalities (kappa statistic 0.81 ± 0.03). Agreements for the individual gradings (1-4) were 97%,
82%, 73%, and 92%, respectively. In Figure 3, examples of short-axis reconstructions are shown, il-
lustrating patients with and without wall motion abnormalities.
Figure 3. MSCT short-axis reconstructions in end-diastole (ED, left panels) and end-systole (ES, right panels). In the upper two panels (A), normal systolic wall thickening is clearly present in all segments. In the lower two pan-els, short-axis reconstructions of a patient with a previous inferolateral infarction are shown. Although preserved wall motion is still present in the anterior region (arrowheads), akinesia of the severely thinned wall is clearly visible in the infarcted region (arrows) (B).

98 Chapter 6
Discussion
Our study demonstrates that non-invasive coronary angiography is feasible in patients with diabe-
tes. An excellent sensitivity and specificity of both 95% were shown for the detection of coronary
artery stenoses. Corresponding positive and negative predictive values were 88% and 98%, respec-
tively. With inclusion of the uninterpretable segments, sensitivity and specificity were still 81% and
82%, respectively. Moreover, although inclusion of uninterpretable segments resulted in a positive
predictive value of 62%, the negative predictive value remained high (92%), which is in line with pre-
vious studies 11;21. This is an important finding, since clinical management is often difficult in patients
presenting with diabetes and suspected CAD. In a substantial number of patients, non-invasive tests
are inconclusive and knowledge of coronary anatomy (by means of invasive angiography) is often
needed in order to determine the most optimal treatment strategy. The high accuracy of MSCT in
the exclusion of CAD as demonstrated by the high specificity and negative predictive value in the
current study underscores the potential of this technique to function as a first-line diagnostic modal-
ity in the workup of patients with suspected CAD. By ruling out the presence of significant stenoses,
risks and costs of invasive angiography can thus be avoided in a substantial number of patients.
Moreover, accurate information of coronary anatomy and extent of atherosclerosis as well as car-
diac function is obtained, which may optimize treatment strategy and prognostification and may
eventually even serve as a guide for interventional procedures. However, further prognostic studies
are needed in larger cohorts before MSCT can become an established diagnostic tool and replace
conventional coronary angiography in certain patient groups.
In addition, LV function analysis was performed after retrospective reconstruction of the acquired
data. In the assessment of LV ejection fraction, a close correlation was observed between MSCT and
2D-echocardiography. Mean LV ejection fraction as determined by MSCT was slightly less as com-
pared to the echocardiographic results, but no statistical difference was reached. A slight underesti-
mation of LV ejection fraction with MSCT has been reported previously 12-14 which may be attributed
to an overestimation of LV end-systolic volume. Since minimal ventricular volume is maintained for
only 80-200 ms, temporal resolution of MSCT may not have been sufficient in all patients.
Overall agreement of regional wall motion score was excellent with 91% of segments scored identi-
cally. The agreement for the individual wall motion scores was highest in the extremes, i.e. in seg-
ments with either normal contractility (97%) or dyskinesia (92%), whereas it was slightly lower in
segments showing intermediate contractile dysfunction. Since MSCT is most likely to be applied as
a first line screening tool, baseline LV function may be used to further refine risk stratification in the
individual patient. However, it does currently not offer an alternative to echocardiographic examina-
tion since evaluation of valvular or diastolic function is not possible with MSCT.
Some limitations of the current study need to be acknowledged. First, in the present study only 30
patients were included. Studies in larger patients cohorts are needed to precisely determine the ac-
curacy of MSCT in patients with type 2 diabetes.
Second, LV function analysis was compared to 2D-echocardiography instead of MRI, which is consid-
ered the current gold standard for evaluation of LV function. In contrast to MRI, 2D-echocardiogra-

99MSCT in Diabetes
phy relies on geometrical assumptions and may thus be somewhat less accurate. Still, our results are
very similar to those obtained in the few available comparisons between MSCT and MRI 13;14. Third,
in the present study 14% of coronary segments were uninterpretable, which is in line with previous
studies 6;11;22. However, with the introduction of 32- and 64-slice systems the percentage of uninter-
pretable segments is likely to decline further.
Fourth, although some authors have recommended the use of beta-blocking agents 7, no additional
beta-blocking agents were administered prior to the examination in the present study. The use of
a multi-segmented reconstruction algorithm, which is available on our MSCT equipment, allowed
the inclusion of patients with heart rates higher than 65 beats per minutes without loss in temporal
resolution 23. Furthermore, additional administration of beta-blocking agents may have interfered
with cardiac function analysis, rendering it less reliable.
Finally, a major drawback of MSCT remains the radiation dose, which is approximately 6-9 mSv 24-26.
The development of new filters and optimized acquisition protocols will lead to a substantial reduc-
tion of radiation dose.
In conclusion, accurate non-invasive evaluation of both the coronary arteries and LV function with
MSCT is feasible in patients with type 2 diabetes. This combined strategy may improve the non-inva-
sive evaluation of CAD in this particular patient group.

100 Chapter 6
References 1. Luscher TF, Creager MA, Beckman JA, Cosentino F. Diabetes and vascular disease: pathophysiology,
clinical consequences, and medical therapy: Part II. Circulation. 2003;108:1655-1661. 2. Herlitz J, Karlson BW, Lindqvist J, Sjolin M. Rate and mode of death during five years of follow-up
among patients with acute chest pain with and without a history of diabetes mellitus. Diabet Med. 1998;15:308-314.
3. Schinkel AF, Elhendy A, Van Domburg RT, Bax JJ, Vourvouri EC, Sozzi FB, Valkema R, Roelandt JR, Pol-dermans D. Prognostic value of dobutamine-atropine stress myocardial perfusion imaging in patients with diabetes. Diabetes Care. 2002;25:1637-1643.
4. Sozzi FB, Elhendy A, Roelandt JR, Van Domburg RT, Schinkel AF, Vourvouri EC, Bax JJ, De Sutter J, Borghetti A, Poldermans D. Prognostic value of dobutamine stress echocardiography in patients with diabetes. Diabetes Care. 2003;26:1074-1078.
5. Achenbach S, Giesler T, Ropers D, Ulzheimer S, Derlien H, Schulte C, Wenkel E, Moshage W, Bautz W, Daniel WG, Kalender WA, Baum U. Detection of coronary artery stenoses by contrast-enhanced, retrospectively electrocardiographically-gated, multislice spiral computed tomography. Circulation. 2001;103:2535-2538.
6. Leber AW, Knez A, Becker C, Becker A, White C, Thilo C, Reiser M, Haberl R, Steinbeck G. Non-invasive intravenous coronary angiography using electron beam tomography and multislice computed tomog-raphy. Heart. 2003;89:633-639.
7. Nieman K, Rensing BJ, van Geuns RJ, Vos J, Pattynama PM, Krestin GP, Serruys PW, de Feyter PJ. Non-in-vasive coronary angiography with multislice spiral computed tomography: impact of heart rate. Heart. 2002;88:470-474.
8. Nieman K, Cademartiri F, Lemos PA, Raaijmakers R, Pattynama PM, de Feyter PJ. Reliable noninvasive coronary angiography with fast submillimeter multislice spiral computed tomography. Circulation. 2002;106:2051-2054.
9. Nieman K, Rensing BJ, van Geuns RJ, Munne A, Ligthart JM, Pattynama PM, Krestin GP, Serruys PW, de Feyter PJ. Usefulness of multislice computed tomography for detecting obstructive coronary artery disease. Am J Cardiol. 2002;89:913-918.
10. Nieman K, Pattynama PM, Rensing BJ, van Geuns RJ, de Feyter PJ. Evaluation of patients after coro-nary artery bypass surgery: CT angiographic assessment of grafts and coronary arteries. Radiology. 2003;229:749-756.
11. Ropers D, Baum U, Pohle K, Anders K, Ulzheimer S, Ohnesorge B, Schlundt C, Bautz W, Daniel WG, Achenbach S. Detection of coronary artery stenoses with thin-slice multi-detector row spiral com-puted tomography and multiplanar reconstruction. Circulation. 2003;107:664-666.
12. Dirksen MS, Bax JJ, de Roos A, Jukema JW, van der Geest RJ, Geleijns K, Boersma E, van der Wall EE, Lamb HJ. Usefulness of dynamic multislice computed tomography of left ventricular function in un-stable angina pectoris and comparison with echocardiography. Am J Cardiol. 2002;90:1157-1160.
13. Mahnken AH, Spuentrup E, Niethammer M, Buecker A, Boese J, Wildberger JE, Flohr T, Sinha AM, Krombach GA, Gunther RW. Quantitative and qualitative assessment of left ventricular volume with ECG-gated multislice spiral CT: value of different image reconstruction algorithms in comparison to MRI. Acta Radiol. 2003;44:604-611.
14. Juergens KU, Grude M, Maintz D, Fallenberg EM, Wichter T, Heindel W, Fischbach R. Multi-detector row CT of left ventricular function with dedicated analysis software versus MR imaging: initial experience. Radiology. 2004;230:403-410.
15. Diagnosis and classification of diabetes mellitus. Diabetes Care. 2004;27 Suppl 1:S5-S10. 16. Cerqueira MD, Weissman NJ, Dilsizian V, Jacobs AK, Kaul S, Laskey WK, Pennell DJ, Rumberger JA, Ryan
T, Verani MS. Standardized myocardial segmentation and nomenclature for tomographic imaging of the heart: a statement for healthcare professionals from the Cardiac Imaging Committee of the Council on Clinical Cardiology of the American Heart Association. Circulation. 2002;105:539-542.
17. Schiller NB, Acquatella H, Ports TA, Drew D, Goerke J, Ringertz H, Silverman NH, Brundage B, Botvinick EH, Boswell R, Carlsson E, Parmley WW. Left ventricular volume from paired biplane two-dimensional echocardiography. Circulation. 1979;60:547-555.
18. Diamond GA, Forrester JS. Analysis of probability as an aid in the clinical diagnosis of coronary-artery disease. N Engl J Med. 1979;300:1350-1358.

101MSCT in Diabetes
19. Bland JM, Altman DG. Statistical methods for assessing agreement between two methods of clinical measurement. Lancet. 1986;1:307-310.
20. Fleiss JL. Statistical methods for Rates and proportions. Second edition. New York: Wiley 1981. 21. Martuscelli E, Romagnoli A, D’Eliseo A, Razzini C, Tomassini M, Sperandio M, Simonetti G, Romeo
F. Accuracy of thin-slice computed tomography in the detection of coronary stenoses. Eur Heart J. 2004;25:1043-1048.
22. Maruyama T, Yoshizumi T, Tamura R, Takashima S, Toyoshima H, Konishi I, Yamashita S, Yamasaki K. Comparison of visibility and diagnostic capability of noninvasive coronary angiography by eight-slice multidetector-row computed tomography versus conventional coronary angiography. Am J Cardiol. 2004;93:537-542.
23. Dewey M, Laule M, Krug L, Schnapauff D, Rogalla P, Rutsch W, Hamm B, Lembcke A. Multisegment and halfscan reconstruction of 16-slice computed tomography for detection of coronary artery stenoses. Invest Radiol. 2004;39:223-229.
24. Hunold P, Vogt FM, Schmermund A, Debatin JF, Kerkhoff G, Budde T, Erbel R, Ewen K, Barkhausen J. Radiation exposure during cardiac CT: effective doses at multi-detector row CT and electron-beam CT. Radiology. 2003;226:145-152.
25. Trabold T, Buchgeister M, Kuttner A, Heuschmid M, Kopp AF, Schroder S, Claussen CD. Estimation of radiation exposure in 16-detector row computed tomography of the heart with retrospective ECG-gat-ing. Rofo Fortschr Geb Rontgenstr Neuen Bildgeb Verfahr. 2003;175:1051-1055.
26. Bae KT, Hong C, Whiting BR. Radiation dose in multidetector row computed tomography cardiac imag-ing. J Magn Reson Imaging. 2004;19:859-863.


Non-Invasive Evaluation of the Coronary
Arteries with Multi-Slice Computed
Tomography in Hypertensive Patients
Hypertension 2005; 45: 227-232
Joanne D. Schuijf, Jeroen J. Bax, J. Wouter Jukema, Hildo J. Lamb, Hubert W. Vliegen, Ernst E. van der Wall, Albert de Roos
7Chapter
Abstract
Background
Because patients with hypertension are at increased risk for developing coronary artery
disease, early and non-invasive identification of the disease in patients with hypertension is
important. Recently, multi-slice computed tomography (MSCT) has been demonstrated to
allow both non-invasive coronary angiography and assessment of left ventricular function.
The purpose of the present study therefore was to demonstrate the feasibility of this approach
in patients with hypertension with known or suspected coronary artery disease and compare
the results to invasive coronary angiography and 2D-echocardiography respectively.
Methods
MSCT was performed in 31 patients with confirmed hypertension. From the MSCT images, the
presence of significant coronary stenoses (≥50% luminal narrowing) and regional wall mo-
tion abnormalities were evaluated and compared with invasive coronary angiography and
2D-echocardiography. In addition, left ventricular ejection fraction was calculated from the
MSCT images.
Results
A total of 243 (88%) coronary artery segments could be evaluated with MSCT. Sensitivity and
specificity for the detection of significant coronary artery stenoses were 93% and 96%. On a
per patient basis, multi-slice computed tomography was accurate in 28 (90%) patients. Mean
left ventricular ejection fraction was 46 ± 14% (range: 16% to 64%. The agreement for assess-
ing regional wall motion was 91% (kappa statistic 0.81).
Conclusion
Simultaneous, non-invasive evaluation of coronary artery stenoses and left ventricular func-
tion with MSCT is accurate in patients with hypertension. This non-invasive approach may al-
low triage of patient treatment in terms of conservative versus invasive management.

105Evaluation of Hypertensive Patients
Introduction
Coronary artery disease (CAD) is the major cause of morbidity and mortality in hypertensive pa-
tients, especially since patients with hypertension are at increased risk for developing CAD as com-
pared to normotensive individuals 1;2. Moreover, since hypertension is present in 1 of every 5 adults,
non-invasive detection of CAD in this particular patient group has become a clinically important
issue 3. However, of several non-invasive tests, including exercise ECG and myocardial perfusion
imaging, a limited specificity in hypertensive patients has been reported due to an increased oc-
currence of false positive results in this particular patient group 4-7. These positive test results may
represent impaired vasodilator reserve and increased myocardial oxygen demand as a consequence
of microvascular disease, and thus myocardial ischemia in the absence of significant coronary artery
abnormalities 4-9. A non-invasive test therefore should ideally allow direct visualization of the coro-
nary arteries to detect or exclude obstructive CAD to triage patients for optimal medical therapy or
invasive evaluation.
Over the recent years, Multi-Slice Computed Tomography (MSCT) has emerged as a potential non-in-
vasive imaging method that allows the acquisition of high-quality images of the entire heart within
a single breath-hold. High sensitivities and specificities in the detection of coronary artery stenoses
have been reported, ranging from 72% to 95% and 75% to 99%, respectively 10-19. Furthermore, the
simultaneous recording of ECG data permits the reconstruction of images at any moment of the
cardiac cycle, thus allowing cardiac function analysis in addition to the evaluation of the coronary
arteries, although data are scarce 20-23.
Since no specific data are available on the performance of MSCT in patients with hypertension, the
purpose of the present study was to demonstrate the feasibility of evaluation of the coronary arter-
ies and left ventricular (LV) function using MSCT in patients with hypertension. Conventional coro-
nary angiography and 2D-echocardiography served as reference standards.
Methods
Patients and study protocol
The study group comprised 31 patients with 1). chest pain and/or dyspnea, 2). confirmed hyper-
tension (defined by sequential (on separate occasions) blood pressure measurements using an arm
cuff and a mercury manometer). All patients were scheduled for conventional coronary angiography
for the evaluation of chest pain/dyspnea complaints. Hypertension was defined as systolic blood
pressure ≥140 mmHg and/or diastolic blood pressure ≥90 mmHg, and/or use of antihypertensive
medication.
Patients with atrial fibrillation were excluded, and additional exclusion criteria were renal insufficien-
cy (serum creatinine >120 mmol/L), known allergy to iodine contrast media, severe claustrophobia,
and pregnancy.

106 Chapter 7
All patients gave informed consent to the study protocol, which was approved by the local ethics
committee.
Multi-slice computed tomography
Dataacquisition
In the initial 17 patients, MSCT angiography was performed with a Toshiba Multi-Slice Aquilion 0.5
system and in the remaining patients with a Toshiba Multi-slice Aquilion 16 system (Toshiba Medical
Systems, Otawara, Japan). Thus, detector collimation was either 4 x 2.0 mm or 16 x 0.5 mm. Other pa-
rameters were: rotation time 400, 500 or 600 ms (depending on the heart rate), tube current 250 mA,
and tube voltage 120 kV. A bolus non-ionic contrast (Xenetix 300®, Guerbet, Aulnay S. Bois, France)
was injected in the antecubital vein at a flow rate of 4.0 ml/s, resulting in a total administered dose of
120-150 ml, depending on the scan time. Automated detection of peak enhancement in the aortic
root was used for timing of the scan. During a breath hold of approximately 25s, cardiac images, from
the aortic root to the apex, were acquired. Data were reconstructed using retrospective ECG gating.
A multi-segment reconstruction algorithm was applied, meaning that data from up to 4 consecutive
heartbeats were used to generate a single image, thereby resulting in a temporal resolution of 105
– 200 ms. Spatial resolution was 0.5 x 0.5 x 2.0 mm and 0.5 x 0.5 x 0.5 mm for the 4-slice and 16-slice
system, respectively. No beta-blocking medication to reduce the heart rate was administered prior
to the examination and patients were included regardless of heart rate.
To evaluate the presence of coronary artery stenoses, reconstructions in diastole (65% - 85% of the
cardiac cycle) were generated with a reconstructed section thickness of either 1.0 mm (4-slice sys-
tem) or 0.4 mm (16-slice system). Images were transferred to a remote workstation (Vitrea2, Vital
Images, Plymouth, Minn. USA) for post-processing and evaluation. Images containing the fewest
motion artifacts were used for evaluation.
For the evaluation of LV function, the same original raw data set (acquired for the evaluation of the
coronary arteries) was used. Images were reconstructed retrospectively at 20 time points, starting
at early systole (0% of the cardiac cycle) to the end of diastole (95% of the cardiac cycle). Subse-
quently, short-axis images with a slice thickness of 2.00 mm were generated and transferred to a re-
mote workstation with dedicated cardiac function analysis software (MR Analytical Software System
[MASS], Medis, Leiden, the Netherlands).
Dataanalysis
The images were evaluated by an experienced observer, blinded to the catheterization results. A
modified AHA-ACC segmentation model was used for stenosis assessment: the left main coronary
artery (segment 5), the right coronary artery (segments 1, 2, 3), the left anterior descending coronary
artery (segments 6,7, and 8), and the left circumflex artery (segment 11, 13) 24. If present and of suf-
ficient size (diameter larger than 2.0 mm), distal segments and side-branches (segments 4, 9, 10, 12,
14, 15, 16 and 17) were also evaluated.
In addition to the original axial slices, curved multiplanar reconstructions and 3D volume rendered

107Evaluation of Hypertensive Patients
reconstructions were used to assess the presence of luminal narrowing. First, assessability was deter-
mined for each segment. Interpretable segments were subsequently classified as having significant
stenosis (≥50% reduction of lumen diameter) or not.
An experienced observer blinded to all other data evaluated the presence of regional wall motion
abnormalities visually on the short-axis slices (displayed in cine-loop format) using a previously de-
scribed 17-segment model 25. Each segment was graded on a 4-point scale (1= normokinesia, 2=
hypokinesia, 3= akinesia and 4= dyskinesia).
In order to calculate LV ejection fractions, endocardial contours were manually drawn on both the
end-systolic and end-diastolic short-axis images. Papillary muscles were regarded as being part of
the LV cavity. LV end-systolic and end-diastolic volumes were calculated using commercially avail-
able software (MASS) developed at our institution by summation of the product (area × slice dis-
tance) of all slices. Finally, the related LV ejection fraction was derived by subtracting the end-systolic
volume from the volume at end-diastole and dividing the result by the end-diastolic volume.
Invasive coronary angiography
Invasive coronary angiography was performed according to standard techniques. Vascular access
was obtained through the femoral approach with Seldinger’s technique and a 6 Fr or 7 Fr catheter.
Coronary angiograms were visually evaluated by an experienced observer without knowledge of
the MSCT data. The same segmentation as described above for MSCT was applied to determine the
presence of significant luminal reduction in each coronary segment.
2D-echocardiography
2D-echocardiography was performed in the left lateral decubitus position using a commercially
available system (Vingmed System FiVe/Vivid-7, GE-Vingmed, Milwaukee, WI, USA). Images
were acquired using 3.5 MHz transducer at a depth of 16 cm in standard parasternal and apical
views.
Regional wall motion was scored using the 17-segment model and 4-point scale as described above
for MSCT.
Statistical analysis
Sensitivity, specificity, positive and negative predictive values with their corresponding 95% Con-
fidence Intervals (CIs) for the detection of significant coronary artery stenoses were calculated. The
95% CIs were calculated using the following formula: p ± 1.96*√ {(p*(100-p))/n}, where p = sensitivity
or specificity (%) and n = the total number of segments. Additionally, data were analyzed on a per
patient basis. MSCT was considered correct in the individual patient analysis if at least one signifi-
cant stenosis was detected on the MSCT images or if MSCT ruled out the presence of any significant
stenosis. Agreement for regional wall motion was expressed in a 4x4 table using weighted kappa

108 Chapter 7
statistics. A kappa value of <0.4 represents poor agreement, a kappa value between 0.4 and 0.75 fair
to good agreement, and a kappa value of >0.75 is considered an excellent agreement based on the
Fleiss’ classification 26. A p-value <0.05 was considered to indicate statistical significance.
Results
Patient characteristics
The patient characteristics are listed in Table 1. The study group consisted of 31 patients with con-
firmed hypertension; mean systolic blood pressure was 138 ± 21 mmHg (range: 110-167 mmHg),
whereas mean diastolic blood pressure was 81 ± 10 mmHg (range: 67-105 mmHg). Average dura-
tion of hypertension at the time of MSCT was 3.1 ± 5.8 years (range: 0 - 9 years). Mean LV mass, as
determined by echocardiography was 197 ± 68 g. Mean body mass index was 25 ± 3 kg/m2. Cardiac
medication was continued during the study period. A total of 23 patients (74%) used beta-block-
ing agents. Other medications included angiotensin converting enzyme inhibitors (n=25), calcium-
antagonists (n=16), nitrates (n=13), diuretics (n=10), oral anticoagulants (n=30) and statins (n=30).
The average interval between conventional coronary angiography and MSCT was 1.9 ± 2.7 days. The
interval between 2D-echocardiography and MSCT was 2.2 ± 1.8 days.
Table 1. Clinical characteristics of the study population (n=31).
Characteristic ValueGender (M/F) 28/3Age (yrs) 63 ± 11 Hypertension 31 (100)Heart rate during data acquisition (bpm) 68 ± 14Beta blocker medication 23 (74)Angina Pectoris CCS class 1/2 7 (23) CCS class 3/4 24 (77)Heart Failure NYHA class 1/2 23 (74) NYHA class 3/4 8 (26)History Previous MI 15 (48) Previous PCI/CABG 25 (81)/ 10 (34) Other risk factors for CAD Diabetes type 2 16 (52) Smoking 15 (48) Hypercholesterolemia 29 (94) Family with CAD 17 (55)
Data between parentheses are %.Bpm: beats per minute; CABG: coronary artery bypass grafting; CAD: coronary artery disease; CCS: Canadian Cardiovas-cular Society; MI: myocardial infarction; NYHA: New York Heart Association; PCI: percutaneous coronary intervention.

109Evaluation of Hypertensive Patients
Coronary artery stenoses
A total of 277 coronary segments was available for comparison between conventional angiogra-
phy and MSCT. Of these segments, 243 (88%) were of sufficient quality to evaluate the presence
of significant (≥50%) narrowing. Reasons of uninterpretability were predominantly the presence of
coronary stents and motion artifacts. Furthermore, the majority of uninterpretable segments was
located in distal segments (segments 3, 8 and 13). Conventional angiography revealed 57 significant
stenoses in the interpretable segments. Of these lesions, 53 were correctly detected by MSCT. The
presence of significant stenosis was correctly ruled out in 179 out of 186 non-diseased segments.
Accordingly, the sensitivity and specificity for the detection of coronary artery stenoses were 93%
and 96%, respectively. Details per coronary artery, including positive and negative predictive values,
are summarized in Table 7.2; among the different coronary arteries, no significant differences were
noted. On a per patient basis, MSCT was accurate in 28 (90%) patients. Of 21 patients with significant
lesions on conventional angiography, 20 (95%) patients were correctly identified. In the remaining
10 patients with no significant abnormalities, MSCT was accurate in 8 (80%) patients. In Figures 1 and
2, MSCT images of both stenotic and normal coronary arteries are shown. Of note, to obtain a multi-
planar reconstruction, each vessel needs to be reconstructed separately. Thus, no side-branches are
visible, since only multiplanar reconstructions of the three major vessels are provided.
Figure 1. Severe lesion in the left anterior descending coronary artery (LAD). In Panel A, a curved multiplanar MSCT reconstruction of the LAD is shown, demonstrating a severe stenosis (white arrowhead) in the proximal part of the vessel. A 3D volume rendered reconstruction is provided in Panel B. The severe lesion is also clearly visible in Panel C (black arrowhead), an enlargement of Panel B. Findings were confirmed by conventional angiography (panel D).

110 Chapter 7
Table 2. Diagnostic accuracy (with 95% Confidence Intervals) of MSCT in the detection of stenoses.
Parameter All segments LM LAD LCx RCA
Interpretable 243/277 (88, 84-92)
30/31(97, 91-100)
84/97(87, 80-94)
59/66(89, 81-97)
70/83(84, 76-92)
Sensitivity 53/57(93, 86-100)
1/1(100, NA)
22/23(96, 88-100)
11/14(79, 58-100)
19/19(100, NA)
Specificity 179/186(96, 93-99)
27/29(93, 84-100)
58/61(95, 90-100)
45/45(100, NA)
49/51(96, 91-100)
PPV 53/60(88, 80-96)
1/3(33, 0-86)
22/25(88, 75-100)
11/11(100, NA)
19/21(90, 77-100)
NPV 179/183(98, 96-100)
27/27(100, NA)
58/59(98, 94-100)
45/48(94, 87-100)
49/49(100, NA)
Values are the absolute values used to calculate the percentages. Numbers in parentheses are the percentages with the corresponding 95% CIs.LAD: left anterior descending coronary artery; LCx: left circumflex coronary artery; LM: left main coronary artery; MSCT: multi-slice computed tomography; NPV: negative predictive value; PPV: positive predictive value; RCA: right coronary artery.
LV function
LV ejection fraction, as determined by MSCT, ranged from 16% to 64% (mean 46 ± 14%), respectively.
Abnormal wall motion was observed in 158 (30%) of 527 segments, with 86 (54%) of these segments
showing hypokinesia, 55 (35%) akinesia and 17 (11%) dyskinesia. In 148 (94%) of these segments,
MSCT also demonstrated abnormal wall motion. Overall, 91% of segments were scored identically
on both modalities (kappa statistic 0.81, Table 3), indicating an excellent agreement between 2D-
echocardiography and MSCT. For the individual wall motion scores (1-4), agreements were 97%,
78%, 71% and 94%, respectively. Examples of short-axis reconstructions are shown in Figure 3 and 4,
showing patients with normal and abnormal LV function.
Figure 2. Patent coronary arteries. Curved multiplanar MSCT reconstructions of the left anterior descending artery, left circumflex artery and right coronary artery, respectively, showing the absence of significant luminal narrowing in all vessels.

111Evaluation of Hypertensive Patients
Table 3. Relation between regional wall motion as determined by echocardiography and MSCT (agreement 91%, kappa statistic 0.81).
EchocardiographyMSCT 1 2 3 4 Total
1 357 10 0 0 3672 12 67 13 0 923 0 9 39 1 494 0 0 3 16 19
Total 369 86 55 17 527
1= normokinesia, 2=hypokinesia, 3= akinesia, and 4= dyskinesia
Discussion
The results of the current study demonstrate that accurate evaluation of the coronary arteries and
LV function in patients with hypertension using contrast-enhanced MSCT is feasible. In the detec-
tion of significant coronary artery stenoses, an excellent sensitivity and specificity of 93% and 96%
were demonstrated. These results are in line with previous studies obtained in the general patient
population. In a study by Ropers et al 19, coronary artery stenoses were detected with a sensitivity
and specificity of 91% and 93%, respectively. A somewhat higher sensitivity (95%) and slightly lower
specificity (89%) were reported by Nieman et al 16. In both studies a negative predictive value of 97%
was reported, similar to our results (98%). These findings demonstrate the potential of MSCT to func-
tion as a diagnostic tool to rule out the presence of CAD. This may improve the non-invasive work
up of patients with hypertension in particular, since in these patients false positive test results in the
absence of coronary artery stenoses are frequently encountered with other non-invasive imaging
modalities, including nuclear perfusion imaging and stress echocardiography 5. These imaging mo-
dalities visualize the consequences of ischemia (induction of perfusion abnormalities or systolic wall
motion abnormalities). In contrast, direct visualization of the coronary arteries is allowed by MSCT.
Figure 3. MSCT short-axis reconstructions in end-diastole and end-systole. Normal systolic wall motion is clearly present in all segments.

112 Chapter 7
Thus, by ruling out the presence of CAD, non-invasive angiography with MSCT may substantially
reduce the number of patients that will need diagnostic invasive coronary angiography. However,
when significant abnormalities are observed on the MSCT images, this information could be used for
a more efficiently targeted (interventional) treatment strategy. Still, further prognostic studies are
needed in larger cohorts before MSCT can become an established diagnostic modality and replace
conventional coronary angiography in certain patient groups.
In addition to non-invasive coronary angiography, LV function analysis was performed. Agreement of
regional wall motion scores was excellent with 91% of segments scored identically, resulting in a kap-
pa statistic of 0.81. For the individual wall motion scores, agreement was highest for segments with
either normal contractility (97%) or dyskinesia (94%), whereas it was slightly lower in segments with
intermediate motion abnormalities (75%). This phenomenon may be attributed to the temporal reso-
lution of the technique (105 –200 ms), which may be insufficient to allow detection of subtler wall mo-
tion abnormalities in some cases. For echo, wall motion was derived from parasternal and apical views
whereas only short-axis views were used with MSCT and this may also account for discrepancies.
In contrast to several other studies 16;19, no beta-blocking agents were administered prior to the
MSCT data acquisition in order to lower heart rates higher than 65 beats per minute. The use of a
multi-segmented reconstruction algorithm, available on our MSCT equipment, allowed the inclu-
sion of patients with higher heart rates without compromise to temporal resolution.
Figure 4. Example of MSCT short-axis reconstructions of a patient with reduced wall motion in the anteroseptal region (black arrow).
Several limitations of the present study need to be addressed.
First, both a 4-slice system and 16-slice system were used for data acquisition. Since 16-slice systems
have been demonstrated to result in both better assessability and accuracy as compared to 4-slice
systems, the use of 2 different systems is likely to have influenced our results. Moreover, of the 34
coronary artery segments with insufficient quality to assess the presence or absence of significant
coronary artery stenoses, 68% was acquired with the 4-slice system. As expected, assessability was

113Evaluation of Hypertensive Patients
lowest in the right coronary artery, since this vessel displays the fastest movement during the cardiac
cycle. In addition, the presence of coronary stents also frequently resulted in degraded image qual-
ity. Similar percentages have been reported previously 13;19;27. In the near future however, this limita-
tion may be overcome by the introduction of 32- and 64-detector row scanners in combination with
faster rotation times, which are likely to reduce the percentage of non-assessable segments.
Second, an important drawback of MSCT is the radiation dose that is still considerably high; approxi-
mately 8 mSv. However, with the use of new filters the radiation dose will decrease substantially.
Third, precise quantification of luminal stenosis (as can be performed with angiography) is currently
not possible with MSCT, since the spatial resolution is still suboptimal and validated software is cur-
rently not available. Finally, the prevalence of CAD in the present population was high and valida-
tion of the technique in patients with lower prevalence of CAD is warranted. Similarly, patients with
late-stage as well as early stage hypertension were included, since the purpose of the present study
was to demonstrate the feasibility of the technique in this population. Thus, further testing of the
technique in patients with early-stage hypertension is needed.
In conclusion, accurate, simultaneous evaluation of both the coronary arteries and LV function in
patients with hypertension is feasible.
Perspectives
This combined strategy may offer a new approach for a non-invasive, conclusive workup in patients
with hypertension and known or suspected CAD. Direct visualization of the coronary arteries may
result in improved identification of patients at risk for cardiovascular events. However, whether this
translates into improved clinical management still needs to be tested, particularly in patient groups
with early-stage hypertension and lower prevalence of CAD.

114 Chapter 7
References 1. MacMahon S, Peto R, Cutler J, Collins R, Sorlie P, Neaton J, Abbott R, Godwin J, Dyer A, Stamler J. Blood
pressure, stroke, and coronary heart disease. Part 1, Prolonged differences in blood pressure: prospec-tive observational studies corrected for the regression dilution bias. Lancet. 1990;335:765-774.
2. Rutan GH, Kuller LH, Neaton JD, Wentworth DN, McDonald RH, Smith WM. Mortality associated with diastolic hypertension and isolated systolic hypertension among men screened for the Multiple Risk Factor Intervention Trial. Circulation. 1988;77:504-514.
3. Hypertension control. Report of a WHO Expert Committee. World Health Organ Tech Rep Ser. 1996;862:1-83.
4. Pringle SD, Dunn FG, Lorimer AR, McKillop JH. The role of nuclear cardiology in hypertension. Nucl Med Commun. 1994;15:4-8.
5. Houghton JL, Frank MJ, Carr AA, von Dohlen TW, Prisant LM. Relations among impaired coronary flow reserve, left ventricular hypertrophy and thallium perfusion defects in hypertensive patients without obstructive coronary artery disease. J Am Coll Cardiol. 1990;15:43-51.
6. Aguirre JM, Rodriguez E, Ruiz dA, Urrengoetxea J, Faus JM, Caso R, Iriarte M. Segmentary coronary reserve in hypertensive patients with echocardiographic left ventricular hypertrophy, gamma-graphic ischaemia and normal coronary angiography. Eur Heart J. 1993;14 Suppl J:25-31.
7. DePuey EG, Guertler-Krawczynska E, Perkins JV, Robbins WL, Whelchel JD, Clements SD. Alterations in myocardial thallium-201 distribution in patients with chronic systemic hypertension undergoing single-photon emission computed tomography. Am J Cardiol. 1988;62:234-238.
8. Harrison DG, Marcus ML, Dellsperger KC, Lamping KG, Tomanek RJ. Pathophysiology of myocardial perfusion in hypertension. Circulation. 1991;83:III14-III18.
9. Hamouda MS, Kassem HK, Salama M, El Masry M, Shaaban N, Sadek E, Khandheria BK, Seward JB, Elhendy A. Evaluation of coronary flow reserve in hypertensive patients by dipyridamole transesopha-geal doppler echocardiography. Am J Cardiol. 2000;86:305-308.
10. Achenbach S, Giesler T, Ropers D, Ulzheimer S, Derlien H, Schulte C, Wenkel E, Moshage W, Bautz W, Daniel WG, Kalender WA, Baum U. Detection of coronary artery stenoses by contrast-enhanced, retrospectively electrocardiographically-gated, multislice spiral computed tomography. Circulation. 2001;103:2535-2538.
11. Becker CR, Knez A, Leber A, Treede H, Ohnesorge B, Schoepf UJ, Reiser MF. Detection of coronary artery stenoses with multislice helical CT angiography. J Comput Assist Tomogr. 2002;26:750-755.
12. Knez A, Becker CR, Leber A, Ohnesorge B, Becker A, White C, Haberl R, Reiser MF, Steinbeck G. Useful-ness of multislice spiral computed tomography angiography for determination of coronary artery stenoses. Am J Cardiol. 2001;88:1191-1194.
13. Leber AW, Knez A, Becker C, Becker A, White C, Thilo C, Reiser M, Haberl R, Steinbeck G. Non-invasive intravenous coronary angiography using electron beam tomography and multislice computed tomog-raphy. Heart. 2003;89:633-639.
14. Morgan-Hughes GJ, Marshall AJ, Roobottom CA. Multislice Computed Tomographic Coronary Angiog-raphy: Experience in a UK Centre. Clin Radiol. 2003;58:378-383.
15. Nieman K, Rensing BJ, van Geuns RJ, Vos J, Pattynama PM, Krestin GP, Serruys PW, de Feyter PJ. Non-in-vasive coronary angiography with multislice spiral computed tomography: impact of heart rate. Heart. 2002;88:470-474.
16. Nieman K, Cademartiri F, Lemos PA, Raaijmakers R, Pattynama PM, de Feyter PJ. Reliable noninvasive coronary angiography with fast submillimeter multislice spiral computed tomography. Circulation. 2002;106:2051-2054.
17. Nieman K, Rensing BJ, van Geuns RJ, Munne A, Ligthart JM, Pattynama PM, Krestin GP, Serruys PW, de Feyter PJ. Usefulness of multislice computed tomography for detecting obstructive coronary artery disease. Am J Cardiol. 2002;89:913-918.
18. Nieman K, Pattynama PM, Rensing BJ, van Geuns RJ, de Feyter PJ. Evaluation of patients after coro-nary artery bypass surgery: CT angiographic assessment of grafts and coronary arteries. Radiology. 2003;229:749-756.
19. Ropers D, Baum U, Pohle K, Anders K, Ulzheimer S, Ohnesorge B, Schlundt C, Bautz W, Daniel WG, Achenbach S. Detection of coronary artery stenoses with thin-slice multi-detector row spiral com-puted tomography and multiplanar reconstruction. Circulation. 2003;107:664-666.

115Evaluation of Hypertensive Patients
20. Dirksen MS, Bax JJ, de Roos A, Jukema JW, van der Geest RJ, Geleijns K, Boersma E, van der Wall EE, Lamb HJ. Usefulness of dynamic multislice computed tomography of left ventricular function in un-stable angina pectoris and comparison with echocardiography. Am J Cardiol. 2002;90:1157-1160.
21. Grude M, Juergens KU, Wichter T, Paul M, Fallenberg EM, Muller JG, Heindel W, Breithardt G, Fischbach R. Evaluation of global left ventricular myocardial function with electrocardiogram-gated multidetec-tor computed tomography: comparison with magnetic resonance imaging. Invest Radiol. 2003;38:653-661.
22. Juergens KU, Grude M, Maintz D, Fallenberg EM, Wichter T, Heindel W, Fischbach R. Multi-detector row CT of left ventricular function with dedicated analysis software versus MR imaging: initial experience. Radiology. 2004;230:403-410.
23. Mahnken AH, Spuentrup E, Niethammer M, Buecker A, Boese J, Wildberger JE, Flohr T, Sinha AM, Krombach GA, Gunther RW. Quantitative and qualitative assessment of left ventricular volume with ECG-gated multislice spiral CT: value of different image reconstruction algorithms in comparison to MRI. Acta Radiol. 2003;44:604-611.
24. Austen WG, Edwards JE, Frye RL, Gensini GG, Gott VL, Griffith LS, McGoon DC, Murphy ML, Roe BB. A reporting system on patients evaluated for coronary artery disease. Report of the Ad Hoc Committee for Grading of Coronary Artery Disease, Council on Cardiovascular Surgery, American Heart Associa-tion. Circulation. 1975;51:5-40.
25. Cerqueira MD, Weissman NJ, Dilsizian V, Jacobs AK, Kaul S, Laskey WK, Pennell DJ, Rumberger JA, Ryan T, Verani MS. Standardized myocardial segmentation and nomenclature for tomographic imaging of the heart: a statement for healthcare professionals from the Cardiac Imaging Committee of the Council on Clinical Cardiology of the American Heart Association. Circulation. 2002;105:539-542.
26. Fleiss JL. Statistical methods for Rates and proportions. Second edition. New York: Wiley 1981. 27. Maruyama T, Yoshizumi T, Tamura R, Takashima S, Toyoshima H, Konishi I, Yamashita S, Yamasaki K.
Comparison of visibility and diagnostic capability of noninvasive coronary angiography by eight-slice multidetector-row computed tomography versus conventional coronary angiography. Am J Cardiol. 2004;93:537-542.


Do Risk Factors influence Diagnostic Accuracy
of Non-Invasive Coronary Angiography with
Multi-Slice Computed Tomography?
J Nucl Cardiol 2006; 13: 635-41
Joanne D. Schuijf, Nico R. Mollet, Filippo Cademartiri, J. Wouter Jukema, Hildo J. Lamb, Albert de Roos, Ernst E.van der Wall, Pim J. de Feyter,
Jeroen J. Bax
8Chapter

Abstract
Background
Multi-Slice Computed Tomography (MSCT) is a relatively new non-invasive imaging modal-
ity in the evaluation of patients with suspected coronary artery disease (CAD). Whether diag-
nostic accuracy is influenced by gender or risk factors for CAD is currently unknown and was
evaluated in the present study.
Methods
In 197 patients (171 men, mean age 60 ± 11 years) 16-slice MSCT was performed and com-
pared to invasive coronary angiography at 2 different centers (Leiden and Rotterdam, the
Netherlands). Diagnostic accuracy for the detection of ≥50% luminal narrowing was calcu-
lated for all patients combined as well as for patients with known versus suspected CAD. In ad-
dition, diagnostic accuracy was determined in men versus women and in different subsets of
patients, based on the presence of risk factors for CAD including hypertension, type 2 diabetes
mellitus, hypercholesterolemia, and obesity. Only segments with a diameter ≥2.0 mm were
evaluated, whereas smaller segments as well as stents were excluded from the analysis.
Results
Overall, a sensitivity and specificity of 99% and 86% on a patient level were demonstrated,
with corresponding positive and negative predictive values of respectively 95% and 96%. Sim-
ilar values were observed in the different subsets of patients, with no statistical differences.
Discussion
These findings confirm the high diagnostic accuracy of MSCT, regardless of gender or risk
factors.

119Do Risk Factors influence the Diagnostic Accuracy of MSCT?
Introduction
Over the past few years, Multi-Slice Computed Tomography (MSCT) has emerged as a promising modal-
ity for non-invasive evaluation of coronary anatomy 1;2. Moreover, with the introduction of 16- and 64-slice
scanners, the non-invasive diagnosis of significant CAD has improved substantially. Reported sensitivi-
ties and specificities are in the range of 70% to 98% and 86% to 98% respectively, with an average sen-
sitivity and specificity of 88% and 96% respectively 3. In addition, more complete coverage of the coro-
nary tree has been achieved, with a substantial reduction in the number of non-diagnostic segments 3.
Accordingly, routine evaluation for CAD has become realistic and the expectation is that (in the near
future) MSCT may replace invasive angiography to rule out CAD. For this purpose, the technique should
primarily be implemented in the clinical work-up of patients with suspected CAD rather than known CAD.
Considering the fact that the majority of these patients will present with atypical or even no complaints
but with an elevated risk of CAD due to the presence of multiple risk factors, information on the accuracy
of MSCT in these various clinical conditions is highly needed. However, despite the overwhelming num-
ber of reported studies thus far, it is unknown whether diagnostic accuracy is influenced by gender or
risk factors. The purpose of the present study therefore, was to evaluate the influence of gender and risk
factors for CAD on the diagnostic accuracy of 16-slice MSCT in a large cohort of patients.
Methods
Study population
A total of 201 patients, presenting with known or suspected CAD (based on symptoms and/or mul-
tiple risk factors for CAD) and scheduled for invasive coronary angiography for diagnostic purposes
were included at 2 different centers (Rotterdam and Leiden, the Netherlands). The following exclu-
sion criteria were applied: renal insufficiency (serum creatinine >120 μmol/L [1.35 mg/dL]) or other
contraindications to the administration of iodinated contrast, pregnancy, acute coronary syndromes
and (supra-)ventricular arrhythmias. For all patients, the presence of coronary risk factors was docu-
mented according to the following criteria:
1. Type 2 Diabetes was defined as 1. Symptoms of diabetes plus casual plasma glucose concentra-
tion ≥200 mg/dl (11.1 mmol/l) or 2. Fasting plasma glucose level ≥126 mg/dl (7.0 mmol/l)4.
2. Hypertension was defined as systolic blood pressure ≥140 mm Hg and/or diastolic blood pres-
sure ≥90 mm Hg, and/or use of anti-hypertensive medication 5.
3. Obesity was defined as a body mass index (BMI) ≥30 kg/m 2 5;6.
4. Hypercholesterolemia was defined as total serum cholesterol ≥230 mg/dl and/or serum triglyc-
erides ≥200 mg/dl or use of a lipid-lowering agent 5;7.
5. Smoking.
6. A positive family history was defined as having relatives of first or second degree with premature
(younger than 55 years of age) cardiovascular disease.

120 Chapter 8
The study protocol was approved by the local ethics committees, and informed consent was ob-
tained from all patients.
MSCT; Data acquisition
All studies were performed with a 16-detector row system. In Rotterdam, a Sensation 16 (Siemens,
Germany) was used, whereas in Leiden, data were acquired with an Aquilion 16 system (Toshiba,
Japan). If the heart rate was 65 beats/min or higher, additional beta-blockers (metoprolol, 100 mg,
single dose, 1 hour prior to scan) were provided if tolerated. Scan parameters of the Sensation 16
system were the following: collimation 16 x 0.75 mm, tube rotation 420 ms, table feed 3 mm/rota-
tion, and tube voltage 120 kV, while the tube current was 400 to 450 mAs 8. A bolus of 100 ml contrast
(Visipaque 320, Amersham Health, Forchheim, United Kingdom) was injected intravenously at a flow
rate of 4 ml/s. Scan parameters of the Aquilion 16 were: collimation 16 x 0.5 mm, tube rotation, 400
or 500 ms, table feed 3-4 mm/rotation, and tube voltage 120 kV at 250mA. The total contrast dose
for the scan ranged from 120 to 150 ml depending on the total scan time, with an injection rate of 4
ml/s through the antecubital vein (Xenetix 300®, Guerbet, Aulnay S. Bois, France), followed by a saline
flush of 40 ml 9. Both systems used an automated bolus tracking system for timing of the helical scan.
Images were obtained during a single breath hold of approximately 20-25 seconds, while the ECG
was recorded simultaneously to allow retrospective gating of the data.
Images were reconstructed in cardiac phase containing the fewest motion artifacts, typically during
the mid-to-end diastolic phase. However, other reconstruction windows were obtained when nec-
essary. Reconstructed images were then transferred to a remote workstation for evaluation.
MSCT; Data evaluation
MSCT angiograms were independently evaluated for the presence of significant (≥50% narrowing
of luminal diameter) by 2 observers (blinded to all other data). In addition to the original axial slices,
thin-slab maximum intensity projections and multiplanar reconstructions were used to estimate
the degree of luminal narrowing. Segments with coronary stents or side-branches with a diameter
smaller than 2.0 mm were excluded from the analysis. In case of previous bypass grafting, only native
segments distal to the anastomosis of a patent bypass graft were evaluated.
Conventional coronary angiography
Conventional coronary angiography was performed according to standard clinical protocols within
1 month of the MSCT examination. To obtain vascular access, the femoral approach with the Seld-
inger technique was applied. Angiograms were evaluated by consensus reading of 2 experienced
observers without knowledge of the MSCT data.

121Do Risk Factors influence the Diagnostic Accuracy of MSCT?
Stress electrocardiography
In a subset of patients, stress-testing, by means of a 12-lead ECG at rest and during stress, was per-
formed within 3 months of MSCT and conventional coronary angiography. Patients with revascular-
ization in the period between the stress-ECG and MSCT/conventional coronary angiography were
excluded, resulting in 44 eligible patients. Electrocardiographic findings during peak stress were
graded as normal or abnormal based on the presence of ≥1.0-mm ST-segment changes (horizontal
or downslope) measured at 80 ms after the J point in 2 contiguous leads during peak stress or im-
mediately after recovery.
Data evaluation and statistical analysis
Sensitivity, specificity, positive and negative predictive values with corresponding 95% confidence
intervals (CI) for the detection of ≥50% luminal narrowing were calculated. Data were analyzed on
a patient, vessel and segmental level. In addition, diagnostic accuracy was compared between men
and women and the data were analyzed according to the presence of risk factors for CAD. A p-value
<0.05 was considered to indicate statistical significance.
Table 1. Characteristics of the study population (n=197).
Characteristic value (%)Gender (M/F) 171/26Age (yrs) 60 ± 11Heart rate during acquisition 61 ± 10Beta blocker medication 181 (92%)Previous PCI/ CABG 59(30%)/23 (12%)Risk factors for CAD Diabetes type 2 54 (27%) Hypertension 106 (54%) Smoking 83 (42%) Hypercholesterolemia 143 (73%) Family with CAD 90 (46%) Obesity 44 (22%)Vessel disease 0-vessel 34 (17%) 1-vessel 57 (29%) 2-vessel 56 (28%) 3-vessel 50 (25%)
Data are presented as absolute values (%).

122 Chapter 8
Results
Clinical features
In total, 201 patients were evaluated with MSCT, of which 128 in Rotterdam 8 and 73 in Leiden 9. A
subset of patients has been included in previous studies 8;9. MSCT was performed successfully in all
but 2 patients. In those 2 patients, the examination could not be evaluated due to technical issues.
In 2 other patients, all 3 vessels were stented and these patients were excluded from the analysis as
well. Main clinical features of the remaining 197 patients are presented in Table 1.
Coronary angiography in all patients
Based on invasive coronary angiography, significant CAD (defined by the presence of significant
stenoses or previous revascularization) was present in 163 patients (1-vessel disease in 57 patients,
2-vessel disease in 56, and 3-vessel disease in 50).
A total of 2015 segments were available for analysis. Of these segments, 92 (5%) were of low image
quality but were included in the analysis. A total of 21 (1%) segments were excluded from the analy-
sis. Causes of poor image quality or uninterpretability were predominantly calcifications, motion
artifacts, and low contrast-to-noise ratio.
Table 2. Diagnostic accuracy of MSCT in the entire study population (n=197).
Segmental basis Vessel basis Patient basis
Excluded 1% 1% 0%
Evaluation possible with low confidence
5% 2% 8%
Sens (%, 95% CI) 90, 87-93 92, 89-95 99, 97-100
Spec (%, 95% CI) 96, 95-97 93, 91-95 86, 76-96
PPV (%, 95% CI) 82, 78-86 87, 83-91 95, 92-98
NPV (%, 95% CI) 98, 97-99 96, 94-98 96, 90-100
NPV: negative predictive value; PPV: positive predictive value; sens: sensitivity; spec: specificity.
Significant stenoses were correctly identified in 303 segments, while the presence of significant ste-
nosis was correctly ruled out in 1591 of 1658 segments, resulting in a sensitivity and specificity of
90% (95% CI 87-93%) and 96% (95% CI 95-97%). In only 2 of 147 (1%) patients, the presence of one
or more significant stenoses was missed on MSCT (resulting in a sensitivity of 99% on a patient level,
95% CI 97-100%), while the absence was correctly identified in 43 of 50 (86%, 95% CI 76-96%) pa-
tients without significant stenoses. On a vessel basis, a sensitivity and specificity of respectively 92%
(95% CI 89-95%) and 93% (95% CI 91-95%) were obtained.
Data are summarized in Table 2.

123Do Risk Factors influence the Diagnostic Accuracy of MSCT?
Influence of gender
In total, 26 (13%) of included patients were female. Similar diagnostic accuracy was observed in men
and women (Table 3). Sensitivity and specificity (on a segmental basis) were respectively 90% (95%
CI 79-100%) and 97% (95% CI 95-99%) in women and 90% (95% CI 87-93%) and 96% (95% CI 95-97%)
in men (sensitivity and specificity not significant versus women).
Table 3. Influence of gender on the diagnostic accuracy of MSCT.
Females
(n=26)
Males
(n=171)Patient basis
Sens (%, 95% CI) 100 98, 96-100
Spec (%, 95% CI) 90, 71-100 85, 74-96
PPV(%, 95% CI) 94, 83-100 96, 93-99
NPV (95% CI) 100 94, 86-100
Segmental basis
Sens (%, 95% CI) 90, 79-100 90, 87-93
Spec (%, 95% CI) 97, 95-99 96, 95-97
PPV (%, 95% CI) 79, 65-94 82, 78-86
NPV (95% CI) 99, 98-100 98, 97-99
NPV: negative predictive value; PPV: positive predictive value; sens: sensitivity; spec: specificity.
Diagnostic accuracy in the presence of different risk factors for CAD
Next, the diagnostic accuracy of MSCT was explored in the presence of different risk factors (type
2 diabetes n=54, hypertension n=106, hypercholesterolemia n=143, obesity n=44, positive family
history n=90, and smoking n=83). Results are summarized in Table 4. No statistical differences were
observed between the different groups.
Comparison of patients with suspected and known CAD
Based on clinical evaluation (ECG, history etc) the presence of significant CAD was already known in
75 (38%) patients, whereas it was suspected (based on the presence of symptoms and/or multiple
risk factors for CAD) in the remaining 122 (62%). In the former, sensitivity and specificity on a seg-
mental basis were respectively 97% (95% CI 93-100%) and 99% (95% CI 98-100%). In the latter, these
values were respectively 89% (95% CI 85-93%, p<0.05 versus known CAD) and 95% (95% CI 94-96%,
p<0.05 versus known CAD). Thus, a slightly higher sensitivity/specificity on a segmental basis was

124 Chapter 8
observed in patients with known CAD as compared to patients with suspected CAD. However, no
differences were observed when analysis was performed on a patient level (see Table 5).
Comparison of coronary angiography with stress-electrocardiography
In 44 patients (36 male, 8 female, average age 61 ± 11 years), stress-ECGs were available to evaluate
the presence of inducible ischemia. In one patient, the presence of left bundle branch block preclud-
ed ECG interpretation. In the remaining 43 patients, stress ECG was abnormal in 10 patients. In all but
1 patient (90%), MSCT confirmed the presence of one or more significant lesions. In 33 patients, no
ischemia was detected during stress-ECG testing. Nevertheless, in 18 (55%) of these patients at least
1 or more significant lesion was demonstrated during MSCT. In 4 of these patients with a normal
stress-ECG, left main or 3 vessel disease was observed.
Table 4. Influence of coronary risk factors on the diagnostic accuracy of MSCT.
Risk factorDM type 2
(n=54)Obesity(n=44)
Hypercholes-terolemia
(n=143)
Hypertension(n=106)
Family(n=90)
Smoking(n=83)
Segmental basis
Excluded 2.7% 1.3% 1.4% 0.6% 0.9% 1.8%
Evaluation possible with low confidence
3.2% 5.7% 5.3% 4.6% 4.6% 3.2%
Sens (%, 95% CI) 89, 82-96 92, 85-99 94, 91-97 91, 87-95 90, 85-95 91, 86-96
Spec (%, 95% CI) 95, 93-97 98, 97-99 96, 95-97 96, 95-97 98, 97-99 97, 96-98
PPV (%, 95% CI) 80, 72-88 85, 77-93 82, 77-88 82, 76-88 89, 84-94 82, 75-89
NPV (%, 95% CI) 98, 97-99 99, 98-100 99, 98-100 98, 97-99 98, 97-99 99, 98-100
Patient basis
Sens (%, 95% CI) 100 97, 91-100 98, 95-100 98,95-100 98, 95-100 100
Spec (%, 95% CI) 100 90, 71-100 86, 76-96 92, 81-100 92, 82-100 81,66-96
PPV (%, 95% CI) 100 97, 91-100 95,91-99 98,95-100 97, 93-100 92, 85-99
NPV (%, 95% CI) 100 90, 71-100 95,88-100 92, 81-100 96, 88-100 100
NPV: negative predictive value; PPV: positive predictive value; sens: sensitivity; spec: specificity.

125Do Risk Factors influence the Diagnostic Accuracy of MSCT?
Discussion
The results of the present study demonstrate the clinical value of MSCT in the assessment of patients
presenting with chest pain. In line with previous reported results, a sensitivity and specificity of re-
spectively 90% and 96% on a segmental level was observed in the entire study population. Similar to
other studies, the diagnostic accuracy of MSCT for the detection of significant CAD differed between
analyses on a patient and segmental level 10. Whereas specificity and negative predictive values were
high on a segmental based analysis (respectively 96% and 98%), these values tended to slightly de-
crease (86% and 96%) when analyzed on a patient basis. In contrast, sensitivity and positive predic-
tive value increased from 90% and 82% to 99% and 95%, respectively. To a large extent, this observa-
tion may be attributed to the high prevalence of CAD in the present population, which was 83% with
one in 4 patients having 3-vessel disease.
Table 5. Diagnostic accuracy of MSCT in patients with known versus suspected CAD.
Suspected CAD(n=122)
Known CAD (n=75)
Patient basis
Sens (%, 95% CI) 100 95, 88-100
Spec (%, 95% CI) 88, 73-100 85, 73-97
PPV (%, 95% CI) 98, 95-100 89, 80-98
NPV (%, 95% CI) 100 93, 84-100
Segmental basis
Sens (%, 95% CI) 89, 85-93 97, 93-100
Spec (%, 95% CI) 95, 94-96 99, 98-100
PPV (%, 95% CI) 79, 74-84 93, 88-98
NPV (%, 95% CI) 98, 97-99 100
NPV: negative predictive value; PPV: positive predictive value; sens: sensitivity; spec: specificity.
Gender
In the current study, no gender differences in diagnostic accuracy were observed. Particularly in
women, a non-invasive modality to visualize the coronary arteries may be of benefit, since obstruc-
tive CAD is less likely to be demonstrated than in age-matched men, despite the presence of symp-
toms 11. Indeed, no abnormalities are observed in almost half of all women referred for invasive coro-
nary angiography as compared to 17% in men 12. However, similar to previous studies using MSCT,
women contributed only to a small portion (13%) of the present study population. Clearly, larger
cohorts of women need to be studied in order to provide consistent evidence that the technique is
not limited in women.

126 Chapter 8
Known CAD, suspected CAD and risk factors
In addition, diagnostic accuracy was compared between patients with suspected and known CAD
(according to clinical presentation). Although the majority of studies involving the diagnostic ac-
curacy of MSCT have thus far been confined to predominantly populations with known CAD, the
use of the technique will eventually shift towards early evaluation of patients with an intermediate
likelihood of CAD. Thus, it is important to establish whether diagnostic accuracy is not affected by
knowledge of previous CAD. In the present study, a comparable diagnostic accuracy was observed
between patients with suspected and known CAD, suggesting that the MSCT can indeed be of value
for early diagnosis of CAD in patients presenting with first complaints or elevated risk profiles. In-
deed, these are precisely the patient populations in which MSCT will play an increasingly important
role in clinical management. Since in these patients, certain risk factors such as hypertension or type
2 diabetes mellitus are highly prevalent, it has become increasingly important to establish the influ-
ence of these clinical conditions on diagnostic performance. At present however only limited data
on the performance of MSCT in the presence of these risk factors for CAD are available. Thus far, two
studies have previously reported on the feasibility of MSCT in either patients with type 2 diabetes
mellitus 13 and hypertension 14. No effect of either risk factor on the diagnostic accuracy of MSCT
was demonstrated and reported sensitivity/specificity were 95%/95% and 93%/96% in respectively
patients with type 2 diabetes and patients with hypertension. However, only a limited number of
patients were included in both studies. Still, results were very similar to the present findings, which
further underline that the diagnostic accuracy of MSCT is not affected by the presence of risk factors.
A slightly higher percentage uninterpretable segments however, was in the present study observed
in patients with type 2 diabetes (2.7%) as compared to the entire study population (1%). To some
extent this phenomenon may be attributed to the more generalized diffuse atherosclerosis that is
known to be present in patients with type 2 diabetes, resulting in an increased incidence of (exten-
sive) calcifications, which in turn may affect image quality 15. Nevertheless, diagnostic accuracy was
not different in patients with type 2 diabetes.
Obesity is another risk factor that may influence image quality due to a decreased signal to noise
ratio in these patients. Indeed, the largest number of segments with low image quality was observed
in patients with a BMI over 30. The percentage of uninterpretable segments however, was similar to
the general study group, with no differences in diagnostic accuracy either. As expected, other risk
factors such as a positive family history for CAD, smoking and hypercholesterolemia, were found to
influence neither image quality nor diagnostic accuracy.
Stress-testing
Finally, results of MSCT were compared in a subset of patients to first-line stress-testing by means
of stress-electrocardiography. Although the observation of ischemia on stress-electrocardiography
and the presence of significant lesions on MSCT correlated well (90%), correlation between the ab-
sence of ischemia versus no significant lesions visible during anatomical testing was considerably

127Do Risk Factors influence the Diagnostic Accuracy of MSCT?
lower (46%). Obstructive CAD was identified in approximately half of patients with a normal stress-
ECG, with 4 patients having even left main or 3-vessel disease. Nonetheless, the majority of observed
lesions with normal stress-ECG may have represented stenoses without hemodynamic relevance.
Comparable findings were reported by Hacker et al, who compared MSCT to myocardial perfusion
scintigraphy (MPS) in 25 patients. Similarly, only 47% of lesions on MSCT were associated with isch-
emia during MPS 16. Thus, the presence of ischemia, as it appears to concern only a moderate portion
of significant lesions, cannot be predicted based on the findings obtained with MSCT. Accordingly,
functional testing remains essential in case of an abnormal MSCT examination to determine further
management (medical therapy versus revascularization).
Limitations
First, patients were evaluated with two different MSCT systems, while presently no data are avail-
able on the relative performance of systems of different manufacturers. Also, to what extent subtle
differences in image acquisition or evaluation protocols between both centers may have influenced
the results is unknown. Only patients with a high suspicion for CAD and thus referred for invasive
coronary angiography were included in the present study, and as a result the prevalence of CAD was
high (83%). Accordingly, validation of MSCT in the presence of coronary risk factors is still needed
in populations with a lower CAD prevalence, as these populations represent the target population
for non-invasive anatomical imaging. Finally, an important limitation is the fact that only segments
with a diameter of ≥ 2.0 mm were included, while also stented segments were excluded. With 4- and
16-slice MSCT, evaluation of segments with a small diameter still pose significant problems, which
is even worse in the presence of calcifications. Inclusion of segments <2.0 mm would likely have
resulted in reduced overall percentage interpretable segments as well as a lower diagnostic perfor-
mance. However, segments less than 2.0 mm can frequently not be surgically revascularized, and
were therefore not included in the present study.
In addition, MSCT has several disadvantages in general. First the radiation dose of a single MSCT ex-
amination still ranges between 8 to 12 mSv, which compares unfavorably to conventional coronary
angiography. Regarding clinical management, another important limitation exists, which is the fact
that no information on the hemodynamical importance of the observed lesions can be derived from
MSCT, as also observed in the present study. As a result, the implementation of MSCT may potential-
ly lead to an increased number of patients that are referred to conventional coronary angiography,
rather than the desired decrease in referral for angiography. Accordingly, the anatomical MSCT data
of patients with a positive examination should ideally be integrated with functional information in
order to determine clinical management more precisely.
Conclusion
These findings confirm the high diagnostic accuracy of MSCT, regardless of gender or risk factors.
Also, accuracy was comparable between patients with known and suspected CAD, suggesting that

128 Chapter 8
the technique may be of value in the early diagnosis of CAD. As both image quality and diagnostic
performance of the technique will continue to improve with the latest generation of 64-slice scan-
ners, cardiologists will become increasingly confident to use the technique as a first-line imaging
modality. Nevertheless, comparison between stress-testing and MSCT showed a considerable dis-
crepancy between functional and anatomical findings. Future research therefore should not merely
focus on the diagnostic accuracy of MSCT but rather on how to relate this new modality to other
available, first-line techniques in order to allow most optimal integration of MSCT in daily clinical
cardiology.

129Do Risk Factors influence the Diagnostic Accuracy of MSCT?
References 1. Achenbach S, Ulzheimer S, Baum U, Kachelriess M, Ropers D, Giesler T, Bautz W, Daniel WG, Kalender
WA, Moshage W. Noninvasive coronary angiography by retrospectively ECG-gated multislice spiral CT. Circulation. 2000;102:2823-2828.
2. Nieman K, Oudkerk M, Rensing BJ, van Ooijen P, Munne A, van Geuns RJ, de Feyter PJ. Coronary angi-ography with multi-slice computed tomography. Lancet. 2001;357:599-603.
3. Schuijf JD, Bax JJ, Shaw LJ, de Roos A, Lamb HJ, van der Wall EE, Wijns W. Meta-analysis of comparative diagnostic performance of magnetic resonance imaging and multislice computed tomography for noninvasive coronary angiography. Am Heart J. 2006;151:404-411.
4. Diagnosis and classification of diabetes mellitus. Diabetes Care. 2004;27 Suppl 1:S5-S10. 5. Grundy SM, Balady GJ, Criqui MH, Fletcher G, Greenland P, Hiratzka LF, Houston-Miller N, Kris-Etherton
P, Krumholz HM, LaRosa J, Ockene IS, Pearson TA, Reed J, Washington R, Smith SC, Jr. Primary preven-tion of coronary heart disease: guidance from Framingham: a statement for healthcare professionals from the AHA Task Force on Risk Reduction. American Heart Association. Circulation. 1998;97:1876-1887.
6. Grundy SM, Brewer HB, Jr., Cleeman JI, Smith SC, Jr., Lenfant C. Definition of metabolic syndrome: Report of the National Heart, Lung, and Blood Institute/American Heart Association conference on scientific issues related to definition. Circulation. 2004;109:433-438.
7. Levey AS, Beto JA, Coronado BE, Eknoyan G, Foley RN, Kasiske BL, Klag MJ, Mailloux LU, Manske CL, Meyer KB, Parfrey PS, Pfeffer MA, Wenger NK, Wilson PW, Wright JT, Jr. Controlling the epidemic of cardiovascular disease in chronic renal disease: what do we know? What do we need to learn? Where do we go from here? National Kidney Foundation Task Force on Cardiovascular Disease. Am J Kidney Dis. 1998;32:853-906.
8. Mollet NR, Cademartiri F, Nieman K, Saia F, Lemos PA, McFadden EP, Pattynama PM, Serruys PW, Krestin GP, de Feyter PJ. Multislice spiral computed tomography coronary angiography in patients with stable angina pectoris. J Am Coll Cardiol. 2004;43:2265-2270.
9. Schuijf JD, Bax JJ, Salm LP, Jukema JW, Lamb HJ, van der Wall EE, de Roos A. Noninvasive coronary im-aging and assessment of left ventricular function using 16-slice computed tomography. Am J Cardiol. 2005;95:571-574.
10. Hoffmann U, Moselewski F, Cury RC, Ferencik M, Jang IK, Diaz LJ, Abbara S, Brady TJ, Achenbach S. Pre-dictive value of 16-slice multidetector spiral computed tomography to detect significant obstructive coronary artery disease in patients at high risk for coronary artery disease: patient-versus segment-based analysis. Circulation. 2004;110:2638-2643.
11. Mieres JH, Shaw LJ, Arai A, Budoff MJ, Flamm SD, Hundley WG, Marwick TH, Mosca L, Patel AR, Qui-nones MA, Redberg RF, Taubert KA, Taylor AJ, Thomas GS, Wenger NK. Role of noninvasive testing in the clinical evaluation of women with suspected coronary artery disease: consensus statement from the Cardiac Imaging Committee, Council on Clinical Cardiology, and the Cardiovascular Imaging and Intervention Committee, Council on Cardiovascular Radiology and Intervention, American Heart As-sociation. Circulation. 2005;111:682-696.
12. Shaw LJ, Gibbons RJ, and McCallister B. Gender differences in extent and severity of coronary disease in the ACC-National Cardiovascular Data Registry. J Am Coll Cardiol 39, 321A. 2002.
13. Schuijf JD, Bax JJ, Jukema JW, Lamb HJ, Vliegen HW, Salm LP, de Roos A, van der Wall EE. Noninvasive angiography and assessment of left ventricular function using multislice computed tomography in patients with type 2 diabetes. Diabetes Care. 2004;27:2905-2910.
14. Schuijf JD, Bax JJ, Jukema JW, Lamb HJ, Vliegen HW, van der Wall EE, de Roos A. Noninvasive evaluation of the coronary arteries with multislice computed tomography in hypertensive patients. Hypertension. 2005;45:227-232.
15. Melidonis A, Dimopoulos V, Lempidakis E, Hatzissavas J, Kouvaras G, Stefanidis A, Foussas S. Angio-graphic study of coronary artery disease in diabetic patients in comparison with nondiabetic patients. Angiology. 1999;50:997-1006.
16. Hacker M, Jakobs T, Matthiesen F, Vollmar C, Nikolaou K, Becker C, Knez A, Pfluger T, Reiser M, Hahn K, Tiling R. Comparison of spiral multidetector CT angiography and myocardial perfusion imaging in the noninvasive detection of functionally relevant coronary artery lesions: first clinical experiences. J Nucl Med. 2005;46:1294-1300.


Defining Patient Populations
IIB
AfterRevascularization
Part II


Feasibility of Assessment of Stent Patency
using 16-Slice Computed Tomography
Am J Cardiol 2004; 94: 427-430
Joanne D. Schuijf, Jeroen J. Bax, J. Wouter Jukema, Hildo J. Lamb, Hazem M. A. Warda, Hubert W. Vliegen, Albert de Roos,
Ernst E. van der Wall
9Chapter

Abstract
Background
Intracoronary stent implantation is a frequently performed procedure in the treatment of ste-
noses in coronary arteries, although in-stent restenosis still occurs in approximately 20%. A
non-invasive diagnostic procedure to evaluate in-stent restenosis would therefore be of great
benefit. The purpose of this study was to demonstrate the feasibility of assessing stent patency
using 16-slice Computed Tomography.
Methods
In 22 patients with previously implanted stents, Multi-Slice Computed Tomography (MSCT)
was performed. For each stent, assessability was determined and related to stent type and
diameter. Subsequently, the presence of significant restenosis was determined in the evalu-
able stents. In addition, peri-stent lumina (5.00mm proximal and distal to the stent) were also
evaluated. Conventional angiography in combination with quantitative coronary angiogra-
phy (QCA) served as the standard of reference.
Results
MSCT was performed successfully in all but one patient. Of 65 stents, 50 (77%) were deter-
mined assessable. Uninterpretable stents tended to have a thicker strut thickness and/or a
smaller diameter. In the evaluable stents, 7 of 9 stenoses were detected and the absence of
restenosis was correctly identified in all 41 patent stents, resulting in a sensitivity and specific-
ity of 78% and 100%, respectively. Sensitivity and specificity for the detection of peri-stent
stenosis were 75% and 96%, respectively.
Conclusion
MSCT may be useful in the assessment of stent patency and may function as a gatekeeper
prior to invasive diagnostic procedures.

135Feasibility of Assessment of Stent Patency using 16-Slice Computed Tomography
Introduction
Although promising results have been obtained using Multi-Slice Computed Tomography (MSCT)
for the detection of coronary artery stenoses 1;2, imaging of metallic stents is technically difficult, and
not much data are available. Stent-related high-density artifacts lead to artificial narrowing of the
lumen, leaving only a small portion of the lumen visible 3;4. However, the recently introduced 16-slice
CT systems allow simultaneous acquisition of 16 submillimeter slices, which has lead to improved
spatial resolution. In combination with the increased temporal resolution due to faster rotation
times, stent assessability is thus likely to improve, which has already been demonstrated in vitro 5.
Recent advances in stent design are also likely to result in improved stent assessability. The purpose
of this study was to demonstrate the feasibility of assessing coronary stent patency using 16-slice
MSCT.
Methods
Patients and study protocol
The study group consisted of 22 consecutive patients who had previously undergone percutaneous
transluminal coronary angioplasty (PTCA) treatment in combination with stent placement. Exclusion
criteria were: 1). atrial fibrillation, 2). renal insufficiency (serum creatinine >120 mmol/L), 3). known
allergy to iodine contrast media, 4). severe claustrophobia, and 5). pregnancy. All patients under-
went a cardiac MSCT examination for the evaluation of stent patency. Conventional catheter-based
coronary angiography with QCA analysis was performed prior or after MSCT and served as reference
standard. All patients gave written informed consent to the study protocol, which was approved by
the local ethics committee.
Data acquisition
Cardiac MSCT was performed on a Toshiba Multi-slice Aquilion 16 system (Toshiba Medical Systems,
Tokyo, Japan) with a collimation of 16 x 0.5 mm and a rotation time of 0.4 or 0.5 s, depending on the
heart rate. The tube current was 250 mA, at 120 kV. Non-ionic contrast material was administered in
the antecubital vein with an amount of 120-150 ml, depending on the total scan time, and a flow rate
of 4.0 ml/sec (Xenetix 300®, Guerbet, Aulnay S. Bois, France). Automated peak enhancement detec-
tion in the aortic root was used for timing of the bolus. Images were acquired during inspiratory
breath hold preceded by mild hyperventilation. During the CT examination, the electrocardiogram
was recorded simultaneously for retrospective gating of the data. With the aid of a segmental recon-
struction algorithm, data of 2 or 3 consecutive heartbeats were used to generate a single image.
To evaluate the coronary arteries, 5 separate reconstructions covering diastole (65% - 85%) were ob-
tained with an effective slice thickness of 0.5 mm and a reconstruction interval of 0.4 mm. If motion

136 Chapter 9
artifacts were present in one of the coronary arteries, additional reconstructions were made at 40%,
45% and 50% of the cardiac cycle. Images were transferred to a remote workstation (Vitrea2, Vital
Images, Plymouth, Minn. USA) for post-processing. For each individual coronary artery, the data set
containing no or minimal motion artifacts were used for further evaluation.
Conventional X-ray coronary angiography was performed according to standard techniques. Vas-
cular access was obtained using the femoral approach with the Seldinger technique and a 6- or 7-
French catheter.
Data analysis
For the assessment of coronary stents, both the original axial CT images and curved multiplanar
reconstructions were evaluated by an experienced observer blinded to the catheterization results.
First, each stent was assigned an image quality score of: 1 (poor image quality or uninterpretable),
2 (adequate image quality) or 3 (good image quality). Subsequently, the presence of significant
restenosis (≥50% reduction of lumen diameter) was assessed in the evaluable stents. A stent was
considered patent if both distal run-off was present and contrast medium could be detected within
the stent. In case of doubt, cross-sections were also taken into account. In addition, the presence of
peri-stent stenosis, ≥50% or ≥70% narrowing of luminal diameter 5.00 mm proximal and distal to the
stent, or, in case of overlapping stents, the stented segment, was evaluated.
Conventional angiograms were evaluated by an experienced observer without knowledge of the
MSCT data. Subsequently QCA was performed of both the stent or stented vessel and their proximal
and distal lumina according to a standard algorithm (QCA-CMS version 5.2, Medis, Leiden, The Neth-
erlands) 6.
Statistical analysis
To relate stent assessability to stent type, stents were divided in either large (>3.00 mm) or small
(≤3.00 mm) diameter stents and stents with either thick (≥140 μm) struts or thin (<140 μm) struts.
Subsequently, percentage assessable stents and average image quality were calculated for each
category. Sensitivity and specificity for the detection of restenosis ≥50%, as determined by visual in-
spection of conventional angiograms, were determined for each stent and stented coronary artery.
A separate analysis was performed per vessel, since in several patients (partially) overlapping stents
or even completely stented vessels were present, thus hampering individual assessment. A stented
vessel was considered assessable, when at least one stented segment was interpretable. Stented
side-branches were also included in the analysis. In addition, sensitivity and specificity were also
determined for the detection of significant (≥50%) or high-grade (≥70%) narrowing of the peri-stent
lumina (5.00 mm proximal and distal to the stent). For this analysis, QCA served as the standard of
reference.

137Feasibility of Assessment of Stent Patency using 16-Slice Computed Tomography
Results
Clinical characteristics of the study group
Twenty-two patients (20 men, aged 63 ± 7 years), with a total of 68 stents (1 to 9 stents per patient,
average 3 ± 2.8), scheduled for invasive coronary angiography, were investigated. The average in-
terval between MSCT and conventional angiography was 3 ± 2 days. All patients had previously un-
dergone PTCA with stent implantation. Seventeen patients (77%) were on continuous beta-blocker
medication, and no additional beta-blockers were administered. The patient characteristics are sum-
marized in Table 1.
Table 1. Clinical characteristics of the study population (n=22).
n (%)Male/Female 20/2 Age (years) 62 ± 7 Heart Rate (bpm) 65 ± 11Single vessel coronary disease 4 (18%)Multi-vessel coronary disease 18 (82%)Previous myocardial infarction 14 (64%)Previous coronary angioplasty 22 (100%) Previous Coronary Bypass Grafting 3 (14%)Beta-Blocker 17 (77%)Angina Pectoris CCS class 1/2 4 (18%) CCS class 3/4 18 (82%)Heart Failure NYHA class 1/2 18 (82%) NYHA class 3/4 4 (18%)Stent location Left Main 1 (1%) Left Anterior Descending 28 (41%) Left Circumflex 5 (7%) Right Coronary Artery 28 (41%) Saphenous Vein Graft 6 (9%)
Values are n (%).CCS: Canadian Cardiovascular Society; NYHA: New York Heart Association;

138 Chapter 9
Stent characteristics
A total of 68 stents was studied, of which 23 implanted more than one month before and 6 placed in
coronary bypass grafts. On average, MSCT was performed 14 ± 26 months (range 0 – 2469 days) after
stent implantation. Diameter of implanted stents ranged from 2.25 to 5.0 mm. Fourteen different
stent types were present: Ave (S660 and S670, Medtronic) 11, Driver (Medtronic) 4, Wiktor Hepa-
med (Medtronic) 2, Ultra (Guidant) 3, Zeta (Guidant) 9, Penta (Guidant) 1, Tristar (Guidant) 4, Achieve
(Guidant) 2, Orbus (Orbus technologies) 3, R-stent (Orbus technologies) 2, Cypher (Cordis) 23, Bx
Velocity (Cordis) 2, Bx Sonic (Cordis) 1, and Express (Boston Scientific) 1.
MSCT
MSCT was performed successfully in all but one patient. In this patient, the electrocardiographical
signal was lost during data acquisition and this patient was therefore excluded from analysis.
Of the remaining 65 stents, 50 (77%) were of sufficient quality to assess patency. Reasons of unin-
terpretability were motion artifacts, metal artifacts, small size of the stent, severe calcifications or
a combination of the above. Average image quality score was 2.7 ± 0.7 for stents with a diameter
Figure 1. Example of a curved multiplanar reconstruction of an uninterpretable stent placed in the distal left circumflex. Due to high-density artifacts of the thick struts of the stent, the lumen is obscured in a large part of the stent, rendering it uninterpretable.

139Feasibility of Assessment of Stent Patency using 16-Slice Computed Tomography
>3.0 mm, in contrast to an average of 2.2 ± 0.9 for stents with a diameter ≤3.0 mm. Of the stents with
a thick strut thickness (≥140 μm), 11 (41%) were uninterpretable, whereas 34 (89%) of stents with
thin struts were assessable. Figure 1 shows an example of an uninterpretable stent with a thick strut
thickness.
Restenosis (≥50% of lumen diameter reduction) was correctly ruled out in 41 stents (Figure 2). MSCT
identified 7 stents with restenosis correctly. However, in 2 stents, distal to occluded stents, the pres-
ence of restenosis was not observed on MSCT. Accordingly, the sensitivity and specificity for the
assessment of patent/stenotic stents were 78% and 100%, respectively. When the uninterpretable
stents were included in the analysis, the overall sensitivity remained 78%, whereas the specificity
decreased to 73%. Details are summarized in Table 2.
Table 2. Individual stent analysis.
n (%)Total stents 65Assessable 50 (77%)Sensitivity 7/9 (78%)Specificity 41/41 (100%)
Uninterpretable stents 15 diameter ≤ 3.0 mm 13 diameter > 3.0 mm 2 strut thickness < 140 μm 4 strut thickness ≥ 140 μm 11
Interpretable stents 50 diameter ≤ 3.0 mm 33 diameter > 3.0 mm 17 strut thickness <140 μm 34 strut thickness ≥ 140 μm 16
In 8 patients, overlapping stents or even completely stented vessels were present, thus hampering
individual stent assessment. Therefore, analysis was also performed per coronary artery or side-
branch individually (Table 3). In 4 patients, one or more coronary arteries were uninterpretable. Thus,
29 stented vessels (81%) were available for evaluation. Significant in-stent restenosis (≥50%) was
correctly detected in 3 vessels (1 left anterior descending and 2 right coronary arteries). Absence of
restenosis was correctly identified in the remaining 26 patent coronary arteries. Therefore, on a per
patient basis, the presence or absence of significant in-stent restenosis was correctly identified in all
patients.

140 Chapter 9
Figure 2. Example of a patent stent in the left anterior descending. In panel A, a curved multiplanar recontruc-tion is shown, which reveals a patent stent, as also evidenced by the distal run-off. Also in panel B, a three-di-mensional volume rendered reconstruction, distal run-off is clearly present. Findings were confirmed by conven-tional angiography (panel C).
In 2 patients, both the left anterior descending and the diagonal branch were stented, resulting in
only one proximal stent lumen and two distal stent lumina. In 6 other stented arteries, both the prox-
imal and distal lumina were uninterpretable and in one patient, only the proximal part of a stent,
placed in the distal left circumflex, could be evaluated. Therefore, 57 of 70 peri-stent lumina were
available for evaluation. Narrowing of ≥50% (as determined by QCA) of the peri-stent lumen was
correctly ruled out in 51 of 53 peri-stent lumina and 3 of 4 significant narrowings were also found on
the MSCT images. One of these significant narrowings, however, was underestimated by MSCT, and
when the threshold was increased to high-grade stenosis (≥70%), sensitivity decreased therefore to
50%. Specificity, however, increased from 96% to 100%.

141Feasibility of Assessment of Stent Patency using 16-Slice Computed Tomography
Table 3. Diagnostic accuracy to detect significant in-stent or peri-stent restenosis (per vessel analysis).
All branches Left Main Left Anterior
Descending
Left
Circumflex
Right
Coronary
Artery
Saphenous
Vein Graft
Stents
(≥50%)
Peristent
(≥50%)
(≥70%)
Total
Assessable
Sensitivity
Specificity
Total
Assessable
Sensitivity
Specificity
Sensitivity
Specificity
36
29 (81%)
3/3 (100%)
26/26 (100%)
70
57 (81%)
3/4 (75%)
51/53 (96%)
2/4 (50%)
53/53 (100%)
1
1 (100%)
-
1/1 (100%)
2
2 (100%)
-
2/2 (100%)
-
2/2 (100%)
15
12 (80%)
1/1 (100%)
11/11 (100%)
28
22 (79%)
0/1 (0%)
20/21 (95%)
0/1 (0%)
21/21 (100%)
5
3 (60%)
-
3/3 (100%)
10
7 (70%)
-
7/7 (100%)
-
7/7 (100%)
13
11 (85%)
2/2 (100%)
9/9 (100%)
26
22 (85%)
2/2 (100%)
19/20 (95%)
2/2 (100%)
20/20 (100%)
2
2 (100%)
-
2/2 (100%)
4
4 (100%)
1/1 (100%)
3/3 (100%)
0/1 (0%)
3/3 (100%)
Values are n (%) and include side-branches.
Discussion
The purpose of this study was to demonstrate the feasibility of stent patency assessment using 16-
slice MSCT. A total of 65 stents was evaluated, of which 50 (77%) were of sufficient image quality to
assess patency. As expected, stents with thicker struts were found to be more prone to high-density
artifacts (and thus decreased assessability) than stents with a thin strut thickness. The effect of di-
ameter on assessability was even more pronounced: 13 out of 15 (87%) uninterpretable stents had
a diameter ≤ 3.0 mm. Stents with a large diameter are more likely to be evaluable since a sufficient
portion of the stent lumen will remain visible despite artificial narrowing.
In the evaluable stents, we demonstrated a good sensitivity and specificity for the detection of sig-
nificant in-stent stenosis. Furthermore, the presence or absence of significant in-stent stenosis was
correctly identified in all patients. Therefore, our results indicate that, although detection of subtle
in-stent hyperplasia remains impossible, qualitative assessment of coronary stents is feasible using
16-slice MSCT. In particular, the presence of contrast enhancement of the vessel distal to the stent
is a potent sign of patency, while the near absence of distal run-off almost certainly indicates severe
stenosis or total stent occlusion.
An important limitation of the present study is that similar to previous studies concerning the as-
sessment of stent patency, only a small number of patients (14%) with significant in-stent restenosis
was present. Therefore, our data concerning the sensitivity for detecting in-stent restenosis have to

142 Chapter 9
be interpreted with care and more data are needed to precisely determine the sensitivity of MSCT in
the detection of in-stent restenosis. Still, as evidenced by the high specificity, the current data sug-
gest that 16-slice MSCT may be useful in the assessment of stent patency, especially in patients with
large diameter stents. Since a substantial amount of all coronary angiograms are not followed by an
intervention, MSCT could play an important role in excluding in-stent restenosis and thus function
as a gatekeeper prior to invasive diagnostic procedures.

143Feasibility of Assessment of Stent Patency using 16-Slice Computed Tomography
References 1. Achenbach S, Giesler T, Ropers D, Ulzheimer S, Derlien H, Schulte C, Wenkel E, Moshage W, Bautz
W, Daniel WG, Kalender WA, Baum U. Detection of coronary artery stenoses by contrast-enhanced, retrospectively electrocardiographically-gated, multislice spiral computed tomography. Circulation. 2001;103:2535-2538.
2. Nieman K, Rensing BJ, van Geuns RJ, Munne A, Ligthart JM, Pattynama PM, Krestin GP, Serruys PW, de Feyter PJ. Usefulness of multislice computed tomography for detecting obstructive coronary artery disease. Am J Cardiol. 2002;89:913-918.
3. Kruger S, Mahnken AH, Sinha AM, Borghans A, Dedden K, Hoffmann R, Hanrath P. Multislice spiral computed tomography for the detection of coronary stent restenosis and patency. Int J Cardiol. 2003;89:167-172.
4. Maintz D, Grude M, Fallenberg EM, Heindel W, Fischbach R. Assessment of coronary arterial stents by multislice-CT angiography. Acta Radiol. 2003;44:597-603.
5. Maintz D, Seifarth H, Flohr T, Kramer S, Wichter T, Heindel W, Fischbach R. Improved coronary artery stent visualization and in-stent stenosis detection using 16-slice computed-tomography and dedi-cated image reconstruction technique. Invest Radiol. 2003;38:790-795.
6. Reiber JH, Serruys PW, Kooijman CJ, Wijns W, Slager CJ, Gerbrands JJ, Schuurbiers JC, den Boer A, Hugenholtz PG. Assessment of short-, medium-, and long-term variations in arterial dimensions from computer-assisted quantitation of coronary cineangiograms. Circulation. 1985;71:280-288.


Usefulness of 64-slice Multi-Slice Computed
Tomography Coronary Angiography
to assess In-stent Restenosis
J Am Coll Cardiol 2007; 49: 2204-2210
Joanne D. Schuijf, Filippo Cademartiri, Francesca Pugliese, Nico R. Mollet, J. Wouter Jukema, Erica Maffei, Lucia J. Kroft, Alessandro Palumbo,
Diego Ardissino, Patrick W. Serruys, Gabriel P. Krestin, Ernst E. Van der Wall, Pim J. de Feyter, Jeroen J. Bax
10Chapter

Abstract
Background
Recent investigations have shown increased image quality and diagnostic accuracy for non-in-
vasive coronary angiography with 64-slice multi-slice computed tomography (64-slice MSCT)
as compared to previous generations MSCT scanners, but data on the evaluation of coronary
stents are scarce. The purpose of the present study was to evaluate the diagnostic accuracy of
64-slice MSCT coronary angiography in the follow-up of patients with previous coronary stent
implantation.
Methods
In 182 patients (152 (84%) males, aged 58 ± 11 years) with previous stent (≥2.5mm diameter)
implantation (n=192), 64-slice MSCT angiography using either a Sensation 64 (Siemens, Ger-
many) or Aquilion 64 (Toshiba, Japan) was performed. At each center, coronary stents were
evaluated by two experienced observers and evaluated for the presence of significant (≥50%)
in-stent restenosis. Quantitative coronary angiography served as the standard of reference.
Results
A total of 14 (7.3%) stented segments were excluded because of poor image quality. In the in-
terpretable stents, 20 of the 178 (11.2%) evaluated stents were significantly diseased, of which
19 were correctly detected by 64-slice MSCT. Accordingly, sensitivity, specificity and positive
and negative predictive value to identify in-stent restenosis in interpretable stents were 95.0%
(CI: 85% to 100%), 93.0% (CI: 90% to 97%), 63.3% (CI: 46% to 81%), and 99.3% (CI: 98% to 100%),
respectively.
Conclusion
In-stent restenosis can be evaluated with 64-slice MSCT with good diagnostic accuracy. In par-
ticular a high negative predictive value of 99% was observed, indicating that 64-slice MSCT
may be most valuable as a non-invasive method to exclude in-stent restenosis.

147Usefulness of 64-slice Multi-Slice Computed Tomography Coronary Angiography to assess In-stent Restenosis
Introduction
Stent-implantation is increasingly performed in the treatment of significant coronary artery disease
(CAD) and has significantly reduced the occurrence of restenosis as compared to balloon angioplas-
ty 1;2. Moreover, with the recent introduction of drug-eluting stents (DES), the occurrence of in-stent
restenosis has further decreased 3-5. Nonetheless, a subset of patients still presents with recurrent
chest pain with possible in-stent restenosis and frequently evaluation with invasive coronary angi-
ography is required.
A non-invasive alternative approach to evaluate these patients may be offered by 64-slice Multi-
Slice Computed Tomography (MSCT). In native coronary arteries, sensitivities and specificities of
approximately 90% and 96% 6-9 for detection of CAD have been reported, with a substantial gain in
diagnostic accuracy over 4- and 16-slice MSCT. Also the evaluation of coronary stents, which posed
still considerable problems with 4- and 16-slice MSCT 10, may have improved with 64-slice MSCT.
However, few data are currently available and the routine use of MSCT in patients with a history
of stent implantation is at present not recommended 11;12. The purpose of the present study was to
evaluate the diagnostic performance of 64-slice MSCT to identify in-stent restenosis (and occlusion)
in comparison to the gold standard, invasive coronary angiography.
Methods
Study population
The study population consisted of 182 patients who were referred for invasive coronary angiogra-
phy after previous coronary stent (≥2.5 mm diameter) implantation. Referral of patients for invasive
coronary angiography was partially part of an ongoing protocol and partially routine (based on the
presence of symptoms, abnormal exercise ECG and/or ischemia on myocardial perfusion imaging).
In addition to invasive coronary angiography, 64-slice MSCT was performed. Exclusion criteria were
the following: 1) atrial fibrillation, 2) renal insufficiency (serum creatinine >120 mmol/L), 3) known
allergy to iodine contrast media, 4) pregnancy and 5) coronary stent diameter <2.5 mm. The study
was approved by the ethical committee of the different centers, and all participating patients gave
informed consent.
Scan protocol and image reconstruction
MSCT angiography was performed with 2 different 64-slice MSCT scanners (Sensation 64®, Siemens,
Germany, n=150, and Aquilion 64, Toshiba Medical Systems, Japan, n=32). Thirty-four patients
(19%) had a pre-scan heart rate ≥65 beats per minute, and were given a single oral dose of 100 mg
metoprolol one hour before the examination in the absence of contraindications. A bolus of 100 ml
iomeprol (400 mgI/ml; Iomeron®, Bracco) was intravenously injected (4-5 ml/s) followed by 50 ml of

148 Chapter 10
saline at the same rate using a double-head injector (Stellant, MedRAD, Pittsburgh, USA). To trigger
the start of the scan a real-time bolus tracking technique was used 13. During the scan which was per-
formed during an inspiratory breath hold of 8 s to 12 s the MSCT data and ECG trace were acquired.
Scan parameters were (for Siemens and Toshiba, respectively): individual detector collimation 32 x 2
x 0.6 mm and 64 x 0.5 mm, tube voltage 120 kV for both, mAs 900 and 712, gantry rotation time 330
ms and 400 ms. No ECG-pulsing was used.
Reconstruction parameters (for Siemens and Toshiba, respectively): effective slice width 0.75 mm and
0.5 mm, increment 0.4 mm and 0.3 mm, standard and sharp heart view convolution filters for both.
For Siemens, B30f and B46f were used, whereas for Toshiba, Q04 was used in addition to Q05-Q07.
Synchronized to the recorded ECG, axial slices were reconstructed from the acquired MSCT data with
the use of segmented or half reconstruction algorithms.
Image data sets were reconstructed during the mid-to-end diastolic phase, during which coronary
artery displacement is relatively small, with reconstruction window positions starting at 400 ms
before the next R wave and/or at 75% of the R-to-R interval. If indicated, additional temporal win-
dow positions were explored including the end-systolic phase to obtain images with least motion
artefacts.
MSCT image interpretation
At each center two observers, both blinded to angiographic and clinical findings but aware of pre-
vious cardiac history, evaluated the MSCT examinations using axial slices, multiplanar and curved
reconstructions. Of note, different window settings, including 1500/300 HU were used for optimal
stent assessment.
A stent was judged to be occluded when the lumen inside the stent was darker than the contrast-
enhanced vessel before the stent and/or when no run-off could be visualised at the distal end of the
stent 14;15.
Non-occlusive in-stent re-stenosis was considered when the lumen inside the stent showed a darker
rim (eccentric or concentric) between the stent and the enhanced vessel lumen with a lumen re-
duction ≥50% (as compared to other portions of the stent). In addition, the presence of reduced
run-off distal to the stent was taken into consideration; if reduced distal run-off was observed, this
was found to be suggestive of in-stent restenosis. Importantly, the presence of distal run-off was not
used as a criterium for the absence of significant in-stent restenosis, since collateral filling may occur
(which cannot be detected adequately by MSCT). In Figures 1, 2 and 3, examples are provided of
patent and diseased stents.

149Usefulness of 64-slice Multi-Slice Computed Tomography Coronary Angiography to assess In-stent Restenosis
Figure 1. Example of a patent stent.Conventional coronary angiography (Panel A) demonstrated patency of a stent (Cypher, 3.0 x 18 mm) placed in the left circumflex coronary artery. In Panels B and C two orthogonal curved multiplanar reconstructions obtained with 64-slice MSCT (Siemens Sensation, kernel B46f ) are provided, also demonstrating patency of the stent.
Invasive coronary angiography
Conventional selective coronary angiography was performed with standard techniques and evaluated
by a reviewer blinded to the MSCT results with the use of quantitative coronary angiography systems
(CAAS II, Pie Medical, Maastricht, The Netherlands or QCA-CMS version 6.0, Medis, Leiden, The Neth-
erlands). The diameter stenosis, as a percentage of the reference diameter, was determined in two or-
thogonal directions and the average between these two values determined the stenosis severity.
Statistical analysis
Sensitivity, specificity, positive and negative predictive values (including 95% confidence intervals (CI))
for the detection of in-stent restenosis ≥50% using conventional angiography in combination with
QCA as the gold standard, were calculated. All statistical analyses were performed using SPSS software
(version 12.0, SPSS Inc, Chicago, Il, USA). A value of P<0.05 was considered statistically significant.
Results
Patient characteristics
In total, 182 patients (152 males, aged 57.8 ± 10.6 years) with a total of 192 coronary stents were
enrolled in the study. A total of 4 patients were not enrolled due to the presence of stents with a
diameter <2.5 mm. Also, 5 patients were not studied due to a high heart rate in combination with
beta-blocker intolerance. Baseline characteristics of the study population are provided in Table 1.

150 Chapter 10
The average time interval between stent implantation and 64-slice MSCT coronary angiography was
6.2 ± 1.6 months; 64-slice MSCT and conventional angiography were performed within 1 month of
each other (average 9 ± 8 days); MSCT was always performed first. The site of stent implantation was:
right coronary artery (RCA) in 55 (28.6%), left main coronary (LM) in 11 (5.7%), left anterior descend-
ing (LAD) in 113 (58.9%), and left circumflex (LCx) in 13 (6.8%). Average stent diameter was 3.1 ± 0.4
mm (range 2.5 mm to 4.5 mm), whereas stent length ranged from 8.0 mm to 33 mm (average 18 ±
7 mm). Eight different stent types were evaluated, the non-DES stents being Vision (Guidant), Driver
(Medtronic), Ave S7 (Medtronic), Orbus (Orbus technologies), Bx Velocity (Cordis), and Liberté (Bos-
ton Scientific). Included DES-stents were Cypher (Cordis) and Taxus (Boston Scientific). Average heart
rate during MSCT data acquisition was 60 ± 7.9 beats per minute.
Table 1. Demographic and angiographic characteristics of patients (n=182).
n (%)Age (yrs) 57.8±10.6Males 152, 84%Previous myocardial infarction 94, 52%Previous PCI 182, 100%Body mass index (kg/m2) 28.8 ± 3.8Diabetes mellitus type II 23, 13%Hypercholesterolemia 64, 35%Hypertension 57, 31%Family history of CAD 88, 48%Current smoking 110, 60%Angiography 1-vessel disease 134, 72.5% 2-vessel disease 34, 18.7% 3-vessel disease 16, 8.8%Stent location RCA 55, 28.6%
LM 11, 5.7%LAD 113, 58.9%LCx 13, 6.8%
Abbreviations: CAD: coronary artery disease; LAD: left anterior descending coronary artery, LCx: left circumflex coro-nary artery; LM: left main coronary artery; PCI: percutaneous coronary intervention.
Coronary stent analysis
In total, 178 stents were available for evaluation while 14 stents (7.3%) were considered uninterpre-
table due to residual motion and high-density artefacts (Table 2). No significant differences were
observed in interpretability between the different stent diameters; 3 (5.8%) of 52 stents with a diam-
eter <3.0 mm were uninterpretable, whereas 7 (10%) of 70 and 4 (5.7%) of 70 stents with diameter of
respectively 3.0 mm or >3.0 mm were uninterpretable (Table 3).

151Usefulness of 64-slice Multi-Slice Computed Tomography Coronary Angiography to assess In-stent Restenosis
The incidence of significant in-stent restenosis (non-occlusive in-stent restenosis and total stent oc-
clusions) was 11.2% (20/178), as determined by conventional angiography. Examples of patent as
well as stents with significant in-stent restenosis are provided in Figures 1, 2, and 3, respectively.
Figure 2. Example of in-stent restenosis.Conventional coronary angiography (Panel A) revealed in-stent restenosis in a stent (Taxus, 2.5 x 20 mm) placed in the second marginal branch of the left circumflex coronary artery (arrowhead). In Panel B, a curved multipla-nar reconstruction obtained with 64-slice MSCT (Siemens Sensation, kernel B46f ) is provided. In the proximal part of the stent (arrowhead), a hypodense area can be observed, indicating the presence of in-stent restenosis.
All 7 stent occlusions were correctly identified by 64-slice MSCT, whereas 1 stent (located in the sec-
ond diagonal) of 13 stents with significant but non-occlusive in-stent restenosis remained undetect-
ed by MSCT. Of the 158 stents without significant in-stent restenosis, 147 were correctly evaluated
by 64-slice MSCT, whereas 11 stents were incorrectly considered positive. Accordingly, the overall
sensitivity, specificity, positive and negative predictive value to detect significant in-stent restenosis
were 95.0% (19/20, CI: 85% to 100%), 93.0% (147/158, CI: 90% to 97%), 63.3% (19/30, CI: 46% to 81%),
and 99.3% (147/148, CI: 98% to 100%), respectively. More detailed information is depicted in Table
2. In stents without significant stenosis on conventional angiography, average percentage stenosis
as determined by QCA was significantly higher in stents falsely classified positive on MSCT as com-
pared to stents correctly classified negative (36% versus 25%, P<0.05). Similarly, average percentage
stenosis was lower in stents false negative on MSCT as compared to correct positive stents (65%
versus 73%, P=NS).
In a subanalysis, the rate of false diagnosis was evaluated according to stent diameter. In stents with a
diameter <3.0 mm, 3 (6.1%) of 49 stents were incorrectly diagnosed. For stents with a diameter of 3.0
mm, this percentage was 1.6% (1 of 63), while in stents with a diameter >3.0 mm incorrect diagnosis
was obtained with MSCT in 8 of 66 (12.0%). More details on the rate of false positives and negatives

152 Chapter 10
are provided in Table 3. In Table 4, the results from the 2 scanners from the 2 centers are reported
separately. At the Leiden center, relatively more stents were deemed uninterpretable as compared
to the Rotterdam center (14.3% versus 5.3%, P=NS). Diagnostic accuracy was slightly lower in the
Rotterdam center (91.5% versus 100%, P<0.05). However, when all stents (including the uninterpre-
table stents) were included in the analysis, no significant differences were observed.
Table 2. Diagnostic accuracy of 64-slice MSCT to detect significant in-stent restenosis.
≥ 50% in-stent restenosisAssessable 178/192 (92.7%, 89% to 97% )With uninterpretable stents excludedSensitivitySpecificityPositive predictive valueNegative predictive value
19/20 (95.0%, 85% to 100%)147/158 (93.0%, 90% to 97%)19/30 (63.3%, 46% to 81% )
147/148 (99.3%, 98% to 100%)
With uninterpretable stents includedSensitivitySpecificityPositive predictive valueNegative predictive value
19/21 (90.5%, 78% to 100%)147/171 (86.0%, 81% to 92%)
19/43 (44.2%, 29% to 59%)147/149 (98.7%, 97% to 100%)
Values are segments (%, 95% CI).
Discussion
In the present study, a sensitivity and specificity of respectively 95% and 93% were observed for the
non-invasive detection of coronary in-stent restenosis. In addition, a negative predictive value of
99% was observed, suggesting that 64-slice MSCT may allow reliable exclusion of in-stent restenosis
prior to more invasive procedures such as conventional coronary angiography.
During MSCT imaging, visualization of stents is particularly challenging because of the metallic
struts resulting in “blooming artefacts” 16. Accordingly, the stent wall appears enlarged on the MSCT
images, which in turn affects the capability to visualize the in-stent lumen. The extent of this artefact
depends on the material and design of the stent with more severe artefacts in stents with high metal
content. While this effect is of minor or no importance in large vessels, such as the aorta and its ab-
dominal branches, it can considerably impair the visualization of the lumen in smaller vessels such as
the coronary arteries 16.
Not surprisingly therefore, visualization of stent lumen could not be achieved in preliminary investi-
gations using 4-slice MSCT scanners 10. In a more recent report 16-slice MSCT was applied, resulting
in a sensitivity and specificity of 78% and 100% 15. Nonetheless, 15 (23%) of the 65 included stents
were uninterpretable, indicating still a limited value for MSCT coronary angiography in populations
with previous stent implantation 15. More detailed analysis of these 15 uninterpretable stents re-
vealed that stent assessability appears to be highly dependent on stent type and size in particular.
These observations were further underlined by Gilard and colleagues 17 who showed in 143 patients

153Usefulness of 64-slice Multi-Slice Computed Tomography Coronary Angiography to assess In-stent Restenosis
undergoing 16-slice MSCT, an increase of stent interpretability from 51% for stents ≤ 3.0 mm to
81% when only stents >3.0 mm were included. More recently, data on stent evaluation using more
advanced MSCT technology were reported by Gaspar et al 18, who evaluated 65 patients with 111
implanted coronary stents using 40-slice MSCT. A considerable improvement in image quality was
witnessed in this study, since only a small number of stents (n=5, 5%) were of non-diagnostic image
quality. Considering these 5 stents as having restenosis, the authors reported a sensitivity and speci-
ficity for detection of in-stent restenosis of 89% and 81% respectively.
Figure 3. Example of high-grade in-stent restenosis.In Panel A, a conventional coronary angiogram is provided demonstrating the presence of high-grade in-stent restenosis in the proximal part of a stent (Taxus, 3.0 x 24 mm) placed in the left anterior descending coronary artery (arrowhead). Also Panel B, a curved multiplanar reconstruction obtained with 64-slice MSCT (Siemens Sensation, kernel B46f ), shows the presence of a large obstructing hypodense lesion in the proximal part of the stent (arrowhead), indicating the presence of high-grade in-stent restenosis.
These observations are further underlined by the first ex vivo reports on stent evaluation with 64-
slice MSCT, suggesting further improvement in stent visibility as well a reduction of artificial lumen
narrowing as compared to 16-slice MSCT 19;20. Also in vivo promising results were reported using 64-
slice MSCT by Rist et al, who could evaluate 45 (98%) of 46 stents with a sensitivity and specificity of
75% and 92%, respectively 21. Nonetheless, somewhat discouraging results were recently reported
by Rixe et al 22, who performed 64-slice MSCT in 64 patients with 102 previously implanted stents.
Similar to our study, 64-slice MSCT was shown to be highly accurate with reported sensitivity and
specificity of 86% and 98%, respectively. However, evaluation could be performed in only 58% of
stents, indicating a major limitation of the current technique. In contrast, only 7% of stents were
deemed uninterpretable in our present study. To a large extent this discordance may be due to dif-
ferences in image interpretation. In our present study evaluation was performed with the intention
to diagnose in order to allow generalization of results as much as possible to daily clinical routine.
Thus, only stents with severely degraded image quality were excluded. In contrast, a more stringent

154 Chapter 10
approach was performed by Rixe et al, and in their study, stents were deemed uninterpretable in the
presence of any artifact, albeit small. Importantly, both in their study as well as ours, a high negative
predictive value was obtained (98% and 99%, respectively), implying a potential role for MSCT to
exclude in-stent restenosis in patients presenting with chest pain after stent implantation.
Table 3. Relationship between stent size and accuracy.
Stent diameter
<3.0 mm 3.0 mm >3.0 mm
Assessable
False positive
False negative
49/52 (94.2%, 88% to 100%)
2/49 (4.1%, 0% to 9.7%)
1/49 (2.0%, 0% to 5.9%)
63/70 (90.0%, 83% to 97%)
1/63 (1.6%, 0% to 4.7%)
0/63 (0%, NA)
66/70 (94.3%, 89% to 100%)
8/66 (12%, 4.2% to 19.8%)
0/66 (0%, NA)
Values are segments (%, 95% CI).NA: not applicable.
Limitations
Several limitations should be addressed. First, only patients having stents with a diameter ≥2.5 mm
were included, whereas stents <2.5 mm, which may be encountered in 3% to 5% of patients with
previous stent placement, were excluded, as at present, they cannot be accurately evaluated with
MSCT. Accordingly, the results obtained in the present study may not be generalizable to other pop-
ulation with different stent characteristics.
Second, as previously reported with MSCT coronary angiography, only patients with stable and low
heart rates were included in this study and a high percentage received additional β-blockers to fur-
ther reduce heart rate. Accordingly, the results of the present study may not apply to the general
population, as in addition to patients with smaller stents, also patients with atrial fibrillation and
contra-indications to β-blocking medication were not studied. Third, in-stent restenosis was only
present in a small number of stents (11%). However, the findings reflect the current clinical situation,
with low in-stent restenosis rates 3-5. In addition, data acquisition was performed in 2 different cen-
ters using 2 different 64-slice MSCT systems which may have influenced the results. Also, no data on
interobserver variability were available. Finally, several disadvantages are inherent to the technique
itself, including the high radiation exposure (15 to 20 mSv) 23;24 and use of iodinated contrast which
remain a matter of concern for routine use of this technique. Also, an important limitation of MSCT
remains the fact that only anatomical information is obtained, whereas the presence or absence of
ischemia cannot be established from the MSCT images. Accordingly, in patients with significant re-
stenosis, functional testing remains mandatory to determine further management.
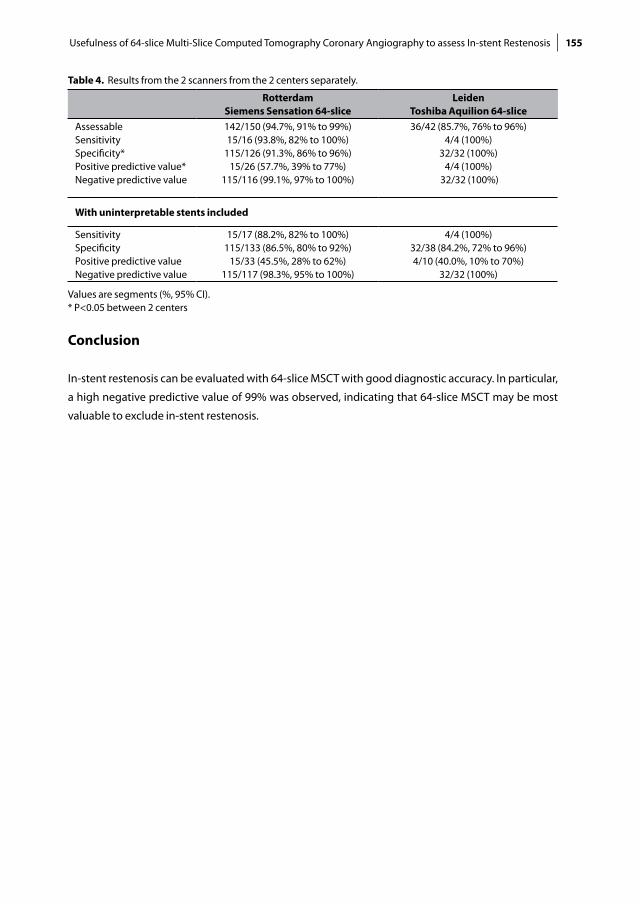
155Usefulness of 64-slice Multi-Slice Computed Tomography Coronary Angiography to assess In-stent Restenosis
Table 4. Results from the 2 scanners from the 2 centers separately.
RotterdamSiemens Sensation 64-slice
LeidenToshiba Aquilion 64-slice
AssessableSensitivitySpecificity*Positive predictive value*Negative predictive value
142/150 (94.7%, 91% to 99%)15/16 (93.8%, 82% to 100%)
115/126 (91.3%, 86% to 96%)15/26 (57.7%, 39% to 77%)
115/116 (99.1%, 97% to 100%)
36/42 (85.7%, 76% to 96%)4/4 (100%)
32/32 (100%)4/4 (100%)
32/32 (100%)
With uninterpretable stents included
SensitivitySpecificityPositive predictive valueNegative predictive value
15/17 (88.2%, 82% to 100%)115/133 (86.5%, 80% to 92%)
15/33 (45.5%, 28% to 62%)115/117 (98.3%, 95% to 100%)
4/4 (100%)32/38 (84.2%, 72% to 96%)4/10 (40.0%, 10% to 70%)
32/32 (100%)
Values are segments (%, 95% CI). * P<0.05 between 2 centers
Conclusion
In-stent restenosis can be evaluated with 64-slice MSCT with good diagnostic accuracy. In particular,
a high negative predictive value of 99% was observed, indicating that 64-slice MSCT may be most
valuable to exclude in-stent restenosis.

156 Chapter 10
References 1. Fischman DL, Leon MB, Baim DS, Schatz RA, Savage MP, Penn I, Detre K, Veltri L, Ricci D, Nobuyoshi M.
A randomized comparison of coronary-stent placement and balloon angioplasty in the treatment of coronary artery disease. Stent Restenosis Study Investigators. N Engl J Med. 1994;331:496-501.
2. Serruys PW, de Jaegere P, Kiemeneij F, Macaya C, Rutsch W, Heyndrickx G, Emanuelsson H, Marco J, Le-grand V, Materne P, . A comparison of balloon-expandable-stent implantation with balloon angioplasty in patients with coronary artery disease. Benestent Study Group. N Engl J Med. 1994;331:489-495.
3. Stone GW, Ellis SG, Cox DA, Hermiller J, O’Shaughnessy C, Mann JT, Turco M, Caputo R, Bergin P, Green-berg J, Popma JJ, Russell ME. A polymer-based, paclitaxel-eluting stent in patients with coronary artery disease. N Engl J Med. 2004;350:221-231.
4. Morice MC, Serruys PW, Sousa JE, Fajadet J, Ban HE, Perin M, Colombo A, Schuler G, Barragan P, Gua-gliumi G, Molnar F, Falotico R. A randomized comparison of a sirolimus-eluting stent with a standard stent for coronary revascularization. N Engl J Med. 2002;346:1773-1780.
5. Moses JW, Leon MB, Popma JJ, Fitzgerald PJ, Holmes DR, O’Shaughnessy C, Caputo RP, Kereiakes DJ, Williams DO, Teirstein PS, Jaeger JL, Kuntz RE. Sirolimus-eluting stents versus standard stents in pa-tients with stenosis in a native coronary artery. N Engl J Med. 2003;349:1315-1323.
6. Leschka S, Alkadhi H, Plass A, Desbiolles L, Grunenfelder J, Marincek B, Wildermuth S. Accuracy of MSCT coronary angiography with 64-slice technology: first experience. Eur Heart J. 2005;26:1482-1487.
7. Mollet NR, Cademartiri F, van Mieghem CA, Runza G, McFadden EP, Baks T, Serruys PW, Krestin GP, de Feyter PJ. High-resolution spiral computed tomography coronary angiography in patients referred for diagnostic conventional coronary angiography. Circulation. 2005;112:2318-2323.
8. Pugliese F, Mollet NR, Runza G, van Mieghem C, Meijboom WB, Malagutti P, Baks T, Krestin GP, Defeyter PJ, Cademartiri F. Diagnostic accuracy of non-invasive 64-slice CT coronary angiography in patients with stable angina pectoris. Eur Radiol. 2006;16:575-582.
9. Raff GL, Gallagher MJ, O’Neill WW, Goldstein JA. Diagnostic accuracy of noninvasive coronary angiog-raphy using 64-slice spiral computed tomography. J Am Coll Cardiol. 2005;46:552-557.
10. Kruger S, Mahnken AH, Sinha AM, Borghans A, Dedden K, Hoffmann R, Hanrath P. Multislice spiral computed tomography for the detection of coronary stent restenosis and patency. Int J Cardiol. 2003;89:167-172.
11. Hendel RC, Patel MR, Kramer CM, Poon M, Hendel RC, Carr JC, Gerstad NA, Gillam LD, Hodgson JM, Kim RJ, Kramer CM, Lesser JR, Martin ET, Messer JV, Redberg RF, Rubin GD, Rumsfeld JS, Taylor AJ, Weigold WG, Woodard PK, Brindis RG, Hendel RC, Douglas PS, Peterson ED, Wolk MJ, Allen JM, Patel MR. ACCF/ACR/SCCT/SCMR/ASNC/NASCI/SCAI/SIR 2006 appropriateness criteria for cardiac computed tomography and cardiac magnetic resonance imaging: a report of the American College of Cardiology Foundation Quality Strategic Directions Committee Appropriateness Criteria Working Group, Ameri-can College of Radiology, Society of Cardiovascular Computed Tomography, Society for Cardiovascular Magnetic Resonance, American Society of Nuclear Cardiology, North American Society for Cardiac Imaging, Society for Cardiovascular Angiography and Interventions, and Society of Interventional Radiology. J Am Coll Cardiol. 2006;48:1475-1497.
12. Budoff MJ, Achenbach S, Blumenthal RS, Carr JJ, Goldin JG, Greenland P, Guerci AD, Lima JA, Rader DJ, Rubin GD, Shaw LJ, Wiegers SE. Assessment of coronary artery disease by cardiac computed tomog-raphy: a scientific statement from the American Heart Association Committee on Cardiovascular Imaging and Intervention, Council on Cardiovascular Radiology and Intervention, and Committee on Cardiac Imaging, Council on Clinical Cardiology. Circulation. 2006;114:1761-1791.
13. Cademartiri F, Nieman K, van der LA, Raaijmakers RH, Mollet N, Pattynama PM, de Feyter PJ, Krestin GP. Intravenous contrast material administration at 16-detector row helical CT coronary angiography: test bolus versus bolus-tracking technique. Radiology. 2004;233:817-823.
14. Cademartiri F, Mollet N, Lemos PA, Pugliese F, Baks T, McFadden EP, Krestin GP, de Feyter PJ. Usefulness of multislice computed tomographic coronary angiography to assess in-stent restenosis. Am J Cardiol. 2005;96:799-802.
15. Schuijf JD, Bax JJ, Jukema JW, Lamb HJ, Warda HM, Vliegen HW, de Roos A, van der Wall EE. Feasibil-ity of assessment of coronary stent patency using 16-slice computed tomography. Am J Cardiol. 2004;94:427-430.

157Usefulness of 64-slice Multi-Slice Computed Tomography Coronary Angiography to assess In-stent Restenosis
16. Maintz D, Juergens KU, Wichter T, Grude M, Heindel W, Fischbach R. Imaging of coronary artery stents using multislice computed tomography: in vitro evaluation. Eur Radiol. 2003;13:830-835.
17. Gilard M, Cornily JC, Pennec PY, Le Gal G, Nonent M, Mansourati J, Blanc JJ, Boschat J. Assessment of coronary artery stents by 16 slice computed tomography. Heart. 2006;92:58-61.
18. Gaspar T, Halon DA, Lewis BS, Adawi S, Schliamser JE, Rubinshtein R, Flugelman MY, Peled N. Diagnosis of coronary in-stent restenosis with multidetector row spiral computed tomography. J Am Coll Cardiol. 2005;46:1573-1579.
19. Maintz D, Seifarth H, Raupach R, Flohr T, Rink M, Sommer T, Ozgun M, Heindel W, Fischbach R. 64-slice multidetector coronary CT angiography: in vitro evaluation of 68 different stents. Eur Radiol. 2005;1-9.
20. Seifarth H, Ozgun M, Raupach R, Flohr T, Heindel W, Fischbach R, Maintz D. 64- Versus 16-slice CT angi-ography for coronary artery stent assessment: in vitro experience. Invest Radiol. 2006;41:22-27.
21. Rist C, von Ziegler F, Nikolaou K, Kirchin MA, Wintersperger BJ, Johnson TR, Knez A, Leber AW, Reiser MF, Becker CR. Assessment of coronary artery stent patency and restenosis using 64-slice computed tomography. Acad Radiol. 2006;13:1465-1473.
22. Rixe J, Achenbach S, Ropers D, Baum U, Kuettner A, Ropers U, Bautz W, Daniel WG, Anders K. Assess-ment of coronary artery stent restenosis by 64-slice multi-detector computed tomography. Eur Heart J. 2006;27:2567-2572.
23. Meijboom WB, Mollet NR, van Mieghem CA, Kluin J, Weustink AC, Pugliese F, Vourvouri E, Cademartiri F, Bogers AJ, Krestin GP, de Feyter PJ. Pre-operative computed tomography coronary angiography to de-tect significant coronary artery disease in patients referred for cardiac valve surgery. J Am Coll Cardiol. 2006;48:1658-1665.
24. Hausleiter J, Meyer T, Hadamitzky M, Huber E, Zankl M, Martinoff S, Kastrati A, Schomig A. Radiation dose estimates from cardiac multislice computed tomography in daily practice: impact of different scanning protocols on effective dose estimates. Circulation. 2006;113:1305-1310.

Evaluation of Patients with Previous Coronary
Stent Implantation using 64-slice Multi-Slice
Computed Tomography
Radiology 2007
Joanne D. Schuijf, Gabija Pundziute, J. Wouter Jukema, Hildo J. Lamb, Joan C. Tuinenburg, Barend L. van der Hoeven, Albert de Roos,
Johannes H. C. Reiber, Ernst E. van der Wall, Martin J. Schalij, Jeroen J. Bax
11Chapter

Abstract
Background
To prospectively evaluate the diagnostic accuracy of 64-slice Multi-Slice Computed Tomogra-
phy (MSCT) for the assessment of in-stent or peri-stent restenosis, using conventional coro-
nary angiography as the reference standard.
Methods
The study was approved by the medical ethics committee and informed consent was ob-
tained in all 50 (40 men, mean age 60 ± 11 years) enrolled patients. In addition to conventional
coronary angiography with quantitative coronary angiography (QCA), 64-slice MSCT was per-
formed. For each stent, assessability was determined and related to stent characteristics and
heart rate using Chi-Square. In the interpretable stents and peri-stent lumina (5.00mm proxi-
mal and distal to the stent), the presence of significant (≥50%) restenosis was determined. For
this analysis, partially overlapping stents were considered as a single stented segment.
Results
Of 76 stents, 65 (86%) were determined assessable. Increased heart rate and overlapping posi-
tioning were found to be associated with increased stent uninterpretability (P<0.05), whereas
stent location or strut thickness were not. In 7 patients stents were placed overlapping result-
ing in 58 stented segments available for the evaluation of significant (≥50%) in-stent resteno-
sis. All 6 significant (≥50%) in-stent restenoses were detected and the absence of significant
(≥50%) restenosis was correctly identified in the 52 remaining stented segments, resulting in
a sensitivity and specificity of 100%. Sensitivity and specificity for the detection of significant
(≥50%) peri-stent stenosis were 100% and 98%, respectively.
Conclusion
In selected patients with previous stent implantation, sensitivity and specificity of 100% to
detect significant (≥50%) in-stent restenosis and 100% and 98%, respectively, to detect signifi-
cant (≥50%) peri-stent stenosis were observed for 64-slice MSCT.

161Evaluation of Patients with Previous Coronary Stent Implantation using 64-slice Multi-Slice Computed Tomography
Introduction
Currently, follow-up imaging in patients presenting with recurrent symptoms after previous intra-
coronary stent placement is performed by means of conventional coronary angiography. However,
this is an invasive procedure associated with a small but definite risk of serious complications 1;2.
Considering the fact that a substantial number of procedures are not followed by an intervention, a
non-invasive diagnostic procedure capable of evaluating not only native coronary arteries but also
coronary stents would therefore be of great benefit.
Although promising results have been obtained using Multi-Slice Computed Tomography (MSCT)
for the detection of coronary artery stenoses in native coronary arteries 3-5, evaluation of metallic
stents has not been as promising 6-10. While substantial improvement in image quality and diagnostic
accuracy was observed with 16-slice as compared to 4-slice MSCT systems, still relatively high num-
bers of stents with inadequate image quality were reported. In particular, stents with thicker struts or
smaller diameters tended to suffer from degraded image quality 6;7;9.
Recently, 64-slice MSCT systems have become available and studies evaluating coronary stent assess-
ment in vitro using 64-slice MSCT suggest further improvement in image quality 11;12. However, only
limited data with 64-slice MSCT are available in patients thus far with conflicting results, as a percent-
age interpretable stents of 58% was recently reported by Rixe et al. 13. Thus, the purpose of this study
was to prospectively evaluate the diagnostic accuracy of 64-slice MSCT for the assessment of in-stent
or peri-stent restenosis, using conventional coronary angiography as the reference standard.
Methods
Patients
The study group consisted of 50 consecutive patients (40 men, mean age 60 ± 11 years, range 41 to 79
years) who met our criteria and who had previously undergone percutaneous transluminal coronary
angioplasty (PTCA) treatment in combination with stent placement. Patients were scheduled for diag-
nostic conventional coronary angiography from June 2005 to May 2006. In addition, MSCT coronary
angiography was performed to allow non-invasive evaluation of the presence of in-stent restenosis or
occlusion. Exclusion criteria were the following: 1) atrial fibrillation, 2) renal insufficiency (serum cre-
atinine >120 mmol/L), 3) known allergy to iodine contrast media, and 4) pregnancy. All patients were
on continuous beta-blocker medication, and no additional beta-blockers were administered prior to
MSCT (Table 1). On average, MSCT was performed 13.4 ± 13.3 months (range 1 – 66 months) after stent
implantation.
Conventional coronary angiography in combination with quantitative coronary angiography (QCA)
analysis was performed on average 14 ± 9 days after MSCT and served as reference standard. All pa-
tients gave informed consent to the study protocol, which was approved by the ethics committee of the
Leiden University Medical Center, after the study details, including radiation exposure, were explained.

162 Chapter 11
Table 1. Clinical characteristics of the study population (n=50).
n (%)Gender (M/F) 40/10Age (years) 60 ± 11Heart Rate (bpm) 58 ± 10Single vessel disease 22 (44%)Multi-vessel disease 28 (56%)Previous myocardial infarction 46 (92%) Anterior 31 (67%) Inferior 14 (30%) Both 1 (2%)Previous PTCA 50 (100%) Previous CABG 0 (0%)Stent location LM 0 (0%) LAD 36 (47%) LCx 11 (14%) RCA 29 (38%)
Values are n (%).Bpm: beats per minute; CABG: coronary artery bypass grafting; LM: Left main coronary artery; LAD: Left anterior descending coronary artery; LCx: Left circumflex coronary artery; RCA: Right coronary artery.
Stent characteristics
Diameter of implanted stents ranged from 2.25 to 4.0 mm with an average of 3.4 ± 0.3 mm, while
stent length ranged from 8.0 mm to 33.0 mm with an average of 19.4 ± 5.0 mm. In total, 21 stents were
positioned with partial overlap. Ten different stent types were evaluated, of which the majority were
non-drug-eluting stents (DES): Vision (Guidant, n=33), Driver (Medtronic, n=3), Ave S7 (Medtronic,
n=2), Ave S670 (Medtronic, n=1), Orbus (Orbus technologies, n=2), Tristar (Guidant, n=2), Bx Velocity
(Cordis, n=1), and Liberté (Boston Scientific, n=1). In addition, 31 DES-stents (Cypher, Cordis, n=30
and Achieve, Guidant, n=1) were included.
Of these stents, Cypher, Bx Velocity and Tristar were considered to have thick struts (≥140 μm).
Data acquisition
Multi-SliceComputedTomography
MSCT was performed using a Toshiba Multi-slice Aquilion 64 system (Toshiba Medical Systems, To-
kyo, Japan) with a collimation of 64 x 0.5 mm and a rotation time of 0.4, 0.45 or 0.5 s, depending on
the heart rate. The tube current was 350 mA, at 120 kV. Non-ionic contrast material was administered
in the antecubital vein with an amount of 90-105 ml, depending on the total scan time, and a flow
rate of 5.0 ml/sec (Iomeron 400 ®). Repetitive low-dose monitoring examinations (120 kV, 10 mA)
were performed 5 seconds after the start of contrast medium injection. After the preset contrast en-
hancement threshold level of baseline HU + 100 HU in the descending aorta was reached, the MSCT

163Evaluation of Patients with Previous Coronary Stent Implantation using 64-slice Multi-Slice Computed Tomography
examination was automatically initiated. After a 2 second delay, data acquisition was performed
during an inspiratory breath hold of approximately 10 seconds, while the ECG was recorded simulta-
neously to allow retrospective gating of the data.
For evaluation of the coronary arteries and intracoronary stents, data were reconstructed using a
segmented reconstruction algorithm at 75% of the R-R interval with a slice thickness of 0.5 mm and
a reconstruction interval of 0.3 mm. If motion artefacts were still present in this phase, additional
reconstructions were explored to obtain the reconstruction phase with least motion artefacts (23
patients). For this purpose, images were reconstructed at a single level throughout the R-R interval
in steps of 20ms to obtain information on the individual patient’s pattern of cardiac motion. Based
on these images, the time point to reconstruct the entire data set was chosen. Also, in all patients, an
additional data set was reconstructed in the most optimal phase(s) using a sharper reconstruction
kernel (Q04 instead of Q05-07) to improve stent image quality 14. MSCT was performed successfully
in all patients. Average heart rate during the acquisition was 58 ± 10 (range 38 to 86).
Conventionalcoronaryangiography
Conventional coronary angiography was performed according to standard techniques by 2 experi-
enced operators with respectively 10 and 15 years experience. Vascular access was obtained using
the femoral approach with the Seldinger technique and a 6- French catheter.
Data analysis
Multi-SliceComputedTomography
For each individual coronary artery, the data set containing no or the least motion artifacts was trans-
ferred to a dedicated workstation (Vitrea2, Vital Images, Plymouth, Minn. USA) for post-processing.
Coronary stents were evaluated on both the standard kernel and sharper kernel reconstructions
using predominantly the original axial MSCT images, while manually obtained curved multiplanar
reconstructions were used for verification of findings. 3D volume rendered reconstructions were not
used. In addition, the axial images and curved multiplanar reconstructions were viewed in 3 differ-
ent window and level settings; 1000/200 HU as a standard window level while also window levels
of 1600/300 HU and 2500/900 HU were used to improve stent appearance. Assessment was per-
formed blinded to the conventional coronary angiography results in consensus reading by 2 experi-
enced observers, both having 3.5 years experience in the evaluation of MSCT coronary angiography,
with one also having extensive (15 years) experience in conventional coronary angiography and
intervention.
First, each individual stent was assigned an image quality score of: 1 (good image quality, no arti-
facts), 2 (moderate image quality, minor or moderate artifacts present but diagnosis possible) or 3
(uninterpretable, no diagnosis possible) as previously described 9;15. Also, it was documented wheth-
er stents were positioned partially overlapping or not. If so, the stents were consequently considered
as a single stented segment for the evaluation of in-stent or peri-stent stenosis.
Subsequently, the presence of significant restenosis (≥50% reduction of lumen diameter) was as-

164 Chapter 11
sessed for each stented segment, while also the observation of non-significant (<50% reduction of
lumen diameter) neo-intima hyperplasia within the stented segment was documented. Finally, since
restenosis of the stent borders may also regularly occur, the presence of peri-stent stenosis, ≥50%
narrowing of luminal diameter 5.00 mm proximal and distal to the stented segment was also evalu-
ated as previously described 9.
Conventionalandquantitativecoronaryangiography
Conventional angiograms were evaluated in consensus by two experienced observers without
knowledge of the MSCT data. First, the location of the intracoronary stents was identified on the
images before contrast injection. Subsequently, QCA with automated vessel contour detection after
catheter-based image calibration was performed in end-diastolic frames by 2 qualified observers
with respectively 2 and 10 years experience in QCA using a standard algorithm dedicated for stent
analysis (Brachy-DES analysis, QCA-CMS version 6.0, Medis, Leiden, The Netherlands) 16. QCA was
performed of the stented segment as well as its proximal and distal (5.00 mm) lumina and percent-
age diameter reduction was determined. An in-stent lumen diameter narrowing ≥50% in diameter
(up to in-stent occlusion) was defined as a significant restenosis.
Statisticalanalysis
Continuous variables are presented as means ± one standard deviation (SD), whereas categorical
data are summarized as frequencies and percentages. In order to relate stent assessability to stent
characteristics, stents were divided according to location in the coronary tree and according to strut
thickness (with stents with ≥140 μm struts regarded as having thick struts and stents with <140 μm
struts regarded as having thin struts), as previously described 9. Distinction was also being made
between stents positioned partially overlapping or not. Percentage assessable stents was calculated
for each category and compared using Chi-Square analysis with Yates’ correction. In addition, aver-
age heart rate was compared between interpretable stents and stents uninterpretable due to at-
tenuation artefacts or motion artefacts using the Student’s t test for independent samples. Logistic
regression analyses were applied to correlate segment and patient characteristics to image qual-
ity, using the generalized estimating equation (GEE) method developed by Liang and Zeger 17. Two
(dichotomous) outcome variables were considered: good versus moderate-or-uninterpretable im-
age quality, and good-or-moderate quality versus uninterpretable image quality. The GEE analyses
were performed with proc GENMOD with a binominal distribution for the outcome variable, the link
function specified as logit, and patients as separate subjects. Odds ratios and 95% confidence inter-
vals (CI) are reported. Sensitivity, specificity, positive and negative predictive values (including 95%
confidence intervals) for the detection of in-stent restenosis ≥50%, as determined by conventional
angiography in combination with QCA, were determined for each stented segment. In addition, di-
agnostic accuracy was also determined for the detection of significant (≥50%) narrowing of the peri-
stent lumina (5.00 mm proximal and distal to the stented segment).

165Evaluation of Patients with Previous Coronary Stent Implantation using 64-slice Multi-Slice Computed Tomography
Table 2. Results from GEE analysis
Odds Ratio (95% CI)Good versus moderate-or-uninterpretable image quality
Heart rate* 0.98 (0.93-1.05) Overlapping (Y/N) 0.70 (0.17-2.96)Strut Thickness (≥140µm or <140µm) 0.44 (0.15-1.29) Good-or-moderate versus uninterpretable image qualityHeart rate* 0.94 (0.86-1.03)Overlapping (Y/N) 0.16 (0.03-0.87)Strut Thickness (≥140µm or <140µm) 0.38 (0.08-1.77)
* Odds ratio per beat per minuteAbbreviations: CI: confidence interval
Statistical analyses were performed using SPSS software (version 12.0, SPSS Inc, Chicago, Il, USA)
and SAS software (The SAS system, release 6.12, Cary, NC, USA: SAS Institute Inc.). A value of P<0.05
was considered statistically significant.
Results
Stent analysis; image quality
The 50 patients had a total of 76 stents (1 to 5 stents per patient, average 1.5 ± 0.87) that were studied.
A total 41 (54%) and 24 (32%) stents were of respectively good or moderate image quality, whereas
stent lumen could not be visualized in the remaining 11 (14%) stents. Reasons of uninterpretability
were motion artifacts in 5 (45%) stents and attenuation artefacts in 6 (55%) stents.
Of the uninterpretable stents, 6 were placed in the right coronary artery (RCA), whereas 3 and 2 were
positioned in the left anterior descending (LAD) and left circumflex coronary arteries (LCx), respec-
tively. No significant differences were observed in interpretability between the different coronary
arteries (P=0.35).
Average heart rate during data acquisition was significantly higher in stents deemed uninterpretable
due to motion artifacts (72 ± 9) as compared to stents deemed uninterpretable due to attenuation
artefacts (55 ± 2, P=0.002). No significant difference was observed between stents uninterpretable
due to attenuation artefacts and interpretable stents (57 ± 9, P=0.62).
In stents positioned without any overlap (n=55), image quality was good in 31 (56%), moderate in
20 (36%) and non-diagnostic in 4 (7%). In contrast, image quality in stents positioned with partial
overlap (n=21) was significantly lower as image quality in these stents was good in 10 (48%) and
moderate in 4 (19%), whereas 7 (33%) were uninterpretable (P=0.01).
A trend towards improved image quality in stents with thin struts (<140 μm; n=43) could be ob-
served as compared to stents with thick struts (≥140 μm; n=33). In the latter 14 (42%) and 12 (36%)
were of respectively good or moderate image quality with 7 (21%) stents being uninterpretable.

166 Chapter 11
In contrast, respectively 27 (63%) and 12 (28%) of stents with thinner struts were of either good or
moderate image quality, while 4 (9%) stents were uninterpretable. Still, no statistical significance
was observed (P=0.15).
Results from GEE analyses are provided in Table 2.
Figure 1. Example of a patent thick-strut drug-eluting stent (diameter 3.5 mm) placed in the left anterior de-scending coronary artery of a 53-year old male patient. In Panels A and B, a curved multiplanar and 3D volume rendered reconstruction are provided, showing a patent thick-strut drug-eluting stent with only limited neo-intima hyperplasia (white arrowhead). Also on the cross-sectional image (insert Panel A), no significant in-stent restenosis can be observed. The corresponding conventional coronary angiogram is provided in Panel C.

167Evaluation of Patients with Previous Coronary Stent Implantation using 64-slice Multi-Slice Computed Tomography
Stent analysis; diagnosis of (significant) in-stent restenosis (Table 3)
In 7 patients, a total of 21 stents were placed partially overlapping, thereby hampering individual
evaluation of the presence of in-stent restenosis. Consequently, overlapping stents were considered
as a single stented segment, resulting in the availability of 58 stented segments for the diagnosis of
significant (≥50% of lumen diameter reduction) in-stent restenosis. Significant restenosis was cor-
rectly ruled out in all 52 stented segments without significant in-stent restenosis as determined by
conventional coronary angiography in combination with QCA (Figures 1 and 2). The remaining 6
stented segments with significant in-stent restenosis were correctly identified on MSCT (Figure 3).
Accordingly, the sensitivity and specificity for the assessment of significant in-stent restenosis were
100%. In the 52 stented segments without significant in-stent restenosis, average luminal narrow-
ing as determined by QCA was 23.4 ± 8.6% (range: 4.3% to 42.4%). Non-significant restenosis could
be observed on MSCT in 37 (71%) stented segments, whereas no neo-intima hyperplasia could be
observed on MSCT in 15 stented segments. In stented segments without neo-intima hyperplasia
visible on MSCT, average luminal narrowing as determined by QCA was slightly but not significantly
lower as compared to that of stented segments with visible neo-intima hyperplasia (20.6% ± 11.7%
vs. 24.0% ± 7.6%).
Figure 2. Example of a patent thin-strut, non-drug-eluting stent placed in the left anterior descending coronary artery of a 46-year old male patient. In Panel A, a curved multiplanar reconstruction is provided of a patent thin-strut stent (diameter 3.5 mm). Cross-sectional image perpendicular of the stent (insert) confirms the presence of only minimal in-stent hyperplasia (appearing as a small rim of hypoattenuating tissue, white arrow). Observa-tions were confirmed by invasive coronary angiography (Panel B).

168 Chapter 11
Peri-stent lumina (Table 3)
Of the 76 implanted stents, 21 were positioned (partially) overlapping. As a result, 55 single stented
segments and 10 stented segments resulting from overlapping stents were available, including both
interpretable as uninterpretable stented segments. Also, 1 stent (located in the RCA) originated di-
rectly from the aorta. Accordingly, 64 proximal stent lumina and 65 distal stent lumina were available
for analysis. All but 1 (1%) of the 129 peri-stent lumina were of sufficient image quality to evalu-
ate the presence of significant narrowing. Conventional coronary angiography in combination with
QCA demonstrated the presence of significant stenosis of 5 peri-stent lumina, which were all cor-
rectly identified on MSCT. However, 2 lesions (1 proximal and 1 distal) were overestimated by MSCT,
resulting in a specificity of 98%.
Table 3. Diagnostic accuracy to detect (significant) in-stent or peri-stent restenosis.
≥ 50% in-stent restenosis Peri-stent restenosisAssessable* 65/76 (86%, 78% - 94%) 128/129 (99%, 97% - 100%)Sensitivity 6/6 (100%) 5/5 (100%)Specificity 52/52 (100%) 121/123 (98%, 96% - 100%)Positive predictive value 6/6 (100%) 5/7 (71%, 37% - 100)Negative predictive value 52/52 (100%) 121/121 (100%)
Values are segments (%, 95% confidence intervals). * Includes all available stents, for the diagnostic accuracy calculations, (partially) overlapping positioned stents were considered as a single stented segment.
Discussion
In our present study, 76 coronary stents were evaluated using 64-slice MSCT, of which 65 (86%) were
interpretable. Both elevated heart rate and overlapping positioning appeared to be associated with
decreased interpretability, while no effect of stent type or location was observed. In the interpre-
table stented segments, a sensitivity and specificity to detect significant (≥ 50%) in-stent restenosis
of 100% was obtained, whereas the presence of non-obstructing in-stent restenosis was accurately
identified in 71% of stented segments. Also the presence of peri-stent stenosis could be accurately
detected with a sensitivity and specificity of 100% and 98%, respectively.
Our current observations compare favourably to previous studies reporting on coronary stent imag-
ing with 16-slice MSCT. In an earlier study by Schuijf et al, 21 patients with 65 previously implanted
stents were evaluated 9. A moderate sensitivity 78% and an excellent specificity of 100%, respec-
tively, to detect in-stent restenosis were observed. However, only 50 (77%) of stents proved to be
of sufficient image quality for evaluation. Exploration of the characteristics of 23% uninterpretable
stents showed that predominantly stents with thicker struts (≥140 μm) as well as stents with smaller
diameter (e.g. ≤3.0 mm) tented to suffer from degraded image quality. The effect of thick struts
was particularly pronounced, 41% of thick strut stents were uninterpretable, as compared to 11%
of stents with thinner struts. Diameter showed less prominent effect, although still a substantially

169Evaluation of Patients with Previous Coronary Stent Implantation using 64-slice Multi-Slice Computed Tomography
higher percentage of stents with a diameter ≤3.0 mm was uninterpretable as compared to stents
with a larger diameter (28% versus 11%). These observations were recently confirmed in a larger
population (143 patients included with a total of 232 stents) 6. In this study by Gilard et al, also using
16-slice MSCT, a substantial increase in interpretability from 51% to 81% was observed in stents with
diameters >3.0 mm as compared to those with diameters ≤3.0 mm. In addition, sensitivity to detect
in-stent restenosis increased similarly from 54% to 86%. For all stents, regardless of diameter, a speci-
ficity of 100% was observed. In this particular study the effect of strut thickness was not explored.
In our present study, improved interpretability of stents with 64-slice MSCT was observed with suf-
ficient image quality in 86% of stents. Exploration of the characteristics of uninterpretable stents
showed that similar to previous studies in native coronary arteries, elevated heart rate was a signifi-
cant cause of non-diagnostic image quality 18. Indeed, uninterpretability was due to motion artefacts
in 45% of uninterpretable stents. Accordingly, these observations underline the need for adequate
heart rate control during MSCT coronary angiography.
Further evaluation of the uninterpretable stents demonstrated that also partially overlapping posi-
tioned stents are associated with deteriorated image quality. The increased metal content is likely to
amplify high-density artefacts, thereby increasing the artificial narrowing of the stent lumen. Indeed,
whereas 93% of single stents were interpretable, 33% of partially overlapping stents were of non-
diagnostic quality. Accordingly, in patients with partially overlapping stents, evaluation by means
of another modality than MSCT may be preferred. In contrast to previous studies, no pronounced
effect of strut thickness was observed. Nonetheless, the presence of thick struts still tended to result
in non-diagnostic image quality more often as compared to stents with thin struts (21% versus 9%,
P=0.15). Accordingly, the influence of strut thickness on image quality with 64-slice MSCT should be
evaluated in larger cohort as our study may have been underpowered to demonstrate any effect.
In the interpretable stented segments, the presence or absence of significant (≥50%) in-stent reste-
nosis was correctly identified in all stented segments. Also, the presence or absence of peri-stent
restenosis could be detected with diagnostic accuracy of 98%. In particular, observed negative
predictive value to exclude the presence of in-stent or peri-stent restenosis was extremely high. Ac-
cordingly, the technique may be well suited for non-invasive rule out of significant (≥50%) in-stent
or peri-stent restenosis. Somewhat lower sensitivity and specificity were reported by a recent study
employing 40-slice MSCT technology 19. In this study by Gaspar and colleagues, evaluating 65 pa-
tients with 111 implanted coronary stents, a sensitivity and specificity to detect ≥50% in-stent re-
stenosis of 89% and 81% were observed 19. In part, this discrepancy may be explained by the fact
that in this study only a very small number of stents (5%) were excluded from the analysis, whereas
the number of excluded stents was higher in our own study. Still, also in the study by Gaspar, a high
negative predictive value (97%) was observed, underlining the potential of MSCT as a non-invasive
technique to rule out the presence of in-stent restenosis.
Another finding of our study was that in contrast to 16-slice MSCT 9;14 the superior image quality
of 64-slice MSCT has improved visualization of non-significant in-stent hyperplasia in addition to
significant in-stent restenosis. The presence of in-stent hyperplasia albeit limited was demonstrated

170 Chapter 11
by QCA in all stents and correctly recognized in 71% of stents on MSCT as well. Our observations are
in line with a recent study by Mahnken et al using 64-slice MSCT in a phantom model 20. Comparison
of16-slice MSCT to 64-slice MSCT in 8 stents with a diameter of 3.0 mm positioned in a static chest
phantom showed superior visualization of stent lumina with 64-slice MSCT due to significantly less
artificial lumen reduction and image noise. Still, a considerable portion of stent lumina remained
obscured even with 64-slice MSCT and in our own study, the presence of neo-intima hyperplasia
could not be observed on MSCT in 30% of stents. Accordingly, the value of MSCT to identify moder-
ate in-stent hyperplasia appears to remain limited at present.
Limitations
A relatively small number of patients were evaluated in the present study. As a result, the total num-
ber of stents and importantly, the number of patients with significant in-stent restenosis (12%), were
relatively low as well. Nonetheless, a much higher prevalence of in-stent restenosis is not likely to be
encountered in daily practice and extrapolation of the current results to clinical practice may there-
fore be justifiable 21;22. Also, the number of evaluated stents was low and the influence of stent and
patient characteristics on stent interpretability should be explored in larger patient cohorts in order
Figure 3. Diagnosis of in-stent restenosis in 2 adjacent stents placed in the left anterior descending coronary artery of a 61-year old male patient. Curved multiplanar reconstruction (Panel A) demonstrates the presence of in-stent restenosis (slightly exceeding 50% luminal diameter narrowing at the mid level [white arrowhead] and more severe at the distal part of the stent [white arrow]) in 2 adjacent non-drug-eluting stents (diameter 3.5 and 3.0 mm). Panel B: Also on the cross-sectional images obtained at the mid level, the presence of in-stent restenosis (appearing as hypoattenuating tissue) can be observed. Panel C: Findings were confirmed by invasive coronary angiography.

171Evaluation of Patients with Previous Coronary Stent Implantation using 64-slice Multi-Slice Computed Tomography
to fully establish which characteristics should potentially be avoided when performing stent evalu-
ation with MSCT. In particular, the range of stent diameters was limited in the present study with an
average of 3.4 ± 0.3 mm and as a result a potential effect of stent diameter could not be evaluated
in the present study. Thus, our study could possibly best be regarded as a basis for further larger
studies concerning image quality and diagnostic accuracy of 64-slice MSCT in coronary stents. In ad-
dition, despite the technological advancements of 64-slice MSCT, several limitations inherent to the
technique remain. First, as also observed in our present study, a stable and low heart rate remains
crucial for high-quality MSCT images and administration of beta-blockers prior to the examination
therefore is often required 18. Finally, an important consideration is the relatively high effective radia-
tion dose (10-15 mSv) to which a patient undergoing MSCT coronary angiography is exposed. For
this purpose, dose-modulation protocols are currently under development.
Conclusion
In selected patients with previous stent implantation, sensitivity and specificity of 100% to detect
significant (≥50%) in-stent restenosis and 100% and 98%, respectively, to detect significant (≥50%)
peri-stent stenosis were observed for 64-slice MSCT. In particular, the technique may be useful for
non-invasive exclusion of in-stent or peri-stent restenosis and avoid invasive imaging in a consider-
able number of patients.

172 Chapter 11
References 1. Krone RJ, Johnson L, Noto T. Five year trends in cardiac catheterization: a report from the Registry of the
Society for Cardiac Angiography and Interventions. Cathet Cardiovasc Diagn. 1996;39:31-35. 2. Scanlon PJ, Faxon DP, Audet AM, Carabello B, Dehmer GJ, Eagle KA, Legako RD, Leon DF, Murray JA, Nis-
sen SE, Pepine CJ, Watson RM, Ritchie JL, Gibbons RJ, Cheitlin MD, Gardner TJ, Garson A, Jr., Russell RO, Jr., Ryan TJ, Smith SC, Jr. ACC/AHA guidelines for coronary angiography. A report of the American College of Cardiology/American Heart Association Task Force on practice guidelines (Committee on Coronary Angiography). Developed in collaboration with the Society for Cardiac Angiography and Interventions. J Am Coll Cardiol. 1999;33:1756-1824.
3. Achenbach S, Giesler T, Ropers D, Ulzheimer S, Derlien H, Schulte C, Wenkel E, Moshage W, Bautz W, Daniel WG, Kalender WA, Baum U. Detection of coronary artery stenoses by contrast-enhanced, ret-rospectively electrocardiographically-gated, multislice spiral computed tomography. Circulation. 2001;103:2535-2538.
4. Nieman K, Rensing BJ, van Geuns RJ, Munne A, Ligthart JM, Pattynama PM, Krestin GP, Serruys PW, de Feyter PJ. Usefulness of multislice computed tomography for detecting obstructive coronary artery dis-ease. Am J Cardiol. 2002;89:913-918.
5. Mollet NR, Cademartiri F, van Mieghem CA, Runza G, McFadden EP, Baks T, Serruys PW, Krestin GP, de Feyter PJ. High-resolution spiral computed tomography coronary angiography in patients referred for diagnostic conventional coronary angiography. Circulation. 2005;112:2318-2323.
6. Gilard M, Cornily JC, Pennec PY, Le Gal G, Nonent M, Mansourati J, Blanc JJ, Boschat J. Assessment of coronary artery stents by 16 slice computed tomography. Heart. 2006;92:58-61.
7. Kitagawa T, Fujii T, Tomohiro Y, Maeda K, Kobayashi M, Kunita E, Sekiguchi Y. Noninvasive assessment of coronary stents in patients by 16-slice computed tomography. Int J Cardiol. 2005.
8. Kruger S, Mahnken AH, Sinha AM, Borghans A, Dedden K, Hoffmann R, Hanrath P. Multislice spiral com-puted tomography for the detection of coronary stent restenosis and patency. Int J Cardiol. 2003;89:167-172.
9. Schuijf JD, Bax JJ, Jukema JW, Lamb HJ, Warda HM, Vliegen HW, de Roos A, van der Wall EE. Feasibility of assessment of coronary stent patency using 16-slice computed tomography. Am J Cardiol. 2004;94:427-430.
10. Cademartiri F, Marano R, Runza G, Mollet N, Nieman K, Luccichenti G, Gualerzi M, Brambilla L, Coruzzi P, Galia M, Midiri M. Non-invasive assessment of coronary artery stent patency with multislice CT: prelimi-nary experience. Radiol Med (Torino). 2005;109:500-507.
11. Maintz D, Seifarth H, Raupach R, Flohr T, Rink M, Sommer T, Ozgun M, Heindel W, Fischbach R. 64-slice multidetector coronary CT angiography: in vitro evaluation of 68 different stents. Eur Radiol. 2005;1-9.
12. Seifarth H, Ozgun M, Raupach R, Flohr T, Heindel W, Fischbach R, Maintz D. 64- Versus 16-slice CT angi-ography for coronary artery stent assessment: in vitro experience. Invest Radiol. 2006;41:22-27.
13. Rixe J, Achenbach S, Ropers D, Baum U, Kuettner A, Ropers U, Bautz W, Daniel WG, Anders K. Assess-ment of coronary artery stent restenosis by 64-slice multi-detector computed tomography. Eur Heart J. 2006;27:2567-2572.
14. Hong C, Chrysant GS, Woodard PK, Bae KT. Coronary artery stent patency assessed with in-stent con-trast enhancement measured at multi-detector row CT angiography: initial experience. Radiology. 2004;233:286-291.
15. Watanabe M, Uemura S, Iwama H, Okayama S, Takeda Y, Kawata H, Horii M, Nakajima T, Hirohashi S, Kichikawa K, Ookura A, Saito Y. Usefulness of 16-slice multislice spiral computed tomography for follow-up study of coronary stent implantation. Circ J. 2006;70:691-697.
16. Reiber JH, Serruys PW, Kooijman CJ, Wijns W, Slager CJ, Gerbrands JJ, Schuurbiers JC, den Boer A, Hu-genholtz PG. Assessment of short-, medium-, and long-term variations in arterial dimensions from com-puter-assisted quantitation of coronary cineangiograms. Circulation. 1985;71:280-288.
17. Liang KY, Zeger SL. Longitudinal Data-Analysis Using Generalized Linear-Models. Biometrika. 1986;73:13-22.
18. Cademartiri F, Mollet NR, Runza G, Belgrano M, Malagutti P, Meijboom BW, Midiri M, Feyter PJ, Krestin GP. Diagnostic accuracy of multislice computed tomography coronary angiography is improved at low heart rates. Int J Cardiovasc Imaging. 2005;1-5.

173Evaluation of Patients with Previous Coronary Stent Implantation using 64-slice Multi-Slice Computed Tomography
19. Gaspar T, Halon DA, Lewis BS, Adawi S, Schliamser JE, Rubinshtein R, Flugelman MY, Peled N. Diagnosis of coronary in-stent restenosis with multidetector row spiral computed tomography. J Am Coll Cardiol. 2005;46:1573-1579.
20. Mahnken AH, Muhlenbruch G, Seyfarth T, Flohr T, Stanzel S, Wildberger JE, Gunther RW, Kuettner A. 64-slice computed tomography assessment of coronary artery stents: a phantom study. Acta Radiol. 2006;47:36-42.
21. Moses JW, Leon MB, Popma JJ, Fitzgerald PJ, Holmes DR, O’Shaughnessy C, Caputo RP, Kereiakes DJ, Williams DO, Teirstein PS, Jaeger JL, Kuntz RE. Sirolimus-eluting stents versus standard stents in patients with stenosis in a native coronary artery. N Engl J Med. 2003;349:1315-1323.
22. Gordon PC, Gibson CM, Cohen DJ, Carrozza JP, Kuntz RE, Baim DS. Mechanisms of restenosis and redila-tion within coronary stents-- quantitative angiographic assessment. J Am Coll Cardiol. 1993;21:1166-1174.


Validation of a High-resolution, Phase Contrast
Cardiovascular Magnetic Resonance Sequence
for Evaluation of Flow in Coronary Artery
Bypass Grafts
J Cardiovasc Magn Reson 2007; 9: 557-63
Liesbeth P. Salm, Joanne D. Schuijf, Hildo J. Lamb, Jeroen J. Bax, Hubert W. Vliegen, J.Wouter Jukema, Ernst E. van der Wall, Albert de Roos,
Joost Doornbos
12Chapter

Abstract
Background
The aim was to validate a magnetic resonance high-resolution, phase-contrast sequence for
quantifying flow in small and large vessels, and to demonstrate its feasibility to measure flow
in coronary artery bypass grafts.
Methods
A breathhold, echo planar imaging (EPI) sequence was developed and validated in a flow
phantom using a fast field echo (FFE) sequence as reference. In 17 volunteers aortic flow was
measured using both sequences. In 5 patients flow in the left internal mammary artery (LIMA)
and aorta was measured at rest and during adenosine stress, and coronary flow reserve (CFR)
was calculated; in 7 patients vein graft flow velocity was measured.
Results
In the flow phantom measurements, the EPI sequence yielded an excellent correlation with
the FFE sequence (r=0.99; p<0.001 for all parameters). In healthy volunteers, aortic volume
flow correlated well (r=0.88; p<0.01), with a minor overestimation. It was feasible to measure
flow velocity in the LIMA and vein grafts of the 12 patients.
Conclusion
The high-resolution, breathhold MR velocity-encoded sequence correlated well with a free-
breathing, FFE sequence in a flow phantom and in the aortae of healthy volunteers. Using the
EPI sequence, it is feasible to measure flow velocity in both LIMA and vein grafts, and in the
aorta.

177Validation of a High-resolution, Phase Contrast Cardiovascular Magnetic Resonance Sequence
Introduction
Coronary artery bypass grafting (CABG) is one of the therapeutic options in obstructive coronary
artery disease. Over time, atherosclerosis may progress in these bypass grafts and graft stenosis
may develop, requiring invasive angiography to assess the severity of the lesions. However, the
hemodynamic consequences of the stenotic lesions cannot be assessed from angiography 1;2.
Measurement of flow velocity and flow reserve by phase-contrast velocity-encoded cardiovascular
magnetic resonance (CMR) has recently been demonstrated for the evaluation of vein graft dis-
ease 3;4. Imaging of arterial grafts remains challenging because of the small luminal diameter of
the internal mammary arteries, and metal clip artefacts. Earlier studies demonstrated the feasibility
to measure flow in left internal mammary artery (LIMA) grafts by free-breathing and breathhold
CMR sequences, but these sequences generated a limited spatial and temporal resolution 5-7. The
aim of the present study was to validate a recently developed velocity-encoded CMR sequence to
measure flow velocity in small and large vessels, and to demonstrate its feasibility to measure flow
in coronary artery bypass grafts.
Methods
In vitro validation
In order to validate the velocity-encoded CMR sequence in small vessels, a calibrated flow simulator
(UHDC flow simulator, Shelley Medical Imaging Technologies, London, Ontario, Canada) was used to
create biphasic flow velocity patterns, such as observed in nonstenotic bypass grafts and coronary
arteries, in a MRI compatible phantom. The design of the pump and its value in application for MR
flow studies were described before 8;9. The simulator provided an ECG-signal to allow triggering by
the MR-system. The phantom consisted of a cylindrical container filled with water, with a 4-mm-di-
ameter glass tube running through the middle. The glass tube was connected to the flow simulator
by two hoses, and filled with a blood-mimicking solution. The phantom was positioned in the bore of
a 1.5 Tesla MRI scanner (Gyroscan ACS/NT, Philips Medical Systems, Best, the Netherlands) with Pow-
ertrak-6000 gradients (gradient strength 25mT/m, slow rate 100 T/m/s) and commercially available
cardiac software (release 9, Philips Medical Systems, Best, the Netherlands). Scout scans of the glass
tube were made, and a plane perpendicular to the tube was planned for the velocity measurements.
A multishot echo planar imaging (EPI) velocity-encoded sequence yielded a field of view (FOV) of
60×150 mm with an acquisition matrix of 55×144 voxels. Per acquisition 55 k-lines were scanned.
Multi-shot gradient echo EPI was performed by acquisition of 5 EPI-readouts twice per frame (Figure
1). For each time frame in the cardiac cycle a velocity-sensitive and a velocity-insensitive image was
acquired, and for each image signals were averaged (NEx=2), resulting in an acquisition time of 22
heartbeats. Number of phases to be acquired during the cardiac cycle was set to 30 by retrospective
ECG-gating. The repetition time (TR), defined as the time to acquire 5 k-lines after one RF pulse, was
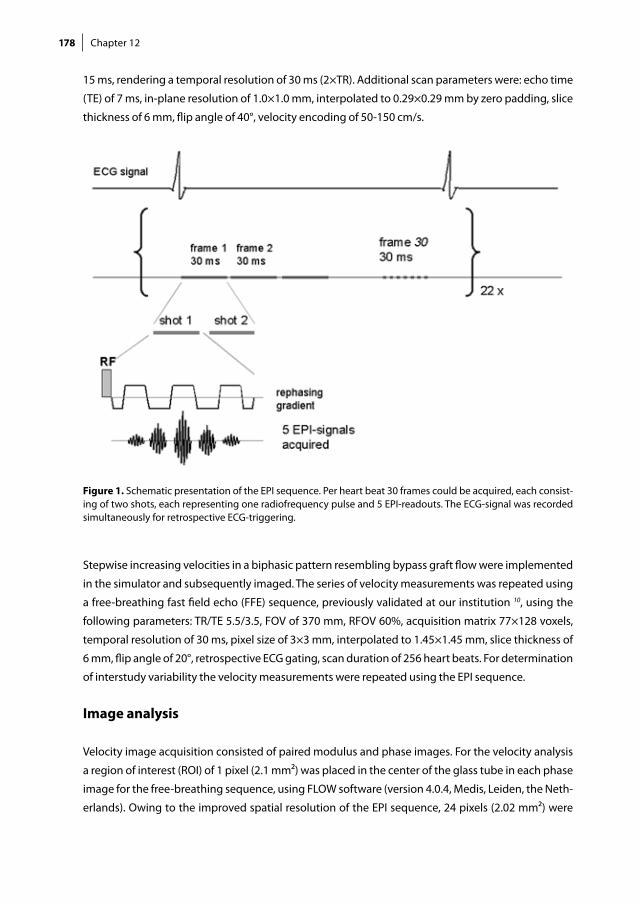
178 Chapter 12
15 ms, rendering a temporal resolution of 30 ms (2×TR). Additional scan parameters were: echo time
(TE) of 7 ms, in-plane resolution of 1.0×1.0 mm, interpolated to 0.29×0.29 mm by zero padding, slice
thickness of 6 mm, flip angle of 40°, velocity encoding of 50-150 cm/s.
Figure 1. Schematic presentation of the EPI sequence. Per heart beat 30 frames could be acquired, each consist-ing of two shots, each representing one radiofrequency pulse and 5 EPI-readouts. The ECG-signal was recorded simultaneously for retrospective ECG-triggering.
Stepwise increasing velocities in a biphasic pattern resembling bypass graft flow were implemented
in the simulator and subsequently imaged. The series of velocity measurements was repeated using
a free-breathing fast field echo (FFE) sequence, previously validated at our institution 10, using the
following parameters: TR/TE 5.5/3.5, FOV of 370 mm, RFOV 60%, acquisition matrix 77×128 voxels,
temporal resolution of 30 ms, pixel size of 3×3 mm, interpolated to 1.45×1.45 mm, slice thickness of
6 mm, flip angle of 20°, retrospective ECG gating, scan duration of 256 heart beats. For determination
of interstudy variability the velocity measurements were repeated using the EPI sequence.
Image analysis
Velocity image acquisition consisted of paired modulus and phase images. For the velocity analysis
a region of interest (ROI) of 1 pixel (2.1 mm²) was placed in the center of the glass tube in each phase
image for the free-breathing sequence, using FLOW software (version 4.0.4, Medis, Leiden, the Neth-
erlands). Owing to the improved spatial resolution of the EPI sequence, 24 pixels (2.02 mm²) were

179Validation of a High-resolution, Phase Contrast Cardiovascular Magnetic Resonance Sequence
selected in the center of the tube in order to compare the two sequences. The peak velocity was
defined as the mean velocity in the ROI for each time frame. The average peak velocity (APV; cm/s)
was then defined as the average velocity measured in the ROIs over the cardiac cycle. Systolic peak
velocity (SPV; cm/s) and diastolic peak velocity (DPV; cm/s) were defined as the maximal peak veloc-
ity during the first and second peak, respectively.
In vivo validation
In 17 healthy volunteers aortic flow was measured using the EPI and FFE sequence. A scout scan in
three planes of the thorax was made. Aortic flow was acquired in a transverse plane planned through
the ascending aorta by both free-breathing FFE and EPI sequence. For this measurement FOV was
increased to 370 mm in the EPI sequence, resulting in a voxel size of 2.6×2.6 mm, interpolated to
0.7×0.7 mm. All breathholds were initiated at end-expiration in order to avoid aortic flow changes
due to high intrathoracic pressures 11.
Feasibility study
In 10 healthy volunteers LIMA and aortic flow were measured using the EPI sequence. Two surface
coils were used, one placed at the proximal native LIMA and one placed at the center of the thorax
to measure aortic flow. First, a scout scan in three planes of the thorax was made. A transversal bal-
anced turbo field echo (bTFE) survey scan of the proximal part of the LIMA was made to identify the
arterial anatomy. The proximal portion of the LIMA was selected in order to avoid artefacts derived
from metal clips in patients with LIMA grafts. The proximal part of the LIMA was scanned in plane in
two perpendicular planes in order to plan a third plane orthogonally. The EPI sequence was applied
to measure velocity in a single breathhold. The sequence validated in the phantom study was used.
Then, aortic flow was acquired as described in the previous section.
In 5 randomly selected patients with LIMA grafts, who underwent coronary angiography because of
recurrent chest pain, aortic and proximal LIMA graft flow was measured in the same manner. After
acquiring the baseline aortic and LIMA flow, adenosine was administered intravenously in dosage of
140 µg/kg/min in order to achieve maximal hyperemia 12. Aortic and LIMA flow velocity scans were
repeated during adenosine stress.
In 7 randomly selected patients with vein grafts, baseline flow velocity was measured. By means of
the bTFE survey scan, vein grafts were visualized at the level of the ascending aorta. On two perpen-
dicular survey images showing the graft in plane, a plane was planned perpendicular to the graft
and velocity was obtained using the EPI sequence. Beforehand, the nature of the study was fully
explained to the patients, and all patients gave informed consent. The study was approved by the
medical ethics committee of our institution.
All patients underwent coronary angiography because of recurrent chest pain by a standard proce-
dure prior to the CMR examination. The MR operators were blinded to the results of invasive angi-
ography. Angiograms were evaluated by an experienced cardiologist for potential stenoses in the

180 Chapter 12
examined bypass grafts and recipient vessels. If more than one stenosis was present in either bypass
graft or recipient vessel, the most severe stenosis was taken into account.
Image analysis
For the image analysis aortic and LIMA contours were traced by automatic contour detection, using
FLOW 4.0.4 (Medis, Leiden, the Netherlands) 13;14. In the flow rate-versus-time curves the area-un-
der-the-curve was multiplied with the heart rate to obtain aortic and LIMA volume flow (ml/min).
The maximal flow rate at systole and diastole were defined as the systolic peak flow (SPF; ml/s) and
diastolic peak flow (DPF; ml/s), respectively. The diastolic-to-systolic flow ratio (DSFR) was defined
as the ratio of DPF and SPF. The ratio of hyperemic to baseline volume flow was defined as coronary
flow reserve (CFR). As values of LIMA flow are known to vary widely between individuals 5, LIMA flow
was also expressed as a percentage of the aortic flow at rest and during stress.
For vein grafts it has been demonstrated previously that the accuracy of volume flow analysis and
peak velocity analysis is similar 15. Therefore, only peak velocity analysis was performed, in which
4 pixels at the center of the vessel were selected and defined as the peak velocity for every phase
in the cardiac cycle. APV, SPV, and DPV were derived from the velocity-versus-time curves, such as
described for the flow simulator.
Statistical analysis
Parameters were expressed as mean ± SD. The velocity parameters, measured by the flow phantom,
and the flow parameters, measured in healthy volunteers, were compared using Pearson correlation
and Bland-Altman analysis. Interstudy variability was expressed as correlation and calculated as the
mean difference divided by the mean of the two measurements. Baseline and stress values in LIMA
grafts were compared using a paired Student t-test. A p-value <0.05 was considered significant.
Results
In vitro validation
When comparing the FFE and EPI sequence with the flow simulator, an excellent correlation was
demonstrated for APV (y=1.06x-2.6; r=0.99; p<0.001), as for SPV and DPV (y=1.05x-2.1; r=0.99 and
y=1.05x-1.3; r=0.99; p<0.001). In the Bland-Altman analysis, the mean differences (95% limits of
agreement) were for APV –1.26 cm/s (-2.89 to 0.36), for SPV –1.05 cm/s (-2.64 to 0.55), and for DPV
0.19 cm/s (-2.84 to 3.23), indicating good agreement. A good reproducibility of the EPI sequence
was demonstrated, expressed by the following correlations: y=x+0.2 for APV, y=x-0.5 for SPV and
y=x+2.2 for DPV (r=0.99 and p<0.001 for all correlations). Interstudy variabilities were –0.2% for APV,
-2.4% for SPV, and 5.5% for DPV.

181Validation of a High-resolution, Phase Contrast Cardiovascular Magnetic Resonance Sequence
Figure 2. Correlation and Bland-Altman analysis of the comparison of the FFE and EPI sequence for aortic flow in healthy volunteers. Identity lines (y=x) are shown in the correlation plots in gray. In the Bland-Altman plots, solid lines represent the mean, and dotted lines represent the 95% limits of agreement.
In vivo validation
In 17 healthy volunteers (mean age 30 years, range 20 to 60, male/female 7/10) aortic flow was mea-
sured by free-breathing FFE and breathhold EPI sequence. For 2 volunteers, image quality was insuf-
ficient due to inability to sustain the obligatory breathhold, and these individuals were excluded
from further analysis. A good correlation was shown for the FFE and EPI sequences (Figure 2). The
regression equation, y=1.2x-301, demonstrated a slight overestimation of volume flow, when the
EPI sequence was used (r=0.88; p<0.01). The EPI sequence correlated well with the FFE sequence
for SPF (y=1.04x-21; r=0.94; p<0.001). Bland-Altman analysis illustrated the overestimation of aortic
flow with the EPI sequence with a mean difference of 560 ml/min (95% limits of agreement –872 to
1992). For SPF mean difference was –4.5 ml/s (95% limits of agreement –75.0 to 66.0).

182 Chapter 12
Feasibility study
In 10 volunteers native LIMA flow was adequately measured using the EPI sequence. Mean LIMA
flow was 66.5 ± 22.3 ml/min (range 32.0 to 106.2), mean SPF was 5.2 ± 1.4 ml/s (range 3.1 to 7.3), and
mean aortic flow was 5365 ± 1302 ml/min (range 3331 to 7493). When LIMA flow was expressed as
percentage of aortic flow, the mean percentage was 1.2 ± 0.4% (range 0.6 to 2.0).
Figure 3. Modulus (left) and phase (right) images of a sequential LIMA graft (arrowheads) to anterolateral and obtuse marginal branch in diastole, acquired using the EPI sequence. Top images represent baseline flow velocity and bottom images flow velocity during adenosine stress.
In 5 male patients (mean age 56 years, range 43 to 73) with 5 LIMA grafts, proximal LIMA graft and aor-
tic flow were successfully measured at rest and during adenosine stress, see Figure 3. Grafts were anas-
tomosed to the left anterior descending (LAD) artery (n=1), first diagonal branch and LAD (n=2), an-
terolateral branch and obtuse marginal (OM) branch (n=1). In one patient the LIMA was anastomosed
to the first diagonal branch and LAD, and a free right IMA was anastomosed from the LIMA to the OM
Figure 4. Flow curve of the LIMA graft depicted in Figure 3. Black squares represent the flow rate at baseline. Open squares characterize adenosine stress flow rate. LIMA volume flow was 58.3 mL/min at baseline and 159.5 mL/min during adenosine stress, resulting in a CFR of 2.7.
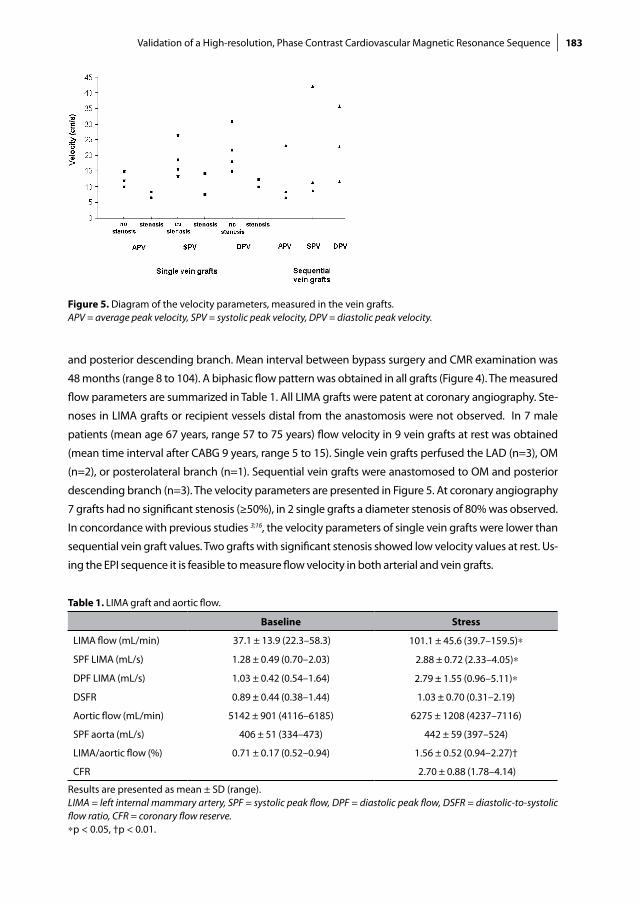
183Validation of a High-resolution, Phase Contrast Cardiovascular Magnetic Resonance Sequence
and posterior descending branch. Mean interval between bypass surgery and CMR examination was
48 months (range 8 to 104). A biphasic flow pattern was obtained in all grafts (Figure 4). The measured
flow parameters are summarized in Table 1. All LIMA grafts were patent at coronary angiography. Ste-
noses in LIMA grafts or recipient vessels distal from the anastomosis were not observed. In 7 male
patients (mean age 67 years, range 57 to 75 years) flow velocity in 9 vein grafts at rest was obtained
(mean time interval after CABG 9 years, range 5 to 15). Single vein grafts perfused the LAD (n=3), OM
(n=2), or posterolateral branch (n=1). Sequential vein grafts were anastomosed to OM and posterior
descending branch (n=3). The velocity parameters are presented in Figure 5. At coronary angiography
7 grafts had no significant stenosis (≥50%), in 2 single grafts a diameter stenosis of 80% was observed.
In concordance with previous studies 3;16, the velocity parameters of single vein grafts were lower than
sequential vein graft values. Two grafts with significant stenosis showed low velocity values at rest. Us-
ing the EPI sequence it is feasible to measure flow velocity in both arterial and vein grafts.
Table 1. LIMA graft and aortic flow.
Baseline Stress
LIMA flow (mL/min) 37.1 ± 13.9 (22.3–58.3) 101.1 ± 45.6 (39.7–159.5)∗
SPF LIMA (mL/s) 1.28 ± 0.49 (0.70–2.03) 2.88 ± 0.72 (2.33–4.05)∗
DPF LIMA (mL/s) 1.03 ± 0.42 (0.54–1.64) 2.79 ± 1.55 (0.96–5.11)∗
DSFR 0.89 ± 0.44 (0.38–1.44) 1.03 ± 0.70 (0.31–2.19)
Aortic flow (mL/min) 5142 ± 901 (4116–6185) 6275 ± 1208 (4237–7116)
SPF aorta (mL/s) 406 ± 51 (334–473) 442 ± 59 (397–524)
LIMA/aortic flow (%) 0.71 ± 0.17 (0.52–0.94) 1.56 ± 0.52 (0.94–2.27)†
CFR 2.70 ± 0.88 (1.78–4.14)
Results are presented as mean ± SD (range). LIMA = left internal mammary artery, SPF = systolic peak flow, DPF = diastolic peak flow, DSFR = diastolic-to-systolic flow ratio, CFR = coronary flow reserve.∗p < 0.05, †p < 0.01.
Figure 5. Diagram of the velocity parameters, measured in the vein grafts. APV = average peak velocity, SPV = systolic peak velocity, DPV = diastolic peak velocity.

184 Chapter 12
Discussion
In this study validation of a high-resolution, phase contrast CMR sequence was described. This se-
quence correlated well with a previously validated FFE sequence in a flow phantom and for aortic
flow measured in healthy volunteers. In addition, the feasibility to measure LIMA and vein graft flow
velocity using the proposed sequence was demonstrated.
In vitro and in vivo validation
CMR phase contrast imaging has succesfully been used before to measure flow velocity in arterial
and vein bypass grafts 3-7. In the current study an improved phase contrast EPI sequence was validat-
ed in vitro and in vivo against an established FFE sequence 10, and the feasibility to measure bypass
graft flow velocity was demonstrated. The EPI sequence used segmented filling of k-space (factor
5), and had an in-plane resolution of 1.0 × 1.0 mm, interpolated to 0.29 × 0.29 mm, with a temporal
resolution of 30 ms. The measurements were obtained at breathholding, and with the use of retro-
spective ECG-gating, data could be collected during the full cardiac cycle. In comparison, spatial and
temporal resolution of formerly established breathhold phase contrast sequences were 2.5×1.9 mm
and 128 ms 6, 1.6×0.8 mm and 112 ms 7, 1.6 × 1.6 mm and 23 ms 3, and 0.9 ×1.5 mm and 125 ms 4,
respectively. In LIMA grafts with a mean diameter of 2.42 ± 0.45 mm 17, an improvement of 0.5 mm in
in-plane spatial resolution is of important benefit. A temporal resolution of 30 ms is adequate to ac-
curately measure the systolic and diastolic peak in peak flow velocity measurements 18. The formerly
established breathhold sequences all used prospective ECG-triggering, with which the flow of late
diastole may not be measured correctly. The presented sequence used retrospective gating, provid-
ing data collection throughout the whole cardiac cycle. Particularly in bypass grafts, where flow is
maximal during diastole, this is an important improvement.
For validation purposes, quantitative flow velocity measurements with FFE phase contrast imaging
have been shown to be accurate 19-22. An excellent agreement between the EPI sequence and the
conventional sequence was demonstrated in vitro, and the sequences correlated well in vivo.
In healthy volunteers aortic volume flow showed a minor overestimation using the EPI sequence,
which may be explained in part by the fact that the EPI sequence had a better spatial resolution,
causing partial volume effects to be less prominent 23. Also, phase offset errors or Maxwell con-
comitant terms may be more prominent using an EPI approach. These artefacts were not specifically
investigated in this study. Moreover, at end-expiration left ventricle stroke volume was previously
demonstrated to be higher than the average stroke volume in healthy volunteers 24. Thus, when aor-
tic volume flow is measured over 22 heart beats in an end-expiratory breathhold, measured volume
flow may be higher than averaged over 256 heart beats in normal breathing, due to low intratho-
racic pressure.
The phase-contrast EPI sequence was initially developed for measuring flow velocity in bypass grafts.
The results of the current study showed that this sequence may additionally be used in large arteries
as part of an integrated CMR approach.

185Validation of a High-resolution, Phase Contrast Cardiovascular Magnetic Resonance Sequence
CMR flow velocity in bypass grafts
Arterial grafts
Absolute LIMA graft flow ranged considerably between patients without stenoses in the graft or
recipient vessel of the graft. Standardized thresholds of the flow parameters are necessary to be
able to detect flow-limiting stenoses. Ishida et al. studied volume flow by CMR in 24 LIMA grafts
at rest and during dipyridamole stress in patients shortly after CABG, and the authors proposed
threshold values for the detection of >70% stenosis of 35 ml/min for baseline LIMA volume flow,
1.0 for diastolic-to-systolic velocity ratio, and 1.5 for CFR 7. These parameters however are known
to change over time 17;25. Langerak et al. formulated a regression model to detect ≥50% and ≥70%
stenoses in vein grafts by using CMR with velocity mapping 3. Arterial grafts (n=41) were addition-
ally investigated, but a sufficient number of stenoses to formulate a model for the identification of
graft disease was lacking. Future studies are necessary to formulate a model to detect significant
stenoses in arterial grafts noninvasively by velocity-encoded CMR. Such a study may be performed
using the currently presented sequence.
Another application of LIMA flow measurements by CMR is assessment before and after surgical
revascularization to evaluate patency of the graft. Stauder et al. demonstrated the feasibility of a
combined CMR protocol, including contrast-enhanced MR angiography and phase contrast flow
measurements, for assessment of patency in 42 LIMA grafts 26. The presented CMR flow velocity se-
quence may also be used for this purpose.
Metal clips used in bypass graft surgery formed no obstacle in the present study, since proximal
CMR measurements were performed. Metal clip artefacts did however prevent the acquisition of
distal flow measurements. As CMR imaging gains acceptance as noninvasive follow-up after sur-
gery, MR compatible clips, e.g. titanium clips, may be used at CABG in a standard fashion.
Vein grafts
Vein graft flow velocity has been studied more extensively by CMR in previous studies 3;4;27;28. Two
models were described to identify diseased vein grafts yielding a sensitivity and specificity of 94%
and 63%, and 78% and 80%, respectively, using velocity-encoded CMR 3;4. Measurement of flow ve-
locity in vein grafts using this sequence was demonstrated to be feasible.
Study limitations
In this study the results in patients are to show the feasibility of the EPI sequence to be used to measure
flow velocity in bypass grafts. A future study validating this sequence to measure bypass grafts flow com-
pared with a prospectively-triggered, breathhold sequence with similar spatial resolution is needed.
Also, artefact sensitivity of EPI was not specifically investigated. Future studies may further focus on
this issue.

186 Chapter 12
Conclusion
In conclusion, the presented velocity-encoded CMR sequence allows accurate measurements of ve-
locity in small vessels with good reproducibility, demonstrated by means of a flow simulator. The
presented sequence correlated well with a conventional sequence for measurement of aortic flow
in healthy volunteers. In addition, the feasibility to quantify flow velocity in LIMA and vein grafts was
demonstrated.

187Validation of a High-resolution, Phase Contrast Cardiovascular Magnetic Resonance Sequence
References 1. Topol EJ, Nissen SE. Our preoccupation with coronary luminology. The dissociation between clinical and
angiographic findings in ischemic heart disease. Circulation. 1995;92:2333-2342. 2. White CW, Wright CB, Doty DB, Hiratza LF, Eastham CL, Harrison DG, Marcus ML. Does visual interpreta-
tion of the coronary arteriogram predict the physiologic importance of a coronary stenosis? N Engl J Med. 1984;310:819-24.
3. Langerak SE, Vliegen HW, Jukema JW, Kunz P, Zwinderman AH, Lamb HJ, van der Wall EE, de Roos A. Value of magnetic resonance imaging for the noninvasive detection of stenosis in coronary artery by-pass grafts and recipient coronary arteries. Circulation. 2003;107:1502-1508.
4. Bedaux WL, Hofman MB, Vyt SL, Bronzwaer JG, Visser CA, van Rossum AC. Assessment of coronary artery bypass graft disease using cardiovascular magnetic resonance determination of flow reserve. J Am Coll Cardiol. 2002;40:1848-1855.
5. Debatin JF, Strong JA, Sostman HD, Negro Vilar R, Paine SS, Douglas JM, Jr., Pelc NJ. MR characterization of blood flow in native and grafted internal mammary arteries. J Magn Reson Imaging. 1993;3:443-50.
6. Sakuma H, Globits S, O’Sullivan M, Shimakawa A, Bernstein MA, Foo TK, Amidon TM, Takeda K, Nakagawa T, Higgins CB. Breath-hold MR measurements of blood flow velocity in internal mammary arteries and coronary artery bypass grafts. J Magn Reson Imaging. 1996;6:219-22.
7. Ishida N, Sakuma H, Cruz BP, Shimono T, Tokui T, Yada I, Takeda K, Higgins CB. Mr flow measurement in the internal mammary artery-to-coronary artery bypass graft: comparison with graft stenosis at radio-graphic angiography. Radiology. 2001;220:441-7.
8. Frayne R, Holdsworth DW, Gowman LM, Rickey DW, Drangova M, Fenster A, Rutt BK. Computer-con-trolled flow simulator for MR flow studies. J Magn Reson Imaging. 1992;2:605-12.
9. Holdsworth DW, Rickey DW, Drangova M, Miller DJ, Fenster A. Computer-controlled positive displace-ment pump for physiological flow simulation. Med Biol Eng Comput. 1991;29:565-570.
10. Rebergen SA, Chin JG, Ottenkamp J, van der Wall EE, de Roos A. Pulmonary regurgitation in the late postoperative follow-up of tetralogy of Fallot. Volumetric quantitation by nuclear magnetic resonance velocity mapping. Circulation. 1993;88:2257-66.
11. Sakuma H, Kawada N, Kubo H, Nishide Y, Takano K, Kato N, Takeda K. Effect of breath holding on blood flow measurement using fast velocity encoded cine MRI. Magn Reson Med. 2001;45:346-348.
12. Wilson RF, Wyche K, Christensen BV, Zimmer S, Laxson DD. Effects of adenosine on human coronary arte-rial circulation. Circulation. 1990;82:1595-606.
13. van der Geest RJ, Niezen RA, van der Wall EE, de Roos A, Reiber JH. Automated measurement of volume flow in the ascending aorta using MR velocity maps: evaluation of inter- and intraobserver variability in healthy volunteers. J Comput Assist Tomogr. 1998;22:904-911.
14. van der Geest RJ, Reiber JH. Quantification in cardiac MRI. J Magn Reson Imaging. 1999;10:602-608. 15. Salm LP, Langerak SE, Vliegen HW, Jukema JW, Bax JJ, Zwinderman AH, van der Wall EE, de Roos A, Lamb
HJ. Blood flow in coronary artery bypass vein grafts: volume versus velocity at cardiovascular MR imag-ing. Radiology. 2004;232:915-920.
16. Langerak SE, Vliegen HW, Jukema JW, Zwinderman AH, Lamb HJ, de Roos A, van der Wall EE. Vein graft function improvement after percutaneous intervention: evaluation with MR flow mapping. Radiology. 2003;228:834-841.
17. Gurne O, Chenu P, Polidori C, Louagie Y, Buche M, Haxhe JP, Eucher P, Marchandise B, Schroeder E. Func-tional evaluation of internal mammary artery bypass grafts in the early and late postoperative periods. J Am Coll Cardiol. 1995;25:1120-8.
18. Lotz J, Meier C, Leppert A, Galanski M. Cardiovascular flow measurement with phase-contrast MR imag-ing: basic facts and implementation. Radiographics. 2002;22:651-671.
19. Boesiger P, Maier SE, Kecheng L, Scheidegger MB, Meier D. Visualization and quantification of the human blood flow by magnetic resonance imaging. J Biomech. 1992;25:55-67.
20. Meier D, Maier S, Boesiger P. Quantitative flow measurements on phantoms and on blood vessels with MR. Magn Reson Med. 1988;8:25-34.
21. Firmin DN, Nayler GL, Kilner PJ, Longmore DB. The application of phase shifts in NMR for flow measure-ment. Magn Reson Med. 1990;14:230-241.
22. Hoogeveen RM, Bakker CJ, Viergever MA. MR phase-contrast flow measurement with limited spatial resolution in small vessels: value of model-based image analysis. Magn Reson Med. 1999;41:520-8.

188 Chapter 12
23. Tang C, Blatter DD, Parker DL. Accuracy of phase-contrast flow measurements in the presence of partial- volume effects. J Magn Reson Imaging. 1993;3:377-385.
24. van den Hout RJ, Lamb HJ, van den Aardweg JG, Schot R, Steendijk P, van der Wall EE, Bax JJ, de Roos A. Real-time MR imaging of aortic flow: influence of breathing on left ventricular stroke volume in chronic obstructive pulmonary disease. Radiology. 2003;229:513-519.
25. Akasaka T, Yoshikawa J, Yoshida K, Maeda K, Hozumi T, Nasu M, Shomura T. Flow capacity of internal mammary artery grafts: early restriction and later improvement assessed by Doppler guide wire. Com-parison with saphenous vein grafts. J Am Coll Cardiol. 1995;25:640-7.
26. Stauder NI, Scheule AM, Hahn U, Fenchel M, Eckstein FS, Kramer U, Claussen CD, Miller S. Perioperative monitoring of flow and patency in native and grafted internal mammary arteries using a combined MR protocol. Br J Radiol. 2005;78:292-298.
27. Galjee MA, van Rossum AC, Doesburg T, van Eenige MJ, Visser CA. Value of magnetic resonance imag-ing in assessing patency and function of coronary artery bypass grafts. An angiographically controlled study. Circulation. 1996;93:660-6.
28. Hoogendoorn LI, Pattynama PM, Buis B, van der Geest RJ, van der Wall EE, de Roos A. Noninvasive evalu-ation of aortocoronary bypass grafts with magnetic resonance flow mapping. Am J Cardiol. 1995;75:845-8.


Anatomical versus Functional
Imaging in the Evaluation of
Coronary Artery Disease
Part III


Diagnostic and Prognostic Value of
Non-Invasive Imaging in Known or Suspected
Coronary Artery Disease
Eur J Nucl Med Mol Imaging 2006; 33: 93-104
Joanne D. Schuijf, Don Poldermans, Leslee J. Shaw, Hildo J. Lamb, Albert de Roos, William Wijns, Ernst E. van der Wall, Jeroen J. Bax
13Chapter

194 Chapter 13
Abstract
The role of non-invasive imaging techniques in the evaluation of patients with suspected or
known coronary artery disease (CAD) has increased exponentially over the past decade. The
traditionally available imaging modalities, including nuclear imaging, stress echocardiography
and magnetic resonance imaging (MRI), relied on detection of CAD by visualization of its
functional consequences (i.e. ischemia). However, at present, extensive research is invested
in the development of non-invasive anatomical imaging using computed tomography (CT) or
MRI to allow detection of (significant) atherosclerosis, eventually at a pre-clinical stage.
In addition to establishing the presence of or excluding CAD, identification of patients at high
risk for cardiac events is of paramount importance to determine post-test management and
for this purpose the majority of non-invasive imaging tests can also be used. The aim of the
present chapter is to provide an overview of the available non-invasive imaging modalities
and their merits for the diagnostic and prognostic work-up in patients with suspected or
known CAD.

195Diagnostic and Prognostic Value of Non-Invasive Imaging in Known or Suspected Coronary Artery Disease
Introduction
In the evaluation of patients with suspected or known coronary artery disease (CAD), the role of non-
invasive imaging techniques has increased exponentially over the past decade. The traditionally
available imaging modalities relied on identification of the presence of significant coronary artery
stenoses, by visualization of their functional consequences (i.e. ischemia), reflected by an induction
of myocardial perfusion or systolic wall motion abnormalities following stress. For this purpose,
nuclear imaging techniques, stress echocardiography and magnetic resonance imaging (MRI) are
currently employed. Although these modalities permit reliable detection of ischemia, the presence
of (significant) atherosclerosis in the absence of a flow-limiting stenosis is not detectable. At present,
extensive research is invested in the development of non-invasive anatomical imaging, e.g. non-
invasive assessment of coronary artery calcium or even non-invasive coronary angiography using
computed tomography (CT) or MRI. With these techniques, the presence of atherosclerosis rather
than ischemia is being evaluated.
Besides the detection or exclusion of CAD (diagnosis), identification of patients at high risk for
adverse events (prognosis) is crucial to determine post-test management and to select those
patients who may benefit from revascularization. Indeed, the non-invasive imaging tests provide not
only diagnostic but also powerful prognostic information. The purpose of this review is to provide
an overview of the available non-invasive imaging modalities and their merits in the diagnosis and
prognosis in patients with suspected or known CAD.
Diagnosis of coronary artery disease
Detection of atherosclerosis
Although detection of ischemia provides a reliable evaluation of patients with known or suspected
CAD, the recent development of non-invasive imaging of coronary anatomy has increased the
interest in detection of atherosclerosis in addition to ischemia. In particular, assessment of diffuse
atherosclerosis without ischemia may target assessment of preclinical disease. For this purpose,
evaluation of coronary artery calcium by CT techniques has attracted substantial attention, and
more recent technological developments have resulted in the possibility to perform non-invasive
coronary angiography.
Currently, non-invasive angiography is feasible with MRI, multi-slice CT (MSCT) and electron beam
computed tomography (EBCT). Since the coronary arteries are small, tortuous and move substantially
during the cardiac cycle, imaging remains technically challenging. As a result, all techniques still have
shortcomings and limitations, but with the rapid technical advances, image quality and diagnostic
accuracy are continuously improving. Besides non-invasive angiography, these techniques may in
the future also allow assessment of plaque composition 1.

196 Chapter 13
Coronaryarterycalciumscoring
EBCT and MSCT allow non-invasive detection and quantification of coronary artery calcium. In
Figure 1, examples of coronary calcium imaging with MSCT are shown. Both EBCT and MSCT provide
similar measures of coronary artery calcium but the majority of data has been obtained with EBCT,
which has a lower radiation dose and superior reproducibility. The Agatston score is the most
widely applied technique for quantification of coronary artery calcium 2. Although the presence of
coronary artery calcium is closely correlated with the total atherosclerotic burden, it is not predictive
of significant coronary stenoses and it is not site-specific, meaning that calcified segments are not
necessarily stenosed, and the reverse 3.
Figure 1. Single-level MSCT calcium scans of patients with respectively no (Panel A), minor (Panel B) and extensive (Panel C) coronary calcifications. Coronary calcifications are identified as regions with high signal intensity, thus appearing as intensely white structures on the MSCT images.Abbreviations: Ao: Aorta, LAD: left anterior descending coronary artery, RCA: right coronary artery.
Also, non-calcified plaques with a low X-ray density are not detected by coronary artery calcium
imaging. However, an approximate of the total atherosclerotic plaque burden is provided and thus the
likelihood of having focally obstructive CAD increases in parallel to the coronary artery calcium score 4.
Non-invasivecoronaryangiography
Magnetic resonance imaging. With the first generation of MR coronary angiography techniques,
only one 2D image was acquired per breath-hold, requiring a substantial number of consecutive
breath-holds. Accordingly, the clinical applicability was limited 5. Superior image quality was
achieved by 3D imaging, while real-time monitoring of diaphragm motion (respiratory navigator-
gating) has enabled data acquisition during free breathing. A pooled analysis of 28 studies (n=903
patients) comparing MRI with invasive angiography as the standard demonstrated a weighted mean
sensitivity of 72% with a specificity of 87% 6. However, the individual studies show a wide variation
in diagnostic accuracy and only 1 multi-center study has been reported thus far 7. In addition, MRI
techniques are still hampered by the relatively long acquisition times, and a substantial percentage
of segments remains uninterpretable (Figure 2). Improvement of image quality and diagnostic
accuracy is anticipated with the introduction of 3Tesla systems and newer acquisition protocols,
including balanced steady-state-free-precession techniques and the improvement of blood pool
contrast agents.

197Diagnostic and Prognostic Value of Non-Invasive Imaging in Known or Suspected Coronary Artery Disease
Figure 2. Diagnostic accuracies of the different non-invasive coronary angiography techniques, based on references 6;8.
Electron beam computed tomography. During EBCT, X-rays are created through an electron beam
that is guided along a 210° tungsten target ring in the gantry. As a result, images are acquired with
high temporal resolution (50-100 ms, depending on the scanner mode used). The acquisition of
serial overlapping cross-sectional images with a 1.5 or 3.0 mm slice thickness is performed using
prospective ECG triggering. To cover the whole heart, 40 to 50 slices are necessary, typically requiring
a breath-hold of 30 to 40 seconds, depending on the heart rate.
A recently published pooled analysis of 10 studies with a total of 538 patients showed a weighted mean
sensitivity and specificity of 87% and 91% to detect CAD with EBCT as compared to invasive angiography
(Figure 2) 8. High percentages of uninterpretable segments were consistently observed, with exclusion
of approximately 20% of segments from analysis. Another major limitation is the presence of extensive
coronary calcifications that interfere with stenosis assessment and lead to overestimation of the degree
of luminal narrowing. Motion artifacts also frequently occur, since prospective triggering is used, which
does not allow reconstruction of data at other phases of the cardiac cycle. Consequently, EBCT is felt to
be not yet robust enough to justify its implementation in clinical routine.
Multi-slice computed tomography. In the late 1990s, MSCT systems were introduced allowing
the acquisition of multiple (4) slices instead of 1 slice in a single gantry rotation, thereby enabling
CT systems to visualize the coronary arteries. Similar to EBCT, administration of iodinated contrast
agent is needed. The initial results with the 4-slice systems were promising, although 20% of
coronary segments had to be excluded from analysis due to non-diagnostic quality 6. Substantial
improvement was achieved by the introduction of 16-slice scanners with submillimeter collimation
as well as faster rotation times. At present, 11 studies (681 patients) have reported on the accuracy
of 16-slice MSCT in comparison to conventional coronary angiography 6. On average, an increase in
sensitivity from 80% (4-slice systems) to 88% (16-slice systems) was noted, with no loss in specificity.
Furthermore, more complete coverage of the coronary tree was achieved, with an average of 96%
of coronary segments showing sufficient image quality to allow interpretation. Overall diagnostic
83 8478
96
72
8780
888791 94 96
0
20
40
60
80
100
MRI (n=903)
EBCT (n=538)
4-slice MSCT(n=569)
16-slice MSCT(n=627)
%
% Assessable
Sensitivity
Specificity

198 Chapter 13
accuracy and percentage interpretable segments with MSCT are depicted in Figure 2. In general, the
specificity of MSCT is extremely high, suggesting that accurate exclusion of CAD can be achieved.
However, no large studies have targeted low prevalence patient groups thus far. Further refinement
of the technique may be achieved with the recently introduced 64-slice systems, of which an
example is provided in Figure 3. Despite these encouraging results the technique has still several
limitations. The radiation exposure during MSCT examination is in the range of 9-12 mSv, and
refinements of imaging protocols are warranted to lower the radiation exposure. In addition, the
reported results depend largely on patient selection, with a substantially lower accuracy in patients
with higher heart rates or arrhythmias due to motion artifacts 9. To circumvent this problem, routine
administration of beta-blocking medication is currently performed in many centers. Image quality
may also be degraded in patients with severe CAD due to the presence of extensive calcifications
which potentially limit precise assessment of the stenosis severity 10.
Figure 3. Example of non-invasive coronary angiography with 64-slice MSCT. In Panel A, a curved multiplanar reconstruction of the right coronary artery with stent placement is shown. No significant stenoses are observed. In Panel B, a 3D volume-rendered reconstruction is depicted, showing the right coronary artery and its side-branches. Findings were confirmed by invasive coronary angiography (Panel C).
However, whether elevated calcium scores should be used as an indication to defer MSCT coronary
angiography remains debatable with recent research suggesting unaffected diagnostic accuracy
even in the presence of high coronary calcification scores 11. Accordingly, further investigations
are needed to determine which patient groups may ultimately benefit the most from non-invasive
coronary angiography with MSCT 12.
Detection of ischemia
In the presence of a flow-limiting stenosis, resting myocardial blood flow is still preserved, whereas
increased myocardial oxygen demand will result in a demand/supply mismatch, leading to inducible
myocardial ischemia. As a result, a sequence of events is initiated, which is referred to as the ischemic
cascade 13. Perfusion abnormalities are induced at an early stage, followed by diastolic and systolic
left ventricular (LV) dysfunction. ECG changes and angina only occur at the end of the cascade.

199Diagnostic and Prognostic Value of Non-Invasive Imaging in Known or Suspected Coronary Artery Disease
Various imaging modalities are available to demonstrate these early changes during ischemia,
including (gated) SPECT or PET, (contrast) stress echocardiography and MRI; local availability and
expertise mainly determine which technique is used. Stress can be achieved using physical (bicycle
or treadmill) exercise, or pharmacological stress (using dobutamine or vasodilators including
dipyridamole and adenosine).
Nuclearimagingtechniques
Single photon emission computed tomography. The most widely available nuclear technique to
assess myocardial perfusion is SPECT using thallium-201, technetium-99m sestamibi or technetium-
99m tetrofosmin. Average sensitivity and specificity, based on a pooled analysis of 79 studies with
8964 patients included, are 86% and 74%, respectively 14. Although the technique is very sensitive, as
perfusion abnormalities occur early in the ischemic cascade, specificity is lower, as shown in Figure
4. This may (in part) be related to post-test referral bias, meaning that patients with normal studies
will only be referred for coronary angiography when the suspicion for CAD is high. Since the majority
of true negative patients will not be referred, a relatively high false positive rate will be obtained,
resulting in a lower specificity. To circumvent this problem, the normalcy rate is used, which indicates
the frequency of normal test results in patients with a low to intermediate likelihood of CAD. In a
pooled analysis of 10 SPECT studies (n=543 patients) the normalcy rate was 89% 14.
Figure 4. Diagnostic accuracy of nuclear imaging techniques to detect significant CAD (Data based on references 14;15).
Another frequently encountered cause of reduced specificity is the occurrence of artefacts due to soft
tissue attenuation that are mistaken for true perfusion defects. For this purpose, dedicated hardware
and software have been developed that allow direct reconstruction of attenuation corrected images
based on measurements of the attenuation distribution profile 16. In addition, the use of ECG gated
imaging, which has allowed simultaneous assessment of LV function, has led to further improvement
of the diagnostic accuracy of SPECT. By identifying normal wall motion in segments with artifacts
86 89
74
8689
0
20
40
60
80
100
SPECT (n=8964) PET (n=663)
%
Sensitivity
Specificity
Normalcy (n=543)

200 Chapter 13
due to soft tissue attenuation, a substantial reduction in the number of false-positive test results
can potentially be achieved 17. Indeed, Smanio et al demonstrated an increase in normalcy rate from
74% to 93%, while the number of inconclusive tests decreased from 31% to 10% through addition of
systolic function data to the original perfusion data 18.
Positron emission tomography. The main advantages of PET over SPECT are the systematic use
of attenuation correction and the feasibility to perform absolute quantification of perfusion (ml/
min/g). Nitrogen-13 ammonia, rubidium-82 and Oxygen-15 labeled water are the most commonly
used tracers. Pooled analysis of 7 studies (1 study using nitrogen-13 ammonia, 4 with rubidium-82
and 2 using both) including 663 patients revealed a sensitivity and specificity of 89% and 86% to
detect CAD (Figure 4) 15. In addition to the higher specificity as compared to SPECT, another potential
advantage of PET is the high spatial resolution that allows distinction between epi- and endocardial
perfusion in some cases 19. In addition, PET is the only technique that permits absolute quantification
of resting and hyperemic blood flow, thereby allowing quantification of coronary flow reserve (CFR).
This is of particular importance, since even in the absence of obstructive coronary artery disease,
endothelial dysfunction that is associated with early atherosclerosis can be assessed by measuring
CFR. Indeed, evidence is accumulating that in the presence of risk factors for CAD, including
hypercholesterolemia, hypertension, diabetes mellitus and smoking, abnormal endothelial function
is precedes clinically overt atherosclerotic changes in the epicardial coronary arteries 20-25. In addition,
microvascular disease can be assessed by quantitative measurements of blood flow and CFR using
PET.
Thus, PET can be used to measure early atherosclerotic disease activity and resultant damage in
patients with elevated risk profiles. Moreover, these measurements also permit monitoring response
to different therapeutic strategies, including pharmacotherapy and life-style modification 26-28.
Echocardiography
Stress echocardiography. The hallmark of myocardial ischemia during stress echocardiography
is the induction of reduced systolic wall thickening. Pooled analysis of 43 available studies on the
diagnostic accuracy of exercise echocardiography (15 studies, n=1849 patients) showed a weighted
mean sensitivity of 84% and specificity of 82% and 80% and 84% for dobutamine echocardiography
(28 studies, n=2246 patients) (Figure 5) 29.
Contrast echocardiography. Limitations of stress echocardiography include suboptimal image
quality (due to poor acoustic window or drop-out of the anterior and lateral wall) in 10-15% of
patients, the operator dependency and reduced reproducibility. Second harmonic imaging as well as
the use of intravenous contrast agents improve image quality. In addition, contrast echocardiography
allows assessment of myocardial perfusion. The diagnostic value of stress echocardiography is
enhanced by integration of perfusion and systolic wall motion abnormalities. Pooled analysis of the
available studies (7 reports, n=245 patients) demonstrated a weighted mean sensitivity of 89% and a
specificity of 63% (Figure 5) 30-36. Thus, specificity of contrast echocardiography is reduced, which may

201Diagnostic and Prognostic Value of Non-Invasive Imaging in Known or Suspected Coronary Artery Disease
(partially) be attributable to the still limited experience with image interpretation and optimization
of data acquisition 31;32. Furthermore, a considerable variation exists among the available studies
in both acquisition protocols and stressors. Consequently, no definite conclusions on the precise
diagnostic accuracy of contrast echocardiography can currently be drawn.
Magneticresonanceimaging
Myocardial perfusion is evaluated by injecting a bolus of contrast agent followed by continuous data
acquisition as the contrast passes through the cardiac chambers and into the myocardium. Relative
perfusion deficits are recognized as regions of low signal intensity within the myocardium. Due to the
high spatial resolution of MRI, the technique is, even better than PET imaging, capable of differentiation
between subendocardial and transmural perfusion defects. At present, weighted mean sensitivity and
specificity, derived from 17 reports with 502 patients are 84% and 85% (Figure 6) 29;37-39.
In addition to myocardial perfusion, global and regional systolic LV function can be assessed with
high accuracy with MRI as well. Pooled analysis of 10 studies (n=654 patients) yielded a weighted
mean sensitivity and specificity of 89% and 84% to detect CAD (Figure 6) 29;37.
Figure 6. Diagnostic accuracy of perfusion and wall motion imaging MRI (Data are based on references 29;37-39).
84 8280 8489
63
0
20
40
60
80
100
Sensitivity Specificity
%
Exercise (n=1849)
Dobutamine (n=2246)
Contrast (n=245)
Figure 5. Diagnostic accuracy of stress-echocardiography (Data based on reference 29).
84 8589
84
0
20
40
60
80
100
Sensitivity Specificity
%
MR perfusion(n=502)
MR wall motion(n=654)

202 Chapter 13
Prognosis of coronary artery disease
Besides diagnosis of CAD, non-invasive imaging also provides prognostic information. For this
purpose, patients are generally classified in 3 categories. Patients are considered at low risk when
the cardiac mortality rate per year is less than 1%, whereas patients are considered at high risk when
cardiac mortality exceeds 3% per year. Patients with an annual mortality rate between 1% and 3%
are classified at intermediate risk.
Patients with low to intermediate risk may benefit from aggressive risk factor modification, whereas
invasive evaluation followed by intervention should be considered in patients with high risk.
Prognostic value of atherosclerosis
Extensive data are available on risk stratification by assessment of coronary artery calcium using EBCT.
Since the presence of calcium in the coronary arteries is indicative for the presence of atherosclerosis,
prognostic information can be derived from the total coronary calcium burden. However, much
controversy still exists to the question whether coronary artery calcium scoring can provide prognostic
information that is incremental to conventional cardiac risk assessment, as based on the Framingham
model or the EuroSCORE. To address this issue, a meta-analysis of studies performing follow-up of
asymptomatic individuals after EBCT calcium measurement was recently performed. Only studies that
provided score-specific relative risks, adjusted for established risk factors, were included, resulting in
analysis of 4 studies with a total of 3970 patients included 40. For calcium scores in the range of 1 to 100,
a summary adjusted relative risk of 2.1% was observed. Higher relative risk estimates were obtained
for higher calcium scores, ranging from 3.0 to 17.0 for calcium scores higher than 400, demonstrating
that coronary artery calcium score indeed provides prognostic information incremental to risk factors.
These findings were further confirmed by Shaw et al, who performed a 5-year follow-up study of a
large cohort of 10.377 asymptomatic individuals after coronary artery calcium scoring with EBCT 41.
Figure 7. Prognostic value of coronary artery calcium scoring with EBCT. Data have been obtained over a 5-year follow-up period in 10.377 asymptomatic individuals with risk factors for CAD (Data based on reference 41).
1
2.63.8
6.2
12.3
0
2
4
6
8
10
12
14
<10 11-100 101-400 401-1000 >1000
Calcium score
All
Cau
se D
eath
(%
)
1
2.63.8
6.2
12.3
0
2
4
6
8
10
12
14
<10 11-100 101-400 401-1000 >1000
Calcium score
All
Cau
se D
eath
(%
)

203Diagnostic and Prognostic Value of Non-Invasive Imaging in Known or Suspected Coronary Artery Disease
As depicted in Figure 7, patients with minimal or no calcium had an excellent survival with a
mortality rate of 1%, whereas mortality increased to 12.3% for patients with a score >1000. In a risk-
adjusted model of mortality, it was demonstrated that the coronary artery calcium score was indeed
a strong and independent predictor of all cause mortality. In fact, the authors showed that for
various Framingham risk subsets, coronary artery calcium score could provide superior prediction
of death, with 5-year mortality rates increasing from 1.1% for scores <10 to 9.0% for scores >1000
in patients at an intermediate risk. Even in low-risk patients, coronary artery calcium score could
provide refinement of risk stratification, with mortality rates increasing for 0.9% to 3.9% similar to
above. Accordingly, coronary artery calcium screening may be used to identify those patients in
whom aggressive risk reduction is needed, although the precise threshold of calcium value above
which intervention is warranted is still unclear due to the wide inter-study variation.
In addition to risk stratification, measurements of coronary calcium may also be used to monitor
anti-atherosclerotic effect of medical therapy. Callister et al performed both baseline and follow-up
assessment after a minimum of 12 months in 149 patients without previously known CAD, referred
for screening with EBCT 42. In 105 patients lipid-lowering treatment was started at the discretion of the
referring physician. In all patients, serial measurements of low-density lipoprotein (LDL) cholesterol
were obtained in order to relate LDL levels to changes in calcium scores. In the untreated population,
as well as in patients with LDL-levels still higher than 120 mg/dl despite medical treatment, increase
in mean calcium-volume scores of respectively +52 ± 36% and +25 ± 22% (P<0.001) were observed.
However, in patients that did respond to medical treatment, as reflected by LDL levels lower than
120 mg/dl, a slight decrease in calcium volumes was observed (-7 ± 23%, P=0.01). These findings
suggest that EBCT calcium assessment may also allow non-invasive monitoring of response to
medical therapy.
In contrast to EBCT calcium scanning, non-invasive angiography with either MRI or CT techniques is
relatively new and the prognostic value of these techniques has not been established yet.
Prognostic value of ischemia
Numerous studies have ascertained the relation between the presence of stress-inducible ischemia
and prognosis. Since both the induction of perfusion defects as well as wall motion abnormalities
are indicative of ischemia, all techniques that assess these phenomena can theoretically be used for
prognostification. Indeed, a large body of evidence has been obtained with particularly both nuclear
techniques and echocardiography and risk stratification has become an integral part of these tests.
Similarly, also MRI is likely to allow prognostification in addition to the diagnosis of CAD, although
thus far, limited data are available.
Nucleartechniques
Single photon emission computed tomography. Of all studies dedicated to the assessment of
prognosis in patients with suspected or known CAD, the vast majority have used SPECT. Recently,
a meta-analysis of 31 papers comprising 69.655 patients on the prognostic value of SPECT was

204 Chapter 13
published 43. A normal SPECT study was associated with an average hard event rate (cardiac death or
myocardial infarction) of 0.85% per year, which is comparable to event rates in the general population
without any evidence of CAD. In contrast, the hard event rate was 5.9% per year in patients with a
moderately-severely abnormal SPECT study. In Figure 8, average annual event rates for normal and
abnormal SPECT studies, obtained with either exercise or pharmacological stress are shown. From
these data, it can be observed that studies using pharmacological stress show event rates that are
slightly higher both in normal and abnormal studies, as compared to exercise testing. Accordingly,
a difference in baseline characteristics and thus risk for cardiac events may exist between patients
selected for pharmacological stress testing and those who can perform an exercise protocol.
Moreover, exercise capacity itself has been shown to be a strong predictor of death 44 and is thus
likely to influence event rates observed after stress testing. This observation was recently confirmed
by Navare and colleagues 45 who performed a meta-analysis of 24 studies evaluating prognosis with
either pharmacological or exercise stress SPECT comprising 14.918 patients. Although based on the
similarity of the obtained odds ratios and ROC curves risk stratification was shown to be comparable
between both techniques, high event rates were observed with pharmacological stress. Indeed,
comparison of demographics revealed that patients selected for this type of stress were in general
older, and had a higher prevalence of other factors of poor prognosis, including type 2 diabetes
mellitus or previous myocardial infarction.
Figure 8. Prognostic value of SPECT, obtained in 69655 patients. Numbers between parentheses are number of patients included (Data are based on reference 43).
Accordingly, these findings underline the relevance of the type of stress used as well as the individual
patient’s characteristics when interpreting the prognostic significance of a functional imaging
study.
It is well known that LV function (LV ejection fraction) and LV volumes also provide powerful
prognostic information 46;47. With the introduction of gated SPECT, it became possible to integrate
information on perfusion and function. Sharir et al were the first to demonstrate the strong
0.71.2 0.9
5.6
8.3
5.9
0
2
4
6
8
10
Exercise Pharmacological
(n=11231)
Ann
ual E
vent
Rat
e (%
/ Y
ear)
NormalAbnormal
(n=58424) (n=69655)
All patients regardless of stress protocol

205Diagnostic and Prognostic Value of Non-Invasive Imaging in Known or Suspected Coronary Artery Disease
prognostic power of gated SPECT when perfusion and function data were integrated in 2.686
patients with a mean follow-up of 21 ± 4.6 months 47. After adjustment for clinical information, the
amount of perfusion defect reversibility was demonstrated to be the strongest predictor for non-
fatal myocardial infarction, whereas cardiac death was best predicted by post-stress left ventricular
ejection fraction. This observation is of interest and supports the idea that ischemic events (e.g.
infarction) are best predicted by the extent of reversible perfusion abnormalities, whereas the
extent of scar tissue as reflected in the severity of reduction in LVEF is most predictive of cardiac
death. Recent data suggest that further refinement of risk stratification can be achieved using end-
diastolic and end-systolic volume measures in addition to LVEF 48. Also, the observation of transient
ischemic dilatation during stress has been shown to be associated with worse prognosis, even in the
presence of normal myocardial perfusion 49. Particularly in such settings, when perfusion is normal
or near-normal, these ancillary findings can have important implications for prognosis that would
have been deemed to be excellent on the basis of the perfusion data only.
Accordingly, functional imaging with SPECT has become an established modality in the identification
of patients at elevated risk and who may benefit from more aggressive medical therapy or
revascularization.
Positron emission tomography. Currently, minimal data are available on the prognostic value of
PET. Marwick et al evaluated the prognostic value of rubidium-82 PET in 685 patients with suspected or
known CAD after a mean follow-up of 41 months 50. Mortality rate was significantly less in patients with
a normal PET study (0.9%) as compared to patients with an abnormal study (4.3%). When all events,
including also myocardial infarction, unstable angina and late (>3 months after the initial PET study)
revascularization, were taken into account, a normal examination was associated with a 90% event-
free survival, whereas event-free survival in patients with small, moderate and extensive abnormalities
were 87%, 75% and 76% respectively. Based on Cox proportional-hazards models, the PET results were
demonstrated to be incremental to those of clinical and angiographic evaluation. Accordingly, PET may
be a valuable alternative for prognostification, particularly in patients that are technically challenging
to image with SPECT, such as obese patients or with extensive previous infarction.
Echocardiography
Besides SPECT, stress echocardiography is often used for risk stratification in patients with suspected
or known CAD. Similar to SPECT, it has been shown that a negative stress echocardiogram is associated
with an excellent prognosis allowing identification of patients at low risk 51. Pooled analysis of 13
stress echocardiography studies with 32.739 patients included, revealed an annual hard event rate
(death or myocardial infarction) of 1.2% for a normal stress echocardiogram as compared to 7.0% for
an abnormal study 52-64. In Figure 9, annual event rates for normal and abnormal studies are depicted
for stress echocardiography according to the different stressors used. Although the emerging use of
simultaneous assessment of myocardial perfusion by means of contrast administration is likely to
enhance the prognostic value of stress echocardiography, no data are currently available to support
this notion.

206 Chapter 13
Figure 9. Annual event rates (death or myocardial infarction) of normal and abnormal stress echocardiograms, obtained by pooled analysis of 13 studies with 32739 patients. Numbers between parentheses are number of patients included. For the individual analyses of either exercise or dobutamine stress only studies specifically stating the use of either exercise or dobutamine stress were included, while studies performing different stress protocols interchangeably during the study protocol were disregarded. However, these studies were included in the combined analysis of all available studies. (Data based on references 52-64).
Magneticresonanceimaging
Currently, only limited data on the value of MRI for prognosis in CAD are available. No prognostic
data on MRI perfusion assessment are available, and only one study has evaluated the prognostic
value of MRI wall motion assessment for prognostification. Hundley and colleagues performed
stress-rest MRI and focused on systolic wall motion. The study comprised 279 patients who were
referred for MRI because of poor LV endocardial border delineation on echocardiography 65.
Patients were categorized according to the presence, extent, and location of inducible wall motion
abnormalities during dobutamine/atropine administration and according to the LVEF being <40%
or ≥40%. Over a mean follow-up period of 20 months, the annual hard event rate, defined as the
occurrence of cardiac death or myocardial infarction, was 2% in the patients preserved LVEF (≥40%)
without ischemia. Conversely, the annual hard event rate was 13% in the patients with depressed
LVEF (<40%), regardless of the presence of ischemia. In patients with a LVEF ≥40% and evidence of
inducible ischemia the annual hard event rate was 10.6%. These data illustrate the potential role of
MRI for prognosis in patients with suspected or known CAD, but larger studies are needed.
Summary and Future Perspectives
With the increasing number of patients referred for evaluation of the presence and extent of CAD,
non-invasive imaging techniques have become very important in the clinical patient management.
Initially, the available techniques relied on visualization of ischemia using myocardial perfusion (with
nuclear imaging techniques) or systolic wall motion (with echocardiography). With recent technical
1.21.7
0.5
7.0
4.8
2.6
0
2
4
6
8
10
Exercise
(n=11517)
Dobutamine
(n=4018)
Available studies combined
(n=32739)
Ann
ual E
vent
Rat
e (%
/ Y
ear)
NormalAbnormal

207Diagnostic and Prognostic Value of Non-Invasive Imaging in Known or Suspected Coronary Artery Disease
developments, both nuclear imaging and echocardiography currently allow assessment of both
perfusion and systolic function, thereby enhancing their diagnostic accuracy. Similarly, MRI can also
provide integrated assessment of perfusion and systolic wall motion, with a comparable accuracy
to SPECT and echocardiography. In addition to the diagnosis of CAD, SPECT and echocardiography
have been used extensively for risk stratification.
Besides the evaluation of ischemia with the established non-invasive imaging techniques, the
assessment of coronary artery calcium with CT techniques, and even non-invasive angiography
with MSCT and MRI is shifting the emphasis from ischemia detection to assessment of preclinical
atherosclerosis and coronary anatomy. Although these techniques appear very accurate for
exclusion of atherosclerosis, it is currently unclear what the clinical value is when these examinations
demonstrate atherosclerosis. The following case report is presented to illustrate this dilemma.
A 54-year old man presented to the outpatient clinic with atypical chest pain, smoking and
hypercholesterolemia. The patient was referred for further evaluation using gated SPECT and non-
invasive angiography using MSCT. The SPECT study was performed using bicycle exercise; blood
pressure and heart rate response were normal, exercise capacity was adequate, the exercise ECG
Figure 10. Non-invasive imaging in a 54-year old man with suspected CAD. SPECT perfusion imaging demon-strated normal myocardial perfusion in all territories (Panel A). MSCT coronary angiography was also performed (Panel B). From the left to the right, curved multiplanar reconstructions are shown of the right coronary artery (RCA), left circumflex (LCx) and left anterior descending coronary artery (LAD). Only minor wall irregularities were observed in the RCA and LCx. In the LAD however, a proximal extensive calcified lesion (arrow head) and various non-calcified plaques (arrows) were observed. Abbreviations: LAD: left anterior descending coronary artery, LCx: left circumflex coronary artery, RCA: right coronary artery, SA: short-axis, VLA: vertical long-axis.
stressSA, stress
SA,rest
VLA, stress
VLA, rest
A
B
RCA LCx LAD

208 Chapter 13
did not show ischemia and angina was not reported. The LVEF on the gated images was 63%, LV
volumes were normal. No perfusion abnormalities were observed during SPECT imaging, as shown
in Figure 10A. In Figure 10B, the results of the MSCT study are shown. Only minor wall irregularities
were observed in the right and left circumflex coronary artery. The left anterior descending coronary
artery however, showed a significant calcified lesion and various non-calcified plaques in the
proximal and mid part of the vessel.
Patient with Atypical Angina + Risk Factors
Calcium/MSCT - CA
Normal Atherosclerosis
Functional Imaging
Safe Discharge
Invasive coronary angiography and
revascularization if required
Ischemia No Ischemia
Medical Therapy and Aggressive Risk Factor
Modification
Figure 11. Flow-chart for patients presenting with an intermediate likelihood of CAD in which MSCT (calcium scoring and coronary angiography) is used as a first-line evaluation tool. Patients with normal coronary arteries can be discharged safely. If atherosclerosis is observed however, patients are referred for functional imaging to determine the presence of ischemia. Consequently, patients with inducible ischemia are then referred for inva-sive coronary angiography, potentially followed by revascularization. If no ischemia is demonstrated, patients can be managed with medical therapy and aggressive life-style and risk factor modification.

209Diagnostic and Prognostic Value of Non-Invasive Imaging in Known or Suspected Coronary Artery Disease
These findings now raise the question how this patient should be further treated. Should coronary
angiography be performed (with potential intervention) based on the lesions visualized on MSCT or
should aggressive medical therapy and risk factor modification be proposed based on the absence
of ischemia on the SPECT study?
Accordingly, algorithms are needed on when to use which of the 2 main categories of non-invasive
imaging: ischemia detection and atherosclerosis imaging. A potential algorithm is proposed in Figure 11.
First, imaging should mainly be applied to patients with an intermediate likelihood of CAD. In
these patients, who present with either atypical angina or who are even asymptomatic but have
an elevated risk profile due to the presence of coronary risk factors (e.g. type 2 diabetes mellitus),
a first step could be to assess coronary artery calcium or non-invasive angiography. In the absence
of coronary atherosclerosis, further imaging may not be needed and the patient can be reassured.
In the presence of atherosclerosis, assessment of ischemia is needed. When ischemia is absent, risk
factor modification and aggressive medical therapy is indicated. When ischemia is present, invasive
evaluation (and potential intervention) should follow. The required information can be gathered by
sequential testing using CT technology (to assess atherosclerosis/anatomy) and a technique that
allows assessment of ischemia (i.e. SPECT, PET, echo or MRI), or integrated imaging, which is possible
with PET-CT (or maybe in the near future with SPECT-CT).
Indeed, hybrid or dual-modality imaging offers the promising prospect of co-registration of
anatomic landmarks with physiological data. Since the CT images can be used for attenuation
correction, both efficiency and image quality of PET data acquisition is likely to improve, thereby
enhancing its diagnostic accuracy while reducing data acquisition time substantially. On the other
hand, incremental information will be added to the MSCT examination, since PET will provide data
on the pathophysiological impact of the detected lesions, which is needed to determine treatment
strategy. Accordingly, the simultaneous assessment of coronary lesions and their pathophysiological
impact is likely to enhance diagnostic certainty and optimize clinical decision-making, as recently
demonstrated by Namdar et al 66. From a practical point of view however, incorporation of CT with
SPECT systems may be preferable in daily clinical routine, and fusion of these two modalities is
currently under development.
In conclusion, non-invasive imaging is a powerful tool in the diagnostic and prognostic work-up of
patients with suspected or known CAD. Integration and fusion of imaging technologies will be the
future in management of patients, with a focus on integration of information on atherosclerosis and
ischemia.

210 Chapter 13
References1. Schroeder S, Kopp AF, Baumbach A, Meisner C, Kuettner A, Georg C, Ohnesorge B, Herdeg C, Claussen
CD, Karsch KR. Noninvasive detection and evaluation of atherosclerotic coronary plaques with multislice computed tomography. J Am Coll Cardiol. 2001;37:1430-1435.
2. Agatston AS, Janowitz WR, Hildner FJ, Zusmer NR, Viamonte M, Jr., Detrano R. Quantification of coronary artery calcium using ultrafast computed tomography. J Am Coll Cardiol. 1990;15:827-832.
3. O’Rourke RA, Brundage BH, Froelicher VF, Greenland P, Grundy SM, Hachamovitch R, Pohost GM, Shaw LJ, Weintraub WS, Winters WL, Jr. American College of Cardiology/American Heart Association Expert Consensus Document on electron-beam computed tomography for the diagnosis and prognosis of coronary artery disease. J Am Coll Cardiol. 2000;36:326-340.
4. Haberl R, Becker A, Leber A, Knez A, Becker C, Lang C, Bruning R, Reiser M, Steinbeck G. Correlation of coronary calcification and angiographically documented stenoses in patients with suspected coronary artery disease: results of 1,764 patients. J Am Coll Cardiol. 2001;37:451-457.
5. Manning WJ, Li W, Edelman RR. A preliminary report comparing magnetic resonance coronary angiog-raphy with conventional angiography. N Engl J Med. 1993;328:828-832.
6. Schuijf JD, Bax JJ, Shaw LJ, de Roos A, Lamb HJ, van der Wall EE, Wijns W. Meta-analysis of comparative diagnostic performance of magnetic resonance imaging and multislice computed tomography for non-invasive coronary angiography. Am Heart J. 2006;151:404-411.
7. Kim WY, Danias PG, Stuber M, Flamm SD, Plein S, Nagel E, Langerak SE, Weber OM, Pedersen EM, Schmidt M, Botnar RM, Manning WJ. Coronary magnetic resonance angiography for the detection of coronary stenoses. N Engl J Med. 2001;345:1863-1869.
8. Budoff MJ, Achenbach S, Duerinckx A. Clinical utility of computed tomography and magnetic resonance techniques for noninvasive coronary angiography. J Am Coll Cardiol. 2003;42:1867-1878.
9. Nieman K, Rensing BJ, van Geuns RJ, Vos J, Pattynama PM, Krestin GP, Serruys PW, de Feyter PJ. Non-in-vasive coronary angiography with multislice spiral computed tomography: impact of heart rate. Heart. 2002;88:470-474.
10. Hoffmann U, Moselewski F, Cury RC, Ferencik M, Jang IK, Diaz LJ, Abbara S, Brady TJ, Achenbach S. Pre-dictive value of 16-slice multidetector spiral computed tomography to detect significant obstructive coronary artery disease in patients at high risk for coronary artery disease: patient-versus segment-based analysis. Circulation. 2004;110:2638-2643.
11. Cademartiri F, Mollet NR, Lemos PA, Saia F, Runza G, Midiri M, Krestin GP, de Feyter PJ. Impact of coronary calcium score on diagnostic accuracy for the detection of significant coronary stenosis with multislice computed tomography angiography. Am J Cardiol. 2005;95:1225-1227.
12. Bax JJ, Schuijf JD. Which role for multislice computed tomography in clinical cardiology? Am Heart J. 2005;149:960-961.
13. Nesto RW, Kowalchuk GJ. The ischemic cascade: temporal sequence of hemodynamic, electrocardio-graphic and symptomatic expressions of ischemia. Am J Cardiol. 1987;59:23C-30C.
14. Underwood SR, Anagnostopoulos C, Cerqueira M, Ell PJ, Flint EJ, Harbinson M, Kelion AD, Al Mohammad A, Prvulovich EM, Shaw LJ, Tweddel AC. Myocardial perfusion scintigraphy: the evidence. Eur J Nucl Med Mol Imaging. 2004;31:261-291.
15. Klocke FJ, Baird MG, Lorell BH, Bateman TM, Messer JV, Berman DS, O’Gara PT, Carabello BA, Russell RO, Jr., Cerqueira MD, John Sutton MG, DeMaria AN, Udelson JE, Kennedy JW, Verani MS, Williams KA, Ant-man EM, Smith SC, Jr., Alpert JS, Gregoratos G, Anderson JL, Hiratzka LF, Faxon DP, Hunt SA, Fuster V, Jacobs AK, Gibbons RJ, Russell RO. ACC/AHA/ASNC guidelines for the clinical use of cardiac radionuclide imaging--executive summary: a report of the American College of Cardiology/American Heart Associa-tion Task Force on Practice Guidelines (ACC/AHA/ASNC Committee to Revise the 1995 Guidelines for the Clinical Use of Cardiac Radionuclide Imaging). J Am Coll Cardiol. 2003;42:1318-1333.
16. Bateman TM, Cullom SJ. Attenuation correction single-photon emission computed tomography myo-cardial perfusion imaging. Semin Nucl Med. 2005;35:37-51.
17. DePuey EG, Rozanski A. Using gated technetium-99m-sestamibi SPECT to characterize fixed myocardial defects as infarct or artifact. J Nucl Med. 1995;36:952-955.
18. Smanio PE, Watson DD, Segalla DL, Vinson EL, Smith WH, Beller GA. Value of gating of technetium-99m sestamibi single-photon emission computed tomographic imaging. J Am Coll Cardiol. 1997;30:1687-1692.

211Diagnostic and Prognostic Value of Non-Invasive Imaging in Known or Suspected Coronary Artery Disease
19. Jadvar H, Strauss HW, Segall GM. SPECT and PET in the evaluation of coronary artery disease. Radio-graphics. 1999;19:915-926.
20. Nitenberg A, Valensi P, Sachs R, Dali M, Aptecar E, Attali JR. Impairment of coronary vascular reserve and ACh-induced coronary vasodilation in diabetic patients with angiographically normal coronary arteries and normal left ventricular systolic function. Diabetes. 1993;42:1017-1025.
21. Frielingsdorf J, Seiler C, Kaufmann P, Vassalli G, Suter T, Hess OM. Normalization of abnormal coronary vasomotion by calcium antagonists in patients with hypertension. Circulation. 1996;93:1380-1387.
22. Frielingsdorf J, Kaufmann P, Seiler C, Vassalli G, Suter T, Hess OM. Abnormal coronary vasomotion in hypertension: role of coronary artery disease. J Am Coll Cardiol. 1996;28:935-941.
23. Pitkanen OP, Raitakari OT, Niinikoski H, Nuutila P, Iida H, Voipio-Pulkki LM, Harkonen R, Wegelius U, Ronnemaa T, Viikari J, Knuuti J. Coronary flow reserve is impaired in young men with familial hypercho-lesterolemia. J Am Coll Cardiol. 1996;28:1705-1711.
24. Kaufmann PA, Gnecchi-Ruscone T, Schafers KP, Luscher TF, Camici PG. Low density lipoprotein choles-terol and coronary microvascular dysfunction in hypercholesterolemia. J Am Coll Cardiol. 2000;36:103-109.
25. Kaufmann PA, Gnecchi-Ruscone T, di Terlizzi M, Schafers KP, Luscher TF, Camici PG. Coronary heart dis-ease in smokers: vitamin C restores coronary microcirculatory function. Circulation. 2000;102:1233-1238.
26. Guethlin M, Kasel AM, Coppenrath K, Ziegler S, Delius W, Schwaiger M. Delayed response of myocardial flow reserve to lipid-lowering therapy with fluvastatin. Circulation. 1999;99:475-481.
27. Baller D, Notohamiprodjo G, Gleichmann U, Holzinger J, Weise R, Lehmann J. Improvement in coronary flow reserve determined by positron emission tomography after 6 months of cholesterol-lowering ther-apy in patients with early stages of coronary atherosclerosis. Circulation. 1999;99:2871-2875.
28. Ling MC, Ruddy TD, deKemp RA, Ukkonen H, Duchesne L, Higginson L, Williams KA, McPherson R, Bean-lands R. Early effects of statin therapy on endothelial function and microvascular reactivity in patients with coronary artery disease. Am Heart J. 2005;149:1137.
29. Bax JJ, Van der Wall EE, De Roos A, Poldermans D. In: Clinical nuclear cardiology. State of the art and future directions. Zaret Bl, Beller GA, eds. 2005. Mosby, Philadelphia.
30. Cwajg J, Xie F, O’Leary E, Kricsfeld D, Dittrich H, Porter TR. Detection of angiographically significant coronary artery disease with accelerated intermittent imaging after intravenous administration of ultra-sound contrast material. Am Heart J. 2000;139:675-683.
31. Heinle SK, Noblin J, Goree-Best P, Mello A, Ravad G, Mull S, Mammen P, Grayburn PA. Assessment of myo-cardial perfusion by harmonic power Doppler imaging at rest and during adenosine stress: comparison with (99m)Tc-sestamibi SPECT imaging. Circulation. 2000;102:55-60.
32. Moir S, Haluska BA, Jenkins C, Fathi R, Marwick TH. Incremental benefit of myocardial contrast to com-bined dipyridamole-exercise stress echocardiography for the assessment of coronary artery disease. Circulation. 2004;110:1108-1113.
33. Olszowska M, Kostkiewicz M, Tracz W, Przewlocki T. Assessment of myocardial perfusion in patients with coronary artery disease. Comparison of myocardial contrast echocardiography and 99mTc MIBI single photon emission computed tomography. Int J Cardiol. 2003;90:49-55.
34. Rocchi G, Fallani F, Bracchetti G, Rapezzi C, Ferlito M, Levorato M, Reggiani LB, Branzi A. Non-invasive de-tection of coronary artery stenosis: a comparison among power-Doppler contrast echo, 99Tc-Sestamibi SPECT and echo wall-motion analysis. Coron Artery Dis. 2003;14:239-245.
35. Shimoni S, Zoghbi WA, Xie F, Kricsfeld D, Iskander S, Gobar L, Mikati IA, Abukhalil J, Verani MS, O’Leary EL, Porter TR. Real-time assessment of myocardial perfusion and wall motion during bicycle and treadmill exercise echocardiography: comparison with single photon emission computed tomography. J Am Coll Cardiol. 2001;37:741-747.
36. Wei K, Crouse L, Weiss J, Villanueva F, Schiller NB, Naqvi TZ, Siegel R, Monaghan M, Goldman J, Aggar-wal P, Feigenbaum H, DeMaria A. Comparison of usefulness of dipyridamole stress myocardial contrast echocardiography to technetium-99m sestamibi single-photon emission computed tomography for de-tection of coronary artery disease (PB127 Multicenter Phase 2 Trial results). Am J Cardiol. 2003;91:1293-1298.
37. Paetsch I, Jahnke C, Wahl A, Gebker R, Neuss M, Fleck E, Nagel E. Comparison of dobutamine stress magnetic resonance, adenosine stress magnetic resonance, and adenosine stress magnetic resonance perfusion. Circulation. 2004;110:835-842.

212 Chapter 13
38. Giang TH, Nanz D, Coulden R, Friedrich M, Graves M, Al Saadi N, Luscher TF, von Schulthess GK, Schwitter J. Detection of coronary artery disease by magnetic resonance myocardial perfusion imaging with vari-ous contrast medium doses: first European multi-centre experience. Eur Heart J. 2004;25:1657-1665.
39. Wolff SD, Schwitter J, Coulden R, Friedrich MG, Bluemke DA, Biederman RW, Martin ET, Lansky AJ, Kasha-nian F, Foo TK, Licato PE, Comeau CR. Myocardial first-pass perfusion magnetic resonance imaging: a multicenter dose-ranging study. Circulation. 2004;110:732-737.
40. Pletcher MJ, Tice JA, Pignone M, Browner WS. Using the coronary artery calcium score to predict coronary heart disease events: a systematic review and meta-analysis. Arch Intern Med. 2004;164:1285-1292.
41. Shaw LJ, Raggi P, Schisterman E, Berman DS, Callister TQ. Prognostic value of cardiac risk factors and coronary artery calcium screening for all-cause mortality. Radiology. 2003;228:826-833.
42. Callister TQ, Raggi P, Cooil B, Lippolis NJ, Russo DJ. Effect of HMG-CoA reductase inhibitors on coro-nary artery disease as assessed by electron-beam computed tomography. N Engl J Med. 1998;339:1972-1978.
43. Shaw LJ, Iskandrian AE. Prognostic value of gated myocardial perfusion SPECT. J Nucl Cardiol. 2004;11:171-185.
44. Myers J, Prakash M, Froelicher V, Do D, Partington S, Atwood JE. Exercise capacity and mortality among men referred for exercise testing. N Engl J Med. 2002;346:793-801.
45. Navare SM, Mather JF, Shaw LJ, Fowler MS, Heller GV. Comparison of risk stratification with pharma-cologic and exercise stress myocardial perfusion imaging: a meta-analysis. J Nucl Cardiol. 2004;11:551-561.
46. White HD, Norris RM, Brown MA, Takayama M, Maslowski A, Bass NM, Ormiston JA, Whitlock T. Effect of intravenous streptokinase on left ventricular function and early survival after acute myocardial infarc-tion. N Engl J Med. 1987;317:850-855.
47. Sharir T, Germano G, Kang X, Lewin HC, Miranda R, Cohen I, Agafitei RD, Friedman JD, Berman DS. Pre-diction of myocardial infarction versus cardiac death by gated myocardial perfusion SPECT: risk strati-fication by the amount of stress-induced ischemia and the poststress ejection fraction. J Nucl Med. 2001;42:831-837.
48. Sharir T, Germano G, Kavanagh PB, Lai S, Cohen I, Lewin HC, Friedman JD, Zellweger MJ, Berman DS. Incremental prognostic value of post-stress left ventricular ejection fraction and volume by gated myo-cardial perfusion single photon emission computed tomography. Circulation. 1999;100:1035-1042.
49. Abidov A, Bax JJ, Hayes SW, Hachamovitch R, Cohen I, Gerlach J, Kang X, Friedman JD, Germano G, Ber-man DS. Transient ischemic dilation ratio of the left ventricle is a significant predictor of future cardiac events in patients with otherwise normal myocardial perfusion SPECT. J Am Coll Cardiol. 2003;42:1818-1825.
50. Marwick TH, Shan K, Patel S, Go RT, Lauer MS. Incremental value of rubidium-82 positron emission tomography for prognostic assessment of known or suspected coronary artery disease. Am J Cardiol. 1997;80:865-870.
51. Marwick TH, Case C, Sawada S, Rimmerman C, Brenneman P, Kovacs R, Short L, Lauer M. Prediction of mortality using dobutamine echocardiography. J Am Coll Cardiol. 2001;37:754-760.
52. Elhendy A, Mahoney DW, Khandheria BK, Paterick TE, Burger KN, Pellikka PA. Prognostic significance of the location of wall motion abnormalities during exercise echocardiography. J Am Coll Cardiol. 2002;40:1623-1629.
53. Sozzi FB, Elhendy A, Roelandt JR, van Domburg RT, Schinkel AF, Vourvouri EC, Bax JJ, De Sutter J, Bor-ghetti A, Poldermans D. Prognostic value of dobutamine stress echocardiography in patients with dia-betes. Diabetes Care. 2003;26:1074-1078.
54. D’Andrea A, Severino S, Caso P, De Simone L, Liccardo B, Forni A, Pascotto M, Di Salvo G, Scherillo M, Mininni N, Calabro R. Prognostic value of pharmacological stress echocardiography in diabetic patients. Eur J Echocardiogr. 2003;4:202-208.
55. Sozzi FB, Elhendy A, Roelandt JR, van Domburg RT, Schinkel AF, Vourvouri EC, Bax JJ, Rizzello V, Pol-dermans D. Long-term prognosis after normal dobutamine stress echocardiography. Am J Cardiol. 2003;92:1267-1270.
56. Yao SS, Qureshi E, Sherrid MV, Chaudhry FA. Practical applications in stress echocardiography: risk strati-fication and prognosis in patients with known or suspected ischemic heart disease. J Am Coll Cardiol. 2003;42:1084-1090.
57. Chung G, Krishnamani R, Senior R. Prognostic value of normal stress echocardiogram in patients with suspected coronary artery disease--a British general hospital experience. Int J Cardiol. 2004;94:181-186.

213Diagnostic and Prognostic Value of Non-Invasive Imaging in Known or Suspected Coronary Artery Disease
58. Sicari R, Pasanisi E, Venneri L, Landi P, Cortigiani L, Picano E. Stress echo results predict mortality: a large-scale multicenter prospective international study. J Am Coll Cardiol. 2003;41:589-595.
59. Chuah SC, Pellikka PA, Roger VL, McCully RB, Seward JB. Role of dobutamine stress echocardiography in predicting outcome in 860 patients with known or suspected coronary artery disease. Circulation. 1998;97:1474-1480.
60. Marwick TH, Case C, Vasey C, Allen S, Short L, Thomas JD. Prediction of mortality by exercise echocar-diography: a strategy for combination with the duke treadmill score. Circulation. 2001;103:2566-2571.
61. Marwick TH, Case C, Poldermans D, Boersma E, Bax J, Sawada S, Thomas JD. A clinical and echocardio-graphic score for assigning risk of major events after dobutamine echocardiograms. J Am Coll Cardiol. 2004;43:2102-2107.
62. Marwick TH, Case C, Short L, Thomas JD. Prediction of mortality in patients without angina: use of an exercise score and exercise echocardiography. Eur Heart J. 2003;24:1223-1230.
63. Cortigiani L, Picano E, Landi P, Previtali M, Pirelli S, Bellotti P, Bigi R, Magaia O, Galati A, Nannini E. Value of pharmacologic stress echocardiography in risk stratification of patients with single-vessel disease: a report from the Echo-Persantine and Echo-Dobutamine International Cooperative Studies. J Am Coll Cardiol. 1998;32:69-74.
64. Shaw LJ, Vasey C, Sawada S, Rimmerman C, Marwick TH. Impact of gender on risk stratification by exer-cise and dobutamine stress echocardiography: long-term mortality in 4234 women and 6898 men. Eur Heart J. 2005;26:447-456.
65. Hundley WG, Morgan TM, Neagle CM, Hamilton CA, Rerkpattanapipat P, Link KM. Magnetic resonance imaging determination of cardiac prognosis. Circulation. 2002;106:2328-2333.
66. Namdar M, Hany TF, Koepfli P, Siegrist PT, Burger C, Wyss CA, Luscher TF, von Schulthess GK, Kaufmann PA. Integrated PET/CT for the assessment of coronary artery disease: a feasibility study. J Nucl Med. 2005;46:930-935.


Relationship between Non-Invasive
Coronary Angiography with Multi-Slice
Computed Tomography and Myocardial
Perfusion Imaging
J Am Coll Cardiol 2006; 48: 2508-2514
Joanne D. Schuijf, William Wijns, J. Wouter Jukema, Douwe E. Atsma, Albert de Roos, Hildo J. Lamb, Marcel P. M. Stokkel,
Petra Dibbets-Schneider, Isabel Decramer, Pieter De Bondt, Ernst E. van der Wall, Piet K. Vanhoenacker, Jeroen J. Bax
14Chapter

Abstract
Background
Multi-slice computed tomography (MSCT) detects atherosclerosis, whereas myocardial per-
fusion imaging (MPI) detects ischemia; how these 2 techniques compare in patients with an
intermediate likelihood of CAD is unknown. Aim of the study was to perform a head-to-head
comparison between MSCT and MPI in patients with an intermediate likelihood of coronary
artery disease (CAD), and to compare non-invasive findings to invasive coronary angiography.
Methods
114 patients, mainly with intermediate likelihood of CAD, underwent both MSCT and MPI.
MSCT studies were classified as having no CAD, non-obstructive (<50% luminal narrowing)
CAD or obstructive CAD. MPI examinations were classified as showing normal or abnormal
(reversible and/or fixed defects). In a subset of 58 patients, invasive coronary angiography was
performed.
Results
Based on the MSCT data, 41 (36%) patients were classified as having no CAD, of which 90%
had normal MPI. A total of 33 (29%) patients showed non-obstructive CAD, whereas at least
1 significant (≥50% luminal narrowing) lesion was observed in the remaining 40 (35%) pa-
tients. Only 45% of patients with an abnormal MSCT had abnormal MPI; even in patients with
obstructive CAD on MSCT, 50% still had a normal MPI. In the subset of patients undergoing
invasive angiography, the agreement with MSCT was excellent (90%).
Conclusions
MPI and MSCT provide different and complementary information on CAD, namely detection
of atherosclerosis versus detection of ischemia. As compared to invasive angiography, MSCT
has a high accuracy for detecting CAD in patients with an intermediate likelihood of CAD.

217Relationship between MSCT and MPI
Introduction
In the evaluation of patients with suspected coronary artery disease (CAD), the role of non-invasive
imaging has increased exponentially over the past decades. Particularly in patients with an interme-
diate pre-test likelihood of CAD, non-invasive imaging plays an important role in risk stratification
and selection of further treatment strategies. Traditionally, the detection of CAD by non-invasive im-
aging was based on assessment of the hemodynamic significance of the stenoses through visualiza-
tion of inducible ischemia. For this purpose, myocardial perfusion imaging (MPI) with gated single
photon emission computed tomography (SPECT) has been used extensively 1.
More recently, multi-slice computed tomography (MSCT) has been proposed as an alternative imag-
ing modality for evaluation of patients with suspected CAD. With the recently introduced 64-slice
MSCT, high sensitivity and specificity for the detection of significant (≥50% luminal narrowing) ste-
noses have been reported 2-7. However, since MSCT visualizes coronary artery stenoses directly rather
than the hemodynamic significance of the lesions, it is important to recognize that, unlike MPI, the
technique identifies atherosclerosis rather than ischemia.
Thus far, data regarding the diagnostic accuracy of MSCT have been obtained in populations under-
going invasive coronary angiography because of a high likelihood of CAD. In contrast, its value in pa-
tients with a lower likelihood of CAD remains to be established, despite the fact that this population
represents the target population for non-invasive diagnostic imaging. Moreover, the relative merits
MPI and MSCT in patients with an intermediate likelihood of CAD remain to be established. Accord-
ingly, the aim of the present study was to perform a head-to-head comparison between MSCT and
MPI in patients with mainly an intermediate likelihood of CAD, including women. In addition, the
non-invasive findings were compared to invasive coronary angiography in a subset of patients.
Methods
Patients and Study protocol
The study group consisted of 114 consecutive patients who presented to the outpatient clinic (Leiden,
the Netherlands and Aalst, Belgium) for the evaluation of chest pain without history of CAD in whom non-
invasive imaging with gated SPECT was clinically indicated. In addition to MPI, patients underwent non-
invasive coronary angiography with MSCT within one month. Exclusion criteria were 1) known allergy
to iodinated contrast agent, 2) renal insufficiency (serum creatinine >120 mmol/L), 3) atrial fibrillation, 4)
pregnancy, and 5) known CAD, defined as history of myocardial infarction or coronary revascularization
and/or presence of one or more angiographically documented coronary stenosis ≥50% luminal diameter 8;9. For each patient, the baseline clinical characteristics (type of symptoms and risk factors) were recorded 10. Pre-test likelihood of CAD was determined according to the Diamond and Forrester method using per-
cent cut-offs of <13.4%, >87.2% and in-between for respectively low, high and intermediate pre-test like-
lihood 11. The study protocol was approved by the ethics committee and informed consent was obtained.

218 Chapter 14
MSCT coronary angiography
In the first 28 patients, data acquisition was performed using a 16-slice MSCT scanner (Aquilion 16,
Toshiba Medical Systems, Japan) with a collimation of 16 x 0.5 as previously described 9. In the re-
maining 86 patients, imaging was performed using a 64-slice MSCT scanner (Aquilion 64, Toshiba
Medical Systems, Japan or Sensation 64, Siemens, Germany). Accordingly, data were acquired with
a collimation of either 64 x 0.5 mm or 32 x 2 x 0.6 mm and a tube rotation time of 400 or 330 ms,
respectively. For the Aquilion 64, the tube current was 300 mA at 120 kV for patients with normal
posture. In case of patients with higher body mass indexes, tube current was increased to 350 or 400
mA at 135 kV. For the Siemens 64, tube currents up to 550 ms at 120 kV were available. During 16-
slice MSCT, non-ionic contrast material was administered in the antecubital vein with an amount of
130 to 140 ml, depending on the total scan time, and a flow rate of 4 ml/sec (Xenetix 300 ®) followed
by a saline flush. Similarly, for 64-slice MSCT, 80 to 110 ml, again depending on the total scan time,
was administered with a flow rate of 5 ml/sec (Iomeron 400 ®) resulting in comparable contrast doses
for 16- and 64-slice MSCT. Subsequently, data sets were reconstructed and transferred to a remote
workstation as previously described 9. Briefly, images were initially reconstructed at 75% of the car-
diac cycle. In case of motion artefacts, a representative single slice was reconstructed throughout
the cardiac cycle in steps of 20 ms to determine the most optimal additional reconstruction phases.
MSCT examinations were evaluated on a patient level and vessel level by an experienced operator
blinded to the gated MPI data for the presence of significant (≥50% luminal narrowing) stenoses. For
this purpose, both the original axial dataset as well as curved multiplanar reconstructions were used.
The MSCT studies, or coronary arteries, without significant or obstructive stenoses were further clas-
sified as completely normal or as having non-obstructive CAD, when atherosclerotic lesions <50% of
luminal diameter were present.
Stress-rest gated myocardial perfusion imaging
In all patients, stress-rest MPI (using either technetium-99m tetrofosmin or technetium-99m sestamibi)
was performed with symptom-limited bicycle exercise or pharmacological (dipyridamole, adenosine
or dobutamine) stress 12. Data were acquired with either a dual-head SPECT camera (Vertex Epic ADAC
Pegasus, n=27) or a triple-head SPECT camera (GCA 9300/HG, Toshiba Corp., Tokyo, Japan, n=87) fol-
lowed by reconstruction into long- and short-axis projections perpendicular to the heart-axis; data
were presented in polar map format (normalized to 100%), and a 17-segment model was used in which
myocardial segments were allocated to the territories of the different coronary arteries as previously
described 13;14. Perfusion defects were identified on the stress images (segmental tracer activity less than
75% of maximum) and divided into ischemia (reversible defects, with ≥10% increase in tracer uptake
on the resting images) or scar tissue (irreversible defects). Accordingly, examinations were classified as
being either normal or abnormal, the latter being further divided in those demonstrating reversible
defects and those demonstrating irreversible defects. The gated images were used to assess regional
wall motion to improve differentiation between perfusion abnormalities and attenuation artifacts 15.

219Relationship between MSCT and MPI
Conventional coronary angiography
A total of 58 patients were referred for conventional coronary angiography based on clinical presen-
tation and/or imaging findings at the discretion of the referring cardiologist. Conventional coronary
angiography was performed according to standard clinical protocols. Coronary angiograms were
evaluated by two experienced observers blinded to the MSCT data using the same classification as
used for the MSCT studies (normal, significant stenoses defined as ≥50% luminal narrowing or non-
obstructive atherosclerosis).
Statistical analysis
Continuous variables were described by mean ± SD. Comparisons between patient groups were
performed using 1-way ANOVA for continuous variables and the Chi-Square test with Yates’ correc-
tion for categorical variables. A P-value <0.05 was considered statistically significant.
Results
Patient characteristics
In total 114 patients (64 male, 50 female, average age 60 ± 11 years) were enrolled and underwent
both MSCT and stress-rest gated SPECT within 1 month of each other. Patient characteristics are
Table 1. Clinical characteristics of the study population (n=114).n (%)
Gender (M/F) 64/50Age (years) 60 ± 11Risk factors for CAD Diabetes Mellitus 24 (21%) Hypertension 53 (46%) Hypercholesterolemia 53 (46%) Positive family history 36 (32%) Current smoking 33 (29%) Obese (BMI ≥ 30 kg/m2) 16 (14%)Symptoms Asymptomatic 10 (9%) Dyspnoea 1 (1%) Non-anginal chest pain 5 (4%) Atypical angina pectoris 88 (77%) Typical angina pectoris 10 (9%)Pre-test likelihood of CAD Low 7 (6%) Intermediate 97 (85%) High 10 (9%)
Abbreviations: BMI: body mass index, CAD: coronary artery disease.

220 Chapter 14
described in detail in Table 1. Pre-test likelihood of CAD according to Diamond and Forrester was
low, intermediate and high in respectively 7 (6%), 97 (85%) and 10 (9%) patients. For men, these per-
centages were respectively 3%, 84%, and 13%. In women, pre-test likelihood was low in 10%, inter-
mediate in 86% and high in 4% of women. Based on clinical presentation and/or imaging results, 58
patients (38 men, 20 women, average age 63 ± 10 years) were referred for invasive coronary angiog-
raphy. Clinical parameters of these patients are provided in Table 2. In this subset, pre-test likelihood
of CAD was low, intermediate or high in 1 (2%), 48 (83%) and 9 (15%) of patients, respectively.
Table 2. Clinical characteristics of patients referred for invasive angiography (n=58). n (%)
Gender (M/F) 38/20Age (years) 63 ± 10Risk factors for CAD Diabetes Mellitus 17 (29%) Hypertension 36 (62%) Hypercholesterolemia 34 (59%) Positive family history 18 (31%) Current smoking 23 (40%) Obese (BMI ≥ 30 kg/m2) 10 (17%)Symptoms Asymptomatic 3 (5%) Dyspnea 1 (2%) Non-anginal chest pain 1 (2%) Atypical angina pectoris 44 (76%) Typical angina pectoris 9 (15%)Pre-test likelihood of CAD Low 1 (2%) Intermediate 48 (83%) High 9 (15%)
Abbreviations: BMI: body mass index, CAD: coronary artery disease.
MSCT coronary angiography
Average heart rate during MSCT data acquisition was 66 ± 15 beats per minute. Based on the MSCT
images, 41 (36%) patients were classified as having no CAD. A total of 33 (29%) patients showed non-
obstructive CAD, whereas at least one significant ≥50% luminal narrowing was observed in the re-
maining 40 (35%) patients. Analysis on a vessel basis resulted in 342 coronary arteries, of which 157
(%) were normal. CAD was identified in the remaining 185 coronary arteries with at least 1 significant
lesion in 62 (18%) coronary arteries.
Stress-rest gated myocardial perfusion imaging
In the majority of patients, stress was performed with symptom-limited bicycle exercise (n=72; 63%).
In those patients, at least 85% of maximum age-predicted heart rate was achieved if no stress-in-
duced symptoms or changes in ECG or blood pressure occurred. In the remaining patients, pharma-

221Relationship between MSCT and MPI
cological stress was applied using adenosine (n=30; 26%), dobutamine (n=7; 7%) or dipyridamole
(n=5; 3%). Normal myocardial perfusion in both stress and rest images was observed in 77 (68%) pa-
tients. In the remaining 37 patients, reversible and fixed defects were observed in 28 and 12 patients,
respectively; 3 patients showed both fixed and reversible defects. On a vascular territory basis, 284
(83%) territories showed normal myocardial perfusion, whereas reversible and fixed defects were
observed in 38 (11%) and 20 (6%) vascular territories, respectively.
Conventional coronary angiography
Out of 58 patients undergoing invasive coronary angiography, no abnormalities were seen in 9
(16%) patients, whereas 22 (38%) patients showed non-obstructive CAD. In the remaining 27 (47%)
patients, at least 1 significant narrowing was detected.
Relation between findings on MSCT angiography and myocardial perfusion imaging
Patientbasedanalysis
As demonstrated in Figure 1, the majority of patients with a normal MSCT study showed normal perfu-
sion on MPI (n=37, 90%). In patients with an abnormal MSCT study (with either obstructive or non-ob-
structive CAD), 40 (55%) patients had a normal MPI, whereas 33 (45%) had an abnormal MPI.
In Figure 2, the distribution of MPI results among patients with either obstructive or non-obstructive
CAD on MSCT is depicted. In patients with obstructive CAD on MSCT, abnormal perfusion was observed
in 20 (50%) patients. Of these patients, respectively 7 and 15 patients showed fixed or reversible defects.
The majority of patients (n=20, 61%) with non-obstructive CAD on MSCT had normal perfusion on MPI.
In the remaining 13 (39%) patients, reversible defects were observed in 11 with only 2 patients showing
fixed defects. An example of a patient with abnormal MSCT but normal MPI is provided in Figure 3.
Figure 1. Pie-charts depicting the relation between MSCT and MPI results. Of note, the MSCT abnormal popula-tion includes both patients with non-obstructive and obstructive CAD.
MSCT Abnormal
40, 55%
33, 45%
MPI Normal
MPI Abnormal
MSCT Normal
37, 90%
4, 10%

222 Chapter 14
Figure 2. Pie-charts depicting the relation between MSCT and MPI results.
In a separate analysis depicted in Table 3, results were compared between data obtained with 16-
slice and 64-slice MSCT, indicating no significant differences in distribution of normal and abnormal
MPI examinations for the different MSCT categories.
Vesselbasedanalysis
In total, 342 coronary arteries and related perfusion territories were evaluated. The majority of the
157 normal coronary arteries on MSCT showed normal MPI as well, (n=142, 90%). Also, in 143 of 185
(77%) vascular territories corresponding to coronary arteries with abnormal MSCT, normal perfusion
was demonstrated. In coronary arteries showing non-obstructive CAD on MSCT, normal MPI was ob-
tained in 104 of 123 (85%) corresponding vascular territories. Finally, 24 of 62 (39%) coronary arteries
with obstructive CAD on MSCT showed abnormal myocardial perfusion.
Comparison of MSCT and MPI to conventional coronary angiography in 58 patients
MSCT Obstructively diseased
20; 50%20; 50%MPI Normal
MPI Abnormal
MSCT Non-obstructively diseased
20; 61%
13; 39%
Table 3. Comparison of 16-slice versus 64-slice MSCT.
16-slice MSCT 64-slice MSCT P-value*MPI Abnormal/MPI NormalMSCT Normal 2/8 2/29 NSMSCT Non-obstructively diseased 5/3 8/17 NSMSCT Obstructively diseased 7/3 13/17 NS
*Chi-square analysis with Yates’ correction.
The relation between findings on MSCT, MPI and conventional coronary angiography is illustrated
in the flowcharts in Figure 4. All patients with normal MSCT (n=9) had normal coronary arteries on
conventional coronary angiography; the majority of these patients (n=7, 78%) also had a normal
MPI; all patients with normal MSCT, normal invasive angiography but abnormal MPI had a mild fixed
defect suggestive of attenuation artefacts.

223Relationship between MSCT and MPI
An abnormal MSCT was noted in 49 patients (with 16 non-obstructive and 33 obstructive CAD) and
invasive coronary angiography confirmed CAD in all patients. Interestingly, only 29 (59%) patients
had an abnormal MPI.
Non-obstructive CAD on MSCT was observed in 16 (28%) patients, and all had non-obstructive CAD on
invasive angiography; of note, 6 (38%) patients had a normal MPI and 10 (62%) had an abnormal MPI.
Obstructive CAD (at least one significant stenosis) on MSCT was noted in 33 (57%) patients, with 27
(82%) having obstructive CAD on invasive coronary angiography. An abnormal MPI was present in 16
(59%) patients, whereas 11 (41%) patients had a normal MPI. Of interest, 2 of these patients had 3-vessel
disease. In a separate analysis, data obtained with 16-slice MSCT were compared to 64-slice data.
With 16-slice MSCT, 19 of 21 (90%) patients were correctly diagnosed as compared to invasive coro-
nary angiography, whereas correct diagnosis was obtained in 33 of 37 (89%) patients studied with
64-slice MSCT (P=NS).
Figure 3. Discrepancy between MSCT and MPI: Example of a 69-year-old male patient with an abnormal MSCT but no perfusion abnormalities on MPI. In Panels A, C, and D, curved multiplanar MSCT reconstructions of respectively the left anterior descending coronary artery, the left circumflex coronary artery and the right coro-nary artery are provided. Panel B is an enlargement of the proximal part of the left anterior descending coro-nary artery perpendicular to Panel A, whereas a 3D volume rendered reconstruction is provided in Panel E. In all 3 coronary arteries, the presence of diffuse atherosclerosis can be observed. In Panel F, however, short-axis (upper two rows), vertical long-axis (middle two rows) and horizontal long-axis (lower two rows) MPI images during exercise (first, third and fifth rows) and rest (second, fourth and sixth rows) demonstrate homogeneous myocardial perfusion without perfusion defects.

224 Chapter 14
Figure 4. Flow charts describing the relation between findings on MSCT, MPI and invasive coronary angiography.
MSCT normaln=9
MPI abnormaln=3
MPI normaln=6
Angio normal
n=9
MSCT non-obstructiven=16
MPI abnormaln=10
MPI normaln=6
Angio non-obstructive
n=16
MSCT obstructiven=33
MPI abnormaln=19
MPI normaln=14
Angio non-obstructive
n=3
Angioobstructive
n=11
Angio non-obstructive
n=3
Angioobstructive
n=16
A
B
C

225Relationship between MSCT and MPI
Discussion
This head-to-head comparison between non-invasive coronary angiography with MSCT and func-
tional imaging by MPI in a large population with an intermediate likelihood of CAD, reveals several
findings. Firstly, 55% of patients with an abnormal MSCT had normal MPI, indicating that only half of
the observed lesions on MSCT may be of hemodynamic significance. Even in patients with obstruc-
tive CAD on MSCT, 50% had a normal MPI.
Conversely, patients with a normal MPI frequently (52%) exhibited an abnormal MSCT, indicating
that a normal MPI does not exclude the presence of coronary atherosclerosis. In the subgroup of
patients undergoing coronary angiography, similar results were obtained. These findings highlight
the discrepancy between the 2 tests, namely that atherosclerosis is not synonymous to ischemia, but
also emphasize the complementary information that both tests provide.
Finally, this is a first attempt to apply MSCT in patients with an intermediate likelihood of CAD, in-
cluding 44% of women. The MSCT findings correlated well with invasive coronary angiography, sug-
gesting that the high accuracy of MSCT demonstrated previously in patients with a high likelihood
of CAD also applies to patients with an intermediate likelihood of CAD.
Obstructive CAD versus hemodynamic significance
In the current study, a normal MPI was obtained in 55% of patients with an abnormal MSCT. More-
over, 50% of patients with obstructive CAD on MSCT had a normal MPI. The findings are in line with
preliminary results by Hacker et al 16 who compared MSCT and MPI in 25 patients with known or
suspected CAD. These authors showed that only 8 of 17 (47%) significant stenoses on MSCT were
associated with abnormal perfusion on MPI.
These observations confirm that the severity of focal stenosis severity in itself is not sufficient to
predict the hemodynamic significance of the coronary plaque burden. In our study, vessel based
analysis shows indeed that only 39% of obstructed vessels have abnormal MPI while 15% of non
obstructive vessels show perfusion abnormalities. In the latter situation, the additive effect of mul-
tiple mild stenoses in series eventually causes the perfusion defect 17. Similarly discrepant results
have been reported when comparing invasive angiography with non-invasive imaging or invasive
fractional flow reserve measurements. Salm et al 18 showed that MPI was normal in 50% of angio-
graphically significant lesions. In particular lesions with an intermediate stenosis severity (defined
as a percent diameter stenosis between 40% and 70%) vary in hemodynamic significance 18-20. To
some extent, these discrepancies may be attributable to imperfect allocation of perfusion defects
to corresponding coronary arteries due to individual variations in coronary anatomy. Still, analysis
on a vessel basis further emphasizes that only a moderate proportion of anatomically significant
stenoses are of hemodynamic significance and result in abnormal perfusion in the corresponding
vascular territory.

226 Chapter 14
Atherosclerosis versus MPI findings
Alternatively, CAD was completely absent in only 48% of patients with normal MPI of which 52% had
atherosclerosis on MSCT and 26% already exhibited obstructive CAD on MSCT. Thus, a normal MPI
does not exclude CAD and non-invasive coronary angiography with MSCT allows detection of CAD
at a much earlier stage than MPI. The relation between atherosclerosis detected by coronary calcifi-
cations and MPI was explored recently by Berman et al 21 in 1195 patients without known CAD who
underwent electron beam computed tomography. The authors showed a poor relation between the
presence of atherosclerosis on electron beam computed tomography and MPI results. Similar to the
current results, a large proportion of patients with a normal MPI had atherosclerosis according to
coronary artery calcium scoring, indicating again that a normal MPI does not exclude the presence
of CAD.
Clinical implications
The current observations have important clinical implications. With the introduction of MSCT and
comparison to MPI, a paradigm-shift occurs in the definition of CAD, displacing the emphasis from
inducible ischemia to atherosclerosis. Based on the discrepancy between MSCT and MPI, one can
argue that MSCT could be used as the first-line test. A normal MSCT excludes CAD and the patient
can be reassured. Alternatively, in the presence of atherosclerosis on MSCT, additional information is
needed to define the hemodynamic significance of the observed lesions. This additional information
could be provided by sequential MSCT and nuclear myocardial perfusion imaging using either PET
or SPECT. Patients with an abnormal MSCT but normal MPI have CAD. In those, aggressive medical
therapy and risk factor modification should be considered (targeted primary prevention), whereas
patients with an abnormal MSCT and an abnormal MPI should be referred for invasive angiography
with potential revascularization.
MSCT in patients with an intermediate likelihood of CAD
As emphasized in a recent meta-analysis 22, the available MSCT studies have been performed in pa-
tients with known CAD or a high likelihood of CAD; in particular, pooling of 24 MSCT studies revealed
a prevalence of significant stenoses on MSCT and invasive angiography of 65%. Pooled data from six
64-slice MSCT studies (including 363 patients) showed a sensitivity of 96% and a specificity of 92%
to detect or exclude significant CAD 2-7. The current study was performed in patients with predomi-
nantly intermediate likelihood of CAD, yet the agreement between MSCT and invasive angiography
remains excellent. All patients with normal MSCT had normal coronary arteries on invasive angiog-
raphy, and all patients with (obstructive or non-obstructive) CAD on MSCT had CAD on invasive an-
giography. Only 6 of 33 (18%) patients with a significant stenosis on MSCT did not have a significant
stenosis on invasive coronary angiography by visual estimation.

227Relationship between MSCT and MPI
These observations suggest that MSCT may be as accurate in patients with an intermediate like-
lihood as in patients with a high likelihood of CAD, although larger studies are clearly needed to
confirm this finding.
Limitations
In the present study, MSCT and MPI protocols were not uniform in all patients. For MSCT, scanners
from 2 generations as well as manufacturers were used, while for MPI different tracers and stressors
were applied. This however, reflects the daily clinical routine and confers generalized applicability to
our observations. Also, comparison of results obtained with either 16-slice or 64-slice MSCT did not
show any significant differences.
Conventional coronary angiography was performed in approximately half of the patients included
in the study and stenotic segments were not analyzed by quantitative angiography. However, the
angiography was performed as considered clinically indicated and according to standard practice.
Finally, despite the introduction of 64-slice MSCT, the technique still suffers from several important
limitations, including limited diagnostic accuracy in case of extensive calcifications or elevated heart
rates. Also, combination of MSCT with MPI and (potentially) conventional coronary angiography will
result in a considerable radiation exposure.
Conclusions
MSCT and MPI provide different information on CAD, namely atherosclerosis versus ischemia. How
both techniques should be integrated in the clinical setting is not entirely clear yet, but the discrep-
ant results provided by the 2 techniques underscore that MSCT and MPI provide complementary
information.
Also, our study demonstrates that MSCT may be as accurate in men and women with an intermedi-
ate likelihood of CAD as was previously reported in patients with a high likelihood of CAD.

228 Chapter 14
References 1. Underwood SR, Anagnostopoulos C, Cerqueira M, Ell PJ, Flint EJ, Harbinson M, Kelion AD, Al Moham-
mad A, Prvulovich EM, Shaw LJ, Tweddel AC. Myocardial perfusion scintigraphy: the evidence. Eur J Nucl Med Mol Imaging. 2004;31:261-291.
2. Leber AW, Knez A, von Ziegler F, Becker A, Nikolaou K, Paul S, Wintersperger B, Reiser M, Becker CR, Steinbeck G, Boekstegers P. Quantification of obstructive and nonobstructive coronary lesions by 64-slice computed tomography: a comparative study with quantitative coronary angiography and intravascular ultrasound. J Am Coll Cardiol. 2005;46:147-154.
3. Leschka S, Alkadhi H, Plass A, Desbiolles L, Grunenfelder J, Marincek B, Wildermuth S. Accuracy of MSCT coronary angiography with 64-slice technology: first experience. Eur Heart J. 2005;26:1482-1487.
4. Mollet NR, Cademartiri F, van Mieghem CA, Runza G, McFadden EP, Baks T, Serruys PW, Krestin GP, de Feyter PJ. High-resolution spiral computed tomography coronary angiography in patients referred for diagnostic conventional coronary angiography. Circulation. 2005;112:2318-2323.
5. Raff GL, Gallagher MJ, O’Neill WW, Goldstein JA. Diagnostic accuracy of noninvasive coronary angiog-raphy using 64-slice spiral computed tomography. J Am Coll Cardiol. 2005;46:552-557.
6. Pugliese F, Mollet NR, Runza G, van Mieghem C, Meijboom WB, Malagutti P, Baks T, Krestin GP, Defeyter PJ, Cademartiri F. Diagnostic accuracy of non-invasive 64-slice CT coronary angiography in patients with stable angina pectoris. Eur Radiol. 2006;16:575-582.
7. Ropers D, Rixe J, Anders K, Kuttner A, Baum U, Bautz W, Daniel WG, Achenbach S. Usefulness of multi-detector row spiral computed tomography with 64- x 0.6-mm collimation and 330-ms rotation for the noninvasive detection of significant coronary artery stenoses. Am J Cardiol. 2006;97:343-348.
8. Cortigiani L, Bigi R, Sicari R, Landi P, Bovenzi F, Picano E. Prognostic value of pharmacological stress echocardiography in diabetic and nondiabetic patients with known or suspected coronary artery disease. J Am Coll Cardiol. 2006;47:605-610.
9. Schuijf JD, Bax JJ, Salm LP, Jukema JW, Lamb HJ, van der Wall EE, de Roos A. Noninvasive coronary im-aging and assessment of left ventricular function using 16-slice computed tomography. Am J Cardiol. 2005;95:571-574.
10. Abidov A, Rozanski A, Hachamovitch R, Hayes SW, Aboul-Enein F, Cohen I, Friedman JD, Germano G, Berman DS. Prognostic significance of dyspnea in patients referred for cardiac stress testing. N Engl J Med. 2005;353:1889-1898.
11. Diamond GA, Forrester JS. Analysis of probability as an aid in the clinical diagnosis of coronary-artery disease. N Engl J Med. 1979;300:1350-1358.
12. Bavelaar-Croon CD, America YG, Atsma DE, Dibbets-Schneider P, Zwinderman AH, Stokkel MP, Pauwels EK, van der Wall EE. Comparison of left ventricular function at rest and post-stress in patients with myocardial infarction: Evaluation with gated SPECT. J Nucl Cardiol. 2001;8:10-18.
13. Cerqueira MD, Weissman NJ, Dilsizian V, Jacobs AK, Kaul S, Laskey WK, Pennell DJ, Rumberger JA, Ryan T, Verani MS. Standardized myocardial segmentation and nomenclature for tomographic imaging of the heart: a statement for healthcare professionals from the Cardiac Imaging Committee of the Council on Clinical Cardiology of the American Heart Association. Circulation. 2002;105:539-542.
14. Hachamovitch R, Hayes SW, Friedman JD, Cohen I, Berman DS. Stress myocardial perfusion single-photon emission computed tomography is clinically effective and cost effective in risk stratification of patients with a high likelihood of coronary artery disease (CAD) but no known CAD. J Am Coll Cardiol. 2004;43:200-208.
15. Smanio PE, Watson DD, Segalla DL, Vinson EL, Smith WH, Beller GA. Value of gating of technetium-99m sestamibi single-photon emission computed tomographic imaging. J Am Coll Cardiol. 1997;30:1687-1692.
16. Hacker M, Jakobs T, Matthiesen F, Vollmar C, Nikolaou K, Becker C, Knez A, Pfluger T, Reiser M, Hahn K, Tiling R. Comparison of spiral multidetector CT angiography and myocardial perfusion imaging in the noninvasive detection of functionally relevant coronary artery lesions: first clinical experiences. J Nucl Med. 2005;46:1294-1300.
17. De Bruyne B, Hersbach F, Pijls NH, Bartunek J, Bech JW, Heyndrickx GR, Gould KL, Wijns W. Abnormal epicardial coronary resistance in patients with diffuse atherosclerosis but “Normal” coronary angiogra-phy. Circulation. 2001;104:2401-2406.

229Relationship between MSCT and MPI
18. Salm LP, Bax JJ, Jukema JW, Langerak SE, Vliegen HW, Steendijk P, Lamb HJ, de Roos A, van der Wall EE. Hemodynamic evaluation of saphenous vein coronary artery bypass grafts: relative merits of Doppler flow velocity and SPECT perfusion imaging. J Nucl Cardiol. 2005;12:545-552.
19. Berger A, Botman KJ, MacCarthy PA, Wijns W, Bartunek J, Heyndrickx GR, Pijls NH, De Bruyne B. Long-term clinical outcome after fractional flow reserve-guided percutaneous coronary intervention in patients with multivessel disease. J Am Coll Cardiol. 2005;46:438-442.
20. Heller LI, Cates C, Popma J, Deckelbaum LI, Joye JD, Dahlberg ST, Villegas BJ, Arnold A, Kipperman R, Grinstead WC, Balcom S, Ma Y, Cleman M, Steingart RM, Leppo JA. Intracoronary Doppler assessment of moderate coronary artery disease: comparison with 201Tl imaging and coronary angiography. FACTS Study Group. Circulation. 1997;96:484-490.
21. Berman DS, Wong ND, Gransar H, Miranda-Peats R, Dahlbeck J, Hayes SW, Friedman JD, Kang X, Polk D, Hachamovitch R, Shaw L, Rozanski A. Relationship between stress-induced myocardial ischemia and atherosclerosis measured by coronary calcium tomography. J Am Coll Cardiol. 2004;44:923-930.
22. Schuijf JD, Bax JJ, Shaw LJ, de Roos A, Lamb HJ, van der Wall EE, Wijns W. Meta-analysis of comparative diagnostic performance of magnetic resonance imaging and multislice computed tomography for noninvasive coronary angiography. Am Heart J. 2006;151:404-411.


Changing Paradigm: Atherosclerosis
versus Ischemia
Eur J Nucl Med Mol Imaging 2007; 34: 1-3
Joanne D. Schuijf, Ernst E. van der Wall, Jeroen J. Bax
Editorial in response to the article: “64-slice spiral CT angiography does not predict the hemodynamical relevance of coronary artery stenoses in patients with stable angina.”
by Hacker M. et al
15Chapter


233Changing Paradigm: Atherosclerosis versus Ischemia
Traditionally, imaging is used for the non-invasive detection of coronary artery disease (CAD)
in patients with an intermediate likelihood of disease 1. Various imaging modalities are currently
available for this purpose, including nuclear imaging with PET and SPECT, echocardiography and
magnetic resonance imaging 1. These tests rely on the demonstration of stress-inducible ischemia,
evidenced by the induction of perfusion abnormalities or systolic dysfunction, as a surrogate marker
for CAD. Based on the location, extent and severity of ischemia, patients may be referred for invasive
coronary angiography followed by interventional therapy 2.
Recently, this algorithm has been challenged by the introduction of non-invasive anatomical
imaging (i.e. non-invasive coronary angiography), using multi-slice computed tomography (MSCT).
Thus far MSCT has only been validated against the anatomical gold standard for CAD, being invasive
coronary angiography, and in selected patient populations the technique has been demonstrated to
provide reliable detection of significant coronary artery stenoses 3-5. The most important contribution
of MSCT however, is the exclusion of CAD, since the likelihood of CAD is virtually nihil in the presence
of a normal MSCT examination.
Substantial data on the performance of MSCT in relation to other imaging techniques (e.g. SPECT)
however, are currently not available. In this issue of the Journal, Hacker and colleagues report their
results of a direct comparison between 64-slice MSCT and gated SPECT imaging in 38 (74% male)
patients presenting with stable angina 6. CAD was suspected in 26 (68%), whereas 12 patients
presented with a previous history of CAD (7 previous coronary artery bypass surgery, 8 previous
percutaneous coronary intervention). Coronary arteries on MSCT were evaluated for the presence of
significant (≥ 50% luminal diameter narrowing) stenoses and results were compared to myocardial
perfusion assessed with SPECT. In total, 152 coronary arteries were evaluated, with 43 (28%) showing
at least 1 significant stenosis.
Only 7 of 109 coronary arteries without significant stenoses on MSCT were associated with abnormal
myocardial perfusion on SPECT, resulting in a negative predictive value of 94%. Thus, in the absence
of significant lesions on MSCT, perfusion will be normal. These findings indicate that MSCT may allow
accurate exclusion of flow-limiting coronary stenoses.
Conversely, abnormal perfusion on SPECT (including both fixed and reversible defects) was noted
in only 23 of 43 (53%) of coronary arteries with significant lesions on MSCT. Moreover, only 12 of
38 coronary arteries with significant CAD revealed ischemia (reversible perfusion abnormalities)
on SPECT. As a consequence, the corresponding positive predictive value of MSCT to detect
hemodynamically relevant stenoses was only 32%.
Similar observations have been reported by the same authors when 16-slice MSCT was compared
to SPECT imaging 7. Data obtained in 99 coronary arteries of 25 patients with known (n=14) or
suspected CAD (n=11) revealed that all 82 coronary arteries without significant (≥ 50% diameter
narrowing) lesions were associated with normal perfusion on SPECT, yielding a negative predictive
value of 100%. On the other hand, a positive MSCT was not consistently associated with abnormal
perfusion and only 8 of 17 (47%) stenotic coronary arteries on MSCT were associated with abnormal
perfusion on SPECT.

234 Chapter 15
Thus, only half of the significant lesions on MSCT appear to have hemodynamical consequences,
indicating that the presence of coronary atherosclerosis with luminal obstruction does not invariably
imply the presence of ischemia. Accordingly, a non-invasive angiographic imaging technique such
as MSCT cannot be used to predict the hemodynamical importance of observed lesions.
This discrepancy between anatomical and functional imaging was noted already in direct
comparisons between invasive angiography and myocardial perfusion imaging. Particularly, lesions
with an intermediate stenosis severity (40% to 70% luminal narrowing) have been demonstrated
to show a wide variation in hemodynamic relevance 8. For example, Heller et al 8 demonstrated
that only 48% of 67 intermediate lesions on invasive angiography (with on average 59±12%
luminal narrowing) were associated with ischemia on myocardial perfusion imaging. An even
lower percentage was reported by Chamuleau et al, who performed SPECT and invasive coronary
angiography in 191 patients with at least 1 severe (>70% diameter narrowing) and 1 intermediate
(defined as between 40% to 70% diameter narrowing) lesion on invasive angiography 9. In particular,
153 (80%) patients showed ischemia on SPECT in the vascular territory corresponding to the severe
lesion, but only 30 (16%) patients exhibited ischemia in the territory of the intermediate lesion.
These observations underscore that anatomical imaging does not provide information on the
hemodynamic consequences of the lesions, and functional testing remains required to provide this
information.
Consequently, the question that emerges is: “What are the implications of these observations for the
clinical use of MSCT in addition to SPECT?”
In fact, the combined use of anatomic and functional imaging may actually be preferred since
this combination may allow better characterization of patients. In subjects with a normal SPECT,
MSCT coronary angiography allows further differentiation into patients with atherosclerosis (but
non-obstructive lesions, not resulting in ischemia), and patients with completely normal coronary
arteries. This differentiation permits to identify CAD at an earlier stage, i.e. atherosclerosis present,
but no ischemia yet. Accordingly, the availability of non-invasive visualization of the coronary
arteries has resulted in a paradigm shift: the hallmark of CAD on non-invasive imaging is shifting
from demonstration of ischemia to assessment of atherosclerosis.
In this respect, sequential use of MSCT and SPECT may provide a useful approach to patients
presenting with an intermediate likelihood of CAD. As depicted in Figure 1, anatomic imaging with
MSCT could be the initial test.
If the coronary arteries reveal no abnormalities on MSCT, the patient may be safely discharged
without the need for further testing. The reliable exclusion of significant CAD by MSCT is supported
by the extensive literature validating the technique against invasive coronary angiography 10
consistently showing that if the MSCT examination is normal, the likelihood of finding significant
CAD on invasive coronary angiography is negligible.
Next, in the presence of atherosclerosis without significant lesions (<50% diameter narrowing), the
likelihood of ischemia is low as demonstrated in the current study 6. These patients need aggressive
risk factor modification and medical therapy.

235Changing Paradigm: Atherosclerosis versus Ischemia
Finally, if obstructive lesions are demonstrated on MSCT, subsequent functional testing is needed
to determine the presence and extent of ischemia, on which the decision for referral to invasive
coronary angiography and possible revascularization is based.
Thus, rather than competing, MSCT and SPECT appear to be complementary techniques which each
its valuable position in the diagnostic work-up of patients with suspected CAD. Still, before adopting
these algorithms in clinical practice, more studies are needed, particularly focusing on long-term
prognosis.
Patient with suspected CAD
Non - invasive anatomical imaging
Normal
Functional imaging
Safe discharge
Invasive coronary angiography +
revascularization if needed
Ischemia No ischemia
Medical therapy and aggressive risk factor
modification
Obstructive Atherosclerosis
Non - obstructive Atherosclerosis
Figure 1. Potential algorithm for diagnostic imaging in patients with suspected CAD.

236 Chapter 15
References 1. Schuijf JD, Poldermans D, Shaw LJ, Jukema JW, Lamb HJ, de Roos A, Wijns W, van der Wall EE, Bax JJ. Di-
agnostic and prognostic value of non-invasive imaging in known or suspected coronary artery disease. Eur J Nucl Med Mol Imaging. 2006;33:93-104.
2. Hachamovitch R, Berman DS. The use of nuclear cardiology in clinical decision making. Semin Nucl Med. 2005;35:62-72.
3. Leschka S, Alkadhi H, Plass A, Desbiolles L, Grunenfelder J, Marincek B, Wildermuth S. Accuracy of MSCT coronary angiography with 64-slice technology: first experience. Eur Heart J. 2005;26:1482-1487.
4. Mollet NR, Cademartiri F, van Mieghem CA, Runza G, McFadden EP, Baks T, Serruys PW, Krestin GP, de Feyter PJ. High-resolution spiral computed tomography coronary angiography in patients referred for diagnostic conventional coronary angiography. Circulation. 2005;112:2318-2323.
5. Raff GL, Gallagher MJ, O’Neill WW, Goldstein JA. Diagnostic accuracy of noninvasive coronary angiogra-phy using 64-slice spiral computed tomography. J Am Coll Cardiol. 2005;46:552-557.
6. Hacker M, Jakobs T, Hack N, Nikolaou K, Becker C, von Ziegler F, Knez A, Konig A, Klauss V, Reiser M, Hahn K, Tiling R. Sixty-four slice spiral CT angiography does not predict the functional relevance of coronary artery stenoses in patients with stable angina. Eur J Nucl Med Mol Imaging. 2007;34:4-10.
7. Hacker M, Jakobs T, Matthiesen F, Vollmar C, Nikolaou K, Becker C, Knez A, Pfluger T, Reiser M, Hahn K, Tiling R. Comparison of spiral multidetector CT angiography and myocardial perfusion imaging in the noninvasive detection of functionally relevant coronary artery lesions: first clinical experiences. J Nucl Med. 2005;46:1294-1300.
8. Heller LI, Cates C, Popma J, Deckelbaum LI, Joye JD, Dahlberg ST, Villegas BJ, Arnold A, Kipperman R, Grinstead WC, Balcom S, Ma Y, Cleman M, Steingart RM, Leppo JA. Intracoronary Doppler assessment of moderate coronary artery disease: comparison with 201Tl imaging and coronary angiography. FACTS Study Group. Circulation. 1997;96:484-490.
9. Chamuleau SA, Tio RA, de Cock CC, de Muinck ED, Pijls NH, Eck-Smit BL, Koch KT, Meuwissen M, Dijkgraaf MG, de Jong A, Verberne HJ, van Liebergen RA, Laarman GJ, Tijssen JG, Piek JJ. Prognostic value of coro-nary blood flow velocity and myocardial perfusion in intermediate coronary narrowings and multivessel disease. J Am Coll Cardiol. 2002;39:852-858.
10. Schuijf JD, Bax JJ, Shaw LJ, de Roos A, Lamb HJ, van der Wall EE, Wijns W. Meta-analysis of comparative diagnostic performance of magnetic resonance imaging and multislice computed tomography for non-invasive coronary angiography. Am Heart J. 2006;151:404-411.

A Comparative Regional Analysis of
Non-Invasive Coronary Angiography and
Calcium Score by Multi-Slice Computed
Tomography with Myocardial Perfusion
Imaging by SPECT
J Nucl Med 2006; 47: 1749-1755
Joanne D. Schuijf, William Wijns, J. Wouter Jukema, Isabel Decramer, Douwe E. Atsma, Albert de Roos, Marcel P. M. Stokkel,
Petra Dibbets-Schneider, Ernst E. van der Wall, Jeroen J. Bax
16Chapter

Abstract
Background
For the non-invasive evaluation of coronary artery disease (CAD), both multi-slice computed
tomography (MSCT) and gated single photon emission computed tomography (SPECT) are
available. How these 2 modalities relate however is yet unclear. The purpose of the study was
to perform a head-to-head comparison between MSCT and gated SPECT results on a regional
basis (per vessel distribution territory) in patients with known or suspected CAD.
Methods
140 patients underwent both MSCT for coronary calcium scoring and coronary angiography
and gated SPECT for myocardial perfusion imaging. Coronary calcium score was determined
for each coronary artery. Coronary arteries on MSCT angiography were classified as having
no CAD, non-significant stenosis (<50% luminal narrowing), significant stenosis, or total or
subtotal occlusion (≥90% luminal narrowing). Gated SPECT examinations were classified as
normal or abnormal (reversible and/or fixed defects) and allocated to one of the territories of
the different coronary arteries.
Results
In coronary arteries with a calcium score ≤10, corresponding myocardial perfusion was normal
in 87% (n=194 of 224). In coronary arteries with extensive calcifications (>400), percentage
vascular territories with normal myocardial perfusion was lower, 54%, (n=13 of 24). Similarly, in
the majority of the normal coronary arteries on MSCT angiography, corresponding myocardial
perfusion on SPECT was normal (156 of 175, 89%). In contrast, percentage normal SPECT was
significantly lower in coronary arteries with obstructive lesions (59%) and total or subtotal
occlusions (8%) (P<0.01). Nonetheless, only 48% of vascular territories with normal perfusion
corresponded to normal coronary arteries on MSCT angiography, whereas non-significant
and significant stenoses were present in respectively 40% and 12% of corresponding coronary
arteries.
Conclusion
Although a relation exists between the severity of CAD on MSCT and myocardial perfusion
abnormalities on SPECT, analysis on a regional basis showed only moderate agreement
between observed atherosclerosis and abnormal perfusion. Accordingly, MSCT and gated
SPECT provide complementary rather than overlapping information and further studies
should address how these 2 modalities can be integrated to optimize patient management.

239Assessment of CAD with MSCT versus SPECT
Introduction
Choice of treatment strategy in patients with suspected or known coronary artery disease (CAD)
stems from the integration of both the extent and severity of anatomical disease and the functional
significance of the coronary lesions, i.e. signs of ischemia. Coronary anatomy used to be accessible
only through invasive coronary angiography while several imaging techniques can detect inducible
ischemia, among which myocardial perfusion imaging using single photon emission computed
tomography (SPECT). Because of its invasive nature, coronary angiography comes second and
the presence/absence of ischemia is the gatekeeper that determines access to the anatomical
information.
This paradigm is challenged with the emergence of non-invasive coronary angiography using multi-
slice computed tomography (MSCT). Because coronary anatomy can now be obtained non-invasively,
MSCT coronary angiography is increasingly often performed at earlier stages of the disease, in the
absence of functional evaluation 1. Preliminary data comparing MSCT with SPECT show that in fact a
large discrepancy exists between the anatomic extent of CAD and ischemia, and that a considerable
number of stenoses do not result in abnormal perfusion 1;2. Thus, it remains undetermined in which
sequence tests should be performed and ultimately, who will benefit from the performance of non-
invasive coronary angiography. In order to design proper evaluation strategies, it will be necessary
to understand how anatomical and functional findings relate to each other on a regional basis, per
vessel distribution territory.
Therefore, we have further explored in an unselected patient population, the relation between
the severity of anatomical CAD based on coronary calcium and MSCT angiography and perfusion
abnormalities assessed by SPECT.
Methods
Patients and study protocol
The study group consisted of 140 consecutive patients (84 male, average age 59 ± 11 years) who were
referred for both gated SPECT and MSCT due to clinical suspicion of CAD and who underwent these
investigations within 1 month of each other. CAD was known in 32 (23%) patients, and suspected
in the remaining 108 patients. Characteristics of the study population are summarized in Table 1.
Average left ventricular ejection fraction during resting gated SPECT was 60% ± 13%.
Exclusion criteria were contra-indications to MSCT 3, and the occurrence of unstable angina,
myocardial infarction or revascularization between both procedures. The study protocol was
approved by the local ethics committee and informed consent was obtained in all patients.

240 Chapter 16
MSCT coronary angiography
First, a prospective coronary calcium scan was performed prior to MSCT angiography with a collimation
4 x 3.0 mm, gantry rotation time 500 ms, the tube voltage 120 kV and tube current 200 mA. The
temporal window was set at 75% after the R-wave for electrocardiographically triggered prospective
reconstruction. Coronary calcium score was derived using dedicated software (Vitrea2, Vital Images,
Plymouth, Minn. USA). Coronary calcium was identified as a dense area in the coronary artery exceeding
the threshold of 130 HU. The global Agatston score as well as per coronary artery was recorded for each
patient. Coronary calcium scores were classified into 4 categories: ≤10, 11-100, 101-400, and >400.
For the contrast enhanced helical scan, data were acquired with a collimation of either 16 x 0.5 mm
or 64 x 0.5 mm and a tube rotation time of 400 ms, 450 ms or 500 ms (depending on the heart rate),
respectively. The tube current was 300 mA, at 120 kV. In 31 patients 16-slice MSCT (Aquilion 16, Toshiba
Medical Systems, Japan) was used 3 and in 109 patients, 64-slice MSCT (Aquilion 64, Toshiba Medical
Systems, Japan) was used. Non-ionic contrast material was administered in the antecubital vein with
an amount of 120 to 140 ml for 16-slice MSCT and 80 to 110 ml for 64-slice MSCT, depending on the
total scan time, and a flow rate of 5 ml/sec (Iomeron 400 ®), followed by a saline flush. Subsequently,
data sets were reconstructed and transferred to a remote workstation as previously described 3.
Table 1. Clinical characteristics of the study population (n=140).
n (%)Gender (M/F) 84/56Age (years) 59 ± 11Heart rate (bpm) 57 ± 8Suspected CAD 108 (77%)Known CAD 32 (23%)Previous myocardial infarction 30 (21%)Previous PCI 28 (20%) Previous stent placement 24 (17%) Stent in RCA 10 (7%) Stent in LAD 18 (13%) Stent in LCx 4 (3%)Previous CABG 2 (1%) Graft to RCA 1 (1%) Graft to LAD 2 (1%) Graft to LCx 1 (1%)Type of stress (SPECT) Exercise 90 (64%) Adenosine 41 (29%) Dobutamine 9 (6%)LVEF during rest (SPECT) 60% ± 13% Average coronary calcium score (Agatston) 310 ± 775
Abbreviations: bpm: beats per minute, CABG: coronary artery bypass grafting, CAD: coronary artery disease, LAD: left anterior descending coronary artery, LCx: left circumflex coronary artery, LVEF: left ventricular ejection fraction, PCI: percutaneous coronary intervention, RCA: right coronary artery, SPECT: single photon emission computed tomography.
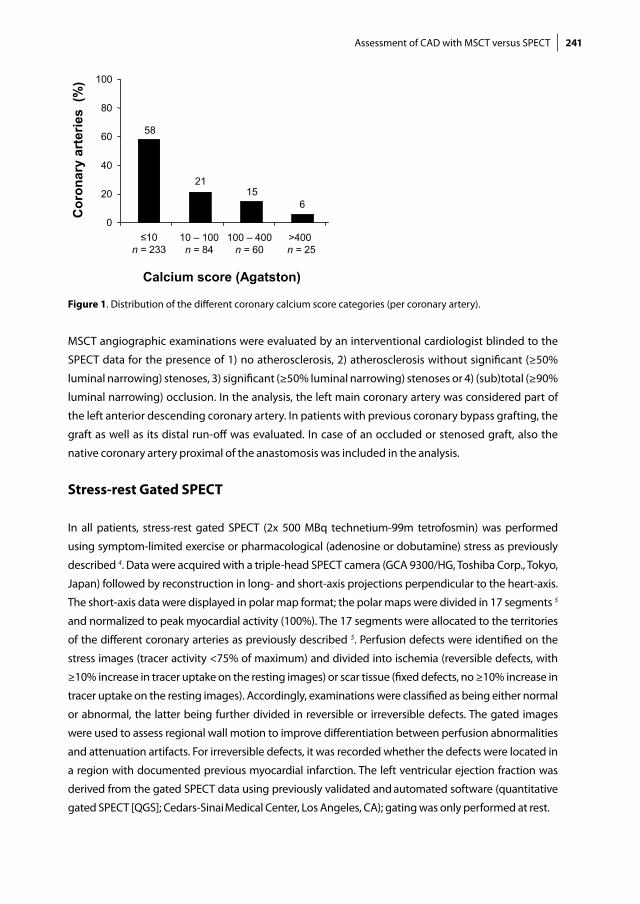
241Assessment of CAD with MSCT versus SPECT
MSCT angiographic examinations were evaluated by an interventional cardiologist blinded to the
SPECT data for the presence of 1) no atherosclerosis, 2) atherosclerosis without significant (≥50%
luminal narrowing) stenoses, 3) significant (≥50% luminal narrowing) stenoses or 4) (sub)total (≥90%
luminal narrowing) occlusion. In the analysis, the left main coronary artery was considered part of
the left anterior descending coronary artery. In patients with previous coronary bypass grafting, the
graft as well as its distal run-off was evaluated. In case of an occluded or stenosed graft, also the
native coronary artery proximal of the anastomosis was included in the analysis.
Stress-rest Gated SPECT
In all patients, stress-rest gated SPECT (2x 500 MBq technetium-99m tetrofosmin) was performed
using symptom-limited exercise or pharmacological (adenosine or dobutamine) stress as previously
described 4. Data were acquired with a triple-head SPECT camera (GCA 9300/HG, Toshiba Corp., Tokyo,
Japan) followed by reconstruction in long- and short-axis projections perpendicular to the heart-axis.
The short-axis data were displayed in polar map format; the polar maps were divided in 17 segments 5
and normalized to peak myocardial activity (100%). The 17 segments were allocated to the territories
of the different coronary arteries as previously described 5. Perfusion defects were identified on the
stress images (tracer activity <75% of maximum) and divided into ischemia (reversible defects, with
≥10% increase in tracer uptake on the resting images) or scar tissue (fixed defects, no ≥10% increase in
tracer uptake on the resting images). Accordingly, examinations were classified as being either normal
or abnormal, the latter being further divided in reversible or irreversible defects. The gated images
were used to assess regional wall motion to improve differentiation between perfusion abnormalities
and attenuation artifacts. For irreversible defects, it was recorded whether the defects were located in
a region with documented previous myocardial infarction. The left ventricular ejection fraction was
derived from the gated SPECT data using previously validated and automated software (quantitative
gated SPECT [QGS]; Cedars-Sinai Medical Center, Los Angeles, CA); gating was only performed at rest.
58
2115
6
0
20
40
60
80
100
10 – 100n = 84
100 – 400n = 60
>400 n = 25
Calcium score (Agatston)
Co
ron
ary
arte
ries
(%
)
≤10n = 233
Figure 1. Distribution of the different coronary calcium score categories (per coronary artery).

242 Chapter 16
Statistical analysis
Continuous variables were described by mean ± SD. Comparisons between patient groups were
performed using 1-way ANOVA for continuous variables and the χ2 test with Yates’ correction for
categorical variables. A P-value <0.05 was considered statistically significant.
Results
Analysis on a vessel basis
MSCTandSPECTfindings
Coronary calcium score was available in 134 (96%) patients and accordingly in 402 coronary
arteries. Average coronary calcium score per coronary artery was 102.6 ± 311.2 (range 0 - 3739). The
distribution of the different coronary calcium scores per coronary artery is provided in Figure 1. In
Figure 2A, average coronary calcium scores for the 3 coronary arteries are depicted, demonstrating
more calcium in the left anterior descending coronary artery as compared to the right and left
circumflex coronary artery (P<0.001, Kruskall-Wallis).
With MSCT angiography, a total of 420 vessels were evaluated. All coronary arteries were included.
No abnormalities were observed on MSCT angiography in 175 (42%) vessels, whereas 245 vessels
revealed either atherosclerosis without significant stenosis (n=165, 39%) or at least 1 significant
stenosis (n=80, 19%). In the latter, total or subtotal occlusions were present in 13 vessels. Results per
coronary artery are displayed in Figure 2B.
On SPECT, 420 vascular territories were available, of which 327 (78%) showed normal myocardial
perfusion. Abnormal perfusion was observed in the remaining 93 (22%) territories. In 20 territories
fixed defects corresponding to territories with known previous myocardial infarction were observed.
In the remaining 73 vascular territories, 41 territories revealed ischemia, 27 showed fixed defects,
while 5 territories showed both. Figure 2C shows the distribution of perfusion findings among the
territories of the different coronary arteries.
StenosesonMSCTangiographyversuscoronaryarterycalciumscore
Average coronary artery calcium score was 1.4 ± 6.0 for normal coronary arteries and increased to
111.6 ± 212.9 and 313.3 ± 600.4 for coronary arteries with non-significant and significant stenoses,
respectively (P<0.001 Kruskall-Wallis). Considering only (sub-)total lesions, the extent of coronary
calcifications was even higher, 656.5 ± 280.9 (P<0.001). In the majority (n=284, 90%) of coronary
arteries with a coronary calcium score below 100, no significant stenoses were demonstrated. In 33
of 60 coronary arteries with a calcium score between 100 and 400, significant stenoses was present
in 45%. This percentage further increased to 60% in 25 coronary arteries with a calcium score above
400.

243Assessment of CAD with MSCT versus SPECT
020406080100
RC
An
= 1
40LA
Dn
= 1
40LC
xn
= 1
40
Co
ron
ary
arte
ry
Percentage (%)
(Sub
)tot
aloc
clus
ion
Sig
nific
ant s
teno
sis
Non
sign
ifica
ntst
enos
is
Nor
mal
P<
0.0
5P
= N
S
020406080100
RC
An
= 1
40LA
Dn
= 1
40LC
xn
= 1
40
Per
fusi
on
ter
rito
ry
Percentage (%)
Bot
h
Irre
vers
ible
def
ect
Rev
ersi
ble
defe
ct
Nor
mal
P<
0.0
5P
= N
S
Figu
re 2
. Res
ults
per
cor
onar
y ar
tery
and
per
fusi
on te
rrito
ry.
RC
An
= 1
34LA
Dn
= 1
34LC
xn
= 1
34
Co
ron
ary
arte
ry
50100
150
200
Average coronarycalcium score (Agatston)
P<
0.0
01P
< 0
.001
P=
NS
(A) A
vera
ge c
oron
ary
calc
ium
sco
res
(+95
% C
I) pe
r co
rona
ry a
rter
y.(B
) MSC
T re
sults
per
cor
onar
y ar
tery
. (C
) SPE
CT
resu
lts p
er c
oron
ary
perf
usio
n te
rrito
ry.

244 Chapter 16
PerfusiononSPECTversuscoronaryarterycalciumscore
The average calcium score in coronary arteries with normal myocardial perfusion on SPECT was 69 ±
167, whereas a significantly higher calcium score of 272 ± 646 was noted for coronary arteries with
abnormal SPECT (P<0.001, Mann-Whitney).
Figure 3 shows the distribution of normal and abnormal myocardial perfusion (with exclusion of 19
vascular territories with previous myocardial infarction) according to the different calcium scores.
In the majority (n=194, 87%) of coronary arteries with no or minimal calcium (≤10), a normal SPECT
was obtained. Percentage normal perfusion was only slightly lower (85%) in coronary arteries with
a calcium score between 11 and 100 (P=NS). In coronary arteries with more extensive calcifications,
87 8575
54
46
251513
0
20
40
60
80
100
≤10n = 224
11 – 100n = 78
101 – 400n = 57
>400n = 24
Calcium score (Agatston)
Per
cen
tag
e S
PE
CT
res
ult
s (%
)
SPECT normal
SPECT abnormal
Figure 3. Distribution of normal (n=316) and abnormal (n=67) myocardial perfusion (vessel based) on SPECT between the different coronary calcium score categories.
87
13
0
20
40
60
80
100
Calcium score = 10 (Agatston)n = 224
Per
cen
tag
e (%
)
5446
0
20
40
60
80
100
Calcium score > 400 (Agatston)n = 24
Per
cen
tag
e (%
)
SPECT normal
SPECT abnormal
A B
87
13
0
20
40
60
80
100
Calcium score ≤ 10 (Agatston)n = 224
Per
cen
tag
e (%
)
SPECT normal
SPECT abnormal
Figure 4. Relation between calcium and perfusion. (A) Prediction of normal perfusion.(B) Prediction of abnormal perfusion

245Assessment of CAD with MSCT versus SPECT
percentage normal myocardial perfusion on SPECT was significantly lower: 75% and 54% for
coronary arteries with calcium scores between 100 and 400 and >400, respectively (P=0.008).
Thus, the likelihood of normal perfusion on SPECT decreased in parallel to an increasing calcium
score on MSCT. The predictive value of absence of calcium (score ≤10) for normal perfusion was 87%
(Fig. 4A), but the value of significant calcium (score >400) for prediction of abnormal perfusion was
only 46% (Fig. 4B).
PerfusionversusstenosesonMSCTangiography
In the majority of normal coronary arteries on MSCT angiography, myocardial perfusion on SPECT in the
corresponding territories was normal (156 of 175, 89%). In coronary arteries with stenoses (regardless of
severity, n=225) on MSCT (with exclusion of 20 vascular territories with previous myocardial infarction),
myocardial perfusion on SPECT was still normal in 171 (76%) corresponding territories. However, the
likelihood of normal perfusion in coronary arteries with a significant stenosis or (sub-)total occlusion
decreased significantly (Fig. 5). Of the 78 coronary arteries with significant stenoses on MSCT, abnormal
perfusion on SPECT was present in 38 (49%) of the corresponding territories, and perfusion on SPECT
was abnormal in almost all coronary arteries with (sub-)total occlusion (11 of 12, 92%).
Thus, a normal MSCT had a high predictive value for normal myocardial perfusion (89%, Fig. 6A);
however, normal perfusion on SPECT did not exclude abnormalities on MSCT and the value of
normal perfusion to predict a normal MSCT was only 48% (Fig. 6B).
In Figure 7 the relation between MSCT and SPECT is depicted per coronary artery/vascular territory.
No significant differences were observed between the different coronary arteries. However,
significant stenoses located in the right coronary artery tended to result more frequently in abnormal
myocardial perfusion on SPECT as compared to the left anterior descending and left circumflex
coronary artery, although no statistical significance was reached (P=0.056).
59
8
8989
0
20
40
60
80
100
Normaln = 175
Nonsignificantstenosisn = 147
Significant stenosisn = 66
(Sub-)total occlusion
n = 12
Degree of stenosis on MSCT
Per
cen
tag
e n
orm
al m
yoca
rdia
l p
erfu
sio
n o
n S
PE
CT
(%
)P = NS P < 0.01 P < 0.01
Figure 5. Relation between stenosis severity on MSCT and myocardial perfusion on SPECT.
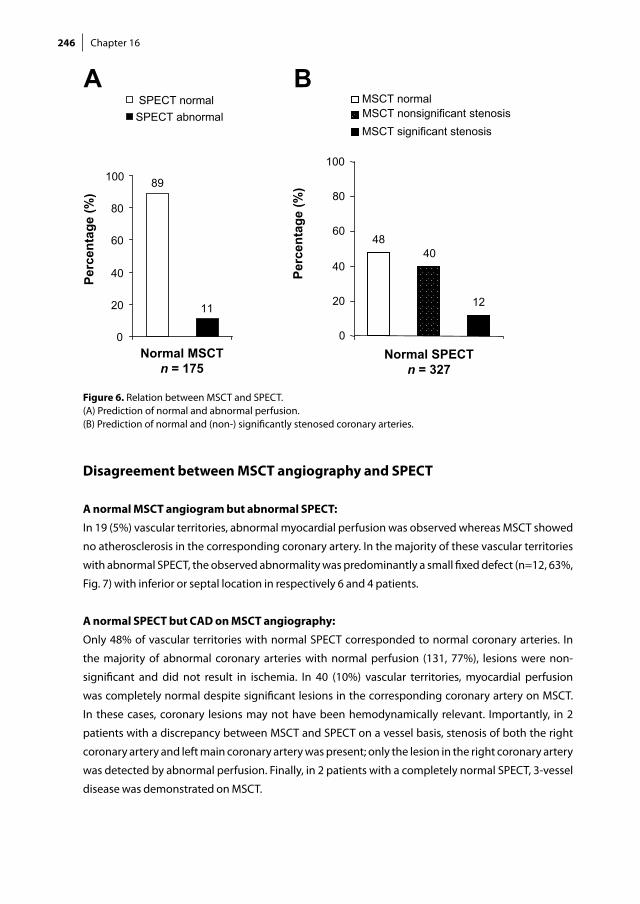
246 Chapter 16
Figure 6. Relation between MSCT and SPECT.(A) Prediction of normal and abnormal perfusion.(B) Prediction of normal and (non-) significantly stenosed coronary arteries.
Disagreement between MSCT angiography and SPECT
A normal MSCT angiogram but abnormal SPECT:
In 19 (5%) vascular territories, abnormal myocardial perfusion was observed whereas MSCT showed
no atherosclerosis in the corresponding coronary artery. In the majority of these vascular territories
with abnormal SPECT, the observed abnormality was predominantly a small fixed defect (n=12, 63%,
Fig. 7) with inferior or septal location in respectively 6 and 4 patients.
A normal SPECT but CAD on MSCT angiography:
Only 48% of vascular territories with normal SPECT corresponded to normal coronary arteries. In
the majority of abnormal coronary arteries with normal perfusion (131, 77%), lesions were non-
significant and did not result in ischemia. In 40 (10%) vascular territories, myocardial perfusion
was completely normal despite significant lesions in the corresponding coronary artery on MSCT.
In these cases, coronary lesions may not have been hemodynamically relevant. Importantly, in 2
patients with a discrepancy between MSCT and SPECT on a vessel basis, stenosis of both the right
coronary artery and left main coronary artery was present; only the lesion in the right coronary artery
was detected by abnormal perfusion. Finally, in 2 patients with a completely normal SPECT, 3-vessel
disease was demonstrated on MSCT.
89
11
0
20
40
60
80
100
Normal MSCTn = 175
Per
cen
tag
e (%
) SPECT normal
SPECT abnormal
A B
4840
12
0
20
40
60
80
100
Normal SPECTn = 327
MSCT normalMSCT nonsignificant stenosis
MSCT significant stenosis
Per
cen
tag
e (%
)

247Assessment of CAD with MSCT versus SPECT
Analysis on a patient basis
MSCTandSPECTfindings
Average coronary calcium per patient was 310 ± 775 (range 0 to 6264). MSCT coronary angiography
was normal in 43 (31%) patients, whereas non-obstructive and obstructive CAD was noted in
respectively 51 (36%) and 46 (33%) patients. A normal SPECT study was obtained in 77 (55%) patients,
whereas abnormal perfusion was noted in 63 (45%) patients, corresponding to previous myocardial
infarction in 15 (11%) patients.
StenosesonMSCTangiographyversuscoronaryarterycalciumscore
Average coronary artery calcium score was 3.8 ± 11 for patients with normal coronary arteries and
increased to 207 ± 271 and 726 ± 1239 in patients with non-significant and significant stenoses,
respectively (P<0.001 Kruskall-Wallis). In the majority (n=45, 88%) of patients with a coronary calcium
score ≤ 10, no significant stenoses were demonstrated. In 20 of 57 patients with a calcium score
between 11 and 400, significant stenoses were present in 35%. This percentage further increased to
65% in patients with a calcium score above 400.
PerfusiononSPECTversuscoronaryarterycalciumscore
The average calcium score in patients with normal myocardial perfusion on SPECT was 162 ± 332,
whereas a significantly higher calcium score of 580 ± 1232 was noted for patients with abnormal
SPECT (P<0.05, Mann-Whitney).
In the majority (n=49, 78%) of patients without extensive calcium (≤100), a normal SPECT was
obtained. Percentage normal perfusion was slightly lower (60%) in patients with a calcium score
between 101 and 400 (P=NS). In coronary arteries with calcium scores >400, percentage normal
myocardial perfusion on SPECT was even lower (41%, P=NS).
Figure 7. Relation between MSCT and SPECT per coronary artery/vascular territory.
Normal
0
20
40
60
80
100
RCA LAD LCx RCA LAD LCx RCA LAD LCx
MSCT results
SP
EC
T r
esu
lts
(%)
Irreversible defect
Reversible defect
Normal SPECT
Nonsignificantstenosis
Significant stenosis

248 Chapter 16
PerfusionversusstenosesonMSCTangiography
In the majority of patients with normal MSCT angiography, the corresponding SPECT study was
normal as well (37 of 43, 86%). In patients with non-significant stenoses on MSCT angiography
(n=38, with exclusion of 13 patients with abnormal perfusion corresponding to previous myocardial
infarction), myocardial perfusion on SPECT was normal in 24 (63%) patients. The percentage normal
perfusion studies further decreased to 36% in patients with at least 1 significant stenosis (P<0.05).
Thus, a normal MSCT angiogram had a high predictive value for normal myocardial perfusion
(86%). However, similar to the vessel-based analysis, normal perfusion on SPECT did not exclude
abnormalities on MSCT angiography as a normal MSCT angiogram was obtained in only 37 (48%) of
77 patients with normal perfusion.
Discussion
In the present study, atherosclerosis imaging with MSCT was compared to myocardial perfusion
imaging with gated SPECT on a coronary artery and corresponding vascular territory basis. Normal
coronary arteries on MSCT were associated with normal perfusion in the majority (89%) of vascular
territories. Moreover, the likelihood of an abnormal SPECT study increased gradually in relation
to increasing abnormalities on MSCT, with 92% of SPECT studies being abnormal in (sub-)total
occlusions on MSCT. Still, 76% of the coronary arteries with atherosclerosis on MSCT did not exhibit
perfusion abnormalities on SPECT, indicating that atherosclerosis does frequently not result in
ischemia. Normal perfusion on SPECT was associated with normal MSCT in only 48% of vascular
territories; 52% of territories with normal SPECT had atherosclerosis on MSCT, with 40% having non-
obstructive and 12% having obstructive CAD.
These observations highlight that normal perfusion on SPECT does not exclude atherosclerosis.
Accordingly, MSCT and gated SPECT provide complementary rather than redundant information,
since the techniques reflect distinct functional and anatomical patho-physiological processes.
An abnormal MSCT does not necessarily imply ischemia
The vast majority (76%) of lesions on MSCT did not result in perfusion abnormalities or ischemia
on SPECT imaging. In particular, 89% of non-obstructive lesions on MSCT were not associated with
perfusion abnormalities on SPECT. This observation underscores that MSCT permits detection
of CAD at an earlier stage than SPECT imaging: the detection of atherosclerosis while perfusion is
not yet compromised. Similar results were reported recently by Hacker et al, using 16-slice MSCT,
and demonstrated in 25 patients that only 8 (47%) of 17 significant stenoses on MSCT resulted
in abnormal perfusion on SPECT 2. Yet, in the present study, a stepwise increase in the incidence
of SPECT perfusion abnormalities was observed in relation to an increasing severity of MSCT
abnormalities (Fig. 5). In particular, (sub-) total occlusions were in 92% of cases associated with
abnormal myocardial perfusion on SPECT. Also, less severe but still significant lesions resulted in
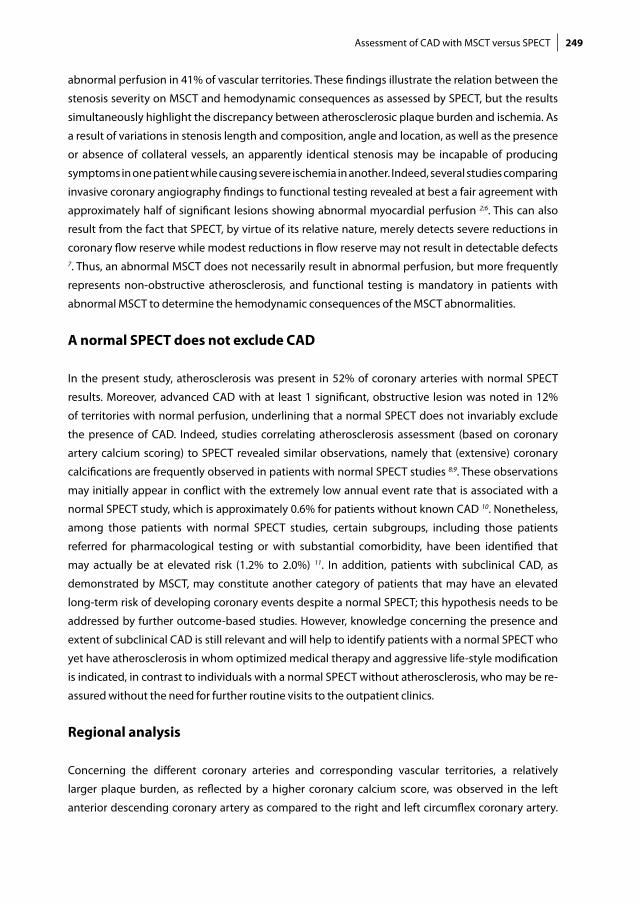
249Assessment of CAD with MSCT versus SPECT
abnormal perfusion in 41% of vascular territories. These findings illustrate the relation between the
stenosis severity on MSCT and hemodynamic consequences as assessed by SPECT, but the results
simultaneously highlight the discrepancy between atherosclerosic plaque burden and ischemia. As
a result of variations in stenosis length and composition, angle and location, as well as the presence
or absence of collateral vessels, an apparently identical stenosis may be incapable of producing
symptoms in one patient while causing severe ischemia in another. Indeed, several studies comparing
invasive coronary angiography findings to functional testing revealed at best a fair agreement with
approximately half of significant lesions showing abnormal myocardial perfusion 2;6. This can also
result from the fact that SPECT, by virtue of its relative nature, merely detects severe reductions in
coronary flow reserve while modest reductions in flow reserve may not result in detectable defects 7. Thus, an abnormal MSCT does not necessarily result in abnormal perfusion, but more frequently
represents non-obstructive atherosclerosis, and functional testing is mandatory in patients with
abnormal MSCT to determine the hemodynamic consequences of the MSCT abnormalities.
A normal SPECT does not exclude CAD
In the present study, atherosclerosis was present in 52% of coronary arteries with normal SPECT
results. Moreover, advanced CAD with at least 1 significant, obstructive lesion was noted in 12%
of territories with normal perfusion, underlining that a normal SPECT does not invariably exclude
the presence of CAD. Indeed, studies correlating atherosclerosis assessment (based on coronary
artery calcium scoring) to SPECT revealed similar observations, namely that (extensive) coronary
calcifications are frequently observed in patients with normal SPECT studies 8;9. These observations
may initially appear in conflict with the extremely low annual event rate that is associated with a
normal SPECT study, which is approximately 0.6% for patients without known CAD 10. Nonetheless,
among those patients with normal SPECT studies, certain subgroups, including those patients
referred for pharmacological testing or with substantial comorbidity, have been identified that
may actually be at elevated risk (1.2% to 2.0%) 11. In addition, patients with subclinical CAD, as
demonstrated by MSCT, may constitute another category of patients that may have an elevated
long-term risk of developing coronary events despite a normal SPECT; this hypothesis needs to be
addressed by further outcome-based studies. However, knowledge concerning the presence and
extent of subclinical CAD is still relevant and will help to identify patients with a normal SPECT who
yet have atherosclerosis in whom optimized medical therapy and aggressive life-style modification
is indicated, in contrast to individuals with a normal SPECT without atherosclerosis, who may be re-
assured without the need for further routine visits to the outpatient clinics.
Regional analysis
Concerning the different coronary arteries and corresponding vascular territories, a relatively
larger plaque burden, as reflected by a higher coronary calcium score, was observed in the left
anterior descending coronary artery as compared to the right and left circumflex coronary artery.

250 Chapter 16
Also slightly more abnormalities were encountered in this coronary artery and corresponding
vascular territory during coronary angiography and perfusion imaging, respectively. Nonetheless,
in the present study significant stenoses located in the right coronary artery tended to result most
frequently in abnormal myocardial perfusion on SPECT, which may be attributable to the higher
frequency of severe, (sub)total occlusions in this coronary artery as compared to the left anterior and
left circumflex coronary arteries.
Limitations
Some limitations need to be defined. First, myocardial perfusion on SPECT was related to
atherosclerosis in coronary arteries and perfect alignment between these methods is difficult,
since precise definition of vascular territories is hampered by variations in coronary anatomy. Also,
a threshold of 50% luminal narrowing on MSCT was applied, while a threshold of 70% might have
resulted in increased agreement between the 2 techniques. Second, the study population consisted
of patients with various clinical presentations with both suspected and known CAD. Studies
performed in more homogenous study populations may provide more uniform results, yet may not
be generalizable to a “real life” population referred for evaluation of CAD, such as the one included
in the present study. Similarly, applied stress protocols for gated SPECT were not identical, as these
were performed as part of standard clinical routine.
Other limitations include the lack of attenuation correction for SPECT, which may (partially) explain
the abnormal SPECT findings in the presence of a completely normal MSCT, albeit a relatively
unfrequent finding. Also, no comparison to conventional coronary angiography was available. In
addition, data were acquired with 2 different generations of MSCT scanners, while ideally all patients
would have been evaluated with 64-slice MSCT. Finally, several limitations of MSCT in general need
to be acknowledged. The technique involves radiation, and further technical developments are
needed to lower the radiation burden. Also, motion artifacts as well as severe coronary calcifications
have been demonstrated to reduce diagnostic accuracy 12;13.
Conclusions
The current analysis on a regional basis underscores that although a relation exists between the
2 modalities, MSCT and SPECT provide complementary information, namely the presence of
(subclinical) atherosclerosis versus the presence of ischemia. Further studies should address how
these 2 modalities may be integrated to optimize patient management.
251Assessment of CAD with MSCT versus SPECT
References1. Schuijf JD, Wijns W, Jukema JW, Atsma DE, de Roos A, Lamb HJ, Stokkel MP, Dibbets-Schneider P, Decra-
mer I, de Bondt P, van der Wall EE, Vanhoenacker PK, Bax JJ. Relationship between noninvasive coronary angiography with multi-slice computed tomography and myocardial perfusion imaging. J Am Coll Car-diol. 2006;48:2508-2514.
2. Hacker M, Jakobs T, Matthiesen F, Vollmar C, Nikolaou K, Becker C, Knez A, Pfluger T, Reiser M, Hahn K, Tiling R. Comparison of spiral multidetector CT angiography and myocardial perfusion imaging in the noninvasive detection of functionally relevant coronary artery lesions: first clinical experiences. J Nucl Med. 2005;46:1294-1300.
3. Schuijf JD, Bax JJ, Salm LP, Jukema JW, Lamb HJ, van der Wall EE, de Roos A. Noninvasive coronary im-aging and assessment of left ventricular function using 16-slice computed tomography. Am J Cardiol. 2005;95:571-574.
4. Beeres SL, Bax JJ, Kaandorp TA, Zeppenfeld K, Lamb HJ, Dibbets-Schneider P, Stokkel MP, Fibbe WE, de Roos A, van der Wall EE, Schalij MJ, Atsma DE. Usefulness of intramyocardial injection of autologous bone marrow-derived mononuclear cells in patients with severe angina pectoris and stress-induced myocardial ischemia. Am J Cardiol. 2006;97:1326-1331.
5. Cerqueira MD, Weissman NJ, Dilsizian V, Jacobs AK, Kaul S, Laskey WK, Pennell DJ, Rumberger JA, Ryan T, Verani MS. Standardized myocardial segmentation and nomenclature for tomographic imaging of the heart: a statement for healthcare professionals from the Cardiac Imaging Committee of the Council on Clinical Cardiology of the American Heart Association. Circulation. 2002;105:539-542.
6. Salm LP, Bax JJ, Jukema JW, Langerak SE, Vliegen HW, Steendijk P, Lamb HJ, de Roos A, van der Wall EE. Hemodynamic evaluation of saphenous vein coronary artery bypass grafts: relative merits of Doppler flow velocity and SPECT perfusion imaging. J Nucl Cardiol. 2005;12:545-552.
7. Yoshinaga K, Katoh C, Noriyasu K, Iwado Y, Furuyama H, Ito Y, Kuge Y, Kohya T, Kitabatake A, Tamaki N. Reduction of coronary flow reserve in areas with and without ischemia on stress perfusion imag-ing in patients with coronary artery disease: a study using oxygen 15-labeled water PET. J Nucl Cardiol. 2003;10:275-283.
8. Berman DS, Wong ND, Gransar H, Miranda-Peats R, Dahlbeck J, Hayes SW, Friedman JD, Kang X, Polk D, Hachamovitch R, Shaw L, Rozanski A. Relationship between stress-induced myocardial ischemia and atherosclerosis measured by coronary calcium tomography. J Am Coll Cardiol. 2004;44:923-930.
9. Thompson RC, McGhie AI, Moser KW, O’Keefe JH, Jr., Stevens TL, House J, Fritsch N, Bateman TM. Clini-cal utility of coronary calcium scoring after nonischemic myocardial perfusion imaging. J Nucl Cardiol. 2005;12:392-400.
10. Shaw LJ, Iskandrian AE. Prognostic value of gated myocardial perfusion SPECT. J Nucl Cardiol. 2004;11:171-185.
11. Underwood SR, Anagnostopoulos C, Cerqueira M, Ell PJ, Flint EJ, Harbinson M, Kelion AD, Al Mohammad A, Prvulovich EM, Shaw LJ, Tweddel AC. Myocardial perfusion scintigraphy: the evidence. Eur J Nucl Med Mol Imaging. 2004;31:261-291.
12. Hoffmann U, Moselewski F, Cury RC, Ferencik M, Jang IK, Diaz LJ, Abbara S, Brady TJ, Achenbach S. Pre-dictive value of 16-slice multidetector spiral computed tomography to detect significant obstructive coronary artery disease in patients at high risk for coronary artery disease: patient-versus segment-based analysis. Circulation. 2004;110:2638-2643.
13. Nieman K, Rensing BJ, van Geuns RJ, Vos J, Pattynama PM, Krestin GP, Serruys PW, de Feyter PJ. Non-in-vasive coronary angiography with multislice spiral computed tomography: impact of heart rate. Heart. 2002;88:470-474.

Evaluation of Coronary Artery Disease:
Implications of Invasive versus
Non-Invasive Imaging
Submitted
Joanne D. Schuijf, Jacob M. van Werkhoven, Gabija Pundziute, J. Wouter Jukema, Isabel Decramer, Marcel P. Stokkel,
Petra Dibbets-Schneider, Martin J. Schalij, Johannes H. C. Reiber, Ernst E. van der Wall, William Wijns, Jeroen J. Bax
17Chapter

Abstract
Background
Preliminary comparisons suggest a large discrepancy between an abnormal Multi-Slice
Computed Tomography (MSCT) study and myocardial perfusion imaging (MPI) results. How
these contradictory findings should be interpreted remains presently unclear. The purpose of
the present study was to perform, in addition to MSCT and MPI, invasive imaging, not only of
the coronary lumen (using quantitative coronary angiography, QCA) but also of the vessel wall
(using intravascular ultrasound, IVUS).
Methods
A total of 62 patients underwent both MSCT and MPI followed by conventional coronary
angiography and IVUS imaging (in 45 patients). QCA and IVUS measurements were performed
of the severest lesion, while MSCT studies were classified as normal (no stenosis exceeding
30% luminal narrowing), or abnormal with further classification into borderline (30% to 70%
luminal narrowing) or severe stenosis (≥70% luminal narrowing). Stress-rest gated MPI was
performed to evaluate myocardial perfusion.
Results
A good agreement between modalities was observed in patients with abnormal MPI. However,
a normal MPI study was in most patients associated with an abnormal MSCT study (82%)
despite only minimal luminal stenosis on QCA (26.0%). Further evaluation by IVUS revealed the
presence of considerable plaque burden (57.9%), yet without luminal compromise (average
minimal luminal area 5.9 mm2).
Conclusion
Observations between MPI, MSCT and QCA may appear initially contradictory as an abnormal
MSCT is frequently obtained in patients with normal perfusion and conventional angiograms.
In these patients, the detected atherosclerosis may be located mainly in the vessel wall, rather
than extending into the coronary lumen.
255Evaluation of Coronary Artery Disease: Implications of Invasive versus Non-Invasive Imaging
Introduction
Traditionally, the evaluation and management of patients with suspected coronary artery disease
(CAD) has been based on the non-invasive detection of ischemia followed by invasive coronary angi-
ography to confirm the presence of luminal stenosis. However, this paradigm has recently been chal-
lenged by the introduction of multi-slice computed tomography (MSCT). With this new technique, the
presence of CAD is detected through direct visualization of the coronary artery stenoses rather than
through their hemodynamical consequences. Preliminary comparisons between MPI and MSCT sug-
gest a large discrepancy between imaging results and abnormal MSCT studies appear to be frequently
associated with normal MPI studies 1;2. How these diverging findings should be interpreted remains at
present unclear. It is conceivable that the vast majority of patients with abnormal MSCT but normal
MPI have non-obstructive CAD, located mainly in the vessel wall, rather than encroaching on the coro-
nary artery lumen. To test this hypothesis, additional studies are needed involving invasive imaging,
not only of the coronary artery lumen (using invasive coronary angiography) but also of the vessel wall
(using intravascular ultrasound, IVUS).
Methods
Patients and study protocol
The study group consisted of 62 symptomatic patients who underwent MSCT and MPI but also
invasive coronary angiography in combination with IVUS.
Exclusion criteria were contra-indications to MSCT 3, and the occurrence of unstable angina,
myocardial infarction or revascularization during the study period. The study protocol was approved
by the local ethics committee and informed consent was obtained in all patients.
Multi-slice computed tomography coronary angiography
MSCT coronary angiography was performed using either an Aquilion 64 (Toshiba Medical Systems, Japan)
or a Sensation 64 (Siemens, Germany). Collimation was either 64 x 0.5 mm or 64 x 0.6 mm, respectively.
The tube current was 300 mA, at 120 kV. Non-ionic contrast material was administered in the antecubital
vein with an amount of 80 to 110 ml for 64-slice MSCT, depending on the total scan time, and a flow rate
of 5 ml/sec (Iomeron 400 ®), followed by a saline flush. Subsequently, data sets were reconstructed and
transferred to a remote workstation as previously described 3.
MSCT angiographic examinations were evaluated on a vessel and patient basis by 2 experienced readers
including an interventional cardiologist blinded to the SPECT data for the presence of atherosclerosis ex-
ceeding 30% luminal narrowing. Abnormal studies were further classified as borderline stenosis, showing
30% to 70% luminal narrowing, or severe stenosis, showing ≥70% luminal narrowing. In the vessel-based
analysis, the left main coronary artery was considered part of the left anterior descending coronary artery.

256 Chapter 17
Myocardial perfusion imaging
In all patients, stress-rest MPI (using either technetium-99m tetrofosmin or technetium-99m
sestamibi) was performed with symptom-limited bicycle exercise or pharmacological (dipyridamole,
adenosine or dobutamine) stress 4. Data were acquired with either a dual-head SPECT camera
(Vertex Epic ADAC Pegasus) or a triple-head SPECT camera (GCA 9300/HG, Toshiba Corp., Tokyo,
Japan) followed by reconstruction into long- and short-axis projections perpendicular to the heart-
axis; data were presented in polar map format (normalized to 100%), and a 17-segment model
was used in which myocardial segments were allocated to the territories of the different coronary
arteries as previously described 5;6. Perfusion defects were identified on the stress images (segmental
tracer activity less than 75% of maximum) and divided into ischemia (reversible defects, with ≥10%
increase in tracer uptake on the resting images) or scar tissue (irreversible defects)2. Accordingly,
examinations were classified as being either normal or abnormal, the latter being further divided
in those demonstrating reversible defects and those demonstrating irreversible defects. The gated
images were used to assess regional wall motion to improve differentiation between perfusion
abnormalities and attenuation artifacts 7. The left ventricular ejection fraction was derived from the
gated SPECT data using previously validated and automated software (quantitative gated SPECT
[QGS]; Cedars-Sinai Medical Center, Los Angeles, CA); gating was only performed at rest.
Conventional coronary angiography
Conventional coronary angiography was performed according to standard clinical protocols.
Quantitative coronary angiography (QCA) was performed using QCA-CMS 6.0 (Medis, Leiden, the
Netherlands). For each coronary artery, the most severe stenosis was identified. The tip of the catheter
was used for calibration and after automated vessel contour detection with manual correction if
needed, percentage diameter stenosis was calculated.
Intravascular ultrasound
IVUS imaging was performed with 2.9Fr 20-MHz catheters (Eagle Eye, Volcano, Brussels, Belgium).
After intracoronary administration of nitrates, the IVUS catheter was advanced to the distal portion
of coronary artery under fluoroscopic guidance. Using automated pullback device, the transducer
was withdrawn at a continuous speed of 0.5 mm/s up to the coronary ostium. Cine runs before and
during contrast injection were performed to confirm the position of the IVUS transducer before
IVUS evaluation was started. All data were stored digitally and were analysed off-line with the
use of QCU-CMS 4.0 (Medis, Leiden, The Netherlands). After motion correction had been applied,
coronary arteries were divided into segments according to the modified American Heart Association
classification 8 using coronary ostia and side branches as landmarks. In each coronary segment, the
frame with the most severe cross-sectional area of narrowing was selected for analysis. In addition,
proximal and distal reference sites that had the largest lumen area by IVUS in the proximal and distal

257Evaluation of Coronary Artery Disease: Implications of Invasive versus Non-Invasive Imaging
portion of the vessel segment in the 10 mm adjacent (but before any side-branch) to the lesion site
were selected. Subsequently, lumen and external elastic membrane (EEM) contours were manually
traced to determine lumen area and EEM area at the lesion site and proximal and distal reference
site. EEM area was defined as the area that was circumscribed by the border between the hypoechoic
media zone and the surrounding echocardiographically bright adventitia. Plaque plus media area
was calculated as the difference between the EEM and the lumen area. Based on these parameters,
minimal lumen area (MLA), plaque area, plaque burden, lumen area stenosis, lumen diameter
stenosis and corrected lumen area stenosis were calculated per coronary segment as previously
described 9;10.
In addition, vascular remodelling was determined in 2 ways, as previously described 11;12. First, the
impact of excess plaque accumulation (at the lesion compared with the reference section) on lumen
compromise was calculated using the following formula: (reference lumen area- MLA)/ (plaque
area at the lesion – plaque area at the reference section) 11. Accordingly, with increasing index
values, the impact of plaque accumulation on lumen compromise will be more severe. In contrast,
an index of 0 will be obtained if all the additional plaque accumulation is accommodated for by
arterial remodelling, resulting in no decrease in lumen area. Secondly, the number of lesions with
positive remodelling was determined by calculating the remodelling index (RI) by dividing the
lesion EEM area by the average of the proximal and distal reference EEM area. Subsequently, positive
remodelling was defined as a RI ≥ 1.0, whereas RI < 1.0 was classified as negative remodelling 12.
Statistical analysis
Data were analysed on a per-patient and per-vessel basis and for the corresponding calculations,
the coronary artery and coronary segment showing the most severe stenosis on either QCA or IVUS
were used respectively. Continuous variables were described by mean ± SD. Comparisons between
patient groups were performed using the independent samples T test for continuous variables and
the χ2 test with Yates’ correction was used for comparison of categorical variables. A P-value <0.05 was
considered statistically significant. All statistical analyses were performed using SPSS (SPSS Institute,
Chicago, Illinois, USA).
Results
Patient characteristics
Characteristics of the study population are summarized in Table 1. Briefly, 62 patients were included,
of which 41 (66%) were male with an average age of 62 ± 11 years. CAD was known in 5 (8%) patients,
and suspected in the remaining 57 (92%) patients. Previous coronary artery bypass grafting was
previously performed in one patient. A total of 2 vascular territories were excluded from the analysis,
since these territories were supplied by coronary artery bypass grafts. In all patients MPI, MSCT and

258 Chapter 17
conventional coronary angiography (with QCA) were performed. In 45 patients, additional vascular
imaging with IVUS was performed in a total of 94 coronary arteries.
MPI versus MSCT and invasive angiography
Patientbasis
The results of the analysis on a patient basis (n=62) are presented in Table 2 and Figure 1. Abnormal
perfusion on SPECT was noted in 23 (37%) patients. This abnormal perfusion was associated an
abnormal MSCT in all patients, with borderline stenosis in 9 (39%) patients and at least 1 severe
lesion in 14 (61%). Considering the most severe stenosis per patient on conventional angiography,
QCA showed an average percentage stenosis of 78.3% ± 16.5%.
The remaining 39 (63%) patients had normal perfusion on SPECT. In these patients, MSCT was
abnormal in 32 (82%) patients with all patients classified as having borderline stenosis. However,
average percentage stenosis of the most severe lesion was only 26.0% ± 16.8% on QCA (P<0.001
versus patients with abnormal SPECT).
Table 1. Clinical characteristics of the study population (n=62).n (%)
Gender (M/F) 41/21 Age (years) 62 ± 11Risk factors for CAD Diabetes Mellitus18 (32%) Hypertension41 (72%) Hypercholesterolemia 31 (54%) Positive family history 22 (39%) Current smoking 22 (39%) Obese (BMI ≥ 30 kg/m2) 12 (25%)Agatston calcium score (range) 374 ± 764 (0,4828)LVEF on gated SPECT 58% ± 14%Nr of significantly stenosed vessels on angiography 0 31 (50%) 1 12 (19%) 2 11 (18%) 3 8 (13%)
Abbreviations: BMI: body mass index, CAD: coronary artery disease, IVUS: intravascular ultrasound, LVEF: left ventricu-lar ejection fraction, SPECT: single photon emission computed tomography.
Table 2. Angiographic characteristics (MSCT and QCA) for patients with respectively abnormal and normal perfusion.
MPI abnormal (n=23) MPI normal (n=39) P -valueMSCT Normal 0 7 (18%) Abnormal 23 (100%) 32 (82%) P=NS Borderline stenosis 9 (39%) 32 (100%) Severe stenosis 14 (61%) 0 (0%) P<0.01QCA 78.3% ± 16.5% 26.0% ± 16.8% P<0.01

259Evaluation of Coronary Artery Disease: Implications of Invasive versus Non-Invasive Imaging
Vesselbasis
On a vessel basis, abnormal myocardial perfusion was noted in 34 (17%) of 184 vascular territories
with ischemia in 29 and fixed perfusion defects in 3 vascular territories (Table 3). In all of the
corresponding coronary arteries, MSCT was abnormal as well. At least 1 severe lesion was observed
in 16 (47%) coronary arteries, while lesions were classified as borderline in 18 (53%) vessels. Average
percentage stenosis on QCA was 70.6% ± 24.5%.
In 150 (82%) vascular territories with normal perfusion on SPECT, atherosclerosis was detected on
MSCT in 109 (73%) of the corresponding coronary arteries, of which the majority (105, 96%) were
classified as showing borderline stenosis. A total of 41 (27%) coronary arteries were normal on
MSCT. According to QCA, average percentage stenosis in coronary arteries associated with normal
perfusion was 22.1% ± 18.7% (P<0.001 as compared to abnormal SPECT).
62 patients
39 (63%) normal23 (37%) abnormal
23 (100%) abnormal(14, 61%, severe lesion)
(9, 39%, borderline lesion)
0 (0%) normal
78.3 ± 16.5%
MPI
MSCT
QCA
32 (82%) abnormal(0, 0% severe lesion)
(32, 100%, borderline lesion)
7 (18%) normal
26.0 ± 16.8% P<0.01
P=NS
Figure 1. Flow chart describing the MSCT and QCA findings in 62 patients with respectively abnormal and normal MPI results. Note the discrepancy between the imaging modalities in patients with normal MPI. In the majority of these patients MSCT was abnormal, despite normal perfusion and only minimal luminal narrowing on QCA. Abbreviations: MPI: myocardial perfusion imaging, MSCT: multi-slice computed tomography, QCA: quantitative coro-nary angiography.
Table 3. Angiographic characteristics (MSCT and QCA) for vascular territories with respectively abnormal and normal perfusion.
MPI abnormal (n=34) MPI normal (n=150) P –valueMSCT Normal 0 41 (27%) Abnormal 34 (100%) 109 (73%) P=NS Borderline stenosis 18 (53%) 105 (96%) Severe stenosis 16 (47%) 4 (4%) P<0.01QCA 70.6% ± 24.5% 22.1% ± 18.7% P<0.01

260 Chapter 17
Correlation of MPI with MSCT, invasive angiography and IVUS (Figure 2)
In 45 of 62 (73%) of patients, additional vascular imaging with IVUS was performed in a total of 94
coronary arteries. In the remaining 17 patients, IVUS imaging was not possible due to the presence
of left main stenosis, severe stenosis or occlusion (n=10) and technical problems or time constraints
during conventional coronary angiography (n=7).
Patientbasis
In total, MPI was abnormal in 14 of 45 (31%) of patients in whom IVUS imaging was obtained. In all
patients, MSCT was abnormal as well with severe stenosis in 3 (21%). Average percentage of luminal
narrowing as determined by QCA was relatively low in these patients (58.6 ± 24.3%), possibly due
to the exclusion of patients with severe stenosis in whom IVUS imaging could not be performed.
Nonetheless, average MLA was 3.5 ± 1.3 mm2 with an average plaque area and plaque burden of
respectively 9.9 ±5.2 mm2 and 71.7% ± 10.6%, confirming the presence of potentially flow-limiting
stenoses. At these lesions, the impact of plaque accumulation on lumen compromise was on average
1.7 ± 2.3. Moreover, 12 (86%) lesions were associated with constrictive remodelling.
Normal perfusion was observed in the remaining 31 (69%) of the 45 patients that underwent
additional IVUS imaging. In these patients, MSCT revealed atherosclerosis in 27 (87%), all classified as
having borderline stenosis.
Figure 2. Flowchart describing the observations in 45 patients in whom additional IVUS imaging was performed. In almost all patients with normal MPI, the presence of atherosclerosis was observed on MSCT with negligible luminal narrowing identified on QCA. IVUS imaging confirmed the presence of substantial atherosclerosis (plaque burden 57.9%), yet without luminal compromise (MLA 5.9 mm2). Abbreviations: IVUS: intravascular ultrasound, MLA: minimal lumen area, MPI: myocardial perfusion imaging, MSCT: multi-slice computed tomography, QCA: quantitative coronary angiography.
31 (69%) normal
27 (87%) abnormal(0, 0% severe lesion)
(27, 100% borderline lesion)
25.2 ± 14.3%
MPI
MSCT
QCA
Luminal measurements
MLA 5.9 ± 3.4 mm2
Vessel wall measurements
Plaque area 8.3 ± 3.5 mm2
Plaque burden 57.9 ± 18.2%
Remodeling
Positive remodeling 48%
IVUS
14 (31%) abnormal
14 (100%) abnormal(3, 21% severe lesion)
(11, 79%, borderline lesion)
58.6 ± 24.3%
Luminal measurements
MLA 3.5 ± 1.3 mm2
Vessel wall measurements
Plaque area 9.9 ± 5.2 mm2
Plaque burden 71.7 ± 10.6%
Remodeling
Positive remodeling 14%
45 patients
P<0.05
P<0.05
P<0.05
P=NS
P=NS
P=NS

261Evaluation of Coronary Artery Disease: Implications of Invasive versus Non-Invasive Imaging
Considering only the most severe percentage stenosis per patient, an average of only 25.2% ± 14.3%
luminal narrowing was observed on QCA, indicating minimal stenosis on angiography. In line with
these observations, preservation of the lumen was observed on IVUS with an average MLA of 5.9 ±
3.4 mm2, significantly higher as compared to patients with abnormal MPI (P<0.01). Nonetheless,
considerable atherosclerosis was identified on IVUS with an average plaque area of 8.3 ± 3.5 mm2, not
significantly different as compared to patients with perfusion abnormalities (P=0.29). Also substantial
plaque burden was observed, with an average of 57.9% ± 18.2% (P<0.05 as compared to abnormal
MPI). The impact of plaque accumulation on lumen compromise was considerably less as compared to
patients with abnormal MPI ( -0.21 ± 5.8 versus 1.7 ± 2.3, P=0.24). In line with this observation, positive
remodeling was identified in approximately half (15, 48%) of patients with normal MPI, as compared to
14% in patients with abnormal MPI (P=0.03). Details are specified in Table 4.
In Figure 3, an example of a patient with discrepant MPI and MSCT observations is provided.
Vesselbasis
In total, 14 (15%) of 94 coronary arteries were associated with abnormal perfusion in the
corresponding vascular territory during MPI. In all coronary arteries with abnormal perfusion,
atherosclerosis was identified on MSCT, with severe stenosis on MSCT in 3 (21%) coronary arteries
and an average degree of stenosis of 57.1% ± 26.1% on QCA. In the remaining 80 (85%) coronary
arteries without perfusion abnormalities, atherosclerosis was absent on MSCT in 15 (19%). The
average degree of stenosis on QCA was 21.4% ± 13.8%. Further details of the IVUS measurements on
a vessel basis are provided in Table 5.
Finally, as shown in Figure 4, significant differences in IVUS measurements were observed when
comparing patients with and without atherosclerosis on MSCT.
Table 4. IVUS characteristics of the most severe lesion in patients with respectively abnormal and normal perfusion on MPI.
Abnormal perfusion (n=14)
Normal perfusion (n=32)
P-value
Reference section EEM area (mm2) 15.0 ± 6.1 15.6 ± 4.0 0.21 Lumen area (mm2) 8.9 ± 3.6 10.2 ±3.2 0.24Lesion section EEM area (mm2) 13.4 ± 5.8 14.2 ± 4.4 0.62 MLA (mm2) 3.5 ± 1.3 5.9 ± 3.4 <0.01 Plaque area (mm2) 9.9 ± 5.2 8.3 ±3.5 0.29 Lesion plaque burden (%) 71.7 ± 10.6 57.9 ± 18.2 <0.01 Lumen area stenosis (%) 60.4 ± 17.6 42.6 ± 22.9 0.01 Lumen diameter stenosis (%) 39.0 ± 16.3 25.8 ± 15.5 0.01 Corrected lumen area stenosis (%) 74.8 ± 10.3 60.9 ±20.9 <0.01Remodeling Impact plaque on lumen index 1.7 ± 2.3 -0.2 ± 5.8 0.24 Positive remodeling (n, %) 2 (14%) 15 (48%) 0.03
Abbreviations: EEM: external elastic membrane, MLA: minimal lumen area.

262 Chapter 17
Discussion
The main observations of the present study can be summarized as follows.
Comparison of MSCT to SPECT showed that abnormal perfusion was in all cases associated with
an abnormal MSCT. In these patients, significant CAD was also observed during invasive imaging,
as reflected by an average percentage stenosis of 78% on conventional angiography as well as an
average MLA of less than 4.0 mm2 on IVUS.
However, in many patients with normal perfusion on SPECT, discrepant findings were obtained.
Frequently, MSCT showed extensive atherosclerosis, whereas only minor stenosis (average 26.0%)
was observed on conventional coronary angiography/QCA. Nonetheless, IVUS revealed considerable
plaque burden (57.9%). Importantly, the observed atherosclerosis involved the arterial wall rather
than leading to luminal compromise, as reflected by a preserved MLA of 5.9 mm2 on average.
Figure 3. A 60-year old male presented to the outpatient clinic with dyspnea and an elevated risk profile for coronary artery disease, including hypertension, hypercholesterolemia and smoking. Contrast enhanced MSCT coronary angiography revealed considerable atherosclerosis in the left anterior descending coronary artery (Panel A). Panels B and C are cross-sectional images of the areas indicated by the arrows in Panel A. In contrast, myocardial perfusion imaging (Panel D), which was performed during exercise stress (first and third panel) and rest (second and fourth panel), showed normal perfusion. However, also during intravascular ultrasound imag-ing (Panels E and F), considerable plaque burden was demonstrated, yet with preservation the coronary lumen.
Hemodynamically relevant stenoses
Abnormal perfusion on SPECT was in all cases associated with an abnormal MSCT. In line with
these observations, lesions that were flow-limiting as determined by MPI were also associated with
significant focal luminal narrowing on invasive imaging. On QCA, an average percentage diameter
stenosis of 78% was obtained. Also, in the subset of patients undergoing IVUS imaging, an average

263Evaluation of Coronary Artery Disease: Implications of Invasive versus Non-Invasive Imaging
MLA of 3.5 mm2 was identified, in line with previous investigations. Nishioka and colleagues
compared IVUS measurements in 70 coronary lesions to gated SPECT 9 and observed an average
MLA of 3.3 mm2 in lesions with a positive SPECT study. Similar findings have been obtained in other
studies employing fractional flow reserve 12;13 indicating a clear convergence of findings between the
different imaging modalities in the presence of hemodynamically relevant stenoses.
Atherosclerosis in the presence of normal perfusion
In 39 patients, a normal MPI study was obtained. In these patients, only mild luminal narrowing (26.0%)
was observed during conventional coronary angiography. Contradictory findings were obtained with
MSCT, since only 7 (18%) patients were classified as having normal coronary arteries. Similarly, on a vessel
basis only 41 of 150 (27%) of coronary arteries were normal on MSCT. In line with the observations of
conventional coronary angiography/QCA, average lumen diameter stenosis on IVUS was only 25.8% and
19.5% on a patient and vessel basis respectively. However, considerable plaque burden was detected with
an average of 58% in patients with abnormal MSCT. Importantly, this observed atherosclerosis involved
the arterial wall rather than leading to luminal compromise, as reflected by an average MLA of 5.9 mm2.
A discrepancy in imaging findings has been described previously in studies comparing MPI to
coronary calcium scoring. In a large cohort of 1195 patients without history of CAD, extensive
atherosclerosis as reflected by a calcium score >400 was observed in 31% of patients with normal
MPI studies 14. Moreover, the presence of substantial disease has been described in angiographically
normal segments previously; Mintz et al showed in a large consecutive series of patients that
atherosclerosis is commonly present in angiographic reference segments and only 6.8% of studied
segments were classified as entirely normal by both QCA and IVUS imaging 15.
Table 5. IVUS characteristics in coronary arteries with respectively abnormal and normal perfusion in the corresponding vascular territory.
Abnormal perfusion (n=14)
Normal perfusion (n=80)
P-value
Reference section EEM area (mm2) 15.9 ± 6.1 15.1 ± 5.2 0.62 Lumen area (mm2) 9.0 ± 3.9 9.9 ± 3.7 0.39Lesion section EEM area (mm2) 14.3 ± 5.8 14.2 ± 5.2 0.93 MLA (mm2) 3.6 ± 1.6 6.7 ± 3.7 <0.01 Plaque area (mm2) 10.7 ± 5.0 7.5 ± 3.7 <0.01 Lesion plaque burden (%) 73.2 ± 9.3 51.9 ± 17.3 <0.01 Lumen area stenosis (%) 59.1 ± 20.1 33.3 ± 21.2 <0.01 Lumen diameter stenosis (%) 38.3 ± 17.6 19.5 ± 13.7 <0.01 Corrected lumen area stenosis (%) 75.6 ± 10.2 54.5 ± 19.0 <0.01Remodeling Impact plaque on lumen index 1.5 ± 2.3 0.34 ± 5.7 0.20 Positive remodeling 4 (29%) 34 (43%) 0.36
Abbreviations: EEM: external elastic membrane, MLA: minimal lumen area.

264 Chapter 17
Accordingly, the noted discrepancies in fact reflect that the techniques provide information
on different aspects of CAD. Conventional coronary angiography and MPI detect anatomically
significant and hemodynamically relevant stenoses respectively. In contrast, the techniques remain
limited in depicting the distribution and extent of diffuse, non-obstructive atherosclerosis, a process
which primarily involves the arterial wall.
Figure 4. Differences in IVUS measurements between coronary arteries with CAD and without CAD as deter-mined on MSCT. Panel A: MLA (mm2) and corrected lumen area stenosis (%). Panel B: plaque area (mm2) and plaque burden (%). All measurements were significantly different between coronary arteries with and without CAD identified on MSCT.Abbreviations: CAD: coronary artery disease, IVUS: intravascular ultrasound, MLA: minimal lumen area, MSCT: multi-slice computed tomography.
Are
a (m
m2 )
CAD on MSCTNo CAD on MSCT
A. Luminal measurements
P<0.001 P<0.001
5.6
9.6
0
2
4
6
8
10
12
14
16
MLA
62.5
32.3
20
40
60
80
Corrected lumen area stenosis
Per
cen
tag
e (%
)
Are
a (m
m2 )
CAD on MSCTNo CAD on MSCT
B. Vessel wall measurements
P<0.01 P<0.01
8.6
4.4
0
2
4
6
8
10
Plaque Area
59.3
31.3
0
10
20
30
40
50
60
70
Plaque Burden
Per
cen
tag
e %

265Evaluation of Coronary Artery Disease: Implications of Invasive versus Non-Invasive Imaging
Clinical implications
Traditionally, non-invasive detection of CAD is based on demonstration of ischemia 16. However, with
the introduction of new non-invasive imaging techniques such as MSCT, clinicians started to appre-
ciate better the different stages of CAD, ranging from early coronary atherosclerosis to obstructive
stenoses. Indeed in the current study, we identified patients with perfusion defects on MPI, indicat-
ing hemodynamically obstructive stenoses, representing advanced CAD; these patients revealed sig-
nificant stenoses on invasive angiography with QCA, and IVUS further strengthened these findings by
demonstration of obstructive CAD.
On the other end of the spectrum, patients with (pre-clinical) atherosclerosis were identified. These
patients presented with normal perfusion on MPI, with (nearly) normal invasive angiography/QCA.
Many of these patients however had extensive atherosclerosis on MSCT; this was further supported by
the IVUS findings indicating absence of obstructive stenoses, but confirming extensive atherosclerosis,
mainly located in the vessel wall.
The main clinical implication of the current study is thus that integrated use of the non-invasive im-
aging techniques (MPI and MSCT) may permit optimal characterization of atherosclerotic lesions and
differentiate early atherosclerosis without hemodynamic consequences from atherosclerotic lesions
that result in ischemia. Whether this advanced characterization of atherosclerotic lesions will result in
superior prognostification of patients, remains to de determined.
Study limitations
In the present study, MSCT examinations were visually assessed, as no validated quantification
algorithms are currently available for MSCT. Also, IVUS imaging was not performed in all vessels in
every patient. In addition, MSCT has several disadvantages in general including the high radiation
burden and the need for a low and stable heart rate during data acquisition.
Conclusion
The current findings demonstrate a good agreement between non-invasive imaging techniques (MPI,
MSCT) and invasive techniques (angiography, QCA and IVUS) in patients with advanced CAD. These pa-
tients exhibited abnormal perfusion on MPI, atherosclerosis on MSCT, and obstructive stenoses on angi-
ography/QCA and IVUS.
In patients with early atherosclerosis, discrepant findings were noted. Perfusion on MPI was normal, but
MSCT demonstrated atherosclerosis. Although invasive angiography/QCA did not reveal significant coro-
nary lesions, IVUS demonstrated considerable atherosclerosis, which was however mainly located in the
vessel wall and associated with positive remodeling, rather than resulting in luminal obstruction.
The current observations further support the integrated use of MPI and MSCT to better characterize
atherosclerotic lesions.
Accordingly, the current findings underline the complementary nature of MSCT and MPI.
266 Chapter 17
References1. Hacker M, Jakobs T, Hack N, Nikolaou K, Becker C, von Ziegler F, Knez A, Konig A, Klauss V, Reiser M, Hahn K,
Tiling R. Sixty-four slice spiral CT angiography does not predict the functional relevance of coronary artery stenoses in patients with stable angina. Eur J Nucl Med Mol Imaging. 2007;34:4-10.
2. Schuijf JD, Wijns W, Jukema JW, Atsma DE, de Roos A, Lamb HJ, Stokkel MP, Dibbets-Schneider P, Decra-mer I, de Bondt P, van der Wall EE, Vanhoenacker PK, Bax JJ. Relationship between noninvasive coronary angiography with multi-slice computed tomography and myocardial perfusion imaging. J Am Coll Cardiol. 2006;48:2508-2514.
3. Schuijf JD, Pundziute G, Jukema JW, Lamb HJ, van der Hoeven BL, de Roos A, van der Wall EE, Bax JJ. Diag-nostic accuracy of 64-slice multislice computed tomography in the noninvasive evaluation of significant coronary artery disease. Am J Cardiol. 2006;98:145-148.
4. Bavelaar-Croon CD, America YG, Atsma DE, Dibbets-Schneider P, Zwinderman AH, Stokkel MP, Pauwels EK, van der Wall EE. Comparison of left ventricular function at rest and post-stress in patients with myocardial infarction: Evaluation with gated SPECT. J Nucl Cardiol. 2001;8:10-18.
5. Cerqueira MD, Weissman NJ, Dilsizian V, Jacobs AK, Kaul S, Laskey WK, Pennell DJ, Rumberger JA, Ryan T, Verani MS. Standardized myocardial segmentation and nomenclature for tomographic imaging of the heart: a statement for healthcare professionals from the Cardiac Imaging Committee of the Council on Clinical Cardiology of the American Heart Association. Circulation. 2002;105:539-542.
6. Hachamovitch R, Hayes SW, Friedman JD, Cohen I, Berman DS. Stress myocardial perfusion single-photon emission computed tomography is clinically effective and cost effective in risk stratification of patients with a high likelihood of coronary artery disease (CAD) but no known CAD. J Am Coll Cardiol. 2004;43:200-208.
7. Smanio PE, Watson DD, Segalla DL, Vinson EL, Smith WH, Beller GA. Value of gating of technetium-99m sestamibi single-photon emission computed tomographic imaging. J Am Coll Cardiol. 1997;30:1687-1692.
8. Austen WG, Edwards JE, Frye RL, Gensini GG, Gott VL, Griffith LS, McGoon DC, Murphy ML, Roe BB. A report-ing system on patients evaluated for coronary artery disease. Report of the Ad Hoc Committee for Grading of Coronary Artery Disease, Council on Cardiovascular Surgery, American Heart Association. Circulation. 1975;51:5-40.
9. Nishioka T, Amanullah AM, Luo H, Berglund H, Kim CJ, Nagai T, Hakamata N, Katsushika S, Uehata A, Takase B, Isojima K, Berman DS, Siegel RJ. Clinical validation of intravascular ultrasound imaging for assessment of coronary stenosis severity: comparison with stress myocardial perfusion imaging. J Am Coll Cardiol. 1999;33:1870-1878.
10. Rodes-Cabau J, Candell-Riera J, Angel J, de Leon G, Pereztol O, Castell-Conesa J, Soto A, Anivarro I, Aguade S, Vazquez M, Domingo E, Tardif JC, Soler-Soler J. Relation of myocardial perfusion defects and nonsignifi-cant coronary lesions by angiography with insights from intravascular ultrasound and coronary pressure measurements. Am J Cardiol. 2005;96:1621-1626.
11. Kornowski R, Mintz GS, Lansky AJ, Hong MK, Kent KM, Pichard AD, Satler LF, Popma JJ, Bucher TA, Leon MB. Paradoxic decreases in atherosclerotic plaque mass in insulin-treated diabetic patients. Am J Cardiol. 1998;81:1298-1304.
12. Briguori C, Anzuini A, Airoldi F, Gimelli G, Nishida T, Adamian M, Corvaja N, Di Mario C, Colombo A. Intravas-cular ultrasound criteria for the assessment of the functional significance of intermediate coronary artery stenoses and comparison with fractional flow reserve. Am J Cardiol. 2001;87:136-141.
13. Abizaid AS, Mintz GS, Mehran R, Abizaid A, Lansky AJ, Pichard AD, Satler LF, Wu H, Pappas C, Kent KM, Leon MB. Long-term follow-up after percutaneous transluminal coronary angioplasty was not performed based on intravascular ultrasound findings: importance of lumen dimensions. Circulation. 1999;100:256-261.
14. Berman DS, Wong ND, Gransar H, Miranda-Peats R, Dahlbeck J, Hayes SW, Friedman JD, Kang X, Polk D, Hachamovitch R, Shaw L, Rozanski A. Relationship between stress-induced myocardial ischemia and ath-erosclerosis measured by coronary calcium tomography. J Am Coll Cardiol. 2004;44:923-930.
15. Mintz GS, Painter JA, Pichard AD, Kent KM, Satler LF, Popma JJ, Chuang YC, Bucher TA, Sokolowicz LE, Leon MB. Atherosclerosis in angiographically “normal” coronary artery reference segments: an intravascular ul-trasound study with clinical correlations. J Am Coll Cardiol. 1995;25:1479-1485.
16. Underwood SR, Anagnostopoulos C, Cerqueira M, Ell PJ, Flint EJ, Harbinson M, Kelion AD, Al Mohammad A, Prvulovich EM, Shaw LJ, Tweddel AC. Myocardial perfusion scintigraphy: the evidence. Eur J Nucl Med Mol Imaging. 2004;31:261-291.


Coronary Plaque Imaging
and Prognostification
Part IV


Differences in Plaque Composition and
Distribution in Stable Coronary Artery Disease
versus Acute Coronary Syndromes;
Non-Invasive Evaluation with Multi-Slice
Computed Tomography
Acute Cardiac Care 2007; 9: 48-53
Joanne D. Schuijf, Torsten Beck, Christof Burgstahler, J. Wouter Jukema, Martijn S. Dirksen, Albert de Roos, Ernst E. van der Wall, Stephen Schroeder,
William Wijns, Jeroen J. Bax
18Chapter

272 Chapter 18
Abstract
Background
Plaque composition rather than degree of luminal narrowing may be predictive of acute
coronary syndromes (ACS). The purpose of the study was to compare plaque composition
and distribution with multi-slice computed tomography (MSCT) between patients presenting
with either stable coronary artery disease (CAD) or ACS.
Methods
MSCT was performed in 22 and 24 patients presenting with ACS or stable CAD, respectively.
Coronary lesions were classified as calcified, non-calcified or mixed while signal intensity (SI)
was measured.
Results
In patients with stable CAD, the majority of lesions were calcified (89%). In patients with ACS,
less calcifications were observed with a greater proportion of non-calcified (18%) or mixed
(36%) lesions (P<0.001). Accordingly, mean SI of plaques was significantly less in ACS (320
± 201 HU versus 620 ± 256 HU in stable CAD, P<0.001). Dividing lesions in the ACS group
according to culprit versus non-culprit vessel location resulted in no significant difference in
average SI between these 2 groups while still lower as compared to stable CAD (P<0.001).
Conclusions
In patients with ACS, significantly less calcifications were present as compared to stable
CAD. Moreover, even in non-culprit vessels, multiple non-calcified plaques were detected,
indicating diffuse rather than focal atherosclerosis in ACS.

273Differences in Plaque Composition between Stable CAD and ACS
Introduction
Non-ST-elevation acute coronary syndromes (ACS) are recognized as among the most frequent and
important manifestations of coronary artery disease (CAD) and contribute to a considerable per-
centage of both morbidity and mortality. In addition, the occurrence of an ACS is associated with an
elevated risk of further coronary incidents within the subsequent year 1.
It is widely acknowledged that local thrombus formation due to plaque rupture or erosion plays a
pivotal role in the pathogenesis of ACS. Consequently, plaque composition rather than the degree
of luminal narrowing may be predictive of the patient’s risk for further coronary events. Extensively
calcified lesions most likely represent atherosclerosis at later stages of remodeling and may reflect
more stable lesions 2. On the other hand, earlier stages of atherosclerosis that lack the presence of
calcium deposits may be more prone to rupture with subsequent occurrence of acute events. Recent
studies indicate a higher degree of inflammation in patients presenting with unstable clinical con-
ditions, resulting in diffuse destabilization of atherosclerotic plaques in the entire coronary tree 3;4.
Indeed, multiple sites of rupture-vulnerable plaque may be present rather than one site of complex
plaque or thrombus, explaining the increased incidence of recurrent ACS, repeat intervention and
coronary bypass grafting in the subsequent year 5.
During the past few years, MSCT has emerged as a new modality to evaluate the presence of signifi-
cant CAD through direct visualization of the coronary arteries. Besides the assessment of coronary
artery stenoses, the technique allows visualization of atherosclerotic plaques. As a result, the tech-
nique may potentially be used to assess plaque composition. Indeed, few recent studies have dem-
onstrated the feasibility of differentiation between calcified, non-calcified or mixed plaques based
on differences in signal intensity (SI) 6. Since the availability of non-invasive coronary angiography
with MSCT is continuously expanding, the technique will increasingly be used to identify patients
at either low- or high- risk for developing coronary events. Accordingly, its potential to differentiate
between various patterns of atherosclerotic lesions needs to be explored. Eventually, this may prove
to provide additional information useful for refinement of risk stratification and may allow early insti-
tution of appropriate therapy to prevent further events.
The purpose of the present study was to compare plaque composition and distribution between
patients presenting with either stable CAD or non-ST-elevation ACS.
Methods
Study populations
The study group consisted of 22 patients presenting with ACS and 24 age- and gender matched pa-
tients with known, stable CAD; all underwent MSCT and invasive coronary angiography. Referral for
coronary angiography was based on the presence of symptoms, abnormal or inconclusive previous
exercise ECG and/or nuclear testing. Only patients in sinus rhythm without contraindications to MSCT

274 Chapter 18
were included. Exclusion criteria were: (supra-) ventricular arrhythmia, renal insufficiency (serum cre-
atinine >120 mmol/L), known allergy to iodine contrast media, severe claustrophobia and pregnancy.
All patients gave written informed consent to the study protocol, which was approved by the local
ethics committees.
MSCT data acquisition
Data acquisition was performed at 2 centers (the Eberhard-Karls-University, Tübingen, Germany and
the Leiden University Medical Center, Leiden, the Netherlands). 16-slice MSCT was performed using
either a Sensation Siemens (Siemens, Germany) or Toshiba Aquilion (Toshiba Medical Systems, Japan)
scanner. In all patients, imaging was performed during electrocardiographic gating and the adminis-
tration of a bolus of non-ionic contrast agent with a flow rate of 4 ml/s, as previously described 7-9.
Data evaluation
Data were evaluated on a remote workstation using dedicated software (Vitrea, Vital Images, USA).
For each patient, the entire coronary arterial tree was inspected for the presence of coronary plaques
(regardless of their severity). For this purpose, knowledge from invasive coronary angiography was
used in order to ensure most optimal lesion detection. Lesions identified on the MSCT were recorded
and classified as being interpretable or not. Interpretable lesions were subsequently visually classified
as calcified, non-calcified or mixed plaques. Examples of each type of lesion are provided in Figure 1.
Figure 1. Example of the different lesion types as visually assigned on the MSCT images. Panel A: non-calcified lesion; Panel B: mixed plaque; Panel C: dense calcified lesion.
In each plaque, SI was measured in 3 regions of interest of each 2-3 mm2, placed in subsequent axial
slices. Subsequently, the average SI was calculated. The location of each lesion was documented
according to the American Heart Association-American College of Cardiology segmentation 10.
Lesions observed in segments 1, 2, 5, 6 and 11 (proximal and mid right coronary artery, left main,
proximal left anterior descending coronary artery and proximal left circumflex coronary artery) were
considered to be located proximally in the coronary arteries. In patients presenting with ACS, further
distinction was made between lesions located in the culprit coronary artery versus elsewhere.
Culprit vessels were identified using electrocardiographic findings, left ventricular wall motion
abnormalities, angiographic lesion morphology, as previously described 11;12.

275Differences in Plaque Composition between Stable CAD and ACS
Statistical analysis
Continuous variables were described by their means and standard deviations. Comparisons between
patient groups were performed using 1-way ANOVA for continuous variables and the 2 test with
Yates’ correction for categorical variables. Nonparametric Mann-Whitney and Kruskall-Wallis tests
were used to compare the means of the plaque SI between the different groups. All statistical
analyses were performed using SPSS software (version 12.0, SPSS Inc, Chicago, Il, USA). A P-value
<0.05 was considered to indicate statistical significance.
Results
Patient characteristics
The baseline characteristics of the patients are summarized in Table 1. No significant differences
in risk factors were present between the 2 groups. By invasive angiography, the average number
of coronary arteries with a ≥50% stenosis was 1.5 ± 1.4 and 2.1 ± 1.0 in patients with respectively
stable CAD and ACS, and was not significantly different between the 2 groups. By MSCT, the average
number of vessels with any evidence of atherosclerotic lesions (including coronary arteries with
both ≥50% as well as coronary arteries with only lesions <50% diameter narrowing) however, was
Table 1. Baseline characteristics of the study population.
Stable CAD ACSNr. patients 24 22Gender (M/F) 22/2 21/1Age (yrs) 62 ± 11 61 ± 12Risk factors for CAD Average Body Mass Index (kg/m2) 29 ± 4 26 ± 3 Diabetes mellitus type 2 11 (46%) 10 (46%) Hypertension 20 (83%) 15 (68%) Hypercholesterolemia 20 (83%) 19 (86%) Family history of CAD 7 (29%) 12 (56%) Current smoking 12 (50%) 13 (59%)History Previous PCI/CABG 6/2 6/6 Previous MI 6 13Significant CAD as observed on CAG No significant CAD 9 (38%) 2 (9%) Single vessel CAD 3 (13%) 5 (23%) Multiple vessel CAD 12 (50%) 12 (55%)Average nr. of coronary arteries with significant stenoses 1.5 ± 1.4 2.1 ± 1.0Average nr. of coronary arteries with any atherosclerotic plaques 2.0 ± 1.0 2.6 ± 0.7
Abbreviations: ACS: acute coronary syndrome; CABG: coronary artery bypass grafting; CAD: coronary artery disease; CAG: conventional coronary angiography; PCI: percutaneous intervention; MI: myocardial infarction.

276 Chapter 18
significantly higher in the ACS patients (2.6 ± 0.7 as compared to 2.0 ± 1.1, P<0.05). In patients with
ACS, 57 diseased coronary arteries were identified, with a total of 106 diseased segments. In patients
with stable CAD, atherosclerotic lesions were present in 101 segments (in 48 coronary arteries).
Spatial distribution of calcified, mixed or non-calcified lesions
In total, 207 segments with a total 258 coronary lesions were identified, of which 228 (88%) lesions
(in 175 evaluable segments) were of sufficient image quality to assign plaque type and measure
average SI.
In patients with ACS, 73 (58%) of 125 lesions were located proximally as compared to a slightly lower
percentage (72 of 133 lesions, 54%) in patients with stable CAD (P=NS). The majority of non-calcified
and mixed lesions (81% and 62%, respectively) tended to be located in the proximal part of the
coronary arteries. Calcified lesions were more equally distributed between the proximal and more
distal parts of the coronary arteries with 56% of calcifications located proximally (P<0.05).
Distribution of plaque types between ACS and stable CAD patients
In patients presenting with stable CAD, 128 of 133 (96%) identified lesions were interpretable. The
majority of observed lesions, 114 (88%), were calcified, whereas only 3 (2%) and 11 (9%) lesions
were either completely non-calcified or mixed, respectively. On the contrary, a larger part of
demonstrated lesions were non-calcified or mixed in patients with ACS. A total of 100 (80%) lesions
were interpretable, of which 18 (18%) and 36 (36%) were respectively non-calcified or mixed. Forty-
six percent of plaques were calcified (P<0.001). Results are summarized in Table 2 and Figure 2.
As a result of the relatively lower number of calcifications, mean SI of the observed plaques was
significantly lower in the ACS patients as compared to the stable CAD patients (320 ± 201 HU versus
620 ± 256 HU, P<0.001).
Culprit vessels versus non-culprit vessels
In the patients with ACS, we compared culprit with non-culprit vessels. In the 22 culprit vessels, a total
of 50 plaques were present, of which 42 could be identified and evaluated with MSCT. The relative
distribution of non-calcified, mixed and calcified lesions, as shown in Table 3, were respectively 9
Table 2. Distribution of plaque types, as visually assessed using MSCT, between patients with stable and unstable angina pectoris.
Plaque type Stable CAD ACS patientsNon-calcified 3 (2%) 18 (18%)Mixed 11 (9%) 36 (36%)Calcified 114 (89%) 46 (46%)Total 128 100
Abbreviations: ACS: acute coronary syndrome; CAD: coronary artery disease.

277Differences in Plaque Composition between Stable CAD and ACS
(21%), 19 (45%) and 14 (33%). In the 35 remaining, non-culprit vessels with atherosclerotic lesions,
75 plaques were present, of which 58 could be evaluated with MSCT. In these vessels, relatively more
calcified lesions were observed, 32 (55%, P=NS). In the remaining lesions, calcium was absent in 9
(16%), whereas a mixture was observed in 17 (29%) plaques.
Although mean signal intensity was higher in plaques located in non-culprit vessels (346 ±196 HU)
as compared the average value observed in culprit vessels (284 ± 205 HU), no statistical difference
was reached (P=NS). Still, as depicted in Figure 3, SI of both culprit and non-culprit vessels in the ACS
patients were significantly lower as compared to the SI of plaques in coronary vessels of the patients
with stable CAD.
Figure 3. Box plot of average signal intensities of lesions in culprit vessels, non-culprit vessels of acute coro-nary syndrome (ACS) patients and signal intensities of lesions in stable coronary artery disease (CAD) patients. The box extends from the 25th percentile to the 75th percentile, with a line at the median (the 50th percentile). The whiskers extend above and below the box to show the highest and lowest values. No significant differ-ence was observed between the average lesion signal intensity in culprit and non-culprit vessel of ACS patients whereas a significantly higher average signal intensity was observed in patients with stable CAD.
0%
20%
40%
60%
80%
100%
SAP ACS
Calcified
Mixed
Non-calcified
Figure 2. Bar graph demonstrating the relative distribution of the different lesion types in patients with ACS and stable CAD (P<0.001). Abbreviations: ACS: acute coronary syndrome; CAD: coronary artery disease.
Culprit vessels in
ACS patients
-200
0
200
400
600
800
1000
1200
1400
1600
Ave
rage
sig
nal I
nten
sity
(H
U)
Non-culpritvessels in
ACS patients
P<0.001
P=NS
-200
0
200
400
600
800
1000
1200
1400
1600
Stable CAD
patients
P<0.001
P=NS

278 Chapter 18
Discussion
Comparison of contrast-enhanced MSCT coronary angiograms of patients with stable CAD and
ACS revealed the following findings. Firstly, non-calcified plaques tended to cluster in the proximal
portion of the coronary arteries, whereas calcified lesions were more equally distributed. The second
observation was that in patients presenting with ACS, a significantly lower percentage of observed
lesions were completely calcified as compared to lesions in the patients with stable CAD. Accordingly,
average plaque SI was significantly lower in the ACS patients as compared the patients with stable
CAD. Finally, even in non-culprit vessels, multiple non-calcified lesions were noted. Accordingly,
average lesion SI was lower in both culprit and non-culprit vessels in ACS patients as compared to
lesions in stable CAD patients.
The spatial distribution of non-calcificied lesions
In the present study, the majority of non-calcified lesions were located in the proximal regions of the
coronary arteries. Although this finding may have been influenced by the possibility that smaller non-
calcified plaques located more distally are more difficult to detect, previous studies underline the
current observation. Wang et al recently studied the spatial distribution of acute myocardial infarction
occlusions in 208 patients and observed that the majority of acute coronary occlusions, caused by
unstable plaque erosions or ruptures, were located in the proximal third of the coronary artery tree 13.
The incidence of calcified lesions
A relative lack of calcified lesions in patients with ACS has been reported previously with most
observations based on angiographic or intravascular ultrasound (IVUS) findings 14-17. In a recent
study by Beckman et al. the extent of coronary calcifications was measured by the angle of its arc in
43 and 18 patients with respectively unstable angina and myocardial infarction, while 17 patients
with stable CAD served as a control group 15. The authors observed a significant decrease in the
average calcium arc from 32 ±7° in the stable CAD patients to an average of 15±4° in the patients
with unstable angina.In other angiographic studies, similar results have been reported 14;16;17.
Although the presence and extent of coronary calcifications can be evaluated with MSCT, data
obtained with MSCT are currently still scarce. In a recent study, plaque morphology and composition
Table 3. Distribution of plaque types between culprit and non-culprit lesions of ACS patients as compared to plaques in stable CAD patients.
Plaque type Culprit vessels Non-culprit vessels Vessels in stable CAD Non-calcified 9 (21%) 9 (16%) 3 (2%)Mixed 19 (45%) 17 (29%) 11 (9%)Calcified 14 (33%) 32 (55%) 114 (89%)Total 42 58 128
Abbreviations: ACS: acute coronary syndrome; CAD: coronary artery disease.

279Differences in Plaque Composition between Stable CAD and ACS
was evaluated using MSCT in 37 patients presenting with either ACS or stable CAD. In line without our
observations, the authors found relatively more non-calcified plaques in culprit lesions in patients
with ACS as compared to patients with stable CAD (100% versus 77%) 18. In contrast, the prevalence
of calcified plaques in culprit lesions in ACS patients was considerably lower (71% versus 85%).
These findings underline the notion that the presence of coronary calcium more likely represents
a feature of advanced obstructive CAD rather than the typical substrate for acute coronary events.
Accordingly, identification of patients at risk based on merely coronary calcium scoring, as has been
proposed, may be insufficient in the setting of ACS.
The incidence of non-calcified lesions in culprit and non-culprit vessels
Another finding of the current study was that the non-calcified and mixed plaques were equally
distributed among culprit and non-culprit vessels of ACS patients, resulting in an average SI of
lesions located in non-culprit vessels that was still significantly lower than that of lesions in stable
CAD patients. Although the number of significantly stenosed vessels was comparable between
populations, lesions tended to be more diffuse in patients with ACS, reflected by a significantly
higher average number of diseased coronary arteries per patient.
A surge of coronary events has been observed in ACS patients in the months following their initial
presentation 5. Even within a year, a large portion of patients will present with recurrent ACS or
infarction and may require intervention 5. Not only worsening of the originally treated culprit lesions
may be the cause of recurrent complaints in these patients but also worsening of lesions that were
initially deemed insignificant. Indeed, evidence is accumulating that multiple sites of rupture-
vulnerable plaque are present in patients presenting with ACS rather than one site of complex plaque
or thrombus 5. Plaque instability may result from generalized inflammation that affects the entire
coronary tree rather than a single site, a finding that is underlined by the elevated inflammation
markers circulating in patients presenting with unstable symptoms. Thus, although one single lesion
may be clinically active at the time of ACS, multiple, potentially unstable, lesions may be present
throughout the entire coronary tree.
(Non-invasive) imaging
Accordingly, conventional coronary angiography may be suboptimal in patients presenting with
ACS, particularly with regard to prognosis. Invasive angiography may identify only the most severe
lesions rather than assessing the presence of widespread but non-significant lesions and as a
consequence overall plaque burden may be underestimated. Although the additional use of IVUS
during coronary angiography may be extremely useful for depicting the coronary artery wall, it is
an invasive technique with inherent limitations. MSCT on the other hand, has the advantage that it
permits direct and non-invasive visualization of coronary artery lumen with corresponding plaques.
Accordingly, MSCT may allow identification of patients at risk for ACS, but larger studies are needed
to confirm this hypothesis.

280 Chapter 18
Limitations
The current study has several limitations. First, only conventional coronary angiography was
performed and no comparison between MSCT and IVUS was available. Accordingly, observed
plaques were classified as calcified, mixed or non-calcified whereas identification of fibrotic or lipid-
rich material was not possible. Also, data were acquired using 2 different MSCT scanners, which may
hamper the reproducibility of our results. Second, whether lesions with low SI on MSCT actually
reflect potentially unstable lesions has not been established yet and prospective studies are needed
to determine whether these plaques are indeed associated with an increased incidence of coronary
events.
Finally, several limitations need to be acknowledged that are inherent to MSCT. The radiation burden
of MSCT is still high and the technique remains limited to patients with low heart rate, making
administration of beta-blocking agents necessary prior to MSCT 19.
Conclusion
MSCT revealed that significantly less calcified lesions were present in ACS patients as compared
to patients with stable CAD. Moreover, even in non-culprit vessels, multiple non-calcified plaques,
which may represent high-risk lesions, were detected, indicating diffuse disease rather than focal
atherosclerosis in ACS. Future studies are warranted to determine whether assessment of plaque
type and distribution with MSCT may indeed allow identification of patients at increased risk for
coronary events.

281Differences in Plaque Composition between Stable CAD and ACS
References1. Hamm CW, Braunwald E. A classification of unstable angina revisited. Circulation. 2000;102:118-122.2. O’Rourke RA, Brundage BH, Froelicher VF, Greenland P, Grundy SM, Hachamovitch R, Pohost GM, Shaw
LJ, Weintraub WS, Winters WL, Jr. American College of Cardiology/American Heart Association Expert Consensus Document on electron-beam computed tomography for the diagnosis and prognosis of coronary artery disease. J Am Coll Cardiol. 2000;36:326-340.
3. Mauriello A, Sangiorgi G, Fratoni S, Palmieri G, Bonanno E, Anemona L, Schwartz RS, Spagnoli LG. Diffuse and active inflammation occurs in both vulnerable and stable plaques of the entire coronary tree: a histopathologic study of patients dying of acute myocardial infarction. J Am Coll Cardiol. 2005;45:1585-1593.
4. Buffon A, Biasucci LM, Liuzzo G, D’Onofrio G, Crea F, Maseri A. Widespread coronary inflammation in unstable angina. N Engl J Med. 2002;347:5-12.
5. Goldstein JA, Demetriou D, Grines CL, Pica M, Shoukfeh M, O’Neill WW. Multiple complex coronary plaques in patients with acute myocardial infarction. N Engl J Med. 2000;343:915-922.
6. Schroeder S, Kopp AF, Baumbach A, Meisner C, Kuettner A, Georg C, Ohnesorge B, Herdeg C, Claussen CD, Karsch KR. Noninvasive detection and evaluation of atherosclerotic coronary plaques with multislice computed tomography. J Am Coll Cardiol. 2001;37:1430-1435.
7. Dirksen MS, Jukema JW, Bax JJ, Lamb HJ, Boersma E, Tuinenburg JC, Geleijns J, van der Wall EE, de Roos A. Cardiac multidetector-row computed tomography in patients with unstable angina. Am J Cardiol. 2005;95:457-461.
8. Kuettner A, Trabold T, Schroeder S, Feyer A, Beck T, Brueckner A, Heuschmid M, Burgstahler C, Kopp AF, Claussen CD. Noninvasive detection of coronary lesions using 16-detector multislice spiral computed tomography technology: initial clinical results. J Am Coll Cardiol. 2004;44:1230-1237.
9. Schuijf JD, Bax JJ, Salm LP, Jukema JW, Lamb HJ, van der Wall EE, de Roos A. Noninvasive coronary im-aging and assessment of left ventricular function using 16-slice computed tomography. Am J Cardiol. 2005;95:571-574.
10. Austen WG, Edwards JE, Frye RL, Gensini GG, Gott VL, Griffith LS, McGoon DC, Murphy ML, Roe BB. A reporting system on patients evaluated for coronary artery disease. Report of the Ad Hoc Committee for Grading of Coronary Artery Disease, Council on Cardiovascular Surgery, American Heart Association. Circulation. 1975;51:5-40.
11. Takano M, Inami S, Ishibashi F, Okamatsu K, Seimiya K, Ohba T, Sakai S, Mizuno K. Angioscopic follow-up study of coronary ruptured plaques in nonculprit lesions. J Am Coll Cardiol. 2005;45:652-658.
12. Hong MK, Mintz GS, Lee CW, Kim YH, Lee SW, Song JM, Han KH, Kang DH, Song JK, Kim JJ, Park SW, Park SJ. Comparison of coronary plaque rupture between stable angina and acute myocardial infarction: a three-vessel intravascular ultrasound study in 235 patients. Circulation. 2004;110:928-933.
13. Wang JC, Normand SL, Mauri L, Kuntz RE. Coronary artery spatial distribution of acute myocardial infarc-tion occlusions. Circulation. 2004;110:278-284.
14. Hodgson JM, Reddy KG, Suneja R, Nair RN, Lesnefsky EJ, Sheehan HM. Intracoronary ultrasound imag-ing: correlation of plaque morphology with angiography, clinical syndrome and procedural results in patients undergoing coronary angioplasty. J Am Coll Cardiol. 1993;21:35-44.
15. Beckman JA, Ganz J, Creager MA, Ganz P, Kinlay S. Relationship of clinical presentation and calcification of culprit coronary artery stenoses. Arterioscler Thromb Vasc Biol. 2001;21:1618-1622.
16. Mintz GS, Pichard AD, Popma JJ, Kent KM, Satler LF, Bucher TA, Leon MB. Determinants and correlates of target lesion calcium in coronary artery disease: a clinical, angiographic and intravascular ultrasound study. J Am Coll Cardiol. 1997;29:268-274.
17. Rasheed Q, Nair R, Sheehan H, Hodgson JM. Correlation of intracoronary ultrasound plaque characteristics in atherosclerotic coronary artery disease patients with clinical variables. Am J Cardiol. 1994;73:753-758.
18. Hoffmann U, Moselewski F, Nieman K, Jang IK, Ferencik M, Rahman AM, Cury RC, Abbara S, Joneidi-Jafari H, Achenbach S, Brady TJ. Noninvasive assessment of plaque morphology and composition in culprit and stable lesions in acute coronary syndrome and stable lesions in stable angina by multidetector computed tomography. J Am Coll Cardiol. 2006;47:1655-1662.
19. Cademartiri F, Mollet NR, Runza G, Belgrano M, Malagutti P, Meijboom BW, Midiri M, Feyter PJ, Krestin GP. Diagnostic accuracy of multislice computed tomography coronary angiography is improved at low heart rates. Int J Cardiovasc Imaging. 2005;1-5.


Non-Invasive Assessment of Plaque
Characteristics with Multi-Slice Computed
Tomography Coronary Angiography in
Symptomatic Diabetic Patients
Diabetes Care 2007; 30: 1113-1119
Gabija Pundziute, Joanne D. Schuijf, J. Wouter Jukema, Eric Boersma, Arthur J.H.A. Scholte, Lucia J.M. Kroft, Ernst E. van der Wall, Jeroen J. Bax
19Chapter

Abstract
Background
Cardiovascular events are high in patients with type 2 diabetes while their risk stratification
is more difficult. The higher risk may be related to differences in coronary plaque burden and
composition. The purpose of the study was to evaluate whether differences in the extent and
composition of coronary plaques in patients with and without diabetes can be observed using
MSCT.
Methods
MSCT was performed in 215 patients (86, 40% with type 2 diabetes). The number of diseased
coronary segments was determined per patient; each diseased segment was classified as
showing obstructive (≥50% luminal narrowing) disease or not. In addition, plaque type (non-
calcified, mixed and calcified) was determined. Plaque characteristics were compared in
patients with and without diabetes. Regression analysis was performed to assess correlation
between plaque characteristics and diabetes.
Results
Patients with diabetes showed significantly more diseased coronary segments compared
to non-diabetic patients (4.9±3.5 vs. 3.9±3.2, p=0.03) with more non-obstructive (3.7±3.0
vs. 2.7±2.4, p=0.008) plaques. Relatively more non-calcified (28% vs. 19%), calcified (49% vs.
43%) and less mixed (23% vs. 38%) plaques were observed in diabetes (p<0.0001). Diabetes
correlated with the number of diseased segments, non-obstructive, non-calcified and calcified
plaques.
Conclusions
Differences in coronary plaque characteristics on MSCT were observed between patients
with and without diabetes. Diabetes was associated with higher coronary plaque burden.
More non-calcified and calcified plaques while less mixed plaques were observed in diabetic
patients. Thus, MSCT may be used to identify differences in coronary plaque burden, which
may be useful for risk stratification.

285Non-Invasive Assessment of Plaque Characteristics in Diabetes
Introduction
At present, 200 million people have diabetes mellitus worldwide while its prevalence is expected
to continue increasing exponentially 1. A close relationship between type 2 diabetes and the
development of coronary artery disease (CAD) exists and cardiovascular disease is the main cause of
death in this patient population 2.
Non-invasive testing, including myocardial perfusion scintigraphy and dobutamine stress-
echocardiography, has been used to detect CAD in diabetic patients 3;4 and a clear association
between abnormal test results and worse outcome has been demonstrated similar to the general
population 6. Nonetheless, after normal findings, still elevated event rates are observed in diabetic
patients as compared to non-diabetic individuals 6;7, indicating a need for further refinement of
prognostification in this population. The higher event rates in patients with diabetes as compared
to patients without diabetes could be related to differences in coronary plaque burden and
composition. Therefore, direct visualization of coronary plaque burden could be a useful tool for risk
stratification. Indeed, using invasive techniques, a considerably higher extent of CAD and plaque
burden has been demonstrated in the presence of diabetes 8;9.
To date, atherosclerosis has been non-invasively assessed in patients with type 2 diabetes using
coronary calcium scoring revealing extensive atherosclerosis 5;6. Still, coronary calcium scoring may
seriously underestimate coronary plaque burden as non-calcified lesions are not recognized 7. More
recently, contrast-enhanced multi-slice computed tomography (MSCT) coronary angiography
has become available which allows, in contrast to calcium scoring, detection of both calcified and
non-calcified coronary lesions 8-11. As a result, the technique potentially allows a more precise non-
invasive evaluation of coronary atherosclerosis, which in turn could be valuable for improving risk
stratification. Accordingly, the purpose of the present study was to evaluate whether differences in
the extent and composition of coronary plaques in patients with diabetes as compared to patients
without diabetes can be observed with MSCT.
Methods
The study population consisted of 86 (40%) patients with known type 2 diabetes mellitus and
129 (60%) patients without diabetes mellitus who underwent examination with MSCT coronary
angiography for recurrent chest pain complaints. Fifty-one (24%) patients were examined with
16-slice MSCT scanner, while the majority (164, 76%) underwent examination with 64-slice MSCT.
Diabetes was diagnosed according to the criteria set by American Diabetes Association 12: 1)
symptoms of diabetes and casual plasma glucose level of ≥11.1 mmol/l or 2) fasting plasma glucose
level of ≥7.0 mmol/l. Only patients in sinus rhythm, without contraindications to MSCT were included 13. All patients gave written informed consent to the study protocol, which was approved by local
ethics committee.

286 Chapter 19
MSCT data acquisition
All examinations were performed using Toshiba Multi-slice Aquilion systems (Toshiba Medical
Systems, Tokyo, Japan). First, a prospective coronary calcium scan without contrast enhancement
was performed, followed by 16- or 64-slice MSCT coronary angiography performed according to the
protocols described elsewhere 14;15. If the heart rate was ≥65 beats/min additional oral β-blockers
(metoprolol, 50 or 100 mg, single dose, 1 hour prior to the examination) were provided if tolerated.
MSCT data analysis
Coronaryarterycalciumscore
Coronary artery calcium was identified as a dense area in the coronary artery exceeding the threshold
of 130 HU. Total Agatston score was recorded for each patient.
Coronaryplaqueassessment
MSCT angiograms were evaluated by two experienced observers who were unaware of the clinical his-
tory of the patients. Coronary arteries were divided into 17 segments according to the modified American
Heart Association classification 16. The presence of coronary plaques was visually evaluated using axial im-
ages and curved multiplanar reconstructions. One coronary plaque was assigned per coronary segment.
Plaques were classified as obstructive and non-obstructive using a 50% threshold of luminal narrowing.
As shown in Figure 1, three types of plaques were identified: 1. non-calcified plaques=plaques having
lower density compared with the contrast-enhanced vessel lumen, 2. calcified plaques=plaques with
high density and 3. mixed plaques=plaques with non-calcified and calcified elements within a single
plaque. The presence of coronary plaques on MSCT, the presence of obstructive CAD in general and
if located in left main (LM)/left anterior descending (LAD) coronary artery as well as the presence of
obstructive CAD in one vessel (single vessel disease) or two or three vessels (multi-vessel disease)
were evaluated. For each patient, the number of diseased coronary segments (segments containing
plaques or previously implanted stents), the number of coronary segments with non-obstructive as
well as obstructive plaques were determined. Also, the number of segments with respectively non-
calcified, mixed and calcified plaques was determined.
Statistical analysis
Categorical variables were expressed as numbers (percentages) and compared between groups with
Chi-square test. Continuous variables were expressed as mean (standard deviation) and compared
with the two-tailed t-test for independent samples. When not normally distributed, continuous
variables were expressed as medians (interquartile range) and compared using nonparametric
Mann-Whitney test.
To determine the relationship between plaque characteristics and the presence of diabetes linear
regression analysis was performed when dependent variable was continuous and logistic regression

287Non-Invasive Assessment of Plaque Characteristics in Diabetes
analysis was performed when dependent variable was categorical. First univariate analysis was
performed, followed by multivariate analysis with correction for the following variables: age, gender,
risk factors for CAD, clinical presentation (typical angina pectoris or atypical chest pain together with
the presence of multiple CAD risk factors) and use of statins.
P-values <0.05 were considered as statistically significant. Statistical analyses were performed using
SPSS software (version 12.0, SPSS Inc, Chicago, Il, USA) and SAS software (The SAS system, release
6.12, Cary, NC, USA: SAS Institute Inc.).
Results
Baseline characteristics of patients with diabetes and without diabetes are provided in Table 1. In
total, 215 patients (136, 63% men, mean age 58±11 years) were included of which 86 (40%) were
patients with known type 2 diabetes mellitus. Ninety-six (45%) patients used statins (41 (48%)
Figure 1. An example of diffuse atherosclerosis demonstrated on MSCT coronary angiography in a patient with type 2 diabetes. Three-dimensional volume rendered reconstruction depicts severe narrowing of the proximal and mid- left anterior descending coronary artery (LAD) and occluded left circumflex coronary artery (LCx) (A). The findings were confirmed by conventional coronary angiography (B). Curved multiplanar reconstruction and the corresponding transversal sections of the LAD show multiple obstructive mixed plaques in the whole course of the artery (C, D). A non-obstructive plaque followed by vessel occlusion was demonstrated in the LCx coronary artery (E). Diffuse non-obstructive calcified plaque and an obstructive non-calcified plaque were seen in the right coronary artery (RCA) (F), which was confirmed by conventional coronary angiography (G).

288 Chapter 19
patients with diabetes, 55 (43%) without diabetes, p=0.47), 91 (42%) aspirin, 78 (36%) β-blockers and
69 (32%) angiotensin converting enzyme inhibitors. Patients with diabetes mellitus were significantly
younger as compared to patients without diabetes, had a higher mean body mass index and lower
prevalence of previous CAD.
MSCT plaque characteristics
Totalpatientpopulation
Coronary plaque characteristics on MSCT in the entire population and in patients presenting
with or without diabetes mellitus are presented in Table 2 and Figure 2. After exclusion of 64 (2%)
segments with non-diagnostic quality (n=11 small caliber, n=45 motion artefacts due to elevated
heart rate, n=8 increased signal-to-noise ratio), a total of 2941 coronary segments were included in
the analysis. CAD was completely absent on MSCT in 41 (19%) patients. In the remaining 174 (81%)
patients 917 (31%) segments with plaques (n=871, 29%) or previously implanted stents (n=46, 2%)
were observed. Of segments containing plaques, 675 (77%) showed non-obstructive and 196 (23%)
showed obstructive CAD. In general, non-calcified plaques were observed in 204 (23%) segments,
mixed in 271 (31%) and calcified in 396 (46%).
Diabeticpatientsversusnon-diabeticpatients
As can be derived from Table 2, the average number of diseased segments was higher in patients with
diabetes (4.9±3.5) as compared to non-diabetic patients (3.9±3.2), p=0.03. Particularly non-obstructive
coronary plaques were more frequently observed on MSCT in the former population (Figure 2 A). In
addition, CAD tended to be more severe in diabetic patients as both LM/LAD disease and multi-vessel
Table 1. Characteristics of patients with diabetes and without diabetes.
All patients(n=215)
Patients with diabetes
(n=86)
Patients without diabetes(n=129)
Age (yrs)* 58±11 56±11 59±12Male gender 136 (63%) 56 (65%) 80 (62%)Hypercholesterolemia 114 (53%) 53 (62%) 61 (47%)Arterial hypertension 107 (50%) 48 (56%) 59 (46%)Smoking 80 (37%) 33 (38%) 47 (36%)Family history of CAD 82 (38%) 30 (35%) 52 (40%)Body mass index (kg/m2)* 27±4 28±5 26±4Obesity 37 (17%) 20 (24%) 17 (14%)Cardiac history
Previous MI*Previous PCI*
41 (19%)42 (20%)
8 (9%)9 (11%)
33 (26%)33 (26%)
* p<0.05 between patients with and without diabetes.Data are mean±SD or n (%).CAD, coronary artery disease; MI, myocardial infarction; PCI, percutaneous coronary intervention.

289Non-Invasive Assessment of Plaque Characteristics in Diabetes
disease were more frequently diagnosed, although the difference did not reach statistical significance.
Concerning plaque types however, significant differences were observed in between diabetic and
non-diabetic patients since patients with diabetes presented with significantly more segments
containing non-calcified plaques (1.3±2.0 versus 0.7±1.2, p=0.005) as well as calcified plaques
(2.3±2.8 versus 1.5±2.1, p=0.02). Accordingly, also the relative distribution of plaque types, which is
illustrated in Figure 2 B, differed since plaques in patients with diabetes were more frequently either
non-calcified (114/406, 28% versus 90/465, 19%) or calcified (198/406, 49% versus 198/465, 43%). In
contrast, plaques in patients with diabetes were less frequently mixed (94/406, 23% versus 177/465,
38%), p <0.0001.
Correlation of MSCT plaque characteristics and diabetes
The results of uni- and multivariate analyses of the correlation between MSCT plaque characteristics
and the presence of diabetes are depicted in Table 3. After correction for baseline characteristics, the
correlation of the number of diseased coronary segments as well as the number of segments with
non-obstructive plaques and the presence of diabetes remained statistically significant. Concerning
plaque type, both the number of coronary segments with non-calcified and calcified plaques
remained significantly correlated with diabetes.
Table 2. MSCT plaque characteristics in the whole study population and comparisonbetween patients with diabetes and without diabetes.
All patients(n=215)
Patients with diabetes
(n=86)
Patients without diabetes(n=129)
Patients Coronary plaques on MSCT 174 (81%) 73 (85%) 101 (78%)Obstructive CAD 80 (37%) 34 (40%) 46 (36%)Single vessel disease 43 (20%) 16 (19%) 27 (21%)Multi-vessel disease 37 (17%) 18 (21%) 19 (15%)Obstructive CAD in LM/LAD 61 (28%) 29 (34%) 32 (25%)Total Agatston calcium score 73 (0-387) 72 (0-372) 74 (0-391)Segments Nr of diseased segments* 4.3±3.4 4.9±3.5 3.9±3.2Nr of segments with obstructive plaques 0.9±1.7 1.0±1.8 0.9±1.6Nr of segments with non-obstructive plaques* 3.1±2.7 3.7±3.0 2.7±2.4Nr of segments with non-calcified plaques* 1.0±1.6 1.3±2.0 0.7±1.2Nr of segments with mixed plaques 1.3±1.8 1.1±1.5 1.4±2.0Nr of segments with calcified plaques* 1.8±2.4 2.3±2.8 1.5±2.1
* p<0.05 between patients with and without diabetes.Data are mean±SD, median (interquartile range) or n (%). CAD, coronary artery disease; LAD, left anterior descending coronary artery; LM, left main coronary artery; MSCT, multi-slice computed tomography.

290 Chapter 19
Figure 2. A. Clustered columns demonstrating the distribution of diseased coronary segments, segments with non-obstructive and obstructive plaques in diabetic and non-diabetic patients. B. Bar graph demonstrating the relative distribution of coronary segments with different plaque types in patients with diabetes mellitus and without diabetes (p<0.0001).
0
2
4
6
8
10
Diseasedsegments
Non-obstructiveplaques
Obstructiveplaques
Av
era
ge
nu
mb
er
of
se
gm
en
ts
p=0.003 p=0.008 p=NS
A Diabetes present
No diabetes
Table 3. Estimates of correlation of MSCT plaque characteristics with the presence of diabetes.
Univariate Multivariate
MSCT characteristics Parameter estimate
p-value Parameter estimate
p-value
PatientsTotal Agatston calcium score 127.91 0.11 139 0.08Coronary plaques on MSCT 1.56 (0.76-3.21) 0.23 1.35 (0.56-3.26) 0.50Non-obstructive CAD 1.53 (0.70-3.32) 0.28 1.11 (0.42-2.94) 0.83Obstructive CAD 1.59 (0.72-3.52) 0.25 2.09 (0.68-6.49) 0.20Obstructive CAD in LM/LAD 1.70 (0.77-3.74) 0.19 2.89 (0.90-9.31) 0.08Single vessel disease 1.11 (0.46-2.67) 0.82 1.35 (0.43-4.29) 0.61Multi-vessel disease 1.77 (0.72-4.35) 0.21 4.78 (0.66-
34.37)0.12
SegmentsNr of diseased segments 1.01 0.03 1.51 0.0004Nr of segments with obstructive plaques 0.13 0.58 0.33 0.17Nr of segments with non-obstructive plaques 0.99 0.008 1.27 0.0005Nr of segments with non-calcified plaques 0.63 0.006 0.69 0.004Nr of segments with mixed plaques -0.28 0.28 0.03 0.91Nr of segments with calcified plaques 0.77 0.02 0.88 0.008
Data are odds ratios (CI) or estimates of correlation. CAD, coronary artery disease; LAD, left anterior descending coronary artery; LM, left main coronary artery; MSCT, multi-slice computed tomography.
0%
20%
40%
60%
80%
100%
Diabetes present No diabetes
Per
cen
tag
e
B Calcified plaques
Mixed plaques
Non-calcified plaques

291Non-Invasive Assessment of Plaque Characteristics in Diabetes
Discussion
In the present study, differences in coronary plaque characteristics between patients with and
without diabetes mellitus were observed using MSCT coronary angiography. A significant, positive
correlation between the presence of diabetes and coronary plaque extent was demonstrated. In
particular, diabetes was associated with an increased number of non-obstructive plaques, indicating
more diffuse CAD as compared to patients without diabetes. Also, differences in the distribution
of coronary plaque types were observed, with diabetic patients showing more non-calcified and
calcified plaques and less mixed plaques.
Plaque burden
In the present study, a larger plaque burden was observed in patients with diabetes. Similar obser-
vations have been reported in previous invasive as well as postmortem studies 5;17;18. Nicholls et al
recently reported observations in 654 subjects (including 128 with diabetes) using intravascular ul-
trasound; the authors demonstrated that diabetes was a strong, independent predictor of percent
plaque volume and total atheroma volume, indicating that diabetes appears to be associated with a
substantial increase in (diffuse) plaque burden 18.
In addition, diabetes was associated with more non-obstructive plaques in current study. This has also
been observed in studies using invasive coronary angiography 8;9. The increased total plaque burden
may be related with the increased event rate, as observed in diabetic patients. Moreover, it has been sug-
gested that plaque rupture may occur often in non-obstructive lesions, referred to as vulnerable plaques 24-27. Many of these non-obstructive lesions will not be associated with stress-inducible ischemia, result-
ing in normal results on functional imaging tests, such as nuclear imaging or stress echocardiography 28;29. Whether the larger total plaque burden and the increased prevalence of non-obstructive lesions in
diabetic patients translate into a higher event rate remains to be determined in future studies.
Plaque composition
Another important finding of the present study is the difference in distribution of different coronary
plaque types between patients with and without diabetes. Relatively more non-calcified and calcified
plaques were observed in patients with diabetes. At the same time, the proportion of mixed plaques
(possibly regarded as an intermediate phase of coronary plaque development) was significantly lower
in patients with diabetes. Accordingly, these observations could suggest a more rapid development
of atherosclerosis in the presence of diabetes, with faster progression from non-calcified lesions to
completely calcified lesions. A faster progression of atherosclerosis in patients with diabetes has been
suggested previously based on event rates in patients undergoing nuclear perfusion imaging 19;20. In
the general population, a normal perfusion scan is associated with a low (<1%) hard event rate which
is sustained over long-term follow-up. In patients with diabetes, the hard event rate is equally low
in the first 2 years in patients with a normal perfusion scan, but an increased event rate (despite the

292 Chapter 19
initial normal myocardial perfusion scan) is observed after 2 years follow-up. This observation has been
considered to be related to a faster progression of CAD in diabetic patients.
The increased prevalence of both non-calcified and calcified plaques may also have implications
for calcium scoring. In a recent study by Raggi et al, 10,377 asymptomatic individuals (including
903 patients with diabetes) were followed for a period of 5±3.5 years after coronary calcium scoring
with electron beam computed tomography 31. Higher mortality was observed in diabetic patients
as compared to non-diabetic patients despite similar coronary calcium scores, a finding which was
observed for every level of coronary calcification. The authors hypothesized that the difference in
prognosis in diabetic and non-diabetic patients despite similar calcium load could be attributed
to the presence of extensive diffuse non-calcified atherosclerosis, which could not be detected by
calcium scoring. In line with these suggestions, the current study indeed demonstrated the presence
of diffuse atherosclerosis with a significantly higher amount of non-calcified coronary plaques in the
diabetic patients. Accordingly, calcium scores may underestimate total coronary plaque burden to
higher extent in patients with diabetes, and thus, MSCT coronary angiography may have substantial
incremental value over coronary calcium scoring, although this concept needs further study.
Limitations
This study is a comparative study, describing coronary atherosclerosis in patients with and without
diabetes. Examinations were performed at a single time point and were not repeated over time. Also,
MSCT angiograms were evaluated visually since no reliable quantitative algorithms are currently
available. Two scanner generations (16- and 64-slice MSCT) were used during the study, which could
have affected the accuracy of detection of different plaque types. Follow-up data are not yet available
and these data are needed to determine whether the observations on MSCT may provide prognostic
information and may potentially be used to identify diabetic patients at increased risk. Finally, patients
in the present study were referred for non-invasive cardiac evaluation of chest pain with known or
suspected CAD. Accordingly, the findings may not be applicable to asymptomatic diabetic patients.
In addition, several limitations of MSCT in general should be mentioned. MSCT is still associated with
an elevated radiation dose, while also the administration of contrast media is required. Finally, the
presence of ischemia cannot be determined on MSCT and abnormal MSCT findings should ideally
be combined with functional data.
Conclusions
Differences in coronary plaque characteristics on MSCT were observed between patients with
diabetes and without diabetes. Diabetes may be associated with a higher coronary plaque burden as
determined on MSCT. Also, more non-calcified and calcified plaques in combination with less mixed
plaques were observed in patients with diabetes, possibly reflecting faster progression of CAD in the
presence of diabetes. MSCT may be used to identify differences in coronary plaque burden, which
may eventually be useful for risk stratification of patients with diabetes.

293Non-Invasive Assessment of Plaque Characteristics in Diabetes
References1. International Diabetes Federation. Available from http://www.idf.org. Accessed October 9, 2006.2. Haffner SM, Lehto S, Ronnemaa T, Pyorala K, Laakso M. Mortality from coronary heart disease in sujects
with type 2 diabetes and in nondiabetic subjects with and without prior myocardial infarction. N Engl J Med. 1998;339:229-234.
3. De Backer G, Ambrosioni E, Borch-Johnsen K, Brotons C, Cifkova R, Dallongeville J, Ebrahim S, Faerge-man O, Graham I, Mancia G, Cats VM, Orth-Gomer K, Perk J, Pyorala K, Rodicio JL, Sans S, Sansoy V, Sechtem U, Silber S, Thomsen T, Wood D. European guidelines on cardiovascular disease prevention in clinical practice: third joint task force of European and other societies on cardiovascular disease pre-vention in clinical practice (constituted by representatives of eight societies and by invited experts). Eur J Cardiovasc Prev Rehabil. 2003;10:S1-S10.
4. Wackers FJ, Young LH, Inzucchi SE, Chyun DA, Davey JA, Barrett EJ, Taillefer R, Wittlin SD, Heller GV, Filipchuk N, Engel S, Ratner RE, Iskandrian AE. Detection of silent myocardial ischemia in asymptomatic diabetic subjects: the DIAD study. Diabetes Care. 2004;27:1954-1961.
5. Sozzi FB, Elhendy A, Roelandt JR, Van Domburg RT, Schinkel AF, Vourvouri EC, Bax JJ, De Sutter J, Borghetti A, Poldermans D. Prognostic value of dobutamine stress echocardiography in patients with diabetes. Diabetes Care. 2003;26:1074-1078.
6. Giri S, Shaw LJ, Murthy DR, Travin MI, Miller DD, Hachamovitch R, Borges-Neto S, Berman DS, Waters DD, Heller GV. Impact of diabetes on the risk stratification using stress single-photon emission com-puted tomography myocardial perfusion imaging in patients with symptoms suggestive of coronary artery disease. Circulation. 2002;105:32-40.
7. Underwood SR, Anagnostopoulos C, Cerqueira M, Ell PJ, Flint EJ, Harbinson M Kelion AD, Al-Moham-mad A, Prvulovich EM, Shaw LJ, Tweddel AC; British Cardiac Society; British Nuclear Cardiology Society; British Nuclear Medicine Society; Royal College of Physicians of London; Royal College of Radiologists. Myocardial perfusion scintigraphy: the evidence. Eur J Nucl Med Mol Imagi. 2004;31:261-291.
8. Saely CH, Aczel S, Marte T, Langer P, Drexel H: Cardiovascular complications in Type 2 diabetes mel-litus depend on the coronary angiographic state rather than on the diabetic state. Diabetologia. 2004;47(1):145-146.
9. Saely CH, Rein P, Schmid F, Koch L, Aczel S, Marte T, Langer P, Hoefle G, Drexel H. Type 2 diabetes and the coronary angiographic state are mutually independent predictors of future vascular events among angiographied coronary patients (Abstract). Circulation. 2006;114(18): II-850.
10. Mielke CH, Shields JP, Broemeling LD. Coronary artery calcium, coronary artery disease, and diabetes. Diabetes Res Clin Pract. 2001;53:55-61.
11. Khaleeli E, Peters SR, Bobrowsky K, Oudiz RJ, Ko JY, Budoff MJ. Diabetes and the associated incidence of subclinical atherosclerosis and coronary artery disease: Implications for management. Am Heart J. 2001;141:637-644.
12. Rumberger JA, Simons DB, Fitzpatrick LA, Sheedy PF, Schwartz RS. Coronary artery calcium area by electron-beam computed tomography and coronary atherosclerotic plaque area. A histopathologic correlative study. Circulation. 1995;92:2157-2162.
13. Schroeder S, Kopp AF, Baumbach A, Meisner C, Kuettner A, Georg C, Ohnesorge B, Herdeg C, Claussen CD, Karsch KR. Noninvasive detection and evaluation of atherosclerotic coronary plaques with mul-tislice computed tomography. J Am Coll Cardiol. 2001;37:1430-1435.
14. Achenbach S, Moselewski F, Ropers D, Ferencik M, Hoffmann U, MacNeill B, Pohle K, Baum U, Anders K, Jang IK, Daniel WG, Brady TJ. Detection of calcified and noncalcified coronary atherosclerotic plaque by contrast-enhanced, submillimeter multidetector spiral computed tomography: a segment-based comparison with intravascular ultrasound. Circulation. 2004;109:14-17.
15. Leber AW, Knez A, Becker A, Becker C, von Ziegler F, Nikolaou K, Rist C, Reiser M, White C, Steinbeck G, Boekstegers P. Accuracy of multidetector spiral computed tomography in identifying and differenti-ating the composition of coronary atherosclerotic plaques: a comparative study with intracoronary ultrasound. J Am Coll Cardiol. 2004;43:1241-1247.
16. Leber AW, Knez A, von Ziegler F, Becker A, Nikolaou K, Paul S, Wintersperger B, Reiser M, Becker CR, Steinbeck G, Boekstegers P. Quantification of obstructive and nonobstructive coronary lesions by 64-slice computed tomography: a comparative study with quantitative coronary angiography and intravascular ultrasound. J Am Coll Cardiol. 2005;46:147-154.

294 Chapter 19
17. Diagnosis and classification of diabetes mellitus. Diabetes Care. 2004;27 Suppl 1:S5-S10.18. Schuijf JD, Bax JJ, Jukema JW, Lamb HJ, Vliegen HW, Salm LP, de Roos A, van der Wall EE. Noninvasive
angiography and assessment of left ventricular function using multislice computed tomography in patients with type 2 diabetes. Diabetes Care. 2004;27:2905-2910.
19. Schuijf JD, Bax JJ, Salm LP, Jukema JW, Lamb HJ, van der Wall EE, de Roos A. Noninvasive coronary im-aging and assessment of left ventricular function using 16-slice computed tomography. Am J Cardiol. 2005;95:571-574.
20. Schuijf JD, Pundziute G, Jukema JW, Lamb HJ, van der Hoeven BL, de Roos A, van der Wall EE, Bax JJ. Diagnostic accuracy of 64-slice multislice computed tomography in the noninvasive evaluation of significant coronary artery disease. Am J Cardiol. 2006;98:145-148.
21. Austen WG, Edwards JE, Frye RL, Gensini GG, Gott VL, Griffith LS, McGoon DC, Murphy ML, Roe BB. A reporting system on patients evaluated for coronary artery disease. Report of the Ad Hoc Committee for Grading of Coronary Artery Disease, Council on Cardiovascular Surgery, American Heart Associa-tion. Circulation. 1975;51:5-40.
22. Burke AP, Kolodgie FD, Zieske A, Fowler DR, Weber DK, Varghese PJ, Farb A, Virmani R. Morphologic findings of coronary atherosclerotic plaques in diabetics: a postmortem study. Arterioscler Thromb Vasc Biol. 2004;24:1266-1271.
23. Nicholls SJ, Tuzcu EM, Crowe T, Sipahi I, Schoenhagen P, Kapadia S, Hazen SL, Wun CC, Norton M, Ntanios F, Nissen SE. Relationship between cardiovascular risk factors and atherosclerotic disease burden measured by intravascular ultrasound. J Am Coll Cardiol. 2006;47:1967-1975.
24. Mann JM, Davies MJ. Vulnerable plaque. Relation of characteristics to degree of stenosis in human coronary arteries. Circulatio. 1996;94:928-931.
25. Giroud D, Li JM, Urban P, Meier B, Rutishauer W. Relation of the site of acute myocardial infarction to the most severe coronary arterial stenosis at prior angiography. Am J Cardiol. 1992;69:729-732.
26. Ambrose JA, Tannenbaum MA, Alexopoulos D, Hjemdahl-Monsen CE, Leavy J, Weiss M, Borrico S, Gor-lin R, Fuster V. Angiographic progression of coronary artery disease and the development of myocar-dial infarction. J Am Coll Cardiol. 1988;12:56-62.
27. Little WC, Constantinescu M, Applegate RJ, Kutcher MA, Burrows MT, Kahl FR, Santamore WP. Can coronary angiography predict the site of a subsequent myocardial infarction in patients with mild-to-moderate coronary artery disease? Circulation. 1988;78:1157-1166.
28. Raggi P, Bellasi A, Ratti C. Ischemia imaging and plaque imaging in diabetes: complementary tools to improve cardiovascular risk management. Diabetes Care. 2005;28:2787-2794.
29. Schuijf JD, Wijns W, Jukema JW, Decramer I, Atsma DE, de Roos A, Stokkel MP, Dibbets-Schneider P, van der Wall EE, Bax JJ. A comparative regional analysis of coronary atherosclerosis and calcium score on multislice CT versus myocardial perfusion on SPECT. J Nucl Med. 2006;47:1749-1755.
30. Hachamovitch R, Hayes S, Friedman JD, Cohen I, Shaw LJ, Germano G, Berman DS. Determinants of risk and its temporal variation in patients with normal stress myocardial perfusion scans: what is the war-ranty period of a normal scan? J Am Coll Cardiol. 2003;41:1329-1340.
31. Raggi P, Shaw LJ, Berman DS, Callister TQ: Prognostic Value of Coronary Artery Calcium Screening in Subjects With and Without Diabetes. J Am Coll Cardiol. 2005;43:1663-1669.

Prognostic Value of Multi-Slice Computed
Tomography Coronary Angiography
in Patients with Known or Suspected CAD
J Am Coll Cardiol 2007; 49: 62-70
Joanne D. Schuijf, Gabija Pundziute, J. Wouter Jukema, Eric Boersma, Albert de Roos, Ernst E. van der Wall, Jeroen J. Bax
20Chapter
Abstract
Background
It is expected that multi-slice computed tomography (MSCT) will be increasingly used as
an alternative imaging modality in the diagnosis of patients with suspected CAD. Data on
prognostic value of MSCT however are currently not available. The purpose of the study was
to determine the prognostic value of MSCT coronary angiography in patients with known or
suspected coronary artery disease (CAD).
Methods
A total of 100 patients (73 men, age 59±12 years), who were referred for further cardiac
evaluation due to suspicion of significant CAD, underwent additional MSCT coronary
angiography to evaluate the presence and severity of CAD. Patients were followed for the
occurrence of: 1. cardiac death, 2. non-fatal myocardial infarction, 3. unstable angina requiring
hospitalization, 4. revascularization.
Results
Coronary plaques were detected in 80 (80%) patients. During a mean follow-up of 16 months,
33 events occurred in 26 patients. In patients with normal coronary arteries on MSCT, first year
event rate was 0% versus 30% in patients with any evidence of CAD on MSCT. Observed event
rate was highest in the presence of obstructive lesions (63%) and when obstructive lesions
were located in the left main (LM) /left anterior descending (LAD) coronary arteries (77%).
Nonetheless elevated event rate was also observed in patients with non-obstructive CAD
(8%). In multivariate analysis, significant predictors of events included the presence of CAD,
obstructive CAD, obstructive CAD in LM/LAD, number of segments with plaques, and number
of segments with obstructive plaques.
Conclusions
MSCT coronary angiography provides independent prognostic information over baseline
clinical risk factors in patients with known and suspected CAD. Excellent prognosis was noted
in patients with a normal MSCT.

297Prognostic Value of Multi-Slice Computed Tomography Coronary Angiography
Introduction
In patients presenting with suspected or known coronary artery disease (CAD), assessment of
prognosis is essential in selecting appropriate patient management. Currently, extensive data are
available on the prognostic value of myocardial perfusion imaging with single photon emission
computed tomography (SPECT). A normal SPECT study has been shown to indicate a good clinical
outcome with an annual death or infarct rate of < 1% per year, whereas the likelihood to develop
cardiac events is significantly increased when perfusion abnormalities are detected 1;2. Similarly,
coronary artery calcium score assessed by electron beam computed tomography (EBCT) or, less
frequently, by multi-slice computed tomography (MSCT) has been used for risk stratification in
patients with known or suspected CAD, and a calcium score < 100 has been associated with excellent
outcome, with an increase in event rate paralleling the increase in calcium score 3;4.
More recently non-invasive coronary angiography techniques (magnetic resonance imaging, EBCT
and MSCT) have been introduced which allow direct visualization of coronary artery lesions. At
present, MSCT appears to be to most robust technique for this purpose and it is expected that this
technique will be increasingly used as an alternative first-line imaging modality in the diagnosis of
patients presenting with chest pain suspect for CAD. MSCT allows detection of both obstructive
as well as non-obstructive lesions, while also non-calcified lesions are visualized. Although the
diagnostic accuracy of MSCT has been demonstrated, data on the prognostic value of MSCT are
not available. Accordingly, the aim of the study was to determine the prognostic value of MSCT in
patients with known or suspected CAD.
Methods
Patients and study protocol
The study population consisted of consecutive patients who presented to the outpatient clinic and
were referred for further evaluation (using exercise-ECG, perfusion imaging or invasive coronary
angiography) of suspected CAD (chest pain complaints, elevated risk profile or abnormal test results).
In all patients, MSCT coronary angiography was performed in addition to the standard clinical work-
up. Subsequent clinical management was based on the latter; MSCT findings were not included in
the diagnostic/therapeutic work-up.
Only patients without previous coronary bypass grafting who were in sinus rhythm and without
contraindications to iodinated contrast media were included. As a result of these inclusion criteria,
5 potentially eligible patients were not enrolled in the study due to potential contrast allergy (n=3)
and atrial fibrillation (n=2), respectively. All patients gave written informed consent to the study
protocol, which was approved by the local ethics committee.
A structured interview and clinical history were acquired and the following cardiac risk factors were
assessed before the MSCT examination.

298 Chapter 20
1. Diabetes mellitus (defined as a fasting glucose level of ≥ 7 mmol/L or the need for insulin or oral
hypoglycaemic agents) 5. 2. Hypercholesterolemia (defined as a total cholesterol level ≥ 5 mmol/L
or treatment with lipid lowering drugs) 6. 3. Hypertension (defined as blood pressure was ≥ 140/90
mmHg or by the use of antihypertensive medication) 7. 4. Obesity (body mass index ≥30kg/m²) 8. 5.
Positive family history of CAD (defined as the presence of CAD in first degree relatives younger than
55 (males) or 65 (females) years of age) 9 and 6. Smoking (defined as previous or current smoking).
MSCT data acquisition
All examinations were performed using Toshiba Multi-slice Aquilion systems (Toshiba Medical
Systems, Tokyo, Japan). If the heart rate was ≥65 beats/min additional oral beta-blockers (metoprolol,
50 mg, single dose, 1 hour prior to scan) were provided if tolerated. First, a prospectively triggered
coronary calcium scan was performed prior to MSCT angiography with identical parameters for 16-
and 64-slice MSCT systems: collimation 4 x 3.0 mm, gantry rotation time 500 ms, the tube voltage
and tube current 120 kV and 200 mA, respectively. The temporal window was set at 75% after the
R-wave for electrocardiographically triggered prospective reconstruction.
Sixteen-slice MSCT coronary angiography was performed according to the protocol described
elsewhere 10. The following parameters were applied for 64-slice MSCT CA: collimation of 64 x 0.5
mm, tube rotation time of 400, 450 or 500 ms, depending on the heart rate, tube current 300 mA at
120 kV. Non-ionic contrast material was administered in the antecubital vein with an amount of 80
to 105 ml, depending on the total scan time, and a flow rate of 5 ml/sec (Iomeron 400 ®, Bracco Altana
Pharma, Konstanz, Germany). Automated detection of peak enhancement in the aortic root was used
for timing of the scan. All images were acquired during an inspiratory breath hold of approximately
10 s, with simultaneous registration of the patient’s electrocardiogram. With the aid of a segmental
reconstruction algorithm, data of one, two or three consecutive heartbeats were used to generate a
single image.
To evaluate the presence of coronary artery plaques, reconstructions in diastole (typically 75% of the
cardiac cycle) were generated with a slice thickness of 0.5 mm at an increment of 0.3 mm. If motion
artefacts were present, additional reconstructions were made in different time points of the R-R
interval. Axial data sets were transferred to a remote workstation (Vitrea2, Vital Images, Plymouth,
Minn. USA) for post-processing and subsequent evaluation.
MSCT data analysis
Coronaryarterycalciumscore
The coronary artery calcium score was assessed with the application of dedicated software (Vitrea2,
Vital Images, Plymouth, Minn. USA). Coronary artery calcium was identified as a dense area in the
coronary artery exceeding the threshold of 130 HU. An overall Agatston score was recorded for each
patient.

299Prognostic Value of Multi-Slice Computed Tomography Coronary Angiography
Coronaryplaqueassessment
For the current study, all MSCT angiograms were evaluated within a time-frame of 2 weeks by
2 experienced observers unaware of the clinical history of the patients, using a standard analysis
(see below). In case of disagreement, a joint reading was performed and a consensus decision was
reached. Coronary arteries were divided into 17 segments according to the modified American
Heart Association classification 11. Only segments with a diameter >1.5 mm (as measured on the
MSCT coronary angiogram) were included. First, each segment was classified as interpretable or not.
Predefined, patients were excluded from the analysis in case of 1. an uninterpretable proximal or mid
segment or 2. more than 3 uninterpretable segments in general.
Then, the interpretable segments were evaluated for the presence of any atherosclerotic plaque using
axial images and curved multiplanar reconstructions. Coronary plaques were defined as structures >1
mm2 within and/or adjacent to the coronary artery lumen, which could be clearly distinguished from the
vessel lumen and the surrounding pericardial tissue, as previously described 12. Subsequently, the type of
plaque was determined per segment using the following classification: 1. non-calcified = plaque having
lower density compared with the contrast-enhanced vessel lumen present without any calcification
discernible, 2. calcified plaque = only plaque with high density present and 3. mixed plaque = plaque
with non-calcified and calcified elements present. Finally, it was determined for each segment whether
obstructive luminal narrowing, using a threshold of 50% luminal narrowing, was present or not. For
each patient, the number of diseased coronary segments, number of segments with obstructive lesions
as well as number of each type of plaques was calculated. Patients without coronary artery calcium or
coronary plaques on MSCT were considered normal; an abnormal MSCT was defined in the presence of
≥1 coronary plaque. Abnormal patients were further classified as having obstructive coronary plaques
(≥50% luminal narrowing) in one ore more coronary arteries, as well as having obstructive coronary
lesions in the left main (LM) and/or left anterior descending (LAD) coronary arteries.
Follow-up
Follow-up information was obtained by either clinical visits or telephone interviews. Hospital
records of all patients were screened for the occurrence of clinical events to confirm the obtained
information. Clinical endpoints were the occurrence of 1. cardiac death, 2. non-fatal infarction, 3.
unstable angina requiring hospitalization, 4. revascularization. Cardiac death was defined as death
caused by acute myocardial infarction, ventricular arrhythmias, or refractory heart failure. Nonfatal
myocardial infarction was defined based on criteria of typical chest pain, elevated cardiac enzyme
levels, and typical changes on the ECG 13.
Statistical analysis
Categorical baseline characteristics are expressed as numbers and percentages, and compared
between 2 groups with the Chi-square test. Continuous variables are expressed as mean (standard
deviation) and compared with the two-tailed t-test for independent samples. When not normally

300 Chapter 20
distributed, continuous variables are expressed as medians (25th - 75th percentile range) and
compared using non-parametric Mann-Whitney test.
To identify the association between MSCT variables and outcomes, Cox regression analysis was used. A
composite endpoint of cardiac death, non-fatal infarction, unstable angina requiring hospitalization,
and revascularization was used. First, univariate analysis of baseline clinical characteristics and MSCT
variables was performed to identify potential predictors. Hazard ratios were calculated with 95%
confidence intervals as an estimate of the risk associated with a particular variable. To determine
independent predictors of the composite endpoint, multivariate analysis of MSCT variables with p ≤
0.05 in the univariate analysis was performed, which was corrected for scanner type, age, EuroSCORE
and baseline characteristics with p ≤ 0.5 in the univariate analysis.
Cumulative event rates as a function over time were obtained by the Kaplan-Meier method. Event
curves of the composite endpoint (cardiac death, non-fatal infarction, unstable angina requiring
hospitalization, revascularization) and hard cardiac events (cardiac death, non-fatal infarction and
unstable angina requiring hospitalization) were compared using the log-rank test.
Statistical analyses were performed using SPSS software (version 12.0, SPSS Inc, Chicago, Il, USA) and
SAS software (The SAS system, release 6.12, Cary, NC, USA: SAS Institute Inc.). P-values < 0.05 were
considered as statistically significant.
Results
Patient characteristics
In total, 104 consecutive patients were enrolled in the present study and underwent MSCT coronary
angiography. In 4 patients, an elevated and/or irregular heart rate during MSCT data acquisition
rendered the MSCT data set uninterpretable, and these patients were excluded from the analysis. As
a result, 100 patients (73 men, mean age 59±12 years) were included in the analysis (15 patients were
included in a previous study on the diagnostic accuracy of MSCT in direct comparison with invasive
angiography 10). Baseline characteristics are provided in Table 1. Briefly, 65 patients (65%) presented
with suspected CAD at the time of MSCT, whereas CAD was known in the remaining 35 patients (35%)
(33 patients had previous myocardial infarction, 31 patients had previous percutaneous coronary
intervention). In total, 55 patients underwent 16-slice MSCT and 45 underwent 64-slice MSCT.
Multi-Slice Computed Tomography
MSCT characteristics are provided in Table 2. Only coronary segments with sufficient lumen diameter
for evaluation of presence of plaques were included in the analysis. After exclusion of 33 (2%) coronary
segments with stents and 19 (1%) non-evaluable segments due to motion artefacts, plaque burden was
evaluated in 1298 segments. CAD was completely absent in 20 patients. In the remaining 80 patients, 345
coronary segments with plaques were observed, of which 47 (14%) contained non-calcified plaques, 109

301Prognostic Value of Multi-Slice Computed Tomography Coronary Angiography
(31%) mixed plaques and 189 (55%) calcified plaques. In 71 (21%) segments of 32 (32%) patients, plaques
were regarded as obstructive (≥ 50% luminal narrowing). Thirty-two (9%) segments with obstructive le-
sions in 23 (23%) patients were located in the LM and/or LAD coronary artery. In Figure 1, examples of
different MSCT observations, including normal coronary arteries, non-obstructive CAD and obstructive
CAD in the LM, are illustrated.
Follow-up results
During a mean follow-up of 16 ± 8 months (median 12 months, range 5 – 39 months), 33 events
occurred in 26 patients (with 7 events occurring repeatedly). One patient (1%) died of acute myocardial
infarction. Non-fatal myocardial infarction occurred in 3 patients (3%), unstable angina requiring
hospitalization occurred in 4 patients (4%, with 1 also undergoing revascularization). A total of 24
patients (24%) underwent coronary revascularization; percutaneous coronary intervention was
performed in 17 patients, whereas the remaining 7 patients underwent coronary artery bypass
grafting. The decision for revascularization was based on worsening angina and/or the presence of
ischemia on non-invasive testing.
Table 1. Characteristics of the study population and comparison between patients with and without events (data are expressed as number (%)).
All patients(n=100)
Patientswith events
(n=26)
Patients without events(n=74)
Clinical characteristics
Age (yrs)*(mean ± SD)
59±12 63±10 58±12
Male gender 73 (73%) 20 (77%) 53 (72%)Obesity 20 (20%) 4 (18%) 16 (22%)Diabetes 21 (21%) 5 (19%) 16 (22%)Hypercholesterolemia 50 (50%) 15 (58%) 35 (47%)Hypertension 44 (44%) 9 (35%) 35 (47%)Family history of CAD 42 (42%) 12 (46%) 30 (41%)Smoking 39 (39%) 13 (50%) 26 (35%)EuroSCORE value* (mean ± SD) 2.4±2.2 3.4±2.5 2.1±2 Cardiac history
Suspected CADPrevious MIPrevious revascularization
65 (65%)33 (33%)31 (31%)
14 (54%)11 (42%)10 (39%)
51 (65%)22 (30%)21 (28%)?
Medical therapy
ACE inhibitors 37 (37%) 7 (27%) 30 (41%)Nitrates 14 (14%) 4 (15%) 10 (14%)Beta-blockers 56 (56%) 16 (62%) 40 (54%)Aspirin 54 (54%) 17 (65%) 37 (50%)Statins 50 (50%) 12 (46%) 38 (51%)
* p < 0.05 between patients with and without events.ACE: angiotensin converting enzyme; CAD: coronary artery disease; MI: myocardial infarction.

302 Chapter 20
Figure 1. Examples of different MSCT observations. In Panels A, B, and C, curved multi-planar reconstructions of respectively the LAD, LCx and RCA of a patient with normal coronary arteries are provided. In Panel D, a curved multi-planar reconstruction of the RCA is provided revealing diffuse CAD without obstructive lesions. In Panel E, stenosis of the LM as well as proximal LAD can be observed.
Table 2. MSCT Characteristics of the study population and comparison between patients with and without events
All patients(n=100)
Patientswith events
(n=26)
Patients without events(n=74)
Total Agatston score*(median, 25th-75th percentile)
147 (0-383) 311 (122-552) 62 (0-309)
Coronary plaques on MSCT* (number (%)) 80 (80%) 26 (100%) 54 (73%)Obstructive CAD* (number (%)) 32 (32%) 20 (77%) 12 (16%)Obstructive CAD in LM/LAD* (number (%)) 23 (23%) 18 (69%) 5 (7%)Nr of segments with plaques*(median, 25th-75th percentile)
3 (1-5) 5 (4-7) 2 (0-5)
Nr of segments with obstructive plaques*(median, 25th-75th percentile)
0 (0-1) 1.5 (0.8-3) 0
Nr of segments with non-calcified plaques(median, 25th-75th percentile)
0 (0-1) 0 (0-1) 0 (0-1)
Nr of segments with mixed plaques*(median, 25th-75th percentile)
0 (0-2) 2 (0.8-3.3) 0 (0-2)
Nr of segments with calcified plaques*(median, 25th-75th percentile)
1 (0-3) 2.5 (1-4) 1 (0-3)
* p < 0.05 between patients with and without events.CAD: coronary artery disease; LAD: left anterior descending coronary artery; LM: left main coronary artery; MSCT: multi-slice computed tomography.

303Prognostic Value of Multi-Slice Computed Tomography Coronary Angiography
Predictors of events
Baseline and clinical characteristics of patients with and without events are described in Table 1. Patients
presenting with events during follow-up were significantly older (p = 0.03) and had worse clinical condi-
tion, as indicated by an elevated EuroSCORE value (p = 0.01). No significant differences in risk factors for
CAD and use of medication were observed.
Differences in MSCT characteristics of patients with and without events are summarized in Table 2. Pa-
tients with events had more extensive atherosclerosis on MSCT as reflected by a higher coronary calcium
score, and a higher number of segments showing (obstructive) plaques. Also, relatively more mixed and
calcified plaques were observed as compared to patients without events.
In Table 3, the univariate analysis of both clinical and MSCT characteristics to predict events is sum-
marized. In the multivariate analysis (Table 4), MSCT characteristics that were significant during
Table 3. Univariate predictors of eventsHR (95% CI) p-value
Clinical characteristicsAge (yrs) 1.0 (0.99 -1.0) 0.12Male gender 0.86 (0.34-2.2) 0.75Obesity 0.71 (0.24-2.0) 0.52Diabetes 0.85 (0.32-2.3) 0.74Hypercholesterolemia 1.4 (0.62-3.0) 0.45Hypertension 0.62 (0.28-1.3) 0.24Family history of CAD 1.3 (0.61-2.9) 0.47Smoking 1.7 (0.77-3.6) 0.19Previous revascularization 1.4 (0.62-3.1) 0.63Previous infarction 1.5 (0.67-3.2) 0.92EuroSCORE value 1.1 (0.99-1.3) 0.08Medical therapyACE inhibitors 0.65 (0.28-1.6) 0.34Nitrates 1.0 (0.36-3.0) 0.94Beta-blockers 1.4 (0.61-3.0) 0.46Aspirin 1.8 (0.80-4.0) 0.15Statins 0.86 (0.40-1.9) 0.70MSCT characteristicsTotal Agatston score 1.1 (1.0-1.1) 0.06Presence of coronary plaques on MSCT 8.0 (1.1-59) 0.04Abnormal coronary arteries, non-obstructive CAD (as compared to no CAD) 2.7 (0.32-22) 0.36Abnormal coronary arteries, obstructive CAD (as compared to no CAD) 22 (2.9-166) 0.003Abnormal coronary arteries, non-obstructive CAD in LM/LAD 3.1 (0.39-25) 0.29Abnormal coronary arteries, obstructive CAD in LM/LAD 36 (4.7-276) 0.0006Nr of segments with plaques* 1.3 (1.1-1.4) 0.0005Nr of segments with obstructive plaques* 1.8 (1.5-2.1) <0.0001Nr of segments with non-calcified plaques* 1.1 (0.78-1.6) 0.43Nr of segments with mixed plaques* 1.5 (1.3-1.9) 0.0002Nr of segments with calcified plaques* 1.1 (0.98-1.3) 0.1
* Ratio per segmentACE: angiotensin converting enzyme; CAD: coronary artery disease; CI: confidence interval; HR: hazard ratio; LAD: left anterior descending coronary artery; LM: left main coronary artery; MI: myocardial infarction; MSCT: multi-slice computed tomography.

304 Chapter 20
univariate analysis were corrected for age and EuroSCORE as well baseline characteristics with p ≤
0.5 during univariate analysis to ensure absence of potential confounders. Also, the type of scanner
(16- versus 64-slice MSCT) used was included in the multivariate analysis. As indicated in Table 4,
the remaining significant independent predictors of cardiac events in the multivariate analysis were
the presence of coronary plaques, obstructive CAD, LM/LAD disease, number of coronary segments
with plaques, number of coronary segments with obstructive plaques and number of coronary seg-
ments with mixed plaques.
0%
10%
20%
30%
40%
0 90 180 270 360
Follow-up (days)
Cum
ulat
ive
card
iac
even
t rat
e
Normal coronary arteries
Abnormal coronary arteries
Log-rank P-value 0.005
100 93 80 40Patients at risk 64
Table 4. Multivariate predictors of events, corrected for baseline variables
MSCT characteristics Multivariate p-valuePresence of coronary plaques on MSCT 8.8 (1.1-70) 0.04Obstructive CAD 28 (3.3-239) 0.002Obstructive CAD in LM/LAD 35 (4.3-288) 0.0009Nr of segments with plaques* 1.3 (1.1-1.6) 0.0009Nr of segments with obstructive plaques* 1.8 (1.5-2.2) <0.0001Nr of segments with mixed plaques* 1.6 (1.2-2.0) 0.0003
* Ratio per segmentData are Cox’s proportional hazard ratios (95% confidence intervals).MSCT: multi-slice computed tomography.
Figure 2. Kaplan-Meier curves for all events (cardiac death, non-fatal infarction, unstable angina requiring hospi-talization, revascularization) in patients with normal and abnormal coronary arteries on MSCT. Abbreviations: MSCT: multi-slice computed tomography.

305Prognostic Value of Multi-Slice Computed Tomography Coronary Angiography
Survival analysis
Kaplan-Meier survival curves are provided in Figures 2 to 5. As can be derived from Figure 2, no
events occurred in patients with normal coronary arteries on MSCT, whereas a first year event rate
(including all events) of 30% was observed in patients with any CAD on MSCT (log-rank p-value =
0.005). Excluding revascularizations resulted in a first year hard cardiac event rate of 5% in patients
with CAD on MSCT, as compared to 0% in patients with completely absent CAD on MSCT (log-rank
p-value = 0.19) (Figure 3).
In Figure 4, the relation between the severity of CAD and the occurrence of events was further
explored, showing an increased event rate in patients with obstructive CAD (63%) as compared to
patients without CAD (0%) or non-obstructive CAD (8%) (log-rank p-value < 0.001). Finally, LM/LAD
disease was found to be associated with the highest event rate (77%) as shown in Figure 5 (log-rank
p-value < 0.001).
Discussion
In the present study MSCT coronary angiography provided independent prognostic information for
predicting cardiac events. Patients with completely absent CAD on MSCT coronary angiography had
excellent prognosis (0% event rate), whereas an increased event rate (30%) was observed in patients
with CAD on MSCT. Furthermore, the risk of cardiac events increased with the extent of CAD as
observed on MSCT, and patients with obstructive lesions (particularly in the LM and LAD) were shown
0%
2%
4%
6%
0 90 180 270 360
Follow-up (days)
Cum
ulat
ive
card
iac
even
t rat
e
100 99 95 51Patients at risk 79
Normal coronaryarteries
Abnormal coronaryarteries
Log-rank P-value 0.19
Figure 3. Kaplan-Meier curves for hard cardiac events (cardiac death, non-fatal infarction and unstable angina requiring hospitalization) in patients with normal and abnormal coronary arteries on MSCT. MSCT: multi-slice computed tomography.

306 Chapter 20
to be at the greatest risk for cardiac events. Even after correction for baseline clinical variables such as
age and risk factors, MSCT variables reflecting coronary plaque burden, including the severity, extent
and location of atherosclerosis, remained independent predictors of cardiac events.
The prognostication and subsequent management of patients with known or suspected CAD in current
practice relies on initial clinical evaluation, with the low-risk patients being reassured and the high-
risk patients being referred for invasive angiography 14. However, the majority of these patients are in
the intermediate risk group, in whom prognosis and subsequent management is less well-defined.
Accordingly, these patients need additional testing with one or more of the established non-invasive
modalities, which include exercise electrocardiography, stress SPECT imaging or stress echocardiography 14. All these techniques aim at detecting ischemia. Exercise electrocardiography is not an ideal modality
due to the suboptimal accuracy, and imaging of stress-induced perfusion abnormalities or systolic wall
motion abnormalities may be preferred; indeed average sensitivity and specificity of 87% and 73%
to detect CAD have been reported for SPECT versus 82% and 84% for stress echocardiography 15;16. In
addition, these tests proved to be predictive of future cardiac events when abnormalities were found
and were associated with a low risk for events when the test results were normal 17-19.
MSCT coronary angiography is a highly accurate, non-invasive imaging technique for the diagnosis
of CAD; in particular, the negative predictive value of MSCT approaches 100%, allowing rule out of
CAD 20;21.
The current study explored the prognostic value of MSCT in a symptomatic patient population
with known or suspected CAD and a high prevalence of conventional risk factors. Consequently,
the pre-test likelihood of CAD was high in this population, and even in patients without known
0%
20%
40%
60%
80%
0 90 180 270 360
Follow-up (days)
Cum
ulat
ive
card
iac
even
t rat
e
Normal coronary arteries
Abnormal coronary arteries, obstructive CAD
Log-rank P-value <0.001
Abnormal coronary arteries, non-obstructive CAD
100 93 80 40Patients at risk 64
Figure 4. Kaplan-Meier curves for all events (cardiac death, non-fatal infarction, unstable angina requiring hos-pitalization, revascularization) in patients with normal coronary arteries, non-obstructive CAD and obstructive CAD on MSCT. CAD: coronary artery disease; MSCT: multi-slice computed tomography.

307Prognostic Value of Multi-Slice Computed Tomography Coronary Angiography
disease, CAD was present on MSCT in 69%. Not surprisingly therefore, high cardiac event rates were
observed. Most importantly however, a 100% event free survival was noted in patients without
any abnormalities on MSCT, highlighting an excellent negative predictive value of a normal MSCT.
This finding is of major clinical relevance, since these patients may indeed be safely reassured
without need for further testing. Patients with coronary atherosclerosis identified on MSCT were
shown to have worse prognosis. More detailed analysis revealed that although the risk of events
was considerably higher in patients with obstructive CAD, patients with non-obstructive CAD still
were at elevated risk as compared to patients without CAD. Indeed, previous studies support the
notion that plaque composition (in addition to stenosis severity) is predictive of events. Moreover,
Mann et al demonstrated in a post-mortem study that lipid core size and minimal cap thickness,
2 major determinants of plaque vulnerability, were not related to absolute plaque size or degree
of stenosis 22. Accordingly, vulnerable plaques may occur across the full spectrum of severity of
stenosis, underlining that also non-obstructive lesions may contribute to coronary events 23;24. Since
less-obstructive plaques are more frequent than severely obstructive plaques, coronary occlusion
and myocardial infarction may in fact most frequently arise from mild to moderate stenoses 23;25-28.
Pooling of these angiographical studies showed that 68% of myocardial infarctions were attributable
to so-called “angiographically silent” lesions (luminal narrowing < 50%), whereas the culprit in
only 14% could be assigned to a severe stenotic lesion (> 70%) 29. In line with these observations,
multivariate analysis of the possible predictors of cardiac events in the present study demonstrated
that non-obstructive CAD was indeed an independent predictor of future cardiac events. Of interest,
the presence of mixed plaques, which may represent less advanced and possibly less stabilized
Figure 5. Kaplan-Meier curves for all events (cardiac death, non-fatal infarction, unstable angina requiring hos-pitalization, revascularization) in patients with normal coronary arteries, patients without obstructive CAD in LM/LAD and patients with obstructive CAD in LM and/or LAD on MSCT. CAD: coronary artery disease; LAD: left anterior descending coronary artery; LM: left main coronary artery; MSCT: multi-slice computed tomography.
0%
20%
40%
60%
80%
0 90 180 270 360
Follow-up (days)
Cum
ulat
ive
card
iac
even
t rat
e
Normal coronary arteries
Abnormal coronary arteries, obstructive CAD in LM/LADLog-rank P-value <0.001
Abnormal coronary arteries, noobstructive CAD in LM/LAD
100 93 80 40Patients at risk 64

308 Chapter 20
atherosclerosis as compared to dense calcified lesions 30, was shown to be an independent predictor
as well. However, further investigations are clearly needed to support these observations.
Nonetheless, considering individual lesions, the likelihood of progression to coronary occlusion
(and subsequent myocardial infarction) remains highest for severe obstructive lesions 23;25;26. Indeed,
prospective evaluation of non-bypassed coronary segments, as was performed in the Coronary
Artery Surgery Study (CASS), showed that during a 5 year follow-up only 0.7% and 2.3% of segments
with narrowing of respectively <5% and 5% to 49% resulted in coronary occlusion 25. In contrast,
occlusion occurred in 10.1% and even 23.6% of lesions with narrowing 50% to 80% and 81% to 95%,
respectively. In agreement, high event rates were observed for patients with obstructive CAD in
the present study. More detailed analysis showed that hazard ratios were highest for patients with
obstructive CAD in either the LM or LAD coronary arteries. Indeed previous studies demonstrated
that patients with severe proximal LAD disease are at high risk 31-33; for example Califf et al reported
a 59% event free survival at 5 years in patients with 3-vessel disease and proximal LAD disease 34.
Accordingly, early identification of these patients with MSCT will be crucial to optimize therapy.
Study limitations
The prognostic value of MSCT in the present study was evaluated in patients presenting with a
wide spectrum of different conditions, including patients with no previous history of CAD as well
as patients with previous myocardial infarction and revascularization. Accordingly, treatment
strategies may have differed substantially within the studied population and future studies will
need to address the prognostic role of MSCT coronary angiography in more homogeneous patient
populations. Also, the study population was small and some clinically relevant predictors may not
have reached statistical significance. Studies in larger cohorts (with longer follow-up) are clearly
warranted to confirm these initial results.
Conclusion
This is the first study to demonstrate the independent prognostic value of MSCT coronary
angiography over baseline clinical risk factors in patients presenting with chest pain. An excellent
prognosis (0% event rate) was noted in patients with a normal MSCT. The presence of CAD (either
non-obstructive or obstructive atherosclerotic lesions) was associated with an event rate of 30%.
The event rate was highest in the presence of obstructive lesions and when lesions were located in
the LM/LAD coronary arteries. Future studies are needed to further define the prognostic value of
MSCT.

309Prognostic Value of Multi-Slice Computed Tomography Coronary Angiography
References1. Underwood SR, Anagnostopoulos C, Cerqueira M, Ell PJ, Flint EJ, Harbinson M, Kelion AD, Al Mohammad
A, Prvulovich EM, Shaw LJ, Tweddel AC. Myocardial perfusion scintigraphy: the evidence. Eur J Nucl Med Mol Imaging. 2004;31:261-291.
2. Shaw LJ, Iskandrian AE. Prognostic value of gated myocardial perfusion SPECT. J Nucl Cardiol. 2004;11:171-185.
3. O’Rourke RA, Brundage BH, Froelicher VF, Greenland P, Grundy SM, Hachamovitch R, Pohost GM, Shaw LJ, Weintraub WS, Winters WL, Jr. American College of Cardiology/American Heart Association Expert Consensus Document on electron-beam computed tomography for the diagnosis and prognosis of coronary artery disease. J Am Coll Cardiol. 2000;36:326-340.
4. Shaw LJ, Raggi P, Schisterman E, Berman DS, Callister TQ. Prognostic value of cardiac risk factors and coronary artery calcium screening for all-cause mortality. Radiology. 2003;228:826-833.
5. Report of the Expert Committee on the Diagnosis and Classification of Diabetes Mellitus. Diabetes Care. 1997;20:1183-1197.
6. Executive Summary of The Third Report of The National Cholesterol Education Program (NCEP) Expert Panel on Detection, Evaluation, And Treatment of High Blood Cholesterol In Adults (Adult Treatment Panel III). JAMA. 2001;285:2486-2497.
7. 2003 European Society of Hypertension-European Society of Cardiology guidelines for the manage-ment of arterial hypertension. J Hypertens. 2003;21:1011-1053.
8. Clinical Guidelines on the Identification, Evaluation, and Treatment of Overweight and Obesity in Adults--The Evidence Report. National Institutes of Health. Obes Res. 1998;6 Suppl 2:51S-209S.
9. Taylor AJ, Bindeman J, Feuerstein I, Cao F, Brazaitis M, O’Malley PG. Coronary calcium independently predicts incident premature coronary heart disease over measured cardiovascular risk factors: mean three-year out-comes in the Prospective Army Coronary Calcium (PACC) project. J Am Coll Cardiol. 2005;46:807-814.
10. Schuijf JD, Bax JJ, Salm LP, Jukema JW, Lamb HJ, van der Wall EE, de Roos A. Noninvasive coronary im-aging and assessment of left ventricular function using 16-slice computed tomography. Am J Cardiol. 2005;95:571-574.
11. Austen WG, Edwards JE, Frye RL, Gensini GG, Gott VL, Griffith LS, McGoon DC, Murphy ML, Roe BB. A reporting system on patients evaluated for coronary artery disease. Report of the Ad Hoc Committee for Grading of Coronary Artery Disease, Council on Cardiovascular Surgery, American Heart Association. Circulation. 1975;51:5-40.
12. Leber AW, Knez A, Becker A, Becker C, von Ziegler F, Nikolaou K, Rist C, Reiser M, White C, Steinbeck G, Boekstegers P. Accuracy of multidetector spiral computed tomography in identifying and differentiat-ing the composition of coronary atherosclerotic plaques: a comparative study with intracoronary ultra-sound. J Am Coll Cardiol. 2004;43:1241-1247.
13. Myocardial infarction redefined--a consensus document of The Joint European Society of Cardiology/American College of Cardiology Committee for the redefinition of myocardial infarction. Eur Heart J. 2000;21:1502-1513.
14. Management of stable angina pectoris. Recommendations of the Task Force of the European Society of Cardiology. Eur Heart J. 1997;18:394-413.
15. Cheitlin MD, Armstrong WF, Aurigemma GP, Beller GA, Bierman FZ, Davis JL, Douglas PS, Faxon DP, Gil-lam LD, Kimball TR, Kussmaul WG, Pearlman AS, Philbrick JT, Rakowski H, Thys DM, Antman EM, Smith SC, Jr., Alpert JS, Gregoratos G, Anderson JL, Hiratzka LF, Faxon DP, Hunt SA, Fuster V, Jacobs AK, Gibbons RJ, Russell RO. ACC/AHA/ASE 2003 Guideline Update for the Clinical Application of Echocardiography: summary article. A report of the American College of Cardiology/American Heart Association Task Force on Practice Guidelines (ACC/AHA/ASE Committee to Update the 1997 Guidelines for the Clinical Appli-cation of Echocardiography). J Am Soc Echocardiogr. 2003;16:1091-1110.
16. Klocke FJ, Baird MG, Lorell BH, Bateman TM, Messer JV, Berman DS, O’Gara PT, Carabello BA, Russell RO, Jr., Cerqueira MD, John Sutton MG, DeMaria AN, Udelson JE, Kennedy JW, Verani MS, Williams KA, Ant-man EM, Smith SC, Jr., Alpert JS, Gregoratos G, Anderson JL, Hiratzka LF, Faxon DP, Hunt SA, Fuster V, Jacobs AK, Gibbons RJ, Russell RO. ACC/AHA/ASNC guidelines for the clinical use of cardiac radionuclide imaging--executive summary: a report of the American College of Cardiology/American Heart Associa-tion Task Force on Practice Guidelines (ACC/AHA/ASNC Committee to Revise the 1995 Guidelines for the Clinical Use of Cardiac Radionuclide Imaging). J Am Coll Cardiol. 2003;42:1318-1333.

310 Chapter 20
17. Gibbons RJ, Balady GJ, Bricker JT, Chaitman BR, Fletcher GF, Froelicher VF, Mark DB, McCallister BD, Mo-oss AN, O’Reilly MG, Winters WL, Gibbons RJ, Antman EM, Alpert JS, Faxon DP, Fuster V, Gregoratos G, Hiratzka LF, Jacobs AK, Russell RO, Smith SC. ACC/AHA 2002 guideline update for exercise testing: sum-mary article. A report of the American College of Cardiology/American Heart Association Task Force on Practice Guidelines (Committee to Update the 1997 Exercise Testing Guidelines). J Am Coll Cardiol. 2002;40:1531-1540.
18. Sozzi FB, Elhendy A, Roelandt JR, Van Domburg RT, Schinkel AF, Vourvouri EC, Bax JJ, Rizzello V, Pol-dermans D. Long-term prognosis after normal dobutamine stress echocardiography. Am J Cardiol. 2003;92:1267-1270.
19. Yao SS, Qureshi E, Sherrid MV, Chaudhry FA. Practical applications in stress echocardiography: risk strati-fication and prognosis in patients with known or suspected ischemic heart disease. J Am Coll Cardiol. 2003;42:1084-1090.
20. Schuijf JD, Bax JJ, Shaw LJ, de Roos A, Lamb HJ, van der Wall EE, Wijns W. Meta-analysis of comparative diagnostic performance of magnetic resonance imaging and multislice computed tomography for non-invasive coronary angiography. Am Heart J. 2006;151:404-411.
21. Mollet NR, Cademartiri F, van Mieghem CA, Runza G, McFadden EP, Baks T, Serruys PW, Krestin GP, de Feyter PJ. High-resolution spiral computed tomography coronary angiography in patients referred for diagnostic conventional coronary angiography. Circulation. 2005;112:2318-2323.
22. Mann JM, Davies MJ. Vulnerable plaque. Relation of characteristics to degree of stenosis in human coro-nary arteries. Circulation. 1996;94:928-931.
23. Giroud D, Li JM, Urban P, Meier B, Rutishauer W. Relation of the site of acute myocardial infarction to the most severe coronary arterial stenosis at prior angiography. Am J Cardiol. 1992;69:729-732.
24. Davies MJ, Thomas AC. Plaque fissuring--the cause of acute myocardial infarction, sudden ischaemic death, and crescendo angina. Br Heart J. 1985;53:363-373.
25. Alderman EL, Corley SD, Fisher LD, Chaitman BR, Faxon DP, Foster ED, Killip T, Sosa JA, Bourassa MG. Five-year angiographic follow-up of factors associated with progression of coronary artery disease in the Coronary Artery Surgery Study (CASS). CASS Participating Investigators and Staff. J Am Coll Cardiol. 1993;22:1141-1154.
26. Nobuyoshi M, Tanaka M, Nosaka H, Kimura T, Yokoi H, Hamasaki N, Kim K, Shindo T, Kimura K. Progression of coronary atherosclerosis: is coronary spasm related to progression? J Am Coll Cardiol. 1991;18:904-910.
27. Ambrose JA, Tannenbaum MA, Alexopoulos D, Hjemdahl-Monsen CE, Leavy J, Weiss M, Borrico S, Gorlin R, Fuster V. Angiographic progression of coronary artery disease and the development of myocardial infarction. J Am Coll Cardiol. 1988;12:56-62.
28. Little WC, Constantinescu M, Applegate RJ, Kutcher MA, Burrows MT, Kahl FR, Santamore WP. Can coro-nary angiography predict the site of a subsequent myocardial infarction in patients with mild-to-moder-ate coronary artery disease? Circulation. 1988;78:1157-1166.
29. Falk E, Shah PK, Fuster V. Coronary plaque disruption. Circulation. 1995;92:657-671.30. Stary HC, Chandler AB, Dinsmore RE, Fuster V, Glagov S, Insull W, Jr., Rosenfeld ME, Schwartz CJ, Wagner
WD, Wissler RW. A definition of advanced types of atherosclerotic lesions and a histological classification of atherosclerosis. A report from the Committee on Vascular Lesions of the Council on Arteriosclerosis, American Heart Association. Arterioscler Thromb Vasc Biol. 1995;15:1512-1531.
31. Yusuf S, Zucker D, Peduzzi P, Fisher LD, Takaro T, Kennedy JW, Davis K, Killip T, Passamani E, Norris R, . Effect of coronary artery bypass graft surgery on survival: overview of 10-year results from randomised trials by the Coronary Artery Bypass Graft Surgery Trialists Collaboration. Lancet. 1994;344:563-570.
32. Nwasokwa ON, Koss JH, Friedman GH, Grunwald AM, Bodenheimer MM. Bypass surgery for chronic stable angina: predictors of survival benefit and strategy for patient selection. Ann Intern Med. 1991;114:1035-1049.
33. Varnauskas E. Twelve-year follow-up of survival in the randomized European Coronary Surgery Study. N Engl J Med. 1988;319:332-337.
34. Califf RM, Armstrong PW, Carver JR, D’Agostino RB, Strauss WE. 27th Bethesda Conference: matching the intensity of risk factor management with the hazard for coronary disease events. Task Force 5. Stratifica-tion of patients into high, medium and low risk subgroups for purposes of risk factor management. J Am Coll Cardiol. 1996;27:1007-1019.


Non-Coronary Imaging
Part V


Quantification of Myocardial Infarct Size and
Transmurality by Contrast-enhanced Magnetic
Resonance Imaging in Men
Am J Cardiol 2004; 94: 284-8
Joanne D. Schuijf, Theodorus A.M. Kaandorp, Hildo J. Lamb, Rob J. v.d. Geest, Eric P. Viergever, Ernst E. v.d. Wall, Albert de Roos,
Jeroen J. Bax
21Chapter

Abstract
Background
Contrast-enhanced Magnetic Resonance Imaging (ce-MRI) allows precise delineation of
infarct transmurality. An issue of debate is whether data analysis should be performed visually
or quantitatively. Accordingly, a head-to-head comparison was performed between visual and
quantitative analysis of infarct transmurality on ce-MRI. In addition, infarct transmurality was
related to the severity of resting wall motion abnormalities.
Methods
In 27 patients with chronic ischemic left ventricular (LV) dysfunction (LV ejection fraction
33 ± 8%) and previous infarction, cine MRI (to assess regional wall motion) and ce-MRI were
performed. Using a 17-segment model, each segment was assigned a wall motion score (from
normokinesia to dyskinesia) and segmental infarct transmurality was visually assessed on a
5-point scale (0=no infarction, 1=transmurality ≤25% of LV wall thickness, 2=transmurality 26-
50%, 3=transmurality 51-75%, and 4=transmurality 76-100%). Quantification of transmurality
was performed using threshold analysis; myocardium showing signal intensity above the
threshold was considered scar tissue and the percentage of transmurality qwas calculated
automatically.
Results
Wall motion was abnormal in 56% of the 459 segments and 55% of segments revealed
hyperenhancement (indicating scar tissue). The agreement between visual and quantitative
analysis was excellent: 90% (kappa 0.86) of segments were categorized similarly by visual and
quantitative analysis. Infarct transmurality paralleled the severity of contractile dysfunction;
96% of normal or mildly hypokinetic segments had infarct transmurality ≤25%, whereas 93%
of a- and dyskinetic segments had transmurality >50% on visual analysis.
Conclusion
Visual analysis of ce-MRI studies may be sufficient for assessment of transmurality of
infarction.

317Quantification of Myocardial Infarct Size and Transmurality
Introduction
Assessment of viability and scar tissue is important to guide treatment of patients with ischemic
cardiomyopathy 1-3. Recently, contrast-enhanced magnetic resonance imaging (ce-MRI) has
emerged as a non-invasive technique that allows imaging of scar tissue with a high spatial resolution.
A close correlation has been shown between irreversible myocardial injury and hyperenhancement
following administration of a gadolinium-based contrast agent 4;5. Furthermore, ce-MRI allows
precise delineation of the transmurality of infarction. A current issue of debate is whether the analysis
of the ce-MRI studies should be performed visually or quantitatively. Quantitative analysis may be
time-consuming while on the other hand visual assessment of transmurality may be less accurate.
Accordingly, the purpose of this study was 2-fold: (1) to demonstrate the feasibility of quantitative
assessment of transmurality, and (2) to perform a head-to-head comparison between visual and
quantitative analysis. In addition, the results of both techniques were related to the severity of
resting wall motion abnormalities.
Methods
Patients and study protocol
The study group consisted of 27 consecutive patients with chronic coronary artery disease and
a previous infarction (>1 month before the study). The inclusion criteria were: 1) sinus rhythm, 2)
angiographically proven coronary artery disease, 3) myocardial infarction >1 month before the study.
Exclusion criteria included: 1) recent myocardial infarction (≤1 month) or episode of unstable angina
and/or heart failure requiring hospitalization (≤1 month), 2) cardiac pacemakers or intracranial
aneurysm clips, 3) (supra-)ventricular arrhythmias.
The study protocol included a resting cine MRI-study to analyze regional and global LV function,
followed by ce-MRI to determine infarct size. All patients gave written informed consent to the study
protocol, which was approved by the local ethics committee.
Data acquisition
Patients were positioned supine in a clinical 1.5-T scanner (Gyroscan NT Intera, Philips Medical Systems,
Best, The Netherlands). All images were acquired using a five elements synergy coil during breath-
holds and were gated to the electrocardiogram. To determine the final short-axis imaging plane,
transverse, oblique sagittal, and double-oblique left ventricular long-axis scout images were obtained
as previously described 6. Depending on the heart size, the heart was imaged from apex to base with
10 to 12 imaging levels in the short-axis orientation using a sensitivity encoding imaging technique
balanced fast field echo sequence. Typical parameters were field of view 400 x 400 mm2, matrix size
256 x 256, slice thickness 10.00 mm, slice gap 0.00 mm, flip angle 50°, time to echo 1.82 ms and time

318 Chapter 21
to repeat 3.65 ms. The number of cardiac phases depended on the heart rate. Prior to the acquisition
of the delayed enhancement images, optimization of inversion time was performed for each patient
individually starting at 15 minutes after a bolus injection of Gd-DTPA (Magnevist; Schering/Berlex,
Berlin, Germany, 0.15 mmol/kg). In order to achieve maximum contrast between viable and non-
viable myocardial tissue, a series of real-time planscan images with decreasing inversion time, starting
at approximately 300 ms were obtained. Real-time planscanning allows immediate adjustment of
inversion time by instant acquisition of short-axis test slices, without the need for breath holding.
In 50-70 seconds a series of images with different inversion times in steps of 5 ms can be acquired
to obtain the optimum inversion time with nulled (black) myocardium and high signal intensity of
infarcted tissue. The following parameters were applied: field of view 400 x 400 mm2, matrix size 256 x
256, slice thickness 6.00 mm, flip angle 15°, time to echo 1.44 ms and time to repeat 4.3 ms.
Contrast-enhanced images were acquired at 17-19 minutes after contrast administration, with an
inversion-recovery gradient echo sequence, in the same views as those used for cine MR. Depending
on the patient’s heart rate and heart size, 20 to 24 slices were obtained in two breath-hold acquisitions
of approximately 15 seconds. Typical parameters were the following: field of view 400 x 400 mm2,
matrix size 256 x 256, slice thickness 5.00 mm, slice gap – 5 mm, flip angle 15°, time to echo 1.36 ms
and time to repeat 4.53 ms.
Data analysis
Regionalandglobalfunction
For the assessment of regional wall motion, cine MR images were visually interpreted by two
experienced observers (blinded to other MR and clinical data) using a previously described
17-segment model 7. Each segment was assigned a wall motion score using a 5-point scale: 0:
normokinesia, 1: mild hypokinesia, 2: severe hypokinesia, 3: akinesia, and 4: dyskinesia.
To determine global function, endocardial borders were outlined manually on the short-axis cine
images using previously validated software (MR Analytical Software System [MASS], version 5.0,
Leiden, The Netherlands). Papillary muscles were regarded as being part of the ventricular cavity.
LV end-systolic and LV end-diastolic volumes were calculated. Subsequently the related LV ejection
fraction was derived by subtracting the end-systolic volume from the volume at end-diastole and
dividing the result by the end-diastolic volume.
Scartissue;Visualanalysis
Delayed enhancement images were scored visually by two experienced observers (blinded to other
MR and clinical data) using the same 17-segment model as used for function analysis (see Figure 21.1).
Each segment was graded on a 5-point scale: 0: absence of hyperenhancement, 1: hyperenhancement
1-25% of LV wall thickness, 2: hyperenhancement extending to 26-50%, 3: hyperenhancement
extending to 51-75%, and 4: hyperenhancement extending to 76-100% of LV wall thickness 8. To
assess intra- and interobserver agreements, 10 patients were re-analyzed. The resulting intra- and
interobserver agreement were 97% and 94%, respectively.

319Quantification of Myocardial Infarct Size and Transmurality
Scartissue;Quantitativeanalysis
The transmural extent of infarction was also determined using threshold analysis (see Figure 1).
In one representative slice of each delayed enhancement set, 2 regions of interest were manually
drawn; one in a region showing the highest signal intensity (center of infarction) and another equally
sized region of interest in normal myocardium (with normal wall motion). A threshold value was
calculated by dividing the sum of the signal intensities in both regions of interest by 2. Myocardial
tissue showing a signal intensity ≥ the threshold value was considered scar tissue.
The extent of transmurality was subsequently determined by the use of the modified centerline
method 9. Using 10 points along each centerline chord, percentage of LV wall thickness with
increased signal intensity was determined and expressed as an average per segment to allow
comparison with the visual analysis. Signal intensity of the 10 equidistant points was determined
by bipolar interpolation. No zoom was used. To assess inter- and intraobserver variability of
quantitative analysis (to assess extent of infarcted tissue), 10 patients were re-analyzed. The inter-
and intraobserver variability were 4.2 ± 6.6% and 3.0 ± 5.1%, respectively.
Statistical analysis
Continuous data were expressed as mean ± SD and compared using the 2-tailed Student’s t test
for paired and unpaired data when appropriate. Simultaneous comparison of >2 mean values was
performed using 1-way analysis of variance (ANOVA). Relations were determined by linear regression
analysis. The agreement for segmental wall motion and scar score, and visual and quantitative
Figure 1. Subsequent steps of quantitative analysis of transmurality of infarction.A1: Representative contrast enhanced, short-axis slice. A2: Two manually drawn regions of intereset; 1 in the center of infarction (black arrow) and another in normal myocardium (white arrow). A3: Contrast-enhanced slice after application of the threshold value. B1: Application of the modified centerline method, resulting in 100 equidistant chords along the LV wall. B2: Enlargement of the dashed box in Panel B1. B3: A signal intensity curve of one of these centerline chords, showing the signal intensity in 10 points along this particular centerline chord, revealing infarction of 50% of LV wall thickness.

320 Chapter 21
analysis of scar tissue, was assessed from 5 x 5 tables using weighted kappa statistics. Kappa values of
<0.4, between 0.4 and 0.75 and >0.75 were considered to represent poor, fair to good and excellent
agreement, respectively, based on Fleiss’ classification 10. The kappa values are reported with their
standard errors (SE). A P-value <0.05 was considered statistically significant.
Results
Patients
The patient characteristics are summarized in Table 1. The study group consisted of 27 males, with
a mean age of 65 ± 7 years. All patients had a history of previous myocardial infarction (>3 months
before the study) and showed Q waves on the electrocardiogram (11 inferior, 16 anterior). The
patients had on average 2.7 ± 0.6 stenosed coronary arteries. Cardiac medication was continued
during the study period and consisted of β-blockers (n = 12), angiotensin-converting enzyme-
inhibitors (n =16), diuretics (n = 16), statins (n = 15), calcium antagonists (n = 10), nitrates (n = 9) and
oral anti-coagulation or aspirin (n = 27).
Regional function, Global function
Systolic wall thickening was normal in 200 (44%) of 459 segments. End-diastolic volumes measured
from the short-axis cine images ranged from 187 to 407 ml (mean 269 ± 70 ml). End-systolic volumes
ranged from 99 tot 313 ml (mean 184 ± 68 ml). Accordingly, LV ejection fraction ranged from 21%
to 52% (mean 33 ± 8%). Since assessment of viability is most important in patients with severely
depressed LV ejection fraction, separate analysis was performed in 15 patients with a LV ejection
fraction ≤35%. In these patients end-diastolic and end-systolic volumes ranged from 218 to 407 ml
(mean 311 ± 66 ml) and 155 to 313 ml (mean 229 ± 58 ml), respectively. Mean LV ejection fraction
Table 1. Clinical characteristics of the study population (n=27).n (%)
Age (years) 65 ± 7Previous infarction 27 (100%)Q wave on electrocardiogram 27 (100%)Multi-vessel disease 24 (89%)Angina Pectoris CCS class 1/2 23 (85%) CCS class 3/4 4 (15%)Heart Failure (NYHA class) 1/2 15 (56%) 3/4 12 (44%)
CCS: Canadian Cardiovascular Society; NYHA: New York Heart Association.

321Quantification of Myocardial Infarct Size and Transmurality
was 27 ± 4% (range 21 to 35%). Linear regression revealed good correlations (y = -0.37 x + 22.0, r =
0.79, P <0.01 and y = -0.37 x + 17.8, r = 0.79, P <0.01) between LV ejection fraction and the number of
dysfunctional segments and between LV ejection fraction and the number of severe dysfunctional
segments, respectively.
Figure 2. Percentag segments with different scores of transmurality of delayed enhancement in relation to re-gional wall motion score. The extent of hyperenhancement paralleled the severity of contractile dysfunction.ak = akinesia, dysk = dyskinesia, mhk = mild hypokinesia, and shk = severe hypokinesia.
Visual analysis of scar tissue
Of the 459 segments evaluated, 253 (55%) segments revealed hyperenhancement. The extent of
hyperenhancement paralleled the severity of contractile dysfunction (Figure 2) and the likelihood of
hyperenhancement >50% of LV wall thickness, was significantly higher in a- or dyskinetic segments
than in mildly hypokinetic or normal segments (93% vs. 2% vs. 0%, P <0.05). Precise data are shown in
Table 2. Percentages of visual scar scores in relation to the segmental wall motion score are depicted
in Figure 2.
0%
20%
40%
60%
80%
100%
MHK SHK AK DYSK
Wall motion score
% s
egm
ents transmural infarction
(visual score 3 & 4) intermediate infarction(visual score 2)subendocardial infarction(visual score 0 &1)
Table 2. Relation between visual hyperenhancement score and severity of contractile dysfunction (expressed as wall motion score) (65%, kappa 0.51).
Wall motion score
Hyperenhancement score (visual analysis) 0 1 2 3 4 Total
0 172 28 0 0 0 2001 31 70 9 2 0 1122 3 28 25 23 0 793 0 2 3 21 28 544 0 0 0 3 11 14
Total 206 128 37 49 39 459

322 Chapter 21
Quantitative analysis of scar tissue
The quantitative percentage of transmurality on delayed enhancement images also paralleled
the severity of resting wall motion abnormalities and increased from an average of 14% in mild
hypokinetic segments to an average of 85% in dyskinetic segments (P <0.05). Average percentages
of transmurality for each wall motion score are shown in Figure 3. An excellent agreement was found
between the visual and quantitative analysis: 90% of 459 segments were scored identically (with a
kappa statistics of 0.86, SE 0.02). Quantitative assessment of scar tissue yielded a different result in 45
(10%) segments, and shifted 13 (29%) of these discrepant segments to a lower transmurality score
and 32 (71%) to a higher transmurality score (Table 3). Average quantitative scores for the different
visual scores are presented in Figure 4.
0
20
40
60
80
100
NORM MHK SHK AK DYSK
Wall motion score
Ave
rag
e %
sca
r ti
ssu
e (q
uan
tita
tive
)
Figure 3. Relation between the severity of contractile dysfunction (expressed as wall motion score) and the average quantitative percentage of hyperenhancement through the left ventricular wall. Average quantitative percentage of hyperenhancement increased from 14% in mild hypokinetic segments to an average of 85% in dyskinetic segments (P <0.05).ak = akinesia, dysk = dyskinesia, mhk = mild hypokinesia, norm = normokinesia, and shk = severe hypokinesia.
Table 3. Agreement between quantitative and visual scoring of scar tissue (90%, kappa 0.86).
Visual analysis
Quantitative analysis 0 1-25% 26-50% 51-75% 76-100% Total
0 188 18 0 0 0 2061 5 117 4 2 0 1282 0 3 33 1 0 373 0 0 0 42 7 494 0 0 0 5 34 39
Total 193 138 37 50 41 459

323Quantification of Myocardial Infarct Size and Transmurality
Discussion
Recently, gadolinium-based contrast agents have been used extensively in combination with MRI to
identify infarcted myocardium 8;11. The accuracy of ce-MRI in the assessment of infarcted myocardium
has been evaluated by Kim and colleagues 11. The authors demonstrated in animal-model of
occlusion and reperfusion, an excellent agreement between the transmural and circumferential
extent of infarction assessed by ce-MRI as compared to histology. In addition, in patients after acute
myocardial infarction, the extent of scar tissue on ce-MRI correlated well with the enzymatically
assessed damage 8.
In patients with chronic ischemic cardiomyopathy, direct comparisons with positron emission
tomography and F18-fluorodeoxyglucose demonstrated a good agreement between the 2
techniques for assessing viability 12. Moreover, Kim and colleagues demonstrated that the extent
of scar tissue on ce-MRI was predictive of improvement of function after revascularization 13:
patients with small subendocardial necrosis had a high likelihood of functional recovery post-
revascularization, as compared to a low likelihood of recovery in patients with transmural infarction.
The major advantage of MRI over other imaging techniques is the extremely high resolution,
allowing assessment of minimal infarction. Recently, Wagner et al 14 performed a head-to-head
comparison between ce-MRI and SPECT imaging, and demonstrated that 47% of segments with
small subendocardial infarctions on ce-MRI were not detected by SPECT.
Currently, the ce-MRI studies are analyzed visually, and the transmurality of infarction is divided into
quintiles based on visual inspection 8;13. However, the high resolution of MRI makes the technique
extremely suited for quantitative analysis. At present, various MRI-derived parameters have been
evaluated quantitatively, including LV volumes, LV ejection fraction, segmental systolic thickening
and end-systolic wall thickness 15-17, providing extreme precision to assess these parameters.
Similarly, quantitative evaluation of transmurality of infarcted tissue on ce-MRI would allow a higher
precision to define the exact percentage infarcted tissue of the LV wall. All previous studies however
0
20
40
60
80
100
0 1 2 3 4
Visual score
Ave
rag
e %
sca
r ti
ssu
e (q
uan
tita
tive
)
Figure 4. Average percentage hyperenhancement (quantitative) in relation to segmental visual scar score.

324 Chapter 21
have relied on visual analysis; in the current study, the feasibility of a more objective, quantitative
approach was demonstrated. Using threshold analysis for signal intensity, precise delineation of the
transmural extent of infarcted tissue was possible (although animal experiments are still needed
to validate the technique). However, when the quantitative approach was compared directly to
visual analysis, an excellent agreement with 90% of segments classified in the same quintiles of
transmurality (Table 3), and only 10% of segments was shifted to a lower or higher quintile when
quantitative analysis was compared to visual analysis. Based on these findings, one may conclude
that visual analysis may be sufficient for clinical assessment of the extent and transmurality on ce-
MRI. Eventually, a head-to-head comparison between visual and quantitative analysis is needed in
patients undergoing revascularization, in order to determine whether precise quantification results
in superior prediction of improvement of function after revascularization.
Besides the comparison between visual and quantitative analysis, the transmurality on ce-MRI was
compared to the severity of contractile dysfunction. Comparable to the findings by Mahrholdt et al 18, the extent of transmurality paralleled the severity of wall motion abnormalities: segments with
normal function had no or minimal infarction, whereas segments with a- or dyskinesia had extensive
scar tissue.
In conclusion, excellent agreement between visual and quantitative analysis of ce-MRI for assessment
of scar tissue was demonstrated, suggesting that visual analysis is sufficient in the assessment of
transmurality of infarction on ce-MRI.

325Quantification of Myocardial Infarct Size and Transmurality
References1. Baker DW, Jones R, Hodges J, Massie BM, Konstam MA, Rose EA. Management of heart failure. III. The
role of revascularization in the treatment of patients with moderate or severe left ventricular systolic dysfunction. JAMA. 1994;272:1528-1534.
2. Elefteriades JA, Tolis G, Jr., Levi E, Mills LK, Zaret BL. Coronary artery bypass grafting in severe left ven-tricular dysfunction: excellent survival with improved ejection fraction and functional state. J Am Coll Cardiol. 1993;22:1411-1417.
3. Mickleborough LL, Maruyama H, Takagi Y, Mohamed S, Sun Z, Ebisuzaki L. Results of revascularization in patients with severe left ventricular dysfunction. Circulation. 1995;92:II73-II79.
4. Fieno DS, Kim RJ, Chen EL, Lomasney JW, Klocke FJ, Judd RM. Contrast-enhanced magnetic resonance imaging of myocardium at risk: distinction between reversible and irreversible injury throughout infarct healing. J Am Coll Cardiol. 2000;36:1985-1991.
5. Ramani K, Judd RM, Holly TA, Parrish TB, Rigolin VH, Parker MA, Callahan C, Fitzgerald SW, Bonow RO, Klocke FJ. Contrast magnetic resonance imaging in the assessment of myocardial viability in patients with stable coronary artery disease and left ventricular dysfunction. Circulation. 1998;98:2687-2694.
6. Plein S, Ridgway JP, Jones TR, Bloomer TN, Sivananthan MU. Coronary artery disease: assessment with a comprehensive MR imaging protocol--initial results. Radiology. 2002;225:300-307.
7. Cerqueira MD, Weissman NJ, Dilsizian V, Jacobs AK, Kaul S, Laskey WK, Pennell DJ, Rumberger JA, Ryan T, Verani MS. Standardized myocardial segmentation and nomenclature for tomographic imaging of the heart: a statement for healthcare professionals from the Cardiac Imaging Committee of the Council on Clinical Cardiology of the American Heart Association. Circulation. 2002;105:539-542.
8. Wu E, Judd RM, Vargas JD, Klocke FJ, Bonow RO, Kim RJ. Visualisation of presence, location, and transmu-ral extent of healed Q- wave and non-Q-wave myocardial infarction. Lancet. 2001;357:21-28.
9. van Rugge FP, van der Wall EE, Spanjersberg SJ, de Roos A, Matheijssen NA, Zwinderman AH, van Dijk-man PR, Reiber JH, Bruschke AV. Magnetic resonance imaging during dobutamine stress for detection and localization of coronary artery disease. Quantitative wall motion analysis using a modification of the centerline method. Circulation. 1994;90:127-138.
10. Fleiss JL. Statistical methods for Rates and proportions. Second edition. New York: Wiley 1981. 1981.11. Kim RJ, Fieno DS, Parrish TB, Harris K, Chen EL, Simonetti O, Bundy J, Finn JP, Klocke FJ, Judd RM. Relation-
ship of MRI delayed contrast enhancement to irreversible injury, infarct age, and contractile function. Circulation. 1999;100:1992-2002.
12. Klein C, Nekolla SG, Bengel FM, Momose M, Sammer A, Haas F, Schnackenburg B, Delius W, Mudra H, Wolfram D, Schwaiger M. Assessment of myocardial viability with contrast-enhanced magnetic reso-nance imaging: comparison with positron emission tomography. Circulation. 2002;105:162-167.
13. Kim RJ, Wu E, Rafael A, Chen EL, Parker MA, Simonetti O, Klocke FJ, Bonow RO, Judd RM. The use of contrast-enhanced magnetic resonance imaging to identify reversible myocardial dysfunction. N Engl J Med. 2000;343:1445-1453.
14. Wagner A, Mahrholdt H, Holly TA, Elliott MD, Regenfus M, Parker M, Klocke FJ, Bonow RO, Kim RJ, Judd RM. Contrast-enhanced MRI and routine single photon emission computed tomography (SPECT) perfusion imaging for detection of subendocardial myocardial infarcts: an imaging study. Lancet. 2003;361:374-379.
15. Baer FM, Voth E, Schneider CA, Theissen P, Schicha H, Sechtem U. Comparison of low-dose do-butamine-gradient-echo magnetic resonance imaging and positron emission tomography with [18F]fluorodeoxyglucose in patients with chronic coronary artery disease. A functional and morpho-logical approach to the detection of residual myocardial viability. Circulation. 1995;91:1006-1015.
16. Baer FM, Theissen P, Schneider CA, Voth E, Sechtem U, Schicha H, Erdmann E. Dobutamine magnetic resonance imaging predicts contractile recovery of chronically dysfunctional myocardium after suc-cessful revascularization. J Am Coll Cardiol. 1998;31:1040-1048.
17. Bellenger NG, Burgess MI, Ray SG, Lahiri A, Coats AJ, Cleland JG, Pennell DJ. Comparison of left ventricu-lar ejection fraction and volumes in heart failure by echocardiography, radionuclide ventriculography and cardiovascular magnetic resonance; are they interchangeable? Eur Heart J. 2000;21:1387-1396.
18. Mahrholdt H, Wagner A, Parker M, Regenfus M, Fieno DS, Bonow RO, Kim RJ, Judd RM. Relationship of contractile function to transmural extent of infarction in patients with chronic coronary artery disease. J Am Coll Cardiol. 2003;42:505-512.


Comprehensive Cardiac Assessment with
MSCT: Evaluation of Left Ventricular Function
and Perfusion in addition
to Coronary Anatomy in Patients
with Previous Myocardial Infarction
Heart 2006; 92: 1779-1783
Maureen M. Henneman, Joanne D. Schuijf, J. Wouter Jukema,Hildo J. Lamb, Albert de Roos, Petra Dibbets, Marcel P. Stokkel,
Ernst E. van der Wall, Jeroen J. Bax
22Chapter

Abstract
Background
In patients with previous infarction comprehensive assessment is needed for optimal risk
stratification, including assessment of coronary artery stenoses, left ventricular (LV) function
and perfusion. Currently, different imaging modalities are needed to provide the information,
but multi-slice computed tomography (MSCT) may be able to provide all information from
a single data set. The purpose of the study was to evaluate a comprehensive MSCT protocol
in patients with previous infarction, including assessment of coronary artery stenoses, LV
function and perfusion.
Methods
16-slice MSCT was performed in 21 patients with previous infarction; from the MSCT data,
coronary artery stenoses, (regional and global) LV function and perfusion were assessed.
Invasive coronary angiography and gated single photon emission computed tomography
(SPECT) served as the gold standard for coronary artery stenoses and LV function/perfusion
respectively.
Results
In total, 236 of 241 (98%) coronary artery segments were interpretable on MSCT. The
sensitivity and specificity for detection of stenoses were 91% and 97%. Pearson’s correlation
showed excellent agreement for assessment of LV ejection fraction between MSCT and
SPECT, respectively 49±13% vs 53±12%, r=0.85. Agreement for assessment of regional wall
motion was excellent (92%, κ statistic 0.77). Finally, in 68 of 73 (93%) segments, MSCT correctly
identified a perfusion defect as compared to SPECT, whereas the absence of perfusion defects
was correctly detected in 277 of 284 (98%) segments.
Conclusions
MSCT permits accurate, non-invasive assessment of coronary artery stenoses, LV function and
perfusion in patients with previous infarction. All parameters can be assessed from a single
data set.

329Comprehensive Cardiac Assessment with MSCT
Introduction
The evaluation of patients with previous myocardial infarction is extensive but mandatory to allow
optimal risk stratification. Coronary angiography is needed for precise assessment of the location
and severity of obstructive coronary artery lesions. Information on systolic function (left ventricular
ejection fraction, LVEF) needs to be evaluated, since this is an important prognostic factor. LVEF
can be assessed by 2D echocardiography, nuclear imaging with gated SPECT, or invasively by left
ventricular (LV) angiography. Finally, assessment of perfusion in the infarct region is of importance;
this can be performed by gated single photon emission computed tomography (SPECT). An
imaging modality that could provide all this information during one acquisition would be preferred.
Over the past few years, multi-slice computed tomography (MSCT) has emerged as a non-invasive
imaging modality that allows the acquisition of high resolution 3D images of the entire heart
within 25 seconds. The technique allows non-invasive coronary angiography, with sensitivities
and specificities for the detection of significant stenoses ranging from 70% to 98%1-5. Since MSCT
data acquisition is gated to the electrocardiogram (ECG), LV function can be derived from the same
dataset1;6. In particular, both global LV function (LVEF) and regional LV function (wall motion) can
be assessed. Moreover, due to the acquisition of images during the first pass of a contrast agent,
hypoenhanced areas can be identified, indicating reduced perfusion. Accordingly, a single MSCT
examination could potentially provide all this information, but currently no data are available on
the value of MSCT on this topic. The purpose of the present study was to evaluate the feasibility of
MSCT to assess all these parameters during a single acquisition. Conventional modalities were used
as gold standard to compare these different parameters, including invasive coronary angiography
to assess coronary stenoses and nuclear perfusion imaging with SPECT to assess resting perfusion.
Moreover, since the SPECT studies were assessed in gated mode, global (LVEF) and regional LV
function (wall motion) could also be derived from SPECT.
Methods
Patients and study protocol
Twenty-one patients with a history of myocardial infarction (>3 months before the study) underwent
MSCT and resting gated SPECT using technetium-99m. In 20 patients also invasive coronary
angiography was performed. Patients with atrial fibrillation were excluded, as well as patients with
renal insufficiency (serum creatinine >120 mmol/L), known allergy to iodine contrast media, severe
claustrophobia, and pregnant patients. All patients provided informed consent to the study protocol,
which was approved by the local ethics committee.

330 Chapter 22
MSCT, data acquisition
MSCT examinations were performed with a 16-slice Toshiba Multi-slice Aquilion 16 system (Toshiba
Medical Systems, Otawara, Japan). Collimation was 16 x 0.5 mm (if arterial grafts were present, a
collimation was 16 x 1.0 mm was used to decrease scan time), and rotation time was 400, 500 or 600 ms,
depending on heart rate. Tube current and tube voltage were 250 mA and 120 kV, respectively. Total
contrast dose for the scan varied from 120 to 150 ml, depending on total scan time, with an injection
rate of 4 ml/s through the antecubital vein (Xenetix 300, Guerbet, Aulnay S. Bois, France), followed by
a saline flush of 40 ml. To time the scan, automated detection of peak enhancement in the aortic root
was used. All images were acquired during an inspiratory breath hold, while the ECG was registrated
simultaneously for retrospective gating of the data. With the aid of a segmental reconstruction
algorithm, data of 2 or 3 consecutive heartbeats were used to generate a single image. Estimated
radiation dose was 8 mSv for men and 10 mSv for women.
Evaluationofcoronaryarterystenoses
For evaluation of coronary artery stenoses, images with a slice thickness of 0.5 mm were reconstructed
at typically 75% of the cardiac cycle. In case of motion artifacts, reconstructions at 40% to 50% were
explored. Subsequently, images were transferred to a remote workstation (Vitrea2, Vital Images,
Plymouth, Mn, USA) for post- processing.
EvaluationofLVfunctionandrestingperfusion
For evaluation of LV function and resting perfusion, 2.0-mm slices were reconstructed in the short-
axis orientation at 20 time points, starting at early systole (0% of cardiac cycle) to end-diastole (95%
of cardiac cycle) in steps of 5%. Images were transferred to a remote workstation with dedicated
cardiac function analysis software (MR Analytical Software System, Medis, Leiden, The Netherlands).
MSCT, data analysis
Assessmentofsignificantcoronaryarterystenoses
For the assessment of significant coronary artery stenoses, the MSCT angiograms were evaluated
by 2 experienced observers, blinded to the results of conventional coronary angiography. Coronary
arteries were divided in 17 segments according to the guidelines of the American Heart Association/
American College of Cardiology 7. Only segments with a diameter ≥2.0 mm were included. First,
segments were classified as evaluable or not. Thereafter, the interpretable segments were evaluated
for the presence of significant narrowing (≥50% decrease in luminal diameter). In case of previous
bypass surgery and patent bypass grafts, only segments distal to the anastomosis were evaluated.
LVfunction
To determine LV function, an independent observer outlined endocardial borders manually on the
short-axis cine images. The papillary muscles were regarded as being part of the LV cavity. The LV

331Comprehensive Cardiac Assessment with MSCT
end-systolic and end-diastolic volumes were calculated and the LVEF was derived. Regional wall
motion was assessed visually using the short-axis slices in cine-loop mode, by one observer blinded
to all other data using a 17- segment model 8. A three-point scale was used to assign to each segment
a wall motion score (1 = normokinesia, 2 = hypokinesia, 3 = a- or dyskinesia) 9.
Myocardialperfusion
To assess myocardial perfusion, the transmural extent of the LV wall showing reduced perfusion was
evaluated in terms of transmurality of decreased signal intensity. A five-point scoring system was
used with 0 = no perfusion defect, 1 = a perfusion defect involving 1% - 25% of the LV wall, 2 = a
defect involving 26% - 50% of the LV wall, 3 = a defect involving 51% - 75% of the LV wall, and 4
= a defect involving >75% of the LV wall, using the same 17-segment model as described for the
assessment of regional wall motion 10.
Resting gated SPECT
Myocardial perfusion SPECT imaging with technetium-99m tetrofosmin (500 MBq, injected at rest) was
performed using a triple head SPECT camera system (GCA 9300/HG, Toshiba Corp.) equipped with low
Figure 1. Example of MSCT coronary angiography.Panel (A) Conventional angiography showing the LCX (white arrow) and the LAD (white arrow head). Panel B-E: Corresponding MSCT images. (B) MSCT 3D volume-rendered reconstruction depicting the LAD (white arrows) and the D1 (white arrowhead). (C) MPR of the LCX (white arrows). (D) MPR of the LAD (white arrow heads) with soft plaque (white arrow). (E) Transaxial image of the LAD (white arrows) demonstrating small calcifications.

332 Chapter 22
energy high-resolution collimators. Around the 140-KeV energy peak of technetium-99m tetrofosmin,
a 20% window was used. A total of 90 projections (step and shoot mode, 35 seconds per projection,
imaging time 23 minutes) were obtained over a 360-degree circular orbit. Data were stored in a 64 x 64,
16-bit matrix. Resting perfusion was assessed using segmental tracer activity (0 = ≥75% of maximum
tracer activity, 1 = 50% - 75% of maximum tracer activity, 2 = 25% - 50% of maximum tracer activity, 3 =
≤25% of maximum tracer activity), using a similar 17-segment model as described above11.
LV volumes were calculated from the gated short-axis images using previously validated and commercially
available automated software (quantitative gated SPECT, QGS, Cedars-Sinai Medical Center, Los Angeles,
California)12. After segmentation of the LV, endo- and epicardial surfaces are estimated and displayed,
the LV end-systolic and end-diastolic volumes are calculated and the LVEF can be derived. Regional wall
motion was evaluated using the same 17-segment model and three-point scale as described for MSCT.
Invasive coronary angiography
Conventional coronary angiography was performed according to the standard techniques. To obtain
vascular access the femoral approach with the Seldinger technique was used. An experienced observer
blinded to the MSCT data performed visual evaluation of the coronary angiograms. Coronary arteries
were divided in 17 segments according to the guidelines of the American Heart Association/American
College of Cardiology 7. Consequently, the segments with a diameter ≥2.0 mm were evaluated for the
presence of significant narrowing (defined as ≥50% decrease in luminal diameter). In case of previous
bypass surgery and patent bypass grafts, only segments distal to the anastomosis were evaluated.
Statistical analysis
Sensitivity, specificity, positive and negative predictive values were calculated to detect significant
coronary artery stenoses (≥50% decrease in luminal diameter) on MSCT using invasive angiography
as the gold standard. Pearson’s correlation coefficient r was calculated for the linear regression
analysis of the LVEFs (MSCT versus gated SPECT). Bland-Altman analysis was performed for each pair
of values of LVEF to calculate the limits of agreement and systematic error between the 2 modalities
(MSCT versus gated SPECT) 13. A P value <0.05 was considered statistically significant.
A 3 x 3 table using weighted κ statistics was applied to express the agreement for regional wall
motion between MSCT and gated SPECT. A κ value of < 0.4 represents poor agreement, a κ value
between 0.4 and 0.75 fair to good agreement and a κ >0.75 states excellent agreement 14.
Results
MSCT was performed successfully in all 21 patients. The study population consisted of 20 men and 1 wom-
an, with a mean age of 61 ± 13 years. A total of 17 (81%) patients used beta-blocking agents, no additional
beta-blockade was administered prior to MSCT imaging. The mean heart rate was 64 ± 9 bpm, range 51 to

333Comprehensive Cardiac Assessment with MSCT
78 bpm, duration of breath hold was approximately 20 seconds, and success rate of obtaining adequate
breath hold was 100%. Clinical characteristics of the study population are summarized in Table 1.
Non-invasive coronary angiography by MSCTConventional, invasive coronary angiography was performed in 20 patients. In these patients, a
total of 241 segments were available for evaluation. Of these segments, 236 (98%) were of sufficient
image quality on MSCT to assess the presence/absence of significant stenoses. During conventional
coronary angiography, significant stenoses were observed in 46 segments, with 42 (91%) correctly
identified on MSCT. In 185 of 190 (97%) segments, MSCT correctly ruled out the presence of
significant stenoses. Accordingly, the sensitivity and specificity were 91% and 97% respectively.
In Table 2, the diagnostic accuracy of MSCT is summarized (for segments, vessels and patients).
An example of MSCT coronary angiography and the corresponding conventional angiography is
provided in Figure 1.
Table 1. Clinical characteristics of the study population (n=21).
n (%)Age (yrs)MenPrevious infarctionLocation Anterior Inferior BothQ wave on electrocardiogramPrevious CABGMulti-vessel CADAngina pectoris CCS class I/II CCS class III/IVHeart failure NYHA class I/II NYHA class III/IV
61 ± 13 20 (95%)21 (100%)
10 (48%) 10 (48%) 1 (4%) 13 (62%) 8 (38%) 13 (62%)
10 (48%) 11 (52%)
17 (81%) 4 (19%)
CAD: coronary artery disease; CCS: Canadian Cardiovascular Society; NYHA: New York Heart Association.
Table 2. Diagnostic accuracy of MSCT for the detection of significant (≥50% luminal narrowing) stenoses.
Segment-based Vessel-based Patient-based
Evaluable (%) 98 (236/241) 99 (76/77)* 100 (20/20)Sensitivity (%) 91 (42/46) 92 (23/25) 92 (12/13)Specificity (%) 97 (185/190) 96 (49/51) 86 (6/7)PPV (%) 89 (42/47) 92 (23/25) 92 (12/13)NPV (%) 98 (185/189) 96 (49/51) 86 (6/7)
Data are percentages (segments).* in 1 patient the LCx was uninterpretable due to its small size, whereas in 3 patients both the LAD and LCx were supplied by patent grafts. In these patients, the LM was not evaluated. NPV: negative predictive value; PPV: positive predictive value.

334 Chapter 22
LV function: MSCT versus gated SPECT
The average LVEF was 53 ± 12% (range 27% to 72%) on gated SPECT, as compared to 49 ± 13% (range
24% to 72%) on MSCT. An excellent correlation was demonstrated using linear regression analysis (r
= 0.85, P<0.0001) (Figure 2A). Bland-Altman analysis (Figure 2B) showed a mean difference of 3.3 ±
13.6%, which was not statistically different from zero.
On resting gated SPECT, regional wall motion abnormalities were detected in 75 (21%) of 357 segments,
with 40 (53%) showing hypokinesia and 35 (47%) a- or dyskinesia. In 69 (92%) of the dysfunctional
segments, decreased systolic wall motion was also observed on the MSCT images (Table 3). An
excellent agreement was shown between the 2 techniques, with 92% of segments scored identically
on both modalities (κ statistics 0.77). Agreements for the individual gradings (1 to 3) were 96%, 75%,
and 74%, respectively. An example of decreased wall motion on MSCT is provided in Figure 3.
y = 0.88x + 3.27R = 0.85, P<0.0001
0
20
40
60
80
0 20 40 60 80
LVEF SPECT (%)
LV
EF
MS
CT
(%
)
A
-15
-10
-5
0
5
10
15
20
20 30 40 50 60 70 80
Mean LVEF SPECT - MSCT (%)
Dif
fere
nce
in
LV
EF
SP
EC
T -
MS
CT
(%
)
B
Figure 2. (A) Linear regression plot shows correlation between left ventricular ejection fraction (LVEF) as mea-sured by SPECT and MSCT (CT). (B) Bland-Altman plot of LVEF shows the difference between each pair plotted against the average value of the same pair, i.e. mean value of differences (solid line) and mean value of differ-ences ± 2 SDs (dotted lines).

335Comprehensive Cardiac Assessment with MSCT
Resting perfusion: MSCT versus SPECT
On the resting SPECT images, reduced tracer uptake was observed in 73 (20%) of 357 segments. Of
these 73 segments, perfusion defects were detected on MSCT in 68 (93%) segments. In 277 of 284
(98%) segments with normal perfusion on SPECT, no perfusion defects were observed on MSCT as
well. The degree of transmurality of the perfusion defects on MSCT paralleled the relative reduction
in tracer activity on SPECT. An example of a large perfusion defect on MSCT is provided in Figure 4.
Discussion
The evaluation of patients with previous infarction is extensive and different imaging modalities are
needed to provide the necessary information. For efficient patient management, a comprehensive
non-invasive cardiac examination would be ideal. The current study was designed to evaluate the
possibility to derive additional information on LV function and perfusion from cardiac MSCT, apart
from the information on coronary arteries.
Conventional coronary angiography is considered the diagnostic standard for determining the
presence of coronary artery stenoses and MSCT has recently been demonstrated to assess coronary
artery stenoses with high accuracy 1-5. The current findings demonstrate that non-invasive coronary
angiography with MSCT also in patients with previous myocardial infarction has a high sensitivity
and specificity (91% and 97% respectively) for the detection of coronary artery stenoses, in line
with previous observations in patients with known or suspected coronary artery disease 1-5. Other
parameters can also be obtained using the same data set as used for evaluation of the coronary
arteries, including LV function and perfusion. In particular LVEF is an important prognostic parameter
after myocardial infarction 15. The current results demonstrated an excellent agreement between
MSCT and gated SPECT for the assessment of LVEF. Previous studies have shown similar results with
other imaging modalities, including magnetic resonance imaging (MRI) and 2D echo, although these
studies were not specifically evaluating a selected study population after myocardial infarction, and
mainly focusing on patients with relatively preserved LVEF 1;16-18.
Table 3. Agreement between assessment of regional wall motion on MSCT as compared to resting gated SPECT (agreement 92%, kappa 0.77).
MSCT
SPECT 1 2 3 Total
1 271 10 1 282
2 6 30 4 40
3 0 9 26 35
Total 277 49 31 357
1= normokinesia, 2=hypokinesia, 3= akinesia or dyskinesia.

336 Chapter 22
Besides assessment of global LV function, MSCT can also be used to evaluate regional wall motion.
A good agreement between MSCT and gated SPECT (κ statistics 0.77) was observed in the present
study. No direct comparisons between gated SPECT and MSCT for assessment of regional wall motion
have been reported, but Mahnken et al. reported a good agreement for assessment of regional wall
motion between 16-slice MSCT and MRI (κ statistics 0.79) 16.
Finally, MSCT was used in the present study to assess resting perfusion. The results demonstrated
that MSCT detected perfusion defects correctly in 93% of the segments with a perfusion defect on
SPECT imaging. On the other hand, MSCT did not detect any perfusion abnormalities in 98% of the
segments with normal perfusion on SPECT. In addition, the extent of transmurality of the perfusion
defects on MSCT corresponded to the relative reduction in tracer activity as assessed on SPECT. Most
segments with ≥75% tracer activity had no or minimal perfusion abnormalities on MSCT, whereas
segments with ≤25% tracer activity had predominantly extensive, transmural perfusion defects
on MSCT. Minimal information on assessment of perfusion with MSCT is currently available. Two
recent studies have focused on assessment of perfusion defects (indicating scar tissue) with MSCT in
comparison to MRI. Nikolaou et al. compared 16-slice MSCT with MRI for assessment of myocardial
infarction, and reported a sensitivity and specificity of 91% and 79% respectively 19. In the second
study, both early-phase MSCT as well as late-enhancement MSCT were performed and compared to
MRI for the evaluation of perfusion defects and infarct size in 28 patients with reperfused myocardial
infarction 20. A good agreement between MRI and MSCT for the detection of scar tissue was
demonstrated. MRI is currently regarded as gold standard for the assessment of LV function, while
scar tissue due to myocardial infarction can be evaluated by delayed enhancement on MRI as well. A
major advantage of this technique is the lack of radiation exposure.
Several limitations of the present study need attention. The study population was relatively small,
and larger studies are needed to confirm the current observations. A drawback of MSCT remains the
Figure 3. Example of wall motion analysis with MSCT of a patient with an inferior myocardial infarction. Short-axis images in end-diastole (A) and end-systole (B) show reduced wall thickening (black arrow) in the inferior wall.

337Comprehensive Cardiac Assessment with MSCT
radiation dose (8 to 10 mSv in this study, which is higher as compared to a conventional diagnostic
angiography) and future developments are needed to reduce radiation. Furthermore, most MSCT
parameters were evaluated qualitatively, and software allowing quantitative analysis needs to be
developed. In addition, MSCT at present only provides information on resting perfusion. Additional
imaging during stress conditions would allow assessment of stress perfusion and the combination
of the stress and rest images would potentially allow detection of ischemia and scar tissue. However,
in view of the radiation burden, such a protocol may currently not be feasible for routine clinical
practice.
In conclusion, the findings in the present study demonstrate the feasibility of integrated assessment
of coronary anatomy, regional and global LV function and perfusion with MSCT in patients with
previous infarction. Agreement with invasive coronary angiography and gated SPECT (for assessment
of function and perfusion) was excellent. In patients with previous infarction, non-invasive evaluation
of the coronary arteries can be performed for the detection or exclusion of possible new significant
stenoses. In patients with previous bypass surgery, non-invasive evaluation with MSCT can provide
information of the patency of the grafts. The additional data on LV function as well as extent of
(possibly) infarcted myocardium can be taken into account in the risk stratification in these patients;
this concept needs further testing in future studies.
Figure 4. Example of a large perfusion defect on SPECT and MSCT of the patient depicted in Figure 3.(A) SPECT short-axis image showing a perfusion defect in the inferior wall (white arrow) at rest, (B) corresponding MSCT short-axis image in end-diastole, revealing a hypoenhanced area (black arrow) in the inferior wall, indicat-ing a perfusion defect.

338 Chapter 22
References1. Schuijf JD, Bax JJ, Salm LP, Jukema JW, Lamb HJ, van der Wall EE, de Roos A. Noninvasive coronary im-
aging and assessment of left ventricular function using 16-slice computed tomography. Am J Cardiol. 2005;95:571-574.
2. Achenbach S, Giesler T, Ropers D, Ulzheimer S, Derlien H, Schulte C, Wenkel E, Moshage W, Bautz W, Daniel WG, Kalender WA, Baum U. Detection of coronary artery stenoses by contrast-enhanced, retrospectively electrocardiographically-gated, multislice spiral computed tomography. Circulation. 2001;103:2535-2538.
3. Nieman K, Rensing BJ, van Geuns RJ, Vos J, Pattynama PM, Krestin GP, Serruys PW, de Feyter PJ. Non-in-vasive coronary angiography with multislice spiral computed tomography: impact of heart rate. Heart. 2002;88:470-474.
4. Nieman K, Cademartiri F, Lemos PA, Raaijmakers R, Pattynama PM, de Feyter PJ. Reliable noninvasive coronary angiography with fast submillimeter multislice spiral computed tomography. Circulation. 2002;106:2051-2054.
5. Nieman K, Pattynama PM, Rensing BJ, van Geuns RJ, de Feyter PJ. Evaluation of patients after coro-nary artery bypass surgery: CT angiographic assessment of grafts and coronary arteries. Radiology. 2003;229:749-756.
6. Schuijf JD, Bax JJ, Jukema JW, Lamb HJ, Vliegen HW, Salm LP, de Roos A, van der Wall EE. Noninvasive angiography and assessment of left ventricular function using multislice computed tomography in patients with type 2 diabetes. Diabetes Care. 2004;27:2905-2910.
7. Austen WG, Edwards JE, Frye RL, Gensini GG, Gott VL, Griffith LS, McGoon DC, Murphy ML, Roe BB. A reporting system on patients evaluated for coronary artery disease. Report of the Ad Hoc Committee for Grading of Coronary Artery Disease, Council on Cardiovascular Surgery, American Heart Associa-tion. Circulation. 1975;51:5-40.
8. Cerqueira MD, Weissman NJ, Dilsizian V, Jacobs AK, Kaul S, Laskey WK, Pennell DJ, Rumberger JA, Ryan T, Verani MS. Standardized myocardial segmentation and nomenclature for tomographic imaging of the heart: a statement for healthcare professionals from the Cardiac Imaging Committee of the Council on Clinical Cardiology of the American Heart Association. Circulation. 2002;105:539-542.
9. Pace L, Cuocolo A, Marzullo P, Nicolai E, Gimelli A, De Luca N, Ricciardelli B, Salvatore M. Reverse redis-tribution in resting thallium-201 myocardial scintigraphy in chronic coronary artery disease: an index of myocardial viability. J Nucl Med. 1995;36:1968-1973.
10. Wu E, Judd RM, Vargas JD, Klocke FJ, Bonow RO, Kim RJ. Visualisation of presence, location, and trans-mural extent of healed Q-wave and non-Q-wave myocardial infarction. Lancet. 2001;357:21-28.
11. Schinkel AF, Bax JJ, Sozzi FB, Boersma E, Valkema R, Elhendy A, Roelandt JR, Poldermans D. Prevalence of myocardial viability assessed by single photon emission computed tomography in patients with chronic ischaemic left ventricular dysfunction. Heart. 2002;88:125-130.
12. Germano G, Kiat H, Kavanagh PB, Moriel M, Mazzanti M, Su HT, Van Train KF, Berman DS. Automatic quantification of ejection fraction from gated myocardial perfusion SPECT. J Nucl Med. 1995;36:2138-2147.
13. Bland JM, Altman DG. Statistical methods for assessing agreement between two methods of clinical measurement. Lancet. 1986;1:307-310.
14. Fleiss JL. Statistical Methods for Rates and Proportions. 2nd ed. 1981. New York, Wiley. 15. White HD, Norris RM, Brown MA, Brandt PW, Whitlock RM, Wild CJ. Left ventricular end-systolic volume as
the major determinant of survival after recovery from myocardial infarction. Circulation. 1987;76:44-51.16. Mahnken AH, Koos R, Katoh M, Spuentrup E, Busch P, Wildberger JE, Kuhl HP, Gunther RW. Sixteen-slice
spiral CT versus MR imaging for the assessment of left ventricular function in acute myocardial infarc-tion. Eur Radiol. 2005;15:714-720.
17. Juergens KU, Grude M, Maintz D, Fallenberg EM, Wichter T, Heindel W, Fischbach R. Multi-detector row CT of left ventricular function with dedicated analysis software versus MR imaging: initial experience. Radiology. 2004;230:403-410.
18. Yamamuro M, Tadamura E, Kubo S, Toyoda H, Nishina T, Ohba M, Hosokawa R, Kimura T, Tamaki N, Komeda M, Kita T, Konishi J. Cardiac functional analysis with multi-detector row CT and segmental reconstruction algorithm: comparison with echocardiography, SPECT, and MR imaging. Radiology. 2005;234:381-390.

339Comprehensive Cardiac Assessment with MSCT
19. Nikolaou K, Sanz J, Poon M, Wintersperger BJ, Ohnesorge B, Rius T, Fayad ZA, Reiser MF, Becker CR. Assessment of myocardial perfusion and viability from routine contrast-enhanced 16-detector-row computed tomography of the heart: preliminary results. Eur Radiol. 2005;15:864-871.
20. Mahnken AH, Koos R, Katoh M, Wildberger JE, Spuentrup E, Buecker A, Gunther RW, Kuhl HP. As-sessment of myocardial viability in reperfused acute myocardial infarction using 16-slice computed tomography in comparison to magnetic resonance imaging. J Am Coll Cardiol. 2005;45:2042-2047.


Assessment of Left Ventricular Volumes and
Ejection Fraction with 16-slice Multi-Slice
Computed Tomography; Comparison with
2D-Echocardiography
Int J Cardiol 2006; 13: 480-487
Joanne D. Schuijf Jeroen J. Bax, J. Wouter Jukema, Hildo J. Lamb, Liesbeth P. Salm, Albert de Roos, Ernst E. van der Wall
23Chapter

Abstract
Background
In recent years, Multi-Slice Computed Tomography (MSCT) has emerged as a rapidly expanding
modality for non-invasive assessment of coronary artery disease. Simultaneously, left
ventricular (LV) function can be evaluated although this is not yet a routine component of an
MSCT examination. Accordingly, the purpose of the present study was to validate assessment
of LV function with MSCT using 2D-echocardiography in a large cohort of patients.
Methods
In 70 patients (57 male, 13 female), 16-slice MSCT was performed (Toshiba Aquilion 16,
Japan) followed by retrospective analysis of global LV function. For these measurements 2D-
echocardiography served as the standard of reference.
Results
For LV volumes, excellent correlations for both end-diastolic volume (EDV) (r=0.97) and end-
systolic volume (ESV) (r=0.98) were obtained by linear regression analysis. At Bland-Altman
analysis, mean differences (± standard deviations) of -1.4 ml ± 11.3 ml and -3.0 ml ± 7.7 ml were
observed between MSCT and 2D-echocardiography for LV EDV and LV ESV respectively. As a
result, LV EF was slightly overestimated with MSCT (1.7% ± 4.9%, P<0.05). Correlation between
the two techniques was excellent (r= 0.91).
Conclusion
In a large cohort of patients, an excellent correlation was observed between 16-slice MSCT
and 2D-echocardiography in the evaluation of LV volumes and EF. The addition of LV function
analysis to the anatomical MSCT data may potentially enhance the diagnostic value of the
technique.

343Assessment of Left Ventricular Volumes and Ejection Fraction
Introduction
Recently, MSCT has emerged as a rapidly progressing and expanding modality for non-invasive
assessment of coronary anatomy. Pooled analysis of recent studies, using 16-slice technology, has
shown an average sensitivity and specificity of 88% and 96% in the detection of significant coronary
artery stenoses 1. Accordingly, the expectation is that the technique will become increasingly used
as an alternative modality to evaluate the presence of coronary artery disease in patients presenting
with chest pain and having risk factors for coronary artery disease. In these patient populations,
additional assessment of cardiac function is often desired for prognostic purposes 2. Generally, this
implies an additional examination with Magnetic Resonance Imaging (MRI), or more frequently,
echocardiography. MRI is currently the gold standard in the assessment of left ventricular (LV)
volumes and ejection fractions (EF), but is a relatively costly and time-consuming technique. As a
result, the technique is not widely available for application in larger patient populations. Thus, in
daily clinical practice, 2D-echocardiography is routinely performed to assess function as it is more
widely available and associated with lower costs.
Functional parameters, however, can also be retrospectively obtained from a MSCT coronary
angiography examination since the data are acquired in a helical mode during ECG gating. As a
result, a high-resolution 3D volume set is obtained that allows retrospective reconstruction of short-
axis images during the entire cardiac cycle. Indeed, the feasibility of additional LV function analysis
during MSCT coronary angiography has been demonstrated in previous studies, comparing data
to other imaging modalities, including MRI or 2D-echocardiography 3-6. Thus far, these data have
been obtained in relatively small patient populations while using older 4-slice MSCT systems in the
majority of studies. Accordingly, the purpose of the present study was to compare 16-slice MSCT to
2D-echocardiography in a relatively large patient population.
Methods
Patients and protocol
The study group consisted of 70 patients presenting to our outpatient clinic for the evaluation of
novel or recurrent chest pain. All patients underwent an MSCT examination as part of ongoing
protocols at our institution concerning the evaluation of coronary artery disease with MSCT. For
comparison, 2D-echocardiography was performed in all patients. Exclusion criteria were: 1. atrial
fibrillation (2 patients excluded), 2. renal insufficiency (serum creatinine >120 mmol/L), 3. known
allergy to iodine contrast media (1 patient excluded), 4. severe claustrophobia, and 5. pregnancy.
All patients gave written informed consent to the study protocol, which was approved by the local
ethics committee.

344 Chapter 23
MSCT; Data acquisition
MSCT was performed using a Toshiba Multi-Slice Aquilion 16 system (Toshiba Medical Systems, Tokyo,
Japan) with a collimation of 16 x 0.5 mm. Rotation time was 0.4s or 0.5s, depending on the heart rate,
while the tube current was 250 mA, at 120 kV. Non-ionic contrast material was administered in the
antecubital vein with an amount of 120-150 ml, depending on the total scan time and a flow rate of
4.0 ml/sec (Xenetix 300®, Guerbet, Aulnay S. Bois, France). Automated peak enhancement detection
in the aortic root was used for timing of the scan. In all patients, the heart was imaged from the aortic
root to the cardiac apex during inspiratory breath hold preceded by mild hyperventilation. During
the examination, the ECG was recorded simultaneously for retrospective gating of the data.
MSCT; Data analysis
For the evaluation of LV function, data sets were reconstructed in the short-axis orientation at
20 different time points and subsequently transferred to a dedicated cardiac analysis program
Figure 1. Example of 16-slice MSCT short-axis reconstructions in end-diastole and end-systole to assess global LV function. In Figure 1A, an example is provided of a patient with a normal LV EF of 67%. In all LV wall segments, normal contractility can be observed. In Figure 1B, a patient with a decreased LV EF of 26% is shown. In both the anterior region (arrowhead) as well as inferolateral (arrow) reduced wall motion and thickening is present.Abbreviations: ED: end-diastole, ES: end-systole

345Assessment of Left Ventricular Volumes and Ejection Fraction
(MR Analytical Software System [MASS], Medis, Leiden, the Netherlands) running on a remote
workstation. On the short-axis cine images, endocardial contours were outlined from the base to
the apex manually by an independent observer in both end-diastole and end-systole. Papillary
muscles were regarded as being part of the ventricular cavity. LV end-systolic (ESV) and end-diastolic
volumes (EDV) were calculated using commercially available software (CT-MASS, Medis, Leiden, The
Netherlands) by summation of the product (area x slice distance) of all included slices. Finally, the
related LV EF was derived by subtracting the end-systolic volume from the volume at end-diastole
and dividing the result by the end-diastolic volume.
2D-echocardiography
2D-echocardiography was performed in the left lateral decubitus position using a Vingmed System
FiVe/Vivid-7 (General Electric-Vingmed, Milwaukee, WI, USA). Images were acquired using a 3.5 MHz
transducer at a depth of 16 cm in the parasternal and apical 2-, 4- and 5-chamber views. LV volumes
and EFs were calculated by an independent observer without knowledge of the MSCT data from
the 2- and 4-chamber images using the biplane Simpson’s rule and commercially available software
(Echopac 6.1, General Electric-Vingmed) 7-9.
Statistical analysis
Continuous data are expressed as mean ± standard deviations (SD). Agreement for global LV function
(EDV, ESV, EF) was determined by Pearson’s correlation coefficient for linear regression and Bland-
Altman analysis 10. The 95% limits of agreement were defined as the range of values ± 2SD from the
mean difference. The statistical significance of the mean difference between the different modalities
was tested by Student’s t test for paired samples. A p-value <0.05 was considered to be significant.
Results
Patient characteristics
A total of 70 patients (57 male, 13 female) with an average age of 66 ± 11 years was included in the
study and underwent MSCT as well as 2D-echocardiography without complications. Average heart
rate during the MSCT studies was 66 ± 11 beats per minute, ranging between 41 beats per minute
to 98 beats per minute. No additional beta-blocking medication was administered prior to MSCT
imaging. Previous percutaneous transluminal coronary angioplasty was performed in 32 (46%)
patients, whereas 24 (34%) patients had undergone previous coronary bypass grafting. Previous
myocardial infarction was present in 31 (44%) patients (anterior wall infarction; n=15, inferior wall
infarction; n=16). Examples of short-axis reconstructions of patients with respectively normal and
decreased LV EF are provided in Figure 1.

346 Chapter 23
LV Volumes and EF
Time to reconstruct the required phases and to calculate LV volumes and EF was approximately
10 to 15 minutes. Mean values of all variables are provided in Table 1. Excellent correlations were
demonstrated by linear regression analysis for both LV EDV and ESV, respectively r=0.97 and r=0.98
(Figures 2A and 3A). At Bland-Altman analysis (Figures 2B and 3B) both parameters were shown to be
slightly underestimated with MSCT with mean differences (and limits of agreement) of respectively
-1.4 ml (-24 ml to 21 ml, P>0.05) and -3.0 ml (-18.5 ml to 12.4 ml, P<0.05). For LV EF a slightly lower
correlation of 0.91 was observed between the two modalities (Figure 4A) with a small but significant
overestimation of LV EF by MSCT (1.7% and -8.0% to 11.5%, P<0.05) (Figure 4B).
In addition, intra- and interobserver variability were evaluated and resulted in a mean difference of
-0.13% ± 2.4% and 1.1% ± 1.9% for LV EF, respectively. Intraobserver variabilities for LV EDV and LV
ESV were respectively 0.82 ml ± 7.7 ml and -0.53 ml ± 7.6 ml, whereas mean interobserver differences
for LV EDV and LV ESV were -1.23 ml ± 6.0 ml and -1.77 ml ± 4.9 ml, respectively.
Discussion
In patients with coronary artery disease, LV chamber volumes and EF are independent and
important predictors of morbidity and mortality 2;11. Accordingly, information of LV function is
frequently required in these populations to determine further clinical management. In recent
years, MSCT has emerged as a rapidly expanding imaging modality that allows the acquisition of
high-resolution, 3D imaging of the entire heart and coronary arteries within a single breath hold 12.
Simultaneously, the technique can also be used to assess cardiac chamber anatomy and function 3-
6.Thus, in a single examination of approximately 15 minutes, information of coronary anatomy and
LV function is obtained. However, data thus far have been obtained in limited patient populations
and validations in larger populations have not been performed yet.
In the present study, global LV function analysis was performed using 16-slice MSCT in 70 patients
Table 1. Comparison of MSCT to 2D-echocardiography in 70 patients.
Parameter Mean MSCT Mean 2D echo Mean DifferencePearson
(r)t Test
(P-value)
EDV (ml)151.5 ± 40.1(70.6, 251.3)
152.9 ± 42.9(64, 251.0)
1.4 ± 11.3 0.97 >0.05
ESV (ml)74.8 ± 35.2
(22.9, 172.0)77.9 ± 35.6(21.0,183.0)
3.0 ± 7.7 0.98 <0.05
EF (%)52.2 ± 11.7 (20.5, 73.5)
50.5 ±12.0(19.7, 79.6)
-1.7 ± 4.9 0.91 <0.05
Data are mean values ± standard deviation (minimum value, maximum value).Abbreviations: EDV: end-diastolic volume, EF: ejection fraction, ESV: end-systolic volume, MSCT: multi-slice computed tomography.

347Assessment of Left Ventricular Volumes and Ejection Fraction
A
-50
-25
0
25
50
0 50 100 150 200 250 300
Average LV EDV MSCT- 2D ECHO (ml)
Dif
fere
nc
e M
SC
T-2
D E
CH
O
LV
ED
V (
ml) y = 0.90x + 13.6
r = 0.97, P<0.01
0
50
100
150
200
250
300
0 50 100 150 200 250 300
LV EDV 2D ECHO (ml)
LV
ED
V M
SC
T (
ml)
B
Figure 2. Linear regression (a) and Bland-Altman (b) plots in the comparison of MSCT and 2D-echocardiography in the assessment of LV EDV. In the Bland-Altman plot, the difference between each pair is plotted against the aver-age value of the same pair (solid line, mean value of differences; dotted lines, mean value of differences ±2 SD).Abbreviations: EDV: end-diastolic volume, LV: left ventricular, MSCT: multi-slice computed tomography.
A B
-50
-25
0
25
50
0 50 100 150 200
Average LV ESV MSCT- 2D ECHO (ml)
Diff
eren
ce M
SC
T-2
D E
CH
O
LV
ES
V (m
l)
y = 0.96x - 0.21r = 0.98
0
50
100
150
200
0 50 100 150 200
LV ESV 2D ECHO (ml)
LV
ES
V M
SC
T (m
l)
Figure 3. Linear regression (a) and Bland-Altman (b) plots in the comparison of MSCT and 2D-echocardiography in the assessment of LV ESV. In the Bland-Altman plot, the difference between each pair is plotted against the average value of the same pair (solid line, mean value of differences; dotted lines, mean value of differences ±2 SD).Abbreviations: ESV: end-systolic volume, LV: left ventricular, MSCT: multi-slice computed tomography.
-15
-10
-5
0
5
10
15
0 20 40 60 80
Average LVEF MSCT- 2D ECHO (%)
Diff
eren
ce M
SC
T-2
D E
CH
O
LV
EF
(%)
y = 0.90x + 7.0r = 0.91; P<0.01
0
20
40
60
80
100
0 20 40 60 80 100
LV EF 2D ECHO (%)
LV
EF
MS
CT
(%)
A B
Figure 4. Linear regression (a) and Bland-Altman (b) plots in the comparison of MSCT and 2D-echocardiography in the assessment of LV EF. In the Bland-Altman plot, the difference between each pair is plotted against the average value of the same pair (solid line, mean value of differences; dotted lines, mean value of differences ±2 SD).Abbreviations: EF: ejection fraction, LV: left ventricular, MSCT: multi-slice computed tomography.

348 Chapter 23
and compared to 2D-echocardiography. Excellent correlations, r=0.97 and r=0.98 respectively, were
observed between MSCT and 2D-echocardiography in the assessment of LV EDV and ESV. For both
variables a small underestimation (<5 ml) with MSCT as compared to 2D-echocardiography was
observed, which was significant for LV ESV. As a result, LV EF was slightly overestimated by MSCT
with an average of 1.7 ± 4.9%. Correlation between the two modalities in the assessment of LV EF
was still excellent with an r-value of 0.91.
These findings are in line with previous observations obtained in smaller patient populations 3;13.
An initial comparison of LV EF derived from 4-slice MSCT and 2D-echocardiography in 15 patients
presenting with unstable angina was described by Dirksen et al, who observed an excellent
correlation between both modalities of 0.93 although MSCT underestimated LV EF with an
average of –1.3 ± 4.5% 3. More recently, results of LV functional analysis with 16-slice MSCT and 2D-
echocardiography in 19 patients has been published, demonstrating excellent correlations between
the two techniques 13. In line with our study, a small overestimation of LV EF of 2.9% on average was
observed. Thus far, two studies have reported on comparisons of LV function parameters between
multiple modalities including MSCT (8- and 16-slice) 5;14. In both studies, performed in 41 and 24
patients respectively, a closer agreement was observed between MSCT and MRI than between
2D-echocardiography and MSCT, suggesting that MSCT may actually be more accurate than 2D-
echocardiography. Indeed, particularly in patients with coronary artery disease, the 3D approach
of MSCT is likely to provide superior measurements as compared to echocardiography, since the
geometrical assumptions that are needed with the latter may frequently result in significant errors in
volumetric calculations. On the other hand, the accuracy of MRI is not likely to be surpassed by MSCT
in the near future, as temporal resolution of the former remains at present superior.
In addition, reproducibility of the LV measurements was evaluated in the present study, and
excellent agreement was observed, with a mean difference of -0.13% ± 2.4% and 1.1% ± 1.9% for LV
EF (intra- and interobserver variability respectively). Accordingly, LV measurements obtained with
MSCT appear to be highly reproducible.
Limitations
Several limitations need to be acknowledged. A disadvantage of MSCT in general is the radiation
exposure of 9 to 15 mSv during a single examination. Preferably, functional testing should be
repeated during stress conditions to detect early ischemia and thus further enhance risk stratification.
However, as such a protocol with MSCT would imply a second radiation dose and contrast material
delivery, repeated imaging remains at least at present undesirable. Moreover, with regard to the
radiation dose, use of the technique solely for the purpose of functional analysis cannot be not
justified. Post-processing time, including the drawing of endocardial contours, is still relatively time-
consuming for LV function analysis. Future improvements in image quality, as expected with the
recently introduced 64-slice systems, would allow considerable reduction in post-processing time
by enabling more accurate and rapid automated endocardial border detection. Another limitation
of the present study is the fact that functional parameters were compared to 2D-echocardiography

349Assessment of Left Ventricular Volumes and Ejection Fraction
rather than the current gold standard for volumetric measurement, MRI. In daily clinical practice
however, LV function is most commonly assessed by means of 2D-echocardiography as it a widely
available technique associated with relatively low costs. Finally, as the indications for performing
MSCT, and thus the precise patient populations that may potentially benefit from this technique, are
still under definition, the precise incremental value additional LV EF calculation would provide is also
at present unclear.
Conclusion
The present study confirms that reliable assessment of LV volumes and EF is possible with MSCT. As
recent years have witnessed a rapid and continuous advancement of the technique, it is anticipated
that MSCT will increasingly be used for routine evaluation of CAD in certain subsets of patients
prior to more invasive investigations. The addition of LV functional parameters to the angiographic
information would entail the addition of a frequently needed prognostic marker to the examination,
thereby potentially enhancing the diagnostic value of an MSCT investigation.

350 Chapter 23
References1. Schuijf JD, Bax JJ, Shaw LJ, de Roos A, Lamb HJ, van der Wall EE, Wijns W. Meta-analysis of comparative
diagnostic performance of magnetic resonance imaging and multislice computed tomography for non-invasive coronary angiography. Am Heart J. 2006;151:404-411.
2. White HD, Norris RM, Brown MA, Brandt PW, Whitlock RM, Wild CJ. Left ventricular end-systolic volume as the major determinant of survival after recovery from myocardial infarction. Circulation. 1987;76:44-51.
3. Dirksen MS, Bax JJ, de Roos A, Jukema JW, van der Geest RJ, Geleijns K, Boersma E, van der Wall EE, Lamb HJ. Usefulness of dynamic multislice computed tomography of left ventricular function in unstable an-gina pectoris and comparison with echocardiography. Am J Cardiol. 2002;90:1157-1160.
4. Grude M, Juergens KU, Wichter T, Paul M, Fallenberg EM, Muller JG, Heindel W, Breithardt G, Fischbach R. Evaluation of global left ventricular myocardial function with electrocardiogram-gated multidetector computed tomography: comparison with magnetic resonance imaging. Invest Radiol. 2003;38:653-661.
5. Heuschmid M, Rothfuss JK, Schroeder S, Fenchel M, Stauder N, Burgstahler C, Franow A, Kuzo RS, Kue-ttner A, Miller S, Claussen CD, Kopp AF. Assessment of left ventricular myocardial function using 16-slice multidetector-row computed tomography: comparison with magnetic resonance imaging and echo-cardiography. Eur Radiol. 2005;1-9.
6. Juergens KU, Grude M, Maintz D, Fallenberg EM, Wichter T, Heindel W, Fischbach R. Multi-detector row CT of left ventricular function with dedicated analysis software versus MR imaging: initial experience. Radiology. 2004;230:403-410.
7. Schiller NB, Acquatella H, Ports TA, Drew D, Goerke J, Ringertz H, Silverman NH, Brundage B, Botvinick EH, Boswell R, Carlsson E, Parmley WW. Left ventricular volume from paired biplane two-dimensional echocardiography. Circulation. 1979;60:547-555.
8. Gordon EP, Schnittger I, Fitzgerald PJ, Williams P, Popp RL. Reproducibility of left ventricular volumes by two-dimensional echocardiography. J Am Coll Cardiol. 1983;2:506-513.
9. Otterstad JE, Froeland G, St John SM, Holme I. Accuracy and reproducibility of biplane two-dimensional echocardiographic measurements of left ventricular dimensions and function. Eur Heart J. 1997;18:507-513.
10. Bland JM, Altman DG. Statistical methods for assessing agreement between two methods of clinical measurement. Lancet. 1986;1:307-310.
11. White HD, Norris RM, Brown MA, Takayama M, Maslowski A, Bass NM, Ormiston JA, Whitlock T. Effect of intravenous streptokinase on left ventricular function and early survival after acute myocardial infarc-tion. N Engl J Med. 1987;317:850-855.
12. Mollet NR, Cademartiri F, Krestin GP, McFadden EP, Arampatzis CA, Serruys PW, de Feyter PJ. Improved diagnostic accuracy with 16-row multi-slice computed tomography coronary angiography. J Am Coll Cardiol. 2005;45:128-132.
13. Kim TH, Hur J, Kim SJ, Kim HS, Choi BW, Choe KO, Yoon YW, Kwon HM. Two-phase reconstruction for the assessment of left ventricular volume and function using retrospective ECG-gated MDCT: comparison with echocardiography. AJR Am J Roentgenol. 2005;185:319-325.
14. Yamamuro M, Tadamura E, Kubo S, Toyoda H, Nishina T, Ohba M, Hosokawa R, Kimura T, Tamaki N, Kome-da M, Kita T, Konishi J. Cardiac functional analysis with multi-detector row CT and segmental reconstruc-tion algorithm: comparison with echocardiography, SPECT, and MR imaging. Radiology. 2005;234:381-390.

Non-Invasive Visualization of
the Cardiac Venous System in
Coronary Artery Disease Patients using
64-slice Computed Tomography
J Am Coll Cardiol 2006; 48: 1832-1838
Nico R. Van de Veire, Joanne D. Schuijf, Johan De Sutter, Dan Devos, Gabe B. Bleeker, Albert de Roos, Ernst E. van der Wall, Martin J. Schalij,
Jeroen J. Bax
24Chapter

Abstract
Background
Cardiac resynchronization therapy (CRT) is an attractive treatment for selected heart failure
patients. Knowledge on venous anatomy may help identifying candidates for successful left
ventricular lead implantation. The purpose of the study was to evaluate the value of 64-slice
computed tomography (CT) to visualize the cardiac veins and evaluate the relation between
variations in venous anatomy and history of infarction.
Methods
The 64-slice CT of 100 individuals (age 61±11 years, 68% men) was studied. Subjects were di-
vided in 3 groups: 28 controls, 38 patients with significant coronary artery disease (CAD), 34
patients with a history of infarction. Presence of the following coronary sinus (CS) tributaries
was evaluated: posterior interventricular vein (PIV), posterior vein of the left ventricle (PVLV)
and left marginal vein (LMV). Vessel diameters were also measured.
Results
CS and PIV were identified in all individuals. PVLV was observed in 96% of controls, 84% of
CAD and 82% of infarction patients. In patients with a history of infarction, a LMV was sig-
nificantly less observed as compared to controls and CAD patients (27% versus 71% and 61%
respectively, p<0.001). None of the patients with lateral infarction and only 22% of patients
with anterior infarction had a LMV. Regarding quantitative data no significant differences were
observed between the groups.
Conclusion
Non-invasive evaluation of cardiac veins with 64-slice CT is feasible. There is considerable
variation in venous anatomy. Patients with a history of infarction were less likely to have a LMV
which may hamper optimal left ventricular lead positioning in CRT implantation.
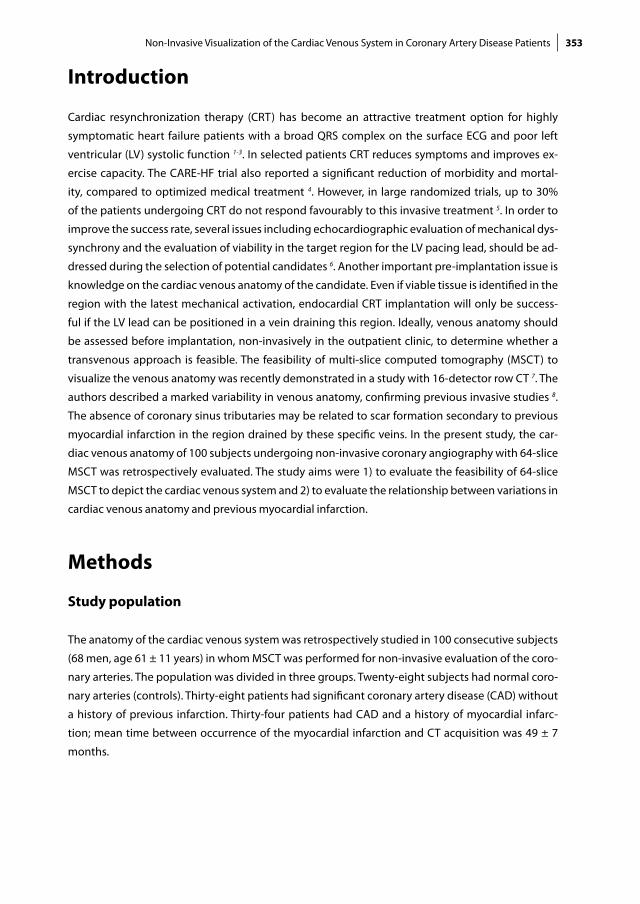
353Non-Invasive Visualization of the Cardiac Venous System in Coronary Artery Disease Patients
Introduction
Cardiac resynchronization therapy (CRT) has become an attractive treatment option for highly
symptomatic heart failure patients with a broad QRS complex on the surface ECG and poor left
ventricular (LV) systolic function 1-3. In selected patients CRT reduces symptoms and improves ex-
ercise capacity. The CARE-HF trial also reported a significant reduction of morbidity and mortal-
ity, compared to optimized medical treatment 4. However, in large randomized trials, up to 30%
of the patients undergoing CRT do not respond favourably to this invasive treatment 5. In order to
improve the success rate, several issues including echocardiographic evaluation of mechanical dys-
synchrony and the evaluation of viability in the target region for the LV pacing lead, should be ad-
dressed during the selection of potential candidates 6. Another important pre-implantation issue is
knowledge on the cardiac venous anatomy of the candidate. Even if viable tissue is identified in the
region with the latest mechanical activation, endocardial CRT implantation will only be success-
ful if the LV lead can be positioned in a vein draining this region. Ideally, venous anatomy should
be assessed before implantation, non-invasively in the outpatient clinic, to determine whether a
transvenous approach is feasible. The feasibility of multi-slice computed tomography (MSCT) to
visualize the venous anatomy was recently demonstrated in a study with 16-detector row CT 7. The
authors described a marked variability in venous anatomy, confirming previous invasive studies 8.
The absence of coronary sinus tributaries may be related to scar formation secondary to previous
myocardial infarction in the region drained by these specific veins. In the present study, the car-
diac venous anatomy of 100 subjects undergoing non-invasive coronary angiography with 64-slice
MSCT was retrospectively evaluated. The study aims were 1) to evaluate the feasibility of 64-slice
MSCT to depict the cardiac venous system and 2) to evaluate the relationship between variations in
cardiac venous anatomy and previous myocardial infarction.
Methods
Study population
The anatomy of the cardiac venous system was retrospectively studied in 100 consecutive subjects
(68 men, age 61 ± 11 years) in whom MSCT was performed for non-invasive evaluation of the coro-
nary arteries. The population was divided in three groups. Twenty-eight subjects had normal coro-
nary arteries (controls). Thirty-eight patients had significant coronary artery disease (CAD) without
a history of previous infarction. Thirty-four patients had CAD and a history of myocardial infarc-
tion; mean time between occurrence of the myocardial infarction and CT acquisition was 49 ± 7
months.

354 Chapter 24
Multi-slice computed tomography
Imaging was performed with a 64-detector row Toshiba Multislice Aquilion 64 system (Toshiba
Medical Systems, Otawara, Japan). Between 80 and 110 ml of contrast material (Iomeron 400, Bracco
Altana Pharma GmbH, Konstanz, Germany) at an injection rate of 5 ml/minute was used. Scanning
was performed using simultaneous acquisition of 64 sections with a collimated slice thickness of 0.5
mm. Rotation time ranged from 400 to 500 ms depending on heart-rate and tube voltage was 120
kV at 300 mA. A segmental reconstruction algorithm allowed inclusion of patients with a range of
heart rates without the need for pre-oxygenation or beta-blocking agents. Retrospective ECG gating
was performed to eliminate cardiac motion artefacts. Data reconstruction was performed on a Vitrea
post-processing workstation (Vital Images, Plymouth, Minnesota). During analysis, the observers
were blinded to the group assignments of the participants.
Anatomic observations
The tributaries of the cardiac venous system (Figure 1) were identified on volume-rendered recon-
structions. Thereafter, the course of the veins was evaluated in three orthogonal planes using mul-
tiplanar reformatting. The presence of the following cardiac veins was evaluated: CS, anterior inter-
ventricular vein, posterior interventricular vein (PIV), posterior vein of the left ventricle (PVLV) and
left marginal vein (LMV). The number of side branches of these tributaries was also evaluated.
Figure 1. Volume-rendered re-construction of the heart, postero-lateral view. The first tributary of the coronary sinus (CS) is the pos-terior interventricular vein (PIV), running in the posterior interven-tricular groove. The second tribu-tary of the CS is the posterior vein of the left ventricle (PVLV) with several side branches (asterix). The next tributary is the left marginal vein (LMV). The great cardiac vein (GCV) will then continue as ante-rior cardiac vein in the anterior interventricular groove. Also note the circumflex coronary artery (CX) and right coronary artery (RCA).
Quantitative data
The ostium of the CS was defined as the site where the CS makes an angle with the right atrium in
the crux cordis area. Multiplanar reformatting was used to determine the size of the ostium in two
directions (Figure 2). The diameters of the proximal parts of the PIV, PVLV and LMV were measured.
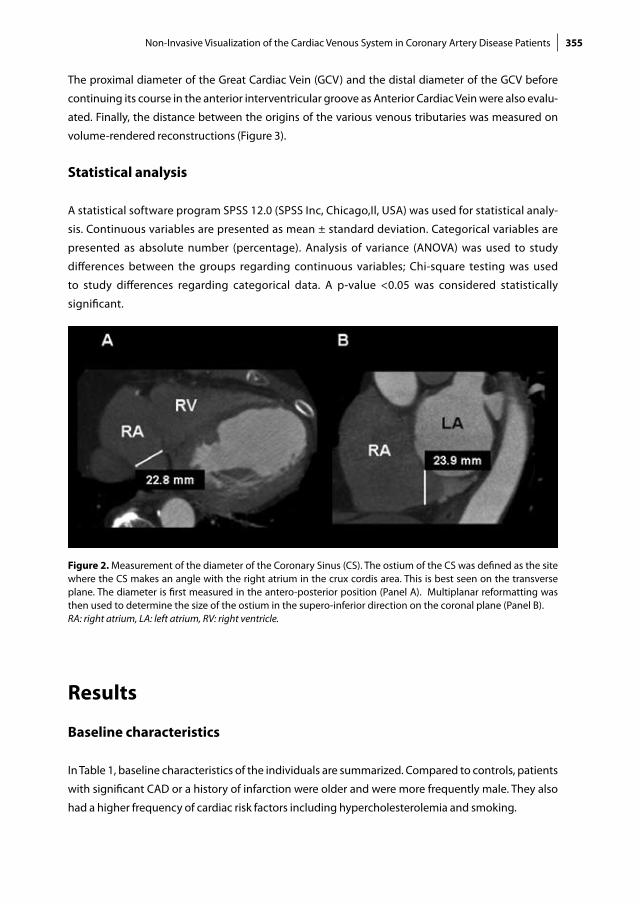
355Non-Invasive Visualization of the Cardiac Venous System in Coronary Artery Disease Patients
The proximal diameter of the Great Cardiac Vein (GCV) and the distal diameter of the GCV before
continuing its course in the anterior interventricular groove as Anterior Cardiac Vein were also evalu-
ated. Finally, the distance between the origins of the various venous tributaries was measured on
volume-rendered reconstructions (Figure 3).
Statistical analysis
A statistical software program SPSS 12.0 (SPSS Inc, Chicago,Il, USA) was used for statistical analy-
sis. Continuous variables are presented as mean ± standard deviation. Categorical variables are
presented as absolute number (percentage). Analysis of variance (ANOVA) was used to study
differences between the groups regarding continuous variables; Chi-square testing was used
to study differences regarding categorical data. A p-value <0.05 was considered statistically
significant.
Figure 2. Measurement of the diameter of the Coronary Sinus (CS). The ostium of the CS was defined as the site where the CS makes an angle with the right atrium in the crux cordis area. This is best seen on the transverse plane. The diameter is first measured in the antero-posterior position (Panel A). Multiplanar reformatting was then used to determine the size of the ostium in the supero-inferior direction on the coronal plane (Panel B). RA: right atrium, LA: left atrium, RV: right ventricle.
Results
Baseline characteristics
In Table 1, baseline characteristics of the individuals are summarized. Compared to controls, patients
with significant CAD or a history of infarction were older and were more frequently male. They also
had a higher frequency of cardiac risk factors including hypercholesterolemia and smoking.

356 Chapter 24
Table 1. Baseline characteristics of the study population.
Controlsn = 28
CADn = 38
Infarctionn = 34
p-value
Age (yrs) 56 ± 11 64 ± 10 62 ± 11 0.02Male gender 14 (50%) 26 (68%) 28 (82%) 0.03LV ejection fraction 64 ± 9 % 58 ± 14 % 50 ± 13 % 0.0001Cardiac risk factorsHypertension 10 (40%) 17 (50%) 11(37%) NSHypercholesterolemia 11 (44%) 24 (71%) 22 (73%) 0.047Smoking 4 (16%) 10 (29%) 14 (47%) 0.048Diabetes mellitus 9 (35%) 14 (40%) 3 (10%) 0.02Familial history CAD 7 (28%) 7 (21%) 12 (39%) NS
CAD: coronary artery disease; LV: left ventricular.
Left ventricular ejection fraction was significantly lower in patients with a history of infarction.
Regarding the coronary artery lesions: none of the controls had significant coronary stenosis (by
definition). In the CAD group, 10 patients had lesions occluding ± 50% of the coronary lumen,
25 patients had lesions occluding ≥75% of the lumen. A significant stenosis was present in the
left anterior descending coronary artery in 78%, in the left circumflex coronary artery in 38% and
in the right coronary artery in 30%. For patients with a history of infarction, these percentages
were 88%, 46% and 42% respectively. Regarding the location of the infarction, 23 patients (68%)
had a previous anterior infarction, 4 (12%) a lateral infarction and 7 (21%) an inferior infarction.
Twelve of the 34 infarction (35%) patients had a non-Q wave infarction, 22 (65%) had a Q wave
infarction.
Anatomic observations
No patients had to be excluded because of suboptimal study quality. The CS, Anterior Interventricu-
lar Vein and PIV were observed in nearly all patients (100%, 100% and 99% respectively). The PVLV
was observed in 96% of the controls, in 84% of the CAD patients and in 82% of the patients with pre-
vious infarction (p=NS). LMV was significantly less often identified in patients with a previous infarc-
tion as compared to CAD patients and controls (27% vs 61% vs 71%, p<0.001, Figure 4). An example
of a patient with a previous infarction and absence of the LMV is presented in Figure 5. None of the
patients with a history of a lateral infarction had a LMV, only 22% of the patients with a history of an
anterior infarction had a LMV whereas 43% of the patients with a previous inferior infarction had a
LMV. In the 12 non-Q wave infarction patients the PVLV was present in 11 patients (92%) and the
LMV was present in 5 patients (42%). In the 24 Q-wave infarction patients the PVLV was only present
in 17 patients (77%) and the LMV in 4 (18%) patients.
In patients with a previous infarction, the presence of both a PVLV and LMV was significantly less of-
ten observed as compared to CAD patients and normals (26.5% vs 60.5% vs 71.4%, p<0.01, Figure 6).

357Non-Invasive Visualization of the Cardiac Venous System in Coronary Artery Disease Patients
Patients with a PIV exhibited one side branch in 7%, two side branches in 28% and three side branch-
es in 2% of patients; 63% of these patients had no side branches. In the patients in whom a PVLV was
identified, one side branch was observed in 2%, 2 side branches in 16% and 3 side branches in 1% of
patients; 81% had no side branches. In patients with a LMV, one side branch was present in 4% and
two side branches in 23% of patients, 73% of these patients had no side branches. No significant
differences were observed between controls, patients with CAD with or without previous infarction
regarding the number of side branches.
Figure 4. Presence of the coronary sinus (CS) and its main tributaries: posterior interventricular vein (PIV), Pos-terior vein of the left ventricle (PVLV) and left marginal vein (LMV) in the three subsets (controls, patients with coronary artery disease (CAD) and patients with CAD and history of myocardial infarction).
Figure 3. Example of measurement of the distance between the origins of the tributaries of the coronary sinus. (PIV: posterior interventricular vein, PVLV: posterior vein of the left ventricle, LMV: left marginal vein).

358 Chapter 24
Quantitative measurements from MSCT
The quantitative measurements are presented in Table 2. Inter- and intra-observer agreement were
assessed in 10 patients; percentage agreements were 94% and 97%. For all patients, the diameter of
the CS in the supero-inferior direction was significantly larger as compared to the antero-posterior
direction: 12.2 ± 3.3 mm versus 11.3 ± 3 mm (p = 0.002). The more distant tributaries of the CS had
smaller diameters. Within the three groups (controls, CAD patients or patients with previous infarc-
tion) no significant differences were noted. The distances between the origins of the different vessels
were also comparable between the three groups.
Discussion
The main findings in the current study are two-fold. First, non-invasive evaluation of the cardiac ve-
nous system in CAD patients is feasible using 64-slice MSCT. Second, variation of the cardiac venous
anatomy in CAD patients appears related to a history of previous myocardial infarction; patients with
previous infarction have significantly less left marginal veins. These observations may have impor-
tant implications for selection of potential CRT candidates with a history of myocardial infarction.
Figure 5. Example of absence of the posterior and left marginal vein in a patient with a history of an anterolateral infarction. Panel A: posterior view, Panel B: left lateral view. The only tributary of the coronary sinus (CS) and great cardiac vein (GCV) is the posterior interventricular vein (PIV). Also note the obtuse marginal (MO) branch of the circumflex coronary artery and the right coronary artery (RCA).

359Non-Invasive Visualization of the Cardiac Venous System in Coronary Artery Disease Patients
Non-invasive evaluation of the cardiac venous system
Until recently, the cardiac venous system could only be evaluated invasively using retrograde ve-
nography, either by direct manual contrast injection or after occlusion of the coronary sinus 8,9. In
2000, few studies reported on the use of non-invasive imaging with electron beam CT to depict the
cardiac venous system 10,11. Recently, Mao et al analyzed the electron beam CT of 231 patients and
demonstrated that this technique provides 3-D visualization of most components of the coronary
venous system 12. In 2003, Tada et al reported the feasibility of MSCT to obtain high quality three-
dimensional images of the cardiac venous system in one patient 13. Recently, preliminary studies
were published on the value of 16-slice MSCT to evaluate the cardiac veins 7,14,15. Since then, 16-
slice MSCT is gradually being replaced by 64-slice MSCT, offering a higher spatial resolution with a
decreased acquisition time. Abbara et al suggested that due to the shorter scanning time, venous
opacification might be insufficient using scanning protocols tailored for imaging the coronary artery
system 14. However, the feasibility of depicting the cardiac venous system with 64-slice MSCT was
clearly demonstrated in the present study. Despite a shorter scanning time, the CS and its tributaries
could be evaluated in all individuals. Prominent side branches - suitable for insertion of pacemaker
leads - were adequately visualized but the distal parts of side branches with a smaller diameter could
not be detected in all patients.
Table 2. Quantitative measurements in venous anatomy from MSCT.
Controlsn = 28
CADn = 38
Infarctionn = 34
p-value
Diameters CS antero-posterior (mm) 11.5 ± 2.4 11.2 ± 3.7 11.2 ± 2.9 NSCS supero-inferior (mm) 12.6 ± 3.2 11.7 ± 3.3 12.5 ± 3.3 NSGCV proximal (mm) 7.2 ± 1.4 7.0 ± 1.8 7.4 ± 1.4 NSGCV distal (mm) 4.9 ± 1.1 5.0 ± 1.0 5.1 ± 1.3 NSPIV (mm) 5.0 ± 0.7 5.2 ± 1.3 5.2 ± 1.3 NSPVLV (mm) 3.8 ± 0.7 3.9 ± 1.0 4.1 ± 1.1 NSLMV (mm) 3.1 ± 0.8 3.6 ± 1.5 5.3 ± 5.8 NS
Distance between origin of PIV and PVLV (mm) 32 ± 17 27 ± 14 36 ± 22 NSPVLV and LMV (mm) 41 ± 13 39 ± 15 38 ± 17 NSPVLV and AIV (mm) 51 ± 16 55 ± 17 57 ± 10 NSLMV and AIV (mm) 45 ± 9 44 ± 14 46 ± 13 NS
AIV: anterior interventricular vein; CS: coronary sinus; GCV: great cardiac vein; LMV: left marginal vein; PIV: posterior interventricular vein; PVLV: posterior vein.
Variations in cardiac venous anatomy
In the current report the accepted terminology for the CS and its tributaries of the Nomina Ana-
tomica (English version) as described by von Lüdinghausen was used to permit comparison with

360 Chapter 24
previous studies 16. Of note, in various studies the PVLV is often described as the Middle Cardiac Vein.
Both in anatomical series and imaging series, either invasive venography or non-invasive evaluation
with CT, a substantial variation in anatomy was reported.
First, the CS was analyzed. The CS is the most constant component of the cardiac venous system and
was detected in all patients. The diameter of the CS was larger in the supero-inferior direction as
compared to the antero-posterior direction, indicating an oval shape of the ostium, confirming the
16-slice MSCT observations of Jongbloed et al 7. and MRI observations by Wittkamp et al 17.
Secondly, the tributaries of the CS were evaluated. The PIV was observed in (nearly) all patients. The
highest variability was observed in the number of tributaries between the PIV and the Anterior In-
terventricular Vein. In anatomical series the PVLV existed as a single large vessel in 63% of the cases
(diameter ranging from 1.0 – 5.5 mm) and the prevalence of the LMV was between 73% and 88% of
cases (diameter varying from 1.0 – 3.0 mm) 15. Meisel et al studied 129 patients referred for cardio-
verter-defibrillator implantation with invasive venography and noted a PVLV in 55% and a LMV in
83% 8. In studies using noninvasive modality (Electron Beam CT or 16 slice MSCT), the prevalence of
the PVLV varied between 13% and 80 % and the prevalence of the LMV between 38% and 93% 11-14.
The number of patients with CAD was not specified in every study and data on the prevalence and
site of infarction were frequently lacking. Mao and co-workers, analyzed 231 patients and found the
CS in 100%, the PIV in 100%, the Posterior Vein in 78% and the Marginal Vein in 81% 12. Abbara et al 14 included 54 patients with suspected CAD, referred for 16-slice MSCT. In 4 patients (7.4%) no LMV
could be identified and in 11 (20.4%) patients no Posterior Vein could be found; however none of
Figure 6. Prevalence of both the posterior vein of the left ventricle (PVLV) and the left marginal vein (LMV), only the PVLV and neither PVLV and LMV according to subject category: controls, coronary artery disease (CAD) and myocardial infarction patients. Overall p = 0.003.

361Non-Invasive Visualization of the Cardiac Venous System in Coronary Artery Disease Patients
the patients had a definite diagnosis of acute myocardial infarction 14. Jongbloed et al studied 38 pa-
tients including 18 CAD patients 7. The CS and PIV were observed in all patients, the PVLV was found
in 95% and the LMV in 60% of patients.
A novelty of the current study is the demonstration of an association between these anatomic
variations and the history of a previous myocardial infarction. None of the patients with a previous
lateral infarction had a LMV and patients with anterolateral myocardial infarctions and especially
Q-wave infarctions were lacking the LMV. Post-mortem studies on cardiac veins in ischemic heart
disease are scarce. Hansen studied several series of patients who died from ischemic heart disease
and detected thrombosis of the epicardial veins in large transmural infarctions 18. In all cases the
thrombosed veins were those draining the infarcted myocardium 19. Indirect evidence supporting
the association between previous infarction and absent cardiac veins is provided by Komamura et
al who used thermodilution meaurements of great cardiac vein flow after reperfusion and dem-
onstrated that salvaged myocardium after successful thrombolysis was not observed in patients
demonstrating a progressive decrease in great cardiac vein flow 20.
Clinical implications
The observation that patients with previous infarction are frequently lacking the LMV has impor-
tant implications for the selection of potential candidates for CRT. Positioning the LV lead is the
most challenging part of CRT implantation. Before referring the patient with previous infarction
for CRT implantation, a triad of questions (Figure 7) has to be answered. First: where is the area of
latest activation located? As shown by Ansalone et al, the best clinical response occurs in patients
who had their LV lead placed in or near the site of latest activation 21. Echocardiography with
tissue Doppler imaging is an adequate non-invasive imaging modality to answer this question 22,23. Second: does the area of latest mechanical activation not contain transmural scar tissue? Re-
cently, Bleeker et al observed that patients with transmural posterolateral scar tissue on contrast-
enhanced MRI failed to respond to CRT 24. This observation underscored that assessment of LV
dyssynchrony in patients with ischemic cardiomyopathy should be combined with assessment of
scar tissue, to verify whether the region that will be targeted for LV pacing does not contain trans-
mural scar tissue. After having identified the region of latest activation without scar tissue a final
and third question has to be answered: are their cardiac veins, draining this target region, suitable
for LV lead placement? MSCT can provide an answer to this question that appears important in
patients with a history of myocardial infarction. If suitable cardiac veins are absent, a surgical ap-
proach is preferred over transvenous LV lead positioning. MSCT is a reliable technique to depict
the cardiac venous system and the 3D reconstruction will also allow segmental classification to
map the cardiac veins and tributaries in relation to the left ventricular wall in a manner compara-
ble to that of echocardiography. (25) MSCT is able to detect anatomic and quantitative differences
that may occur in CS and venous anatomy of heart failure patients who are candidates for CRT.
MSCT will not only confirm the presence of a specific CS tributary but will also provide information

362 Chapter 24
on the course of the vessel, side-branches, the diameter, the distance from the CS and the relation
with adjacent structures. Depending on the experience of the implanting cardiologist, no invasive
venography at all or only selected venography of the target cardiac vein may be sufficient to im-
plant the lead successfully, based on the MSCT data. In addition, information on cardiac venous
anatomy acquired with MSCT could possibly also be used during CRT implantation for 3-D naviga-
tion into the heart cavities and veins 26.
Figure 7. Non-invasive approach for left ventricular (LV) lead positioning.
Limitations
The 64-slice MSCT scans were tailored for optimal visualization of the coronary arteries. This could
have caused suboptimal enhancement of the coronary veins, particularly of second and third de-
gree side branches with a small diameter. Since atrial fibrillation is considered a contraindication for
MSCT of the coronary arteries only patients in sinus rhythm were included. Prospective confirmation
of the current findings is needed in patients referred for CRT.
Conclusion
Non-invasive evaluation of the cardiac venous anatomy with 64-slice MSCT is feasible. There is con-
siderable variation in cardiac venous anatomy. Patients with a history of myocardial infarction were
less likely to have a LMV possibly limiting optimal LV lead positioning for CRT.

363Non-Invasive Visualization of the Cardiac Venous System in Coronary Artery Disease Patients
References 1. Leclercq C, Hare JM. Ventricular resynchronization. Current state of the art. Circulation 2004; 109: 296-
299. 2. Auricchio A, Abraham WT. Cardiac resynchronization therapy: Current state of the art. Cost versus ben-
efit. Circulation 2004; 109: 300-307. 3. Willerson JT, Kereikaes DJ. Cardiac resynchronization therapy: helpful now in selected patients with CHF.
Circulation 2004; 109: 308-309. 4. Cleland JGF, Daubert J-C, Erdmann E, Freemantle N, Gras D, Kappenberger L, Tavazzi L, for the Cardiac
Resynchonization – Heart Failure (CARE-HF) Study Investigators. The effect of cardiac resynchronization on morbidity and mortality in heart failure. N Engl J Med 2005; 352: 1539-1549.
5. Mehra M, Greenberg B. Cardiac Resynchronization Therapy: Caveat Medicus! J Am Coll Cardiol 2004; 43: 1145-1148.
6. Bax JJ, Abraham T, Barold SS Breithardt OA, Fung JWH Garrigue S, Gorcsan J, Hayes DL, Kass DA, Knuuti J, Leclercq C, Linde C, Mark DB, Monaghan MJ, Nihoyannopoulos P, Schalij MJ, Stellbrink C, Yu CM. Cardiac resynchronization therapy: Part 1—issues before device implantation. J Am Coll Cardiol 2005; 46: 2153-2167.
7. Jongbloed MRM, Lamb HJ, Bax JJ, Schuijf JD, de Roos A, van der Wall EE, Schalij MJ. Noninvasive visual-ization of the cardiac venous system using multislice computed tomography. J Am Coll Cardiol 2005; 45: 749-753.
8. Meisel E, Pfeiffer D, Engelmann L, Tebbenjohanns J, Schubert B, Hahn S, Fleck E, Butter C.Investigation of coronary venous anatomy by retrograde venography in patients with malignant ventricular tachycar-dia. Circulation 2001; 104: 442-447.
9. De Martino G, Messano L, Santamaria M Parisi Q, Dello Russo A, Pelargonio G, Sanna T, Narducci ML, Chiriaco T, Bellocci F, Zecchi P, Crea F. A randomized evaluation of different approaches to coronary sinus venography during biventricular pacemaker implants. Europace 2005; 7: 73-76.
10. Schaffler GJ, Groell R, Peichel KH, Rienmüller R. Imaging the coronary venous drainage system using electron-beam CT. Surg Rad Anat 2000; 22: 35-39.
11. Gerber TC, Sheedy PF, Bell MR Hayes DL, Rumberger JA, Behrenbeck T, Holmes DR Jr, Schwartz RS. Evalu-ation of the coronary venous system using electron beam computed tomography. Int J Cardiovasc Imag-ing 2001; 17: 65-75.
12. Mao S, Shinbane JS, Girsky MJ Child J, Carson S, Oudiz RJ, Budoff MJ. Coronary venous imaging with electron beam computed tomographic angiography: Three-dimensional mapping and relationship with coronary arteries. Am Heart J 2005; 150: 315-322.
13. Tada H, Naito S, Koyama K, Taniguchi K. Three-dimensional computed tomography of the coronary ve-nous system. J Cardiovasc Electrophysiol 2003; 14: 1385.
14. Abbara S, Cury RC, Nieman K Reddy V, Moselewski F, Schmidt S, Ferencik M, Hoffmann U, Brady TJ, Achenbach S. Noninvasive evaluation of cardiac veins with 16-MDCT angiography. AJR 2005; 185: 1001-1006.
15. Mühlenbruch G, Koos R, Wildberger JE, Günther R, Mahnken AH. Imaging of the cardiac venous system: comparison of MDCT and conventional angiography. AJR 2005; 185: 1252-1257.
16. von Lüdinghausen M. The venous drainage of the human myocardium. Adv Anat Embryol Cell Biol 2003; 168 Suppl I: 1-107.
17. Wittkamp FH, Vonken EJ, Derksen Loh P, Velthuis B, Wever EF, Boersma LV, Rensing BJ, Cramer MJ. Pulmo-nary vein ostium geometry: analysis by magnetic resonance angiography. Circulation 2003; 107:21-23.
18. Hansen BF. Ischaemic heart disease. Patho-anatomic findings revealed by comprehensive autopsy tech-nique. Acta Pathol Microbiol Immunol Scan 1982; 90: 37-49.
19. Hansen BF. Thrombosis of epicardial coronary veins in acute myocardial infarction. Am Heart J 1979; 97: 696-700.
20. Komamura K, Kitakaze M, Nishida K Naka M, Tamai J, Uematsu M, Koretsune Y, Nanto S, Hori M, Inoue M. Progressive decreases in coronary vein flow during reperfusion in acute myocardial infarction: clinical documentation of the no reflow phenomenon after successful thrombolysis. J Am Coll Cardiol 1994; 24: 370-377.

364 Chapter 24
21. Ansalone G, Giannantoni P, Ricci R, Trambaiolo P, Fedele F, Santini M. Doppler myocardial imaging to evaluate the effectiveness of pacing sites in patients receiving biventricular pacing. J Am Coll Cardiol 2002; 39:489-499.
22. Blank AJ, Kelly AS. Tissue Doppler Imaging and left ventricular dyssynchrony in heart failure. J Card Fail 2006; 12: 154-162.
23. Van de Veire N, De Sutter J, Van Camp G Vandervoort P, Lancellotti P, Cosyns B, Unger P, Gillebert TC; Belgian Multicenter Registry on Dyssynchrony. Global and regional parameters of dyssynchrony in isch-emic and nonischemic cardiomyopathy. Am J Cardiol 2005; 95: 1020-1023.
24. Bleeker GB, Kaandorp TA, Lamb HJ Boersma E, Steendijk P, de Roos A, van der Wall EE, Schalij MJ, Bax JJ. Effect of posterolateral scar tissue on clinical and echocardiographic improvement after cardiac resyn-chronization therapy. Circulation 2006; 113: 926-928.
25. Singh JP, Houser S, Heist KE, Ruskin JN. The coronary venous anatomy. A segmental approach to aid cardiac resynchronization therapy. J Am Coll Cardiol 2005; 46:68-74.
26. Rioual K, Unanua E, Laguitton S, Garreau M, Boulmier D, Haigron P, Leclercq C, Coatrieux JL. MSCT la-belling for pre-operative planning in cardiac resynchronization therapy. Computer Med Imaging Graph 2005; 29: 431-439.

Summary and Conclusion


367Summary and Conclusion
Summary and Conclusion
The general introduction (Chapter 1) of this thesis provides an overview of the different modalities
that are available for diagnosis of coronary artery disease (CAD). The individual strengths and
limitations as well as the current accuracies - based on pooled analyses of the literature when
available - of each imaging modality are described, followed by the outline of the thesis.
Part I
The first part of the thesis focuses on the recently introduced technique Multi-Slice Computed
Tomography (MSCT). MSCT is a rapidly developing technique that allows direct noninvasive
visualization of the coronary arteries. In Chapter 2, the technical background of performing
noninvasive coronary angiography with this novel technique is described. Data acquisition and
post-processing protocols for optimal image quality and data evaluation are discussed. In addition,
the potential applications of MSCT coronary angiography are outlined.
Subsequently, the diagnostic accuracy of this novel technique in the detection of significant CAD
(defined as 50% luminal narrowing or more) as compared to conventional coronary angiography is
explored in Chapters 3-5. In Chapter 3, the diagnostic accuracy of 16-slice MSCT to detect significant
stenosis was evaluated in 45 patients presenting with suspected or known CAD. A total of 94% of
native coronary artery segments could be evaluated with MSCT, whereas 85% of grafts and 79% of
coronary stents were interpretable. For all segments, overall sensitivity, specificity, and positive and
negative predictive values were 85%, 89%, 71%, and 95%, respectively. In addition to evaluation of
the coronary arteries, left ventricular ejection fraction (LVEF) was evaluated and compared to 2D-
echocardiography, which revealed a close correlation between these modalities. With regard to
the high specificity and negative predictive value observed, it was concluded that 16-slice MSCT
may be useful as a noninvasive modality to rule out significant stenosis. In addition, LVEF, being an
important prognostic marker, may be evaluated with high accuracy. More recently, 64-slice MSCT
has become available with the simultaneous acquisition of 64 rather than 16-slices per rotation
as well as with improved rotation times. Chapter 4 describes the initial results obtained with this
scanner. A sensitivity and specificity of 94% and 97%, respectively, were obtained on a patient basis.
In conclusion, the study confirmed - in line with previous investigations - that 64-slice MSCT enables
accurate noninvasive evaluation of significant coronary artery stenoses. Finally, a meta-analysis of
the available literature on noninvasive coronary imaging with either MSCT or Magnetic Resonance
Imaging (MRI) was performed. In Chapter 5 the results from this meta-analysis are described.
Comparison of sensitivities and specificities revealed significantly higher values for MSCT (weighted
average 85% and 95%) as compared with MRI (weighted average 72%, and 87%). In addition, a
significantly higher odds ratio (16.9-fold) for the presence of significant stenosis was observed for
MSCT as compared with MRI (6.4-fold) (P < 0.0001). Accordingly, the results of this meta-analysis
of the available literature on noninvasive coronary angiography with MRI and MSCT indicated that
MSCT has currently a significantly higher accuracy to detect or exclude significant CAD.

368 Summary and Conclusion
Part II
In the second part of the thesis, the potential use of MSCT and MRI is explored in subpopulations
in order to identify those patient populations that may or may not benefit from these techniques.
For example, patients with certain risk factors for CAD may benefit from early identification of CAD
followed by targeted atherosclerotic treatment. However, it is important to establish beforehand
whether the presence of these risk factors do not have any negative influence on the diagnostic
performance of MSCT. In Part II A, therefore, the diagnostic performance of 4-and 16-slice MSCT
was explored in the setting of different risk factors. In Chapter 6, the potential of MSCT coronary
angiography was evaluated in patients with type 2 diabetes. A total of 86% of segments was
interpretable with MSCT. In these segments, sensitivity and specificity for detection of coronary
stenoses were 95%. Including the uninterpretable segments, sensitivity and specificity were 81% and
82%, respectively. In addition, no significant difference was observed between LVEF values obtained
by MSCT and 2D-echocardiography, while agreement in the assessment of regional contractile
function was also excellent (91%). Accordingly, no major effect of type 2 diabetes on the diagnostic
performance of MSCT was revealed, indicating that this technique may allow optimal identification of
high-risk patients in this population. In Chapter 7, MSCT was applied in patients with hypertension.
A total of 88% coronary artery segments could be evaluated with MSCT. Sensitivity and specificity for
the detection of significant stenoses were 93% and 96%. On a per-patient basis, MSCT was accurate
in 90% of patients. The results suggest that in patients with hypertension, MSCT may be applied for
noninvasive triage of patients. Finally in Chapter 8, the effect of gender and various risk factors for
CAD (including type 2 diabetes, hypertension, obesity, smoking and hypercholesterolemia) on the
diagnostic accuracy of 16-slice was explored in 197 patients. Patients were enrolled in the Erasmus
Medical Center Rotterdam and the Leiden University Medical Center. Overall, a sensitivity and
specificity of 99% and 86%, respectively, on a patient level were demonstrated. Among the various
subsets of patients, similar values were observed, with no statistical differences, indicating a high
diagnostic accuracy of MSCT coronary angiography, regardless of gender and risk factors.
In part II B, patients with a history of revascularisation were studied. In this population, noninvasive
imaging may be more challenging as compared to patients with suspected CAD due to the presence
of stents and surgical clips, resulting in metal artefacts. In addition, the presence of extensive
atherosclerosis may also pose substantial difficulties. In Chapter 9, the feasibility of 16-slice MSCT
to evaluate patency of intracoronary stents was investigated in patients referred for conventional
coronary angiography. For each stent, assessability was determined and related to stent type and
diameter. Subsequently, the presence of significant restenosis was determined in the evaluable
stents as well as peri-stent lumina. Of 65 stents, 50 (77%) were considered assessable. Uninterpretable
stents tended to have a thicker strut thickness (≥ 140 μm) and/or a smaller diameter (≤ 3.0 mm).
In the evaluable stents, a sensitivity and specificity of 78% and 100%, respectively, were obtained.
Sensitivity and specificity for the detection of peri-stent stenosis were 75% and 96%, respectively.
In conclusion, in stents with a larger diameter and relatively thin struts, MSCT may be useful in
the assessment of stent patency and may function as a gatekeeper prior to invasive diagnostic
procedures.
369Summary and Conclusion
The expectation of improved assessability of coronary stents with 64-slice MSCT was tested in
Chapter 10. State-of-the-art imaging and evaluation protocols were applied in 182 patients
presenting with a total of 192 stents. MSCT images obtained by 64-slice MSCT (either using a
Siemens Sensation or Toshiba Aquilion) were evaluated by experienced observers at each center
for the presence of significant in-stent restenosis. Only stents with a diameter ≥ 2.5 mm were
included. Ninety-three percent of stents were of good diagnostic quality. In interpretable stents,
high sensitivity and specificity to identify in-stent restenosis were observed. Accordingly, in stents
with a larger diameter, in-stent restenosis can be evaluated with 64-slice MSCT with good diagnostic
accuracy. In particular, a high negative predictive value of 99% was observed indicating that 64-slice
MSCT may be most valuable as a noninvasive method of excluding in-stent restenosis.
In Chapter 11, the performance of 64-slice MSCT in the assessment of in-stent restenosis was
evaluated in more detail. In 50 patients, 64-slice MSCT was performed in addition to conventional
coronary angiography with quantitative coronary angiography (QCA). For each stent, assessability
was determined and related to stent characteristics and heart rate. In the interpretable stents, the
presence of significant (≥50%) restenosis was determined. Since restenosis may frequently occur at
the stent borders, also peri-stent lumina (5.00 mm proximal and distal to the stent) were evaluated.
Of 76 stents, 86% were determined assessable. Increased heart rate and overlapping positioning
were found to be associated with increased stent uninterpretability, whereas stent location and
strut thickness were not. In the interpretable stents, the presence or absence of significant (≥50%)
in-stent restenoses was correctly detected in all stents. Sensitivity and specificity for the detection
of significant (≥50%) peri-stent stenosis were 100% and 98%, respectively. In selected patients with
previous stent implantation, 64-slice MSCT may allow accurate evaluation of in-stent and peri-stent
stenosis.
Although percutaneous coronary intervention is increasingly performed in the treatment of
obstructive CAD, a considerable portion of patients still receives coronary bypass surgery. In
Chapter 12, a high-resolution, phase contrast MRI sequence for quantifying flow in small and large
vessels was validated. In addition, its feasibility to measure flow in coronary artery bypass grafts was
demonstrated. For this purpose, a breath-hold, echo planar imaging (EPI) sequence was developed
and validated in a flow phantom using a fast field echo (FFE) sequence as reference. In 17 volunteers
aortic flow was measured using both sequences. In 5 patients flow in the left internal mammary
artery (LIMA) and aorta was measured at rest and during adenosine stress, and coronary flow reserve
(CFR) was calculated; in 7 patients, vein graft flow velocity was measured. In the flow phantom
measurements, the EPI sequence yielded an excellent correlation with the FFE sequence, while also
aortic volume flow in healthy volunteers correlated well with only a minor overestimation. It was
feasible to measure flow velocity in the LIMA and vein grafts of the 12 patients.
Part III
Based on the consistently high negative predictive value of MSCT coronary angiography, the
technique has been proposed as a suitable alternative for first-line evaluation in patients presenting
with suspected CAD. However, functional imaging modalities have traditionally been used for this

370 Summary and Conclusion
purpose. As a result, the presence and extent of ischemia, i.e. the hemodynamical consequences of a
lesion, have served as the gatekeeper for referral to conventional coronary angiography. In contrast,
MSCT coronary angiography provides direct information on coronary anatomy. Accordingly, in
order to fully appreciate both the potential and limitations of this new technique as well as to allow
optimal integration, its performance needs to be evaluated not only against conventional coronary
angiography but also against functional imaging.
In Chapter 13, an update of the various noninvasive modalities, including both anatomical as well
as functional modalities, is provided. Their values in both the diagnosis of obstructive CAD and
prognostification are discussed. In addition, a potential algorithm for integration of anatomical
imaging with MSCT and functional imaging is proposed.
In order to design and support such algorithms, the relationship between noninvasive coronary
angiography with MSCT and myocardial perfusion imaging (MPI) needs to be determined.
Therefore, in Chapter 14, a total of 114 patients, presenting with an intermediate pre-test likelihood
of CAD, underwent both MSCT coronary angiography and myocardial perfusion imaging (MPI)
using gated SPECT. An excellent agreement was observed between normal coronary arteries on
MSCT and the presence of normal myocardial perfusion on gated SPECT (90%). In contrast, only
50% of patients with a significant stenosis on MSCT displayed abnormal perfusion during gated
SPECT. Accordingly, an abnormal MSCT does not imply the presence of a hemodynamically relevant
stenosis. As knowledge of ischemia is needed to determine further management and decide
between aggressive intervention or conventional therapy, functional testing appears necessary
following an abnormal MSCT scan. On the other hand, CAD could be ruled out by MSCT in only 46%
of patients with a normal perfusion study, indicating that a normal MPI cannot rule out extensive
atherosclerosis. Combination of both techniques, either by integrated or sequential imaging, may
therefore be preferred and allow more precise cardiac assessment. This current change in paradigm
- namely the shift from detection of ischemia to detection of (sub)clinical atherosclerosis - is further
discussed in Chapter 15.
In Chapter 16, the relation between anatomical imaging, using both MSCT calcium scoring and
noninvasive coronary angiography, and MPI was assessed in an unselected population, including
patients with known CAD. Analysis of data on a regional basis revealed that in coronary arteries with
a calcium score of 10 or less, the corresponding myocardial perfusion was normal in 87%. In coronary
arteries with extensive calcifications (calcium score > 400), the percentage of vascular territories
with normal myocardial perfusion was substantially lower, 54%. Similarly, coronary arteries without
detectable atherosclerosis as well as coronary arteries with non-obstructive atherosclerosis were
generally found to be associated with normal myocardial perfusion in the corresponding vascular
territory (89%).
In contrast, the percentage of normal SPECT findings was significantly lower in coronary arteries
with obstructive lesions (59%) or with total or subtotal occlusions (8%). Nonetheless, only 48% of
vascular territories with normal perfusion corresponded to normal coronary arteries on MSCT
angiography, whereas insignificant and significant stenoses were present in, respectively, 40% and
12% of corresponding coronary arteries.

371Summary and Conclusion
These discrepant findings were further investigated in Chapter 17. In a subset of patients, the
discrepancy between MPI and MSCT was compared to invasive imaging, not only of the coronary
artery lumen (using invasive coronary angiography) but also of the vessel wall (using intravascular
ultrasound, IVUS). A good agreement between modalities was observed in patients with abnormal
MPI. However, a normal MPI study was in most patients associated with an abnormal MSCT study.
In these patients only minimal luminal stenosis was observed on QCA (26.5%) as well. Considerable
plaque burden (58%), however, was revealed by IVUS imaging, yet without luminal compromise
(average minimal luminal area 5.7 mm2). From the chapter was concluded that in patients with
discrepant MSCT and MPI findings, the detected atherosclerosis may be located mainly in the vessel
wall, rather than extending into the coronary lumen.
Part IV
A particular feature of MSCT is that it allows visualization of not only luminal narrowing but also of
the coronary vessel wall. While this may lead to discrepant results with other imaging modalities
as described in Part III, knowledge of the presence and extent of atherosclerosis may eventually
become an advantage of MSCT.
In Chapter 18 the hypothesis that MSCT may detect differences in plaque composition and
distribution between patients with stable CAD versus patients presenting with acute coronary
syndromes (ACS) was tested. In patients with stable CAD, the majority of lesions were calcified (89%),
whereas in patients with ACS, a greater proportion of noncalcified (18%) or mixed (36%) lesions
was noted. Moreover, even in non-culprit vessels, multiple noncalcified plaques were detected,
indicating the presence of diffuse rather than focal atherosclerosis in ACS.
In Chapter 19, the influence of type 2 diabetes on MSCT plaque characteristics, including plaque
extent and composition was evaluated in 215 patients, of whom 40% with type 2 diabetes. Significant
differences in plaque characteristics were observed and the presence of diabetes was demonstrated
to correlate with the number of diseased segments and the number of nonobstructive, noncalcified,
and calcified plaques. Diabetes was associated with increased coronary plaque burden as well as
more noncalcified and calcified plaques and less mixed plaques. Since MSCT may provide an estimate
of coronary plaque burden as well as distinction in atherosclerotic patterns between various clinical
presentations, this information obtained with MSCT may be useful for risk stratification. Chapter
20 describes the observations in 100 patients who were followed for coronary events (including
cardiac death, nonfatal myocardial infarction, unstable angina requiring hospitalisation, and
revascularisation) after a baseline MSCT examination. During a mean follow-up of 16 months, 33
events occurred in 26 patients. In patients with normal coronary arteries on MSCT, the first-year
event rate was 0% versus 30% in patients with any evidence of CAD on MSCT. The observed event
rate was highest in the presence of obstructive lesions (63%) and when obstructive lesions were
located in the left main (LM)/left anterior descending (LAD) coronary arteries (77%). Nonetheless,
an elevated event rate was also observed in patients with nonobstructive CAD (8%). In multivariate
analysis, significant predictors of events were the presence of CAD, obstructive CAD, obstructive CAD
in LM/LAD, number of segments with plaques, number of segments with obstructive plaques, and

372 Summary and Conclusion
number of segments with mixed plaques. From this chapter it was concluded that MSCT coronary
angiography provides independent prognostic information over baseline clinical risk factors in
patients with known and suspected CAD. Of particular importance, an excellent prognosis was
noted in patients with a normal MSCT, supporting safe rule-out of CAD with this technique.
Part V
In the final part of the thesis, non-coronary applications of MSCT and MRI are described. Delayed
enhancement MRI allows precise delineation of infarcted myocardium including assessment of
transmural extent. In Chapter 21, a head-to-head comparison was performed between visual and
quantitative analyses of infarct transmurality in 27 patients with long-term ischemic LV dysfunction
and previous infarction. In addition, infarct transmurality was related to the severity of wall motion
abnormalities at rest. Both cine MR imaging (to assess regional wall motion) and contrast enhanced
(ce) - MR imaging were performed and visually analysed using a 17-segment model for wall motion
and segmental infarct transmurality. Quantification of transmurality was performed with threshold
analysis. The agreement between visual and quantitative analyses was excellent: 90% of segments
(kappa 0.86) were categorised similarly by visual and quantitative analyses. Infarct transmurality
paralleled the severity of contractile dysfunction; 96% of normal or mildly hypokinetic segments
had infarct transmurality ≤25%, whereas 93% of akinetic and dyskinetic segments had transmurality
>50% on visual analysis. In conclusion, visual analysis of ce-MR imaging studies may be sufficient for
assessment of transmurality of infarction.
Information on myocardial infarct tissue may also be derived from MSCT. As a 3D data set is acquired
during ECG gating, images can be reconstructed in the short-axis orientation throughout the cardiac
cycle. In addition, imaging is performed during a bolus administration of contrast agent, resulting
in images during first-pass. As a result, areas of reduced myocardial perfusion can be identified as
hypodense areas on the MSCT images. The purpose of Chapter 22 was to evaluate the potential of
MSCT to provide a comprehensive cardiac assessment, with evaluation of LV function and perfusion in
addition to coronary anatomy. In 21 patients with previous infarction, MSCT was performed in addition
to conventional coronary angiography (coronary anatomy) and gated SPECT imaging (perfusion and
function). In this population, observed sensitivity and specificity for detection of stenoses were 91%
and 97% with 98% of segments being interpretable on MSCT. Excellent agreement was observed for
assessment of LVEF and regional wall motion between MSCT and SPECT. With regard to perfusion,
MSCT correctly identified a resting perfusion defect in 93%, whereas the absence of perfusion defects
was correctly detected in 98% of segments. LV function measurements were further validated in
Chapter 23. Measurements of LV volumes and LVEF were compared to 2D-echocardiography.
Linear regression analysis showed excellent correlations between the 2 techniques, although LVEF
was slightly overestimated with MSCT. Finally, in Chapter 24, a novel application of MSCT coronary
angiography, namely the visualization of the cardiac venous system, was evaluated. For successful LV
lead implantation in cardiac resynchronization therapy (CRT), knowledge of venous anatomy may be
useful. The presence of the coronary sinus tributaries was evaluated in a total of 100 patients of whom
28 control patients, 38 patients with significant CAD, and 34 patients with a history of myocardial

373Summary and Conclusion
infarction. While the coronary sinus and posterior interventricular vein were identified in all patients,
a left marginal vein (LMV) was significantly less frequently observed in patients with a history of
infarction as compared with control patients and CAD patients (27% vs. 71% and 61%, respectively).
None of the patients with lateral wall infarction and only 22% of patients with anterior wall infarction
showed a LMV on MSCT in. Accordingly, there appears to be a considerable variation in venous
anatomy. Patients with a history of myocardial infarction showed less frequently a LMV, which may
hamper optimal LV lead positioning in CRT implantation.
Conclusion
Various modalities are available in the diagnostic and prognostic evaluation of patients presenting
with known or suspected CAD. A particularly rapidly expanding technique is noninvasive coronary
angiography with MSCT. During the past few years, noninvasive coronary angiography with
this technique has witnessed an enormous development. In comparison to invasive coronary
angiography, the technique has been demonstrated to allow accurate detection of significant
coronary stenoses and currently outperforms noninvasive coronary angiography with MRI. Due to
the high negative predictive value, the most important contribution of the technique will lie in the
noninvasive exclusion of CAD in patients presenting with suspected CAD and intermediate pre-test
likelihood. Although imaging in populations such as patients with previous stent placement appears
to be more challenging, promising results have been obtained in these populations as well.
However, it remains important to realize that only half of the significant lesions on MSCT appear
to have hemodynamical consequences. These observations indicate that the presence of coronary
atherosclerosis with luminal obstruction does not invariably imply the presence of ischemia.
Accordingly, a noninvasive angiographic imaging technique such as MSCT cannot be used to
predict the hemodynamical importance of observed lesions. In patients with borderline stenosis or
limited image quality on MSCT, therefore, functional testing will remain necessary to determine the
presence of ischemia. This can be performed by nuclear imaging, stress echocardiography or MRI.
Moreover, the latter may allow measurements of coronary flow in coronary bypass grafts.
One of the advantages of MSCT on the other hand, is the fact that the technique allows detection of
CAD at a far earlier stage than functional imaging. Initial investigations even suggest that MSCT may
distinguish different plaque characteristics between various presentations. Potentially, this information
could be useful for risk stratification. Finally, in addition to information on the coronary arteries, also
other non-coronary information can be derived from the MSCT examination. LV function can be
evaluated with high accuracy while also information on the cardiac venous system can be obtained.
With regard to daily clinical management in patients presenting with (suspected) CAD, integration
of MSCT coronary angiography with functional imaging techniques may potentially be most
beneficial. This will allow accurate exclusion as well as earlier detection of CAD in combination with
knowledge of ischemia. However, it is important to realize that available data are currently scarce
and investigations supporting improved outcome as well as cost-effectiveness of algorithms
incorporating both MSCT coronary angiography and functional testing are eagerly awaited.

374 Summary and Conclusion

Samenvatting en Conclusie


377
Samenvatting en Conclusie
In de algemene inleiding (Hoofdstuk 1) wordt een overzicht gegeven van de verschillende
technieken die beschikbaar zijn voor de diagnostiek van coronairlijden. Van elke techniek worden
de voor- en nadelen beschreven, evenals de huidige diagnostische nauwkeurigheid - gewogen op
basis van de beschikbare literatuur- , gevolgd door een overzicht van het proefschrift.
Deel I
Het eerste gedeelte van het proefschrift beschrijft de onlangs geïntroduceerde techniek multi-slice
computed tomography (MSCT). MSCT is een techniek die zich enorm snel heeft ontwikkeld en die
directe weergave van de kransslagaderen toelaat. Hoofdstuk 2 beschrijft de technische achtergrond
van niet-invasieve coronairangiografie met deze techniek. Protocollen voor 1. data-acquisitie en 2.
beeldbewerking om optimale beeldkwaliteit te bereiken worden beschreven. Daarnaast wordt een
overzicht gegeven van de mogelijke toepassingen van MSCT.
Hoofdstukken 3-5 verkennen de diagnostische nauwkeurigheid van MSCT in het opsporen van
significante vernauwingen (gedefinieerd als minimaal 50% vernauwing van het lumen van het vat)
in vergelijking met de traditionele invasieve coronairangiografie.
In Hoofdstuk 3 is de nauwkeurigheid van 16-slice MSCT onderzocht om significante vernauwingen
te herkennen in een populatie van 45 patiënten. In totaal kon 94% van de natieve kransslagaderen
beoordeeld worden, terwijl 85% van de coronaire omleidingen en 79% van de coronaire stents
beoordeelbaar waren. Op segmentniveau werd een sensitiviteit van 85% en een specificiteit
van 89% aangetoond. De bereikte positief en negatief voorspellende waarden waren 71% en
95%. Naast beoordeling van coronairvernauwingen zijn de MSCT beelden ook gebruikt om de
linkerventrikelejectiefractie (LVEF) bij alle patiënten te bepalen. Deze metingen werden vergeleken
met 2D-echocardiografie, waarbij een goede correlatie tussen de metingen werd gevonden.
Op basis van deze resultaten werd geconcludeerd dat, gelet op de hoge specificiteit en negatief
voorspellende waarde, MSCT van nut kan zijn om op niet-invasieve wijze de aanwezigheid van
significante vernauwingen uit te sluiten. Eveneens kan de LVEF, - als belangrijke prognostische marker
-, nauwkeurig bepaald worden waarbij gebruik wordt gemaakt van dezelfde gegevens als die voor
de coronairangiografie. Sindsdien is 64-slice MSCT beschikbaar gekomen. Met deze generatie van
MSCT scanners worden 64 in plaats van 16 coupes per omwenteling van de röntgenbuis verkregen
bij een snellere omwentelingstijd. Hoofstuk 4 beschrijft de eerste resultaten met deze nieuwe
scanner bij patiënten die verwezen waren voor traditionele coronairangiografie. Op patiëntniveau
bedroegen de verkregen sensitiviteit en specificiteit 94% en 97%. De conclusie is dat nauwkeurige
en niet-invasieve beoordeling van significante coronairvernauwingen mogelijk is met 64-slice MSCT,
in lijn met eerder behaalde resultaten.
Tot slot werd een meta-analyse van de beschikbare literatuur op het gebied van niet-invasieve
coronairangiografie met MSCT en kernspin resonantie tomografie (MRI) uitgevoerd. De resultaten
van deze meta-analyse worden beschreven in Hoofdstuk 5. Vergelijking van sensitiviteit en
specificiteit waarden onthulde significant hogere waarden voor MSCT (gewogen sensitiviteit en
Samenvatting en Conclusie

378
specificiteit 85% en 95% voor MSCT versus 72% en 87% voor MRI). Tevens werd een significant
hogere odds ratio (16.9-voud) voor de aanwezigheid van een significante vernauwing gevonden
voor MSCT in vergelijking tot MRI (6.4-voud). Op basis van deze meta-analyse is geconcludeerd dat
MSCT momenteel een significant betere nauwkeurigheid heeft dan MRI voor het aantonen dan wel
uitsluiten voor significant coronairlijden.
Deel II
In Deel II is het mogelijke gebruik van MSCT en MRI in bepaalde subpopulaties onderzocht om de
patiëntenpopulaties te identificeren die al dan niet baat kunnen hebben bij toepassing van deze
technieken. Patiënten met bepaalde risicofactoren voor coronairlijden zouden bijvoorbeeld een
gezondheidsvoordeel kunnen hebben bij vroegtijdige opsporing van de ziekte, gevolgd door
gerichte anti-atherosclerotische behandeling. Daarentegen is het, voordat de techniek tot dit doel
gebruikt kan worden, van groot belang om te bepalen of de aanwezigheid van deze risicofactoren
geen negatieve invloed op de diagnostische nauwkeurigheid van MSCT kan hebben.
In Deel II A is daarom de diagnostische nauwkeurigheid van 4-slice en 16-slice MSCT onderzocht
in de aanwezigheid van risicofactoren voor coronairlijden. Hoofdstuk 6 beschrijft de resultaten bij
patiënten met type 2 diabetes. In totaal was 86% van de coronairsegmenten beoordeelbaar met
MSCT. In deze beoordeelbare segmenten werden een sensitiviteit en een specificiteit van 95%
gevonden. Inclusie van de onbeoordeelbare coronairsegmenten resulteerde in een sensitiviteit van
81% en een specificiteit van 82%. Bovendien werd in de vergelijking van de LVEF bepalingen met
MSCT en 2D-echocardiografie slechts een klein niet-significant verschil gezien. Tevens werd een
zeer goede overeenkomst gevonden in de beoordeling van regionale wandbewegingsstoornissen
(91%). Van de aanwezigheid van type 2 diabetes op de nauwkeurigheid van MSCT is geen aanzienlijk
effect waargenomen, hetgeen suggereert dat MSCT een geschikte techniek zou kunnen zijn om
in patiënten met type 2 diabetes coronairlijden vroegtijdig op te sporen. In Hoofdstuk 7 is MSCT
toegepast bij patiënten met hypertensie. In 88% van de beoordeelbare coronairsegmenten, werd
een sensitiviteit en een specificiteit van 93% en 96% gevonden. Op patiëntniveau werd met MSCT
de juiste diagnose gesteld bij 90% van patiënten. De gevonden resultaten wijzen er op dat MSCT
toegepast kan worden voor niet-invasieve triage van patiënten met hypertensie. Tot slot is in
Hoofdstuk 8 de invloed onderzocht van geslacht en verschillende risicofactoren voor coronairlijden
in een grote populatie van 197 patiënten (geïncludeerd in het Erasmus Medisch Centrum en
Leids Universitair Medisch Centrum). Er werden geen verschillen gevonden in de verschillende
subpopulaties, hetgeen de eerdere bevindingen bevestigt.
In Deel II B zijn patiënten met een revascularisatieprocedure in hun voorgeschiedenis bestudeerd.
In deze populatie is niet-invasieve beeldvorming mogelijk uitdagender door de aanwezigheid
van metaalartefacten als gevolg van stents en chirurgische clips. Bovendien kan de aanwezigheid
van vaak uitgebreide atherosclerose bij deze patiënten nog meer moeilijkheden opleveren. In
Hoofdstuk 9 is de haalbaarheid van 16-slice MSCT om coronaire stents te beoordelen op restenose
onderzocht in patiënten die reeds verwezen waren voor invasieve coronairangiografie. Voor elke
stent werd bepaald of deze beoordeelbaar was. Vervolgens werd de beoordeelbaarheid van stents
Samenvatting en Conclusie

379
gerelateerd aan de grootte en het type van de stent. In de beoordeelbare stents en peri-stent lumina
werd de aanwezigheid van significante in-stent restenose vastgesteld. Van de 65 stents waren 50
(77%) beoordeelbaar. In onbeoordeelbare stents werd vaker een grotere strutdikte (≥ 140 μm)
en/of een kleiner diameter (≤ 3.0 mm) gevonden in vergelijking met beoordeelbare stents. In de
beoordeelbare stents werd een sensitiviteit en specificiteit van 78% en 100% verkregen. Sensitiviteit
en specificiteit voor de beoordeling van peri-stent lumina waren 75% en 96%. Op basis van deze
resultaten is geconcludeerd dat in stents met een grotere diameter en relatief kleinere strutdikte,
16-slice MSCT gebruikt kan worden voor het uitsluiten van in-stent of peri-stent restenose.
De verwachting dat met 64-slice MSCT coronaire stents beter beoordeelbaar zouden kunnen zijn, is
onderzocht in Hoofdstuk 10. Recent ontwikkelde beeldvorming- en beoordelingsprotocollen zijn
toegepast bij 182 patiënten met een totaal van 192 stents. De MSCT beelden - verkregen met een 64-
slice Siemens Sensation en een 64-slice Toshiba Aquilion - werden beoordeeld op de aanwezigheid
van significante in-stent restenose met als goudstandaard kwantitatieve coronairangiografie. Slechts
stents met een diameter ≥ 2.5 mm werden geïncludeerd. In totaal kon 93% van de beschikbare stents
beoordeeld worden, met een sensitiviteit en een specificiteit van 95% en 93% in de beoordeelbare
stents. Geconcludeerd is dat in stents met voldoende diameter in-stent restenose betrouwbaar kan
worden beoordeeld. Met name de negatief voorspellende waarde is hoog, hetgeen er op wijst dat
MSCT het waardevolst is voor het niet-invasief uitsluiten van in-stent restenose.
In Hoofdstuk 11 is de waarde van 64-slice MSCT om stents te beoordelen in meer detail geëvalueerd.
In totaal ondergingen 50 patiënten een onderzoek met 64-slice MSCT in aanvulling op traditionele
coronairangiografie in combinatie met kwantitatieve coronairangiografie, of QCA. Voor elke stent
werd de beeldkwaliteit bepaald en vervolgens gerelateerd aan stentkarakteristieken en het hartritme.
In de beoordeelbare stents werd de aanwezigheid van significante (≥50%) in-stent restenosis bepaald.
Aangezien restenose ook frequent optreedt op de stentranden, werden ook de peri-stent lumina (5
mm proximaal en distaal) geëvalueerd. Van de 76 stents waren 65 (86%) beoordeelbaar. Een verhoogd
hartritme en overlappende plaatsing van meerdere stents bleken verband te houden met verminderde
beoordeelbaarheid. In de beoordeelbare stents werden een hoge sensitiviteit en specificiteit bereikt,
net als voor het identificeren van peri-stent restenose.
Alhoewel percutane interventies in toenemende mate toegepast worden bij de behandeling van
patiënten met coronairlijden, ondergaat nog steeds een aanzienlijk gedeelte van de patiënten
coronaire bypasschirurgie. In Hoofdstuk 12 wordt een nieuwe MRI sequentie geïntroduceerd om de
doorstroming in arteriële en veneuze omleidingen te meten. Hiervoor werd een “echo planar imaging”
(EPI) sequentie ontwikkeld en door middel van een fantoom gevalideerd tegen een “fast field echo”
(FFE) sequentie. Bij 17 gezonde vrijwilligers werd de doorstroming van de aorta gemeten door middel
van beide sequenties. In 5 patiënten werd de doorstroming in de linker arteriële omleidingen en aorta
gemeten in rust en tijdens adenosinestress. Op basis hiervan werd de doorstromingsreserve bepaald; bij
7 patiënten werd de doorstromingssnelheid gemeten in de veneuze omleiding. De fantoommetingen
brachten een uitstekende correlatie tussen de beide sequenties naar voren. Ook de doorstroming in
gezonde vrijwilligers toonde een goede correlatie. Tevens kon in patiënten met behulp van de nieuwe
sequentie de doorstroming gemeten worden in arteriële en veneuze omleidingen.
Samenvatting en Conclusie
380
Deel III
Op basis van de consistent hoge negatief voorspellende waarde van MSCT coronairangiografie wordt de
techniek beschouwd als een geschikt alternatief voor vroege diagnostiek in patiënten met verdenking
op coronairlijden. Van oudsher zijn echter de functionele beeldvormingtechnieken voor dit doeleinde
toegepast. Als gevolg hiervan wordt verwijzing naar traditionele coronairangiografie al tijden lang
bepaald op basis van de aanwezigheid en uitgebreidheid van ischemie (het hemodynamische gevolg
van een vernauwing). Daarentegen verschaft MSCT coronairangiografie directe informatie over de
coronairanatomie. Om de mogelijkheden evenals de beperkingen van deze nieuwe techniek beter op
waarde te schatten, en tevens een zo optimaal mogelijke integratie in de kliniek toe te staan, moeten
de prestaties van de techniek niet alleen vergeleken worden met traditionele coronairangiografie maar
ook met de veelvuldig gebruikte functionele beeldvormende technieken.
In Hoofdstuk 13 wordt een bijgewerkt overzicht gegeven van de verschillende niet-invasieve
beeldvormende technieken (zowel anatomische als functionele). Hun waarden en prestaties in
de diagnostiek en prognose van obstructief coronairlijden worden besproken. Tot slot wordt een
mogelijk algoritme voor de integratie van anatomische beeldvorming met MSCT en functionele
beeldvorming voorgesteld.
Om tot zulke algoritmes te komen, dient de relatie tussen niet-invasieve coronairangiografie met
MSCT en myocardiale perfusie scintigrafie (MPS) nader te worden bepaald. In Hoofdstuk 14 is dan
ook in een totaal of 114 patiënten die zich op de polikliniek presenteerden met een gemiddelde
voorafkans op coronairlijden, zowel MSCT als MPS (met behulp van gated SPECT) uitgevoerd. Tussen
normale kransslagaderen op het MSCT beeld en normale doorbloeding op het gated SPECT beeld
werd een goede overeenkomst (90%) gevonden. Daarentegen werd slechts bij 50% van de patiënten
met een significante vernauwing op de MSCT scan afwijkende perfusie gevonden. Het lijkt er dus op
dat een abnormaal MSCT onderzoek niet direct de aanwezigheid van een hemodynamisch relevante
vernauwing impliceert. Daar informatie over de aanwezigheid van ischemie noodzakelijk is om het
vervolgbeleid - de keuze tussen revascularisatie of meer terughoudende medicamenteuze therapie
- te bepalen, lijkt vervolgonderzoek met behulp van functionele beeldvorming noodzakelijk in
het geval van een afwijkend MSCT onderzoek. Anderzijds werd coronairlijden slechts in 46% van
de patiënten met een normaal MPS onderzoek volledig uitgesloten door MSCT. Deze bevinding
wijst erop dat normale doorbloeding van de hartspier niet per definitie betekent dat coronairlijden
afwezig is. Het combineren van beide technieken, hetzij door geïntegreerde, hetzij door sequentiële
beeldvorming, verdient wellicht de voorkeur en staat mogelijk preciezere cardiale beoordeling toe.
De verschuiving van het onderzoeksdoel die momenteel gaande is in de diagnostiek van
coronairlijden, namelijk de verschuiving van het uitsluitend opsporen van ischemie naar de
opsporing van (sub)klinische atherosclerose, wordt in Hoofdstuk 15 gedetailleerder besproken.
Hoofdstuk 16 beschrijft de relatie tussen de bepaling van de kalkscore, MSCT coronairangiografie
en MPS in een ongeselecteerde populatie bestaand uit patiënten zowel bekend met als verdacht
van coronairlijden. Analyse van de resultaten op regionaal niveau (kransslagader versus het
bijbehorende stroomgebied van de hartspier), liet normale doorbloeding zien in 87% van de
kransslagaderen met een calcium score <10. Daarentegen was dit percentage significant lager (54%)
Samenvatting en Conclusie

381
in kransslagaderen met uitgebreide verkalkingen (calcium score >400). Ook in kransslagaderen
zonder zichtbare atherosclerose of met atherosclerose zonder vernauwingen werd in het
merendeel normale doorbloeding gevonden (89%). Het percentage normale MPS onderzoeken
was daarentegen significant lager in kransslagaderen met significante vernauwingen (59%) of met
totale of subtotale occlusies (8%). Desalniettemin toonde slechts 48% van de stroomgebieden met
normale doorbloeding ook afwezigheid van atherosclerose op de MSCT onderzoeken, terwijl niet-
significante en significante vernauwingen aanwezig waren in respectievelijk 40% en 12% van de
bijbehorende kransslagaderen.
Deze verschillen zijn verder onderzocht in Hoofdstuk 17. In een gedeelte van de patiënten is het
verschil tussen MPS en MSCT vergeleken met invasieve beeldvorming. Niet alleen het lumen van de
coronair, door middel van invasieve coronairangiografie, maar ook de coronairwand, door middel
van intravasculaire ultrasound of IVUS, werd onderzocht. Een goede overeenkomst werd gezien in
het geval van een afwijkend MPS onderzoek. Echter, een normaal MPS onderzoek ging in de meeste
patiënten gepaard met een afwijkend MSCT onderzoek. Ook waren bij de patiënten slechts geringe
afwijkingen op de traditionele coronairangiografie (gemiddelde stenose graad 26.5%) zichtbaar.
Beeldvorming van de coronairwand met IVUS liet in deze patiënten aanzienlijke plaque-opbouw
zien (gemiddelde plaque belasting 58%) zonder vermindering van het lumen oppervlak (gemiddeld
5.7 mm2). In patiënten met tegenstrijdige MSCT en MPS bevindingen lijkt deze discrepantie
verklaard te kunnen worden door de aanwezigheid van de atherosclerose die voornamelijk in de
wand gelokaliseerd is in plaats van zich uitbreidend naar het lumen.
Deel IV
Een specifieke eigenschap van MSCT is dat de techniek niet alleen het lumen laat zien maar ook
de opbouw van atherosclerotische plaques in de coronairwand. Terwijl dit tot discrepanties met
resultaten van andere technieken kan leiden, zoals beschreven in Deel IV, kan kennis van de
aanwezigheid en uitgebreidheid van atherosclerose ook voordelen bieden. Het is dan ook goed
mogelijk dat beoordeling van aanwezigheid en uitgebreidheid van coronairplaques een belangrijke
component van het MSCT onderzoek zal worden.
In Hoofdstuk 18 is de hypothese onderzocht dat MSCT verschillende patronen in atherosclerotische
plaques kan herkennen. MSCT werd uitgevoerd bij 22 patiënten met verdenking op een acuut
coronair syndroom (ACS) en vergeleken met 24 patiënten met stabiel coronairlijden. In patiënten
met stabiel coronairlijden werden voornamelijk gecalcificeerde plaques geïdentificeerd (89% van het
totaal). Daarentegen was een significant groter gedeelte van de gevonden plaques in patiënten met
ACS danwel niet-gecalcificeerd (18%) of een combinatie van gecalcificeerd en niet-gecalcificeerd
weefsel (36%). Vergelijking van de culprit vaten met de niet-culprit vaten in de patiënten met ACS liet
bovendien zien dat ook in de niet-culprit vaten verscheidene niet-gecalcificeerde plaques aanwezig
waren, hetgeen wijst op de aanwezigheid van uitgebreide en diffuse in plaats van plaatselijk
beperkte atherosclerose in deze patiënten groep. Vervolgonderzoek dient uit te wijzen of deze
gevonden verschillen ook prospectief kunnen worden gebruikt om patiënten met een verhoogd
risico op ACS op niet-invasieve wijze te identificeren.
Samenvatting en Conclusie

382
In Hoofdstuk 19 is de invloed onderzocht van type 2 diabetes op MSCT plaquekarakteristieken
zoals de uitgebreidheid en het type. In een populatie van 215 patiënten, waarvan 40% met type
2 diabetes werd MSCT uitgevoerd. Significante verschillen werden gevonden tussen patiënten
met en zonder type 2 diabetes. De aanwezigheid van diabetes hield verband met het totaal aantal
atherosclerotisch aangetaste en het aantal niet-obstructieve vernauwde coronairsegmenten. De
hoeveelheid van zowel niet-gecalcificeerde als gecalcificeerde plaque was positief gecorreleerd met
de aanwezigheid van type 2 diabetes. Geen verschillen werden gevonden in de totale hoeveelheid
significante vernauwingen. Op basis van deze niet-invasieve MSCT bevindingen is geconcludeerd
dat type 2 diabetes gepaard gaat met een toegenomen hoeveelheid plaques die voornamelijk
niet-obstructief zijn. Gemengde plaques zijn beduidend minder aanwezig bij patiënten met type 2
diabetes.
Daar men met behulp van MSCT een schatting kan geven van de hoeveelheid atherosclerose in de
kransslagaderen en een onderscheid kan maken tussen verschillende atherosclerotische patronen,
is het aannemelijk dat de informatie die MSCT verschaft gebruikt kan worden voor risicostratificatie.
Hoofdstuk 20 beschrijft de bevindingen bij 100 patiënten die gedurende een periode van gemiddeld
16 maanden gevolgd zijn voor het optreden van coronaire gebeurtenissen nadat zij een MSCT scan
hadden ondergaan. Tijdens de follow-up traden 33 gebeurtenissen op bij 26 patiënten. In patiënten
met volledig normale kransslagaderen op MSCT werd in het eerste jaar een complicatiefrequentie
van 0% gezien in vergelijking tot 30% bij patiënten met aanwijzingen voor coronairlijden op MSCT.
Multivariate analyse, waarbij gecorrigeerd werd voor patiëntenkarakteristieken, toonde aan dat
de aanwezigheid van coronairlijden, significant coronairlijden, significant coronairlijden in de
hoofdstam, het aantal segmenten met plaques, het aantal segmenten met obstructieve plaques, en
het aantal segmenten met mixed plaques significante voorspellers zijn van coronaire gebeurtenissen.
Op basis van dit hoofdstuk is geconcludeerd dat MSCT coronairangiografie onafhankelijk van
patiëntenkarakteristieken belangrijke prognostische informatie kan verschaffen. In het bijzonder is
van belang dat een de uitstekende prognose van patiënten met een normaal MSCT onderzoek is
gevonden, hetgeen laat zien dat MSCT veilig uitsluiten van coronairlijden toestaat.
Deel V
In het laatste gedeelte van de thesis worden niet-coronaire toepassingen van MSCT en MRI
beschreven.
Contrast MRI staat precieze afgrenzing van infarctweefsel toe. Hierbij kan ook de mate van
transmuraliteit worden bepaald. In Hoofdstuk 21 werd visuele beoordeling van de infarct
transmuraliteit vergeleken met kwantitatieve bepaling. Hiernaast werd infarct transmuraliteit
gerelateerd aan de ernst van bewegingsstoornissen in rust. Beeldvorming met MRI werd uitgevoerd
bij 27 patiënten met langdurig ischemische LV disfunctie op basis van een eerder doorgemaakt
infarct. Zowel cine MRI (om de regionale wandbeweging te beoordelen) als contrast MRI (om het
infarctweefsel te detecteren) werden uitgevoerd in rust en visueel geanalyseerd. Hiervoor werd
een 17 segments model gebruikt. De mate van transmuraliteit werd tevens gekwantificeerd op
basis van drempelanalyse. Een goede overeenkomst tussen visuele en kwantitatieve analyses werd
Samenvatting en Conclusie

383
gevonden en 90% van de myocardsegmenten werden vergelijkbaar geclassificeerd. De mate van
transmuraliteit hield verband met de ernst van wandbewegingsstoornissen; 96% van de segmenten
met normale of slechts geringe afwijkende wandbeweging lieten infarcering van ≤25% van de
wand zien. Daarentegen was in 93% van segmenten met akinesie of dyskinesie >50% van de wand
betrokken. Geconcludeerd is dat, in vergelijking tot kwantitatieve analyse, visuele analyse van
contrast MRI studies voldoende is voor de beoordeling van de mate van infarct transmuraliteit.
Informatie aangaande infarctweefsel kan ook verkregen worden met MSCT. Aangezien een
3D dataset wordt verkregen tijdens registratie van het ECG, kunnen beelden gereconstrueerd
worden in de korte-as oriëntatie op elk tijdstip van de hartcyclus. Bovendien worden de beelden
verkregen tijdens de toediening van een contrast bolus, resulterend in beelden tijdens de eerste
passage van contrast. Als gevolg hiervan kunnen gebieden met verminderde doorbloeding worden
herkend als hypodense gebieden. Het doel van Hoofdstuk 22 was om met MSCT de haalbaarheid
te onderzoeken van een compleet cardiaal onderzoek, inclusief beoordeling van LV functie en
doorbloeding in combinatie met de coronairanatomie. Bij 21 patiënten met een doorgemaakt
infarct werd MSCT in aanvulling op traditionele coronairangiografie (beoordeling coronairanatomie)
en gated SPECT (beoordeling doorbloeding en functie) uitgevoerd. In vergelijking met traditionele
coronairangiografie bereikte MSCT een sensitiviteit en specificiteit van 91% en 97%. Een uitstekende
overeenstemming werd gezien in de bepaling van LVEF en regionale wandbeweging tussen
MSCT en gated SPECT. Met betrekking tot de beoordeling van doorbloeding in rust identificeerde
MSCT 93% van gebieden met hypoperfusie correct, terwijl tevens de afwezigheid van een
doorbloedingsstoornis correct beschreven werd in 98%.
Hoofdstuk 23 beschrijft de resultaten van onze validatie van functie metingen met MSCT in een
groot patiëntencohort. Globale functie (LV volumina en EF) werd bepaald met 16-slice MSCT en
vergeleken met 2D-echocardiografie. Lineaire regressie liet uitstekende correlaties zien alhoewel
een geringe overschatting van LVEF met MSCT werd gezien.
Tot slot is in Hoofdstuk 24 een zeer nieuwe toepassing van MSCT coronairangiografie, namelijk
de weergave van het cardiale veneuze systeem, onderzocht. Voor succesvolle implantatie van
de LV draad bij cardiale resynchronisatie behandeling kan kennis van het veneuze systeem
zeer bruikbaar zijn. In deze studie werd dan ook de aanwezigheid van de verschillende venen
onderzocht bij 100 patiënten (38 patiënten met significant coronairlijden, 34 met een doorgemaakt
infarct en 28 patiënten als controle groep). De sinus coronarius en diens eerste zijtak, de posterior
interventriculaire vene, werden geïdentificeerd in alle patiënten. Daarentegen bleek bij patiënten
met een doorgemaakt infarct de linker marginale vene frequent te ontbreken, hetgeen succesvolle
implantatie van de LV draad bij cardiale resynchronisatie behandeling zou kunnen verhinderen.
Conclusie
Verscheidene modaliteiten zijn beschikbaar in de diagnostiek en risicostratificatie van patiënten
die zich presenteren met bekend of verdenking op coronairlijden. Een in het bijzonder snel
ontwikkelende techniek is niet-invasieve coronairangiografie met MSCT. In vergelijking met invasieve
Samenvatting en Conclusie

384
coronairangiografie is aangetoond dat de techniek zeer nauwkeurig significante vernauwingen kan
opsporen en momenteel een geschiktere techniek is voor niet-invasieve coronairangiografie dan MRI.
Gelet op de hoge negatief voorspellende waarde ligt de voornaamste bijdrage van de techniek in het
uitsluiten van coronairlijden op niet-invasieve wijze in patiënten met verdenking op coronairlijden
en gemiddelde voorafkans hierop. Hoewel beeldvorming in patiënten met bekend coronairlijden,
zoals patiënten met eerdere stent implantatie, lastiger lijkt, zijn ook in deze patiëntenpopulaties
veelbelovende resultaten verkregen.
Ondanks deze veelbelovende observaties dient men zich te realiseren dat slechts de helft van de
vernauwingen die op MSCT gezien worden hemodynamische gevolgen lijkt te hebben. Deze
bevindingen wijzen erop dat de aanwezigheid van coronairatherosclerose, zelfs wanneer deze leidt
tot vernauwing, niet altijd de aanwezigheid van ischemie impliceert. Zodoende blijft in het geval
van twijfelachtige stenosering of beperkte beeldkwaliteit op MSCT functionele beeldvorming
noodzakelijk om de aanwezigheid van ischemie te bepalen. Voor dit doel kunnen nucleaire
beeldvorming, stress echocardiografie of MRI worden toegepast. Met de laatste techniek kan zelfs
de bloeddoorstroming gemeten worden in coronaire omleidingen. Wellicht zullen metingen in de
natieve kransslagaderen in de toekomst ook worden uitgevoerd.
Een van de grote voordelen van MSCT is de zeer vroegtijdige detectie van coronairlijden. Onderzoek
heeft laten zien dat MSCT verschillende plaque-karakteristieken kan onderscheiden tussen
verschillende klinische presentaties zoals bij patiënten met ACS. Het is zeer goed mogelijk dat deze
informatie nuttig kan zijn voor verfijning van risicostratificatie. Tot slot, in aanvulling op informatie
over de coronairanatomie, kan ook andere, niet-coronair gerelateerde, informatie verkregen
worden met deze techniek. De LV functie kan betrouwbaar worden bepaald terwijl bijvoorbeeld ook
informatie over de doorbloeding in rust of het cardiale veneuze systeem kan worden verkregen.
Terugkerend naar de behandeling van coronairlijden lijkt integratie van MSCT coronairangiografie
met functionele beeldvorming de geschiktste strategie. Op deze wijze kan coronairlijden met
hoge zekerheid worden uitgesloten of juist vroegtijdig worden gedetecteerd. In het laatste geval
kan de behandeling vervolgens worden bepaald aan de hand van de aanwezigheid van ischemie.
Men dient zich evenwel te realiseren dat de beschikbare data op dit gebied nog spaarzaam zijn.
Vervolgstudies moeten aantonen of toepassing van zulke strategieën tot een patiëntenbeleid zal
leiden dat resulteert in zowel een verbeterde uitkomst als besparing van kosten.
Samenvatting en Conclusie

List of Publications


387List of Publications
List of PublicationsSchuijf JD, Kaandorp TA, Lamb HJ, van der Geest RJ, Viergever EP, van der Wall EE, de Roos A, Bax JJ. Quantification of myocardial infarct size and transmurality by contrast-enhanced magnetic resonance imaging in men. Am J Cardiol. 2004;94:284-288.
Schuijf JD, Bax JJ, Jukema JW, Lamb HJ, Warda HM, Vliegen HW, de Roos A, van der Wall EE. Feasibility of assessment of coronary stent patency using 16-slice computed tomography. Am J Cardiol. 2004;94:427-430.
Schuijf JD, Bax JJ, Jukema JW, Lamb HJ, Dirksen MS, van der Wall EE, de Roos A. Coronary stent imaging with multidetector row computed tomography. Int J Cardiovasc Imaging. 2004;20:341-344.
Schuijf JD, Bax JJ, Jukema JW, Lamb HJ, Vliegen HW, Salm LP, de Roos A, van der Wall EE. Noninvasive angiography and assessment of left ventricular function using multislice computed tomography in patients with type 2 diabetes. Diabetes Care. 2004;27:2905-2910.
Schuijf JD, Shaw LJ, Wijns W, Lamb HJ, Poldermans D, de Roos A, van der Wall EE, Bax JJ. Cardiac imaging in coronary artery disease: differing modalities. Heart. 2005;91:1110-1117.
Schuijf JD, Bax JJ, Salm LP, Jukema JW, Lamb HJ, van der Wall EE, de Roos A. Noninvasive coronary imaging and assessment of left ventricular function using 16-slice computed tomography. Am J Cardiol. 2005;95:571-574.
Schuijf JD, Kaandorp TA, Jukema JW, Lamb HJ, de Roos A, van der Wall EE, Bax JJ. Noninvasive evaluation of coronary artery disease: magnetic resonance imaging and multislice computed tomography. Future Cardiology 2005; 1: 79-86
Schuijf JD, Bax JJ, Jukema JW, Lamb HJ, Vliegen HW, van der Wall EE, de Roos A. Noninvasive evaluation of the coronary arteries with multislice computed tomography in hypertensive patients. Hypertension. 2005;45:227-232.
Schuijf JD, Bax JJ, van der Wall EE. Non-invasive visualization of the coronary arteries with multi-detector row computed tomography; influence of technical advances on clinical applicability. Int J Cardiovasc Imaging. 2005;21:343-345.
Schuijf JD, Bax JJ, Shaw LJ, de Roos A, Lamb HJ, van der Wall EE, Wijns W. Meta-analysis of comparative diagnostic performance of magnetic resonance imaging and multislice computed tomography for noninvasive coronary angiography. Am Heart J. 2006;151:404-411.
Schuijf JD, Mollet NR, Cademartiri F, Jukema JW, Lamb HJ, de Roos A, van der Wall EE, de Feyter PJ, Bax JJ. Do risk factors influence the diagnostic accuracy of noninvasive coronary angiography with multislice computed tomography? J Nucl Cardiol. 2006;13:635-641.
Schuijf JD, Pundziute G, Jukema JW, Lamb HJ, van der Hoeven BL, de Roos A, van der Wall EE, Bax JJ. Diagnostic accuracy of 64-slice multislice computed tomography in the noninvasive evaluation of significant coronary artery disease. Am J Cardiol. 2006;98:145-148.

388
Schuijf JD, Poldermans D, Shaw LJ, Jukema JW, Lamb HJ, de Roos A, Wijns W, van der Wall EE, Bax JJ. Diagnostic and prognostic value of non-invasive imaging in known or suspected coronary artery disease. Eur J Nucl Med Mol Imaging. 2006;33:93-104.
Schuijf JD, Bax JJ, Jukema JW, van der Wall EE. Screening of asymptomatic individuals for coronary disease using CT-calcium measurement in the coronary arteries. Ned Tijdschr Geneeskd. 2006;150:597-600.
Schuijf JD, Wijns W, Jukema JW, Atsma DE, de Roos A, Lamb HJ, Stokkel MP, Dibbets-Schneider P, Decramer I, De Bondt P, van der Wall EE, Vanhoenacker PK, Bax JJ. Relationship between noninvasive coronary angiography with multi-slice computed tomography and myocardial perfusion imaging. J Am Coll Cardiol. 2006;48:2508-2514.
Schuijf JD, Wijns W, Jukema JW, Decramer I, Atsma DE, de Roos A, Stokkel MP, Dibbets-Schneider P, van der Wall EE, Bax JJ. A comparative regional analysis of coronary atherosclerosis and calcium score on multislice CT versus myocardial perfusion on SPECT. J Nucl Med. 2006;47:1749-1755.
Schuijf JD, van der Wall EE, Bax JJ. Quantification of multi-slice computed tomography coronary angiography: current status and future directions. Acute Card Care. 2006;8:105-106.
Schuijf JD, Jongbloed MRM, Jukema JW, Lamb HJ, van der Wall EE, de Roos A, Bax JJ. Clinical applications of cardiac multislice computed tomography. Current Medical Imaging Reviews 2006.
Schuijf JD, Bax JJ. What is the future of coronary imaging? Medicographica 2006.
Schuijf JD, Bax JJ, Jukema JW, Lamb HJ, Salm LP, de Roos A, van der Wall EE. Assessment of left ventricular volumes and ejection fraction with 16-slice multi-slice computed tomography; comparison with 2D-echocardiography. Int J Cardiol. 2007;116:201-205.
Schuijf JD, van der Wall EE, Bax JJ. Changing paradigm: atherosclerosis versus ischaemia. Eur J Nucl Med Mol Imaging. 2007;34:1-3.
Schuijf JD, Beck T, Burgstahler C, Jukema JW, Dirksen MS, de Roos A, van der Wall EE, Schroeder S, Wijns W, Bax JJ. Differences in plaque composition and distribution in stable coronary artery disease versus acute coronary syndromes; non-invasive evaluation with multi-slice computed tomography. Acute Card Care. 2007;9:48-53.
Schuijf JD, Bax JJ, van der Wall EE. Screening for coronary artery disease in asymptomatic diabetic patients. European Cardiovascular Disease 2007
Schuijf JD, Bax JJ. Perspectives of New Imaging Techniques for Patients with Known or Suspected Coronary Artery Disease. Heart Metab 2007;34: 1-5
List of Publications

389
Schuijf JD, Pundziute GP, Bax JJ. Prognostic Value of Multi-Slice Computed Tomography Coronary Angiography. Cardiology Review 2007
Schuijf JD, Bax JJ. Noninvasive Coronary Angiography with Multi-Slice Computed Tomography versus Myocardial Perfusion Imaging. Cardiology Review 2007
Schuijf JD, Jukema JW, van der Wall EE, Bax JJ. The Current Status of Multi-Slice Computed Tomography in the Diagnosis and Prognosis in Coronary Artery Disease. J Nucl Cardiol 2007;14:604-12.
Schuijf JD, Jukema JW, van der Wall EE, Bax JJ. Multi-Slice Computed Tomography in the Evaluation of Patients with Acute Chest Pain. Acute Cardiac Care 2008 (In Press).
Schuijf JD, Pundziute G, Jukema JW, Lamb HJ, Tuinenburg JC, van der Hoeven BL, de Roos A, Reiber JHC, van der Wall EE, Schalij MJ, and Bax JJ. Evaluation of patients with previous coronary stent implantation using 64-slice Multi-Slice Computed Tomography. Radiology 2007 (In Press).
Schuijf JD, van Werkhoven JM, Pundziute G, Jukema JW, Decramer I, Stokkel MPM, Dibbets-Schneider P, Schalij MJ, Reiber JHC, van der Wall EE, Wijns W, Bax JJEvaluation of coronary artery disease: implications of invasive versus non-invasive imagingSubmitted
Bax JJ, Schuijf JD. Which patients should be referred for non-invasive angiography with multi-slice CT? Int J Cardiol. 2007;114:1-3.
Bax JJ, Schuijf JD. Which role for multislice computed tomography in clinical cardiology? Am Heart J. 2005;149:960-961.
Bax JJ, Schuijf JD, van der Wall EE. Non-invasive imaging for the detection of coronary artery disease. Ned Tijdschr Geneeskd. 2007;151:799-804.
Bax JJ, Poldermans D, Schuijf JD, Scholte AJ, Elhendy A, van der Wall EE. Imaging to differentiate between ischemic and nonischemic cardiomyopathy. Heart Fail Clin. 2006;2:205-214.
Bax JJ, Inzucchi SE, Bonow RO, Schuijf JD, Freeman MR, Barrett E. Cardiac Imaging for Risk Stratification in Diabetes. Diabetes Care. 2007; 30: 1295-304.
Cademartiri F, Schuijf JD, Pugliese F, Mollet NR, Jukema JW, Maffei E, Kroft LJ, Palumbo A, Ardissino D, Serruys PW, Krestin GP, van der Wall EE, de Feyter PJ, Bax JJ. Usefulness of 64-slice multislice computed tomography coronary angiography to assess in-stent restenosis. J Am Coll Cardiol. 2007;49:2204-2210.
Cademartiri F, Schuijf JD, Mollet NR, Malagutti P, Runza G, Bax JJ, de Feyter PJ. Multislice CT coronary angiography: how to do it and what is the current clinical performance? Eur J Nucl Med Mol Imaging. 2005;32:1337-1347.
List of Publications

390
Delgado V, Tops LF, Schuijf JD, Brugada J, Schalij MJ, Thomas JD, Bax JJ. Assessment of Mitral Valve Anatomy and Geometry with 64-slice Multislice Computed Tomography. Submitted
Dogan H, Kroft LJ, Bax JJ, Schuijf JD, van der Geest RJ, Doornbos J, de Roos A. MDCT assessment of right ventricular systolic function. AJR Am J Roentgenol. 2006;186:S366-S370.
Henneman MM, Schuijf JD, Jukema JW, Lamb HJ, de Roos A, Dibbets P, Stokkel MP, van der Wall EE, Bax JJ. Comprehensive cardiac assessment with multislice computed tomography: evaluation of left ventricular function and perfusion in addition to coronary anatomy in patients with previous myocardial infarction. Heart. 2006;92:1779-1783.
Henneman MM, Schuijf JD, Jukema JW, Holman ER, Lamb HJ, de Roos A, van der Wall EE, Bax JJ. Assessment of global and regional left ventricular function and volumes with 64-slice MSCT: a comparison with 2D echocardiography. J Nucl Cardiol. 2006;13:480-487.
Henneman MM, Bax JJ, Schuijf JD, Jukema JW, Holman ER, Stokkel MP, Lamb HJ, de Roos A, van der Wall EE. Global and regional left ventricular function: a comparison between gated SPECT, 2D echocardiography and multi-slice computed tomography. Eur J Nucl Med Mol Imaging. 2006;33:1452-1460.
Henneman MM, Schuijf JD, van der Wall EE, Bax JJ. Non-invasive anatomical and functional imaging for the detection of coronary artery disease. Br Med Bull. 2006;79-80:187-202.
Henneman MM, Bax JJ, Schuijf JD, van der Wall EE. Noninvasive visualization of the coronary arteries with multi-slice computed tomography; influence of heart rate on diagnostic accuracy. Int J Cardiovasc Imaging. 2006;22:107-109.
Henneman MM, Schuijf JD, Dibbets-Schneider P, Stokkel MP, van der Geest RJ, van der Wall EE, Bax JJ. Comparison of multi-slice computed tomography to gated single photon emission computed tomography for imaging of healed myocardial infarcts. Am J Cardiol 2007 (In Press)
Henneman MM, Schuijf JD, Pundziute G, van Werkhoven JM, Jukema, JW, Bax JJ. Non-invasive evaluation with MSCT in suspected ACS: Plaque morphology on MSCT versus coronary calcium score. Submitted
Jongbloed MR, Lamb HJ, Bax JJ, Schuijf JD, de Roos A, van der Wall EE, Schalij MJ. Noninvasive visualization of the cardiac venous system using multislice computed tomography. J Am Coll Cardiol. 2005;45:749-753.
Kaandorp TA, Bax JJ, Schuijf JD, Viergever EP, Der Wall EE, de Roos A, Lamb HJ. Head-to-head comparison between contrast-enhanced magnetic resonance imaging and dobutamine magnetic resonance imaging in men with ischemic cardiomyopathy. Am J Cardiol. 2004;93:1461-1464.
Pundziute G, Schuijf JD, Jukema JW, Boersma E, de Roos A, van der Wall EE, Bax JJ. Prognostic value of multislice computed tomography coronary angiography in patients with known or suspected coronary artery disease. J Am Coll Cardiol. 2007;49:62-70.
List of Publications

391
Pundziute G, Schuijf JD, Bax JJ, van der Wall EE. Image assessment and post-processing with multislice CT angiography in highly calcified coronary arteries. Int J Cardiovasc Imaging. 2006;22:533-536.
Pundziute G, Schuijf JD, Jukema JW, van Werkhoven JM, Boersma E, de Roos A, van der Wall EE, Bax JJ. Gender Influence on the Diagnostic Accuracy of 64-Slice Multislice Computed Tomography Coronary Angiography for Detection of Obstructive Coronary Artery Disease. Heart. 2007 (In Press)
Pundziute G, Schuijf JD, Jukema JW, Lamb HJ, de Roos A, van der Wall EE, Bax JJ. Impact of coronary calcium score on diagnostic accuracy of multislice computed tomography coronary angiography for detection of coronary artery disease. J Nucl Cardiol. 2007;14:36-43.
Pundziute G, Schuijf JD, Jukema JW, de Roos A, van der Wall EE, Bax JJ. Advances in the noninvasive evaluation of coronary artery disease with multislice computed tomography. Expert Rev Med Devices. 2006;3:441-451.
Pundziute G, Schuijf JD, Jukema JW, Boersma E, Scholte AJ, Kroft LJ, van der Wall EE, Bax JJ. Non-Invasive Assessment of Plaque Characteristics With Multi-Slice Computed Tomography Coronary Angiography in Symptomatic Diabetic Patients. Diabetes Care. 2007;30:1113-1119.
Pundziute G, Schuijf JD, Jukema JW, van Werkhoven JM, Bax JJ.Which Parameters on Multi-slice Computed Tomographic Coronary Angiography Predict an Abnormal Exercise Test?Submitted
Salm LP, Schuijf JD, de Roos A, Lamb HJ, Vliegen HW, Jukema JW, Joemai R, van der Wall EE, Bax JJ. Global and regional left ventricular function assessment with 16-detector row CT: comparison with echocardiography and cardiovascular magnetic resonance. Eur J Echocardiogr. 2006;7:308-314.
Salm LP, Schuijf JD, Lamb HJ, Bax JJ, Vliegen HW, Jukema JW, van der Wall EE, de Roos A, Doornbos J. Validation of a high-resolution, phase contrast cardiovascular magnetic resonance sequence for evaluation of flow in coronary artery bypass grafts. J Cardiovasc Magn Reson. 2007;9:557-563.
Salm LP, Bax JJ, Jukema JW, Schuijf JD, Vliegen HW, Lamb HJ, van der Wall EE, de Roos A. Comprehensive assessment of patients after coronary artery bypass grafting by 16-detector-row computed tomography. Am Heart J. 2005;150:775-781.
Scholte AJHA, Schuijf JD, Kharagjitsingh AV, Jukema JW, Pundziute G, van der Wall EE, Bax JJ. Prevalence of coronary artery disease and plaque morphology assessed by multi-slice computed tomography coronary angiography and calcium scoring in asymptomatic patients with type 2 diabetes. Heart 2007 (In Press).
Tops LF, Van de Veire NR, Schuijf JD, de Roos A, van der Wall EE, Schalij MJ, Bax JJ. Noninvasive evaluation of coronary sinus anatomy and its relation to the mitral valve annulus: implications for percutaneous mitral annuloplasty. Circulation. 2007;115:1426-1432.
Tops LF, Wood DA, Delgado V, Schuijf JD, Mayo JR, Pasupati S, van der Wall EE, Schalij MJ, Webb JG, Bax JJNoninvasive Evaluation of the Aortic Root with Multislice Computed Tomography: Implications for Transcatheter Aortic Valve ReplacementSubmitted
List of Publications

392
Van de Veire NR, Schuijf JD, De Sutter J, Devos D, Bleeker GB, de Roos A, van der Wall EE, Schalij MJ, Bax JJ. Non-invasive visualization of the cardiac venous system in coronary artery disease patients using 64-slice computed tomography. J Am Coll Cardiol. 2006;48:1832-1838.
Van Werkhoven JM, Schuijf JD, Jukema JW, Kroft LJ, Stokkel MPM, Dibbets-Schneider P, Pundziute G, Scholte AH, van der Wall EE, Bax JJ.Anatomical correlates of a normal perfusion scan using sixty-four-section computed tomography coronary angiographyAm J Cardiol 2007 (In Press)
Bookchapters
Non-invasive imaging techniques in the detection and prognostication of coronary artery diseaseSchuijf JD, van der Wall EE, Bax JJChapter in: Nuclear Cardiac Imaging Oxford University Press, Inc.
Computer TomografieSchuijf JD, Jukema JW, Bax JJChapter in: Leerboek CardiologieBohn Stafleu van Loghum.
Cardiovascular magnetic resonance and computed tomography of coronary artery bypass grafts Salm LP, Bax JJ, Schuijf JD, Lamb HJ, Jukema JW, van der Wall EE, de Roos A.Chapter in: MRI and CT of the cardiovascular system. Second edition. Lippincott Williams & Williams.
Screening for coronary heart disease in patients with diabetes mellitusBax JJ, Schuijf JD, Poldermans DUp to Date 2007
List of Publications