Multimedia measurements and activity patterns in an observational pilot study of nine young children
14
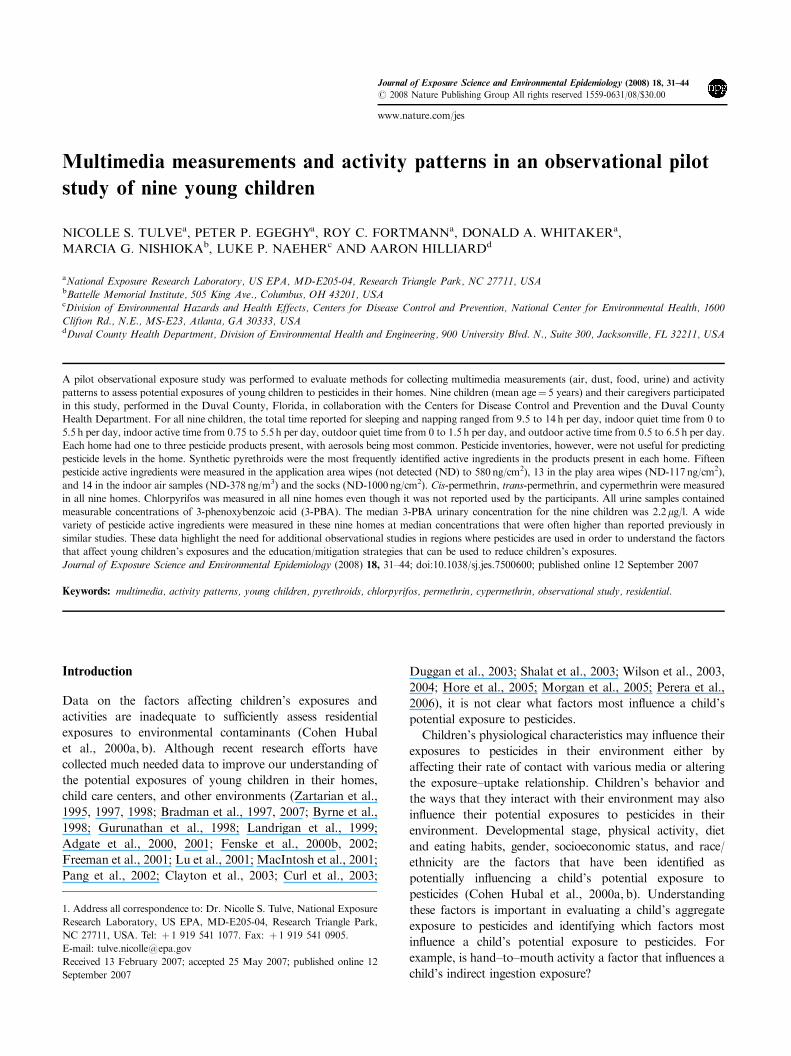
Multimedia measurements and activity patterns in an observational pilot study of nine young children NICOLLE S. TULVE a , PETER P. EGEGHY a , ROY C. FORTMANN a , DONALD A. WHITAKER a , MARCIA G. NISHIOKA b , LUKE P. NAEHER c AND AARON HILLIARD d a National Exposure Research Laboratory, US EPA, MD-E205-04, Research Triangle Park, NC 27711, USA b Battelle Memorial Institute, 505 King Ave., Columbus, OH 43201, USA c Division of Environmental Hazards and Health Effects, Centers for Disease Control and Prevention, National Center for Environmental Health, 1600 Clifton Rd., N.E., MS-E23, Atlanta, GA 30333, USA d Duval County Health Department, Division of Environmental Health and Engineering, 900 University Blvd. N., Suite 300, Jacksonville, FL 32211, USA A pilot observational exposure study was performed to evaluate methods for collecting multimedia measurements (air, dust, food, urine) and activity patterns to assess potential exposures of young children to pesticides in their homes. Nine children (mean age ¼ 5 years) and their caregivers participated in this study, performed in the Duval County, Florida, in collaboration with the Centers for Disease Control and Prevention and the Duval County Health Department. For all nine children, the total time reported for sleeping and napping ranged from 9.5 to 14 h per day, indoor quiet time from 0 to 5.5 h per day, indoor active time from 0.75 to 5.5 h per day, outdoor quiet time from 0 to 1.5 h per day, and outdoor active time from 0.5 to 6.5 h per day. Each home had one to three pesticide products present, with aerosols being most common. Pesticide inventories, however, were not useful for predicting pesticide levels in the home. Synthetic pyrethroids were the most frequently identified active ingredients in the products present in each home. Fifteen pesticide active ingredients were measured in the application area wipes (not detected (ND) to 580 ng/cm 2 ), 13 in the play area wipes (ND-117 ng/cm 2 ), and 14 in the indoor air samples (ND-378 ng/m 3 ) and the socks (ND-1000 ng/cm 2 ). Cis-permethrin, trans-permethrin, and cypermethrin were measured in all nine homes. Chlorpyrifos was measured in all nine homes even though it was not reported used by the participants. All urine samples contained measurable concentrations of 3-phenoxybenzoic acid (3-PBA). The median 3-PBA urinary concentration for the nine children was 2.2 mg/l. A wide variety of pesticide active ingredients were measured in these nine homes at median concentrations that were often higher than reported previously in similar studies. These data highlight the need for additional observational studies in regions where pesticides are used in order to understand the factors that affect young children’s exposures and the education/mitigation strategies that can be used to reduce children’s exposures. Journal of Exposure Science and Environmental Epidemiology (2008) 18, 31–44; doi:10.1038/sj.jes.7500600; published online 12 September 2007 Keywords: multimedia, activity patterns, young children, pyrethroids, chlorpyrifos, permethrin, cypermethrin, observational study, residential. Introduction Data on the factors affecting children’s exposures and activities are inadequate to sufficiently assess residential exposures to environmental contaminants (Cohen Hubal et al., 2000a, b). Although recent research efforts have collected much needed data to improve our understanding of the potential exposures of young children in their homes, child care centers, and other environments (Zartarian et al., 1995, 1997, 1998; Bradman et al., 1997, 2007; Byrne et al., 1998; Gurunathan et al., 1998; Landrigan et al., 1999; Adgate et al., 2000, 2001; Fenske et al., 2000b, 2002; Freeman et al., 2001; Lu et al., 2001; MacIntosh et al., 2001; Pang et al., 2002; Clayton et al., 2003; Curl et al., 2003; Duggan et al., 2003; Shalat et al., 2003; Wilson et al., 2003, 2004; Hore et al., 2005; Morgan et al., 2005; Perera et al., 2006), it is not clear what factors most influence a child’s potential exposure to pesticides. Children’s physiological characteristics may influence their exposures to pesticides in their environment either by affecting their rate of contact with various media or altering the exposure–uptake relationship. Children’s behavior and the ways that they interact with their environment may also influence their potential exposures to pesticides in their environment. Developmental stage, physical activity, diet and eating habits, gender, socioeconomic status, and race/ ethnicity are the factors that have been identified as potentially influencing a child’s potential exposure to pesticides (Cohen Hubal et al., 2000a, b). Understanding these factors is important in evaluating a child’s aggregate exposure to pesticides and identifying which factors most influence a child’s potential exposure to pesticides. For example, is hand–to–mouth activity a factor that influences a child’s indirect ingestion exposure? Received 13 February 2007; accepted 25 May 2007; published online 12 September 2007 1. Address all correspondence to: Dr. Nicolle S. Tulve, National Exposure Research Laboratory, US EPA, MD-E205-04, Research Triangle Park, NC 27711, USA. Tel: þ 1 919 541 1077. Fax: þ 1 919 541 0905. E-mail: [email protected] Journal of Exposure Science and Environmental Epidemiology (2008) 18, 31–44 r 2008 Nature Publishing Group All rights reserved 1559-0631/08/$30.00 www.nature.com/jes
-
Upload
independent -
Category
Documents
-
view
0 -
download
0
Transcript of Multimedia measurements and activity patterns in an observational pilot study of nine young children
Multimedia measurements and activity patterns in an observational pilot
study of nine young children
NICOLLE S. TULVEa, PETER P. EGEGHYa, ROY C. FORTMANNa, DONALD A. WHITAKERa,
MARCIA G. NISHIOKAb, LUKE P. NAEHERc AND AARON HILLIARDd
aNational Exposure Research Laboratory, US EPA, MD-E205-04, Research Triangle Park, NC 27711, USAbBattelle Memorial Institute, 505 King Ave., Columbus, OH 43201, USAcDivision of Environmental Hazards and Health Effects, Centers for Disease Control and Prevention, National Center for Environmental Health, 1600
Clifton Rd., N.E., MS-E23, Atlanta, GA 30333, USAdDuval County Health Department, Division of Environmental Health and Engineering, 900 University Blvd. N., Suite 300, Jacksonville, FL 32211, USA
A pilot observational exposure study was performed to evaluate methods for collecting multimedia measurements (air, dust, food, urine) and activity
patterns to assess potential exposures of young children to pesticides in their homes. Nine children (mean age¼ 5 years) and their caregivers participated
in this study, performed in the Duval County, Florida, in collaboration with the Centers for Disease Control and Prevention and the Duval County
Health Department. For all nine children, the total time reported for sleeping and napping ranged from 9.5 to 14 h per day, indoor quiet time from 0 to
5.5 h per day, indoor active time from 0.75 to 5.5 h per day, outdoor quiet time from 0 to 1.5 h per day, and outdoor active time from 0.5 to 6.5 h per day.
Each home had one to three pesticide products present, with aerosols being most common. Pesticide inventories, however, were not useful for predicting
pesticide levels in the home. Synthetic pyrethroids were the most frequently identified active ingredients in the products present in each home. Fifteen
pesticide active ingredients were measured in the application area wipes (not detected (ND) to 580 ng/cm2), 13 in the play area wipes (ND-117 ng/cm2),
and 14 in the indoor air samples (ND-378 ng/m3) and the socks (ND-1000 ng/cm2). Cis-permethrin, trans-permethrin, and cypermethrin were measured
in all nine homes. Chlorpyrifos was measured in all nine homes even though it was not reported used by the participants. All urine samples contained
measurable concentrations of 3-phenoxybenzoic acid (3-PBA). The median 3-PBA urinary concentration for the nine children was 2.2mg/l. A wide
variety of pesticide active ingredients were measured in these nine homes at median concentrations that were often higher than reported previously in
similar studies. These data highlight the need for additional observational studies in regions where pesticides are used in order to understand the factors
that affect young children’s exposures and the education/mitigation strategies that can be used to reduce children’s exposures.
Journal of Exposure Science and Environmental Epidemiology (2008) 18, 31–44; doi:10.1038/sj.jes.7500600; published online 12 September 2007
Keywords: multimedia, activity patterns, young children, pyrethroids, chlorpyrifos, permethrin, cypermethrin, observational study, residential.
Introduction
Data on the factors affecting children’s exposures and
activities are inadequate to sufficiently assess residential
exposures to environmental contaminants (Cohen Hubal
et al., 2000a, b). Although recent research efforts have
collected much needed data to improve our understanding of
the potential exposures of young children in their homes,
child care centers, and other environments (Zartarian et al.,
1995, 1997, 1998; Bradman et al., 1997, 2007; Byrne et al.,
1998; Gurunathan et al., 1998; Landrigan et al., 1999;
Adgate et al., 2000, 2001; Fenske et al., 2000b, 2002;
Freeman et al., 2001; Lu et al., 2001; MacIntosh et al., 2001;
Pang et al., 2002; Clayton et al., 2003; Curl et al., 2003;
Duggan et al., 2003; Shalat et al., 2003; Wilson et al., 2003,
2004; Hore et al., 2005; Morgan et al., 2005; Perera et al.,
2006), it is not clear what factors most influence a child’s
potential exposure to pesticides.
Children’s physiological characteristics may influence their
exposures to pesticides in their environment either by
affecting their rate of contact with various media or altering
the exposure–uptake relationship. Children’s behavior and
the ways that they interact with their environment may also
influence their potential exposures to pesticides in their
environment. Developmental stage, physical activity, diet
and eating habits, gender, socioeconomic status, and race/
ethnicity are the factors that have been identified as
potentially influencing a child’s potential exposure to
pesticides (Cohen Hubal et al., 2000a, b). Understanding
these factors is important in evaluating a child’s aggregate
exposure to pesticides and identifying which factors most
influence a child’s potential exposure to pesticides. For
example, is hand–to–mouth activity a factor that influences a
child’s indirect ingestion exposure?Received 13 February 2007; accepted 25 May 2007; published online 12
September 2007
1. Address all correspondence to: Dr. Nicolle S. Tulve, National Exposure
Research Laboratory, US EPA, MD-E205-04, Research Triangle Park,
NC 27711, USA. Tel: þ 1 919 541 1077. Fax: þ 1 919 541 0905.
E-mail: [email protected]
Journal of Exposure Science and Environmental Epidemiology (2008) 18, 31–44
r 2008 Nature Publishing Group All rights reserved 1559-0631/08/$30.00
www.nature.com/jes
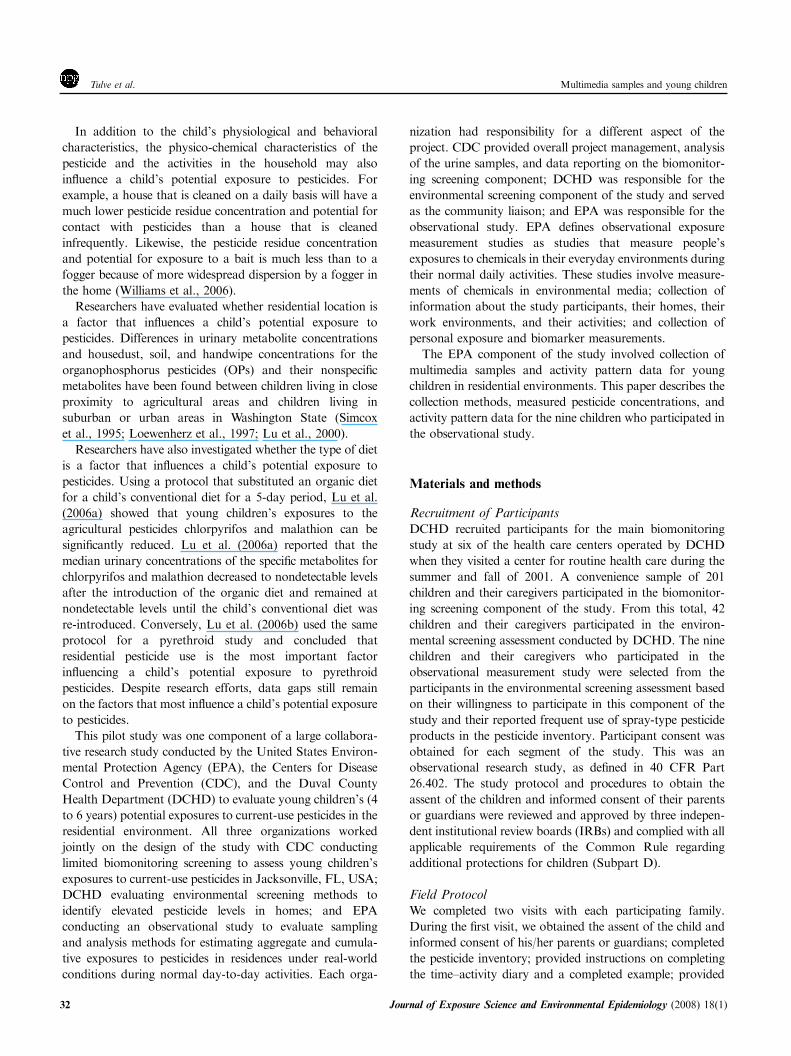
In addition to the child’s physiological and behavioral
characteristics, the physico-chemical characteristics of the
pesticide and the activities in the household may also
influence a child’s potential exposure to pesticides. For
example, a house that is cleaned on a daily basis will have a
much lower pesticide residue concentration and potential for
contact with pesticides than a house that is cleaned
infrequently. Likewise, the pesticide residue concentration
and potential for exposure to a bait is much less than to a
fogger because of more widespread dispersion by a fogger in
the home (Williams et al., 2006).
Researchers have evaluated whether residential location is
a factor that influences a child’s potential exposure to
pesticides. Differences in urinary metabolite concentrations
and housedust, soil, and handwipe concentrations for the
organophosphorus pesticides (OPs) and their nonspecific
metabolites have been found between children living in close
proximity to agricultural areas and children living in
suburban or urban areas in Washington State (Simcox
et al., 1995; Loewenherz et al., 1997; Lu et al., 2000).
Researchers have also investigated whether the type of diet
is a factor that influences a child’s potential exposure to
pesticides. Using a protocol that substituted an organic diet
for a child’s conventional diet for a 5-day period, Lu et al.
(2006a) showed that young children’s exposures to the
agricultural pesticides chlorpyrifos and malathion can be
significantly reduced. Lu et al. (2006a) reported that the
median urinary concentrations of the specific metabolites for
chlorpyrifos and malathion decreased to nondetectable levels
after the introduction of the organic diet and remained at
nondetectable levels until the child’s conventional diet was
re-introduced. Conversely, Lu et al. (2006b) used the same
protocol for a pyrethroid study and concluded that
residential pesticide use is the most important factor
influencing a child’s potential exposure to pyrethroid
pesticides. Despite research efforts, data gaps still remain
on the factors that most influence a child’s potential exposure
to pesticides.
This pilot study was one component of a large collabora-
tive research study conducted by the United States Environ-
mental Protection Agency (EPA), the Centers for Disease
Control and Prevention (CDC), and the Duval County
Health Department (DCHD) to evaluate young children’s (4
to 6 years) potential exposures to current-use pesticides in the
residential environment. All three organizations worked
jointly on the design of the study with CDC conducting
limited biomonitoring screening to assess young children’s
exposures to current-use pesticides in Jacksonville, FL, USA;
DCHD evaluating environmental screening methods to
identify elevated pesticide levels in homes; and EPA
conducting an observational study to evaluate sampling
and analysis methods for estimating aggregate and cumula-
tive exposures to pesticides in residences under real-world
conditions during normal day-to-day activities. Each orga-
nization had responsibility for a different aspect of the
project. CDC provided overall project management, analysis
of the urine samples, and data reporting on the biomonitor-
ing screening component; DCHD was responsible for the
environmental screening component of the study and served
as the community liaison; and EPA was responsible for the
observational study. EPA defines observational exposure
measurement studies as studies that measure people’s
exposures to chemicals in their everyday environments during
their normal daily activities. These studies involve measure-
ments of chemicals in environmental media; collection of
information about the study participants, their homes, their
work environments, and their activities; and collection of
personal exposure and biomarker measurements.
The EPA component of the study involved collection of
multimedia samples and activity pattern data for young
children in residential environments. This paper describes the
collection methods, measured pesticide concentrations, and
activity pattern data for the nine children who participated in
the observational study.
Materials and methods
Recruitment of ParticipantsDCHD recruited participants for the main biomonitoring
study at six of the health care centers operated by DCHD
when they visited a center for routine health care during the
summer and fall of 2001. A convenience sample of 201
children and their caregivers participated in the biomonitor-
ing screening component of the study. From this total, 42
children and their caregivers participated in the environ-
mental screening assessment conducted by DCHD. The nine
children and their caregivers who participated in the
observational measurement study were selected from the
participants in the environmental screening assessment based
on their willingness to participate in this component of the
study and their reported frequent use of spray-type pesticide
products in the pesticide inventory. Participant consent was
obtained for each segment of the study. This was an
observational research study, as defined in 40 CFR Part
26.402. The study protocol and procedures to obtain the
assent of the children and informed consent of their parents
or guardians were reviewed and approved by three indepen-
dent institutional review boards (IRBs) and complied with all
applicable requirements of the Common Rule regarding
additional protections for children (Subpart D).
Field ProtocolWe completed two visits with each participating family.
During the first visit, we obtained the assent of the child and
informed consent of his/her parents or guardians; completed
the pesticide inventory; provided instructions on completing
the time–activity diary and a completed example; provided
Multimedia samples and young childrenTulve et al.
32 Journal of Exposure Science and Environmental Epidemiology (2008) 18(1)
the cotton socks, duplicate diet collection containers, urine
specimen collection cups and instructions on their uses, and
collection schedules; and set up the indoor and outdoor air
samplers. During the second visit, we reviewed the time–
activity diary for completeness, collected all samples, and
provided monetary compensation to the participants. The
activity collection instruments and multimedia samples collected
in this study included the time–activity diary, pesticide
inventory, indoor and outdoor air samples, surface wipe
samples, clothing (socks), duplicate diet, and urine samples.
Activity Collection Instruments
Time–Activity DiaryEach caregiver completed a 24-h time–activity diary for his/
her participating child during the observational study. The
diary was divided into two time periods, with time period one
including the time from when the child woke up to lunch time
and time period two including from lunch time to when the
child went to sleep. Identical information was asked in each
time period and included the time indoors, outdoors, and
away from home; locations occupied; surfaces contacted
(carpet/rugs, hard floor, upholstered furniture, bedding,
grass, dirt, paved surfaces, wood, other); activities that the
child engaged in; activity level (active play, quiet play,
napping/sleeping); and type of clothing worn (long-sleeved
clothing, short-sleeved clothing, legs and ankles covered, legs
partially covered).
Pesticide InventoryA pesticide inventory was completed by the field technician
and the primary caregiver by inspection of containers and use
of a recall survey. Information was collected for the brand
name, type of product, EPA registration number, label
copyright year, date last used, frequency of use in the last 6
months, purpose for use, and where applied in the home.
Information was also collected for any professional applica-
tions and/or for products that may have recently been used,
but for which there were no longer containers of the product
in the home.
Multimedia SamplesIndoor and outdoor air samples were collected at each
participant’s home during a 24-h monitoring event with a
pre-cleaned polyurethane foam (PUF) plug attached to a
constant-flow battery powered pump operating at a flow rate
of approximately 3.8 l/min. Indoor air samples were collected
in the main play area of the house from a height
approximating the child’s breathing zone (1 m as measured
from the floor), while outdoor samples were collected from
the front yard at a height of 1.5m, similar to the method used
by Bradman et al. (2007).
One surface wipe sample was collected from the main play
area of the house and another surface wipe sample was
collected from an area where the caregiver reported past
pesticide application(s). Wipe samples were collected from a
929 cm2 area on a hard surface using Johnson & Johnson
SOF-WICKt dressing sponges wetted with 10 ml of
isopropanol (Tulve et al., 2006a).
Duplicate diet samples were collected during the 24-h
monitoring period. To collect the duplicate diet, each
caregiver was asked to monitor the amount of food
consumed by the participating child during breakfast, lunch,
dinner, and snack times, and place an exact copy of the foods
consumed into the solid food and liquid food sampling
containers (Thomas et al., 1997; Bradman et al., 2007). The
food sampling containers were stored in the participant’s
refrigerator until the field technicians arrived at the home to
collect the samples.
Socks (80% cotton/20% polyester, Cuddly Soft
Brand, Childrenswear Centres, Piscataway, NJ, USA, www.
childrenswearcentre.com) were used to estimate the amount
of pesticide residue that could be on the participating child’s
skin after normal play activities. Children wore the socks for
a 1-h or longer period while at home and engaged in normal
play activities. The caregiver was asked to record the time the
socks were put on and the time that the socks were taken off.
Each participating child collected a morning void urine
sample during the 24-h monitoring period. The procedure used
to collect the sample has been published previously by the
Centers for Disease Control and Prevention (CDC, 2003). The
urine sample was stored in a cooler with frozen ice packs until
the field technicians arrived at the home to collect the environ-
mental samples. All data were collected in October, 2001.
Multi-Residue Analysis MethodEnvironmental samples were analyzed by a multi-residue
method that involved solvent extraction, solid-phase extrac-
tion (SPE) clean-up, and analysis by gas chromatography/
mass spectrometry (GC/MS) (Tulve et al., 2006a). Details
for the extraction and clean-up of the various matrices can be
found in Bradman et al. (2007). All solvents were high purity
and purchased from Fisher Scientific. The method included
the analysis of 22 organophosphate pesticides, 13 synthetic
pyrethroid pesticides, two natural pyrethroid pesticides, one
synergist (piperonyl butoxide), and one phenyl pyrazole
(fipronil). The method included the addition of surrogate
recovery standards (SRSs) representative of the major
compound classes. The internal standard (IS) method of
quantification was used for all analytes and SRSs, and
analyte concentrations were adjusted by the appropriate SRS
recovery (Tulve et al., 2006a).
Wipe samples were extracted using accelerated solvent
extraction (ASE) with dichloromethane (DCM), concen-
trated, solvent exchanged into hexane, loaded onto a silica
SPE cartridge (1 g BakerBond, JT Baker) and eluted with a
Multimedia samples and young children Tulve et al.
Journal of Exposure Science and Environmental Epidemiology (2008) 18(1) 33

series of solvents (hexane (3 ml), 15% diethyl ether in hexane
(two aliquots of 6ml each), DCM (6 ml), 20% acetone in
ethyl acetate (three aliquots of 6 ml each)), concentrated
again, and fortified with IS (Tulve et al., 2006a). Laboratory
and field quality control samples were processed in sequence
with the field samples.
Air samples were extracted using ASE with acetone:hexane
(10:90, v:v), then processed in a manner identical to that
described for the wipes (Bradman et al., 2007).
A 5� 5 cm section of the sock corresponding to the ball of
the participant’s foot was cut from the sock for analysis. This
sock sample was extracted using ASE with DCM. Labora-
tory and field quality control samples were prepared with
5� 5 cm sock sections. Due to a laboratory error, the field
spike and blank samples were not available for analysis.
A 10 g aliquot of the homogenized food sample was fortified
with SRS (5ng), equilibrated, and combined with Extrelute
(5 g, EM Sciences). This sample was homogenized with
acetonitrile (100ml), centrifuged, and decanted into a
separatory funnel containing a saturated NaCl solution
(30ml). This process was repeated twice for each sample.
After partitioning, the aqueous layer was discarded. After
drying over sodium sulfate, the extract was solvent exchanged
into acetone and then eluted through a series of SPE cartridges
(1 g alumina, 1 g Envicarb, 1 g aminopropyl) with acetone:
toluene (four aliquots of 6ml of 3:1, v:v). The resulting extract
was eluted a second time through this same series of SPE
cartridges with acetone:toluene (two aliquots of 6ml of 3:1,
v:v), concentrated, re-diluted with hexane, and eluted through
a silica SPE cartridge using hexane (3ml) and 60% ethyl ether
in hexane (6ml). This final extract was used for analysis.
A seven-point calibration curve of analytes and SRSs was
prepared that spanned the concentration range of 2.5–50�the instrument detection limit of each analyte. Samples and
standards were analyzed using an Agilent/HP 6890 gas
chromatograph/5973 mass selective detector in the multiple
ion detection mode using an embedded standard approach in
which the standards were interspersed with the field samples
within the run sequence. For samples where an analyte(s)
exceeded the maximum calibration concentration by 415%,
the solution was diluted, re-spiked with IS, and re-analyzed
(Tulve et al., 2006a).
Urine samples were extracted and analyzed using pub-
lished methods (Baker et al., 2004; Olsson et al., 2004;
Bradman et al., 2007).
In developing the database for analysis, the wipe samples
were blank- and surrogate-recovery corrected.
Results
Quality Control DataThe performance of the multi-residue analysis method has
been previously discussed in Tulve et al. (2006a). For this
manuscript, the quality control data for the 12 synthetic
pyrethroid pesticides (cis-permethrin, trans-permethrin, cy-
fluthrin, cypermethrin, cis-allethrin, trans-allethrin, delta/
tralomethrin, esfenvalerate, lambda-cyhalothrin, bifenthrin,
sumithrin, tetramethrin), two natural pyrethroid pesticides
(pyrethrins I and II), an organophosphate pesticide (chlor-
pyrifos), a synergist (piperonyl butoxide) and a phenyl
pyrazole (fipronil) will be presented since these were the
pesticide products measured in the homes.
The method detection limit (MDL) was based on
instrumental performance only, as equivalent clean-up was
achieved with all matrices. The MDL was determined as the
analyte level giving 3:1 S:N in a wipe-extract fortified with a
known amount of analyte just before the GC/MS analysis.
The method detection limits (MDLs) ranged from 0.002 to
0.016 ng/cm2 for wipe samples, 0.4 to 3 ng/m3 for air
samples, 0.08 to 0.8 ng/cm2 for sock samples, and 0.02 to
0.4 ng/g for duplicate diet samples (Table 1).
Three field matrix blanks and eight laboratory matrix
blanks were analyzed with the 18 field wipe samples.
Concentrations (mean7SD, ng/cm2) of the target analytes
in the field wipe matrix blanks were as follows: pyrethrin II
(0.0170.01), cis-permethrin (0.0270.04), trans-permethrin
(0.0170.01), chlorpyrifos (0.0370.05), and piperonyl but-
oxide (0.0270.04). For the laboratory wipe matrix blanks,
the concentrations (mean7standard deviation, ng/cm2)
were: cis-allethrin (0.00270.01), cypermethrin (0.270.5),
cis-permethrin (0.0170.02), trans-permethrin (0.270.4),
chlorpyrifos (0.00470.01), and piperonyl butoxide
(0.170.1).
Three field matrix blanks and three laboratory matrix
blanks were analyzed with the 18 field air samples.
Concentrations (mean7SD, ng/m3) of the target analytes
in the field PUF matrix blanks were as follows: pyrethrin II
(1.973.4), cis-permethrin (1.570.12), trans-permethrin
(2.270.9), and tetramethrin (0.570.43). For the laboratory
PUF matrix blanks, the concentrations (mean7SD, ng/m3)
were: bifenthrin (0.370.5), pyrethrin II (0.470.7), cis-
permethrin (1.271.0), trans-permethrin (1.271.1), and
tetramethrin (0.170.1).
The laboratory solvent method blanks for the food
analyses only showed trace levels of piperonyl butoxide
(equivalent to 0.02 ng/g) in one blank. The only analytes
detected in the laboratory food matrix blanks were cis-
permethrin and trans-permethrin at 0.19 and 0.11 ng/g,
respectively.
Although the pesticide levels in the wipe blanks were low,
they were measurable and statistically different from zero. As
a result, all wipe samples were corrected for field blank levels.
No other sample media were corrected by the corresponding
field blank levels.
For each medium type, corresponding laboratory spike
samples were prepared and processed. For the eight wipe
samples, the mean recovery averaged 108764% and the
Multimedia samples and young childrenTulve et al.
34 Journal of Exposure Science and Environmental Epidemiology (2008) 18(1)

SRS recoveries were 69726% for fenchlorphos and
71721% for 13C6-trans-permethrin. For the three air
samples, the mean recovery averaged 78733% and the
SRS recoveries were 8375% for fenchlorphos and 8874%
for 13C6-trans-permethrin. For the two reference food
samples, the mean recovery averaged 84720%, and the
SRS recoveries were 83716% for fenchlorphos and
98750% for 13C6-trans-permethrin.
Nine wipe and three air samples were spiked with 11 target
pesticides for use as field controls. The recoveries ranged
from 74 to 131% for the wipe sample field controls and 62 to
119% for the air sample field controls.
Participant DemographicsNine children (five males, four females; M¼ 5 years; SD¼ 1
year) and their caregivers participated in this component of
the study. Six children attended school during the monitoring
period (ranging from 7.5 to 9.5 h per day). For all nine
children, the total time reported for sleeping and napping
ranged from 9.5 to 14 h per day, indoor quiet time ranged
from 0 to 5.5 h per day, indoor active time ranged from 0.75
to 5.5 h per day, outdoor quiet time ranged from 0 to 1.5 h
per day, and outdoor active time ranged from 0.5 to 6.5 h per
day. In situations where the time reported in the time–activity
diary did not sum to 24 h, we estimated the hours based on
the information available in the time–activity diary.
Distribution of Pesticides in the ResidencesTable 2 presents the results of the information collected in the
pesticide inventory for each participant. At the time of the
study, each home had one to three products present, with
aerosols being the most common. All homes reported recent
and frequent pesticide use (Table 2; pesticide inventory
questions: When was the last time it was used? and In the last
6 months, how often was it used?). Roaches and ants were the
most commonly reported bug problems. All participants
reported applying a pesticide in the kitchen, and most
reported applying a pesticide in more than one room of the
house. Synthetic pyrethroids were the most frequently
identified active ingredients in products present in each home
at the time of the study.
Table 3 presents the pesticide concentrations in the air,
wipe, sock, and duplicate diet (food) samples for 17
pesticides measured in the homes. Fourteen of the 17
pesticides were detected in the indoor air samples, whereas
cypermethrin, cis-permethrin, trans-permethrin, tetramethrin,
piperonyl butoxide, and chlorpyrifos were the only com-
pounds measured in the outdoor air samples. Both the
application area wipes and the play area wipes had numerous
pesticide residues measured, 15 and 13 pesticides, respec-
tively. Of the pesticides reported in this study, cyfluthrin and
the natural pyrethrins (pyrethrins I and II) were the only
pesticides not detected in the sock samples. Numerous
pesticide residues were also measured in the food samples
(Table 3).
Table 4 highlights four pesticides that were measured in all
homes (cis-permethrin, trans-permethrin, cypermethrin,
chlorpyrifos). Chlorpyrifos was detected in the highest
concentrations in the indoor air in six (Homes 1, 2, 6, 7, 8,
9) of the nine homes (Table 4) even though it was not
Table 1. Method detection limits (MDLs) and detection frequencies (DFs) for the target analytes in multimedia samples (N¼ 9).
Analyte Outdoor air (ng/m3) Indoor air (ng/m3) Wipe, Appl Area (ng/cm2) Wipe, Play Area (ng/cm2) Sock (ng/cm2) Food (ng/g)
MDL DF (%) MDL DF (%) MDL DF (%) MDL DF (%) MDL DF (%) MDL DF (%)
Pyrethroids and Pyrethrins
cis-Allethrin 1.0 0 1.0 33 0.005 56 0.005 33 0.20 33 0.2 0
trans-Allethrin 1.0 0 1.0 33 0.005 56 0.005 33 0.20 33 0.2 0
Bifenthrin 1.0 0 1.0 11 0.005 11 0.005 22 0.20 22 0.02 33
Cyfluthrina 1.2 0 1.2 11 0.006 33 0.006 11 0.24 0 0.1 22
l-Cyhalothrin 1.0 0 1.0 0 0.005 22 0.005 11 0.20 11 0.04 0
Cypermethrina 1.2 22 1.2 22 0.006 89 0.006 67 0.24 67 0.1 67
Deltamethrin 3.0 0 3.0 0 0.016 22 0.016 0 0.60 11 0.4 11
Esfenvalerate 1.4 0 1.4 0 0.008 11 0.008 0 0.28 22 0.2 0
cis-Permethrin 1.0 100 1.0 89 0.005 78 0.005 67 0.80 80 (N¼ 8) 0.02 78
trans-Permethrin 1.0 100 1.0 89 0.005 78 0.005 78 0.20 100 0.02 78
Pyrethrin I 2.0 0 2.0 44 0.011 11 0.011 0 0.40 0 NR 0
Pyrethrin II 0.8 0 0.8 11 0.011 0 0.011 0 0.16 0 NR 0
Sumithrin 1.0 0 1.0 11 0.005 0 0.005 33 0.20 44 0.04 11
Tetramethrin 0.4 0 0.4 22 0.002 11 0.002 33 0.08 22 0.04 22
Other
Piperonyl Butoxide 1.0 33 1.0 89 0.005 75 (N¼ 5) 0.005 67 0.20 78 0.04 100
Chlorpyrifos 1.0 56 1.0 100 0.005 78 0.005 56 0.40 100 0.04 100
Fipronil 1.0 0 1.0 0 0.005 33 0.005 22 0.20 33 NM NM
Abbreviations: Appl, application; DF, detection frequency; MDL, method detection limit; NR, not recovered; NM, not measured.aDetection limit when all chromatographically resolved isomers are detected.
Multimedia samples and young children Tulve et al.
Journal of Exposure Science and Environmental Epidemiology (2008) 18(1) 35

reported used in the last 6 months. For the indoor samples
(indoor air, application area floor wipes, play area floor
wipes, socks), the cypermethrin concentrations measured in
homes 3 and 5 were much higher than the other pesticide
residues measured in the same media in these homes. In
general, the concentrations of the three pyrethroids measured
in the wipe samples are higher than the concentrations of
chlorpyrifos measured in the wipe samples, suggesting that
the pyrethroids are more likely to be bound to a surface or
dust particles (the exceptions are Homes 1 and 2). All four
pesticides were measured on the socks with four homes
(Homes 3, 4, 8, 9) having all pesticide residues detected. Five
homes (Homes 1, 2, 5, 6, 8) had all four pesticides measured
in the food samples.
Table 5 shows a comparison of the pesticide concentrations
in the multimedia samples across three recent studies where
numerous pyrethroid and OP pesticides were measured.
Where comparable, the median pesticide residue concentra-
tions in the air, application area floor wipes, and food were
usually higher for this study as compared to the Bradman
et al. (2007) study or the CTEPP (A Pilot Study of
Children’s Total Exposure to Persistent Pesticides and Other
Persistent Organic Pollutants) study (Morgan et al., 2004).
Each participating child provided a morning urine sample.
All urine samples contained measurable concentrations of
3-phenoxybenzoic acid (3-PBA), cis/trans-3-(2,2-dichloro-
vinyl)-2,2-dimethylcyclopropane carboxylic acid (cis/trans-
DCCA), and 3,5,6-trichloro-2-pyridinol (TCPy) (Table 6).
In addition, all nine children had measurable levels of
4-fluoro-3-phenoxybenzoic acid (4F-3-PBA) in their urine,
with four children having 4F-3-PBA metabolite concentra-
tions slightly less than the limit of detection (0.05 mg/l)
reported in Table 6. The TCPy concentrations are within the
range of TCPy concentrations reported by Morgan et al.
(2005), but the median TCPy concentration of 9.8mg/l is
near the 90th percentile (10.7mg/l) for the 6–11 year old age
group in the Third National Report on Human Exposure to
Environmental Chemicals (NHANES) (CDC, 2005). Becker
et al. (2006) reported a 4F-3-PBA median concentration of
less than 0.1 mg/l from a sample size of 395 participants in
Table 2. Information collected in the pesticide inventories from the nine homes.
Home Type When was the last
time it was used?
In the last 6 months, how
often was it used?
(times per month)
What was the pesticide
used for?
Where was the pesticide
applied?
Active ingredients in
product
1 Aerosol 1 day ago 8 Roaches, ants Kitchen Propoxur, pyrethrins I
and II, cyfluthrin,
piperonyl butoxide
1 Aerosol 4 days ago 8 Roaches, ants Kitchen, bathroom Propoxur, pyrethrins I
and II, cyfluthrin,
piperonyl butoxide
2 Aerosol 2 days ago 2 Roaches Kitchen, bathroom Cypermethrin,
imiprothrin
3 Aerosol 1 day ago 4 Roaches, ants Kitchen, living room, family
room, bedroom
Cypermethrin,
imiprothrin
4 Aerosol 1 day ago 12 Roaches Kitchen, living room,
bedroom, bathroom
Tralomethrin, d-trans-
allethrin
4 Fogger 30 days ago o1 Roaches All rooms Permethrin, sumithrin,
piperonyl butoxide
4 Fogger 30 days ago o1 Roaches All rooms Permethrin, sumithrin,
piperonyl butoxide
5 Aerosol 1 day ago 4 Roaches, ants Kitchen, living room,
bathroom
Cypermethrin,
imiprothrin
6 Aerosol 1 day ago 5 Flies, ants, mosquitoes Kitchen, front yard, living
room
Pyrethrins I and II,
piperonyl butoxide
6 Aerosol 30 days ago 10 Mosquitoes On body DEET
6 Bait station 7 days ago o1 Roaches On countertops, in cabinets Fa
7 Pump spray 1 day ago 1 Roaches, ants Kitchen, living room Fa
7 Aerosol 1 day ago 8 Roaches, ants Kitchen, living room Cypermethrin,
imiprothrin
8 Fa 1 day ago 60 Roaches Kitchen, bathroom Fa
8 Aerosol Fa Fa Fa Fa Tralomethrin, d-trans-
allethrin
9 Granules 14 days ago o1 Ants Backyard Fa
9 Aerosol 3 days ago 1.25 Roaches, ants Kitchen, bathroom Permethrin, pyrethrins I
and II, piperonyl butoxide
aInformation not available.
Multimedia samples and young childrenTulve et al.
36 Journal of Exposure Science and Environmental Epidemiology (2008) 18(1)

which less than 1% of the samples were greater than or equal
to the limit of quantification (LOQ¼ 0.1 mg/l). The 3-PBA
and trans-DCCA median concentrations (2.2mg/l and 1.1 mg/
l, respectively) fall within the 95% confidence interval of the
90th percentile (1.34–2.69 mg/l for 3-PBA and 1.03–1.68mg/l
for trans-DCCA) for the age group 6–11 years (NHANES).
The median concentration of cis-DCCA (0.62 mg/l) falls
within the 95% confidence interval (0.49–0.87 mg/l) of the
95th percentile for the age group 6–11 years (NHANES)
(CDC, 2005).
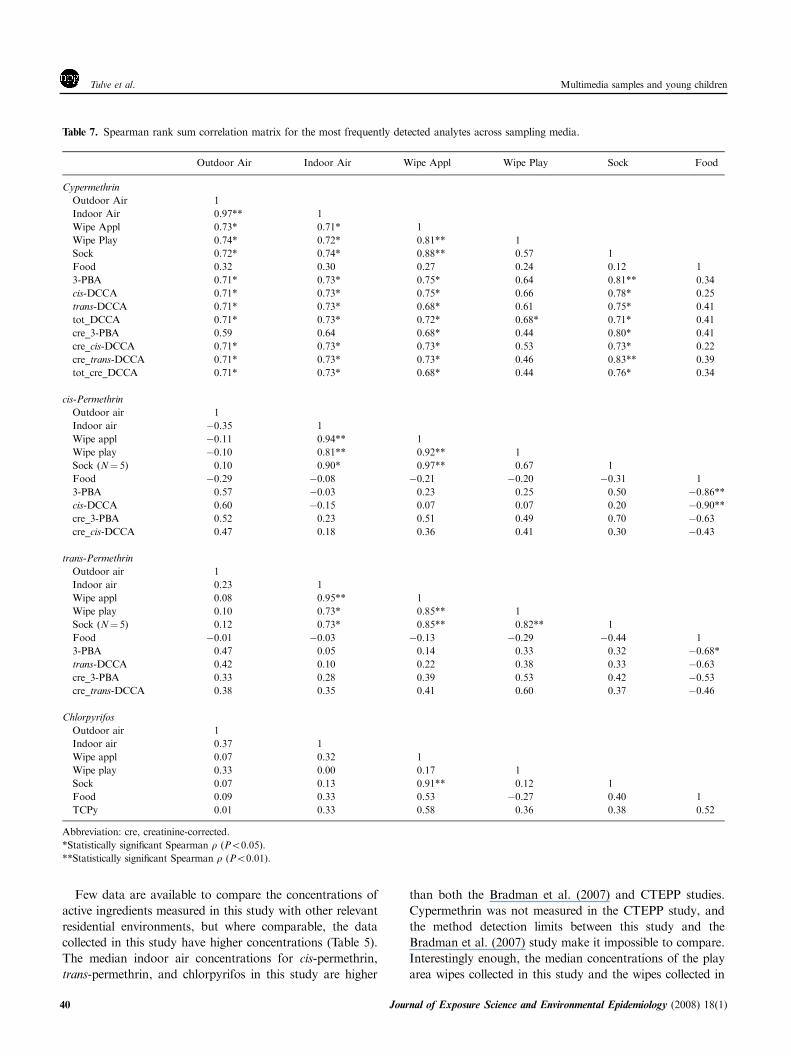
Table 7 presents a Spearman rank sum correlation matrix
for cypermethrin, cis-permethrin, trans-permethrin, and
chlorpyrifos. For cypermethrin, significant correlations
existed among all parameters evaluated (except the food
and creatinine-corrected 3-PBA) and indoor and outdoor air,
application area floor wipes, and the sock samples, whereas
no relationship existed between food and the play area floor
wipes and any of the parameters evaluated (except the play
area floor wipes and total DCCA). For cis-permethrin and
trans-permethrin, significant correlations existed among
indoor air, application area floor wipes, play area floor
wipes, and the sock samples. A significant association also
existed between food and 3-PBA (cis-permethrin and trans-
permethrin) and food and cis-DCCA (cis-permethrin). For
chlorpyrifos, the only significant association was between the
application area floor wipes and the sock samples.
Discussion
We collected multimedia samples in homes for a subset of
children who participated in a larger biomonitoring survey.
Measurable levels of pyrethroids, OPs, a synergist, and a
phenyl pyrazole were detected in indoor and outdoor air,
application and play area floor wipes, socks, and food
samples. Metabolites corresponding to the parent pesticides
were also measured in the children’s urine.
We also collected time–activity information for the nine
participating children. Using a paper diary, each caregiver
recorded location and activity information, time spent on
various surface types (carpet/rugs, hard floor, upholstered
furniture, bedding, grass, dirt, paved surfaces, wood, other),
and the type of clothing worn, while engaged in that
particular activity. In an attempt to make the diary as easy
as possible for the participants, the diary was divided into
morning and afternoon sections. We asked the participants to
complete the diary in real time.
One participant child (Home 5) spent approximately 27%
of his time outdoors, as compared to the others who averaged
6.4%. The total average outdoor time for all children was
9%. Sleeping averaged 47% of the children’s time and
indoor time awake at home averaged 21%. Total time away
from home averaged 23% for all children, but averaged 34%
for the six children (homes 2, 3, 4, 6, 8, 9), who were in
Table 3. Pesticide concentrations in multimedia samples (N¼ 9)a.
Analyte Outdoor Air (ng/m3) Indoor Air (ng/m3) Wipe, Appl Areab (ng/cm2) Wipe, Play Area (ng/cm2) Sockc (ng/cm2) Food (ng/g)
p50 max p50 max p50 max p50 max p50 max p50 max
Pyrethroids and pyrethrins
Cis-Allethrin Fd Fd Fd 74 0.20 31 Fd 0.11 Fd 180 NM NM
trans-Allethrin Fd Fd Fd 38 0.09 15 Fd 0.05 Fd 96 NM NM
Bifenthrin Fd Fd Fd 3.0 Fd 2.5 Fd 0.05 Fd 68 Fd 1.3
Cyfluthrine Fd Fd Fd 5.5 Fd 10 Fd 3.4 Fd Fd Fd 3.6
l-Cyhalothrin Fd Fd Fd Fd Fd 3.7 Fd 0.12 Fd 14 Fd Fd
Cypermethrine Fd 19 Fd 100 6.9 580 0.68 18 8.7 1000 2.3 9.5
Delta/Tralomethrin Fd Fd Fd Fd Fd 1.8 Fd Fd Fd 13 Fd 13
Esfenvalerate Fd Fd Fd 0.32 Fd 0.7 Fd Fd Fd 2.6 Fd Fd
cis-Permethrin 2.1 2.3 2.0 92 0.24 42 0.04 9.8 7.7 130 0.29 13
trans-Permethrin 2.5 10 3.1 130 0.34 67 0.05 14 1.4 180 0.22 22
Pyrethrin I Fd Fd Fd 12 Fd 1.4 Fd Fd Fd Fd Fd Fd
Pyrethrin II Fd Fd Fd 0.91 Fd Fd Fd Fd Fd Fd Fd Fd
Sumithrin Fd Fd Fd 4.2 Fd Fd Fd 1.36 Fd 31 Fd 0.11
Tetramethrin Fd 0.15 0.15 63 Fd 4.6 Fd 0.28 Fd 30 Fd 0.13
Other
Piperonyl Butoxide Fd 3.1 7.4 378 1.4 264 0.35 117 7.9 85 0.36 1.1
Chlorpyrifos 3.8 6.6 20 85 0.39 3.1 0.006 2.3 2.2 5.1 0.38 7.4
Fipronil Fd Fd Fd Fd Fd 2.3 Fd 0.03 Fd 4.3 NM NM
Abbreviations: Appl, application; NM, not measured; p50, median; max, maximum.aAnalyte concentrations presented only when detectable levels were measured in one or more media.bN¼ 8 for piperonyl butoxide application area wipe sample measurement.cN¼ 5 for cis- and trans-permethrin sock sample measurements.dAt this percentile, all values were below the detection limit.eSum of all chromatographically-resolved isomers.
Multimedia samples and young children Tulve et al.
Journal of Exposure Science and Environmental Epidemiology (2008) 18(1) 37

school at the time of the observation period. Our results are
similar to other published results on how and where children
spend their time (Schwab et al., 1992; Silvers et al., 1994;
Elgethun et al., 2003).
The paper diary did not work very well. The participants
found the morning and afternoon sections difficult to
complete when the field technicians did not arrive in the
morning. Furthermore, too many questions needed to be
answered with text and the hours did not always sum to 24.
During the second visit (as described in the field protocol),
the field technicians spent a fair amount of time helping the
caregivers complete the time–activity diary. Based on these
observations, the time–activity diary was redesigned and pilot
tested (Tulve et al., 2007).
We used simple regression to analyze the responses to the
questions in the pesticide inventory (application types, days
since last use, frequency of use, and rooms treated) in an
attempt to determine which questions may be the most useful
in predicting pesticide levels in the home. The only
association with logged total surface residue loading (mM/
cm2, summed over all measured pyrethrins and pyrethroids)
was found with the number of types of rooms treated (P-
value¼ 0.06). The questions were specific to each pesticide
product inventoried. These inventories may adequately
capture the products in the home at the time of the inventory,
but they are not useful for collecting information on other
pesticide products used but discarded or never stored in the
home. As a result, the inventories were not useful for
predicting pesticide levels in the home. Sexton et al. (2003)
also reported that their questionnaire screening approach was
ineffective in identifying households with higher levels of the
individual target pesticides.
Table 4. Concentrations of selected pesticides measured in all homes.
Pesticide Home ID Number
1 2 3 4 5 6 7 8 9
Outdoor Air (ng/m3)
Cypermethrin Fa Fa 19.2 Fa 3.2 Fa Fa Fa Fa
cis-Permethrin 1.9 2.3 2.2 2.1 2.3 1.7 1.7 2.2 1.8
trans-Permethrin 4.6 5.7 10.2 2.1 3.0 1.8 1.7 2.5 2.1
Chlorpyrifos 5.1 4.2 6.6 Fa 4.9 3.8 Fa Fa Fa
Indoor Air (ng/m3)
Cypermethrin Fa Fa 64.8 Fa 105 Fa Fa Fa Fa
cis-Permethrin 1.9 2.0 2.2 93 1.8 2.0 1.9 Fa 5.6
trans-Permethrin 3.1 6.0 6.4 134 1.9 2.1 1.8 Fa 6.6
Chlorpyrifos 32.4 84.9 18.4 18.3 20.4 28.1 9.8 45.5 12.6
Application area surface wipe (ng/cm2)
Cypermethrin Fa 6.9 580 39 198 0.8 3.7 72 0.8
cis-Permethrin 0.1 0.2 1.7 42 0.2 0.5 Fa Fa 32
trans-Permethrin 0.2 0.3 3.5 67 0.1 0.7 Fa Fa 45
Chlorpyrifos 0.2 0.7 3.1 0.4 Fa 0.3 Fa 2.4 0.5
Play area surface wipe (ng/cm2)
Cypermethrin Fa Fa 18 0.4 10 0.7 1.0 1.0 Fa
cis-Permethrin Fa 0.01 2.7 0.9 0.04 0.7 Fa Missing 10
trans-Permethrin o0.01 0.03 2.2 1.5 0.05 1.2 Fa 0.02 14
Chlorpyrifos Fa 0.04 2.3 Fa 0.01 o0.01 0.5 0.01 Fa
Socks (ng/cm2)
Cypermethrin Fa 2.9 173 70 408 Fa Fa 2.5 0.3
cis-Permethrin Missing Fa 3.8 64 Fa Fa Fa 0.1 0.6
trans-Permethrin 0.6 0.5 5.8 90 0.4 1.1 0.4 0.1 0.8
Chlorpyrifos 0.7 1.0 2.5 0.9 0.4 0.8 1.3 0.2 0.2
Food (ng/g)
Cypermethrin 1.5 7.6 5.4 Fa 3.8 9.5 Fa 2.3 Fa
cis-Permethrin 0.3 12.9 Fa Fa 0.1 0.3 0.4 0.1 0.5
trans-Permethrin 2.1 22.1 Fa Fa 0.2 0.2 0.2 0.2 0.5
Chlorpyrifosb 2.7 1.9 1.0 15 0.2 1.8 0.5 0.7 0.6
aNot detected in media.bSum chlorpyrifos and chlorpyrifos methyl concentrations in solid food.
Multimedia samples and young childrenTulve et al.
38 Journal of Exposure Science and Environmental Epidemiology (2008) 18(1)

Floor wipe samples had the largest variety of pesticides
detected, as compared to the other media. Outdoor air had
the least number of pesticides detected. With the discontinued
registration on the use of chlorpyrifos and diazinon in the
indoor residential environment, pyrethroids are being in-
creasingly used in the indoor environment. Although
chlorpyrifos was not reported used, it was measured in all
media, suggesting that it has a long residence time in the
indoor environment (Fenske et al., 2000a, b). Piperonyl
butoxide is added as a synergist to many pyrethroid mixtures
for products used in the residential environment so it was not
surprising to find it in all media (Selim et al., 1999).
Cypermethrin, cis-permethrin, trans-permethrin, and
chlorpyrifos were measured in all nine homes. For homes 3
and 5, cypermethrin was measured in the highest con-
centration in all indoor media (indoor air, wipes, socks, food)
following a reported pesticide application in numerous
rooms in the home, including the kitchen. Lu et al. (2006b)
suggest that for pyrethroids, the residential concentra-
tions are most important for estimating exposure. His
results, combined with the observations in this paper,
would suggest that residential pesticide usage where pyre-
throids are the active ingredients, and not just dietary
intake, is important for estimating a child’s exposure.
However, due to the small sample size of this study,
further research is needed to evaluate the impact of resi-
dential pesticide usage on the factors influencing a child’s
exposure.
Table 5. Comparison of the pesticide concentrations in multimedia samples across recent studies.
Sample Pesticide Studya
This Study Bradman et al. (2007) CTEPP-NC CTEPP-OH
Median Max Median Max Median Max Median Max
Airb (ng/m3) cis-Permethrin 2.0 92 o0.56c 8.2 0.58 34.4 o0.39c 5.39
trans-Permethrin 3.1 130 o0.56c 11 0.36 40.9 o0.33c 6.8
Cypermethrin o1.2c 100 o28c 380 NM NM NM NM
Chlorpyrifos 20 85 11 36 6.21 391 1.67 98
Wiped (ng/cm2) cis-Permethrin 0.24, 0.04 9.8 0.10 1.7 0.044 0.87 0.009 5.2
trans-Permethrin 0.34, 0.05 14 0.23 3.6 0.04 1.01 0.0094 5.18
Cypermethrin 6.9, 0.68 18 o0.22c 2.8 NM NM NM NM
Chlorpyrifos 0.39, 0.006 2.3 0.046 0.2 0.007 0.21 0.003 3.86
Food (ng/g) cis-Permethrin 0.29 13 o4.5c o4.5c o0.08c 80.7 o0.08c 560
trans-Permethrin 0.22 22 o2.9c o2.9c o0.08c 70.4 o0.08c 448
Cypermethrin 2.3 9.5 NM NM NM NM NM NM
Chlorpyrifos 0.38 7.4 o1.4c o1.4c 0.19 19.7 0.19 3.51
Abbreviation: NM, not measured.aThis Study: N¼ 9; Bradman et al. (2007)’s study: N¼ 20; CTEPP-NC: N¼ 128 (air), N¼ 28 (wipe), N¼ 129 (food, cis-permethrin, and chlorpyrifos),
N¼ 128 (food, trans-permethrin); CTEPP-OH: N¼ 125 (air), N¼ 21 (wipe), N¼ 125 (food).bIndoor air.cReported method detection limit.dThis study wipe sample: application area wipe, play area wipe; Bradman et al. (2007)’s study wipe sample: floor wipe collected from a central location,
usually the kitchen or dining area near the boundary with a carpeted floor; CTEPP-NC and CTEPP-OH wipe samples: hard floor surface wipes collected from
an indoor floor where the children spent most of their time.
Table 6. Limits of detection (mg/l), detection frequencies (%), and concentrations (mg/l) for the target analytes in urine samples (N¼ 9 children).
Analyte Parent Compounda LOD (mg/l) DF (%) p50 p75 Max
Pyrethroids
3-Phenoxybenzoic acid (3-PBA) Cypermethrin, Deltamethrin, Permethrin 0.52 100 2.2 29 99
4-Fluoro-3-phenoxybenzoic acid (4F-3-PBA) Cyfluthrin 0.05 56 0.09 0.26 1.7
cis-3-(2,2-Dichlorovinyl)-2,2-dimethlycyclopropane
carboxylic acid (cis-DCCA)
Cyfluthrin, cis-Cypermethrin,
cis-Permethrin
0.19 100 0.62 3.9 43
trans-3-(2,2-Dichlorovinyl)-2,2-dimethlycyclopropane
carboxylic acid (trans-DCCA)
Cyfluthrin, trans-Cypermethrin,
trans-Permethrin
0.21 100 1.1 6.9 61
Organophosphates
3,5,6-Trichloro-2-pyridinol (TCPy) Chloryrifos 0.40 100 9.8 15 21
aOnly parent compounds relevant to the environmental sampling are included.
Multimedia samples and young children Tulve et al.
Journal of Exposure Science and Environmental Epidemiology (2008) 18(1) 39
Few data are available to compare the concentrations of
active ingredients measured in this study with other relevant
residential environments, but where comparable, the data
collected in this study have higher concentrations (Table 5).
The median indoor air concentrations for cis-permethrin,
trans-permethrin, and chlorpyrifos in this study are higher
than both the Bradman et al. (2007) and CTEPP studies.
Cypermethrin was not measured in the CTEPP study, and
the method detection limits between this study and the
Bradman et al. (2007) study make it impossible to compare.
Interestingly enough, the median concentrations of the play
area wipes collected in this study and the wipes collected in
Table 7. Spearman rank sum correlation matrix for the most frequently detected analytes across sampling media.
Outdoor Air Indoor Air Wipe Appl Wipe Play Sock Food
Cypermethrin
Outdoor Air 1
Indoor Air 0.97** 1
Wipe Appl 0.73* 0.71* 1
Wipe Play 0.74* 0.72* 0.81** 1
Sock 0.72* 0.74* 0.88** 0.57 1
Food 0.32 0.30 0.27 0.24 0.12 1
3-PBA 0.71* 0.73* 0.75* 0.64 0.81** 0.34
cis-DCCA 0.71* 0.73* 0.75* 0.66 0.78* 0.25
trans-DCCA 0.71* 0.73* 0.68* 0.61 0.75* 0.41
tot_DCCA 0.71* 0.73* 0.72* 0.68* 0.71* 0.41
cre_3-PBA 0.59 0.64 0.68* 0.44 0.80* 0.41
cre_cis-DCCA 0.71* 0.73* 0.73* 0.53 0.73* 0.22
cre_trans-DCCA 0.71* 0.73* 0.73* 0.46 0.83** 0.39
tot_cre_DCCA 0.71* 0.73* 0.68* 0.44 0.76* 0.34
cis-Permethrin
Outdoor air 1
Indoor air �0.35 1
Wipe appl �0.11 0.94** 1
Wipe play �0.10 0.81** 0.92** 1
Sock (N¼ 5) 0.10 0.90* 0.97** 0.67 1
Food �0.29 �0.08 �0.21 �0.20 �0.31 1
3-PBA 0.57 �0.03 0.23 0.25 0.50 �0.86**
cis-DCCA 0.60 �0.15 0.07 0.07 0.20 �0.90**
cre_3-PBA 0.52 0.23 0.51 0.49 0.70 �0.63
cre_cis-DCCA 0.47 0.18 0.36 0.41 0.30 �0.43
trans-Permethrin
Outdoor air 1
Indoor air 0.23 1
Wipe appl 0.08 0.95** 1
Wipe play 0.10 0.73* 0.85** 1
Sock (N¼ 5) 0.12 0.73* 0.85** 0.82** 1
Food �0.01 �0.03 �0.13 �0.29 �0.44 1
3-PBA 0.47 0.05 0.14 0.33 0.32 �0.68*
trans-DCCA 0.42 0.10 0.22 0.38 0.33 �0.63
cre_3-PBA 0.33 0.28 0.39 0.53 0.42 �0.53
cre_trans-DCCA 0.38 0.35 0.41 0.60 0.37 �0.46
Chlorpyrifos
Outdoor air 1
Indoor air 0.37 1
Wipe appl 0.07 0.32 1
Wipe play 0.33 0.00 0.17 1
Sock 0.07 0.13 0.91** 0.12 1
Food 0.09 0.33 0.53 �0.27 0.40 1
TCPy 0.01 0.33 0.58 0.36 0.38 0.52
Abbreviation: cre, creatinine-corrected.
*Statistically significant Spearman r (Po0.05).
**Statistically significant Spearman r (Po0.01).
Multimedia samples and young childrenTulve et al.
40 Journal of Exposure Science and Environmental Epidemiology (2008) 18(1)

the Bradman et al. (2007) and the CTEPP studies suggest
that these wipes were all collected from similar type locations.
The median concentrations of cis-permethrin and trans-
permethrin in food for the CTEPP and Bradman et al. (2007)
studies were less than the method detection limit, so
comparisons to this study are difficult. The median
concentration of chlorpyrifos in the food measured in this
study is twice the median concentration measured in the
CTEPP study (Table 5).
The most frequently detected pesticides in this study were
cypermethrin, cis-permethrin, trans-permethrin, and chlor-
pyrifos. Bradman et al. (2007) also reported the concentra-
tions of these pesticides from a small pilot observational
study conducted in the Salinas Valley, CA, but the median
concentrations reported by these researchers were lower than
what was reported in this study (Table 5). Cis-permethrin and
trans-permethrin were measured in the CTEPP study, but the
median concentrations were lower than our reported results
(Table 5). Our results support the observation made by
Bradman et al. (2007) that pyrethroids are increasingly found
in the home environment. Seifert et al. (2000a, b) also report
the widespread use of permethrin in the indoor environment
in Germany. The German Environmental Survey is a large-
scale, representative population study conducted approxi-
mately every 7 years that measures the concentrations of
chemicals to which German people are exposed. In the
second environmental survey, permethrin was measured in
90.6% of the dust samples collected from vacuum cleaner
bags (Seifert et al., 2000a, b). As we did not collect bulk dust
in these homes, it is impossible to compare the concentrations
reported by Seifert et al. (2000a, b) and the concentrations
measured on the wipes and sock samples. The German
Environmental Survey IV pilot study (GerES IV) reports on
pesticide concentrations in dust and pesticide metabolite
concentrations in urine for 500 children. In GerES IV,
permethrin was detected in 79% of the dust samples with a
median concentration of 0.09mg/kg. Five pyrethroid meta-
bolites were measured in the children’s urine samples with
3-PBA measured in 90% of the samples with a median
concentration of 0.29 mg/l; trans-DCCA measured in 74% of
the samples with a median concentration of 0.19mg/l; cis-
DCCA measured in 56% of the samples with a median
concentration of 0.11mg/l; and 4F-3-PBA measured in less
than 1% of the samples with a median concentration
o0.1 mg/l (Becker et al., 2006).
In addition, the First National Environmental Health
Survey of Child Care Centers (CCC) (Tulve et al., 2006a)
and CTEPP (Morgan et al., 2004) studies reported median
pesticide residue concentrations in day care centers at much
lower concentrations than those reported in this study for the
same active ingredients (compare to Table 5) (CCC study:
floor wipes: cis-permethrin: median¼ 0.03 ng/cm2; trans-
permethrin: median¼ 0.03 ng/cm2; cypermethrin: median
o detection limit; chlorpyrifos: median¼ 0.02 ng/cm2;
CTEPP study: hard floor surface wipes: NC: cis-permethrin:
median¼ 0.09 ng/cm2; trans-permethrin: median¼ 0.07 ng/
cm2; chlorpyrifos: median¼ 0.01 ng/cm2; OH: cis-perme-
thrin: median¼ 0.006 ng/cm2; trans-permethrin: median¼0.005 ng/cm2; chlorpyrifos: median o detection limit).
Agricultural OPs on our target analyte list were not measured
in any environmental media.
Comparisons of the pyrethroid metabolites, 3-PBA, cis-
DCCA, and trans-DCCA, in urine between this study and
other available studies suggest that the median concentrations
for these children are higher than any other published studies
involving children. In the GerES IV study, the median 3-
PBA concentration was 0.29mg/l (Becker et al., 2006) and in
NHANES the median 3-PBA concentration was 0.3 mg/l
(95% confidence interval¼ 0.2–0.41 mg/l) for the age group
6–11 years (CDC, 2005); in contrast, the median 3-PBA
concentration for the nine children in this pilot observational
study was 2.2 mg/l. In the GerES IV study, the median
concentrations of cis-DCCA and trans-DCCA were 0.11 and
0.19mg/l, respectively, and in NHANES the median
concentrations of cis-DCCA and trans-DCCA were o0.1
and o0.4 mg/l, respectively, (95% confidence interval for cis-
DCCA o0.1 mg/l, 95% confidence interval for trans-DCCA
o0.4 mg/l) for the age group 6–11 years (CDC, 2005); in
contrast, the median cis-DCCA and trans-DCCA concentra-
tions for the nine children in this pilot observational study
were 0.62 and 1.1 mg/l, respectively. In the GerES IV study
the median 4F-3-PBA concentration was o0.1 mg/l (Becker
et al., 2006) and in NHANES the median 4F-3-PBA
concentration was o0.2 mg/l (95% confidence interval
o0.2 mg/l) for the age group 6–11 years (CDC, 2005). The
median 4F-3-PBA concentration reported in this study is
similar (0.09 mg/l), suggesting that diet may be a potential
source of this metabolite. However, more research is needed
to evaluate this hypothesis. The metabolite values reported
here are a small subset of the results for the 201 children in
the main biomonitoring study which will be published in an
upcoming manuscript.
The results reported in this study show a wide variety of
pesticide active ingredients found in the residential environ-
ment. Furthermore, when the results from this study are
compared to other studies, our reported median results are
almost always higher. Yet, with such a small sample size, it is
not possible to do more than show trends in the data. Further
research with a larger cohort is needed to better understand
how pesticide concentrations change during routine pesticide
use in an indoor environment and what factors most likely
influence a child’s potential exposure to pesticides.
Although there are limitations to this study, there are also
significant facts that can be reported from these results. While
chlorpyrifos was not reported used, it was measured in all
media. A better understanding of the fate of chlorpyrifos
and other pesticides indoors is needed to estimate how long
the pesticide will be present in the indoor residential
Multimedia samples and young children Tulve et al.
Journal of Exposure Science and Environmental Epidemiology (2008) 18(1) 41
environment. To predict the spatial and temporal distribu-
tions of pesticides in the indoor environment and how this
may impact a child’s exposure, we are developing a fugacity
model that incorporates the physico-chemical properties of
the pesticides. This model will need to be evaluated with real-
world data.
Wipe samples showed a wide variety of pesticide active
ingredients, suggesting that many different pyrethroid
products were used in this area at the time of the study.
With pyrethroid concentrations higher in the wipes and socks
than the OP concentrations, this would suggest that
pyrethroids are more likely to stick to surfaces and dust
particles than to volatilize into the air. Socks showed
potential usefulness for measuring pesticide residue concen-
trations for locations where children spent time. Additional
methods development is needed for methods to estimate
dermal exposure. The location of the pesticide and the child’s
activity patterns will influence the child’s potential exposures
to indoor chemicals.
The median urinary metabolite concentrations measured in
these children’s urine samples highlight the need for further
research to understand the factors that result in these urinary
levels. Pesticide metabolites have been measured in environ-
mental media and diet samples, suggesting that individuals
may be exposed to the pesticide metabolites during their
normal day-to-day activities. In CTEPP, chlorpyrifos and its
degradation product TCPy were measured in environmental
media and diet samples, but the corresponding urinary TCPy
concentrations could not be adequately explained by the
amount of chlorpyrifos and TCPy measured in the multi-
media samples (Morgan et al., 2005). Further research is also
needed to understand whether urinary output is a better
measure of a child’s potential exposure than urine concen-
tration.
Comparison of the application area floor wipe and the play
area floor wipe concentrations show a large variation in
measured concentration that can occur depending on the
sampling location. This indicates that the sampling locations
need to relate to the objective or hypothesis being evaluated.
Multimedia samples were collected in this study. In
combination with time–activity profiles, aggregate and
cumulative exposure assessments can be undertaken. Multi-
media sampling increases our ability to accurately understand
the routes and pathways contributing to a child’s potential
exposure.
Conclusions
Pyrethroid pesticides (e. g., cis-permethrin, trans-permethrin,
cypermethrin) were frequently detected in multimedia
samples (e.g., air, dust, food) at median concentrations that
were often higher than reported previously in similar studies.
In addition, the pyrethroid metabolite concentrations in the
urine were higher than the concentrations reported by either
NHANES or GerES studies. Results of this small pilot study
suggest the need for larger observational exposure measure-
ment studies to measure exposure and to determine the
factors affecting children’s exposures in homes where
pesticides are used.
Acknowledgements
The United States Environmental Protection Agency
through its Office of Research and Development partially
funded and collaborated in the research described here under
contract number 68-D-99-011 to Battelle Memorial Insti-
tute. It has been subjected to Agency administrative review
and approved for publication. Mention of trade names or
commercial products does not constitute endorsement or
recommendation for use. We thank the children and their
caregivers for participating in this study, Carry W. Croghan
at the EPA for help with the data, and Linda S. Sheldon for
constructive comments on the manuscript.
References
Adgate J.L., Barr D.B., Clayton C.A., Eberly L.E., Freeman N.C., Lioy P.J.,
Needham L.L., Pellizzari E.D., Quackenboss J.J., Roy A., and Sexton K.
Measurement of children’s exposure to pesticides: analysis of urinary
metabolite levels in a probability-based sample. Environ Health Perspect
2001: 109(6): 583–590.
Adgate J.L., Clayton C.A., Quackenboss J.J., Thomas K.W., Whitmore R.W.,
Pellizzari E.D., Lioy P.J., Shubat P., Stroebel C., Freeman N.C., and Sexton
K. Measurement of multi-pollutant and multi-pathway exposures in a
probability-based sample of children: practical strategies for effective field
studies. J Expo Anal Environ Epidemiol 2000: 10(6 Part 2): 650–661.
Baker S.E., Olsson A.O., and Barr D.B. Isotope dilution high-performance liquid
chromatography-tandem mass spectrometry method for quantifying urinary
metabolites of synthetic pyrethroid insecticides. Arch Environ Contam Toxicol
2004: 46(3): 281–288.
Becker K., Seiwert M., Angerer J., Kolossa-Gehring M., Hoppe H.-W., Ball M.,
Schulz C., Thumulla J., and Seifert B. GerES IV pilot study: assessment of the
exposure of German children to organophosphorus and pyrethroid pesticides.
Int J Hyg Environ Health 2006: 209: 221–233.
Bradman A., Whitaker D., Quiros L., Castorina R., Henn B.C., Nishioka M.,
Morgan J., Barr D.B., Harnly M., Brisnin J.A., Sheldon L.S., McKone T.E.,
and Eskenazi B. Pesticides and their metabolites in the homes and urine of
farmworker children living in the Salinas Valley, CA. J Expo Sci Environ
Epidemiol 2007: 17(4): 331–349.
Bradman M.A., Harnly M.E., Draper W., Seidel S., Teran S., Wakeham D., and
Neutra R. Pesticide exposures to children from California’s Central
Valley: results of a pilot study. J Expo Anal Environ Epidemiol 1997: 7(2):
217–234.
Byrne S.L., Shurdut B.A., and Saunders D.G. Potential chlorpyrifos exposure to
residents following a standard crack and crevice treatment. Environ Health
Perspect 1998: 106(11): 725–731.
CDC. 2003 Second national report on human exposure to environmental
chemicals, National Center for Environmental Health, Division of Laboratory
Sciences, Atlanta, Georgia, NCEH Pub. No.: 02-0716.
CDC. 2005 Third national report on human exposure to environmental chemicals,
Atlanta, Georgia: National Center for Environmental Health, Division of
Laboratory Sciences, NCEH Pub. No.: 05-0570.
Clayton A., Pellizzari E.D., Whitmore R.W., Quackenboss J.J., Adgate J., and
Sexton K. Distributions, associations, and partial aggregate exposure of
pesticides and polynuclear aromatic hydrocarbons in the Minnesota children’s
Multimedia samples and young childrenTulve et al.
42 Journal of Exposure Science and Environmental Epidemiology (2008) 18(1)
pesticide exposure study (MNCPES). J Expo Anal Environ Epidemiol 2003:
13(2): 100–111.
Cohen Hubal E.A., Sheldon L.S., Burke J.M., McCurdy T.R., Berry M.R., Rigas
M.L., Zartarian V.G., and Freeman N.C.G. Children’s exposure assessment:
a review of factors influencing children’s exposure, and the data available to
characterize and assess that exposure. Environ Health Perspect 2000a: 108(6):
475–486.
Cohen Hubal E.A., Sheldon L.S., Zufall M.J., Burke J.M., and Thomas K.T.
The challenge of assessing children’s residential exposure to pesticides. J Expo
Anal Environ Epidemiol 2000b: 10: 638–649.
Curl C.L., Fenske R.A., and Elgethun K. Organophosphorus pesticide exposure
of urban and suburban preschool children with organic and conventional diets.
Environ Health Perspect 2003: 111(3): 377–382.
Duggan A., Charnley G., Chen W., Chukwudebe A., Hawk R., Krieger R.I.,
Ross J., and Yarborough C. Di-alkyl phosphate biomonitoring data: assessing
cumulative exposure to organophosphate pesticides. Regul Toxicol Pharmacol
2003: 37(3): 382–395.
Elgethun K., Fenske R.A., Yost M.G., and Palcisko G.J. Time-location analysis
for exposure assessment studies of children using a novel global positioning
system instrument. Environ Health Perspect 2003: 111(1): 115–122.
Fenske R.A., Kedan G., Lu C., Fisker-Andersen J.A., and Curl C.L. Assessment
of organophosphorous pesticide exposures in the diets of preschool children in
Washington State. J Expo Anal Environ Epidemiol 2002: 12(1): 21–28.
Fenske R.A., Kissel J.C., Lu C., Kalman D.A., Simcox N.J., Allen E.H., and
Keifer M.C. Biologically based pesticide dose estimates for children in an
agricultural community. Environ Health Perspect 2000a: 108(6): 515–520.
Fenske R.A., Lu C., Simcox N.J., Loewenherz C., Touchstone J., Moate T.F.,
Allen E.H., and Kissel J.C. Strategies for assessing children’s organopho-
sphorus pesticide exposures in agricultural communities. J Expo Anal Environ
Epidemiol 2000b: 10(6 Part 2): 662–671.
Freeman N.C.G., Jimenez M., Reed K.J., Gurunathan S., Edwards R.D., Roy
A., Adgate J.L., Pellizzari E.D., Quackenboss J., Sexton K., and Lioy P.J.
Quantitative analysis of children’s microactivity patterns: the Minnesota
children’s pesticide exposure study. J Expo Anal Environ Epidemiol 2001:
11(6): 501–509.
Gurunathan S., Robson M., Freeman N., Buckley B., Roy A., Meyer R.,
Bukowski J., and Lioy P.J. Accumulation of chlorpyrifos on residential
surfaces and toys accessible to children. Environ Health Perspect 1998: 106(1):
9–16.
Hore P., Robson M., Freeman N., Zhang J., Wartenberg D., Ozkaynak H., Tulve
N., Sheldon L., Needham L., Barr D., and Lioy P.J. Chlorpyrifos
accumulation patterns for child-accessible surfaces and objects and urinary
metabolite excretion by children for 2 weeks after crack-and-crevice
application. Environ Health Perspect 2005: 113(2): 211–219.
Landrigan P.J., Claudio L., Markowitz S.B., Berkowitz G.S., Brenner B.L.,
Romero H., Wetmur J.G., Matte T.D., Gore A.C., Godbold J.H., and Wolff
M.S. Pesticides and inner-city children: exposures, risks, and prevention.
Environ Health Perspect 1999: 107(Suppl 3): 431–437.
Loewenherz C., Fenske R.A., Simcox N.J., Bellany G., and Kalman D. Biological
monitoring of organophosphorus pesticide exposure among children of
agricultural workers in central Washington State. Environ Health Perspect
1997: 105(12): 1344–1353.
Lu C., Barr D., Pearson M., Bartell S., and Bravo R. A longitudinal approach of
assessing urban and suburban children’s exposure to pyrethroid pesticides.
Environ Health Perspect 2006b: 114(9): 1419–1423.
Lu C., Fenske R.A., Simcox N.J., and Kalman D. Pesticide exposure of children
in an agricultural community: evidence of household proximity to farmland
and take home exposure pathways. Environ Res Sec A 2000: 84: 290–302.
Lu C., Knutson D.E., Fisker-Andersen J., and Fenske R.A. Biological monitoring
survey of organophosphorus pesticide exposure among preschool children
in the Seattle Metropolitan Area. Environ Health Perspect 2001: 109(3):
299–303.
Lu C., Toepel K., Irish R., Fenske R.A., Barr D.B., and Bravo R. Organic diets
significantly lower children’s dietary exposure to organophosphorus pesticides.
Environ Health Perspect 2006a: 114(2): 260–263.
MacIntosh D.L., Kabiru C., Echols S.L., and Ryan P.B. Dietary exposure to
chlorpyrifos and levels of 3,5,6-trichloro-2-pyridinol in urine. J Expo Anal
Environ Epidemiol 2001: 11(4): 279–285.
Morgan M.K., Sheldon L.S., Croghan C.W., Chuang J.C., Lordo R.A., Wilson
N.K., Lyu C., Brinkman M., Morse N., Chou Y.L., Hamilton C., Finegold
J.K., Hand K., and Gordon S.M. A pilot study of children’s total exposure to
persistent pesticides and other persistent organic pollutants (CTEPP), 2004
Volume 1: Final Report and Volume 2: Appendices. EPA/600/R-04/193.
www.epa.gov/heasd/ctepp/index.htm.
Morgan M.K., Sheldon L.S., Croghan C.W., Jones P.A., Robertson G.L.,
Chuang J.C., Wilson N.K., and Lyu C.W. Exposures of preschool children to
chlorpyrifos and its degradation product 3,5,6-trichloro-2-pyridinol in their
everyday environments. J Expo Anal Environ Epidemiol 2005: 15(4): 297–309.
Olsson A.O., Baker S.E., Nguyen J.V., Romanoff L.C., Udunka S.O., Walker
R.D., Flemmen K.L., and Barr D.B. A liquid chromatography-tandem mass
spectrometry multiresidue method for quantification of specific metabolites of
organophosphorus pesticides, synthetic pyrethroids, selected herbicides, and
DEET in human urine. Anal Chem 2004: 76(9): 2453–2461.
Pang Y., MacIntosh D.L., Camann D.E., and Ryan P.B. Analysis of aggregate
exposure to chlorpyrifos in the NHEXAS-Maryland investigation. Environ
Health Perspect 2002: 110(3): 235–240.
Perera F., Viswanathan S., Whyatt R., Tang D., Miller R.L., and Rauh V.
Children’s environmental health researchFhighlights from the Columbia
Center for Children’s Environmental Health. Ann NY Acad Sci 2006: 1076:
15–28.
Schwab M., McDermott A., and Spengler J.D. Using longitudinal data to
understand children’s activity patterns in an exposure context: data from the
Kanawha County health study. Environ Internat 1992: 18: 173–189.
Seifert B., Becker K., Helm D., Krause C., Schulz C., and Seiwert M. The
German Environmental Survey 1990/1992 (GerES II): reference concentra-
tions of selected environmental pollutants in blood urine, hair, house
dust, drinking water and indoor air. J Expo Anal Environ Epidemiol 2000a:
10(6 Pt 1): 552–565.
Seifert B., Becker K., Hoffmann K., Krause C., and Schulz C. The German
Environmental Survey 1990/1992 (GerES II): a representative population
study. J Expo Anal Environ Epidemiol 2000b: 10(2): 103–114.
Selim S., Preiss F.J., Gabriel K.L., Jonkman J.H.G., and Osimitz T.G.
Absorption and mass balance of piperonyl butoxide following an 8-h dermal
exposure in human volunteers. Toxicol Lett 1999: 107: 207–217.
Sexton K., Adgate J.L., Eberly L.E., Clayton C.A., Whitmore R.W., Pellizzari
E.D., Lioy P.J., and Quackenboss J.J. Predicting children’s short-term
exposure to pesticides: results of a questionnaire screening approach. Environ
Health Perspect 2003: 111(1): 123–128.
Shalat S.L., Donnelly K.C., Freeman N.C., Calvin J.A., Ramesh S., Jimenez M.,
Black K., Coutinho C., Needham L.L., Barr D.B., and Ramirez J.
Nondietary ingestion of pesticides by children in an agricultural community
on the US/Mexico border: preliminary results. J Expo Anal Environ Epidemiol
2003: 13(1): 42–50.
Silvers A., Florence B.T., Rourke D.L., and Lorimor R.J. How children spend
their time: a sample survey for use in exposure and risk assessments. Risk Anal
1994: 14(6): 931–944.
Simcox N.J., Fenske R.A., Wolz S.A., Lee I.-C., and Kalman D.A. Pesticides in
household dust and soil: exposure pathways for children of agricultural
families. Environ Health Perspect 1995: 103(12): 1126–1134.
Thomas K.W., Sheldon L.S., Pellizzari E.D., Handy R.W., Roberds J.M., and
Berry M.R. Testing duplicate diet sample collection methods for measuring
personal dietary exposures to chemical contaminants. J Expo Anal Environ
Epidemiol 1997: 7(1): 17–36.
Tulve N.S., Jones P.A., McCurdy T., and Croghan C.W. A pilot study using
an accelerometer to evaluate a caregiver’s interpretation of their infant or
toddler’s activity level as recorded in a time activity diary. Res Q Exer Sport
2007: 78(4): 375–383.
Tulve N.S., Jones P.A., Nishioka M.G., Fortmann R.C., Croghan C.W., Zhou
J.Y., Fraser A., Cave C., and Friedman W. Pesticide measurements from the
first national environmental health survey of child care centers using a multi-
residue GC/MS analysis method. Environ Sci Technol 2006a: 40(20): 6269–
6274.
Williams M.K., Barr D.B., Camann D.E., Cruz L.A., Carlton E.J., Borjas M.,
Reyes A., Evans D., Kinney P.L., Whitehead Jr R.D., Perera F.P.,
Matsoanne S., and Whyatt R.M. An intervention to reduce residential
insecticide exposure during pregnancy among an inner-city cohort. Environ
Health Perspect 2006: 114(11): 1684–1689.
Wilson N.K., Chuang J.C., Iachan R., Lyu C., Gordon S.M., Morgan M.K.,
Ozkaynak H., and Sheldon L.S. Design and sampling methodology for a large
study of preschool children’s aggregate exposures to persistent organic
pollutants in their everyday environments. J Expo Anal Environ Epidemiol
2004: 14(3): 260–274.
Multimedia samples and young children Tulve et al.
Journal of Exposure Science and Environmental Epidemiology (2008) 18(1) 43

Wilson N.K., Chuang J.C., Lyu C., Menton R., and Morgan M.K. Aggregate
exposures of nine preschool children to persistent organic pollutants
at day care and at home. J Expo Anal Environ Epidemiol 2003: 13(3):
187–202.
Zartarian V.G., Ferguson A.C., and Leckie J.O. Quantified dermal activity data
from a four-child pilot field study. J Expo Anal Environ Epidemiol 1997: 7(4):
543–552.
Zartarian V.G., Ferguson A.C., and Leckie J.O. Quantified mouthing activity
data from a four-child pilot field study. J Expo Anal Environ Epidemiol 1998:
8(4): 543–553.
Zartarian V.G., Streicker J., Rivera A., Cornejo C.S., Molina S., Valadez O.F.,
and Leckie J.O. A pilot study to collect micro-activity data of two- to four-
year-old farm labor children in Salinas Valley, California. J Expo Anal Environ
Epidemiol 1995: 5(1): 21–34.
Multimedia samples and young childrenTulve et al.
44 Journal of Exposure Science and Environmental Epidemiology (2008) 18(1)