
Multi-task feature selection in microarray data by binary ...
10
PROCEEDINGS Open Access Multi-task feature selection in microarray data by binary integer programming Liang Lan, Slobodan Vucetic * From Great Lakes Bioinformatics Conference 2013 Pittsburgh, PA, USA. 14-16 May 2013 Abstract A major challenge in microarray classification is that the number of features is typically orders of magnitude larger than the number of examples. In this paper, we propose a novel feature filter algorithm to select the feature subset with maximal discriminative power and minimal redundancy by solving a quadratic objective function with binary integer constraints. To improve the computational efficiency, the binary integer constraints are relaxed and a low-rank approximation to the quadratic term is applied. The proposed feature selection algorithm was extended to solve multi-task microarray classification problems. We compared the single-task version of the proposed feature selection algorithm with 9 existing feature selection methods on 4 benchmark microarray data sets. The empirical results show that the proposed method achieved the most accurate predictions overall. We also evaluated the multi-task version of the proposed algorithm on 8 multi-task microarray datasets. The multi-task feature selection algorithm resulted in significantly higher accuracy than when using the single-task feature selection methods. Background Microarray technology has the ability to simultaneously measure expression levels of thousands of genes for a given biological sample, which is classified into one of the several categories (e.g., cancer vs. control tissues). Each sample is represented by a feature vector of gene expressions obtained from a microarray. Using a set of microarray samples with known class labels, the goal is to learn a classifier able to classify a new tissue sample based on its microarray measurements. A typical micro- array classification data set contains a limited number of labeled examples, ranging from only a few to several hundred. Building a predictive model from such small- sample high-dimensional data is a challenging problem that has received a significant attention in machine learning and bioinformatics communities. To reduce the risk of over-fitting, a typical strategy is to select a small number of features (i.e., genes) before learning a classifi- cation model. As such, feature selection [1,2] becomes an essential technique in microarray classification. There are several reasons for feature selection in microarray data, in addition to improving the classifier’s generalization ability. First, the selected genes might be of interest to domain scientists interested in identifying disease biomarkers. Second, building a classifier from a small number of features could result in an easily inter- pretable model that could give important clues to biolo- gists. Depending on how the feature selection process is combined with model learning process, feature selection techniques can be organized into three categories. (1) Filter methods [3] are independent of the learning algo- rithm. (2) Wrapper methods [4] are coupled with the learning algorithm using heuristics such as forward selection and backward elimination. (3) Embedded methods [5,6] integrate feature selection as a part of the classifier training. Both the wrapper and the embedded methods effectively introduce hyper-parameters that require computationally costly nested cross-validation and increase likelihood of over-fitting. Feature filter methods are very popular because they are typically conceptually simple, computationally efficient, and robust to over-fitting. These properties also explain why the filter methods are more widely used than the other two approaches in microarray data classification. * Correspondence: [email protected] Department of Computer and Information Science, Temple University, Philadelphia, PA, USA Lan and Vucetic BMC Proceedings 2013, 7(Suppl 7):S5 http://www.biomedcentral.com/1753-6561/7/S7/S5 © 2013 Lan and Vucetic; licensee BioMed Central Ltd. This is an Open Access article distributed under the terms of the Creative Commons Attribution License (http://creativecommons.org/licenses/by/2.0), which permits unrestricted use, distribution, and reproduction in any medium, provided the original work is properly cited. The Creative Commons Public Domain Dedication waiver (http://creativecommons.org/publicdomain/zero/1.0/) applies to the data made available in this article, unless otherwise stated.
-
Upload
khangminh22 -
Category
Documents
-
view
0 -
download
0
Transcript of Multi-task feature selection in microarray data by binary ...
PROCEEDINGS Open Access
Multi-task feature selection in microarray databy binary integer programmingLiang Lan, Slobodan Vucetic*
From Great Lakes Bioinformatics Conference 2013Pittsburgh, PA, USA. 14-16 May 2013
Abstract
A major challenge in microarray classification is that the number of features is typically orders of magnitude largerthan the number of examples. In this paper, we propose a novel feature filter algorithm to select the featuresubset with maximal discriminative power and minimal redundancy by solving a quadratic objective function withbinary integer constraints. To improve the computational efficiency, the binary integer constraints are relaxed and alow-rank approximation to the quadratic term is applied. The proposed feature selection algorithm was extendedto solve multi-task microarray classification problems. We compared the single-task version of the proposed featureselection algorithm with 9 existing feature selection methods on 4 benchmark microarray data sets. The empiricalresults show that the proposed method achieved the most accurate predictions overall. We also evaluated themulti-task version of the proposed algorithm on 8 multi-task microarray datasets. The multi-task feature selectionalgorithm resulted in significantly higher accuracy than when using the single-task feature selection methods.
BackgroundMicroarray technology has the ability to simultaneouslymeasure expression levels of thousands of genes for agiven biological sample, which is classified into one ofthe several categories (e.g., cancer vs. control tissues).Each sample is represented by a feature vector of geneexpressions obtained from a microarray. Using a set ofmicroarray samples with known class labels, the goal isto learn a classifier able to classify a new tissue samplebased on its microarray measurements. A typical micro-array classification data set contains a limited number oflabeled examples, ranging from only a few to severalhundred. Building a predictive model from such small-sample high-dimensional data is a challenging problemthat has received a significant attention in machinelearning and bioinformatics communities. To reduce therisk of over-fitting, a typical strategy is to select a smallnumber of features (i.e., genes) before learning a classifi-cation model. As such, feature selection [1,2] becomesan essential technique in microarray classification.
There are several reasons for feature selection inmicroarray data, in addition to improving the classifier’sgeneralization ability. First, the selected genes might beof interest to domain scientists interested in identifyingdisease biomarkers. Second, building a classifier from asmall number of features could result in an easily inter-pretable model that could give important clues to biolo-gists. Depending on how the feature selection process iscombined with model learning process, feature selectiontechniques can be organized into three categories. (1)Filter methods [3] are independent of the learning algo-rithm. (2) Wrapper methods [4] are coupled with thelearning algorithm using heuristics such as forwardselection and backward elimination. (3) Embeddedmethods [5,6] integrate feature selection as a part of theclassifier training. Both the wrapper and the embeddedmethods effectively introduce hyper-parameters thatrequire computationally costly nested cross-validationand increase likelihood of over-fitting. Feature filtermethods are very popular because they are typicallyconceptually simple, computationally efficient, androbust to over-fitting. These properties also explain whythe filter methods are more widely used than the othertwo approaches in microarray data classification.
* Correspondence: [email protected] of Computer and Information Science, Temple University,Philadelphia, PA, USA
Lan and Vucetic BMC Proceedings 2013, 7(Suppl 7):S5http://www.biomedcentral.com/1753-6561/7/S7/S5
© 2013 Lan and Vucetic; licensee BioMed Central Ltd. This is an Open Access article distributed under the terms of the CreativeCommons Attribution License (http://creativecommons.org/licenses/by/2.0), which permits unrestricted use, distribution, andreproduction in any medium, provided the original work is properly cited. The Creative Commons Public Domain Dedication waiver(http://creativecommons.org/publicdomain/zero/1.0/) applies to the data made available in this article, unless otherwise stated.
Traditional filter methods rank the features based ontheir correlation with the class label and then select thetop ranked features. The correlation can be measured bystatistic tests (e.g., t-test) or by information-theoretic cri-teria such as mutual information. The filter methodseasily scale up to high dimensional data and can be usedin conjunction with any supervised learning algorithm.However, because the traditional filter methods accesseach feature independently, highly correlated featurestend to have similar rankings and tend to be selectedjointly. Using redundant features could result in low clas-sification accuracy. As a result, one common improve-ment for filter methods is to reduce redundancy betweenselected features. For example, minimal-redundancy-maximal-relevance (mRMR) proposed by [7] selects thefeature set with both maximal relevance to the targetclass and minimal redundancy among the selected fea-ture set. Because of the high computational cost of con-sidering all possible feature sets, the mRMR algorithmselects features greedily, minimizing their redundancywith features chosen in previous steps and maximizingtheir relevance to the target class.A common critique of popular feature selection filters
is that they are typically based on relatively simple heuris-tics. To address this concern, recent research resulted inmore principled formulation of feature filters. For exam-ple, algorithms proposed in [8] and [9] attempt to selectthe feature subset with maximal relevance and minimalredundancy by solving a constrained quadratic optimiza-tion problem (QP). The objective used by [8] is a combi-nation of a quadratic term and a linear term. Theredundancy between feature pairs is measured by thequadratic term and the relevance between features andclass label is measured by the linear term. The featuresare ranked based on a weight vector obtained by solvinga QP problem. The main limitation of this method is thatthe relevance between a feature and the class label ismeasured by either Pearson correlation or mutual infor-mation. However, Pearson correlation assumes normaldistribution of the measurements, which might not beappropriate to measure correlation between numericalfeatures and binary target. The mutual informationrequires using discrete variables and is sensitive to discre-tization. The objective used by [9] contains only onequadratic term. This quadratic term consists of twoparts: one measures feature relevance using mutual infor-mation between features and the class label, and anothermeasures feature redundancy using mutual informationbetween each feature pair. However, the square matrix inthe proposed quadratic term is not positive semi-definite.Thus, the resulting optimization problem is not convexand could result in poor local optima.In this paper, we propose a novel feature filter method
to find the feature subset which maximizes the inter-class
separability and intra-class tightness, and minimizes thepairwise correlations between selected features. We for-mulate the problem as a quadratic programming with bin-ary integer constraints. For high dimensional microarraydata, to solve the proposed quadratic programming pro-blem with binary integer constraints requires high timeand space cost. Therefore, we relax binary integer con-straints and apply the low rank approximation to thequadratic term in the objective function. The resultingobjective function can be efficiently solved to obtain asmall subset of features with maximal relevance and mini-mal redundancy.In many real-life microarray classification problems, the
size of the given microarray dataset is particularly small(e.g., we might have less than 10 labeled high-dimensionalexamples). In this case, even the most carefully designedfeature selection algorithms are bound to underperform.Probably the only remedy is to borrow strength fromexternal microarray datasets. Recent research [10,11] illus-trates that multi-task feature selection algorithms canimprove the classification accuracy. The multi-task featureselection algorithms select the informative features jointlyacross many different microarray classification data sets.Following this observation, we extend our feature selectionalgorithm to the multi-task microarray classification setup.The contributions of this paper can be summarized as
follows.(1) We propose a novel gene filter method whichcan obtain a feature subset with maximal discriminativepower and minimal redundancy; (2) The globally optimalsolution can be found efficiently by relaxing the integerconstraints and using a low-rank approximation techni-que; (3) We extend our feature selection method tomulti-task classification setting; (4) The experimentalresults show our algorithms achieve higher accuracy thanthe existing filter feature selection methods, both in sin-gle-task learning and multi-task settings.
Results and discussionWe compared our proposed feature algorithm with 9representative feature selection filters. The first 6 arestandard feature selection filters: Pearson Correlation(PC), ChiSquare [3], GINI, Infogain, Kruskal-Wallis testand Relief [12]. They rank the features based on differentcriteria that measure correlation between each featureand class label. The remaining 3 are the state-of-the-artfeature selection methods which are able to removeredundant features: mRMR [7], QPFS [8] and SASMIF[9]. The feature similarity for both QPFS and our algo-rithm was measured by Pearson correlation. For faircomparison, for the SASMIF method we used top mranked features. To balance the effect of feature relevanceand feature redundancy, the parameter l in (9) was set tom2M
∑i Ci∑
i,j Qij. The low-rank parameter k was set to 0.1 · M,
Lan and Vucetic BMC Proceedings 2013, 7(Suppl 7):S5http://www.biomedcentral.com/1753-6561/7/S7/S5
Page 2 of 10
as suggested in [13]. Our algorithm is denoted as ST-BIPfor single task version and MT-BIP for multi-task version.Given the selected features, we used LIBLINEAR [14]
to train the linear SVM model. The linear SVM modelwas chosen because previous studies [5] showed SVMclassifier could be very accurate on microarray data. Theregularization parameter C of LIBLINEAR was chosenamong {10-3, 10-4, …, 103}. For the experiments in thesingle-task scenario, we used the nested 5 cross validationto select the optimal regularization parameter. Forexperiments in multi-task learning scenario, it was tootime consuming to use the nested cross-validation toselect the regularization parameter. Thus, we simplyfixed the regularization parameter to 1 in the multi-taskexperiments.
Single task feature selectionIn this section, we evaluate our proposed feature selectionalgorithm for single-task learning using four benchmarkmicroarray gene expression cancer datasets: (1) Colondataset [15] containing 62 samples, 40 tumor and 22 nor-mal samples; (2) Lung dataset [16] containing 86 samplescoming from 24 patients that died and 62 that survived;(3) Diffuse B-cell Lymphoma (DLBCL) dataset [17] con-taining 77 samples, 58 coming from DLBCL patients and19 from Bcell lymphoma patients. (4) Myeloma dataset[18] containing 173 samples, 137 coming from patientswith bone lytic lesions and 36 from control patients. Wesummarize the characteristics of these datasets in Table 1.For each microarray dataset, we randomly selected
20 positive and 20 negative examples (except for choos-ing 15 positive and 15 negative in DLBCL dataset) as thetraining set and the rest as the test set. Due to the classimbalance in test sets, we used AUC, the area underthe Receiver Operating Characteristic (ROC) curve, toevaluate the performance. The average AUC based on10 repetitions of experiments on different random splitsto training and test set are reported in Table 2. WeCompared the AUC accuracy of different feature selec-tion algorithms for m = 20, 50, 100, 200, 1000. For eachdataset, the best AUC score among all methods wasemphasized in bold. As shown in Table 2, our proposedmethod achieved the highest accuracy on Colon andDLBCL datasets. On the Myeloma dataset, it had thehighest accuracy when m = 100 and 1000 and had thesecond highest accuracy when m = 20, 50 and 200. Onthe Lung dataset, our algorithm was ranked in the upperhalf of the competing algorithms. The last column in
Table 2 shows the average AUC score across four differ-ent datasets. Our method achieved the highest averageAUC scores. The next two successful feature selectionalgorithms are Relief and QSFS. The mRMR had some-what lower accuracy, comparable to simple filters such asPC, ChiSquare, GINI and InfoGain. SASMIF was consid-erably less accurate, while KW was the least successful.
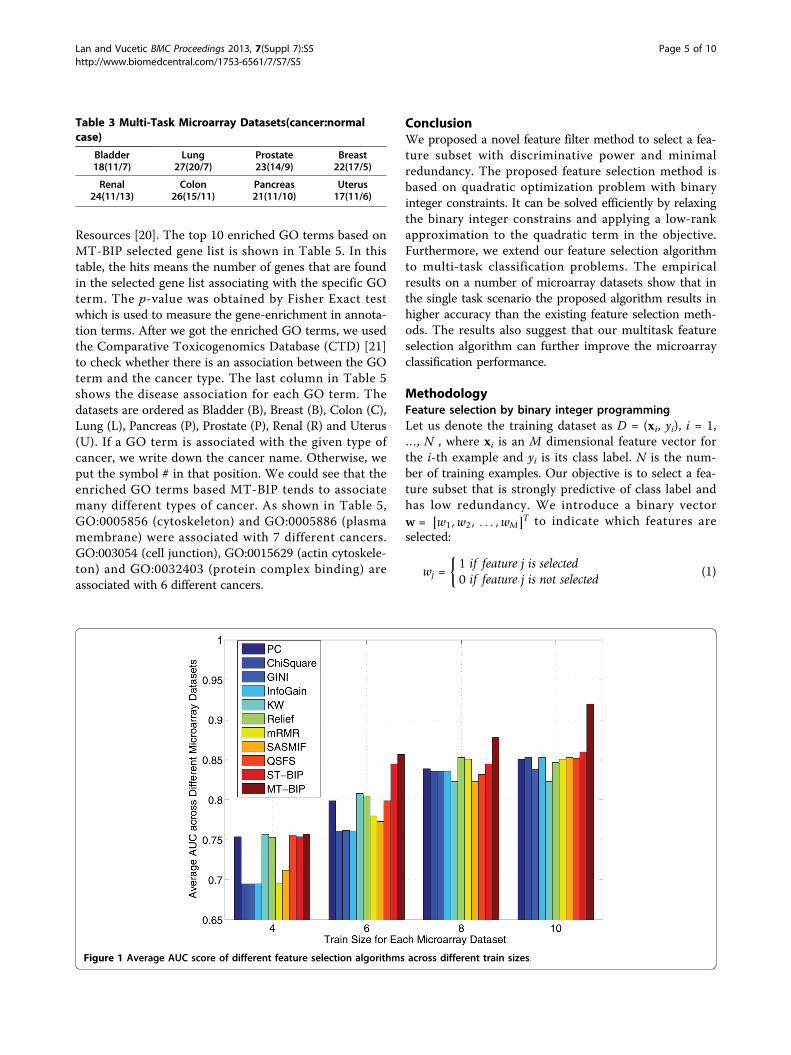
Multi-task feature selectionIn this section, we evaluate our proposed feature selec-tion algorithm for multi-task learning. We used 8 cancerrelated binary microarray classification datasets publishedin [19]. The data are summarized in Table 3. As shown inTable 3, the size of the 8 microarray datasets was verysmall. The single-task feature selection algorithms arenot expected to perform well because there might beinsufficient information even when simple feature selec-tion filters are used. In contrast, our multi-task featureselection algorithm is expected to improve the accuracyby borrowing strength across multiple microarraydatasets.For each microarray data set, we randomly selected N+ =
2, 3, 4, 5 positive and the same number of negative exam-ples as the training data and used the rest as the test data.We show the results for m = 100 in this section. The aver-age AUC across these 8 microarray datasets is shown inFigure 1. The results clearly show the multi-task version ofour proposed algorithm was the most successful algorithmoverall.To gain a deeper understanding about the reason why
the multi-task feature selection algorithm obtained betteroverall accuracy than single-task feature selection algo-rithms, we show the AUC score of each individual microar-ray dataset based on N+ = 3 in Table 4. We can see thatthe single task version of our feature selection algorithmhad the highest overall accuracy among other single-taskbenchmarks, a result consistent with Table 2. The multi-task version of our algorithm has higher AUC than its sin-gle task version on 4 datasets and its average AUC is about1.5% higher. In 4 cases, (e.g. Colon, Lung, Pancreas, Renaldatasets) we can also observe the negative transfer, wherethe accuracy drops. How to prevent negative transfer inmulti-task feature selection would be another interestresearch topic for our future research.
Gene-annotation enrichment analysis for multi-taskmicroarray datasetsThe multi-task experimental results show that accuraciesobtained by MT-BIP are better than other single task fea-ture filters overall. So we would like to perform functionannotation of the MP selected genes. In MT-BIP filter,only one selected gene list is obtained for all 8 differenttypes of cancers. Given this gene list, the top 10 enrichedGO terms were obtained using DAVID Bioinformatics
Table 1 Summary of the Microarray Datasets
Colon Lung DLBCL Myeloma
# Samples 60(40/22) 86(24/62) 77(58/19) 173(137/36)
# Genes 2000 5469 5469 12558
Lan and Vucetic BMC Proceedings 2013, 7(Suppl 7):S5http://www.biomedcentral.com/1753-6561/7/S7/S5
Page 3 of 10
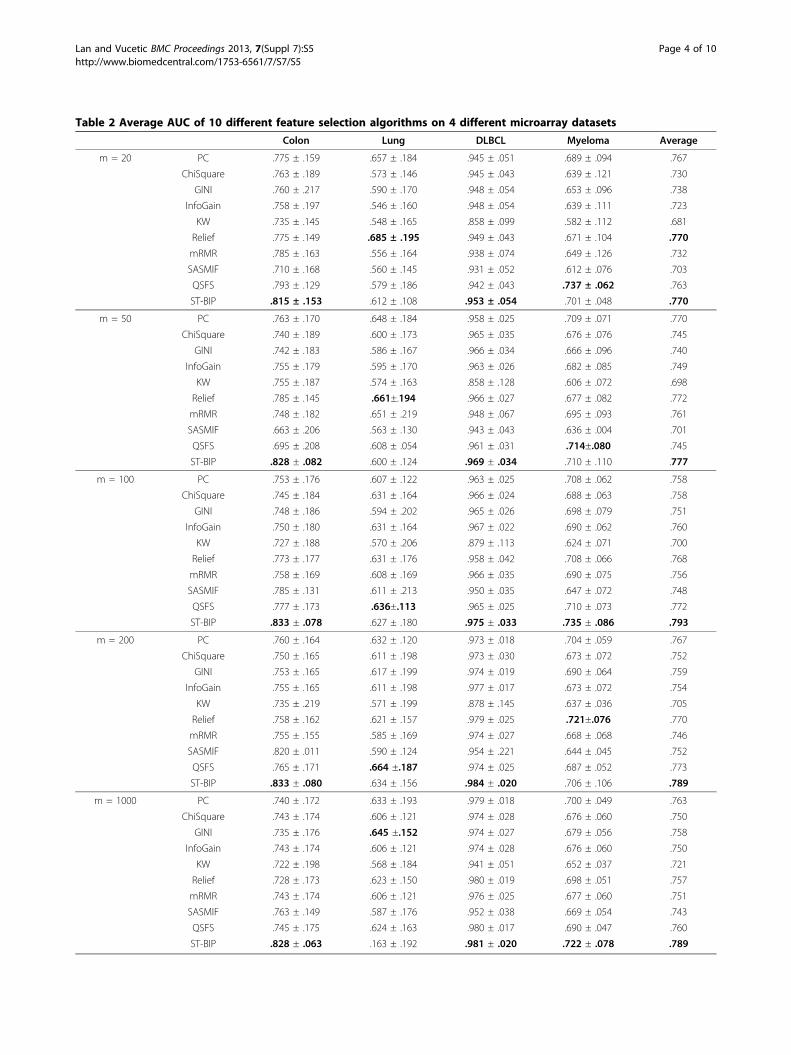
Table 2 Average AUC of 10 different feature selection algorithms on 4 different microarray datasets
Colon Lung DLBCL Myeloma Average
m = 20 PC .775 ± .159 .657 ± .184 .945 ± .051 .689 ± .094 .767
ChiSquare .763 ± .189 .573 ± .146 .945 ± .043 .639 ± .121 .730
GINI .760 ± .217 .590 ± .170 .948 ± .054 .653 ± .096 .738
InfoGain .758 ± .197 .546 ± .160 .948 ± .054 .639 ± .111 .723
KW .735 ± .145 .548 ± .165 .858 ± .099 .582 ± .112 .681
Relief .775 ± .149 .685 ± .195 .949 ± .043 .671 ± .104 .770
mRMR .785 ± .163 .556 ± .164 .938 ± .074 .649 ± .126 .732
SASMIF .710 ± .168 .560 ± .145 .931 ± .052 .612 ± .076 .703
QSFS .793 ± .129 .579 ± .186 .942 ± .043 .737 ± .062 .763
ST-BIP .815 ± .153 .612 ± .108 .953 ± .054 .701 ± .048 .770
m = 50 PC .763 ± .170 .648 ± .184 .958 ± .025 .709 ± .071 .770
ChiSquare .740 ± .189 .600 ± .173 .965 ± .035 .676 ± .076 .745
GINI .742 ± .183 .586 ± .167 .966 ± .034 .666 ± .096 .740
InfoGain .755 ± .179 .595 ± .170 .963 ± .026 .682 ± .085 .749
KW .755 ± .187 .574 ± .163 .858 ± .128 .606 ± .072 .698
Relief .785 ± .145 .661±.194 .966 ± .027 .677 ± .082 .772
mRMR .748 ± .182 .651 ± .219 .948 ± .067 .695 ± .093 .761
SASMIF .663 ± .206 .563 ± .130 .943 ± .043 .636 ± .004 .701
QSFS .695 ± .208 .608 ± .054 .961 ± .031 .714±.080 .745
ST-BIP .828 ± .082 .600 ± .124 .969 ± .034 .710 ± .110 .777
m = 100 PC .753 ± .176 .607 ± .122 .963 ± .025 .708 ± .062 .758
ChiSquare .745 ± .184 .631 ± .164 .966 ± .024 .688 ± .063 .758
GINI .748 ± .186 .594 ± .202 .965 ± .026 .698 ± .079 .751
InfoGain .750 ± .180 .631 ± .164 .967 ± .022 .690 ± .062 .760
KW .727 ± .188 .570 ± .206 .879 ± .113 .624 ± .071 .700
Relief .773 ± .177 .631 ± .176 .958 ± .042 .708 ± .066 .768
mRMR .758 ± .169 .608 ± .169 .966 ± .035 .690 ± .075 .756
SASMIF .785 ± .131 .611 ± .213 .950 ± .035 .647 ± .072 .748
QSFS .777 ± .173 .636±.113 .965 ± .025 .710 ± .073 .772
ST-BIP .833 ± .078 .627 ± .180 .975 ± .033 .735 ± .086 .793
m = 200 PC .760 ± .164 .632 ± .120 .973 ± .018 .704 ± .059 .767
ChiSquare .750 ± .165 .611 ± .198 .973 ± .030 .673 ± .072 .752
GINI .753 ± .165 .617 ± .199 .974 ± .019 .690 ± .064 .759
InfoGain .755 ± .165 .611 ± .198 .977 ± .017 .673 ± .072 .754
KW .735 ± .219 .571 ± .199 .878 ± .145 .637 ± .036 .705
Relief .758 ± .162 .621 ± .157 .979 ± .025 .721±.076 .770
mRMR .755 ± .155 .585 ± .169 .974 ± .027 .668 ± .068 .746
SASMIF .820 ± .011 .590 ± .124 .954 ± .221 .644 ± .045 .752
QSFS .765 ± .171 .664 ±.187 .974 ± .025 .687 ± .052 .773
ST-BIP .833 ± .080 .634 ± .156 .984 ± .020 .706 ± .106 .789
m = 1000 PC .740 ± .172 .633 ± .193 .979 ± .018 .700 ± .049 .763
ChiSquare .743 ± .174 .606 ± .121 .974 ± .028 .676 ± .060 .750
GINI .735 ± .176 .645 ±.152 .974 ± .027 .679 ± .056 .758
InfoGain .743 ± .174 .606 ± .121 .974 ± .028 .676 ± .060 .750
KW .722 ± .198 .568 ± .184 .941 ± .051 .652 ± .037 .721
Relief .728 ± .173 .623 ± .150 .980 ± .019 .698 ± .051 .757
mRMR .743 ± .174 .606 ± .121 .976 ± .025 .677 ± .060 .751
SASMIF .763 ± .149 .587 ± .176 .952 ± .038 .669 ± .054 .743
QSFS .745 ± .175 .624 ± .163 .980 ± .017 .690 ± .047 .760
ST-BIP .828 ± .063 .163 ± .192 .981 ± .020 .722 ± .078 .789
Lan and Vucetic BMC Proceedings 2013, 7(Suppl 7):S5http://www.biomedcentral.com/1753-6561/7/S7/S5
Page 4 of 10
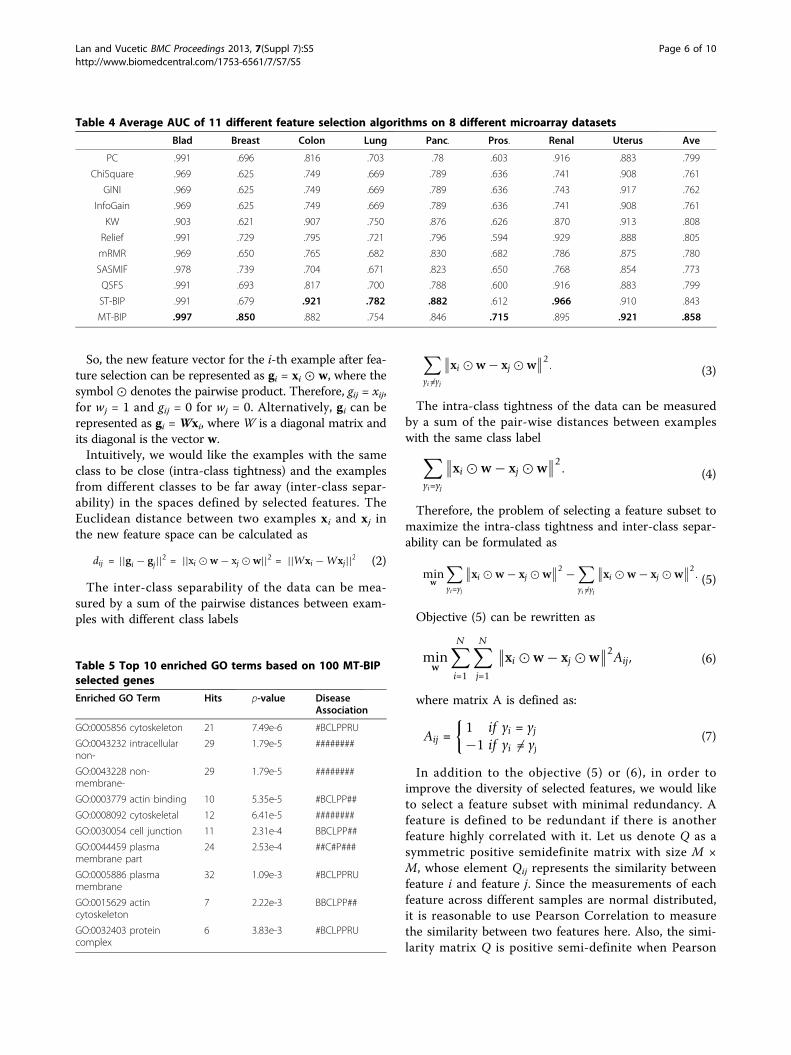
Resources [20]. The top 10 enriched GO terms based onMT-BIP selected gene list is shown in Table 5. In thistable, the hits means the number of genes that are foundin the selected gene list associating with the specific GOterm. The p-value was obtained by Fisher Exact testwhich is used to measure the gene-enrichment in annota-tion terms. After we got the enriched GO terms, we usedthe Comparative Toxicogenomics Database (CTD) [21]to check whether there is an association between the GOterm and the cancer type. The last column in Table 5shows the disease association for each GO term. Thedatasets are ordered as Bladder (B), Breast (B), Colon (C),Lung (L), Pancreas (P), Prostate (P), Renal (R) and Uterus(U). If a GO term is associated with the given type ofcancer, we write down the cancer name. Otherwise, weput the symbol # in that position. We could see that theenriched GO terms based MT-BIP tends to associatemany different types of cancer. As shown in Table 5,GO:0005856 (cytoskeleton) and GO:0005886 (plasmamembrane) were associated with 7 different cancers.GO:003054 (cell junction), GO:0015629 (actin cytoskele-ton) and GO:0032403 (protein complex binding) areassociated with 6 different cancers.
ConclusionWe proposed a novel feature filter method to select a fea-ture subset with discriminative power and minimalredundancy. The proposed feature selection method isbased on quadratic optimization problem with binaryinteger constraints. It can be solved efficiently by relaxingthe binary integer constrains and applying a low-rankapproximation to the quadratic term in the objective.Furthermore, we extend our feature selection algorithmto multi-task classification problems. The empiricalresults on a number of microarray datasets show that inthe single task scenario the proposed algorithm results inhigher accuracy than the existing feature selection meth-ods. The results also suggest that our multitask featureselection algorithm can further improve the microarrayclassification performance.
MethodologyFeature selection by binary integer programmingLet us denote the training dataset as D = (xi, yi), i = 1,…, N , where xi is an M dimensional feature vector forthe i-th example and yi is its class label. N is the num-ber of training examples. Our objective is to select a fea-ture subset that is strongly predictive of class label andhas low redundancy. We introduce a binary vectorw = [w1, w2, . . . , wM]T to indicate which features areselected:
wj ={
1 if feature j is selected0 if feature j is not selected
(1)
Table 3 Multi-Task Microarray Datasets(cancer:normalcase)
Bladder18(11/7)
Lung27(20/7)
Prostate23(14/9)
Breast22(17/5)
Renal24(11/13)
Colon26(15/11)
Pancreas21(11/10)
Uterus17(11/6)
Figure 1 Average AUC score of different feature selection algorithms across different train sizes.
Lan and Vucetic BMC Proceedings 2013, 7(Suppl 7):S5http://www.biomedcentral.com/1753-6561/7/S7/S5
Page 5 of 10
So, the new feature vector for the i-th example after fea-ture selection can be represented as gi = xi ⊙ w, where thesymbol ⊙ denotes the pairwise product. Therefore, gij = xij,for wj = 1 and gij = 0 for wj = 0. Alternatively, gi can berepresented as gi = Wxi, where W is a diagonal matrix andits diagonal is the vector w.Intuitively, we would like the examples with the same
class to be close (intra-class tightness) and the examplesfrom different classes to be far away (inter-class separ-ability) in the spaces defined by selected features. TheEuclidean distance between two examples xi and xj inthe new feature space can be calculated as
dij = ||gi − gj||2 = ||xi � w − xj � w||2 = ||Wxi − Wxj||2 (2)
The inter-class separability of the data can be mea-sured by a sum of the pairwise distances between exam-ples with different class labels
∑yi �=yj
∥∥xi � w − xj � w∥∥2. (3)
The intra-class tightness of the data can be measuredby a sum of the pair-wise distances between exampleswith the same class label
∑yi=yj
∥∥xi � w − xj � w∥∥2. (4)
Therefore, the problem of selecting a feature subset tomaximize the intra-class tightness and inter-class separ-ability can be formulated as
minw
∑yi=yj
∥∥xi � w − xj � w∥∥2 −
∑yi �=yj
∥∥xi � w − xj � w∥∥2. (5)
Objective (5) can be rewritten as
minw
N∑i=1
N∑j=1
∥∥xi � w − xj � w∥∥2
Aij, (6)
where matrix A is defined as:
Aij ={
1 if yi = yj
−1 if yi �= yj(7)
In addition to the objective (5) or (6), in order toimprove the diversity of selected features, we would liketo select a feature subset with minimal redundancy. Afeature is defined to be redundant if there is anotherfeature highly correlated with it. Let us denote Q as asymmetric positive semidefinite matrix with size M ×M, whose element Qij represents the similarity betweenfeature i and feature j. Since the measurements of eachfeature across different samples are normal distributed,it is reasonable to use Pearson Correlation to measurethe similarity between two features here. Also, the simi-larity matrix Q is positive semi-definite when Pearson
Table 5 Top 10 enriched GO terms based on 100 MT-BIPselected genes
Enriched GO Term Hits p-value DiseaseAssociation
GO:0005856 cytoskeleton 21 7.49e-6 #BCLPPRU
GO:0043232 intracellularnon-
29 1.79e-5 ########
GO:0043228 non-membrane-
29 1.79e-5 ########
GO:0003779 actin binding 10 5.35e-5 #BCLPP##
GO:0008092 cytoskeletal 12 6.41e-5 ########
GO:0030054 cell junction 11 2.31e-4 BBCLPP##
GO:0044459 plasmamembrane part
24 2.53e-4 ##C#P###
GO:0005886 plasmamembrane
32 1.09e-3 #BCLPPRU
GO:0015629 actincytoskeleton
7 2.22e-3 BBCLPP##
GO:0032403 proteincomplex
6 3.83e-3 #BCLPPRU
Table 4 Average AUC of 11 different feature selection algorithms on 8 different microarray datasets
Blad Breast Colon Lung Panc. Pros. Renal Uterus Ave
PC .991 .696 .816 .703 .78 .603 .916 .883 .799
ChiSquare .969 .625 .749 .669 .789 .636 .741 .908 .761
GINI .969 .625 .749 .669 .789 .636 .743 .917 .762
InfoGain .969 .625 .749 .669 .789 .636 .741 .908 .761
KW .903 .621 .907 .750 .876 .626 .870 .913 .808
Relief .991 .729 .795 .721 .796 .594 .929 .888 .805
mRMR .969 .650 .765 .682 .830 .682 .786 .875 .780
SASMIF .978 .739 .704 .671 .823 .650 .768 .854 .773
QSFS .991 .693 .817 .700 .788 .600 .916 .883 .799
ST-BIP .991 .679 .921 .782 .882 .612 .966 .910 .843
MT-BIP .997 .850 .882 .754 .846 .715 .895 .921 .858
Lan and Vucetic BMC Proceedings 2013, 7(Suppl 7):S5http://www.biomedcentral.com/1753-6561/7/S7/S5
Page 6 of 10
Correlation is used. Then, we define a redundancyamong the selected set of features represented by vectorw as their average pair-wise similarity wTQw/m2, wherem is the number of selected features. Our objective is tominimize the redundancy defined in such way.The first contribution of this paper is to formulate the
feature selection task as a new quadratic programmingproblem subject to binary integer and linear constraints asfollows,
minw
N∑i=1
N∑j=1
||xi � w − xj � w ||2Aij + λ1
m2wTQw
s.t. wi ∈ {0, 1}∀iM∑i=1
wi = m.
(8)
The first term in (8), which is a linear term as shown inthe following Proposition 1, tries to maximize the inter-class separability and intra-class tightness of the data. Itdescribes the discriminative power of the selected featuresubset. The second quadratic term is the average pair-wise similarity score between the selected features, whichresults in reduction of feature redundancy. Parameter lis introduced to control the tradeoff between feature rele-vance and feature redundancy. Since Q is a positive semi-definite matrix, the proposed objective function is con-vex. The first constraint ensures that the resulting vectorw is binary, while the second constraint ensuresthat exactly m features are selected. The following pro-position establishes that the first term in the objective(8) is linear.Proposition 1. The first term of the objective function
(8) can be written as a linear term cT w, where c is vectorof size M with elements ci = (XTLX)ii, L is the Laplacianmatrix of A, defined as L = D − A. D is a diagonaldegree matrix such that Dii =
∑j Aij. The X is the N × M
feature matrix. Each row in X corresponds to one exam-ple. (XTLX)ii denotes the i-th element in the diagonal ofthe matrix XTLX.Proof. Let us denote W as a diagonal matrix where Wii =
wi. Then,
N∑i=1
N∑j=1
||xi � w − xj � w ||2Aij =N∑
i=1
N∑j=1
||Wxi − Wxj ||2Aij
= trace(WTXTLXW)= trace(XTLXWWT)
because wi Î {0, 1}, WWT = W. Therefore,
trace(XTLXWWT) =∑M
i=1 (XTLX)iiWii = cTw, where ci =(XT LX)ii. □Based on Proposition 1, objective (8) can be rewritten
as the following constrained quadratic optimization pro-blem,
minw
cTw + λ1
m2wTQw
s.t. wi ∈ {0, 1}∀iM∑i=1
wi = m.
(9)
There are two practical obstacles in solving (9): (1)Binary constraint of variable w, and (2) feature similaritymatrix Q is with size M × M, which implies high com-putational cost for high dimensional data. In the nexttwo sections, we will first relax the binary constraint,and then we will apply a low-rank approximation to Q.The resulting constrained optimization problem can besolved very efficiently, with linear time with respect tothe number of features M.Problem relaxation. Due to the binary constraint on
the indictor vector w, it is difficult to solve (9) [9]. Toresolve this, we first relax the binary constraint on w byallowing its elements wi to be within the range [0, m].Then, (9) could be approximated by
minw
cTw + λ1
m2wTQw
s.t. wi ≥ 0 ∀iM∑i=1
wi = m.
(10)
Now, (10) becomes a standard Quadratic Program-ming (QP) problem. The optimal solution can beobtained by a general QP solver (e.g., MOSEK [22]).Low-rank approximation. The matrix Q in (10) is of
size M × M . So, it results in high time and space cost ifwe work with high dimensional microarray data. There-fore, we would like to avoid the computational bottle-neck by using low-rank approximation techniques.The matrix Q in (10) is symmetric positive semidefi-
nite. So, it can be decomposed as Q = UΛUT, where Uis a matrix of eigenvectors and Λ is a diagonal matrixwith corresponding eigenvalues of Q. By setting
α = �12 UTw, it follows that w = U�− 1
2 α. Therefore,problem (10) can be rewritten as
minα
cTU�−
12 α + λ
1m2
αTα
s.t. U�−
12 α ≥ 0
1U�−
12 α = m.
(11)
Typically, the rank of Q (let us denote it as k) is muchsmaller than M, k � M. Therefore, we can replace thefull eigenvector and eigenvalue matrices U and Λ by the
Lan and Vucetic BMC Proceedings 2013, 7(Suppl 7):S5http://www.biomedcentral.com/1753-6561/7/S7/S5
Page 7 of 10
top k eigenvectors and eigenvalues, resulting in an M × kmatrix Uk and a k × k diagonal matrix Λk, without losingmuch information. Therefore, (11) is reformulated as
minα
cTUk�−
12
k α + λ1
m2αTα
s.t. Uk�−
12
k α ≥ 0
1Uk�−
12
k α = m.
(12)
Since a is a vector with length k, k � M. the QP (11)is reduced to a new QP in a k-dimensional space withM + 1 constraints. Once the solution a of (12) isobtained, the variable w in original space can be
approximated by w = Uk�− 1
2k α.
Decomposing matrix Q requires O(M3) time, which isexpensive in microarray data where M is large. Next wewill show how to efficiently compute the top k eigenvec-tors and eigenvalues using Nystrom approximation tech-nique [23]. Nystrom method approximates a M × Msymmetric, positive semi-definite matrix Q by
Q = EMkW−1kk ET
Mk (13)
where EMk denotes the sub-matrix of Q created byselecting k of its columns, and Wkk is a sub-matrix thatcorresponds to the intersection of the selected columnsand rows. Sampling schemes in Nystrom methodinclude random sampling [23], probabilistic sampling[24], and k-means based sampling [13]. We chose thek-means sampling in our experiments because [13]showed that it produces very good low-rank approxima-tions at a relatively low cost. Given (13), we can easilyobtain the low rank approximation of Q as
Q = GGT where G = EMkW−
12
kk .(14)
As shown in the following Proposition 2, the top keigenvectors and eigenvalues can be computed in O(Mk2)time using Nystrom method, which is much more efficientthan doing eigen-decomposition of Q, which requiresO(M3) time.Proposition 2. The top k eigenvectors Uk and the cor-
responding eigenvectors Λk of Q = GGT can be approxi-
mated as Λk = ΛG and Uk = GUG�− 1
2G
, where UG and
ΛG are obtained by the eigen-decomposition of k × kmatrix GTG = UG�GUT
GProof. First, we observe that Uk contains orthonormal
columns.
UTk Uk = �
−12
G UTGGTGUG�
−12
G
= �−
12
G UTGUG�GUT
GUG�−
12
G = I.
Next, we observe that
Uk�kUTk = GUG�
−12
G �G�−
12
G UTGGT = GGT = Q
□Our proposed feature selection algorithm is summarized
in Algorithm 1. In the Algorithm 1, steps 1 to 5 requireO(Mk2 + k3) time. QP in step 6 with k variables has a poly-nomial time complexity with respect to k. Step 7 requiresO(Mk) time. Therefore, overall, the proposed feature selec-tion algorithm is very efficient and it has linear time com-plexity with the number of features M.Algorithm 1 Single-Task Binary Integer Program Fea-
ture SelectionInput: training data X, their labels y, regularized para-
meter l, number of features m, low-rank parameter k.Output: m selected features1. Apply Proposition 1 to compute the vector c2. Use k-means to select k landmark features for low-
rank approximation of Q3. Compute EMk and Wkk in (13)4. Obtain low-rank approximation of Q by (14)5. Apply Proposition 2 to compute the top k eigenva-
lue Λk and eigenvector Uk of Q6. Obtain a by solving the lower dimensional QP pro-
blem(12).7. Obtain w in original feature space as w = Uk�
− 12 α
8. Rank the features according to the weight vector wand select the top m features
Multi-task feature selection by binary integerprogrammingMulti-task learning algorithms have been shown to beable to achieve significantly higher accuracy than singletask learning algorithms both empirically [11] and theo-retically [25]. Motivated by these promising results, inthis section, we extend our feature selection algorithmto the multi-task setting. The objective is to select fea-tures which are discriminative and non-redundant overmultiple microarray datasets.Let us suppose there are K different but similar classi-
fication tasks, and denote the training data of the t-thtask as Dt = {(xt
i , yti), i = 1, . . . , Nt}, where Nt is the
number of training examples of the t-th task. [10,11]proposed multi-task feature selection algorithms thatuse ℓ1,2 norm to regularize the linear model coefficientsb across K different classification tasks. The ℓ1,2 norm
Lan and Vucetic BMC Proceedings 2013, 7(Suppl 7):S5http://www.biomedcentral.com/1753-6561/7/S7/S5
Page 8 of 10
regularizer over all bs across K classification tasks could
be expressed as∑M
j=1 (∑K
t=1 ||β jt ||2), where β
jt is the coef-
ficient of the j-th feature in the t-th task. Due to the ℓ1
norm on the ℓ2 norm of group of coefficients of eachfeature across K tasks, the ℓ1,2 norm regularizer selectsthe same feature subset across K tasks. However, theℓ1,2 norm regularized problem is challenging to solvebecause the non-smoothness of the ℓ1,2 norm. In thissection, we would like to show our proposed featureselection can be easily extended to multi-task learningversion. The resulting objective optimization problemhave the same form as objective (9), which can be solveefficiently as shown in previous section.Let us denote wt as the binary indicator defined in (1)
to represent the selected feature subset of the t-th classi-fication task. If we do not consider the relatednessbetween these K classification task, individual wt couldbe obtained by applying Algorithm 1 to different classi-fication tasks. Based on the conclusion given by [10,11],it would be beneficial to select the same feature subsetacross K related classification task. In our case, this iscan be achieved by setting wt = w ∀ t. Therefore, thesame feature across K tasks, defined by vector w, can beobtained by solving the following optimization problem,
minw
K∑j=1
cTj w + λ
1m2
wTK∑
j=1
Qjw
s.t. wi ∈ {0, 1}∀iM∑i=1
wi = m.
(15)
where cj and Qj are the linear and quadratic terms of theQP corresponding to the j-th task. The details about howto compute the cj and Qj are explained in the previous sec-tion. The technique of relaxing binary integer constraintsand applying low-rank approximation to Q introduced inthe previous section can be used to solve (15). Theextended multi-task feature selection algorithm is also afeature filter. It can be used in conjunction with any super-vised learning algorithm.
Competing interestsThe authors declare that they have no competing interests.
Authors’ contributionsLL and SV conceived the study and developed the algorithm. LL wrote thefirst draft of the manuscript. Both authors participated in the preparation ofthe manuscript and approved the final version.
AcknowledgementsThis work was supported by the U.S. National Science Foundation Grant IIS-0546155.
DeclarationsPublication of this work was supported by the U.S. National ScienceFoundation Grant IIS-0546155.
This article has been published as part of BMC Proceedings Volume 7Supplement 7, 2013: Proceedings of the Great Lakes BioinformaticsConference 2013. The full contents of the supplement are available online athttp://www.biomedcentral.com/bmcproc/supplements/7/S7.
Published: 20 December 2013
References1. Guyon I, Elisseeff A: An Introduction to Variable and Feature Selection.
Journal of Machine Learning Research 2003, 1157-1182.2. Saeys Y, Inza I, Larranãga P: A review of feature selection techniques in
bioinformatics. Bioinformatics 2007, 23(19):2507-2517.3. Liu H, Setiono R: A probabilistic approach to feature selection - a filter
solution. Proceedings of the Thirteeth th International Conference on MachineLearning 1996, 319-327.
4. Kohavi R, John G: Wrappers for Feature Subset Selection. ArtificialIntelligence 1997, 97:273-324.
5. Guyon I, Weston J, Barnhill S, Vapnik V: Gene Selection for CancerClassification using Support Vector Machines. Machine Learning 2002,46:389-422.
6. Tibshirani RJ: Regression Shrinkage and Selection via the Lasso. Journal ofthe Royal Statistical Society, Series B 1996, 58:267-288.
7. Peng H, Long F, Ding CHQ: Feature Selection Based on MutualInformation: Criteria of Max-Dependency, Max-Relevance, and Min-Redundancy. IEEE Transactions on Pattern Analysis and Machine Intelligence2005, 27(8):1226-1238.
8. Lujan IR, Huerta R, Elkan C, Cruz CS: Quadratic Programming FeatureSelection. Journal of Machine Learning Research 2010, 11:1491-1516.
9. Liu S, Liu H, Latecki LJ, Yan S, Xu C, Lu H: Size Adaptive Selection of MostInformative Features. Proceedings of the Twenty-Fifth AAAI Conference onArtificial Intelligence 2011.
10. Argyriou A, Evgeniou T, Pontil M: Convex multi-task feature learning.Machine Learning 2008, 73(3):243-272.
11. Obozinski G, Taskar B, Jordan MI: Joint covariate selection and jointsubspace selection for multiple classification problems. Statistics andComputing 2010, 20(2):231-252.
12. Kira K, Rendell LA: A Practical Approach to Feature Selection.Proceedings of the Ninth International Conference on Machine Learning1992, 249-256.
13. Zhang K, Kwok JT, Parvin B: Prototype vector machine for large scalesemi-supervised learning. Proceedings of the Twenty-sixth InternationalConference on Machine Learning 2009, 1233-1240.
14. Fan RE, Chang KW, Hsieh CJ, Wang XR, Lin CJ: LIBLINEAR: A Library forLarge Linear Classification. Journal of Machine Learning Research 2008,9:1871-1874.
15. Alon U, Barkai N, Notterman DA, Gish K, Ybarra S, Mack D, Levine AJ: Broadpatterns of gene expression revealed by clustering analysis of tumorand normal colon tissues probed by oligonucleotide arrays. TheProceedings of the National Academy of Sciences USA 1999, 6745-6750.
16. Beer DG, Kardia SL, Huang CC, Giordano TJ, Levin AM, Misek DE, Lin L,Chen G, Gharib TG, Thomas DG, Lizyness ML, Kuick R, Hayasaka S, Taylor JM,Iannettoni MD, Orringer MB, Hanash S: Gene-expression profiles predictsurvival of patients with lung adenocarcinoma. Nature Medicine 2002,816-824.
17. Shipp MA, Ross KN, Tamayo P, Weng AP, Kutok JL, Aguiar RC,Gaasenbeek M, Angelo M, Reich M, Pinkus GS, Ray TS, Koval MA, Last KW,Norton A, Lister TA, Mesirov J, Neuberg DS, Lander ES, Aster JC, Golub TR:Diffuse large B-cell lymphoma outcome prediction by gene-expressionprofiling and supervised machine learning. Nature Medicine 2002, 68-74.
18. Tian E, Zhan F, Walker R, Rasmussena E, Ma Y, Barlogie B, Shaughnessy J:The role of the Wnt-signaling antagonist DKK1 in the development ofosteolytic lesions in multiple myeloma. New England Journal of Medicine2003, 2483-2494.
19. Ramaswamy S, Tamayo P, Rifkin R, Mukherjee S, Yeang CH, Angelo M,Ladd C, Reich M, Latulippe E, Mesirov JP, Poggio T, Gerald W, Loda M,Lander ES, Golub TR: Multiclass cancer diagnosis using tumor geneexpression signatures. Proceedings of the National Academy of Sciences USA2001, 15149-54.
20. Da Wei Huang BTS, Lempicki RA, et al: Systematic and integrative analysisof large gene lists using DAVID bioinformatics resources. Nature protocols2008, 4:44-57.
Lan and Vucetic BMC Proceedings 2013, 7(Suppl 7):S5http://www.biomedcentral.com/1753-6561/7/S7/S5
Page 9 of 10
21. Davis AP, King BL, Mockus S, Murphy CG, Saraceni-Richards C, Rosenstein M,Wiegers T, Mattingly CJ: The comparative toxicogenomics database:update 2011. Nucleic acids research 2011, 39(suppl 1):D1067-D1072.
22. Andersen ED, Andersen KD: The MOSEK interior point optimizer for linearprogramming: an implementation of the homogeneous algorithm. HighPerformance Optimization 2000, 197-232.
23. Williams CKI, Seeger M: The Effect of the Input Density Distribution onKernel-based Classifiers. Proceedings of the Seventeenth InternationalConference on Machine Learning 2000, 1159-1166.
24. Drineas P, Mahoney MW: On the Nyström Method for Approximating aGram Matrix for Improved Kernel-Based Learning. Journal of MachineLearning Research 2005, 6:2153-2175.
25. Ben-David S, Schuller R: Exploiting Task Relatedness for Multiple TaskLearning. COLT: Proceedings of the Workshop on Computational LearningTheory 2003.
doi:10.1186/1753-6561-7-S7-S5Cite this article as: Lan and Vucetic: Multi-task feature selection inmicroarray data by binary integer programming. BMC Proceedings 20137(Suppl 7):S5.
Submit your next manuscript to BioMed Centraland take full advantage of:
• Convenient online submission
• Thorough peer review
• No space constraints or color figure charges
• Immediate publication on acceptance
• Inclusion in PubMed, CAS, Scopus and Google Scholar
• Research which is freely available for redistribution
Submit your manuscript at www.biomedcentral.com/submit
Lan and Vucetic BMC Proceedings 2013, 7(Suppl 7):S5http://www.biomedcentral.com/1753-6561/7/S7/S5
Page 10 of 10