MULTI-CHANNEL MANAGEMENT IN PES: FROM BLENDING ...
50
Employment, Social Affairs and Inclusion DECEMBER 2017 ANALYTICAL PAPER MULTI-CHANNEL MANAGEMENT IN PES: FROM BLENDING TO OMNI-CHANNELLING
-
Upload
khangminh22 -
Category
Documents
-
view
0 -
download
0
Transcript of MULTI-CHANNEL MANAGEMENT IN PES: FROM BLENDING ...

Employment,Social Affairsand Inclusion
DECEMBER 2017
ANALYTICAL PAPER
MULTI-CHANNEL MANAGEMENT IN PES: FROM BLENDING TO OMNI-CHANNELLING
Europe Direct is a service to help you find answers to your questions about the European Union.
Freephone number (*):
00 800 6 7 8 9 10 11
(*) The information given is free, as are most calls (though some operators, phone boxes or hotels may charge you).
More information on the European Union is available on the internet (http://europa.eu).
Luxembourg: Publications Office of the European Union, 2017
ISBN 978-92-79-76850-7
doi:10.2767/73549
© European Union, 2017
Reproduction is authorised provided the source is acknowledged.
Cover picture: © European Union
The European Network of Public Employment Services was created following a Decision of the European Parliament and Council in June 2014 (DECISION No 573/2014/EU). Its objective is to reinforce PES capacity, effectiveness and efficiency. This activity has been developed within the work programme of the European PES Network. For further information: http://ec.europa.eu/social/PESNetwork.
This activity has received financial support from the European Union Programme for Employment and Social Innovation ‘EaSI’ (2014-2020). For further information please consult: http://ec.europa.eu/social/easi
LEGAL NOTICE
This document has been prepared for the European Commission however it reflects the views only of the authors, and the Commission cannot be held responsible for any use which may be made of the information contained therein.

Written by Willem Pieterson, Center for eGovernment Studies
ANALYTICAL PAPER
MULTI-CHANNEL MANAGEMENT IN PES: FROM BLENDING TO OMNI-CHANNELLING
DECEMBER 2017


5
5
CONTENTSEXECUTIVE SUMMARY 6
The changing world 6Changes in channel behaviour: more online, but other channels persist 6Evolution of MCM towards omni-channel management 7Integration at different levels remains a key challenge 8New channels and innovation: the robots are coming 8
INTRODUCTION 91. The changing world: digitalisation is an opportunity and a challenge 92. The changes in customers’ channel behaviour 93. The evolution of PES’ multi-channel strategies 94. The challenges PES face when implementing their channel strategies 105. New developments and innovations in the space 10
1. THE CHANGING WORLD: DIGITALISATION IS AN OPPORTUNITY AND A CHALLENGE 111.1 Technological changes 111.2 Societal changes 121.3 Changes in the labour market 131.4 Conclusions regarding the changing world of work 15
2. CHANGES IN CHANNEL BEHAVIOUR: MORE ONLINE BUT OTHER CHANNELS PERSIST 162.1 Use of the internet for public services 162.2 Channel behaviour 162.3 Conclusions regarding channel behaviour 20
3. EVOLUTION OF MCM TOWARDS OMNI-CHANNEL MANAGEMENT 213.1 MCM strategies 213.2 Omni-channel strategies 243.3 Implementing channel strategies 263.4 Future plans and developments 283.5 Conclusions regarding MCM strategies 29
4. INTEGRATION AT DIFFERENT LEVELS REMAINS KEY CHALLENGE 304.1 The problem of ‘integration’ 30
4.1.1 Organisational integration 304.1.2 Process integration 314.1.3 Data integration 324.1.4 IT integration 32
4.2 Collecting the right data 334.3 Other challenges and obstacles 354.4 Conclusions regarding challenges and obstacles 35
5. NEW CHANNELS AND INNOVATION: THE ROBOTS ARE COMING 365.1 New generations of channels 36
5.1.1 Channel elimination 385.2 Data, intelligence and automation 395.3 Other innovations and experimentation 395.4 Conclusions regarding new channels and innovations 40
REFERENCES 41
APPENDICES 44Appendix 1: Household internet access EU-28 (+ NO) 44Appendix 2: Internet use in the EU 45Appendix 3: Channel choice studies in different countries 46Appendix 4: UK Digital Service Standard 47Appendix 5: Participating PES 48

6
6
This executive summary contains the key find-ings of the analyses. These findings are based on an extensive review of the literature, as well as the input kindly provided by 22 Public Employ-ment Services (PES) across Europe. This sum-mary focuses on the main topics discussed in the analyses. These topics form the basis of the different chapters of the report.
The changing world
PES operate in an ever-changing environment. This provides the context in which we analyse develop-ments in multi-channel management. We discuss a number of important developments. The first topic concerns changes in the world that are impacting PES’ service delivery. One major change is the increasing adoption of technology across the EU. The number of EU citizens going online and inter-acting with their governments and PES is still grow-ing. However, differences between Member States remain high.
While in advanced countries most people are online, this has not led to a closing of the so-called digital divide. The digital divide is shifting from a gap between ‘haves’ and ‘have nots’ of computer owners and internet access, to gaps between peo-ple with high and low digital skill levels. This divide shows more and more parallels with ‘classic’ socio-economic divides. Variables like ‘education’ are now stronger predictors of digital skills than age or gender. The implication is twofold:
1. Even in countries where most people have access to the internet, there remains a group of people that are disconnected and thus lack both access to and sufficient skills to use the internet (and related technologies).
2. Parts of the population may have access to the internet and use it on a daily basis, but lack the skills needed to move beyond the execution of fairly simple tasks.
Technological and societal changes have a strong reciprocal relationship. Globalisation, for example is both caused by technological innovation and driving it. Globalisation leads to an increase of mobility, causing an increase in labour migration and stimulating more international services.
This will probably lead to increased pressures on PES to internationalise their services and deploy channels across member states.
Labour markets themselves are also in flux. Although the economic tide is better than during previous reviews in 2011 and 2014, there are challenges ahead such as the increase in roboti-sation and automation that will severely impact employment in the coming decades. Furthermore, more people work part-time and switch jobs more often (in part due to an increase in fixed tempo-rary employment). So while automation may relieve pressure on PES, changes in the labour market could negate this. The implication is that PES, more than ever, need to be aware of the world around them and more closely monitor the changes in the labour markets in order to antici-pate those changes.
Changes in channel behaviour: more online, but other channels persistCitizens’ channel behaviours are in constant flux. Since the availability of internet connections in the mid-1990s, citizens have started to adopt new tech-nologies and use new ways to communicate among each other and with their governments. In more advanced countries, online channels are becoming the ‘backbone’ of governmental service delivery. Not only are online channels the most used channels, but they are also the preferred channels for both citizens and governments to deliver information. In other words, in more advanced countries citizens actually prefer using online services.
PES are also witnessing these developments as both jobseekers and employers increasingly use online services. However, online service usage var-ies from PES to PES and it appears there is ample room for growth across the EU.
Despite the overall increase in the usage of the electronic channels, we see the disparity between different countries is large. Especially in southern and south-eastern European countries, jobseekers are more inclined to use face-to-face and other more traditional channels. This is because the PES offer fewer services online, fewer citizens have access to the internet, and those who have access
EXECUTIVE SUMMARY

7
7
are less inclined to use (governmental) online services. Especially for those countries, the tradi-tional channels (mostly face-to-face contact) remain an important primary service channel.
The traditional channels remain important in coun-tries with high levels of internet adoption and usage, but the role of these channels is fundamen-tally different. While the internet is evolving into the backbone of service delivery in more advanced countries, many traditional channels are not dis-appearing. Rather, different channels are finding very specific functions, often in conjunction with the online channels. For example, the telephone becomes more and more a support channel for online services, and the richness of face-to-face interaction remains valuable to solve highly com-plex and ambiguous situations, for training pur-poses, and to build relationships.
Specific types of people still require ‘traditional’ forms of communication. Even in advanced coun-tries where most people are online, many people lack the digital skills needed to utilise many even relatively simple government services. Several PES are trying to identify these people in their profiling processes to guide them to the most appropriate channels as early as possible in the service deliv-ery process.
Lastly, the use and deployment of newer channels (e.g. social media, mobile) is on the rise, but still relatively marginal. Several PES are developing or exploring mobile apps, but their use is not yet widespread, and we lack empirical data support-ing or disproving their success.
Evolution of MCM towards omni-channel managementCompared to 2011 and 2014, when we conducted reviews of multi-channel strategies, PES have made good progress in a) their strategic plans regarding service delivery and b) their concrete channel strategies. These strategies are evolving. The focus has shifted from offering channels in parallel or trying to replace more traditional chan-nels with online channels, to highly sophisticated strategies in which channels interact and are so well integrated they provide seamless experiences for customers as they move along their journey.
The latest of these strategies is the concept of ‘omni-channel management,’ which is gaining popularity in the private sector and increasingly in
the public sector, as well as a small number of PES. This omni-channel strategy refers to a holis-tic view of channels, where channels are seen as an entity that need to be managed and organised as one unit. The discrete difference between chan-nels disappears and the interaction takes place via touch-points. These touch-points are moments of customer interaction with a non-predefined set of communication cues.
Main reasons for the introduction of this omni-channel perspective are:
● Customers are demanding a seamless channel experience and switch between channels, thus forcing organisations to unify their channel back-offices and achieve high levels of IT, data, process, and organisational integration. This implies that customers can choose whichever channel they prefer to obtain services, but are subsequently guided to different channels based on their characteristics and the nature of the task.
● The need to track and serve customers throughout the customer journey requires smooth transfers between channels. This helps reduce mistakes and ease administrative burdens (for example, to prevent the customer from entering the same information multiple times).
● The increased fragmentation of customer groups and the increase in channels forces organisations to be extremely flexible in how people are routed and guided through their process. This is especially important for customers who are less digitally literate and need to be steered toward the appropriate channels to serve them well.
Several PES are moving in the direction of omni-channelling (sometimes implicit). However, the majority of PES are not moving in this direction yet. Most PES have some kind of channel strategy which in most cases is a mix of existing strategies. Some PES lack any form of strategy and/or work-ing on it. As PES differ strongly in the maturity of their systems, the channel behaviours of their clients, and their organisational goals, these dif-ferences are understandable. However, given the general technological and societal developments (as outlined in chapter one), we encourage PES to keep defining, assessing, evaluating, and updating their channel strategies. This is to serve the chang-ing needs of their clients and to remain in line with societal changes.

8
8
Integration at different levels remains a key challengePES experience various challenges while improv-ing service delivery and their multi-channel strat-egies. Many types of obstacles are mentioned in the literature and the survey we conducted among PES. Similar to the peer reviews in 2011 & 2014, we see staff training and the protection of privacy and security as important obstacles. However, as PES evolve and start blending and integrating their service channel strategies, as well as striving toward seamless customer experiences, a new class of obstacle emerges. This concerns the prob-lems that PES encounter when trying to integrate vital elements needed to achieve channel success. More specifically, this pertains to the need to inte-grate a) service delivery processes, b) the data infrastructures feeding into these processes and the various service channels, c) the IT systems behind these service channels, and d) the organi-sational units responsible for different channels, processes and systems.
The more advanced the multi-channel strategy is, the more coordination and integration is needed. For customer journeys to be seamless, the chan-nels and underlying processes need to be highly unified. This requires more effort from the organi-sation, so the impact of the obstacles increases. Of specific importance is the role of organisational fragmentation or ‘siloing’. Organisational silos can hinder fruitful collaboration between different parts of the organisation, and data fragmentation can hamper a seamless customer journey. PES working on the multi-channel strategies are wise to start planning these integrations early on and include activities pertaining to integration and coordination into their strategic plans.
New channels and innovation: the robots are comingTechnology is playing an important role within PES and technological developments are moving faster and faster. As a consequence, PES are not only slowly evolving their overall channel strategies, but are also innovating in related areas. The most important area of innovation is the increase in dig-italisation and automation of processes and ser-vices. Many PES are working on the integration of their processes and systems (see above) and are looking into ways to automate these processes more and more.
As part of this automation, various PES are explor-ing the introduction of social robots as service chan-nels. These come in various forms and could potentially supplement or replace existing channels. For example, several PES are looking into Chat or Conversational Bots as a means to improve ser-vice delivery, as well as improve the efficiency of the organisation. However, the exact role of these robots remains unclear and needs to be understood further before any large scale deployments seem justified. As most PES are still in their early stages regarding deployment or experimentation with these social robots, there are no real-life experi-ences from PES yet.
Related to automation are PES initiatives in the areas of artificial intelligence and big data. For example, data driven artificial intelligence is seen as a way to improve various services and pro-cesses such as matching and profiling.
Lastly, in part to explore these innovations and anticipate future technological developments, PES have started to experiment more with new tech-nologies and applications. Several PES have inno-vation labs or other environments where they can learn from technologies in a controlled way. Such experiments are a good way to gain valuable infor-mation in controlled environments. We highly rec-ommend this practice and encourage more PES to start conducting evidence-based experiments and share their learnings.

9
9
Improving service delivery has been high on the agenda of Public Employment Services (PES) for the past decades. There are very good reasons for this level of attention. Technological and societal devel-opments put constant pressures on PES to keep changing and innovating. This especially applies to the service channels that mediate the interactions between PES and their customers. The number of channels has increased, customers have developed complicated channel behaviours, and channels are penetrating organisations more deeply. On top of that, channels are blending and interacting with each other, requiring more and more coordination between organisational units. As such, a well-func-tioning multi-channel strategy is a vital instrument in realising effective, efficient service delivery with the appropriate levels of customer satisfaction.
EU peer reviews in 2011 and 2014 explored the multi-channel strategies of PES. In 2011 the emphasis was on the creation of multi-channel strategies and in 2014 the focus was on blending and integrating channels. Now, in 2017, another review is taking place, albeit in a different form. There is no in-person workshop and thus no way for PES to share their ideas and discuss their plans. However, we do compare and review PES multi-channel strategies across the EU. We embed their practices in technological and societal develop-ments and contrast their plans with practices from other public and private organisations, as well as academic studies in the field. As such, this paper is part comparative review, part analytical paper.
The basis for the comparison is a qualitative sur-vey sent out to the PES in the EU-28 (+NO & IS), to which 23 PES responded (compared to 14 in 2014 and 12 in 2011). However, not every PES completed the entire survey. The survey included questions about current strategies, developments since 2014, plans for the future, and obstacles encountered along the way. The responses form the basis of the comparison in this paper. An over-view of the participating countries can be found in Appendix 5.
The paper is structured as follows. Firstly:
1. The changing world: digitalisation is an opportunity and a challenge
The changing nature of digitalisation, and how this is reflected in technology, society and the labour market, is influencing how PES operate and develop strategies. We discuss the main changes over the past few years to provide context to the current approaches, as well as setting out the anticipated future changes.
2. The changes in customers’ channel behaviour
In tandem with the growth of online services, cus-tomers’ channel behaviours evolve. In general peo-ple continue to adopt the online channels, but this does not imply the other channels go away. Tradi-tional channels remain important for those without internet access or digital skills. Furthermore, even the digitally savvy often choose other channels, and sometimes even prefer traditional channels. More often, they prefer digital channels and choose dif-ferent channels for specific purposes in specific sit-uations. This, obviously, has implications for channel strategies.
3. The evolution of PES’ multi-channel strategies
Channel strategies are evolving too, as PES try to balance their customers’ needs with their own goals of providing effective and efficient services. PES rec-ognise the growing importance of the online chan-nels and are still focusing heavily on digitalisation of their services and processes. At the same time, they acknowledge the relevance of other channels and are developing strategies that intelligently incorpo-rate all channels. The latest of those is the explora-tion of the omni-channel concept where all channels are designed and managed holistically.
INTRODUCTION

10
10
4. The challenges PES face when implementing their channel strategies
Implementing channel strategies remains chal-lenging, but we see the challenges shift over time. As channels penetrate deeper in the organisations’ back-offices and as they integrate and blend more, coordination and integration become more impor-tant. PES see this integration as a key challenge, for example in overcoming organisational siloing. The increase in coordination also requires more detailed data about customers and processes, data that is often still lacking.
5. New developments and innovations in the space
Lastly, we discuss new developments in the space. PES are continuing the digitalisation of their ser-vices and processes. A logical next step is the full automation of back-office processes and the intro-duction of ‘social robots’ in the front-office. Sev-eral PES have plans to explore the use of these robots. Furthermore, the role of experimentation is increasing, where PES in controlled environments can learn about their customers, services, pro-cesses, and their own organisation.

11
11
One of the main factors influencing PES channel strategies and general operating strategies con-sists of the external world in which the PES are operating. It is important to, briefly, discuss the main changes over the past few years, as well as the anticipated future changes. We do this to pro-vide relevant context to discuss PES’ channel strategies, as well as to properly compare PES’ current strategies and plans to those of the 2011 and 2014 reviews of multi-channel strategies.
In this chapter, we discuss three of the main changes impacting PES: 1) technological changes, 2) societal changes, and 3) changes in the labour market. While we discuss them separately, it is important to note that these changes are inter-dependent and mutually influence each other.
1.1 Technological changes
The first important change is the changing role in our society of information technologies. A key part of this is the access to and use of the internet. While near-ing saturation levels, the percentage of households in the EU with access to the internet keeps growing.
1. THE CHANGING WORLD: DIGITALISATION IS AN OPPORTUNITY AND A CHALLENGE
As we can see in Figure 1, the percentage of house-holds within the EU-28 is still increasing steadily (and almost linearly year over year). Between 2014 and 2016, the percentage of households with access to the internet rose from 81 % to 85 %. This suggests that access to the internet is reaching saturation levels and provides a positive promise with regards to access to electronic channels. Though the overall EU average is increasing, the disparity between Member States remains large. The levels of access to the internet vary from 64 % (Bulgaria) to 97 % (Luxembourg, Netherlands, Nor-way), leaving more room for growth in various countries. See Appendix 1 for an overview of the levels of internet access of the EU-28 (plus NO).
Similarly, adoption of mobile (smartphone) devices is still increasing. The leader in the EU, Sweden, had a 72.2 % smartphone adoption rate in April 2017. Romania was last with 56 % 1. These num-bers are expected to grow in the next few years, although saturation is near for the advanced coun-tries (mostly western European and Scandinavian).
1 See https://en.wikipedia.org/wiki/List_of_countries_by_smartphone_penetration
Figure 1: Household internet access (EU-28)
2007 2008 2009 2010 2011
2012 2013 2014 2015 2016
60 % 66 % 70 % 73 %
85 %83 %81 %79 %76 %
55 %
Figure 1. Internet use: Percentage of households with internet access, average of all EU (28) member states. Source: Eurostat (2017).

12
12
As a result, a majority of all customers will be able to interact online with the PES, and nearly every-body will be able to do so in the near future.
This does not imply that everyone with access to the internet is able to use it to their advantage. Research on the so-called digital divide (see Van Dijk, 2005) suggests that the digital divide is slowly moving from a divide between people who do or do not have access to the internet, to a divide in the type of activities people (are able to) do online. A recent survey in the Netherlands (Van Deursen & Van Dijk, 2014) found that lower edu-cated people spend more time online than higher educated people. This is largely because the types of activities the lower educated do online, namely social interaction and gaming, tend to be very time consuming. The higher educated tend to spend less time online, but when they are online they spend more time finding information, looking for news, or doing (commercial) transactions. This correlates heavily with the level of digital skills of people. These digital skills break down into 5 types of skills (see Van Deursen & Helsper, & Eynon, 2016):
● Operational Skills (being able to operate a computer).
● Mobile Skills (being able to use a mobile device).
● Information Navigation Skills (being able to find and interpret relevant information).
● Social Skills (sharing information and curating friendships).
● Creative Skills (creating online content).
These digital skills increasingly become a function of people’s education, rather than of age or gender. This, in turn, leads to the digital divide becoming more and more a reflection of traditional media use patterns in society, with a sharp divide between peo-ple who ‘consume’ media and people who use media for their own strategic benefit. Or, as Zillien and Hargittai (2009, p. 287) put it: ‘those already in more privileged positions are reaping the benefits of their time spent online more than users from lower socio-economic backgrounds.’
Several PES acknowledge the existence of the dig-ital divide, social exclusion, and the need to address people with different levels of digital skills (e.g. DE, PT, SE). The Swedish PES specifically mentions that targeting and improving the digital skill levels of jobseekers will be crucial in the future. We recom-mend that PES focus more and more on the digi-tal divide as a socio-economic phenomenon and, when addressing digital skills, focus on skills
beyond the operational skills (i.e. using computers). Rather, they should focus on Information Naviga-tion Skills and Social Skills. Research shows that those types of skills correlate heavily with the pro-pensity of people to use the internet to their advan-tage. For example, the ability to find the relevant information can help people in their dealings with organisations and to solve problems.
However, despite working on digital skills of jobseek-ers as an Active Labour Market Policy (ALMP), we should not forget nor neglect the role of the PES to provide services to people with lower access and skill levels. This is worded appropriately by the Polish PES: ‘It is necessary to continuously develop all available channels of communication with the customers. It is important, however, not to forget about customers who, for reasons independent of them, have no access to the internet or adequate technical equip-ment. It should also be borne in mind that certain forms of assistance are more effective if they are provided face-to-face [rather] than using IT.’
A second type of change related to information technologies is that of the increased automation and/or digitalisation of work and work processes. These changes will very likely disrupt the labour market in the coming decades. Because of the impact on labour markets, we will discuss these changes in section 1.3.
1.2 Societal changes
Society itself is also changing. Other documents describe these changes in the context of PES in more detail (see e.g. Pieterson, 2016), but some of the changes are worth mentioning in the context of service delivery. These changes are globalisa-tion and the increase in labour mobility (and labour migration) 2. These two appear to be strongly inter-twined. Globalisation makes it easier for people to migrate, and the more people migrate, the more the world will globalise. For example, the improve-ments in communication technologies make it eas-ier for people to maintain family relationships while living far apart, thus making it easier to migrate. The more people migrate, the higher the demand for global communication technologies.
In 2013, about 5 % of working-age EU citizens lived in a different EU country than where they were born.
2 For an in depth analysis, see http://www.un.org/en/development/desa/policy/cdp/cdp_background_papers/bp2015_26.pdf

13
13
Although a fairly low percentage (for example com-pared to state-to-state mobility in the US), labour mobility within the EU has been increasing over the past two decades (Arpaia et al. 2016). The same applies to people from outside the EU moving to the EU to work and live here. Although speculative at this point, it is possible that developments like the recent abolition of mobile roaming charges in the EU could have an effect on labour mobility (e.g. living in one country and working in another).
Various PES recognise these changes and their impact on their service delivery. The Portuguese PES, for example, recognises that ‘globalisation will continue to have an impact in the labour market and society in general as it will result in countries increasing their capacity to create new opportunities within work but also on technological developments reducing the demand on unskilled workers’. We can foresee two key changes for multi-channel service delivery in the coming years resulting from globalization and labour mobility, primarily within the EU. We also anticipate these changes and conclude/recommend that:
1. Internationalisation and globalisation of the labour market will probably continue to increase. This will likely put more pressure on PES in terms of international (multi-lin-gual) oriented service delivery.
2. Further increases in labour mobility (and a more EU-based space of supply and demand) will likely pressurise PES towards more international cooperation (e.g. vacancy sharing) and subsequently more internation-ally oriented service strategies.
1.3 Changes in the labour market
Several PES have mentioned two changes in the labour market that are impacting their current or planned multi-channel strategies. The first of these is very simple (and relevant for this report), namely the changing economic situation in the EU and the world. The previous two reviews (in 2011 & 2014) on multi-channelling both took place during or at the end of the last economic crisis and that impacted PES in two ways:
1. In general a higher workload because of the higher unemployment.
2. More austerity, due to lower budgets.
In sum, PES had to do more with less. In general this led to PES focusing more heavily on their online, more cost-efficient, service channels. One notable example of this was the online strategy followed by the NL PES (see the 2014 report). While the NL PES followed a replacement channel strategy (see chap-ter 3 for an overview of channel strategies) for sev-eral years due to a 50 % budget reduction, the tide there has changed and the organizations’ leader-ship has recognised the need for personal contact in service delivery processes 3.
Now, the economic situation is changing, with an expected 1.6 % economic growth in 2017 and in
3 See https://www.volkskrant.nl/economie/topman-uwvweer-persoonlijk-contact-met-werkloze-nodig~a4135960/ (in Dutch)
Figure 2: Unemployment levels (EU-28)
Figure 2. Unemployment levels EU-28, compared to US, Japan & EA19. Source: Eurostat (2017).
2011
17 %
2013
17 %
2015
17 %
2010
15 %
2009
2014 2015 2016
15 %
2008
2013
13 %
2007
2012
12 %
0 %
2 %
4 %
6 %
8 %
10 %
12 %
2000
2001
2002
2003
2004
2005
2006
2007
2008
2009
2010
2011
2012
2013
2014
2015
2016
2017
● European Union (28 countries)● Euro area (19 countries)● United States● Japan
0 %
2 %
4 %
6 %
8 %
10 %
12 %
2000
2001
2002
2003
2004
2005
2006
2007
2008
2009
2010
2011
2012
2013
2014
2015
2016
2017
● European Union (28 countries)● Euro area (19 countries)● United States● Japan

14
14
a consensus that some change is about to happen, and governments are starting to plan for these changes. For PES and their multi-channel strate-gies, we can foresee two important changes:
1. It is likely that several job categories will cease to exist and new ones will be created. This will likely increase the need for re-training of jobseekers into other job categories. Further-more, it is possible that unemployment levels will increase and that especially long term unemployment will increase for those jobseek-ers that are hard to re-train. As such, the importance of the PES as a counsellor, trainer, and provider of career guidance could increase.
2. Automation also creates opportunities for PES’ processes and service strategies. Not only does automation create new service channels (see Chapter 4), it is also likely that new data-driven technologies will impact processes, such as fully automated and more intelligent matching. As such, PES should start exploring the implications of automation on themselves as an employer as well as their own processes.
This is noted by several PES (AT, CY, DE, FI, PT, SI) and worded fittingly by the Cypriot PES: ‘Technolog-ical changes drive labour market needs towards a more digital economy. In order to be aligned with present and future trends, a contemporary organi-sation should constantly strive to be technologically innovative and adjust to the trend of the present and future digital ages. Our PES understand that digital-isation can be a way to facilitate the provision of our services when it is used in a way that will enhance its other service channels and preserve its personalised/individualised character’.
A last, somewhat related, change in the labour market is the transformation of working life in gen-eral. First of all, more people across the EU work part-time. Between 2007 and 2015, the percent-age of Europeans working part-time increased from 16.8 % to 18.9 % 9. However, the shares per country vary widely (see Figure 3).
People change jobs more frequently (in part due to more contracts being temporary contracts), and more people work as freelancers. In addition, robotisation and the accompanying discussions around it – basic income, for example – are topics
9 See http://ec.europa.eu/social/main.jsp?langId=en&catId=1196&newsId=2535&furtherNews=yes
its fifth consecutive year of recovery 4. Most EU countries, as a result, see their unemployment lev-els going down. The EU-28 unemployment level currently stands at around 7.7 % (q3 2017), down from 11 % in 2013 (see Figure 2).
Several PES recognise the changing economic tide and how this allows them to reposition their focus. For example, as said by the Slovenian PES: ‘due to positive economic trends we are facing with lower-ing of unemployment rate and within this context rising long-term unemployment. Since we are cur-rently planning to undergo big changes on multi-channelling, we have to take the challenges that go with the ever-changing labour market into account’.
The biggest change is more of an anticipated change for the future. This concerns the increase in automation and robotisation in the workplace. Recently, the World Economic Forum 5 predicted that automation will result in the loss of over 5 million jobs across 15 developed nations in 2020. Another, slightly less conservative estimate suggests that advanced algorithms could replace approximately 140 million full-time knowledge workers worldwide, and computers will increasingly replace human labour in a wide range of cognitive tasks (MGi, 2013). The International Labour Organization men-tions a similar number of around 140 million 6, but only in five Asian countries (Cambodia, Indonesia, the Philippines, Thailand, Vietnam). A more conserv-ative estimate from Research Agency Forrester 7 in 2016 predicted that AI will replace 16 % of all work-ers in the US by 2025. New types of jobs (e.g. in automation) would create 9 % more new jobs, but the end result would be a loss of 7 % of all jobs. Several countries have developed (or are in the pro-cess of doing so) plans to deal with the impact of automation on the workforce. Often these use the moniker ‘Industry 4.0’ after Germany’s leading ini-tiative ‘Industrie 4.0’ in this space 8.
So, while predictions on the role impact of auto-mation will play vary widely, there seems to be
4 https://ec.europa.eu/info/business-economy-euro/economic-performance-and-forecasts/economic-forecasts_en
5 See http://www3.weforum.org/docs/WEF_FOJ_Executive_Summary_Jobs.pdf
6 See http://www.ilo.org/public/english/dialogue/actemp/downloads/publications/2016/asean_in_transf_2016_r1_techn.pdf
7 See https://www.forrester.com/Robots+AI+Will+Replace+7+Of+US+Jobs+By+2025/-/E-PRE9246
8 See https://ec.europa.eu/digital-single-market/en/blog/implementation-industry-40-strategy-german-plattform-industrie-40

15
15
1. Even in those countries where most people have access to the internet, there remains a group of people that are disconnected and thus lack both access to and sufficient skills to use the internet and related technologies.
2. Parts of the population may have access to the internet and use the internet on a daily basis, but lack the skills needed to move beyond the execution of fairly simple tasks.
In a strongly reciprocal relationship with the tech-nological changes come changes in societies. Glo-balisation, for example, is both caused by and driving technological innovation. Globalisation leads to an increase of mobility, causing an increase in labour migration and stimulating more international services. This will probably lead to increased pres-sures on PES to internationalise their services and deploy channels across member states.
Labour markets themselves are also in flux. Although the economic tide is better than during previous reviews in 2011 and 2014, there are chal-lenges ahead such as the increase in robotisation and automation that will severely impact employ-ment in the coming decades. Furthermore, more people work part-time and switch jobs more often (in part due to an increase in fixed temporary employment). So while automation may relieve pressure on PES, changes in the labour market could negate this. The implication is that PES, more than ever, need to be aware of the world around them and more closely monitor the changes in the labour markets in order to anticipate those changes.
that belong on the agenda of PES and warrant attention in the coming years. As such, we recom-mend that PES continuously analyse these changes in the labour market and develop plans to tackle these changes (if that falls within their mandate) by developing re-training programs targeted at jobseekers in job categories that will cease to exist.
1.4 Conclusions regarding the changing world of work
The ever-changing environment in which PES oper-ate provides the context in which we analyse developments in multi-channel management. We discuss a number of important developments. The first topic that emerges from the analysis con-cerns the changes in the world that are impacting PES’ service delivery. The first of these changes is the increasing adoption of technology across the EU. The number of EU citizens going online and interacting with their governments and PES is still growing throughout the EU. However, differences between Member States remain high.
While in advanced countries most people are online, this has not led to a closing of the so-called digital divide. The digital divide is shifting from a gap between ‘haves’ and ‘have nots’ of comput-ers and internet access, to gaps between people with high and low digital skill levels. This divide shows more and more parallels with ‘classic’ socio-economic divides. Variables like ‘education’ are now stronger predictors of digital skills than age or gender. The implication is twofold:
Figure 3: Share of part-time work in the EU-28
2011
17 %
2013
17 %
2015
17 %
2010
15 %
2009
2014 2015 2016
15 %
2008
2013
13 %
2007
2012
12 %
0 %
10 %
20 %
30 %
40 %
50 %
60 %
70 %
80 %
100 %
Men● 2007● 2015
Women● 2007● 2015
EU28 BE BU CZ D
K DE EE IR GR ES FR HR IT CY LV LT LU HU
MT
NL AT PL PT RO SL SK FI SE UK
Uni
on e
urop
éenn
e (2
8 pa
ys)
Belg
ique
Bulg
arie
Répu
bliq
ue tc
hèqu
e
Dan
emar
k
Alle
mag
ne (j
usqu

9;en
199
0, a
ncie
n te
rrito
ire d
e la
RFA
)
Esto
nie
Irlan
de
Grè
ce
Espa
gne
Fran
ce
Croa
tie
Italie
Chyp
re
Lett
onie
Litu
anie
Luxe
mbo
urg
Hon
grie
Mal
te
Pays
-Bas
Autr
iche
Polo
gne
Port
ugal
Roum
anie
Slov
énie
Slov
aqui
e
Finl
ande
Suèd
e
Roya
ume-
Uni
Figure 3. Share of part-time work as percentage of total employment: Eurostat (2015).

16
16
In this second chapter we focus on the broader developments around citizens’ channel behaviour.
We first focus on the general use of the inter-net to use public services across the EU. Second, we discuss recent developments in channel choice research from both the private and pub-lic sector. We end the chapter with some conclu-sions regarding citizens’ channel behaviours.
2.1 Use of the internet for public services
In the previous chapter we saw that the percentage of Europeans with access to the internet is still increasing and is nearing saturation levels in more advanced countries. However, this increase in access does not immediately translate into an increase in the number of Europeans going online to find infor-mation from public authorities. The percentage of Europeans doing so has been remarkably stable over the past five years (see Figure 4).
According to Eurostat (2017) data, other types of online interactions with governments also haven’t evolved strongly in the past years. The percentage of EU citizens submitting forms online to public authorities has only increased from 28 % in 2012 to 33 % in 2014, to 34 % in 2016 (see Appendix 2). While these numbers seem fairly low, we must also acknowledge here that the differences between
the more advanced countries and those lagging behind are large. In Estonia (the EU leader in 2016), around 80 % of all citizens have submitted online forms to government, whereas that number was not even 10 % for citizens from Romania. So, as with the general internet access, channel use var-ies quite strongly between different countries, and that should be kept in mind as we explore channel behaviour in more detail in the next paragraph. In general, the finding that the increase in use of dig-ital e-government and PES services is lagging com-pared to the increase in internet access suggests there is substantial room for growth in the use of online services by PES clients.
2.2 Channel behaviour
Most studies on channel behaviour take place in the more digitally advanced countries. Most of the studies have been conducted over the past years in Western European countries, Canada, and Aus-tralia. However, as we will see below, some work has been done in countries such as Spain and Italy. Since the majority of the work has been done in these advanced countries, the data regarding channel behaviours in this section is not entirely relevant for the situation of every PES. Still, it does give an idea of how channel behaviour evolves over time and what the less advanced countries await as their online infrastructures and citizen behaviours mature.
2. CHANGES IN CHANNEL BEHAVIOUR: MORE ONLINE BUT OTHER CHANNELS PERSIST
Figure 4: Obtaining online government information (EU 28)
Figure 4. Internet use: obtaining information from public authorities web sites (last 12 months), as a percentage of individuals who used internet within the last year, average of all EU (28) member states. Source: Eurostat.
2012 2013 2014 2015 2016
50 %49 %51 %48 %52 %

17
17
Channel behaviours consist of a number of inter-related elements, as Figure 5 shows. The use of the internet, as discussed above, is thus the con-sequence of the initial channel choices made by the citizen who wants or needs to contact the PES.
Several studies have examined channel choice and subsequent channel use and evaluation in the con-text of public-sector service delivery, although there are no recent academic publications available focusing specifically on PES. Most recently, Ebbers and Pieterson (2017) did a study of channel choice and use in the Netherlands. They compare their recent data with data collected in 2008 using the same questions (see Pieterson, 2009; Pieterson & Ebbers, 2008). Their survey data illustrates the shift that has taken place in the Netherlands in the last decade. Citizens changed their channel choices both in terms of most frequently used and preferred channels. They asked citizens to indicate which channel they use most frequently in their contacts with government (most often used channels), and
which channel they prefer to use when contacting government (preferred channel) (see Figure 6). The most frequently used channel is now the website, followed by the telephone and email. In terms of channel preferences, a clear preference for the ‘tra-ditional’ channels has been replaced by a shift towards equal preferences for the telephone, web-site, and email. In this case, the strong push of the Dutch government (including the Dutch PES) towards online services seems to be paying off.
We see similar tendencies indicated by the PES who completed the survey for this review. Most PES see an increase in the use of the online chan-nels, both by jobseekers and employers. However, the degree to which this happens varies, with sev-eral countries seeing a shift towards online chan-nels (e.g. BE-Flanders, NL, SE), and others reporting increases in use (e.g. ES, PT). This seems to align with the Eurostat data on the percentage of EU citizens that use the internet to search and apply for jobs online (see Figure 7).
● In person 3 %● Telephone 30 % ● Website 42 % ● E-mail 20 % ● Written 3 %● Social media 0 % ● Other 1 %
● In person 20 %● Telephone 43 % ● Website 27 % ● E-mail 6 % ● Written 3 % ● Other 1 %
● In person 6 %● Telephone 28 % ● Website 31 % ● E-mail 29 %● Written 3 % ● Social media 2 % ● Other 1 %
● In person 20 %● Telephone 40 % ● Website 25 % ● E-mail 10 % ● Written 3 %● Other 0 %
Most frequently used channel Preferred channel
2008 2017 2008 2017
Figure 6: Most often used and preferred channels for public sector services (NL)
Figure 6. Most frequently used and preferred channels to interact with governments in the Netherlands. Source: Ebbers & Pieterson (2017).
Figure 5: Channel behaviour
Figure 5. Schematic representation of Channel behaviour (adapted from Pieterson, 2009).
● In person 3 %● Telephone 30 % ● Website 42 % ● E-mail 20 % ● Written 3 % ● Social Media 0 % ● Other 1 %
● In person 20 %● Telephone 43 % ● Website 27 % ● E-mail 6 % ● Written 3 % ● Social Media 0 % ● Other 1 %
● In person 6 %● Telephone 40 % ● Website 25 % ● E-mail 10 % ● Written 3 % ● Social Media 2 % ● Other 1 %
● In person 20 %● Telephone 40 % ● Website 25 % ● E-mail 10 % ● Written 3 % ● Social Media 0 % ● Other 0 %
Most frequently used channel Preferred channel
Preferred behaviour
Experiences influence future choice
2008 2017 2008 2017
ChannelEvaluation
ChannelUse
ChannelChoice

18
18
The percentage of Europeans using the internet to find and apply for jobs is increasing, albeit slowly. Furthermore, the numbers vary wildly from coun-try to country. While in Denmark 36 % of citizens had used the internet for job search and applica-tion, only 6 % of all Romanians used the internet for these purposes. An increase in the use of online channels does not imply this applies to all custom-ers. For example, the Dutch PES indicates that ‘most jobseekers do use and appreciate the digital channel. However, this does not apply to all job-seekers. More vulnerable jobseekers are more in favour of face to face services’. These more vul-nerable jobseekers tend to be the jobseekers with lower digital skills (see also previous section).
So, the use of the internet in general is increasing. More people across Europe do more and more things online. This also appears to apply to PES (as indicated by PES in the survey), as well as the broader activity of general job search and applica-tion. But this increase in the use of the internet for varying purposes does not imply that citizens tend to choose the website for all types of services and in all types of situations. The study from the Neth-erlands mentioned above also compared citizens’ channel choices for different types of tasks (sim-ple or complex, see Figure 8) and in different situ-ations (urgent or not urgent, see Appendix 3). These results show that depending on the situa-tion or task, citizens do discriminate between the different types of channels. While citizens have made the shift from telephone to website to com-plete simple tasks, this shift has not occurred for complex tasks. This illustrates how channels find their specific niches in providing specific functions in service delivery.
In a quantitative study in Italy, Lamberti et al. (2014) found similar results: citizens prefer differ-ent channels for different reasons, and different types of citizens have different types of channel preferences. However, an important difference is
Case study: Work Profiler (NL)
The Dutch PES is in a situation where a majority of all jobseekers use the online self-service chan-nels to find and obtain new employment. How-ever, the PES recognises that there are vulnerable jobseekers that lack the capabilities to help them-selves online. The Work Profiler tool is an instru-ment that helps identify those vulnerable people and is an important instrument in steering these jobseekers to the right channels (in this case face-to-face).
The Work Profiler is primarily an instrument that indicates a jobseeker’s probability of work resumption within a year. In addition, it offers a quick diagnosis of obstacles hindering job-seekers’ return to work. The instrument steers jobseekers towards face-to-face or online ser-vices by estimating the jobseekers’ chances of finding work within a year. In addition, the tool offers a diagnosis of the most important obsta-cles for their return to work. This helps deter-mine the type of services needed to increase the successful return to a job.
The Profiler is based on a short survey. The job-seeker completes 20 questions and the Work Pro-filer provides two outcomes based on the answers. The first outcome shows the client’s chance of resuming work within one year. The second out-come provides a quick diagnosis illustrating which of the 11 predictive factors for work resumption need to be positively influenced in order to increase the client’s chances of returning to work.
Read more: Wijnhoven & Havinga (2014).Also see case study on PES Practices database:http://ec.europa.eu/social/main.jsp?catId=1206&langId=en
Figure 7: Individuals using the internet for looking for a job or sending a job application (EU-28)
Figure 7. Individuals using the internet for looking for a job or sending a job application as % of individuals aged 16 to 74.
2011
17 %
2013
17 %
2015
17 %
2010
15 %
2009
15 %
2008
13 %
2007
12 %

19
19
the much lower levels of adoption of online chan-nels by the Italian citizens. In Italy, governmental websites are only the fifth preferred service provi-sion point by Italian citizens, and the top four chan-nels are traditional channels. This suggests that, despite large investments by the Italian Govern-ment in the development and marketing of online channels, this shift is not yet entirely successful (Lamberti et al., 2014). Complicating the issue is that lower levels of adoption of online channels in Italy (in this case) are partially caused by lower levels of trust in government. This is one reason citizens still favour to complete their transactions in person. We see something similar in Spain, where Rey-Moreno and Medina-Molina (2016) studied the use of channels to interact with gov-ernments, as well as the choice of channels for transactional procedures. They found that citizens are not only stable in their channel choices for spe-cific situations, but still prefer the traditional chan-nels over the online channels (see Appendix 3).
Other studies suggest that users tend to prefer e-government services, but mostly when their use is mandated (Madsen & Kræmmergaard, 2016). In their study in Denmark, Madsen and Kræmmer-gaard studied how the introduction of mandatory online services impact the use of the online chan-nel, as well as the backup and secondary telephone channel. Their main findings were that a) the oblig-atory use of the online channels drastically increased adoption of the online channels, and b) the increased use of online channels did not in itself lead to effi-ciency gains, because many customers kept using traditional channels. This was largely due to c) the poor communication around online channels lead-ing to increased pressure on the traditional chan-nels. For example, people start calling when they
run into problems when using the website. In gen-eral, people had three reasons to still call: naviga-tion (i.e. issues arising from not knowing where to be on the website or being unable to find the right information), knowing when the task was completed (i.e. confirmation about the completion and correct-ness of the information or transaction), and attempts to circumvent the mandatory requirement.
Reddick and Anthopoulos (2014) studied public sector channel choice behaviour in Canada. Their study shows that the use of traditional channels has been steadily declining. For example, in-per-son contacts (e.g. traditional office visits) reduced from 64 % in 2005 to 47 % in 2012. While the use of websites increased to 47 % in 2008, it subse-quently declined to 38 % in 2012. Reddick and Anthopoulos argue that the decline in website usage is due to its limited capabilities to solve problems. This study also found that citizens choose different channels for different purposes. For example, in-person contacts were more prev-alent for transactional services (e.g. applications), the telephone was chosen more frequently to solve problems, and websites were most frequently cho-sen to find information. This seems to point to cit-izens using channels more often as complements and for different parts of the same customer jour-ney, and is thus in line with the findings from the other studies mentioned above in the Netherlands, Denmark, Italy and Spain.
This aligns to findings from the private sector. Seck and Philippe (2013) found that there is a change in consumer behaviour towards the combined use of the different channels offered by a single ser-vice provider. These so-called ‘mixed customers’ (Vanheems, 2009) or ‘multi-channel customers’
● In person 2 %● Telephone 28 % ● Website 48 % ● E-mail 19 % ● Other 3 %
● In person 3 %● Telephone 45 % ● Website 31 % ● E-mail 21 % ● Other 1 %
● In person 14 %● Telephone 53 % ● Website 10 % ● E-mail 19 % ● Other 3 %
● In person 27 %● Telephone 51 % ● Website 5 % ● E-mail 12 % ● Other 5 %
Simple Complex
2008 2017 2008 2017
Figure 8: Channel choice for simple and complex tasks (NL)
Figure 8. Channel choices for ‘simple’ and ‘complex’ tasks in the Netherlands in 2008 and 2017. Source: Ebbers & Pieterson (2017).

20
20
(Seck, 2010) use different channels for different purposes, often at the same time, and expect to have a uniform and seamless quality of experience across multiple channels. This has implications when it comes to customer satisfaction. Some studies (see Seck and Philippe (2013) for an over-view) have researched customer satisfaction in a multi-channel environment while including all channels used by customers. Across these studies, it appears that customer satisfaction is impacted by the quality of all channels. Hence, lower quality in one channel will impact customer satisfaction across all channels in use.
But what determines those behaviours? This ques-tion knows no straightforward answer. Ebbers et al. (2016), in a study of channel choice determi-nants, found that situational and emotional fac-tors often play a more important role in choosing channels than a more rational approach of match-ing the task at hand to the available channels. Fac-tors such as habits, the need for closure, and the urgency of the situation tend to be strong drivers of channel choices. Furthermore, while digital skills do play a role in how people in general use the internet, Ebbers, Jansen and Van Deursen (2016) found digital skills do not impact the choice for the online channel (for government services), but do impact channel satisfaction. People with higher levels of skills tend to be more satisfied with online services. Furthermore, while there are certainly correlations pertaining to gender, age, education and channel choices, these are not very strong cor-relations. This seems to suggest that the playing field becomes more ambiguous; it is not a given that a certain cohort or group will solely use one channel for all interactions. This makes it more dif-ficult to develop a segmented channel strategy that specifically targets certain groups through certain channels. This is where tools such as the Dutch PES ‘Work Profiler’ (see above) can help in segmenting the population in very specific groups for specific purposes.
2.3 Conclusions regarding channel behaviour
Citizens’ channel behaviours are in constant flux. Since the availability of internet connections in the mid-1990s, citizens have started to adopt new technologies and use new ways to communicate among each other and with their governments. In more advanced countries, the online channels are becoming the ‘backbone’ of governmental service delivery. Not only are the online channels the most
used channels, but they are also the preferred channels for both citizens and governments to deliver information. In other words, in more advanced countries citizens actually prefer using online services.
PES are also witnessing these developments as both jobseekers and employers increasingly use online services. However, usage of online services varies from PES to PES and it appears across the EU there is ample room for growth.
Despite the overall increase in the usage of the elec-tronic channels, we see a large disparity between different countries. Especially in southern and south-eastern European countries, jobseekers are more inclined to use face-to-face and other more tradi-tional channels. This is because the PES offer fewer services online, fewer citizens have access to the internet, and those who have access are less inclined to use governmental online services. Especially for those countries, the traditional channels (mostly face-to-face contact) remain important as a pri-mary service channel.
Traditional channels remain important in those countries with high levels of internet adoption and usage, but the role of these channels is fundamen-tally different. While the internet is evolving into the backbone of the service delivery in the more advanced countries, many traditional channels are not disappearing. Rather, different channels are finding very specific functions, often in conjunction with the online channels. For example, the tele-phone becomes more and more a support channel for online services, and the richness of face-to-face interaction remains valuable to solve highly complex and ambiguous situations, for training purposes, and to build relationships.
Furthermore, specific types of people still require ‘traditional’ forms of communication. Even in advanced countries where most people are online, many people lack the digital skills needed to uti-lise many government services. Several PES are trying to identify these groups of people in their profiling processes to guide them to the most appropriate channels as early as possible in the service delivery process.
Lastly, the use and deployment of newer channels (e.g. social media, mobile) is on the rise, but still relatively marginal. Several PES are developing or exploring mobile apps, but their use is not yet widespread and we lack empirical data supporting or disproving their success.

21
21
In this chapter we focus on how PES strategies have evolved over time and what their plans for the future are. We contrast these plans and developments with developments from the (broader) public sector and private sector liter-ature. We also compare the developments to the findings of the previous reviews on MCM from 2011 & 2014.
3.1 MCM strategies
The first relevant question when comparing MCM strategies is the degree to which PES have actual channel strategies. In 2011 we concluded that, while most PES did have a strategy, there was a large variety in the MCM strategies. Some organisations already focused heavily on the online channel (e.g. NL), whereas others barely had an online presence (e.g. BG, RO). Most PES saw an important role for face-to-face services. In 2014 we concluded that the field had evolved and that more PES had started adopting ‘multi-channel’ strategies. At that point, we concluded that convergence was taking place and roughly three types of strategies were in use:
1. One primary channel, while others served as support and/or backup. This strategy was followed by a number of PES focusing primarily on online services (e.g. NL) with other channels in supporting roles (notably the phone as support for online channels and face-to-face as fall-back option in case online service delivery failed). This resembles most closely the replacement strategy (see further below), but with added elements from the supplemen-tal strategy.
2. Channels as supplements (supplemental positioning). A larger group followed this strategy, where certain services were deliv-ered through certain channels (e.g. Registra-tion online and counselling in person).
3. All channels open (parallel positioning). The largest group followed this strategy, which centres around the idea that customers can choose any channel, and all services are available via all channels. However, in most cases there were elements of integration, where customers were being steered to other channels (in most cases the online channels).
In general, we saw that PES were focusing on the maturity of their online services and many had plans to keep evolving the digital channels. It appears that this is still ongoing in 2017, as we will see below. What is changing is the degree to which PES have multi-channel strategies (see Figure 9).
In 2017, a majority of the 23 PES that partially com-pleted the survey (52 %) have a formalised strategy that covers all available channels and services. While we did not explicitly ask this question in 2014 and 2011, it does appear that this is a big step forward compared to the previous reviews. Another large group (22 %) has a strategy under development. Smaller groups (each 9 %) have no strategy, a for-malised strategy covering part of the offerings, or a strategy that is not formalised. So, while the good news is that more and more PES have developed more unified strategies, there are still PES that have no strategy, a fragmented strategy, or a more infor-mal strategy. We recommend these PES develop and formalise strategies covering the entire spectrum.
3. EVOLUTION OF MCM TOWARDS OMNI-CHANNEL MANAGEMENT
● Formalised strategy | all channels/services 52 %● Strategy under development 22 % ● Formalised strategy | some channels/services 9 % ● Strategy | not formalised 9 % ● No strategy 9 %
Figure 9. Degree to which PES currently have a channel strategy (N=23).
Figure 9: Existence of a strategy

22
22
When asking PES what kind of strategy they are currently following, we once again base our ques-tions on the typology introduced by Pieterson and Van Dijk (2006). They distinguish four different MCM strategies:
1. Parallel positioning: Channels are positioned next to each other. Citizens are free to choose their channels and services are available through each channel.
2. Replacement positioning: Channels can replace each other. The assumption is that channels can be superior or inferior to each other. Customers would prefer to use the best channel and therefore one channel would replace another (immediately or over time).
3. Supplemental positioning: Channels have supplemental values; each channel has its own characteristics that make it suitable for certain types of services or customer groups. Therefore, governments should offer services via the best suited channels.
4. Integrated positioning: All channels are inte-grated in the entire service delivery process. This means that all services are offered via all channels, but that strengths and weaknesses of channels are considered in their design. Citizens are guided to the ‘best’ channels and channels seamlessly refer to each other.
In the 2014 review we focused heavily on the concept of blending, which we can see as a fifth strategy (although closely related to integrated positioning).
5. Blended positioning: Channels are being mixed, properties of one channel are being integrated into another channel, and channels can be used concurrently. Through this inte-gration, citizens can (virtually) use several channels simultaneously and enjoy a seam-less experience across channels. For example, through co-browsing a citizen deploys two channels that completely blend in the service experience.
Figure 10 shows the key characteristics of these different strategies.
We asked PES to indicate what kind of strategy they are currently pursuing (see Figure 11). The results show some remarkable differences com-pared to 2014. This time, fewer PES explicitly focus on one channel as their primary channel, with very minor roles as support or back-up for the other channels. Another key difference is that more PES are working on more integrated or blended chan-nel approaches. Another large group of PES men-tion that their channel strategy is a mix of various aspects of other strategies. A good example of this is the strategy followed by Belgian PES.
Figure 10: Characteristics of channel strategies
Channel(s)
Services 1 1 2 1 2 1 2 1 2 1 2
1
2
2
4
Channel Classification
Single Channel
Multiple Channel Supplemental Multi-Channel
Cross-Channel
Channel Strategy – Replacement Parallel Supplemental Integrated Blended
Key Characteristic –
New channels make older
channels obsolete
All channels offer all services in
parallel
Certain services offered via certain
channels
Users are guided towards preferred channels during entire customer
journey
Channels increasingly
integrate and/or are used
simultaneously
Available | Unavailable | Replaces | Refers to | Integrates

23
23
Their strategy is based on the principles that:
● Customers have the choice between several channels to obtain the same service.
● There is a preference towards offering and steering customers to online services for those who are self-sufficient in order to free up resources to devote to customers with the most important needs.
● Customer journeys are coherent so that regardless of the channels used, all data is being shared and synchronised.
The Dutch PES strategy is different in angle, but ultimately boils down to the same results. The Dutch strategy is an evolution of the approach fol-lowed in 2011 & 2014. In these years, customers of the Dutch PES had to go online first and could only use other channels after a certain amount of time had passed. The approach now is:
● Digital first for jobseekers that do not receive benefits.
● Digital first for unemployment beneficiaries with a good labour market position.
● Face-to-face for vulnerable jobseekers with a week labour market position.
While this is a different approach than that of Belgian-Flemish PES, both PES have in common that customers are being steered towards the online channels and the ‘offline’ channels are being reserved for customers with special needs.
So, while Figure 11 suggests that there is a wide variety in strategies followed, a closer analysis of these strategies reveals a much more uniform pic-ture (with differences mostly in nuanced focal points). Most PES appear to be mixing elements from different strategies, while increasingly inte-grating channels and back-offices. For a large num-ber of PES (e.g. LV, NL, SI), the strategy has elements of the following:
Case study: Integrating channels for interview preparation (SI)
The Slovenian PES tries to improve service delivery with the goal of improved employabil-ity of jobseekers. The service is targeted at jobseekers with a preference for personal counselling, who have an interview scheduled at a prospective employer. When PES staff recognise the needs of a job searcher, he/she posts this candidate for the mentioned service.
After the jobseeker has been identified during in-person counselling as a relevant candidate, the jobseeker receives a phone call to prepare for the job interview. During the preparation, the counsellor guides the jobseeker with key questions regarding his/her competencies and how to present him/herself in best possible way to the employer.
The results of this integrated service in which different channels are deployed and the job-seeker is steered from one channel to another are positive. The following key outcomes have been identified:
‣ Empowerment of jobseekers prior to the job interview
‣ Support for the counselling process
‣ Higher satisfaction of employers with referred candidates.
● Integrated/Blended 24 %● Channels in parallel 24 % ● Different channels different purposes 24 % ● Mix of different strategies 19 % ● One channel leading, others support 5 % ● Something else 5 %
Figure 11: Nature of the strategy

24
24
1. The online channels are evolving into the back-bone of service delivery. This consists of:
a. The ongoing digitalisation of existing services.
b. Through harder (mandating) or softer (steering/marketing) means slowly pushing customers to start using these online channels.
2. Other channels play an increasingly impor-tant role in conjunction with these channels and are thus increasingly integrated with those online channels. For example:
a. Channels that act as support to the online channels (e.g. the telephone to resolve issues with online services).
b. Channels that serve very specific functions in relation to online channels (e.g. video chat for counselling purposes).
3. Some other channels do keep their role as ‘fully-fledged’ channels for the time being, most notably:
a. As a back-up for those that cannot or refuse to use the online channels.
b. As an entry point for citizens (based on their habits or preferences), after which the PES tries to steer these customers to the online channel. If that does not work, the customer is free to keep using the original channels.
One important implication of such a strategy is that channels increasingly integrate and work in conjunction with each other. This requires a holis-tic approach towards the design and management of channels. Such a holistic approach is called an omni-channel approach. One PES mentioning their ambition to move from a multi-channel (in which channels are still separate entities) to an omni-channel strategy, is the Finnish PES. The Finnish strategy consists of a few simple elements:
● Priority of e-services; ● Role of the telephone is supportive and its motto is ‘don’t call us, we call you’;
● Increasing e-services and telephone services, decreasing face-to-face services.
This approach near perfectly resembles the pat-terns and evolution of citizens’ behaviour in more advanced countries, as discussed in the previous
chapter. And we see this as a clear evolution of channel strategies, reflecting changes in customer behaviour, as well as the evolution of channel char-acteristics. Therefore, it is no surprise that omni-channelling as a channel strategy has been gaining popularity in the private sector in recent years.
3.2 Omni-channel strategies
There are different definitions of ‘omni-channel-ling’. Frost & Sullivan (2015) define omni-chan-nel as ‘seamless and effortless, high-quality customer experiences that occur within and between contact channels. It ensures that data and context from the initial contact carries over to subsequent channels, reducing customer effort, improving the customer interaction, and enabling the business to tailor the customer journey’ (Frost & Sullivan, 2015). Accenture (2015), on the other hand, defines omni-channel as ‘a synchronized operating model in which all of the company’s channels are aligned and present a single face to the customer, along with one consistent way of doing business’. In such an omni-channel approach, the entire brand of the service provider should effectively operate as a single channel that generates high-value customer experiences across all different touch points. Thus, the cus-tomer experience it delivers becomes seamless and is consistent and personalised because of the tight integration of all kinds of channels (e.g. in person, online, and social media) (Accenture, 2015). Verhoef et al. (2015) defines omni-chan-nel management as ‘the synergetic management of the numerous available channels and customer touch-points, in such a way that the customer experience across channels and the performance over channels is optimized’.
The EHI retail institute, lastly, sees the concept as ‘a seamless purchase experience for customers across all channels with fluid transfers and a uni-fied brand experience’. While there are differences between these definitions, they do share a num-ber of points, namely:
● The focus on the seamless customer journey; ● The synchronisation (unification) and alignment between channels (in part needed to create this seamless experience).

25
25
In line with this, but expanding on these ideas, is IBM’s interpretation. IBM (2014) sees authentic omni-channel experiences as comprising of three vital components:
● Seamless integration between all channels; ● Transparent visibility of transactional and behavioural data (e.g. for personalisation);
● A customer-centric operating model.
What is apparent in some of the definitions (see also Accenture’s above) is that the concept of a ‘channel’ is being replaced by the concept of a ‘touchpoint’. Verhoef et al. (2015) see these touch-points as ‘an episode of direct or indirect contact with a brand or firm (incl. retailers)’. These touch-points are moments of interaction. Within these moments of interaction a variety of channels or media can be used. Activities such as co-browsing or getting real-time product information on a smart-phone while shopping and talking to a sales agent are examples of this use of multiple media, or chan-nels within the context of what was traditionally seen as one channel. This also leads to the notion that the concept of the ‘channel’ itself becomes increasingly ambiguous and dividing lines between channels become blurry. For example, if a jobseeker browses the PES website and on this site opens a chat-window to talk to a customer service agent, what channel(s) is the jobseeker using? Is it one channel (just a website, since the chat function is integrated into the code of the website) or is it two channels at the same time (website and chat)?
Such increasing blending of channels is made clear in some studies. For example, Worldpay (2015) found that 80 % of smartphone shoppers use their mobile in-store to help with shopping, and more than 50 % of purchases are now influenced by digi-tal information. Brynjolfsson et al. (2013) found something similar, namely more than 70 % of smartphone users used their device for comparison shopping. Such blending can also have negative consequences for retailers. As mentioned in Bryn-jolfsson et al. (2013), one study found that the amount of exaggeration about snowing conditions by ski resorts has fallen sharply due to smartphone apps that allow customers to check snow conditions in real time, while comparing their data to that pro-vided by the resorts on their smartphones. This approach, where different channels interact (often the tandem between online and offline), has also been recognised by PES. For example, the French PES sees the nature and design of local agencies in conjunction with online services as a challenge. They are conducting a new pilot around blended service
delivery under the label of ‘phygital’ [a portmanteau of ‘physical’ and ‘digital’] services.
So, channel behaviour in retail contexts is becoming more complex, supplemental, and blended, often impacting the relationship between online and offline behaviours. To counter these developments many retailers, like public sector agencies, have developed multi-channel strategies. Initially, these strategies involved the decision as to whether new channels should be added to the existing channel mix. How-ever, with the increase of complexities the scope of multi-channel retailing has been broadened, now considering issues such as the management of cus-tomers across channels and the integration of the retail mix across channels. With the channel palette increasing even more, the retail landscape continues to change, incentivising retailers to move to an omni-channel retailing model. (Verhoef et al., 2015). This led to American retailer Macy’s creating a ‘Head of Omni-Channel’ position (Accenture, 2015).
In our view, the essence of this omni-challenge approach consists of a number of aspects:
● High levels of integration between the available channels to ensure various entry points, but channels refer to each other in order to exploit the characteristics of the available channels.
● High levels of coordination or even integration of underlying data, IT, processes, and organisation to ensure a seamless and coherent customer experience.
● High levels of knowledge about customers behaviour to tailor the experience, further develop (digitalise and automate) services, and inform future channel strategies.
Instead of viewing channels as discrete entities in multiple or multi-channel approaches, the essence of the omni-channel strategy is that there is one channel with multiple touchpoints, delivering a consistent and seamless experience for the cus-tomer. We see an increase in blending of touch-points, as well as customers and organisations using multiple (discrete) touchpoints at the same time. From this point of view, we can add omni-channelling or a more holistic channel strategy as a new type of channel strategy (after replacement, parallel, supplemental, integrated and blended approaches). Figure 12 gives an overview of all channel strategies, combined with our view of the level of integration needed within each strategy.

26
26
While omni-channelling is an approach likely to be adopted by more PES in the future, as PES adopt strategies from the private sector and in part do so under customer pressure, the implementation of omni-channelling will not be easy. Even retailers are still struggling with the implementation of integrated or blended multi-channel approaches. Frost and Sul-livan, in evaluating channel strategies, argue that ‘Today, most companies deliver what we refer to as ‘fractured’ multi-channel experiences. When custom-ers move from one channel to another, their context and history doesn’t move with them. So they have to repeat their effort or problem when they move between channels. This situation results in lower cus-tomer satisfaction, missed opportunities for upsell/cross sell, and eventually customer churn’ (Frost & Sullivan, 2015). It is probably safe to assume the same applies to PES as well. In the next paragraph we will explore in more detail what PES are doing in the implementation of their channel strategies.
3.3 Implementing channel strategies
Several PES give us an idea on how they’re imple-menting their current strategies. In many cases their approaches are similar and the Slovenian PES approach is exemplar for many PES. Their aim is to develop a multi-channel approach, in which face-to-face, online, and telephone services are linked. This suggests the Slovenian PES is striving towards integrated multi-channelling at this point. The main components of their development of multi-channelling are:
● Analysis of user’s needs and the existing situation;
● Preparation of the concept and design for the development of a multi-channel integrated service model;
● Establishing working groups for multi-channelling;
● Development of a multi-channel integrated service model;
● Upgrading of the multi-channel services; ● Staff training for using the tools; ● Maintenance and updating of multi-channel services.
Figure 12: Overview of channel strategies
Channel(s)
Services(or part thereof)
1 1 2 1 2 1 2 1 2 1 2 ∞
1
2
2
4
Channel Classification
Single Channel
Multiple Channel
Multi-ChannelCross-Channel
Omni Channel
Channel Strategy – Replacement Parallel Supplemental Integrated Blended Holistic
Key Characteristic –
New channels make older
channels obsolete
All channels offer all services in
parallel
Certain services offered via certain
channels
Users are guided towards preferred channels during entire customer
journey
Channels increasingly
integrate and/or are used
simultaneously
Channels are fully integrated and
create fully seamless service
processes
Organisational Integration none none none low
(coordination)
low/medium(coordination/ integration)
medium/high(coordination/ integration)
high(integration)
Process Integration none none none low
(coordination)
medium(coordination/ integration)
medium/high(coordination/ integration)
high(integration)
Systems Integration none none none none/low
(coordination)
medium/high(coordination/ integration)
high(coordination/ integration)
very high(integration)
Data Integration none none none none/low
(coordination)
medium/high(coordination/ integration)
high(coordination/ integration)
very high(integration)
Available | Unavailable | Replaces | Refers to | Integrates
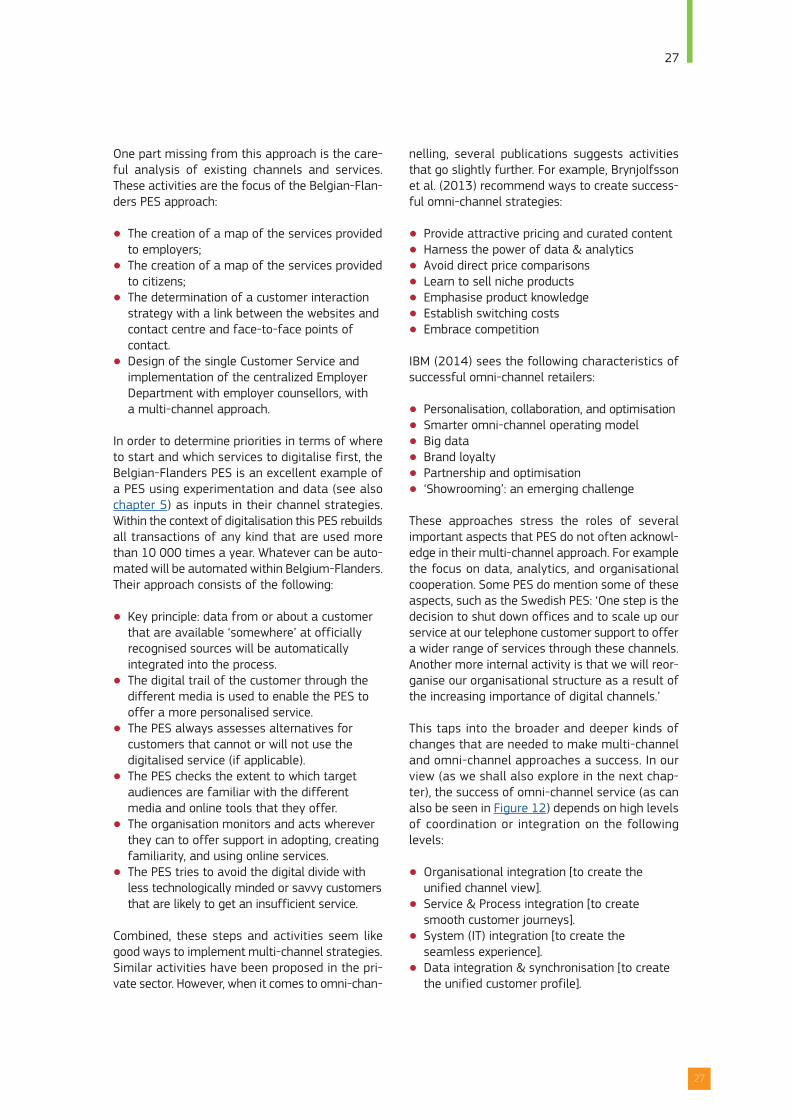
27
27
One part missing from this approach is the care-ful analysis of existing channels and services. These activities are the focus of the Belgian-Flan-ders PES approach:
● The creation of a map of the services provided to employers;
● The creation of a map of the services provided to citizens;
● The determination of a customer interaction strategy with a link between the websites and contact centre and face-to-face points of contact.
● Design of the single Customer Service and implementation of the centralized Employer Department with employer counsellors, with a multi-channel approach.
In order to determine priorities in terms of where to start and which services to digitalise first, the Belgian-Flanders PES is an excellent example of a PES using experimentation and data (see also chapter 5) as inputs in their channel strategies. Within the context of digitalisation this PES rebuilds all transactions of any kind that are used more than 10 000 times a year. Whatever can be auto-mated will be automated within Belgium-Flanders. Their approach consists of the following:
● Key principle: data from or about a customer that are available ‘somewhere’ at officially recognised sources will be automatically integrated into the process.
● The digital trail of the customer through the different media is used to enable the PES to offer a more personalised service.
● The PES always assesses alternatives for customers that cannot or will not use the digitalised service (if applicable).
● The PES checks the extent to which target audiences are familiar with the different media and online tools that they offer.
● The organisation monitors and acts wherever they can to offer support in adopting, creating familiarity, and using online services.
● The PES tries to avoid the digital divide with less technologically minded or savvy customers that are likely to get an insufficient service.
Combined, these steps and activities seem like good ways to implement multi-channel strategies. Similar activities have been proposed in the pri-vate sector. However, when it comes to omni-chan-
nelling, several publications suggests activities that go slightly further. For example, Brynjolfsson et al. (2013) recommend ways to create success-ful omni-channel strategies:
● Provide attractive pricing and curated content ● Harness the power of data & analytics ● Avoid direct price comparisons ● Learn to sell niche products ● Emphasise product knowledge ● Establish switching costs ● Embrace competition
IBM (2014) sees the following characteristics of successful omni-channel retailers:
● Personalisation, collaboration, and optimisation ● Smarter omni-channel operating model ● Big data ● Brand loyalty ● Partnership and optimisation ● ‘Showrooming’: an emerging challenge
These approaches stress the roles of several important aspects that PES do not often acknowl-edge in their multi-channel approach. For example the focus on data, analytics, and organisational cooperation. Some PES do mention some of these aspects, such as the Swedish PES: ‘One step is the decision to shut down offices and to scale up our service at our telephone customer support to offer a wider range of services through these channels. Another more internal activity is that we will reor-ganise our organisational structure as a result of the increasing importance of digital channels.’
This taps into the broader and deeper kinds of changes that are needed to make multi-channel and omni-channel approaches a success. In our view (as we shall also explore in the next chap-ter), the success of omni-channel service (as can also be seen in Figure 12) depends on high levels of coordination or integration on the following levels:
● Organisational integration [to create the unified channel view].
● Service & Process integration [to create smooth customer journeys].
● System (IT) integration [to create the seamless experience].
● Data integration & synchronisation [to create the unified customer profile].

28
28
At present, few organisations have achieved these levels of integration, and as of now it appears that fragmentation in all these areas is hindering the successful execution of multi- or omni-channel service delivery.
3.4 Future plans and developments
To conclude this chapter, we focus on the future and plans PES have regarding their channel strategies. In the survey, we asked PES to describe any longer-term plans they have regarding their channel strat-egies. This question yields a number of relevant themes that were all mentioned by several PES. We briefly mention these plans:
● Further development and customer adoption of e-services (BE-Brussels, BE-Wallonia, CZ, DE, ES, FI, HR, IS, SE, SI, SK) For many PES, further digitalisation of services is high on the agenda. This varies from ‘simply’ digitalising existing services to integrating all e-services in one portal. Many PES mention their ambition to strive towards full digitalisation of all services. One recurring problem here is the need to keep serving the digital illiterate and understanding the behaviours of those groups who cannot be served online.
● Improvement of service delivery and customer journey (DE, NL, PT, SE) Related yet different is the ambition to improve service delivery and achieve a seamless customer journey. For example, the Dutch PES describes various phases in the typical service delivery process: a) awareness of our services, b) orientation to our services, c) request of our services, d) actual service delivery, and e) temporary termination of service delivery. The PES stresses the importance of the customer journey across these channels as well as how certain channels are more suitable during a certain phase than others. For instance, social media might be suitable during the awareness and orientation phase, but are not suitable for the request for a benefit or job mediation service. In that case, other channels are promoted (digital, face to face, call centre). The ability to create a coherent and seamless customer journey hinges on the collection of data about the use of the changes in different stages of the customer journey.
● Evaluation, monitoring & measurement (ES, FR, LV) A third topic for future development mentioned by multiple PES is the plan to improve practices related to data-collection, such as evaluation of services, monitoring of channel behaviour, and measurement of other parts of the PES processes. The Latvian PES, for example, mentions the current process of evaluating the online CV and Vacancies portal that was brought online in 2015. The PES will not develop new future plans for the portal until after the evaluation. Furthermore, the evaluation will be used as an input for the promotion of e-services with the long term goal being the maximisation of the number of customers using e-services.
● Development of a strategy (HU, LT) Some PES do not have a multi-channel strategy yet, and a number of those mention that one of their future plans is to develop such a strategy. For example, the Lithuanian PES mentions that: ‘We are on the way to create a comprehensive multi-channelling/blended services strategy, focusing on providing a seamless transition of customers between different channels with the most value-added for the customer. Lithuanian Government’s strategy is to integrate all online social/public services (provided by different institutions) into one online channel for e-government’.
● Segmentation & user profiling (CY, FR, HR) Lastly, several PES mention plans to further segment or individualise their service offerings. Some see user profiles as a useful tool to create personalised services, or as input for customer segments (see also Pieterson, Ebbers & Van Dijk, 2007 for an overview of challenges and obstacles in this domain).
Besides ongoing activities, some PES indicate that they don’t have plans at present regarding their channel strategies (AT, PL). Other PES mention activities pertaining new channels and/or technol-ogies. We discuss those separately in Chapter 5.

29
29
3.5 Conclusions regarding MCM strategies
Compared to 2011 and 2014, when we conducted reviews of multi-channel strategies, PES have made good progress in a) their strategic plans regarding service delivery and b) their concrete channel strategies. These strategies are evolving. The focus has shifted from offering channels in parallel or trying to replace more traditional chan-nels with online channels, to highly sophisticated strategies in which channels interact and are so well integrated that they provide seamless expe-riences for customers as they move along their customer journey.
The latest of such strategies is the concept of ‘omni-channel management’ which is gaining popularity in the private sector, and increasingly the public sec-tor, as well as a small number of PES. This omni-channel strategy refers to a holistic view of channels, where channels are seen as one entity that need to be managed and organised as one unit. The discrete difference between channels disappears and the interaction takes place via touch-points. These touch-points are moments of customer interaction with a non-predefined set of communication cues.
Main reasons for the introduction of this omni-channel perspective are:
1. Customers are demanding a seamless channel experience and switch between channels, thus forcing organisations to unify their channel back-offices and achieve high levels of IT, data, process, and organisational integration. This implies that customers can choose whichever channel they prefer to obtain services, but are subsequently guided to different channels based on the nature of the task and the char-acteristics of the customer.
2. The need to track and serve customers throughout the customer journey requires smooth transfers between channels. This is needed to reduce mistakes and administra-tive burdens (for example to prevent the customer from entering the same informa-tion multiple times).
3. The increased fragmentation of customer groups and increase in channels forces organisations to be extremely flexible in how people are routed and guided through their process. This is especially important for those customers that are less digitally liter-ate and need to be steered to the appropri-ate channels to serve them well.
Several PES are moving in the direction of omni-channelling (sometimes implicit). However, the majority of PES are not moving in this direction yet. Most PES have some kind of channel strategy and in most cases that is a mix of existing strategies. Some PES lack any form of strategy and/or work-ing on it. As PES differ strongly in the maturity of their systems, the channel behaviours of their cli-ents, and their organisational goals, these differ-ences are understandable. However, given the general technological and societal developments (as outlined in chapter one), we encourage PES to keep defining, assessing, evaluating, and updating their channel strategies. This is to serve the chang-ing needs of their clients and remain in line with societal changes.

30
30
In this chapter we focus on the challenges PES are facing as they implement their multi-chan-nel strategies. First we discuss the broader problem of ‘integration’, the struggles of PES to integrated data, IT, processes, and parts of the organisation. Second, we discuss the recurring challenge of measuring the right aspects of cus-tomers and customers’ behaviours. We conclude the chapter with some other challenges and obstacles that PES encounter.
4.1 The problem of ‘integration’
In the previous chapter, we outlined four aspects where integration (or coordination) can greatly ben-efit the success of the multi-channel strategy. In this context, by coordination we mean the structural and recurrent activities of coordinating actions. By integration we mean the actual fusion of the aspects. Suppose different organisational units are responsible for different channels. Coordination, in this case, would mean that there are regular con-tacts (and maybe some joint activities) between the two units regarding how the channels interact. Inte-gration would mean that the two units merge to become one. Coordination has a key benefit in that it is easier to achieve in the short run. In the long run, integration has more benefits as it eases the decision making processes and implementation of actions. For this reason, we can see coordination as an initial ‘must have’ for successful multi-channel-ling, but integration as the long term goal.
For now, it appears that the reverse situation – the lack of integration as an obstacle to successful multi-channelling–poses challenges. Several pub-lications about private sector (retailing) multi-channelling mention integration as a challenge. Regarding the implementation of successful multi-channel management, Neslin et al. (2006) identify five challenges:
● Data integration across channels; ● Understanding customer behaviour in a multiple channel environment;
● Channel evaluation; ● Allocating resources across channels; and ● Coordination of channel strategies.
Zhang et al. (2010) list the following as major chal-lenges towards the creation of integrated multi-channel management:
● Organisational structure; ● Data integration; ● Consumer analytics; and ● Evaluation and performance metrics.
We synthesise between these challenges and include the aspects related to integration men-tioned in the previous chapter. This leads us to see the following key integration challenges:
4.1.1 Organisational integration
The first of these challenges is the lack of organi-sational integration. In opposite terms, this is often referred to as the existence of silos in the organisa-tion where the different parts of the organisation work as independent islands without connection. The need, and issues, pertaining to organisational coordination or integration are illustrated by a qual-itative study conducted at a Swedish governmental agency (Nygren, Axelsson & Melin, 2014), which found that different hierarchical levels in the organ-isation have different perceptions of channels, the division of channels, and the levels of task-channel fit. This results in different levels of the organisa-tions having different viewpoints of multi-channel strategies. Therefore, different tiers (in this case top level management, middle management, and case officers) need to collaborate and share their ideas and understandings in order to create and imple-ment successful channel strategies. In the private sector, the existence of silos, such as the independ-ent operation of the physical store and online sales channels, are often seen as a factor hindering chan-nel integration and successful multi-channel man-agement (see Herhausen et al., 2015; Gallino & Moreno, 2014; Rigby, 2011). Furthermore, Neslin and Shankar (2009) argue that from an organisa-tional perspective, coordinating channels rather than running them independently can help realise multi-channel service delivery.
The same applies to PES, where not only organisa-tional siloing may play a role, but also other factors that often result in the failure of (IT) related
4. INTEGRATION AT DIFFERENT LEVELS REMAINS KEY CHALLENGE

31
31
projects, such as ‘organisational power’ and ‘politics’ (see Anthopolou, 2016; Janssen et al., 2015). Sev-eral PES mention the role of organisational integra-tion and the existence of organisational silos. The German PES mentions that: ‘through digitisation, much higher flexibility requirements are placed on the responsiveness of organisational units and for the whole organisation. Transparency and commu-nication are used to reduce organisational silos’. They also list some of the requirements to help implement changes in the organisation, namely:
● An agile mentality, allowing the organisation to be more flexible and change more frequently.
● Creating awareness of the silos and the ‘silo mentality’ in the organisation (e.g. the tendency to protect one’s own turf).
One notable attempt to overcome silos and use coordination as a means to integrate the activities of various organisational units is that of the French PES (see next column).
While organisational integration and the needed organisational transformation are posing chal-lenges for PES right now, it is expected that such changes will be needed more frequently in the future as technology and customer behaviour evolve. In the private sector, the notion of continu-ous change due to the changes in the channel landscape is gaining ground. Pantano (2014) notes that the retail industry is already frequently sub-ject to disruptive innovation processes. These lead to a large number of novel information systems that enable or even require the modification of tra-ditional organizational processes. These changes are largely due to the large amount of research on advanced technologies, as well as the subsequent speed of development of new systems (Gunday, Ulusoy, Kilic, & Alpkan, 2008; Pantano & Viassone, 2014). As the speed of innovation in this space is increasing, we can expect these disruptive innova-tions to occur more frequently, eventually leading to a permanent state of change.
4.1.2 Process integration
The second type of integration needed is that of process integration. This is especially important when it comes to the creation of seamless cus-tomer journeys across all channels and all stages of the service delivery process. For example, cus-tomers that have to re-enter the same informa-tion at several points throughout their process are not experiencing a seamless customer journey.
In the context of retailing, Verhoef et al. (2015) discuss the performance across the numerous available channels and customer touch-points and how this performance can be optimised. Key fac-tors there are effective operations and processes. The more coordination between the different oper-ational units, the easier it becomes to transfer cus-tomers between channels and/or different stages of their process.
Currently, this level of integration is rare. According to Frost and Sullivan (2015), most companies deliver so called ‘fractured’ multi-channel experiences. When
Case study: Organisational integration at French PES
One of the goals in improving service delivery for the French PES was the creation of a more unified (and seamless) user experience.
In order to implement this user experience approach, the PES created a dedicated division in charge of it. The creation of the Digital and User Experience Division reflects the desire to ensure that the change and innovation strat-egy conducted within French PES was properly understood and assimilated by in-house agents and users alike. In adopting this approach, it encourages the involvement of users (internal and external) in the design, performance and adoption of these new uses and services.
An important component is that this division is in charge of channel integration. This division:
‣ Coordinates with the different departments in charge of the different channels (such as the IT Division, the Division in charge of call centre, etc.).
‣ Ensures the complementarity of service deliv-ery across the entire customer journey.
In order to achieve this objective, the division has created several life events (‘Finding a job’; ‘receiving benefit’; ‘Recruit a jobseeker’, etc.) and created pathways (or prototype customer journeys) for the completion of these life events. The division works closely with opera-tional divisions to implement the customer journeys and create a seamless experience.

32
32
customers switch from one channel to another, rel-evant information such as their context and history doesn’t switch with them. So even in the private sec-tor they have to repeat their effort or re-enter their information when they move between channels. This situation leads to lower customer satisfaction, missed opportunities for upsell or cross sell, and eventually customer churn. Although customer churn is typically not possible in public sector service settings, lower satisfaction and an increase in complaints are pos-sibilities and both are considered undesirable.
Several PES mention the challenge pertaining to process integration and/or creating customer jour-neys. In that sense, the comment of the Lithuanian PES is on spot and mentions not only the importance of process integration but also related aspects: ‘Adapt people, process and technology to meet the coordinated approach to channel management’.
Indeed, most of the PES that mention some challenge related to the integration of processes do that in the context of service delivery, organisation, IT systems, and/or customer journeys. To us this is an important signal that all types of integration are interdepend-ent and should probably be treated as such.
4.1.3 Data integration
The third type of integration is that of the integra-tion of data infrastructures. This refers to:
● Integrating databases in the organisation. ● Integrating system data with data from other sources.
● Connecting to data sources from outside the organisation.
The Czech PES gives an example from the latter: ‘In particular, sectoral data integration – the Uni-form Information System of the Ministry of Labour and Social Affairs – is important. The PES is work-ing on an online information system’.
Data integration has been extensively discussed in the 2016 peer review on ‘Modernising PES through supportive data and IT strategies’, and therefore we will not discuss this topic here in detail. It suf-fices to say it is a serious challenge for PES and deserves ongoing attention.
4.1.4 IT integration
The last type of integration is certainly one that is getting ongoing attention, and rightfully so. As the role of technology in PES is increasing, IT is touch-
ing nearly every single aspect of the organisation. Therefore, each of the other types of integration will most certainly touch upon IT integration. How-ever, as organisations adopt more systems, IT inte-gration becomes more of a challenge in itself.
Several PES are working on integration and trans-formation of IT systems and see the challenge here. For example, the Belgian-Walloon PES is working on the transformation of ‘ancient database and IT sys-tems’. The Austrian PES mentions the compatibility of the different IT-systems as a challenge. To tackle this, the Portuguese PES is developing an integrated information system (appropriately called ‘UNO’):
UNO is aimed at creating a unique system that allows a functional and applicational integration between the area of employment (job offer and demand and ALMP) and the area of vocational training (for job-seekers) in an agile and simple way, also allowing the effective management of the costumer journey to run in an integrated way. UNO system has a clear orientation for the electronic services to be made available to our customers, aiming at a complete review of the existing NETemprego portal.
Let’s touch upon the topic of organisational inte-gration as it is the current plan from Belgian-Brus-sels. They are working on ‘the strengthening of the collaboration with business to elaborate and update the IT strategic plan to better respond to business needs: we need to set up a co-construc-tion between operational Directorates and IT to align IT and business processes’. Part of that jour-ney is to create a new IT oriented business func-tion (IT business SPOC) that serves as the link between the operational directorates and the IT management. This approach might be beneficial in reducing the number of organisational silos.
This indicates a key point; integration of one aspect often requires other types of integration as well. If organisational silos hinder the integration of IT systems, then the organisational silos need to be bridged first before successful IT integration takes place. This is acknowledge by the Slovenian PES. The PES is planning to completely revamp their online services and create more links between ser-vices. This not only requires the involvement of both jobseekers and staff, but also requires an organisational structure that allows for the smooth implementation and functioning of (integrated) multi-channelling. This, for Slovenian PES, is a work in progress.

33
33
Another relevant aspect is the involvement of top management and the proper managerial approach towards integration. On this point, the Czech PES comments:
Increasing digitalisation and integration of IT tools in different business processes requires additional efforts from the management perspective to interconnect data between different tools and platforms. The connection of data stored in different platforms helps organisation to have an overall view of client, services provided and evaluation of services.
This point makes sense, as different parts of the organisation and different people could be respon-sible for different parts of IT systems. This neces-sitates the involvement of management, and if managers of the different departments are not able to resolve issues pertaining to integration, a logical next step would be to involve higher level management.
Similar to the topic of data-integration was the integration of IT systems, a key topic of the 2016 peer review on ‘Modernising PES through support-ive data and IT strategies’. However, given the importance of IT integration for the success of multi-channel strategies, we recommend deeper and broader attention to this issue.
4.2 Collecting the right data
In the previous section we discussed the impor-tance of integrating data to create unified cus-tomer profiles and ensure all data is synchronised across all channels. Another challenge for PES con-cerns the types of data they collect and store, whether they collect this through their systems or through other means (e.g. surveys). It is important to collect data about customers for several rea-sons. The first is the increasing complexity of cus-tomers and their behaviours. Accenture (2015) signals that customers are becoming more com-plex in a number of dimensions:
● More knowledgeable, thanks to the accessibility of information online.
● More demanding, due to the redefinition of ‘value’.
● More empowered, as more options (e.g. channels) are available.
● More collaborative, due to the sharing economy, social media and ‘bring your own’ cultures.
● More diverse, due to globalisation and diversification of IT and channels.
● More interactive, due to increased opportunities to create and share content.
● More mobile, as mobile devices allow access from anywhere.
PES themselves list some other important reasons to collect high quality data, including some stressed by PES, including:
● Development of services which will be user-friendly and will be in accordance to customer’s needs (CY, LT, LV, PT, SI) Making services user friendly remains a challenge for many PES. While the creation of user friendly services largely depends on dedicated types of research (such as UI (User Interface) / UX (User Experience) testing), collecting behavioural data can provide important insights about the types of services used by certain groups of services and thus help to tailor services to those groups.
The French PES mentions this issue in relation to the topics discussed above: ‘There is a list of chal-lenges in relation to deliver an effective ‘user expe-rience’ approach as we try to implement it:
• Improve knowledge about user and uses though data collecting and data mining;
• Put digital at the core of counsellors activity without make them feel threatened by this shift;
• Improve the convergence/integration of digital services but also with other channels (eliminating channels for step of services which re note the more valuable). This convergence is a challenge for service delivery but also for performance management.’
In this case, data is needed as an input to design services and process.
● Balancing user needs and goals with the internal organisational goals (such as cost-efficiency) (NL, PL, PT) The need to collect data to measure the extent to which organisational goals are being met is the second reason mentioned by several PES and one discussed in earlier PES publications. During the 2014 PES review in Amsterdam we discussed how PES need to balance a) effectiveness of service delivery, b) efficiency,

34
34
and c) customer satisfaction. While in the end which goals are most important and which KPIs are used to measure progress towards these goals is an organisational decision, the organisation will still need relevant data for these KPIs. For many PES, balancing these goals and measuring them remains challenging. Or, as worded by the Dutch PES: ‘The challenge is to find a balance between service delivery and available budget. Measurements on effectiveness of services are continuously necessary in order to find out what works for whom in the most effective and efficient way.’
So, measurement is important. But what do PES currently measure? We asked PES to indicate whether or not they collect certain (relevant) types of data. Figure 13 shows which percentage of all PES in the study collect the different types of data.
A majority of 59 % collect information about the number of contacts via each channel. This is fol-lowed by 50 % of all PES collecting data about cus-tomer satisfaction. After that, all types of data are being collected by a minority of all PES. For exam-ple, the cost of each transaction or contact via each channel (contact cost) is measured by 18 % of all PES, even though this type of information is very important in determining the efficiency of each channel and the overall channel strategy.
It does appear, therefore, that the amount and quality of data collected by PES to monitor their channel strategies is insufficient. The Finnish PES put this in words:
‘At the moment, tracking and managing omni-channel efficiency and effectiveness of a channel-specific service are not in satisfactory condition. The plan is that the channel management model which includes, among others, channel-specific mar-keting and communication plan, monitoring and evaluating the user-friendliness, efficiency, and effectiveness of the various channels, is introduced.’
Given that the Finnish PES is in some ways ahead of many of its European counterparts in terms of developing and executing a multi- (in this case omni-)channel strategy, we expect the situation at most other PES be ‘not satisfactory’ as well, at best.
Gathering this information also gets harder. One reason for this (already mentioned in Chapter 2) is that aspects like customer satisfaction are impacted by the quality of all channels. Hence, lower quality in one channel will impact customer satisfaction across all channels in use (see Beck and Philip (2013) for an overview). Thus, as PES start imple-menting true multi-channel strategies, it becomes more important to measure across channels in order to rightfully assess parameters like satisfaction. A second reason entails the complexities arising from the introduction of new systems and tools. In order to determine the success of these new sys-tems, organisations need to capture relevant met-rics from these systems. But, as argued by Grant et al. (2013), assessing the value from information technologies involves the development of new met-rics, as well as measurement tools. The implication is that as PES continue to change and, more con-tinuously, introduce new systems, they need to con-tinuously develop metrics and collect the right data.
Satisfaction
50 %
Duration of contacts
41 %
Channel preference
23 %
Customer journeys
9 %
Channel switching
5 %
Other
18 %
Contact cost
18 %
No Contacts
59 %
Figure 13: Channel data collected by PES
Figure 13. Data collected by the PES in the sample (based on n=23, percentages indicate percentage of the PES that collect this type of data)..

35
35
4.3 Other challenges and obstacles
Some other challenges and obstacles that have been mentioned by PES. These include the following:
● Security and data protections (DE, IS) Several PES mention the need to protect data and ensure the privacy of customers is properly protected. The German PES mentions the need to protect data as it is being pulled from various heterogeneous systems. While largely a technical challenge, there are behavioural aspects involved, for example regarding user consent and staff training.
● Staff training (PT, SE, SI) Or, as put by the Slovenian PES: ‘Before implementation of new services which encourage use of online tools, our staff is trained to promote e-services with the method of internal dissemination of information (Intranet, meetings) and face-to-face trainings. The introduction of new channels often requires new competences. Demonstrations, meetings, presentations, and training courses are organ-ized to familiarize staff with new forms of service-delivery.’ The Swedish PES extends this by also arguing that it will be challenging to find staff with the right skills to begin with.
These challenges and obstacles have been the subject in the previous peer-reviews in 2011 and 2014 as well. For this reason we do not discuss these extensively, but it is worth noting that these obstacles remain important for the PES across the EU. As such, they could benefit from future learn-ing and knowledge sharing.
4.4 Conclusions regarding challenges and obstacles
PES experience various challenges while improv-ing service delivery and their multi-channel strat-egies. Many types of obstacles are mentioned in the literature and the survey we conducted among PES. Similar to the peer reviews in 2011 & 2014 we see staff training and the protection of privacy and security as important obstacles. However, as PES evolve and start blending and integrating their service channel strategies, as well as striving towards seamless customer experiences, a new class of obstacle emerges. This concerns the prob-lems that PES encounter when trying to integrate vital elements needed to achieve channel success. More specifically, this pertains to the need to inte-grate a) service delivery processes, b) the data infrastructures feeding into these processes and the various service channels, c) the IT systems behind these service channels, and d) the organi-sational units responsible for different channels, processes, and systems.
The more advanced the multi-channel strategy is, the more coordination or even integration is needed. For example, for customer journeys to be seamless, the channels and the underlying processes need to be highly unified. This requires more effort from the organisation and the impact of the obstacles increases. Of specific importance is the role of organisational fragmentation or ‘siloing’. Organisa-tional silos can hinder fruitful collaboration between different parts of the organisation and data frag-mentation can hamper a seamless customer jour-ney. PES working on the multi-channel strategies are wise to start planning these integrations early on and include activities pertaining to integration and coordination into their strategic plans.
Case study: Staff training as part of IT implementation (DE)
The German PES has long recognised the importance of staff training and takes the following approach. The introduction of IT applications in the German Federal Employ-ment Agency is usually carried out as a project. For extensive applications, face-to-face train-ings take place, in which professional content is trained together with the IT-application.
For the professionalisation of staff with respect to office applications, learning pro-grams are freely available for every staff member and are being offered during working hours. In addition, in the services of the Ger-man Federal Employment Agency there are so-called IT-specialists, particularly trained employees, who support their colleagues in IT-programs (this method of ‘peer training and support’ is also carried out by other PES, such as in Belgium-Flanders).

36
36
In this fifth and final channel we discuss the role of new innovations and channels that are slowly making an appearance in private sector service delivery, the public sector and, finally, PES. First, we focus on new developments in the channel landscape, namely the arrival of a new genera-tion of service channels or ‘social robots’, fol-lowed by a short discussion on the topic of channel elimination. Next, increasingly related to the topic of ‘channels’ are that of data and intelligence. Data is needed to evaluate multi-channelling, but at the same time, data becomes an increasingly important building block of channels and channel infrastructures. We sum-marise the findings in the final paragraph.
5.1 New generations of channels
The number of available service channels has grown quite large in the past decades. This applies to retailing (see e.g. Pantano and Viassone, 2015), but certainly also applies to public sector service delivery. Before the 1990s it was common for organisations, including PES, to have in-person ser-vice delivery, supported by telephone and mail (and in some cases the fax). Nowadays, many organi-sations have to choose between channels includ-ing face-to-face contact, the telephone, mail, websites, email, social media, and mobile apps. This creates challenges in terms of choosing which
channels to deploy in the first place, and which purposes and target audiences these channels will be deployed once they are chosen. One important reason for this challenge is simply the cost asso-ciated with deploying channels. An increasing num-ber of channels also leads to an increase in costs. This is because every channel requires specific technical infrastructures and resources (Wirtz & Langer, 2016). Branding of the channel, staffing, and staff training, are examples of these resources.
Several PES mention that they are expanding or planning to expand their channel portfolio with one of the existing channels. Some PES are planning or considering work on their ‘mobile’ offerings, either through adaptive or mobile friendly websites (e.g. SK) or dedicated mobile apps (e.g. NL, LT). The French PES is currently developing the video-chat as a contact channel. It will be available for job-seekers on a voluntary basis. Similarly, Belgium-Flanders is implementing physical touch points (service points) where the customer can commu-nicate live via video with PES counsellors. Social media is also still being explored (e.g. social net-works in the Czech PES). Finland is working on the use of social media channels as part of their digi-talisation plans.
The number of available channels is still increasing. Pieterson, Ebbers, and Madsen (2017) discuss the potential of social robots as channels to improve pub-
5. NEW CHANNELS AND INNOVATION: THE ROBOTS ARE COMING
Table 1. Generations of service channels (based on Pieterson, Ebbers & Madsen, 2017).
GEN. PERIOD LABEL ALTERNATIVE(S) EXAMPLE CHANNELS
0 <1990s Traditional - In-person, telephone, mail
1 1990s Electronic Digital, Online Website, email
2 2000s Social Social media, Web 2.0, Government 2.0
Social media (e.g. social networking sites, (micro-)
blogging, wikis)
3 2010s Mobile M-Government Smartphones, responsive sites, mobile apps
4 2020s Social Robot Robots, Robotisation Social & conversational robots, artificial intelligence,
virtual intelligence

37
37
lic sector service delivery. A social robot can be defined as: ‘an autonomous or semi-autonomous robot that interacts and communicates with humans by following the behavioural norms expected by the people with whom the robot is intended to interact’ (Bartnick & Forlizzi, 2004). What these social robots have in common is that they rely heavily on Artificial Intelligence (AI)10 to process data and transfer inputs into meaningful outputs. Pieterson et al. (2017) argue that social robots are not one homogeneous chan-nel, but rather a generation of electronic channels (Table 1) consisting of several separate channels. These channels are being explored now mostly by private sector organisations, as well as some govern-ments (Including PES, see below).
According to Pieterson et al. (2017), these social robots, like social media, consist of several types of channels. Their typology is based on the com-municative properties of these channels and they distinguish the following types:
1. Software agents. These are social robots that feed into existing front-office in- and outputs. They typically rely on one or two types of sensory inputs and output the same type of outputs. For example, a chat bot takes written input, processes this input, and creates an output. If an organisation already uses chat as a service channel, the chat bot is simply replac-ing the human that currently processes the inputs. Presently, we can distinguish between three types of software agents:
a. Chat bots [processing written inputs].b. Conversational robots [processing spoken
inputs].c. Intelligent agents [combining multiple
types of (sensory) inputs].
2. Virtual and ‘virtuality’ enhancing robots. These are robots that start interacting with the physical space. They don’t simply ‘live’ in the background, but actually create or impact a (virtual) presence. The clearest example of this is virtual reality in which the robot cre-ates an environment in which interaction can take place. This creates possibilities for richer types of interactions where more types of sensory inputs can be used (e.g. body lan-
10 Also see the analytical paper on ‘Modernising PES through supportive data and IT strategies’. http://ec.europa.eu/social/BlobServlet?docId=16602& langId=en
guage). Currently we have two types of virtual and ‘virtuality’ enhancing robots:
a. Augmented reality [changing a physical environment].
b. Virtual reality [recreating a physical environment].
3. Physical social robots. The last type of social robots have a physical presence. This allows them to move around, physically interact with people, and potentially have more emotionally laden conversations. Two types of these exist:
a. Non-humanoids [having a physical presence, not resembling a human].
b. Humanoids [physically resembling humans].
These social robots have different properties, potentially rendering them suitable to replace or supplement existing channels, or create completely new service opportunities. See Table 2.
We can see several opportunities for these social robots within the context of PES’ service delivery. For example, virtual reality could be used for train-ing purposes, such as practising job interviews. Intelligent agents have potential to assist jobseek-ers through their entire labour mediation process, acting as guardians of their portfolios and being the first entry point for questions. In the long term, physical robots might be a replacement of case-workers or office receptionists. However, these would all be longer term possibilities.
At this point, there is a high level of enthusiasm among the PES about the possibilities of social robots (and then mostly the software agents). No fewer than 10 PES (BE-Wallonia, DE, ES, FI, FR, LT, SE, SI) mention that they are looking into these new channels. Some of these are focusing on chat robots (BE-Wallonia, FI, SI), while others are thinking about conversational robots (FR, LT). In most cases, how-ever, these are either (far) future plans or planned experiments. The only PES with concrete plans to actually implement a chat bot is the German PES. The German PES is also the only one mentioning intelligent virtual assistants as a longer-term ambi-tion, as well as virtual and virtuality enhancing robots (AR/VR). Physical robots are not yet on PES’ agendas. As such, we are probably a few years away from a) having concluded insightful experiments with these channels and b) having actual opera-tional robots within PES.
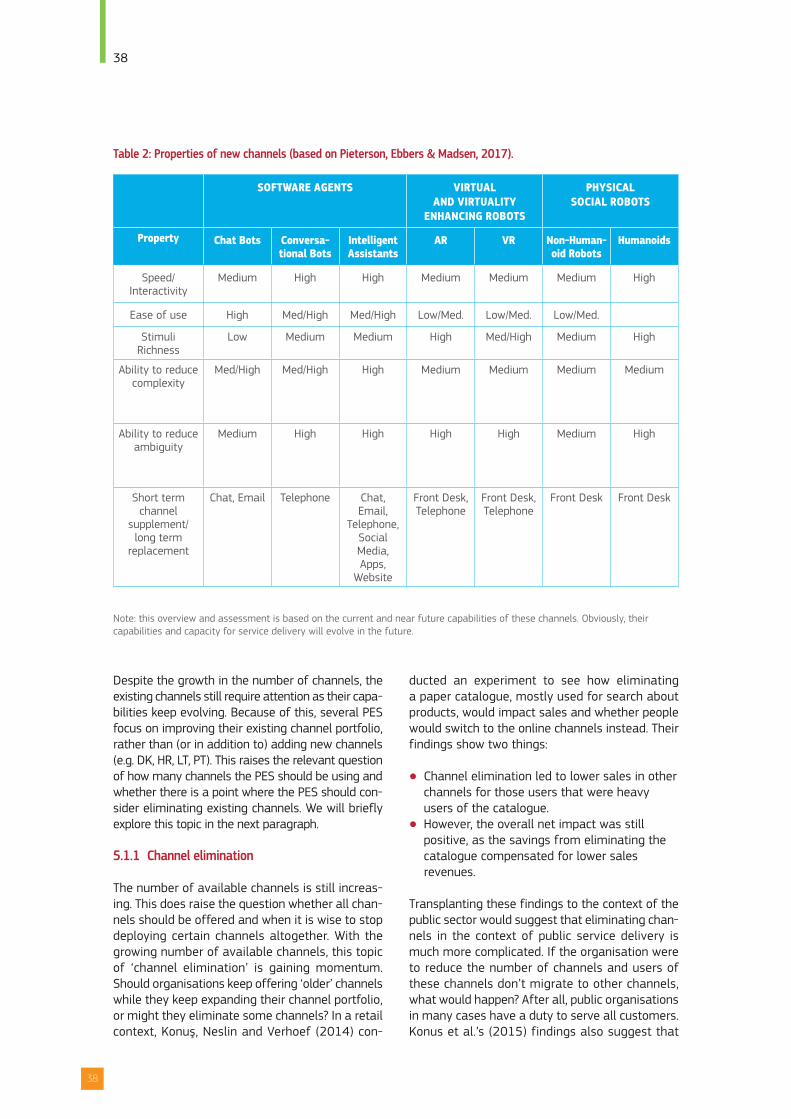
38
38
Despite the growth in the number of channels, the existing channels still require attention as their capa-bilities keep evolving. Because of this, several PES focus on improving their existing channel portfolio, rather than (or in addition to) adding new channels (e.g. DK, HR, LT, PT). This raises the relevant question of how many channels the PES should be using and whether there is a point where the PES should con-sider eliminating existing channels. We will briefly explore this topic in the next paragraph.
5.1.1 Channel elimination
The number of available channels is still increas-ing. This does raise the question whether all chan-nels should be offered and when it is wise to stop deploying certain channels altogether. With the growing number of available channels, this topic of ‘channel elimination’ is gaining momentum. Should organisations keep offering ‘older’ channels while they keep expanding their channel portfolio, or might they eliminate some channels? In a retail context, Konuş, Neslin and Verhoef (2014) con-
ducted an experiment to see how eliminating a paper catalogue, mostly used for search about products, would impact sales and whether people would switch to the online channels instead. Their findings show two things:
● Channel elimination led to lower sales in other channels for those users that were heavy users of the catalogue.
● However, the overall net impact was still positive, as the savings from eliminating the catalogue compensated for lower sales revenues.
Transplanting these findings to the context of the public sector would suggest that eliminating chan-nels in the context of public service delivery is much more complicated. If the organisation were to reduce the number of channels and users of these channels don’t migrate to other channels, what would happen? After all, public organisations in many cases have a duty to serve all customers. Konus et al.’s (2015) findings also suggest that
Table 2: Properties of new channels (based on Pieterson, Ebbers & Madsen, 2017).
SOFTWARE AGENTS VIRTUAL AND VIRTUALITY
ENHANCING ROBOTS
PHYSICAL SOCIAL ROBOTS
Property Chat Bots Conversa - tional Bots
Intelligent Assistants
AR VR Non-Human-oid Robots
Humanoids
Speed/Interactivity
Medium High High Medium Medium Medium High
Ease of use High Med/High Med/High Low/Med. Low/Med. Low/Med.
Stimuli Richness
Low Medium Medium High Med/High Medium High
Ability to reduce complexity
Med/High Med/High High Medium Medium Medium Medium
Ability to reduce ambiguity
Medium High High High High Medium High
Short term channel
supplement/long term
replacement
Chat, Email Telephone Chat, Email,
Telephone, Social Media, Apps,
Website
Front Desk, Telephone
Front Desk, Telephone
Front Desk Front Desk
Note: this overview and assessment is based on the current and near future capabilities of these channels. Obviously, their capabilities and capacity for service delivery will evolve in the future.

39
39
customers who already use multiple channels in their general shopping behaviours, suffer less from channel elimination. This seems to suggest that organisations should first try to have their custom-ers use multiple channels (in parallel) before elim-inating channels. This would suggest that PES should monitor closely which customers are using which channels for which purposes before elimi-nating channels. Furthermore, also from a cost-perspective, this monitoring is needed. As all deployed channels have a certain base cost (see Wirtz & Langer, 2016) (e.g. for the channel infra-structure) associated with them, a cost-benefit analysis can help determine whether channels should be eliminated or not.
5.2 Data, intelligence and automation
The development of new channels is closely related to the development of artificial intelligence, which in turn relies heavily on the availability of well organised data stored in, and collected from, sophisticated IT systems. As such, further automa-tion of processes within PES is a necessary condi-tion for the creation of high-quality and real-time data, and thus the introduction of new channels. The reverse also applies, as Pantano (2014) argues: ‘capturing value from information technol-ogies requires the development of new metrics and measurement tools’.
Further automation and digitalisation of services are high on the agenda of PES across the EU. The automation agenda breaks down in certain areas:
● Increase in digitalisation of existing services (e.g. IS).
● Automation of services (e.g. AT, IS, HR). Prime focal point for several PES in this area is the development or improvement of their automated skill/job-matching applications. This appears to be an area where peer-learning could be of great help.
● Use of data based (artificial) intelligence to improve process (e.g. HU, FR, FI, SE).
● Use of big data (for example to personalise service and improve customer services, NL, or design and operate business processes, HU) (e.g. NL, HU, FR, FI).
● Sharing data and integrating with other organisations (e.g. HR, BE-Wallonia).
One of the key lessons for PES working on data and technology related innovation is to always
approach these topics in tandem, focusing on the following questions:
1. Which types of data are needed by new tech-nologies in order for them to be successful? (data as inputs).
2. Which types of data could be generated by new technologies that could further improve the technology or other technologies (or pro-cesses)? (data as outputs).
3. Which data-points are required to assess the success of the new technology? (data as means to evaluate).
5.3 Other innovations and experimentation
Many of the technologies underlying new channels can also be used to improve services and pro-cesses, potentially leading to other relevant inno-vations. In the context of retailing, for example, Pantano (2014) notes that the number of innova-tive technologies available to sell goods and pro-vide services is diffusing fast. These technologies enable many interactive and innovative systems that support shoppers and retailers (e.g. by provid-ing fast and updated information on market trends and selling process). New technologies making their way into the physical shopping environment and that support shoppers include large interac-tive displays (i.e. digital signage). Research sug-gests they tend to have a positive influence on the customer experience by invoking feelings of enter-tainment and pleasure (Dennis et al., 2014). In a similar vein is the education industry currently focused on the development of digital storytelling, virtual and augmented reality based scenarios, and collaborative 3D environments to enhance the effectiveness of learning. It is very well possible that some of these technologies could be applied to the context of PES service delivery. The men-tioned interactive displays, for example, could be accompanied by video chat kiosks, as currently explored by Belgium-Flanders.
There are many related developments happening in other sectors that could be relevant for PES. What these other sectors have in common is room for experimentation to drive innovation. The good news is that we are seeing more experimental ini-tiatives within PES. Experimentation is a central part of Belgium-Flanders’s innovation lab and Bel-gium-Flanders in their practices is inspired by the

40
40
United Kingdom’s Digital service standard (see Appendix 4), which sets out a number of guidelines for good service delivery and service innovation. A similar, more experimental approach is currently being embrace by the German PES. This PES gives several potential examples of experiments that are being considered in the context of innovation:
● Relief of employees by automating manual process steps (e.g. manual data synchronisation between systems or automated transfer of data from eAkte (= electronic file system) in specialised procedures).
● Use of artificial intelligence (e.g. chatbots in level 1 and virtual assistants in level 2) to automate even complex customer requests/to support the employees.
● Linkages to other authorities in order to ‘standardise’ the customers’ journey (e.g. fully automated application to child allowance).
● Use of predictive analytics for the targeted proactive approach on customers to avoid unemployment.
● Use of analytics for the ‘hyper’ personalisation of offers for customers as well as to enable a 360° customer profile, which can be used by our staff in an individual conversation.
● Use of analytics to identify recommendations for action for customers and staff.
● Use of analytics and robotics to fully automated case processing in customer segments, where the customers do not require any support and look for new jobs by themselves.
● Integration into ecosystems increases the range as well as changes and complements digital offerings.
● Augmented/Virtual Reality scenarios (e.g. display of vacancies when using a smartphone app/camera pointing on a shop in the city centre).
So, while no directly relevant or implementable innovations outside of the ones being discussed in the previous sections have been mentioned by PES, it appears that more PES are adopting an innova-tive mindset (potentially inspired by Belgium-Flan-ders’ lead in this space). This leads to more room for experimentation, which we consider a good approach. After all, experimentation is a useful way to gather valuable information in a controlled environment.
5.4 Conclusions regarding new channels and innovations
Technology is playing an important role within PES and technological developments are going faster and faster. As a consequence, PES are not just slowly evolving their overall channel strategies, but are also innovating in related areas. The most important areas of innovation are the increase in digitalisation and automation of processes and services. Many PES are working on the integration of their processes and systems (see above), and are looking into ways to automate these processes more and more.
As part of this automation, various PES are explor-ing the introduction of social robots as service channels. These come in various forms and could potentially supplement or replace existing chan-nels. For example, several PES are looking into Chat or Conversational Bots as means to improve ser-vice delivery, as well as to improve the efficiency of the organisation. However, the exact role of these robots remains unclear and needs to be understood further before any large scale deploy-ments seem justified. As most PES are still in their early stages regarding deployment or experimen-tation with these social robots, there are no real-life experiences from PES yet.
Related to automation are PES initiatives in the areas of artificial intelligence and big data. For example, data driven artificial intelligence is seen as a way to improve various services and pro-cesses such as matching and profiling.
Lastly, in part to explore these innovations and anticipate future technological developments, PES have started to experiment more with new technol-ogies and applications. Several PES have innovation labs or other environments where they can learn from technologies in a controlled way. Such experi-ments are a good way to gain valuable information in such controlled environments. As such, we highly recommend this practice and encourage more PES to start conducting evidence-based experiments and share their learnings.

41
41
REFERENCES• Accenture (2015). The New Omni-Channel Approach to Serving Customers Strategy Implications
for Communications Service Providers. Accenture.
• Anthopoulos, L., Reddick, C. G., Giannakidou, I., & Mavridis, N. (2016). Why e-government projects fail? An analysis of the Healthcare. gov website. Government Information Quarterly, 33(1), 161-173.
• Arpaia, A., Kiss, A., Palvolgyi, B., & Turrini, A. (2016). Labour mobility and labour market adjustment in the EU. IZA Journal of Migration, 5(1), 21.
• Van Baal, S. (2014). Should retailers harmonize marketing variables across their distribution channels? An investigation of cross-channel effects in multi-channel retailing. Journal of Retailing and Consumer Services, 21(6), 1038-1046.
• Bartneck, C., & Forlizzi, J. (2004, September). A design-centred framework for social human-robot interaction. In Robot and Human Interactive Communication, 2004. ROMAN 2004. 13th IEEE International Workshop on (pp. 591-594). IEEE.
• Beck, N., & Rygl, D. (2015). Categorization of multiple channel retailing in Multi-, Cross-, and Omni- Channel Retailing for retailers and retailing. Journal of Retailing and Consumer Services, 27, 170-178.
• Brynjolfsson, E., Hu, Y. J., & Rahman, M. S. (2013). Competing in the age of omnichannel retailing. mIt sloan management Review, 54(4), 23.
• Dennis, C., Brakus, J.J., Gupta, S., & Alamanos, E., (2014). The effect of digital signage on shopper behavior: the role of the evoked experience. Journal of Business Research, 67(11), 2250-2257.
• Van Deursen, A. J., & Van Dijk, J. A. (2014). The digital divide shifts to differences in usage. New media & society, 16(3), 507-526.
• Van Deursen, A. J., Helsper, E. J., & Eynon, R. (2016). Development and validation of the Internet Skills Scale (ISS). Information, Communication & Society, 19(6), 804-823.
• Van Dijk J (2005) The Deepening Divide: Inequality in the Information Society. London: SAGE.
• Ebbers, W. E., Jansen, M. G., Pieterson, W. J., & van de Wijngaert, L. A. (2016). Facts and feelings: The role of rational and irrational factors in citizens’ channel choices. Government information quarterly, 33(3), 506-515.
• Ebbers, W. E., Jansen, M. G., & van Deursen, A. J. (2016). Impact of the digital divide on e-government: Expanding from channel choice to channel usage. Government information quarterly, 33(4), 685-692.
• Ebbers, W.E. & Pieterson, W.J. (2017). Daar gaat een blauwe envelop. 5e Deelrapportage online enquête. Meting 4 mei 2017. Enschede: Universiteit Twente.
• EHI Retail Institute (2016). Omnichannel-Commerce 2016 Services, Herausforderungen und Trends. Köln: EHI Retail Institute.
• Eurostat (2017). ICT Usage in Households and by individuals (ISOC I). http://ec.europa.eu/eurostat/data/database?node_code=isoc_ci_in_h

42
42
• Frost & Sullivan (2015). Moving from Multi-channel to Omni-channel Customer Engagement: Intelligent Interaction Analytics are the Foundation. Mountain View, CA: Frost & Sullivan.
• Gallino, S., & Moreno, A. (2014). Integration of online and offline channels in retail: The impact of sharing reliable inventory availability information. Management Science, 60(6), 1434-1451.
• Grant, K., Alefantos, T., Meyer, M., & Edgar, D. (2013). Capturing and measuring technology based service innovation – A case analysis theory and practice. International Journal of Information Management, 33(5), 899-905.
• Herhausen, D., Binder, J., Schoegel, M., & Herrmann, A. (2015). Integrating bricks with clicks: retailer-level and channel-level outcomes of online–offline channel integration. Journal of Retailing, 91(2), 309-325.
• IBM (2014). Authenticity and advantage in an omnichannel world. London: IBM United Kingdom Limited.
• Janssen, M., van der Voort, H., & van Veenstra, A. F. E. (2015). Failure of large transformation projects from the viewpoint of complex adaptive systems: Management principles for dealing with project dynamics. Information Systems Frontiers, 17. pp: 15-29.
• Janssen, M., Van Veenstra, A., & Van der Voort, H. (2013). Management and failure of large transformation projects: Factors affecting user adoption. In: Y. Dwivedi, H. Henriksen, D. Wastell, & R. De (Eds.), Grand Successes and Failures in IT. Public and Private Sectors. Berlin/Heidelberg: Springer.
• Madsen, C. Ø., & Kræmmergaard, P. (2016). How to Succeed with Multichannel Management: A Case Study of Cross-Organizational Collaboration Surrounding a Mandatory Self-Service Application for Danish Single Parents. International Journal of Public Administration in the Digital Age (IJPADA), 3(4), 94-110.
• MGI (2013). Disruptive technologies: Advances that will transform life, business, and the global economy. Technology Republic. McKinsey Global Institute.
• Neslin, S. A., Grewal, D., Leghorn, R., Shankar, V., Teerling, M. L., Thomas, J. S., & Verhoef, P. C. (2006). Challenges and opportunities in multichannel customer management. Journal of Service Research, 9(2), 95-112.
• Neslin, S. A., & Shankar, V., (2009). Key issues in multichannel customer management: current knowledge and future directions. Journal of Interactive Marketing, 23, 70-81.
• Nygren, K., Axelsson, K., & Melin, U. (2014). Multi-channel service management in Public Sector: Three interpretative frames illustrating e-government and work practice in a swedish state agency. Electronic Journal of e-Government, 12(1), 112-125.
• Pantano, E. (2014). Innovation drivers in retail industry. International Journal of Information Management, 34(3), 344-350.
• Pantano, E., & Viassone, M. (2014). Demand pull and technology push perspective in technology-based innovations for the points of sale: The retailers evaluation. Journal of Retailing and Consumer Services, 21(1), 41-47.
• Pantano, E., & Viassone, M. (2015). Engaging consumers on new integrated multichannel retail settings: Challenges for retailers. Journal of Retailing and Consumer Services, 25, 106-114.

43
43
• Paulin, A. (2015). Twenty years after the hype: Is e-government doomed? – Findings from Slovenia. International Journal of Public Administration in the Digital Age, 2(2), pp: 1-22.
• Pieterson, W. (2009). Channel choice: Citizens’ channel behavior and public service channel strategy. Enschede: University of Twente.
• Pieterson, W., & Dijk, J. (2006). Governmental service channel positioning: history and strategies for the future. Electronic Government. Communication Proceedings of the Fifth International EGOV Conference 2006
• Pieterson, W., Ebbers, W., & Van Dijk, J. (2007). Personalization in the public sector: An inventory of organizational and user obstacles towards personalization of electronic services in the public sector. Government Information Quarterly, 24(1), 148-164.
• Pieterson, W., Ebbers, W. & Madsen, C. (2017). New Channels, New Possibilities: A Typology and Classification of Social Robots and Their Role in Multi-channel Public Service Delivery. In: M. Janssen et al. (Eds.): EGOV 2017, LNCS 10428, pp. 47-59.
• Rigby, D. (2011), The Future of Shopping. Harvard Business Review, 89 (12), 65-76.
• Reddick, C. G., & Anthopoulos, L. (2014). Interactions with e-government, new digital media, and traditional channel choices: Citizen-initiated factors. Transforming Government: People, Process and Policy, 8(3), 2014.
• Reddick, C. G., & Turner, M. (2012). Channel choice and public service delivery in Canada: Comparing e-government to traditional service delivery. Government Information Quarterly, 29(1), 1-11
• Reis, J., Amorim, M., & Melão, N. (2015, February). Disclosing paths for multi-channel service research: A contemporaneous phenomenon and guidelines for future investigations. In International Conference on Exploring Services Science (pp. 289-300). Springer, Cham.
• Verhoef, P. C., Kannan, P. K., & Inman, J. J. (2015). From multi-channel retailing to omni-channel retailing: introduction to the special issue on multi-channel retailing. Journal of retailing, 91(2), 174-181.
• Wijnhoven, M. A., & Havinga, H. (2014). The Work Profiler: A digital instrument for selection and diagnosis of the unemployed. Local Economy, 29(6-7), 740-749.
• Wirtz, B. W., & Langer, P. F. (2016). Public Multichannel Management–an Integrated Framework of Off-and Online Multichannel Government Services. Public Organization Review, 1-18.
• Worldpay (2015). The Store of the Future and the Role of Omni-Channel Payments in Driving Business Growth. London: Worldpay.
• Zhang, J., Farris, P. W., Irvin, J. W., Kushwaha, T., Steenburgh, T. J., & Weitz, B. A. (2010). Crafting integrated multichannel retailing strategies. Journal of Interactive Marketing, 24(2), 168-180.
• Zillien N & Hargittai E (2009) Digital distinction: status-specific Internet uses. Social Science Quarterly 90(2): 274-291.

44
44
APPENDICES
Appendix 1: Household internet access EU-28 (+ NO)
Household internet access (EU-28 + NO)
Figure 14. Internet use: Percentage of households with internet access, average of all EU (28) member states + Norway (Icelandic data not completely available). Percentages are for 2016. Source: Eurostat (2017).
2014 2015 2016201320120
10
20
30
40
50
60
70
80
0 % 20 % 40 % 60 % 80 % 100 %
EU28BEBUCZDKDEEEIR
GRESFRHRIT
CYLVLTLUHUMTNLATPLPTROSLSKFI
SEUKNOIS
● 2012● 2014● 2016

45
45
Appendix 2: Internet use in the EU
Submitting completed online forms to government (EU-28)
2012 2013 2014 2015 2016
34 %32 %33 %27 %29 %
Figure 15. Internet use: submitting completed forms (last 12 months) to government, as a percentage of individuals who used internet within the last year, average of all EU (28) Member States. Source: Eurostat.
Submitting completed online forms to government | leaders & laggards
Figure 16. Internet use: submitting completed forms (last 12 months) to government 2012-16, as a percentage of individuals who
used internet within the last year. Top three countries with highest and lowest levels of usage in 2016. Source: Eurostat (2017).
2011
17 %
2013
17 %
2015
17 %
2010
15 %
2009
2014 2015 2016
15 %
2008
2013
13 %
2007
2012
12 %
0 %
10 %
20 %
30 %
40 %
50 %
60 %
70 %
80 %
90 %
100 %
● Estonia● Denmark● Finland● EU28 + IS, NO● Czech Republic● Bulgaria● Romania

46
46
Appendix 3: Channel choice studies in different countries
Channel choice in rushed and non-rushed situations (NL)
Figure 17. Channel choices for ‘simple’ and ‘complex’ tasks in the Netherlands in 2008 and 2017. Source: Ebbers & Pieterson (2017).
Channel choice for doing transactions (ES)
● In person 5 %● Telephone 55 % ● Website 24 % ● E-mail 11 % ● Other 4 %
● In person 13 %● Telephone 67 % ● Website 12 % ● E-mail 7 % ● Other 1 %
● In person 3 %● Telephone 15 % ● Website 33 % ● E-mail 42 % ● Other 7 %
● In person 7 %● Telephone 24 % ● Website 28 % ● E-mail 27 % ● Other 15 %
No rush (not urgent) Rush (urgent)
2008 2017 2008 2017
If you had to carry out a procedure with the Administration and could choose, howe would you prefer the contact to be?
2006 2007 2008 2010 2012 2013
In person 72.6 72.2 72.8 72.9 71.3 71.4
By phone 10.9 12.4 10.2 10.5 7.0 7.4
By letter or fax 1.0 0.9 0.7 0.2 0.2 0.4
By internet 12.8 12.9 14.8 14.7 16.7 17.3
By email n.d. n.d. n.d. n.d. 2.5 2.3
Figure 18. Channel choices for completing procedures in Spain (based on Rey-Moreno and Medina-Molina, 2016).Sources: CIS (2006, 2007, 2008, 2010, 2012, 2013).

47
47
1. Understand user needs Understand user needs. Research to develop a deep knowledge of who the service users are and what that means for the design of the service.
2. Do ongoing user research Put a plan in place for ongoing user research and usability testing to continuously seek feedback from users to improve the service.
3. Have a multidisciplinary team Put in place a sustainable multidisciplinary team that can design, build, and operate the service, led by a suitably skilled and senior service manager with decision-making responsibility.
4. Use agile methods Build your service using the agile, iterative, and user-centred methods set out in the manual.
5. Iterate and improve frequently Build a service that can be iterated and improved on a frequent basis and make sure that you have the capacity, resources, and technical flexibility to do so.
6. Evaluate tools and systems Evaluate what tools and systems will be used to build, host, operate, and measure the service, and how to procure them.
7. Understand security and privacy issues Evaluate what user data and information the digital service will be providing or storing and address the security level, legal responsibilities, privacy issues, and risks associated with the service (consulting with experts where appropriate).
8. Make all new source code open Make all new source code open and reusable, and publish it under appropriate licences (or provide a convincing explanation as to why this can’t be done for specific subsets of the source code).
9. Use open standards and common platforms Use open standards and common government platforms where available, including GOV.UK. Verify as an option for identity assurance.
10. Test the end-to-end service Be able to test the end-to-end service in an environment identical to that of the live version, including on all common browsers and devices, and using dummy accounts and a representative sample of users.
11. Make a plan for being offline Make a plan for the event of the digital service being taken temporarily offline.
12. Make sure users succeed first time Create a service which is simple to use and intuitive enough that users succeed the first time.
13. Make the user experience consistent with GOV.UK Build a service consistent with the user experience of the rest of GOV.UK, including using the design patterns and style guide.
14. Encourage everyone to use the digital service Encourage all users to use the digital service (with assisted digital support if required) alongside an appropriate plan to phase out non-digital channels and services.
15. Collect performance data Use tools for analysis that collect performance data. Use this data to analyse the success of the service and to translate this into features and tasks for the next phase of development.
16. Identify performance indicators Identify performance indicators for the service, including the 4 mandatory key performance indicators (KPIs) defined in the manual. Establish a benchmark for each metric and make a plan to enable improvements.
17. Report performance data on the Performance Platform. Why you should report data and how you’ll be assessed.
18. Test with the minister Test the service from beginning to end with the minister responsible for it. (https://www.gov.uk/service-manual)
Appendix 4: UK Digital Service Standard

48
48
Appendix 5: Participating PES
The following PES have completed the survey sent to the in the summer of 2017 (some partially).
Country code/ abbreviation
Country/ Name
AT Austria
BE-Brussels Belgium/Actiris
BE-Wallonia Belgium/Le Forem
BE-Flanders Belgium/VDAB
HR Croatia
CY Cyprus
CZ Czech Republic
DK Denmark
EE Estonia
FI Finland
FR France
DE Germany
HU Hungary
IS Iceland
LV Latvia
LT Lithuania
NL The Netherlands
PL Poland
PT Portugal
SK Slovakia
SI Slovenia
ES Spain
SE Sweden

HOW TO OBTAIN EU PUBLICATIONS
Free publications:• one copy:
via EU Bookshop (http://bookshop.europa.eu)• more than one copy or posters/maps:
from the European Union’s representations (http://ec.europa.eu/represent_en.htm); from the delegations in non-EU countries (http://eeas.europa.eu/delegations/index_en.htm); by contacting the Europe Direct service (http://europa.eu/europedirect/index_en.htm) orcalling 00 800 6 7 8 9 10 11 (freephone number from anywhere in the EU) (*).
(*) The information given is free, as are most calls (though some operators, phone boxes or hotels may charge you).
Priced publications:• via EU Bookshop (http://bookshop.europa.eu).

KE-06-17-415-EN-N