Msc Thesis Originality Test Report - AAU Institutional Repository
98
-
Upload
khangminh22 -
Category
Documents
-
view
0 -
download
0
Transcript of Msc Thesis Originality Test Report - AAU Institutional Repository


To My Father
MSc. Thesis, 2017 I AAU, School of Earth Sciences
Msc Thesis Originality Test Report
Msc Thesis Originality Test Report
School of the Earth Sciences
Addis Ababa University
Name of
Student Beza Gebremelak
ID.No. GSR/0447/08
Stream Geological Engineering(Engineering Geology)
Thesis Title Reliability of Standard Penetration Test to Determine Bearing Capacity
of Fine Grained Soil: A Case Study in Addis Ababa Soils.
Online site used
for originality
used
http.//www.paperrater.com/plagiarisim_checker
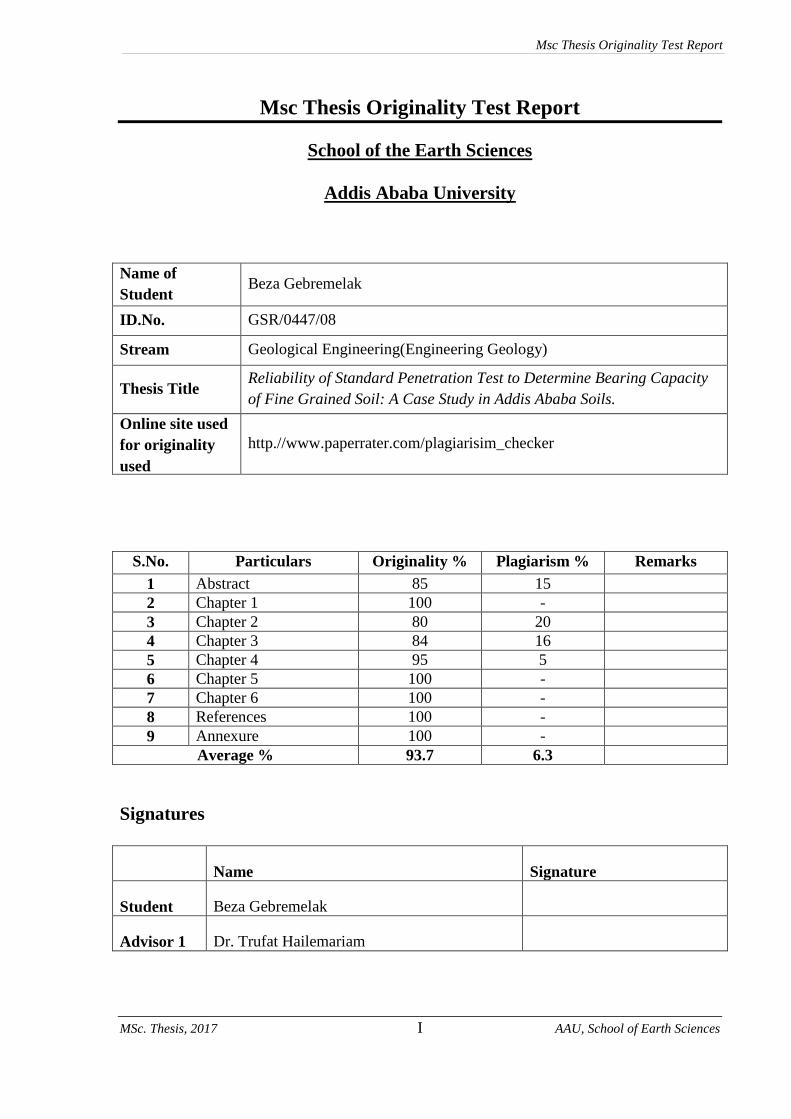
S.No. Particulars Originality % Plagiarism % Remarks
1 Abstract 85 15
2 Chapter 1 100 -
3 Chapter 2 80 20
4 Chapter 3 84 16
5 Chapter 4 95 5
6 Chapter 5 100 -
7 Chapter 6 100 -
8 References 100 -
9 Annexure 100 -
Average % 93.7 6.3
Signatures
Name Signature
Student Beza Gebremelak
Advisor 1 Dr. Trufat Hailemariam

MSc. Thesis, 2017 II AAU, School of Earth Sciences
Signature Page
Signature Page
Addis Ababa University
School of Graduate Studies
This is to certify that the thesis prepared by Beza Gebremelak, entitled: Reliability of
Standard Penetration Test to Determine Bearing Capacity of Fine Grained Soil: A Case
Study in Addis Ababa Soils and submitted in partial fulfillment of the requirements for the
Degree of Master of Science (Engineering Geology) complies with the regulations of the
University and meets the accepted standards with respect to originality and quality.
Signed by the Examining Committee:
Examiner _______________________ Signature ______________ Date _______________
Examiner _______________________ Signature ______________ Date _______________
Advisor _________________________Signature ______________ Date _______________
________________________________________ ______________________
Chair of School or Graduate Program Coordinator Date
MSc. Thesis, 2017 III AAU, School of Earth Sciences
Abstract
Abstract
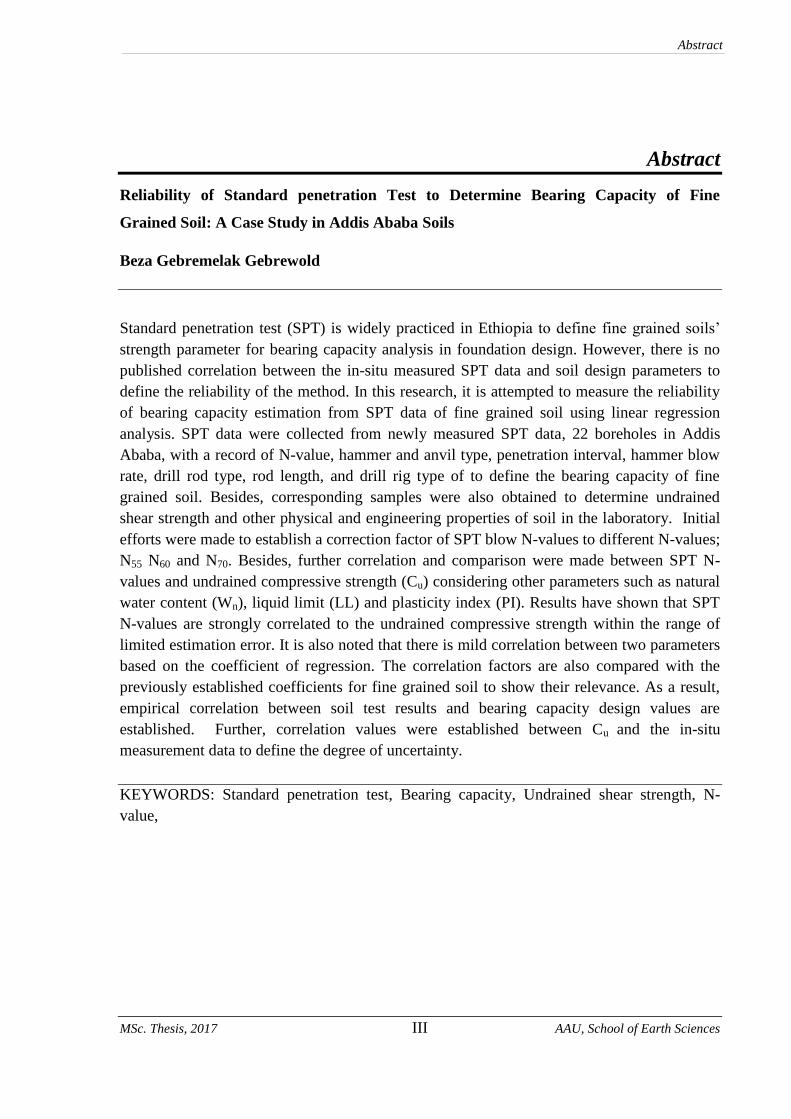
Reliability of Standard penetration Test to Determine Bearing Capacity of Fine
Grained Soil: A Case Study in Addis Ababa Soils
Beza Gebremelak Gebrewold
Standard penetration test (SPT) is widely practiced in Ethiopia to define fine grained soils’
strength parameter for bearing capacity analysis in foundation design. However, there is no
published correlation between the in-situ measured SPT data and soil design parameters to
define the reliability of the method. In this research, it is attempted to measure the reliability
of bearing capacity estimation from SPT data of fine grained soil using linear regression
analysis. SPT data were collected from newly measured SPT data, 22 boreholes in Addis
Ababa, with a record of N-value, hammer and anvil type, penetration interval, hammer blow
rate, drill rod type, rod length, and drill rig type of to define the bearing capacity of fine
grained soil. Besides, corresponding samples were also obtained to determine undrained
shear strength and other physical and engineering properties of soil in the laboratory. Initial
efforts were made to establish a correction factor of SPT blow N-values to different N-values;
N55 N60 and N70. Besides, further correlation and comparison were made between SPT N-
values and undrained compressive strength (Cu) considering other parameters such as natural
water content (Wn), liquid limit (LL) and plasticity index (PI). Results have shown that SPT
N-values are strongly correlated to the undrained compressive strength within the range of
limited estimation error. It is also noted that there is mild correlation between two parameters
based on the coefficient of regression. The correlation factors are also compared with the
previously established coefficients for fine grained soil to show their relevance. As a result,
empirical correlation between soil test results and bearing capacity design values are
established. Further, correlation values were established between Cu and the in-situ
measurement data to define the degree of uncertainty.
KEYWORDS: Standard penetration test, Bearing capacity, Undrained shear strength, N-
value,
MSc. Thesis, 2017 IV AAU, School of Earth Sciences
Acknowledgements
Acknowledgements
I would like to express the deepest appreciation to my advisor, Dr. Trufat Hailemariam, for
his guidance, encouragement and patience throughout the research work. He is definitely the
best advisor. I am really very grateful to him for having complete faith in me and guiding me
through this path to success. Without his enthusiasm, motivation and support this research
would not have been possible.
Besides my advisor, I would also like to thank Dr. Tarun Kumar Raghuvanshi for his
valuable advice. I would like to give my sincere thanks to Best Consulting Engineers plc and
Core consulting Engineers plc to collect the data and allowed their laboratory to conduct the
test and all geotechnical engineering staffs, Timbit zekarias, Abeselom, Biruk, Esikindir,
drilling crews and laboratory technicians for their unlimited support.
I would like to present the most heartfelt acknowledgements to my beloved husband, Betselot
Yinesu for unceasing love, encouragement, support and patience, my mother, Shibre
Demdme, my aunt, Aklil Gebrewold, I am highly indebted to them for their encouragement,
support, caring and understanding in all my endeavors.
Lastly, I appreciates the unforgettable help from the Engineering geology graduate students
Daneil Hailemicheal, Medhanit Akalu and Selam Tesfaye will always be remembered for the
exchange of knowledge and the valuable discussions on daily events.
*****
MSc. Thesis, 2017 V AAU, School of Earth Sciences
TABLE OF CONTENTS
TABLE OF CONTENTS
Msc Thesis Originality Test Report ............................................................................................I
Signature Page .......................................................................................................................... II
Abstract .................................................................................................................................... III
Acknowledgements .................................................................................................................. IV
Table of Contents ...................................................................................................................... V
List of Figure......................................................................................................................... VIII
List of Plate .............................................................................................................................. IX
List of Table .............................................................................................................................. X
Chapter 1 Introduction ...................................................................................................... 1
1.1 General ........................................................................................................................... 1
1.2 Problem Statement ......................................................................................................... 2
1.3 SPT Practice in Ethiopia ................................................................................................ 3
1.4 Objectives ...................................................................................................................... 4
1.4.1 General Objectives ................................................................................................. 4
1.4.2 Specific Objectives ................................................................................................ 4
1.5 Methodology .................................................................................................................. 4
1.6 Significance of the Study ............................................................................................... 6
1.7 Scope and Limitations of the study ................................................................................ 6
1.8 Scheme of Presentation .................................................................................................. 7
Chapter 2 Literature Review ............................................................................................ 8
2.1 Introduction .................................................................................................................... 8
2.2 History and Definition of Standard Penetration Test ..................................................... 8
2.3 Standard Penetration Test Practice ................................................................................ 9
2.3.1 National standards and test procedures .................................................................. 9
2.3.2 Corrections applied for SPT N-Values ................................................................ 11
2.3.3 SPT limitations..................................................................................................... 13
2.4 Standard Penetration Test and Fine Grained Soils ...................................................... 15
2.5 Correlation with Undrained Shear Strength ................................................................. 17
2.6 Previous Works ............................................................................................................ 18
2.7 Evolution of Methodology for the Present Study ........................................................ 19

MSc. Thesis, 2017 VI AAU, School of Earth Sciences
TABLE OF CONTENTS
Chapter 3 Description of the Study Area ....................................................................... 21
3.1 Introduction .................................................................................................................. 21
3.2 Location of the Study Area .......................................................................................... 21
3.3 Topography and Drainage ............................................................................................ 21
3.4 Climate ......................................................................................................................... 23
3.4.1 Rainfall ................................................................................................................. 24
3.4.2 Temperature ......................................................................................................... 25
3.5 Hydrogeology .............................................................................................................. 26
3.6 Seismicity ..................................................................................................................... 27
3.7 Regional Geology and Tectonics ................................................................................. 28
3.8 Geology of Addis Ababa ............................................................................................. 29
3.8.1 Addis Ababa basalt .............................................................................................. 29
3.8.2 Addis Ababa ignimbrite ....................................................................................... 30
3.8.3 Central volcanoes unit.......................................................................................... 30
3.8.4 Akaki unit............................................................................................................. 30
3.9 Soils in the Study Area ................................................................................................ 32
3.10 Fine Grained Soils in the Study Area .......................................................................... 34
Chapter 4 SPT Measurement Details And Laboratory Analysis ................................ 36
4.1 Introduction .................................................................................................................. 36
4.2 SPT Equipment Details ................................................................................................ 37
4.2.1 SPT hammer system ............................................................................................ 37
4.2.2 Split spoon sampler .............................................................................................. 43
4.3 SPT Procedure ............................................................................................................. 44
4.4 Standardization of SPT N-values ................................................................................. 46
4.5 Laboratory and Field Test Analysis ............................................................................. 51
4.6 Overall SPT Measurement Results .............................................................................. 53
Chapter 5 Analysis and Interpretation .......................................................................... 58
5.1 General ......................................................................................................................... 58
5.2 Depth Distribution of SPT N-value ............................................................................. 59
5.3 SPT N-values with Atterberg Limit and Moisture Content ......................................... 59
5.4 SPT N-value and Undrained Shear Strength Correlation ............................................ 61
5.5 Data Analysis ............................................................................................................... 63
MSc. Thesis, 2017 VII AAU, School of Earth Sciences
TABLE OF CONTENTS
5.6 Comparison .................................................................................................................. 66
5.6.1 Comparison with predicted Cu with measured Cu value ...................................... 66
5.6.2 Comparison with Existing Correlation ................................................................ 68
5.7 Comparison with SPT Method and Bearing Capacity ................................................. 72
5.7.1 Bearing capacity based on SPT ............................................................................ 72
5.7.2 Bearing Capacity based on UCS .......................................................................... 74
5.8 Final Remark ................................................................................................................ 76
Chapter 6 Conclusion and Recommendations .............................................................. 77
6.1 Conclusion ................................................................................................................... 77
6.2 Recommendations and Future Work ........................................................................... 79
REFERENCES ....................................................................................................................... 81
Annexes……………………………………...…………………………...………………… .86
MSc. Thesis, 2017 VIII AAU, School of Earth Sciences
List of Figure
List of Figure
Fig. 2.1 ASTM, Split spoon sampler ....................................................................................... 10
Fig. 2.2 SPT Procedure as per ASTM D1586 .......................................................................... 10
Fig. 3.1 Engineering Geological map of Addis Ababa (Kebede Tsehayu & Tadesse H.
Mariam, 1990).................................................................................................................. 33
Fig. 4.1 Test point location ...................................................................................................... 37
Fig. 4.2 SPT N-values distribution with depth ........................................................................ 54
Fig. 4.3 SPT N-values with depth in silty clay soils ................................................................ 55
Fig. 4.4 SPT N-values with depth in clayey silt soils .............................................................. 55
Fig. 5.1 Relation between N-values with Atterberg limits and moisture content .................... 60
Fig. 5.2 Field N-value versus undrained shear strength ........................................................... 61
Fig. 5.3 Corrected SPT number versus undrained shear strength ............................................ 62
Fig. 5.4 N-values versus undrained shear strength .................................................................. 63
Fig. 5.5 Undrained shear strength versus PI, LL, PL& Wn ..................................................... 65
Fig. 5.6 Comparison of Predicted Cu from field N-value vs measured Cu from Nf ................. 66
Fig. 5.7 Comparison of predicted Cu with measured Cu from N70 ........................................... 67
Fig. 5.8 Existing and proposed Cu equation ............................................................................. 68
Fig. 5.9 Measured versus predicted Cu for present and previous proposed correlations ......... 71

MSc. Thesis, 2017 IX AAU, School of Earth Sciences
List of Plate
List of Plate
Plate 3.1 Red clay soil (Gulele area) ........................................................................................ 34
Plate 3.2 Dark Clay soil around (Akaki area) .......................................................................... 35
Plate 3.3 Red silt soil (Lamberet area) ..................................................................................... 35
Plate 4.1 Drilling rigs with SPT hammers ............................................................................... 39
Plate 4.2 (a) & (c) Standard split spoon sampler, (b) & (d) Split spoon sampler used in this
study ................................................................................................................................. 43
Plate 4.3 (a) Deformed driving shoe, (b) New driving shoe .................................................... 44
Plate 4.4 SPT test procedures: (a) drilled at target depth (b) assembled SPT Equipment (c) put
.......................................................................................................................................... 45
MSc. Thesis, 2017 X AAU, School of Earth Sciences
List of Table
List of Table
Table 2.1 Suggestions for the value of the standard energy ratio Erb (Bowels, 1997) ............. 12
Table 2.2 Summary of correction factors by different author (Aggour and Radding, 2001) .. 13
Table 2.3. Common source of errors while carrying out SPT tests Kulhawy and Mayne,
1990). ............................................................................................................................... 14
Table 2.4 Summarized empirical correlation of Cu versus N-values suggested by different
researcher (fine grain soils) .............................................................................................. 18
Table 3.1 Mean annual and monthly rainfall data of Addis Ababa (1900 to 2004) ................ 25
Table 3.2 Temperature variation in Addis Ababa .................................................................... 26
Table 4.1 Drilling rigs and hammer tested............................................................................... 40
Table 4.2 SPT N-values with the corresponding depth of different hammer type .................. 40
Table 4.3 SPT field correction factors (Bowles, 1997) ........................................................... 48
Table 4.4 Anvil and blow rate correction (Seed (1984) per McGregor and Duncan (1998)). . 48
Table 4.5 Adjusted measured SPT N-values ........................................................................... 50
Table 4.6 Geotechnical properties of collected soils ............................................................... 52
Table 4.7 Consistency of fine grain soil .................................................................................. 52
Table 4.8 Summarized geotechnical properties of studied soil ............................................... 54
Table 5.1 The values of correlation coefficient (Taylor, 1990) ............................................... 59
Table 5.2 Summary Output regression analysis ...................................................................... 63
Table 5.3 Summary Output regression analysis ...................................................................... 64
Table 5.4 Existing empirical equations estimating Cu of fine grain soils ................................ 68
Table 5.5 Allowable Bearing Capacity Based on SPT ............................................................ 73
Table 5.6 Allowable Bearing Capacity Based on UCS ........................................................... 75
Table 5.7 Bearing capacity comparison between SPT and UCS ............................................. 76

MSc. Thesis, 2017 1 AAU, School of Earth Sciences
INTRODUCTION
CHAPTER 1 INTRODUCTION
1.1 General
Geotechnical investigation provide sufficient information regarding far site suitability, design
criteria, and possible construction problems. Both laboratory and in-situ (field) testing are
routinely used to obtain information about engineering properties of soils and rocks. During
the field exploration phase, in the case of laboratory testing is not conducted, field test will be
needed to determine the soil strength parameters. One of the most common field test that is
used in geotechnical investigation is standard penetration test (SPT) (Bowles, 1997).
Standard penetration test is the most common in-situ test method that widely used in ground
investigation. It can provide much of the information required during a site investigation as
compared to other field techniques because of its simplicity, quick estimation and relatively
inexpensiveness. It is conducted in the vertical direction at the bottom of borehole using the
drilling rig and its accessories made up of split-spoon sampler, hammer, and drill rods. This
test provide a measurement of the resistance of the soil, interms of hammer blow counts (N-
value). The N-values are used to estimate the consistency, strengh and in some cases, the
compressibilty of the soil (Clayton, 1995).
The purpose of SPT is determine the resistance of soil to the penetration of the standard-size
sampler. Its done to characterize the shear strength of soil by counting the number of hammer
blows that are required to penetrate a given depth. SPT mainly involves in determining soil
properties as well as estimating the bearing capacity of soils. The technique is suitable for
most soil types except gravel and is usually performed using a conventional geotechnical
drill rig (Aggour and Radding, 2001). It can estimate the relative density and compressibility
for granular soils, since it is originally developed for coarse-grained soils; but these days, it
has been also widely applied for fine-grained soils in estimating the unconfined compressive
strength (qu), undrained shear strength (Cu), and coefficient of volume compressibility (mv) in
Sirvikaya et al., (2009, cited in Frazad and Behzad, 2011).
Since SPT is highly dependent upon the equipment and operator performing the test, it is
often susceptible for errors. Numerous authors have researched on the accuracy and validity
of SPT for many years. Most of them have learned the test need a standard or correction on

MSc. Thesis, 2017 2 AAU, School of Earth Sciences
INTRODUCTION
the basic things; includes hammer efficiency, split spoon sampler design, length of drill rod,
diameter of borehole and over burden pressure. (Bowles, 1997).
Although questions have been rased on the consistency of standard penetration test method
applying in fine grained soils but still it is widely used in the world including Ethiopia.
Efforts are always made in order to minimize or avoid uncertainties by dealing with possible
source of errors and correlating values with soil strength parameters in order to get a better
result.
1.2 Problem Statement
Now a days Ethiopia, particularly Addis Ababa is undergoing a transformation in the
construction industry. In order to strengthen its infrastructure and supply affordable housing
and power to its population a proper geotechnical investigation should be practiced for safe
and long lasting engineering structures. However, in many constructions a standard
construction procedure has not been practiced even if the government declared a construction
law. One of the vital work in building construction is foundation investigation and it is not
getting the necessary attention it needed. Determination of bearing capacity of a particular
building is one of the major task in foundation investigation. Due to lack of understanding
and for the sake of money saving most contractors are carelessly practiced foundation
investigation and some of them are not experienced at all.
The SPT method has been widely practiced in Ethiopia, due to its cost effectiveness and
quick estimation. In fact, this test is conventionally measured using different kinds of
hammers, drill rigs, energy delivery systems with different degrees of efficiency, drill rod
lengths, hammer blow rates, borehole fluids, and sampling tubes. Thus this can affect the test
result. On the other hand, the SPT N-value may vary significantly with seasonal fluctuations
in the water table of cohesive soil (Aggour and Radding, 2001). Therefore, the values may
fall short of providing information on the characteristics of the fine grain soil, mainly its
strength. Consequently, this getting rise an question around the ability of the test to consistant
result.
This is also the problem in Addis Ababa. Several geotechnical firms used SPT method for
estimating bearing capacity despite the question of reliability and compatibility for fine
grained soil. In this study, it is planned to define the degree of reliability of SPT method in
estimating the bearing capacity of fine grained soil. It is basically intended to correlate the
MSc. Thesis, 2017 3 AAU, School of Earth Sciences
INTRODUCTION
SPT results with its undrained shear strengh and identify the main source of errors during
testing data analysis and interpretations as well as to evaluate any related uncertainties.
1.3 SPT Practice in Ethiopia
Internationally, standard penetration test has significant differences between the drilling
techniques, SPT equipment and test procedures. The major influences on the result of SPT
are method of drilling, hammer mechanism, borehole fluid, borehole diameter, rod stiffness,
split-spoon geometry and method of testing (Clayton, 1995).
In Ethiopia currently several geotechnical firms outshine related with the rise of construction
in the country. Majority of the contractor’s interest to make geotechnical investigation for
safe and economical foundation design. This investigation provided the ultimate bearing
capacity and tolerable limit of settlement of the foundation material (soil / rock). Both
analytical and emiperical (semi emiperical) methods are widely used for the determination of
bearing capacity. Most geotechnical engineers in ethiopia have been prefer standard
penetration test since it is simple and quick estimation for foundation design. Meyerhoff SPT
equation is used for bearing capacity calculation with 25mm settlement. SPT N-value is
standardazed by applying different correction factors (hammer, sampler, borehole, rod and
depth correction). According to previous suggustion the SPT N-values to be standardized to
N55, N60 and N70 (Aggour and Radding, 2001). Most companies have been applied N55 and
N70. for the ajustment of SPT depending on the SPT equipment and drilling rigs.
As stated in Ethiopian building code standards (EBCS-7, 1995), during conducting SPT test
some features shall be considered. This includes lifting method, shoe, mass of the falling
weight, the drop height, the diameter of the casing and the rods, groundwater condition, the
nature of the ground. The test is conducted with different drilling rig types, hammer types
(donut, safety and automatic hammer), drilling system, and hammer lifting mechanism
(cathead and automatic release system).
Ethiopia hasn’t establish its own SPT standard and as a result companies are adopting
different standards from other country practice. The standards widely applied in Ethiopia are
American standard (ASTM D1586: 2008) and Britain standard (BS 1377: 1975). Applying
other’s country SPT standards which have different soil types, climate and hydrogeology
leads to untrustworthy result. In order to reduce the significant variability of the SPT N-value

MSc. Thesis, 2017 4 AAU, School of Earth Sciences
INTRODUCTION
due to the large variation in energy delivered and other factors, it has been recommended that
the N-value be standardized to a specific value through the use of correction factors.
1.4 Objectives
1.4.1 General Objectives
The general objective of this research work is assessing the reliability of standard penetration
test to estimating bearing capacity of fine grained soil.
1.4.2 Specific Objectives
Describe the engineering properties of the fine grained soils
Identify the possible source of errors during conducting the test.
Standardization of SPT N-values by applying different correction factor.
Correlate SPT N-value with undrained shear strength.
Correlate SPT N-value with PI, PL, LL and Wn
Proposed empirical equations.
Compare predicated undrained shear strength with measured undrained shear strength of
fine grain soil values.
Compare with previous correlation.
Recommend important measures that to be taken minimize the errors in SPT data
collection.
1.5 Methodology
The objectives of the study were accomplished following an appropriate and systematically
organized work. The research work was started on literature review followed by field work
which includes in-situ testing, and sample collection. Prior to make an interpretation and
result analysis a detail laboratory work had been done.
In order to effectively and systematically accomplish the research’s objectives the following
detail methodology were adopted.
In the desk study the following work were undertaken
Literatures were reviewed that related to the research topic including journals, books,
published and unpublished technical papers.

MSc. Thesis, 2017 5 AAU, School of Earth Sciences
INTRODUCTION
Different types of maps have been reproduced and georeferenced in ArcGIS project for
this research work. Some of the maps are geological map, engineering geological maps
and city maps of the study area.
Developed the geo-database in microsoft access and excel that got from field work.
The primary tasks were done in the field includes, recording N-values of SPT, geotechnical
logging, taking disturbed and undisturbed samples for laboratory testing on active sites in
Addis Ababa. Standard penetration tests were conducted at 15 cm interval and the split-barrel
sampler was penetrated 45cm in to the soil at the bottom of the bore hole and recorded only
the last count (30 cm) to obtain the N-value.
Along with sample collection, the major source of errors have been identified while
conducting SPT. The test was executed using different rig types with two SPT hammer types;
donut and automatic hammer. The samples were collected from different sites of Addis
Ababa to conduct the following tests in the laboratory;
Liquid limit
Plastic limit
Grain size analysis
Natural moisture content
Unit weight and
Unconfined compressive strength test
Once the results of in-situ and laboratory testing are completed:
The soil engineering properties are defined by comparing and relating different
parameters.
Characterization of the soil by integrating the results obtained from geotechnical field
investigations and laboratory result analysis.
Interpretation of the results of the tests and the classification in parallel to determine, the
index properties of the soil by correlating in-situ N-values and unconfined compressive
strength or undrained shear strength derive from qu.
Comparing with previous correlation.

MSc. Thesis, 2017 6 AAU, School of Earth Sciences
INTRODUCTION
1.6 Significance of the Study
This research work was conducted to define examine the capability and consistency of
standard penetration test for fine grain soils and to identify the major source of errors in SPT.
The findings of the research will provide information for foundation designers to ensure
about SPT method that give representative result or not in determining bearing capacity.
Simultaneously it is tried to answer the question that arising around its reliability SPT
method for estimating bearing capacity of fine grain soil. Thus this study will contribute in
the efforts to develop a guide line for SPT data collection and estimation of bearing capacity
of soil.
1.7 Scope and Limitations of the study
To study the reliability of SPT test in determination of bearing capacity of fine grain soil,
many SPT measurements at different depth were carried out. Many samples were collected to
determine experimentally the properties of soil. There are different parameters were taken
into consideration such as SPT number (N-value), undrained shear strength parameters (Cu),
liquid limit (LL), plastic limit (PL), plasticity index (PI) and moisture content (Wn). In this
study, the relationships between SPT N-values and undrained shear strength have been
discussed to make sure that the reliability of the SPT result.
Since there is a shortage of financial support it is difficult to conduct drilling operation solely
for this project. Therefore, the only way to proceed the study is to cooperate with few
companies to collect data on their active drilling sites which are not well enough.
Consequently, it affected the study to deal with various source of errors which is related to
rig machines, sampler and SPT equipment. The study has also been limited to assessing the
consistency of standard penetration test of fine grain soils, limited samples, field test and
laboratory test and the tests were conducted on limited number of drilling rig type and SPT
equipment.
Consequently further research is required to assess the consistency in-terms of hammer
efficiency including different SPT tools and drilling rig type and also the fine grain soils
collaborate with other compressive strength test, investigating with a large scale.
MSc. Thesis, 2017 7 AAU, School of Earth Sciences
INTRODUCTION
1.8 Scheme of Presentation
This research is composed of six chapters and the scheme of presentation is as follows:
Chapter 1 comprises the introduction to the research in general which basically is the
background, problem statement, objective and significance of the research, methodology,
application of the research and limitations and scope of research.
Chapter 2 presents the literature review. The literature review comprises a brief description
of previous works relevant to the present research it includes history and background SPT,
Standard penetration test practice, adjustment of measured SPT N-values, and SPT
limitation.
Chapter 3 is describing a brief description of the study area including geographical location,
climate, geology, physiographic and drainage conditions, soils, hydrogeology and
seismology of the research area.
Chapter 4 deals with the SPT measurement details and laboratory analysis. It consists, SPT
equipment, test procedure and standardization of field N-values.
Chapter 5 presents the data analysis and interpretation of the test results, correlation between
different parameters and comparison of the test results, and comparison with existing
correlation.
Chapter 6 presents the overall conclusions and recommendations that can be made out of the
present research work.
*****

MSc. Thesis, 2017 8 AAU, School of Earth Sciences
LITERATURE REVIEW
CHAPTER 2 LITERATURE REVIEW
2.1 Introduction
In this chapter, a brief literature review on standard penetration test has been presented. The
information which compiled here was selected to be directly related to the scope of this
particular study. More detailed information obtained from the literature on standard
penetration test can be found in detail in Construction Industry Research Information
Association (CIRIA) Report No.143, SPT Methods and Use 1995, which mainly describe
about the standard penetration test practice and influence of equipment and ground condition
on penetration resistance. Bowles also describes SPT test procedures and correction factors
in Foundation Analysis and Design presented in 1997. The other literature that reviewed is
Standard Penetration Test Correction presented by Aggour and Radding (2001), which
mainly describe about the correction factors that mainly applied in the adjustment of standard
penetration test.
2.2 History and Definition of Standard Penetration Test
Standard penetration test is an in-situ dynamic penetration test that measures the resistance of
the soil to penetration of the sampler. The SPT is a simple and rugged test suitable for most
soil types and is usually performed using a conventional geotechnical drill rig (Sabatini and
Bachus, 2002).
As stated in American Society for Testing Materials (ASTM D1586: 2008) manual, this
method performed from the base of borehole using split- spoon sampler which consists a
driving shoe, a split- barrel of circular cross-section and a coupling. SPT describes a
procedure for using a split-barrel sampler to obtain representative samples of soil for
identification purposes and other laboratory tests.
According to Aggour and Radding (2001), the earliest credits for the SPT are attributed to
Mohr and also to Terzaghi. The standard penetration test, developed around 1927, is
currently the most popular and economical means to obtain subsurface information (Bowles,
1997). The split soon sampler was first introduced by Harry Mohr (a subsidiary of the
Raymond concrete pile Co.) and the other by Sprague and Henwood. The sample tubes has a
2-in diameter and were driven into the bottom of the borehole by repeated blows of a weight

MSc. Thesis, 2017 9 AAU, School of Earth Sciences
LITERATURE REVIEW
lifted by two men by hand, without the use of any powdered winch equipment (Clayton,
1995).
The system to drive the SPT sampler into the soil, known as the drive-weight assembly,
basically consists of the hammer, hammer fall guide, anvil, and a hammer release system.
There are different types of hammers applied for the standard penetration test; safety and
donut hammer type, those also used different hammer lifting systems; the trip, automatic, or
semiautomatic system, where the hammer is lifted and allowed to drop unimpeded. The other
one is the cathead release system; it is a method of raising and dropping the hammer that uses
a rope slung through a center crown sleeve or pulley on the drill rig mast and turns on a
cathead to lift the hammer (Day, 2006).
2.3 Standard Penetration Test Practice
2.3.1 National standards and test procedures
The SPT has been used in almost every part of the word. The Standard penetration test was
first “standardized” by the American Society for Testing Materials in the USA in 1958 with
periodic revisions to date (Clayton, 1995). The method was further standardized with the
most recent update in 1999. The test introduce in to Britain standard (BS 1377) in 1975 as the
‘Determination of the penetration resistance using the split spoon sampler’.
Although many countries have their own standard, internationally ASTM standard is widely
used. According to ASTM (D1586), SPT is utilize using a split spoon sampler which has 51
mm external diameter, 35 mm inside diameter and 45 cm to 65 cm length (see Fig. 2.1). The
split spoon sampler is connected to a string of drill rods and is lowered in to the bottom of the
borehole which was drilled and cleaned in advance. As shown in Fig. 2.2 the drill rods
marked in three successive 15 cm increments so that the advance of the sampler under the
impact of the sliding hammer weighing 63.5 kg having a free fall length of 760 mm and
count the number of blows applied in each 150 mm. The first 150 mm so considered to be a
seating drive. The sum of the number of blows required for the second and third 150 mm
increment of penetration is used as N-value. The SPT commonly terminates when the
number of blows to drive any of the 150 mm segment exceeds 50 or when no more depth was
attained with 10 consecutive blows. The test procedure is repeated at every 1.5 m or at every
stratum change. At the end of each SPT operation, the sampler tube is removed and
disassembled to collect representative disturbed sample for further laboratory tests (Bowles,
1997).

MSc. Thesis, 2017 10 AAU, School of Earth Sciences
LITERATURE REVIEW
Fig. 2.1 ASTM, Split spoon sampler
Fig. 2.2 SPT Procedure as per ASTM D1586
MSc. Thesis, 2017 11 AAU, School of Earth Sciences
LITERATURE REVIEW
2.3.2 Corrections applied for SPT N-Values
The standard penetration test has been conducted conventionally using different kinds of
hammers, drill rig types, drill rod lengths and types, hammer blow rates, different energy
delivery systems with different degrees of efficiency, different borehole fluids, and different
kinds of sampling tubes (Aggour and Radding, 2001). In order to reduce the significant
variability associated with the SPT N-value, it was needed to adjust by applying different
correction factors.
Various correction factors that commonly applied to field N-values, these includes the energy
efficiency, split spoon configuration, borehole diameter, overburden pressure, rod length,
blow rate and anvil correction factors (Aggour and Radding, 2001), recognize that most
significant factor affecting the measured N-value as the amount of energy delivered to the
drill rods. They indicated that the energy delivered to the rods during an SPT test can vary
from about 30% to 80% of the theoretical maximum depending on the type of hammer
system used and made a summary of energy efficiencies as predicted by a number of
researchers, indicated that the energy transfer ratio for safety hammers with cathead and rope
hoisting mechanism can vary considerably. The range of reported values is from 30% to
96%. For automatic trip hammers, the range is smaller, with a low of 60% and a high of 90%.
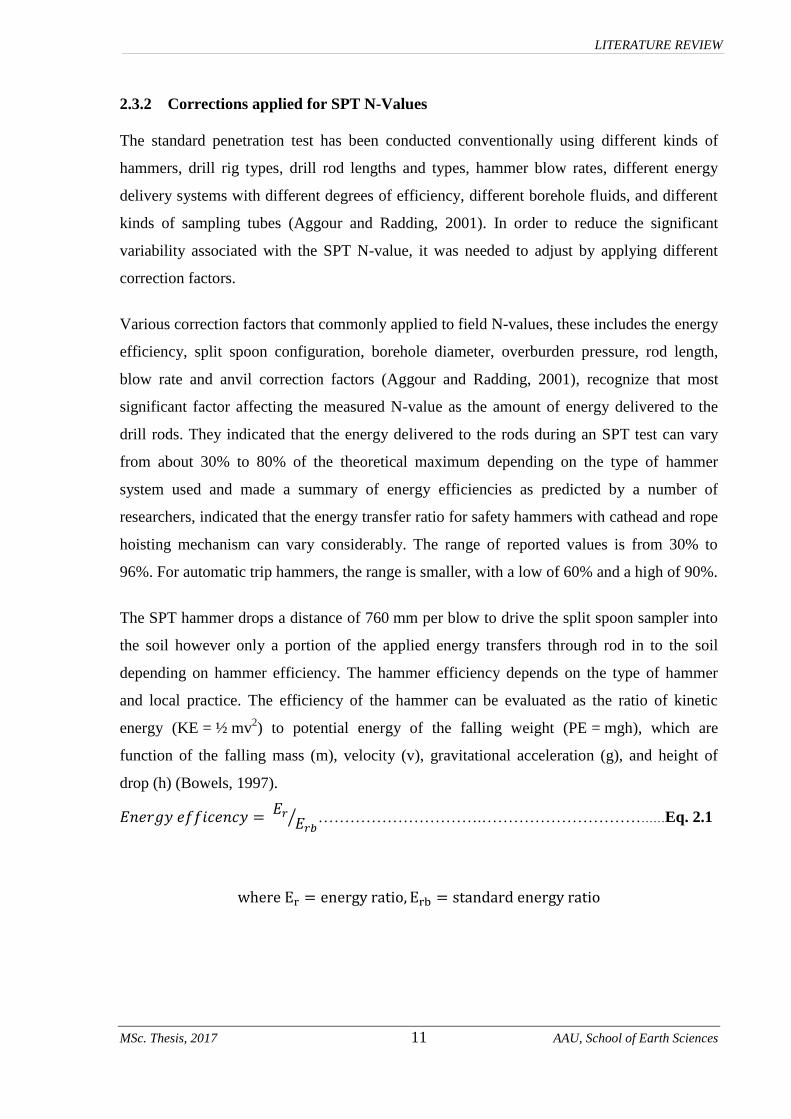
The SPT hammer drops a distance of 760 mm per blow to drive the split spoon sampler into
the soil however only a portion of the applied energy transfers through rod in to the soil
depending on hammer efficiency. The hammer efficiency depends on the type of hammer
and local practice. The efficiency of the hammer can be evaluated as the ratio of kinetic
energy (KE = ½ mv2) to potential energy of the falling weight (PE = mgh), which are
function of the falling mass (m), velocity (v), gravitational acceleration (g), and height of
drop (h) (Bowels, 1997).
⁄ ………………………….………………………………Eq. 2.1
MSc. Thesis, 2017 12 AAU, School of Earth Sciences
LITERATURE REVIEW
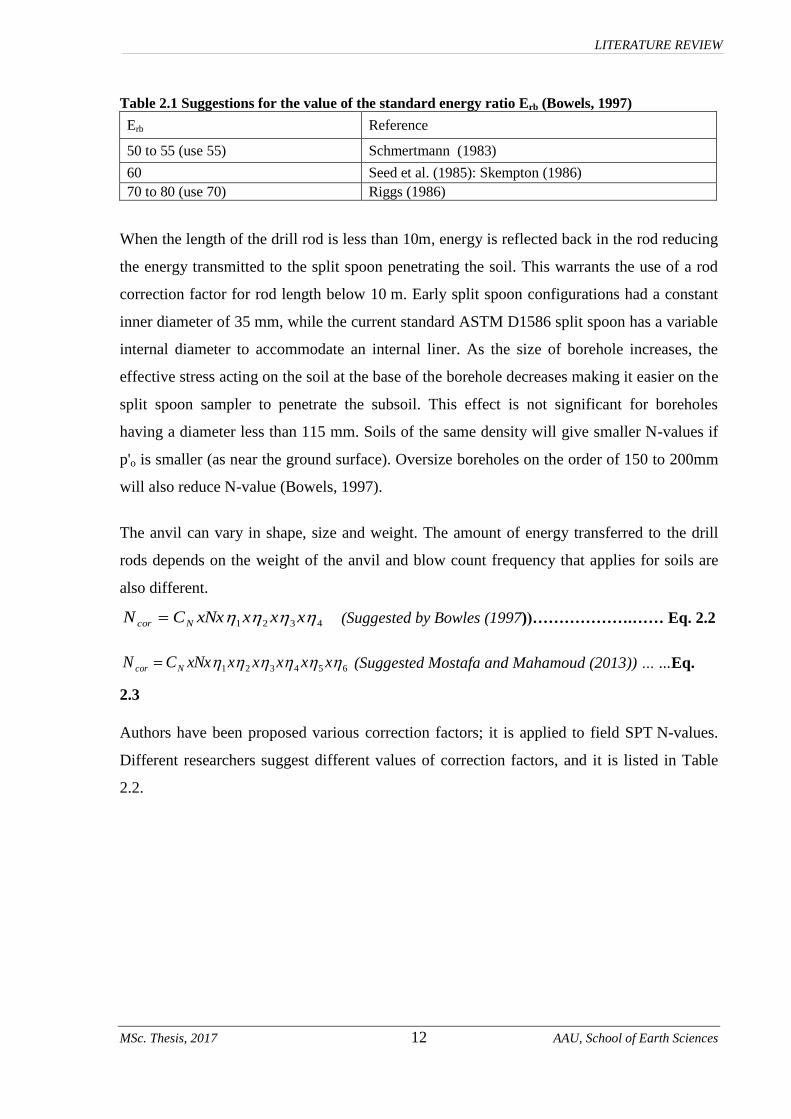
Table 2.1 Suggestions for the value of the standard energy ratio Erb (Bowels, 1997)
Erb Reference
50 to 55 (use 55) Schmertmann (1983)
60 Seed et al. (1985): Skempton (1986)
70 to 80 (use 70) Riggs (1986)
When the length of the drill rod is less than 10m, energy is reflected back in the rod reducing
the energy transmitted to the split spoon penetrating the soil. This warrants the use of a rod
correction factor for rod length below 10 m. Early split spoon configurations had a constant
inner diameter of 35 mm, while the current standard ASTM D1586 split spoon has a variable
internal diameter to accommodate an internal liner. As the size of borehole increases, the
effective stress acting on the soil at the base of the borehole decreases making it easier on the
split spoon sampler to penetrate the subsoil. This effect is not significant for boreholes
having a diameter less than 115 mm. Soils of the same density will give smaller N-values if
p'o is smaller (as near the ground surface). Oversize boreholes on the order of 150 to 200mm
will also reduce N-value (Bowels, 1997).
The anvil can vary in shape, size and weight. The amount of energy transferred to the drill
rods depends on the weight of the anvil and blow count frequency that applies for soils are
also different.
4321 xxxxNxCN Ncor (Suggested by Bowles (1997))……………….…… Eq. 2.2
654321 xxxxxxNxCN Ncor (Suggested Mostafa and Mahamoud (2013)) … ...Eq.
2.3
Authors have been proposed various correction factors; it is applied to field SPT N-values.
Different researchers suggest different values of correction factors, and it is listed in Table
2.2.

MSc. Thesis, 2017 13 AAU, School of Earth Sciences
LITERATURE REVIEW
Table 2.2 Summary of correction factors by different author (Aggour and Radding, 2001)
Seed (1984) per
McGregor and
Duncan (1998)
Robertson &
Wride (1997)
Bowles
(1997)
Skempton
(1986)
Hammer Type η1= Er/Era
Automatic
Pulley/Safety
Donut
1.67
1
0.75
0.8 –1.5
0.7 –1.2
0.5 –1.0
1.14 –1.43
1 –1.14
0.64 -
Rod Length Correction, η2
>30m
10-30m
6-10m
4 -6m
3-4m
0-3m
1
1
1
1
1
0.75
>1
1
0.95
0.85
0.75
-
1
1
0.95
0.85
0.75
0.75
1
1
0.95
0.85
0.75
0.75
Sampler Correction, η3
No liner
With liner: loose sand
With liner: dense
sand, clay
-
1.1-1.3
1
1
1
0.9
0.8
1.2
1
1
Borehole Diameter Correction, η4
Parameter
60-120mm
150mm
200mm
-
1
1.05
1.15
N4
1
1.05
1.15
1
1.05
1.15
Anvil correction η5
Small
Large
Safety
0.85
0.7
0.9
- -
0.7-0.8
0.6-0.7
0.7-0.8
Corrections for Blow Rate η6
>20
<20
10-20b/m - 0.95
10-20 b/m - 1.05 - - -
2.3.3 SPT limitations
The SPT should not be relied on in soils containing coarse gravel, cobbles, or boulders,
because the sampler can become obstructed, resulting in high N-values. The test should not
be relied on for cohesionless silts because dynamic effects at the sampler tip can lead to
erroneous strength and compressibility evaluations. The test also has little meaning in soft
and sensitive clays (Kulhawy and Mayne (1990, as cited in Sabatini and Bachus, 2002).
The limitation of SPT in fine grained soils is due to the variability of drilling rig type, drilling
system, test procedures and equipment’s. Some of the limitation of standard penetration test
MSc. Thesis, 2017 14 AAU, School of Earth Sciences
LITERATURE REVIEW
is related with drilling process that disturb the ground at the base of borehole, Prone to errors
by drillers, device imposes very complex strain paths to the soil and no theory at present is
capable of predicting what are the most influential factors affecting the N-value (Clayton,
1995).
Many engineers have experience using SPT for foundation design purposes; even though the
standard accepted correlations are often based on limited laboratory reference tests.
Additionally, variability associated with hammer types used (donut, safety, and automatic)
and specific testing errors result in relatively poor correlations for evaluating performance
properties for design, especially for cohesive soils. The test does provide a rough index of the
relative strength and compressibility of the soil in the vicinity of the test (Sabatini and
Bachus, 2002).
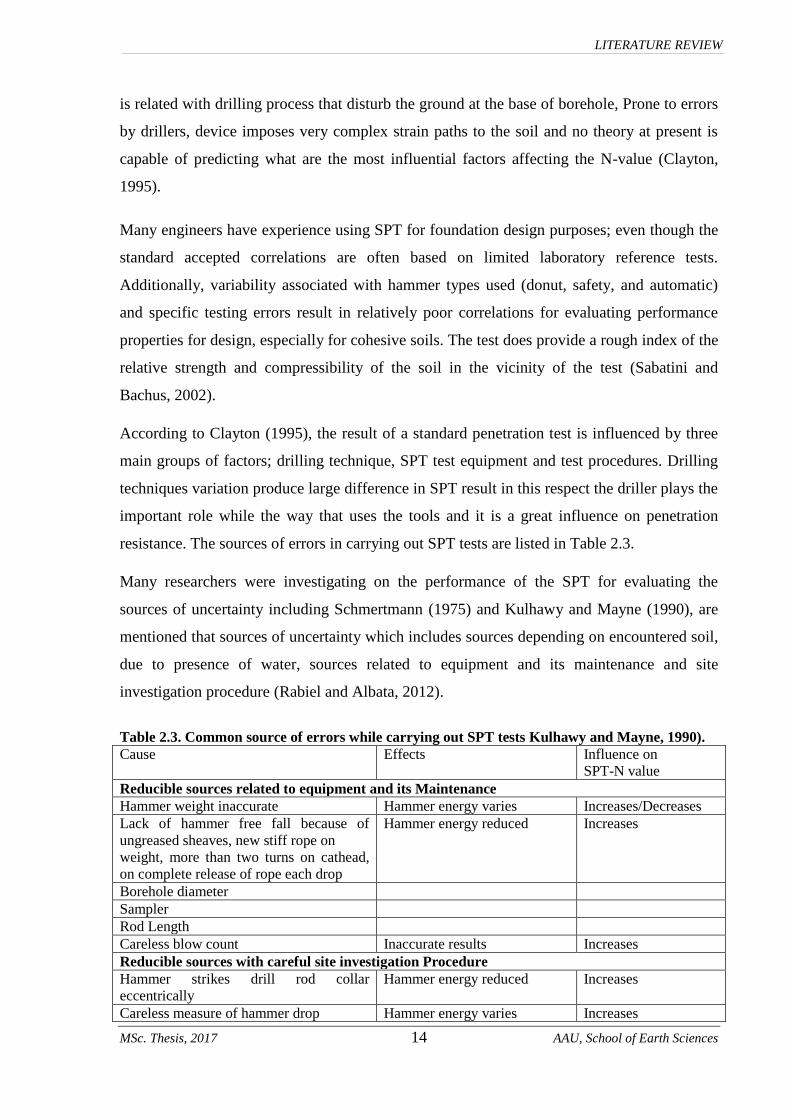
According to Clayton (1995), the result of a standard penetration test is influenced by three
main groups of factors; drilling technique, SPT test equipment and test procedures. Drilling
techniques variation produce large difference in SPT result in this respect the driller plays the
important role while the way that uses the tools and it is a great influence on penetration
resistance. The sources of errors in carrying out SPT tests are listed in Table 2.3.
Many researchers were investigating on the performance of the SPT for evaluating the
sources of uncertainty including Schmertmann (1975) and Kulhawy and Mayne (1990), are
mentioned that sources of uncertainty which includes sources depending on encountered soil,
due to presence of water, sources related to equipment and its maintenance and site
investigation procedure (Rabiel and Albata, 2012).
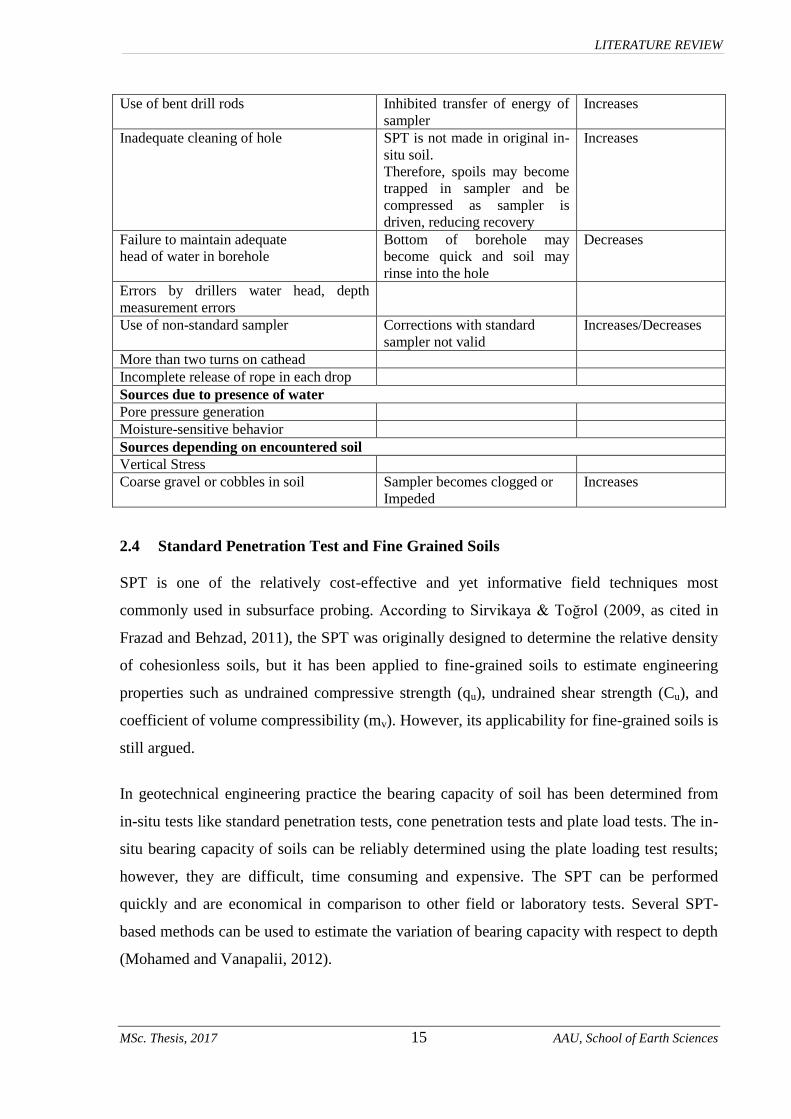
Table 2.3. Common source of errors while carrying out SPT tests Kulhawy and Mayne, 1990).
Cause Effects Influence on
SPT-N value
Reducible sources related to equipment and its Maintenance
Hammer weight inaccurate Hammer energy varies Increases/Decreases
Lack of hammer free fall because of
ungreased sheaves, new stiff rope on
weight, more than two turns on cathead,
on complete release of rope each drop
Hammer energy reduced Increases
Borehole diameter
Sampler
Rod Length
Careless blow count Inaccurate results Increases
Reducible sources with careful site investigation Procedure
Hammer strikes drill rod collar
eccentrically
Hammer energy reduced Increases
Careless measure of hammer drop Hammer energy varies Increases
MSc. Thesis, 2017 15 AAU, School of Earth Sciences
LITERATURE REVIEW
Use of bent drill rods Inhibited transfer of energy of
sampler
Increases
Inadequate cleaning of hole SPT is not made in original in-
situ soil.
Therefore, spoils may become
trapped in sampler and be
compressed as sampler is
driven, reducing recovery
Increases
Failure to maintain adequate
head of water in borehole
Bottom of borehole may
become quick and soil may
rinse into the hole
Decreases
Errors by drillers water head, depth
measurement errors
Use of non-standard sampler Corrections with standard
sampler not valid
Increases/Decreases
More than two turns on cathead
Incomplete release of rope in each drop
Sources due to presence of water
Pore pressure generation
Moisture-sensitive behavior
Sources depending on encountered soil
Vertical Stress
Coarse gravel or cobbles in soil Sampler becomes clogged or
Impeded
Increases
2.4 Standard Penetration Test and Fine Grained Soils
SPT is one of the relatively cost-effective and yet informative field techniques most
commonly used in subsurface probing. According to Sirvikaya & Toğrol (2009, as cited in
Frazad and Behzad, 2011), the SPT was originally designed to determine the relative density
of cohesionless soils, but it has been applied to fine-grained soils to estimate engineering
properties such as undrained compressive strength (qu), undrained shear strength (Cu), and
coefficient of volume compressibility (mv). However, its applicability for fine-grained soils is
still argued.
In geotechnical engineering practice the bearing capacity of soil has been determined from
in-situ tests like standard penetration tests, cone penetration tests and plate load tests. The in-
situ bearing capacity of soils can be reliably determined using the plate loading test results;
however, they are difficult, time consuming and expensive. The SPT can be performed
quickly and are economical in comparison to other field or laboratory tests. Several SPT-
based methods can be used to estimate the variation of bearing capacity with respect to depth
(Mohamed and Vanapalii, 2012).
MSc. Thesis, 2017 16 AAU, School of Earth Sciences
LITERATURE REVIEW
As stated in Day (2006), the bearing capacity of cohesive soils may be stiffened or softened
depending on an increase or decrease of their moisture contents. It became dried-out during
the summer and getting wet in rainy season. It can cause heave (upward movement) of lightly
loaded foundations and the calculation of bearing capacity has for short-term condition (total
stress analyses) and long-term condition (effective stress analyses). Total stress analyses that
use the undrained shear strength of the plastic soil and should be determined from field tests,
such as the vane shear test, or in the laboratory from unconfined compression tests. If the
undrained shear strength is approximately constant with depth, then Cu=C (cohesion) and f
(angle of friction) =0. These types of shear strength tests are often referred to as undrained
shear strength tests because there is no change in water content of the soil during the shear
portion of the test.
According to Terzaghi and peck (1967, as cited in (Clayton, 1995). reports that penetration
resistance in cohesive soil is broadly a function of Cu but the relationship is controlled by
various factors like plasticity, sensitivity, and fissuring.
Schmertmann (1979) attempted to investigate the derivation of soil resistance in clay soil, at
least 70% of the soil resistance can be derived from side shear, the remainder coming from
end bearing capacity. Since end bearing capacity is determined by undisturbed undrained
shear strength, and side shear by remolded strength a modest sensitivity of 10 will increase a
Cu/N-value from 5 for insensitive clay to 13.5 if the clay is sensitive. An estimate of the
influence on the Cu/N-value ratio can be obtained for the insensitive London clay by examine
the value of this ratio when remolded samples are used to determine undrained shear
strength. The compressibility of clay cannot be expected to have any significant influence on
SPT penetration resistance.
The SPT produced dynamic failure condition therefore compressibility or penetration
resistance correlations will depend up on the broad relationship between the undrained
strength of the material and its stiffness, which occurs as a result of the influence of void
ratio upon the two valuables. Different researcher indicated on their studies the effect of soil
type on the SPT N-value result related to its stiffness. Clayton (1995), mentioned different
researcher works around soil type and its effect for example; studies made by Bosscher and
Showers (1987), indicates the effect of soil type on the amount of energy losses during SPT
operations with stiffer soils subject to higher losses which in turn, falsely increases blow
counts. Yokel (1989) studied the mechanism of energy transfer in SPT sampler and
MSc. Thesis, 2017 17 AAU, School of Earth Sciences
LITERATURE REVIEW
concluded that the amount of energy actually used to penetrate the sampler depends on the
stiffness of soil such that it decreases with increase in number of blows. Lee et al. (2010),
analyzed the reaction of SPT sampler as it strikes soils of different stiffness. They came to
conclusion that two different secondary impacts occur depending on soil penetration
resistance where in soils with N < 25, additional sampler penetration is to be expected due to
rebound impact while for N > 50; the secondary impact does not contribute to further driving
of the sampler hence larger N-values.
2.5 Correlation with Undrained Shear Strength
In geotechnical engineering, problems can be solved directly by taking the N-value result and
proceed directly to the required quantity in design calculation it includes allowable bearing
capacity, settlement, liquefaction potential of sand and indirectly uses the test result to derive
geotechnical parameters it includes undrained shear strength of clay, effective angle of
friction of sand, unconfined compressive strength of clay, coefficient of volume
compressibility (Alan and John, 2010).
In cohesive soils, SPT N-values are usually used to correlate with undrained shear strengths
several authors suggest different correlations. First study to determine the relationship
between qu - N (SPT) was done by Terzaghi & Peck (1967). Their study was done on a
variety of fine- grained soils that only examined qu and N-value which did not considered
other parameters.
Frazad and Behzad (2011) summarized various researcher work; Stroud (1974), examined
the different relationships and used the shear strengths that were obtained from
UU(unconfined undrained test) but then results of Sowers (1979), were shown that Cu
increases with increasing in plasticity index. Sirvikaya & Toğrol (2002), made a wider study
on different fine-grained soils using results of UCS experiment and presented a new
correlation. Hettiarachchi & Brown (2009), assumed SPT sampler as an open-end pile and
presented a correlation using energy balance method based on N60.
Bowles (1997), gives an empirical correlation between Ncor and unconfined compressive
strength that can be estimated by the following equation:
………………………………………………..…………………………..Eq.
2.4

MSc. Thesis, 2017 18 AAU, School of Earth Sciences
LITERATURE REVIEW
Where, k = proportional factor, k =12 has been recommended by Bowles
In line with this, Stroud (1974, as cited in Clayton, 1995) had reported good correlations for
insensitive fissured over consolidated clays between N-value and Cu. Stroud suggested that
N- value in cohesive soils is not only a function of undrained shear strength but also it has a
relationship with plasticity index.
Cu = f1*N60 …...............................................................................................................Eq. 2.5
Values of f1 depend slightly up on the plasticity so the clay if the clay is sensitive; this
method will also yield an underestimate of undrained shear strength.
Table 2.4 Summarized empirical correlation of Cu versus N-values suggested by different
researcher (fine grain soils)
Terzaghi & Peck (1967) 6.25N
Bowles (1997) 6Ncor
Sivikaya &togrol (2002) (UCS) 4.32N
Hettiarachichi & Brown (2009) 4.1N60
Sirvikaya (2009)(UCS) Cu = 2.41N - 0.82Wn + 0.14LL + 1.44PI
Cu = 3.24N60 - 0.53Wn - 0.43LL + 2.14PI
Frazad & Behzad (2011)(UCS) Cu = 1.5N - 0.1Wn - 0.9LL + 2.4PI +21.1
Cu = 2N60 - 0.4Wn - 1.1LL + 2.4PI +33.3
2.6 Previous Works
Many researches have been done around reliability of standard penetration test estimating the
engineering properties of fine grained soils and determination of bearing capacity.
Mustafa and Mohammed (2013), attempted to measure the reliability of using standard
penetration test in predicting some properties, such as Atterberg limits and shear strength
parameters of silty clay with sand soils. The results of the research indicated that the shear
strength of soil affects SPT number. However Atterberg limits LL, PL and PI has no effect
on SPT result. Frazad and Behzad (2011) examined the SPT ability to predict undrained
shear strength of fine-grained soil using the multi linear regression analysis. Results showed
that considering other parameters such as natural water content (w), liquid limit (LL) and
plasticity index (PI), in addition to N (SPT), increase the correlation coefficient of estimation.
MSc. Thesis, 2017 19 AAU, School of Earth Sciences
LITERATURE REVIEW
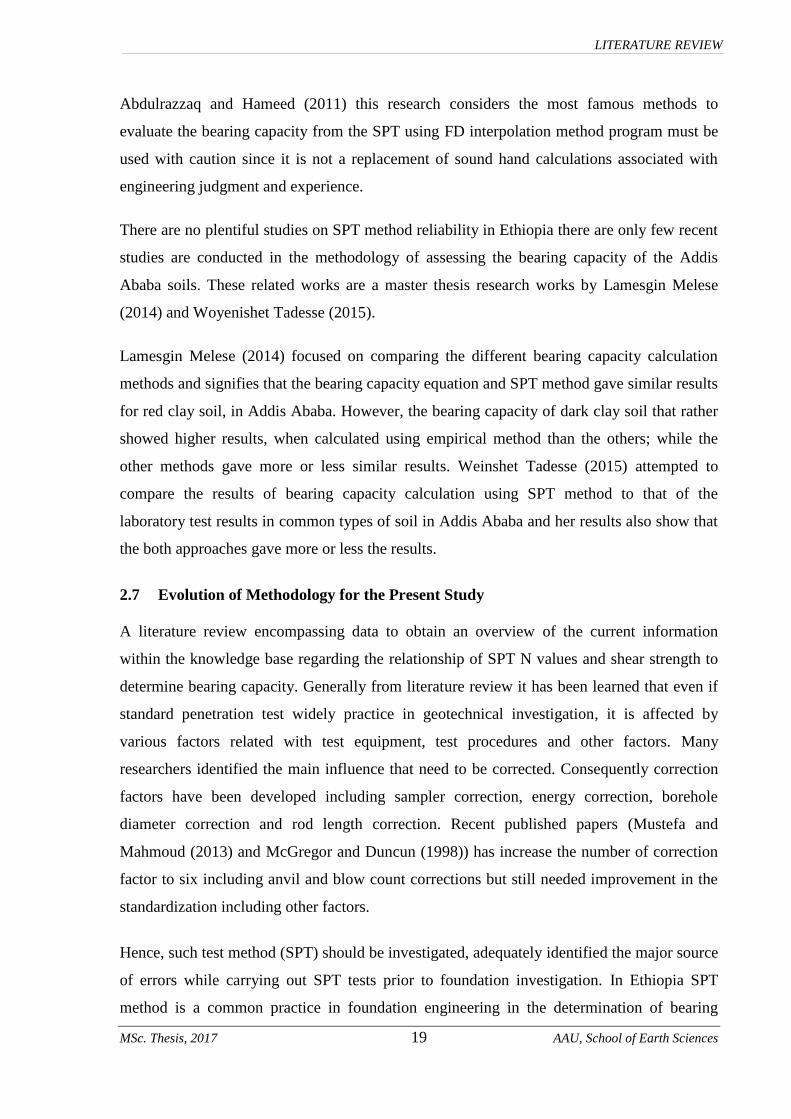
Abdulrazzaq and Hameed (2011) this research considers the most famous methods to
evaluate the bearing capacity from the SPT using FD interpolation method program must be
used with caution since it is not a replacement of sound hand calculations associated with
engineering judgment and experience.
There are no plentiful studies on SPT method reliability in Ethiopia there are only few recent
studies are conducted in the methodology of assessing the bearing capacity of the Addis
Ababa soils. These related works are a master thesis research works by Lamesgin Melese
(2014) and Woyenishet Tadesse (2015).
Lamesgin Melese (2014) focused on comparing the different bearing capacity calculation
methods and signifies that the bearing capacity equation and SPT method gave similar results
for red clay soil, in Addis Ababa. However, the bearing capacity of dark clay soil that rather
showed higher results, when calculated using empirical method than the others; while the
other methods gave more or less similar results. Weinshet Tadesse (2015) attempted to
compare the results of bearing capacity calculation using SPT method to that of the
laboratory test results in common types of soil in Addis Ababa and her results also show that
the both approaches gave more or less the results.
2.7 Evolution of Methodology for the Present Study
A literature review encompassing data to obtain an overview of the current information
within the knowledge base regarding the relationship of SPT N values and shear strength to
determine bearing capacity. Generally from literature review it has been learned that even if
standard penetration test widely practice in geotechnical investigation, it is affected by
various factors related with test equipment, test procedures and other factors. Many
researchers identified the main influence that need to be corrected. Consequently correction
factors have been developed including sampler correction, energy correction, borehole
diameter correction and rod length correction. Recent published papers (Mustefa and
Mahmoud (2013) and McGregor and Duncun (1998)) has increase the number of correction
factor to six including anvil and blow count corrections but still needed improvement in the
standardization including other factors.
Hence, such test method (SPT) should be investigated, adequately identified the major source
of errors while carrying out SPT tests prior to foundation investigation. In Ethiopia SPT
method is a common practice in foundation engineering in the determination of bearing
MSc. Thesis, 2017 20 AAU, School of Earth Sciences
LITERATURE REVIEW
capacity despite the reliability of tests. Thus, to study the reliability of the test in fine grain
soils the present research problem was conceived. The present study was conducted on SPT
method reliability in Addis Ababa on where the soil samples were taken. During the present
study the following were conducted.
Field testing, borehole logging and soil samples for selected laboratory testing’s and to have
a correlation between in-situ test (SPT) and Laboratory test (UCS). Consequently a
comparison was made with the parameters and previous correlations. Lastly, based on the
results of analysis and interpretations, conclusions and recommendations have been
suggested.
*****
MSc. Thesis, 2017 21 AAU, School of Earth Sciences
DESCRIPTION OF THE STUDY AREA
CHAPTER 3 DESCRIPTION OF THE STUDY AREA
3.1 Introduction
The study area was defined in terms of soils and geology, physiography and drainage,
climate, hydrogeology and seismicity. Common factors required for the prediction of soil
type are rock type, climate, and topography (Roy, 2006).
3.2 Location of the Study Area
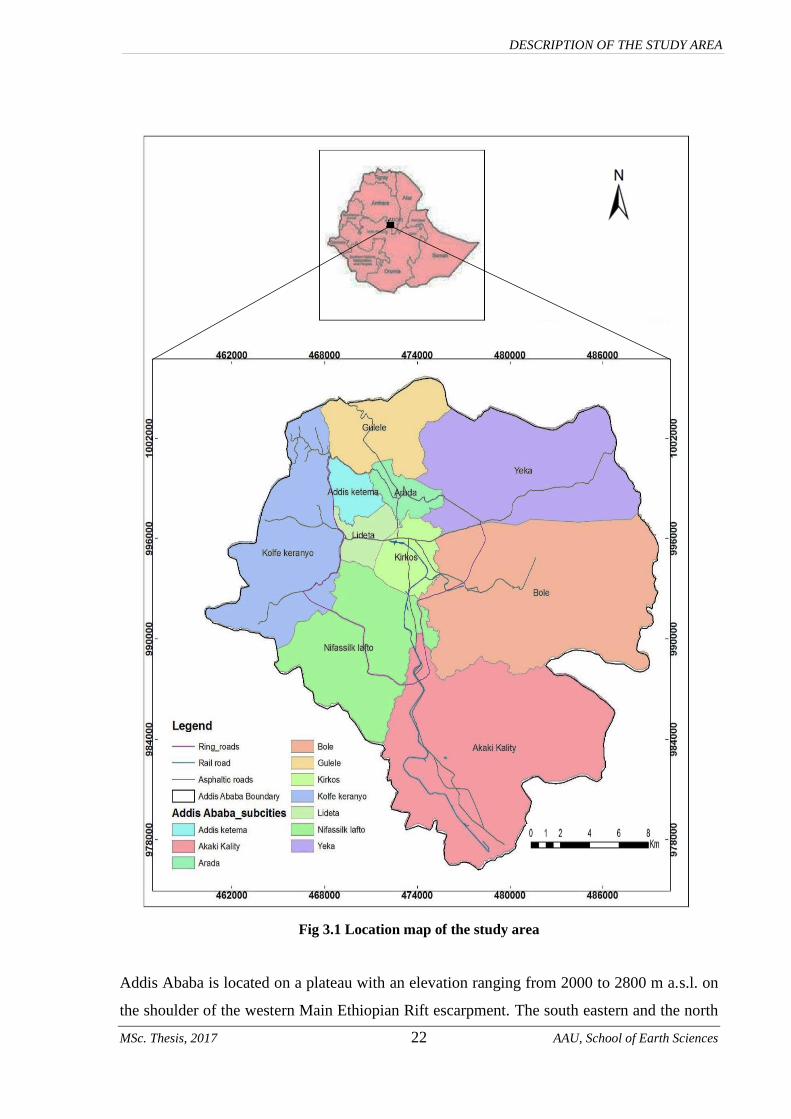
Addis Ababa (the study area) is located in the central part of Ethiopia. It is situated in the
western margin of the Main Ethiopian Rift and represents a transition zone between the
Ethiopian Plateau and the rift with poorly defined escarpment. It is located between 986000
N to 100500 N and 463000 E to 481000 E (Fig. 3.1). Its maximum elevation is at the
northern tip around 3000 m and decreasing towards the Ethiopian rift valley, south direction,
which is measured about 2000 m. The city covers a total area of about 540 square kilometers.
3.3 Topography and Drainage
Topography controls the rate of weathering by partly determining the amount of available
water for each zone of weathering. Precipitation will tend to run off hills and accumulate
soils in valleys and hollows (Blight (1997 as cited in Hana Tibebu, 2008)).
Terrain investigation provides a basis for identifying the mode of occurrence of soil
formations and classifying them by origin. Landform and stream forms and pattern are the
basic interpretative factors for terrain exploration. Soils are sub classified on the basis of their
mode of occurrence, which refers to the landform or surface expression of a deposit, or its
location relative to the regional physiography. Ethiopia can be divided in to four major
physiographic regions widely known as the Western plateau, Southern plateau, the Main
Ethiopian Rift and Afar Depression (Mengesha Tefera et al., 1996).
MSc. Thesis, 2017 22 AAU, School of Earth Sciences
DESCRIPTION OF THE STUDY AREA
Fig 3.1 Location map of the study area
Addis Ababa is located on a plateau with an elevation ranging from 2000 to 2800 m a.s.l. on
the shoulder of the western Main Ethiopian Rift escarpment. The south eastern and the north
MSc. Thesis, 2017 23 AAU, School of Earth Sciences
DESCRIPTION OF THE STUDY AREA
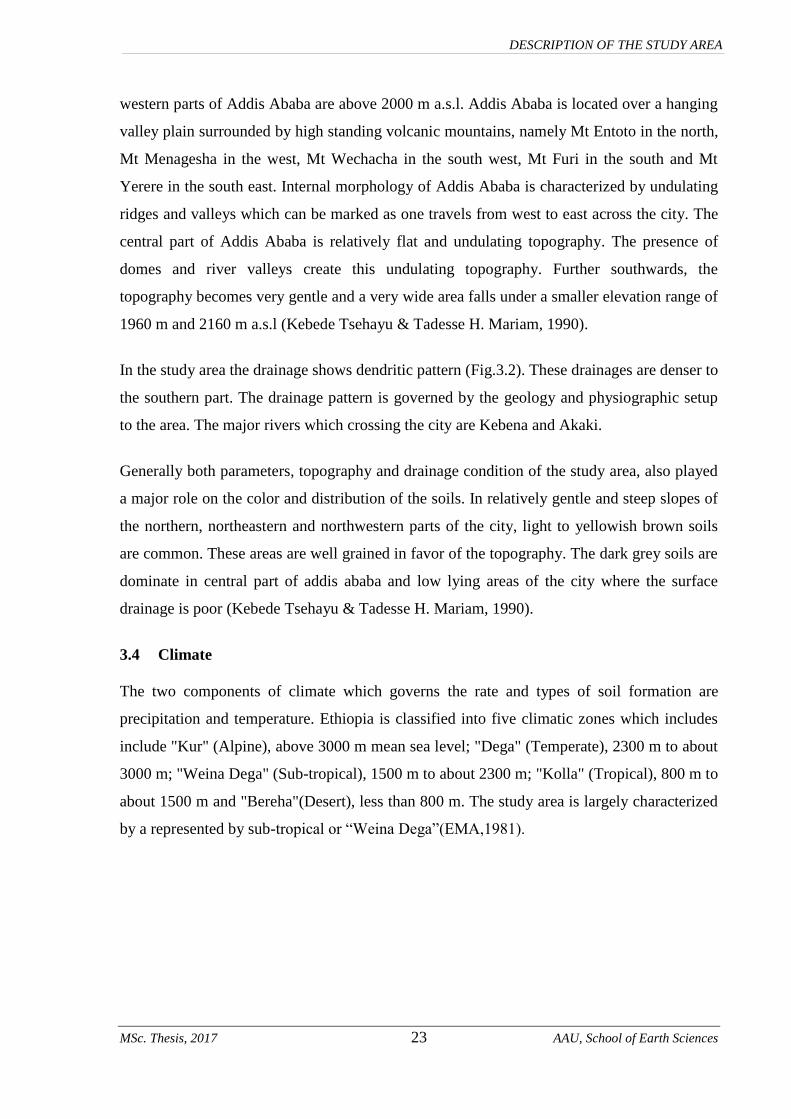
western parts of Addis Ababa are above 2000 m a.s.l. Addis Ababa is located over a hanging
valley plain surrounded by high standing volcanic mountains, namely Mt Entoto in the north,
Mt Menagesha in the west, Mt Wechacha in the south west, Mt Furi in the south and Mt
Yerere in the south east. Internal morphology of Addis Ababa is characterized by undulating
ridges and valleys which can be marked as one travels from west to east across the city. The
central part of Addis Ababa is relatively flat and undulating topography. The presence of
domes and river valleys create this undulating topography. Further southwards, the
topography becomes very gentle and a very wide area falls under a smaller elevation range of
1960 m and 2160 m a.s.l (Kebede Tsehayu & Tadesse H. Mariam, 1990).
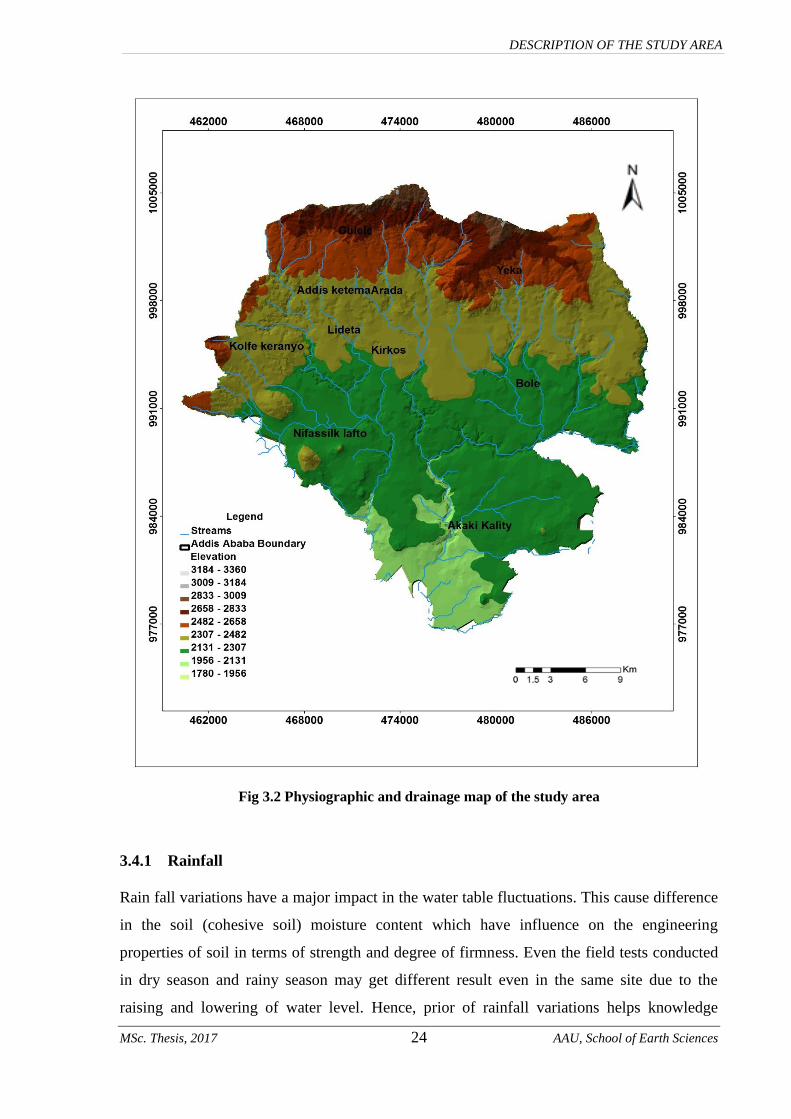
In the study area the drainage shows dendritic pattern (Fig.3.2). These drainages are denser to
the southern part. The drainage pattern is governed by the geology and physiographic setup
to the area. The major rivers which crossing the city are Kebena and Akaki.
Generally both parameters, topography and drainage condition of the study area, also played
a major role on the color and distribution of the soils. In relatively gentle and steep slopes of
the northern, northeastern and northwestern parts of the city, light to yellowish brown soils
are common. These areas are well grained in favor of the topography. The dark grey soils are
dominate in central part of addis ababa and low lying areas of the city where the surface
drainage is poor (Kebede Tsehayu & Tadesse H. Mariam, 1990).
3.4 Climate
The two components of climate which governs the rate and types of soil formation are
precipitation and temperature. Ethiopia is classified into five climatic zones which includes
include "Kur" (Alpine), above 3000 m mean sea level; "Dega" (Temperate), 2300 m to about
3000 m; "Weina Dega" (Sub-tropical), 1500 m to about 2300 m; "Kolla" (Tropical), 800 m to
about 1500 m and "Bereha"(Desert), less than 800 m. The study area is largely characterized
by a represented by sub-tropical or “Weina Dega”(EMA,1981).
MSc. Thesis, 2017 24 AAU, School of Earth Sciences
DESCRIPTION OF THE STUDY AREA
Fig 3.2 Physiographic and drainage map of the study area
3.4.1 Rainfall
Rain fall variations have a major impact in the water table fluctuations. This cause difference
in the soil (cohesive soil) moisture content which have influence on the engineering
properties of soil in terms of strength and degree of firmness. Even the field tests conducted
in dry season and rainy season may get different result even in the same site due to the
raising and lowering of water level. Hence, prior of rainfall variations helps knowledge
MSc. Thesis, 2017 25 AAU, School of Earth Sciences
DESCRIPTION OF THE STUDY AREA
understand its impact on ground water table fluctuation for appropriate design and safety of
engineering structures (Daniel Gemechu, 1977).
The variation in the seasonal distribution of rainfall in Ethiopia can be attributed by the
reference to the position of the Inter-Tropical Convergence Zone, the relationship between
upper and lower air circulation, the effects of topography and the role of local convection
currents and the amount of rainfall (Daniel Gemechu, 1977). Addis Ababa is provided with
on balance 1089 mm of rainfall per year or 90.8 mm per month. Wet climate in which the
rainy season prevails is from June to September.
In Addis Ababa rainfall intensity variation is attributed to differences in topography. The
high elevated areas such as the Entoto receive relatively greater precipitation than lowland
areas around Bole and Akaki. High rainfall data is recorded in the month of August whereas
in the month of January and February no rainfall data is recorded. This shows that there is
variation in the amount of rainfall within Addis Ababa with difference in altitude.
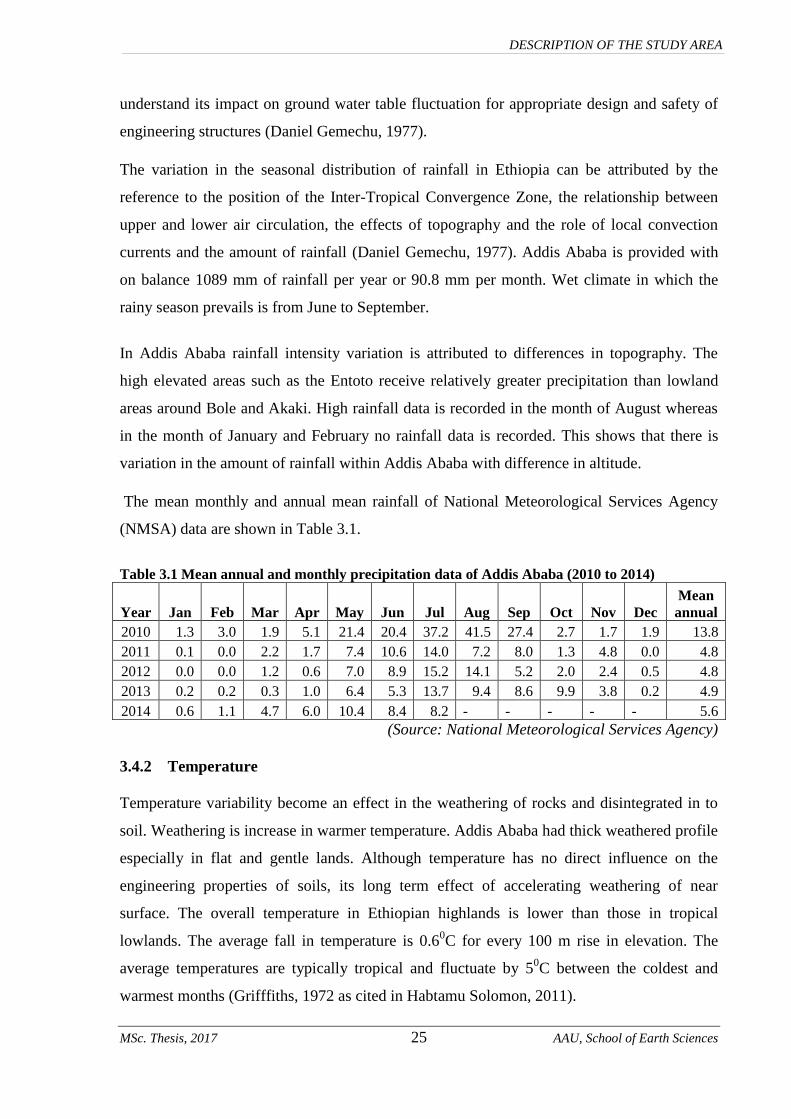
The mean monthly and annual mean rainfall of National Meteorological Services Agency
(NMSA) data are shown in Table 3.1.
Table 3.1 Mean annual and monthly precipitation data of Addis Ababa (2010 to 2014)
Year Jan Feb Mar Apr May Jun Jul Aug Sep Oct Nov Dec
Mean
annual
2010 1.3 3.0 1.9 5.1 21.4 20.4 37.2 41.5 27.4 2.7 1.7 1.9 13.8
2011 0.1 0.0 2.2 1.7 7.4 10.6 14.0 7.2 8.0 1.3 4.8 0.0 4.8
2012 0.0 0.0 1.2 0.6 7.0 8.9 15.2 14.1 5.2 2.0 2.4 0.5 4.8
2013 0.2 0.2 0.3 1.0 6.4 5.3 13.7 9.4 8.6 9.9 3.8 0.2 4.9
2014 0.6 1.1 4.7 6.0 10.4 8.4 8.2 - - - - - 5.6
(Source: National Meteorological Services Agency)
3.4.2 Temperature
Temperature variability become an effect in the weathering of rocks and disintegrated in to
soil. Weathering is increase in warmer temperature. Addis Ababa had thick weathered profile
especially in flat and gentle lands. Although temperature has no direct influence on the
engineering properties of soils, its long term effect of accelerating weathering of near
surface. The overall temperature in Ethiopian highlands is lower than those in tropical
lowlands. The average fall in temperature is 0.60C for every 100 m rise in elevation. The
average temperatures are typically tropical and fluctuate by 50C between the coldest and
warmest months (Grifffiths, 1972 as cited in Habtamu Solomon, 2011).
MSc. Thesis, 2017 26 AAU, School of Earth Sciences
DESCRIPTION OF THE STUDY AREA
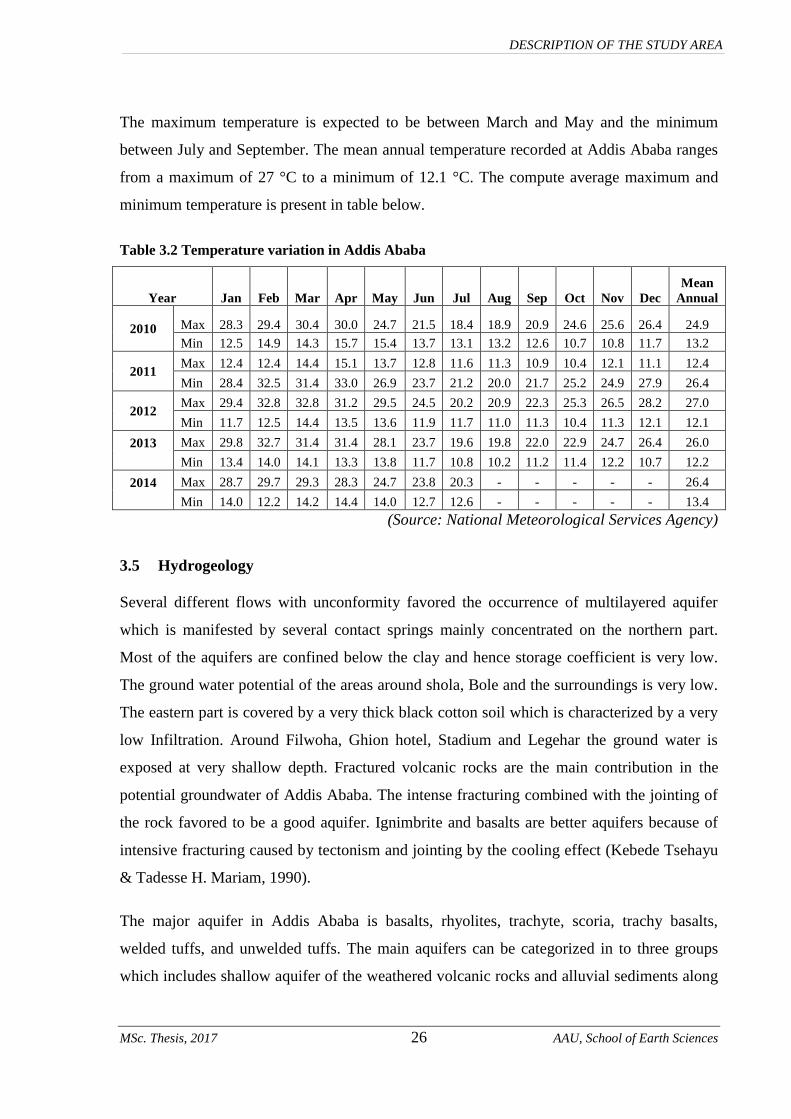
The maximum temperature is expected to be between March and May and the minimum
between July and September. The mean annual temperature recorded at Addis Ababa ranges
from a maximum of 27 °C to a minimum of 12.1 °C. The compute average maximum and
minimum temperature is present in table below.
Table 3.2 Temperature variation in Addis Ababa
Year Jan Feb Mar Apr May Jun Jul Aug Sep Oct Nov Dec
Mean
Annual
2010 Max 28.3 29.4 30.4 30.0 24.7 21.5 18.4 18.9 20.9 24.6 25.6 26.4 24.9
Min 12.5 14.9 14.3 15.7 15.4 13.7 13.1 13.2 12.6 10.7 10.8 11.7 13.2
2011 Max 12.4 12.4 14.4 15.1 13.7 12.8 11.6 11.3 10.9 10.4 12.1 11.1 12.4
Min 28.4 32.5 31.4 33.0 26.9 23.7 21.2 20.0 21.7 25.2 24.9 27.9 26.4
2012 Max 29.4 32.8 32.8 31.2 29.5 24.5 20.2 20.9 22.3 25.3 26.5 28.2 27.0
Min 11.7 12.5 14.4 13.5 13.6 11.9 11.7 11.0 11.3 10.4 11.3 12.1 12.1
2013
Max 29.8 32.7 31.4 31.4 28.1 23.7 19.6 19.8 22.0 22.9 24.7 26.4 26.0
Min 13.4 14.0 14.1 13.3 13.8 11.7 10.8 10.2 11.2 11.4 12.2 10.7 12.2
2014
Max 28.7 29.7 29.3 28.3 24.7 23.8 20.3 - - - - - 26.4
Min 14.0 12.2 14.2 14.4 14.0 12.7 12.6 - - - - - 13.4
(Source: National Meteorological Services Agency)
3.5 Hydrogeology
Several different flows with unconformity favored the occurrence of multilayered aquifer
which is manifested by several contact springs mainly concentrated on the northern part.
Most of the aquifers are confined below the clay and hence storage coefficient is very low.
The ground water potential of the areas around shola, Bole and the surroundings is very low.
The eastern part is covered by a very thick black cotton soil which is characterized by a very
low Infiltration. Around Filwoha, Ghion hotel, Stadium and Legehar the ground water is
exposed at very shallow depth. Fractured volcanic rocks are the main contribution in the
potential groundwater of Addis Ababa. The intense fracturing combined with the jointing of
the rock favored to be a good aquifer. Ignimbrite and basalts are better aquifers because of
intensive fracturing caused by tectonism and jointing by the cooling effect (Kebede Tsehayu
& Tadesse H. Mariam, 1990).
The major aquifer in Addis Ababa is basalts, rhyolites, trachyte, scoria, trachy basalts,
welded tuffs, and unwelded tuffs. The main aquifers can be categorized in to three groups
which includes shallow aquifer of the weathered volcanic rocks and alluvial sediments along
MSc. Thesis, 2017 27 AAU, School of Earth Sciences
DESCRIPTION OF THE STUDY AREA
the river courses, deep aquifer of the fractured volcanic rocks that traps fresh ground water
and thermal aquifer along Filuha fault (Tamru Alemayehu et al,. 2006).
3.6 Seismicity
Different literature and historical records is confirmed that earthquakes have occurred in
Ethiopia many times in the past. Most shocks originate along the rift structures of red sea,
Gulf of Aden and the Ethiopia rift. Currently hazard levels due to expected earthquake
occurrences are available in the form of regional seismic zonation map of the country
(RADIUS, 1999).
The seismic activity around Addis Ababa is related to the main Ethiopian rift. Hence Addis
Ababa is placed in the western margin of rift, which is among the tectonically active areas of
the world. Due to this fact, recurrence of earthquake poses a significant risk in the area. The
level of hazard due to earthquake occurrence of a certain magnitude/intensity can be
significantly affected by surface geology, which can vary appreciably within close
proximities (EBCS-8, 1995).
According to the seismic hazard map presented in Ethiopian Building Code Standard (EBCS-
8, 1995), the country subdivides in to five seismic zones. Depending on the local hazard the
seismic zonation map of the Ethiopia shows the distribution of the expected hazard, which
follows the physical boundaries of the Rift Valley itself. Areas, which are near the valley,
experience more hazard than those located far away. According to the seismicity map of
Ethiopia, Addis Ababa is lies in the second high risk zone.
Hence topography play an important role in amplifying seismic motion, Entoto relatively
high intensities following earthquake that occurred outside Addis Ababa. Around Yeka,
Abware and Filwoha which reported of high intensities fall along the Filwoha fault (Kebede
Tsehayu & Tadesse H. Mariam, 1990).
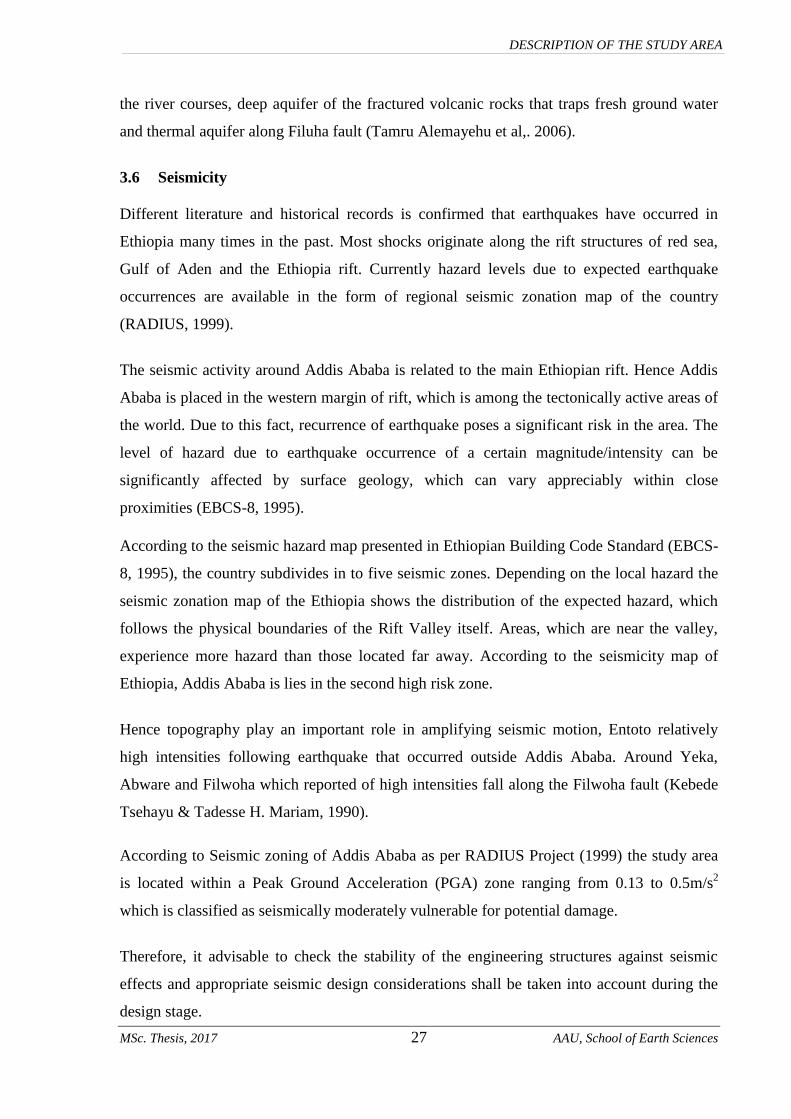
According to Seismic zoning of Addis Ababa as per RADIUS Project (1999) the study area
is located within a Peak Ground Acceleration (PGA) zone ranging from 0.13 to 0.5m/s2
which is classified as seismically moderately vulnerable for potential damage.
Therefore, it advisable to check the stability of the engineering structures against seismic
effects and appropriate seismic design considerations shall be taken into account during the
design stage.
MSc. Thesis, 2017 28 AAU, School of Earth Sciences
DESCRIPTION OF THE STUDY AREA
3.7 Regional Geology and Tectonics
The Tertiary volcanic of central Ethiopians divided in three stages of volcanism and
tectonism Zanettin (1997, cited in Asseged Getaneh, 2007). Where the first transitional
(thiolettic) flood basalt followed by alkali rhyolite and ending with alkali basalt. At first the
volcanism has occurred on a large elongated basin. The outer part of the basin was uplifted
and deep eroded during this stage the volcanism dies out on the uplifted area.
The outcrops of Addis Ababa and its environs are entirely Cenezoic volcanics sequences
with different types of recent sediments. The Tertiary Volcanics include basalts, ignimbrite,
rhyolite, trachyte, tuff and occasional pumice. From stratigraphic point of view, the tertiary
Fig 3.3 Seismic zoning of Addis Ababa as per RADIUS Project (1999).
MSc. Thesis, 2017 29 AAU, School of Earth Sciences
DESCRIPTION OF THE STUDY AREA
volcanic rocks are classified as Trap Series, Entoto Silicics, Addis Ababa Basalt and
Younger Volcanics in chronological order from the oldest to the youngest.
The Addis Ababa area is characterized by tectonic and volcanic activities associated with the
formation of the rift valley that commenced in Miocene following major uplifting called the
Afro-Arabian dome during early Tertiary period. N and NE trending steep normal faults
bounds the area in the east and west. Most of which have sub parallel trend as the main
Ethiopian rift fault. Besides, the region is traversed by the major east-west trending Yerer-
Ambo lineament which separates the southern Main Ethiopian Rift and the northern Afar
Rift. The western marginal zone of the Main Ethiopian Rift is affected by the younger, N-S
trending Wonji faults forming small horst and graben structures (Assegid Getaneh, 2007).
3.8 Geology of Addis Ababa
The geological map of Addis Ababa compiled by Hailieselasse Girmay and Getaneh Assefa
(1989), Assegid Getahun (2007), Efrem Beshawered (2009) and WWDSE (2008). According
to these previous geological studies, Addis Ababa is covered by volcanic rocks dominated in
the lower part by basaltic lava flows (Addis Ababa basalt), followed by a pyroclastic
sequence, mainly formed by ignimbrites (Addis Ababa Ignimbrite), followed by central
composite volcanoes (Central Volcanoes unit), and finally small spatter cones and lava flows
(Akaki unit) and superficial deposits.
According to Assegid Getahun (2007), Addis Ababa is covered by volcanic rocks and
superficial deposits consisting of superficial deposits of mainly CLAY, Repi basalt unit
(strongly jointed basalt topped by trachy basalt), Entoto mixed volcanic unit (Silicic volcanic
rocks with minor sediments), Lower ignimbrite unit (Ignimbrites, un-welded tuffs, ash flows
and trachyte) and Ignimbrites and associated pyroclastic unit of Yerer volcanic in the east
(Fig. 3.4).
3.8.1 Addis Ababa basalt
Extensively crops out along Akaki, Kebena, and Dukem rivers at the east to southeastern part
of Addis Ababa, and represents the oldest unit of the area. It consists of essentially sub-
horizontal lava flows with thickness ranging from few meters up to 20m. Maximum exposed
thickness was found east of Addis Ababa, along the Kebena River. Addis Ababa basalt is
predominantly constituted by alkaline and olivine basalts with three main textural attributes,
that is, porphyritic, aphyric, and sub-aphyric (Assegid Getaneh, 2007).
MSc. Thesis, 2017 30 AAU, School of Earth Sciences
DESCRIPTION OF THE STUDY AREA
3.8.2 Addis Ababa ignimbrite
It is exposed close to Addis Ababa along the Akaki and Kebena rivers. It overlies the Addis
Ababa basalt and locally covers the products of the composite central volcanoes of
Wechecha and Furi. The sequence is constituted by different flow units, consisting of pale-
green to pale-yellow welded and crystal rich ignimbrites (Assegid Getaneh, 2007).
3.8.3 Central volcanoes unit
Includes the Yerer volcano and the product of the two composite volcanoes wechecha and
Furi west and southeast of Addis Ababa, respectively. Wechecha and Furi volcanoes are two
large edifices composed by predominant trachyte with minor pyroclastics. Yerer represents
the largest volcanic edifice in the region, with a relief of 1000m from the plain and 14km
wide along east-west direction. Products mainly consist of trachytes, even if pyroclastics are
widespread mainly in the central part eastern sector. The highest part of Yerer volcano was
affected by a more recent volcanic activity that produces spatter cones and associated basalt
(Assegid Getaneh, 2007).
3.8.4 Akaki unit
Crops out east of Addis Ababa and consists of scoria and spatter cones with associated
tabular lava flows and phreato- magmatic deposits. Alluvial deposits covering these units
consists of regolith, reddish brown soils, talus and alluvium with maximum thickness of
about two meters (Assegid Getaneh, 2007).

MSc. Thesis, 2017 31 AAU, School of Earth Sciences
DESCRIPTION OF THE STUDY AREA
Fig 3.4 Geological map of Addis Ababa (Assegde Getaneh, 2007)
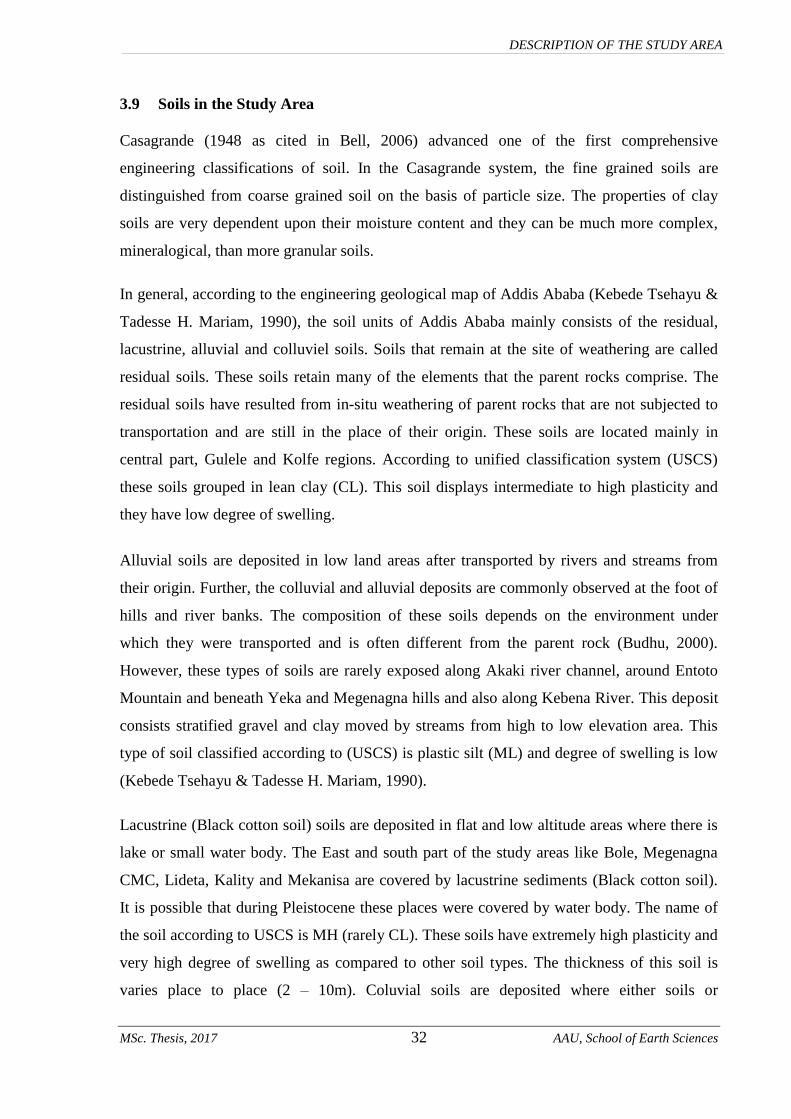
MSc. Thesis, 2017 32 AAU, School of Earth Sciences
DESCRIPTION OF THE STUDY AREA
3.9 Soils in the Study Area
Casagrande (1948 as cited in Bell, 2006) advanced one of the first comprehensive
engineering classifications of soil. In the Casagrande system, the fine grained soils are
distinguished from coarse grained soil on the basis of particle size. The properties of clay
soils are very dependent upon their moisture content and they can be much more complex,
mineralogical, than more granular soils.
In general, according to the engineering geological map of Addis Ababa (Kebede Tsehayu &
Tadesse H. Mariam, 1990), the soil units of Addis Ababa mainly consists of the residual,
lacustrine, alluvial and colluviel soils. Soils that remain at the site of weathering are called
residual soils. These soils retain many of the elements that the parent rocks comprise. The
residual soils have resulted from in-situ weathering of parent rocks that are not subjected to
transportation and are still in the place of their origin. These soils are located mainly in
central part, Gulele and Kolfe regions. According to unified classification system (USCS)
these soils grouped in lean clay (CL). This soil displays intermediate to high plasticity and
they have low degree of swelling.
Alluvial soils are deposited in low land areas after transported by rivers and streams from
their origin. Further, the colluvial and alluvial deposits are commonly observed at the foot of
hills and river banks. The composition of these soils depends on the environment under
which they were transported and is often different from the parent rock (Budhu, 2000).
However, these types of soils are rarely exposed along Akaki river channel, around Entoto
Mountain and beneath Yeka and Megenagna hills and also along Kebena River. This deposit
consists stratified gravel and clay moved by streams from high to low elevation area. This
type of soil classified according to (USCS) is plastic silt (ML) and degree of swelling is low
(Kebede Tsehayu & Tadesse H. Mariam, 1990).
Lacustrine (Black cotton soil) soils are deposited in flat and low altitude areas where there is
lake or small water body. The East and south part of the study areas like Bole, Megenagna
CMC, Lideta, Kality and Mekanisa are covered by lacustrine sediments (Black cotton soil).
It is possible that during Pleistocene these places were covered by water body. The name of
the soil according to USCS is MH (rarely CL). These soils have extremely high plasticity and
very high degree of swelling as compared to other soil types. The thickness of this soil is
varies place to place (2 – 10m). Coluvial soils are deposited where either soils or
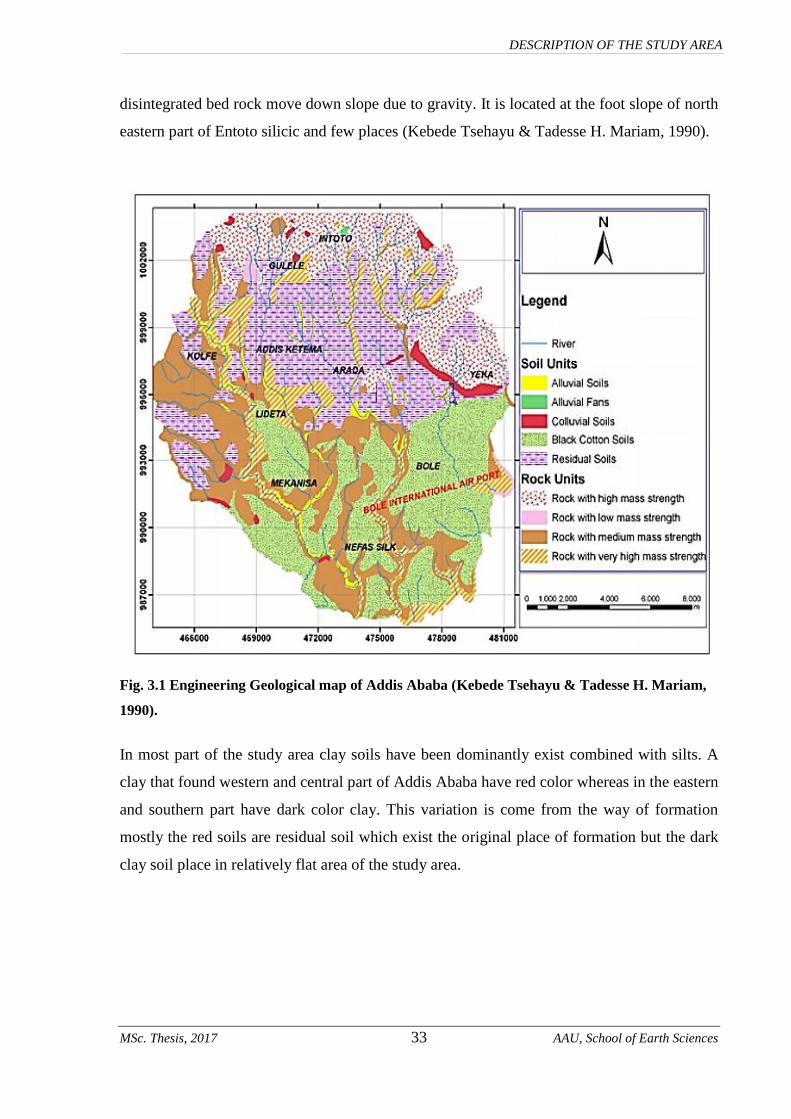
MSc. Thesis, 2017 33 AAU, School of Earth Sciences
DESCRIPTION OF THE STUDY AREA
disintegrated bed rock move down slope due to gravity. It is located at the foot slope of north
eastern part of Entoto silicic and few places (Kebede Tsehayu & Tadesse H. Mariam, 1990).
Fig. 3.1 Engineering Geological map of Addis Ababa (Kebede Tsehayu & Tadesse H. Mariam,
1990).
In most part of the study area clay soils have been dominantly exist combined with silts. A
clay that found western and central part of Addis Ababa have red color whereas in the eastern
and southern part have dark color clay. This variation is come from the way of formation
mostly the red soils are residual soil which exist the original place of formation but the dark
clay soil place in relatively flat area of the study area.

MSc. Thesis, 2017 34 AAU, School of Earth Sciences
DESCRIPTION OF THE STUDY AREA
3.10 Fine Grained Soils in the Study Area
The fine grained soil distributions in the study area are classified based on their color,
consistency and plasticity. These are dark clay, red clay and red silt soils.
The red clay soils found on the study area are characterized by firm to very stiff, medium to
highly plastic silty clay. A minimum and a maximum of 6 and 30 blows per 300mm
penetration were measured. The soil layer has firm to stiff consistency.
Plate 3.1 Red clay soil (Gulele area)
Dark clay soils found in the study area is characterized by firm to very stiff, medium to
highly plastic clay (black cotton soil). A minimum and a maximum of 5 and 21 blows per
300mm penetration were measured. The soil layer has firm to stiff consistency.
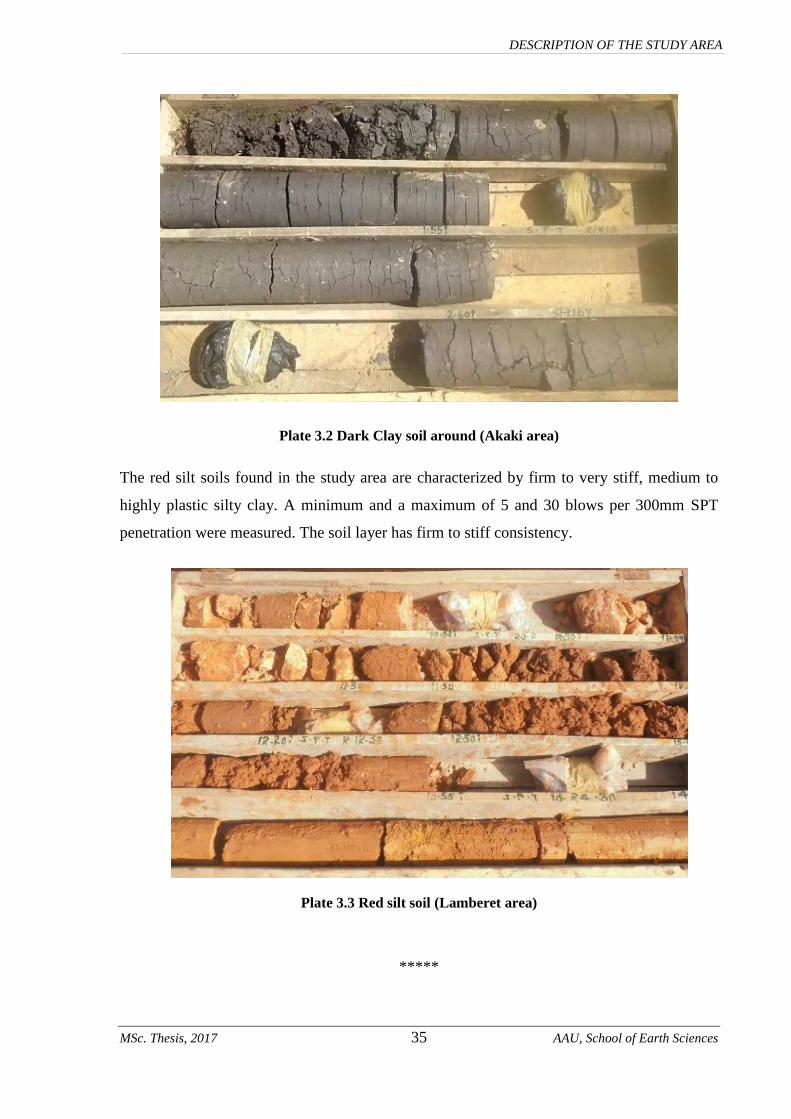
MSc. Thesis, 2017 35 AAU, School of Earth Sciences
DESCRIPTION OF THE STUDY AREA
Plate 3.2 Dark Clay soil around (Akaki area)
The red silt soils found in the study area are characterized by firm to very stiff, medium to
highly plastic silty clay. A minimum and a maximum of 5 and 30 blows per 300mm SPT
penetration were measured. The soil layer has firm to stiff consistency.
Plate 3.3 Red silt soil (Lamberet area)
*****
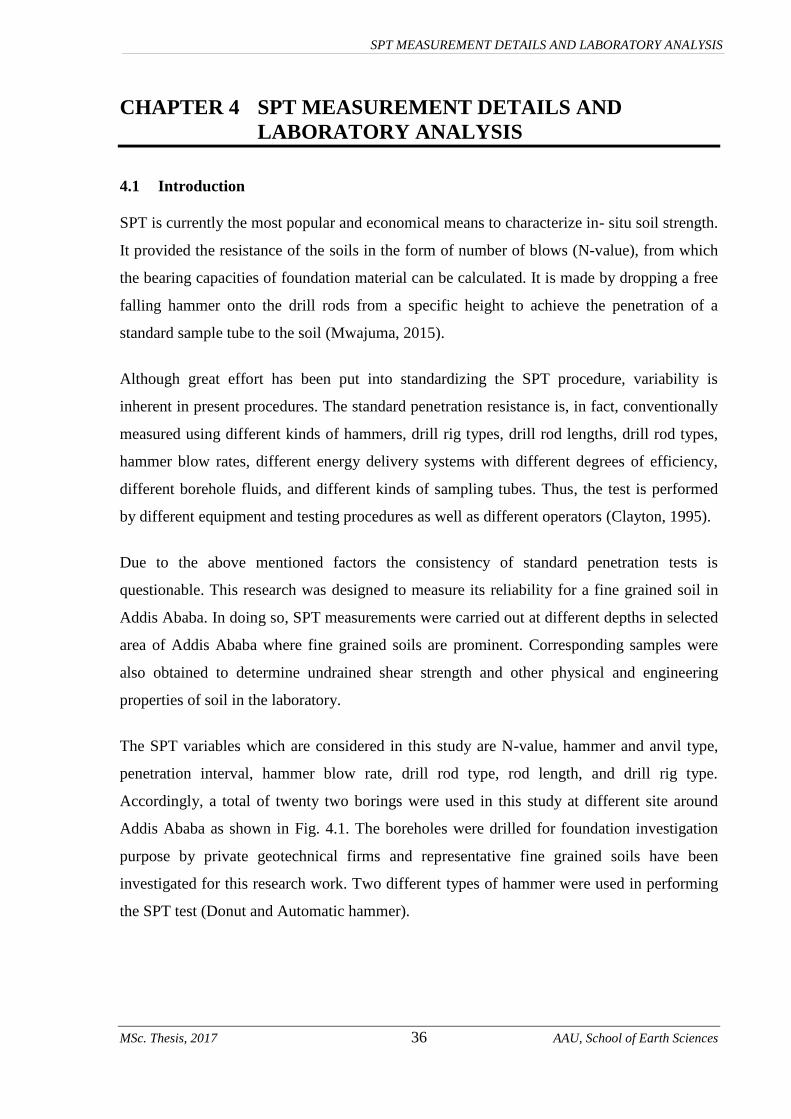
MSc. Thesis, 2017 36 AAU, School of Earth Sciences
SPT MEASUREMENT DETAILS AND LABORATORY ANALYSIS
CHAPTER 4 SPT MEASUREMENT DETAILS AND
LABORATORY ANALYSIS
4.1 Introduction
SPT is currently the most popular and economical means to characterize in- situ soil strength.
It provided the resistance of the soils in the form of number of blows (N-value), from which
the bearing capacities of foundation material can be calculated. It is made by dropping a free
falling hammer onto the drill rods from a specific height to achieve the penetration of a
standard sample tube to the soil (Mwajuma, 2015).
Although great effort has been put into standardizing the SPT procedure, variability is
inherent in present procedures. The standard penetration resistance is, in fact, conventionally
measured using different kinds of hammers, drill rig types, drill rod lengths, drill rod types,
hammer blow rates, different energy delivery systems with different degrees of efficiency,
different borehole fluids, and different kinds of sampling tubes. Thus, the test is performed
by different equipment and testing procedures as well as different operators (Clayton, 1995).
Due to the above mentioned factors the consistency of standard penetration tests is
questionable. This research was designed to measure its reliability for a fine grained soil in
Addis Ababa. In doing so, SPT measurements were carried out at different depths in selected
area of Addis Ababa where fine grained soils are prominent. Corresponding samples were
also obtained to determine undrained shear strength and other physical and engineering
properties of soil in the laboratory.
The SPT variables which are considered in this study are N-value, hammer and anvil type,
penetration interval, hammer blow rate, drill rod type, rod length, and drill rig type.
Accordingly, a total of twenty two borings were used in this study at different site around
Addis Ababa as shown in Fig. 4.1. The boreholes were drilled for foundation investigation
purpose by private geotechnical firms and representative fine grained soils have been
investigated for this research work. Two different types of hammer were used in performing
the SPT test (Donut and Automatic hammer).
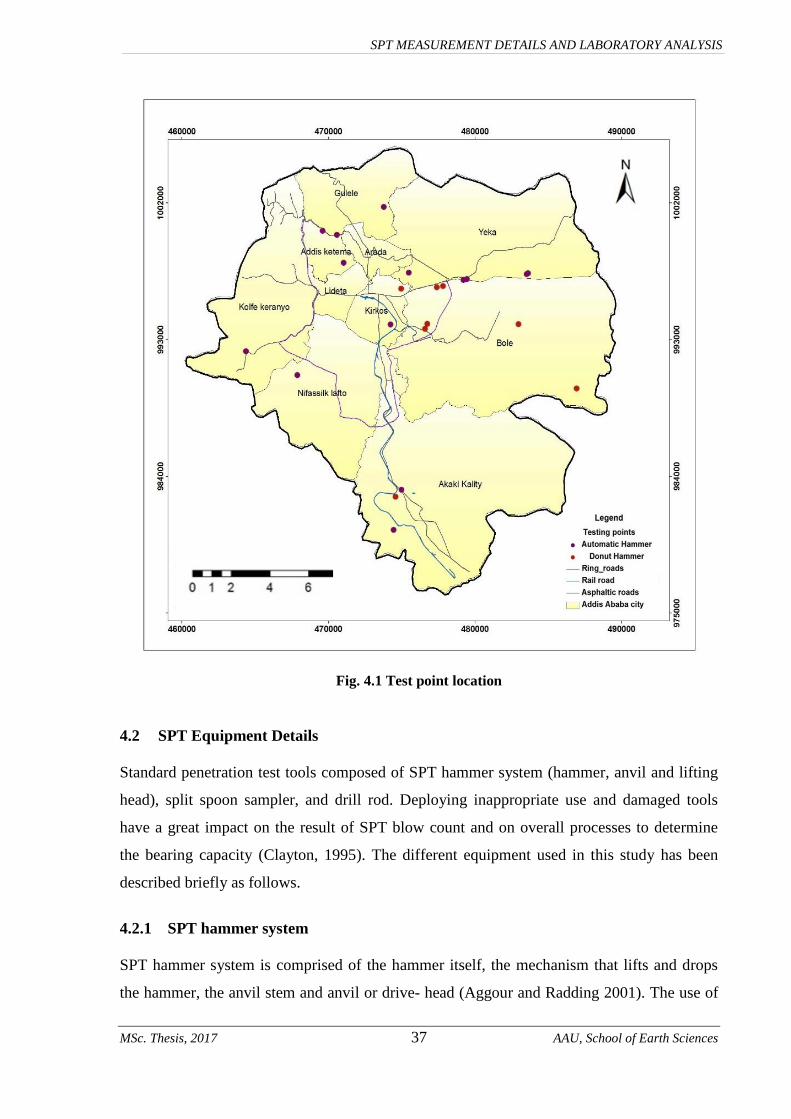
MSc. Thesis, 2017 37 AAU, School of Earth Sciences
SPT MEASUREMENT DETAILS AND LABORATORY ANALYSIS
Fig. 4.1 Test point location
4.2 SPT Equipment Details
Standard penetration test tools composed of SPT hammer system (hammer, anvil and lifting
head), split spoon sampler, and drill rod. Deploying inappropriate use and damaged tools
have a great impact on the result of SPT blow count and on overall processes to determine
the bearing capacity (Clayton, 1995). The different equipment used in this study has been
described briefly as follows.
4.2.1 SPT hammer system
SPT hammer system is comprised of the hammer itself, the mechanism that lifts and drops
the hammer, the anvil stem and anvil or drive- head (Aggour and Radding 2001). The use of

MSc. Thesis, 2017 38 AAU, School of Earth Sciences
SPT MEASUREMENT DETAILS AND LABORATORY ANALYSIS
SPT has grown rapidly; three different types hammer systems have been developed: donut
hammer, safety hammer, and automatic hammer. Herein the tests were conducted only in two
of the hammer type system; donut and automatic hammers. The donut hammer system is the
weight centered on a guide pipe which strikes an external anvil above the drill rods and the
weight is raised and dropped by the operator and relatively its increase the risk of injury
(Lamb, 1997). Unlike the donut type of hammer, the automatic hammer system is a
hydraulically powered chain lift device; the only thing that operator does is to open the
hydraulic valve in order to start the lifting and dropping sequences and weight which slides
over the drill rods and impacts against an internal anvil (Riggs, 1986).
Due to its difficulty of measure the hammer weight in the field, the hammer weight data was
collected from drilling rig manual and specifications. Most of the hammers were fall on the
range between 62 kg to 63 kg qualified the ASTM standards. The drill rigs were used for this
study are SH-700 and SH-100 Korea rigs mounted with an automatic hammer, HXY – 2BT
and XY-200 spindle type China rigs with a donut hammer as shown in Fig. 4.2. The hammer
drop system the donut hammer used the cathead and rope system whereas the semiautomatic
or automatic hammers have a trip system.
The anvil is that portion of the hammer system through which the hammer energy is
transmitted to the drill rods as it is impacted by the falling hammer. The hammer and anvil is
designed for steel on steel contact when the hammer is dropped. During field observation the
anvils have different shape and size.
The hammer type is the most influential due to the variability in energy delivered to the drill
rods. Researchers have shown that energy transfer efficiency can be varies from 30% to 90%
depending on the type of hammer used. Thus, different drill rig hammer systems give
different N values. Hammer efficiency highly depends on equipment and operator skill. It has
been found that an inverse relationship exists between the N measured and the efficiency of
the hammer (Sherbiny and Salem 2013). These findings and the recognition of the direct
impact of this inconsistency on geotechnical design.
Bowels (1997), listed the energy ratio of different counties practice, is between the range of
40% to 60% and 60% to 100% for donut hammer and automatic hammer, respectively. It is
evident from the above mentioned values that energy efficiency for each type of hammer
varies widely with the local practice in different parts of the world.
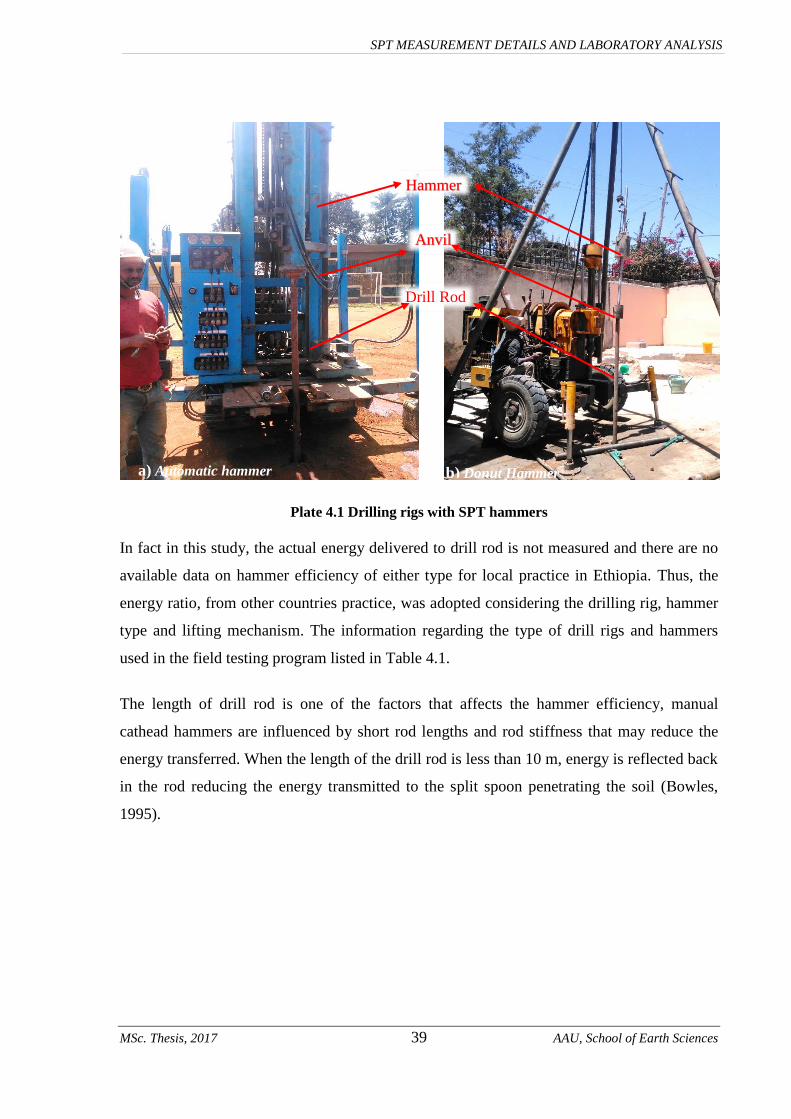
MSc. Thesis, 2017 39 AAU, School of Earth Sciences
SPT MEASUREMENT DETAILS AND LABORATORY ANALYSIS
Plate 4.1 Drilling rigs with SPT hammers
In fact in this study, the actual energy delivered to drill rod is not measured and there are no
available data on hammer efficiency of either type for local practice in Ethiopia. Thus, the
energy ratio, from other countries practice, was adopted considering the drilling rig, hammer
type and lifting mechanism. The information regarding the type of drill rigs and hammers
used in the field testing program listed in Table 4.1.
The length of drill rod is one of the factors that affects the hammer efficiency, manual
cathead hammers are influenced by short rod lengths and rod stiffness that may reduce the
energy transferred. When the length of the drill rod is less than 10 m, energy is reflected back
in the rod reducing the energy transmitted to the split spoon penetrating the soil (Bowles,
1995).
Hammer
Anvil
Drill Rod
a) Automatic hammer b) Donut Hammer
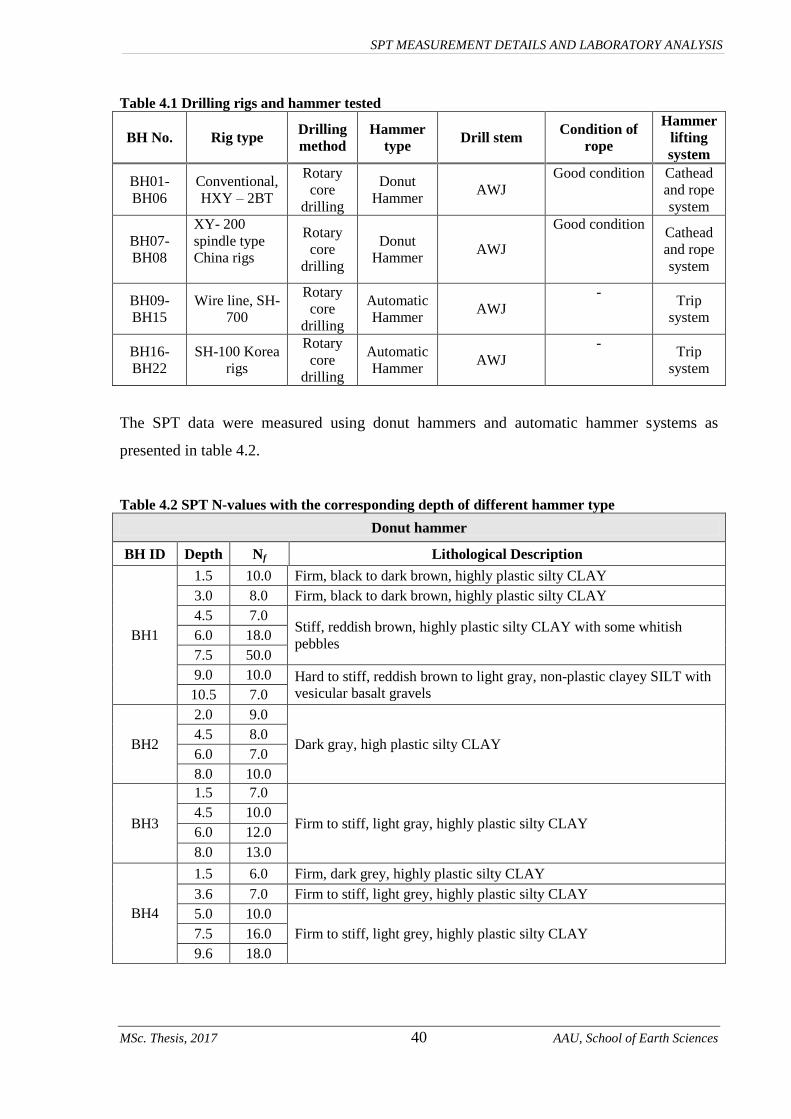
MSc. Thesis, 2017 40 AAU, School of Earth Sciences
SPT MEASUREMENT DETAILS AND LABORATORY ANALYSIS
Table 4.1 Drilling rigs and hammer tested
The SPT data were measured using donut hammers and automatic hammer systems as
presented in table 4.2.
Table 4.2 SPT N-values with the corresponding depth of different hammer type
Donut hammer
BH ID Depth Nf Lithological Description
BH1
1.5 10.0 Firm, black to dark brown, highly plastic silty CLAY
3.0 8.0 Firm, black to dark brown, highly plastic silty CLAY
4.5 7.0 Stiff, reddish brown, highly plastic silty CLAY with some whitish
pebbles 6.0 18.0
7.5 50.0
9.0 10.0 Hard to stiff, reddish brown to light gray, non-plastic clayey SILT with
vesicular basalt gravels 10.5 7.0
BH2
2.0 9.0
Dark gray, high plastic silty CLAY 4.5 8.0
6.0 7.0
8.0 10.0
BH3
1.5 7.0
Firm to stiff, light gray, highly plastic silty CLAY 4.5 10.0
6.0 12.0
8.0 13.0
BH4
1.5 6.0 Firm, dark grey, highly plastic silty CLAY
3.6 7.0 Firm to stiff, light grey, highly plastic silty CLAY
5.0 10.0
Firm to stiff, light grey, highly plastic silty CLAY 7.5 16.0
9.6 18.0
BH No. Rig type Drilling
method
Hammer
type Drill stem
Condition of
rope
Hammer
lifting
system
BH01-
BH06
Conventional,
HXY – 2BT
Rotary
core
drilling
Donut
Hammer AWJ
Good condition Cathead
and rope
system
BH07-
BH08
XY- 200
spindle type
China rigs
Rotary
core
drilling
Donut
Hammer AWJ
Good condition Cathead
and rope
system
BH09-
BH15
Wire line, SH-
700
Rotary
core
drilling
Automatic
Hammer AWJ
- Trip
system
BH16-
BH22
SH-100 Korea
rigs
Rotary
core
drilling
Automatic
Hammer AWJ
- Trip
system
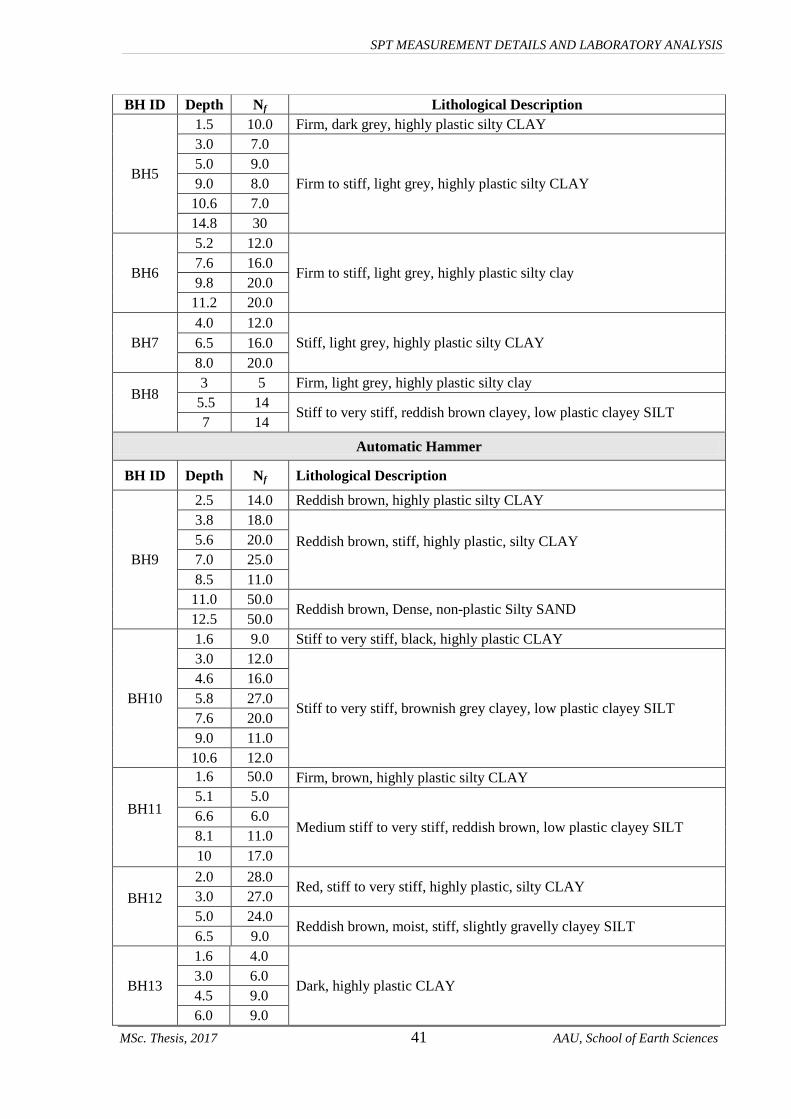
MSc. Thesis, 2017 41 AAU, School of Earth Sciences
SPT MEASUREMENT DETAILS AND LABORATORY ANALYSIS
BH ID Depth Nf Lithological Description
BH5
1.5 10.0 Firm, dark grey, highly plastic silty CLAY
3.0 7.0
Firm to stiff, light grey, highly plastic silty CLAY
5.0 9.0
9.0 8.0
10.6 7.0
14.8 30
BH6
5.2 12.0
Firm to stiff, light grey, highly plastic silty clay 7.6 16.0
9.8 20.0
11.2 20.0
BH7
4.0 12.0
Stiff, light grey, highly plastic silty CLAY 6.5 16.0
8.0 20.0
BH8
3 5 Firm, light grey, highly plastic silty clay
5.5 14 Stiff to very stiff, reddish brown clayey, low plastic clayey SILT
7 14
Automatic Hammer
BH ID Depth Nf Lithological Description
BH9
2.5 14.0 Reddish brown, highly plastic silty CLAY
3.8 18.0
Reddish brown, stiff, highly plastic, silty CLAY
5.6 20.0
7.0 25.0
8.5 11.0
11.0 50.0 Reddish brown, Dense, non-plastic Silty SAND
12.5 50.0
BH10
1.6 9.0 Stiff to very stiff, black, highly plastic CLAY
3.0 12.0
Stiff to very stiff, brownish grey clayey, low plastic clayey SILT
4.6 16.0
5.8 27.0
7.6 20.0
9.0 11.0
10.6 12.0
BH11
1.6 50.0 Firm, brown, highly plastic silty CLAY
5.1 5.0
Medium stiff to very stiff, reddish brown, low plastic clayey SILT 6.6 6.0
8.1 11.0
10 17.0
BH12
2.0 28.0 Red, stiff to very stiff, highly plastic, silty CLAY
3.0 27.0
5.0 24.0 Reddish brown, moist, stiff, slightly gravelly clayey SILT
6.5 9.0
BH13
1.6 4.0
Dark, highly plastic CLAY 3.0 6.0
4.5 9.0
6.0 9.0
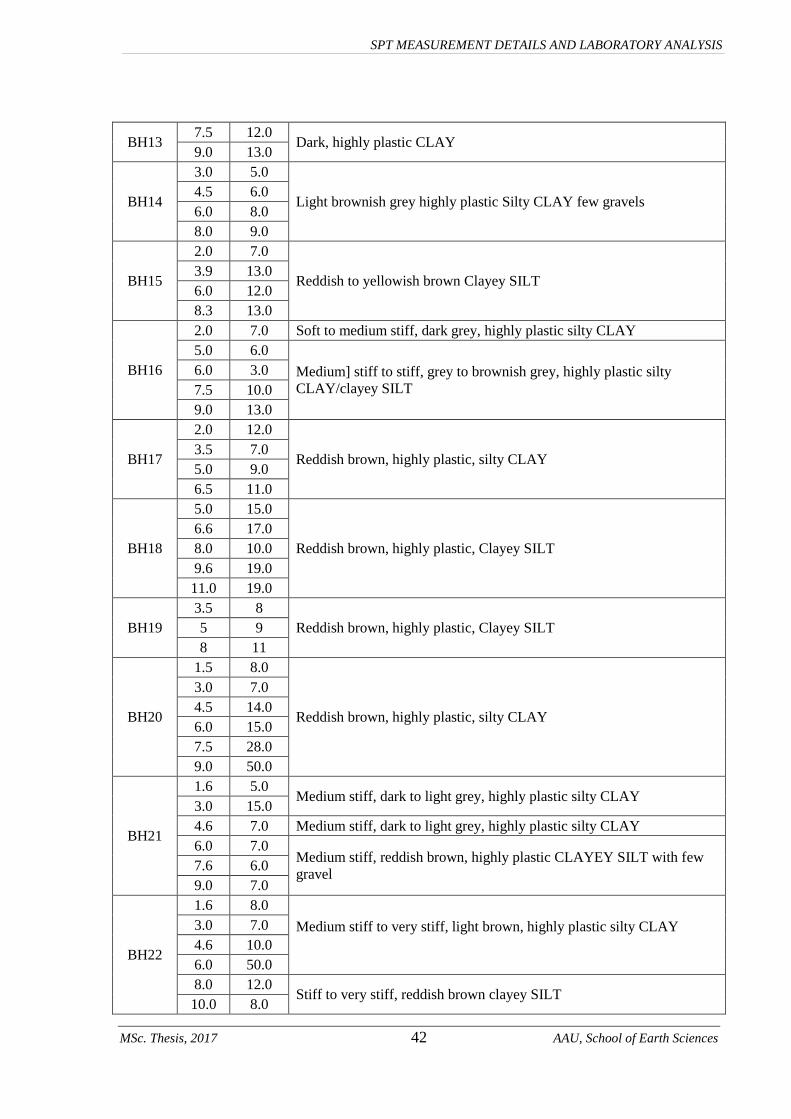
MSc. Thesis, 2017 42 AAU, School of Earth Sciences
SPT MEASUREMENT DETAILS AND LABORATORY ANALYSIS
BH13 7.5 12.0
Dark, highly plastic CLAY 9.0 13.0
BH14
3.0 5.0
Light brownish grey highly plastic Silty CLAY few gravels 4.5 6.0
6.0 8.0
8.0 9.0
BH15
2.0 7.0
Reddish to yellowish brown Clayey SILT 3.9 13.0
6.0 12.0
8.3 13.0
BH16
2.0 7.0 Soft to medium stiff, dark grey, highly plastic silty CLAY
5.0 6.0
Medium] stiff to stiff, grey to brownish grey, highly plastic silty
CLAY/clayey SILT
6.0 3.0
7.5 10.0
9.0 13.0
BH17
2.0 12.0
Reddish brown, highly plastic, silty CLAY 3.5 7.0
5.0 9.0
6.5 11.0
BH18
5.0 15.0
Reddish brown, highly plastic, Clayey SILT
6.6 17.0
8.0 10.0
9.6 19.0
11.0 19.0
BH19
3.5 8
Reddish brown, highly plastic, Clayey SILT 5 9
8 11
BH20
1.5 8.0
Reddish brown, highly plastic, silty CLAY
3.0 7.0
4.5 14.0
6.0 15.0
7.5 28.0
9.0 50.0
BH21
1.6 5.0 Medium stiff, dark to light grey, highly plastic silty CLAY
3.0 15.0
4.6 7.0 Medium stiff, dark to light grey, highly plastic silty CLAY
6.0 7.0 Medium stiff, reddish brown, highly plastic CLAYEY SILT with few
gravel 7.6 6.0
9.0 7.0
BH22
1.6 8.0
Medium stiff to very stiff, light brown, highly plastic silty CLAY
3.0 7.0
4.6 10.0
6.0 50.0
8.0 12.0 Stiff to very stiff, reddish brown clayey SILT
10.0 8.0
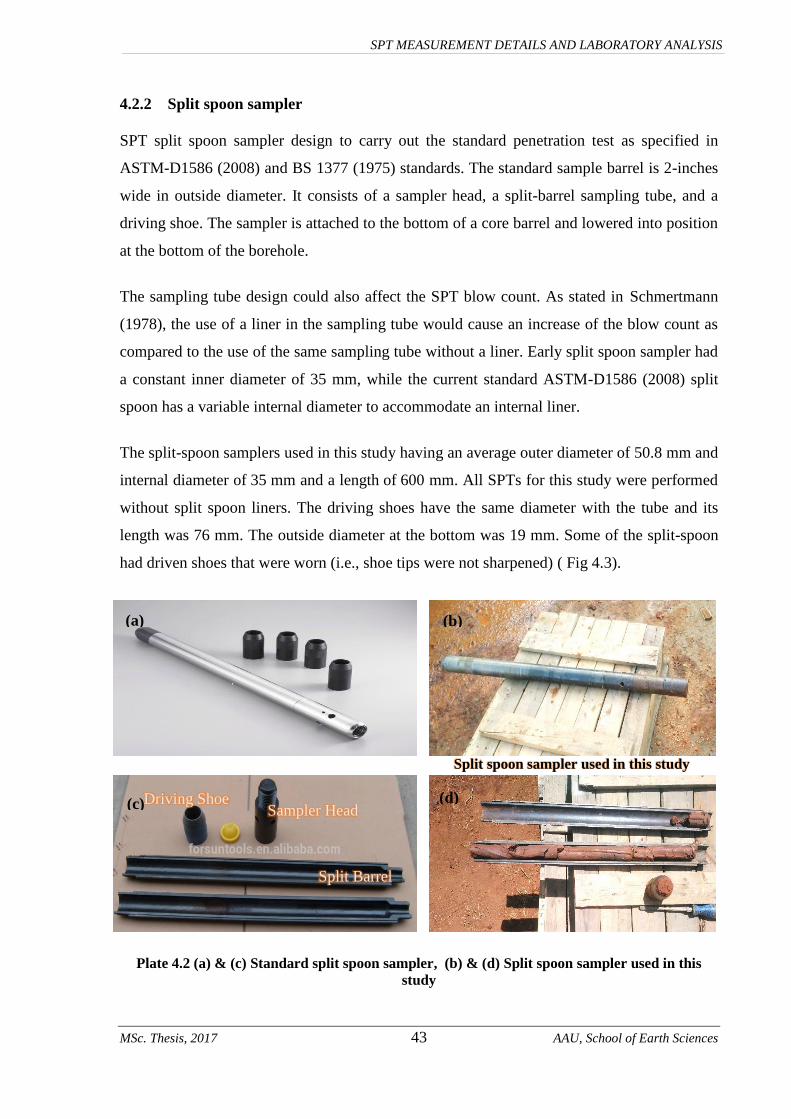
MSc. Thesis, 2017 43 AAU, School of Earth Sciences
SPT MEASUREMENT DETAILS AND LABORATORY ANALYSIS
4.2.2 Split spoon sampler
SPT split spoon sampler design to carry out the standard penetration test as specified in
ASTM-D1586 (2008) and BS 1377 (1975) standards. The standard sample barrel is 2-inches
wide in outside diameter. It consists of a sampler head, a split-barrel sampling tube, and a
driving shoe. The sampler is attached to the bottom of a core barrel and lowered into position
at the bottom of the borehole.
The sampling tube design could also affect the SPT blow count. As stated in Schmertmann
(1978), the use of a liner in the sampling tube would cause an increase of the blow count as
compared to the use of the same sampling tube without a liner. Early split spoon sampler had
a constant inner diameter of 35 mm, while the current standard ASTM-D1586 (2008) split
spoon has a variable internal diameter to accommodate an internal liner.
The split-spoon samplers used in this study having an average outer diameter of 50.8 mm and
internal diameter of 35 mm and a length of 600 mm. All SPTs for this study were performed
without split spoon liners. The driving shoes have the same diameter with the tube and its
length was 76 mm. The outside diameter at the bottom was 19 mm. Some of the split-spoon
had driven shoes that were worn (i.e., shoe tips were not sharpened) ( Fig 4.3).
Plate 4.2 (a) & (c) Standard split spoon sampler, (b) & (d) Split spoon sampler used in this
study
Split spoon sampler used in this study
Driving Shoe Sampler Head
Split Barrel
(a) (b)
(d) (c)

MSc. Thesis, 2017 44 AAU, School of Earth Sciences
SPT MEASUREMENT DETAILS AND LABORATORY ANALYSIS
Plate 4.3 (a) Deformed driving shoe, (b) New driving shoe
4.3 SPT Procedure
SPT test procedure was comprised in four steps, the test hole, assembling equipment,
penetration interval and handling samples.
Step 1 - Drill the hole to the desired sampling depth and clean out all disturbed material.
Step 2 - Attach the split-barrel sampler to the drill-rod and lower into the hole until it is
reached on the undisturbed material then attached the drive weight assembly and lift the
hammer approximately 76 cm and allow it to fall on the anvil delivering one seating blow
then mark the drill rod in three successive 15 cm increments to observe penetration. The
blow count data was recorded for each of three consecutive 15 cm increments of drive of the
sampling spoon sampler.
Step 3 - Raise and drop the hammer by means of the lifting and dropping mechanisms. The
hammer should be operated between 40 and 60 blows per minute and should drop freely. The
blow rate is depending on the efficiency of the rigs, types of hammer and hammer lifting
mechanisms. The recorded rate values of application for automatic hammers is on the range
of 24 to 30 blows per minute (b/min) whereas donut hammer is on the range of 15 to 20 blow
per minute (b/min). The blows were counted until the sampler has penetrated 45 cm into the
soil at the bottom of the borehole or until refusal has occurred. Refusal is defined as the
condition when 50 blows have been applied during any one of three 150 mm increments of
drive. Finally the number of blows recorded for each 15 cm increment of penetration.
However the first 15 cm of drive is rejected because it is considered as a seating drive. Thus
(a) (b)
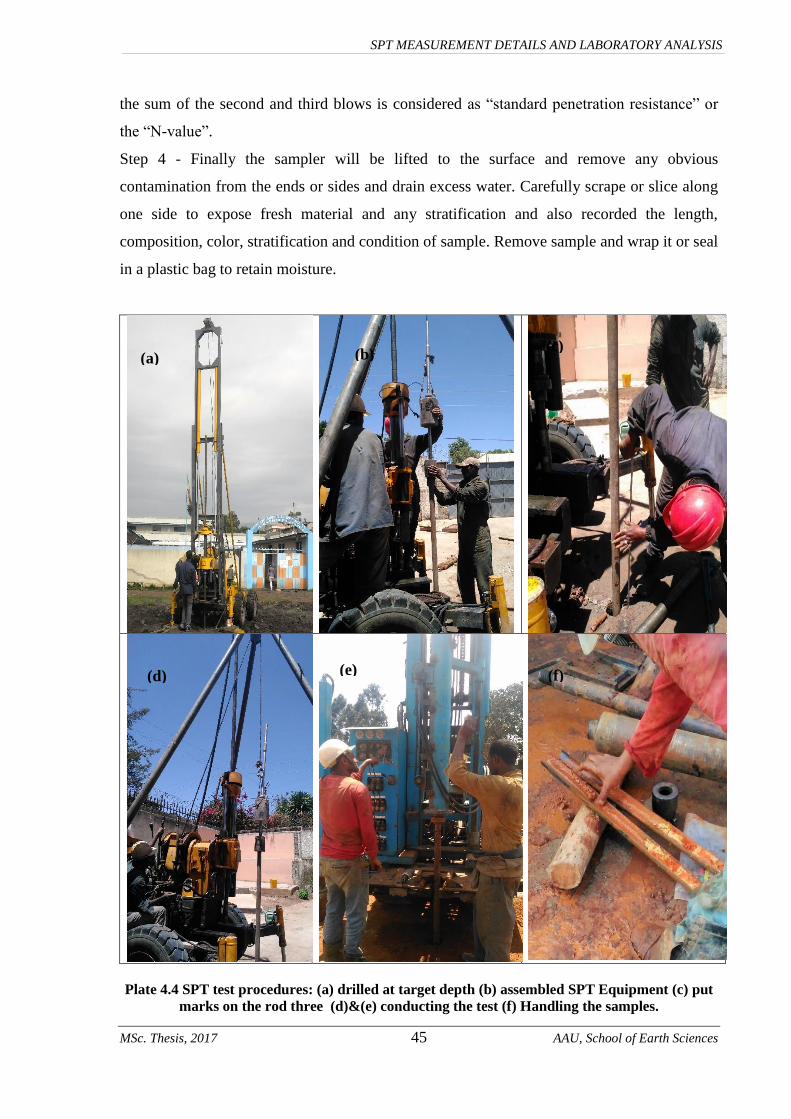
MSc. Thesis, 2017 45 AAU, School of Earth Sciences
SPT MEASUREMENT DETAILS AND LABORATORY ANALYSIS
the sum of the second and third blows is considered as “standard penetration resistance” or
the “N-value”.
Step 4 - Finally the sampler will be lifted to the surface and remove any obvious
contamination from the ends or sides and drain excess water. Carefully scrape or slice along
one side to expose fresh material and any stratification and also recorded the length,
composition, color, stratification and condition of sample. Remove sample and wrap it or seal
in a plastic bag to retain moisture.
Plate 4.4 SPT test procedures: (a) drilled at target depth (b) assembled SPT Equipment (c) put
marks on the rod three (d)&(e) conducting the test (f) Handling the samples.
(a) (b)
(d) (e) (f)
(c)
MSc. Thesis, 2017 46 AAU, School of Earth Sciences
SPT MEASUREMENT DETAILS AND LABORATORY ANALYSIS
4.4 Standardization of SPT N-values
Accurate measurement of the N-value and correcting those values with the appropriate
correction factor is extremely important in engineering design. The observed SPT N-values
as measured in the field are not reliable due to several factors such as the energy efficiency,
split spoon sampler design, diameter of the borehole and rod length and other factors
(Aggour and Radding, 2001). Thus, corrections are needed to apply in SPT blow counts in
order to achieve a normalized value prior to use.
Correction factors have been proposed by various authors to account the above factors;
Bowles (1997), listed five correction factors comprises hammer efficiency, sampler, rod
length, and borehole diameter and depth correction. While recent papers (Mostefa and
Mohammed, (2013) and McGregor and Duncan (1998)) has been applied seven correction
factors includes anvil and blow rate correction. In this research, the following equation is
employed to adjust the SPT values.
Ncor is calculated using Eq. 4.2. (McGregor and Duncan 1998):
Eq 4.1
Where
= adjusted N
= adjustment for overburden pressure
p’o (kPa)
= overburden pressure
= reference overburden pressure
= Energy correction (where is average energy ratio that depends on
the drill system and is the standard energy ratio).
= Rod length correction
= Sampler correction
= Borehole diameter correction
= Anvil correction
= Blow count frequency correction
There are several publications recommending that a standard energy ratio (Erb) should be
adopted for SPT investigations in to allow reproducible and consistent blow counts. Kovacs
(1983) initially suggested that order 55% be adopted as the efficiency at which most drill rig
MSc. Thesis, 2017 47 AAU, School of Earth Sciences
SPT MEASUREMENT DETAILS AND LABORATORY ANALYSIS
systems operated at the time that empirical correlations were made. Seed (1985), suggested
instead that 60% be used since it is associated with the safety hammer whereas, Bowles
(1997), has recommended 70% be used (Aggour and Radding, 2001). These estimates are the
basis for the proposed correction factors for hammer types. In this study it is adopted 70% as
the standard energy ratio since it will greatly minimize field data (N-value) and it is more
recent suggestion using current drilling equipment with a donut or an automatic hammer
technology. In most cases, local practices were usually employed to estimate the energy
efficiency; and the energy ratio often assumed 45% and 60% of donut hammer and automatic
hammer, respectively. The values for the above factors used from Bowles (1997), listed in
Table 4.5.
⁄ Eq
4.2
The SPT is considered to be standard to the energy ratio Er = 70%.
⁄
⁄
Since the drilling rigs considered in this research are equipped with a donut and automatic
hammer; the hammer correction factors of 0.64 and 0.84 are used, respectively. When the
length of the drill rod is less than 3m, a considerable amount of energy is reflected back in
the rod reducing the energy available for driving the sampling tube into the ground, thus it is
recommended that the Nf values should be corrected for short lengths of rods. The rod length
correction was performed according to Table 4.3.
SPT Nf values are corrected if they are made in boreholes having diameter larger than
114mm.When boreholes diameter are larger than 114mm, measured Nf values are lower than
they would be for a smaller diameter hole. All boreholes had a diameter between 60 - 120
mm; thus, the borehole diameter correction is 1.0. The split spoon had a constant diameter of
35 mm (without liner); thus, the split spoon configuration correction is 1.0.

MSc. Thesis, 2017 48 AAU, School of Earth Sciences
SPT MEASUREMENT DETAILS AND LABORATORY ANALYSIS
When the hammer falls during the SPT testing, it strikes an anvil attached to the drill rod
stem. The anvil can vary in shape, size and weight. The amount of energy transferred to the
drill rods depends on the weight of the anvil. Therefore the values used for correction for
donut and automatic hammer are 0.70 and 0.90 respectively. The last correction is blow
count frequency this depending on hammer type and rig type. As mentioned previously the
recorded rate values of application for automatic hammers is on the range of 24 to 30 blows
per minute (b/min) whereas donut hammer is on the range of 15 to 20 blow per minute
(b/min). Thus the correction factor that was used for both types of hammer was taken 1.05
(Table 4.4).
Table 4.3 SPT field correction factors (Bowles, 1997)
Hammer for η1= Er/70
Average Energy Ratio, Er
Donut Safety
Country Rope-Pulley Trip Rope-Pulley Trip/Auto
United States 45 - 70-80 80-100
Japan 67 78 - -
United Kingdom - - 50 60
China 50 60 - -
Rod Length Correction, η2
Length >10m η2 = 1.00
6-10m = 0.95
4-6m = 0.85
0-4m = 0.75
Sampler Correction, η3
Without liner η3=1.00
With liner: Dense sand, clay = 0.80
Loose sand = 0.90
Borehole Diameter Correction, η4
Hole diameter: 60-120mm η4=1.00
150mm =1.05
200mm =1.15
Table 4.4 Anvil and blow rate correction (Seed (1984) per McGregor and Duncan (1998)).
Anvil Correction, η5
Small
Large
Safety
0.85
0.7
0.9
Corrections for Blow Rate (CBF), η6
>20
<20
10-20b/m - 0.95
10-20 b/m - 1.05

MSc. Thesis, 2017 49 AAU, School of Earth Sciences
SPT MEASUREMENT DETAILS AND LABORATORY ANALYSIS
The final adjustment of measured SPT (N-values) is presented in the table 4.5 by applying
various corrections as mention earlier.

MSc. Thesis, 2017 50 AAU, School of Earth Sciences
SPT MEASUREMENT DETAILS AND LABORATORY ANALYSIS
Table 4.5 Adjusted measured SPT N-values
Ham
mer
Typ
e
BH
ID
Tes
t p
oin
t (m
)
Dep
th o
f
Str
atu
m (
m)
Nf
γ (k
N/m
3)
σ' v
(k
N/m
2)
CN
η1=
E
r/E
70
η1=
E
r/E
60
η2
η3
η4
η5
η6
N7
0
N6
0
Don
ut
BH-1 6.00 6.00 18.00 14.30 85.80 1.00 0.64 0.75 0.95 1.00 1.00 0.70 1.05 8 9
BH-2 4.50 4.50 14.00 20.10 90.45 1.00 0.64 0.75 0.85 1.00 1.00 0.70 1.05 5 7
BH-3 4.50 4.50 10.00 20.80 93.60 1.00 0.64 0.75 0.85 1.00 1.00 0.70 1.05 4 5
BH-4 3.00 3.00 7.00 18.00 54.00 1.00 0.64 0.75 0.75 1.00 1.00 0.70 1.05 2 3
BH-5 10.00 10.00 30.00 18.00 180.73 0.73 0.64 0.75 1.00 1.00 1.00 0.70 1.05 10 12
BH-6 7.60 7.60 16.00 18.24 138.62 0.83 0.64 0.75 0.95 1.00 1.00 0.70 1.05 5 7
BH-7 7.70 7.70 21.00 18.00 138.60 0.83 0.64 0.75 0.95 1.00 1.00 0.70 1.05 7 9
BH-8 5.50 5.50 14.00 19.00 12.05 1.00 0.64 0.75 0.85 1.00 1.00 0.70 1.05 5 7
Au
tom
ati
c
BH-9 7.00 7.00 25.00 17.98 125.86 0.87 0.86 1.00 0.95 1.00 1.00 0.70 1.05 13 15
BH-10 5.90 5.90 14.00 17.57 103.65 0.96 0.86 1.00 0.85 1.00 1.00 0.70 1.05 7 8
BH-11 5.00 5.00 5.00 17.44 87.20 1.00 0.86 1.00 0.85 1.00 1.00 0.90 1.05 3 4
BH-12 3.50 3.50 27.00 21.58 75.53 1.00 0.86 1.00 0.75 1.00 1.00 0.90 1.05 16 19
BH-13 4.50 4.50 9.00 17.25 77.63 1.00 0.86 1.00 0.85 1.00 1.00 0.90 1.05 6 7
BH-14 3.50 3.50 5.00 17.47 61.13 1.00 0.86 1.00 0.75 1.00 1.00 0.90 1.05 3 4
BH-15 4.50 4.50 13.00 16.66 74.97 1.00 0.86 1.00 0.85 1.00 1.00 0.90 1.05 8 10
BH-16 4.50 4.50 6.00 18.28 82.26 1.00 0.86 1.00 0.85 1.00 1.00 0.90 1.05 4 5
BH-17 3.50 3.50 7.00 17.82 62.37 1.00 0.86 1.00 0.75 1.00 1.00 0.90 1.05 4 5
BH-18 6.50 6.50 17.00 19.10 124.17 0.88 0.86 1.00 0.95 1.00 1.00 0.90 1.05 11 13
BH-19 3.50 3.50 8.00 15.82 55.37 1.00 0.86 1.00 0.75 1.00 1.00 0.90 1.05 4 6
BH-20 2.90 2.90 7.00 17.00 49.30 1.00 0.86 1.00 0.75 1.00 1.00 0.90 1.05 4 5
BH-21 4.55 4.55 7.00 18.76 85.36 1.00 0.86 1.00 0.85 1.00 1.00 0.90 1.05 4 6
BH-22 4.5 4.5 12 17.83 80.24 1.00 0.86 1.00 0.85 1.00 1.00 0.90 1.05 8 10
MSc. Thesis, 2017 51 AAU, School of Earth Sciences
SPT MEASUREMENT DETAILS AND LABORATORY ANALYSIS
4.5 Laboratory and Field Test Analysis
The field and laboratory tests have been used for determination engineering and physical
properties of the fine grained soils. These tests include the unconfined compressive test,
Atterberg limits, moisture content and standard penetration test. Most problems in
construction involve either the strength of the in-situ soil or the compressibility of the
soil.
In this study a total of twenty two undisturbed samples were taken (one per borehole) for
conducted unconfined compressive test (UC) and disturbed samples for classification tests.
The primary purpose of UC test is to determine the unconfined compressive strength (qu),
which is then used to calculate the unconsolidated undrained shear strength of the clay under
unconfined conditions. According to the ASTM D 2166 (2004), the unconfined compressive
strength is defined as the compressive stress at which an unconfined cylindrical specimen of
soil will fail in a simple compression test. In addition, in this test method, the unconfined
compressive strength is taken as the maximum load attained per unit area, whichever occurs
first during the performance of a test.
In fine grained soils the penetration resistance is broadly a function of undrained shear
strength. The undrained shear strength of soils is necessary for the determination of the
bearing capacity of foundations and other civil structures.
Cu of a cohesive soil is equal to one-half the unconfined compressive strength (qu) when the
soil is under the f = 0 condition (f = the angle of internal friction). This is expressed as: using
for determine unconfined compressive strength (qu) and with full saturation of sample, Cu can
be obtained from the Eq. 4.3 (Hara et al, 1974):
Cu = 0.5qu …...………………………………………………………………………….Eq 4.3
The test was performed according to ASTM D2166 (2004), the test were carried out on
shelby tube samples recovered from the borings as essentially unaltered moisture content and
especial attention was given during transportation and testing procedures in order to avoid
inappropriate result.
On the other hand seive analysis, atterberg limits and moisture content were carried out from
disturbed samples. Plasticity index (PI) and liquid limit (LL) can be used to determine

MSc. Thesis, 2017 52 AAU, School of Earth Sciences
SPT MEASUREMENT DETAILS AND LABORATORY ANALYSIS
the swelling characteristics of fine grain soil. Table 4.6 summarizes the representative SPT
N-value (the test conducted while the undisturbed samples were taken) with engineering
properties of fine grain soils.
Table 4.6 Geotechnical properties of collected soils
Soil Type BH ID Test
Depth Nf Seive LL PL PI Y Wn qu Cu
Dark to
light
CLAY
BH-2 5 14 99 78 35 43 20 30 130 65
BH-3 5 10 99 71 30 41 21 38 72 36
BH-4 3 7 95 78 42 36 18 34 38 19
BH-7 8 21 98 89 43 46 18 38 68 34
BH-13 5 9 92 77 41 36 17 29 106 53
BH-14 4 5 97 95 50 45 17 42 89 44
BH-21 5 7 96 64 39 25 19 40 81 41
BH-22 5 12 96 74 34 40 18 40 85 43
Red
CLAY
BH-1 6 18 86 86 41 45 14 30 218 109
BH-5 10 30 86 50 34 16 18 37 271 136
BH-9 7 25 94 56 29 27 18 35 220 110
BH-12 4 27 90 62 32 30 22 33 266 133
BH-16 5 6 98 90 50 40 18 41 59 29
BH-17 4 7 85 92 43 49 18 30 79 39
BH-20 3 7 92 89 43 46 17 45 150 75
Red SILT
BH-6 8 16 95 92 43 49 18 38 65 33
BH-8 6 14 95 57 29 28 19 35 176 88
BH-10 6 14 92 40 28 12 18 36 199 99
BH-11 5 5 93 60 29 31 17 49 68 34
BH-15 5 13 98 68 35 33 17 41 83 41
BH-18 7 17 92 56 32 24 19 33 143 71
BH-19 4 8 85 52 33 19 16 31 105 53
As mentioned in the previous chapter, the type of fine grained soils that are encountered in
the study area are red clay, dark clay and red silt soils. The soils’ consistency is considered
from the results of SPT blow count, based on the Terzaghi and Peck, (1967) and Bowles
(1997) correlation.
Table 4.7 Consistency of fine grain soil
N (Terzaghi and Peck, 1967) N (Bowles 1997) Consistency qu(kN/m2)
0-2
2-4
4-8
8-15
15-30
>30
0-2
3-5
6-9
10-16
17-30
>30
Very soft
Soft
Firm
Stiff
Very stiff
Hard
<25
25-50
50-100
100-200
200-400
>400

MSc. Thesis, 2017 53 AAU, School of Earth Sciences
SPT MEASUREMENT DETAILS AND LABORATORY ANALYSIS
Based on field and laboratory test result, the fine grained soils are described below;
Accordingly, the dark grey soils recorded from 5 to 21 blows per 30 cm penetration and the
corresponding Cu values yielded on the range of 19 kPa to 65 kPa; which implied the soil is
firm to very stiff. Plasticity index and liquid limit values ranging from 25% - 46% and 64% -
95% respectively. It implies that the dark grey soil is medium to highly plastic. The
percentage of the material finer than the 0.075 mm sieve ranges from 86% - 95%.
The red clay soils recorded from 6 to 30 blows per 30 cm penetration and the corresponding
Cu values yielded on the range of 29 kPa to 136 kPa; which implied the soil is firm to very
stiff. Plasticity index and liquid limit values ranging from 16% - 45% and 50% - 86%,
respectively. It implies that the red clay soil is medium to highly plastic. The percentage of
the material finer than the 0.075 mm sieve ranges from 81% - 99%.
The red silt soils recorded from 5 to 30 blows per 30 cm penetration and the corresponding
Cu values yielded on the range of 33 kPa to 99 kPa; which implied the soil is firm to very
stiff. Plasticity index and liquid limit values ranging from 12% - 52% and 28% - 92%,
respectively. It implies that the red silt soil is low to highly plastic. The percentage of the
material finer than the 0.075 mm sieve ranges from 77% - 90%.
4.6 Overall SPT Measurement Results
The tests were carried out in fourteen boreholes by automatic hammer and eight boreholes
were tested by donut hammer. A total of 100 SPT blow counts at the twenty two sites were
used for this research. N-values with the corresponding depth for each borehole of both
hammer types are shown in figure 4.2.
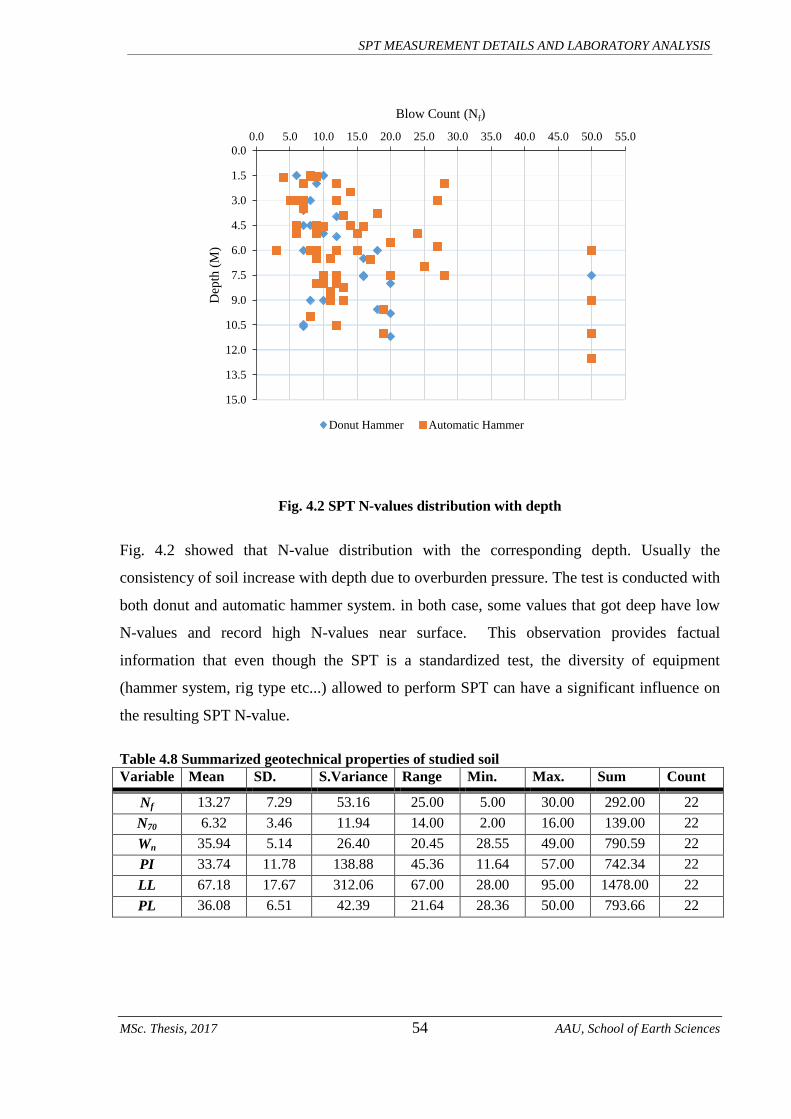
MSc. Thesis, 2017 54 AAU, School of Earth Sciences
SPT MEASUREMENT DETAILS AND LABORATORY ANALYSIS
Fig. 4.2 SPT N-values distribution with depth
Fig. 4.2 showed that N-value distribution with the corresponding depth. Usually the
consistency of soil increase with depth due to overburden pressure. The test is conducted with
both donut and automatic hammer system. in both case, some values that got deep have low
N-values and record high N-values near surface. This observation provides factual
information that even though the SPT is a standardized test, the diversity of equipment
(hammer system, rig type etc...) allowed to perform SPT can have a significant influence on
the resulting SPT N-value.
Table 4.8 Summarized geotechnical properties of studied soil
Variable Mean SD. S.Variance Range Min. Max. Sum Count
Nf 13.27 7.29 53.16 25.00 5.00 30.00 292.00 22
N70 6.32 3.46 11.94 14.00 2.00 16.00 139.00 22
Wn 35.94 5.14 26.40 20.45 28.55 49.00 790.59 22
PI 33.74 11.78 138.88 45.36 11.64 57.00 742.34 22
LL 67.18 17.67 312.06 67.00 28.00 95.00 1478.00 22
PL 36.08 6.51 42.39 21.64 28.36 50.00 793.66 22
0.0
1.5
3.0
4.5
6.0
7.5
9.0
10.5
12.0
13.5
15.0
0.0 5.0 10.0 15.0 20.0 25.0 30.0 35.0 40.0 45.0 50.0 55.0
Dep
th (
M)
Blow Count (Nf)
Donut Hammer Automatic Hammer

MSc. Thesis, 2017 55 AAU, School of Earth Sciences
SPT MEASUREMENT DETAILS AND LABORATORY ANALYSIS
Fig. 4.3 SPT N-values with depth in silty clay soils
Fig. 4.4 SPT N-values with depth in clayey silt soils
As illustrated in the figures 4.3 & 4.4 the tests were conducted by donut and automatic
hammer on both silty clay and clayey silt soils. The test that conducted in clay soil have
different value the even count in the same depth and also recorded high N-value in the clay
soils around 50, this is due to the data collected in dry season so it may be increase the
stiffness of the soil. The consistency of the soil was not increase with depth whereas The N-
values of silt soil recorded by both types of hammer were relatively increased with depth than
0
2
4
6
8
10
12
0 5 10 15 20 25 30
Dep
th (
m)
Blow count (Nf)
CLAYEY SILT SOILS
Donut Hammer Automatic Hammer
0
2
4
6
8
10
12
14
0 5 10 15 20 25 30 35 40 45 50 55
Dep
th (
m)
Blow Count (Nf)
SILTY CLAY SOILS
Donut Hammer Automatic Hammer

MSc. Thesis, 2017 56 AAU, School of Earth Sciences
SPT MEASUREMENT DETAILS AND LABORATORY ANALYSIS
clay soils. This indicated that SPT N-value high affected by clay soil than silt soil and the soil
type also one of the factor affecting the N-value.
As mentioned earlier in this study, SPT measurements were carried out in twenty two
boreholes with donut and automatic hammers. Researchers were indicated the result of a
standard penetration test is influenced by drilling technique, SPT test equipment and test
procedures. In this research work further, possible source of errors due to faulty equipment,
procedure and other are also considered as follows.
Used damage and old cutting shoes
The main advantage of cutting shoe is cutting and penetrating the soil while
conducting the test. Thus it should be sharp and new to give an appropriate result.
When the test is conducted in damage shoe the N-values result may increase and
overestimate the strength of foundation material. In this study it has been observed
some of the tests conducted in damaged and old cutting shoes; which caused the N-
values increase the blow counts.
Lack of hammer free fall
Due to the lack of free fall the hammer energy doesn’t reach at the bottom of the
testing depth. This is because of ungreased sheaves and as a result its increase SPT N-
values. In this study also observed such type of problem in donut hammers due to the
dropping/lifting mechanism (cathead and rope).
Rusty cathead and low-speed cathead
During carried out the test, it was noted that majority of the donut hammers have rusty
cathead and use low speed cathead. Such problems lead to decrease the hammer
energy delivered to split spoon sampler tips. Consequently it increases the N-value.
Hammer weight inaccuracy
In this study such type of errors was observed in donut hammer type. The hammer
weight has above the standard weight given by ASTMD1586 (2008). This may
decrease the N-value result.
Presence of gravels and pebbles
MSc. Thesis, 2017 57 AAU, School of Earth Sciences
SPT MEASUREMENT DETAILS AND LABORATORY ANALYSIS
In this research, the presence of pebbles and gravels in fine grain soil were observed
to affect the SPT measurement. It is also overestimating the consistency of the soil by
increasing the blow counts.
Stiffness of the soil
The consistency of soil is depends on the presence of water table or not around the
foundation material. Hence, the present study was carried out in dry season, most of
the borehole were dried. Some have a perched aquifer the N-value is very low.
Generally, SPT measurement helps try to identify the possible source of errors while
conducting the test especially from SPT equipment like hammer types, hammer weight, split
spoon sampler design and etc…The main source of errors that identified in this studies are,
used damage and old cutting shoes, hammer weight inaccuracy, rusty cathead and low-speed
cathead, presence of gravels and pebbles and stiffness of the soil. Most the identified errors
may overestimate the strength of the soil by increasing the result of N-value. Others are
underestimate the strength of soil by decreasing the N-values. Usually N-value increase when
getting depth due to overburden pressure but as shown in depth distribution of N-value it’s
not observed such type of relationship due to the above reasons.
*****
MSc. Thesis, 2017 58 AAU, School of Earth Sciences
ANALYSIS AND INTERPRETATION
CHAPTER 5 ANALYSIS AND INTERPRETATION
5.1 General
Despite the associated defect related to its less reproducibility, geotechnical engineers have
established correlations with the SPT N-values for most of the soil geotechnical properties. It
is known that there are well-established correlations, charts and empirical equations in
relation to the physical properties, in-situ state of stress, strength, and stiffness of the
cohesive soil to that of the SPT N-values. Though, it is quite unreliable to draw correlations
for in-situ shear strength of fine grained soils from SPT N-values. There are also few attempts
like penetration resistance in cohesive soil is broadly a function of undrained shear strength.
Cu of a cohesive soil is equal twelve times of N-value (Terzaghi and peck, 1967),
Schmertmann (1979) try to investigate the derivation of soil resistance in clay soil, at least
70% of the soil resistance can be derived from side shear, the remainder coming from end
bearing capacity and Stroud (1979) indicated that undrained shear strength is four times of N-
value.
Recent studies indicated that undrained shear strength of fine grain soil calculated from N-
value with atterberg limit and moisture content shows better empirical correlation. In this
chapter, then the correlations drawn from the SPT N-value to different geotechnical
properties of soils will be discussed and will be further compared to the results of this
research.
In correlation, it is known that it will be important to consider the correlation coefficient (R2),
and the best fitting plots between the results. According to Taylor (1990, as cited in Mostefa
and Mohammad, 2013) the purpose of using this statistical method is to give us a statistic
known as the correlation coefficient which is a summary value of a large set of data
representing the degree of linear association between two measured variables. R2 is a statistic
that will give some information about the best fit of a relationship. In regression, the R2
coefficient of determination is a statistical measure of how well the regression line
approximates the real data points. The values of R2, the relationship between any two
parameters can be classified as presented in table 5.1.
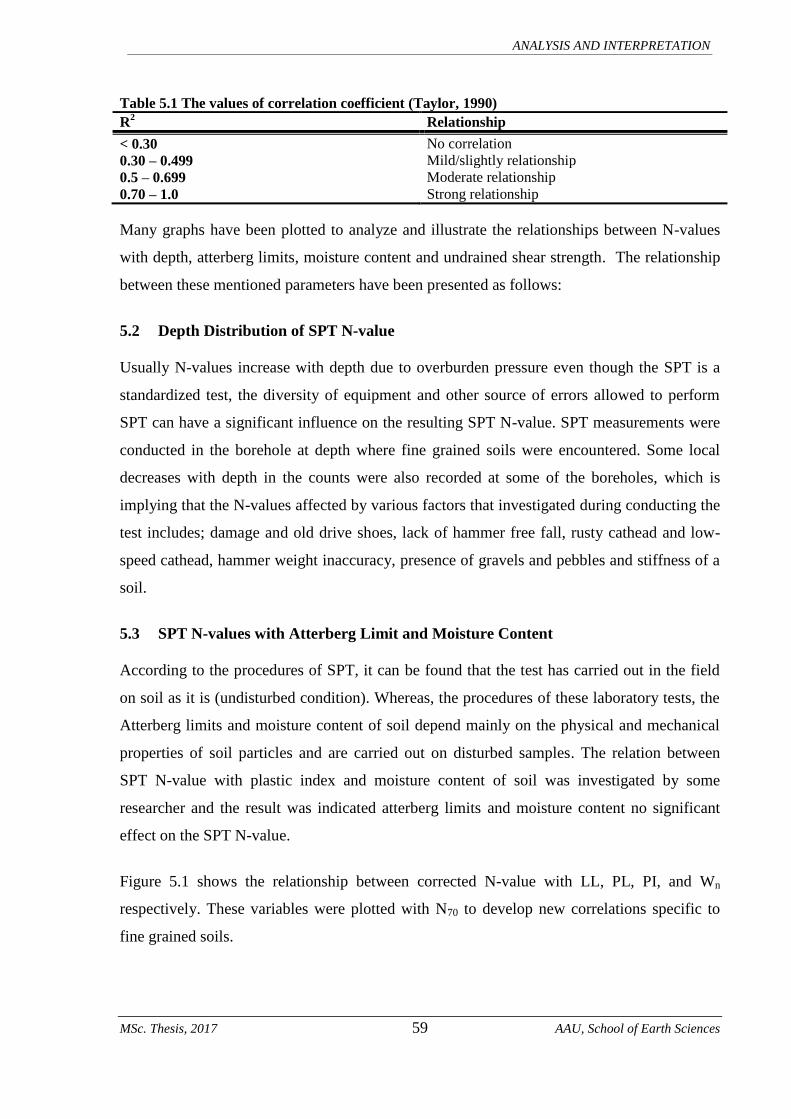
MSc. Thesis, 2017 59 AAU, School of Earth Sciences
ANALYSIS AND INTERPRETATION
Table 5.1 The values of correlation coefficient (Taylor, 1990)
R2 Relationship
< 0.30 No correlation
0.30 – 0.499 Mild/slightly relationship
0.5 – 0.699 Moderate relationship
0.70 – 1.0 Strong relationship
Many graphs have been plotted to analyze and illustrate the relationships between N-values
with depth, atterberg limits, moisture content and undrained shear strength. The relationship
between these mentioned parameters have been presented as follows:
5.2 Depth Distribution of SPT N-value
Usually N-values increase with depth due to overburden pressure even though the SPT is a
standardized test, the diversity of equipment and other source of errors allowed to perform
SPT can have a significant influence on the resulting SPT N-value. SPT measurements were
conducted in the borehole at depth where fine grained soils were encountered. Some local
decreases with depth in the counts were also recorded at some of the boreholes, which is
implying that the N-values affected by various factors that investigated during conducting the
test includes; damage and old drive shoes, lack of hammer free fall, rusty cathead and low-
speed cathead, hammer weight inaccuracy, presence of gravels and pebbles and stiffness of a
soil.
5.3 SPT N-values with Atterberg Limit and Moisture Content
According to the procedures of SPT, it can be found that the test has carried out in the field
on soil as it is (undisturbed condition). Whereas, the procedures of these laboratory tests, the
Atterberg limits and moisture content of soil depend mainly on the physical and mechanical
properties of soil particles and are carried out on disturbed samples. The relation between
SPT N-value with plastic index and moisture content of soil was investigated by some
researcher and the result was indicated atterberg limits and moisture content no significant
effect on the SPT N-value.
Figure 5.1 shows the relationship between corrected N-value with LL, PL, PI, and Wn
respectively. These variables were plotted with N70 to develop new correlations specific to
fine grained soils.
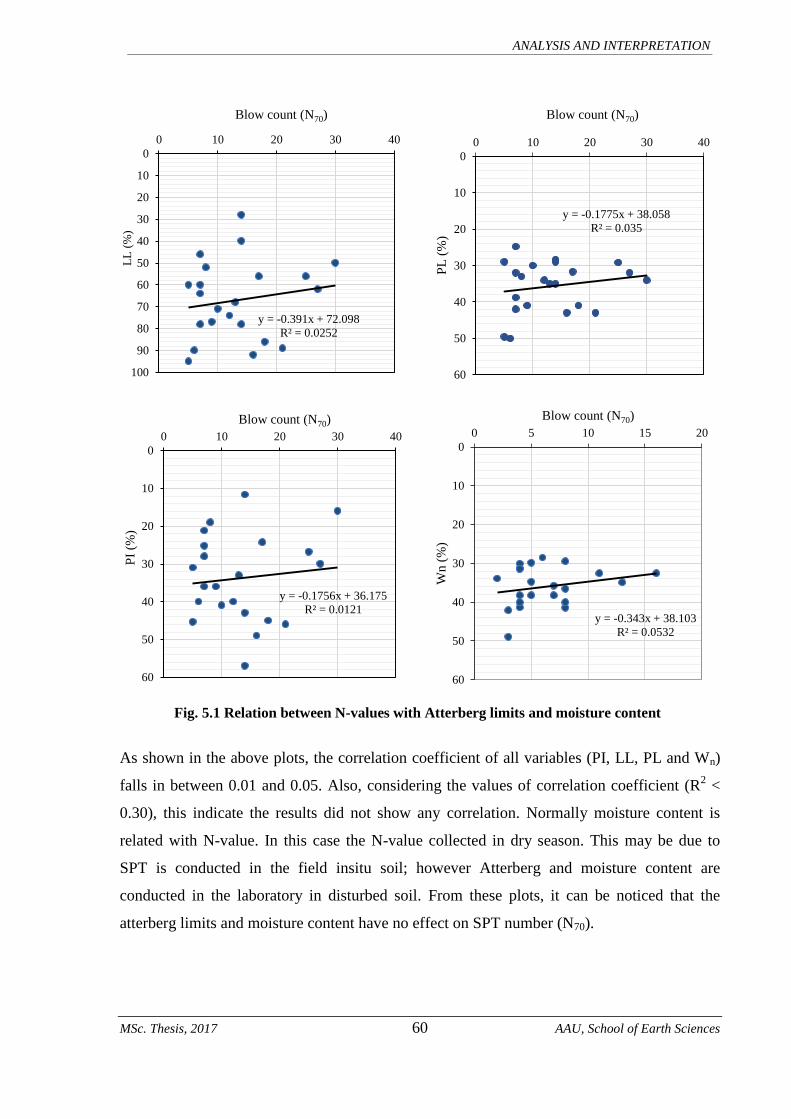
MSc. Thesis, 2017 60 AAU, School of Earth Sciences
ANALYSIS AND INTERPRETATION
Fig. 5.1 Relation between N-values with Atterberg limits and moisture content
As shown in the above plots, the correlation coefficient of all variables (PI, LL, PL and Wn)
falls in between 0.01 and 0.05. Also, considering the values of correlation coefficient (R2 <
0.30), this indicate the results did not show any correlation. Normally moisture content is
related with N-value. In this case the N-value collected in dry season. This may be due to
SPT is conducted in the field insitu soil; however Atterberg and moisture content are
conducted in the laboratory in disturbed soil. From these plots, it can be noticed that the
atterberg limits and moisture content have no effect on SPT number (N70).
y = -0.391x + 72.098
R² = 0.0252
0
10
20
30
40
50
60
70
80
90
100
0 10 20 30 40
LL
(%
) Blow count (N70)
y = -0.1775x + 38.058
R² = 0.035
0
10
20
30
40
50
60
0 10 20 30 40
PL
(%
)
Blow count (N70)
y = -0.1756x + 36.175
R² = 0.0121
0
10
20
30
40
50
60
0 10 20 30 40
PI
(%)
Blow count (N70)
y = -0.343x + 38.103
R² = 0.0532
0
10
20
30
40
50
60
0 5 10 15 20W
n (
%)
Blow count (N70)
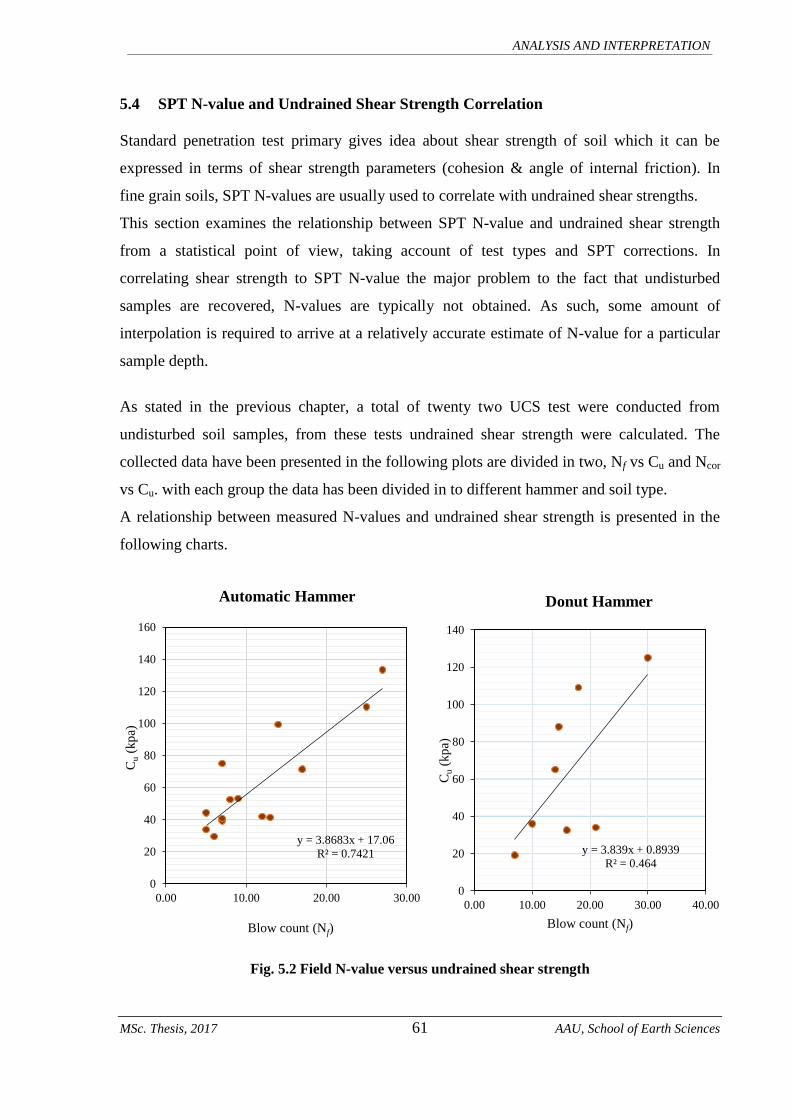
MSc. Thesis, 2017 61 AAU, School of Earth Sciences
ANALYSIS AND INTERPRETATION
5.4 SPT N-value and Undrained Shear Strength Correlation
Standard penetration test primary gives idea about shear strength of soil which it can be
expressed in terms of shear strength parameters (cohesion & angle of internal friction). In
fine grain soils, SPT N-values are usually used to correlate with undrained shear strengths.
This section examines the relationship between SPT N-value and undrained shear strength
from a statistical point of view, taking account of test types and SPT corrections. In
correlating shear strength to SPT N-value the major problem to the fact that undisturbed
samples are recovered, N-values are typically not obtained. As such, some amount of
interpolation is required to arrive at a relatively accurate estimate of N-value for a particular
sample depth.
As stated in the previous chapter, a total of twenty two UCS test were conducted from
undisturbed soil samples, from these tests undrained shear strength were calculated. The
collected data have been presented in the following plots are divided in two, Nf vs Cu and Ncor
vs Cu. with each group the data has been divided in to different hammer and soil type.
A relationship between measured N-values and undrained shear strength is presented in the
following charts.
Fig. 5.2 Field N-value versus undrained shear strength
y = 3.8683x + 17.06
R² = 0.7421
0
20
40
60
80
100
120
140
160
0.00 10.00 20.00 30.00
Cu (
kp
a)
Blow count (Nf)
Automatic Hammer
y = 3.839x + 0.8939
R² = 0.464
0
20
40
60
80
100
120
140
0.00 10.00 20.00 30.00 40.00
Cu (
kp
a)
Blow count (Nf)
Donut Hammer

MSc. Thesis, 2017 62 AAU, School of Earth Sciences
ANALYSIS AND INTERPRETATION
Fig. 5.3 Corrected SPT number versus undrained shear strength
The above plots shows the relationship between SPT N-values and undrained shear strength
of fine grain soil with automatic and donut hammer types. In Fig. 5.2 the automatic hammer
has a high correlation coefficient (R2 = 0.74), this can be an indication of a strong relationship
whereas the correlation coefficient of donut hammer test (R2 = 0.46) it implies that the test
has a mild relationship. This indicates that it is a fair correlation between Nf and Cu. Also,
Fig. 5.3, the correlation coefficient of an automatic hammer is 0.64 and 0.63 for donut
hammer. The relationships between Ncor and Cu in both cases are considered to a moderate
relationship.
Mostly the donut hammer types the correlation is increases after applying the correction
factors this implies hammer types highly affected the result of N-value compare to an
automatic hammer. Generally this leads to conclude that the undrained shear strength of fine
grain soil’s estimation from SPT is moderately affected by the hammer type.
It can be noticed that N-value increases as undrained shear strength of fine grain soil increase.
The increasing of shear strength parameters of soil is due to increasing in consistency which
leads to increasing in N-value. Therefore SPT can predict the strength of fine grain soil in
terms of undrained shear strength.
y = 6.3133x + 18.982
R² = 0.6405
0
20
40
60
80
100
120
140
160
0 5 10 15 20
Cu (
kp
a)
Blow count (Ncor)
Automatic Hammer
y = 10.446x + 0.8889
R² = 0.6334
0
20
40
60
80
100
120
140
0 5 10 15
Cu (
kp
a)
Blow count (Ncor)
Donut Hammer

MSc. Thesis, 2017 63 AAU, School of Earth Sciences
ANALYSIS AND INTERPRETATION
5.5 Data Analysis
The correlations were developed using simple linear regression and multi linear regression
analysis. Linear regression analysis is trying to establish linear correlations between
undrained shear strength and N-value, PI, LL, PL & Wn. In simple linear regression analysis
trying to establish linear correlations between SPT N-value and Cu using the least square
method whereas in multi linear regression analysis establish linear correlations in addition to
N-value, LL, PL, PI and Wn were included. This analysis is developed by linear regression
excel software (see Table 5.2).
Table 5.2 Summary Output regression analysis
Regression Statistics
N70 Nf
Multiple R 0.7816 0.776549
R Square 0.610898 0.603029
Adjusted R Square 0.591443 0.58318
Standard Error 21.68659 21.896
Observations 22 22
Coefficients Standard Error Lower 95.0% Upper 95.0%
Intercept 13.65212 9.700173 -6.58208 33.88633
N70 7.403143 1.321139 4.647296 10.15899
Coefficients Standard Error Lower 95.0% Upper 95.0%
Intercept 13.52698 9.871608 -7.06483 34.11879
Nf 3.612156 0.655333 2.245155 4.979156
Fig. 5.4 N-values versus undrained shear strength
y = 3.4889x + 16.15
R² = 0.5602
0
20
40
60
80
100
120
140
160
0.00 10.00 20.00 30.00 40.00
Cu (
kp
a)
Blow count (Nf)
Uncorrected N-values vs Cu
Cu Predicted Cu Linear (Cu)
y = 7.1637x + 15.893
R² = 0.5913
0
20
40
60
80
100
120
140
160
0 5 10 15 20
Cu (
kp
a)
Blow count (N70))
Corrected N-values vs Cu
Cu Predicted Cu Linear (Cu)
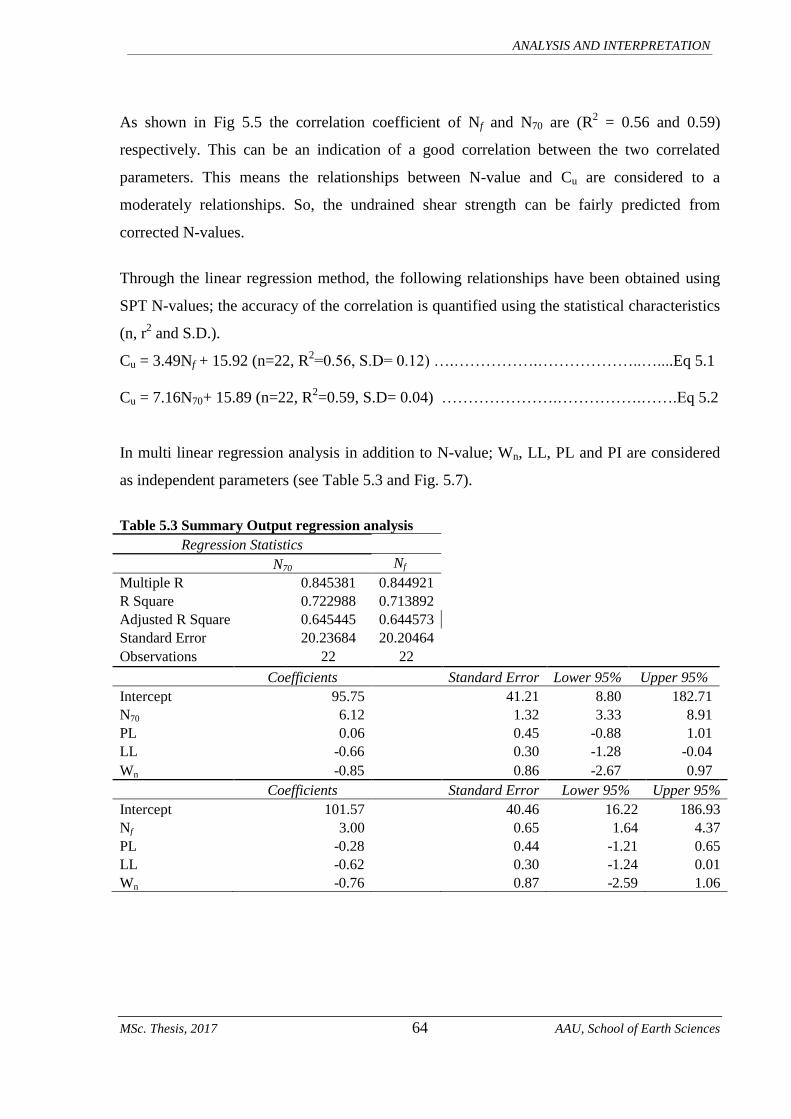
MSc. Thesis, 2017 64 AAU, School of Earth Sciences
ANALYSIS AND INTERPRETATION
As shown in Fig 5.5 the correlation coefficient of Nf and N70 are (R2 = 0.56 and 0.59)
respectively. This can be an indication of a good correlation between the two correlated
parameters. This means the relationships between N-value and Cu are considered to a
moderately relationships. So, the undrained shear strength can be fairly predicted from
corrected N-values.
Through the linear regression method, the following relationships have been obtained using
SPT N-values; the accuracy of the correlation is quantified using the statistical characteristics
(n, r2 and S.D.).
Cu = 3.49Nf + 15.92 (n=22, R2=0.56, S.D= 0.12) ….…………….………………..…....Eq 5.1
Cu = 7.16N70+ 15.89 (n=22, R2=0.59, S.D= 0.04) ………………….…………….…….Eq 5.2
In multi linear regression analysis in addition to N-value; Wn, LL, PL and PI are considered
as independent parameters (see Table 5.3 and Fig. 5.7).
Table 5.3 Summary Output regression analysis
Regression Statistics
N70 Nf
Multiple R 0.845381 0.844921
R Square 0.722988 0.713892
Adjusted R Square 0.645445 0.644573
Standard Error 20.23684 20.20464
Observations 22 22
Coefficients Standard Error Lower 95% Upper 95%
Intercept 95.75 41.21 8.80 182.71
N70 6.12 1.32 3.33 8.91
PL 0.06 0.45 -0.88 1.01
LL -0.66 0.30 -1.28 -0.04
Wn -0.85 0.86 -2.67 0.97
Coefficients Standard Error Lower 95% Upper 95%
Intercept 101.57 40.46 16.22 186.93
Nf 3.00 0.65 1.64 4.37
PL -0.28 0.44 -1.21 0.65
LL -0.62 0.30 -1.24 0.01
Wn -0.76 0.87 -2.59 1.06
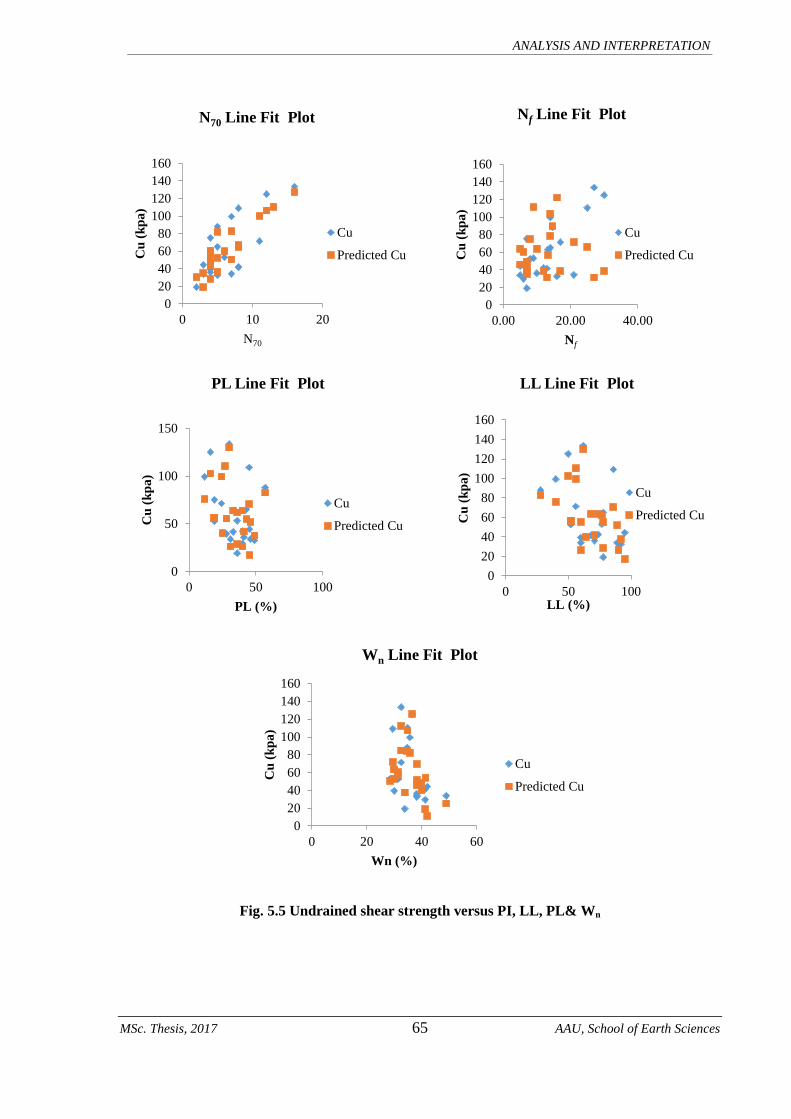
MSc. Thesis, 2017 65 AAU, School of Earth Sciences
ANALYSIS AND INTERPRETATION
Fig. 5.5 Undrained shear strength versus PI, LL, PL& Wn
0
20
40
60
80
100
120
140
160
0 10 20
Cu
(k
pa
)
N70
N70 Line Fit Plot
Cu
Predicted Cu
0
20
40
60
80
100
120
140
160
0.00 20.00 40.00
Cu
(k
pa
)
Nf
Nf Line Fit Plot
Cu
Predicted Cu
0
50
100
150
0 50 100
Cu
(k
pa
)
PL (%)
PL Line Fit Plot
Cu
Predicted Cu
0
20
40
60
80
100
120
140
160
0 50 100
Cu
(k
pa
)
LL (%)
LL Line Fit Plot
Cu
Predicted Cu
0
20
40
60
80
100
120
140
160
0 20 40 60
Cu
(k
pa
)
Wn (%)
Wn Line Fit Plot
Cu
Predicted Cu
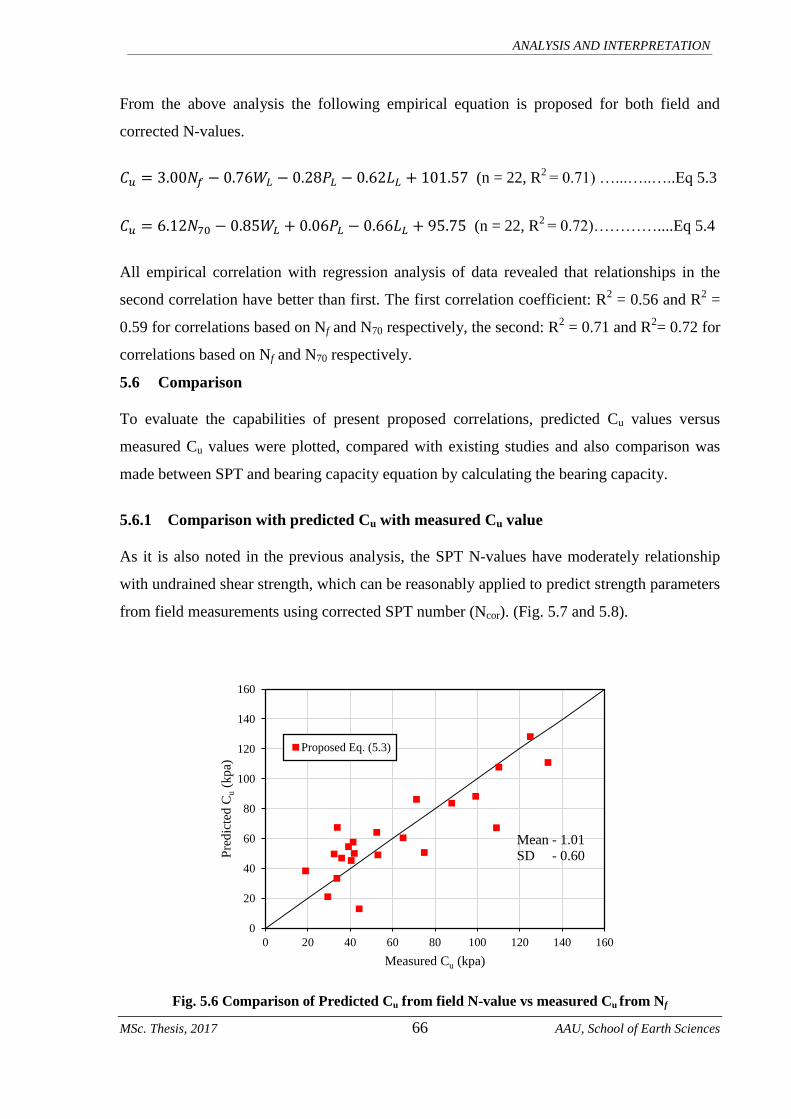
MSc. Thesis, 2017 66 AAU, School of Earth Sciences
ANALYSIS AND INTERPRETATION
From the above analysis the following empirical equation is proposed for both field and
corrected N-values.
(n = 22, R2
= 0.71) …...…..…..Eq 5.3
(n = 22, R2
= 0.72)…………....Eq 5.4
All empirical correlation with regression analysis of data revealed that relationships in the
second correlation have better than first. The first correlation coefficient: R2 = 0.56 and R
2 =
0.59 for correlations based on Nf and N70 respectively, the second: R2 = 0.71 and R
2= 0.72 for
correlations based on Nf and N70 respectively.
5.6 Comparison
To evaluate the capabilities of present proposed correlations, predicted Cu values versus
measured Cu values were plotted, compared with existing studies and also comparison was
made between SPT and bearing capacity equation by calculating the bearing capacity.
5.6.1 Comparison with predicted Cu with measured Cu value
As it is also noted in the previous analysis, the SPT N-values have moderately relationship
with undrained shear strength, which can be reasonably applied to predict strength parameters
from field measurements using corrected SPT number (Ncor). (Fig. 5.7 and 5.8).
Fig. 5.6 Comparison of Predicted Cu from field N-value vs measured Cu from Nf
0
20
40
60
80
100
120
140
160
0 20 40 60 80 100 120 140 160
Pre
dic
ted
Cu (
kp
a)
Measured Cu (kpa)
Mean - 1.01
SD - 0.60
Proposed Eq. (5.3)
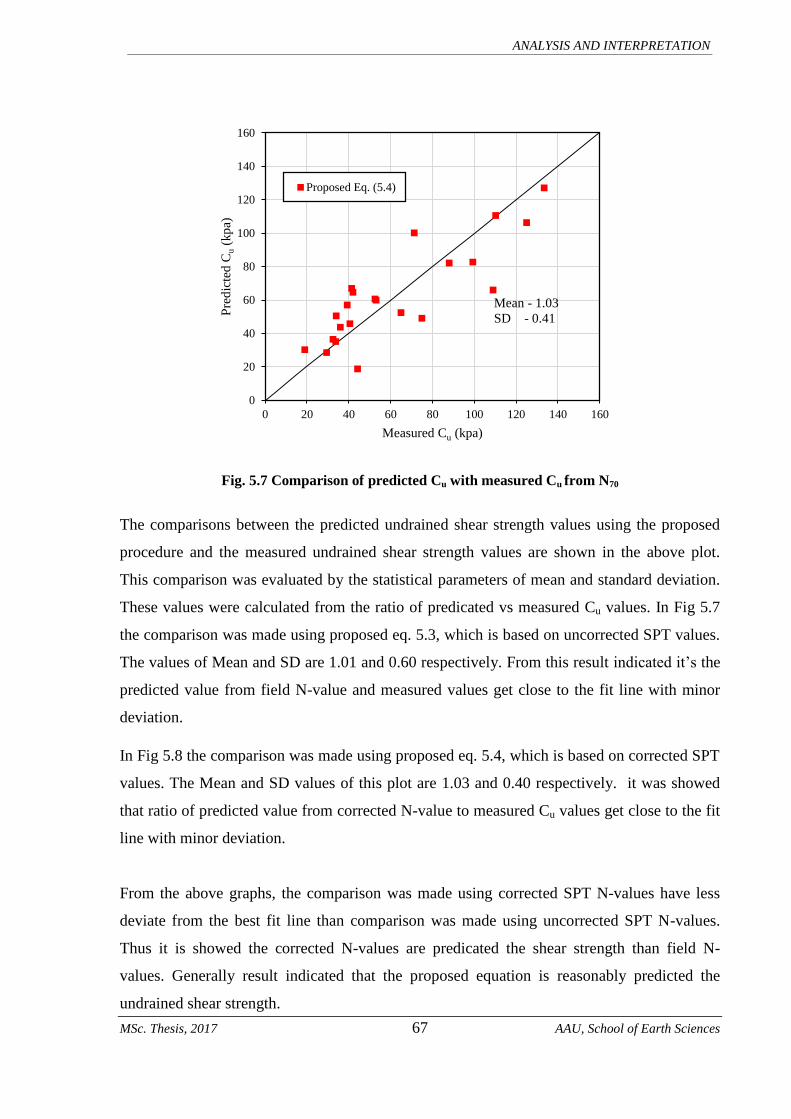
MSc. Thesis, 2017 67 AAU, School of Earth Sciences
ANALYSIS AND INTERPRETATION
Fig. 5.7 Comparison of predicted Cu with measured Cu from N70
The comparisons between the predicted undrained shear strength values using the proposed
procedure and the measured undrained shear strength values are shown in the above plot.
This comparison was evaluated by the statistical parameters of mean and standard deviation.
These values were calculated from the ratio of predicated vs measured Cu values. In Fig 5.7
the comparison was made using proposed eq. 5.3, which is based on uncorrected SPT values.
The values of Mean and SD are 1.01 and 0.60 respectively. From this result indicated it’s the
predicted value from field N-value and measured values get close to the fit line with minor
deviation.
In Fig 5.8 the comparison was made using proposed eq. 5.4, which is based on corrected SPT
values. The Mean and SD values of this plot are 1.03 and 0.40 respectively. it was showed
that ratio of predicted value from corrected N-value to measured Cu values get close to the fit
line with minor deviation.
From the above graphs, the comparison was made using corrected SPT N-values have less
deviate from the best fit line than comparison was made using uncorrected SPT N-values.
Thus it is showed the corrected N-values are predicated the shear strength than field N-
values. Generally result indicated that the proposed equation is reasonably predicted the
undrained shear strength.
0
20
40
60
80
100
120
140
160
0 20 40 60 80 100 120 140 160
Pre
dic
ted
Cu (
kp
a)
Measured Cu (kpa)
Mean - 1.03
SD - 0.41
Proposed Eq. (5.4)

MSc. Thesis, 2017 68 AAU, School of Earth Sciences
ANALYSIS AND INTERPRETATION
5.6.2 Comparison with Existing Correlation
As mentioned earlier several researchers have been suggested an approximation for the
undrained shear strength which can be obtained from a standard penetration test. In this study
correlations were established between the two parameters obtained from a research oriented
site investigation. Summarized empirical correlation of Cu versus N-values suggested by
different researchers are presented in Table 5.4.
Table 5.4 Existing empirical equations estimating Cu of fine grain soils
Terzaghi & Peck (1967) 6.25N
Hara et al. (1974) 29N0.72
Ajayi& Ballogun (1988) 1.39N+74.2
Sivikaya &togrol (2002) 4.32N
6.18N60
Stroud (1974) 4.2N
Hettiarachichi & Brown (2009) 4.1N60
Sirvikaya (2009) Cu = 2.41N - 0.82Wn + 0.14LL + 1.44PI
Cu = 3.24N60 – 0.53Wn – 0.43LL + 2.14PI
Frazad & Behzad (2011) Cu = 1.5N – 0.1Wn – 0.9LL + 2.4PI +21.1
Cu = 2N60 – 0.4Wn – 1.1LL + 2.4PI +33.3
As shown in the table 5.4 the existing correlations uses the uncorrected SPT blow count and
corrected N-values (N60).
Fig. 5.8 Existing and proposed Cu equation
0
20
40
60
80
100
120
0 5 10 15 20
Cu (
kp
a)
Blow counts (Nf)
Terzaghi et al. (1967)
Hara et al. (1997)
Sivikayaet al. (2002)
Aajai
Stroud (1974)
This study
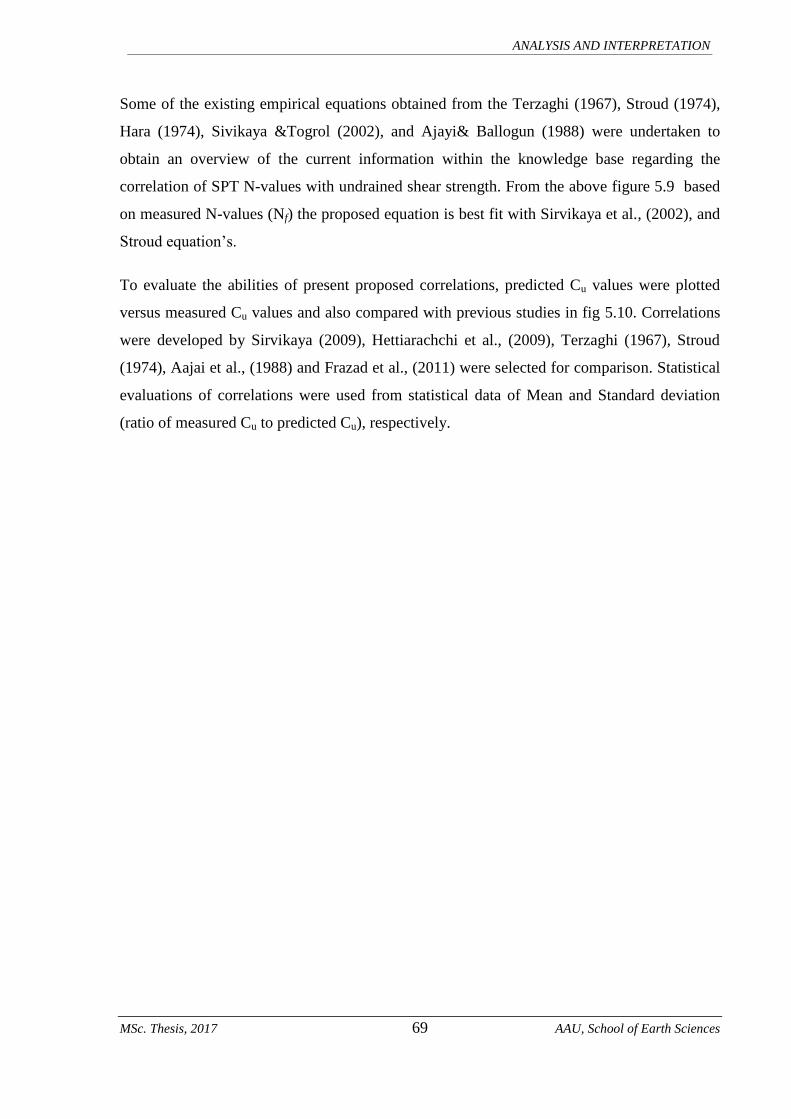
MSc. Thesis, 2017 69 AAU, School of Earth Sciences
ANALYSIS AND INTERPRETATION
Some of the existing empirical equations obtained from the Terzaghi (1967), Stroud (1974),
Hara (1974), Sivikaya &Togrol (2002), and Ajayi& Ballogun (1988) were undertaken to
obtain an overview of the current information within the knowledge base regarding the
correlation of SPT N-values with undrained shear strength. From the above figure 5.9 based
on measured N-values (Nf) the proposed equation is best fit with Sirvikaya et al., (2002), and
Stroud equation’s.
To evaluate the abilities of present proposed correlations, predicted Cu values were plotted
versus measured Cu values and also compared with previous studies in fig 5.10. Correlations
were developed by Sirvikaya (2009), Hettiarachchi et al., (2009), Terzaghi (1967), Stroud
(1974), Aajai et al., (1988) and Frazad et al., (2011) were selected for comparison. Statistical
evaluations of correlations were used from statistical data of Mean and Standard deviation
(ratio of measured Cu to predicted Cu), respectively.

MSc. Thesis, 2017 70 AAU, School of Earth Sciences
ANALYSIS AND INTERPRETATION
0
50
100
150
0 50 100 150
Pre
dic
ted
Cu (
kp
a)
Measured Cu (kpa)
Terzaghi et al. (1967)
0
50
100
150
0 50 100 150
Pre
dic
ted
Cu (
kp
a)
Measured Cu (kpa)
Stroud (1974)
0
50
100
150
0 50 100 150
Pre
dic
ted
Cu (
kp
a)
Measured Cu (kpa)
Sivikayaet al. (2002)
0
20
40
60
80
100
120
140
0 50 100 150
Pre
dic
ted
Cu (
kp
a)
Measured Cu (kpa)
Sivikaya et al (2002)
0
20
40
60
80
100
120
140
0 50 100 150
Pre
dic
ted
Cu (
kp
a)
Measured Cu (kpa)
Sivikaya (2009)
0
50
100
150
0 50 100 150
Pre
dic
ted
Cu (
kp
a)
Measured Cu (kpa)
Sivikaya (2009)
(Nf)
(Nf) (Nf)
(Nf) (N60)
(N60)
MSc. Thesis, 2017 71 AAU, School of Earth Sciences
ANALYSIS AND INTERPRETATION
Fig. 5.9 Measured versus predicted Cu for present and previous proposed correlations
0
20
40
60
80
100
120
140
0 50 100 150
Pre
dic
ted
Cu (
kp
a)
Measured Cu (kpa)
Frazad et al. (2011)
0
50
100
150
0 50 100 150
Pre
dic
ted
Cu (
kp
a)
Measured Cu (kpa)
Frazad et al. (2011)
0
50
100
150
0 50 100 150
Pre
dic
ted
Cu (
kp
a)
Measured Cu (kpa)
Aajai
0
50
100
150
0 50 100 150
Pre
dic
ted
Cu (
kp
a)
Measured Cu (kpa)
Hettiarachichi et al. (2009)
0
50
100
150
0 50 100 150
Pre
dic
ted
Cu (
kp
a)
Measured Cu (kpa)
This study
0
50
100
150
0 50 100 150
Pre
dic
ted
Cu (
kp
a)
Measured Cu (kpa)
This study
(Nf)
(Nf)
(Nf) (N70)
(N60)
(N60)

MSc. Thesis, 2017 72 AAU, School of Earth Sciences
ANALYSIS AND INTERPRETATION
Generally the above plots shows that correlation was made between predicated Cu versus
measured Cu values. The comparison was made based on corrected and uncorrected N-values
of previous and the present proposed empirical equation. As mentioned earlier the previous
empirical equations were developed based on SPT N-values to predict the shear strength of
fine grained soils. The empirical equations that proposed by researchers were different. This
can be even if the research was conducted in fine grained soil but it has different region with
different SPT equipment and laboratory testing.
The correlation were developed by Stroud (1974), Sivikaya &Togrol (2002) and Terzhagi
(1968), relatively good estimate with the present proposed equation whereas the equation
developed by Hettiarachchi et al., (2009), and Aajai et al., (1988) had a wide difference. this
difference come maybe the research is conducted in different region this lead the engineering
properties of the fine grained soil and the equipment that used the test like SPT equipment
(hammer system, split spoon sampler drill rod), drilling rigs, drilling system etc... The other
possible cause of variation is most of the correlation SPT N- value standardized to N60 but the
present proposed equation were developed based on N70.
5.7 Comparison with SPT Method and Bearing Capacity
The comparison was done by calculating the bearing capacity of fine grained soils using SPT
method and Meyerhof bearing capacity equation. The parameters that used for this
comparison were corrected SPT N-value and shears strength parameters (c & Ø).
5.7.1 Bearing capacity based on SPT
After adjusting the N-counts based on the above formula a design N-value is chosen from
consecutive depths where the test is performed. The design N-value is taken as the average of
N-values which are found in between ½ B above and 2B below the proposed footing depth
where B is the width of the foundation.
The bearing capacity for an isolated footing can be calculated from the SPT N- values using
Meyerhof’s equation as follows (Bowles, 1997);
(
)
……………………………………..…………..Eq. 5.1
Where

MSc. Thesis, 2017 73 AAU, School of Earth Sciences
ANALYSIS AND INTERPRETATION
= Allowable bearing pressure for settlement limited
to 25 mm.
= 1+0.33D/B < 1.33
= 0.04
= 0.06
= 0.3
= 1.2
= Width of foundation
= Depth of foundation
(Factor of safety) FS = 3
Table 5.5 presented the allowable bearing capacity of fine grained soil using SPT method and
the assumed foundation depth is 3m and widths are varied from 2.0m to 6.0m.
Table 5.5 Allowable Bearing Capacity Based on SPT
Soil type
BH-
No. N70
Allowable Bearing Capacity, kPa
Assumed Depth of Foundation (3m)
Width of Foundation (B), m
2 2.5 3 3.5 4 4.5 5 5.5 6
Dark clay
BH-2 4 117 111 103 97 93 90 87 85 84
BH-3 4 117 111 107 101 96 93 90 87 86
BH-4 4 117 111 107 105 99 95 92 90 88
BH-7 6 176 167 161 157 154 151 149 145 141
BH-13 5 147 139 134 131 128 126 125 120 117
BH-14 4 117 111 107 105 102 101 100 96 94
BH-21 4.5 132 125 121 118 115 113 112 108 105
BH-22 9.8 287 272 263 256 251 247 244 236 230
Red clay
BH-1 6 176 159 148 140 133 130 127 125 122
BH-5 10 293 278 268 261 256 245 237 230 224
BH-9 15 440 417 402 392 384 378 374 361 351
BH-12 13 381 361 349 340 333 328 324 313 305
BH-16 4.6 135 128 123 120 118 116 115 111 108
BH-17 6 176 167 161 157 154 151 149 145 141
BH-20 4 117 111 107 105 102 101 100 96 94
Red silt
BH-6 5 147 139 134 131 128 126 121 118 115
BH-8 11 322 306 295 287 282 277 274 265 258
BH-10 9 264 250 241 235 231 227 224 217 211
BH-11 10 293 278 268 261 256 252 249 241 234
BH-15 7 205 195 188 183 179 177 174 169 164
BH-18 9.4 276 261 252 246 241 237 234 226 220
BH-19 4 117 111 107 105 102 101 100 96 94
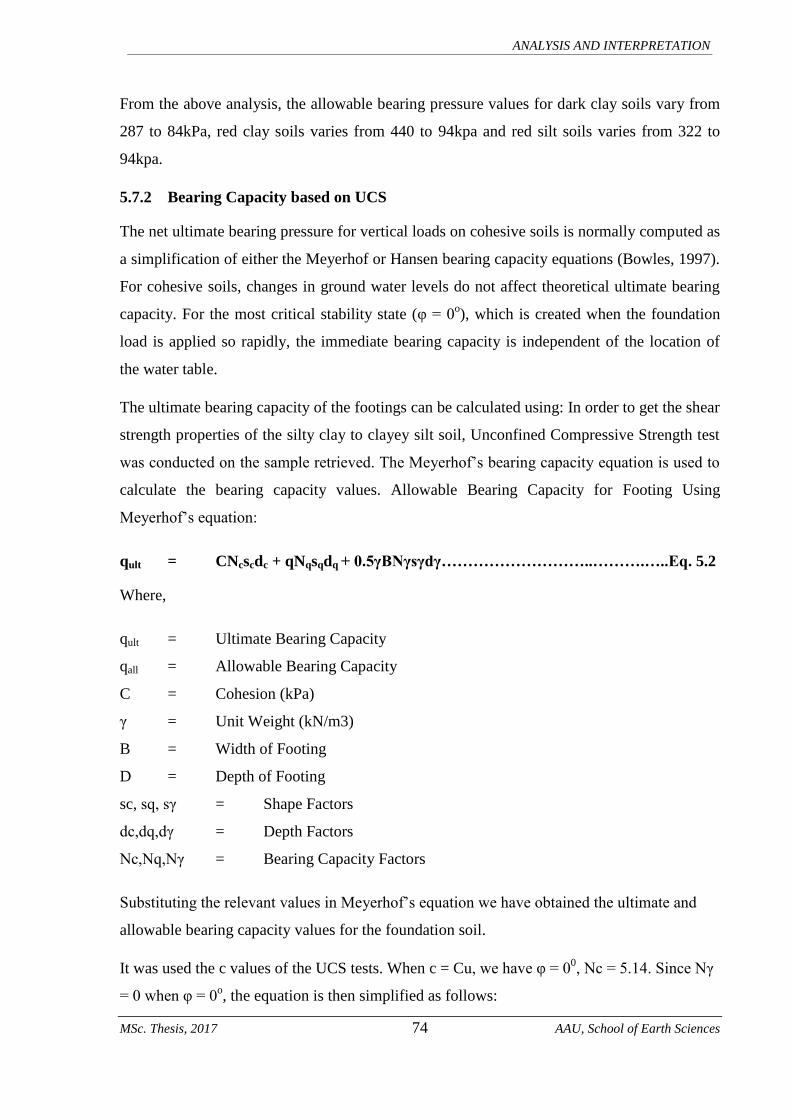
MSc. Thesis, 2017 74 AAU, School of Earth Sciences
ANALYSIS AND INTERPRETATION
From the above analysis, the allowable bearing pressure values for dark clay soils vary from
287 to 84kPa, red clay soils varies from 440 to 94kpa and red silt soils varies from 322 to
94kpa.
5.7.2 Bearing Capacity based on UCS
The net ultimate bearing pressure for vertical loads on cohesive soils is normally computed as
a simplification of either the Meyerhof or Hansen bearing capacity equations (Bowles, 1997).
For cohesive soils, changes in ground water levels do not affect theoretical ultimate bearing
capacity. For the most critical stability state (φ = 0o), which is created when the foundation
load is applied so rapidly, the immediate bearing capacity is independent of the location of
the water table.
The ultimate bearing capacity of the footings can be calculated using: In order to get the shear
strength properties of the silty clay to clayey silt soil, Unconfined Compressive Strength test
was conducted on the sample retrieved. The Meyerhof’s bearing capacity equation is used to
calculate the bearing capacity values. Allowable Bearing Capacity for Footing Using
Meyerhof’s equation:
qult = CNcscdc + qNqsqdq + 0.5γBNγsγdγ………………………..……….…..Eq. 5.2
Where,
qult = Ultimate Bearing Capacity
qall = Allowable Bearing Capacity
C = Cohesion (kPa)
γ = Unit Weight (kN/m3)
B = Width of Footing
D = Depth of Footing
sc, sq, sγ = Shape Factors
dc,dq,dγ = Depth Factors
Nc,Nq,Nγ = Bearing Capacity Factors
Substituting the relevant values in Meyerhof’s equation we have obtained the ultimate and
allowable bearing capacity values for the foundation soil.
It was used the c values of the UCS tests. When c = Cu, we have φ = 00, Nc = 5.14. Since Nγ
= 0 when φ = 0o, the equation is then simplified as follows:
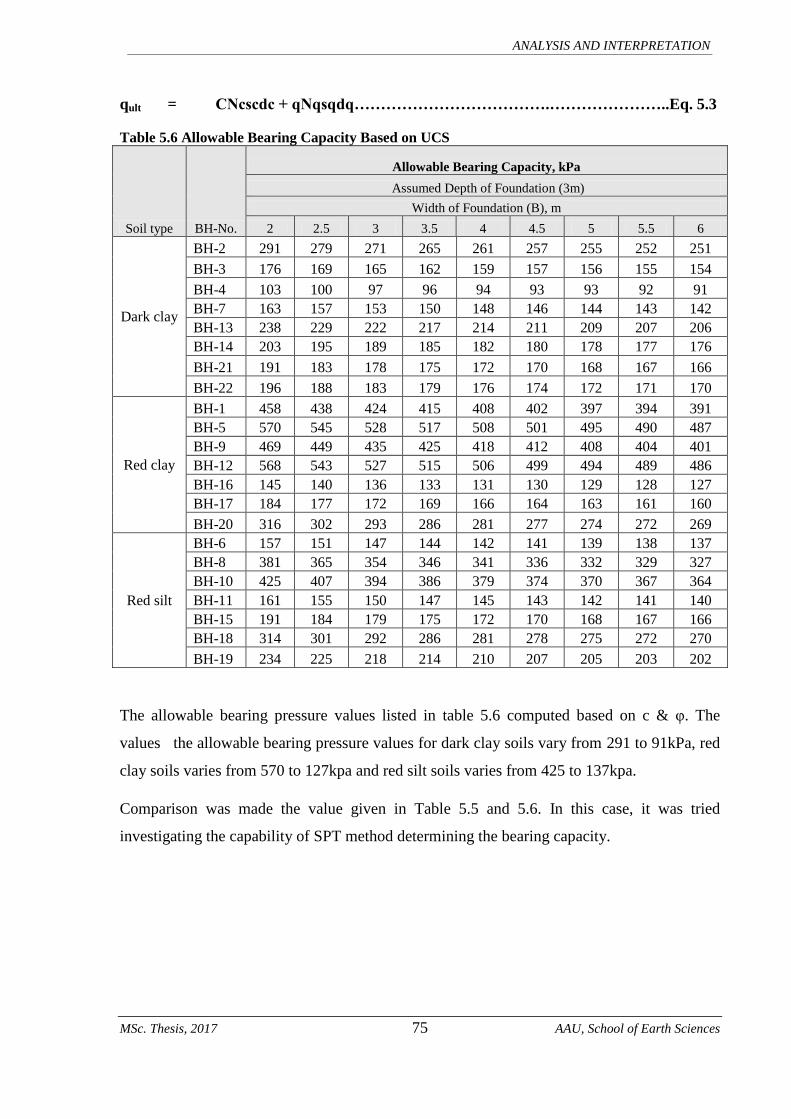
MSc. Thesis, 2017 75 AAU, School of Earth Sciences
ANALYSIS AND INTERPRETATION
qult = CNcscdc + qNqsqdq……………………………….…………………..Eq. 5.3
Table 5.6 Allowable Bearing Capacity Based on UCS
Soil type BH-No.
Allowable Bearing Capacity, kPa
Assumed Depth of Foundation (3m)
Width of Foundation (B), m
2 2.5 3 3.5 4 4.5 5 5.5 6
Dark clay
BH-2 291 279 271 265 261 257 255 252 251
BH-3 176 169 165 162 159 157 156 155 154
BH-4 103 100 97 96 94 93 93 92 91
BH-7 163 157 153 150 148 146 144 143 142
BH-13 238 229 222 217 214 211 209 207 206
BH-14 203 195 189 185 182 180 178 177 176
BH-21 191 183 178 175 172 170 168 167 166
BH-22 196 188 183 179 176 174 172 171 170
Red clay
BH-1 458 438 424 415 408 402 397 394 391
BH-5 570 545 528 517 508 501 495 490 487
BH-9 469 449 435 425 418 412 408 404 401
BH-12 568 543 527 515 506 499 494 489 486
BH-16 145 140 136 133 131 130 129 128 127
BH-17 184 177 172 169 166 164 163 161 160
BH-20 316 302 293 286 281 277 274 272 269
Red silt
BH-6 157 151 147 144 142 141 139 138 137
BH-8 381 365 354 346 341 336 332 329 327
BH-10 425 407 394 386 379 374 370 367 364
BH-11 161 155 150 147 145 143 142 141 140
BH-15 191 184 179 175 172 170 168 167 166
BH-18 314 301 292 286 281 278 275 272 270
BH-19 234 225 218 214 210 207 205 203 202
The allowable bearing pressure values listed in table 5.6 computed based on c & φ. The
values the allowable bearing pressure values for dark clay soils vary from 291 to 91kPa, red
clay soils varies from 570 to 127kpa and red silt soils varies from 425 to 137kpa.
Comparison was made the value given in Table 5.5 and 5.6. In this case, it was tried
investigating the capability of SPT method determining the bearing capacity.
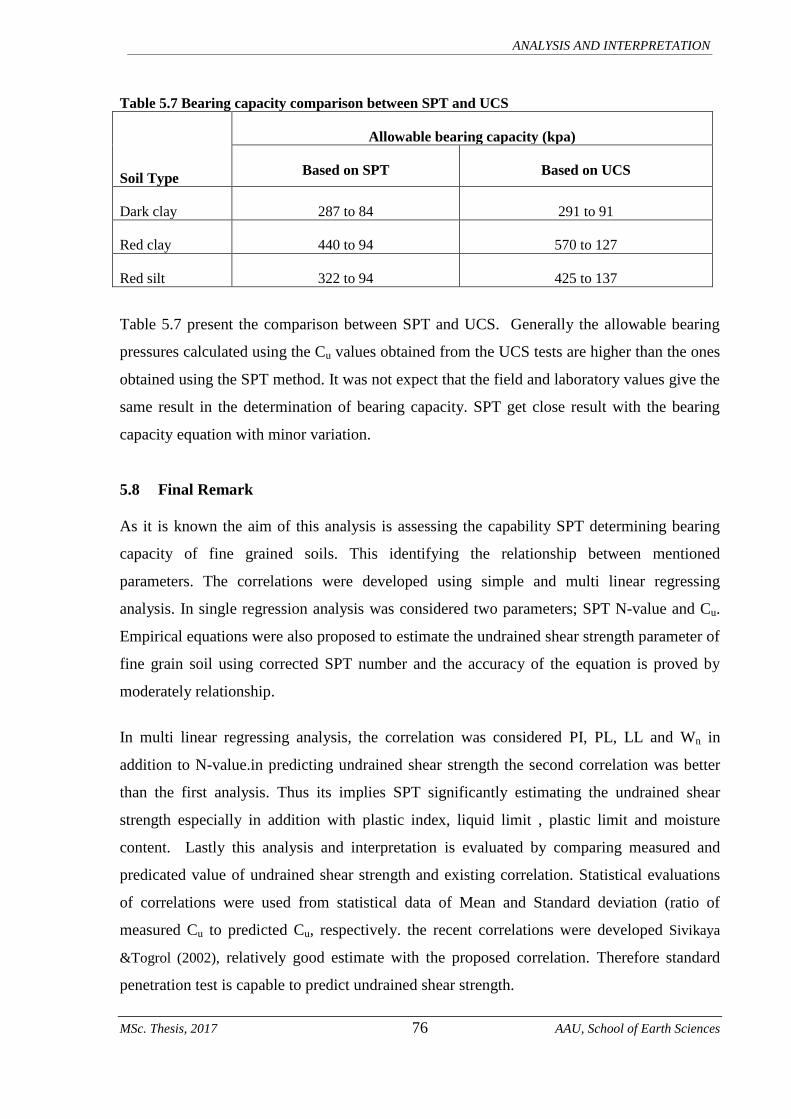
MSc. Thesis, 2017 76 AAU, School of Earth Sciences
ANALYSIS AND INTERPRETATION
Table 5.7 Bearing capacity comparison between SPT and UCS
Soil Type
Allowable bearing capacity (kpa)
Based on SPT Based on UCS
Dark clay 287 to 84 291 to 91
Red clay 440 to 94 570 to 127
Red silt 322 to 94 425 to 137
Table 5.7 present the comparison between SPT and UCS. Generally the allowable bearing
pressures calculated using the Cu values obtained from the UCS tests are higher than the ones
obtained using the SPT method. It was not expect that the field and laboratory values give the
same result in the determination of bearing capacity. SPT get close result with the bearing
capacity equation with minor variation.
5.8 Final Remark
As it is known the aim of this analysis is assessing the capability SPT determining bearing
capacity of fine grained soils. This identifying the relationship between mentioned
parameters. The correlations were developed using simple and multi linear regressing
analysis. In single regression analysis was considered two parameters; SPT N-value and Cu.
Empirical equations were also proposed to estimate the undrained shear strength parameter of
fine grain soil using corrected SPT number and the accuracy of the equation is proved by
moderately relationship.
In multi linear regressing analysis, the correlation was considered PI, PL, LL and Wn in
addition to N-value.in predicting undrained shear strength the second correlation was better
than the first analysis. Thus its implies SPT significantly estimating the undrained shear
strength especially in addition with plastic index, liquid limit , plastic limit and moisture
content. Lastly this analysis and interpretation is evaluated by comparing measured and
predicated value of undrained shear strength and existing correlation. Statistical evaluations
of correlations were used from statistical data of Mean and Standard deviation (ratio of
measured Cu to predicted Cu, respectively. the recent correlations were developed Sivikaya
&Togrol (2002), relatively good estimate with the proposed correlation. Therefore standard
penetration test is capable to predict undrained shear strength.
MSc. Thesis, 2017 77 AAU, School of Earth Sciences
CONCLUSION AND RECOMMENDATIONS
CHAPTER 6 CONCLUSION AND RECOMMENDATIONS
6.1 Conclusion
In-situ SPT testing of fine grained soils is a common practice in the world. It is mainly
conducted to determine the bearing capacity of fine grain soils when taking samples is not
reliable for laboratory testing. It is also involved to determine the soil’s penetration
resistance.
Likewise in Ethiopia, SPT has been widely practiced for foundation investigation and mostly
empirical methods are employed to analyze the values for the estimation of bearing capacity.
However, questions are being raised as the SPT measurement are affected by different kinds
of hammers, sampling tubes, drill rig types, drill rod lengths and types, hammer blow rates
and different energy delivery systems with different degrees of efficiency. The reliability of
the method and the accuracy of the result depend largely on the test equipment, and test
procedures well as and the test procedure. The present study, hence, has been done to assess
the reliability of standard penetration test for determination of bearing capacity of fine grain
soil.
This research was carried out based on the geotechnical data of fine grained soil that are
collected from different locations of Addis Ababa. The studied soil have been classified
based on their color into three category; dark clay, red clay and red silt. In order to achieve
the objectives of this research a systematic methodology was followed. Twenty two borehole
drillings were engaged in this study using different (donut hammer and automatic hammer. A
total of 100 SPTs were conducted at 15 cm interval on average and 22 undisturbed soil
samples were taken for the determination of unconfined compressive strength. Disturbed
samples were also taken to describe the soil properties. Simultaneously information about
SPT equipment has been collected for dealing a possible source of errors. The possible
sources of errors during performing SPT were from test procedure; such as testing intervals
and blow count were recorded. Generally, the rig type, hammer efficiency, the omission of
liners in the spoon, split spoon sampler design variation and sharpness and the presence of
gravel and pebbles were also documented.
In order to reduce the significant variability associated with the SPT tools, it was used that N-
values to be standardized to N70. This standardization was to be achieved by correcting the

MSc. Thesis, 2017 78 AAU, School of Earth Sciences
CONCLUSION AND RECOMMENDATIONS
measured field N-values by applying different correction factors including hammer
efficiency, split spoon sampler, rod length, borehole diameter, and anvil and blow rate
corrections.
Based on the test results and analysis, interpretations were made to meet the general
objectives of the present study. Accordingly, simple relationships were proposed to estimate
undrained shear strength of fine grain soils. New empirical equations were also proposed to
determine undrained shear strength of fine grain soil using linear and multi linear regression
analysis. Furthermore, other parameters (PL, LL, PI and Wn) are correlated with SPT in the
determination of undrained shear strength and likely increase the correlation coefficient of
estimation. These relationships cannot be considered as a perfect substitute of laboratory
values and the implementation of the findings requires experience and high certitude of
engineering judgments as well as continuous controlling with obtained laboratory
experiments.
Finally, comparison was made between predicted and measured value of undrained shear
strength of fine grain soil. The predicted Cu result reasonably fair to good comparison
between the predicted and measured undrained shear strength values. Compared to previous
correlations, correlations presented by Sirvikaya (2002) and Stroud (1979) had the best
conformity with present proposed correlations but those correlation presented by Aajai et al.,
(1988) and Hettiarachchi et al., (2009), had relatively large differences. These differences
could have been caused by variation of the physical properties soils, local ground condition,
SPT equipment and test procedure variation.
The following results are concluded based on the results, discussion and analysis presented in
this research:
Donut hammer system and its lifting mechanism is significantly affected the result of
measured N-value relative to an automatic hammer.
Automatic hammer is providing relatively a consistent result of N-values than donut
hammer especially in energy transfer mechanism.
The N-value is mainly influenced by hammer efficiency and split spoon design.
Deformed cutting shoe was the major source of errors.

MSc. Thesis, 2017 79 AAU, School of Earth Sciences
CONCLUSION AND RECOMMENDATIONS
The N-values is mainly influenced by the use of unlubricated cathead and rope in donut
hammer.
The depth of soil below ground surface significantly affects the SPT number.
The Atterberg limits (LL, PL, PI) and moisture content (Wn) has not affect the SPT
number.
The undrained shear strength of fine grain soil is strongly affects the SPT number.
Empirical equations to predict Cu of fine grain soil using SPT have been presented. The
accuracy of these equations proved to be moderately relationships.
The standard penetration test is considered reliable in predicting of undrained shear
strength to determine bearing capacity with good maintenance of the equipment and
quality control in the performance of the test.
6.2 Recommendations and Future Work
Based on the conclusion made above, the appropriate recommendations are given here under:
SPT Hammer efficiency should be checked and recalibrated periodically using energy
measurement tools.
SPT equipment’s used should be evaluated because the energy delivered by the hammer
may be quite variable.
The SPT N-value of fine grain soils especially clay soils may vary significantly with
seasonal fluctuations in the water table. These correlations are not as meaningful for
sensitive and medium to soft clays where effects of disturbance during sampler
penetration may cause a lowering in the SPT N-value.
Users should carefully inspect the split spoon sampler especially the cutting shoe.
For different regions, it is recommended the specific relationship regarding that particular
area to be used when predicting values for Cu.
SPT measurement should be conducted by a well professional drilling crew and a good
engineer on- for a quality and reliable results.
MSc. Thesis, 2017 80 AAU, School of Earth Sciences
CONCLUSION AND RECOMMENDATIONS
Understanding the SPT N-value, the engineer will be able use the SPT to come up with a
quick estimation of the bearing capacity.
The SPT should be used with discrete judgment when it is used to estimate the bearing
capacity of cohesive soils; since silt and clay may be stiffened or softened depending on
an increase or decrease of their moisture contents.
The SPT number may be misleading if large-size gravel is wedged into the split spoon
sampler resulting in apparently high N-values, so it should be checked and make a note if
any coarse particle observed in the fine grain soil.
It is hoped that this paper will help the testing much more reliable and can only be
accomplished with careful attention to equipment and procedures when performing the
test.
Finally, the results and findings of the present study may be considered as indicative only as
these findings are based on limited parameters and on small number of in-situ and laboratory
tests. Further detail investigation should be carried out. More elaborate sampling and field
testing would be mandatory before implementation of results from the present study.
However, the present study provides a general methodology to conduct similar studies on
reliability of SPT method.
*****
MSc. Thesis, 2017 81 AAU, School of Earth Sciences
REFERENCES
REFERENCES
AbdulRazzaq, K. S., Husseinet W. A. and Hameed, A. H. (2011). Bearing Capacity Based On
Spt-Computer Interpolation. Diyala Journal of Engineering Sciences. 4(2): 118-129.
Aggour, M. S., and Radding, W. R. (2001). Standard Penetration Test (SPT) Correction,
Technical report, Civil and Environmental Engineering Department, University of
Maryland College Park, Maryland.
Aggour M. S. (2002). Updating Bearing Capacity – SPT graphs. Technical Report,
Department of Transportation State Highway Administration, Maryland.
Alan, R. and John T. (2010). The Misuse of SPTs in Fine Soils and the Implications of
Eurocode 7, Technical report, Geotechnical Engineers, South Lanarkshire Council.
Arora, K. R. (2004). Soil Mechanics and Foundation Engineering. Standard publisher’s
distributors, Delhi, 886 pp.
Asfaw, Lete mariam (1990). Seismicity and Earthquake Risk in Addis Ababa Region. SINET:
Ethiopia J. Sci. 13 (1): 15-35.
Assegid Getahun (2007). Geology of Addis Ababa City, Ethiopian. Unpublished technical
report, Institute of Geological Survey, Addis Ababa, Ethiopia. 31 pp.
ASTM D 1586: 2008. Standard Test Method for Standard Penetration Test SPT and Split-
Barrel Sampling of Soils. Annual Book of standards, American Society of Testing and
Materials, West Conshohocken.
ASTM D 2166: 2004. Special Procedures for Testing Soil and Rock for Civil Engineering.
Purpose,U.S. America. Bell, F.G. (2006). Engineering geology and Geotechnics, Butterworth
&co (publishers) ltd, London, England.
Bereket Fentaw and Leta Alemayehu (2011) Hydrogeological, Hydrochemical and
Engineering Geology Maps of Addis Ababa Nc 37-10 Explanatory Notes.
Blight G.E., (1997). Mechanics of Residual Soils, A.ABalkema, Netherlands.
Bosscher, P. J. and Showers, D. R. (1987). Effect of soil type on Standard Penetration Test
input energy. Journal of Geotechnical engineering. 113(4):385-389.
Bowels, J.E. (1997). Foundation Analysis and Design, 5th ed., MCgraw-Hill companies, Inc.,
New York.
BS 1377:1975. Laboratory Determination Methods of Engineering Soil Properties. British
Standards Institution, London.
Clayton, C.R.I. (1995). The Standard Penetration Test (SPT): Methods and Use, Construction
Industry Research and Information Association Report, CIRIA, London. 143 pp.
MSc. Thesis, 2017 82 AAU, School of Earth Sciences
REFERENCES
Daniel Gemechu, (1977). Aspects of Climate and Water Budget in Ethiopia, A Technical
Monograph Published For Addis Ababa University, Addis Ababa University Press,
Ethiopia.
Das, B.M. (2007). Principles of Foundation Engineering, 6th
ed., CT Global Engineering,
Stamford, 794pp.
Day, R.W. (1999). Geotechnical and Foundation Engineering Design and Construction.
McGraw hill, New York.
Day, R.W. (2006). Foundation Engineering Handbook. McGraw hill, New York, 822 pp.
Efrem Beshawered (2009). Geology of the Akaki-Beseka Area, Unpublished technical report,
Ethiopian Institute of Geological Survey, Addis Ababa, Ethiopia. 93 pp.
Ethiopian mapping Authority (EMA) (1981), National atlas of Ethiopia, Addis Ababa,
Ethiopia
Ethiopian Building Code Standard (EBCS-7). (1995). Foundations, Unpublished technical
report, Ministry of Works and Urban Development, Addis Ababa, Ethiopia,159 pp.
Ethiopian Building Code Standard (EBCS-8). (1995). Design of Structures for Earthquake
Resistance, Unpublished technical report, Ministry of Works and Urban Development,
Addis Ababa, Ethiopia, 109 pp.
Frazad, N. and Behzad, K. (2011). SPT Capability to Estimate Undrained Shear Strength of
Fine-Grained Soils of Tehran. EJGE. 16.
Geological Survey of Ethiopia (GSE) (1996). Explanation to the Geological Map of Ethiopia,
Unpublished technical report, GSE, Addis Ababa, Ethiopia, 69 pp.
Habtamu Solomon (2010). Chemical Stabilization of Expansive subgrade soil performance
evaluation on selected road section in northern Addis Ababa. Unpublished MSc thesis,
Addis Ababa University, Addis Ababa, Ethiopia, 77 pp
Haile Sellasie Girmay and Getaneh Assefa(1989). The Addis Ababa-Nazareth Volcanics: A
Miocene-Pleistocene volcanic succession in Ethiopian Rift.SINET. 12 (1).
Hana Tibebu (2008).Study of index properties and shear strength parameters of Lateritic soils
in Welayita Sodo, Unpublished MSc thesis, Addis Ababa University, Addis Ababa,
Ethiopia, 119pp.
Hara, A., Ohta, T., Niwa, M., Tanaka, S., and Banno, T. (1974). Shear modulus and shear
strength of cohesive soils. Soils Found. 143:1-12.
Hettiarachchi, H. and Brown, T. (2009). Use of SPT Blow Counts to Estimate Shear Strength
Properties of Soils: Energy Balance Approach. Journal of Geotechnical and
Geoenvironmental Engineering. 135: 6.
Jeff, F. (1999). Standard Penetration Test: Driller’s / Operator’s Guide DSO-98-17. Earth
Sciences and Research Laboratory, U.S. Department of Interior Bureau of Reclamation.

MSc. Thesis, 2017 83 AAU, School of Earth Sciences
REFERENCES
Kebede Tsehayu & Tadesse H. Mariam 1990. Engineering Geological Mapping of Addis
Ababa, Ethiopian Institute of Geological Survey, Addis Ababa, Ethiopia.
Kulhawy, F. H., and Mayne, P. W. (1990). Manual on estimating soil properties for foundation
design. Technical Report, Electric Power Research Institute, Palo Alto, California 306.
Lamesgin Mesele (2014). Bearing capacity assessment for building foundation using different
approaches-A comparative study at Addis Ababa, Unpublished MSc thesis, Addis Ababa
University, Addis Ababa, Ethiopia, 149pp.
Lamb, R. (1997). SPT Energy Measurements with the PDA. In: proceedings of the 45th
Annual Geotechnical Engineering Cong., University of Minnesota.
Landy, H. R (2002). Analysis of In-situ Test Derived Soil Properties with Traditional and
Finite Element Methods, University of Florida, USA.
Lee, C., Lee, J. S., An, S. and Lee, W. (2010). Effect of secondary impacts on SPT rod energy
and sampler penetration. Journal of geotechnical and geo environmental engineering.
Liao S.C. and Whitman R.V. (1986). Overburden Correction Factors for SPT in Sand.
Journal of Geotechnical Engineering (ASCE).112(3):373-377.
McGregor, J., and Duncan, J.M. (1998). Performance and Use of the Standard Penetration
Test in Geotechnical Engineering Practice. Technical Report of CGPR, Virginia
Polytechnic Institute.
Mengesha Tefera, Tewodros Chernet and Workneh Haro (1996). Geological Map of Ethiopia
(1:2000000), Second Edition and Explanatory notes. Bulletin N0.3. GSE.
Meyerhof, G.G. (1956). Penetration Tests and Bearing Capacity of Cohesionless Soils.
JSMFD. 82:1-19.
Mohamed, F. M. O., and Vanapalli, S. K. (2006). Estimation of Bearing Capacity of Saturated
and Unsaturated Sands from the SPT and CPT Correlations. In: Proceedings of the 59th
Canadian Geotechnical Cong. (ACEM’ 12), pp. 219-216. Seoul, Korea,
Mostafa, A. and Mahmoud N. (2013). Reliability of Using Standard Penetration Test (SPT) in
Predicting Properties of Silty Clay with Sand Soil. International Journal of Civil and
Structural Engineering. 3.
Murthy, V.N.S. (2009). Principles and practices of soil mechanics and foundation
engineering, Marcel Dekker Inc., New York, 1029 pp.
Mwajuma, I.L. (2015). In-Situ Penetration as Alternative To Extensive Boreholes and Lab
Testing For Exploration in Sandy Soils. MSc thesis, Stockholm.
Rabie, N. A. and Albata A. H. (2012). Uncertainty of Standard Penetration Test Measurements
and its Effect on Geotechnical Design. In: Proceedings of the 3rd African Young
Geotechnical Engineering Cong., 3AyGEC'12, Cairo, Egypt.
MSc. Thesis, 2017 84 AAU, School of Earth Sciences
REFERENCES
Risk Assessment Tools for Diagnosis of Urban Areas against Seismic Disasters (RADIUS)
(2008), Guidelines for Implementing Earthquake Risk Management Projects.
Riggs, C. O. (1986). Use of insitu test in Geotechnical Engineering, North American Standard
Penetration Test Practice, an Essay Geotechnical Special Publication, No. 6, pp.9-967,
198.
Roy, E. H. (2006). Characteristics of geologic materials and formations: a field guide for
geotechnical engineer, 6th ed., Taylor & Francis Group, USA.
Sabatini, P.J., Bachus, R.C. Mayne P.W., (2002). Geotechnical Engineering Circular No. 5;
Evaluation of Soil and Rock Properties. Technical report FHWA-IF-02-034, U.S.
Department of Transportation Office of Bridge Technology Federal Highway
Administration 400 Seventh Street, SW Washington, DC.
Sarkar, R. (2014). Use of In-Situ Tests to identify Soil Behavior Type and Liquefaction
Susceptibility of SCCP Soils. MSc thesis, University of South Carolina - Columbia 149
pp.
Schmertmann, J. H. (1975). Measurement of in-situ shear strength. In: Proceeding ASCE
Specialty Cong., pp 57–138.
Schmertmann, J. H. 1979. Statics of SPT. Journal of the Geotechnical Engineering Division,
105(5): 655-670.
Seed, H. B, Tokimatsu, K., Harder, L. F., and Chung, R. M. (1985). Influence of SPT
Procedures in Soil Liquefaction Resistance Evaluations. Journal of Geotechnical
Engineering (ASCE). 111(12): 1425–1445.
Sherbiny R. M. and Salem M. A. 2013. Evaluation of SPT Energy for Donut and Safety
Hammers using CPT Measurements in Egypt. Ain Shams Engineering Journal. 701–708.
Sivrikaya, O. and Toğrol, E. (2002). Relations between SPT-N and qu. In: Proceedings of the
5th Advances Civil engineering Int. Cong., pp. 943-952. Istanbul, Turkey.
Sirvikaya, O. (2009). Comparison of Artificial Neural Networks Models with Correlative
Works on Undrained Shear Strength. Eurasian Soil Science. 42(13):1487–1496.
Skempton, A. W. (1986). Standard Penetration Test Procedures and Effects in Sands of
Overburden pressure, Relative Density, Particle Size, Aging and Over Consolidation.
Geotechnique. 363:425–447.
Sowers, G. F. (1979). Introductory Soil Mechanics and Foundations, 4th ed., Macmillan, 621,
New York.
Stroud, M. A. (1974). The Standard Penetration Test in Insensitive Clays and Soft rock. In:
Proceedings of the 1st European Symposium on Penetration Testing, pp. 367-375.
Sweden, Stockholm.
MSc. Thesis, 2017 85 AAU, School of Earth Sciences
REFERENCES
Tamiru Alemayehu, Tenalem Ayenew, Dagnachew Legese, Yirga Tadesse, Solomon
Waltenigus and Nuri Mohamed (2006). Ground Water Vulnerability Mapping of the
Addis Ababa Water Supply Aquifers. Unpublished technical report, Addis Ababa,
Ethiopia.
Taylor, R. (1990). Interpretation of the correlation coefficient - A basic review. Journal of
Diagnostic Medical Sonography. JDMS. 6:35-3.
Terzaghi, K. and Peck, R.B. (1967). Soil Mechanics in Engineering Practice, John Willey and
Sons, New York.
U.S. Army Corps of Engineers, (1997). Engineering and Design: Introduction to Probability
and Reliability Methods for Use in Geotechnical Engineering. Technical report No. 1110-
2-547, Department of the Army, Washington, D. C.
U.S. Army Corps of Engineers (USACE) (1992). Engineering and Design of Bearing Capacity
of soils. American Society of Civil Engineers (ASCE), Washington DC.
Water Works Design and Supervision Enterprise (WWDSE) (2008). Evaluation of water
resources of the Ada’a and Becho groundwater basin for irrigation development
project,Unpublished technical report, WWDSE, Addis Ababa, Ethiopia, 147 pp.
Wazoh, H. N and Mallo, S. J (2014). Standard Penetration Test in Engineering Geological
Site Investigations – A Review. The International Journal of Engineering and Science
(IJES). 3(7):40-48.
Weynshet Tadesse, (2015). Correlation of Bearing Capacity of SPT and Lab Result for
Shallow Foundation; Emphasis to Common soils in Addis Ababa, Unpublished MSc
thesis, Addis Ababa University, Addis Ababa, Ethiopia, 149 pp.
Zanettin, B. and Justin, V.E. (1974). The Volcanics of Western Afar and Ethiopian Rift
Margins, Padova, Italy.
*****