
comparison of concrete properties - AAU Institutional Repository
Upload
khangminh22Category
view
1download
0
ADDIS ABABA UNIVERSITY
INSTITUTE OF TECHNOLOGY
POST GRADUATE PROGRAM IN INDUSTRIAL ENGINEERING
MSc Thesis
On
Investigating the Impact of (ISO 9001) Quality Management System Implementation on
Organizational Performance: Case In, Ethiopia Cable Industries
By
BETIEL TSEGAYE
June, 2021
Addis Ababa, Ethiopia

i
Addis Ababa University
Addis Ababa Institute of Technology
School of Mechanical and Industrial Engineering
Industrial Engineering Stream
This is to acknowledge that the thesis entitled: “Investigating the Impact of (ISO 9001)
Quality Management System Implementation on Organizational Performance: In Ethiopia
Cable Industries” submitted by Betiel Tsegaye, in partial fulfilments of the
requirements for Master of Science (Mechanical and Industrial Engineering), Addis
Ababa Institute of Technology.
Signed by Examining Committee:
Internal Examiner Dr. Ameha Mulugeta Signature___________ Date___________
External Examiner Dr. Ephrem Gidey Signature___________ Date___________
Advisor Dr. Yitagesu Yilma. Signature___________ Date___________
________________________________
School or Center of Chair Person

ii
DECLARATION
I hereby declare that the work which is being presented in this thesis entitled:
“Investigating the impact of (ISO 9001) Quality management System Implementation on
Organizational Performance” is original work of my endeavour and has not been
presented for a degree of any other university and all the resources of materials used
for the thesis have been duly acknowledged.
Betiel Tsegaye _______________________ __________________
(Candidate) Signature Date
This is to certify that the above declaration made by the author is correct to the best of
my Knowledge
Dr. Yitagesu Yilma _______________________ __________________
(Thesis Advisor) . Signature Date

iii
DEDICATION
This Thesis work is dedicated to my father, my mother and my beloved family and
friends who stood behind me.

iv
Acknowledgment
In the name of the Almighty God, the most Kind, the most Merciful thanks and all Praises
to Him for the Strength and His Blessings in completing this Thesis.
This thesis would not have come to an end without the support of many individuals and
bodies. I owe a great debt of thanks, first and foremost to my Advisor Dr. Eng. Yitagesu
Yilma for his useful, fruitful, insightful, constructive comments and constant support
throughout the process of this thesis. My thanks also go to my Co-Advisor Mr. Goitom
Birhane for his support, engagement, knowledge and constant support for this thesis. The
same appreciation goes to Mr. Shimelis Thilahun.
I also wish to thank the ISO 9001 certified cable companies that participated in this
research project and provided me valuable company information which is really the sole
base of this research, but most of all BMET put a great support not only for this thesis, but
also for the academic permission throughout the three years.
Also I would like to express my deepest appreciation to my Parents, Sisters and Brothers;
Tsegaye Dinku, Almaz Tesfaye, Yemisrach Tsegaye, Hanna Tsegaye, Nsebho Tsegaye
and Surafel Beyene for their endless love, moral and financial support with encouragement
whenever I felt down.
I am also grateful to Alemayehu Tesfaye, Derbew Alebel and Daniel Gugsa for their
provision of computer hardware. I am indebted to Bizuayehu, Yidnekachew and Admasu
for their support throughout the study process.
Last but not least, I am thankful to Abiy Melaku for his wholehearted teamwork until I
firm up this research.

v
Abstract
Quality Management has been known as a method to improve the organizational
performances. This research has been performed to investigate the impact of (ISO 9001)
Quality Management System implementation on organizational performance which will
provide good information about this effect in cable manufacturing sector. A descriptive
research design has been applied to investigate the impact of QMS on the selected cable
company’s organizational performance. It used primary and secondary data collection
and analysed the input by using SPSS software. The outcome of the study showed that
Implementation of Quality Management System has positive hand-outs to all of the
performance indicators in the selected companies. Organizational performance
dimensions such as business performance, operational performance, and product/service
quality are positively impacted by the quality management system practices such as
management & team working, quality information, supplier relationship management,
customer relationship management and competitiveness. The research finding has also
demonstrated that the main obstacles in the investigating of quality management system
implementation are strategic decisions are affected by top managements, top management
commitment while implementing Quality Management System and insufficient time for
continual improvement.
Key Words: Quality management system, organizational performance, manufacturing sector
vi
Table of Contents
DECLARATION ............................................................................................................................................. ii
DEDICATION ................................................................................................................................................ iii
Acknowledgment ............................................................................................................................................ iv
Abstract............................................................................................................................................................ v
List of Tables ................................................................................................................................................ viii
List of Figures ............................................................................................................................................... viii
Acronyms ....................................................................................................................................................... ix
Chapter One: Introduction ........................................................................................................................... 1
1.1 Background of the Study ...................................................................................................................... 1
1.2 Statement of the Research Problem ...................................................................................................... 3
1.3 Research Questions .............................................................................................................................. 3
1.4 Objectives ............................................................................................................................................ 4
1.4.1 General Objective: ....................................................................................................................... 4
1.4.2 Specific Objectives: ..................................................................................................................... 4
1.5 Significance of the Study ..................................................................................................................... 4
1.6 Scope of the Study ............................................................................................................................... 5
Chapter Two: Literature Review.................................................................................................................. 6
2.1 Conceptual Definition .......................................................................................................................... 6
2.2 Theoretical Concepts of QMS ............................................................................................................ 12
2.3 The Motivation for implementing ISO 9000 ...................................................................................... 14
2.4 ISO 9001 Certification ....................................................................................................................... 15
2.5 Impact of ISO Certification ................................................................................................................ 16
2.5.1 Internal Impacts.......................................................................................................................... 17
2.5.2 External Impacts ........................................................................................................................ 19
2.6 Empirical Studies on QMS implementation ....................................................................................... 22
2.7 Research Gap ..................................................................................................................................... 29
2.8 Conceptual Framework ...................................................................................................................... 29
Chapter Three: Research Methodology ..................................................................................................... 31
3.1 Introduction ........................................................................................................................................ 31
3.2 Research Design................................................................................................................................. 31
3.3 Area of the Study ............................................................................................................................... 31
3.4 Data Type and Source ........................................................................................................................ 32
3.5 Target Population ............................................................................................................................... 32
3.6 Inclusion and Exclusion Criteria ........................................................................................................ 33
3.7 Methods of Data Collection ............................................................................................................... 34

vii
3.7.1 Primary data collection .............................................................................................................. 34
3.7.2 Secondary data collection .......................................................................................................... 35
3.8 Reliability and Validity of Data ......................................................................................................... 35
3.9 Data Analysis ..................................................................................................................................... 39
Chapter Four: Result and Discussion ......................................................................................................... 40
4.1 Introduction ........................................................................................................................................ 40
4.2 Profile of the Respondents ................................................................................................................. 40
4.3 Data Analysis ..................................................................................................................................... 42
4.3.1 Analysis of Descriptive Statistics ............................................................................................... 42
4.3.2 Descriptive Analysis of Main Quality Management Practices ................................................... 43
4.3.3 Descriptive Analysis of Main Organizational Performance Constructs ...................................... 44
4.3.4 Bivariate Correlation Test .......................................................................................................... 44
4.3.5 Regression Analysis ................................................................................................................... 45
4.4 Interview Question Summary Analysis .............................................................................................. 48
4.4 Summary of Findings ......................................................................................................................... 51
Chapter Five: Conclusion and Recommendation ...................................................................................... 53
5.1 Conclusion ......................................................................................................................................... 53
5.2 Recommendation from the study ....................................................................................................... 54
5.3 Limitation and Future Work ............................................................................................................... 54
References ..................................................................................................................................................... 55
Appendix-A: Questionnaire ........................................................................................................................... 61
Appendix-B: Guide for Interview ................................................................................................................. 71
Appendix-C: Pearson Correlation Coefficient for the various items .............................................................. 72
Appendix-D: Sample Report Documents of the Companies .......................................................................... 86

viii
List of Tables
Table 2.1: ISO 9001 Principles and Organizational welfares. ........................................................ 9
Table 3.1: The Concepts and Parameters for the Study ................................................................ 32
Table 3.2: Target Population......................................................................................................... 32
Table 3.3: Sampling Design .......................................................................................................... 33
Table 3.4: Reliability Statistics for Cronbach’s Alpha ................................................................. 36
Table 4.1: Frequency of Position of Respondents. ....................................................................... 40
Table 4.2: Frequency of Qualification of Respondents ................................................................ 41
Table 4.3: Frequency of Service year in the company of Respondents ........................................ 41
Table 4.4: Gender of Respondents ................................................................................................ 42
Table 4.5: Frequency of QMS Awareness of Respondents. ......................................................... 42
Table 4.6: Descriptive Statistics for Quality Management Practice ............................................. 43
Table 4.7: Descriptive Statistics for Organization Performance .................................................. 44
Table 4.8: Correlation between Constructs ................................................................................... 44
Table 4.9: Coefficientsa ................................................................................................................. 47
Table 4.10: Model Summary for Organizational Performance .................................................... 47
Table 4.11: ANOVAa for Organizational Performance ................................................................ 47
List of Figures
Figure 2.1: A procedure based Quality Management System Model. .......................................... 10
Figure2.2: Conceptual Framework of the Study ........................................................................... 30
Figure 4.1: Sample Analysis of companies before & after their ISO implementation. ................ 50

ix
Acronyms
QMS Quality Management System
ISO International Organizations for Standardization
QM Quality Management
SPSS Statistical Package for the Social Science
OP Organizational Performance

1
Chapter One
1. Introduction
1.1 Background of the Study
Today’s global market is increasing with business competitions. To be in the increased global
competition, organizations are forced to produce high quality products and continuously
improve themselves to survive and to stay in the market (Abdul-Aziz, Chan, Metcalfe, 2000).
According to (Sharma et al, 2005), the main focus of a company should be the customer and
it should consider their needs and demands so as to maintain a competitive edge and survive
in the market.
The quality theory has emerged and disseminated in various activities to become a vital
management performance instrument as opposed to its initial role of control (Belay et al,
2011). Quality management is one of the key challenges that brought the attention of the
research and business community in the last 3 decades (Noranha, 2002, Feng et al, 2007).
There are many quality management approaches used by organizations to achieve these
objectives such as Kaizen, Six Sigma, Lean management, TQM, etc. The most common
approach is ISO 9001 QMS (Limakatso P., 2011).In the present situation of highly
competitive business environment in domestic as well as global market, implementation of
Quality Management System (QMS) concept has become an important business style and a
key survival tool, both for manufacturing and service industries, from large-scale to small-
scale, for achieving the business goal and market value (Başak M., 2014).
The adoption of a QMS should be a strategic decision (Mello et al, 2005), development and
implementation of this system should consider the uniqueness of each organization, since it
depends on several factors like: Specific objectives; supplied products, and processes used
(Salgado et al, 2014).
Implementation of ISO 9001 QMS represents the basic precondition of a company’s success
and entrance in the market (Gotzamani et al, 2015). This implementation of QMS is a

2
voluntary process supported by organization’s own strategy, motivations, policies and goals
(Kaziliunas, 2010).
The ISO 9001 QMS standard has been accepted and realized almost in all countries of the
world since its inception in 1987 (Dupendant, 2016). The ISO 9000 series certification is
important to organization seeking to interact internationally. The newer version of ISO 9001
is introduced in 2015. The standard is widely used by organizations to gain both operational
and market benefits. Therefore, recently in Ethiopia ISO 9001 QMS has been adopted on the
same voluntary basis by Cable industries in order to improve their competitive advantage.
The performance of organization is dependent on the ability of the organization to meet the
standards of good or service quality required by end users. The organizations are mentioned
to have a good quality management if the output of the organization is meeting with end users
requirements and the possibility to develop the outputs to meet the customers' expectations.
For this study purpose from the manufacturing sector, cable industries in Ethiopia are
selected. BMET, Elsewedy and Belayab cable factories implement QMS (ISO 9001) and got
certificate.
This study will investigated the impact of quality management on organizational performance
which will provide good information about this effect in cable manufacturing sector. This
thesis used primary and secondary data collection and analysed the input by using SPSS.

3
1.2 Statement of the Research Problem
The implementation of the ISO 9001QMS internationally provides inherent positive impact
on the overall performance of the organizations. However, the impact of its implementation
in the area of study remains questionable. Many researchers’ studies have shown mixed
conclusions on the impact of ISO 9001,but most of the reports show positive results of QMS
practice on performance (Zu, 2009); (Kaynak and Hartley, 2005); (Sila and Ebrahimpour,
2005); (Prajogo and Sohal, 2003); (Kaynak, 2003); (Ahire et al, 1996), but still, some studies
reveal negative results (Abdel Aziz, 2011); (Kitaw and Bete, 2003); (Beshah and Kitaw,
2014).
Even if there is reasonably variety of studies available on the impact of QMS implementation
on sectors such as Agro-processing, metal industries, limited or no studies has been done
concerning for Ethiopia cable industries. The result of such studies indicated that the impact
of QMS via application of ISO 9001 is tremendous. The impact can be highlighted on product
quality improvement, market share penetration, inventory monitoring. As a result of this
studying impact of QMS on Ethiopia cable industries can help to maximize benefits from
manufacturing industry due to quality management and other different problems. The impact
can be illustrated such as electrical cables are highly linked to our day-to-day activity. And
also electricity is essential for any factory activity.
Therefore, the aim of this thesis is to find out what are the impacts of ISO 9001, and to give
better understanding the differences in the current literature.
1.3 Research Questions
After finalizing this thesis, the following research questions will be resolved
Question 1: What is the current QMS implementation practice in Ethiopia cable industries?
Question 2: What are the impacts of QMS implementation in Ethiopia cable industry?

4
1.4 Objectives
1.4.1 General Objective:
The general objective of this thesis is, to investigate the impact of the implementation of QMS
(ISO 9001) on organizational performance for the selected cable industries in Ethiopia. The
organizational performance variables used are: business performance, operational
performance and quality of service/product.
1.4.2 Specific Objectives:
Investigating of ISO 9001 QMS trend, impact and application related to cable
industries.
To investigate positive and negative impacts of implementing QMS.
To draw a frame work and general conclusion on the impact of ISO 9001 QMS on
cable industries in Ethiopia.
1.5 Significance of the Study
Since there are limited studies in the area, it will give a comprehensive starting point for more
precise quality researches for Ethiopia Cable Industries.
The research offers a realizable contribution to standing academic and practical knowledge
related impacts on implementing QMS ISO 9001 on Ethiopia cable industries. It can inform
others who think that implementing ISO 9001 is mandatory, by presenting whether it has a
positive or negative impact.
Finally, the research may assist as an initiative for further research on impacts of
implementing QMS ISO 9001 on Ethiopia cable industries for educational institutes.
Conclusively, anybody who is interested in QMS especially in Cable products may get a good
idea from this thesis. With this regard, this study has added its own importance to the concept
by studying the impacts of ISO Quality Management System implementation on
organizational performance.

5
1.6 Scope of the Study
The scope of this thesis is limited to investigating the impacts of QMS on Ethiopia cable
industries specifically; BMET, Elsewedy and Belayab cable industries.
However, most of the data and information will be collected from BMET cable industry, due
to the fact that the researcher has good access to get required data or information.

6
Chapter Two
2 Literature Review
2.1 Conceptual Definition
2.1.1 Quality
The word “quality” illustrates a concern for customer satisfaction. Quality is the sum of
imbedded characteristics & features of a product/service which satisfies the required need of
the users.
It has been found that different researchers adopted different quality definitions and outlines
based on their own understanding of QMS and research objectives. Consequently, there are
fewer agreements on what QMS is and what constitutes it.
Quality has become an advantageous marketing tool of many companies to exceed
competitors in expanding the market share of a product (Awoku, 2012).
Quality can be considered as a competitive tool in the marketplace. Quality creates
competitive advantage by proving products that meet or exceed customer needs and
expectations (Lee and Zhou, 2000). Quality is defined using different perspectives, as it is
still a subjective goal that has indefinable characteristics (Kazan et al., 2006). An early
definition for quality is presented by, (Juran, 1974) who defines quality as “fitness for
Purpose”. (Reeves and Bednar, 1994) define quality as excellence, value, conformance to
specifications, and meeting or exceeding customers’ expectation. The term “fitness for
purpose” defined by (Juran, 1974) is also included in the quality definition presented by
(Reeves and Bednar, 1994). Thus, the customer perspective with respect to quality is the
master key that should be understood while determining any term for quality or definition of
quality. (Garvin, 1987) sees quality as a multidimensional construct. He describes quality as
having eight dimensions, which include: conformance, performance, reliability, features,
durability, serviceability, aesthetics, and perceived quality. Conformance is the level of
satisfaction of a set of specification labelled by the end users, while performance depicts the
level of efficiency.

7
2.1.2 Meaning of ISO 9001 Quality Management System and Certificate
ISO is a Greek word which means “Equal”. The International Organization for
Standardization (ISO) is founded in February 23, 1947; London United Kingdom. It is a
worldwide federation of national standards bodies from some 100 countries, with one
standards body representing each member country. ISO is the world’s largest non-profit
organization to develop and publish international management system standards on various
subjects such as ISO 9001, Requirements for a QMS. Quality Management System is a set of
interrelated activities performed to meet the required needs of the end users. Some quality
specialists consider Quality Management System as a major activity required to meet the
customer needs. Researchers define Quality Management (QM) is both a set of guiding
principles and management style and that have been adopted by managers in organizations to
improve competitiveness and organizational performance. The ISO does not enforce
regulations (Dupendant, 2016).
A Quality Management System is a set of tools for intended to manage the planned activities
of a company/organization to accomplish and achieve a targeted outcome regarding the
satisfaction of customer demands. This may refer to engaging Human-Resource, Knowledge
& Technology and Working Procedures to achieve the intended goal (Feraneceschini, 2007).
ISO 9000 standard has been revised during the last thirty years. The revisions has under-gone
four times since the first publish in 1987 of which the 9001:2015 is the last version.
The 9001 shows the standard code for Quality Management System and the 2015 shows the
publication year of the standard. The revision of the standard were essential since they
depicted the new demands of the end users by avoidance of doubts in the previous
publications of the standard.
“ISO 9001 Certified” means an organization has met the requirements in ISO9001 (QMS).An
ISO certification is not a license that permits an activity. ISO 9001 evaluates whether
your QMS is appropriate and effective, while forcing you to identify and implement
improvements (Dupendant, 2016).

8
2.1.3 Brief review of QMS ISO standards and principles
Generally speaking, a management system is the way in which an organization manages the
inter-related parts of its business in order to achieve its objectives (ISO, 2017). According to
ISO, these objectives can relate to a number of different areas, including product or service
quality, operational efficiency, environmental performance, health and safety in the
workplace and many more.
The ISO 9000 standards originated in 1987 with a bulletin from the International Organization
for Standardization (Ferguson, 1996). Its purpose was to provide a series of international
standards dealing with quality systems that could be used for external quality purposes
(Aggelo Giannopoulos, et al., 2007). The other objective was the desire to provide
information to organizations about how to design their own quality systems based on
individual company marketplace needs.
The management system standard has been presented with the purpose of guaranteeing
achievement of customers’ needs with regards to the service/products provided is ISO 9001,
Quality Management System (ISO, 2017). All the standards set in the ISO 9001 QMS are
practical aiming to satisfy the basic requirements of the customers’ requirements.
Accordingly, the target set in the application of the minimum standardization will be
beneficial to both the customers’ needs satisfactions & the supplier’s achievements. It also
ascertains the definition of a contractual agreement standard which enables the customers’
needs conformity to the supplier’s duty to fulfil the demands (Gohe and Yahaya, 2001).
According to the International Organization for Standardization (ISO), quality management
system is demarcated as a general guideline to coordinate the activities required to achieve
the quality performance of the organization. It is a standard established by the International
Organizations for Standardization & act as a framework for organizational quality
management systems (Omeachonu and Bella, 2011). The framework is widely agreed by all
stakeholders, i.e. governments and companies around the world & as a result used as standards
for management system.

9
The ISO 9000 series standard is definitely the most recognized quality management system
(Bashirs and AlRawahi, 2011).
ISO 9001 involves requirements for quality management system that can be used for inner
system procedures by companies, for contractual resolutions and for certification. It
concentrations on the efficiency of quality management system in fulfilling customer needs
(INTERA.ITILTD-India, 2019).
The below table give a brief discussion on ISO 9001 Principle
Table 2.1: ISO 9001 Principles and Organizational welfares
ISO 9001 Principle Organizational Welfares
Customer Focus
Growth Market share as a result of quick response to market demands.
Increase efficient employment of resources to fulfil customers demand on
time.
Leadership Customers will be appealed by the presentation of the company objectives.
Actions will be executed in a combined fulfilments
Involvement of
people
People will be attracted and motivated to align with the company. People
ready to participate in the activities and development.
Process approach Avoidance of rework and concentrate on cost saving. Aspire to renewed,
improved & reliable outcomes. Concentrate on development opportunities.
System approach to
management
Alignment of accepted procedures to accomplish the required results.
Concentrated on the key courses.
Continuous
improvement
High achievement over development company competencies. Suppleness to
respond rapidly to prospects.
Truthful approach to
decision making
Developed facility to review, to comply, to change opinions, and reach
results. Assured judgements.
Mutually beneficial
supplier relationships
Developed aptitude to ascertain worth for mutual benefits. Suppleness in fast
reply to altering demands and customer requirements.
(Source: BSI, 2019)

10
The quality management system tracks the procedure based abstract model as represented in
Figure 2.1. The model includes the main segments and divisions of the quality management
standard counting: management responsibility, resource management, product realizations
and measurement analysis & improvement whereas considering the customers requirement
as input & customer happiness as output in a continual improvement method.
Figure 2.1: A procedure based Quality Management System Model
(Source: INTRA.ITILTD-India, 2019)

11
2.1.4 Organizational Performance
Performance of the business is a measurement of the achievement of organizational goals
(Carlos, Alex and Jose, 2012). The measurement is operationalized by the organizations
report that indicators of business performance, market share, the percentage of new product
sales to total sales and return on the investments (ROI).
The overall helpfulness of the company is stately by linking the commercial and non-
commercial aspects of the company (Razaei and Baalousha, 2011).
Performance measurement business was conducted with the financial and non-financial
criteria. Dimensions are used to measure the performance of the business is done by
combining financial and non-financial criteria are market share, the sales of new products and
services, return on investment (ROI), improved processes, reduced time to respond to market
changes.
Another study conducted by (Jho Rhodes and Peter Lok, 2008), entitled “An integrative
models of organizational learning and social capital on effective knowledge transfer and
perceived organization performance”. Performance measurement is done by using the
concept of balanced scorecard (Kaplan and Norton, 2002). Dimensions and performance
indicators that are used include: Innovation and learning (such as new products, technological
improvements, an increase in patents, improvement of human capital); Process (such as a new
system, cycle time reduction, process reengineering); Customer satisfaction (such as an
increase in the number of customers, repeat purchase, reduction of customer complaints;
Finance (such as profit improvement, cost reduction, increased sales).These four dimensions
are grouped into 2 of the financial performance in the form of repair cost advantages and
increase market share; and non-financial performance / performance innovation of product
development and process engineering.
Consequent study conducted by Pantauvakis & Kafetzopoulusen, titled the impact of ISO
9001 efficiency on the routine of service organization. Their research was conducted on 100
companies services in Greek that has been certified ISO 9001-2008. Performance
12
measurement is done with the financial performance, operational performance and quality of
services / products. Dimensions and indicators of the abovementioned research converted a
large part of the balanced scorecard method of assessing the performance of companies /
businesses based on financial and non-financial criteria. Results of non-financial assessment
which includes innovation and learning, internal business processes, customer satisfaction
always should automatically reinvested to increase the value of the company's business that
is known as intellectual capital.
2.2 Theoretical Concepts of QMS
The literature currently advances main theories to explain the implementation of QMS, each
of which centres on idea of the implementation of QMS, top management commitment as
well as quality improvement which offers a sufficient amount of information and research on
the topic, also implementation of QMS to various cable industries in Ethiopia.
2.2.1 QMS Implementation in Ethiopia Cable Industries
2.3.2.1 BMET
BMET Energy Telecom Industry and Trade PLC has been established in 2013, and it’s located
in Sebeta, Dima. The company perform design, production and marketing of the following
goods and services, Communication cables and accessories (Fiber optic cables and
accessories, data cables and optical cables), power cables, energy transmission and
accessories (insulated cables, bare grounding, copper wire rod, aluminium wire rod and bare
aluminium conductors), building wires and multi core cables, low voltage energy cables,
medium voltage energy cables, high voltage energy cables, aluminium conductor and copper
telecom cables. The company started implementation QMS in December 2014 and Certified
in December 2015 (BMET Quality Manual, 2019).

13
2.3.2.2 BelayAb
BelayAb cable manufacturing private limited company has been established in 2014, and it’s
located in Adama city. The company produces data cables and aluminium cables. The
company started implementation QMS in January 2016 and Certified in December
2016(Company Manual, 2019).

14
2.3.2.3 Elsewedy Electric
Elsewedy Cables Ethiopia PLC has been established in 2008, and it’s located in Dukem
city. Their products are; Low Voltage Cables, Medium Voltage Cables, Overhead
Conductors, Special Cables, Copper telecom cables, Telecom Accessories, Winding Wires,
etc. The company started implementation QMS in April 2015 and Certified in May 2016
(Elsewedy Quality System Manual, 2019).
2.3 The Motivation for implementing ISO 9000
ISO 9000 comes with long list of requirements, which the organization will have to fulfil in
order to become certified. Regardless of the organization’s motivation, it’ll have to go through
the process of change to adopt the quality assurance standard. Organizational change does not
come easily. Existing procedures, practices and organizational culture ensure that most
organizations are quite rigid and resistance to change. To make the transition, the organization
will first have to practice its norms and values, altered them such that they fit the new
paradigm and have refrozen to make them stick. In the meantime, organizational procedures

15
have to be re-established and supplemented by the requirements for the coming from the ISO
9000 standards.
Moreover, the motivation for ISO 9000 implementation is often claimed to be a significant
factor for business success which could be external reasons such as, marketing advantages,
customer expectation and competitive pressures, instead of internal reasons such as improving
the quality of products and services, (Feng et al., 2008). However, more recent research
indicates that manager’s motivation for seeking ISO 9000 certification has shifted
significantly from external to internal reasons. For example, market related reasons for
certification do not rank high as motivators to gain ISO 9000 certification.
2.4 ISO 9001 Certification
ISO 9001 evaluates whether organizations Quality Management System is appropriate and
effective, while forcing the organization to identify and implement improvements.
ISO outlines a set of proprietary commercial and industrial standards which are followed
worldwide as a measure of best practice conformed to buy a company. In order to be certified
to ISO 9001, a company must follow the requirements set forth in the ISO 9001 standard. The
standard is designed to help companies at many levels, including a focus on customer
requirements, improving leadership within the company, finding ways to continually
improve, and more. There are several different documents in the ISO 9000 families of
standards, but ISO 9001 is the only standard in the 9000 series that request certification (ISO
9000 series, 2015).
In general, it is understood that ISO certification can improve the performance of the
organizations though there are some others who do not agree with this argument.
Being this is the case and even if there are a multiple of studies in the field of quality
management, there is still a gap on how ISO certification have an impact on the performance
of an organization.

16
Moreover, to get certification as a proof of the organization that has fully complied the
standard, several procedures should be taken, which are:
1. ISO 9000 Assessment: The primary assessment is a detailed review of the company’s
quality systems and procedures compared to ISO 9000 requirement. This process defines
the objective and scope of the ISO 9000 project.
2. Training: All employees must be trained in two areas. 1st, they must have an overall
understanding of ISO 9000 vocabulary requirements, the role of the quality manual and
the benefits that will be derived from the system. 2nd, they must understand the actual day
to day process of upgrading and improving procedures.
3. Documentation of work instruction: All procedures must be described and documented so
that they can be understood prior to approval. Once completed, this document should
outline every process a company undertakes that affects the quality of its finished
products.
4. Quality Assurance Manual: While ISO 9000 standard does not require a Quality
Assurance and policy manual, they do require that a company document everything it does
and every system that affects the quality of the finished product. The manual is often used
to assemble all documents in one place.
5. Registration Audit: The final step in certification is an audit by an organization chosen as
external registrar to see that the system is working as described in the Quality Manual and
that meets ISO 9000 requirement.
This literature is, therefore, believed to include the impact of ISO certification on
organizations performance.
2.5 Impact of ISO Certification
ISO 9000 is an international standard for quality assurance, recognized throughout the world
(Ashton and Jackson, 1995). ISO certification stands for assured minimum quality standards
that organizations should meet, and is held to assure a reliable required quality levels (Singles
et al., 2001).

17
(Singles et al., 2001) also stated that ISO 9000 standards help to ensure that organizations
follow specific well documented procedures in making of their products or services, and
nothing more. These procedures describe how operations in an organization must be
conducted. By doing this, organizations will have consistent product or services that are
offered to the customers. If the products or services are consistent and meet customer
specifications, then the organization will benefit from ISO certification.
These benefits, (Cagnazzo et al., 2009), could then be those that are internally impact the
performance of the organization or those that can externally affect the organization. From
this, the researcher will discuss the internal impacts of ISO 9000 certification impacts on
quality system, product/service, competitiveness, management and team working, financial
performances; and followed by external impacts, such as impacts on market, customer and
impacts from or on suppliers.
2.5.1 Internal Impacts
2.6.1.1 Impact on the Quality System
ISO 9000 accreditation, inspections & assessments permit organizations to always modernise
& regulate their quality systems. Specifically, the quality assurance should be: - dedicated to
quality, practice the interior quality assessments for promotion in estimating the usefulness
of quality system, confirm the quality system is developed, and frequently evaluate the quality
system (Luca Cagnazzo, Paolo Taticchi, Francesco Fuiano, 2009).
2.6.1.2 Impact on Management & Team Working
Many authors (Cartin T.J. 1995, Ingles S., 1994, Tenner A.R. and DeToro I.J.,July 1992) have
frazzled staffs participation & additional worker features as the major to fruitful application
of the International Standard of Organization system.
Some authors experiential that ISO 9000 procedures convey almost observable variations in
such fields as HR growth, attracted and motivated of employees, communication and
collaboration, and organization aim mission & vision. An assessment applied on 700
companies, (Taylor W.A., 1995) observed that obligation to ISO 9000 certificate
18
implementation has shown major enhancements in the approaches & performances of the
management teams of the companies. According to the conclusions of the research, ISO 9000
implementation system determine that it can change & restructure administrative conditions
of a company (Kunnanatt J.T., 2007)
2.6.1.3 Impact on Product or Service
The main significant thing that will impact the presentation of the rivalry is the fact that there
is a direct link among product/service quality, and also there is a direct connection among
consumer gratification & success/profitability (Helmi, M.A. 1998). The main improvements
made to the ISO 9000, as a result of the international reporting period, will be related to the
overall product quality of the product, as well as the quality of the service (Brown A., Van
der Wiele T. and Loughton K. 1998). These will ensure that ISO 9000 is fully improved the
invention quality and customer demand (Quazi H.A. and Padibjo S.R 1998). Many other
industries are working to improve the overall productivity of the product, and as well as to
improve the overall productivity of the business (Chean C.S and Yaeug T.L, 2003).
Additional features of the status quo that have had an optimistic impact: it has seen a reduction
in the distribution time, the overall cost of the product, the overall saving in the product price,
and increase leading-time. The ISO 9000 program offer a comprehensive overview of the
processes that are set up in a comprehensive process, both in productive or in-service delivery
system. It decreases the overall erraticism of the product because it deliver a superior way to
write and process directions (Curkovic S. and Pagell M., 1999).
2.6.1.4 Impact on Competitiveness
Implementing ISO 9000 standards allows organizations to compete more effectively because
their products have a higher quality and their procedures are more efficient and consistent. If
organizations become certified for ISO 9000, they have an even bigger competitive advantage
because they can bid on contracts that specify ISO 9000 certification, while their competitors
lacking certification can't bid. Overall, ISO 9000 improves their competitive position in the
marketplace (Bert Markgraf, 2015).

19
2.6.1.5 Impact on Financial Performances
Most researchers describe that the impact of ISO 9000 on financial performance is a potential
sources of discussion. A research conducted by (Van Der Wiele et al., 2000) justified that
there is no clear relationship between having ISO 9000 series certificate and the financial
performance of an organization. This is mainly due to the reason that ISO 9000 focuses only
on how organizations reduces their costs through minimizing the inspection time, detecting
the quality problem early at the production level and the time spent for call backs. ISO also
requires the tasks to be performed as per the stated procedures. But, in general, ISO certified
companies have more access to new markets and can control the existing markets which in
turn can improve their financial performance.
ISO 9000 had the most immediate and substantial impact on productivity/efficiency,
profitability and cost factors (Pinar, 2001). This might suggest that these were the main factors
influencing the belief or perceptions of the firms regarding ISO 9000 success.
(Corbett, 2002) supplemented that firms that decided to seek ISO 9000 maintained their return
on assets (ROA), while the non-certified firms saw their performance decline over time.
(Sharma, 2005) provided the evidence that ISO 9000 certification is associated with
improvements in financial performance. His results revealed that ISO 9000 certification does
bring benefits to the firm and its stakeholders. Profit margin, growth in sales, and earnings
per share are among the significant improvements observed as a result of ISO 9000
certification. However, the impact of ISO 9000 certification was greater on profit margin than
on growth in sales which suggests that the improvement in overall performance is attributed
largely to improvements in internal business processes.
2.5.2 External Impacts
2.6.2.1 Impact on International Trades
According to a number of studies, the international standard of deciding whether to implement
the entire level of trade is completely undefined by the fact that it does not have a definite
article, and that it does not have valid ISO 9000 certification. In fact, in most cases, it is clearly

20
indicate the purpose of their acceptance to implement ISO 9000. Such that, ISO 9000 valid
certification will be used as a passport for performing most businesses in different countries.
The ISO 9000 certification represents a significant features for increasing sales on
international trades (Costa, M. and Lorente, M., 2004).
The acceptance of international quality ISO 9000 has created a consensus to evaluate and
measure suppliers to eliminate the most obstacles to international trade. Consequently, the
standard ISO 9000 has been recognized as a national & international trademark (Cater D.J.,
Pasqualone R.G., 1995).
2.6.2.2 Impact on Market
Acceptance of the ISO 9000 program, the basis of performance enlargement comes from the
fact that ISO 9000 certified companies have found a new market (Corbett, C. Montes-Sancho,
M. Kirsch, D., 2005). The ISO 9000 chain of accredited certification is widely accepted for
its versatility in access to markets (Aarts F. and Vos E. 2001). Agreeing to a recent study
published in the UK, some of the welfares of a certifications are as follows: it will be very
helpful to access new and international market, it helps to keep a close-knit market in place,
to increase the chance of procurement new contracts. An additional essential feature related
to ISO 9000 certification is related to the rapid response to market demand exploration
(McGuire, S.J., Dilts, D. M., 2008).
Santos and Escanciano (2002) described that companies will achieve the development of a
more suitable commercial offer for their customer needs, which implies a marked increase in
customer satisfaction and loyalty, and greater opportunities appear in the access to new
markets as a result of the improvements in the commercial management. And also there is an
increase in market participation and the firm acquires a strong image.
Moreover, as Cagnazzo et al. (2009) identified, the company that get ISO certification may
help them in gaining access to the market and the faster reaction to the market request. The
fact that ISO 9000 series certification can lead to gain access to markets, besides it can also
review some of the welfares of certification; implementing one-on-one important marketing,

21
helping to secure new contracts, and growing access to new and global markets will be a great
help. This ISO 9000 certified organizations have been able to find a new marketplace that
will provide with the latest ISO program.
2.6.2.3 Impact on Customer
The implementation of the ISO 9000 system provides a comprehensive and wide-ranging
solution for organizations across the global, as well as increasing customer’s satisfaction
(Luca Cagnazzo, 2007). The positive impact of customers has been widely acknowledged by
many companies in the world, and all of the companies that are certified by the ISO 9000
certifications are fully aware of the needs of their customers. These include: a number of
planned activities to increase customer satisfaction, complete methodical procedures for the
elimination of misconstructions by customer orders, a methodical approach to dealing with
customers, and methodical analysis the terms of agreements (Luca Cagnazzo, Paolo Taticchi,
Francesco Fuiano, 2009).
2.6.2.4 Impact on Supplier
There are two main features that can be used by suppliers to make a difference. Welfares that
come from accreditation and certificates come from the end of the company. The first, the
ISO 9000 standards have been acknowledged by the world-wide accredited and qualified
suppliers of quality assurance management system (Beattie, K.K., A.S., 2009).
All cases related to ISO 9000 are required to be permanently certified by the company.
Providers are selected based on the quality of the certain product: There is a general lack of
disagreement with the suppliers of trade orders, the quality of services provided has been
reviewed all materials from customers’ and non-suppliers are treated in the same way, and all
subcontractors are in the same position. It agreed with the suppliers of the work they do. With
the growing demand for certified suppliers (in USA industries) stated that it expects ISO 9000
certified companies to be able to increase the quality of their supplier communications (Buttle,
F., 1997).

22
(Terlaak A., King A.A., 2006) has studied ISO 9000 certificates as a quality marker, and
organizations with ISO 9000 certification are growing rapidly and faster than non-certified
companies.
2.6.2.5 Impact on Financial Stakeholder
(Sharma, 2005) stated that ISO 9000 certification does bring benefits to the firm and its
stakeholders. The practice of ISO certification is linked to the need for comprehensive
financial commitment to the overall commercial performance of all stakeholders (Cagnazzo
et al., 2009). According to the authors, the ISO certification is clear indication of the fact that
other organization are suffering from the effects of the crisis. Organization established in a
low-quality background that have high agreements with quality standards should have
relatively great properties compared to companies in the area that are believed to manufacture
extraordinary quality.
2.6 Empirical Studies on QMS implementation
In above sections theories regarding to QMS implementation have been explained in detail.
On other side there are various of researchers who have attempted to describe the impacts of
QMS implementation which form their view of empirical studies in this section and has a
particular focus on those that have been conducted from Ethiopia, Africa and worldwide in
general and it is presented as follows:
2.6.1 Empirical Literature Review: World Wide
(Magd et al. 2006) assessed the outcomes of a study of 175 manufacturing companies
certified by ISO 9001 in Saudi Arabia. The research concentrate on the welfares gained from
the application of ISO 9000, the overall satisfaction level, the post ISO 9001 performance
requirements, the reasons for the impact of the recording agencies, and the reasons for the
overall impact of the registration, and of course the registration: have been through a lot of
problems with agencies. In Saudi Arabia, a number of certified organizations have
demonstrated the full scope of the recording process. The reason why this is possible is that
most of the important customers who claim to have high quality service/product that do not
have a valid/permanent certificates are required due to the fact that the high-quality

23
environment is not enough. The study propose: in order to implement a comprehensive
standard of conduct in a complete manner, other organization must carefully monitor the
company, monitor external & internal features, and at the same time evaluate the
implementation practise as a cost effective analysis. They also need to use ISO 9000 to meet
the requirements of ISO. At-the-time of this study, a number of certified organizations were
still in the area, limiting future research in this area.
(Jang and Lin, 2007) has thoroughly explored whether business can benefit from ISO-9001,
and insists that the implementation of ISO-9000: will greatly enhance the overall impact of
ISO 9001 on the overall performance of ISO-9000 in Taiwan. A study inquiry-form have
been sent to 1,668 organizations with a valid ISO 9000 certification, in over-all 441 practical
reply have been carry-on. By means of the structure of equation model, the research
investigates based on the generalization of the implementation of the ISO, both in general and
in the context of the implementation routine of the ISO-9000. As the result show, we
recognize that there is a long-term positive link between the organization and the company in
which the organization is implementing the ISO 9001 and strong performance. It also adjusts
the complete range of inter-relationship between the internal and external components of the
ISO implementation. In addition, the implementation of the ISO 9000 will directly distress
the overall performance of the market, both directly and indirectly.
(Ul-Hassan et al, 2012) empirical examined the association between QMS practices and
performance, i.e. quality, business, and organizational performance. The quantitative data
were obtained through a survey from 171 quality managers of Pakistan’s manufacturing
industry. This study supports the hypothesis that QMS practices positively impact the
performance. QMS tools and techniques (Incentive and Recognition System, Process,
Monitoring and Control and Continuous Improvement) and Behavioural factors (Fact based-
management, top management’s commitment to quality, employee involvement and customer
focus) contribute to the successful implementation of QMS. According to the research, the
successful implementation of a comprehensive and wide-ranging implementation of the QMS
trend will improve the overall performance of the organization. The findings are based on the

24
fact that public and private executives are working together to achieve better customer
experience, greater customer satisfaction, better communication, better quality, and better
business performance rather than implementing QMS trends.
(Omer el Tigani, 2011) has evaluated the overall impact of the QMS application on the overall
routine of involved staff. Qualitative as well as quantifiable studies were performed. In Qatar,
the state of emergency, both private and public, gathered data from a total of 150 participants.
The results also demonstration that the implementation of the ISO 9001, will not affect the
overall performance of the staff of participating organizations. This was a study of research
and development in the field of public relations. It allows the applications to raise certain
questions. And the ISO quality management system is a quality-based system that recognizes
the performance of the structure. The research addresses some of the important questions in
the global ranking systems.
(Memari et al, 2013) investigates the relationship between organizational commitment and
employees’ job performance in Meli Bank in Kurdistan Iran. The results showed a positive
relationship between organizational commitment and employees’ job performance. In the
comparative analysis of three dimensions of organizational commitment, normative
commitment has a positive and significant correlation with employees’ job performance.
2.6.2 Empirical Literature Review: Africa
(Muturi et al, 2015) has been studying the overall results of the implementation on companies
of the ISO in Kenya. He has repeatedly directed the recorded companies in the most widely
used security interactions in East Africa. Secondary data available from the NSE warehouses
on financial performance was collected from 19 of these organizations. The study covered
five sectors namely: Finance; Automobiles; Manufacturing; Energy/petroleum and
Commercial services. The study used a wide-range of web analytics to collect information
from the world’s leading websites. During the last four fiscal years (2010-2013) the net profit,
the exchange rate, and the total net possessions were collected. According to the results of the

25
study, the total number of ISO certifications in the companies will be affected by the total
number of non-permanent returns.
(Benarbia et al, 2015) investigated the effect of ISO 9001 certification of BeniSaf company
performance, as perceived by the management. Results indicated that the ISO 9001
certification has a positive impact on BeniSaf Company’s performance. The marketing
advantages were the principal benefits and the benefits related to the human resources
occupied the lowest position in the company.
(Otieno et al, 2015), examined the effects of QMS implementation on students’ employment,
and establish the effect of QMS implementation on employee performance and to establish
the level of infrastructural growth of Maseno University. The study adopted a case study
design since it was desirable for in-depth analysis. The target population was 1283 non-
teaching staff of Maseno University. A sample of 296 employees was obtained from the
population using stratified random sampling. Primary data was then collected using
questionnaires while secondary data obtained from records in relevant offices. Data collected
was analysed using correlation, regression analyses. The study findings established that the
QMS implementation had a strong positive impact on student employment.
(Wanjauand Kibe, 2014) explored QMS and their influence performance of food processing
firms in Kenya, where, food processing companies still find it challenging to effectively
implement QMS that contribute towards realization of increased organization performance.
Over 75% of food processing companies in Kenya are still struggling to embrace effective
quality management systems as a strategy to gain a competitive edge in the target market
through development of superior product quality, market growth and higher customer
satisfaction.
The study found that quality management practices under study have a strong positive
connection with an organizations’ competitive performance. These quality practices are
critical in achieving and maintaining this competitive performance, they include top
management support, control measures, adoption and utilization of information technology

26
and capacity enhancement. The study therefore recommends that food processing firms focus
should thus be on modifying the culture of the whole organization with a view to transforming
it into an overtly quality-oriented culture, for the firm to achieve the benefits of a QMS, it is
critical to regularly run training in this area with the aim of instilling habits and make workers
more receptive to the change of working methods. The implementation of quality
management techniques enables organizations to improve internal efficiencies, which is
considered as a prerequisite to become competitive in global marketplace.
(El Sakka and El Khamess, 2013) determined the relationship between applying QMS and
environmental standard on organizational performance (OP). Data in the study was collected
from sample of 150 management staff of small and medium enterprises (SME’S) in Egypt.
The collected data were analysed using SPSS (Statistical Package for Social Sciences). The
study found that quality management and environmental standard aspects were related to
organizational performance. The study also revealed that applying QMS and environment
standard contributed to organizational performance, it was found that QMS had more effects
on organizational performance than environmental standard; the findings of study provide
empirical evidence that quality of management system significantly has an influence on the
organizational performance more than the influence of environment standard findings.
(Fening et al, 2013) examined the linkages between QMS and organizational survival in
manufacturing companies in Ghana. The quantitative approach and the survey method of
collecting data were used. The questionnaire was administered through the face-to-face
method of collecting data. A sample of 250 manufacturing firm within the city of Kumasi,
the second largest city in Ghana was selected and interviewed. The missing data and data
differences were eliminated resulting in a final valid sample of 101. A structural equation
model (SEM) was proposed to examine the relationships between the seven organizational
linkages and five practices of QMS impact on the Ghanaian companies. The findings showed
significant positive effect on organizational performance. This study demonstrated that
Ghanaian and foreign owned manufacturing companies believe that QMS is a key-
contributing factor to a firm’s survival.

27
(Fapohunda, 2012) examined correlate of QMS as a leadership style on organization
performance. The current trend of QMS as used in work organisations encouraged the interest
of this study. The objective was to establish relationship between QMS and organization
performance using a manufacturing company in Nigeria. One hundred and fifty (150)
questionnaires were returned in usable condition. With the aid of chi-square statistical
method, the four hypotheses formulated were tested. The findings showed a significant
relationship between QMS and organizational performance; between the success of QMS and
perception of organization members; between QMS and effective management of resistance
to change performance. This study recommends that management should also provide
enabling environment to implement QMS policy with democratic leadership styles in the
organisation and should think of how satisfy customers at the first time always.
2.6.3 Empirical Literature Review: Ethiopia
(Frew, 2016) examined the practice and challenges of QMS (ISO 9001:2008) in the
Pharmaceutical industry: The case of EPHARM Ethiopia. A descriptive research approach
was employed using a self-administered questionnaire to get primary data from employees of
EPHARM S.C. The research findings are concrete and valuable hence it can be concluded
that implementing the system brings the benefits of building the image of company, creating
a better competitive advantage on top of its competitors, improved awareness of employees
to quality, increased profit and reduced or fewer rejections of products. And also efforts to
determine the challenges of implementing QMS revealed that lack of adequate information,
lack of management commitment and lack of capacity by personnel to be the main challenges
that impede the effective implementation of the system. In spite of the few challenges faced
by the company to develop, implement and maintain ISO 9001:2008 Quality Management
System, broadly asserted benefits of implementing it were found significant as a whole and
has resulted in good impact on the performance of the company. The study finally
recommends, it is important that all potential problems identified in the implementation of
QMS to be given a due attention and appropriate preventive and corrective actions planned
ahead during the planning and development stage of the system.

28
(Kidanu, 2014) assessed the impact of QMS (ISO 9001) certification on Ethiopia construction
companies. To carry out the study a questionnaire is designed based on the literature review
and distributed to ISO certified construction companies, then collected and analysed. The
conclusion was drawn from the findings. The ISO 9001 certified construction companies have
not got tangible benefit. The main reason for failure is that construction companies do not
give much emphasis to internal benefits of the standard such as process efficiency and
effectiveness, inadequate training, inadequate motivation etc. In addition to this, the support
and encouragement of governmental bodies to certified companies lacks continuity. The top
main challenges that certified companies faced during ISO implementation are change
resistance, inconsistency in implementing QMS and Turnover. Lastly, recommendations are
forwarded to fill the gaps observed in the findings.
(Beshah and Kitaw, 2014) assessed Quality Management Practice in Ethiopia. The study
states that the importance of Total Quality Management, is growing to increase customers’
satisfaction and as a result to win the market in the long term. In the criteria analysis, the
problem is associated with all criteria. At the sub-criteria level the root cause for the problem
are clearly identified. In fact, almost all the sub-criteria are negatively skewed which
practically shows weak quality management practice in Ethiopian Industries.
(Tulu, 2011) investigates the impact of ISO 9001 certification on organization performance:
on Ethiopia Beer Factories. The research was studied mainly due to the reason that companies
often claim ISO certification can improve the performance of the organization. To investigate
this, secondary data of five brewery companies in Ethiopia are collected. The statistics used
the organizations over the ten-year duration, and it is before and after the completion of the
ISO permanent certification. The collected data was analysed using descriptive statistics and
tested for its significance. As the result demonstrate, the ISO’s certification has been
implicated in the company’s overall performance and it has a major impact on the firms. The
finding also indicated that, after ISO certification the companies have acquired improvements
on their total sales. Further study is suggested to investigate the impact of ISO certification
on company performance, particularly for Ethiopian Companies.
29
(Kitaw and Bete, 2003) investigative research QMS title Exertions and Difficulties in the
Ethiopian Manufacturing Industry. The research findings reveal some insight with respect to
the implementation of various quality advantages in the Ethiopian manufacturing industry:
some of the manufacturing companies understand the importance of involvement of top level
management in quality improvement and they actively practice it. Based on the survey, they
draw conclusions on current quality management situation in Ethiopia. The first one is, the
management level of many Ethiopian companies, especially those of public enterprises,
doesn't have strong quality sense. Secondly, because of the poor management commitment in
quality, most enterprises don't have their own business culture to support total employees
involvement in quality improvement. Thirdly, some managers have misconception about ISO
9000. In many manufacturing companies in Ethiopia, because they don't have systematic
quality training program, people in quality and other departments are not familiar with quality
tools and thus quality improvement cannot be achieved in a systematic way. Based on the
survey to 55 manufacturing companies in Ethiopia, the paper addresses the current situation
of quality management in Ethiopia. The survey is not a random sampling from manufacturing
companies in Ethiopia. The surveyed are located in the central cities and cities of high
industry level.
2.7 Research Gap
In paragraphs under section 2.7, the review of the relevant literature on impacts of
implementation of QMS ISO 9001 on business and organizational performance have been
well researched, evident and documented in developed countries, emerging markets like
Saudia Arabia, Taiwan, Pakistan, Qatar, Iran, India and few in Africa. However, there is very
little evidence of empirical studies in Ethiopia context. Therefore the study required to fill or
link the knowledge gap existing by empirically marking out the impacts of implementation
of QMS ISO 9001 on organizational performance for the cable industry in Ethiopia.
2.8 Conceptual Framework
The following conceptual framework has been adopted and diagram describes the relationship
among variables of interest.

30
The dependent variable in this study is Organizational performance (Business Performance,
Operational Performance and Product/Service Quality). And independent variables are top
management commitment, management and team working, quality information, supplier
relationship management, customer relationship management, product/service management
and competitiveness.
Figure 2.2 Conceptual Framework of the study
Independent Variables
(QMS Practice)
- Management & Team working
- Quality Information
- Supplier Relationship Management
- Customer Relationship Management
- Competitiveness
Dependent Variable
(Organizational Performance)
- Business Performance
- Operational Performance
- Product/Service Quality

31
Chapter Three
3 Research Methodology
3.1 Introduction
This chapter describes the research design, Area of the study, method of data collection, data
collection tools, reliability and validity of the research data as well as the techniques used in
data analysis.
3.2 Research Design
A research design helps to decide upon issues like what, where, when, how much, by what
means etc, with regard to research study. In general, the research design is the conceptual
structures within which research is conducted; it constitutes the blue print for the collection,
measurement and analysis of data (Seltizet al, 1962).
Both quantitative and qualitative methodology is essentially driven by the need to gain an
understanding into the impact of implementation QMS on organizational performance in
Ethiopia cable industries.
For the study purpose, from the manufacturing sector, cable industries were selected. The
study has investigated the performance of the industries after the certification. Also for the
investigation purpose, among the cable companies in Ethiopia, the researcher has selected
three certified cable factories, because only three of them have implement QMS and got the
ISO certificate. These include BMET, Belayab and Elsewedy cable industries.
3.3 Area of the Study
The study was conducted in BMET which is located in Sebeta city, Belayab which is located
in Adama city, and Elsewedy which is located in Dukem city.

32
3.4 Data Type and Source
Table 3.1: The concepts and parameters for the study
Objective Constructs Variable References
1. Detecting the
overall performance
dynamics affected by
QMS practices.
2. Analysing the
results of the ISO
9000 QMS practice
on the overall
performance of the
selected companies
Business
performance
Budget of Production
(Kiafetzopoulos, 2015)
(Alkhal, and Yung., 2009)
(Yuar, 2009), (Feng, et al.,
2008), (Lin & Jang, 2008),
(Soung., 2008),
Revenues
Operative wages
Fair whole
Trades
Operational
performance
Performance description
Apparent feature
Consistency
Routine
Stability
Product/Service
Quality
Procedure use
Fairs Proficiency
Efficiency
3.5 Target Population
The population of interested in the study included of General Manager/D.G Manager, Head
of Department/Section, QMS coordinators/ Quality Teams, Subordinate. The target
population was 51 as shown in table 3.1 and for the interview it is 12.
Table 3.2: Target Population
S/No. Position Total Population
1 General Manager/D.G Manager 3
2 Head of Department/Section 18
3 QMS coordinators/ Quality Teams 9
4 Subordinate Departments 21
Total 51

33
3.6 Inclusion and Exclusion Criteria
3.6.1 Sampling Design
Sample is part of the target population that has been selected to represent it. Sampling is the
process of systematically selecting representative elements of a concerned population Kothari
(2004).
The study engaged purposive sampling to select the General Manager/D.G Manager, Head of
Department/Section and QMS coordinators/ Quality Teams, and simple random sampling
was used to select the Subordinate within the selected Ethiopia Cable Industries. Purposive
sampling is popular in qualitative research. Patton (1990) has recommended that among other
cases, purposive sampling can be appropriate where there’s maximum variation in responses
and it serves to identify important common patterns that cut across variations.
Again it was important to purposively sample as it was also found that General Manager/D.G
Manager, Head of Department/Section and QMS coordinators/ Quality Teams were directly
involved with the organizational QMS implementation.
Simple random sampling was used to avoid unfairness and every individual to have an equal
chance to participate in the study. It also confirmed that the cost per observation was greatly
reduced. On this study the subordinates are which works under scrap section, packaging
section, labours etc.
Table 3.3: Sampling Design
S/No. Position Total Population Sampling Design
1 General Manager/D.G Manager 3 Purposive
2 Head of Department/Section 18 Purposive
3 QMS coordinators/ Quality Teams 9 Purposive
4 Subordinate 21 Simple Random
Sampling
Total 51

34
3.6.2 Inclusion Criteria
The Case Company’s General Manager/D.G Manager, Head of Department/Section, QMS
coordinators/ Quality Teams and with the help of ISO 9000 QMS, the implementation of
proposal, development and final evaluation, there have been number of permanent and
general staff members who are involved.
3.6.3 Exclusion Criteria
The Case Company’s employees, who were field workers (like purchasers, sellers) and those
who are newly employed and had inadequate knowledge/information for the ISO 9001
implementation were excluded.
3.7 Methods of Data Collection
Different methodologies will be used for the preparation of this thesis paper. The main sources
of information especially for collecting the theoretical background are different consistent
books, company manuals and Internet websites.
But mostly in data collection, both primary and secondary data are used.
3.7.1 Primary data collection
In primary data collection, the researcher used the following methods: -
Visiting and observation:
To see if the companies are implemented ISO 9001 and also to witness whether they are
working based on the QMS standards so that the researcher can find the first step to
investigate the impact of QMS implementing in cable industries. Therefore, the researcher
observed all the companies are implement ISO 9001 and work based on the implementation.
Interview:
In this data collection method, structured interview questions are prepared and conducted with
each company’s staff members, different department/section managers and Top managements
in order to collect detail qualitative data. It has been conducted for 30 individuals.
35
Questionnaire
Under this data collection method, different questionnaires are designed and distribute for
each company’s staff members, different department/section managers and Top managements
in order to collect quantitative data.
3.7.2 Secondary data collection
With a particular focus on the problems of investigating and measurement activities in cable
industry, data’s are organized from different Academic, Social and Public sources. Each and
every literature searches were conducted using major multi-purpose databases such as Google
Scholarly, International journals, Company reports, prior AAiT thesis’s are among the vast
to applicable for this thesis. The original search results reveal that around a total of 100 articles
were found from various academic journals, textbooks and professional journals more from
the date of 1989-2019 G.C.
3.8 Reliability and Validity of Data
3.8.1 Reliability of Data
Saunders et al (2007), Reliability has been used to determine the extent to which the relevant
information collection and general analysis of various technologies. After a series of tests, it
will find that the research tool has been used to determine the overall or complete information.
Reliability is affected by arbitrary error. Increasing the reliability of the information has been
verified by the use of a built-in application of Cronbach’s Alpha, which is used to measure
the overall uniformity of both internal & external components.
The Cronbach’s Alpha formula was used since reduces the time required to compute a
reliability coefficient in other methods. Its coefficient is also a conventional estimate of
reliability hence avoids over-estimation. Dimension verbs are used in the five-point-Likert
scales in end-point of “strongly disagree (1)” and “strongly agree (5)”. There are 106
inconstant congregated into 10 concealed inconstant that can be used to extent the overall
routine of the company. Before examining the questions of the study, the full scope of the
survey was examined, and the general accuracy of the study was examined for rationality. In
addition to the fact that the approach used in this study has been used to measure the reliability

36
of the component of the method, it has been uses extensively. It already learned that the
accuracy of construction of levelheadedness is determine by the specification of specific
constructions, complete analysis and generalization of study details.
Table 3.4: Reliability Statistics for Cronbach's Alpha
No Construct Item Cronbach’s α N
1 Management & Team Working MTW1 0.522 51
MTW2 51
MTW3 51
MTW4 51
MTW5 51
MTW6 51
MTW7 51
MTW8 51
2 Information Quality IQ1 0.912 51
IQ2 51
IQ3 51
IQ4 51
IQ5 51
IQ6 51
IQ7 51
IQ8 51
IQ9 51
IQ10 51
IQ11 51
IQ12 51
IQ13 51
IQ14 51
IQ15 51
IQ16 51
IQ17 51
IQ18 51
IQ19 51
IQ20 51
IQ21 51
IQ22 51
3 Supplier Relationship Management SRM1 0.886 51

37
SRM2 51
SRM3 51
SRM4 51
SRM5 51
SRM6 51
SRM7 51
SRM8 51
4 Customer Relationship Management CRM1 0.795 51
CRM2 51
CRM3 51
CRM4 51
CRM5 51
CRM6 51
CRM7 51
CRM8 51
CRM9 51
CRM10 51
CRM11 51
CRM12 51
CRM13 51
CRM14 51
5 Competitive Priorities CP1 0.868 51
CP2 51
CP3 51
CP4 51
CP5 51
6 Business Performance BP1 0.768 51
BP2 51
BP3 51
BP4 51
BP5 51
7 Operational Performance OP1 0.969 51
OP2 51
OP3 51
OP4 51
OP5 51
OP6 51

38
OP7 51
OP8 51
8 Product Quality PQ1 0.801 51
PQ2 51
PQ3 51
PQ4 51
PQ5 51
PQ6 51
PQ7 51
PQ8 51
PQ9 51
Service Quality SQ1 51
SQ2 51
SQ3 51
SQ4 51
SQ5 51
SQ6 51
SQ7 51
SQ8 51
SQ9 51
SQ10 51
SQ11 51
SQ12 51
SQ13 51
SQ14 51
SQ15 51
SQ16 51
SQ17 51
SQ18 51
SQ19 51
SQ20 51
SQ21 51
SQ22 51

39
Cronbach’s Alpha starting point is have to be 0.60 at-least. And if it’s 0.70, it is well thought-
out to be the most reliable (Muturi, D., 2015). Table 3.3 shows the preliminary Cronbach’s
Alpha for each creates with a total of 160 components of Cronbach’s Alpha is 0.921. Reliability
is a testament to the importance of sustainability and acceptance for additional investigation.
Between the constructs to be discussed in this research, the Operational performance and
Information Quality were good/strong. Business performance and Customer relationship
management is marginally of challenge in the case companies. There has been a high level of
irregularities in the Management and Team working for the variable of “Do planned
pronouncement in your company have a general impact by top managements?”
3.8.2 Validity of Data
According to Saunders et al (2007), it is important to note that the validity of the information
in the context of the fact/findings that it is in general is clear to them, and seem to be universal.
Based on the results of research, it has established the importance of the completeness and
accuracy of the data.
3.9 Data Analysis
Data was screened to confirm that responses are readable and understandable and that
responses are within an acceptable range and are complete. Collected data and responses from
questionnaires was coded and entered into the Statistical Package for Social Sciences (SPSS)
program for analysis.
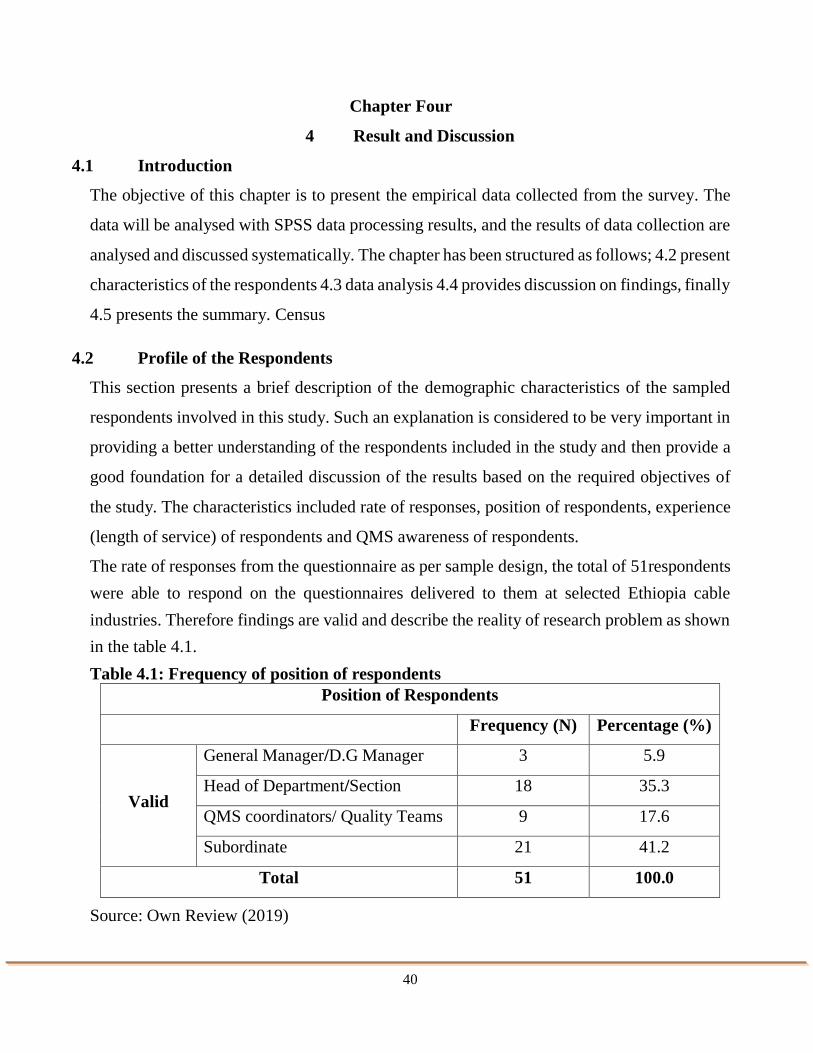
40
Chapter Four
4 Result and Discussion
4.1 Introduction
The objective of this chapter is to present the empirical data collected from the survey. The
data will be analysed with SPSS data processing results, and the results of data collection are
analysed and discussed systematically. The chapter has been structured as follows; 4.2 present
characteristics of the respondents 4.3 data analysis 4.4 provides discussion on findings, finally
4.5 presents the summary. Census
4.2 Profile of the Respondents
This section presents a brief description of the demographic characteristics of the sampled
respondents involved in this study. Such an explanation is considered to be very important in
providing a better understanding of the respondents included in the study and then provide a
good foundation for a detailed discussion of the results based on the required objectives of
the study. The characteristics included rate of responses, position of respondents, experience
(length of service) of respondents and QMS awareness of respondents.
The rate of responses from the questionnaire as per sample design, the total of 51respondents
were able to respond on the questionnaires delivered to them at selected Ethiopia cable
industries. Therefore findings are valid and describe the reality of research problem as shown
in the table 4.1.
Table 4.1: Frequency of position of respondents
Position of Respondents
Frequency (N) Percentage (%)
Valid
General Manager/D.G Manager 3 5.9
Head of Department/Section 18 35.3
QMS coordinators/ Quality Teams 9 17.6
Subordinate 21 41.2
Total 51 100.0
Source: Own Review (2019)

41
The researcher wanted to establish the position of the respondents. These respondents were
grouped in line with the leadership and involvement of people of the principles of QMS. The
leadership part of respondents accounted 60.8% and subordinate accounted 39.2%.
Table 4.2: Frequency of qualification of respondent
Frequency Percent Valid Percent Cumulative
Percent
Valid
MSC / MA 7 13.7 13.7 13.7
BSC / BA 24 47.1 47.1 60. 8
College Diploma 12 23.5 23.5 84.3
Below Diploma 8 15.7 15.7 100.0
Total 51 100.0 100.0
Source: Own Review (2019)
The data in table 4.2 show that, the total number of respondent, 24(47.1%) were first
degree holders, 7(13.7%) of the total number were second degree holders, also 12(23.5%)
were holder of college diploma and 8 (15.7%) were holder of below diploma. Unfortunately,
there were no PhD holders in the sample.
Table 4.3: Frequency of service year in the company of respondents
Frequency Percent Valid Percent Cumulative
Percent
Valid
Less than 1 year 2 3.9 3.9 3.9
1-3 years 8 15.7 15.7 19.6
Over 3 years 41 80.4 80.4 100.0
Total 51 100.0 100.0
Source: Own Review (2019)
On the length of service, 41 (80.4%) of respondents had served for more than three years, 8
(15.7%) of respondents had served between one to three years and there are 2 (3.9 %)
respondents which had served less than one year in the company. The data showed that
majority of respondents had served above three years, 80.4% of respondents which is
significantly long period enough to provide significant information concerning regional
operations and management. The longer one stays in a job, the better understanding of the
organization he/she has

42
Table 4.4: Gender of Respondents
Source: Own Review (2019)
From Table 4.4 it can be observed that the total number of respondent taken as a sample was
51 and from which 43 are male and 8 are female.
4.2.1 QMS Awareness of Respondents
The data showed that 62.7%, 31.4% and 5.9% of respondents are strongly aware, aware and
not aware respectively on the awareness of QMS. This findings show that almost all
respondents were able to describes the concept of QMS which indicates that study covered
the maximum proportion acceptance of their awareness from respondents. Therefore the
possibilities of missing data due to lack of awareness were reduced as shown in table 4.5.
Table 4.5: Frequency of QMS Awareness of Respondents
QMS Awareness
Frequency Percent Valid % Cumulative %
Valid Strongly Aware 32 62.7 62.7 62.7
Aware 16 31.4 31.4 94.1
Not Aware 3 5.9 5.9 100.0
Total 51 100.0 100.0
Source: Own Review (2019)
4.3 Data Analysis
4.3.1 Analysis of Descriptive Statistics
This sub-section presents a descriptive analysis of the data achieved through data collection
instruments. In descriptive statistical analysis the aim is to summarize data. The basic features
of the data are being described in terms of measures of central tendency and measures of
variability descriptive statistics. A measure of central tendency includes the minimum,
maximum &mean. A measure of variability includes standard deviation and skewness.
Frequency Percent Valid Percent Cumulative Percent
Valid
Man 43 84.3 84.3 84.3
Woman 8 15.7 15.7 100.0
Total 51 100.0 100.0

43
Descriptive analysis of data is necessary as it helps to determine the normality of the
distribution. The nature of the statistical technique to be applied for inferential analysis of the
data depends on the characteristics of the data. Due to the flexibility, accurate and quick
response, I the researcher prefer to use SPSS to analysis the data.
4.3.2 Descriptive Analysis of Main Quality Management Practices
As described in the survey, it can be seen the full range of Quality Management System
Practice experienced in general and the full text of the study in the entire section of the
literature are:- management & team working, quality information, supplier relationship
management, customer relationship management and competitiveness.
As it can be seen at the below table 4.6, the minimum total score is 2.25. While 5.00 is
maximum-scoring result. The average value is more than 4.46, and the standard deviation
about the average mean value for all is less than 0.80.
Under the benefits obtained by companies after ISO 9001 QMS certification all the
parameters studied in detail by the level of agreement of the respondents with their
implications at selected cable industries in Ethiopia.
Table 4.6: Descriptive Statistics for Quality Management System Practice
N Min. Max. Aver. Mean
Standard
Deviation
Management & Team Working 51 2.25 5.00 4.46 0.80
Quality Information 51 3.68 5.00 4.82 0.36
Supplier R/Ship Management 51 3.88 5.00 4.84 0.35
Customer R/Ship Management 51 4.29 5.00 4.92 0.20
Competitiveness 51 4.80 5.00 5.00 0.03
Valid N (list wise) 51
Source: Own Review (2019)

44
4.3.3 Descriptive Analysis of Main Organizational Performance Constructs
As described in the method of the study & referred in Literature chapter, the full range of
performance indicators that reveal the organization’s overall performance in this study are:
Business performance, Operational performance and Product/Service quality.
Table 4.7: Descriptive Statistics for Organization Performance
N Min. Max. Average Mean Standard Deviation
Business Performance 51 4.00 5.00 4.94 0.21
Operational Performance 51 4.00 5.00 4.78 0.41
Product/ Service Quality 51 4.26 5.00 4.91 0.20
Valid N (list wise) 51
Source: Own Review (2019)
As it can be seen at the above table 4.7, the minimum total score is 4.00. While 5.00 is
maximum-scoring result. The average value is more than 4.78, and the standard deviation
about the average mean value for all is less than 0.41.
4.3.4 Bivariate Correlation Test
Bivariate correlation is an arithmetical method that is used as describing the reality of
connection between two unlike inconstant. Pairwise correlation table offers connections that
calculated from statements that have non-missing standards for several twosomes of
inconstant. Pearson correlation coefficient is extended to control the connection between 2
quantifiable inconstant & the gradation to which the 2 inconstant correspond with each other.
It can be used to summarize the strength of the linear r/ship between two data samples. The
pair-wise correlation assessment was initially prepared on every variables on the quantifying
scale (see Appendix-C).
Table 4.8: Correlation between Constructs
MTW IQ SRM CRM CP BP OP PQ_SQ
MTW
Pearson Correlation 1
Sig. (2-tailed)
N 51

45
IQ
Pearson Correlation .900** 1
Sig. (2-tailed) .000
N 51 51
SRM
Pearson Correlation .868** .912** 1
Sig. (2-tailed) .000 .000
N 51 51 51
CRM
Pearson Correlation .865** .889** .888** 1
Sig. (2-tailed) .000 .000 .000
N 51 51 51 51
CP
Pearson Correlation .532** .590** .508** .593** 1
Sig. (2-tailed) .000 .000 .000 .000
N 51 51 51 51 51
BP
Pearson Correlation .842** .888** .837** .884** .746** 1
Sig. (2-tailed) .000 .000 .000 .000 .000
N 51 51 51 51 51 51
OP
Pearson Correlation .360** .395** .315* .483** .295* .416** 1
Sig. (2-tailed) .009 .004 .024 .000 .035 .002
N 51 51 51 51 51 51 51
PQ_SQ
Pearson Correlation .689** .751** .805** .774** .515** .690** .353* 1
Sig. (2-tailed) .000 .000 .000 .000 .000 .000 .011
N 51 51 51 51 51 51 51 51
Source: Own Review (2019)
In addition, the Pearson correlation exploration gain that, p<0.01. The company’s Business
performance is certainly correlated with Management& Team working is (r = 0.842),
Information quality is (r = 0.888), Supplier relationship management is (0.837), Customer
relationship management is (r = 884), and Competitiveness Priorities is (r = 0.746).
4.3.5 Regression Analysis
Linear regression used to model the assessment of the reliant inconstant that is Business
performance, Operational performance and Product/Service quality, because of the linear
relationship between forecasters. This method for defining the relationships of the problem is
linear regression. Well known measurement to know how the regression model meet the data
is R2. This is a complete statistic that shows the alteration of reaction with the relationship of
the forecasters. Those are: Management & Team working, Information quality, Supplier

46
relationship management, Customer relationship management, and Competitive priorities. If
R2 is close to 1, the model will be a greater acceptable.
The regression equation
Y= α + β1 X1 + β2 X2 + β3 X3 + β4 X4 + β5 X5 +e
Y= Organization Performance
α= Autonomous factors
X1= Management and Team Working
X2= Quality Information
X3= Supplier Relationship Management
X4= Customer Relationship Management
X5= Competitiveness Priorities
βi represents the beta coefficient of the independent variables Xi
e= Error term – Captures all relevant variables not included in the model
Replacing Beta coefficients identified in Table 4.9, the equation will be:
Y= 1.867 + 0.092 X1+ 0.311 X2+ 0.286 X3+ 0.779 X4+ 0.109 X5+e
According to the regression equation established, taking all factors (Management and Team
Working, Quality Information, Supplier Relationship Management, Customer Relationship
Management, and Competitiveness Priorities) constant at zero, Organization Performance
realized would be 1.867. The data findings analysed also shows that taking all other
independent variables at zero, a unit increase in Management and Team Working results to
0.092 increase in organizational performance. Increasing the quality information by a single
unit will result in an increase in the organization’s overall performance to a total of 3.11; a
unit increase in Supplier Relationship Management will lead to 0.286 increase in
organizational performance; a unit increase in Customer Relationship Management results to
0.779 increase in organizational performance, whereas a unit increase in Competitiveness
Priorities will lead to 0.109 increase in organizational performance. The significant which
were less than 5% imply that all the predictors used were significant. All the t values are >1.96
hence the values are significant.
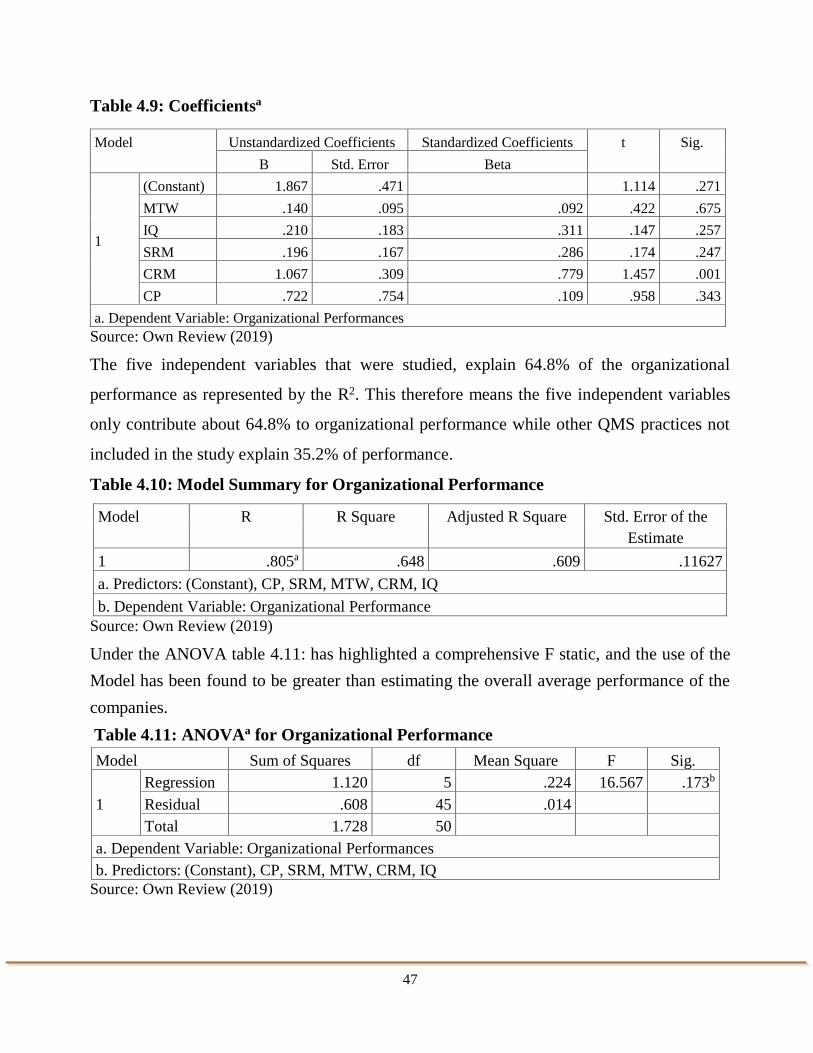
47
Table 4.9: Coefficientsa
Model Unstandardized Coefficients Standardized Coefficients t Sig.
B Std. Error Beta
1
(Constant) 1.867 .471 1.114 .271
MTW .140 .095 .092 .422 .675
IQ .210 .183 .311 .147 .257
SRM .196 .167 .286 .174 .247
CRM 1.067 .309 .779 1.457 .001
CP .722 .754 .109 .958 .343
a. Dependent Variable: Organizational Performances
Source: Own Review (2019)
The five independent variables that were studied, explain 64.8% of the organizational
performance as represented by the R2. This therefore means the five independent variables
only contribute about 64.8% to organizational performance while other QMS practices not
included in the study explain 35.2% of performance.
Table 4.10: Model Summary for Organizational Performance
Model R R Square Adjusted R Square Std. Error of the
Estimate
1 .805a .648 .609 .11627
a. Predictors: (Constant), CP, SRM, MTW, CRM, IQ
b. Dependent Variable: Organizational Performance
Source: Own Review (2019)
Under the ANOVA table 4.11: has highlighted a comprehensive F static, and the use of the
Model has been found to be greater than estimating the overall average performance of the
companies.
Table 4.11: ANOVAa for Organizational Performance
Model Sum of Squares df Mean Square F Sig.
1
Regression 1.120 5 .224 16.567 .173b
Residual .608 45 .014
Total 1.728 50
a. Dependent Variable: Organizational Performances
b. Predictors: (Constant), CP, SRM, MTW, CRM, IQ
Source: Own Review (2019)

48
4.4 Interview Question Summary Analysis
For the purpose of this study, there were 19 different staff members from the top management,
middle management, and employees as all of them as a key source of information. The
questions are 5, as shown in Appendix B.
According to the interview, the organization has fully implemented the quality management
system. And it was to increase quality information communication through the organization,
decrease deficiency, enhancement end-users satisfaction, and improve quality of
service/product. The top management adherents of the executive branch had a strong desire
to accomplish a comprehensive, complete and high market performance for the organizations
via the quality management system implementation. The interviews as well as the general
practice of ISO 9001: 2015 were experienced throughout the selected case companies. Some
of the five interviewees had full experience of ISO 9001: 2015 QMS implementation
commencement from registering process to QMS certification and continual improvements,
and complete system-wide access to the ISO 9001: 2015 QMS application. On the other hand,
despite the fact that they had a complete experience throughout the entire implementation
process, there were also some employees who do not have experience in the implementation
of the system, even though, they had partial experience in the continual improvement process.
For the query, “there are many challenges in the implementation of QMS application”, and in
some cases, the answer for the respondents were the same. For these reason, the lack of
knowledge and experience of ISO 9001 has always been a challenge for QMS
implementation. There was not enough-time for QMS implementation, the QMS system was
fully budgeted to run the implementation, and at the time of the implementation of QMS,
there was a significant lack of commitment from top managements.
The interviewees’ perception on the benefits/achievements of the implementation of the ISO
9001:2008 QMS were mainly the increase on the sales performance of the company. They
had also insight on the improvement of organizational performance in terms of product
quality, business performance, and operational performance as well.

49
Proceeding the QMS implementation process the interviewer were asked “To what extent do
you believe that your implemented QMS met your expected benefits?” majority (14 out of
19) of them said that the implementation met their organizational benefits > 90%.
And for the question “Is the ISO 9001certificate of the certified cable company still
maintained and audited by external auditor or expired?” all the selected cable companies are
still audited by external auditors annually and their certificate is not expired.
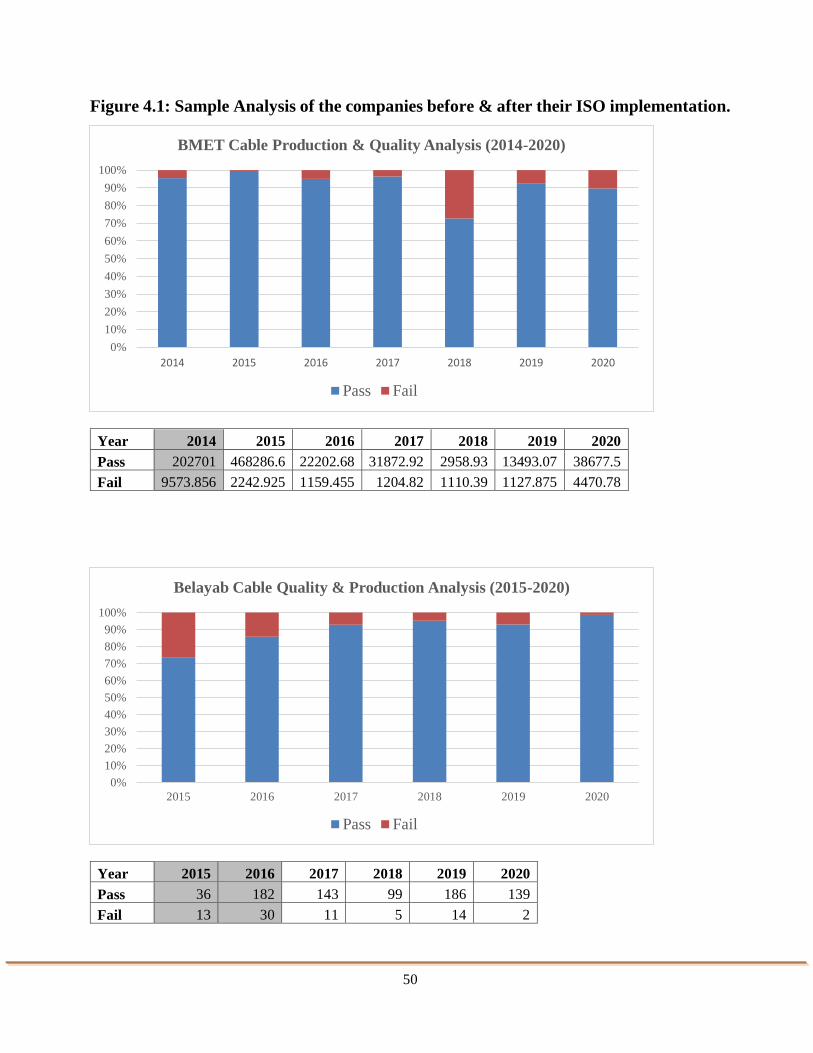
50
Figure 4.1: Sample Analysis of the companies before & after their ISO implementation.
Year 2014 2015 2016 2017 2018 2019 2020
Pass 202701 468286.6 22202.68 31872.92 2958.93 13493.07 38677.5
Fail 9573.856 2242.925 1159.455 1204.82 1110.39 1127.875 4470.78
Year 2015 2016 2017 2018 2019 2020
Pass 36 182 143 99 186 139
Fail 13 30 11 5 14 2
0%
10%
20%
30%
40%
50%
60%
70%
80%
90%
100%
2014 2015 2016 2017 2018 2019 2020
BMET Cable Production & Quality Analysis (2014-2020)
Pass Fail
0%
10%
20%
30%
40%
50%
60%
70%
80%
90%
100%
2015 2016 2017 2018 2019 2020
Belayab Cable Quality & Production Analysis (2015-2020)
Pass Fail

51
4.4 Summary of Findings
The purpose of this study is to investigate the overall impact of ISO quality management
system on the overall performance of organization. The main purpose is to accomplish the
study’s objective by following technical methods. The first step in understanding the quality
of ISO 9001 is to comprehend the hypothetical aspects, and practical findings. A
comprehensive review of this relevant literature has been conducted. Literacy criteria
evaluates the ISO quality management system practices by theoretical relationship and
practical applications, inclosing Business performance, Operational Performance, and
Product/Service quality.
The overall of Five QMS practice and Three Company performance enhancement have been
acknowledged for the case companies to determine however there is an effect on
organizational performance of the ISO 9001 implementation. A 106-items questionnaire have
been developed for general organization performance measurements, quality management,
and application experiment theory. Out of 51 queries, 51 queries with 100 % response rate
were answered and returned. The reliability and measurement of the items are a minimum of
0.5 α value using the Cronbach’s Alpha Coefficient with all groups. The coefficient total
value of the additional accreditation was stated to be 0.921, so it is satisfactory to provide
additional investigation.
Descriptive examination has presented that
For all the construct, the minimum result is greater than 2.25.
For all the construct, the maximum result is 5.00.
Also the mean average mean value is greater than the average value, 4.46 for all items.
Average mean deviation is below 0.8, which the standard deviation of all standard QMS
practice. At the same time, the minimum value is greater than the mean value for all
organizational performance theory.
The average value of the standard deviation is estimated to be less than 0.41 standard.
52
The regression analysis has shown that
Repeated completion of the organizational performance by Regression on the five
forecasters will result in a total R2 of 0.648. This inconstant described in terms of the
number of forecasters in linear regression.
The company implementation before and after ISO implementation has shown that
Before the implementation the documentation system were poor
It was hard to find the documents based on the product type
They couldn’t calculate their failurity root cause to improve their production
After the implementation documents are easy to find
Finding their root cause and calculate it, improves their productivity
The study also confirmed that the organizations has been challenged a number of main
problems in the implementation of quality management system.
Top management obligation
Provide information on production for employees
The commitment of the workforce
Getting adequate time

53
Chapter Five
5 Conclusion and Recommendation
5.1 Conclusion
This study has examined the impact of the ISO 9000 QMS implementation on organization
performance; case study in Ethiopia cable industry. One hundred six indicator questions are
used in the study.
After all the parameters under the benefits obtained by companies ISO 9001 QMS
certification studied in detail at selected cable industries in Ethiopia, the following
conclusions were drawn. The researcher able to demonstrate a significant conclusion based
on the fact obtained from literatures and questionnaire response.
Operational performance and Quality information are amongst the top achieved benefits
obtained by companies after ISO 9001 QMS certification.
Supplier relationship and Competitive priorities are reasonable results obtained by companies
after ISO 9001 QMS certification.
Top management commitment, gain workforce commitment to QMS implementation and
insufficient time for QMS implementation are still not yet achieved by companies after ISO
9001 QMS certification.
Generally comparison of the performance of quality certified cable industries before and after
certification have indicated that the ISO 9000 quality management systems did have positive
contributions to all of the performance indicators in the selected companies. Nevertheless, it
can be said that the ISO 9000 practices guided cable companies in improving their
performance and improve overall business standards.
From the interview the researcher conclude that to be more competitive with the
implementation sustainability, the company should involve more the lower level employees
and their internal auditors in the ISO system training; give material utilization training besides
the ISO training.

54
5.2 Recommendation from the study
The study recommends that manufacturing firms adopt and implement ISO 9001 for purpose
of comparison and selecting the best practices for improved operational performance.
Manufacturing firms in Ethiopia have to benchmark themselves against the best firms
globally in an effort to enhance competitiveness.
5.3 Limitation and Future Work
The research findings are limited to three organizations in the study may consider as
limitation for this study outcome and that is because there is no more ISO certified
organizations in cable manufacturing sectors in Ethiopia. The study collected information
about performance in relation to ISO 9001 QMS elements from company higher official
point of view and no customers included. In addition all the case company employees are
not participated in questioner because of the author time, financial capabilities and the
author also believes higher officials have better awareness of ISO 9001 QMS related subject
which brings an issue of accuracy considering those responding may have supplied the
data desired in that time of collection and might have made the businesses to have some
more positive outlooks. Future studies may well examine the perception of customers of
quality in these manufacturing firms.
Therefore further research recommended in this topic which shall include both employee and
customer’s point of view from more than those organization in Ethiopia (if any) ISO 9001
Quality Management System certified. Future researchers must work upon all the dimensions
of quality management and they must ensure that no dimension would be showed by the other
item.

55
References
1. Aarts F. and Vos E., “The impact of ISO registration on New Zealand firms’
performance: a financial perspective”, The TQM Magazine, Vol. 13 No. 3, 2001.
2. Ali Bakhit Jaafreh “The Effect of Quality Management Practices on Organizational
Performance in Jordan: An Empirical Study” Vol.4, No.1; 2013.
3. Amar K. and Zain Z.M., “Barriers to implementing TQM in Indonesian manufacturing
organization”, The TQM Magazine, Volume 14, pp. 367-372, 2002.
4. Awoku R. Y. “An Empirical Study on Quality Management Practices, Organization
Performance and Suppliers' Selection in Southern Minnesota Manufacturing Firms”
Theses, Dissertations, and Other Capstone Projects.., Mankato: Minnesota State
University, 2012.
5. Beattie, K.K., Sohal, A.S., Implementing ISO 9000: a study of its benefits among
Australian organizations, Total Qual. Manage, March 2009.
6. Belayab Company Manual, 2018.
7. Bert Markgraf , The Impact of ISO 9000, 2015.
8. Beshah and Kitaw, Assessed Quality Management Practice in Ethiopia, 2014.
9. BMET Quality Manual, 2018.
10. Brown A., Van der Wiele T. and Loughton K., “Smaller enterprises’ experiences with
ISO 9000”, International Journal of Quality & Reliability Management, Vol. 15 No.
3, pp. 273-85, February 1998.
11. BSI (British Standards Institution), 2017 bsi-group
https://www.bsigroup.com/Documents/iso-9001/resources/BSI-ISO-9001-
Management-system-White-paper-UK-EN.pdf [Accessed 08:30 12 March 2018].
12. Buttle, F., ISO 9000: Marketing motivations and benefits, International Journal of
Quality and Reliability Management, 1997.
13. Cartin T.J., “Principles and Practices of TQM”, ASQC Quality Press, 1995.
14. Casadesu´s M., Gime´nez G. and Heras I., “Benefits of ISO 9000 implementation in
Spanish industry”, European Business Review, Vol. 13 No. 6, pp. 327-35, 2001.

56
15. Cater, D.J., Pasqualone, R. G., “IS0 9000- A Perspective on a Global Quality
Standard”, IEEE transactions on industry applications, vol. 31, no. 1, February 1995.
16. Chad Matthew Laux “The Impacts of A Formal Quality Management System: A Case
Study of Implementing ISO 9000 At Farmers’ Cooperative” Co., I owa Iowa State
University, 2017.
17. Corbett C., Montes-Sancho M., Kirsch, D., The financial impact of ISO 9000
certification: an empirical analysis, December 2005.
18. Costa M. and Lorente M., “ISO 9000 as a tool for TQM: a Spanish case study”, The
Quality Management Journal, Vol. 11 No. 4, pp. 20- 30, May 2004.
19. Curkovic S. and Pagell M., “A critical examination of the ability of ISO 9000
certification to lead to a competitive advantage” Journal of Quality Management,
February 1999.
20. Kitaw and Bete, “Examined Quality Management: Efforts and Problems in Ethiopian
Manufacturing Industries”, 2003.
21. Tulu, Investigates the impact of ISO 9001 certification on companies’ performance,
2011.
22. Dominik Zimon “The Impact of The Quality Management System For The
Improvement Of Warehousing Processes” 9th International Quality Conference, June
2015.
23. Douglas A., Coleman S. and Oddy R., “The case for ISO 9000”, The TQM Magazine,
Vol. 15 No. 5, pp. 316-24, 2003.
24. Elsewedy Quality System manual, 2018.
25. Erel, E., Ghosh, J.B., “ISO 9000 implementation in Turkish industry”, International
Journal of Operations & Production Management, Vol. 17, N. 12, 1998.
26. Evelyn Nyakio Kibe and Kenneth Wanjau “The Effect of Quality Management
Systems on the Performance of Food Processing Firms in Kenya”), PP 61-72, Volume
16, Issue 5. Ver. II (May. 2014).
27. Ferguson W. “Impact of the ISO 9000 series standards on industrial marketing”
Industrial Marketing Magazine, Volume 25, p. 305–310, 1996.

57
28. Franceschini F., Galetto M. & Maisano D. “Management by Measurement Designing
Key Indicators and Performance Measurement Systems” 1st ed. Heidelberg: Springer-
Verlag Berlin, 2007.
29. George D Tsiotras and Katerina Gotzamani“An Empirical Study of the ISO 9000
standards Contribution towards TQM”, October, 2001.
30. Gotzamani K. and Tsiotras G., “The true motives behind ISO 9000 certification: their
effect on the overall certification benefits and long-term contribution towards TQM”,
International Journal of Quality & Reliability Management, Vol. 19 No. 2, pp. 151-69,
2002.
31. Haversjo T., “The financial effects of ISO 9000 registration for Danish companies”,
Managerial Auditing Journal, Vol. 15 No. 1, pp. 47-52, 2000.
32. Helmi, M.A., “Measuring the effect of customer satisfaction on profitability: a
challenging role for management accountants”, Vol. 43 No. 10, pp. 8-13, 1998.
33. Ingles S., “Bridging employee involvement process with TQM and ISO 9000 system”,
Proceedings of the Association for Quality and Participation: 16th Annual Spring
Conference, April, 1994.
34. Jeanne dependant “The case of International Organization for Standardization (ISO)”,
December 2016.
35. Juran, J. M. “The Quality Control Handbook”, 3rd Edition, New York: McGraw-Hill,
1974.
36. Frew, Examined the practice and challenges of QMS (ISO 9001:2008) in the
Pharmaceutical industry: The case of EPHARM Ethiopia, 2016.
37. Koernia Purwihartuti “Quality Management Systems and Performance of
Organization”, November 2016.
38. Kunnanatt J.T., “Impact of ISO 9000 on organizational climate - Strategic change
management experience of an Indian organization”, International Journal of
Manpower, Vol. 28, No. 2, 2007.

58
39. Lagrosen Y. and Lagrosen S., “The effects of quality management – a survey of
Swedish quality professionals”, International Journal of Operations & Production
Management, Vol. 25 No. 10, pp. 940-52, 2005.
40. Lakhal L., Pasin F. & Limam M. “Quality management practices and their impact on
performance” International Journal of Quality & Reliability Management, 23(6), pp.
625-646, 2006.
41. Limakatso Patricia Nonyana “A critical evaluation of the quality management system
at the medical company in the North West”, November 2011.
42. Luca Cagnazzo, Paolo Taticchi,Francesco Fuiano, Impacts of ISO 9000 on business
performances, January 2009.
43. Magd, H. “An investigation of ISO 9000 adoption in Saudi Arabia”, Managerial
Auditing Journal, Vol. 21 No. 2, pp. 132-47, 2006.
44. Marta F. Simões Nicolina Dias, Cledir Santosand & Nelson Lima “Establishment of a
Quality Management System Based on ISO 9001 Standard in a Public Service Fungal
Culture Collection”, May 2013.
45. McGuire, S.J., Dilts, D. M., “The financial impact of standard stringency: An event
study of successive generations of the ISO 9000 standard”, June 2008.
46. Merino J., “The Quality of Spanish Company” Jornal, 2001.
47. Mohamed Zairi “Total Quality Management for Engineers”, 1991.
48. Muturi, D, Njihia, S. and Ochieng, J. “Impact of ISO 9001 Implementation on
Organizational Performance in Kenya. ST-2: ISO 9000/14001, OH18001, etc.”, 2015.
49. Neely A. “Business Performance Measurement: Theory and Practice. 2nd ed.
Cambridge: Cambridge University Press, 2009.
50. Nelson, C.: illustrations by Lindell, M. “TQM and ISO 9000 for Architects and
Designers”, p. 35, McGraw-Hill, ISBN 0-07-046277-1, (1996).
51. Abdel Aziz El Tigani “The Impact of the Implementation of the ISO 9000 QMS upon
the Perception of the Performance of the Organization's Worker”, August 2011.

59
52. Patyal V. S. & Koilakuntla M. “The impact of quality management practices on
performance: an empirical study. Benchmarking: An International Journal, 24(2), pp.
511-535, 2017.
53. Quazi H.A. and Padibjo S.R., “A journey towards total quality management through
ISO 9000 certification: A study on small and medium sized enterprises in Singapore”',
Vol. 15 No. 5, pp. 364-71, 1998.
54. Romano P., “ISO 9000: what is its impact on performance?”, Quality Management
Journal, Vol. 7 No. 3, pp. 38-56, 2000.
55. Salah Alolayan, B.Sc., M.Sc. “An assessment of quality management system
indicators for the ISO 9001: 2008 certified work organizations in Kuwait”, Jan. 2014.
56. Sherine El Sakka “The Impact of Applying Quality Management System and
Environment Standard on Organization Performance an Application on SME’S in
Egypt” 5Th Settlement, end of 90 st. Tagamoa El khamess, Cairo, Egypt, Vol.5, No.19,
2013.
57. Sofija Petkovska and Biljana Gjorgjeska “The significance of the quality management
system in making management decisions” University Goce Faculty of medical science,
2015.
58. Srivastava A.K., “ISO 9000 as a tool for organizational change and work redesign”,
1992.
59. Tari J. and Molina J., “Quality management results in ISO 9000 certified Spanish
firms”, The TQM Magazine, Vol. 14 No. 4, pp. 232-9, 2002.
60. Taylor, W.A., “Senior executives and ISO 9000”, International Journal of Quality &
Reliability Management, Vol. 12 No. 7, 1995.
61. Teklebrhan Kidanu, Assessed the impact of QMS (ISO 9001) certification on Ethiopia
construction companies, 2014.
62. Tenner A.R. and DeToro I.J., Total Quality Management: Three Steps to Continuous
Improvement, July 1992.

60
63. Terlaak, A., King, A.A., The effect of certification with the ISO 9000 quality
management standard: a signaling approach; Journal of Economic Behavior and
Organization, 2006.
64. Yahya S. & Goh W. “The implementation of an ISO 9000 quality system”.
International Journal of Quality & Reliability Management, 18(9), pp. 941-966, 2001.
65. Yeung, C.L., Lee, T.S. and Chan, L.Y., “Senior executives’ perspectives and ISO 9000
effectiveness: an empirical research”, International Journal of Production Research,
Vol. 41, No. 3, pp. 545-69, February 2003. 1. ( D upe nda nt , 2016)
2 . ( ht tp:/ /w ww. be la ya bc a ble .c om/ , 2017)
3 . ( ht tp:/ /w ww /bmet -e ne r gy- te lec om- indust r y- a nd- tra de- plc , 2017)
4 . ( ht tp:/ /w ww.e ur oca ble plc.c om, 2017)
5 . ( ht tp:/ /w ww.e lse we dye lec tr ic.c om, 2017)

61
Appendix-A: Questionnaire
ADDIS ABABA UNIVERSITY
INSTITUTE OF TECHNOLOGY
SCHOOL OF MECHANICAL AND INDUSTRIAL ENGINEERING
(Industrial Engineering Stream)
Thesis Title: Investigating the impact of (ISO 9001) Quality Management System implementation
on organizational performance: Case of Ethiopia Cable Industries
Dear Participants;
I would like to extend my deep appreciation if you could spend a few minutes answering the attached
questionnaire as truthfully as possible and your response will be highly confidential.
This questionnaire is developed to conduct a scientific research on investigating the impact of (ISO 9001)
Quality Management System implementation on organizational performance: Case of Ethiopia Cable
Industries.
I would also like to assure you that all responses given will be treated as STRICTLY CONFIDENTIAL!!
And used for academic purposes only. If you need further clarification, please feel free to contact through
the address below.
Thank you for your kind cooperation.
Sincerely,
Betiel Tsegaye Advisor: Dr. Yitagesu Yilma (PhD)
Tel: +251-911-007-4716 Tel: +251- 913-043-328
Email: [email protected] Co- Advisor: Mr. Goitom Birhane (PhD Candidate)
Addis Ababa Institute of Technology
Tell: +251-947-132-338
N.B: Please give answers in the spaces provided and matches your responses to the questions
where applicable

62
Company Name: _______________________
SECTION A: RESPONDENT PROFILE
1. What is your current position in the company? (Tick as applicable)
a) General Manager/ D.G Manager ( )
b) Head of department/section ( )
c) QMS coordinator ( )
d) Subordinate ( )
2. What is your qualification? ( Tick as applicable)
a) MA/MSc ( )
b) BA/BSc ( )
c) College Diploma ( )
d) Below Diploma ( )
3. How long is your service year? ( Tick as applicable)
a) Less than 1 year ( )
b) 1- 3 years ( )
c) Over 3 years ( )
4. Gender ( Tick as applicable)
a) Male ( )
b) Female ( )
5. How aware are you of ISO 9001 QMS in your company? ( Tick as applicable)
a) Strongly not Aware ( )
b) Not Aware ( )
c) Aware ( )
d) Strongly Aware ( )
6. Specify sector type of your organization. ( Tick as applicable)
a) Government ( )
b) Private ( )
c) Government – Private (Jointly Owned) ( )

63
7. Please refer to any remarks, opinions, and recommendations that you may have about the full
effect of the implementation of quality management system from your understanding?
_______________________________________________________________________
_______________________________________________________________________
SECTION B: IMPLEMENTATION OF QUALITY MANAGEMENT SYSTEMS
(QMS)
Dimension 1: Implementation of Quality Management Systems& Certification Information
8. Please indicate for how long your organization it has been certified? (Tick as applicable)
Less than a Year 1-3 years 3-5 years 5 years and above
1 2 3 4
9. In your organization, are QMS implemented as a way for Change? If yes, what are the changes it
made? (Tick as applicable)
5: Strongly Agree; 4: Agree; 3: Neutral; 2: Disagree; 1: Strongly Disagree
To Start for Improved Quality Performance 1 2 3 4 5
Familiarizing Innovative Applies 1 2 3 4 5
To Change the Company Principles 1 2 3 4 5
Point of View for Quality Development 1 2 3 4 5
Looking for Prospects to Progress 1 2 3 4 5
10. What are the reasons for implementation of QMS in your organization? (Tick the appropriate
box)
5: Strongly Agree; 4: Agree; 3: Neutral; 2: Disagree; 1: Strongly Disagree
To Get a Chance from Global Markets 1 2 3 4 5
To Stay in Business 1 2 3 4 5
For having a Source to Quality Improvement 1 2 3 4 5
Allowing for Bidding 1 2 3 4 5
From Consumer Burden 1 2 3 4 5
To Get the Most out of Marketing Opportunities 1 2 3 4 5

64
To Generate a Systematic Structure within the Company 1 2 3 4 5
For Transforming Company Principles 1 2 3 4 5
To Escalation Market-share 1 2 3 4 5
For Customers’ Needs for the Imminent 1 2 3 4 5
To Increasing Customer Provisions 1 2 3 4 5
With customers, to Create a long-term Relationship 1 2 3 4 5
To Increasing Productivity 1 2 3 4 5
11. Do you use QMS in daily practice? (Tick the appropriate box)
5: Strongly Agree; 4: Agree; 3: Neutral; 2: Disagree; 1: Strongly Disagree
Structure is fit organized 1 2 3 4 5
Designed to the requirements of the Company 1 2 3 4 5
Documents Development 1 2 3 4 5
QMS is a Part of Daily Practice 1 2 3 4 5
Dimension 2: Management and Team Working:
12. What do you say about the top management commitment trend in your organization?(Tick
the appropriate box)
5: Strongly Agree; 4: Agree; 3: Neutral; 2: Disagree; 1: Strongly Disagree
Assumes responsibility for quality performance 1 2 3 4 5
Provides personal leadership for quality products &
improvements 1 2 3 4 5
Evaluated for quality performance 1 2 3 4 5
Quality Issues are reviewed in top-management meeting 1 2 3 4 5
Looks at Quality as a Whole and as a Goal 1 2 3 4 5
Planned pronouncements have a general impact by top
managements 1 2 3 4 5
Quality Management Policy has been Established by Top-
Managements. 1 2 3 4 5
Making the Information Progression more Effective 1 2 3 4 5

65
Dimension 3: Information Quality:
13. What do you say about the impact of quality management system application in your
organization’s information content?(Tick the appropriate box)
5: Strongly Agree; 4: Agree; 3: Neutral; 2: Disagree; 1: Strongly Disagree
When making a decision, information is significant 1 2 3 4 5
Quality linked policies are noticeably stated 1 2 3 4 5
For everyday routine, information is beneficial 1 2 3 4 5
Information that has been registered is correct and precise 1 2 3 4 5
There is a different/secured section for document handling 1 2 3 4 5
Information concentrates on main commercial practices 1 2 3 4 5
14. What do you say about the impact of quality management system application in your
organization’s information distribution?(Tick the appropriate box)
5: Strongly Agree; 4: Agree; 3: Neutral; 2: Disagree; 1: Strongly Disagree
Is information sharing agreeable with employees 1 2 3 4 5
There is a good connection and direction with every
department 1 2 3 4 5
Information based to quality enlargement has been
distributed to suppliers and customers 1 2 3 4 5
Creates believable and comfortable working atmosphere
through customers and suppliers 1 2 3 4 5
15. What do you say about the impact of quality management system application in your
organization’s information use?(Tick the appropriate box)
5: Strongly Agree; 4: Agree; 3: Neutral; 2: Disagree; 1: Strongly Disagree
Administrative performance can be assessed by quality
information 1 2 3 4 5
Practical Theory has been offered to all employees, to the
conception of ‘Total Quality Management Model’ 1 2 3 4 5
In work place, quality information and control-charts are
available 1 2 3 4 5
For managing quality, as an instrument quality
information is applied 1 2 3 4 5
Top-managements and directors can find quality
information easily 1 2 3 4 5
Trainings are provided to top-managements and directors
on quality based 1 2 3 4 5
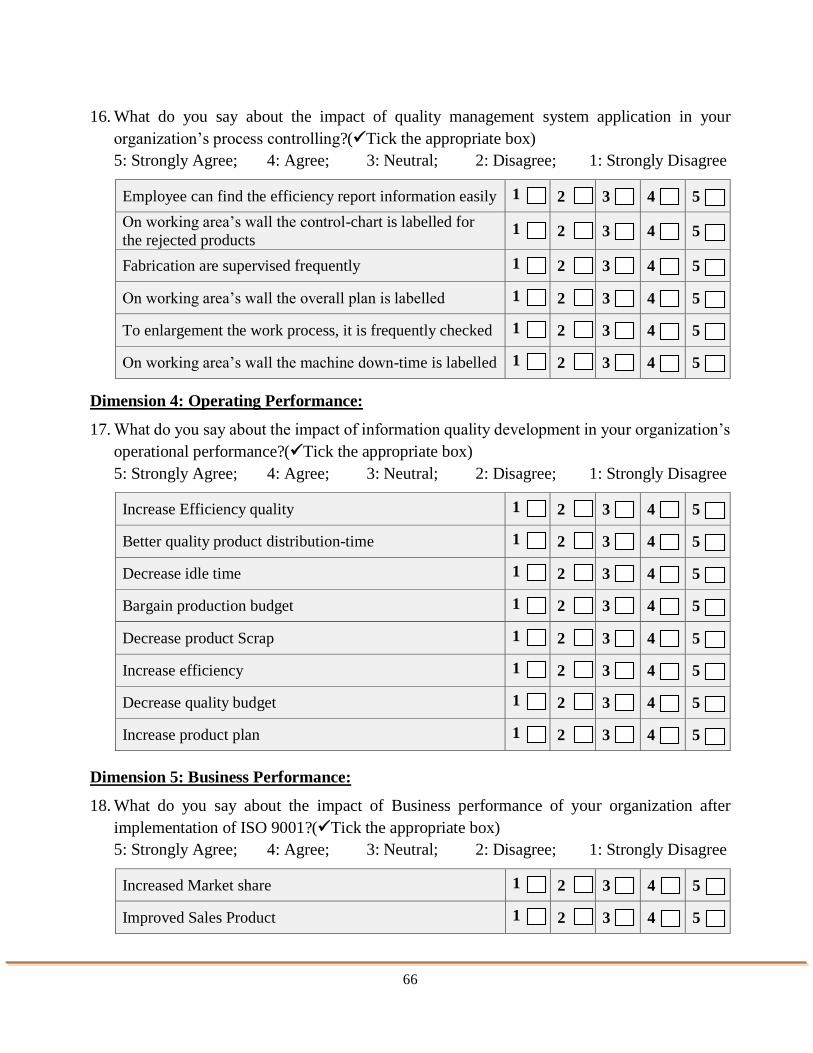
66
16. What do you say about the impact of quality management system application in your
organization’s process controlling?(Tick the appropriate box)
5: Strongly Agree; 4: Agree; 3: Neutral; 2: Disagree; 1: Strongly Disagree
Employee can find the efficiency report information easily 1 2 3 4 5
On working area’s wall the control-chart is labelled for
the rejected products 1 2 3 4 5
Fabrication are supervised frequently 1 2 3 4 5
On working area’s wall the overall plan is labelled 1 2 3 4 5
To enlargement the work process, it is frequently checked 1 2 3 4 5
On working area’s wall the machine down-time is labelled 1 2 3 4 5
Dimension 4: Operating Performance:
17. What do you say about the impact of information quality development in your organization’s
operational performance?(Tick the appropriate box)
5: Strongly Agree; 4: Agree; 3: Neutral; 2: Disagree; 1: Strongly Disagree
Increase Efficiency quality 1 2 3 4 5
Better quality product distribution-time 1 2 3 4 5
Decrease idle time 1 2 3 4 5
Bargain production budget 1 2 3 4 5
Decrease product Scrap 1 2 3 4 5
Increase efficiency 1 2 3 4 5
Decrease quality budget 1 2 3 4 5
Increase product plan 1 2 3 4 5
Dimension 5: Business Performance:
18. What do you say about the impact of Business performance of your organization after
implementation of ISO 9001?(Tick the appropriate box)
5: Strongly Agree; 4: Agree; 3: Neutral; 2: Disagree; 1: Strongly Disagree
Increased Market share 1 2 3 4 5
Improved Sales Product 1 2 3 4 5

67
Increased Profit 1 2 3 4 5
Improved Operating income 1 2 3 4 5
Reduced Manufacturing unit cost 1 2 3 4 5
Dimension 6: Supplier Relationships:
19. What do you say about the impact of information quality enlargement in your organization’s
relationship of suppliers?(Tick the appropriate box)
5: Strongly Agree; 4: Agree; 3: Neutral; 2: Disagree; 1: Strongly Disagree
Suppliers are carefully chosen based on quality 1 2 3 4 5
Suppliers gets practical help from the company 1 2 3 4 5
Where there’s new product enlargement, suppliers will be
announced 1 2 3 4 5
Company and supplier creates long-term relationship 1 2 3 4 5
Decrease assessment of raw material 1 2 3 4 5
Company and suppliers share information frequently 1 2 3 4 5
Suppliers support companies on improving environment 1 2 3 4 5
Dimension 7: Customer Relationships:
20. What do you say about the impact of information quality enlargement in your organization’s
relationship of customers?(Tick the appropriate box)
5: Strongly Agree; 4: Agree; 3: Neutral; 2: Disagree; 1: Strongly Disagree
Frequently customers are present/come in the company 1 2 3 4 5
Customer’s feed-back are followed regularly 1 2 3 4 5
In company’s overall design, customers are intricate 1 2 3 4 5
To develop enlargements, customer feed-backs are a good
source 1 2 3 4 5
Company and customers share information to each other 1 2 3 4 5
Document handling for customer compliant is well
organized 1 2 3 4 5
Announce customers’ needs 1 2 3 4 5
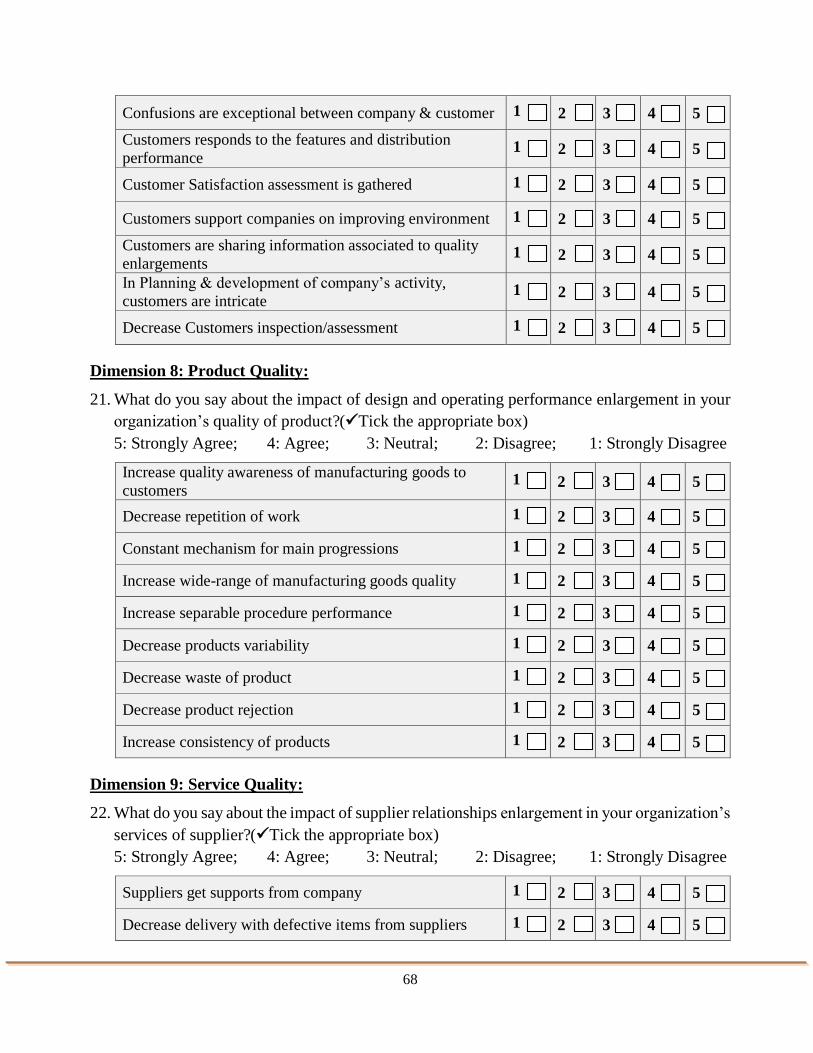
68
Confusions are exceptional between company & customer 1 2 3 4 5
Customers responds to the features and distribution
performance 1 2 3 4 5
Customer Satisfaction assessment is gathered 1 2 3 4 5
Customers support companies on improving environment 1 2 3 4 5
Customers are sharing information associated to quality
enlargements 1 2 3 4 5
In Planning & development of company’s activity,
customers are intricate 1 2 3 4 5
Decrease Customers inspection/assessment 1 2 3 4 5
Dimension 8: Product Quality:
21. What do you say about the impact of design and operating performance enlargement in your
organization’s quality of product?(Tick the appropriate box)
5: Strongly Agree; 4: Agree; 3: Neutral; 2: Disagree; 1: Strongly Disagree
Increase quality awareness of manufacturing goods to
customers 1 2 3 4 5
Decrease repetition of work 1 2 3 4 5
Constant mechanism for main progressions 1 2 3 4 5
Increase wide-range of manufacturing goods quality 1 2 3 4 5
Increase separable procedure performance 1 2 3 4 5
Decrease products variability 1 2 3 4 5
Decrease waste of product 1 2 3 4 5
Decrease product rejection 1 2 3 4 5
Increase consistency of products 1 2 3 4 5
Dimension 9: Service Quality:
22. What do you say about the impact of supplier relationships enlargement in your organization’s
services of supplier?(Tick the appropriate box)
5: Strongly Agree; 4: Agree; 3: Neutral; 2: Disagree; 1: Strongly Disagree
Suppliers get supports from company 1 2 3 4 5
Decrease delivery with defective items from suppliers 1 2 3 4 5

69
Decrease delivery time of procured supplies 1 2 3 4 5
A comprehensive approach has been implemented to
address the general problem of suppliers 1 2 3 4 5
Improve recording of raw-materials transition 1 2 3 4 5
Decrease assessment of raw-material 1 2 3 4 5
Decrease the amount of raw-materials in store 1 2 3 4 5
23. What do you say about the impact of customer relationship enlargement in your
organization’s services of customer?(Tick the appropriate box)
5: Strongly Agree; 4: Agree; 3: Neutral; 2: Disagree; 1: Strongly Disagree
Improve cost-effectiveness of customers 1 2 3 4 5
Responds are quick to customers’ questions 1 2 3 4 5
A comprehensive approach has been implemented to
address the general compliant of customers 1 2 3 4 5
To respond customers’ complaints, company employees
are ready to proceed 1 2 3 4 5
Customers are less likely to complain 1 2 3 4 5
Based on customers’ fulfilment, customer complaints are
responded 1 2 3 4 5
24. What do you say about the impact of customer relationship enlargement in your
organization’s fulfilment of customer?(Tick the appropriate box)
5: Strongly Agree; 4: Agree; 3: Neutral; 2: Disagree; 1: Strongly Disagree
Customers are delighted with the overall services
available through the company 1 2 3 4 5
Increase customers in quantities 1 2 3 4 5
Customer satisfaction assessment is measured 1 2 3 4 5
To decrease customer complaints, overall plan is made by
the company 1 2 3 4 5
Improve reliability of customers 1 2 3 4 5
Improve marketing 1 2 3 4 5
Increase quality manufacturing goods for customers 1 2 3 4 5
Increase customer satisfaction 1 2 3 4 5

70
Dimension 10: Competitive Priorities:
25. What do you say about the impact of Product/Service Quality enlargement in your
organization’s priorities of competitiveness? (Tick the appropriate box)
5: Strongly Agree; 4: Agree; 3: Neutral; 2: Disagree; 1: Strongly Disagree
Better-quality Product Distribution-time 1 2 3 4 5
Increase Customer Fulfilment 1 2 3 4 5
Reduce Product Variability 1 2 3 4 5
Decrease Quality Budget 1 2 3 4 5
Bargain Production Budget 1 2 3 4 5
Thank You for your cooperation to fill this questionnaire
**********************

71
Appendix-B: Guide for Interview
Ensuring validity and reliability of the data obtained in survey is critical as most of the time
compared with other data gathering methods such as interview and case study approaches;
generally surveys are prone to bias and misunderstanding and thus overall validity is doubtful.
Therefore, checking by interviewing based on the same questionnaire to let support respondent’s
responses by example will be mandatory.
In addition, in this particular research the interview also helped to get additional information
which was not covered in questionnaire. The base ideas used to get additional information are as
below.
1. Is the ISO 9001certificate of the certified cable company still maintained and audited by
external auditor or expired?
2. Driving force to implement QMS:
Is there any legal requirement that forced you to implement QMS? If yes please give an
example: ______________________________________________________
3. Challenges during QMS implementation:
Do you have well trained your own internal auditors?
Do the challenges you faced during implementation of QMS solved after
implementation or remained to be still challenges?
4. Actual benefits acquired:
Can you please mention examples of what you achieved by having the QMS?
5. To what extent do you believe that your implemented QMS met your expected benefits?
a) > 90% b) 75-89% c) 65-74% d) 50-64% e) < 50%

72
Appendix-C: Pearson Correlation Coefficient for the various items
1. Correlation Coefficient for Management and Team working Commitment
MTW1 MTW2 MTW3 MTW4 MTW5 MTW6 MTW7 MTW8
MTW1
Pearson Correlation
1
Sig. (2-tailed)
N 51
MTW2
Pearson Correlation
.514** 1
Sig. (2-tailed) .000
N 51 51
MTW3
Pearson Correlation
.516** .761** 1
Sig. (2-tailed) .000 .000
N 51 51 51
MTW4
Pearson Correlation
.424** .870** .605** 1
Sig. (2-tailed) .002 .000 .000
N 51 51 51 51
MTW5
Pearson Correlation
.440** .914** .657** .755** 1
Sig. (2-tailed) .001 .000 .000 .000
N 51 51 51 51 51
MTW6
Pearson Correlation
-.638** -.453** -.312* -.393** -.479** 1
Sig. (2-tailed) .000 .001 .026 .004 .000
N 51 51 51 51 51 51
MTW7
Pearson Correlation
.170 .571** .366** .536** .668** -.292* 1
Sig. (2-tailed) .234 .000 .008 .000 .000 .038
N 51 51 51 51 51 51 51
MTW8
Pearson Correlation
.403** .836** .649** .675** .873** -.438** .564** 1
Sig. (2-tailed) .003 .000 .000 .000 .000 .001 .000
N 51 51 51 51 51 51 51 51
**. Correlation is significant at the 0.01 level (2-tailed).
*. Correlation is significant at the 0.05 level (2-tailed).
b. Cannot be computed because at least one of the variables is constant.

73
2. Correlation Coefficient for Information Quality Management
IQ1 IQ2 IQ3 IQ4 IQ5 IQ6 IQ7 IQ8 IQ9 IQ10 IQ11 IQ12 IQ13 IQ14 IQ15 IQ16 IQ17 IQ18 IQ19 IQ20 IQ21 IQ22
IQ1
Pearson Correlation
1
Sig. (2-tailed)
N 51
IQ2
Pearson Correlation
.429** 1
Sig. (2-tailed) .002
N 51 51
IQ3
Pearson Correlation
.613** .700** 1
Sig. (2-tailed) .000 .000
N 51 51 51
IQ4
Pearson Correlation
.b .b .b .b
Sig. (2-tailed)
N 51 51 51 51
IQ5
Pearson Correlation
.b .b .b .b .b
Sig. (2-tailed)
N 51 51 51 51 51
IQ6
Pearson Correlation
.b .b .b .b .b .b
Sig. (2-tailed)
N 51 51 51 51 51 51
IQ7
Pearson Correlation
.681** .624** .891** .b .b .b 1
Sig. (2-tailed) .000 .000 .000
N 51 51 51 51 51 51 51

74
IQ8
Pearson Correlation
.738** .504** .720** .b .b .b .860** 1
Sig. (2-tailed) .000 .000 .000 .000
N 51 51 51 51 51 51 51 51
IQ9
Pearson Correlation
.758** .566** .808** .b .b .b .907** .891** 1
Sig. (2-tailed) .000 .000 .000 .000 .000
N 51 51 51 51 51 51 51 51 51
IQ10
Pearson Correlation
.746** .575** .821** .b .b .b .844** .793** .766** 1
Sig. (2-tailed) .000 .000 .000 .000 .000 .000
N 51 51 51 51 51 51 51 51 51 51
IQ11
Pearson Correlation
.613** .700** 1.000** .b .b .b .891** .720** .808** .821** 1
Sig. (2-tailed) .000 .000 0.000 .000 .000 .000 .000
N 51 51 51 51 51 51 51 51 51 51 51
IQ12
Pearson Correlation
.648** .753** .793** .b .b .b .824** .832** .864** .786** .793** 1
Sig. (2-tailed) .000 .000 .000 .000 .000 .000 .000 .000
N 51 51 51 51 51 51 51 51 51 51 51 51
IQ13
Pearson Correlation
.640** .485** .693** .b .b .b .774** .846** .857** .748** .693** .941** 1
Sig. (2-tailed) .000 .000 .000 .000 .000 .000 .000 .000 .000
N 51 51 51 51 51 51 51 51 51 51 51 51 51
IQ14
Pearson Correlation
.b .b .b .b .b .b .b .b .b .b .b .b .b .b
Sig. (2-tailed)
N 51 51 51 51 51 51 51 51 51 51 51 51 51 51
IQ15
Pearson Correlation
.648** .753** .793** .b .b .b .824** .832** .864** .786** .793** 1.000** .941** .b 1
Sig. (2-tailed) .000 .000 .000 .000 .000 .000 .000 .000 0.000 .000
N 51 51 51 51 51 51 51 51 51 51 51 51 51 51 51

75
IQ16
Pearson Correlation
.594** .393** .562** .b .b .b .654** .712** .695** .724** .562** .629** .633** .b .629** 1
Sig. (2-tailed) .000 .004 .000 .000 .000 .000 .000 .000 .000 .000 .000
N 51 51 51 51 51 51 51 51 51 51 51 51 51 51 51 51
IQ17
Pearson Correlation
.273 .700** .480** .b .b .b .418** .318* .379** .518** .480** .510** .317* .b .510** .315* 1
Sig. (2-tailed) .053 .000 .000 .002 .023 .006 .000 .000 .000 .024 .000 .025
N 51 51 51 51 51 51 51 51 51 51 51 51 51 51 51 51 51
IQ18
Pearson Correlation
.273 .700** .480** .b .b .b .418** .318* .379** .518** .480** .510** .317* .b .510** .315* 1.000** 1
Sig. (2-tailed) .053 .000 .000 .002 .023 .006 .000 .000 .000 .024 .000 .025 0.000
N 51 51 51 51 51 51 51 51 51 51 51 51 51 51 51 51 51 51
IQ19
Pearson Correlation
.366** .219 .313* .b .b .b .427** .588** .387** .555** .313* .425** .452** .b .425** .479** .091 .091 1
Sig. (2-tailed) .008 .122 .025 .002 .000 .005 .000 .025 .002 .001 .002 .000 .524 .524
N 51 51 51 51 51 51 51 51 51 51 51 51 51 51 51 51 51 51 51
IQ20
Pearson Correlation
.231 .156 .223 .b .b .b .304* .459** .276 .428** .223 .303* .322* .b .303* .448** .223 .223 .712** 1
Sig. (2-tailed) .103 .274 .116 .030 .001 .050 .002 .116 .031 .021 .031 .001 .116 .116 .000
N 51 51 51 51 51 51 51 51 51 51 51 51 51 51 51 51 51 51 51 51
IQ21
Pearson Correlation
.346* .209 .299* .b .b .b .408** .559** .370** .590** .299* .406** .431** .b .406** .485** .299* .299* .955** .746** 1
Sig. (2-tailed) .013 .141 .033 .003 .000 .008 .000 .033 .003 .002 .003 .000 .033 .033 .000 .000
N 51 51 51 51 51 51 51 51 51 51 51 51 51 51 51 51 51 51 51 51 51
IQ22
Pearson Correlation
.296* .242 .346* .b .b .b .472** .607** .428** .541** .346* .470** .500** .b .470** .423** .181 .181 .895** .684** .882** 1
Sig. (2-tailed) .035 .087 .013 .000 .000 .002 .000 .013 .001 .000 .001 .002 .203 .203 .000 .000 .000
N 51 51 51 51 51 51 51 51 51 51 51 51 51 51 51 51 51 51 51 51 51 51
**. Correlation is significant at the 0.01 level (2-tailed).
*. Correlation is significant at the 0.05 level (2-tailed).
b. Cannot be computed because at least one of the variables is constant.

76
3. Correlation Coefficient for Operational Performance
OP1 OP2 OP3 OP4 OP5 OP6 OP7 OP8
OP1
Pearson Correlation
1
Sig. (2-tailed)
N 51
OP2
Pearson Correlation
.721** 1
Sig. (2-tailed) .000
N 51 51
OP3
Pearson Correlation
.671** .736** 1
Sig. (2-tailed) .000 .000
N 51 51 51
OP4
Pearson Correlation
.865** .736** .587** 1
Sig. (2-tailed) .000 .000 .000
N 51 51 51 51
OP5
Pearson Correlation
.685** .835** .791** .791** 1
Sig. (2-tailed) .000 .000 .000 .000
N 51 51 51 51 51
OP6
Pearson Correlation
.685** .835** .791** .791** 1.000** 1
Sig. (2-tailed) .000 .000 .000 .000 0.000
N 51 51 51 51 51 51
OP7
Pearson Correlation
.685** .835** .791** .791** 1.000** 1.000** 1
Sig. (2-tailed) .000 .000 .000 .000 0.000 0.000
N 51 51 51 51 51 51 51
OP8
Pearson Correlation
.685** .835** .791** .791** 1.000** 1.000** 1.000** 1
Sig. (2-tailed) .000 .000 .000 .000 0.000 0.000 0.000
N 51 51 51 51 51 51 51 51
**. Correlation is significant at the 0.01 level (2-tailed).

77
4. Correlation Coefficient for Business Performance
BP1 BP2 BP3 BP4 BP5
BP1
Pearson Correlation
1
Sig. (2-tailed)
N 51
BP2
Pearson Correlation
.485** 1
Sig. (2-tailed) .000
N 51 51
BP3
Pearson Correlation
.704** .681** 1
Sig. (2-tailed) .000 .000
N 51 51 51
BP4
Pearson Correlation
.485** .729** .488** 1
Sig. (2-tailed) .000 .000 .000
N 51 51 51 51
BP5
Pearson Correlation
.b .b .b .b .b
Sig. (2-tailed)
N 51 51 51 51 51
**. Correlation is significant at the 0.01 level (2-tailed).
b. Cannot be computed because at least one of the variables is constant.
5. Correlation Coefficient for Supplier Relationship Management
SRM1 SRM2 SRM3 SRM4 SRM5 SRM6 SRM7 SRM8
SRM1
Pearson Correlation
1
Sig. (2-tailed)
N 51
SRM2
Pearson Correlation
.655** 1
Sig. (2-tailed) .000
N 51 51
SRM3
Pearson Correlation
.613** .512** 1
Sig. (2-tailed) .000 .000
N 51 51 51
SRM4
Pearson Correlation
.364** .571** .594** 1
Sig. (2-tailed) .009 .000 .000
N 51 51 51 51
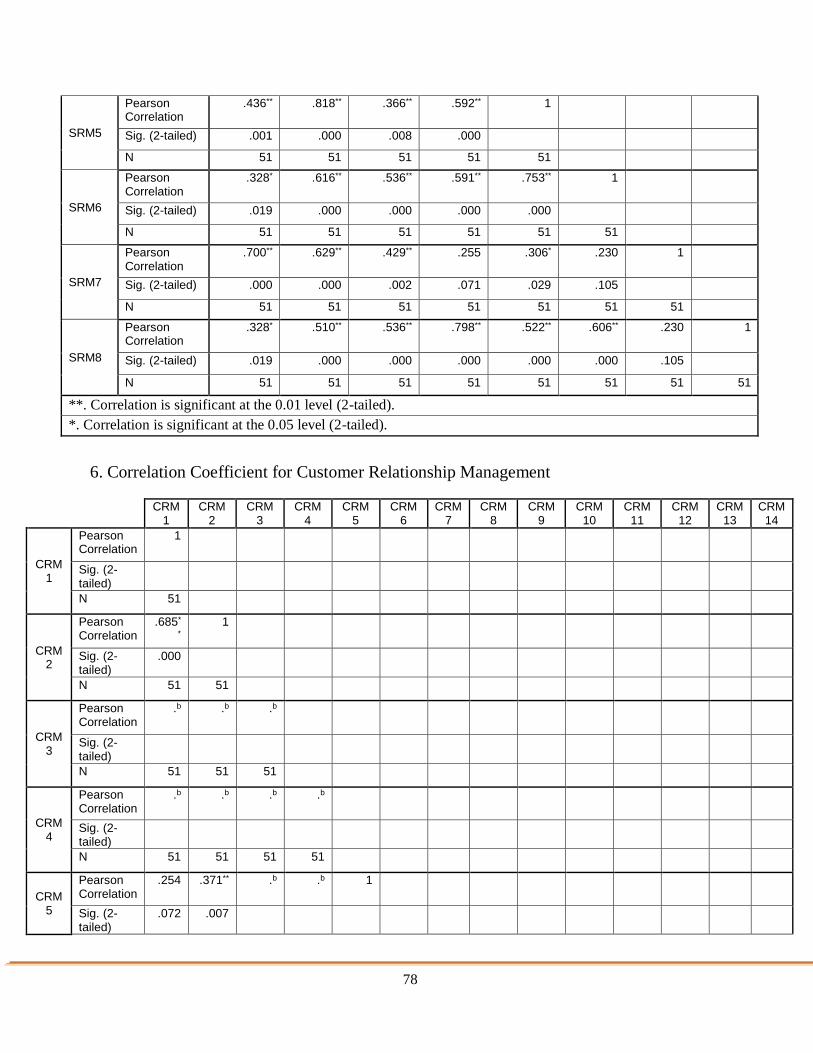
78
SRM5
Pearson Correlation
.436** .818** .366** .592** 1
Sig. (2-tailed) .001 .000 .008 .000
N 51 51 51 51 51
SRM6
Pearson Correlation
.328* .616** .536** .591** .753** 1
Sig. (2-tailed) .019 .000 .000 .000 .000
N 51 51 51 51 51 51
SRM7
Pearson Correlation
.700** .629** .429** .255 .306* .230 1
Sig. (2-tailed) .000 .000 .002 .071 .029 .105
N 51 51 51 51 51 51 51
SRM8
Pearson Correlation
.328* .510** .536** .798** .522** .606** .230 1
Sig. (2-tailed) .019 .000 .000 .000 .000 .000 .105
N 51 51 51 51 51 51 51 51
**. Correlation is significant at the 0.01 level (2-tailed).
*. Correlation is significant at the 0.05 level (2-tailed).
6. Correlation Coefficient for Customer Relationship Management
CRM
1 CRM
2 CRM
3 CRM
4 CRM
5 CRM
6 CRM
7 CRM
8 CRM
9 CRM
10 CRM
11 CRM
12 CRM
13 CRM
14
CRM1
Pearson Correlation
1
Sig. (2-tailed)
N 51
CRM2
Pearson Correlation
.685*
* 1
Sig. (2-tailed)
.000
N 51 51
CRM3
Pearson Correlation
.b .b .b
Sig. (2-tailed)
N 51 51 51
CRM4
Pearson Correlation
.b .b .b .b
Sig. (2-tailed)
N 51 51 51 51
CRM5
Pearson Correlation
.254 .371** .b .b 1
Sig. (2-tailed)
.072 .007

79
N 51 51 51 51 51
CRM6
Pearson Correlation
.566*
* .387** .b .b -.078 1
Sig. (2-tailed)
.000 .005 .584
N 51 51 51 51 51 51
CRM7
Pearson Correlation
.b .b .b .b .b .b .b .b .b .b .b .b .b .b
Sig. (2-tailed)
N 51 51 51 51 51 51 51
CRM8
Pearson Correlation
.808*
* .553** .b .b .126 .700** .b 1
Sig. (2-tailed)
.000 .000 .378 .000
N 51 51 51 51 51 51 51 51
CRM9
Pearson Correlation
.292* .426** .b .b .254 .566** .b .379** 1
Sig. (2-tailed)
.038 .002 .072 .000 .006
N 51 51 51 51 51 51 51 51 51
CRM10
Pearson Correlation
.b .b .b .b .b .b .b .b .b .b
Sig. (2-tailed)
N 51 51 51 51 51 51 51 51 51 51
CRM11
Pearson Correlation
.b .b .b .b .b .b .b .b .b .b .b
Sig. (2-tailed)
N 51 51 51 51 51 51 51 51 51 51 51
CRM12
Pearson Correlation
.627*
* .385** .b .b .316* .355* .b .507** .142 .b .b 1
Sig. (2-tailed)
.000 .005 .024 .011 .000 .319
N 51 51 51 51 51 51 51 51 51 51 51 51
CRM13
Pearson Correlation
.451*
* .371** .b .b .346* .255 .b .364** .451** .b .b .316* 1
Sig. (2-tailed)
.001 .007 .013 .071 .009 .001 .024
N 51 51 51 51 51 51 51 51 51 51 51 51 51
CRM14
Pearson Correlation
.673*
* .417** .b .b .203 .600** .b .622** .285* .b .b .632** .418*
* 1
Sig. (2-tailed)
.000 .002 .154 .000 .000 .042 .000 .002
N 51 51 51 51 51 51 51 51 51 51 51 51 51 51
**. Correlation is significant at the 0.01 level (2-tailed).
*. Correlation is significant at the 0.05 level (2-tailed).
b. Cannot be computed because at least one of the variables is constant.

80
7. Correlation Coefficient for Product Quality
PQ1 PQ2 PQ3 PQ4 PQ5 PQ6 PQ7 PQ8 PQ9
PQ1 Pearson Correlation
1
Sig. (2-tailed)
N 51
PQ2 Pearson Correlation
.121 1
Sig. (2-tailed) .396
N 51 51
PQ3 Pearson Correlation
.198 .613** 1
Sig. (2-tailed) .164 .000
N 51 51 51
PQ4 Pearson Correlation
.121 .198 .a .a
Sig. (2-tailed)
N 51 51 51 51
PQ5 Pearson Correlation
.a .a .a .a .a
Sig. (2-tailed)
N 51 51 51 51 51
PQ6 Pearson Correlation
.198 .a .a .a .a 1
Sig. (2-tailed) .061
N 51 51 51 51 51 51
PQ7 Pearson Correlation
.323* .191 .220 .a .a .a 1
Sig. (2-tailed) .021 .180 .120
N 51 51 51 51 51 51 51
PQ8 Pearson Correlation
.323* .191 .220 .a .a .a 1.000** 1
Sig. (2-tailed) .021 .180 .120 0.000
N 51 51 51 51 51 51 51 51
PQ9 Pearson Correlation
.323* .191 .220 .a .a .a 1.000** 1.000** 1
Sig. (2-tailed) .021 .180 .120 0.000 0.000
N 51 51 51 51 51 51 51 51 51
*. Correlation is significant at the 0.05 level (2-tailed).
**. Correlation is significant at the 0.01 level (2-tailed).
a. Cannot be computed because at least one of the variables is constant.
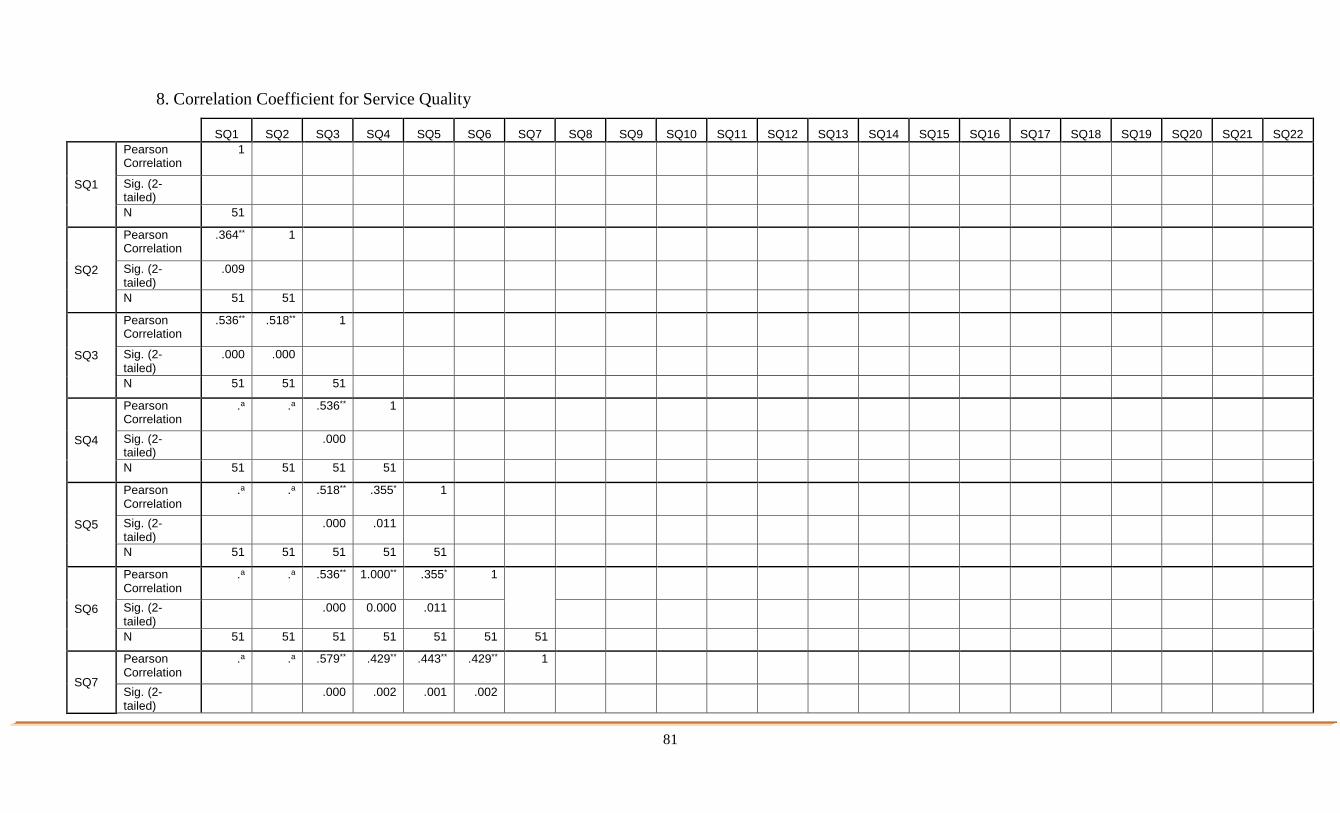
81
8. Correlation Coefficient for Service Quality
SQ1 SQ2 SQ3 SQ4 SQ5 SQ6 SQ7 SQ8 SQ9 SQ10 SQ11 SQ12 SQ13 SQ14 SQ15 SQ16 SQ17 SQ18 SQ19 SQ20 SQ21 SQ22
SQ1
Pearson Correlation
1
Sig. (2-tailed)
N 51
SQ2
Pearson Correlation
.364** 1
Sig. (2-tailed)
.009
N 51 51
SQ3
Pearson Correlation
.536** .518** 1
Sig. (2-tailed)
.000 .000
N 51 51 51
SQ4
Pearson Correlation
.a .a .536** 1
Sig. (2-tailed)
.000
N 51 51 51 51
SQ5
Pearson Correlation
.a .a .518** .355* 1
Sig. (2-tailed)
.000 .011
N 51 51 51 51 51
SQ6
Pearson Correlation
.a .a .536** 1.000** .355* 1
Sig. (2-tailed)
.000 0.000 .011
N 51 51 51 51 51 51 51
SQ7
Pearson Correlation
.a .a .579** .429** .443** .429** 1
Sig. (2-tailed)
.000 .002 .001 .002

82
N 51 51 51 51 51 51 51
SQ8
Pearson Correlation
.429** .443** .a .a .429** .a 1
Sig. (2-tailed)
.002 .002 .000
N 51 51 51 51 51 51 51 51
SQ9
Pearson Correlation
.a .a .a .a .a .a .a .a .a
Sig. (2-tailed)
N 51 51 51 51 51 51 51 51 51
SQ10
Pearson Correlation
.a .a .364** .485** .308* .485** .149 .a .a 1
Sig. (2-tailed)
.009 .000 .028 .000 .296
N 51 51 51 51 51 51 51 51 51 51
SQ11
Pearson Correlation
.a .a .a .a .a .a .a .a .a .a .a
Sig. (2-tailed)
N 51 51 51 51 51 51 51 51 51 51 51
SQ12
Pearson Correlation
.a .a -.021 -.035 .142 -.035 .198 .a .a -.073 .a 1
Sig. (2-tailed)
.882 .805 .319 .805 .164 .611
N 51 51 51 51 51 51 51 51 51 51 51 51
SQ13
Pearson Correlation
.a .a .a .a .a .a .a .a .a .a .a .a .a
Sig. (2-tailed)
N 51 51 51 51 51 51 51 51 51 51 51 51 51
SQ14
Pearson Correlation
.a .a .a .a .a .a .a .a .a .a .a .a .a .a
Sig. (2-tailed)
N 51 51 51 51 51 51 51 51 51 51 51 51 51 51

83
SQ15
Pearson Correlation
.a .a .463** .566** .385** .566** .478** .a .a .547** .a -.063 .a .a 1
Sig. (2-tailed)
.001 .000 .005 .000 .000 .000 .663
N 51 51 51 51 51 51 51 51 51 51 51 51 51 51 51
SQ16
Pearson Correlation
.a .a -.081 -.020 -.056 -.020 -.047 .a .a -.041 .a -.035 .a .a -.035 1
Sig. (2-tailed)
.574 .889 .694 .889 .745 .774 .805 .805
N 51 51 51 51 51 51 51 51 51 51 51 51 51 51 51 51
SQ17
Pearson Correlation
.a .a .a .a .a .a .a .a .a .a .a .a .a .a .a .a .a
Sig. (2-tailed)
N 51 51 51 51 51 51 51 51 51 51 51 51 51 51 51 51 51
SQ18
Pearson Correlation
.a .a .a .a .a .a .a .a .a .a .a .a .a .a .a .a .a .a
Sig. (2-tailed)
N 51 51 51 51 51 51 51 51 51 51 51 51 51 51 51 51 51 51
SQ19
Pearson Correlation
.a .a .a .a .a .a .a .a .a .a .a .a .a .a .a .a .a .a .a
Sig. (2-tailed)
N 51 51 51 51 51 51 51 51 51 51 51 51 51 51 51 51 51 51 51
SQ20
Pearson Correlation
.a .a .a .a .a .a .a .a .a .a .a .a .a .a .a .a .a .a .a .a
Sig. (2-tailed)
N 51 51 51 51 51 51 51 51 51 51 51 51 51 51 51 51 51 51 51 51
SQ21
Pearson Correlation
.a .a .125 -.020 .355* -.020 .429** .a .a -.041 .a .566** .a .a -.035 -.020 .a .a .a .a 1
Sig. (2-tailed)
.383 .889 .011 .889 .002 .774 .000 .805 .889
N 51 51 51 51 51 51 51 51 51 51 51 51 51 51 51 51 51 51 51 51 51
SQ22 Pearson Correlation
.a .a .125 -.020 -.056 -.020 -.047 .a .a .485** .a -.035 .a .a .566** -.020 .a .a .a .a -.020 1

84
Sig. (2-tailed)
.383 .889 .694 .889 .745 .000 .805 .000 .889 .889
N 51 51 51 51 51 51 51 51 51 51 51 51 51 51 51 51 51 51 51 51 51 51
**. Correlation is significant at the 0.01 level (2-tailed).
*. Correlation is significant at the 0.05 level (2-tailed).
a. Cannot be computed because at least one of the variables is constant.

85
9. Correlation Coefficient for Competitive Priorities
CP1 CP2 CP3 CP4 CP5
CP1
Pearson Correlation 1
Sig. (2-tailed)
N 51
CP2
Pearson Correlation .390** 1
Sig. (2-tailed) .005
N 51 51
CP3
Pearson Correlation .525** .b 1
Sig. (2-tailed) .000
N 51 51 51
CP4
Pearson Correlation .663** .b .288* 1
Sig. (2-tailed) .000 .040
N 51 51 51 51
CP5
Pearson Correlation .472** .b .398** .b 1
Sig. (2-tailed) .000 .004
N 51 51 51 51 51
**. Correlation is significant at the 0.01 level (2-tailed).
b. Cannot be computed because at least one of the variables is constant.

86
Appendix-D: Sample Report Documents of the Companies
Before ISO Implementation (Year 2015)
BELAYAB CABLES
DATE PRODUCTION
ORDER PRODUCTION
DATE CABLE TYPE START END
LENGTH (mt)
TEST RESULT
DELIVERED OR NOT
02,09,2015 0015/2015 24,08,2015 3x70+35 mm2 1010 0 1010 Pass Delivered
02,09,2015 0015/2015 24,08,2015 3x70+35 mm2 2102 1011 1091 Pass Delivered
02,09,2015 0015/2015 14,08,2015 3x70+35 mm2 2101 1006 1095 Pass Delivered
02,09,2015 0015/2015 31,08,2015 3x70+35 mm2 2100 1050 1050 Pass Delivered
03,09,2015 0061/2015 02,09,2015 2x1.5 mm2 1402 2 1400 Fail not deliverd
03,09,2015 0061/2015 02,09,2015 2x1.5 mm2 2844 1403 1441 Fail
03,09,2015 0061/2015 02,09,2015 2x1.5 mm2 3008 2845 163 Pass Delivered
05,09,2015 0015/2015 24,08,2015 3x70+35 mm2 1040 0 1040 Pass Delivered
05,09,2015 0015/2015 31,08,2015 3x120+70
mm2 354 0 354 Pass Delivered
06,09,2015 0058/2015 01,09,2015 3x70+35 mm2 1000 0 1000 Pass Delivered
07,09,2015 0061/2015 01,09,2015 4x4 mm2 877 0 877 Fail
07,09,2015 0015/2015 24,08,2015 3x120+70
mm2 1017 666 351 Pass Delivered
07,09,2015 0015/2015 24,08,2015 3x120+70
mm2 485 0 485 Pass Delivered
07,09,2015 0015/2015 24,08,2015 3x120+70
mm2 651 0 651 Pass Delivered
07,09,2015 0039/2015 06,09,2015 2X6 mm2 3675 0 3675 Pass Delivered
07,09,2015 0039/2015 06,09,2015 2X6 mm2 3654 0 3654 Pass Delivered
07,09,2015 0015/2015 24,08,2015 3x120+70
mm2 664 488 176 Fail not deliverd
07,09,2015 0015/2015 31,08,2015 3x70+35 mm2 1039 0 1039 Pass Delivered
07,09,2015 0015/2015 24,08,2015 3x120+70
mm2 352 0 352 Pass Delivered
07,09,2015 0039/2015 06,09,2015 2X6 mm2 3564 0 3564 Pass
07,09,2015 0039/2015 06,09,2015 2X6 mm2 3628 0 3628 Pass
17,09,2015 0039/2015 08,09,2015 4x16 mm2 1050 0 1050 Fail
17,09,2015 0039/2015 08,09,2015 4x16 mm2 2101 1051 1050 Fail not deliverd
17,09,2015 0061/2015 08,09,2015 3x2.5 mm2 2859 1101 1758 Fail not deliverd
17,09,2015 0061/2015 08,09,2015 3x2.5 mm2 4064 0 4064 Pass Delivered
17,09,2015 0039/2015 13,09,2015 2x10 mm2 2206 0 2206 Pass Delivered
17,09,2015 0039/2015 13,09,2015 2x10 mm2 2034 0 2034 Pass Delivered
17,09,2015 0039/2015 13,09,2015 2x10 mm2 6641 4234 2407 Pass Delivered
17,09,2015 0039/2015 13,09,2015 2x10 mm2 4226 2207 2019 Fail
17,09,2015 0039/2015 13,09,2015 2x10 mm2 2085 0 2085 Pass Delivered
17,09,2015 0039/2015 13,09,2015 2x10 mm2 4173 2086 2087 Fail
17,09,2015 0039/2015 13,09,2015 2x10 mm2 1651 0 1651 Pass Delivered
21,09,2015 0058/2015 16,09,2015 3x70+35 mm2 1052 0 1052 Pass Delivered
21,09,2015 0058/2015 07,09,2015 3x70+35 mm2 2104 1021 1083 Fail not deliverd
21,09,2015 0039/2015 08,09,2015 4x16 mm2 3042 2102 940 Pass Delivered
21,09,2015 0039/2015 17,09,2015 4x16 mm2 3218 2168 1050 Pass Delivered
21,09,2015 0039/2015 17,09,2015 4x16 mm2 2167 1084 1083 Pass Delivered

87
21,09,2015 0039/2015 16,09,2015 4x16 mm2 1083 0 1083 Pass Delivered
21,09,2015 0039/2015 17,09,2015 2X6 mm2 3614 0 3614 Pass Delivered
21,09,2015 0039/2015 28,08,2015 2X6 mm2 1562 0 1562 Pass Delivered
21,09,2015 0039/2015 07,09,2015 2X6 mm2 3645 0 3645 Fail
23,09,2015 0039/2015 20,09,2015 2X6 mm2 3387 522 2865 Fail not deliverd
23,09,2015 0039/2015 20,09,2015 2X6 mm2 1105 0 1105 Pass Delivered
23,09,2015 0039/2015 20,09,2015 2X6 mm2 2210 0 2210 Pass Delivered
23,09,2015 0039/2015 20,09,2015 2X6 mm2 2881 0 2881 Pass Delivered
23,09,2015 0039/2015 20,09,2015 2X6 mm2 3637 0 3637 Pass Delivered
30,09,2015 0062/2015 13,09,2015 4x6 mm2 3025 0 3025 Pass Delivered
30,09,2015 0039/2015 17,09,2015 2x10 mm2 3135 0 3135 Pass Delivered
30,09,2015 07,09,2015 3x25+16 mm2 312 0 312 Pass Delivered
Before ISO Implementation (Year 2016)
BELAYAB CABLES
DATE PRODUCTION
ORDER PRODUCTION
DATE CABLE TYPE START END
LENGTH (mt)
TEST RESULT
DELIVERED OR NOT
07,07,2016 0039/2016-1 29,06,2016 4x10 mm2 3045 1551 1494 Pass delivered
07,07,2016 0010/2016 05,07,2016 5x16 mm2 1447 0 1447 Fail
07,07,2016 0039/2016-1 05,07,2016 4x10 mm2 3048 1813 1235 Pass delivered
08,07,2016 0039/2016-1 05,07,2016 4x10 mm2 1809 0 1809 Pass delivered
08,07,2016 0015/2016 01,07,2016 3x70+35 mm2 1075 1 1074 Pass delivered
08,07,2016 0039/2016-1 07,07,2016 2x6 mm2 0 3110 3110 Pass
11,07,2016 0015/2016 01,07,2016 3x70+35 mm2 1021 0 1021 Fail Not Delivered
11,07,2016 0015/2016 01,07,2016 3x70+35 mm2 2043 1022 1021 Pass delivered
11,07,2016 08,07,2016 4x25 mm2 0 95 95 Pass
11,07,2016 20,06,2016 3x6 mm2 179 0 179 Pass
11,07,2016 018/2016 20,04,2016 4x16 mm2 145 0 145 Pass
11,07,2016 0035/2016 04,07,2016 3x35 mm2 789 0 789 Fail Not Delivered
11,07,2016 0015/2016 01,07,2016 3x70+35 mm2 1071 1 1070 Pass
11,07,2016 0050/2016 21,06,2016 3x2.5 mm2 3295 2251 1044 Pass
11,07,2016 0050/2016 09,07,2016 3x4 mm2 1194 0 1994 Pass delivered
12,07,2016 0015/2016 30,06,2016 3x300+150 mm2 Fail Not Delivered
12,07,2016 0015/2016-
2&3 30,06,2016 3x300+150 mm2
251 0 251 Pass delivered
12,07,2016 0034/2016-5 11,07,2016 4x16 mm2 3977 2069 1908 Pass delivered
12,07,2016 0034/2016-5 11,07,2016 4x16 mm2 2066 0 2066 Pass delivered
12,07,2016 0015/2016-5 01,07,2016 3x70+35 mm2 1029 1029 Fail
12,07,2016 0015/2016-5 01,07,2016 3x70+35 mm2 2060 1030 1030 Pass delivered
12,07,2016 0007/2016 07,05,2016 4x10 mm2 4254 3918 336 Fail
12,07,2016 0010/2016 05,07,2016 5x6 mm2 935 0 935 Fail Not Delivered
13,07,2016 024/2016 25,03,2016 3x185+95 mm2 233 190 33 Fail
13,07,2016 2008 3x240+120 mm2 95 0 95 Pass

88
14,07,2016 0050/2016 12,07,2016 3x2.5 mm2 3476 0 3476 Pass delivered
14,07,2016 0039/2016-1 08,07,2016 2X6 mm2 2965 1310 1655 Pass delivered
14,07,2016 05,07,2016 4x10 mm2 1013 0 1013 Pass delivered
15,07,2016 0046/2016 13,07,2016 3x185+95 mm2 512 289 221 Pass delivered
16,07,2016 0037/2016 11,07,2016 2X6 mm2 2093 0 2093 Fail
16,07,2016 034/2016-5 14,07,2016 4X16 mm2 2068 0 2068 Pass delivered
16,07,2016 034/2016-5 14,07,2016 4X16 mm2 1932 0 1932 Pass delivered
17,07,2016 0039/2016 16,07,2016 2X6 mm2 3713 0 3713 Pass delivered
17,07,2016 0039/2016 16,07,2016 2X6 mm2 3663 0 3663 Pass delivered
17,07,2016 0039/2016 16,07,2016 2X6 mm2 3659 0 3659 Pass delivered
18,07,2016 0039/2016 08,07,2016 2X6 mm2 1309 0 1309 Pass delivered
18,07,2016 0015/2016-5 13,07,2016 3x300+150 mm2 497 249 248 Pass delivered
18,07,2016 0015/2016-5 13,07,2016 3x300+150 mm2 506 255 251 Pass delivered
18,07,2016 0015/2016-5 13,07,2016 3x300+150 mm2 254 0 254 Pass delivered
18,07,2016 0039/2016 11,07,2016 3x6 mm2 1572 0 1572 Pass delivered
18,07,2016 0015/2016-5 13,07,2016 3x300+150 mm2 248 0 248 Pass delivered
20,07,2016 0039/2016 19.07,2016 2X6 mm2 2171 0 2171 pass delivered
20,07,2016 0039/2016 19.07,2016 2X6 mm2 3649 54 3595 pass delivered
20,07,2016 0039/2016 16.07,2016 2X6 mm2 3687 109 3578 pass delivered
20,07,2016 0039/2016 19,07,2016 2X6 mm2 3361 0 3359 Pass delivered
20,07,2016 0039/2016 19,07,2016 2X6 mm2 3655 1 3654 Pass delivered
20,07,2016 0039/2016 19,07,2016 2X6 mm2 3716 0 3716 Pass delivered
20,07,2016 0039/2016 19,07,2016 2X6 mm2 449 1 448 Pass
20,07,2016 010/2016 28,06,2016 3X16 mm2 2736 2051 685 Pass
20,07,2016 0039/2019 11,07,2016 2x2.5 mm2 939 0 939 Pass
20,07,2016 0039/2019 11,07,2016 4x1.5 mm2 624 0 624 Pass
21,07,2016 024/2016 25,03,2016 . 57 0 57 Pass
21,07,2016 0039/2016 20,07,2016 2X6 mm2 3336 0 3336 Pass delivered
21,07,2016 0039/2016 20,07,2016 2X6 mm2 3715 1 3714 Pass delivered
21,07,2016 0039/2016 19,07,2016 2X6 mm2 926 1 925 Pass delivered
21,07,2016 19,10,2015 3X150+70 mm2 699 608 91 Fail
23,07,2016 0039/2016 21,07,2016 2X6 mm2 3237 0 3237 Pass delivered
25,07,2016 0015/2016-2 30,06,2016 3x300+150 mm2 248 0 248 Pass
25,07,2016 0015/2016-2 30,06,2016 3x300+150 mm2 498 249 249 Fail
26,07,2016 0039/2016 21,07,2016 2X6 mm2 3594 3239 355 Pass delivered
26,07,2016 0046/2016 13,07,2016 3x185+95 mm2 288 0 288 Pass delivered
26,07,2016 0039/2016 25,07,2016 2X6 mm2 3687 1885 1802 Pass delivered
26,07,2016 0039/2016 25,07,2016 2X6 mm2 3601 494 3107 Fail
26,07,2016 0039/2016 25,07,2016 2X6 mm2 3676 763 2913 Pass delivered
26,07,2016 0039/2016 25,07,2016 2X6 mm2 1884 1408 476 Pass
26,07,2016 0039/2016 25,07,2016 2X6 mm2 815 0 815 Pass delivered
26,07,2016 0039/2016 25,07,2016 2X6 mm2 3627 1 3626 Pass delivered
26,07,2016 0039/2016 25,07,2016 2X6 mm2 3566 818 2748 Fail Not Delivered
26,07,2016 0039/2016 25,07,2016 2X6 mm2 1407 0 1407 Pass delivered
26,07,2016 0039/2016 25,07,2016 2X6 mm2 3673 0 3673 Pass delivered
26,07,2016 0039/2016 25,07,2016 2X6 mm2 3660 2 3660 Pass delivered
27,07,2016 0039/2016 26,07,2016 2X6 mm2 339 0 339 Pass delivered
27,07,2016 0039/2016 26,07,2016 2X6 mm2 2651 0 2651 Pass delivered

89
27,07,2016 0039/2016 26,07,2016 2X6 mm2 3650 0 3650 Pass delivered
27,07,2016 0039/2016 26,07,2016 2X6 mm2 3452 2 3450 Fail
27,07,2016 0039/2016 25,07,2016 2X6 mm2 2318 18 2300 Pass delivered
29,07,2016 0015/2016-
8&9 26,07,2016 3x70+35 mm2
2103 1051 1052 Pass
29,07,2016 0015/2016-
8&9 26,07,2016 3x70+35 mm2
1050 0 1050 Pass delivered
29,07,2016 0015/2016-
8&9 28,06,2016 3x70+35 mm2
1020 0 1020 Pass delivered
29,07,2016 0015/2016-
1&2 27,07,2016 3x95+50 mm2
441 0 441 Pass delivered
30,07,2016 0015/2016-
1&2 27,07,2016 3x95+50 mm2
498 Pass delivered
30,07,2016 0039/2016 29,07,2016 2X6 mm2 3310 0 3310 Pass delivered
30,07,2016 0039/2016 29,07,2016 2X6 mm2 1525 2 1523 Pass delivered
01,10,2016 0039/2016 24,09,2016 2X6 mm2 1919 0 1919 Pass Delivered
01,10,2016 0039/2016 24,09,2016 2X6 mm2 3611 1926 1685 Pass Delivered
01,10,2016 0039/2016 22,09,2016 2X6 mm2 3503 1977 1526 Pass Delivered
01,10,2016 0039/2016 21,09,2016 2X6 mm2 3586 3023 563 Pass Delivered
01,10,2016 0039/2016 21,09,2016 2X6 mm2 6003 4602 1401 Pass Delivered
01,10,2016 0039/2016 21,09,2016 2X6 mm2 2338 179 2159 Pass Delivered
01,10,2016 0039/2016 20,08,2016 2X6 mm2 1415 1201 214 Pass
01,10,2016 0039/2016 24,09,2016 4x16 mm2 3213 2143 1070 Pass Delivered
01,10,2016 0061/2016 14,09,2016 4x2.5 mm2 964 1 963 Pass
03,10,2016 0056/2016 01,09,2016 4x4 mm2 443 0 443 Pass
03,10,2016 0039/2016 24,09,2016 2X6 mm2 3632 749 2883 Pass Delivered
03,10,2016 0039/2016 24,09,2016 2X6 mm2 3639 0 3639 Pass Delivered
03,10,2016 0039/2016 24,09,2016 2X6 mm2 3411 0 3411 Pass Delivered
03,10,2016 0039/2016 21,09,2016 2X6 mm2 3621 1846 1775 Pass Delivered
03,10,2016 0039/2016 21,09,2016 2X6 mm2 1264 0 1264 Pass Delivered
03,10,2016 0039/2016 26,09,2016 2X6 mm2 2933 0 2933 Pass Delivered
03,10,2016 0058/2016 01,10,2016 4x16 mm2 4216 2116 2100 Pass Delivered
03,10,2016 0058/2016 01,10,2016 4x16 mm2 3123 2001 1122 Pass Delivered
03,10,2016 0058/2016 01,10,2016 4x16 mm2 2000 0 2000 Pass Delivered
05,10,2016 0058/2016 01,10,2016 4x16 mm2 1105 0 1105 Pass Delivered
05,10,2016 0058/2016 01,10,2016 4x16 mm2 3315 2211 1104 Pass Delivered
05,10,2016 0058/2016 01,10,2016 4x16 mm2 2210 1106 1104 Pass Delivered
05,10,2016 0058/2016 01,10,2016 4x16 mm2 3216 1668 1548 Pass Delivered
05,10,2016 0058/2016 01,10,2016 4x16 mm2 2115 1057 1058 Pass Delivered
05,10,2016 0058/2016 01,10,2016 4x16 mm2 1056 0 1056 Pass Delivered
05,10,2016 0058/2016 03,10,2016 4x16 mm2 4034 2690 1344 Pass Delivered
05,10,2016 0058/2016 03,10,2016 4x16 mm2 1564 0 1564 Pass Delivered
05,10,2016 0039/2016 21,09,2016 2X6 mm2 662 0 662 Pass Delivered
05,10,2016 0039/2016 20,09,2016 2X6 mm2 517 0 517 Pass Delivered
07,10,2016 0039/2016 03,10,2016 2X6 mm2 8999 5385 3614 Pass Delivered
07,10,2016 0039/2016 03,10,2016 2X6 mm2 5053 1760 3293 Pass Delivered
07,10,2016 0039/2016 21,09,2016 2X6 mm2 1758 0 1758 Pass Delivered
07,10,2016 0039/2016 21,09,2016 2X6 mm2 3613 1762 1851 Pass Delivered
07,10,2016 0039/2016 21,09,2016 2X6 mm2 4069 3626 443 Pass
07,10,2016 0039/2016 21,09,2016 2X6 mm2 1844 1268 576 Pass Delivered

90
07,10,2016 0039/2016 21,09,2016 2X6 mm2 4951 4079 872 Pass Delivered
07,10,2016 0058/2016 03,10,2016 4x16 mm2 3129 1565 1564 Pass Delivered
07,10,2016 0058/2016 03,10,2016 4x16 mm2 2689 1344 1345 Pass Delivered
07,10,2016 0058/2016 05,10,2016 3x70+35 mm2 1035 0 1035 Pass Delivered
07,10,2016 0058/2016 05,10,2016 3x70+35 mm2 2093 1036 1057 Pass Delivered
08,10,2016 0065/2016 07,10,2016 3x10 mm2 4037 3251 786 Pass Delivered
11,10,2016 0065/2016 07,10,2016 3x10 mm2 1133 0 1133 Pass
11,10,2016 0065/2016 07,10,2016 3x10 mm2 3250 1134 2116 Pass Delivered
11,10,2016 0058/2016 03,10,2016 4x16 mm2 2137 0 3137 Pass Delivered
11,10,2016 0058/2016 03,10,2016 4x16 mm2 2001 0 2001 Pass Delivered
11,10,2016 0058/2016 03,10,2016 4x16 mm2 3058 2002 1056 Pass Delivered
11,10,2016 0039/2016 03,10,2016 2X6 mm2 7623 6218 1405 Fail
11,10,2016 0065/2016 08,10,2016 3x50+25 mm2 1493 1208 285 Pass Delivered
11,10,2016 0058/2016 07,10,2016 3x70+35 mm2 953 0 953 Pass Delivered
11,10,2016 0065/2016 07,10,2016 3x10 mm2 6133 4133 2000 Pass Delivered
11,10,2016 0058/2016 03,10,2016 4x16 mm2 1239 0 1239 Pass Delivered
11,10,2016 0058/2016 03,10,2016 4x16 mm2 1343 0 1343 Pass Delivered
11,10,2016 0058/2016 03,10,2016 4x16 mm2 1983 0 1983 Pass Delivered
11,10,2016 0058/2016 01,10,2016 4x16 mm2 1666 0 1666 Pass Delivered
12,10,2016 0066/2016 10,10,2016 3x4 mm2 536 0 536 Pass
14,10,2016 0058/2016 07,10,2016 3x70+35 mm2 1050 1 1049 Pass Delivered
14,10,2016 0058/2016 07,10,2016 3x70+35 mm2 1050 0 1050 Pass Delivered
14,10,2016 0039/2016 03,09,2016 2X6 mm2 1402 0 1402 Pass Delivered
15,10,2016 0039/2016 03,09,2016 2X6 mm2 3635 0 3635 Pass Delivered
15,10,2016 0039/2016 03,09,2016 2X6 mm2 3649 0 3649 Pass Delivered
17,10,2016 0058/2016 15,10,2016 4x16 mm2 2100 0 2100 Pass Delivered
17,10,2016 0058/2016 15,10,2016 4x16 mm2 4227 2101 2126 Pass Delivered
18,10,2016 0058/2016 15,10,2016 4x16 mm2 2120 0 2120 Pass Delivered
18,10,2016 0058/2016 14,10,2016 4x16 mm2 2110 0 2110 Pass Delivered
18,10,2016 0058/2016 15,10,2016 4x16 mm2 0 2153 2153 Pass Delivered
18,10,2016 0058/2016 15,10,2016 4x16 mm2 4227 2111 2116 Pass Delivered
18,10,2016 0058/2016 15,10,2016 3x70+35 mm2 1035 3 1032 Pass Delivered
18,10,2016 0039/2016 15,10,2016 2X6 mm2 5702 2377 3325 Pass Delivered
19,10,2016 0058/2016 15,10,2016 4x10 mm2 5345 3335 2010 Pass Delivered
19,10,2016 0058/2016 15,10,2016 4x10 mm2 3334 1368 1966 Pass Delivered
19,10,2016 0058/2016 15,10,2016 4x10 mm2 1248 0 1248 Pass Delivered
19,10,2016 0058/2016 15,10,2016 4x10 mm2 1367 0 1367 Pass Delivered
19,10,2016 0039/2016 04,10,2016 2X6 mm2 7485 5706 1779 Pass Delivered
19,10,2016 0039/2016 17,10,2016 2X6 mm2 3622 2 3620 Pass Delivered
19,10,2016 0058/2016 15,10,2016 3x70+35 mm2 1074 0 1074 Pass Delivered
19,10,2016 0039/2016 04,10,2016 2X6 mm2 12997 9352 3645 Pass Delivered
19,10,2016 0039/2016 04,10,2016 2X6 mm2 2373 486 1887 Pass Delivered
19,10,2016 0058/2016 14,10,2016 4x16 mm2 4308 2154 2154 Pass Delivered
19,10,2016 0058/2016 17,10,2016 4x16 mm2 4229 3016 1213 Pass Delivered
19,10,2016 0058/2016 17,10,2016 4x16 mm2 3014 1551 1463 Pass Delivered
19,10,2016 0058/2016 17,10,2016 4x16 mm2 1550 0 1550 Pass Delivered
20,10,2016 0058/2016 15,10,2016 4x16 mm2 2100 0 2100 Pass Delivered
20,10,2016 0058/2016 14,10,2016 4x16 mm2 2153 0 2153 Pass Delivered

91
20,10,2016 0058/2016 17,10,2016 4x16 mm2 2144 2 2142 Pass Delivered
20,10,2016 0058/2016 19,10,2016 4x10 mm2 2110 0 2110 Pass Delivered
20,10,2016 0058/2016 19,10,2016 4x10 mm2 4223 2111 2112 Pass Delivered
20,10,2016 0039/2016 04,10,2016 2X6 mm2 9346 7487 1859 Pass Delivered
21,10,2016 0065/2016 08,10,2016 3X50+25 mm2 1066 772 294 Pass Delivered
21,10,2016 0066/2016 19,10,2016 3X120+70 mm2 392 294 98 Pass
22,10,2016 0058/2016 19,10,2016 4x10 mm2 4223 2112 2111 Pass Delivered
22,10,2016 0058/2016 19,10,2016 4x10 mm2 2111 0 2111 Pass Delivered
22,10,2016 0058/2016 20,10,2016 4x10 mm2 6459 4229 2230 Pass Delivered
22,10,2016 0058/2016 15,10,2016 3x70+35 mm2 1030 0 1030 Pass
25,10,2016 0039/2016 20,10,2016 2X6 mm2 3624 2914 710 Pass Delivered
25,10,2016 0039/2016 20,10,2016 2X6 mm2 4060 3629 431 Pass Delivered
25,10,2016 0039/2016 20,10,2016 2X6 mm2 7859 7060 799 Pass Delivered
25,10,2016 0039/2016 10,10,2016 2X6 mm2 3642 2616 1026 Pass Delivered
25,10,2016 0039/2016 07,09,2016 2X6 mm2 327 0 327 Pass Delivered
25,10,2016 0058/2016 15,10,2016 3x70+35 mm2 1020 0 1020 Pass Delivered
25,10,2016 0058/2016 15,10,2016 3x70+35 mm2 2069 1031 1038 Fail Not Deliverd
25,10,2016 0058/2016 15,10,2016 3x70+35 mm2 2084 1021 1063 Fail
26,10,2016 0039/2016 25,10,2016 2X6 mm2 3614 0 3614 Pass Delivered
26,10,2016 0039/2016 20,10,2016 2X6 mm2 1140 0 1140 Pass Delivered
26,10,2016 0039/2016 03,10,2016 2X6 mm2 3495 0 3495 Pass
26,10,2016 0039/2016 20,10,2016 2X6 mm2 2389 0 2389 Pass Delivered
27,10,2016 0039/2016 20,10,2016 2X6 mm2 2856 0 2856 Fail
27,10,2016 0039/2016 20,10,2016 2X6 mm2 2912 3 2909 Fail
27,10,2016 0039/2016 17,10,2016 2X6 mm2 3610 0 3610 Pass Delivered
27,10,2016 0039/2016 22,10,2016 2X6 mm2 3112 2 3110 Fail
27,10,2016 0039/2016 22,10,2016 2X6 mm2 3658 2 3656 Pass
27,10,2016 0039/2016 25,10,2016 2X6 mm2 3660 0 3660 Pass Delivered
27,10,2016 0039/2016 24,10,2016 2X6 mm2 9384 7308 2076 Pass Delivered
27,10,2016 0039/2016 24,10,2016 2X6 mm2 7304 3676 3628 Fail
27,10,2016 0039/2016 24,10,2016 2X6 mm2 10603 9392 1211 Fail
27,10,2016 0039/2016 24,10,2016 2X6 mm2 1185 1 1184 Pass
27,10,2016 0058/2016 22,10,2016 4X10 mm2 3269 1634 1635 Fail
27,10,2016 0058/2016 22,10,2016 4X10 mm2 1633 0 1633 Pass Delivered
27,10,2016 0058/2016 26,10,2016 4X16 mm2 2131 0 3131 Pass Delivered
27,10,2016 0065/2016 08,10,2016 3X50+25 mm2 771 691 80 Pass
28,10,2016 0039/2016 07,09,2016 2X6 mm2 1564 0 1564 Pass Delivered
28,10,2016 0039/2016 24,10,2016 2X6 mm2 6126 3650 2476 Pass Delivered
28,10,2016 0039/2016 03,10,2016 2X6 mm2 7623 6218 1405 Fail
28,10,2016 0039/2016 24,10,2016 2X6 mm2 7339 6129 1205 Fail
28,10,2016 0039/2016 24,10,2016 2X6 mm2 3648 1188 2460 Pass Delivered
28,10,2016 0039/2016 20,09,2016 2X6 mm2 3039 1541 1498 Pass Delivered
28,10,2016 0039/2016 20,09,2016 2X6 mm2 7058 4076 2982 Pass Delivered
28,10,2016 0039/2016 20,09,2016 2X6 mm2 1540 0 1540 Fail
28,10,2016 0039/2016 17,10,2016 2X6 mm2 5287 3626 1661 Pass Delivered
28,10,2016 0039/2016 17,10,2016 2X6 mm2 3496 2113 1383 Pass Delivered
28,10,2016 0039/2016 17,10,2016 2X6 mm2 2110 0 2110 Pass Delivered
28,10,2016 0058/2016 22,10,2016 4X10 mm2 2234 0 2234 Pass Delivered

92
28,10,2016 0058/2016 22,10,2016 4X10 mm2 1657 0 1657 Pass Delivered
28,10,2016 0058/2016 22,10,2016 4X10 mm2 3316 1658 1658 Pass Delivered
28,10,2016 0058/2016 27,10,2016 4X16 mm2 3108 2101 1007 Pass Delivered
29,10,2016 0065/2016 08,10,2016 3X50+25 mm2 690 390 300 Pass Delivered
31,10,2016 0065/2016 08,10,2016 3X50+25 mm2 389 115 274 Pass Delivered
31,10,2016 0058/2016 27,10,2016 4X16 mm2 4212 3109 1103 Pass Delivered
31,10,2016 0058/2016 26,10,2016 3x70+35 mm2 1123 0 1123 Pass Delivered
31,10,2016 0039/2016 11,10,2016 2X6 mm2 5959 4442 1517 Pass Delivered
31,10,2016 0039/2016 11,10,2016 2X6 mm2 2385 1040 1345 Pass Delivered
31,10,2016 0039/2016 11,10,2016 2X6 mm2 8224 6202 2022 Pass Delivered
31,10,2016 0039/2016 11,10,2016 2X6 mm2 11527 10240 1287 Pass Delivered
31,10,2016 0039/2016 11,10,2016 2X6 mm2 9627 8335 1292 Pass Delivered
31,10,2016 0039/2016 11,10,2016 2X6 mm2 10237 9629 608 Pass Delivered
31,10,2016 0039/2016 22,10,2016 2X6 mm2 3527 3113 414 Pass Delivered
31,10,2016 0039/2016 03,10,2016 2X6 mm2 685 0 685 Pass Delivered
31,10,2016 0039/2016 17,10,2016 2X6 mm2 7103 5310 1793 Pass Delivered

93
After ISO Implementation (Year 2017)
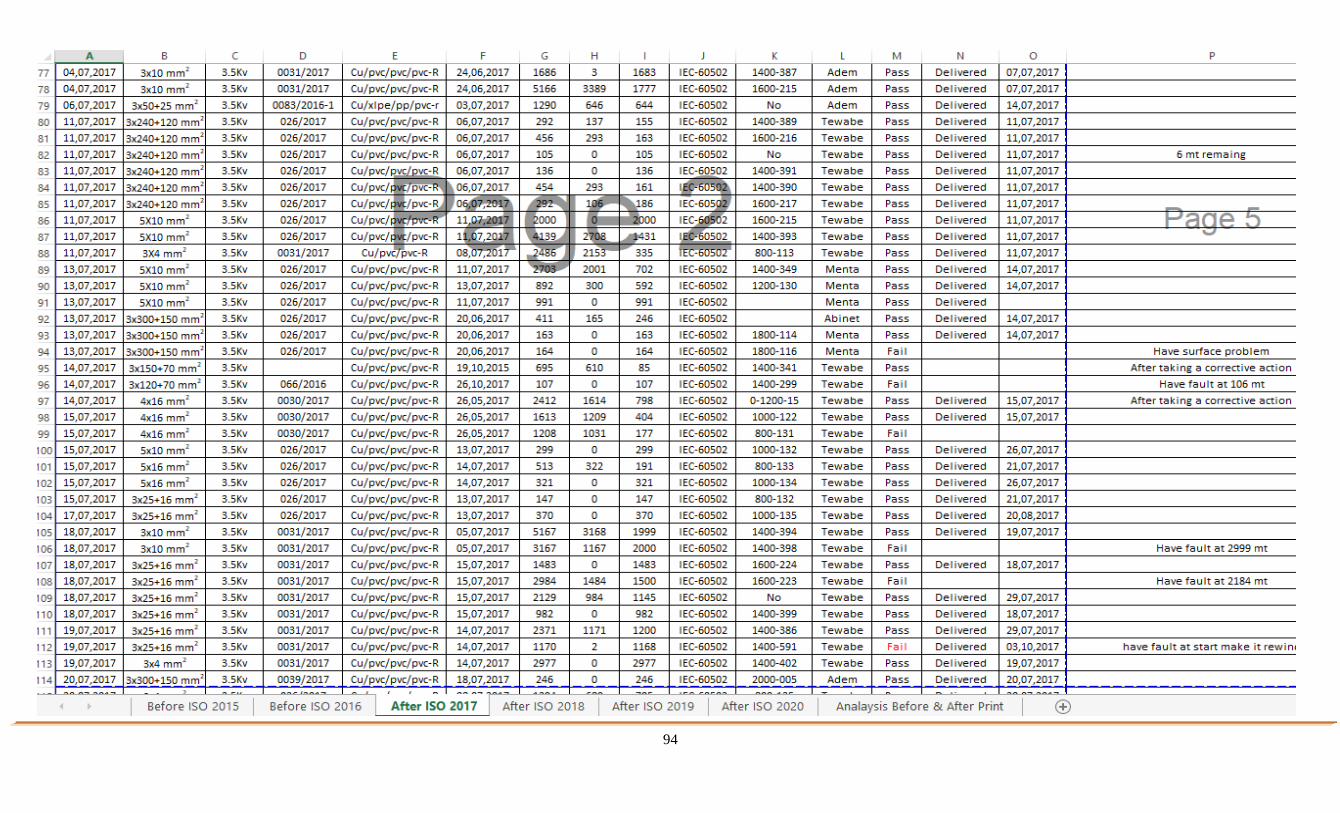
94

95
After ISO Implementation (Year 2018)

96

97
After ISO Implementation (Year 2019)

98

99
After ISO Implementation (Year 2020)

100

101
Before ISO Implementation (Year 2014)
Production and Quality Report
Month August 2014
Product Type
Method Process
Machine Number
Tested Quantity
(M)
Machine operator
Quality Personnel
Result
RG-6 Drawing, Coaxial Insulation, Braiding, Sheathing, Packaging
Drw.Comm-1, Coax Insulation-1, Sheathing (90)-4, PACKING-2
16.67 Gurmesa, Tesema, Abebe
Senait & Mulu Pass
Drop Wire Drawing, Insulation, Packaging
Drw.Comm-2,
Insulation-1,
PACKING-3
48.55 Kebede, Tesfaye, Alemitu
Addis & Lomi Pass
CAT-6 Insulation, Pairing, Assembling, Sheathing, Packaging
Insulation-3,
Paring-2,
Armoring-1,
Sheathing
(120)-1,
PACKING-2
88.11 Abdu, Fikir, Sami, Tolosa
Addis & Lomi Pass
Copper Conductor
Melting Rod/Pallet
CCR-1 8 Tilahun, Elias
Tigist, Alem Fail
Copper Rod Drawing CRBD-1 6 Birhanu Gadisa, Aman Fail
Production and Quality Report
Month November 2014
Product Type Method Process
Machine Number
Tested Quantity
(Km)
Machine operator
Quality Personnel
Result
Drop Wire Drawing, Insulation, Packaging
PACKING-3 110.50 Tesfaye, Kebede, Alemitu
Fatuma, Senait Pass
CAT-6 Insulation, Pairing, Assembling, Sheathing, Packaging
PACKING-2 255.33 Abdu, Fikir, Sami, Tolosa
Addis, Lomi Pass
Copper Conductor Melting Rod/Pallet
CCR-2 9 Tilahun, Elias
Tigist, Alem Pass
Copper Rod Drawing CRBD-1 7 Birhanu Gadisa, Aman Pass

102
After ISO Implementation (Year 2015)
Production and Quality Report
Month September 2015 Total
Product Type Unit Process Tested
Qty (Km)
Pass
(Km)
Fail
(Km)
Performance
%
CAT-6 Km
Insulation 7005.00 7005.00 0.00 100%
Pairing 56379.30 55802.20 163.60 99%
Assembling 767.91 749.16 18.72 98%
Sheathing 592.92 592.92 0.00 100%
Packaging 766.88 816.45 9.58 106%
RG-6 Km
Drawing 603.76 249.76 140.00 41%
Coaxial Insulation 166.61 151.35 15.26 91%
Braiding 0.00 0.00 0.00 #DIV/0!
Sheathing 147.92 118.04 28.50 80%
Packaging 760.70 769.50 6.60 101%
Drop Wire Km
Drawing 4601.20 4001.20 300.00 87%
Insulation 2654.57 2515.97 0.00 95%
Packaging 5229.75 4774.75 #REF! 91%
Total (Km) 79676.52 77546.30 #REF! 97.33%
Man Power
Labor Productivity 77546.30
Rank #N/A
Production and Quality Report
Month December 2015 Total
Product Type Unit Process Tested Qty
(Km)
Pass
(Km)
Fail
(Km
Performance
%
CAT-6 Km
Insulation 2821.89 2696.26 175.63 96%
Pairing 37758.30 37552.90 85.40 99%
Assembling 587.49 574.99 12.48 98%
Sheathing 437.89 576.45 29.10 132%
Packaging 628.83 668.53 20.95 106%
RG-6 Km
Drawing 470.76 144.76 162.00 31%
Coaxial Insulation 335.17 286.33 35.26 85%
Braiding 0.00 0.00 0.00 #DIV/0!
Sheathing 323.22 304.22 19.00 94%
Packaging 713.20 1131.50 32.60 159%
Drop Wire Km
Drawing 5502.15 4208.15 650.00 76%
Insulation 3139.67 2903.67 1.50 92%
Packaging 4325.90 3980.85 #REF! 92%
Conduit 16 mm Pcs Insulation 2380.38 2373.18 0.00 100%
Total (Km) 407362.57 391778.39 #REF! 96.17%
Man Power
Labor Productivity
Rank

103
After ISO Implementation (Year 2016)
Production and Quality Report
Month April 2016 Total
Product Type Unit Process Tested Qty
(Km)
Pass
(Km)
Fail
(Km)
Performance
%
CAT-6 Km
Insulation 5549.30 5134.70 412.60 93%
Pairing 793.60 726.60 94.50 92%
Assembling 254.32 248.22 12.40 98%
Sheathing 302.74 278.34 24.40 92%
Packaging 308.89 309.47 0.00 100%
Drop Wire Km
Drawing 2810.20 2610.20 200.00 93%
Insulation 1743.21 1719.13 25.20 99%
Packaging 1320.48 1315.23 5.25 100%
Fiber optic Km
loading stage 17271.78 15611.60 0.00 90%
buffering stage 3735.08 3631.93 0.00 97%
SZ stage 894.50 890.52 4.00 100%
Inner sheathing 30.80 30.80 0.00 100%
outer sheathing 782.41 778.17 6.20 99%
Total (Km) 13082.74 12341.88 774.35 94.34%
Man Power
Labor Productivity
Rank
Production and Quality Report
Month December 2016 Total
Product Type Unit Process Tested Qty
(Km)
Pass
(Km)
Fail
(Km
Performance
%
Root Cause
for Fail
CAT-6 Km
Insulation 5233.45 5230.95 230.00 100%
Copper
Quality
Problem
Raw Material
Quality
Problem
Pairing 716.85 682.15 31.50 95%
Assembling 316.80 310.60 12.40 98%
Sheathing 414.72 414.72 0.00 100%
Packaging 310.26 309.96 0.31 100%
RG-6 RG-6 Sheathing 17.50 17.50 0.00 100%
Drop Wire Km
Drawing 2407.20 2357.20 50.00 98%
Insulation 950.02 888.62 59.40 94%
Packaging 891.99 761.43 1.50 85%
Fiber optic Km
loading stage 5482.95 5470.76 0.00 100%
buffering stage 752.63 750.63 0.00 100%
SZ stage 341.72 336.57 4.15 98%
Inner sheathing 82.96 82.96 0.00 100%
outer sheathing 364.16 353.80 10.33 97%
Total (Km) 11258.78 10973.13 385.11 97.46%
Man Power
Labor Productivity
Rank

104
After ISO Implementation (Year 2017)
Production and Quality Report
Month May 2017 Total
Product Type Unit Process Tested
Qty (Km)
Pass
(Km)
Fail
(Km
Performance
%
Root Cause
for Fail
CAT-6 Km
Insulation 4450.80 4150.80 300.00 93%
Change In
Product Type
Power
Interruption
Lack Of
Machine
Operators
Pairing 875.30 831.20 50.40 95%
Assembling 252.82 252.82 12.40 100%
Sheathing 258.81 195.81 61.00 76%
Packaging 275.67 275.67 0.61 100%
Drop Wire Km
Drawing 3157.20 2907.20 250.00 92%
Insulation 960.41 961.01 0.00 100%
Packaging 2757.54 2753.04 4.50 100%
Fiber optic Km
loading stage 18627.90 18186.82 0.00 98%
buffering stage 2755.56 2684.80 8.10 97%
SZ stage 847.53 843.54 4.00 100%
Inner sheathing 151.27 151.27 0.00 100%
outer sheathing 805.12 786.37 18.60 98%
Total (Km) 12988.55 12327.55 678.91 94.91%
Man Power
Labor Productivity
Rank
Production and Quality Report
Month December 2017 Total
Product Type Unit Process Tested
Qty (Km)
Pass
(Km)
Fail
(Km
Performance
%
Root Cause
for Fail
CAT-6 Km
Insulation 4675.80 4325.80 350.00 93%
Lack Of
Machine
Operators
Pressure
Decrement/
Compressor
Problem
Pairing 673.70 648.50 37.80 96%
Assembling 218.74 218.74 6.20 100%
Sheathing 214.21 163.41 48.80 76%
Packaging 206.76 206.76 0.61 100%
Drop Wire Km
Drawing 2907.20 2807.20 100.00 97%
Insulation 847.31 848.51 0.00 100%
Packaging 2685.72 2683.22 2.50 100%
Fiber optic Km
loading stage 16114.32 15232.87 0.00 95%
buffering stage 2573.61 2440.18 8.10 95%
SZ stage 747.04 739.06 8.00 99%
Inner sheathing 151.27 151.27 0.00 100%
outer sheathing 775.31 762.78 12.40 98%
Conduit 16 mm Pcs Insulation 35.84 35.84 0.00 100%
Total (Km) 1336.41 1279.72 545.91 95.76%
Man Power
Labor Productivity
Rank

105
After ISO Implementation (Year 2018)
Production and Quality Report
Month Feb 2018 Total
Product Type Unit Process Tested
Qty (Km)
Pass
(Km)
Fail
(Km
Performance
%
Root Cause
for Fail
CAT-6 Km
Insulation 4974.30 4459.70 512.60 90%
Copper
Quality
Problem
Lack Of
Drums, Tools
and other
accessories
Pairing 818.80 746.90 75.60 91%
Assembling 279.52 273.42 12.40 98%
Sheathing 302.74 278.34 24.40 92%
Packaging 308.89 309.47 0.00 100%
Drop Wire Km
Drawing 2710.20 2460.20 250.00 91%
Insulation 1683.91 1659.83 25.20 99%
Packaging 1278.48 1273.23 5.25 100%
Fiber optic Km
loading stage 17271.48 15611.30 0.00 90%
buffering stage 3659.41 3556.26 0.00 97%
SZ stage 870.13 866.15 4.00 100%
Inner sheathing 30.80 30.80 0.00 100%
outer sheathing 732.61 728.37 6.20 99%
Conduit 16 mm Pcs Insulation 52.36 52.36 0.00 100%
Total (Km) 1941.12 1800.31 905.45 92.75%
Man Power
Labor Productivity
Rank
Production and Quality Report
Month December 2018 Total
Product Type Unit Process Tested
Qty (Km)
Pass
(Km)
Fail
(Km
Performance
%
Root Cause
for Fail
CAT-6 Km
Insulation 4462.80 3717.80 700.00 83%
Welding/Repair
Change In
Product Type
Power
Interruption
Machine
Mechanical
Failure
Pairing 1232.70 965.20 74.90 78%
Assembling 552.69 541.29 6.20 98%
Sheathing 509.51 473.86 39.65 93%
Packaging 498.25 544.96 21.69 109%
Drop Wire Km
Drawing 2783.80 2633.80 150.00 95%
Insulation 2322.02 2321.75 0.00 100%
Packaging 2553.48 2633.73 12.50 103%
Fiber optic Km
loading stage 23455.57 22458.59 0.00 96%
buffering stage 3008.11 2942.74 8.30 98%
SZ stage 865.86 867.87 0.00 100%
Inner sheathing 254.10 254.10 0.00 100%
outer sheathing 854.72 842.17 12.45 99%
Conduit 16 mm Pcs Insulation 27.82 27.82 0.00 100%
Total (Km) 1249.00 1158.62 1004.94 92.76%
Man Power
Labor Productivity
Rank

106
After ISO Implementation (Year 2019)
Production and Quality Report
Month March 2019 Total
Product Type Unit Process Tested
Qty (Km)
Pass
(Km)
Fail
(Km)
Performance
%
Root Cause
for Fail
CAT-6 Km
Insulation 3310.70 3135.70 175.00 95%
Copper
Quality
Problem
Raw Material
Quality
Problem
Change In
Product
Type,
Lack Of
Drums, Tools
and other
accessories
Machine
Electrical
Failure
Pairing 761.55 744.05 126.00 98%
Assembling 242.87 242.87 6.20 100%
Sheathing 333.98 333.98 0.00 100%
Packaging 247.93 247.92 0.00 100%
RG-6 Km Sheathing 17.50 17.50 0.00 100%
Packaging 100.00 100.00 0.00 100%
Drop Wire Km
Drawing 2542.30 2392.30 150.00 94%
Insulation 879.77 841.77 37.00 96%
Packaging 779.22 706.22 3.00 91%
Fiber optic Km
loading stage 10339.95 9573.95 0.00 93%
buffering stage 1418.20 1375.71 0.00 97%
SZ stage 448.77 443.63 4.15 99%
Inner sheathing 94.38 94.39 0.00 100%
outer sheathing 454.95 447.71 6.20 98%
Conduit 16 mm Pcs Insulation 518.16 443.17 75.00 86%
Total (Km) 14325.81 11649.57 497.43 81.32%
Man Power
Labor Productivity
Production and Quality Report
Month December 2019 Total
Product Type Unit Process Tested
Qty (Km)
Pass
(Km)
Fail
(Km
Performance
%
Root Cause
for Fail
CAT-6 Km
Insulation 4974.30 4684.70 287.60 94%
Extruder
Cleaning
Lack Of Semi-
Finished
Material
Lack Of
Machine
Operators
Machine
Mechanical
Failure
Pairing 818.80 746.90 75.60 91%
Assembling 279.52 273.42 12.40 98%
Sheathing 302.74 278.34 24.40 92%
Packaging 308.89 309.47 0.00 100%
Drop Wire Km
Drawing 2710.20 2510.20 200.00 93%
Insulation 1683.91 1659.83 25.20 99%
Packaging 1278.48 1273.23 5.25 100%
Fiber optic Km
loading stage 17271.48 15611.30 0.00 90%
buffering stage 3659.41 3556.26 0.00 97%
SZ stage 870.13 866.15 4.00 100%
Inner sheathing 30.80 30.80 0.00 100%
outer sheathing 732.61 728.37 6.20 99%
Conduit 16 mm Pcs Insulation 52.36 52.36 0.00 100%
Total (Km) 1941.12 1843.50 630.45 94.97%
Man Power
Labor Productivity

107
After ISO Implementation (Year 2020)
Production and Quality Report
Month April 2020 Total
Product Type Unit Process Tested
Qty (Km)
Pass
(Km)
Fail
(Km)
Performance
%
Root Cause
for Fail
CAT-6 Km
Insulation 6392.20 5892.20 500.00 92%
Copper
Quality
Problem
Raw Material
Quality
Problem
Power
Interruption
Pressure
Decrement/
Compressor
Problem
Extruder
Cleaning
Pairing 1200.00 735.20 377.10 61%
Assembling 533.21 465.71 93.00 87%
Sheathing 446.10 280.00 197.30 63%
Packaging 509.21 865.00 183.30 170%
RG-6 Km Drawing 10.00 10.00 0.00 100%
Drop Wire Km
Drawing 4173.80 3247.80 801.00 78%
Insulation 2375.86 1976.07 859.66 83%
Packaging 3593.62 4626.89 454.48 129%
Fiber optic Km
loading stage 26330.04 17569.97 7559.50 67%
buffering stage 4783.07 3082.60 1684.87 64%
SZ stage 1192.18 918.90 340.30 77%
Inner sheathing 141.87 92.31 59.56 65%
outer sheathing 987.37 638.95 423.43 65%
Total (Km) 19334.00 18198.87 3465.84 94.13%
Man Power
Labor Productivity
Production and Quality Report
Month December 2020 Total
Product Type Unit Process Tested
Qty (Km)
Pass
(Km)
Fail
(Km
Performance
%
Root Cause
for Fail
CAT-6 Km
Insulation 4462.80 3717.80 700.00 83%
Copper Quality
Problem
Raw Material
Quality
Problem
Change In
Product Type
Power
Interruption
Welding/Repair
Machine
Mechanical
Failure
Pairing 1232.70 965.20 74.90 78%
Assembling 552.69 541.29 6.20 98%
Sheathing 509.51 473.86 39.65 93%
Packaging 498.25 544.96 21.69 109%
RG-6 Km Packaging 50.00 50.00 0.00 100%
Drop Wire Km
Drawing 2783.80 2633.80 150.00 95%
Insulation 2322.02 2321.75 0.00 100%
Packaging 2553.48 2633.73 12.50 103%
Fiber optic Km
loading stage 23455.57 22458.59 0.00 96%
buffering stage 3008.11 2942.74 8.30 98%
SZ stage 865.86 867.87 0.00 100%
Inner sheathing 254.10 254.10 0.00 100%
outer sheathing 854.72 842.17 12.45 99%
Conduit 16 mm Pcs Insulation 27.82 27.82 0.00 100%
Total (Km) 1249.00 1158.62 1004.94 92.76%
Man Power
Labor Productivity
Copyright © 2022 FDOKUMEN