comparison of concrete properties - AAU Institutional Repository
Upload
khangminh22Category
view
0download
0
ANALYSES OF PHENOTYPIC AND MOLECULAR DIVERSITY, GENOTYPE
BY ENVIRONMENT INTERACTION AND FOOD-FEED TRAITS IN TEF
[ERAGROSTISTEF (ZUCC.) TROTTER]
A THESIS SUBMITTED TO
THE DEPARTMENT OF MICROBIAL, CELLULAR AND MOLECULAR
BIOLOGY
BY
HABTE JIFAR DABA
IN PARTIAL FULFILLMENT OF THE REQUIREMENTS FOR THE DEGREE
OF DOCTOR OF PHILOSOPHY IN BIOLOGY (APPLIED GENETICS)
ADDIS ABABA UNIVERSITY
ADDIS ABABA, ETHIOPIA
DECEMBER 2018

Dedidication
This thesis is dedicated to my father and grandmother who believed in the education of girls and
boys during those early days and to my beloved mother, Gebi Shure, a strong woman who stood
alone to raise and educate the whole family. In general, it is dedicated to those people with a
genuine and kind heart to support and guide others.

ii

Acknowledgements
First of all, I would like to thank the Almighty God, for His absolute protection and the
courage and patience He offered me to successfully accomplish my PhD study and research.
Next, I would like to express my sincere gratitude and appreciation to my supervisors: Dr.
Kifle Dagne, Dr. Kassahun Tesfaye, Dr. Kebebew Assefa and Dr. Zerihun Tadele, for their
guidance throughout my study. Dr. Kifle Dagne and Dr. Kassahun Tesfaye from Addis
Ababa University guided me all the way from initiation of the research proposal to final
write-up of this thesis. Besides, their visit to my field work at various locations in Ethiopia
and their comments and suggestions are highly appreciated. My co-spervisor, Lead
Scientist Dr. Kebebew Assefa, from the Ethiopian Institute of Agricultural Research (EIAR)
has shared me his lifelong knowledge and experiences to conduct my thesis research
without any difficulties. Hence, I deeply express my respect and appreciation to him. The
role of my co-supervisor Dr. Zerihun Tadele, Tef Improvement Project Team Leader at
University of Bern, Switzerland, is far beyond expectations. He facilitated a six-month
fellowship opportunity to conduct my molecular study in his laboratory by covering from
his project all costs related to my travel, laboratory and living expenses in Switzerland.
Despite the various responsibilities he has at his home institute, he was assisting and
guiding my laboratory research in Switzerland and field research in Ethiopia. Hence, he
deserves special appreciation for his intelligent mind as well as a genuine and kind heart to
support his students.

ii
The inspiration of my academic achievement, a move from a little boy to a PhD holder,
was first conceived when my father and grandmother placed me at Algae Elementary
School in Illu Ababora zone, Ethiopia. My grandmother was an elite woman believing in
the education of girls and boys. She brought my elder sisters and me to school when even
most males in rural Ethiopian do not get such a chance. My parents nurtured and educated
me with affection and love without being educated by their family. Sadly, they were not
fortunate enough to live a little longer to see their ambitions being realized with the
eventual success of their son. I would, therefore, wish to dedicate this thesis to their
immortal love and memories which always reside deep in my heart.
My heartfelt thanks are to my dear wife, Gebaynesh Negash, for her love, encouragement,
inspiration and perfectly shouldering all responsibilities during the entire period of my
study. My beloved son Kennaol and my little daughter Eliyana have always been the pillars
of my life and the spines of my courage. My deepest gratitude and appreciation should also
go to my beloved mother, Gebi Shure, a strong woman who stood alone to raise me and
my six brothers and sisters. She has been through many difficulties to grow and educate us
without significant support from others. My brothers (Terefe and Tesfaye) and sisters
(Tirunesh, Chaltu, Aregash and Shitaye) have all played their role to lift me up to this level.
Next to my supervisors and families, I would also like extend my sincere respect and
gratitude to all individuals who contributed to my education that led me to a mature
professional level. Among others, Workineh Nura (my elementary teacher), Ato Mekonnen
Negeri, Ato Mengistu Worku and his wife w/ro Sinknesh Tefera, the late Ato Tesema

iii
Yeneneh; my high school teachers (Yared Kebede, Dr. Assefa Abegaz, Markos Alem and
Zemichael Abera); my former colleagues at Bako research center (Dr. Diriba Geleti, Dr.
Firdissa Eticha, Dr. Girma Abera, Dr. Tolera Abera and Mr. Zewude Kelkay) had kindly
devoted their precious time and resources to assist my study at various levels.
This PhD study was sponsored by Syngenta Foundation for Sustainable Agriculture and
the University of Bern through its cooperation with Ethiopian Institute of Agricultural
Research (EIAR). Besides, International Livestock Research Institute (ILRI) has covered
the laboratory cost for analysis of feed quality traits. EIAR has granted me astudy leave
with full salary whileAddis Ababa University offered me a studentship and various
supports. Holetta and Debre Zeit Agricultural Research Centersprovided me with immense
material, financial and technical supports. The germplasm used for this PhD work were
obtained from the Ethiopian Biodiversity Institute (EBI), University of Bern and National
Tef Research Project at Debre Zeit Agricultural Research Center (DZARC). Hence, I
would like to acknowledge them all for their kind cooperation and support.
All researchers and technicians on tef breeding, especially, Woynishet, Adane, Desta,
Kitaw and Negus from Holetta; Negussu, Worku, Kidist, Mengistu and Girma from Debre
Zeit; Belay from Alem Tena sub center; Atinkut, Gedefa and Sewagegne from Adet; Kidu,
Alemat and Miruts from Axum, and Merera, Kassahun and Girma from Bako research
centers are highly and duly acknowledged. My deepest gratitude also goes to Dr. Solomon
Chanyalew (Director of DZARC) and his entire staff for allowing me to use their vehicles
and field facilities during my field studies at Debre Zeit and Alem Tena. My heartfelt

iv
thanks are also to staff members of the University of Bern; especially, Miss. Regula and
Miss. Annette for kindly assisting and guiding my laboratory study, and Dr. Ginna, the
Bioinformatician in tef project, for her kind guidance in selecting primers for the molecular
study. I am also grateful to Dr. Michael, Head of the ILRI feeds and nutrition laboratory in
Addis Ababa, for allowing me his laboratory to analyze my feed samples free of charge. It
was due to Dr. Alemayehu Teressa that I can get Dr. Michael and hence, thank you very
much Alex. I would also like to thank Mr. Yonas, Mr. Degusew and Mr. Alemeshet, who
kindly assisted me even beyond their normal working times during sample preparation,
NIRS scanning and wet chemistry analysis. Thus, it was due to their genuine assistance
that I have been able to finish the entire laboratory activities within two months.
My special gratitude is to Dr. Zerihun’s family (his wife Haymanot and children Biya and
Beka) for hosting me and making my stay in Switzerland more enjoyable and memorable.
Finally, I would also like to thank my friends, PhD students and colleagues who have
assisted me in one way or the other to accomplish my study and research at various levels.
Among others, my sister W/ro Abebaye Gezahegn; my colleagues: Dr. Temesgen
Dessalegn, Dr. Berhane Lakew, Wondimu Fekadu, Fikadu Amsalu, Thomas Tsige, Atsede
Solomon and Bezaye Gorfu from Holetta, Dagnachew Bekele and Wasihun Legesse from
Debre Zeit, Tolera Kenno from Bako, Elzabeth Basilos, Abebe Kirub and Etagegn from
EIAR head office, my PhD fellows (Dr. Fikadu Gadissa & Agegnehu Wasssie) from Addis
Ababa University and Terefe Fita from International maize and wheat improvement center
(CIMMYT) are highly acknowledged.

v
Table of Contents
TABLE OF CONTENTS ................................................................................................................................ V
LIST OF TABLES ......................................................................................................................................... X
LIST OF FIGURES ..................................................................................................................................... XII
LIST OF APPENDICES ............................................................................................................................... XV
LISTS OF ACRONYMS AND ABBREVIATIONS .......................................................................................... XVI
ABSTRACT ........................................................................................................................................... XVIII
CHAPTER 1. GENERAL INTRODUCTION ................................................................................................. 1
BACKGROUND AND JUSTIFICATION ............................................................................................................. 1
OBJECTIVES ....................................................................................................................................... 6
General Objective: ...................................................................................................................... 6
Specific objectives: ...................................................................................................................... 6
CHAPTER 2. LITERATURE REVIEW ........................................................................................................ 8
DESCRIPTION OF THE TEF CROP ................................................................................................................. 8
ORIGIN AND DOMESTICATION OF TEF ......................................................................................................... 9
THE ROLE OF TEF IN ETHIOPIAN FARMING SYSTEM ....................................................................................... 10
Agronomic role of tef ................................................................................................................. 10
The utilization of tef ................................................................................................................... 11
2.3.2.1 Nutritional content of tef .................................................................................................................. 11
2.3.2.2 The nutritional importance of tef ...................................................................................................... 12
CONSTRAINTS OF TEF PRODUCTION .......................................................................................................... 12
EFFORTS AND SUCCESSIN TEF IMPROVEMENT ............................................................................................. 13
Collection and conservation of tef germplasm resources .......................................................... 13
Genetic Characterization ........................................................................................................... 14
2.5.2.1 Morphological and chemical characterization of tef ......................................................................... 15
2.5.2.2 Molecular characterization of tef ...................................................................................................... 16
2.5.2.3 Establishing core collection ............................................................................................................... 17
Development of tef varieties ...................................................................................................... 18
Success in tef breeding ............................................................................................................... 19
GENOTYPE BY ENVIRONMENT INTERACTIONS ............................................................................................. 20
Assessing the suitability of environments .................................................................................. 20
Description of tools used to explain GEI .................................................................................... 21
FOOD–FEED TRAITS .............................................................................................................................. 22
Food Value study in tef .............................................................................................................. 22

vi
Feed value study in tef ............................................................................................................... 22
CHAPTER 3. AGRO-MORPHOLOGICAL TRAITS DIVERSITY IN TEF [ERAGROSTIS TEF (ZUCC.) TROTTER]
GENOTYPES FROM VARIOUS GENETIC AND ECO-GEOGRAPHIC ORIGINS .......................... 25
INTRODUCTION .................................................................................................................................... 26
MATERIALS AND METHODS .................................................................................................................... 27
Plant materials ........................................................................................................................... 27
Description of study sites and design ......................................................................................... 31
Data collection ........................................................................................................................... 32
3.2.3.1 Qualitative Data ................................................................................................................................ 32
3.2.3.2 Quantitative traits data ..................................................................................................................... 33
Statistical analysis of phenotypic traits ..................................................................................... 35
Broad-sense heritability and genetic gains from selection ........................................................ 36
RESULTS .......................................................................................................................................... 38
Qualitative traits diversity ......................................................................................................... 38
3.3.1.1 Seed colour distribution by origin ..................................................................................................... 40
3.3.1.2 Panicle form distribution by origin .................................................................................................... 40
3.3.1.3 Lemma colour distribution by origin ................................................................................................. 42
3.3.1.4 Basal stalk colour distribution by origin ............................................................................................ 43
Quantitative Traits Diversity ...................................................................................................... 45
3.3.2.1 Analysis of Variance........................................................................................................................... 45
3.3.2.2 Patterns of quantitative traits variation in tef ................................................................................... 47
3.3.2.3 Principal component analysis ............................................................................................................ 51
3.3.2.4 Cluster Analysis ................................................................................................................................. 56
3.3.2.5 Estimates of variance components, heritability and genetic advance .............................................. 70
3.3.2.6 Association among major traits of tef genotypes.............................................................................. 73
DISCUSSION ........................................................................................................................................ 76
Qualitative traits diversity ......................................................................................................... 76
Variation in quantitative traits of tef ......................................................................................... 77
Principal component analysis .................................................................................................... 78
Cluster Analysis .......................................................................................................................... 79
Estimates of variance components, heritability (H2) and genetic advance ............................... 80
Association among major traits of tef ....................................................................................... 81
CHAPTER 4. GENETIC DIVERSITY AND POPULATION STRUCTURE ANALYSES IN TEF [ERAGROSTIS TEF
(ZUCC.) TROTTER] GENOTYPES USINGMICROSATELLITE MARKERS .................................. 83
INTRODUCTION .................................................................................................................................... 84
MATERIALS AND METHODS .................................................................................................................... 85

vii
Plant materials and DNA extraction .......................................................................................... 85
SSR marker selection .................................................................................................................. 86
PCR amplification using fluorescently labeled primers .............................................................. 86
SSR study at Sci-Corp laboratory ................................................................................................ 87
SSR data analysis ....................................................................................................................... 88
Establishing non-redundant core collection and construction of dendrogram .......................... 90
RESULTS .......................................................................................................................................... 91
SSR markers and its use for tef genetic diversity ....................................................................... 91
Tef populations diversity ............................................................................................................ 92
Population differentiation and gene flow .................................................................................. 93
Patterns of genetic diversity and population structure ............................................................. 97
Patterns of genetic diversity and clustering among individual genotypes .............................. 100
Establishing core collections .................................................................................................... 101
DISCUSSIONS ..................................................................................................................................... 106
SSR markers and its use in tef genetic diversity ....................................................................... 106
Tef populations diversity .......................................................................................................... 107
Population differentiation and gene flow ................................................................................ 109
Patterns of genetic diversity and population structure ........................................................... 110
Construction of core collections ............................................................................................... 111
CHAPTER 5. GENOTYPE BY ENVIRONMENT INTERACTION IN MAJOR QUANTITATIVE TRAITS AND
YIELD STABILITY OF TEF .................................................................................................... 112
INTRODUCTION .................................................................................................................................. 113
MATERIALS AND METHODS .................................................................................................................. 114
Plant materials ......................................................................................................................... 114
Description of the study environment ...................................................................................... 114
Experimental Design and other practices ................................................................................ 116
STATISTICAL ANALYSIS FOR PHENOTYPIC TRAITS ........................................................................................ 117
RESULTS ........................................................................................................................................ 118
Analysis of variance ................................................................................................................. 118
AMMI analysisof variance for grain yield ................................................................................ 120
5.4.2.1 Mean grain yieldand stability .......................................................................................................... 121
5.4.2.2 AMMI stability value (ASV) .............................................................................................................. 123
5.4.2.3 Analysis based on Eberhart and Russell Regression Model ............................................................. 123
Analysis of GGE biplot .............................................................................................................. 127
5.4.3.1 Genotype performance and mega environment determination ..................................................... 127

viii
5.4.3.2 Relationship among environments ................................................................................................. 128
5.4.3.3 Discriminativeness vs representativeness ....................................................................................... 130
5.4.3.4 Genotypes mean yield and their stability ........................................................................................ 131
5.4.3.5 Ranking genotypes based on ideal environment ............................................................................ 133
5.4.3.6 Ranking genotypes relative to the ideal genotypes ........................................................................ 134
Association of traits ................................................................................................................. 135
5.4.4.1 Cluster Analysis ............................................................................................................................... 137
Principal component analysis .................................................................................................. 140
DISCUSSION ...................................................................................................................................... 142
Analysis of variance ................................................................................................................. 142
AMMI Analysis ......................................................................................................................... 142
Analysis of GGE Biplot .............................................................................................................. 143
Cluster Analysis ........................................................................................................................ 147
Pricipal Component Analysis .................................................................................................... 147
CHAPTER 6. VARIABILITY AND ASSOCIATION OF FOOD-FEED TRAITS IN TEF [ERAGROSTIS TEF (ZUCC.)
TROTTER] VARIETIES ........................................................................................................ 148
INTRODUCTION .................................................................................................................................. 149
MATERIALS AND METHODS .................................................................................................................. 150
Field Study................................................................................................................................ 150
Laboratory Study ..................................................................................................................... 150
6.2.2.1 Analysis of feed quality using NIRS .................................................................................................. 151
6.2.2.2 Wet Chemistry Analysis ................................................................................................................... 151
6.2.2.3 Developing the tef straw equation .................................................................................................. 152
ANALYSIS OF VARIANCE ....................................................................................................................... 152
RESULTS ........................................................................................................................................ 153
Variation in major food-feed traits of tef ................................................................................ 153
Heritability of food-feed traits in Tef ....................................................................................... 158
Association of food-feed traits of tef ....................................................................................... 158
Scatterplot showing the relationships among food-feed traits of tef genotypes .................... 160
Distribution of traits and genotypes across PC1 and PC2 ........................................................ 164
Economic return of growing tef varieties from various groups ............................................... 166
Near Infrared Reflectance Spectroscopy (NIRS) for determination of feed quality
parameters….. .......................................................................................................................... 169
DISCUSSIONS ..................................................................................................................................... 175
CHAPTER 7. SUMMARY, CONCLUSIONS AND RECOMMENDATIONS ................................................. 179
SUMMARY ........................................................................................................................................ 179

ix
CONCLUSIONS ................................................................................................................................... 182
RECOMMENDATIONS .......................................................................................................................... 183
REFERENCES ......................................................................................................................................... 186
APPENDICES ......................................................................................................................................... 210
BIOGRAPHY OF THE AUTHOR ............................................................................................................... 219

x
List of Tables Table 1. Description of the tef genotypes used in the present study ................................ 29
Table 2. Phenotypic classes of the qualitative characters used for diversity study .......... 33
Table 3. Summary of the analysis of variance model ...................................................... 37
Table 4. Variation in qualitative traits of tef genotypes evaluated at two locations
in 2015 .................................................................................................................. 39
Table 5. Seed color distribution of 188tef genotypes from various origins ..................... 41
Table 6. Panicle form distribution of 188tef genotypes from various origins ................. 42
Table 7.Lemma colour distribution of 188 tef genotypes from various origins. ............. 43
Table 8. Basal stalk colour distribution of 189 tef genotypes from various origins ........ 44
Table 9. Distribution of Lemma colour by altitude .......................................................... 45
Table 10. Combined ANOVA across two locations for 16 traits of 188 tef genotypes ... 46
Table 11. Range, mean and Standard error (SE) of mean for 13 different traits of tef .... 49
Table 12. Range, mean and standard error (SE) of mean for 13 different traits of tef .... 50
Table 13. Range, mean and standard error (SE) of mean for 13 traits of tef genotypes .. 51
Table 14. Principal component analysis for 12 quantitative traits of 188tef genotypes .. 52
Table 15. Principal component analysis of 12 traits of tef genotypes based on 14 origins
........................................................................................................................................... 54
Table 16. Principal component analysis for 12 traits of tef based on four altitudinal ..... 55
Table 17. Clustering of 188 tef genotypes into six clusters using mean of 12 morpho- .. 58
Table 18. Cluster means of 12 quantitative traits of 188 tef genotypes ........................... 60
Table 19.Distance among six clusters of 188 tef genotypes ............................................ 61
Table 20. Distance among four clusters of 188 tef genotypes ......................................... 63
Table 21. Estimates of variance components, heritability and genetic advance for 188
tef genotypes evaluated at two locations .............................................................. 72
Table 22. Genotypic (upper) and Phenotypic (lower) correlation among 12 traits of
188 tef genotypes evaluated at Holetta and ........................................................... 75
Table 23. Characteristics of selected SSR markers developed for Eragrostis tef ............ 89
Table 24.Genetic diversity parameters of 189 tef genotypes assessed based on16 SSR . 92
Table 25. Summary of genetic diversity parameters obtained for 14 populations of tef . 93
Table 26. AMOVA showing variation among populations, among individuals within .. 94

xi
Table 27. Summary of F-Statistics and estimates of gene flow (Nm) over all populations
........................................................................................................................................... 95
Table 28. Pair-wise Nei’s Unbiased Genetic Distance (above diagonal) and genetic
differentiation (FST) (below diagonal) ................................................................ 96
Table 29. Description of the tef genotypes proposed to construct a none redundant core
......................................................................................................................................... 104
Table 30. Description of the tef varieties considered for GXE interaction studies ........ 115
Table 31. Description of the test environments* ............................................................ 116
Table 32. Analysis of variance for major quantitative traits of tef varieties evaluated
at nine environments ......................................................................................... 119
Table 33. AMMI analysis of variance for grain yield (tha-1) of 35 tef genotypes
grown at nine environments ................................................................................ 121
Table 34. Mean grain yield (t/ha) of tef varieties evaluated at nine environments in .... 126
Table 35. Genotypic (lower diagonal) and Phenotypic (upper diagonal) association of
major quantitative traits in 35 tef varieties ....................................................... 136
Table 36. Distance between Cluster Centroid ................................................................ 139
Table 37. Means for 12 different traits of 35 released tef varieties grouped into seven 140
Table 38. Eigenvectors and values of the first three principal components for 35
released tef varieties ............................................................................................. 141
Table 39. Simple descriptive statistics for major feed quality traits at Debre Zeit and . 155
Table 40. Combined ANOVA across two locations and two years ............................... 156
Table 41.Variation in major food-feed traits of tef across different locations and years157
Table 42. Heritability (%) of major food-feed traits of tef............................................. 158
Table 43. Correlation between major food-feed traits of tef data across locations and . 159
Table 44. Correlation between locations for all parameters of tef (the middle diagonal)
......................................................................................................................................... 159
Table 45.Analysis of the economic benefits of producing tef with various traits(ha) ... 167
Table 46. Combined mean of major food-feed traits for 36 tef varieties evaluated at ... 168
Table 47. NIRS calibration statistics for tef straw feed quality parameters on dry
weight basis ....................................................................................................... 170
Table 48. SECV/SD ratio ............................................................................................... 171
xii
List of Figures Figure 1. Area, production, productivity and number of farmers involved in the ............. 3
Figure 2. Map of Ethiopia and collectionWoredas of the 144 tef germplasm lines
(based zones .......................................................................................................... 31
Figure 3. One hundred and eightyeight tef genotypes grown at Holetta Agric.
Research ................................................................................................................ 38
Figure 4. Dendrogram showing the genetic relationship among 188 tef genotypes ........ 59
Figure 5. Distribution of 12 traits of 188 tef genotypes across PC1 and PC2 ................... 60
Figure 6. Clustering pattern of the 14 populations based on origins ............................... 62
Figure 7. Biplot showing the distribution of 14 populations based on genetic and eco-
geographic origins ................................................................................................. 63
Figure 8. Biplot showing the distribution of 12 traits of the 14 populations across
PC1 & PC2 ............................................................................................................ 64
Figure 9. Clustering pattern of 12 zones of collection based on the variation in 12
major traits ............................................................................................................ 65
Figure 10. Biplot showing the distribution of 12 zones of tef germplasm collections .... 66
Figure 11. Biplot showing the distribution of 12 traits of the 12 collection zones on
PC1 & PC2 ............................................................................................................. 66
Figure 12. Dendrogram based on complete linkage Euclidean distance showing ........... 67
Figure 13. Biplot showing the distribution of four altitudes of tef germplasm
collections ............................................................................................................ 68
Figure 14. Biplot showing distribution of 12 traits of tef from four altitudes of
collection .............................................................................................................. 68
Figure 15. Dendrogram based on complete linkage Euclidean distance showing ........... 69
Figure 16. Clustering pattern of 12 major traits of tef based on collections of 72
woredas ................................................................................................................ 70
Figure 17. Dendrogram showing the relationship among14 populations of tef from ...... 98
Figure 18. Delta K showing the best K (a) and structure bar-plot (b) of tef genotypes... 99
Figure 19. Dendrogram based on Unweighted Pair Group Method with

xiii
Arithmetic Mean ................................................................................................ 101
Figure 20. Proportion of core collection to entire studied genotypes and contributions
of the various populations to the core collections .............................................. 103
Figure 21. Dendrogram showing the clustering pattern of genotypes in the core ......... 105
Figure 22. The performance of tef genotypes at Holetta Agric. Research Center
(October 2015, Photo: Zerihun Tadele .............................................................. 120
Figure 23. Plot showing environment focused mean grain yield versus IPCA-1 score. 122
Figure 24. Interaction of mean grain yield performance of 35 tef genotypes
evaluated at nine environments .......................................................................... 122
Figure 25. Plot showing genotypes mean grain yield (t/ha) versus IPCA1 (a), versus . 125
Figure 26. Polygon view of the GGE biplot showing “which-won-where” .................. 128
Figure 27. GGE biplot showing the relationship among test environments .................. 130
Figure 28. Discriminativeness vs Representativeness ................................................... 131
Figure 29. Ranking biplot based on mean yield performance and stability of the ........ 132
Figure 30. Ranking the performance of different genotypes relative to the best ........... 133
Figure 31. Ranking Environments based on the performance of an ideal
Genotype (‘G6’) ........................................................................................... 134
Figure 32.Dendrogram based on complete linkage Euclidean distance showing the .... 138
Figure 33. A biplot graph showing the distribution of the studied tef varieties using
the first two PCs ................................................................................................. 139
Figure 34. Scree plot showing the Eigen value for each component number ................ 141
Figure 35a-h. Scatter plots showing the the distributution of genotypes evaluated
for food-feed traits .............................................................................................. 160
Figure 36. Distribution of major food-feed traits of tef across PC1 and PC2 ................. 164
Figure 37. Distribution of 36 tef varieties evaluated for major food-feed traits
across PC1 & PC2 ................................................................................................ 165
Figure 38. Relationship between chemical analysis and NIRS results for CP %
from tef straw ..................................................................................................... 172
Figure 39. Relationship between chemical analysis and NIRS results for Ash%
from tef straw ..................................................................................................... 172
Figure 40. Relationship between chemical analysis and NIRS results for OM %

xiv
from tef straw .................................................................................................... 173
Figure 41. Relationship between chemical analysis and NIRS results for ADF %
from tef straw ..................................................................................................... 173
Figure 42. Relationship between chemical analysis and NIRS results for ADL %
from tef straw ..................................................................................................... 174
Figure 43. Relationship between chemical analysis and NIRS results for IVOMD %
from tef straw ..................................................................................................... 174

xv
List of Appendices
Appendix Table 1. Regional, zonal and altitudinal distribution of the studied tef........ 210
Appendix Table 2. Distribution of studied tef germplasm by regions, zones ............... 211
Appendix Table 3. Private allelic richness per locus & populations for 189 tef
genotypes from various sources .................................................................... 212
Appendix Table 4. Allelic frequency of each marker for 189 tef genotypes from
various sources .............................................................................................. 213
Appendix Figure 1. Distribution of 188 tef genotypes across the first two PCs ........... 215
Appendix Figure 2. Biplot showing distribution of 72 Woredas of tef germplasm
collection on PC1& PC2 ................................................................................ 216
Appendix Figure 3. Partial view of LI-COR gel electrophoretic bands of DNA
from 189 tef genotypes as revealed by polymorphic SSR ............................. 217
Appendix Figure 4. CP%, ME (MJ/Kg) and IVOMD (%) of tef straw from 36
genotypes evaluated at two locations for two years ...................................... 218
Appendix Figure 5. NDF, ADF, ADL and DM% of tef straw from 36 genotypes
evaluated at two locations for two years ....................................................... 218

xvi
Lists of Acronyms and Abbreviations AARC Adet Agricultural Research Center
AAU Addis Ababa University
ADF Acid detergent fiber
ADL Acid detergent lignin
AEA Average Environment Axis
AFLP Amplified fragment length polymorphism
AMMI Additive Main effect and Multiplicative Interaction
AMOVA Analysis of molecular variance
ANOVA Analysis of variance
BARC Bako Agricultural Research Center
CA Cluster analysis
CLUMPAK Cluster Markov Package Across K
CSA Central Statistics Agency
CTAB Cetyl tri-ethyl ammonium bromide
CV Coefficient of variation
EDTA Ethylene diamine tetra acetic acid
DAP Diammonium phosphate DAP
DF Degrees of freedom
DZARC Debre Zeit Agricultural Research Center
EIAR Ethiopian Institute of Agricultural Research
EBI Ethiopian Biodiversity Institute
GA Genetic advance
GCV Genotypic Coefficient of Variation
GEI Genotype by environment interaction
GGE Genotype and genotype by environment interaction
HARC Holetta Agricultural Research Center
ICRISAT International Crops Research Institute for the Semi-Arid Tropics
IPCA Interaction Principal Component Axes
ISSR Inter Simple Sequence Repeat
LSD Least Significant Difference
MCMC Markov Chain Monte Carlo
MSE Mean square of error

xvii
NJ Neighbor Joining
PAGE Polyacrylamide gel electrophoresis
PCA Principal Component Axis
PCV Phenotypic Coefficient of variation
PIC Polymorphic Information Content
RAPD Random amplified polymorphic DNA
RCBD randomized complete block design
RFLP Restriction fragment length polymorphism
RILs Recombinant inbred lines
SAS Statistical Analysis System
SE standard error of mean
SSR Simple sequence repeat
TBE Tris/Borate/EDTA
TE Tris EDTA
TEMED Tetramethylenediamine

xviii
Abstract Analyses of Phenotypic and Molecular Diversity, Genotype by Environment
Interaction and Food-feed Traits in Tef [Eragrostistef (Zucc.) Trotter]
Habte Jifar Daba
Addis Ababa University, 2018
Tef [Eragrostis tef (Zucc.) Trotter] is an indigenous major cereal crop widely grown and
utilized in Ethiopia. It is an excellent source of healthy and nutritious human food and
livestock feed. However, its productivity is significantly lower than that of major cereals
grown in Ethiopia. Although diverse constraints contribute for its inferior grain yield, the
huge diversity present in tef germplasm has not been exploited. This study was, therefore,
conducted to assess the phenotypic and molecular diversity, genotype by environment
interactions and variation of food-feed traits in tef genotypes from various sources. The
field experiments were conducted at Holetta, Debre Zeit, Alem Tena, Adet, Axum and
Shambu using randomized complete block design with three replications whereas, the
laboratory analyses were conducted at the University of Bern in Switzerland, Sci-Co in
South Africa, International Livestock Research Institute (ILRI) in Ethiopia and
International Crops Research Institute for Semi-Arid Tropics (ICRISAT) in India.
Phenotypic diversity was assessed based on 12 quantitative and five qualitative traits of
188 tef genotypes while, the genotyping study was conducted using 189 genotypes with 16
SSR markers. Results from phenotypic study revealed the existence of huge variability in
plant height (60.7 to 107.1 cm), panicle length (19.5 to 39.5 cm), number of fertile tillers
per plant (2.1 to 5.5), number of spikelets per panicle (156.7 to 441.7), thousand kernel
weight (20.7 to 33.0 mg), grain yield (3.7 to 7.3 t/ha) and lodging index (44.7 to 79.3%).
Molecular diversity study generated a total of 260 alleles for the total studied loci. Cluster
and STRUCTURE analyses showed four gene pools, but with high level of admixtures due

xix
to geographic proximity and/or trans human seed exchange. Analysis of molecular variance
showed significant variation of 56.6% within individuals, 40.8% among individuals within
population and 2.6% among populations. Based on SSR study, furthermore, a core
collection composed of 64 genotypes (33.9%) is suffice to capture the entire alleles of
studied genotypes. Significant variations were also detected for all traits due to genotypes,
environments and their interaction. Based on AMMI, GGE and Eberhart Russell’s model,
G6 (Melko) was identified as the highest yielding and moderately stable variety while, E5
(Debre Zeit-1) was the highest yielding and ideal environment. GGE biplot grouped the
test environments into four mega environments and the studied genotypes into seven
groups. Analysis of food-feed traits revealed significant (P<0.01) effect of genotypes, year,
locations and their interactions. Based on this, the highest mean crude protein (CP), in vitro
organic matter digestibility (IVOMD), metabolic energy (ME), total biomass (TBM) and
straw yield (STY), and the lowest mean for neutral detergent fiber (NDF), acid detergent
fiber (ADF) and acid detergent lignin (ADL) were obtained from genotypes evaluated at
Debre Zeit. Cluster analysis and PCA-biplot grouped the genotypes into four. These are,
(i) those with improved feed quality traits such as Kena, Genet and Ambo Toke;(ii)) those
with high food-feed traits such as Dukem, Gimbichu and Dega Tef; (iii) those with dual
purpose such as Melko, Koye and Key Tena; and (iv) those with low food-feed traits such
as Simada, Etsub and Mechare. The overall results of the present study enabled to identify
tef genotypes with sufficient morpho-agronomic and molecular variations, better yield and
stability, and food-feed traits having implications for collection, conservation and proper
utilization of germplasm which are the basis of tef improvement.
Key words: Allelic richness, Eragrostis tef, genetic diversity, genotypes, phenotypic
diversity, population structure, simple sequence repeats, tef
1
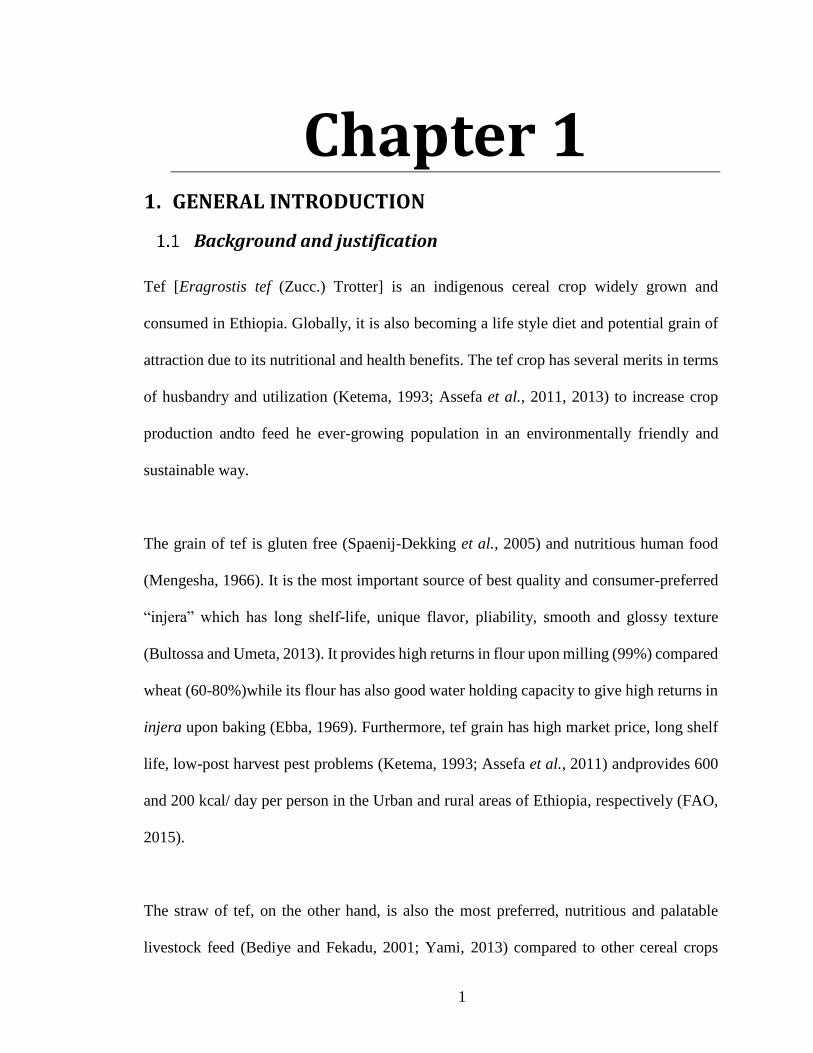
Chapter 1 1. GENERAL INTRODUCTION
Background and justification
Tef [Eragrostis tef (Zucc.) Trotter] is an indigenous cereal crop widely grown and
consumed in Ethiopia. Globally, it is also becoming a life style diet and potential grain of
attraction due to its nutritional and health benefits. The tef crop has several merits in terms
of husbandry and utilization (Ketema, 1993; Assefa et al., 2011, 2013) to increase crop
production andto feed he ever-growing population in an environmentally friendly and
sustainable way.
The grain of tef is gluten free (Spaenij-Dekking et al., 2005) and nutritious human food
(Mengesha, 1966). It is the most important source of best quality and consumer-preferred
“injera” which has long shelf-life, unique flavor, pliability, smooth and glossy texture
(Bultossa and Umeta, 2013). It provides high returns in flour upon milling (99%) compared
wheat (60-80%)while its flour has also good water holding capacity to give high returns in
injera upon baking (Ebba, 1969). Furthermore, tef grain has high market price, long shelf
life, low-post harvest pest problems (Ketema, 1993; Assefa et al., 2011) andprovides 600
and 200 kcal/ day per person in the Urban and rural areas of Ethiopia, respectively (FAO,
2015).
The straw of tef, on the other hand, is also the most preferred, nutritious and palatable
livestock feed (Bediye and Fekadu, 2001; Yami, 2013) compared to other cereal crops

2
grown in Ethiopia (Bediye et al., 1996; Yami, 2013). Besides, it is also useful as a binder
of mud for plastering walls of local houses. Hence, both the grain and straw of tef generate
high income for farmers in the major tef production areas of Ethiopia who do not have
alternative cash crops like coffee, tea or cotton (FAO, 2015).
.
In Ethiopia, cereals contribute for 81.3% of the total area and 87.4% of the total production
of grain crops (CSA, 2014 ; CSA, 2017). Tef is one of the major cereals in terms of area
and volume of production among grain crops. Amongcereals, tef, maize, sorghum and
wheat are annually cultivated on29.5%, 20.9%, 18.4% and 16.6% of the total area under
cerealcrops (Fig. 1) indicating their large-scale coverage in the country. Regarding the total
production, the contribution of the same cereals in the same order to the total cereal grain
production is 19.8%, 31%, 18.7% and 17.9%, respectively. This shows thattef stands first
in the total area and second to maize in the total grain production and the number of
households involved in its production while, it ranked last in terms ofproductivity among
major cereals grown in Ethiopia (CSA, 2014 ; CSA, 2017) (Figure 1). Thus, despite its
large-scale cultivation and its preferraces by both growers and consumers, its national
average the productivity is the lowest and is only about 1.66tons per hectare (CSA, 2017).
Nevertheless, it is possible to get over4.5 tons of grain per hectare by using improved
varieties (Dukem) and management practices under non-lodging condition (Tefera and
Ketema, 2001). Such low productivity of tef at national level is mainly resulting due to
lodging, drought and different biotic stresses (Assefa et al., 2011; Assefa et al., 2015).
Hence, a lot is expected from tef breeders and all stakeholders to improve the productivity
and minimize the yield gap with other major cereals.

3
Figure 1.Area, production, productivity and number of farmers involved in the
production of major cereal crops in Ethiopia (CSA, 2017).
Despite the various research efforts to increase production and productivity, there are still
many gaps in tef breeding that require further research and investigation. Thus, the
morphological, molecular and biochemical markers based genetic diversity studies
conducted ontef germplasm was not as suchexhaustive. The Ethiopian Biodiversity
Institute (EBI) was reported tomhold 5169 tef accessions in its gene bank (Tessema, 2013).
Of the total accession in theEBI gene‐bank, 3315 were collected directly by EBI, while the
remaining 1854 accessionswere acquired through donations and repatriations (Assefa et al.,
2017). More than half of the total accessions atEBI have not yet been characterized
(Tessema, 2013) and some of those characterized were found to be redundant (Chanyalew
et al., 2013). Besides, the extent and pattern of genetic diversity in existinggermplasm have
not yet been exhaustively studied. Based on these constraints, the need for detailed
3.0
2
5.0
2
1.6
6
7.0
0
2.1
4
7.8
7
3.6
8
10
.86
1.8
8
4.7
5
2.5
3
5.9
9
1.7
0
4.5
4
2.6
7
5.0
0
0
2
4
6
8
10
12
Area (mio ha) Production (mio t) Yield (t/ha) No farmers (mio)
Tef Maize Sorghum Wheat

4
characterization of tef germplasm and the importance of establishing non-redundant
working core germplasm were suggested (Chanyalew et al., 2013). The EBI tefaccessions
collected from diverse growing regions in Ethiopiais expected toharborgenotypeswith
beneficial agronomic and nutritional traits for the improvement of tef crop. Hence,
assessing the extent and pattern of genetic diversity among genotypes from various genetic
and eco-geographic origins using a combination of markers is very essential.
Tef grows under various altitudes, soil and climate as well as crop management conditions
whereby the same/or different genotypes may perform differently. Hence, the study of
genotype by environment (G x E) interaction is a vitalresearch area in crop breeding and
varietal development (Ketema, 1993). So far, limited studies have been made on G x E
interaction in tef (Kefyalew, 1999; Ashamo and Belay, 2012). The study of G x E enables
breeders to generate appropriate information on the magnitude and nature of G x E
interactions and to design a workable future tef breeding strategy. Hence, it has long been
suggested to conduct such study across the major tef growing areas of the country
(Kefyalew, 2001).
The mid and highland areas characterized to have a mixed farming system are the major
tef production environment in Ethiopia. In such system, the crop and livestock husbandry
are practiced under the same management unit whereby the livestock provides draught
power, cash and plant nutrition (manure) while crop residues are used as feed sources
forlivestock. As the contribution of natural pasture is declining due to continued increase
ofcrop farming into grazing lands, feed shortage is becoming a serious constraint (Tolera

5
et al., 1999). Hence, proper use of crop residue is a good strategical option to be
implemented. This is due to the fact that tef straw provides nearly half of the total annual
cereal straw in the central highland (Yami, 2013) and a quarter of the straw in the whole
country (Bediye et al., 1996). However, the quantity and quality of the grain and straw of
tefvary among varieties, and its growing climatic and soil conditions (Bediye et al., 1996;
Bediye and Dereje, 2001). So far, limited information is available on the straw quality of
released tef varities and the food-feed traits have not yet been investigated. The importance
of tef as food and feed, the critical decline in grazing land, and the fact that farmers started
to worry about crop residues and its grain require identification of tef genotypes with better
grain and straw yield and quality. Hence, assessing the feed quality traits and identification
of tef genotypes with high quality food-feed traits is essential in order to develop and
release new varieties that fulfill these criteria.

6
Objectives
General Objective:
To investigate the genetic diversity, genotype by environment interaction and food-
feed trait variation among tef genotypes from various genetic and eco-geographic
origins.
Specific objectives:
❖ To characterize the phenotypic diversity oftef genotypes from various
origins using morpho-agronomic traits;
❖ To assess the genetic diversity oftef genotypes and populations from various
origins and to establish a non-redundent core tef germplasm using
microsatellite (SSR) markers;
❖ To evaluate the extent of genotype by environment interactions, stability of
improved tef varieties across locations and to characterize the tef growing
environments.
❖ To assess and understand the association among food-feed traits of
improved tef varieties evaluated across locations and years;
Outline of the thesis
This PhD thesis is based on four research areas on tef: morphological, molecular, genotype
by environment interactions and food-feed traits analysis. There are seven chapters
including the general introduction (Chapter I), the literature review (Chapter II), the four
7
experimental chapters (Chapters III to VI) and the conclusion and recommendations
(Chapter VII). Thus,
In chapter III and IV, diversity among tef genotypes from various origins in the
country was assessed using morphological and molecular markers, respectively.
Chapter V deals with the assessment of genotype, environment and genotype by
environment interaction using 35 improved varieties evaluated at nine
representative tef growing environemts in the country.
Chapter VI assesses the performance of 36 tef genotypes across two years and two
locations for food and feed related traits.
Chapter VII deals with the overall conclusion and recommendations drawn based
on the results from various experiments conducted in this PhD study. It also
summarizes major findings from experiments described in Chapters III to VI and
provides recommendations as well as future directions in tef improvement.

8
Chapter 2
2. LITERATURE REVIEW
Description of the tef crop Tef is an allotetraploid specieswith chromosome number (2n =4x = 40) (Jones et al., 1978;
Ponti, 1978; Tavassoli, 1986) and is a cereal crop grown primarily in Ethiopia (Amanda
and Doyle, 2003). The genome size of tef ranges from 714 to 733 Mbp (Ayele et al., 1996)
and 648 to 926 Mbp (Hundera et al., 2000) based on different sets of cultivars suggesting
that it varies with cultivars. Gina et al (2014) also reported a draft genome containing 672
Mbp representing 87% of the genome size estimated from flow cytometry.
Morphologically, tef has fibrous root system, fine stem and many tillers. It is a C4, self-
pollinated chasmogamous annual cereal crop consisting of both the stamens and pistils in
the same floret (Ketema, 1997). Tef has a very minute seed size ranging from 0.9-1.7 mm
length and 0.7-1.0 mm diameter (Ebba, 1975) and the weight of its 100 to 150 grains is
equal to a grain of wheat (Saturni et al., 2010). According to Ketema (1997), tef spikelet
has 2-12 florets consisting of a lemma, palea, three stamens, an ovary and mostly two
feathery stigmas. The maturity periods of tef cultivars ranges from 60 to 180 days
depending on its growing environments (Ketema, 1997; Assefa et al., 2001; 2011; 2013).
Grain and lemma colour, panicle form and plant height as well as maturity period are the
main distinguishing features among various tef cultivars (Berhe et al., 1989; Tefera et al.,
1990, 1995; Ketema, 1997). Berhe et al. (1989) found that lemma and seed colour, and
panicle forms are inherited independently whereby parents with colored lemma can
9
produce white or red lemma and colored lemma can be produced in the absence of
coloration. Regarding dominance level, colored lemmas were reported to be dominant over
non-colored ones (Berhe et al., 1989). Furthermore, panicle form and maturity were
reported to be linked among tef landraces (Tefera et al., 1992) and thus, the late maturing
genotypes have compact panicles and larger plants whereas the early maturing ones have
very loose or open panicle forms. However, according to the same authors, seed and lemma
colour are not linked to panicle form revealing that the seed and lemma color is not
determined by the panicle form or vice versa.
Origin and domestication of tef The center of origin and diversity oftef crop is believed to be in Ethiopia (Vavilov, 1951).
The domestication of tef for human consumption was made by pre–Semitic inhabitants of
Ethiopia between 4000 and 1000 B.C. (Ketema, 1997; Tessema, 2013). Tef is the only
cultivated speciesin the genus Eragrostis which consists of 350 species (Tefera and Ketema,
2001; Tefera et al, 2003). The fact that 14 of the 54 Eragrostis species found in Ethiopiaare
endemic (Tefera and Ketema, 2001; Tefera et al., 2003) is strong evidence for Ethiopia to
be considered as a center of origin and diversity of tef. About 43%, 18%, 12%, 10%, 9%,
6% and 2% of the 350 Eragrostisspecies were reported to be originated in Africa, South
America, Asia, Australia, Central America, North America and Europe, respectively
(Costanza 1974; Ketema, 1997). Amanda and Doyle (2003) suggested E. pilossa as the
most likely wild progenitor of tef.

10
The role of tef in Ethiopian farming system
Agronomic role of tef
Agronomically, tef has several merits for the growers compared to other cereals. It
possesses an excellent adaptation under various environmental conditions (altitudes, soils,
rainfall and temperatures) and fits to different cropping systems, patterns and sequences
(Assefa et al., 2011, 2013; Ketema 1993). Tef crop can be grown from sea level to about
3000 meter above sea level (masl) and under various rainfall, temperature and soil regimes
(Ketema, 1993). Therefore, it exhibits high level of phenotypic plasticity in phenology,
morphology and agronomic performance depending on its growing environment (Assefa
et al., 2001c). However, the climate and soils under which it is grown affect both its quality
and yield (Ketema, 1993) and hence, it gives a better yield and qualitywhen it grows
between1,800 to 2,100 m a. s. l., receives 450 to 550 mm rainfall and gets 10 to 27°C
temperature throughout its growing period (Ketema, 1993). Tef is a relatively resistantcrop
having no serious threats from disease and pest epidemics in the field and store (Assefa et
al., 2013) and hence has a long shelf life (Ketema, 1993; Assefa et al., 2011). Furthermore,
it can be used as a replacement crop at times of failures of long-season crops by drought,
pest and/or other calamities. The fact that a smaller quantity of tef grains can saw larger
area of land is also its additional advantage. Tef exhibits high level of phenotypic plasticity
in phenology, morphology and agronomic performance depending on its growing
environment (Assefa et al., 2001). Hence, it is considered to be a reliable cereal for
unreliable climate to enhance food security and crop diversification in the moisture stress
and challenging agroecological areas of the country.

11
The utilization of tef
2.3.2.1 Nutritional content of tef
Tef is a very nutritious cereal grain having a relatively high content of minerals such as
iron, phosphorous, and calcium (Melak-Hail, 1966; Asrat and Tekabe 2001; Baye, 2014).
Besides, it contains more calcium, copper, zinc, aluminum, and barium than wheat, barley
and sorghum. It has also a starch-rich endosperm, nutrient-rich germ and fiber-rich hull
with much higher germ to endosperm ratio than any other grain due to its minute size
(Patricia and Lisette, 2008). Tef grain provides human body with complete range of
nutrients such as carbohydrates, fats, proteins, vitamins and minerals (Patricia and Lisette,
2008).It contributes 40-60% of the energy required by the body (Bultosa and Umeta,
2013)and approximately 60-80 percent starch (Bultossa et al., 2008; Bultosa and Umeta,
2013; Baye, 2014).Surprisingly, a dirqosh or dried tef injera has a good digestibility and
keeping quality compared to any other forms ofinjera (Bultossa et al., 2008). Tef grain has
significantly lower glycemic index (74) than white wheat (100) but comparable to sorghum
(72) and oats (71) (Wolter et al., 2013).
The iron and calcium content of tef ranges from 11 to 33 mg and 100 to 150 mg,
respectively, revealing a higher content of both nutrients than those reported for wheat,
barley, or sorghum (NAS, 1996). Besides, its zinc and copper content are also reported to
be higher than sorghum and wheat (Baye, 2014). Furthermore, the grain and injera of tef
provide high level of phosphorus, potassium and sodium than maize, sorghum, wheat and
millet though fermented injera has more bio-available iron than the unfermented one
(Bultosa and Umeta, 2013).

12
The protein content of tef grain ranges from 8 to 15 % with an average of 11% (National
Acadamy of Sciences (NAS), 1996), which is a value higher than maize but comparable
with wheat (Hundera, 1998; Bultosa, 2007). Tef grain is remarkably rich in albumins and
globulins which is a digestible type of proteins (Bekele, 1995). Its composition of essential
amino acids is comparable to an egg protein except for lysine content (Jansen et al., 1962;
Patricia and Lisette, 2008) which is still better than barley, millet and wheat (Bultosa and
Umeta, 2013). Regarding its feed aspect, amean crude protein (9 to 14%), acid detergent
fiber (32 to 38%), neutral detergent fiber (53 to 65%) and Total Digestible Nitrogen (55 to
64%) was reported for tef forage (Miller, 2009).
2.3.2.2 The nutritional importance of tef
The fact that grain of tef is gluten free (Spaenij-Dekking et al., 2005) has brought a global
attention as a healthy diet for people suffering from gluten allergy or celiac disease. Besides,
its slowly released carbohydrate is suitable for diabetic people and high iron content is very
useful for pregnant woman and for people suffering from hookworm infestation related
anemia (Spaenij-Dekking et al., 2005). The minimum dietary energy (2100 kcal)
requirements for food security for a person can be met by consuming about 546 g of dried
injera per day (Bultosa and Umeta, 2013). In general, its better amino acid composition
and gluten free nature potentially makes tef a very useful raw material for the development
of new food products (Patricia and Lisette, 2008).
Constraints of tef production Despite its major importance in Ethiopia as a source of food, feed, cash, and as a rescue
crop, tef is reported to have several production constraints. Hence, its national average
yield is only about 1.64 tons per hectare (CSA, 2017) which is far below its expected

13
genetic potential. The major reasons for such low yield of tef has been summarized by
Assefa et al. (2011) as follows: low yield potential of the widely cultivated farmers’
varieties; susceptibility to lodging especially under growth and yield promoting conditions;
biotic stresses (diseases, insects, etc.); abiotic stress; the labor-intensive husbandry and the
weak seed and extension system. Thus, the poor extension linkage has hampered the
penetration of improved varieties and production package to reach the desired level. As a
result, most farmers in the larger parts of the country are still using local landraces or
traditional agronomic practices. Such wide gap between using improved production
package and using local landraces and cultural practices, is therefore, seriously affecting
the national productivity of tef. Besides, lodging is a major production bottlenecks causing
a grain yield loss of 17 to 27% (Ketema, 1993) under natural conditions and 15 to 45%
(Zhu et al., 2012) depending on the weather condition and varietal inherent nature. The
fact that tef production is a labor-intensive husbandry (requires up to five ploughing) and
the difficulty of farmers to fulfill such requirement is another factor affecting the
productivity of tef (Assefa et al, 2011). Good land preparation usually allows tef to grow
better and become more competive to weed so as toincrease yield (Hundera et al., 2001;
Fisehaye and Tadele, 2001). Last but not least, inadequate research investment allocated to
tef improvement at national level and lack of global attention due to its localized
importance has been considered as another critical constraint of tef (Assefa et al., 2011).
Efforts and successin tef improvement
Collection and conservation of tef germplasm resources
Existence of sufficient genetic variation forms the fundamental basis of any crop breeding.
Indigenous germplasm resources are the primary source of variability for tef genetic

14
improvement. Hence, collection and conservation of these resources is essential to develop
new varieties with desired traits. To this effect, the Ethiopian Biodiversity Institute (EBI)
has collected about 5169 tef accessions. However, only 2533 of these accessions had the
necessary passport data (Tessema, 2013) and most of them werenot yet characterized.
Based on their passport data, 42.6%, 39.6%, 11.8% and 5.9% of these accessions were
collected from altitude range of 2001 to 2500m, 1501 to 2000m, 2501 to 3000m and 1001
to 1500 m above sea level (asl), respectively, while those from below 1000m and above
3000m asl is less than 1% (Tessema, 2013).
Genetic Characterization
Characterization of germplasm is the process of detecting genetic diversity existing within
or among germplasm accessions using descriptor lists of morphological characters or at the
level of gene expression or DNA sequences (de Vicente et al., 2005). Plant breeders may
put more focus on diversity within a crop species of interest (Rubenstein et al., 2005) and
hence, genetic characterization from breeding point of view involves the evaluation of
agronomic performance of accessions for different morpho-agronomic and physiological
characters under various environmental conditions (de Vicente et al., 2005). Hence, genetic
characterization and evaluation provides essential information for germplasm utilization,
establishment of core collections and detection of duplications in collections (Carvalho,
2004).Genetic diversity studies are usually performed using morpho-agronomic characters,
biochemical and molecular methods (Assefa et al., 2001c; Carvalho, 2004; de Vicente et
al., 2005; Zeid et al., 2012; Chanyalew et al., 2013)) or combination of them.

15
2.5.2.1 Morphological and chemical characterization of tef
Various studies based on phenotypic traitshave been conducted(Ebba, 1975; Tefera, 1988;
Tefera et al., 1990; Ketema, 1993; Bekele, 1996; Ketema, 1997; Teklu, 1998; Assefa et al.,
1999; Assefa et al., 2000; Kefyalew et al., 2000; Assefa et al., 2001b; Assefa et al., 2001a;
Assefa et al., 2001c; Adenew, 2002; Assefa et al., 2002a; Assefa et al., 2003b; Tefera et
al., 2003 ; Adinew et al., 2005; Teklu and Tefera, 2005; Jifar, 2008; Assefa et al., 2011;
Jifar et al., 2011; Plaza et al., 2013). Thus, the existence of wide range of phenotypic
variation in improved varieties (Hundera, 1998; Jifar, 2008; Jifar et al., 2011), cultivars
(Tefera, 1988; Tefera et al., 1990) and germplasm accessions (Assefa et al., 2000; Assefa
et al., 2001b; Assefa et al., 2001a) for the various traits of tef have been revealed. Besides,
wide range of phenotypic variability and heritability in grain yield and yield related
characters were also reported (Tefera, 1988). Panicle form, seed and lemma color, embryo
mark and basal stalk color are identified to be the major indicators of morphological
variation in tef (Ketema, 1997; Tefera and Ketema, 2001). Variation in tef , furthermore,
wasalso assessed using leaf and seed proteins (Bekele, 1995), grain chemical composition
(Bekele and Lester, 1981; Hundera, 1998).Studies on grain chemical composition, for
instance, revealed that a protein content and total nitrogen value ranging from 9.4% to 12.8%
and 1.5% to 2.0% (Hundera, 1998).
Multivariate analysis such as cluster and principal component analysis have also revealed
the existence of variation in tef (Assefa et al., 2000; Assefa et al., 2001b; Assefa et al.,
2001a; Adenew, 2002; Assefa et al., 2003b; Adinew et al., 2005; Jifar, 2008; Jifar et al.,
2011). In PCA, for instance, PCs with eigen values greater than unity accounted for 71 to
85% of the entire variation in tef (Assefa et al., 2000; Adinew et al., 2005; Jifar et al.,

16
2011). Reports based on cluster analysis have also documented the formation of three to
seven clusters using various sets of tef (Assefa et al., 2000; Assefa et al., 2001b; Assefa et
al., 2001a; Adenew, 2002; Assefa et al., 2003b; Adinew et al., 2005; Jifar, 2008; Jifar et
al., 2011).
2.5.2.2 Molecular characterization of tef
Molecular markers are useful tools for assessing genetic variations, and provide an efficient
means to link phenotypic and genotypic variations (Varshney et al., 2005;Agarwal et al.,
2008). Understanding the molecular basis of essential biological phenomena is crucial for
effective conservation, management, and efficient utilization of plant genetic resources
(Mondini et al., 2009). So far, the national tef improvement program in Ethiopia, Cornell
University in USA and the University of Bern in Switzerland has been employing various
modern genetic and genomic tools and techniques for tef crop improvement. Several
molecular markers such as Restriction Fragment Length Polymorphism (RFLP) (Zhang et
al., 2001), Amplified Fragment Length Polymorphism (AFLP) (AYELE et al., 1999; Bai
et al., 1999; Ayele and Nguyen, 2000), Random Amplified Polymorphism DNA (RAPD)
(Bai et al., 2000), Inter-simple sequence repeats (ISSR) (Assefa et al., 2003a), simple
sequence repeat (SSR) (Zeid et al., 2012)and QTL mapping studies (Chanyalew et al.,
2005; Yu et al., 2006; Yu et al., 2007 ; Zeid et al., 2011) and high throughput mutation
discovery (Zhu et al., 2012) have been employed to assess the genetic diversity in tef.
Besides, the publication of tef genome sequences(Cannarozzi et al., 2014) was another
important breakthrough in tef improvement. Thus, it has confirmed that breeding targets
identified for other cereal crops will also be a valuaeable breeding targets for tef. Besides,
the draft genome and transcriptomeenabled to identify those identified targets for gentic

17
improvement of tef. More recently, studies conducted by Girma et al (2018) using 40 wild
Eragrostis species based on genotype by sequencing (GBS) confirmed 92% sequence
representation of E. pilosa, E. aethiopica, E. obtusa, E. ferruginea, E. lugens, and E.
lehmanniana in the tef reference genome. This is another confirmation to suggest E.
pilosaas a potential diploid progenitor of tef.
Simple Sequence Repeats, commonly known as microsatellites, are the markers of choice
in plant breeding (Gupta and Varshney, 2000). It has been widely in use to screen,
characterize and evaluate genetic diversity in cereal crops (Tautz, 1989; Gous et al., 2013)
including tef (Zeid et al., 2012; Abate, 2015; Abraha et al., 2016). Co-dominant inheritance,
high abundance, enormous allelic diversity and high reproducibility (Mondini et al., 2009)
are among the features increasing the potential use of microsatellites in large-scale genetic
diversity studies.
2.5.2.3 Establishing core collection
Germplasm collections enable to maintain the genetic variation of crop plants and their
wild relatives. However, efficient management of existing genetic variation is sometimes
very difficult especially when we have large germplasm holdings. Nevertheless, one can
reducethe problem by establishing a proper core collection. A core collection is a group of
accessions from an existing germplasm collection being chosen to represent the genetic
variations of the entire collection (Hao et al., 2006). It should include the maximum genetic
variation contained in the whole collection, with minimum redundancies (Brown, 1989;
Anoumaa et al., 2017). According to Paredes et al.(2010), knowing the level of genetic
diversity and population structure are very essential in establishing a core set .

18
Development of tef varieties
The success of any crop breeding program depends on the level of genetic variability
existing in its germplasm. The first step in the variety development is, therefore, knowing
how variable the working germplasms are and designing strategies of creating variability
if there is no sufficient variability. In tef, variety development relies on germplasm
enhancement using indigenous germplasm, hybridization and induced mutation techniques.
Thus, genetic characterization and evaluation, and targeted crossing among selected
parental lines are the most common practices to develop and release varieties (Assefa et
al., 2011). So far, the existence of wide range of genetic variability in tef crop phenology,
morphology and agronomic traits (Tefera et al., 1992; Assefa et al., 2001, 2011) that can
be utilized for various improvements have been reported while, the variability observed for
seed size, lodging, shattering, and leaf rust disease resistance was not sufficient (Assefa et
al., 2001, 2011). The use of induced mutation has also been employed to create variability
for lodging resistance and seed size (Assefa et al., 2011) though not succeded to alleviate
such critical problems.
Genotypes developed through various germplasm enhancement schemes are promoted for
variety evaluation at various stage such as observation nursery, preliminary variety trial,
national variety trial and variety verification trial. Commonly, there are two sets of variety
evaluation (early and late sets) in which the late set is targeted for high potential
environments, while the early set is targeted for terminal moisture stress areas and for
double cropping (Assefa et al., 2011; 2013). Variety verification trial is the last stage of
variety evaluation whereby promising genotypes obtained from national variety trials are
evaluated on larger plots both on station and on farm by the national variety release

19
committee. In the process of variety development, genotypes selected for a given trait are
subsequently evaluated for direct yield tests or taken back as parental lines for
hybridization or mutation schemes of germplasm enhancement (Assefa et al., 2011, 2013,
2015).
Success in tef breeding
The discovery of tef floral biology and flowering time in 1974 by Tareke Berhe (Berhe,
1975) is a great breakthrough in tef breeding that enabled usknow the time within 24hour
cycle when tef flowers open (from about 6:00 to 6:45 am). This has allowed to start
artificial crossing technique and incorporation of intra-specific hybridization into the pre-
existing breeding methods. Personal communication with tef breeders at Debre Zeit
agicultural research center confirmed the existence of over 650 crosses made by the
national tef improvement programuntil 2018. Thosecrossings with high genetic variability
werepromoted for further selection and generation advancement (Teferaet al., 2001). Thus,
about 44 varieties with different genetic backgrounds have been released for use by small
holder farmers (MoANR, 2017). Notably,varietieslike Dukemhave a yield potentialofover
4.5 t/hawith improvedmanagement practices under non-lodging condition (Tefera and
Ketema, 2001).The sequencing of dwarfing candidate genes homologous of dw3 of
sorghum and rht1 of wheat has enabled to identify mutant tef lines to be combined and
tested for improved lodging resistance (Zhu et al., 2012). Thus, promising semi-dwarf and
lodging tolerant tef lines has been developedusing induced mutagenesis(Esfeld et al., 2013).
Kinde is one of those lines identified tohave semi-dwarf stature, increased number of tillers,
larger leaf size, stay green traits and strong tolerance to lodging (Jifar et al., 2017).
However, the yield of Kindewas very low compared to the locally adapted improved

20
varieties. But,introgression of the important agronomic merits of Kinde was possible by
crossing itwith the high-yielding and locally adapted tef cultivars in Ethiopia(Esfeld et al.,
2013). Such introgression has, therefore, enabled to release tef variety Tesfain 2017
(MoANR, 2017) and to develop several promising tef pipelines. Overall, however, the tef
breeding has so far enabled to develop and release over 40 tef varieties to the farming
communities in Ethiopia (MoANR, 2017).
Genotype by Environment Interactions
Assessing the suitability of environments
Presence of significant genotype by environment interactions (GEI)affects selection
progress and makes variety development and recommendation more difficult (Allard and
Bradshaw, 1964), and reduces the opportunity to get stable and high yielding genotypes
across environments. Hence, understanding crop performance and its growing environment
enables plant breeders and geneticists to increase agricultural production (Tolessa et al.,
2013; Yan and Kang, 2003). Besides, it enables to reduce the cost of genotype evaluation
by eliminating unnecessary spatial and temporal replication of yield trials (Shafi et al.,
1992; Basford and Cooper, 1998). Furthermore, it is alsovery useful to establish additional
testing environments when the existing ones are underrepresented (Piepho, 1996; Wakjira
and Labuschagne, 2002). Multi environment trial (MET), generally, enables the
identification of superior cultivar for a target region and to determine how the target region
is subdivided into different mega-environments (Yan et al., 2000). This gives breeders the
opportunity to determine optimum breeding strategy to make informed choices of the
locations and input systems to be used in the breeding efforts (Gruneberg et al., 2005).

21
Hence, study of GEI and yield stability will continue to be important in checking varietal
suitability for cultivation across seasons and ecological zones (Nassir and Ariyo, 2011).
Description of tools used to explain GEI
Various approaches have been used to quantify the genotype by environment interaction
and to recommend the best genotypes for target environments. Joint regression (Eberhart
and Russell, 1966), additive main effect a multiplicative interaction (AMMI) analysis
(Gauch, and Zobel, 1988) and GGE biplot (Yan and Rajcan, 2002) are among these
approaches. The AMMI biplot model is one of the widely used statistical methods for GEI
and is relatively powerful for effective analysis and interpretation of multi environment
data (Zobel et al., 1988; Yan et al., 2000; Samonte et al., 2005). Besides, its biplots are also
useful to visualize relationships among genotypes and environments by showing both the
main and interaction effects (Zobel et al., 1988; Sadeghi et al., 2011).
GGE biplot methodology is another essential tool for plant breeders and researchers
enabling the detection of genotype by environment interaction pattern, classification of
mega environments, simultaneous selection of genotypes based on stability and mean yield.
It is also useful to present the “which-won-where” pattern, mean performance and stability
of genotypes, discriminating power and representativeness of environments, etc. (Gabriel,
1971; Yan et al., 2000; Frutos et al., 2013). Genotype by environment interaction analysis
in R (GEAR) is free software developed by the CIMMYT (Alvarado et al., 2016) and
employed to analyze the AMMI and GGE biplot in the present study.

22
Food–feed traits
Food Value study in tef
Tef is one of the crops having high food and feed trait values. As a whole grain, its
contribution to the human diet is of immense significance. Thus, tef a grain with higher
fiber content than other grains due to its small size and whole grain nature (Bultossa and
Umeta, 2013) and also contain 20-40% resistant starches (Patricia and Lisette, 2008) which
is of significant health benefits. Tef, therefore, is a source of nutritious and healthy diet for
people having various health disorders such as celiac disease, diabetes, cardo vascular
disease, obesity, etc. (Bultossa and Umata, 2013, Baye, 2014). Consumption of tef helps
to manage celiac disease and possibly prevent and control iron deficiency and diabetes
(Baye, 2013). Furthermore, tef is a good source of iron and vitamin B; especially, for
women who are prone to anemic conditions (Bultossa and Umeta, 2013). In general,
according to NAS (1996), iron deficiency related anemia among Ethiopian people is very
rare in the tef consumption area (especially, the red tef) have higher level of hemoglobin
and a decreased risk of anemia related to parasitic infection (Bultosa and Umeta, 2013).
Feed value study in tef
Natural pastures, crop residues, agro-industrial by-products, and to some extent improved
forage and pasture species are the sources of animal feeds (Diriba et al., 2013). Tef straw
is reported to be a better feed resource than wheat and barley straws since it has lower
lignin content and higher in vitro dry matter digestibility (IVOMD) and energy
composition (Yami, 2013). As a result, farmers preferred to feed tef straw to lactating cows
and working oxen (Ketema. 1997). Hence, its nutrient supply is close to that of a medium
quality native grass hay (Ketema, 1993; Yami, 2013).Tef crop has been identified as a fast
growing, low cost, high quality annual forage with multiple harvests during a growing

23
season compared to other common forage grasses (Roseberg et al., 2008). According to
Ketema (1997), it is possible to get up to three harvests of green products annually from
tef. Forage quality is the appropriate consumption of the forage by the animal and the
efficient conversion of its nutrients into animal products (Fulgueira et al., 2007). The feed
quality and food-feed yield traits are affected by the crop cultivar, climate, location, soil
fertility, stage of maturity, techniques of harvest and storage conditions (Bediye et al., 1996;
Bediye and Dereje, 2001). The feeding value of crop residues also varies with the crop
variety, content of anti-nutritional factors (tannins, lignin, silica etc.), stage of harvest,
length of storage, leaf to stem ratio, soil fertility and fertilizer application as well as on the
agronomic practices we follow (Yami, 2013). Thus, late harvesting reduces the protein
content of a given feed compared to harvesting made at proper stage of growth and tef hay
protein, therefore, ranged from 12 to 19.5% and 9.6 to 13.7% in South Dakota and Montana
states respectively (Patricia and Lisette, 2008). This justifies that the protein content varies
with location and crop growth stage of a given feed. Besides, studies conducted by Bediye
et al. (1996) also reported that improved tef varieties had higher proportion of the more
digestible leaf and panicle fractions compared to unimproved varieties indicating that
palatability varies with genotypes. Studies conducted in USA reported a mean crude
protein (9 to 14%), acid detergent fiber (ADF) (32 to 38%), neutral detergent fiber (NDF)
(53 to 65%) and Total Digestible Nitrogen (TDN) (55 to 64%) for tef forage (Miller, 2009).
Feed quality parameters can be analyzed by using either Near Infrared Reflectance
Spectroscopy (NIRS) or the conventional wet chemistry method. The NIRS method is,
however, a cheaper and faster method of analyzing larger samples whereas the latter is
accurate and costly. It is one of the recent techniques applied for feed resource quality

24
determination and further characterization. NIRS is one of the robust applications to
estimate chemical entity and parameters such as Dry matter (DM), organic matter (OM),
Ash. Crude protein (CP), Acid detergent fiber (ADF), Neutral detergent fiber (ADF), Acid
detergent lignin (ADL), Metabolic energy (ME) and In vitro organic matter digestibility
(IVOMD).

25
Chapter 3
3. Agro-morphological traits diversity in Tef [Eragrostis tef (Zucc.) Trotter] genotypes from various genetic and eco-geographic origins
Abstract
Morphological characterization is the process of detecting genetic diversity existing within
or among germplasm accessions using descriptor lists of morphological characters.
Conducting further studies with this regard is essential as most of the tef accessions in the
EBI gene-bank are not yet existively characterized. A total of 188 tef genotypes including
144 pure lines selected from germplasm collection, 35 released varieties, eight breeding
lines and their parents were evaluated in three replications at two locations in Ethiopia.
The objectives were to assess the magnitude and pattern of phenotypic diversity among tef
genotypes, and to see association among major traits of tef from various sources. The
results revealed existence of sufficient level of genetic variation for both qualitative and
quantitative traits of tef. Combined analysis of variance revealed highly significant (P <
0.01) differences among genotypes, locations and genotype by environment interaction for
all the studied traits. A wider range of variations were also observed for days to heading
(40.3 to 60.8 days), days to maturity (101 to 122.5 days), plant height (60.7cm to 107.1
cm), panicle length (19.5 to 39.5 cm), second culm diameter (1.2 to 2.1 cm), number of
fertile tillers per plant (2.1 to 5.5) and number of spikelet per panicle (156.7 to 441.7).
Besides, 1000 kernel weights, grain yield and lodging index also ranged from 20.7 mg to
33.0 mg, 3.7 to 7.3 t/ha and 44.7 to 79.3 %, respectively. Genotypes collected from West
Shewa and Central Tigray zones were found to have the highest plant height, second culm
diameter, number of fertile tillers, number of spikelet per panicle, grain yield and shoot
biomass. Cluster analysis also revealed the formation of six distinct groups for individual
genotypes while the 14 populationswere grouped into four distinct clusters.
Key words: Eragrostis tef, morphological markers, cluster analysis, genetic diversity,
phenotypic parameters, tef, tef accessions

26
Introduction Tef is the most important staple cereal having a dozen of agronomic, nutritional and health
merits. Despite its various importance, the national productivity of tef (1.66 t/ha) is very
low compared to the common cereals grown in Ethiopia (CSA, 2017). Poor dissemination
of improved varieties and production packages, inability to tackle the problem of lodging
and lack of capacity to characterize the available germplasm are among the major factors
contributing to lowproductivity of tef.
Morphological markers are the earliest markers utilized in the assessment of genetic
diversity within and among populations. Even though they have low polymorphism,
heritability and expression, and are vulnerable to environmental influences (Smith and
Smith, 1992; Mondini et al., 2009), they are simple and direct measures of phenotypes and
are cheap to characterize germplasm accessions. Hence, they are still very important
methodological option to document the diversity at phenotypic traits levels when
researchers/breeders have no access to the molecular or biochemical methodsfor detecting
genetic variation.
Various studies conducted on morpho-agronomic characters revealed the existence of wide
range of genetic variation in tef varieties (Hundera, 1998; Jifar, 2008; Jifar et al., 2011),
cultivars (Tefera, 1988; Tefera et al., 1990) and germplasm accessions (Assefa et al., 2000;
Assefa et al., 2001b; Assefa et al., 2001a) for days to maturity, plant height, culm and
panicle length, and number of tillers per plant. Thus, days to heading, days to maturity and
grain filling period were reported to range from 25 to 81, 60 to 140 and 29 to 76,
respectively (Assefa et al., 2001c; Assefa et al., 2003b). Besides, wide range of phenotypic

27
variability and heritability in grain yield and yield related characters were also reported
(Tefera, 1988). The range of values reported for phenological traits is very useful for
selection of genotypes for different maturity groups and adaptation (Assefa et al., 2002a;
Assefa et al., 2002b). Panicle form, seed and lemma color, embryo mark and basal stalk
color are the major indicators of morphological variation in tef (Ketema, 1997; Tefera and
Ketema, 2001). Thus, genotypes having very loose panicle form were reported to have the
highest yield and wider adaptation compared to those with other panicle forms (Tefera,
1988). Cluster and principal component analysis have also revealed the existence of
variation in tef (Assefa et al., 2000; Assefa et al., 2001b; Assefa et al., 2001a; Adenew,
2002; Assefa et al., 2003b; Adinew et al., 2005; Jifar, 2008; Jifar et al., 2011). Despite
previous diversity studiesin tef germplasm using morphological traits, there is limited
investigationsusingrepresentative accessions from diverse tef growingregions. The
objectives of this study were, therefore, to assess the magnitude and pattern of phenotypic
diversity and to determine association among the major morphological traits in tef
genotypes collected from representative tef growing areas in Ethiopia.
Materials and methods
Plant materials
A total of 188 tef genotypes including 144 pure lines selected from accessions collected
from 12 administrative zones in the northern and central Ethiopia, 35 released varieties,
eight breeding lines and their parents (mutant line Kinde and cultivar Kaye Murri) were
studied. The collection year of the accessions ranged from1979 to 2011 with the altitude
range of1260 m to 3090m above sea level (a. s. l.). Description of the collection Woredas

28
forthe144 lines identified from germplasm ispresented (Table 1; Figure 2). The germplasm
was originally acquired from EBI in 2014 and sorted into pure lines in the same year after
proper evaluation under field and greenhouse conditions. Thus, 12 pure lines were selected
from each of the 12 administrative zones to make a total of 144 pure lines. The 35 tef
varieties, on the other hand, were released by seven research centers in Ethiopia between
1970 and 2014 and obtained from the respective research centers. The source of the mutant
line (Kinde) and the eight breeding lines from the crosses to Kinde were from the
collaborative work between the University of Bern and the Ethiopian Institute of
Agricultural Research (EIAR). Kinde is a mutant line identified to have shorter plant height
and better lodging tolerance compared to improved tef varieties. Kaye Murri is a cultivar
known to have several desirable agronomic properties whereas Quncho is a popular variety
widely cultivated in the country. The remaining eight breeding lines were selected based
on their performance from population involving two crosses (Kinde x Kaye Murri and
Quncho x Kinde). The seeds of these breeding lines were obtained from Debre Zeit
Agricultural Research Center (DZARC). The detailed description of all studied genotypes
is given in Table 1. Regarding altitude of collections, 12, 49, 51 and 32 genotypes were
collected from altitudes up to 1500, between 1501-2000m, 2001-and above 2500m,
respectively (Appendix Table1). As to the collection year, 42% and 58% of the studied
genotypes were collections before 2000 and those from 2001 to 2011, respectively
(Appendix Table 2).

29
Table 1.Description of the tef genotypes used in the present study
Origin/
Category
Collection
Zones
No of
genotypes
(serial No.)
Name of genotypes (Accessions) Altitude
(masl)
Lines
from
landrace
accessions
Central
Tigray
12 (1-12) Acc. nos. 19132-2, 19132-3, 19166-1,19253-1,19253-2, 234407-1,
234407-2, 237184-1, 237205-2, 243513-1, 243513-3 & 243520-2
1350-2640
East Gojam 12 (13-24) Acc. nos. 9545-1, 9556-1, 19516-1, 19516-3, 55221-1, 55221-2,
212698-2, 229768-1, 229768-3, 229768-4, 55046-2 and 55046-3
1470-2650
East Shewa 12 (25-36) Acc. nos. 15361-3, 17335-1, 18460-0, 18466-2, 18466-3, 236963-1,
236963-2, 236965-1,236965-3,236967-1, 236967-2 and 236972-0
1657-2303
East Tigray 12 (37-48) Acc. nos. 15297-1, 15297-2,15299-1,15299-3,19201-1,19201-3,
19202-2, 234460-1, 234460-2, 234460-3, 242540-1 and 242540-2
1979-2632
North
Gonder
12 (49-60) Acc.9448-1, 9448-2, 9451-2, 9469-2, 9472-2, 9472-4,19343-2,
242186-3, 242186-4, 243540-1, 243540-3 and 243540-4
1840-2208
North
Shewa
12 (61-72) Acc. nos. 9559-1, 9559-2, 15309-2, 15309-3, 15322-1, 15322-2,
18385-2, 212482-1, 236745-2, 236746-0, 236748-2 and 236957-1
1260-2670
North Wello 12 (73-84) Acc. nos. 55104-3, 215196-1, 215200-1, 215200-2, 215200-3,
234356-4, 234985-2, 234993-1, 234993-3, 237148-1, 237148-5 and
243501-2
1520-2950
South
Gonder
12 (85-96) Acc. nos. 19341-2, 19341-3, 19367-2, 19374-1, 55293-2, 212717-0,
212720-1, 225919-2, 225919-3, 225919-4, 225919-7 and 242160-1
1804-2950
South Wello 12 (97-
108)
Acc. nos. 212607-2, 212612-3, 212614-1, 212614-2, 225898-1,
242214-1, 242214-2, 243491-2, 2433497-2, 243504-1, 243504-2 and
243504-3
1550-3090
West Gojam 12 (109-
120)
Acc. nos. 19394-1, 19443-3, 19452-4, 19506-2, 19506-4, 242140-3,
242144-1, 242144-3, 242155-1, 242155-3, 55029-2 and 55029-3
1890-2735
West Shewa 12 (121-
132)
Acc. nos. 17365-1, 17371-3, 18410-1, 18410-2, 18410-3,18414-2,
18414-4, 18423-3, 236757-2, 236760-1, 236760-4 and 236760-6
1640-2674

30
Table 1. Continued Origin/
Category
Zones No of
genotypes
(serial No.)
Name of genotypes (Accessions) Altitude
(masl)
West
Tigray
12 (133-144) Acc. nos. 9419-1, 9444-2, 9444-3, 19241-1, 19241-2, 234435-2,
237236-3, 237236-4, 237239-3, 243526-2, 243526-4 and
243526-5
1260-2054
Improved
varieties by
breeders
Improved
varieties
35 (145-179) Enatite (DZARC), Asgori (DZARC), Magna (DZARC),
Wellenkomi (DZARC), Menagesha (DZARC), Melko
(DZARC), Tsedey (DZARC), Gibe (DZARC), Ziquala
(DZARC), Dukem (DZARC), Holetta Key (HARC), Ambo Toke
(HARC), Gerado (DZARC), Koye (DZARC), Key Tena
(DZARC), Gola (SARC), Ajora (ArARC), Genete (SARC),
Zobel (SARC), Dima (AARC), Yilmana (AARC), Dega Tef
(DZARC), Gimbichu (DZARC), Amarach (DZARC), Quncho
(DZARC), Gudurru (BARC), Gemechis (MARC), Mechare
(SARC), Kena (BARC), Etsub (AARC), Laketch (SARC),
Simada (DZARC), Boset (DZARC), Kora (DZARC) and Were-
Kiyu (SARC
-
Lines from
crosses of
mutant by
adapted
cultivars
Breeding
lines
10 (180-189) Kaye Murri (cultivar, parent), Kinde (Mutant line, parent),
Quncho X Kinde (RIL-85),Quncho X Kinde (RIL-91), Quncho X
Kinde (RIL-96),KindeX Kaye Murri (RIL-11),KindeX Kaye
Murri (RIL-302), KindeX Kaye Murri (RIL-69) and KindeX
Kaye Murri (RIL-81)
-
• DZARC, HARC, SARC, ArARC, AARC, BARC and MARC refer to Debre Zeit, Holetta, Sirinka, Areka, Adet, Bako and Melkassa Agricultural
Research Centers, respectively.

31
Figure 2. Map of Ethiopia and collection Woredas for the 144 tef germplasm lines based
on passport data from EBI.
.
Description of study sites and design
The field experiment was conducted during the main cropping season of 2015/16at Holetta
and Debre Zeit Agricultural Research Centers which represent themajor tef production
areas in Ethiopia. Holetta Agricultural Research Center is located at 9044’ N, 38030’ E, at
2400 m above sea level (m a. s. l.) 39 km west of Addis Ababa and receives a mean annual
rainfall of 1100 mm, with annual minimum and maximum temperatures of 60C and 220C,
respectively (Jifar et al., 2017). The majority of its rain is obtained between March and
October with a peak in July and August. Debre Zeit Agricultural Research Center, on the
other hand, is situated at 80 44'N and 38058'E, 47 km East of Addis Ababa at an altitude of
1900 m. a. s. l andreceives a mean annual rainfall of 851 mm with a minimum and

32
maximum temperature of 8.90C to 28.30C, respectively (Jifar et al., 2017). The
experimental soil at Holetta was acidic Nitosols, whereas the soil at Debre Zeit is a black
clay soil (Pellic Vertisol) with high moisture holding capacity.
This experiment was laid in Randomized Complete Block Design with three replications.
Each genotype was grown intwo rows of 0.5 m length in each plot at a spacing of 0.2 m,
0.4m and 1.5m between genotypes, rows and replications, respectively. During the crop
growing period, all agronomic and cultural practices recommended for tef production were
applied at each location.
Data collection
3.2.3.1 Qualitative Data
Qualitative traits data were recorded for panicle form, number of internodes, and the colors
of basal stalk culm, lemma and seeds (Table 2). The description of the various qualitative
traits was partially made based on the classifications in the previous works (Tefera et al.,
1992; Ketema 1997). The number and percentage frequency distribution of qualitative
traits across genetic and ecogeographic origins were calculatedusing Microsoft Excel.
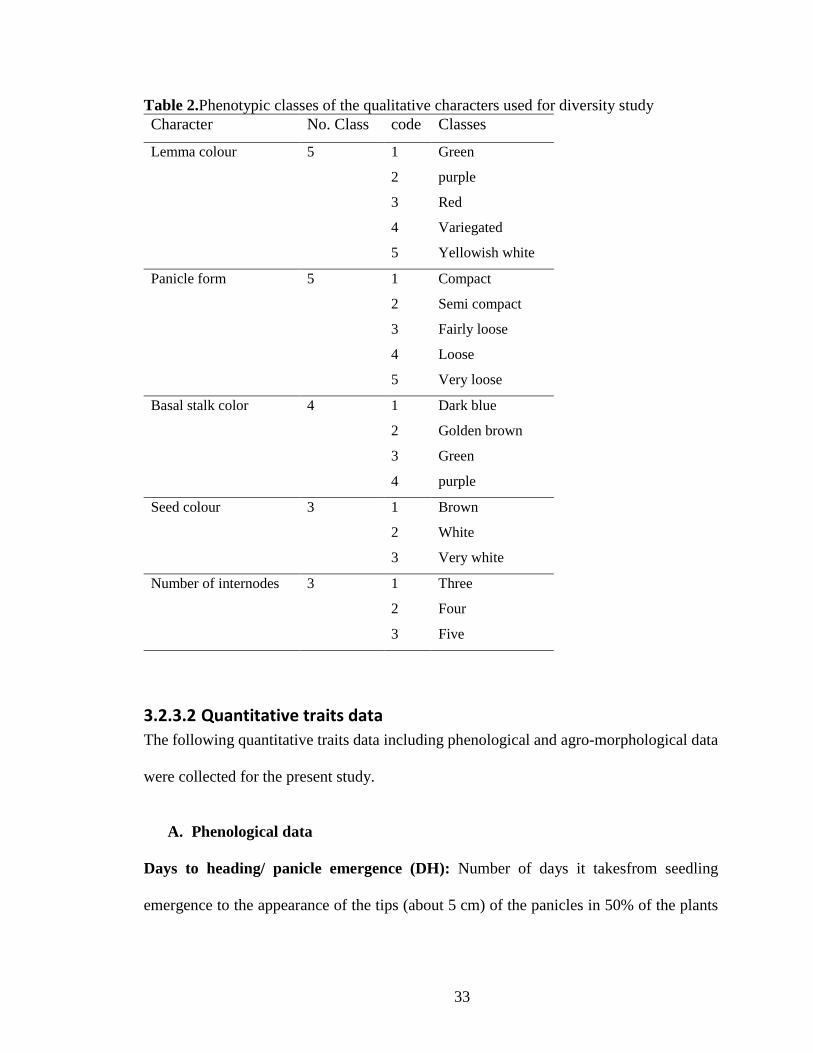
33
Table 2.Phenotypic classes of the qualitative characters used for diversity study
Character No. Class code Classes
Lemma colour 5 1 Green
2 purple
3 Red
4 Variegated
5 Yellowish white
Panicle form 5 1 Compact
2 Semi compact
3 Fairly loose
4 Loose
5 Very loose
Basal stalk color 4 1 Dark blue
2 Golden brown
3 Green
4 purple
Seed colour 3 1 Brown
2 White
3 Very white
Number of internodes 3 1 Three
2 Four
3 Five
3.2.3.2 Quantitative traits data
The following quantitative traits data including phenological and agro-morphological data
were collected for the present study.
A. Phenological data
Days to heading/ panicle emergence (DH): Number of days it takesfrom seedling
emergence to the appearance of the tips (about 5 cm) of the panicles in 50% of the plants

34
on a plot. Note that tef panicle appears without showing the booting stage, which is unlike
the other small cereals like wheat and barley, but similar to that in rice.
Days to maturity (DM): Number of days it takesfrom seedling emergence to physiological
maturity as judged by the change to straw color of the vegetative parts of 75% of the plants
in a plot.
Grain filling period (days) (GFP): This is computed as the difference between days to
panicle emergence and to maturity.
B. Agro-morphological data collected on five randomly selected plants
All traits under this section were recorded at crop maturity stage.
Plant height (PH): The length of the plant in centimeters from ground level to the tip of
the panicle.
Panicle length (PL): Length in centimeters from the node where the first panicle branch
starts to the tip of the panicle.
Peduncle length (Pdl): Length in centimeters of the top most spanning from the last culm
node until the start of the first panicle branch. It stretches from the node where the flag leaf
starts to where the first panicle branch starts.
Culm length (cm): Length in centimeters from ground level to the node where the first
panicle
branch starts.
Culm diameter (CD): The circumference of the second basal culm internode in millimeter
measured using caliper.
Number of fertile tillers per plant (NFT): Counts of the panicle-bearing tillers of a single
plant that have produced a productive panicle.

35
C. Agro-morphological data collected on plot bases
Shoot biomass yield (SBM): The dry weight in kilograms of the above ground biomass
per plot before threshing
Grain yield/plot (GY): The dry weight in grams or kilograms of grains after threshing.
Straw yield/plot (STY): The dry weight in grams or kilograms of tef crop residues
obtained after threshing and grain removal.
Harvest index (HI) (ratio): The ratio of grain yield to total biomass.
1000-kernel weight (TKW): The weight in milligrams of 1000 random kernels of tef.
Lodging Index (LI): The displacement of plants from the vertical up right position. The
common method accepted by the tef program is the lodging index method of Caldicott and
Nuttall (1979), which considers both the extent and severity of lodging.
✓ Severity of lodging can be measured from 0 to 5 based on the angle of lodging (0 =
no lodging = 100% upright, and 5 = completely lodged = 100% flat). Intermediate
readings of lodging are expressed as scores 1 to 4 according to the angle of lodging.
✓ The extent of lodging in a plot (percentage areaof the plot affected for each severity
score) is also recorded.
Statistical analysis of phenotypic traits
All quantitative traits data were subjected to analysis of variance (ANOVA) as per the
procedure suggested by (Gomez and Gomez, 1984). (SAS, 2002), Minitab 17.1 (2013)
statistical software packages were used for different analysis of quantitative traits data.
Variance homogeneity test and combined analysis of variance was performed using the
general linear model (PROC GLM) procedure to determine the effect of environment (E),

36
genotype (G) and G x E interaction for the various traits of tef. Mean separation was
performed using Duncan's multiple range test at 5% probability level. Genotypic and
phenotypic association of major quantitative traits were analyzed using Multi Environment
Trial Analysis with R for windows (META-R) version 6.0 developed by CIMMYT
(Alvarado et al., 2016). Principal component analysis and cluster analysis, on the other
hand, were conducted using MINITAB software version 17 (MINITAB, 2013). Genetic
distances between clusters as standardized Mahalanobis’s D2 statistics were calculated as:
D2ij = (xi – xj)’ cov-1(xi – xj)
Where, D2ij = the distance between cases i and j; xi and xj = vectors of the values of the
variables for cases i and j; and cov-1 = the pooled within groups variance-covariance matrix.
The D2 values obtained for pairs of clusters were considered as the calculated values of
Chi-square (X2) and were tested for significance at 1% and 5% probability levels against
the tabulated value of X2 for ‘P’ degrees of freedom, where P is the number of characters
considered in each study (Singh and Chaudhary 1985).
Broad-sense heritability and genetic gains from selection
Partitioning of the total phenotypic variance into components due to genotype (σ2g),
environment (σ2e) and genotype by location interaction (σ2gl) variances was performed
from the analyses of variance by assuming various observed mean squares equal to their
expected mean squares (Table 3) as suggested by Singh and Chaudhary (1985).

37
Table 3.Summary of the analysis of variance model
Source of variation Degree of
Freedom
Mean
Square (MS)
Expected Mean
Square (EMS)
Locations L –1 MS1 σ2e + Gσ2r+ GRLσ2
Rep within location L (R -1) MS2 σ2e + Gσ2r
Genotypes G –1 MS3 σ2 e+ Rσ2gl+ RLσ2g
Genotype x Location (G –1) (L-1) MS4 σ2e+ Rσ2gl
Error L (G -1) (R –1) MS5 σ2e
Thus,
σ2g = [(σ2e + Rσ2gl + RLσ2g) - (σ2e+ Rσ2gl)]/RL = (MS3-MS4)/RL
σ2 e= MS5
σ2gl = [(σ2e + Rσ2gl) - (σ2e)]/R = (MS4-MS5)/R
Where: σ2g = genotype variance, σ2e= environmental variance and σ2gl = genotype
by location interaction variance.
Broad-sense heritability (h2b) was calculated as: : ℎ2𝑏 = 𝜎2𝑔
[𝜎2𝑔+𝜎2𝑔𝑙
𝐿+
𝜎2𝑒
𝑅𝐿]
× 100
The predicted response to selection or the expected genetic advance (GA) was calculated,
assuming the selection intensity of 5%, as:
𝐺𝐴 = 𝐾√𝛿2𝑃 × ℎ2
𝐺𝐴𝑀 = (𝐺𝐴
𝑋) × 100
Where, GAM= Genetic advance as percent of mean, X= grand mean, GA = expected
genetic advance from selection and K = the selection differential (K = 2.06 at 5% selection
intensity), σ2P = phenotypic variance and h2 = broad-sense heritability (Singh and
Chaudhary, 1985).

38
RESULTS
Qualitative traits diversity
The variations among qualitative traits of the studied genotypes were analyzed and are
presented in Table 4 and Fig. 3. Based on this result, panicle form of the studied genotypes
was grouped into five categories: loose, fairly loose, very loose, compact and semi compact
types, and included 87, 72, 23, 6 and 1 genotypes, respectively. Thus, the majority of the
genotypes had loose (46.0%) and fairly loose (38.1%) types while the semi compact type
accounted for less than 1 % (Table 4). With regard to lemma colour, the studied genotypes
showed green, purple, red, variegated and yellowish white lemma colour. The majority of
these genotypes were represented by yellowish white (43.9%) and variegated (38.1%)
lemma colour while the remaining classes accounted for about 18% of the variation. The
basal stalk colour, on the other hand, were categorized into dark brown, golden brown,
green and purple types whereby the green basal stalk colour covered 90.5% whereas the
remaining three colours together constitutedless than 10% of the variation.
Figure 3. One hundred and eightyeight tef genotypes grown at Holetta Agric. Research
Center (October 2015). Photo: Habte Jifar

39
In addition, the variation for number of internodesand seed colour among the tef
genotypesare summarized in Table 4. Regarding number of internodes, the majority of the
studied genotypes had four internodes (51.3%) followed by those having three (35.5%) and
five (13.2 %) internodes. Furthermore, 55%%, 42.9% and 2.1% of the studied tef genotypes
were found to have white, brown and very white grain colour, respectively.
Table 4.Variation in qualitative traits of tef genotypes evaluated at two locations in 2015
Character code Classes No of
genotypes
%
Lemma colour 1 Green 16 8.5
2 purple 12 6.4
3 Red 6 3.2
4 Variegated 72 38.1
5 Yellowish white 83 43.9
Panicle form 1 Compact 6 3.2
2 Semi compact 1 0.5
3 Fairly loose 72 38.3
4 Loose 87 46.3
5 Very loose 23 12.2
Basal stalk color 1 Dark blue 3 1.6
2 Golden brown 10 5.3
3 Green 171 90.5
4 purple 4 2.1
Seed colour 1 Brown 81 42.9
2 White 104 55.0
3 Very white 4 2.1
Number of
internodes
1 Three 67 35.5
2 Four 97 51.3
3 Five 25 13.2

40
3.3.1.1 Seed colour distribution by origin
The seed colour distribution of the studied genotypes across genetic origin, region and zone
of collection was assessed and presented in Table 5. Based on zones of collections,
genotypes from the three zones of Tigray region were identified to have 66.7% white, 36.6%
brown and 2.8% very white seed colour whereas, those from North and South Gonder of
Amhara region were composed of 62.5% brown, 33.3% white and 4.2% very white seed
colour. Besides, genotypes from North and South Wello zones of Amhara region showed
45.8% brown, 37.5% white and 16.7% very white seed colour while those from West and
East Gojam zones of the same region occupy 41.7% brown, 45.8% white and 12.5% very
white seed colour.
On the other hand, genotypes from North Shewa zone of Oromia region showed 58.3%
brown, 25.0% white and 16.7% very white seed colour while those from West Shewa zone
showed 41.7% brown, 50.0% white and 8.3% very white seed colour. Unlike other zones,
the majority of genotypes from East Shewa zone had very white seed colour (50.0%)
followed by 33.3% brown and 16.7% white seeded types. The improved varieties, on the
other hand, were found to have11.4% brown, 71.4% white and 17.1% very white seed
colour while the breeding lines had 70% white and 30% very white seed colour (Table 5).
3.3.1.2 Panicle form distribution by origin
The distribution of panicle form ofthe studied genotypes across genetic origin, region and
zone of collection was assessed and presented in Table 6. Based on zones of collections,
genotypes from the three zones of Tigray region were identified to have 33.3% fairly loose,
47.2% loose, 11.1%very loose, 5.6% semi compact and 2.8% compact type panicle form.

41
Among the three zones, the loose type has the highest proportion in East and Central Tigray
whereas the fairly loose accounted for the largest portion for West Tigray collections. In
Amhara region, collections from North and South Gonder were composed of 37.5% fairly
loose, 54.2% loose and 8.3% very loose panicle form whereas those from North and South
Wello zones had 37.5% fairly loose, 50%loose, 8.3% very loose and 4.2% compact panicle
form. Collections from West and East Gojam zones of the same region had, however,29.2%
fairly loose, 41.7% loose, 20.8% very loose and 8.3% compact panicle form (Table 6).
In Oromia region, collections from the three zones of Shewa had 27.8% fairly loose, 50%
loose, 19.4% very loose and 2.8% compact panicle form. The improved varieties, on the
other hand, were found to have57.1% fairly loose, 33.3% loose and 8.3% very loose panicle
form while the breeding lines had 30% fairly loose, 30% loose,10% very loose and 20%
compact panicle form (Table 6).
Table 5. Seed color distribution of 188tef genotypes from various origins
Region Zones Class I (Brown) Class II (White)
Class II
(very white) Total
Tigray
Central Tigray 3 (25%) 8(66.7%) 1(8.3%) 12
East Tigray 4 (33.3%) 8(66.7%) 0 (0.0%) 12
West Tigray 4 (33.3%) 8 (66.7%) 0 (0.0%) 12
Amhara
North Gonder 7 (58.3%) 4 (33.3%) 1 (8.3%) 12
South Gonder 8 (66.7%) 4 (33.3%) 0 (0.0%) 12
North Wello 6 (50.0%) 5 (41.7%) 1 (8.3%) 12
South Wello 5 (41.7%) 4 (33.3%) 3(25.0%) 12
East Gojam 7 (58.3%) 4 (33.3%) 1 (8.3%) 12
West Gojam 3 (25.0%) 8 (66.7%) 1 (8.3%) 12
Oromia
North Shewa 7 (58.3%) 3 (25.0%) 2 (16.7%) 12
East Shewa 4 (33.3%) 2 (16.7%) 6 (50.0%) 12
West Shewa 5 (41.7%) 6 (50.0%) 1 (8.3%) 12
Improved varieties 4(11.4%) 25 (71.4%) 6 (17.1%) 35
Breeding lines 0 (0.0%) 6 (66.7%) 3 (33.3%) 9
Total 67 (35.6%) 96 (51.06) 26 (13.8%) 188
NB. Numbers in bracket shows the percentage of grain colour in each class.

42
Table 6. Panicle form distribution of 188tef genotypes from various origins
Region Zones Panicle form
FL L VL SC Comp. Total
gray
Central Tigray 4 (33.3) 6(50.0) 1(8.3) 1(8.3) 0(0.0) 12
East Tigray 1(8.3) 7(58.3) 2(16.7) 0(0.0) 2(16.7) 12
West Tigray 7(58.3) 4(33.3) 1(8.3) 0(0.0) 0(0.0) 12
Amhara
North Gonder 4(33.3) 6 (50.0) 2(16.7) 0(0.0) 0(0.0) 12
South Gonder 5(41.7) 7(58.3) 0(0.0) 0(0.0) 0(0.0) 12
North Wello 5(41.7) 5(41.7) 1(8.3) 0(0.0) 1(8.3) 12
South Wello 4(33.3) 7(58.3) 1(8.3) 0(0.0) 0(0.0) 12
East Gojam 1(8.3) 7(58.3) 2(16.7) 0(0.0) 2(16.7) 12
West Gojam 6(50.0) 3(25.0) 3(25.0) 0(0.0) 0(0.0) 12
Oromia
North Shewa 3(25.0) 6(50.0) 3(25.0) 0(0.0) 0(0.0) 12
East Shewa 3(25.0) 8(66.7) 1(8.3) 0(0.0) 0(0.0) 12
West Shewa 4(33.3 4(33.3) 3(25.0) 0(0.0) 1(8.3) 12
Improved varieties 20(57.1) 12(34.3) 3(8.6) 0(0.0) 0(0.0) 35
Breeding lines 3(33.3) 4(44.4) 1(11.1) 0(0.0) 1(11.1) 9
Total 70 (37.2) 86(45.7) 24 (12.8) 1(0.5) 7 (3.7) 188
NB. Numbers in bracket shows the percentage of grain colour in each class.FL= fairly
loose, L= loose, VL= very loose, SC= semi compact, comp. = compact
3.3.1.3 Lemma colour distribution by origin
The lemmacolour distribution of the studied genotypes across origin, region and zone of
collection was assessed and presented in Table 7. Based on zones of collections, thelemma
colour for genotypes from the three zones of Tigray region were 41.7 % yellowish white,
47.2% variegated 5.6% red, 2.8% purple and 2.8% green. On the other hand, collections
from the six zones of Amhara region were 36.1 % yellowish white, 38.9% variegated 1.2%
red, 12.5% purple and 11.1% green in lemma colour. Furthermore, collections from three
zones of Oromia region were 33.3% yellowish white, 44.4% variegated, 2.8% red, 5.6%
purple and 13.9% green in lemma colour. In general, in all regions and zones, the majority
of the lemma colour in the studied genotypes were of variegated and yellowish white type.

43
The improved varieties showed71.4% yellowish white, 22.9% variegated, 2.9% purple and
2.9% greenlemma colour while the breeding lines showed50% yellowish white, 20%
variegated, 10% purple and 10% red.
Table 7.Lemma colour distribution of 188 tef genotypes from various origins.
Region Zones
Lemma Colour Yellowish
White Variegated Red Purple Green Total
Tigray
Central Tigray 8(66.7) 4 (33.3) 0 0 0 12
East Tigray 4(33.3) 8(66.7) 0 0 0 12
West Tigray 3(25.0) 5(41.7) 2(16.7) 1(8.3) 1(8.3) 12
Amhara
North Gonder 4(33.3) 5(41.7) 0 1(8.3) 2(50.0) 12
South Gonder 3(25.0) 6(50.0) 0 2(16.7) 1(8.3) 12
North Wello 6(50.0) 4(33.3) 0 2(16.7) 0 12
South Wello 3(25.0) 5(41.7) 1(8.3) 3(25.0) 0 12
East Gojam 3(25.0) 5(41.7) 0 1(8.3) 3(25.0) 12
West Gojam 7(58.3) 3(25.0) 0 0 2(50.0) 12
Oromia
North Shewa 6(50.0) 4(33.3) 0 2(16.7) 0 12
East Shewa 2(16.7) 8(66.7) 0 0 2(16.7) 12
West Shewa 4(33.3) 4(33.3) 1(8.3) 0 3(25.0) 12
Improved varieties 25 (71.4) 8(22.9) 0 1(2.9) 1(2.9) 35
Breeding lines 5(55.6) 1(11.1) 1(11.1) 1(11.1) 0 9
Total 83(44.1) 70(37.2) 5(2.7) 14(7.4) 15(8.4) 188
NB. Numbers in bracket shows the percentage of grain colour in each class.
3.3.1.4 Basal stalk colour distribution by origin
The basal stalk colour distribution of the studied genotypes across genetic origin, region
and zone of collection are presented in Table 8. Based on zones of collections, the
genotypes from central and East Tigray, East and West Gojam, East Shewa and North
Wello showedentirely of green basal stalk colour. However, those from West Tigray, North
Gonder, South Wello, North and East Shewa showeda combination of stalk colour withthe
majority still green colour. Similarly, 94.3% and 5.7% of the improved varieties were of

44
green and golden brown colour, respectively whereas the breeding lines had 70% green,
10% purple, 10% golden brown, and 10% dark brown stalk colour.
Table 8. Basal stalk colour distribution of 189 tef genotypes from various origins
Region Zones Basal stalk colour
DB GB Purple Green Total
Tigray
Central Tigray 0 0 0 12(100) 12
East Tigray 0 0 0 12(100) 12
West Tigray 0 3(33.3) 1(8.3) 8(66.7) 12
Amhara
North Gonder 1(8.3) 0 0 11(91.7) 12
South Gonder 0 1(8.3) 1(8.3) 10(83.3) 12
North Wello 0 0 0 12(100) 12
South Wello 1(8.3) 2(16.7) 0 9(75.0) 12
East Gojam 0 0 0 12(100) 12
West Gojam 0 0 0 12(100) 12
Oromia
North Shewa 1(8.3) 0 1(8.3) 10(83.3) 12
East Shewa 0 0 0 12(100) 12
West Shewa 0 1(8.3) 0 11(91.7) 12
Improved varieties 0 2(5.7) 0 33(94.3) 35
Breeding lines 1(11.1) 1(11.1) 1(11.1) 6(66.7) 9
Total 4(2.1) 10 (5.3) 4(2.1) 170(90.4) 188 NB. Numbers in bracket shows the percentage of grain colour in each class.DB = Dark
brawn, GB = Golden brown
The distribution of lemma colour across the various altitude is summarized in Table 9.
Thus, the variegated and yellowish white lemma colour accounted for the largest
proportion in all altitudinal classes. On the other hand, the red lemma colour occupied the
least proportion and even collections from altitude class of 2001-2500 and above 2500m
showed no such colour. The green and purple lemma colourwere equally represented by
6.25% in altitude above 2500m.

45
Table 9.Distribution of Lemma colour by altitude
Lemma colour Altitude
<1500 1501-2000 2001-2500 >2500m
# % # % # % # %
Variegated 6 50 20 40.8 19 37.3 17 53.1
Yellowish white 3 25 18 37.6 21 41.2 11 34.4
Purple 1 8.3 4 8.2 3 5.9 2 6.25
Red 2 16.6 2 4.1 0 0 0 0
Green 0 0 5 10.2 8 15.7 2 6.25
Total 12 100 49 100 51 100 32 100
Quantitative Traits Diversity
3.3.2.1 Analysis of Variance
The results of combined analysis of variance revealed highly significant (P<0.01)
differences among genotypes, locations and genotype by environment interaction for the
studied traits (Table 10). Thus, the mean square due to genotypes was significant for all
traits and that of location was also significant for all traits except culm length. Furthermore,
GXE interaction was also highly significant (P<0.01) for all studied traits except plant
height, peduncle length, number of total and fertile tillers (P>0.05) showing the differential
performance of genotypes across different environments (Table 10).

46
Table 10. Combined ANOVA across two locations for 16 traits of 188 tef genotypes
studied
Traits Loc Rep (loc) Geno GXE Error
DH 298350.2*** 86.8*** 97.9*** 31.9*** 5.47
DM 510085.3*** 41.3*** 92.85*** 63.9*** 7.86
GFP 27415.5*** 90.4*** 98.7*** 71.3*** 9.34
PH 2313.89*** 137.5*** 392.4*** 13.5ns 13.48
PL 1429.7*** 54.2*** 101.0*** 2.0ns 5.64
CL 0.32ns 17.8ns 219.2*** 15.5** 11.92
Pdl 362.0*** 145.0*** 36.6*** 0.8ns 3.85
SCD 159.9*** 0.37*** 0.14*** 0.10*** 0.04
TT 140.2*** 17.5*** 2.41*** 0.02ns 0.47
FT 73.1*** 8.9*** 2.14*** 0.02ns 0.43
SPK 6432547.4*** 3120.3** 21514.7*** 13205.3*** 896.7
SBM 36895.1*** 23.4*** 89.0*** 56.4*** 1.09
GY 666.1*** 0.57*** 2.5*** 1.6*** 0.05
HI 2574.4*** 0.72ns 29.1*** 27.8*** 0.41
TKW 364.0*** 32.2*** 24.4*** 22.2*** 6.41
LG 4036.4*** 669.0*** 201.0*** 242.8*** 21.33
Abbreviations: DH: days to heading; DM: days to maturity; GFP: grain filling period; PH: plant
height; PL: panicle length; CL: culm length; Pdl: peduncle length; SCD: second culm diameter; TT:
number of total tillers; FT: number of fertile tillers; SPK: number of spikelet; TBM: total biomass;
GY: grain yield; HI: harvest index; TKW: thousand kernel weight; LG: lodging index.
**, *** significantly different at 1%and 0.1%, respectively.
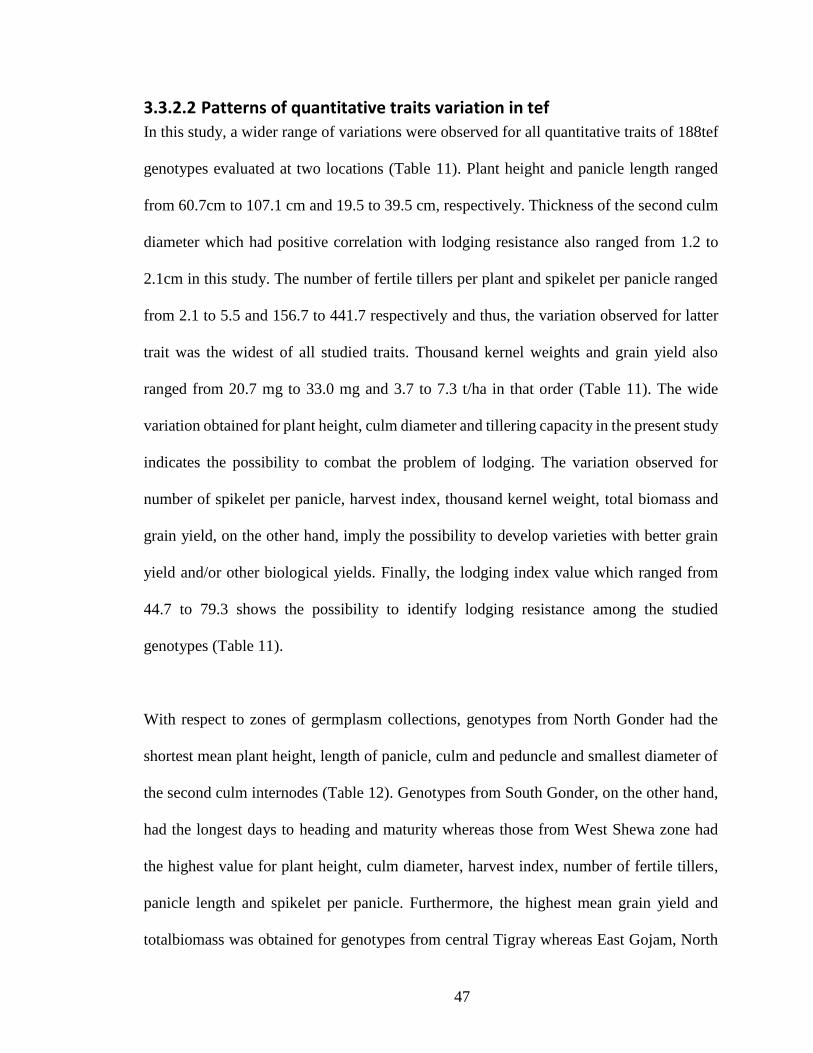
47
3.3.2.2 Patterns of quantitative traits variation in tef
In this study, a wider range of variations were observed for all quantitative traits of 188tef
genotypes evaluated at two locations (Table 11). Plant height and panicle length ranged
from 60.7cm to 107.1 cm and 19.5 to 39.5 cm, respectively. Thickness of the second culm
diameter which had positive correlation with lodging resistance also ranged from 1.2 to
2.1cm in this study. The number of fertile tillers per plant and spikelet per panicle ranged
from 2.1 to 5.5 and 156.7 to 441.7 respectively and thus, the variation observed for latter
trait was the widest of all studied traits. Thousand kernel weights and grain yield also
ranged from 20.7 mg to 33.0 mg and 3.7 to 7.3 t/ha in that order (Table 11). The wide
variation obtained for plant height, culm diameter and tillering capacity in the present study
indicates the possibility to combat the problem of lodging. The variation observed for
number of spikelet per panicle, harvest index, thousand kernel weight, total biomass and
grain yield, on the other hand, imply the possibility to develop varieties with better grain
yield and/or other biological yields. Finally, the lodging index value which ranged from
44.7 to 79.3 shows the possibility to identify lodging resistance among the studied
genotypes (Table 11).
With respect to zones of germplasm collections, genotypes from North Gonder had the
shortest mean plant height, length of panicle, culm and peduncle and smallest diameter of
the second culm internodes (Table 12). Genotypes from South Gonder, on the other hand,
had the longest days to heading and maturity whereas those from West Shewa zone had
the highest value for plant height, culm diameter, harvest index, number of fertile tillers,
panicle length and spikelet per panicle. Furthermore, the highest mean grain yield and
totalbiomass was obtained for genotypes from central Tigray whereas East Gojam, North

48
Shewa and South Gonder had the least value of grain yield, shoot biomass and number of
spikelet per panicle respectively. Genotypes from East Tigray had the highest mean value
for 1000-kernel weight and lodging index while North Wellohad the least mean value for
both traits (Table 13). In general, among all zones, genotypes from Central Tigray and
West Shewa were found to have several desirable traits to increase tef productivity.
Regarding altitudinal classes, collections from below 1500m a. s. l. had the highest mean
value for days to heading and maturity, plant height, length of panicle and peduncle, culm
diameter while those from 1500-2000m a. s. l. had moderate values for some studied traits.
On the other hand, the highest mean value for spikelet per panicle, shoot biomass, grain
yield and 1000-kernel weight were observed for genotypes collected from 2001-2500m a.
s. l. whereas the highest value of lodging and number of fertile tillers was obtained for
genotypes collected from altitude above 2500m a. s. l (Table 13), Thus, based on the
altitude of collections, genotypes obtained from altitudes ranging from 2001-2500m had
more desirable traitsuseful to increase tef productivity.

49
Table 11. Range, mean and Standard error (SE) of mean for 13 different traits of tef
genotypes (based on average of 188genotypes from 14 populations)
Variable
Range Mean+ SE
Minimum Maximum
Value Genotype Value Genotype
Days to heading (days) 40.3 Simada 60.8 Acc. 236760-6 51.1+0.30
Days to maturity (days) 101 Acc. 212614-2 122.5 Melko 114.0+0.29
Plant height (cm) 62.7 Acc. 19506-4 107.1 Acc. 212698-2 85.9+0.59
Panicle length (cm) 19.5 Acc. 55221-1 39.5 Acc. 18460-0 30.4+0.30
Peduncle length (cm) 12.5 Acc. 237205-2 26 Acc. 242160-1 18.9+0.18
Culm diameter (mm) 1.2 Acc. 19506-4 2.1 Acc. 243491-2 1.5+0.01
Fertile tillers (number) 2.1 Acc. 243540-3 5.5 Acc. 242186-4 3.2+0.04
Spikelet per panicle (number) 156.7 Acc. 236760-4 441.7 Acc. 15309-3 312.5+4.37
Shoot biomass (kg/ha) 15.8 RIL-11 36.7 Acc. 237184-1 26.3+0.28
Grain yield (kg/ha) 3.7 RIL-302 7.3 RIL-91 5.6+0.05
Harvest index (%) 14.7 Acc. 237205-2 24.3 Acc. 234407-2 21.73+0.10
Thousand kernel weights (mg) 20.7 Acc. 243513-1 33 Acc. 19241-1 26.7+0.15
Lodging index (%) 44.7 Key Murri 79.3 Acc. 242155-3 67.2+0.42

50
Table 12. Range, mean and standard error (SE) of mean for 13 different traits of tef
genotypes (based on average of 188 genotypes from 12 zones of collections)
Variable Range
Mean+ SE
Minimum Maximum
Value Origin Value Origin
Days to heading (days) 49.0 East Shewa 52.9 South Gonder 51. +0.37
Days to maturity (days) 112.5 North Shewa 114.9 South Gonder 113.9+0.18
Plant height (cm) 80.4 North Gonder 87.7 West Shewa 85.7+0.62
Panicle length (cm) 28.0 North Gonder 31.4 East Shewa 30.0+0.30
Peduncle length (cm) 17.5 North Gonder 20.5 North Shewa 18.9+0.26
Culm diameter (mm) 1.4 North Gonder 1.6 West Shewa 1.5+0.02
Fertile tillers (number) 3.0 East Shewa 3.5 West Shewa 3.2+0.05
Spikelet per panicle (number) 289.6 South Gonder 344.1 West Shewa 305.9+4.4
Shoot biomass (kg/ha) 24.7 North Shewa 28.1 Central Tigray 26.7+0.30
Grain yield (kg/ha) 5.3 East Gojam 6.0 Central Tigray 5.6+0.06
Harvest index (%) 20.5 West Shewa 22.5 East Tigray 21.73+0.09
Thousand kernel weights (mg) 25.6 North Wello 28.2 East Tigray 26.7+0.23
Lodging index (%) 65.3 North Wello 69.4 East Tigray 67.6+0.38

51
Table 13. Range, mean and standard error (SE) of mean for 13 traits of tef genotypes
(based on average of 188 genotypes from 4 altitudinal ranges of collections)
Variable Range
Mean+ SE Minimum Maximum
Value Origin Value Origin Days to heading (days) 51.1 15001-2000m 52.2 <1500m 51.6+0.25
Days to maturity (days) 113.7 15001-2000m 114.6 <1500m 114.1+019
Plant height (cm) 85.5 15001-2000m 87.7 <1500m 86.2+0.51
Panicle length (cm) 30.0 15001-2000m 30.5 <1500m 30.2+0.13
Peduncle length (cm) 18.5 15001-2000m 19.4 >2500m 18.9+0.19
Culm diameter (mm) 1.5 >2500m 1.6 <1500m 1.5+0.01
Fertile tillers (number) 3.0 >2500m 3.3 >2500m 3.2+0.05
Spikelet per panicle (number) 282.0 <1500m 310.2 15001-2000m 301.9+6.65
Shoot biomass (kg/ha) 25.5 >2500m 27.8 15001-2000m 26.3+0.55
Grain yield (kg/ha) 5.4 <1500m 5.7 15001-2000m 5.6+0.05
Harvest index (%) 21.1 2001-2500m 22.4 >2500m 21.73+0.09
Thousand kernel weights (mg) 26.2 >2500m 27.2 15001-2000m 26.7+0.21
Lodging index (%) 66.1 <1500m 68.6 >2500m 67.5+0.53
3.3.2.3 Principal component analysis
3.3.2.3.1 PCA based on individual genotypes
The principal component analysis (PCA) based on 12 quantitative traits of 188tef
genotypes from various genetic and eco-geographic origin was assessed and is presented
(Table 14). Thus, the first three PCs with eigen value greater than unity contributed 60.1%
of the total variation, with PC1, PC2 and PC3 accounted for 32.9%, 15.8% and 11.4% of
the total variation, respectively. All traits other than peduncle length and 1000-kernel

52
weight contributed tomost ofthe variation in PC1(Table 14) whereas the variation in PC2
was mainly due to grain yield and total biomass, lodging index and peduncle length.
Furthermore, peduncle length, 1000-kernel weight, days to heading and grain yield,
respectively was the major traits for the variation in PC3.
Table 14.Principal component analysis for 12 quantitative traits of 188tef genotypes
from various origins
Variable PC1 PC2 PC3
Days to heading (days) 0.323 -0.050 -0.468
Days to maturity (days) 0.368 -0.196 -0.088
Plant height (cm) 0.443 0.051 0.113
Panicle length (cm) 0.359 0.213 -0.046
Peduncle length (cm) 0.076 -0.390 0.520
Culm diameter (mm) 0.387 -0.244 0.091
Fertile tillers (number) -0.217 0.112 -0.262
Spikelet per panicle (number) 0.338 0.013 -0.100
Shoot biomass (kg/ha) 0.267 0.478 0.052
Grain yield (kg/ha) 0.142 0.513 0.399
Harvest index (%) 0.004 -0.135 0.473
Thousand kernel weights (mg) -0.160 0.420 0.127
Eigenvalue 3.866 1.893 1.371
Proportion 0.322 0.158 0.114
Cumulative 32.2 48.0 59.4
3.3.2.3.2 PCA based on 14 genetic and eco-geographic origins
Principal component analysis based on 14 genetic and eco-geographic origins revealed that
the first PCs with eigen value greater than one accounted for 75.8% of the total variations.
In this analysis, PC1, PC2 and PC3 respectively contributed for 39.5%, 21.6% and 14.7%

53
of the total variations (Table 15). Thus, the majority of variations in PC1 were due to
variations in lodging index, panicle length, shoot biomass, days to maturity, plant height
and grain yield whereas those in PC2were due to peduncle length, culm diameter, shoot
biomass and plant height. Likewise, the variation in PC3 was contributed due to variations
in number of spikelet per panicle, 1000-kernel weight and number of fertile tillers.
3.3.2.3.3 PCA based on 12 zones of germplasm collection
The first five PCs based on 12 zones of germplasm collection which had eigen value greater
than oneaccounted for 89.2% of the total variation using 12 quantitative traits of tef. Thus,
PC1, PC2, PC3, PC4 and PC5 accounted for 30.7%, 23.7%, 15.3%, 10.7% and 8.7% of the
total variation respectively (Table 15). Peduncle length, plant height, panicle length and
second culm diameter and shoot biomass were the major contributors for variations in PC1
whereas lodging index, 1000 kernel weight, days to maturity, grain yield and spikelet per
panicle were the major contributors for PC2. On the other hand, the major contributors for
PC3 were days to heading, lodging index, grain yield, shoot biomass and 1000 kernel
weight whereas fertile tillers, lodging index and 1000 kernel weight were for PC4.
Furthermore, 1000 kernel weight, days to heading, second culm diameter and peduncle
length were the major traits accounted for PC5.

54
Table 15. Principal component analysis of 12 traits of tef genotypes based on 14 origins
(left half) and 12 zones (right half) of germplasm collections
Variable
Based on Origins* (14) Based on zones of collections** (12)
PC1 PC2 PC3 PC1 PC2 PC3 PC4 PC5
Days to heading 0.177 0.297 0.271 0.223 -0.187 -0.473 0.134 0.455
Days to maturity 0.366 0.142 0.196 0.198 -0.334 -0.187 -0.369 0.143
Plant height 0.36 -0.311 0.102 -0.411 -0.265 -0.129 -0.222 0.016
Panicle length 0.375 -0.281 0.091 -0.405 -0.291 0.129 0.054 0.179
Peduncle length -0.001 -0.556 -0.098 -0.462 0.057 -0.077 -0.043 -0.335
Culm diameter 0.265 -0.4 0.05 -0.406 -0.181 -0.074 0.178 0.416
Fertile tillers -0.235 0.073 0.451 0.22 -0.125 -0.198 0.637 -0.283
Spikelet per panicle -0.042 -0.269 0.628 -0.125 -0.424 -0.281 0.294 -0.20
Shoot biomass 0.372 0.338 0.016 0.321 -0.317 0.274 -0.126 0.271
Grain yield 0.352 0.129 0.061 0.039 -0.396 0.397 -0.158 -0.213
1000- kernel weights 0.174 -0.084 -0.506 -0.16 0.319 0.328 0.336 0.461
Lodging index 0.38 0.177 -0.029 0.07 -0.329 0.488 0.337 -0.055
Eigenvalue 4.736 2.589 1.768 3.690 2.848 1.838 1.286 1.038
Proportion 0.395 0.216 0.147 0.307 0.237 0.153 0.107 0.087
Cumulative 0.395 0.61 0.758 0.307 0.545 0.698 0.805 0.892
* combined data of populations from12 zones of collections plus one improved variety
plus population of breeding lines. **12 populations from 12 zones of collections.
3.3.2.3.4 PCA based on four altitudes of germplasm collection
For altitude classes, the first two PCs with eigen values greater than one extracted 92.9%
of the total variation. The first PC accounted for 63.9% of the total variation mainly due to
almost all traits other than Peduncle length and 1000-kernel weight (Table. 16). PC2, on
the other hand, accounted for 29% of the total variation whereby peduncle length, 1000-
kernel weight, shoot biomass and fertile tillers contributed for the largest proportion.

55
3.3.2.3.5 PCA based on woredas of germplasm collection
Based on collection Woredas, the first three PCs with eigen values greater than one
extracted 62.5% of the total variation whereby PC1, PC2 and PC3 respectively accounted
for 32.7%, 17.2% and 12.6% of the variations exhibited for collection Woredas. Thus, the
variation in PC1 was mainly due to plant height, days to maturity, second culm diameter,
panicle length and spikelet per panicle (Table. 16). PC2, on the other hand, was based on
the variation mainly resulting from shoot biomass, peduncle length, grain yield and lodging
index whereas the variation in grain yield, days to heading, peduncle length and 1000-
kernel weight were the major contributors to PC3.
Table 16. Principal component analysis for 12 traits of tef based on four altitudinal
zones (left half) and 72 Woredas (right half) of germplasm collections
Variable
Based on altitude Based on collection Woredas
PC1 PC2 PC1 PC2 PC3
Days to heading 0.298 -0.28 0.273 -0.147 -0.526
Days to maturity 0.324 -0.106 0.397 0.146 -0.065
Plant height 0.355 -0.083 0.45 0.053 0.071
Panicle length 0.328 0.148 0.345 -0.245 0.044
Peduncle length 0.001 -0.509 0.116 0.48 0.399
Culm diameter 0.346 0.15 0.381 0.285 -0.013
Fertile tillers -0.286 -0.322 -0.248 -0.086 -0.2
Spikelet per panicle -0.359 -0.023 0.343 -0.253 -0.003
Shoot biomass -0.203 0.385 0.207 -0.485 0.144
Grain yield -0.344 0.12 0.097 -0.36 0.542
Thousand kernel weights -0.028 0.502 -0.001 0.179 0.392
Lodging index -0.285 -0.284 -0.236 -0.339 0.21
Eigenvalue 7.6724 3.475 3.9205 2.0685 1.5094
Proportion 0.639 0.29 0.327 0.172 0.126
Cumulative 0.639 0.929 0.327 0.499 0.625
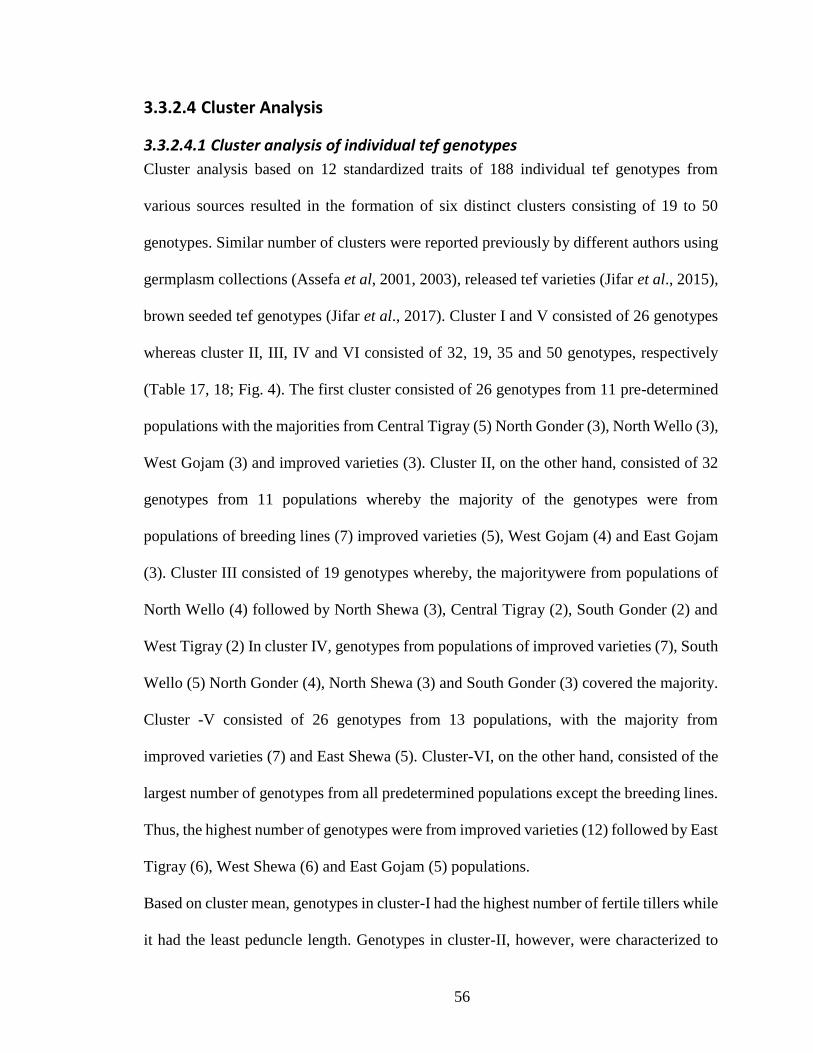
56
3.3.2.4 Cluster Analysis
3.3.2.4.1 Cluster analysis of individual tef genotypes
Cluster analysis based on 12 standardized traits of 188 individual tef genotypes from
various sources resulted in the formation of six distinct clusters consisting of 19 to 50
genotypes. Similar number of clusters were reported previously by different authors using
germplasm collections (Assefa et al, 2001, 2003), released tef varieties (Jifar et al., 2015),
brown seeded tef genotypes (Jifar et al., 2017). Cluster I and V consisted of 26 genotypes
whereas cluster II, III, IV and VI consisted of 32, 19, 35 and 50 genotypes, respectively
(Table 17, 18; Fig. 4). The first cluster consisted of 26 genotypes from 11 pre-determined
populations with the majorities from Central Tigray (5) North Gonder (3), North Wello (3),
West Gojam (3) and improved varieties (3). Cluster II, on the other hand, consisted of 32
genotypes from 11 populations whereby the majority of the genotypes were from
populations of breeding lines (7) improved varieties (5), West Gojam (4) and East Gojam
(3). Cluster III consisted of 19 genotypes whereby, the majoritywere from populations of
North Wello (4) followed by North Shewa (3), Central Tigray (2), South Gonder (2) and
West Tigray (2) In cluster IV, genotypes from populations of improved varieties (7), South
Wello (5) North Gonder (4), North Shewa (3) and South Gonder (3) covered the majority.
Cluster -V consisted of 26 genotypes from 13 populations, with the majority from
improved varieties (7) and East Shewa (5). Cluster-VI, on the other hand, consisted of the
largest number of genotypes from all predetermined populations except the breeding lines.
Thus, the highest number of genotypes were from improved varieties (12) followed by East
Tigray (6), West Shewa (6) and East Gojam (5) populations.
Based on cluster mean, genotypes in cluster-I had the highest number of fertile tillers while
it had the least peduncle length. Genotypes in cluster-II, however, were characterized to

57
have the shortest days to heading and maturity, plant height and panicle length, least value
of second culm diameter, number of spikelet per panicle and shoot biomass and the highest
value of lodging index. Cluster-III had the highest value of days to maturity, peduncle
length and 1000-kernel weight and the lowest value of lodging index with moderate values
for all remaining studied traits. Cluster-IV, furthermore, had the least value for grain yield
and 1000-kernel weight while it had the longest days heading with moderate values for the
remaining traits. Interestingly, cluster-V had the highest values for five of the twelve
studied traits while it had the least value for number of fertile tillers only. Genotypes in
cluster-VI were found to have the highest value of grain yield and average values of all
other studied traits (Table 18). Thus, breeders dealing with high yield should use genotypes
in cluster VI whereas those dealing with early maturity should focus on genotypes in
cluster-II. Besides, in variability creation, excellent level of genetic variability and high
heterosis can be obtained bycrossing genotypes in cluster 2 & 5 followed by cluster 1 & 3,
Cluster 2 & 3 and cluster 1 & 5, respectively (Table 19).
The distribution of 12 investigated traits in tef genotypes across PC1 and PC2 was also
assessed and revealed the formation of four distinct groups. Thus, the first group consisted
of fertile tillers and lodging index; the second group consisted of grain yield and total
biomass; the third group consisted of plant height, panicle length, culm diameter, days to
maturity and days to heading whereas the fourth group consisted of 1000-kernel weight
and peduncle length (Fig. 5). Similarly, the distribution of the studied genotypes across the
first two PCs was also analyzed and it showed no distinct grouping pattern similar with
that of the clustering of individual genotypes (Appendix Fig. 1) may be due to the fact that
the two PCs together accounted for less than 60% of the total variations.

58
Table 17. Clustering of 188 tef genotypes into six clusters using mean of 12 morpho-
agronomic characters
Cluster No of
genotypes
Name of genotypes
C1 26 Acc. 19166-1, 19253-1, 234407-2, 243513-3, 243520-2, 19516-1, 55221-1,
18466-3, 236972-0, 234460-3, 9448-1, 242186-4, 243540-1, 15322-1, 212482-1,
215200-1, 237148-1, 243501-2, 19506-4, 242140-3, 55029-2, 18410-2, 237236-
4, Holeta Key, Key Tena, Yilmana
C2 32 Acc. 243513-1, 55221-2, 229768-3, 55046-3, 242540-2, 9472-4, 15309-2,
234993-1, 19341-2, 225919-3, 212614-2, 225898-1, 19394-1, 19452-4, 242155-
1, 242155-3, 17365-1, 236760-1, 9444-2, 234435-2, Asgori, Tseday, Amarach,
Simada, Boset, Kaye Murri, RIL-85, RIL-91, RIL-96, RIL-11, RIL-302 and RIL-
69
C3 19 Acc. 19132-2, 19132-3, 236965-1, 19202-2, 9559-1, 9559-2, 236746-0, 55104-3,
215200-2, 234985-2, 234993-3, 19341-3, 19374-1, 242214-1, 242144-1, 237236-
3, 237239-3, Magna and RIL-81.
C4 35 Acc.234407-1, 237205-2, 19516-3, 18466-2, 19201-1, 242540-1, 9448-2, 9469-
2, 9472-2, 243540-3, 15309-3, 18385-2, 236745-2, 215196-1, 234356-4, 212717-
0, 225919-2, 225919-7, 212607-2, 212612-3, 2433497-2, 243504-1, 243504-3
and 19443-3, 18423-3, 236757-2, 19241-1, 243526-2, Holenkomi, Melko, Gibe,
Gerado, Dega Tef, Gemechis and Kena
C5 26 Acc.19253-2, 55046-2, 15361-3, 17335-1, 18460-0, 236963-1, 236965-3, 19201-
3, 9451-2, 242186-3, 15322-2, 19367-2, 212720-1, 242214-2, 19506-2, 18414-4,
9444-3, 243526-5, Genet, Zobel, Quncho, Guduru, Etsub, Laketch, Kinde and
Kora
C6 50 Acc.237184-1, 9545-1, 9556-1, 212698-2, 229768-1, 229768-4, 236963-2,
236967-1, 236967-2, 15297-1, 15297-2, 15299-1, 15299-3, 234460-1, 234460-2,
19343-2, 243540-4, 236748-2, 236957-1, 215200-3, 237148-5, 55293-2, 225919-
4, 242160-1, 212614-1, 243491-2, 243504-2, 242144-3, 55029-3, 17371-3,
18410-1, 18410-3, 18414-2, 236760-4, 236760-6, 9419-1, 19241-2, 243526-4,
Enatit, Menagesha, Ziquala, Dukem, Ambo-Toke, Koye, Gola, Ajora, Dima,
Gimbichu, Mechare and Workiyu

59
Figure 4. Dendrogram showing the genetic relationship among 188 tef genotypes from
various sources in Ethiopia using 12 major traits. Genotypes and zones of collections are
described as 1-12 (central Tigray), 13-24 (East Gojam), 25-36 (East Shewa), 37- 48 (East Tigray),
49-60 (North Gonder), 61-72 (North Shewa), 73-84 (North Wello), 85-96 (South Gonder), 97-108
(South Wello), 109-120 (West Gojam), 121-132 (West Shewa) and 133-144 (West Tigray).
Improved varieties (145-179) and breeding lines (180-189) are written in red and blue color,
respectively.

60
Figure 5. Distribution of 12 traits of 188 tef genotypes across PC1 and PC2
Table 18. Cluster means of 12 quantitative traits of 188 tef genotypes
Traits
Cluster Means
I II III IV V VI
Days to heading 50.86 47.23 52.21 54.45 54.14 49.33
Days to maturity 111.97 108.92 116.32 116.17 115.51 115.22
Plant height (cm) 80.16 77.54 84.74 87.97 95.01 88.33
Panicle length(cm) 29.25 26.40 25.60 32.33 34.42 32.03
Peduncle length(cm) 16.16 18.88 22.06 18.19 18.85 19.58
Culm diameter(mm) 1.42 1.41 1.65 1.58 1.70 1.54
Number of fertile tillers 3.87 3.36 2.91 3.38 2.85 3.02
Number of spikelet per panicle 275.93 266.89 308.84 368.52 379.65 350.94
Shoot biomass (kg/ha) 27.57 23.53 24.17 24.99 28.99 27.87
Grain yield(kg/ha) 5.78 5.38 5.08 4.92 5.87 6.02
Thousand kernel weights 26.60 26.59 28.11 26.09 27.01 26.62
Lodging index 68.69 69.50 62.72 67.44 63.88 68.04

61
Table 19.Distance among six clusters of 188 tef genotypes
Cluster1 Cluster2 Cluster3 Cluster 4 Cluster5 Cluster6
Cluster1 0
Cluster2 9.73 0
Cluster3 30.67** 26.65** 0
Cluster4 12.51 20.96 17.14 0
Cluster5 25.34** 38.98** 19.17 12.23 0
Cluster6 12.97 19.55 16.07 9.63 6.81 0
*** Significant at 1% probability level
3.3.2.4.2 Clustering of tef populations
Clustering based on 14 populations of tef from various genetic and eco-geographic origin
resulted in the formation of four distinct clusters (Fig. 6& 7). The number of genotypes in
each cluster ranged from one to six genotype in cluster-I V & III, respectively. The first
and second cluster, on the other hand, consisted of three and four genotypes, respectively.
In this study, the breeding lines remained solitary whereas the improved varieties were
grouped along with populations from the different zones of Shewa, and those from North
Gonder and West Tigray zones. The grouping of populations from different parts of Shewa
zones is due to geographic proximity along the three zones. Cluster-I consisted of three
populations from Central Tigray, North Wello and West Gojam whereas, cluster-II
consisted of four populations from East Gojam, East Tigray, South Gonder and South
Wello. Here, the grouping of Central Tigray population with that of the West Gojam could
be due to trans human seed exchanges among regions and zones. On the other hand, the

62
largest inter cluster distance was observed between Cluster 3 & 4 followed by Cluster 2 &
4, and 1 & 4 to provide best level of genetic recombination (Table 20).
Biplot analysis of the 12 traits of the 14 populations resulted in the formation of four major
groups (Fig.8). Thus, group-I consisted of fertile tiller whereas group-II consisted of days
to heading, days to maturity, lodging index, total biomass and grain yield. Group-III
consisted of 1000-kernel weight, plant height, panicle length and culm diameter while
Group-IV consisted of peduncle length spiklet per panicle.
Figure 6. Clustering pattern of the 14 populations based on genetic and eco-geographic
origins
Breed
ing
lines
Wes
t Tigr
ay
Wes
t Shew
a
Nort
h She
wa
Nor
th G
onder
Impro
ved
East
She
wa
South
Wello
South
Gond
er
East
Tig
ray
East G
ojam
Wes
t Goja
m
Nor
th W
ello
Central T
igra
y
0.00
33.33
66.67
100.00
Genetic and eco-geographic origns of genotypes
Sim
ilari
ty
Cluster-I Cluster-II
Cluster-III Cluster-IV

63
Figure 7. Biplot showing the distribution of 14 populations based on genetic and eco-
geographic origins
Table 20. Distance among four clusters of 188 tef genotypes
Cluster 1 Cluster 2 Cluster 3 Cluster 4
Cluster 1 0
Cluster 2 3.21 0
Cluster 3 3.84 2.97 0
Cluster 4 6.08 7.01 7.78 0

64
Figure 8. Biplot showing the distribution of 12 traits of the 14 populations across PC1 &
PC2
3.3.2.4.3 Clustering of tef collection zones
Clustering based on 12 zones of tef germplasm collection grouped the 12 zones into three
distinct clusters (Fig.9 and 10). Thus, cluster I, II and III consisted of three, four and five,
respectively. The first cluster consisted of Central Tigray, North Wello and West Gojam
zoneswhereas cluster-II includes East Tigray, East Gojam, South Gonder and South Wello
zones. Cluster-III, on the other hand, consisted of the three Shewa zones as well as North
Gonder and West Tigray zones. This grouping based of zones is in line with the origin-
basedclustering whereby the same zones were grouped under the three clusters (I, II & III).
Biplot analysis based on 12 traits of the 12 collection zones formed four major groups
(Fig.11) whereby group 1 consisted of days to heading and days to maturity whereas group
culm diameter, spiklet per panicle, plant height, panicle length, total biomass, and grain
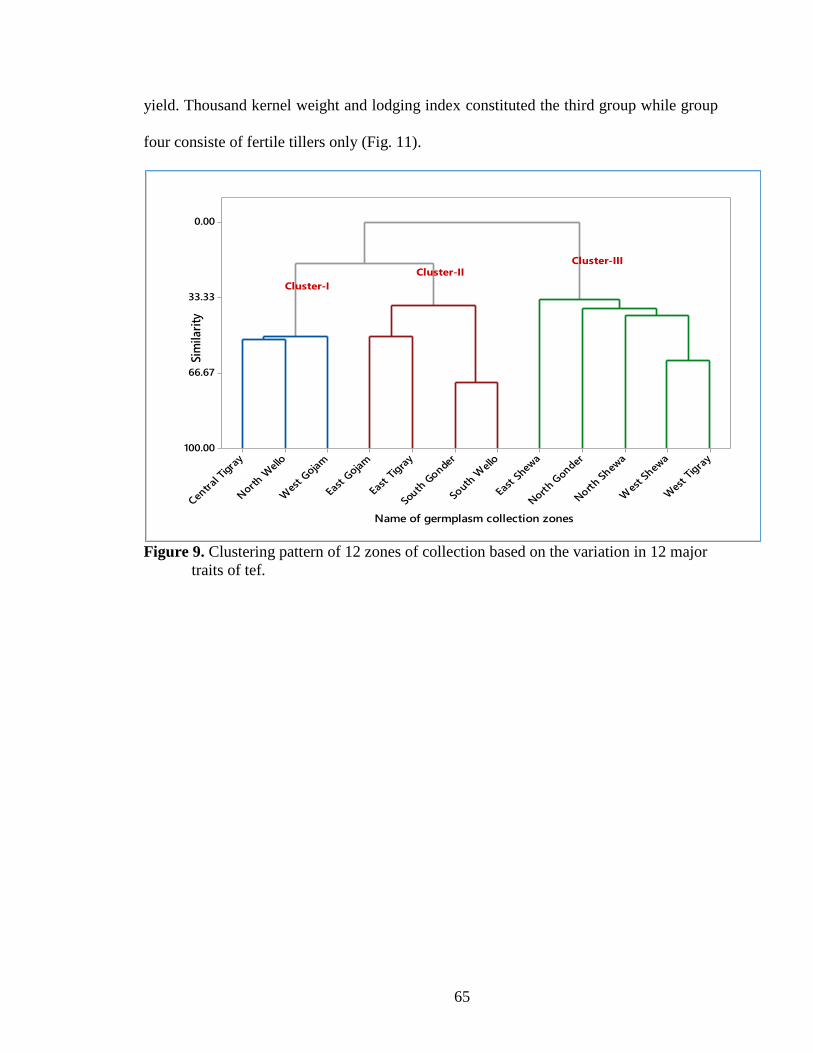
65
yield. Thousand kernel weight and lodging index constituted the third group while group
four consiste of fertile tillers only (Fig. 11).
Figure 9. Clustering pattern of 12 zones of collection based on the variation in 12 major
traits of tef.
Wes
t Ti
gray
Wes
t Shew
a
Nort
h Shew
a
Nort
h Gon
der
East
She
wa
Sout
h Wel
lo
South
Gonde
r
East
Tig
ray
East
Goja
m
Wes
t Goja
m
Nort
h Wel
lo
Centr
al T
igra
y
0.00
33.33
66.67
100.00
Name of germplasm collection zones
Sim
ilari
ty
Cluster-I
Cluster-IICluster-III

66
Figure 10. Biplot showing the distribution of 12 zones of tef germplasm collections
Figure 11. Biplot showing the distribution of 12 traits of the 12 collection zones on PC1
and PC2

67
3.3.2.4.4 Clustering of tef collection altitudes
Clustering based on the altitude of collectionsgrouped the four populations into three
distinct clusters (Fig.12 and 13). Thus, cluster I consisted ofcollections from below 1500m
a. s. l while, cluster II consisted of collections from 1501-2000 and from 2001-2500m a. s.
l. The third cluster, on the other hand, consisted of those collected from above 2500m. Thus,
the upper (>2500m) and the lower (<1500m) altitudinal classes appeared solitary while the
middle two altitudinal classes were grouped together.
Biplot analysis of the 12 traits of four altitudes of collections resulted in the formation of
four major groups (Fig. 14). Thus, group-I consisted of four yield related traits such as
number of spikelets per panicle, 1000-kernel weight, grain yield and total biomass while
group-II consisted of panicle length, plant height, second culm diameter, days to heading,
and days to maturity. Group-III, on the other hand, constituted of peduncle length onle
while, cluster IV consisted of lodging index and number of fertile tillers.
Figure 12. Dendrogram based on complete linkage Euclidean distance showing
clustering pattern among four altitudes of collections using 12 major traits of tef.
>2500m2001-2500m1500-2000m<1500m
0.00
33.33
66.67
100.00
Altitudinal classes
Sim
ilarit
y (%
)
Cluster-I
Cluster-II
Cluster-III

68
Figure 13. Biplot showing the distribution of four altitudes of tef germplasmcollections
Figure 14. Biplot showing distribution of 12 traits of tef from four altitudes of collection
across PC1 & PC2
3.3.2.4.5 Clustering based on germplasm collection Woredas
Cluster analysis based on collection Woredas formed five groups (Fig. 15 &Appendix Fig.
2). Thus, the first cluster consisted of 10 collection woredas which include Amhara (4),

69
Tigray (3) and Oromia (3) regions while the second cluster consisted of 23 woredas from
Amhara (15), Tigray (4) and Oromia (4) regions. Cluster-III, on the other hand, consisted
of 23 woredas from Amhara (11), Tigray (7) and Oromia (5) regions while, cluster-IV
consisted of 14 woredas from Amhara (9), Tigray (2) and Oromia (3) regions. Cluster-V,
however, consisted of two Woredas namely Lay Gayint from Amhara and Arsi Negele
from Oromia region. In this grouping no two adjacentworedas were grouped together. In
PCA-biplot analysis, the 12 investigated traits were grouped into five groupsbased on
collection woredas (Fig. 16). The first group consisted of peduncle length and 1000-kernel
weight while the second group consisted of culm diameter, days to maturity and plant
height. The third group, however, consisted of days to heading, number of spikelet per
panicle and panicle length while, the fourth group consisted grain and total biomass. The
fith group consisted of number of fertile tillers and lodging index,
Figure 15. Dendrogram based on complete linkage Euclidean distance showing
Lay G
yin
tA
rsi N
eg
ele
Ko
la D
iba
Tehule
dere
Tse
lem
tiElu
F.S
ela
mB
ele
saK
ew
et
L.C
hukala
Fart
aM
ere
b L
ehe
Chilg
aH
ab
ruJ.
Tehnan
Ad
da B
erg
aL.
Kem
kem
Makse
gnit
Gim
bic
hu
Dera
Kalu
H. A
wula
loA
wab
el
E.H
am
us
Ad
igra
tW
ench
iSele
hle
ha
W.G
oro
M.S
henko
raT.D
ing
ay
Fo
gera
Wukro
Kuta
ber
Deje
nT. K
ura
roA
det
Shir
aro
H.A
bo
teA
.Chukala
H.E
j Enese
D.T
ela
tgen
Bako
Tib
eK
.Tem
ben
D.D
ela
nta
S.D
eb
rina
Sekela
D.T
em
ben
Ata
ye
Guza
mn
Ad
wa
Weliso
Deb
re S
ina
Mech
aB
/Dar
Zuri
aB
ure
G.A
fesh
um
Est
eG
ub
a L
aft
oG
ond
er
Zuri
aA
mb
ase
lEnem
ay
Ad
dis
Zem
en
K.A
wula
loTenta
Dess
ie Z
uri
aC
hliya
Hag
re S
ela
mG
ohats
ion
M, Zana
Y.G
ule
leK
ob
oA
chefe
r
0.00
33.33
66.67
100.00
Names of germplasm collection Woredas
Sim
ilar
ity
Cluster-ICluster-II
Cluster-III Cluster-IV Cluster-V

70
clustering pattern among 72 woredas of germplasm collections.
Figure 16. Clustering pattern of 12 major traits of tef based on collections of 72 woredas
3.3.2.5 Estimates of variance components, heritability and genetic advance
3.3.2.5.1 Phenotypic and Genotypic Coefficient of Variation
In this study, the PCV values ranged from 0.06% forlodging indexto 19.2% for number of
spikelet per panicle while GCV ranged from 0.0% for lodging index to 17.0% for number
of fertile tillers (Table 21). Panicle length, peduncle length, number of fertile tillers and
spikelet per panicle were found to have intermediate values of both GCV and PCV while
second culm diameter, yield of shoot biomass and grain had such intermediate value at
PCV level only. All remaining traits had low PCV and GCV while no traits showed high
value in both cases.

71
3.3.2.5.2 Broad sense heritability (h2) and Genetic advance
Heritability and genetic advance are important factors determining the success of selection
in breeding programs. Estimates of heritability (h2) in the present study ranged from near
zero per cent for lodging index to 96.6% for plant height (Table 21). Thus, the highest
heritability estimates were observed for plant height (96.6%), panicle length (95.1%),
peduncle length (91.1%) and number of fertile tillers per plant (83.7%). Lodging index,
1000-kernel weight, days to maturity, grain yield and second culm diameter, on the other
hand, exhibitedrelatively low heritability value of below 40%. Estimates of genetic
advance as percent of mean ranged from 0% for lodging index to 32.0 % for number of
fertile tillers (Table 21). In this study, highest heritability coupled with high genetic
advance were estimated for plant height (96.6%, 18.8%), panicle length (95.1%, 26.4%),
peduncle length (91.1%, 24.6%) and number of fertile tillers per plant (83.7%, 31.9%)
showing that they are predominantly controlled by the additive gene action. This indicates
that additive gene action plays key role in controlling the expression and existence of
highly expected genetic gain through selection.

72
Table 21. Estimates of variance components, heritability and genetic advance for 188 tef genotypes evaluated at two locations
Traits gσ2 glσ2 lσ2 eσ2 Phσ2 σPh σg GCV (%) PCV (%) H2 GA GA (%) Grand
Mean
DH 11.00 8.81 528.42 5.47 16.32 4.04 3.32 6.49 7.91 67.42 5.61 10.98 51.09
DM 4.82 18.69 905.30 7.86 15.48 3.93 2.20 1.93 3.45 31.15 2.52 2.21 114.0
PH 63.14 0.02 3.86 13.48 65.40 8.09 7.95 9.25 9.42 96.55 16.1 18.73 85.86
PL 16.01 0.0 2.44 4.91 16.83 4.10 4.00 13.2 13.5 95.14 8.04 26.43 30.42
PdL 5.56 0.0 0.38 3.25 6.10 2.47 2.36 12.5 13.1 91.12 4.64 24.56 18.88
SCD 0.01 0.02 0.28 0.04 0.03 0.16 0.10 6.54 10.7 37.50 0.12 7.56 1.53
FT 0.30 0.0 0.11 0.35 0.36 0.60 0.55 17.0 18.5 83.72 1.03 31.94 3.23
SPK 1384.9 4102.9 11376.3 896.7 3585. 8 59.9 37.2 11.9 19.2 38.62 47.6 15.25 312.5
SBM 5.44 18.42 65.23 1.09 14.83 3.85 2.33 8.85 14.6 36.68 2.91 11.04 26.34
GY 0.14 0.53 1.18 0.05 0.41 0.64 0.37 6.73 11.6 33.87 0.45 8.17 5.56
TKW 0.37 5.26 0.56 6.41 4.07 2.02 0.61 2.28 7.55 9.09 0.37 1.40 26.72
LI 0.0 66.85 5.62 21.33 36.98 6.08 0.00 0.00 0.06 0.00 0.00 0.00 67.15
Abbreviations: DH: days to heading; DM: days to maturity; GFP: grain filling period; PH: plant height; PL: panicle length; CL: culm length;
Pdl: peduncle length; SCD: second culm diameter; TT: number of total tillers; FT: number of fertile tillers; SPK: number of spikelet; TBM:
total biomass; GY: grain yield; HI: harvest index; TKW: thousand kernel weight; LG: lodging index.

73
3.3.2.6 Association among major traits of tef genotypes
Days to heading and maturity showed positive and significant (P<0.01) phenotypic
association with all traits other than number of fertile tillers per plant, number of spikelets
per panicle, shoot biomass, grain yield and 1000-kernel weight which were found to be
significant (P<0.01) but negatively correlated (Table 22). Besides, plant height had positive
and significant association with all traits except with number of fertile tillers which were
significantly and negatively associated. On the other hand, the grain yield,1000-kernel
weight and lodging index were not significant (P>0.05). Likewise, panicle length was
positively and significantlycorrelated with all traits other thanfertile tillers which was
negatively correlated (P<0.05). However, pnicle length was negatively associated with
shoot biomass, grain yield and 1000-kernel weight. Furthermore, peduncle length had
positive and significant association with phenological and morphological traits whereas it
had negative association with all agronomic and yield traits. However, its association with
1000-kernel weight and lodging index was not significant. Shoot biomass and grain yield
had negative and significant phenotypic association with all traits other than number of
fertile tillers, number of spikelets per panicle, 1000-kernel weight and with each other
while their association with panicle length and lodging index was not significant (P>0.05).
The association of lodging was positive and significant with days to heading and maturity,
and panicle length while all remaining traits other than number of spikelets per panicle
were not significant (P>0.05).
At genotypic level, the association of days to heading was negative and significant with all
traits except with days to maturity, plant height, panicle length, second culm diameter,
number of spikelets per panicle and shoot biomass which were positively correlated with

74
it (Table 22). Similarly, days to maturity had positive and significant association with all
traits other than number of fertile tillers and lodging index whereas grain yield and 1000-
kernel weight had no significant association with it. Plant height, on the other hand, had
positive and significant association with all traits other than fertile tillers which had
negative and significant association whereas its association with 1000-kernel weight and
lodging index were not significant (P>0.05). The genotypic association of grain yield with
all traits other than plant height, shoot biomass and panicle length was not significant
(P>0.05). Furthermore, lodging index had no genotypic correlation with all traits (P>0.05)
other than days to heading and maturity, peduncle length and second culm diameter which
were negative and significant while its association with fertile tillers and grain yield was
found to be positive and significant (P<0.05).

75
Table 22. Genotypic (upper) and Phenotypic (lower) correlation among 12 traits of 188 tef genotypes evaluated at Holetta and
Debre Zeit in 2016
Trait DH DM PH PL PdL SCD FT SPK SBM GY TKW LI
DH 1 0.49*** 0.48*** 0.32*** -0.18* 0.45*** -0.15* 0.34*** 0.34*** -0.13ns -0.11ns -0.25***
DM 0.95*** 1 0.51*** 0.38*** 0.20*** 0.51*** -0.26*** 0.41*** 0.26*** -0.01ns 0.03ns -0.35***
PH 0.26*** 0.24*** 1 0.71*** 0.24*** 0.63*** -0.32*** 0.51*** 0.41*** 0.28*** 0.02ns -0.10ns
PL 0.30*** 0.29*** 0.68*** 1 -0.07ns 0.40*** -0.11ns 0.48*** 0.37*** 0.26*** -0.03ns 0.02ns
PdL 0.14*** 0.20*** 0.21*** 0.01ns 1 0.28*** -0.17* 0.07ns -0.24*** -0.04ns 0.17* -0.16*
SCD 0.83*** 0.85*** 0.33*** 0.33*** 0.25*** 1 -0.33*** 0.42*** 0.19* 0.04ns 0.13ns -0.39***
FT -0.30*** -0.32*** -0.19*** -0.06* -0.16*** -0.30*** 1 -0.20** -0.14* -0.14ns -0.04ns 0.17*
SPK -0.62*** -0.63*** 0.14*** 0.07* -0.10*** -0.50*** 0.14*** 1 0.22** 0.14ns -0.11ns -0.14ns
SBM -0.69*** -0.72*** 0.07* -0.01ns -0.23*** -0.61*** 0.17*** 0.56*** 1 0.66*** 0.00ns 0.05ns
GY -0.67*** -0.67*** 0.04ns -0.03ns -0.14*** -0.57*** 0.14*** 0.51*** 0.80*** 1 0.00ns 0.19*
TKW -0.17*** -0.15*** -0.02ns -0.06ns 0.04ns -0.10*** 0.05ns 0.05ns 0.12*** 0.11*** 1 -0.02ns
LI 0.13*** 0.11*** -0.02ns 0.06* -0.06ns -0.01ns 0.01ns -0.17*** -0.04ns 0.00ns -0.06ns 1
Abbreviations: DH: days to heading; DM: days to maturity; GFP: grain filling period; PH: plant height; PL: panicle length; CL: culm length;
Pdl: peduncle length; SCD: second culm diameter; TT: number of total tillers; FT: number of fertile tillers; SPK: number of spikelet; TBM:
total biomass; GY: grain yield; HI: harvest index; TKW: thousand kernel weight; LG: lodging index.

76
Discussion
Qualitative traits diversity
Panicle form, andthe colour of grain, lemma and stalk are the most important qualitative traits
to distinguish among various tef genotypes (Berhe et al., 1989; Tefera et al., 1990, 1995;
Ketema, 1997). In the present study, the qualitative traits variation among tef genotypes were
assessed andexistence of wide range of variation was observed. Regarding seed colour, most
improved varieties, breeding lines and genotypes from West Gojam, West Shewa and three
zones of Tigray exhibited white seed colour while those from North and South Gonder,
North and South Wello, East Gojam and North Shewahad brown seed colours. On the other
hand, the majority of genotypes from East Shewa zone exhibitedvery white seed colour
(Table 6). Such larger proportion of very white seed colourcould be a justification for the
premium market price for tef grain from in east Shewa zone (Belay et al., 2008).
According to Tefera et al (1990), panicle forms are the determinant trait to know about the
yielding potential of a given tef genotypewhereby genotypes with loose panicle forms are
high yielding and the most adapted type. In the present study, the loose and fairly loose
panicle forms accounted for the largest proportion in almost all zones of tef germplasm
collections& this is in line with the previous findings (Tefera et al.,1990). This is, therefore,
a good opportunity to make selection for yield related traits, earliness and better
addaptationas loose panicle forms are early maturing, adapted and higher
yieldingcompared to compact forms (Tefera et al., 1992, 1995; Ketema, 1997). Thus, early
maturing genotypes are useful to overcome the recurrent climate change problem as well
as to use them for double cropping to increase tef productivity per unit area.
77
Variation in quantitative traits of tef
Quantitative traits are another important features to distingush among tef genotypes. In this
study, highly significant variation was revealed among genotypes, locations and their
interactions for all studied traits of tef genotypes. Thus, the days to heading and maturity
ranged from 40.3 to 60.8 and 101 to 122.5 days respectively. Assefa et al. (2001) also
reported values ranging from 37- 46 and 83-101 for days to heading and maturity
respectively based on study conducted using germplasm collections whereas, Tefera et al.
(1990) reported a range of 82-113 for days to maturity. Such variations are very essential
to augment the efforts to develop varieties fitting to various agro-ecologies and cropping
systems to increase tef production and productivity in Ethiopia. Thus, focusing on traits for
ealiness enables breeders to develop variety that can escape late season drought happening
due to climate change.
The values of plant height and panicle forms that rangedfrom 60.7cm to 107.1cm and
19.5cm and 39.5cm, respectivelyin the present studyis in line with the previous findings
ofTefera et al., (1992) who reported 73.6 -123 cm for plant height and 41.2 to 56.3cm for
panicle length. Tadesse (1993) also reported 71.3-93.7cm for plant height and 27.9-40.6cm
for panicle form while, Assefa et al (2001) reported 28.1-38.8 cm for panicle length
usinggermplasm collections from North and Central Ethiopia.
In the present study, a widerange of values were observed for number of spikelet per
panicle (156.7 to 441.7) and harvest index (14.7 to24.3%). These observed ranges are wider

78
than the previous report of 224.3 - 427.4 and 16.9-28.8% for number of spiklet per panicles
and harvest index, respectively (Assefa et al., 2001). Regarding altitudinal classes,
collections from 2001 to 2500m asl exhibited most of the desirable traits in tef. Similar
findings have also been reported previously (Ketema, 1993, 1997) whereby altitude from
1800-2400m asl was identified as ideal tef production environment.
Principal component analysis
In this study, the variation explained based on individual genotypes, 14 populations, 12
zones and four altitudes of collections were analysed. Thus, it showed that the first three
PCs, three PCs, five PCs and two PCs with eigen vale greater than unityaccounted for
59.4%, 75.8%, 89.2% and 92.9% oftheir respective total variationbased on twelve
quantitative traits. Thus, the observed values for individual genotypes was very small while
those for the remaining three factors was comparable to the previous reports. For instance,
Assefa et al. (2003), reported 81% of the total variance explained for germplasm collected
from south and western Ethiopia whereas Jifar et al (2015) reported 78.3% based on 36
brown seeded tef genotypes. Besides, it is also far below the studies conducted using 28
semi dwarf tef genotypes (Jifar et al., 2017) who reported 85% for the first five PCs. The
variation in PC1 was due to all studied traits other than peduncle length and 1000-kernel
weight whereas that of PC2 was mainly due to grain yield, shoot biomass, lodging index and
peduncle length. However, grain yield, 1000-kernel weight and days to heading were the major
traits contributing to the variation in PC3 (Table 15). Various authors also reported the
contribution of different phenotypic traits to each PCs in tef (Assefa et al., 2003; Lule et
al., 2011; Jifar et al., 2013; Plaza et al., 2013; Jifar et al., 2015a & b; Jifar et al., 2017).

79
Cluster Analysis
Cluster analysis based on 188 individual tef genotypes revealed the formation of six
clusters consisting of 19 to 50 genotypes whereas the clustering based on 14 populations
resulted in the formation of four clusters consisting of 1 to 5 populations. In this clustering,
the grouping of individual genotypes or populations into a given cluster was neither purely
based on geographic nor genetic origin. In population clustering, for instance, the improved
varieties were grouped with East, West and North Shewa, North Gonder and West Tigray
zones while the breeding lines remained solitary. The grouping ofpopulations from three
zones of Shewa in the same cluster could be due to geographic proximityand seed exchange
along their borders. On the other hand, the grouping of Central Tigray with West Gojam
zonesor the grouping of East Tigraywith East Gojam population could be due to seed
movement by trans humans. Such seed movement may occur during resettlement program
conducted about40 years ago when people from Tigray were forced to move to the western
parts of Ethiopia due to continuous failure of rainfall. In the present study, therefore, seeds
from adjacent zones and/or distant origin wasclustered together may be due to geographic
proximity and/or trans human seed exchange.
In individual genotypes clustering, genotypes cluster-I exhibited the longest days to
maturity, peduncle length, thicker culm diameter and the least value for lodging percentage.
Cluster-II, however, consisted of 32 genotypes with the longest days to heading, plant
height and panicle length, the highest number of spikelet per panicle, yield of grain and
totalbiomass with the least number of fertile tillers. The third cluster had moderate
performance for all studied traits while genotypes in cluster-IV exhibited the lowest value
ofpeduncle length and 100-kernel weight with the highest grain yield while the genotypes

80
in cluster-V were identified to have the highest value for 1000-kernel weight and lodging
percent. The sixth cluster, however, had the least value for all traits other than peduncle
length, 1000-kernel weight and lodging percent with the highest number of fertile tillers
(Table 18).
The PCA-biplotsfor the 188 individual genotypes, 14 populations, 12 zones of collections,
four altitudesand 72 Woredas of germplasm collection also revealed similar patterns of
clustering with that of ther respective dendrogram (Fig. 3, 5, 6, 8, 10, 11 & 13).
Furthermore, in this study, genotypes in cluster-II can be recommended for breeders
dealing with high yield whereas those dealing with early maturity should focus on
genotypes in cluster-VI. In variability creation, excellent level of genetic variability and
high heterosis can be obtained between cluster 2 &5 followed by cluster 1&3, and cluster
2&3, and cluster 1& 4, respectively for individual clustrs. In the case of population
clustering, the best genetic recombination and high level of heterosis can be obtained by
making crossingbetween cluster 3 & 4, Cluster 2 & 4, cluster 1 & 4, respectively.
Estimates of variance components, heritability (H2) and genetic advance
PCV and GCV values below 10%, 10%-20% and above 20% are considered to be low,
intermediate and high, respectively (Khorgade et al., 1985). In the present study, about
41.7% and 66.7% of the studied traits had low PCV and GCV values respectively whereas
the remaining traits had intermediate PCV and GCV. Thus, panicle length, peduncle length,
number of fertile tillers and spikelet per panicle had intermediate values of both GCV and
PCV while second culm diameter, yield of shoot biomass and grain had such intermediate

81
value at PCV level only (Table 21). All remaining studied traits had low PCV and GCV
while no trait was observed to have high PCV or GCV in this study. The range of values
estimated in the present study is in line with the previous reports of 6.1 to 40.2% for PCV
and 3.0 to 22.1% for GCV by Assefa et al. (1999), 4.3 to 21.7 for PCV and 4.0 to 20.3%
for GCV (Jifar et al., 2015a) while it is observed to be far below the previous report of 2
to 58% for PCV and less than 1 to 35% for GCV (Assefa et al.,2000). Furthermore, the
GCV (6.73%) and PCV (11.6%) estimated for grain yield in the present study is far below
the previous report for the same traits (GCV=21.3 and PCV=21.7) (Jifar et al., 2015b)
High heritability indicates high proportion of genetic variance that could be inherited and
would be exploited by breeders to select superior genotypes based on phenotypic
performance (Peter et al., 2008; Tazeen et al., 2009, Atnaf et al., 2017). Singh (2000)
suggested the importance of considering heritability along with genetic advance. In the
present study, higher heritability coupled with high genetic advance was estimated for three
morphological traits and number of fertile tillers. This shows the role of additive gene
action in controlling their expression and the existence of high expected genetic gain
through selection.
Association among major traits of tef
The existence of significant positive associations (Table 22) among grain yield and that of
totalbiomass, thousand kernel weight and number of spikelets per panicle indicates that
improving one of them would bring an improvement in the other trait. Thus, selection for
such related traits can be made based on traits that can be assessed relatively easily. In line
with these findings, significant positive association were reported between grain yield and

82
that of totalbiomass and harvest index in the previous studies by several researchers
(Chanyalew et al., 2006; Chanyalew et al., 2009; Jifar and Assefa, 2013; Jifar et al., 2015a;
Jifar et al., 2015b; Jifar et al., 2017). Similarly, positive and significant phenotypic
association observed between lodging and days to heading, days to maturity and panicle
length is also in line with the previous findings of Jifar et al. (2015b) and Jifar et al. (2017).
The positive phenotypic correlation between lodging index and that of phenological traits
imply that long maturing genotypes expected to have higher yield is susceptible lodging
and vice versa.

83
Chapter 4 4. Genetic diversity and population structure analyses in Tef [Eragrostis tef
(Zucc.) Trotter] genotypes usingmicrosatellite markers
Abstract
Tef [Eragrostis tef (Zucc.) Trotter] is a major cereal crop widely grown and utilized in
Ethiopia. As more than half of our current germplasm holdings were not yet characterized
conducting more studies are required with regard. One hundred eightnine tef genotypes
from various sources in Ethiopia were studied using 16 simple sequence repeat markersto
characterize and assess the genetic diversity and pattern of relationship among tef
genotypes. A total of 260 alleles were identified with a mean of 16.25 alleles per locus. The
number of alleles, polymorphic information content (PIC), gene diversity and allelic
richness per locus ranged from 2 to 26, 0.30 to 0.92, 0.37 to 0.93 and 2 to 10.6, respectively.
Improved varities and collections from North Shewa and East Tigray respectively exhibited
the largest average allelic richness (8.9), gene diversity (0.85) and private allele (0.63),
whilebreeding lines had the least values for all genetic parameters. Furthermore, the rare
and intermediate alleles constituted together 99.2% while abundant alleles accounted
for0.8%. Molecular analysis of variance revealed a variation of 56.6% within individuals,
40.8% among individuals within population and 2.6% among populations. Genetic
differentiation (FST) showed the existence of high genetic variation among the various
origins of genotypes. Clustering analysis of population and individual genotypes revealed
formation of fourclusters. The model-based approach of structure softwarealso inferred
four gene pools, but withhigh level of admixtures amongthe various gene pools. A core
collectionconsisting 64(33.9%) of the genotypes and 100% of the alleles for the entire
genotypes was identified. In general, existence of substantial polymorphism among
genotypes from diverse sources shows the potential of using these variabilities in the future
improvement of tef.
Key words: Allelic richness, cluster analysis, Eragrostis tef, genetic diversity,
microsatellite markers, population structure, Tef,

84
Introduction
Tef [Eragrostis tef (Zucc.) Trotter] is a gluten free (Spaenij-Dekking et al., 2005),
nutritious human food (Ketema, 1993; Assefa et al., 2011) and livestock feed (Bediye and
Fekadu, 2001; Yami, 2013). It is an indigenous cereal domesticated by pre–Semitic
inhabitants of Ethiopia between 4000 and 1000 B.C. (Ketema, 1997; Tessema, 2013). Tef
is the only cereal cultivated for human food in the genus Eragrostis which consists of 350
species (Tefera and Ketema, 2001; Tefera et al., 2003 ). The genus Eragrostis seem to have
originated in Africa (43%), South America (18%), Asia (12%), Australia (10%), Central
America (9%), North America (6%) and Europe (2%) (Costanza, 1974).
As indigenous germplasm rcollectionsare the main source of variability for tef genetic
improvement; collection and conservation of such resources is very essential to develop
new varieties with traits of interest. To this effect, the Ethiopian Biodiversity Institute (EBI)
collected about 6000 tef accessions of which only 2533 had the necessary passport data
(Tessema, 2013). Thus, germplasm characterization and evaluation, and targeted crossing
among selected parental lines have been the most common practices to develop and release
improved tef varieties in Ethiopia (Assefa et al., 2011). Currently over 35 varieties of tef
with different genetic backgrounds have been released for use by small holder farmers
(MoANR, 2016)
Molecular characterization of germplasm in gene bank enables the provision of relevant
information to conserve and improve crop productivity. However, studies indicated that
more than half of the tef germplasm holdings of EBI was not yet characterized, which

85
makes the effort towards improving this neglected crop less comprehensive (Chanyalew et
al., 2013; Tessema, 2013). Hence, it is essential to undertake intensive and comprehensive
characterization of the available germplasm for further use. As part of this effort, this study
was performed to characterize and assess the genetic diversity and pattern of relationship
among tef genotypes from various genetic and eco-geographic origin using microsatellite
markers.
Materials and methods
Plant materials and DNA extraction
A total of 189 tef genotypes including 188 genotypes from previous studies (Table 1) and
a breeding line called RIL-44(a progeny ofKinde x Kaye Murri) were planted in a
40mmddiameter pot using sterile soil in a long day growth room at the Institute of Plant
Sciences, University of Bern, Switzerland. A total of 100mg fresh leaves were harvested
from 3 to 4 weeks old seedlings and kept in 2 ml Eppendorf tube (at -80°C) until DNA
isolation. Manual grinding of samples was done in Eppendorf tubes using blue pestle in
the presence of liquid nitrogen. Genomic DNA was isolated using slightly modified Cetyl-
trimethyl-ammonium bromide (CTAB) protocol of Doyle and Doyle (1990). The quality
and quantity of the isolated DNA was assessed on 2% agarose standard gel electrophoresis
and using Nano drop-1000 spectrophotometer. A cyber-green dye was used instead of the
carcinogenic ethidium bromide to facilitate the detection of the PCR products. A1 kb
standard DNA ladder was used to determine the size of DNA fragment. The gel products
were visualized using gel documentation, 3UV- trans illuminator (Bio-Doc).

86
SSR marker selection
Twenty-five polymorphic simple sequence repeat (SSR) markers distributed throughout
the tef genome were selected (Zeid et al., 2011; Zeid et al., 2012; Cannarozzi et al., 2014)
were screened for amplification of their target genomic region. Forward and reverse
primers of these 25 markers were synthesized at Micro-synth (Switzerland). These markers
were tested using 30 selected tef genotypes representing the diversity among eco-
geographic and genetic origin. PCR optimization was performed using a thermal cycler
(Bio-Rad) in a total volume of 20 µl containing 1 µl DNA, 0.5 µl 10µM dNTPs, 4 µl buffer
5x, 0.75 µl 10µM each forward and reverse primer and 0.1 µl Go-Taq DNA polymerase
(Promega) and 12.9 µl dH2O. The PCR machine was programmed for initial denaturation
at 95°C for 2 minutes followed by 35 cycles at 95°C for 30 seconds, annealing temperature
at 54°C or 50°C (depending on the melting temperature of the primers) for 30 sec, and an
extension at 72°C for 50 sec. Then, a 5 min. final extension at 72°C was also
employed.After screening for amplification of unambiguously visible and polymorphic
SSR bands, 16 primer pairs showing polymorphism and good resolution were identified
for further analysis (Table 23). SSR studies of all genotypes were carried out at the Institute
of plant Sciences, University of Bern in Switzerland and at Sci-Corp laboratory in South
Africa. Eight markers were analyzed at the University of Bern, whereas the remaining eight
markers and two control markers from University of Bern were sent to Sci-Corp laboratory
in South Africa.
PCR amplification using fluorescently labeled primers
For cost effectiveness and improved quality of the amplified products, a 19 bp M13
sequence (5’- CACGACGTTGTAAAACGAC -3’) was added to the 5’ side of each

87
forward primer of the 16 markers. Thus, separately fluorescent labeled (Dyomics681,
Microsynth, Balgach, Switzerland) M13 sequence was included in the PCR together with
the forward primer (described above) and a corrspondingreverse primer (Schuelke, 2000).
PCR amplification was performed using thermal cycler in a total volume of 10 µl
containing [1 µl DNA, 0.2µl 10mM dNTPs, 2 µl 10x buffer, 0.35 µl 1µM forward primer,
0.35 µl1µM reverse primer, 0.35 µl 1µM fluorescently labeled primer, 0.25 µl Go-Taq
DNA polymerase and 5.5 µl dH2O]. The labeled primer is sensitive to light and was always
protected from direct light. The PCR was programmed to the following five steps: an initial
denaturation of 95°C for 2 min; 40 cycles of denaturation at 95°C for 30 sec.; 30 seconds
of annealing at 54 or 50°C (based on melting temperature for the pair of primers); initial
extension at 72°C for 30 sec., and a final extension at 72°C for 5 min.
SSR study at Sci-Corp laboratory
Leaves of 2-week old seedlings from each genotype were pressed onto labeled FTA cards
(Sigma, Germany) and were sent to Sci-Corp Laboratory in South Africa. Pestles were
used to press the leaf sample until both sides of the FTA card were soaked with a leaf
extract. The pressing board and pestle were cleaned with 70% ethanol between each sample
to avoid cross-contamination. The DNA was extracted at the Sci-Corp laboratory in South
Africa from the sample fixed on the FTA cards using Whatman FTA Card extraction
protocol. A marker specific PCR was performed for the 10 polymorphic SSR markers (Zeid
et al., 2012) and thePCR amplicons were analysed via capillary electrophoresis using
fluorescent dyes.

88
SSR data analysis
The generated fragment size data from all entries were summarized and converted into
input files suitable for various analyses using convert software version 1.31 (Glaubitz,
2004). Analysis of molecular variance (AMOVA), determination of the number of alleles
(Na) and effective alleles per locus (Ne), observed heterozygosity (Ho), gene diversity
(UHe) and FST were carried out using GenAlEx software version 6.5 (Peakall and Smouse
2006, 2012). Besides, allelic richness (Ar) was estimated using the rarefaction method
implemented in HP-Rare 1.03 (Kalinowski, 2005). Power Marker software v.3.25 (Liu and
Muse, 2005) was also employed to compute polymorphic loci percentage, gene flow and
Nei’s unbiased genetic distance. Cluster analysis was carried out based on population and
individual genotypes using Pop tree2 (Takezaki et a l.,2010) and DARwin software version
6.0.13 (Perrier and Jacquemoud-Collet, 2006), respectively. The dendrogram for individual
genotypes was edited for visualization using Fig-Tree software version 1.4.3 (Rambaut,
2016).
Population structure was inferred by the Bayesian model-based clustering method using
the Structure Software version 2.3.4 (Pritchard et al., 2000; Falush et al., 2007) assuming
population admixture through inferred ancestry. Twenty independent simulations were
performed by setting 50,000 for burn-in and 500,000 replications of Markov Chain Monte
Carlo run to estimate the number of sub-populations for each K values from the K=1 to
K=14 settings. The appropriate number of clusters (best K) was determined as suggested
by Evanno et al. (2005) using the STRUCTURE HARVESTER online software developed
by Earl (2012). Besides, CLUMPAK (Cluster Markov Packager Across K) software was
also used to identify an optimal alignment of inferred clusters across different values of K.

89
Table 23. Characteristics of selected SSR markers developed for Eragrostis tef
No. Primer Forward primer5’…3’) Reverse primer (5’…3’) Repeat type and
size
Expecte
d size
(bp)
Source
1 CNLTs 27 TTGGAATGAGATGGCATTTG GAAGCGGGGTAAGATTTGAA (TC)14 174 Zeid et al.
(2012) 2 CNLTs 33 TTTGCACCTAGTCTCCCATTG ACGATCGGATGTTTTGCTTT (GA)16 230
3 CNLTs 42 ATGCATGGATGGATGGCTA TTACCCAATTGCCCTAGCTG (TC)27 179
4 CNLTs 60 AGGGTGATAGCTGCCCAGAC CCCGAGTAATTGGTCGCTAA (TC)20& (CA)7 297
5 CNLTs 133 GGGGAGACTGCATTGGACTA CAAGAGGGACTGCACAGTGA (GA)9 249
6 CNLTs 136 TGAGAAGGTAATAACTGGTGAAGC CAAGGTTTACACACCGTGACTT (CT)18 246
7 CNLTs 150 AACACGTCCTTGCCGTATTC CGGGGTAGCCATAGCCTAAT (AG)5& (AG)16 225
8 CNLTs 157 GGATCCGACATGACGTGTAGT CACAGAATGAGATTGGGGAGA (CT)18 168
9 CNLTs 216 GGAAATTCGCACGAGAGAGA CGAGAGAGAAGCCTGTGAGG (GA)15(AAG)6 191
10 CNLTs 315 ATAGCTGCTCCGTTTTGCAT GGTCCACTTGGCATTCTGTT (AG)8 (TAG)6 233
11 CNLTs 416 AACAGATACAGTTGGAGACAGAAATG CTCTGAGTGCGTCGCAAG (AG)19 151
12 CNLTs 438 CTAACCGGCGGCGAGAGA CTGCCACATGCGTCGTTAGA (GA)14 153
13 CNLTs 484 GAGATCCTACCACGGCGATA CGCTTTCCCCTCCTTTTGTA (GA)18 157
14 CNLTs 538 CCATCTTAGCTTTGGCGAGA ACAAGAGGCAACAAGCCAGA (AG)18(AGA)20 176
15 SSR3.3 GGGAAGAGGAGTGTACAGA CCCTGGCAACTGCTTTAAGA (AAG)6 226 Cannarozzi
et al. (2014) 16 SSR9.4 CTCATCTCCCACCCTCACTC GTAGCCCAGATCAAACGACC (CTCCT)5 204
N.B. All forward primers used for SSR study had an additional 19 bp (5’-CACGACGTTGTAAAACGAC-3’)
sequence at the 5’-end.

90
Establishing non-redundant core collection and construction of dendrogram
Development of core collection enables monitoring of germplasm conservation and
maximizing the evaluation and utilization of these resources for breeding purposes. In other
words, an ideal core collection is essential to maximize the genetic diversity in the large
collection. A core collection was constructed by selecting accessions with higher diversity
and capturing the total alleles present in the entire collection. Thus, the size of the core
collection was determined by referring to the number of samples corresponding to the
inflection point prior to the plateau of the redundancy curve. The individuals of the core
collection were selected based on the number of alleles that they accounted for and based
on the value of the standard deviation from the mean. As suggested by Anoumaa et al.
(2017), when the removal of several individuals led to the same number of alleles in the
collection, only the one with low standard deviation from the mean (which when removed
from the core collection has little effect on the mean standard deviation) was selected. In
constructing the genetic core collections, allelic data were used to calculate the
dissimilarity matrix as implemented in Dissimilarity Analysis for Representation in
Window (DARwin), v 6.0.13 software (Perrier and Jacquemoud Collect, 2006) following
random sampling method. The efficiency of the strategy was assessed by comparing the
total number of alleles captured for each run using the same software.

91
RESULTS
SSR markers and its use for tef genetic diversity
The 16 studied SSR markers generated a total of 260 alleles with a mean of 16.3 alleles per
locus (Table 24). Besides, the number of effective alleles (Ne) was also in the range of 1.56
for SSR 3.3 to 13.60 for CNLT 42, while Shannon diversity index (I) rangedfrom 0.55 to
2.8 for the same markers in the same order.Thus, Ho per locus ranged from 0.01(CNLT
157) to 0.97 (CNLT 484) with a mean of 0.51 whereas, He ranged from 0.36 (SSR 3.3) to
0.93 (CNLT 42) with a mean of 0.82. Furthermore, the polymorphic information content
(PIC) of the studied loci also ranged from 0.30 (SSR 3.3) to 0.92 (CNLT42) with a mean
of 0.80 (Table 24).
In this study, rare alleles with frequency < 0.05, intermediate alleles with 0.05 to 0.50
frequency and abundant alleles with frequency > 0.50 constituted for 61.5%, 37.7% and
less than 1% of all detected alleles, respectively. The frequency of major alleles ranged
from 0.15 (CNLT 42; CNLT 438 and CNLT 538) to 0.76 (SSR 3.3) with a mean of 0.28
per marker (Table 24Analysis of allelic richness, on the other hand, showed the existence
of high level of variation among loci that ranged from 2 (SSR 3.3) to 10.6 (CNLT 42), with
a mean of 7.2 alleles (Table 24). Markers like CNLT 42, CNLT 216 and CNLT 484 had
mean allelic richness of 10 or more. Besides, CNLT 484 had the highest number of private
alleles (eight) followed by CNLT 416 which had seven private alleles while, CNLT 27,
CNLT 150 and SSR 3.3 were found to have no private allele (Appendix Table 3). SSR 3.3
had the least value of PIC, uHe, He, allelic richness and effective alleles suggesting that the
sequence used for its development is highly conserved in the studied tef genotypes.

92
Table 24.Genetic diversity parameters of 189 tef genotypes assessed based on16 SSR
markers
Locus Allele size
range
Genetic parameters
MAF Na Ne Ar I Ho He uHe F PIC
CNLT 133 260-302 0.25 21 7.40 7.71 2.36 0.39 0.86 0.87 0.50 0.85
CNLT 216 186-235 0.19 24 11.12 10.21 2.69 0.60 0.91 0.91 0.32 0.90
CNLT 27 186-200 0.28 8 5.78 6.21 1.91 0.35 0.83 0.83 0.52 0.81
CNLT 538 162-198 0.15 26 11.84 9.57 2.73 0.33 0.92 0.92 0.61 0.91
CNLT 60 298-320 0.22 12 7.39 7.14 2.15 0.62 0.87 0.87 0.25 0.85
CNLT 33 228-268 0.23 19 7.96 7.64 2.38 0.41 0.88 0.87 0.51 0.86
SSR 9.4 200-225 0.33 6 3.73 4.14 1.42 0.61 0.73 0.73 0.10 0.68
CNLT 42 177-220 0.15 22 13.6 10.64 2.80 0.61 0.93 0.93 0.27 0.92
CNLT 150 232-269 0.24 14 6.50 7.29 2.13 0.82 0.83 0.85 -0.04 0.83
CNLT 157 181-199 0.35 10 4.80 5.21 1.80 0.01 0.79 0.79 0.99 0.77
SSR 3.3 228-243 0.76 2 1.56 2.00 0.55 0.47 0.36 0.36 -0.38 0.30
CNLT 136 252-281 0.27 17 7.17 5.79 2.27 0.05 0.86 0.86 0.90 0.85
CNLT 315 206-279 0.52 12 2.92 4.93 1.44 0.95 0.66 0.66 -0.48 0.62
CNLT 416 155-199 0.24 25 7.70 8.21 2.41 0.61 0.87 0.87 0.25 0.86
CNLT 438 158-214 0.15 18 11.21 7.64 2.59 0.27 0.91 0.91 0.67 0.90
CNLT 484 170-202 0.21 24 8.32 10.00 2.46 0.97 0.88 0.88 -0.17 0.87
Mean 0.28 16 7.44 7.15 2.13 0.50 0.82 0.82 0.33 0.80
SE 0.01 7.3 3.32 0.19 0.59 0.30 0.14 0.14 0.03 0.32
MAF = maximum allele frequency, Na = observed number of allele, Ne = number of effective allele, Ar =
Allelic richness, I = Shannon’s Information Index, Ho = observed heterozygosity, He = expected
heterozygosity, uHe = Un-biased heterozygosity, F= fixation index, PIC= polymorphic information content.
Tef populations diversity
Analysis of important genetic parameters among14 populations revealed that improved
varieties had the highest mean number of alleles (8.94), effective alleles (5.56), and
Shannon’s information index (1.80) (Table 25). North Shewa (0.83) and North Gonder

93
(0.81) had the highest gene diversity whereas the breeding lines had the least value for all
genetic parameters (Table 25). Analysis of allelic richness revealed existence of high level
of variation among populations which ranged from 4.9 for breeding lines to 8.9 for
improved varieties (Table 25). The highest average number of private alleles in this study
was detected for genotypes from East Tigray (10) followed by North Gonder (7) private
alleles while the breeding lines had no private allele (Table 25).
Table 25. Summary of genetic diversity parameters obtained for 14 populations of tef
genotypes based on 16 SSR markers
Population Na Ne I NPA Ho He uHe F Ar PPL
C. Tigray 7.38 5.09 1.71 1.00 0.49 0.75 0.79 0.33 7.38 100
E. Gojam 7.25 5.17 1.69 2.00 0.56 0.77 0.80 0.23 7.25 100
E. Shewa 6.94 4.76 1.64 2.00 0.51 0.75 0.78 0.31 6.94 100
E. Tigray 7.25 5.09 1.68 10.0 0.51 0.76 0.79 0.30 7.25 100
N. Gonder 7.88 5.51 1.78 7.00 0.52 0.77 0.81 0.29 7.88 100
N. Shewa 7.44 5.79 1.78 5.00 0.48 0.79 0.83 0.37 7.44 100
N. Wello 6.50 4.60 1.58 2.00 0.46 0.73 0.77 0.34 6.50 100
S. Gonder 7.50 5.47 1.72 1.00 0.41 0.76 0.80 0.43 7.50 100
S. Wello 7.06 5.01 1.67 4.00 0.53 0.75 0.79 0.28 7.06 100
W. Gojam 7.56 4.77 1.67 5.00 0.49 0.74 0.78 0.32 7.56 100
W. Shewa 7.19 5.23 1.70 3.00 0.53 0.76 0.80 0.28 7.19 100
W. Tigray 6.31 4.55 1.57 4.00 0.47 0.73 0.77 0.33 6.31 100
Improved 8.94 5.58 1.81 3.00 0.53 0.77 0.79 0.29 8.94 100
Breeding lines 4.88 3.57 1.32 0.00 0.59 0.67 0.71 0.13 4.88 100
Mean 7.15 5.01 1.66 0.22 0.50 0.75 0.79 0.30 7.15 100
SE 0.19 0.14 0.03 0.11 0.02 0.01 0.01 0.03 0.19 0.00
Na = No. of different Alleles, Ne = No. of Effective Alleles, I = Shannon's Information Index,
NPA= No. Private Alleles, He = Expected Heterozygosity, uHe = Unbiased Expected
Heterozygosity, Ar= Allelic richness, PPL= Percentage of polymorphic loci.
Population differentiation and gene flow
Molecular analysis of variance (AMOVA) showed highly significant (P <0.01) variation
among populations, among genotypes within populations and within genotypes from
different genetic and eco-geographic origin (Table 26). Thus, 56.6%, 40.7% and 2.7% of

94
the total genetic variation was explained by variation within individuals, among individuals
within populations and among populations, respectively.
Table 26. AMOVA showing variation among populations, among individuals within
populations and within individual tef genotypes from various sources
Source df SS MS
Variance F- Statistic P
Estimated %
Among populations (AP) 13 180.74 13.90 0.175 2.7 FST=0.027 0.001
Among individuals
within population (AI) 175 1618.49 9.25 2.729 40.7
FIS=0.418
0.001
Within individuals WI) 189 716.50 3.79 3.791 56.6 FIT=0.434 0.001
Total 377 2515.73 - 6.695 100
F-statistic has also showed significant genetic differentiation among populations (FST =
0.03), among individuals within population (FIS=0.42) and within individuals (FIT = 0.43)
(Table 26). On the other hand, the FST values for various markers in this study ranged from
0.03 to 0.14with a mean of 0.08. For instance, CNLT 315 had the least FST (0.03) and
highest gene flow (8.67) values whereas CNLT-136 had the highest FST (0.137) and lowest
gene flow (1.573) (Table 27). Pair-wise population FST showed existence of significant
differentiation between populations from various sources. Thus, the largest differentiation
value was detected between the breeding lines and that of East Tigray (0.09), West Shewa
(0.09) and West Tigray (0.085). On the other hand, very low pairwise differentiation was
observed between North Wello and improved varieties; South Well and East Gojam; West
Shewa and East Shewa, and improved varieties and North Gonderpopulations (Table 28).
This shows the presence of high geneflow among populations with lower pair-wise FST
values.

95
Table 27.Summary of F-Statistics and estimates of gene flow (Nm) over all populations
for each locus
Locus FIS FIT FST Nm
CNLT_133 0.490 0.541 0.100 2.250
CNLT_216 0.321 0.372 0.075 3.101
CNLT_27 0.508 0.541 0.068 3.412
CNLT_538b 0.608 0.632 0.060 3.947
CNLT_60 0.258 0.306 0.065 3.594
CNLT_33 0.520 0.565 0.095 2.375
SSR_9.4 0.107 0.194 0.098 2.305
CNLT_42 0.271 0.327 0.076 3.032
CNLT_150 -0.037 0.040 0.074 3.117
CNLT_157 0.992 0.993 0.110 2.027
SSR_3.3 -0.438 -0.351 0.061 3.875
CNLT_136 0.906 0.919 0.137 1.573
CNLT_315 -0.486 -0.444 0.028 8.703
CNLT_416 0.241 0.299 0.076 3.035
CNLT_438 0.667 0.708 0.123 1.788
CNLT_484 -0.172 -0.104 0.058 4.087
Mean 0.297 0.346 0.081 3.264
SE 0.107 0.102 0.007 0.412
Furthermore, pairwise population Nei unbiased genetic distance (Nei, 1978) between
population ranged from 0.045 (South Wello vs East Gojam) to 0.545 (breeding lines vs
East Tigray) (Table 28). Thus, most large values were observed between the breeding lines
and the other 13 populations whereas the least values observed between South Wello and
East Gojam. This shows that the breeding lines derived from mutant line were substantially
differenciated from population other than released varietiesin the pair-wise comparisons.
On the other hand, the relatively smallest distance observed between breeding lines and
improved varieties could be due to the breeding lines were developed through hybridization
of the mutant line with improved varieties.

96
Table 28.Pair-wise Nei’s Unbiased Genetic Distance (above diagonal) and genetic differentiation (FST) (below diagonal)
Pop. CT EG ES ET NG NS NW SG SW WG WS WT REL BrL
CT 0.000 0.196 0.143 0.072 0.108 0.126 0.086 0.125 0.106 0.082 0.139 0.084 0.167 0.401
EG 0.050 0.000 0.208 0.168 0.154 0.110 0.195 0.099 0.045 0.115 0.145 0.212 0.177 0.350
ES 0.041 0.048 0.000 0.228 0.233 0.174 0.175 0.295 0.173 0.324 0.053 0.246 0.138 0.454
ET 0.033 0.043 0.049 0.000 0.172 0.139 0.188 0.180 0.126 0.120 0.128 0.129 0.241 0.545
NG 0.034 0.043 0.048 0.041 0.000 0.134 0.148 0.181 0.116 0.110 0.106 0.247 0.133 0.337
NS 0.039 0.035 0.042 0.038 0.038 0.000 0.109 0.155 0.167 0.067 0.082 0.201 0.179 0.362
NW 0.035 0.051 0.046 0.047 0.041 0.039 0.000 0.220 0.099 0.189 0.177 0.151 0.104 0.272
SG 0.038 0.036 0.054 0.043 0.041 0.039 0.050 0.000 0.169 0.113 0.244 0.152 0.223 0.423
SW 0.036 0.030 0.042 0.037 0.035 0.041 0.037 0.041 0.000 0.170 0.158 0.141 0.164 0.386
WG 0.031 0.040 0.058 0.036 0.034 0.031 0.046 0.036 0.042 0.000 0.170 0.153 0.230 0.433
WS 0.042 0.041 0.030 0.038 0.037 0.033 0.046 0.050 0.041 0.044 0.000 0.241 0.198 0.518
WT 0.034 0.051 0.053 0.040 0.050 0.047 0.045 0.041 0.041 0.041 0.052 0.000 0.253 0.474
REL 0.034 0.040 0.033 0.044 0.030 0.038 0.029 0.040 0.035 0.042 0.041 0.046 0.000 0.190
BrL 0.076 0.072 0.083 0.088 0.069 0.071 0.066 0.076 0.074 0.079 0.088 0.086 0.046 0.000
CT=Central Tigray, EG= East Gojam, ES= East Shewa, ET=East Tigray, NG=North Gonder, NS= North Shewa, NW=North Wello, SG=
South Gonder, SW= South Wello, WG= West Gojam, WS=West Shewa, WT=West Tigray, Imp= Improved variety, BrL= Breedinglines

97
Patterns of genetic diversity and population structure
In this study, the 14 populations from various sources were grouped into four clusters
consisting of one to nine populations (Fig. 17) whereby the different populations within a
cluster are assumed to be more closely related with each other than those in different
clusters. Thus, cluster one was solitary and consisted of the breeding lines alone whereas
cluster two consisted three populations from West, Central and East Tigray zones. This
clearly shows the existence of high gene flow among three zones of Tigray due to
geographical proximity. The third cluster consisted of six populations from South and
North Gonder, East and West Gojam, South Wello and North Shewa zones resulting may
be due to exchange of germplasm resources along their border. The fourth cluster consisted
of populations from East Shewa, West Shewa and North Wello zones along with improved
varieties.
In this study, several germplasms from adjacent collection zones or various origin tend to
cluster together. In this study, Delta K reached its highest pick at K = 4 and hence, it was
decided to have four clusters (Fig. 18a). At K=4, the structure bar plot revealed the
existence of four clusters with wide genetic admixtures (Fig. 19b). Thus, the major
constituents of cluster I were populations from West Gojam (77.4%), East Tigray (61.9%),
North Gonder (51.1%), South Gonder (44.2%) and North Shewa (43.3%) represented by
light blue color. Cluster II, on the other hand, consisted of mostly population from North
Wello (43.4%), West Tigray (29.5%), East Gojam (27.6%) and West Shewa (27.1%) and
represented by a dark purple colour. The inferred cluster III had a significant admixture
mainly from East Shewa (49.9%), South Wello (39.3%) and improved varieties (37.6%)

98
and represented by a orangecolor. Cluster IV constituted mostly the breeding lines (92.8%)
with some admixtures from improved varieties (43%) and represented by a green color.
Figure 17. Dendrogram showing the relationship among14 populations of tef from
different genetic and eco-geographic origins based on 16 SSR markers. (A boot
strap value less than 50 was not written for all nodes in this figure).

99
(a)
(b)
Figure 18. Delta K showing the best K (a) and structure bar-plot (b) of tef
genotypes from 14 populations showing the pattern of assignment into
four clusters

100
Patterns of genetic diversity and clustering among individual genotypes
Cluster analysis of the 189 individual tef genotypes from various genetic and eco-
geographic origins grouped into four distinct clusters with further major and minor sub
clusters. Each cluster consisted of 40 to 60 genotypes (Fig. 19). Cluster I, for instance,
consisted of 40 genotypes including 38 pure lines from all geographic zones and two
improved varieties. In this cluster, large number of genotypes were represented from North
Wello (6), North Shewa (5) and West Tigray (5) while all remaining population other than
the breeding lines were represented by one to three genotypes. Cluster II, on the other hand,
consisted of 60 genotypes from all populations other than West Gojam. Thus, the highest
number of genotypes was represented from improved varieties (21), East Shewa (8),
Central Tigray (4), North Gonder (4), North Wello (4), South Wello (4) and West Shewa
(4) while the remaining populations were represented with 1 to3 genotypes.
The third cluster consisted of 41 genotypes from allpopulations except East Shewa and the
breeding lines. Thus, large number of genotypes was represented from West Gojam (8),
East Tigray (6), East Gojam (4), North Gonder (4) and South Wello (4) while the remaining
populations were represented with 1 to3 genotypes. Cluster IV, consisted of 48 genotypes
including 31 pure lines from germplasm collections, 10 improved varieties and seven
breeding lines. The majority of the genotypes were from improved varieties (10), breeding
lines (7), South Gonder (5), East Gojam (4) and North Shewa (4) whereas the remaining
populations were represented by 1 to 3genotypes.

101
Figure 19. Dendrogram based on Unweighted Pair Group Method with Arithmetic Mean
(UPGMA)showing the genetic relationship among 189 tef genotypes using 16 SSR
markers. Genotypes and region of collections are described as 1-12 (central Tigray), 13-24 (East
Gojam), 25-36 (East Shewa), 37-48 (East Tigray), 49-60 (North Gonder), 61-72 (North Shewa), 73-
84 (North Wello), 85-96 (South Gonder), 97-108 (South Wello), 109-120 (West Gojam), 121-132
(West Shewa) and 133-144 (West Tigray). Improved varieties (145-179) and breeding lines (180-
189) are written in red and blue color respectively.
Establishing core collections
In this study, a core collection consisting of 64 (33.9%) genotypes and capturing100% of
the alleles from the entire studied genotypes. The genotypes identified for core collections
were from all the 14 populations with various proportions. Thus, the number of genotypes

102
captured for core collection from each population ranged from 1 to 9 for the breeding lines
and East Tigray population, respectively. The second largest number of genotypes (8) was
from improved varieties followed by those from North Gonder (6) and North Shewa (6)
populations (Table 29, Fig. 20). Such large number of genotypes identified for core
collection from East Tigray, North Gonder and North Shewa is in line with the number of
private alleles detectedinthe entire studied genotypes for the same population.
A dendrogram showing the relationship among core collections was also constructed and
compared to the dendrogram for the entire genotypes (Fig. 21). Thus, four clusters were
displayed for bothcore set and entire studied genotypes. As it is clearly seen in Fig. 21,
cluster I, II, III and IV consisted of 13, 8, 12 and 31 individuals, respectively. Thus,
genotypes in cluster-I were composed of genotypes from seven populations with the
majority from South Gonder and improved varieties. Cluster-II, on the other hand consisted
of genotypes from eight populations with equal proportion. The third cluster was composed
of genotypes from eight populations whereby the improved varieties and North wello
populations accounted for the vast majority. The fourth cluster, however, consisted of the
largest number of genotypes from all the 14 populations with most of them from East
Tigray (7) followed by North Gonder (4) and South Wello (3). The other seven populations
were represented by two genotypes whereas theother three populations were each
represented by one genotype. Based on altitude of collection, about 5.5%, 32.7%, 40 %
and 21.8% of the genotypes of the core collections were from below 1500m, 1501-2000m,
2001-2500m and >2500m, respectively (Table 29).
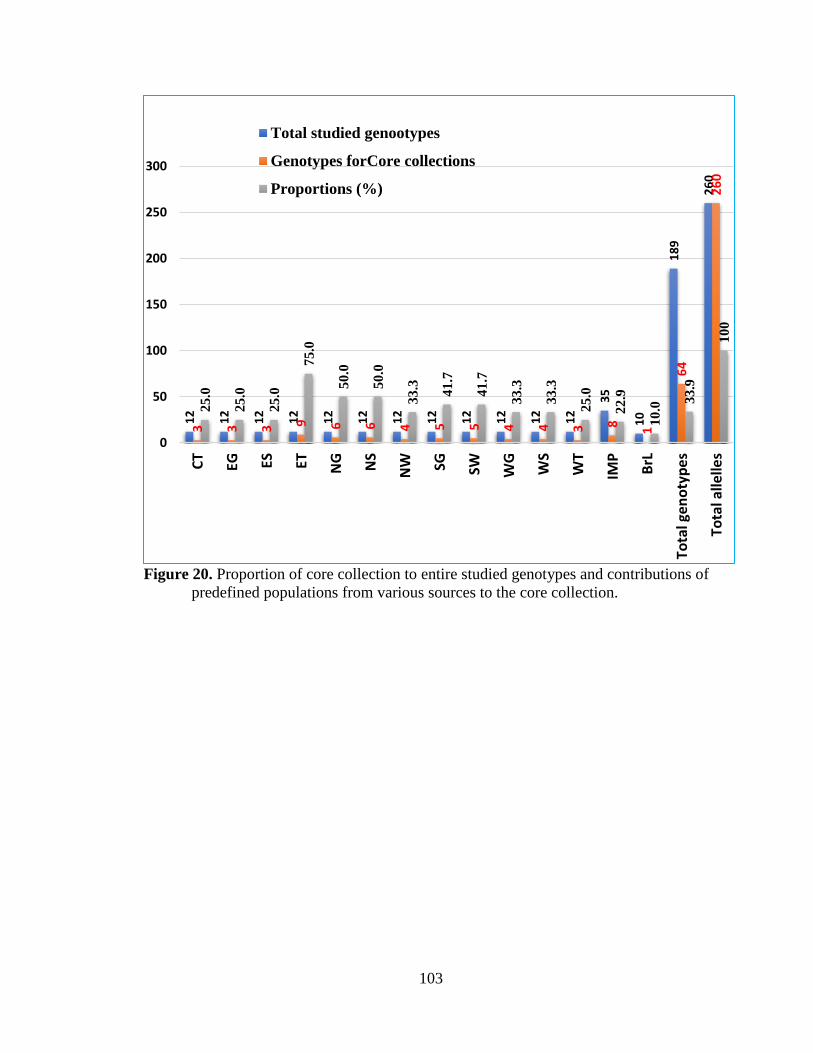
103
Figure 20. Proportion of core collection to entire studied genotypes and contributions of
predefined populations from various sources to the core collection.
12
12
12
12
12
12
12
12
12
12
12
12
35
10
18
9
26
0
3 3 3 9 6 6 4 5 5 4 4 3 8 1
64
26
0
25.0
25.0
25.0
75
.0
50.0
50.0
33.3
41.7
41.7
33.3
33.3
25.0
22.9
10.0
33.9
10
0
0
50
100
150
200
250
300
CT
EG ES ET NG NS
NW SG SW WG
WS
WT
IMP
BrL
Tota
l gen
oty
pe
s
Tota
l alle
lles
Total studied genootypes
Genotypes forCore collections
Proportions (%)

104
Table 29. Description of the tef genotypes proposed to construct a none redundant core
collection No. Acc./ name Zone Altitude No. Acc./ name Zone Altitude
1 19132-3 Central Tigray 2644 33 234985-2 North Wello 1520
2 234407-1 Central Tigray 1830 34 234993-3 North Wello 2580
3 237184-1 Central Tigray 2300 35 55293-2 South Gonder 1900
4 9545-1 East Gojam 2481 36 212717-0 South Gonder 2650
5 9556-1 East Gojam 1470 37 225919-2 South Gonder 2360
6 229768-3 East Gojam 2570 38 225919-3 South Gonder 2360
7 18460-0 East Shewa 1961 39 225919-7 South Gonder 2360
8 236963-1 East Shewa 2300 40 212612-3 South Wello 1550
9 236963-2 East Shewa 2300 41 212614-1 South Wello 1560
10 15297-1 East Tigray 2632 42 225898-1 South Wello 2575
11 15297-2 East Tigray 2632 43 243491-2 South Wello 3090
12 15299-1 East Tigray 2517 44 243504-1 South Wello 2265
13 15299-3 East Tigray 2517 45 19506-2 West Gojam 2043
14 19201-1 East Tigray 2063 46 242140-3 West Gojam 2300
15 19202-2 East Tigray 1997 47 242155-1 West Gojam 1890
16 234460-1 East Tigray 2210 48 242155-3 West Gojam 1890
17 234460-2 East Tigray 2210 49 18410-2 West Shewa 1880
18 242540-1 East Tigray 2052 50 18410-3 West Shewa 1880
19 9448-1 North Gonder 2059 51 236760-1 West Shewa 2380
20 9448-2 North Gonder 2059 52 236760-4 West Shewa 2380
21 9451-2 North Gonder 1840 53 9444-3 West Tigray 1492
22 9472-4 North Gonder 2208 54 19241-1 West Tigray 1963
23 19343-2 North Gonder 1916 55 237236-3 West Tigray 2050
24 243540-3 North Gonder 2050 56 Melko Improved Varieties
25 9559-1 North Shewa 2575 57 Gibe Improved Varieties
26 9559-2 North Shewa 2575 58 Ziquala Improved Varieties
27 15322-2 North Shewa 1693 59 Holeta Key Improved Varieties
28 18385-2 North Shewa 1260 60 Yilmana Improved Varieties
29 236746-0 North Shewa 2650 61 Amarach Improved Varieties
30 236957-1 North Shewa 1700 62 Mechare Improved Varieties
31 215200-1 North Wello 2000 63 Worekiyu Improved Varieties
32 234356-4 North Wello 1580 64 RIL-44 Breeding Line
(KindeX Kaye Murri)

105
Figure 21. Dendrogram showing the clustering pattern of genotypes in the core
collections. Genotypes and Zones of collections are described as 1-3 (Central Tigray), 4-6 (East Gojam), 7-
9 (East Shewa), 10-18 (East Tigray), 19-24 (North Gonder), 25-30 (North Shewa), 31-34 (North Wello), 35-
39 (South Gonder), 40-44 (South Wello), 45-48 (West Gojam), 49-52 (West Shewa) and 53-55 (West Tigray).
The names of improved varieties (56-63) and breeding lines (64) are written in red and blue color respectively.

106
Discussions
SSR markers and its use in tef genetic diversity
The present study revealed that all the studied SSR markers were highlypolymorphic (mean
PIC = 0.80). The 16 markers generated a largetotal number of alleles (260) and average
number of alleles per locus (16.3) (Table 24). Thus, the number of alleles generated per
locus ranged from 2 (SSR 3.3) to 26 alleles (CNLT 538) which is by far more than the
previously reported 148 total number ofalleles (Abate, 2015) and 164 alleles (Abraha et al.,
2016) obtained using 16 and 10 markers, respectively. This could be due to use of different
types and numbers of genotypes and markers. The number of alleles (Na) generated per
locus in the present study is, however, closer to Abate (2015) who reported 2 to 27 alleles
per locus while it is slightly larger than the 8 to 23 alleles per locus reported by other
authors (Zeid et al., 2012; Abraha et al., 2016).
Observed heterozygosity (Ho) is the frequency of heterozygous individuals in a population
whereas expected heterozygosity (He) or gene diversity is the probability that two gametes,
randomly chosen from the gene pool, are of different alleles (Greenbaum et al., 2014).
Thus, the value obtained for gene diversity in the current study (0.36 for SSR 3.3 to 0.93
for CNLT- 42) is a bit different from the previous reports of 0.75 to 0.91 based on most of
the present markers (Zeid et al., 2012); 0.00 to 0.85 (Abate, 2015) and 0.67 to 0.94 (Abrha
et al., 2016). Furthermore, the PIC value obtained in the present study (0.30 to 0.92 with a
mean of 0.80), is different fromto those previous reports of PIC ranging from 0.05 to 0.86
(Zeid et al., 2012), 0.02 to 0.95 (Abate, 2015) and 0.64 to 0.94 (Abraha et al., 2016) using
39, 16 and 10 microsatellite markers, respectively. In general, more than 85% of the studied
markers were selected from Zeid et al. (2012) and thus, generated similar PIC with the

107
previous report (Zeid et al., 2012). In general, about 75% of the 16 studied SSR markers
were found to be polymorphic with a mean PIC greater than 80% whereas Abate (2015)
reported 81% polymorphic loci with PIC of over 50% for the number of SSR markers. The
fact that about 75% of the loci in the present study had PIC values greater than 0.80 reveals
the excellent discriminatory power of the studied loci. Thus, a positive and significant
correlation was detected between the allele number and gene diversity (r = 0.751, P = 0.01)
and PIC (r = 0.764, P = 0.01) for more than 80% of the studied loci in the present study
showing that loci having a greater number of alleles (>10) had also high PIC values. In
general, the highest value of various genetic parameters observed for CNLT 42 in the
present study is in line with most of the previous reports (Zeid et al., 2012; Abate, 2015,
Abraha et al., 2016). Therefore, such SSR markers identified for high gene diversity are
useful for the genetic diversity assessment of tef germplasm.
Tef populations diversity
The level of diversity among the various populations was assessed and it was possible to
identify populations having better genetic diversity. All studied populations in the present
study were polymorphic across all loci unlike the previous report of Abate (2015) which
revealed a polymorphic value ranging from 69 to 100%. Populations from North Shewa
and North Gonder were identified to have the highest gene diversity whereas the breeding
lines had the least value for all studied genetic parameters (Table 27). Similar to this finding,
Abate (2015) reported high level of genetic diversity among germplasm accessions
compared to the breeding lines. This could be due to mutagenesis, hybridization and
artificial selection that would reduce the level of some genetic parameters. The highest
108
gene diversity for most of the genotypes from germplasm collection, however, could be
due to more chances of coevolving in nature than those under artificial selection or due to
variation in sample size. In general, the present result suggests that collections from North
Shewa and North Gonder Zoneswhich had high gene diversityare important for future
germplasm collections and conservation.
Allelic richness or allelic diversity is the total number of alleles in a population. It is a
measure of genetic diversity indicative of population's long-term potential for adaptability
and persistence (Greenbaum et al., 2014). In the present study, allelic richness was the
highest for improved varieties followed by North Gonder, West Gojam and South Gonder
population whereas the breeding lines had the least value of allelic richness. This is in line
with Abate (2015) who reported the least allelic richness for the breeding lines. As allelic
richness is a raw material for evolution by natural selection, its decrease leads to a reduction
in the population’s potential to adapt to future environmental changes (Greenbaum et al.,
2014). In the present study, the estimated allelic richness for improved varietieswas found
to be the highest mostly due to the fact that the largest number of samples (35 genotypes
for improved varieties) compared to the 12 genotypes for lines from germplasm accessions.
Private alleles are alleles that are found only in a single population among a broader
collection of populations (Szpiech and Rosenberg, 2011). In the present study, the number
of private alleles was the highest for germplasm collections while the breeding lines had
no private allele. Such findings are inline with the previous findings of Abate (2015) who
reported the least value of private alleles for the breeding lines and improved varieties.

109
Among the germplasm collections, the highest number of private alleles was observed for
East Tigray population (10) followed by North Gonder population (7), North Shewa (5)
and West Gojam (5). Therefore, it is important to give due attention for collection from
these zones while establishing core collections.
Population differentiation and gene flow
In the present study, the variations explained by within individuals, among individuals
within populations and among populations variation is in line with the results of Abraha et
al. (2016) who reported a variation of 2%, 35% and 65% among population, among
genotypes within population and within genotypes, respectively. Abate (2015), however,
reported the highest value for variation among genotypes within population (60%)
followed by within genotypes (31%) and among populations (9%). This could be due to
the use of different number and type of genotypes and markers.
The FST values for various markers in this study ranged from 0.03 to 0.14, with a mean of
0.08 (Table 29) and it is according to Wright (1978) considered to be low to moderate. The
detection of such low to moderate value could be due to high variability among individuals
and within individuals as a result of gene flow. Because, Kent and Bruce (2009), reported
the occurrence of little differentiation in large populations having extensive migration. In
the current study, markers having small FSTwere observed to have the highest gene flow
values (Table 29) since FSTis inversely proportional to the gene flow. Lower values of FST
according to Abraha et al. (2016) could appear due to exchange of genes through
hybridization during varietal development.

110
Pair-wise population FST showed that the largest differentiation value was detected between
breeding lines and East Tigray population whereas the least was observed between the
improved varieties and North Wello populations. In general, very low differentiation was
observed among population from adjacent region showing the presence of high gene flow
among the border zone. On the other hand, most large values of Nei unbiased genetic
distance were observed between the breeding lines and the populations from germplasm
collections whereas the value observed between the remaining populations was quite lower.
This shows that the breeding lines derived from the crossing of mutant lines withadapted
cultivars created substantial variability in the pair-wise comparisons. As suggested by
Abraha et al (2016), the relatively smaller distance observed between breeding lines and
improved varieties could be due to hybridization during the development of the breeding
lines.
Patterns of genetic diversity and population structure
Clustering of the 189 individual genotypes and the 14 populations revealed the formation
of four distinct clusters whereby genotypes from populations of adjacent geographic zones
and genetic origins were grouped together. This is may be due to seed exchange resulting
from geographical proximity and dissemination of improved tef cultivars via extension.
The observed number of clusters in this study is in line with the previous reports of Abate
(2015) and Abrha et al. (2016) who grouped 41 and 60 tef genotypes into three clusters
based on 16 and 10 selected microsatellite markers, respectively.
In this study, in general, genotypes from various origins were grouped into different
clusters with various proportions. For instance, the improved varieties were distributed in

111
all the four clusters whereas the breeding lines were grouped into two clusters. In the
grouping of breeding lines, surprisingly, the mutant parental line (Kinde) and cultivar Kaye
Murri were grouped in the first cluster together with all progenies of Kinde X Kaye Murri
whereas the progenies of Quncho X Kinde were grouped in cluster two. The lines derived
from germplasm collections, on the other hand, were grouped into all clusters and sub
clusters with various proportion. Such groupings may be resulted from seed exchange due
to geographical proximity; dissemination of improved tef cultivars via extension. In
general, the clustering pattern observed based on molecular data is to some extent in line
with the clustering pattern based on morphological traits.
Construction of core collections
Various researchers suggesteddifferent proportion of sample size to establish a core
collection. For instance, Brown (1989) suggested a sampling percentage of 5% to 10%
whereas a 33.9% of the entire population was identified to establish a core set in the present
study. In previous studies, Atnaf (2017) reported 16% whereas; Liu and Hou (2010)
reported a core collection size 27%. The present result demonstrated the great potential of
using molecular data to construct a core collection for efficient conservation and utilization
of the tef germplasm collections. However, the number of markers employed for genetic
analysis in the present study is relatively low to give a concluding remark about the
conservation of all available genetic resources. Therefore, it is very important to increase
the number and kind of markers to be used.

112
Chapter 5 5. Genotype by environment interaction in major quantitative traits and yield
stability of tef
Abstract Tef adapts to a wide range of environmental conditions and hence, identification of adaptable,
stable and high yielding genotypes under varying environmental conditions is the primary concern
of crop breeders. In this study, 35 improved tef varieties were evaluated at Debre Zeit, Holetta and
Alem Tena for two years and at Axum, Adet and Shamu for one year to assess the effect of genotype,
environment, G x E interaction; existence of mega environments and the stability of genotypes. The
mean grain yield across test environments ranged from 1.7 t/ha for Alem Tena-2to 4.29 t/ha for
Debre Zeit-1 while, the genotypic mean yield ranged from 2.49 t/ha for Simada to 3.33 t/ha for
Melko. The AMMI, GGE and Eberhart Russell model confirmed Melko as the highest yielding and
relatively stable variety.GGE biplot analysis grouped thenine test environments andthe 35
genotypes into four mega environments and seven genotypic groups, respectively. Thus, Melko was
the highest yielding and ideal genotype to evaluate and rank different test environments relative to
it whileDebre Zeit-1 was the highest yielding and ideal environment to evaluate and rank different
genotypes relative to it. Both the relationship between environments and GGE biplot revealed
existence of four Mega environments: group-I (Debre Zeit-1), Group-II (Adet, Axum&Debre Zeit-
2), Group-III (Alem Tena-1, Alem Tena-2, Holetta-1 & Holetta-2) and group-IV (Shambu). Besides,
Debre Zeit-1& 2, and Holetta 1 & 2 having the longest vector length were the most discriminating
of all environments while, Adet and Axum having the smallest angle with the average environmental
axis were the most representative all environments. The association of grain yield with second culm
length and shoot biomass weresignificant and positive while, thatwithlodging index was significant
(P<0.01) and negative. Cluster analysis formed seven clusters whereby high yielding and early
maturing genotypes appeared into their respective cluster. In principal component analysis, the
first three PCs with eigenvalue greater than unityaccounted for 82.9% of the total variations. This
study generally enabled to identify genotypes with better yield and moderate stability, and
discriminating and representative environmentsfor future tef breeding.
Key words: AMMI; Cluster; discriminating power; Genotype x Environment; GGE, Eberhart
Russell model; Genotype plus Genotype x Environment; Mega environment; PCA; Tef

113
Introduction Crop performance is a function of genotype, environment, and genotype by environment
interactions (GEI) and hence, the importance of understanding crop management and its
growing environments has, therefore, been suggested by various researchers to increase
agricultural production (Tolessa et al., 2013; Yan and Kang, 2003; Basford and Cooper,
1998).This is possible byeliminating unnecessary spatial and temporal replication of yield
trials andby establishing additional testing environment onlywhen the existing ones are
underrepresented (Basford and Cooper, 1998).
Tef, a crop widely cultivated in Ethiopia, adapts to wide range of environments which
include soil, altitude, rainfall and temperature conditions (Ketema, 1997; Assefa et al.,
2011). G x Estudy is useful in tef crop breeding and varietal development particularly
forreleasingvariety for different agro-ecologies, effective allocation of resources and
characterization of genotype responses to variable productivity levels (Ketema, 1993;
Kefyalew et al, 2001). Such information enables breeders to determine optimum breeding
strategy so as to make informed choices of the locations and input systems to be used in
the breeding efforts (Gruneberg et al., 2005). However, there are very limited studies on G
x E in tef cropsuggesting to conduct more studiesacross major tef growing areas in Ethiopia
(Kefyalew, 1999; Kefyalew et al., 2000, 2001; Ashamo and Belay, 2012).
This study was, therefore, conducted to (1) assess the magnitude of GE interaction and
stability; (2) examine the possible existence of different mega-environments; and (3)
determine the discriminating ability and representativeness of the environments.

114
Materials and Methods
Plant materials
Thirty-five improved varieties released by seven research centers in Ethiopia between 1970
and 2014 were evaluated. About 35% and 65% of these varieties were developed through
hybridization and selection from landraces, respectively. Furthermore, 77.1%, 17.1% and
5.7% of these varietiesrespectively were released for high potential environments, moisture
deficit areas and waterlogged areas in the country. Detail descriptionsof the 35
varietiesinvestigated are given in Table 30.
Description of the study environment
The study environments include Holetta (2015 & 2016), Debre Zeit (2015 & 2016), Alem
Tena (2015 & 2016), Adet, Axum and Shambu in 2015 (Table 31). All study environments
are located in the highland high potential areas except for Alem Tena a moisture deficit
environment situated in the Central Rift Valley of Ethiopia. Holetta and Shambu are
located at 39 and 310 km west of Addis Ababa, respectively while Debre Zeit and Alem
Tena are located at 47 and 109 Km in the southeast direction from Addis Ababa,
respectively. Adet and Axum, however, are located in the Northern parts of Ethiopia at 533
and 1025 Km in that order from Addis Ababa.Detail descriptions of the studied
environments are given in Table 31.

115
Table 30. Description of the tef varieties considered for GXE interaction studies Varietal name Code Release
Year
Seed
color
Techniques
used
Environmental
Adaptation
Common name Pedigree
Enatit DZ-01-354 G1 1970 P. white Selection High potential
Asgori DZ-01-99 G2 1970 Brown Selection High potential
Magna DZ-01-196 G3 1978 v. white Selection High potential
Wolenkomi DZ-01-787 G4 1978 P. white Selection High potential
Menagesha DZ-Cr-44 G5 1982 White Hybridization High potential
Melko DZ-Cr-82 G6 1982 White Hybridization High potential
Tseday DZ-Cr-37 G7 1984 White Hybridization Low moisture
Gibe DZ-Cr-255 G8 1993 White Hybridization High potential
Ziquala DZ-Cr-358 G9 1995 White Hybridization High potential
Dukem DZ-01-974 G10 1995 White Selection High potential
Holeta Key DZ-01-2053 G11 1999 Brown Selection High potential
Ambo-Toke DZ-01-1278 G12 2000 White Selection High potential
Gerado DZ-01-1281 G13 2002 White Selection High potential
Koye DZ-01-1285 G14 2002 White Selection High potential
Key Tena DZ-01-1681 G15 2002 Brown Selection High potential
Gola DZ-01-2054 G16 2003 P. white Selection High potential
Ajora PGRC/E 205396 G17 2004 P. white Selection High potential
Genet DZ-01-146 G18 2005 P. white Selection High potential
Zobel DZ-01-1821 G19 2005 P. white Selection High potential
Dima DZ-01-2423 G20 2005 Brown Selection High potential
Yilmana DZ-01-1868 G21 2005 P. white Selection High potential
Dega Tef DZ-01-2675 G22 2005 P. white Selection Highland vertisols
Gimbichu DZ-01-899 G23 2005 White Selection Highland vertisols
Amarach Ho -Cr-136 G24 2006 P. white Hybridization Low moisture
Quncho DZ-Cr-387 (RIL 355) G25 2006 v. white Hybridization High potential
Guduru DZ-01-1880 G26 2006 White Selection High potential
Gemechis DZ-Cr-387 (RIL-127) G27 2007 v. white Hybridization Low moisture
Mechare Acc. 205953 G28 2007 P. white Selection High potential
Kena 23-Tafi Adi-72 G29 2008 White Selection High potential
Etsub DZ-01-3186 G30 2008 White Selection High potential
Laketch RIL 273 G31 2009 V. white Hybridization High potential
Simada DZ- CR-385 (RIL-295) G32 2009 White Hybridization Low moisture
Boset DZ-Cr-409 (RIL 50d) G33 2011 V. white Hybridization Low moisture
Kora DZ-Cr-438 (RIL 133B) G34 2014 v. white Hybridization High potential
Worekiyu 214746A G35 2014 White Selection Low moisture

116
Table 31. Description of the test environments* Environment
name
Location
code
Altitu
de latitude longitude Annual
RF(mm)
Temperature Soil type Min 0C
Max 0C
Adet E1 2240 11017’ N 37o43’E 921.3 7.3 31.3 Nitosol
Alem Tena1 E2 1580 8020’ N 390E’ 500 8.0 29.8 Light sandy
Alem Tena 2 E3 1580 8020’ N 390 E 500 8.0 29.8 Light sandy
Axum E4 2100 1406′N 38048′E 700 12.2 26.8 Vertisol
Debre Zeit 1 E5 1900 8 044’ N 380 58’ E 851 8.9 28.3 Pellic Vertisol
Debre Zeit 2 E6 1900 80 44’ N 380 58’ E 851 8.9 28.3 Pellic Vertisol
Holetta1 E7 2400 9044’N 380 30’ 1100 6 22 Nitosol
Holetta2 E7 2400 9044’ N 38030’ 1100 6 22 Nitosol
Shambu E9 2503 9057’N 37010’ E Nitosol
*The weather and edaphic informations were obtained from their respective research
centers.
Experimental Design and other practices
The experiment was laid out in Randomized Complete Block Design with three
replications. Five rows of one-meter length were used with spacing of 0.2m, 1m and 1.5m
between rows, plots and replications, respectively. All agronomic and cultural practices
were applied during the crop growth stage as per the recommendation for each location.
Data on days to 50% panicle emergence and maturity, length of plant, culm, panicle and
peduncle, diameter of the second culm internode, number of total and fertile tillers shoot
biomass, grain yield, 1000-kernel weight and lodging index were recorded. Harvest index
was calculated as the ratio of grain yield to biomass yield.

117
Statistical analysis for phenotypic traits All quantitative traits data were subjected to analysis of variance (ANOVA) as per the
procedure suggested by (Gomez and Gomez, 1984) using (SAS, 2002), Minitab 17.1 (2013)
statistical software packages. Test of homogeneity and combined analysis of variance was
also performed using the general linear model (PROC GLM) while mean separation and
test of significance was performed using Duncan's multiple range test at 5% probability
level. Additive main effects and multiplicative interactions (AMMI), and genotype plus
genotype-by-environment (GGE) were performed using theGenotype by Environment
Analysis with R (GEA-R) version 4.0 (Pacheco et al., 2016). AMMI and GGE biplot were
used to analyze the multi-environment trial (MET) data, to graphically represent the GE
interaction, and to identify the rank of the studied genotypes and environments (Yan et al.,
2000).The extracted principal component axes (PCAs) were statistically tested by Gollob's
F-test procedure (Gollob, 1968). The first two components were used to construct a biplot
based on the no-scaling and tester-centered model for the E and G × E interaction biplot
analysis.
Genotypic and phenotypic correlation of major quantitative traits were analyzed using
multi environment trial analysis with R for windows (META-R) version 6.0 developed by
CIMMYT (Alvarado et al., 2016). Principal component and cluster analyses were
conducted using MINITAB software version 17.1 (MINITAB, 2013).
Genetic distances between clusters as standardized Mahalanobis’s D2 statistics were
calculated as:
D2ij = (xi – xj)’ cov-1(xi – xj)

118
Where, D2ij = the distance between cases i and j; xi and xj = vectors of the values of the
variables for cases i and j; and cov-1 = the pooled within groups variance-covariance matrix.
The D2 values obtained for pairs of clusters were considered as the calculated values of
Chi-square (X2) and were tested for significance both at 1% and 5% probability levels
against the tabulated value of X2 for ‘P’ degree of freedom, where P is the number of
characters considered in each study (Singh and Chaudhary 1985).
RESULTS
Analysis of variance
Combined analysis of variance for the major quantitative traits of released tef varieties
across environment is given in Table 32. Thus, almost all traits in the combined analysis
were highly significant (P < 0.01) due to genotype, environment and genotype by
environment interaction effects. Grain yield performance of some genotypes was affected
by lodging at Adet (E1) due to excess rainfall whereas moisture deficit exhibited a critical
problem at Alem Tena (E2 and E3) and partly at Axum (E4). The highly significant variation
among genotypes revealed existence of high inherent variability among the tef varieties
(Fig. 22). Significant variation for genotype x environment interactionobsereved in this
study clearly showed unstable performance of the studied tef varieties across testing
environments. Such conditions were reported to complicate selection and recommendation
of stable genotype across environments (Hundera et al., 2000a; Kefyalew et al. 2000, 2001).
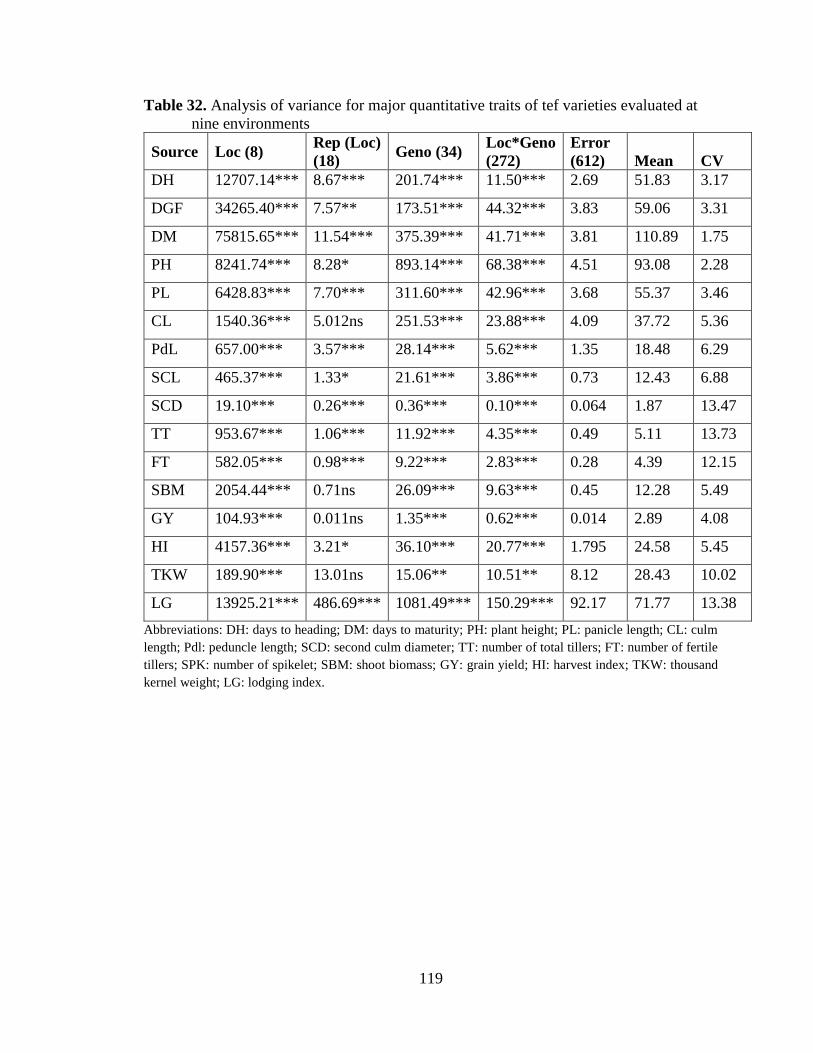
119
Table 32. Analysis of variance for major quantitative traits of tef varieties evaluated at
nine environments
Source Loc (8) Rep (Loc)
(18) Geno (34)
Loc*Geno
(272)
Error
(612) Mean CV
DH 12707.14*** 8.67*** 201.74*** 11.50*** 2.69 51.83 3.17
DGF 34265.40*** 7.57** 173.51*** 44.32*** 3.83 59.06 3.31
DM 75815.65*** 11.54*** 375.39*** 41.71*** 3.81 110.89 1.75
PH 8241.74*** 8.28* 893.14*** 68.38*** 4.51 93.08 2.28
PL 6428.83*** 7.70*** 311.60*** 42.96*** 3.68 55.37 3.46
CL 1540.36*** 5.012ns 251.53*** 23.88*** 4.09 37.72 5.36
PdL 657.00*** 3.57*** 28.14*** 5.62*** 1.35 18.48 6.29
SCL 465.37*** 1.33* 21.61*** 3.86*** 0.73 12.43 6.88
SCD 19.10*** 0.26*** 0.36*** 0.10*** 0.064 1.87 13.47
TT 953.67*** 1.06*** 11.92*** 4.35*** 0.49 5.11 13.73
FT 582.05*** 0.98*** 9.22*** 2.83*** 0.28 4.39 12.15
SBM 2054.44*** 0.71ns 26.09*** 9.63*** 0.45 12.28 5.49
GY 104.93*** 0.011ns 1.35*** 0.62*** 0.014 2.89 4.08
HI 4157.36*** 3.21* 36.10*** 20.77*** 1.795 24.58 5.45
TKW 189.90*** 13.01ns 15.06** 10.51** 8.12 28.43 10.02
LG 13925.21*** 486.69*** 1081.49*** 150.29*** 92.17 71.77 13.38
Abbreviations: DH: days to heading; DM: days to maturity; PH: plant height; PL: panicle length; CL: culm
length; Pdl: peduncle length; SCD: second culm diameter; TT: number of total tillers; FT: number of fertile
tillers; SPK: number of spikelet; SBM: shoot biomass; GY: grain yield; HI: harvest index; TKW: thousand
kernel weight; LG: lodging index.

120
Figure 22. The performance of tef genotypes at Holetta Agric. Research Center (October
2015). Photo: Zerihun Tadele.
AMMI analysisof variance for grain yield
AMMI analysis revealed highly significant (p <0.01) differences for grain yield (t ha-1) of
35 tef varieties due to genotypes, environments and their interaction. Thus, the environment
accounted for 79.7% of the total variationsfollowed by the GEI (16.2%) and genotype
(4.1%). In this case, the variation explained by the environment was about four times higher
than what was explained by G plus GE revealing the differential performance of genotypes
across the test environments. The AMMI analysis, furthermore, partitioned the G x E
variance into principal component axes (IPCA) and the results are presented in Table 33.
In this study, the first eight of the nine possible IPCA of the AMMI model were found to
capture the entire pattern in the G x E interaction whereas the ninth was pooled into the
residual. Even though all theeight PCs were significant (P< 0.01) in the AMMI analysis,
substantial percentage of GEI was explained by PC1 (53.04%) followed by PC2 (19.41%)

121
and PC3 (13.12) whereas less than 15% was explained by the remaining five PCs. In current
study, the first two PCs which contributed for over 70% of the G x E interaction were used
to create a biplot.
Table 33. AMMI analysis of variance for grain yield (tha-1) of 35 tef genotypes grown at
nine environments.
Source of
variation DF SS MS F value Explained % of SS
Environment 8 745.80 93.23 7581.71*** 79.66
Genotype 34 40.80 1.20 97.60*** 4.34
GEI 272 149.65 0.55 44.74*** 15.98
PC1 41 79.38 1.94 157.20*** 53.04
PC2 39 29.04 0.74 60.46*** 19.41
PC3 37 19.63 0.53 43.08*** 13.12
PC4 35 9.32 0.27 21.61*** 6.23
PC5 33 4.58 0.14 11.26*** 3.06
PC6 31 4.48 0.144 11.73*** 2.99
PC7 29 1.64 0.056 4.58*** 1.09
PC8 27 1.59 0.059 4.78*** 1.06
PC9 25 0 0 0 0
Residuals 630 7.75 0.012 NA 0
GEI= Genotype by Environment interaction; DF= Degrees of freedom; SS= Sums of
square; MS= Mean square.
5.4.2.1 Mean grain yieldand stability
The mean grain yieldacross the nine test environments ranged from 1.7 t ha-1 at Alem Tena
in 2016 to 4.29 t ha-1 at Debre Zeit in 2015with a grand mean of 2.89 t ha-1(Table 34& Fig.
23&24). Thus, Debre Zeit 1&2 were among the top yielding environments whereas Alem
Tena 1 & 2 remained the lowest yielding environments in both seasons. In this study, Debre
Zeit-1 followed by Holetta-1, Debre Zeit 2 &Holetta-2, respectively were identified to be

122
the best environments with a mean grain yield higherthan the grand mean unlike the
remaining test environments.
Figure 23. Plot showing environment focused mean grain yield versus IPCA-1 score.
The reference line on the x-axis is the grand mean for grain yield of genotypes
across environments (2.89-ton ha-1) and on the y-axis is the IPCA1 value
indicating genotype stability (IPCA1=0)
Figure 24. Interaction of mean grain yield performance for 35 tef genotypes evaluated
across nine environments

123
On the other hand, mean grain yield among the 35 studied tef genotypes at nine
environments ranged from 2.49 t ha-1 for Simada (G29) to 3.33 t ha-1 for Melko (G6). In this
study, Melko (3.33t/ha) followed by Kora (3.27t/ha), Quncho (3.22t/ha), Gimbichu
(3.18t/ha) had the highest mean yield Thus, G6which have the highest mean grain yield and
IPCA-1 value of 0.46was moderately adaptable and high yielding (Table 34, Fig 23; Fig
25a, b, c) whereas G21, which had the lowest IPCA-1 score (-0.01) was found to be stable
and having consistent performance across locations but with lower grain yield than G6.
5.4.2.2 AMMI stability value (ASV)
Dukem (G10) had the lowest ASV (0.0.03) and moderately high grain yield (3.0 t/ha)
whereas G6 had the highest yield (3.33t/ha) with relatively lower ASV (0.71) followed by
Kora (G34) having grain yieldof 3.27 t/ha and ASV=1.16 (Table 34, Fig. 25a). Hence, when
considering yield, Melko, Kora and Qunchowhich had the highest mean yield and relative
stability could be a variety of choice instead of G10 or G20 which were stable and moderately
low yielding (Table 34, Fig 25a, b&c).
5.4.2.3 Analysis based on Eberhart and Russell Regression Model
In the present study the five high yielding genotypes Melko (G6), followed by Kora (G34),
Quncho (G25), Gola (G16) and Gimbichu (G23) had a regression coefficient (bi) value of
1.27, 1.06, 1.09, 1.34 and 1.44, respectively. Among these, especially, Kora and Quncho
are the second-highestyielding but with regression coefficient closer to unity followed by
Melko which was identified to be high yielding and more stable genotypes in this study
(Table 34, Fig. 26c).

124
Ingeneral, Melko, Kora, Quncho, Gola and Gimbich which had a mean grain yield of 3.33,
3.27,3.22, 3.20 and 3.18 t/ha, with ASV value of 0.71, 1.16, 1.42, 0.26 and 0.26), IPCA
value of 0.46, 058,0.67, 0.31 and 0.31 as well as a regression coefficient (bi) value of 1.27,
1.06, 1.09, 1.34 and 1.44, respectively were identified as the highest yielding and adaptable
genotypes (Fig. 25a, b & c).
a) Genotypes mean grain yield (t/ha) versus AMMI stability value (ASV).

125
b) Scatter plot of IPCA vs Mean grain yield (t/ha)
c) Genotypes mean grain yield (t/ha) versus regression coefficient (bi).
Figure 25. Plot showing genotypes mean grain yield (t/ha) versus IPCA1 (a), versus
ASV(b) and versus regression coefficient (c). (The reference line on the x-axis is the
average grain yield (2. 89 t/ha) whereas that on the y-axis is the IPCA1 value (IPCA1= 0), ASV is
(ASV=0.88) and the regression coefficient (bi=1) indicating stability of genotype).
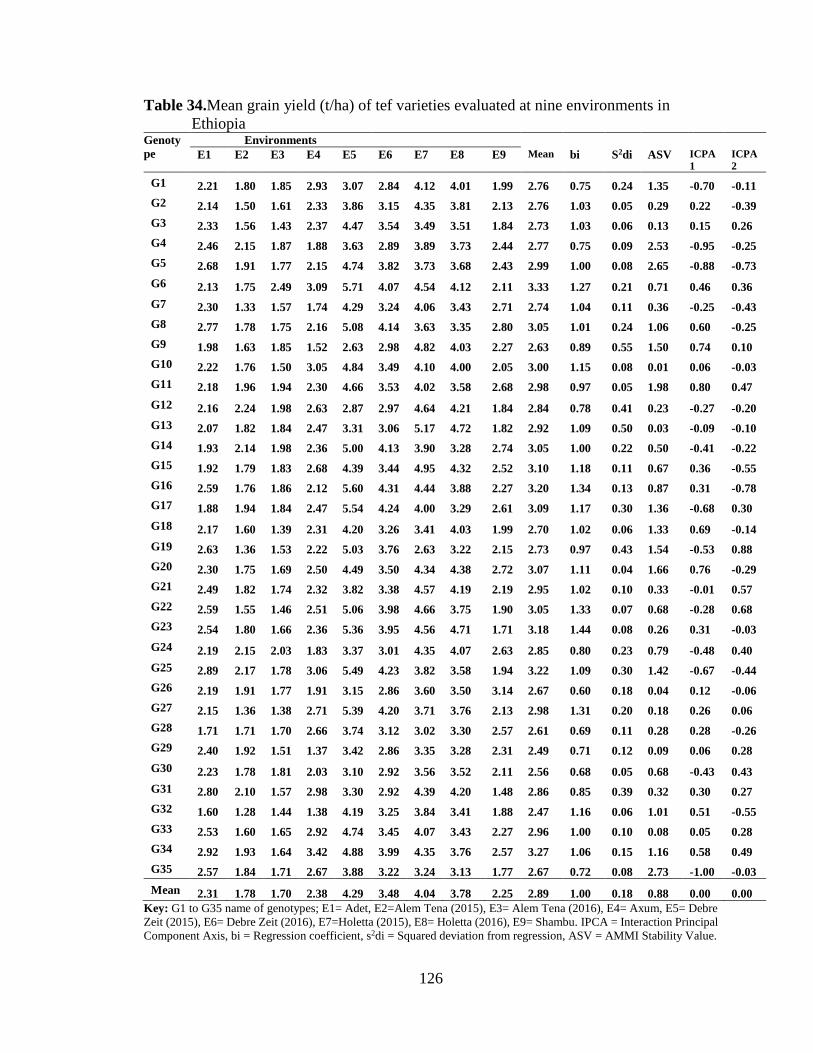
126
Table 34.Mean grain yield (t/ha) of tef varieties evaluated at nine environments in
Ethiopia Genoty
pe
Environments
E1 E2 E3 E4 E5 E6 E7 E8 E9 Mean bi S2di ASV ICPA
1
ICPA
2
G1 2.21 1.80 1.85 2.93 3.07 2.84 4.12 4.01 1.99 2.76 0.75 0.24 1.35 -0.70 -0.11
G2 2.14 1.50 1.61 2.33 3.86 3.15 4.35 3.81 2.13 2.76 1.03 0.05 0.29 0.22 -0.39
G3 2.33 1.56 1.43 2.37 4.47 3.54 3.49 3.51 1.84 2.73 1.03 0.06 0.13 0.15 0.26
G4 2.46 2.15 1.87 1.88 3.63 2.89 3.89 3.73 2.44 2.77 0.75 0.09 2.53 -0.95 -0.25
G5 2.68 1.91 1.77 2.15 4.74 3.82 3.73 3.68 2.43 2.99 1.00 0.08 2.65 -0.88 -0.73
G6 2.13 1.75 2.49 3.09 5.71 4.07 4.54 4.12 2.11 3.33 1.27 0.21 0.71 0.46 0.36
G7 2.30 1.33 1.57 1.74 4.29 3.24 4.06 3.43 2.71 2.74 1.04 0.11 0.36 -0.25 -0.43
G8 2.77 1.78 1.75 2.16 5.08 4.14 3.63 3.35 2.80 3.05 1.01 0.24 1.06 0.60 -0.25
G9 1.98 1.63 1.85 1.52 2.63 2.98 4.82 4.03 2.27 2.63 0.89 0.55 1.50 0.74 0.10
G10 2.22 1.76 1.50 3.05 4.84 3.49 4.10 4.00 2.05 3.00 1.15 0.08 0.01 0.06 -0.03
G11 2.18 1.96 1.94 2.30 4.66 3.53 4.02 3.58 2.68 2.98 0.97 0.05 1.98 0.80 0.47
G12 2.16 2.24 1.98 2.63 2.87 2.97 4.64 4.21 1.84 2.84 0.78 0.41 0.23 -0.27 -0.20
G13 2.07 1.82 1.84 2.47 3.31 3.06 5.17 4.72 1.82 2.92 1.09 0.50 0.03 -0.09 -0.10
G14 1.93 2.14 1.98 2.36 5.00 4.13 3.90 3.28 2.74 3.05 1.00 0.22 0.50 -0.41 -0.22
G15 1.92 1.79 1.83 2.68 4.39 3.44 4.95 4.32 2.52 3.10 1.18 0.11 0.67 0.36 -0.55
G16 2.59 1.76 1.86 2.12 5.60 4.31 4.44 3.88 2.27 3.20 1.34 0.13 0.87 0.31 -0.78
G17 1.88 1.94 1.84 2.47 5.54 4.24 4.00 3.29 2.61 3.09 1.17 0.30 1.36 -0.68 0.30
G18 2.17 1.60 1.39 2.31 4.20 3.26 3.41 4.03 1.99 2.70 1.02 0.06 1.33 0.69 -0.14
G19 2.63 1.36 1.53 2.22 5.03 3.76 2.63 3.22 2.15 2.73 0.97 0.43 1.54 -0.53 0.88
G20 2.30 1.75 1.69 2.50 4.49 3.50 4.34 4.38 2.72 3.07 1.11 0.04 1.66 0.76 -0.29
G21 2.49 1.82 1.74 2.32 3.82 3.38 4.57 4.19 2.19 2.95 1.02 0.10 0.33 -0.01 0.57
G22 2.59 1.55 1.46 2.51 5.06 3.98 4.66 3.75 1.90 3.05 1.33 0.07 0.68 -0.28 0.68
G23 2.54 1.80 1.66 2.36 5.36 3.95 4.56 4.71 1.71 3.18 1.44 0.08 0.26 0.31 -0.03
G24 2.19 2.15 2.03 1.83 3.37 3.01 4.35 4.07 2.63 2.85 0.80 0.23 0.79 -0.48 0.40
G25 2.89 2.17 1.78 3.06 5.49 4.23 3.82 3.58 1.94 3.22 1.09 0.30 1.42 -0.67 -0.44
G26 2.19 1.91 1.77 1.91 3.15 2.86 3.60 3.50 3.14 2.67 0.60 0.18 0.04 0.12 -0.06
G27 2.15 1.36 1.38 2.71 5.39 4.20 3.71 3.76 2.13 2.98 1.31 0.20 0.18 0.26 0.06
G28 1.71 1.71 1.70 2.66 3.74 3.12 3.02 3.30 2.57 2.61 0.69 0.11 0.28 0.28 -0.26
G29 2.40 1.92 1.51 1.37 3.42 2.86 3.35 3.28 2.31 2.49 0.71 0.12 0.09 0.06 0.28
G30 2.23 1.78 1.81 2.03 3.10 2.92 3.56 3.52 2.11 2.56 0.68 0.05 0.68 -0.43 0.43
G31 2.80 2.10 1.57 2.98 3.30 2.92 4.39 4.20 1.48 2.86 0.85 0.39 0.32 0.30 0.27
G32 1.60 1.28 1.44 1.38 4.19 3.25 3.84 3.41 1.88 2.47 1.16 0.06 1.01 0.51 -0.55
G33 2.53 1.60 1.65 2.92 4.74 3.45 4.07 3.43 2.27 2.96 1.00 0.10 0.08 0.05 0.28
G34 2.92 1.93 1.64 3.42 4.88 3.99 4.35 3.76 2.57 3.27 1.06 0.15 1.16 0.58 0.49
G35 2.57 1.84 1.71 2.67 3.88 3.22 3.24 3.13 1.77 2.67 0.72 0.08 2.73 -1.00 -0.03
Mean 2.31 1.78 1.70 2.38 4.29 3.48 4.04 3.78 2.25 2.89 1.00 0.18 0.88 0.00 0.00
Key: G1 to G35 name of genotypes; E1= Adet, E2=Alem Tena (2015), E3= Alem Tena (2016), E4= Axum, E5= Debre
Zeit (2015), E6= Debre Zeit (2016), E7=Holetta (2015), E8= Holetta (2016), E9= Shambu. IPCA = Interaction Principal
Component Axis, bi = Regression coefficient, s2di = Squared deviation from regression, ASV = AMMI Stability Value.

127
Analysis of GGE biplot
GGE biplot is visualized on the basis of results explained for the first two principal
components (Yan, 2001). Thus, in the present study, the first two principal components of
GGE biplot explained 72.8 % (PC1=49.8 and PC2=23.0%) of the total variationsin GEI
(Fig. 27). Smaller values of PC2 for genotypes indicate high stability of genotypes while
smaller values of PC2 for environment indicate more representativeness of the overall
environment. In this study, therefore, higher PC1 (49.8%) and lower PC2 (23.0%) values
were obtained for G6, G16, G25, G34 and G23indicating high mean yield for the studied
genotypes. Similarly, E4 and E5 had also high PC1 and lower PC2 values and hence they
are representative of the test environments.
5.4.3.1 Genotype performance and mega environment determination
GGE biplot enables to classify the study genotypes and environments based on the
performance of genotypes and the response of the growing environments. In the present
study, a polygon view was created by connecting the vertex genotypes (G19, G6, G13, G9
and G29) which were found furthest away from the origin. These genotypes were the highest
yielding in their respective environments or sector. The lines emanating from the origin
which are perpendicular to the line connecting the furthest genotypesdivided the test
environments and genotypes into different groups. Based on this grouping, the nine test
environments were grouped into fourmega environments whereas, the 35 test genotypes
were grouped in to seven genotypic groups (Fig. 26). Thus, G6 was the highest yielding
genotype in the environment where E1, E4 and E6 exist. Similarly, G13 was the highest
yielding genotype in the environment where E7 and E8 exist while, G19 was the highest
yielding at E9. E5 was identified to be the fourth mega environment though it had no vertex
genotype. The other vertex genotypes (G9 and G29) had no corresponding environment and

128
hence have the lowest mean grain yield across environments. On the other hand, the sector
consisting G17, G33 and G27 had no vertex genotype and corresponding environment.
Nevertheless, the mean yieldsof these genotypes were substantially higher than the grand
mean and were among the top yielding genotypes in their neighboring environments (Fig.
26).
Figure 26. Polygon view of the GGE biplot showing “which-won-where”
5.4.3.2 Relationship among environments
In the present study, the relationships among the nine test environments is presented in Fig.
27. The smallest angle was observed between E5& E6 followed by those between E7&

129
E8indicating the existence of high correlation between them. This shows that genotypes
performing best at E5 can repeat the same performance atE6, and those performing best at
E7 can also perform similarly at E8 and vice versa. The angles between E7 and E6, and E8
and E1, on the other hand, were closer to 90° showing that they have no correlation or
indicating that each environment has independent genotypic performance. Furthermore,
the angle between E9 and that of E7 and E8 is greater than 900 showing that they have
negative correlations. Hence, genotypes performing best at E9does not repeat the same
performance at E7 & E8 and vice versa. The nine test environments in the present study
were grouped into three based on the relationship among environments. Thus, group-I
consisted of E1, E4, E5 and E6; group two consisted of E2, E3, E7 and E8 whereas the third
group consisted of E9 only. The grouping based on relationship among environments is in
line with the environmental grouping of the polygon view. In both cases, however, the
grouping of high potential environments (E7 & E8) along with the moisture deficit
environments (E2 & E3) is unexpected.
Figure 27, furthermore, presented the variation in vector length of the different
environments. E5, E7 and E6 had the longest vector length and, therefore, are the most
discriminating environments in the present study. Similarly, E1, E2 and E3 had the shortest
vector length which indicates that they are the least discriminating of all the test
environments.
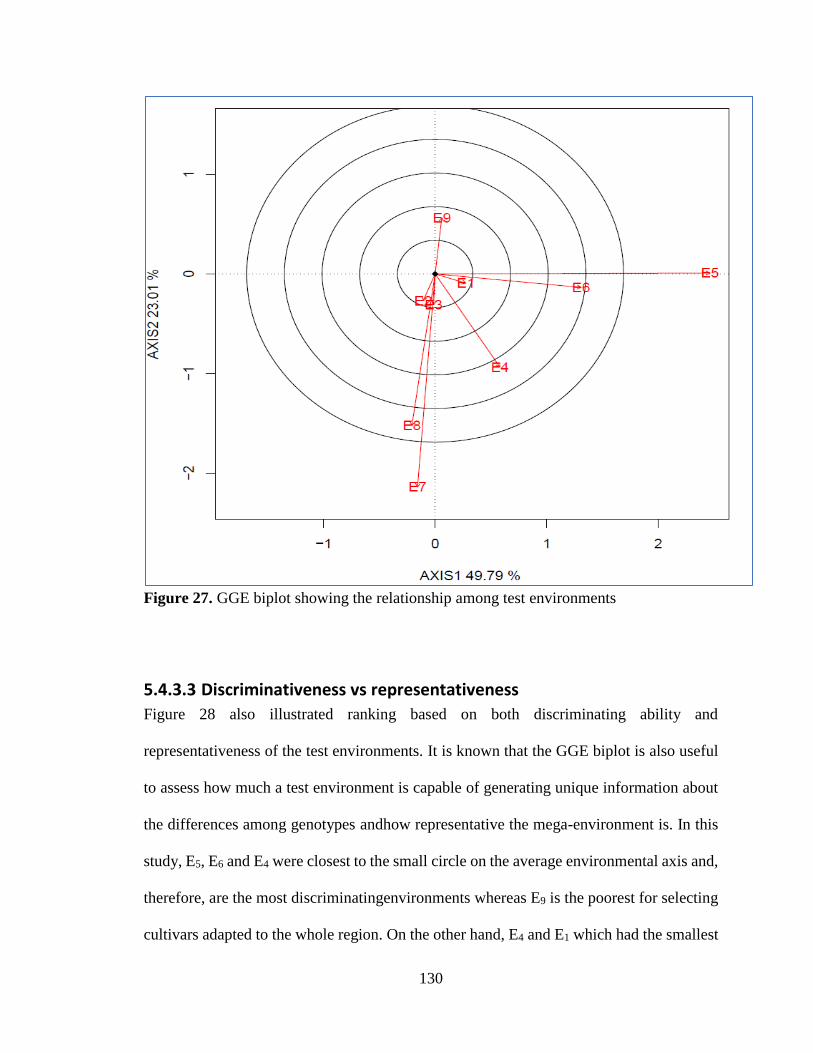
130
Figure 27. GGE biplot showing the relationship among test environments
5.4.3.3 Discriminativeness vs representativeness
Figure 28 also illustrated ranking based on both discriminating ability and
representativeness of the test environments. It is known that the GGE biplot is also useful
to assess how much a test environment is capable of generating unique information about
the differences among genotypes andhow representative the mega-environment is. In this
study, E5, E6 and E4 were closest to the small circle on the average environmental axis and,
therefore, are the most discriminatingenvironments whereas E9 is the poorest for selecting
cultivars adapted to the whole region. On the other hand, E4 and E1 which had the smallest

131
angle with average environmental axis were identifiedto be the most representative
environmentwhereas, E9having the largest angle is the least representative of all studied
environments (Fig.28).
Figure 28. Discriminativeness vs Representativeness
5.4.3.4 Genotypes mean yield and their stability
Based on Fig. 30, G6, G34, G22 and G10 had the shortest vector length from the average
environmental coordination (AEC) and, therefore, are identified to be the most stable. G13,
G19, G12 and G9, which had the longest vector length from the AEC, however, were the most
unstable ones. G6 followed by G23, G34, G16 and G25exhibited were identified to have the

132
highest mean yield whereas G29, G26, 30 and G28 performed far below the mean in all
environments (Fig. 29). An ideal genotype for a specific environment has the highest mean
yield and responds best to the particular environment while it is less stable in the other
environments. Thus, the vertex genotypes which have the highest mean yield in their
respective sectors need to be recommended for their specific sector.
Figure 29. Ranking biplot based on mean yield performance and stability of the
genotypes.

133
5.4.3.5 Ranking genotypes based on ideal environment
In this study, E5 (Debre Zeit-1) was the highest yielding environment to evaluate and rank
the performance of different genotypes relative to it (Fig.30). Those genotypes appearing
on the right side of the perpendicular line with E5 performed above the mean unlike those
in the opposite side of E5. Thus, G25, G27, G16, G17, G6, G22, G34, G23 appeared on the same
side with E5had above average performance whereas G9, G12, G29, G26, G30, etc. which
appeared on the opposite side of the perpendicular line to E5performed below average at
E5. Hence, those genotypes performing above the grand mean and occurred on the right
side of the perpendicular are suitable genotypes for E5 whereas the remaining ones are not.
Figure 30. Ranking the performance of different genotypes relative to the best
environment (E5).

134
5.4.3.6 Ranking genotypes relative to the ideal genotypes
Figure 31shows the ranking of genotypes based on the performance of an ideal genotypes
in the present study. The length of environmental projections appeared onto this genotype
axis indicate the performance of the best genotype at different environments relative to the
other genotypes. As Fig 31clearly shows, E5 followed by E7, E6 and E8 had the longest
projection from the genotype axis (G6 axis). Hence, E5, E7, E6 and E8 are the environment
where G6 performed the best compared to the remaining environments.
Figure 31. Ranking Environments based on the performance of an ideal Genotype (‘G6’)

135
Association of traits
Table 35presents the association among major traits of improved tef varieties evaluated
across nine environments. Grain yield showed significant (P<0.01) association with the
second culm diameter, shoot biomassand lodging index while, its associationwith the all
remaining traits were not significant at bothphenotypic and genotypic level. Shoot biomass
exhibited positive and significant (P< 0.01) genotypic association with all traits except
peduncle length andculm diameter. The same holds true with all traits except for fertile
tillers, peduncle length andculm diameterLodging index, on the other hand, had negative
and significant (P<0.01) association with all traits other than fertile tillers and grain yield
at both genotypic and phenotypic levels. Thus, its association with number of fertile tillers
was significant (P< 0.01) and positive at both genotypic and phenotypic levelswhile it had
no association with grain yield at both levels. The association of number of fertile tillers
was significant and negative at phenotypic level with all traits other than grain yield and
lodging index. It also showed the same associationwith alltriats other than shoot biomass,
grain yield and lodging index at genotypic level (Table 35).
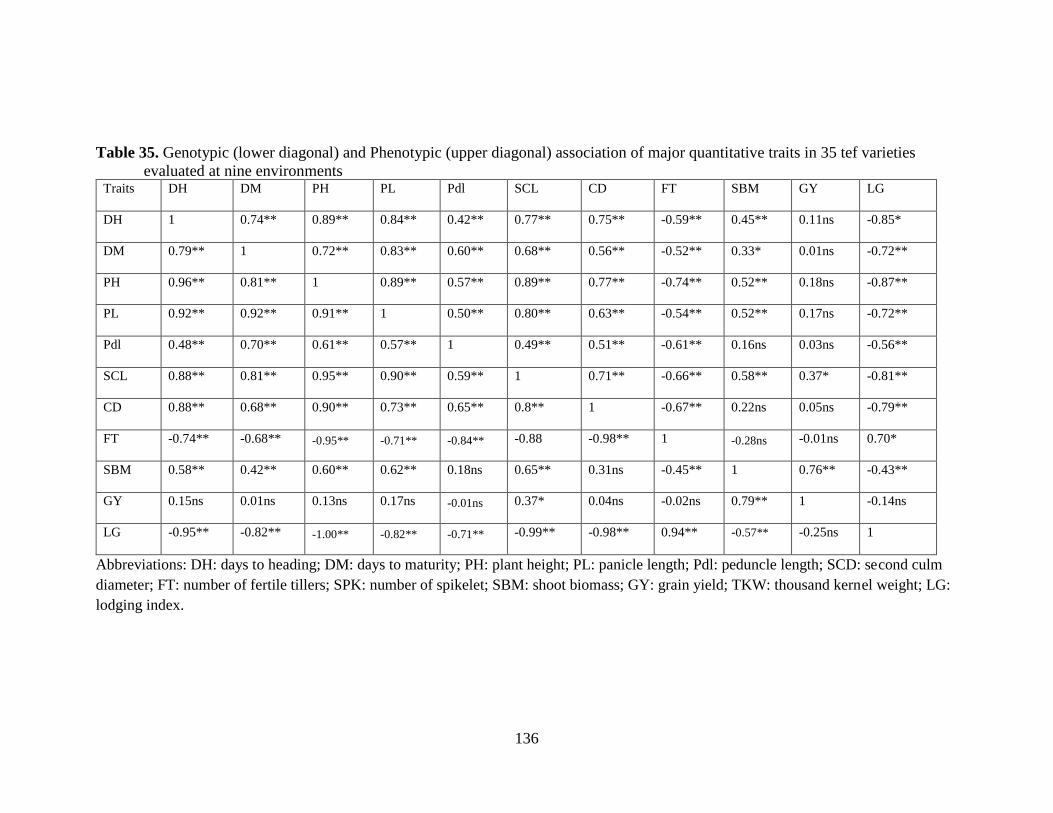
136
Table 35. Genotypic (lower diagonal) and Phenotypic (upper diagonal) association of major quantitative traits in 35 tef varieties
evaluated at nine environments Traits DH DM PH PL Pdl SCL CD FT SBM GY LG
DH 1 0.74** 0.89** 0.84** 0.42** 0.77** 0.75** -0.59** 0.45** 0.11ns -0.85*
DM 0.79** 1 0.72** 0.83** 0.60** 0.68** 0.56** -0.52** 0.33* 0.01ns -0.72**
PH 0.96** 0.81** 1 0.89** 0.57** 0.89** 0.77** -0.74** 0.52** 0.18ns -0.87**
PL 0.92** 0.92** 0.91** 1 0.50** 0.80** 0.63** -0.54** 0.52** 0.17ns -0.72**
Pdl 0.48** 0.70** 0.61** 0.57** 1 0.49** 0.51** -0.61** 0.16ns 0.03ns -0.56**
SCL 0.88** 0.81** 0.95** 0.90** 0.59** 1 0.71** -0.66** 0.58** 0.37* -0.81**
CD 0.88** 0.68** 0.90** 0.73** 0.65** 0.8** 1 -0.67** 0.22ns 0.05ns -0.79**
FT -0.74** -0.68** -0.95** -0.71** -0.84** -0.88 -0.98** 1 -0.28ns -0.01ns 0.70*
SBM 0.58** 0.42** 0.60** 0.62** 0.18ns 0.65** 0.31ns -0.45** 1 0.76** -0.43**
GY 0.15ns 0.01ns 0.13ns 0.17ns -0.01ns 0.37* 0.04ns -0.02ns 0.79** 1 -0.14ns
LG -0.95** -0.82** -1.00** -0.82** -0.71** -0.99** -0.98** 0.94** -0.57** -0.25ns 1
Abbreviations: DH: days to heading; DM: days to maturity; PH: plant height; PL: panicle length; Pdl: peduncle length; SCD: second culm
diameter; FT: number of fertile tillers; SPK: number of spikelet; SBM: shoot biomass; GY: grain yield; TKW: thousand kernel weight; LG:
lodging index.

137
5.4.4.1 Cluster Analysis
Cluster analysis based on data from the combined means across nine environments for 12
major quantitative traits grouped the 35 tef varieties into seven distinct classes (Fig.32).
The number of varieties in each cluster ranged from one variety in cluster-VII to12 varieties
in cluster-I. Cluster-II consisted of nine varieties whereas cluster-III, IV & VI each
consisted of three varieties. Cluster-V, on the other hand, consisted of four varieties
including two brown seeded and one extra white seeded variety released for the moisture
stress areas. Cluster-IV, consisted of three high yielding genotypes (Dukem, Quncho and
Kora) which were released for the high potential areas whereas, cluster-VI consisted of
three varieties released for the moisture stress areas of the country. Cluster-I, II and III
consisted of a mix of varieties with various agro- ecological adaptation, seed color,
maturity groups. Analysis of distance between clusters revealed that the best recombination
is expected between C5 & C6 followed by C4 & C5, C6& C7, and C4 & C7 which had the
highest inter cluster distance respectively (Table 36).
The traits mean for the seven clusters in the present study are shown in Table 37. Cluster I
consisted of 12 tef varieties that have the longest days to maturity and peduncle length.
Cluster II and V, however, had moderate values for all the traits evaluated. Cluster-VI, on
the other hand, were found to have the highest values for about 70% of the studied traits
with the smallest value for lodging percent whereas cluster-VII was solitary and that
include a genotype with the highest number of fertile tillers, 1000-kernel weight and
lodging index along with the shortest length of peduncle and second culm and the thinnest
second culm diameter. The genotype in cluster VI had the shortest days to heading and
maturity, plant height, panicle length as well as the smallest values for shoot biomass and

138
grain yield. Cluster VI composed of three varieties with the shortest days to heading and
maturity that were originally released for moisture deficit environments. In general, the
observed clustering pattern among the studied tef varieties is in line with their distribution
in a biplot graph (Fig. 33).
Figure 32.Dendrogram based on complete linkage Euclidean distance showing the
clustering pattern of 35 tef varieties evaluated for major quantitative traits at nine
environments in Ethiopia.
Ho
leta
Key
Sim
ad
a
Am
ara
ch
Tse
day
Bo
set
Ajo
ra
Key T
en
a
Asg
ori
Ko
ra
Qu
nch
o
Du
kem
Wo
rkiy
e
Laketc
h
Gu
du
ru
Gim
bic
hu
Gem
ech
is
Dim
a
Gib
e
Deg
a T
ef
Melk
o
Go
la
Ko
ye
Men
ag
esh
a
Am
bo
-To
ke
Gera
do
Zo
bel
Ziq
uala
Yil
man
a
Ho
len
ko
mi
Mag
na
Ken
a
Gen
et
Ets
ub
Mech
are
En
ati
t
0.00
33.33
66.67
100.00
Variety name
Sim
ilari
ty
III
III
VI V
VI
VII

139
Figure 33. A biplot graph showing the distribution of the studied tef varieties using the
first two principal components
Table 36. Distance between Cluster Centroid
Cluster1 Cluster2 Cluster3 Cluster4 Cluster5 Cluster6 Cluster7
Cluster1 0
Cluster2 3.76 0
Cluster3 2.31 3.30 0
Cluster4 6.22 3.51 6.5 0
Cluster5 4.51 6.72 3.8 9.88 0
Cluster6 7.21 3.96 6.9 3.98 10.06 0
Cluster7 2.67 5.16 3.3 7.76 3.49 8.47 0
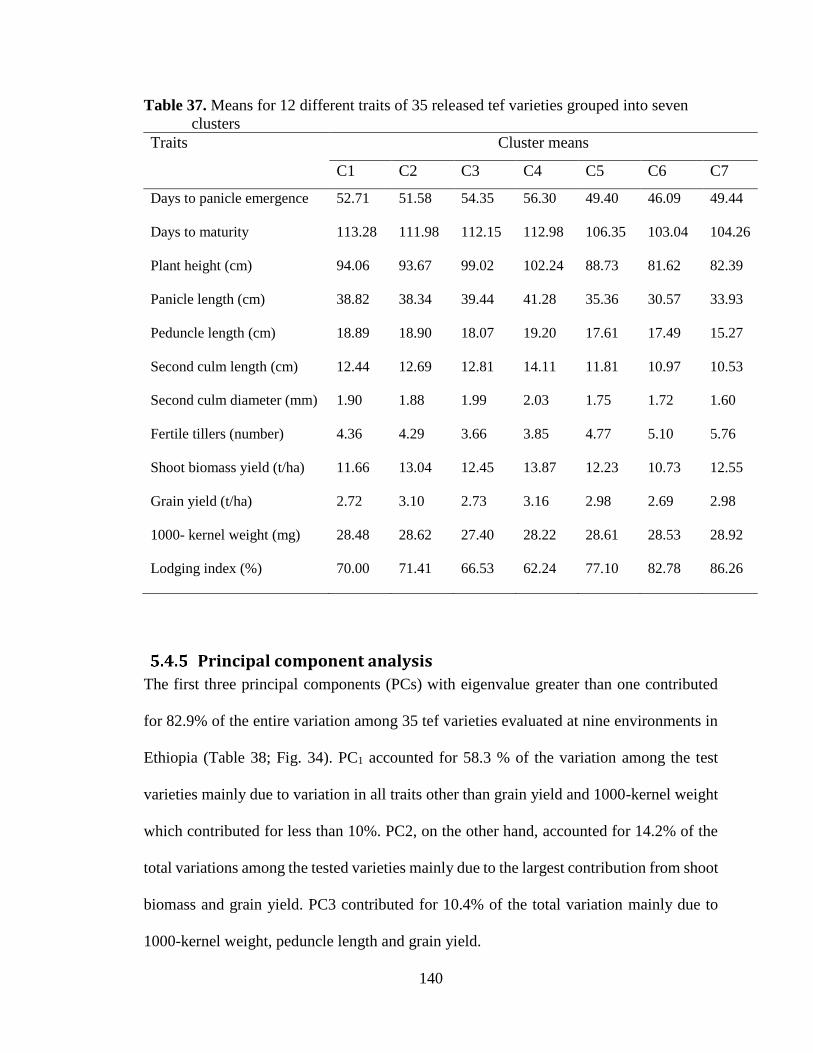
140
Table 37. Means for 12 different traits of 35 released tef varieties grouped into seven
clusters
Traits Cluster means
C1 C2 C3 C4 C5 C6 C7
Days to panicle emergence 52.71 51.58 54.35 56.30 49.40 46.09 49.44
Days to maturity 113.28 111.98 112.15 112.98 106.35 103.04 104.26
Plant height (cm) 94.06 93.67 99.02 102.24 88.73 81.62 82.39
Panicle length (cm) 38.82 38.34 39.44 41.28 35.36 30.57 33.93
Peduncle length (cm) 18.89 18.90 18.07 19.20 17.61 17.49 15.27
Second culm length (cm) 12.44 12.69 12.81 14.11 11.81 10.97 10.53
Second culm diameter (mm) 1.90 1.88 1.99 2.03 1.75 1.72 1.60
Fertile tillers (number) 4.36 4.29 3.66 3.85 4.77 5.10 5.76
Shoot biomass yield (t/ha) 11.66 13.04 12.45 13.87 12.23 10.73 12.55
Grain yield (t/ha) 2.72 3.10 2.73 3.16 2.98 2.69 2.98
1000- kernel weight (mg) 28.48 28.62 27.40 28.22 28.61 28.53 28.92
Lodging index (%) 70.00 71.41 66.53 62.24 77.10 82.78 86.26
Principal component analysis
The first three principal components (PCs) with eigenvalue greater than one contributed
for 82.9% of the entire variation among 35 tef varieties evaluated at nine environments in
Ethiopia (Table 38; Fig. 34). PC1 accounted for 58.3 % of the variation among the test
varieties mainly due to variation in all traits other than grain yield and 1000-kernel weight
which contributed for less than 10%. PC2, on the other hand, accounted for 14.2% of the
total variations among the tested varieties mainly due to the largest contribution from shoot
biomass and grain yield. PC3 contributed for 10.4% of the total variation mainly due to
1000-kernel weight, peduncle length and grain yield.

141
Figure 34. Scree plot showing the Eigen value for each component number
Table 38. Eigenvectors and values of the first three principal components for 35 released
tef test varieties evaluated at nine environments in Ethiopia Variable PC1 PC2 PC3
Days to panicle emergence 0.344 0.033 0.171
Days to maturity 0.316 0.112 0.023
Plant height (cm) 0.364 0.008 0.077
Panicle length (cm) 0.343 -0.046 0.119
Peduncle length (cm) 0.258 0.201 -0.439
Second culm length 0.346 -0.103 -0.037
Second culm diameter (mm) 0.314 0.207 -0.057
Fertile tillers (number) -0.265 -0.209 0.044
Shoot biomass yield (t/ha) 0.208 -0.609 -0.004
Grain yield (t/ha) 0.094 -0.669 -0.327
100- kernel weight (mg) -0.071 0.147 -0.802
Lodging index (%) -0.347 -0.085 0.012
Eigenvalue 6.99 1.706 1.254
Proportion 0.583 0.142 0.104
Cumulative 0.583 0.725 0.829
121110987654321
7
6
5
4
3
2
1
0
Component Number
Eige
nval
ue

142
Discussion
Analysis of variance
The highly significant (P < 0.01) variation detected among genotypes, environments and
genotype by environment interaction for almost all traits in the current study is in line with
the previous reports in tef (Kefyalew et al., 2000). The existence of significant variation
among testing environments might be attributed due to variation in climatic element and
soil condition across the testing environments. Such significant genotype by environment
interaction complicatesselection and recommendation of stable genotype across
environments (Hundera et al., 2000a; Kefyalew et al. 2000, 2001).
AMMI Analysis
AMMI analysiswhichrevealed the existence of significant mean grain yield variation
among genotype, environment and GE interaction is in line with the previous works
(Kefyalew, 1999; Kefyalewet al., 2000, 2001). Besides, the variation explained by the
environment was very high and it was about four times what was explained by the genotype
and the genotype plus genotype by environment interactions. Similar results were also
reported in the previous findings (Gauch and Zobel, 1997; Tolessa et al., 2013). PC1and
PC2, respectively explained 53.0% and 19.4% of the variation for GEI. Kefyalew et al
(2001) also reported the PC1 value of 52.1% while Lule (2015) obtained the PC1 value of
66.1%. However, according to Crossaet al. (1990), 93% of the variance of GxE interaction
was from the first IPCA alone. The use of the first two PCs which contributed for more
than 70% of the G x E interaction in this study in line with several previous works in tef
(Kefyalew et al., 2000; 2001), Faba beans (Tolessa et al., 2013) and Finger Millet (Lule,
2015).

143
AMMI Stability Value (ASV) was suggested to aid selection of relatively stable & high
yielding genotypes in many crops whereby an ideal genotype has high mean yield and
small ASV value (Lule, 2015). According to Eberhart and Russell (1966) model, however,
the best yielding genotype is expected to have high mean yield and a regression coefficient
(bi) value of unity. As Eberhart and Russell (1966) suggested high yielding genotype
having squared deviation from regression (S2di) different from zero should be considered
as stable and adaptable ones. Hence, in this study, consideration of Melko which had bi
value of 1.27 and S2di value of 0.21 is justifiable.
Analysis of GGE Biplot
One of the most important features of a GGE biplot is its ability to show the which-won-
where pattern of a genotype by environment dataset (Yan and Tinker, 2005; Farshadfar et
al., 2011). In a GGE biplot, the polygon view is created by connecting the markers of the
furthest genotypes and thus all other genotypes are included in the polygon indicating that
the best genotype(s) in each environment and groups of environments are represented at
the vertex (Farshadfar et al., 2011; Yan, 2002). In other words, the the vertex genotypes
had the highest yield for the environments falling within that quadrant (Farshadfar et al.,
2011; Yan, 2002). In the present study, therefore, G6, G13, G9, G29 and G19 were the
vertex genotypes having the highest mean yield in their respective environments.
The angle between the vectors of two environments has a meaningful relation with the
correlation coefficient between them (Kroonenberg, 1995; Yan, 2002; Yan and Kang, 2003)

144
and such relationship is used to group the test environments. Thus, if two environments are
positively correlated, the best yielding genotypes in one environment will perform best in
the other environment. Contrary to this, if two environments are negatively correlated, the
best yielding genotypes in one environment perform the least in the other environment and
vice versa (Yan, 2002; Yan and Kang, 2003). In the present study, Debre Zeit-1, Debre
Zeit-2, Adet and Axumwhich had an angle less than 900are positively correlated with each
other. Similarly, the angles between Axum, Holetta-1, Holetta-2, Alem Tena-1 and Alem
Tena-2 were also less than 900indicating that they have a positive correlation with each
other. On the other hand, the angle between Axum and all environments other than
Shambuis nearly 900 and hence these environments have no correlation with each other.
The angle between Shambu& all environments other than Adet, Debre Zeit-1 &2 had
greater than 900 and hence they have negative correlations.
A vector length is the absolute distance between the marker of an environment and the plot
origin (Yan, 2001; Yan et al., 2002; Yan and Tinker, 2006) and it is used to measure the
discriminating ability of an environment. Thus, the longer the vector length, the better the
discriminating power of an environment. An ideal environment is a point on the average
environmental axis (AEA) in the positive direction of the biplot origin and is equal to the
longest vector of all environments (Yan and Tinker, 2006). It is represented by small circle
with an arrow pointing to it and is the most discriminating of the genotypes across all other
test environments. In the present study, therefore, E5, E6, E7 and E8 which had the longest
vector length were identified to be the most discriminating of all test environments. On the
other hand, the average environmental axis (AEA) is a line passing through the origin and

145
pointing to the positive direction with its distance equal to the longest vector. Thus, atest
environment having a smaller angle with that of AEA is said to be more representative of
other test environments (Yan and Tinker, 2006). In the present study, therefore, E1 and E4
which had the smallest angle with the average environmental axis were identified to be the
most representative of all test environments.
The average environment coordination (AEC) is a line that passes through the origin and
points to the higher mean yield across environments and shows the increase in rank of
genotypes towards the positive end (Yan et al., 2000). AEC was reported to be important
to evaluate mean yield and stability of genotypes (Yan, 2001; Yan, 2002; Yan and Hunt,
2002) based on genotypes performance across environments. According to this evaluation,
genotypes considered to be stable are those appeared closer to the origin with the shortest
vector length from the AEC. Thus, in the present study, G33 which had minimal distance
from the AEC was the most stable, but lower yielding genotypes whereas G6, G25 and
G34 were the highest yielding but moderately stable genotypes (Table 27).
According to Farshadfar et al., 2011), an ideal environment or the best environment is
represented by an arrow pointing to it. According to the same author, an environmental
axis is a line passing through the origin and connected to the best environment.
Aperpendicular to the environmental axis that passes through the biplot origin is then used
to separate genotypes yielding above and below the mean in the ideal environment. Thus,
E5 was identified to be the best environment and G6, G34, G25, G27, G16, G17, G23 and

146
G22 which appeared on the same direction with E5 were found to perform above average
in this environment.
As suggested by Yan et al. (2000), the relative adaptation of the ideal genotype was
evaluated by drawing a line passing through the biplot origin and the best genotype marker.
A genotype axis is a line passing through the biplot origin and connected to the best
genotype (Yan et al., 2000). In the present study, G6 which had the highest average yield
was identified to be the ideal genotype to evaluate the performance of test environments
relative to it. Hence, all environments other than E9 were found to be best for the
performance of G6 (Melko). In general, according to Yan et al. (2001), ideal cultivars have
large PC1 scores (high mean yield) and small PC2 scores (high stability) while ideal
environments are expected to have more power of discriminating genotypes and more
representative of the overall environments (Yan et al., 2001; Yan and Rajcan, 2002). Thus,
in the present study, genotypes such as G6, G25, G16, G23 and G34 which had larger PC1
and smaller PC2 scores were identified to be high yielding and stable.
The fact that no association was observed between grain yield and all traits other than shoot
biomass and second culm diameter at both phenotypic and genotypic level is contrary to
the positive and significant association previously reported for the same traits (Jifar et al.,
2015; Jifar et al., 2017). However, the positive and significant association obtained
between fertile tillers and lodging index in the present study is in line with the previous
report (Jifar et al., 2017).

147
Cluster Analysis
Theresult of cluster analysis in the present finding is in line with Jifar et al (2015) who
reported the grouping of 36 brown tef genotypes into seven clusters whereas Plaza-
Wüthrich et al. (2013) obtained six clusters based on 10 traits of 18 genotypes. The results
of cluster analysis and that of the plotting of genotypes across the first and second PCs
revealed the formation of seven distinct clusters. For instance, the shavy brown seeded,
Holetta Key, variety was solitary and grouped alone in cluster seven whereas the early
maturing Tsedey, Amarach and Simada were grouped together in cluster six. Surprisingly,
the extra white seeded and high yielding genotypes (Kora and Quncho) were grouped in
cluster four along with Dukem which is the female parents of Quncho.
Pricipal Component Analysis
The value obtained for the principal component analysis (82.9%) in the present study is in
line with the earlier reports on the same cropranging from 79 to 85% (Assefa et al., 2003;
Adinew et al. 2005; Plaza-Wüthrich et al., 2013; Jifar et al. 2015). On the other hand, the
contribution of PC1 is substantially higher than some previous reports (Assefa et al., 2003;
Plaza et al., 2013; Jifar et al., 2015), but in line with Adinew et al. (2005). The contribution
of PC2(14.2%) in the present study, however, is much lower than that of earlier report (Jifar
et al., 2015).
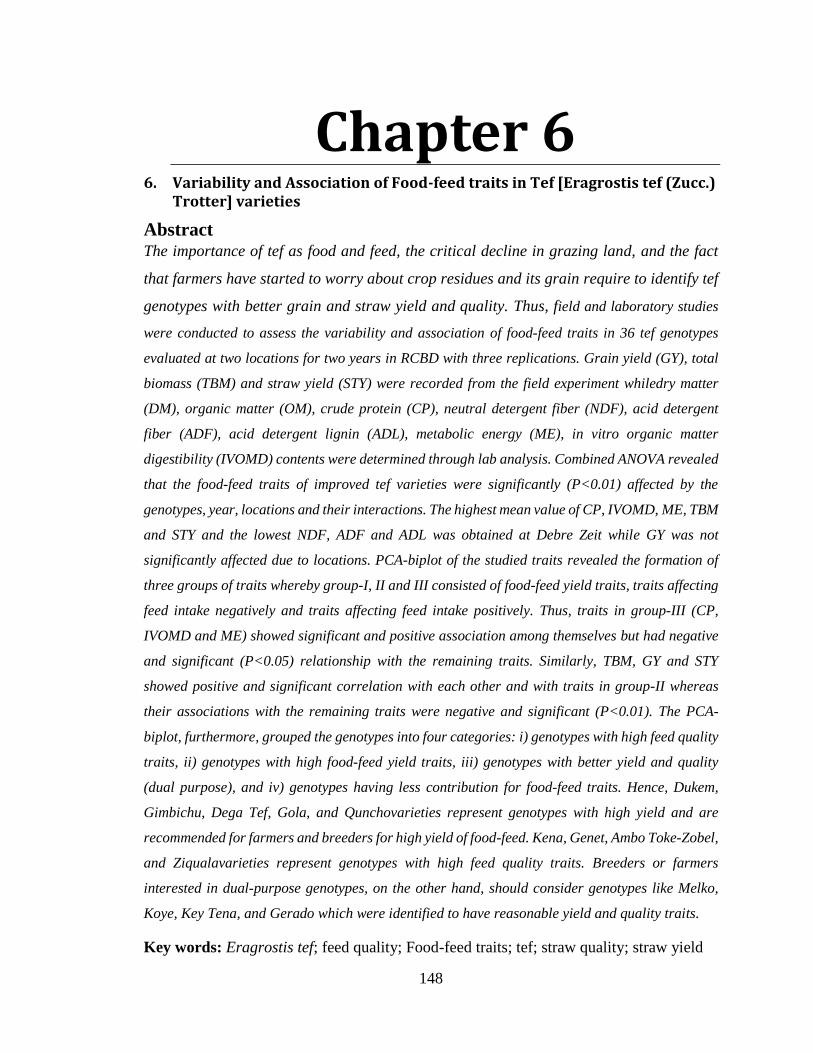
148
Chapter 6 6. Variability and Association of Food-feed traits in Tef [Eragrostis tef (Zucc.)
Trotter] varieties
Abstract
The importance of tef as food and feed, the critical decline in grazing land, and the fact
that farmers have started to worry about crop residues and its grain require to identify tef
genotypes with better grain and straw yield and quality. Thus, field and laboratory studies
were conducted to assess the variability and association of food-feed traits in 36 tef genotypes
evaluated at two locations for two years in RCBD with three replications. Grain yield (GY), total
biomass (TBM) and straw yield (STY) were recorded from the field experiment whiledry matter
(DM), organic matter (OM), crude protein (CP), neutral detergent fiber (NDF), acid detergent
fiber (ADF), acid detergent lignin (ADL), metabolic energy (ME), in vitro organic matter
digestibility (IVOMD) contents were determined through lab analysis. Combined ANOVA revealed
that the food-feed traits of improved tef varieties were significantly (P<0.01) affected by the
genotypes, year, locations and their interactions. The highest mean value of CP, IVOMD, ME, TBM
and STY and the lowest NDF, ADF and ADL was obtained at Debre Zeit while GY was not
significantly affected due to locations. PCA-biplot of the studied traits revealed the formation of
three groups of traits whereby group-I, II and III consisted of food-feed yield traits, traits affecting
feed intake negatively and traits affecting feed intake positively. Thus, traits in group-III (CP,
IVOMD and ME) showed significant and positive association among themselves but had negative
and significant (P<0.05) relationship with the remaining traits. Similarly, TBM, GY and STY
showed positive and significant correlation with each other and with traits in group-II whereas
their associations with the remaining traits were negative and significant (P<0.01). The PCA-
biplot, furthermore, grouped the genotypes into four categories: i) genotypes with high feed quality
traits, ii) genotypes with high food-feed yield traits, iii) genotypes with better yield and quality
(dual purpose), and iv) genotypes having less contribution for food-feed traits. Hence, Dukem,
Gimbichu, Dega Tef, Gola, and Qunchovarieties represent genotypes with high yield and are
recommended for farmers and breeders for high yield of food-feed. Kena, Genet, Ambo Toke-Zobel,
and Ziqualavarieties represent genotypes with high feed quality traits. Breeders or farmers
interested in dual-purpose genotypes, on the other hand, should consider genotypes like Melko,
Koye, Key Tena, and Gerado which were identified to have reasonable yield and quality traits.
Key words: Eragrostis tef; feed quality; Food-feed traits; tef; straw quality; straw yield
149
Introduction
Tef [Eragrostis tef (Zucc.) Trotter] is a major cereal crop domesticated and widely grown
in Ethiopia. It is a gluten free (Spaenij-Dekking et al., 2005), nutritious human food
(Ketema, 1993; Assefa et al., 2011) and livestock feed (Bediye and Fekadu, 2001; Yami,
2013). It is annually grown by seven million households in Ethiopia covering over three
million hectares of land and providing five million tons of grain (CSA, 2017). Though tef
has wider adaptations, its major production is in the mid and highland areas having the
largest human and livestock population.
Natural pastures, crop residues, agro-industrial by-products, and to some extent improved
forage and pasture are the major sources of animal feeds in Ethiopia (Geleti et al.,
2013).The contribution of natural pasture is, however, declining continuously due to
continued increase of crop farming into grazing lands to nourish the rising human
population (Tolera et al., 1999). Hence, feed shortage is becoming a serious constraint in
Ethiopia. As livestock is the major components of the farmingsystem in Ethiopian,
designing a comprehensive strategicaloption to solve such feed shortage problem is very
essential. Proper use of crop residue is, therefore, among theoptions to be implemented.
Tef straw provides nearly half of the total annual cereal straws in the central highlands
(Yami, 2013) and about a quarter of the total straw for the country (Bediye et al., 1996).
Hence, itisone of the most important feed resources to alleviate the feed shortage through
better use of cultivars with higher fodder yield and higher straw quality. To date, however,
studies conducted on food-feed traits of improved tef varieties are limited and key food-
feed traitswere not addressed properly.

150
The importance of tef as food and feed, and farmers worry about crop residues and its grain
require to identify genotypes with better grain and straw yield and quality. Conducting feed
quality analysis enables to identify tef genotypes suitable for food-feed traits and to
incorporate such traits into future variety development. Hence, the objectives of this study
were: to assess the variability for food-feed traits among released varieties; to reveal the
relationships among the food and feed traits; and to provide recommendations regarding
food and feed value of the crop to the tef breeding.
Materials and methods
Field Study
Thirty-five improved tef varieties (Table 30) and a local check were grown for two years
(2015 and 2016) at two locations (Debre Zeit and Holetta) using randomized complete
block design (RCBD) with three replications. A plot size of 1m x1m was used with a
spacing of 0.2m between rows, 1m between plots and 1.5mbetween replications. Total
biomass was weighed and recorded before threshing whereas the grain yield and straw
yieldwere recorded after threshing. The tef straw samples for laboratory analysis were
taken after threshing and partitioning of shoot biomass into grain and straw.
Laboratory Study
Four hundred thirty-two straw samples from 35 improved tef varieties and a local check
grown in three replications at two locations for two years (36 genotypes x 3 replications x
2 locations x 2 years = 432) were collected and evaluated. Each sample was ground to pass
through 1 mm sieve using Christu lab mill at the International Livestock Research Institute
(ILRI), Ethiopia. Dry matter (DM), ash, nitrogen (N), neutral detergent fiber (NDF), acid
detergent fiber (ADF), acid detergent lignin (ADL) and in vitro organic matter digestibility
151
(IVOMD) were determined using the Near Infrared Reflectance Spectroscopy (NIRS)
according to the manufacturer’s protocol.
6.2.2.1 Analysis of feed quality using NIRS
Scanning of samples was performed using NIRS machine (Foss NIRS 5000 Win II project
version 1.5, Intra Soft International, LLC) on 3 g ground samples. Before scanning, all
samples were pre-dried in an oven at 1050 C overnight to standardize moisture conditions.
In this study, a wave length range of 1100 to 2498 was used for the NIRS machine at 2 nm
intervals.
6.2.2.2 Wet Chemistry Analysis
After NIRS scanning, 108 selected samples were used for the wet chemistry analysis to
develop and validate a tef straw equation at ILRI Feed Nutrition Laboratory in Addis
Ababa, Ethiopia and ICRISAT, India. Thus, 82 of these samples were used to develop and
calibrate the equation whereas the remaining 26 were used to validate the developed
equation. Thus, the prediction of all samples scanned by NIRS were done after developing
and validating a new tef straw equation.
Dry matter (DM), ash and nitrogen were analyzed according to AOAC (1990), neutral
detergent fiber (NDF), acid detergent fiber (ADF) and acid detergent lignin (ADL)
following the Goering and Van Soest (1970) method and in vitro organic matter
digestibility (IVOMD) by two-stage in vitro technique (Tilley and Terry, 1963). The
determination of crude protein was performed following the Kjeldahl method procedure
(AOAC, 2000). All chemical analyses were performed in duplicate and expressed on a dry
weight basis whereby 2 g, 1 g, 0.5 g and 0.3 gwere used for determination of DM, ADF,
NDF and N, respectively.
152
6.2.2.3 Developing the tef straw equation
Predictive equations were developed using the modified partial least squares (MPLS)
(Shenk and Wester Haus, 1993) regression with internal cross-validation and scatter
correction using standard normal variates and detrend (Barnes et al., 1989). The
mathematical treatment applied in the present study was (1, 4, 4, 1); where the first number
indicates the order of derivative (one is first derivative of log 1/R), the second number is
the gap in nm over which the derivative is calculated; the third number is the number of
nm used in the first smoothing and the fourth number refers to the number of nm over
which the second smoothing is applied. Standard error of calibration (SEC), the coefficient
of determination in calibration (R2), the standard error of cross validation (SECV) and the
coefficient of determination in cross validation (1-VR) were calculated as calibration
statistics (Shenk and Wester Haus, 1993). The optimum calibrations were selected on the
basis of minimizing the standard error of cross validation (SECV). The standard error of
cross validation to standard deviation of the constituent data was calculated to evaluate the
calibrations (Murray, 1993).
Analysis of variance Descriptive statistics was used to summarize all the data on food-feed traits. The GLM
procedure of SAS (SAS, 2002) was employed for analysis of variance and the test of
significance was declared at P <0.05 using the least significance differences (LSD).
Associations among the various food-feed traits were assessed using the SAS software
(SAS, 2002). A biplot showing the distribution of nine traits and 36 tef genotypes were
analyzed using MINITAB version 17.1 (Minitab, 2013).

153
RESULTS
Variation in major food-feed traits of tef
The chemical composition of feed quality traits and their descriptive statistics like mean,
standard deviation (SD), range, and coefficient of variation (CV%) for individual locations
were estimated and are presented (Table 39). At Debre Zeit, the measurements for key
traits ranged from 6.95 to 9.3 for CP, 74.9 to 78.8% for NDF, 41.3 to 45.0% for ADF, 6.6
to 7.5% for ADL, 6.7 to 7.2 for ME and 46.8 to 50.1% for IVOMD. Similarly, at Holetta,
the values ranged from 2.78 to 3.96% for CP, 82.3 to 84.7% for NDF, 50.1 to 51.8% for
ADF, 8.0 to 8.5% for ADL, 6.2 to 6.4 for ME, and 42.3 to 43.6% for IVOMD. The yields
of total biomass, grain and straw, on the other hand, ranged from 11.98 to 21.90 t/ha, 2.90
to 4.94 t/ha and 9.06 to 16.96 t/ha, respectively at Debre Zeit whereas the same yield traits
in the same order ranged from 10.70 to 16.78 t/ha, 3.17 to 4.78 t/ha and 7.53 to 12.72 t/ha
at Holetta (Table 39).
Combined mean, SD, range, and CV% of the chemical composition of feed quality traits
of tef are presented in Table 39. This result showed that the mean CP content was 5.69%,
with values ranging from 5.04 for G25 to 6.26 % for G19 (SD = 0.30; CV = 10.24%). The
NDF, on the other hand, ranged from 79.08% for G18 to 81.2% for G20, with a mean of
80.2% (SD = 0.57; CV = 1.68%). The ADF content, similarly, ranged from 46.05 for G29
to 47.9% for G16 with a mean of 47.1% (SD = 0.54; CV = 2.41%). Likewise, the ADL
ranged from 7.32% for G29 to 7.96% for G27, with a mean of 7.69% (SD = 0.15; CV =
5.05%). Furthermore, the ME content (MJ Kg-1 DM) also ranged from 6.51 for G7 to 6.70
for G26, with a mean of 7.69 (SD = 0.05; CV = 2.01%). Combined mean of IVOMD %, on
the other hand, was 45.6% with values ranging from 44.9 for G25 to 46.30% for G9 (SD =

154
0.42; CV = 2.01%). On the other hand, the combined mean for biomass yield was 15.80
t/ha, with values ranging from 13.30 t/ha for G20 to 18.94 t/ha for G10 (SD = 1.48; CV =
10.68 %). Besides, the mean for grain yield was 3.88 t/ha with values ranging from 3.23
t/ha G30 to 4.63 t/ha for G17 (SD = 0.37; CV = 7.66 %). Furthermore, the combined mean
for tef straw yield was 11.92 t/ha, with values ranging from 9.7 t/ha for G12 to 14.83 t/ha
for G10.
Combined analysis variance revealed that the food-feed traits of improved tef varieties
were significantly (P < 0.01) affected by the genotypes, year, locations and their
interactions (Table 40). Thus, all studied traits were significantly affected by the genotypes
and by the location except for grain yield while the year effect significantly (P<0.01)
affected all food-feed traits except metabolic energy. On the other hand, the genotype by
location effect was significant (P<0.01) for all traits other than ADL. Similarly, the year
by genotype interaction was significant for all traits other than ADL, SBM and STY while,
all traits other than ADL were significant (P<0.01) affected by the interaction of the three
factors (Table 40).

155
Table 39. Simple descriptive statistics for major feed quality traits at Debre Zeit and
Holetta
Location Variable Mean Minimum Maximum Std. Dev CV (%)
Debre Zeit CP 8.1 7.0 9.3 0.54 13.82
NDF 76.7 74.9 78.8 0.96 1.43
ADF 43.0 41.3 45.0 0.97 2.14
ADL 7.1 6.6 7.5 0.24 4.74
ME 6.9 6.7 7.2 0.10 1.67
IVOMD 48.3 46.8 50.1 0.82 1.72
TB 17.7 12.0 21.9 2.49 8.57
GY 3.9 2.9 4.9 0.60 6.67
STY 13.9 9.1 17.0 1.96 10.63
Holetta CP 3.3 2.8 3.8 0.25 8.47
NDF 83.7 82.3 84.7 0.60 1.94
ADF 51.1 50.1 51.8 0.43 2.73
ADL 8.3 8.0 8.5 0.15 5.42
ME 6.3 6.2 6.4 0.04 2.24
IVOMD 42.9 42.3 43.6 0.29 2.21
TB 13.9 10.7 16.8 1.40 11.64
GY 3.9 3.2 4.8 0.38 8.54
STY 10.0 7.5 12.7 1.13 13.82
Combined CP 5.7 5.0 6.3 0.30 10.24
NDF 80.2 79.1 81.2 0.57 1.68
ADF 47.1 46.1 47.9 0.54 2.41
ADL 7.7 7.3 8.0 0.15 5.05
ME 6.6 6.5 6.7 0.05 2.01
IVOMD 45.6 44.9 46.3 0.42 2.01
TB 15.8 13.3 18.9 1.48 10.68
GY 3.9 3.2 4.6 0.37 7.66
STY 11.9 10.1 14.3 1.19 12.70
CP=crude protein, NDF=neutral detergent fiber, ADF=acid detergent fiber, ADL=acid detergent
lignin, ME=metabolic energy, IVOMD=in vitro organic matter digestibility, TB=total biomass,
GY= grain yield, STY=straw yield
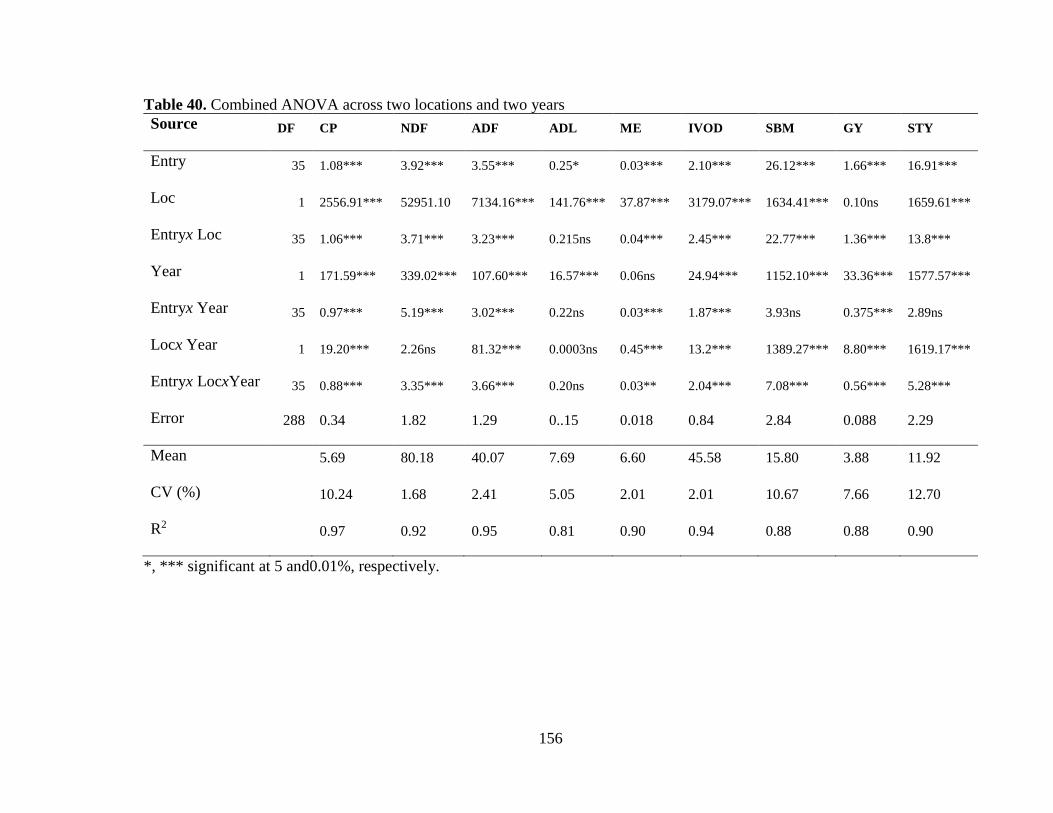
156
Table 40. Combined ANOVA across two locations and two years
Source DF CP NDF ADF ADL ME IVOD SBM GY STY
Entry 35 1.08*** 3.92*** 3.55*** 0.25* 0.03*** 2.10*** 26.12*** 1.66*** 16.91***
Loc 1 2556.91*** 52951.10 7134.16*** 141.76*** 37.87*** 3179.07*** 1634.41*** 0.10ns 1659.61***
Entryx Loc 35 1.06*** 3.71*** 3.23*** 0.215ns 0.04*** 2.45*** 22.77*** 1.36*** 13.8***
Year 1 171.59*** 339.02*** 107.60*** 16.57*** 0.06ns 24.94*** 1152.10*** 33.36*** 1577.57***
Entryx Year 35 0.97*** 5.19*** 3.02*** 0.22ns 0.03*** 1.87*** 3.93ns 0.375*** 2.89ns
Locx Year 1 19.20*** 2.26ns 81.32*** 0.0003ns 0.45*** 13.2*** 1389.27*** 8.80*** 1619.17***
Entryx LocxYear 35 0.88*** 3.35*** 3.66*** 0.20ns 0.03** 2.04*** 7.08*** 0.56*** 5.28***
Error 288 0.34 1.82 1.29 0..15 0.018 0.84 2.84 0.088 2.29
Mean 5.69 80.18 40.07 7.69 6.60 45.58 15.80 3.88 11.92
CV (%) 10.24 1.68 2.41 5.05 2.01 2.01 10.67 7.66 12.70
R2 0.97 0.92 0.95 0.81 0.90 0.94 0.88 0.88 0.90
*, *** significant at 5 and0.01%, respectively.
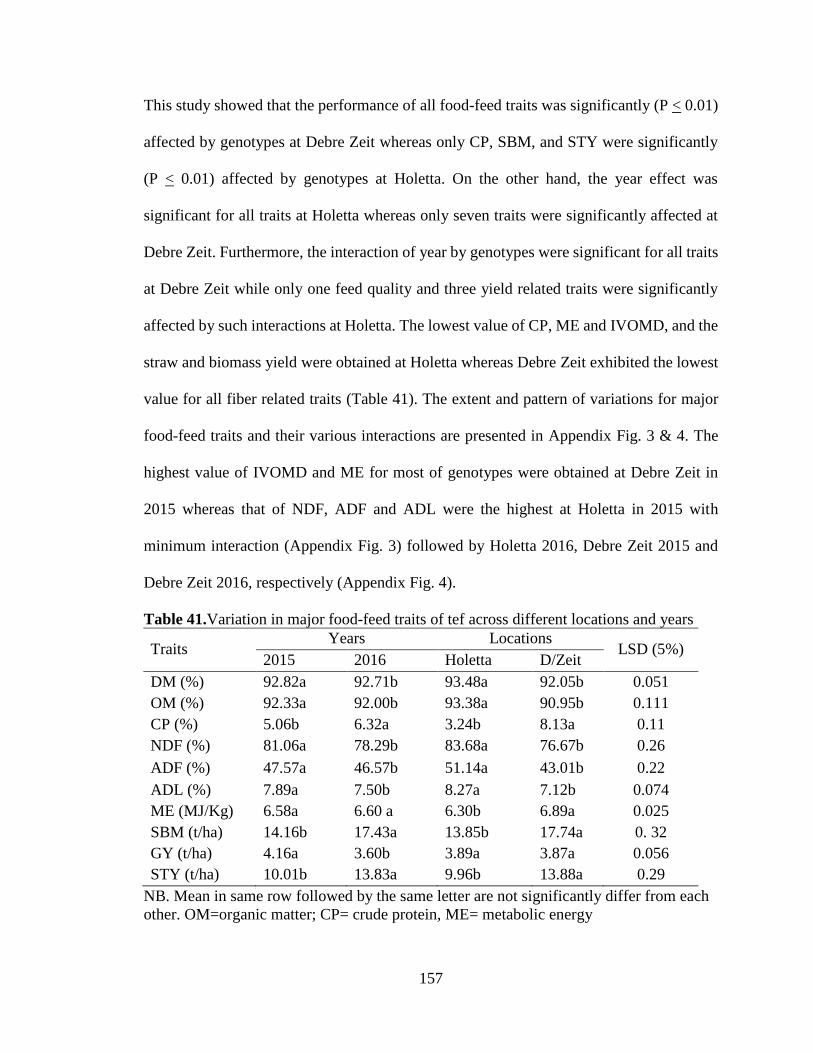
157
This study showed that the performance of all food-feed traits was significantly (P < 0.01)
affected by genotypes at Debre Zeit whereas only CP, SBM, and STY were significantly
(P < 0.01) affected by genotypes at Holetta. On the other hand, the year effect was
significant for all traits at Holetta whereas only seven traits were significantly affected at
Debre Zeit. Furthermore, the interaction of year by genotypes were significant for all traits
at Debre Zeit while only one feed quality and three yield related traits were significantly
affected by such interactions at Holetta. The lowest value of CP, ME and IVOMD, and the
straw and biomass yield were obtained at Holetta whereas Debre Zeit exhibited the lowest
value for all fiber related traits (Table 41). The extent and pattern of variations for major
food-feed traits and their various interactions are presented in Appendix Fig. 3 & 4. The
highest value of IVOMD and ME for most of genotypes were obtained at Debre Zeit in
2015 whereas that of NDF, ADF and ADL were the highest at Holetta in 2015 with
minimum interaction (Appendix Fig. 3) followed by Holetta 2016, Debre Zeit 2015 and
Debre Zeit 2016, respectively (Appendix Fig. 4).
Table 41.Variation in major food-feed traits of tef across different locations and years
Traits Years Locations
LSD (5%) 2015 2016 Holetta D/Zeit
DM (%) 92.82a 92.71b 93.48a 92.05b 0.051
OM (%) 92.33a 92.00b 93.38a 90.95b 0.111
CP (%) 5.06b 6.32a 3.24b 8.13a 0.11
NDF (%) 81.06a 78.29b 83.68a 76.67b 0.26
ADF (%) 47.57a 46.57b 51.14a 43.01b 0.22
ADL (%) 7.89a 7.50b 8.27a 7.12b 0.074
ME (MJ/Kg) 6.58a 6.60 a 6.30b 6.89a 0.025
SBM (t/ha) 14.16b 17.43a 13.85b 17.74a 0. 32
GY (t/ha) 4.16a 3.60b 3.89a 3.87a 0.056
STY (t/ha) 10.01b 13.83a 9.96b 13.88a 0.29
NB. Mean in same row followed by the same letter are not significantly differ from each
other. OM=organic matter; CP= crude protein, ME= metabolic energy

158
Heritability of food-feed traits in Tef
The heritability values of various food-feed traits were estimated based on data from the
two locations (Debre Zeit and Holetta) and combined data across locations (Table 42).
Based this, the highest heritability value was estimated at Debre Zeit followed by Holetta
and combined data of the two locations. Among the nine investigated traits, eight, six and
five traits had sufficient heritability at Debre Zeit, Holetta and at combined level,
respectively. Surprisingly, in all the three cases, the highest heritability was obtained for
yields of shoot biomass, grain and straw whereas feed quality traits had the least or zero
values. Thus, no heritability was observed for CP, NDF, ME and IVOMD values for
combined data while ADF, ADL, ME and IVOMD showed ni heritability at Holetta and
NDF at Debre Zeit.
Table 42. Heritability (%) of major food-feed traits of tef
State CP NDF ADF ADL ME IVOMD SBM GY STY
Debre Zeit 15.5 0 8.2 14.9 18.12 22.93 79.31 73.23 74.38
Holetta 8.51 14.13 0 0 0 0 71.6 58.0 71.33
Combined 0 0 6.81 5.73 0 0 12.83 18.60 18.25
Association of food-feed traits of tef
In the present study, the association among major food-feed traits of tef was highly
significant for most of the studied traits (Table 43). Thus, the association among CP%, ME
and IVOMD % was positive and significant while their association with all remaining traits
was negative and significant (P < 0.01). Similarly, the association of SBM, GY and STY
was significant and positive with all traits except CP%, ME and IVOMD%. In general, a
negative association was observed between yields of food-feed traits and feed quality traits
while the association of food-feed yield and other traits was moderately significant (Table

159
43). All studied parameters, however, showed no significant association between Debre
Zeit and Holetta (Table 44).
Table 43. Correlation between major food-feed traits of tef data across locations and
years
Traits CP NDF ADF ADL ME IVOMD SBM GY STY
CP (%) 1
NDF (%) -0.79*** 1
ADF (%) -0.90*** 0.84*** 1
ADL (%) -0.54*** 0.75*** 0.75*** 1
ME () 0.73*** -0.82*** -0.83*** -0.84*** 1
IVOMD (%) 0.82*** -0.88*** -0.89*** -0.81*** 0.98*** 1
SBM (t/ha) -0.44** 0.43*** 0.45*** 0.44*** -0.48** -0.52*** 1
GY (t/ha) -0.45** 0.40* 0.47*** 0.47*** -0.48** -0.51** 0.83*** 1
STY (t/ha) -0.40* 0.41* 0.42* 0.40* -0.45** -0.48** 0.98*** 0.71*** 1
CP=crude protein, NDF=neutral detergent fiber, ADF= acid detergent fiber, ADL= acid detergent
lignin, ME= metabolic energy, IVOMD= invitro organic matter digestibility, SBM= shoot biomass,
GY= grain yield, STY= straw yield
Table 44. Correlation between locations for all parameters of tef (the middle diagonal)
Traits CP_DZ NDF_DZ ADF_DZ ADL_DZ ME_DZ IVOMD_DZ sbm_DZ gy_DZ sty_DZ
CP_HT 0.009ns -0.001ns -0.105ns 0.013ns 0.011ns 0.006ns 0.001ns 0.006ns -0.001ns
NDF_HT 0.016 ns 0.031 ns 0.071 ns 0.059 ns 0.026 ns 0.042 ns -0.049 ns -0.086 ns -0.036 ns
ADF_HT -0.109 ns 0.031 ns 0.064 ns 0.008 ns 0.009 ns -0.001 ns 0.111 ns 0.101 ns 0.110 ns
ADL_HT -0.037 ns 0.017 ns 0.012 ns 0.093 ns -0.006 ns 0.006 ns 0.179 ns 0.157 ns 0.180 ns
ME_HT -0.045 ns 0.067 ns 0.099 ns 0.116 ns -0.143 ns -0.156 ns -0.021 ns 0.079 ns -0.050 ns
IVOMD_HT 0.002 ns 0.017 ns 0.046 ns 0.103 ns -0.115 ns -0.122 ns -0.048 ns 0.049 ns -0.076 ns
SBM_HT 0.079 ns -0.168 ns -0.100 ns -0.184 ns 0.100 ns 0.104 ns 0.080 ns 0.072 ns 0.080 ns
GY_HT 0.116 ns -0.138 ns -0.110 ns -0.130 ns 0.064 ns 0.082 ns -0.014 ns 0.110 ns -0.051 ns
STY_HT 0.058 ns -0.161 ns -0.087 ns -0.183 ns 0.102 ns 0.100 ns 0.104 ns 0.052 ns 0.116 ns
CP=crude protein, NDF=neutral detergent fiber, ADF= acid detergent fiber, ADL= acid detergent
lignin, ME= metabolic energy, IVOMD= invitro organic matter digestibility, SBM= shoot biomass,
GY= grain yield, STY= straw yield, HT=Holetta, DZ= Debre Zeit

160
Scatterplot showing the relationships among food-feed traits of tef genotypes
Scatterplots showing the relative position of various genotypes on a biplot of major food-
feed traits of tef are presented (Fig 35a-h). Thus, scatter plot of grain yield versus invitro
organic matter digestibility revealed that Koye, Gerado, Melko, Amarach, Yilmana, Key
Tena and Holetta Key varietieshada mean value above the mean for both the grain yield
and invitro organic matter digestibility (36a).
35a. Scatter plot of GY vs IVOMD
Figure 35a-h. Scatter plots showing the the distributution of genotypes evaluate for food
feed.
On the other hand, scatter plot of grain yield versus NDF revealed that Melko, Koye, Key
Tena, Amarach, Yilmana and Gerado varieties were identified to have lower NDF value

161
coupled with high grain yield which is one indication of feed quality traits (Fig 35b).
Furhermore, scatterplot of GY vs STY showed that Dukem, Gimbichu, Gola, Quncho,
Melko, Dega Tefa, Kora, Gemechis, Key Tena, Koye, Yilmana, Tsedey, Menagesha and
Holetta Key varieties had above average grain and straw yield (Fig. 35c).
35b. Scatter plot of GY vs NDF
35c. Scatter plot of GY vs STY

162
Scatter plot of CP vs STY showed that Melko, Dukem, Gimbichu, Wolenkomi, Guduru,
Menagesha, Yilmana and Worekiyu varieties had values greater than the mean for the two
traits (Fig.35d). Scatterplot of CP vs IVOMD, on the other hand, indicated that Kenna,
Ambo Toke, Guduru, Zobel, Genet, Laketch, Gerada, Ziquala, Melko, Enatit, Amarach,
Wolenkomi, Yilmana and Workiyu varieties scored the highest values of both CP % and
IVOMD % (Fig. 35e).
35d. Scatter plot of STY vs CP
35e. Scatter plot of IVOMD vs CP

163
As shown in Fig 35f, Genet, Kenna, Workiyu, Gerado, Ambo-Toke, Melko, Zobel, Ziquala,
Guduru, Amarach, Yilmana, Laketch and Koye varieties scored high CP coupled with the
smallest NDF value. These genotypes are, therefore, have better feed quality traits.
Furthermore, Guduru, Wolenkomi, Koye, Worekiyu, Holetta Key and Yilmana varieties
had above average value of ME and straw yield (Fig. 35g) whereas Koye, Gerado, Amarach,
Yilmana and Holetta Key varieties had the highest ME and grain yield values (Fig. 35g & h).
h).
35f. Scatterplot of NDF vs CP
35g & h. Scatterplot of STY vs ME (g) and grain yield vs ME (h)

164
Distribution of traits and genotypes across PC1 and PC2
The studied food-feed traits of improved tef varieties was plotted on PC1 (68.2%) and PC2
(18.2%) which accounted for 86.4% of the total variations (Fig.36). Based on this figure
three major groups of traits were formed. Thus, group-I consisted of feed quality traits
positively correlated with feed intake (ME, IVOMD and CP) whereas the traits in group-II
include SBM, STY and GY which are related to food-feed traits yield. On the other hand,
the third group of traits include NDF, ADL and ADF which are known to affect the feed
intake negatively.
Figure 36. Distribution of major food-feed traits of tef across PC1 and PC2
Like the food-feed traits, the 36 studied varieties were also plotted on PC1 vs PC2 which
resulted in the formation of four distinct groups (Fig. 37). Thus, the first group consisted
of tef genotypes having better yield of both food-feed traits and they include Melko, Dukem,
Gola, Gimbichu, Quncho, Kora, Dega Tef, Koye, Key Tena, Yilmana, Menagesha, Tsedey,

165
Gemechis and Ajora. Group two, on the other hand, consisted of tef genotypes having
better feed quality traits such as: Kenna, Genet, Zobel, Ambo-Toke, Gerado, Ziquala,
Enatit, Laketch, Guduru, Worekiyu, Amarach and Wolenkomi. Genotypes in Group III,
however, were known to have above average food-feed trait yield and feed quality traits.
The genotypes in group III were partly overlapped with both group-I and group-II and are
encircled with green colour. Hence, the genotypes in group-III include Melko, Koye, Key
Tena, Yilmana and Holetta Key from Group-I and Wolenkomi, Worekiyu, Guduru, Gerado
and Amarach from Group-II. Genotypes in group-IV, however, were not identified to be
good for any of the nine studied traits (Fig. 37).
Figure 37. Distribution of 36 tef varieties evaluated for major food-feed traits across PC1
and PC2
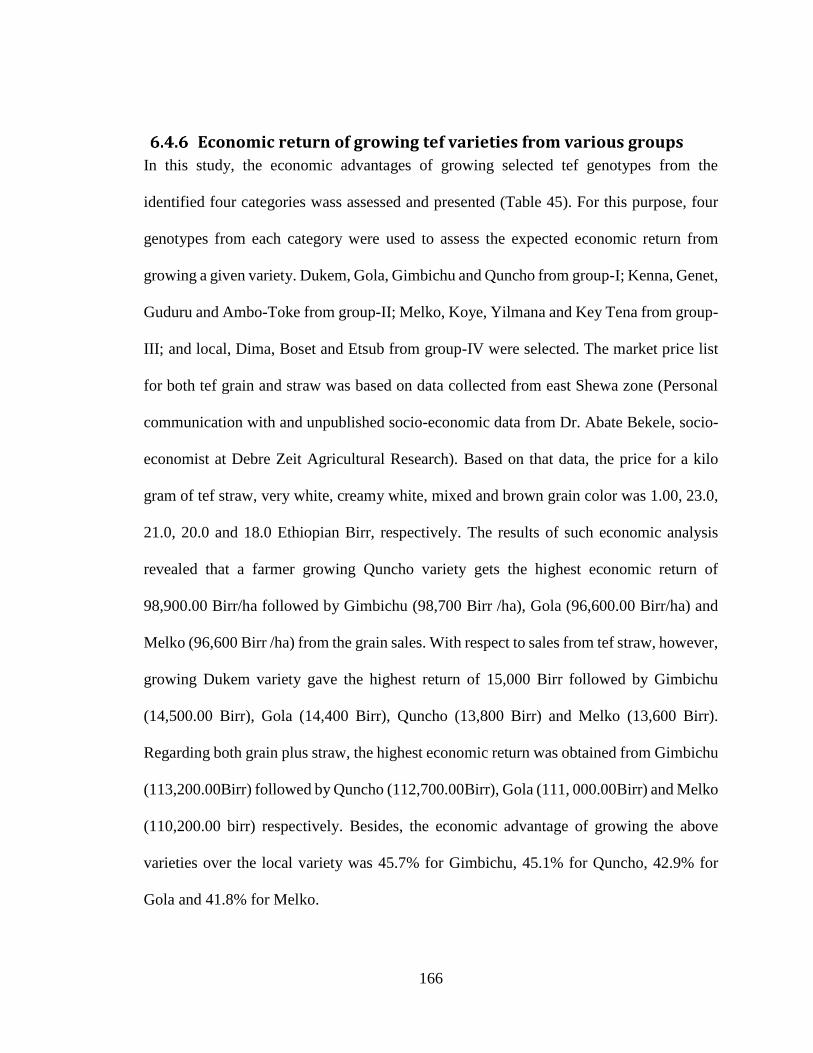
166
Economic return of growing tef varieties from various groups
In this study, the economic advantages of growing selected tef genotypes from the
identified four categories wass assessed and presented (Table 45). For this purpose, four
genotypes from each category were used to assess the expected economic return from
growing a given variety. Dukem, Gola, Gimbichu and Quncho from group-I; Kenna, Genet,
Guduru and Ambo-Toke from group-II; Melko, Koye, Yilmana and Key Tena from group-
III; and local, Dima, Boset and Etsub from group-IV were selected. The market price list
for both tef grain and straw was based on data collected from east Shewa zone (Personal
communication with and unpublished socio-economic data from Dr. Abate Bekele, socio-
economist at Debre Zeit Agricultural Research). Based on that data, the price for a kilo
gram of tef straw, very white, creamy white, mixed and brown grain color was 1.00, 23.0,
21.0, 20.0 and 18.0 Ethiopian Birr, respectively. The results of such economic analysis
revealed that a farmer growing Quncho variety gets the highest economic return of
98,900.00 Birr/ha followed by Gimbichu (98,700 Birr /ha), Gola (96,600.00 Birr/ha) and
Melko (96,600 Birr /ha) from the grain sales. With respect to sales from tef straw, however,
growing Dukem variety gave the highest return of 15,000 Birr followed by Gimbichu
(14,500.00 Birr), Gola (14,400 Birr), Quncho (13,800 Birr) and Melko (13,600 Birr).
Regarding both grain plus straw, the highest economic return was obtained from Gimbichu
(113,200.00Birr) followed by Quncho (112,700.00Birr), Gola (111, 000.00Birr) and Melko
(110,200.00 birr) respectively. Besides, the economic advantage of growing the above
varieties over the local variety was 45.7% for Gimbichu, 45.1% for Quncho, 42.9% for
Gola and 41.8% for Melko.

167
Table 45.Analysis of the economic benefits of producing tef with various traits(ha)
Parameters Genotypes
Quality Yield (t/ha) Price*
IVOMD GY STY GY Straw Total
Genotypes
selected for
yield
Dukem 45.60 4.1 15.00 86100.0 15000.0 101100.0
Gola 45.20 4.6 14.40 96600.0 14400.0 111000.0
Gimbichu 45.40 4.7 14.50 98700.0 14500.0 113200.0
Quncho 45.10 4.3 13.80 98900.0 13800.00 112700.0
Genotypes
selected for
quality traits
Kenna 46.40 3.2 11.60 67200.0 11600.0 78800.0
Genet 46.10 3.7 10.60 77700.0 10600.0 88300.0
Guduru 46.30 3.3 12.10 69300.0 12100.0 81400.0
Ambo-Toke 46.30 3.7 9.70 77700.0 9700.0 87400.0
Genotypes
selected for
dual purpose
Melko 45.90 4.6 13.60 96600.0 13600.0 110200.0
Koye 46.10 4.1 11.80 86100.0 11800.0 97900.0
Yilmana 45.40 4.0 11.90 84000.0 11900.0 95900.0
Key Tena 45.30 4.3 12.00 77400.0 12000.0 89400.0
Genotypes with
little yield and
quality traits
Local 45.50 3.4 9.70 68000.0 9700.0 77700.0
Simada 45.30 3.7 10.00 77700.0 10000.0 87700.0
Etsub 45.30 3.3 9.70 69300.0 9700.0 79000.0
Boset 45.20 3.9 11.40 89700.0 11400.0 101100.0
* The average price for very white, pale white and brown tef grain and tef straw for all
varieties in east Shewa is 22.00birr/ kg and 1birr/kg respectively. GY = grain yield, STW
= Straw yield
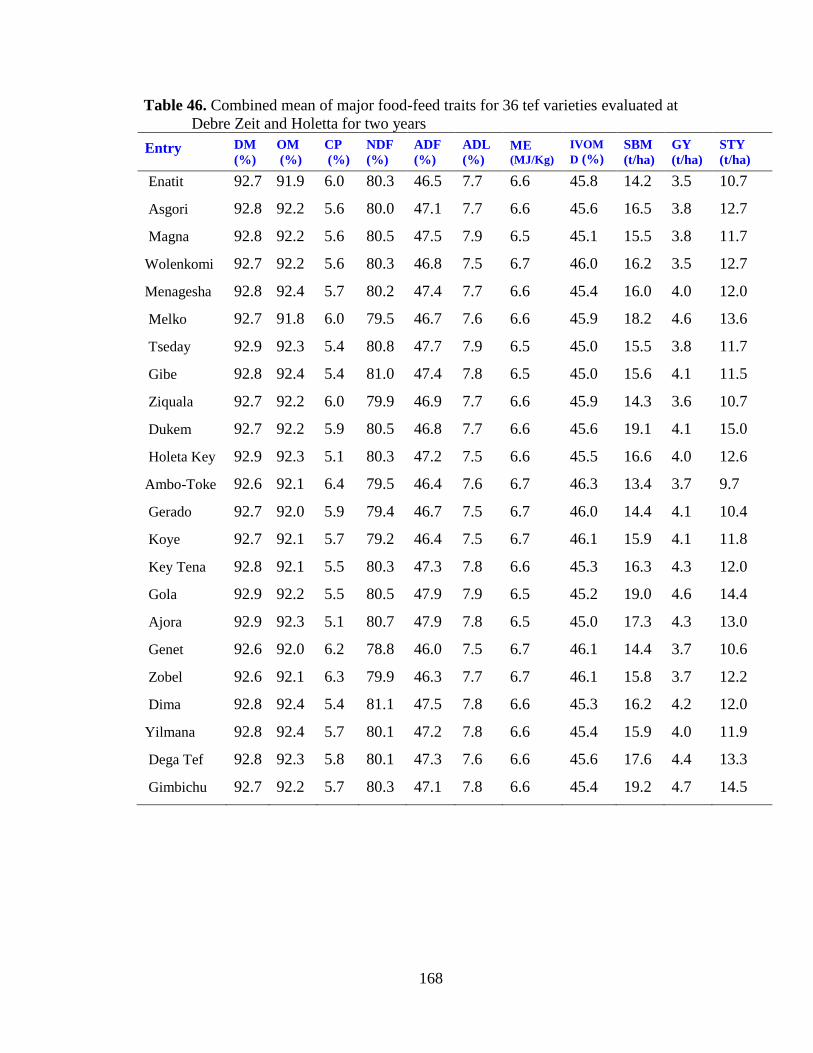
168
Table 46. Combined mean of major food-feed traits for 36 tef varieties evaluated at
Debre Zeit and Holetta for two years
Entry DM
(%)
OM
(%)
CP
(%)
NDF
(%)
ADF
(%)
ADL
(%) ME (MJ/Kg)
IVOM
D (%) SBM
(t/ha)
GY
(t/ha)
STY
(t/ha)
Enatit 92.7 91.9 6.0 80.3 46.5 7.7 6.6 45.8 14.2 3.5 10.7
Asgori 92.8 92.2 5.6 80.0 47.1 7.7 6.6 45.6 16.5 3.8 12.7
Magna 92.8 92.2 5.6 80.5 47.5 7.9 6.5 45.1 15.5 3.8 11.7
Wolenkomi 92.7 92.2 5.6 80.3 46.8 7.5 6.7 46.0 16.2 3.5 12.7
Menagesha 92.8 92.4 5.7 80.2 47.4 7.7 6.6 45.4 16.0 4.0 12.0
Melko 92.7 91.8 6.0 79.5 46.7 7.6 6.6 45.9 18.2 4.6 13.6
Tseday 92.9 92.3 5.4 80.8 47.7 7.9 6.5 45.0 15.5 3.8 11.7
Gibe 92.8 92.4 5.4 81.0 47.4 7.8 6.5 45.0 15.6 4.1 11.5
Ziquala 92.7 92.2 6.0 79.9 46.9 7.7 6.6 45.9 14.3 3.6 10.7
Dukem 92.7 92.2 5.9 80.5 46.8 7.7 6.6 45.6 19.1 4.1 15.0
Holeta Key 92.9 92.3 5.1 80.3 47.2 7.5 6.6 45.5 16.6 4.0 12.6
Ambo-Toke 92.6 92.1 6.4 79.5 46.4 7.6 6.7 46.3 13.4 3.7 9.7
Gerado 92.7 92.0 5.9 79.4 46.7 7.5 6.7 46.0 14.4 4.1 10.4
Koye 92.7 92.1 5.7 79.2 46.4 7.5 6.7 46.1 15.9 4.1 11.8
Key Tena 92.8 92.1 5.5 80.3 47.3 7.8 6.6 45.3 16.3 4.3 12.0
Gola 92.9 92.2 5.5 80.5 47.9 7.9 6.5 45.2 19.0 4.6 14.4
Ajora 92.9 92.3 5.1 80.7 47.9 7.8 6.5 45.0 17.3 4.3 13.0
Genet 92.6 92.0 6.2 78.8 46.0 7.5 6.7 46.1 14.4 3.7 10.6
Zobel 92.6 92.1 6.3 79.9 46.3 7.7 6.7 46.1 15.8 3.7 12.2
Dima 92.8 92.4 5.4 81.1 47.5 7.8 6.6 45.3 16.2 4.2 12.0
Yilmana 92.8 92.4 5.7 80.1 47.2 7.8 6.6 45.4 15.9 4.0 11.9
Dega Tef 92.8 92.3 5.8 80.1 47.3 7.6 6.6 45.6 17.6 4.4 13.3
Gimbichu 92.7 92.2 5.7 80.3 47.1 7.8 6.6 45.4 19.2 4.7 14.5

169
Table 46. continued.
Entry DM
(%)
OM
(%)
CP
(%)
NDF
(%)
ADF
(%)
ADL
(%)
ME
(MJ/Kg)
IVOMD
(%)
SBM
(t/ha)
GY
(t/ha)
STY
(t/ha)
Amarach 92.8 92.2 5.6 80.4 47.4 7.8 6.6 45.6 13.2 3.7 9.5
Quncho 92.9 92.2 5.1 81.0 47.5 7.7 6.5 45.1 18.1 4.3 13.8
Guduru 92.7 92.5 5.8 79.4 47.0 7.6 6.7 46.3 15.3 3.3 12.1
Gemechis 92.8 92.2 5.6 80.9 47.5 7.9 6.5 45.1 16.5 4.3 12.2
Mechare 92.8 92.0 5.7 80.3 47.2 7.9 6.5 45.2 13.6 3.3 10.3
Kena 92.6 91.9 6.2 79.3 46.1 7.3 6.7 46.4 14.8 3.2 11.6
Etsub 92.8 92.3 5.6 80.6 47.4 7.8 6.6 45.3 13.0 3.3 9.7
Laketch 92.7 92.1 5.8 80.0 46.6 7.6 6.7 46.1 15.8 3.7 12.1
Simada 92.9 92.2 5.5 80.1 47.9 7.9 6.6 45.3 13.7 3.7 10.0
Boset 92.9 92.5 5.4 81.0 47.6 7.7 6.6 45.2 15.3 3.9 11.4
Kora 92.7 92.1 5.6 80.8 47.0 7.9 6.6 45.4 17.6 4.2 13.4
Workiye 92.7 91.7 6.0 79.4 46.5 7.6 6.6 45.8 16.0 3.4 12.6
Local 92.8 92.1 5.5 80.0 47.3 7.6 6.6 45.5 13.0 3.4 9.7
Mean 92.76 92.2 5.7 80.2 47.1 7.69 6.60 45.58 15.80 3.88 11.92
Max. 92.94 92.5 6.43 81.1 47.9 7.91 6.71 46.35 19.19 4.65 15.03
Min. 92.58 91.7 5.05 78.8 46.0 7.28 6.52 45.01 12.98 3.23 9.54
LSD (5%) 0.22 0.47 0.73 1.18 1.22 0.30 0.10 0.80 0.60 0.10 0.50
Near Infrared Reflectance Spectroscopy (NIRS) for determination of feed quality parameters
Calibration and validation of the chemical entities (DM, Ash, OM, CP, NDF, ADF, ADL,
ME and IVOMD) as well as the equation statistics for all the studied parameters are
summarized (Table 47). Based on this, the coefficients of determination in calibration (R2)
and the errors in cross validation (SECV) were 0.99 (0.48), 0.67 (0.63), 0.98 (0.45) 0.98
(1.13) and 0.94 (1.45) for crude protein, dry matter, ash, neutral detergent fiber and acid
detergent fiber on the basis of a dry weight respectively. The R2 obtained in the present
study is high and consistent for all the studied parameters except for dry matter per cent.

170
Table 47. NIRS calibration statistics for tef straw feed quality parameters on dry weight
basis.
Parameters/
Traits N Mean SD Range (%) SEC RSQ SECV 1-VR
DM (%) 76 92.518 1.036 89.41-95.6 0.60 0.67 0.63 0.63
Ash (%) 78 8.317 1.745 3.08-13.6 0.25 0.98 0.45 0.93
OM (%) 78 91.683 1.745 86.45-96.9 0.25 0.98 0.45 0.93
N (%) 81 1.094 0.508 0.000-2.6 0.06 0.99 0.08 0.98
CP (%) 81 6.837 3.180 0.00-16.4 0.35 0.99 0.48 0.98
NDF (%) 78 78.347 4.556 64.7-92.0 0.63 0.98 1.13 0.94
ADF (%) 77 45.436 5.077 30.2-60.7 1.24 0.94 1.45 0.92
ADL (%) 79 7.480 0.904 4.8-10.2 0.34 0.86 0.44 0.77
ME (MJ/Kg) 76 6.692 0.382 5.55-7.8 0.061 0.97 0.091 0.943
IVOMD (%) 77 46.529 3.389 36.36-56.7 0.41 0.99 0.651 0.963
N= Number of samples in calibration, R2= Coefficient of determination in calibration, SEC=
Standard error of calibration, 1-VR= Coefficient of determination of cross validation, SECV= error
of cross validation, ME= Metabolic energy, IVOMD=Invitro organic matter digestibility
As it can be seen from Table 48the ratio of SECV/SD is less than 0.30 for all parameters
other than DM and ADL. Hence, the equation is acceptable for predicting the chemical
parameters suggesting that the models built are very robust and not overfitted. Because, all
parameters had the best equations except for the dry matter (R2 = 0.67) and ADL (R2 =
0.86). In this study, in general, high coefficients of determination and low SEC or SECV
were obtained for almost all of the analyzed components suggesting comprehensive
calibrations detect less outlier samples and probably being more robust and efficient.

171
Table 48. SECV/SD ratio
Traits STD SEP RPD SECV/SD
ASH (%) 1.452 0.497 2.92 0.26
OM (%) 1.463 0.488 3.00 0.26
CP (%) 2.877 0.317 9.08 0.15
NDF (%) 4.12 1.178 3.50 0.25
ADF (%) 4.954 1.012 4.90 0.29
ADL (%) 0.874 0.348 2.51 0.49
ME (MJ/Kg) 0.391 0.088 4.44 0.24
IVOMD (%) 3.32 0.558 5.95 0.19
The relationships of NIRS data versus chemical data for crude protein, OM%, in vitro
organic matter digestibility %, NDF%, ADF% and ADL % ash exhibited similar graphing
patterns (Fig. 38- 43). The high correlation observed between NIRS and chemical analysis
in the present study, therefore, shows the potential use of NIRS for prediction of tef straw
quality.

172
Figure 38. Relationship between chemical analysis and NIRS results for CP % from
tef straw
Figure 39. Relationship between chemical analysis and NIRS results for Ash% from
tef straw
y = 0.9941x + 0.0378R² = 0.989
0
2
4
6
8
10
12
14
16
0.00 2.00 4.00 6.00 8.00 10.00 12.00 14.00 16.00
We
t ch
em
istr
y an
alys
is
NIRS prediction
CP(%)
y = 0.9333x + 0.5346R² = 0.9776
0.00
2.00
4.00
6.00
8.00
10.00
12.00
14.00
0.00 2.00 4.00 6.00 8.00 10.00 12.00 14.00
We
t C
he
mis
try
anal
ysis
NIRS prediction
Ash(%)

173
Figure 40. Relationship between chemical analysis and NIRS results for OM % from
tef straw
Figure 41. Relationship between chemical analysis and NIRS results for ADF % from
tef straw
y = 0.9333x + 6.1383R² = 0.9776
87.00
88.00
89.00
90.00
91.00
92.00
93.00
94.00
95.00
86.00 87.00 88.00 89.00 90.00 91.00 92.00 93.00 94.00 95.00 96.00
We
t C
he
mis
try
anal
ysis
NIRS prediction
OM (%)
y = 0.9449x + 2.5308R² = 0.9399
0.00
10.00
20.00
30.00
40.00
50.00
60.00
0.00 10.00 20.00 30.00 40.00 50.00 60.00
We
t ch
em
istr
y an
alys
is
NIRS prediction
ADF (%)
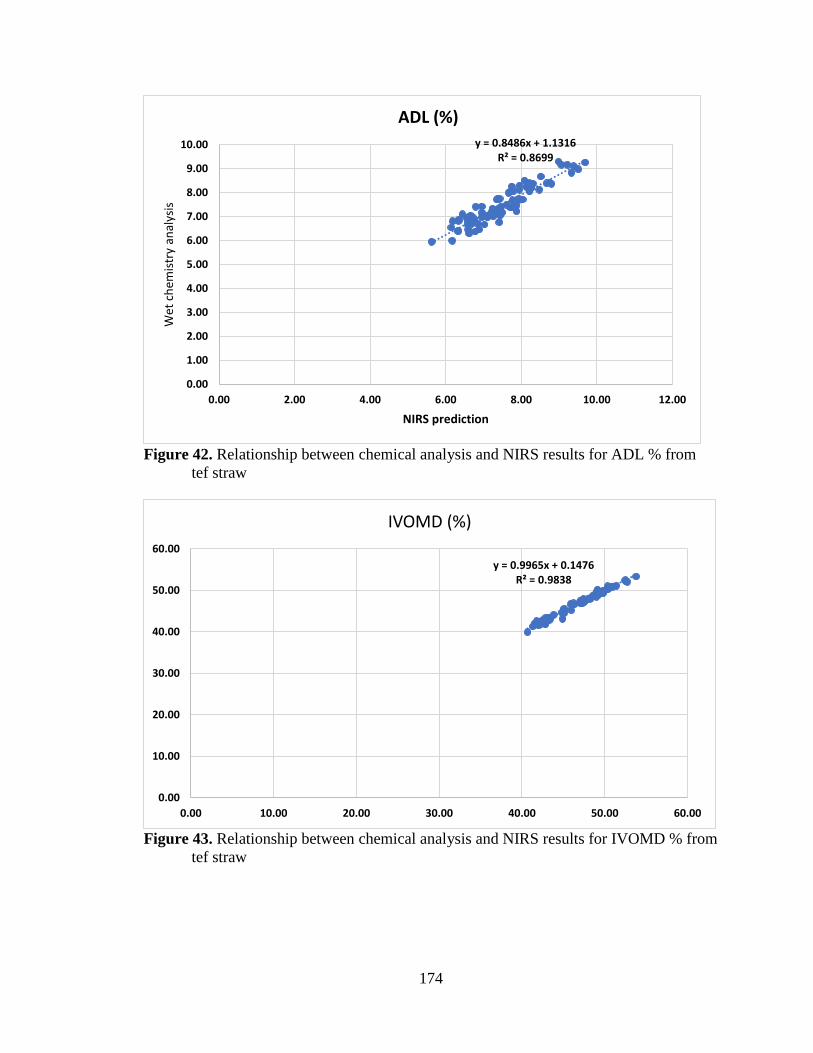
174
Figure 42. Relationship between chemical analysis and NIRS results for ADL % from
tef straw
Figure 43. Relationship between chemical analysis and NIRS results for IVOMD % from
tef straw
y = 0.8486x + 1.1316R² = 0.8699
0.00
1.00
2.00
3.00
4.00
5.00
6.00
7.00
8.00
9.00
10.00
0.00 2.00 4.00 6.00 8.00 10.00 12.00
Wet
ch
emis
try
anal
ysis
NIRS prediction
ADL (%)
y = 0.9965x + 0.1476R² = 0.9838
0.00
10.00
20.00
30.00
40.00
50.00
60.00
0.00 10.00 20.00 30.00 40.00 50.00 60.00
IVOMD (%)

175
Discussions
Study on food-feed traits variation in 36 improved tef varieties revealed existence of
significant variation among genotypes, location, year and their interactions. The range of
values for crude protein (5.04 -6.26%) in the current study is far below the 9-14%reported
previously (Miller, 2009) whereas, the combined mean crude protein (5.7%) is higher than
the 3.9% reported earlier (Geleti et al., 2013). In the present study, a wide range of variation
was generally observed for food-feed yield traits compared to the feed quality traits may
be due to the fact that the breeders were focusing mostly on improving grain yield related
traits with little or no attention to feed quality traits (Table 39).
Kassier (2002) reported that the protein, amino acid and mineral content of tef are affected
by altitude showing that samples from low altitude contain more lysine than those from
mid and high altitudes. The high altitudes are, therefore, more deficient than the mid
altitudes. Furthermore, the same study reported that the proline level at mid altitude is twice
that of the low altitude and three times that of the high-altitude samples. This could
probably be a reason for the low protein content observed in the present study for samples
collected from Holetta which is located at high altitude compared to Debre Zeit which is
situated in the mid altitude. On the other hand, Debre Zeit location was alos found to favor
tef feed yield and quality traits compared to Holetta mainly due to substantial differences
in soils and climate conditions.
The heritability values observed for feed quality traits in the present study were generally
very low compared to that of the yield related traits. Thus, the highest heritability was

176
obtained for yields of shoot biomass, grain and straw whereas feed quality traits had the
least or zero values at Holetta, Debre Zeit and for the combined data from both locations.
In general, no heritability value was observed for the location combined CP, NDF, ME and
IVOMD values, and location specific ADF, ADL, ME and IVOMD at Holetta and NDF at
Debre Zeit. This might be partially due to the previous varietal development strategy of
breeders that did not give due attention to improvement of feed quality traits. In the present
study, in general, various locations were observed to have different heritability value
indicating the need to design a location specific strategy to develop the feed quality traits.
The association between yield traits and feed quality traits in the present study was found
to be negative and significant. This is in agreement with the negative associationpreviously
reported between grain yield and crude protein content (Tolera et al., 1999). Such negative
correlations between feed quality and yield related traits indicates the difficulty to
simultaneously improve both yield and quality traits in tef without affecting the other.
However, the moderately significant association observed between food-feed yield and
quality traits shows the possibility of improving feed quality traits without significantly
affecting the yield traits (Table 43). The development of suitable variety for food-feed yield
and feed quality traits could, therefore, be either for high yield, for high quality or for dual
purpose (yield and quality traits). The absence of significant association between Holetta
and Debre Zeit locations in the present study (Table 44), on the other hand, shows that each
location needs an independent action for the development of variousfood-feed traits.

177
Based on the current study results, some genotypes were identified for high grain and straw
yield, others for better feed quality traits while few genotypes combined high yield and
feed quality traits whereas some others had no significant contribution for the studiedof
food-feed traits. Hence, this study revealed the formation of four groups of genotypes.
These include: those genotypes having high yield of grain and straw; better feed quality
traits; dual purpose (yield and quality traits); and no significant importance for the studied
food-feed traits. Based on this, Melko, Gerado, Koye, Yilmana, Key Tena, Amarach and
Worekiyu varietiesexhibited more than four desirable food-feed traits and hence, are
varieties of choice for breeders and consumers interested in both food-feed yield and
quality traits. Breeders and consumers interested in high yield of food-feed traits, however,
should focus on Gola, Dukem, Dega Tefa, Quncho, Kora and Gemechis varieties which
showed high food-feed yield traits. Furthermore, those interested in feed quality traits
should focus on Zobel, Ziquala, Kenna, Genet, Gerado, Laketch and Goduru varieties
which gave better feed quality traits. The economic return obtained from growing tef
varieties from the four categories were also analyzed and the result enable to identify four
varieties with the highest economic returnsbased on sales of both grain and straw (Table
45). The four varieties identified to have high economic return perhectare includeGimbichu
(113,200.00 Eth. birr), Quncho (112,700.00 Eth. birr), Gola (111, 000.00 Eth. birr) and
Melko (110,200.00 Eth. birr).
Regarding feed quality analysis using NIRS, the calibration equations for all studied feed
quality traits in the present study have shown high coefficient of determination (R2), except
for DM which is still relatively high (0.67). Besides, the detected low standard errors of

178
calibration (SEC) and standard errors of cross validation (SECV) indicates that all
parameters were among the traits that could be predicted with good precision (Table
48).Previously, Fekadu et al. (2010) also reported similar results using NIRS for the
determination of chemical entities of natural pasture from Ethiopia.The observed scatter
plotin this study also showed that the data points were distributed evenly about the line for
almost all studied traits. Hence, it confirms the usefulness of NIRS for predicting the
indicated nutrient contents compared to the conventional chemical method of analysis
whichis highly accurate, but expensive and time consuming.
179
Chapter 7 7. Summary, Conclusions and Recommendations
Summary
Despite the fact that tef is the most important indigenous cereal with various uses, its
productivity is far below its expected genetic potential and that of other major cereal crops
grown in Ethiopia. Exhaustive characterization, refining and establishing non-redundant
core collections, assessing variation in food feed traits and tef growing environment
characterizations are priority research areas in tef improvement. This section of the thesis,
therefore, summarizes the overall findings of the four experimental chapters accordingly.
Chapter I and II dealt with the general introduction and literature review, respectively. In
chapter-III, the genetic diversity wasstudied based on different phenotypic traits of tef
genotypes obtained from various origins. The results from chapter-III revealed existence
of wide ranges of qualitative and quantitative variations among individual genotypes,
origins, and zones of collection, altitude and woredas. In the assessment of qualitative
traits, variation in seed colour, lemma colour, panicle form, basal stalk colour and number
of internodes were observed. Based on panicle form, for instance, five groups were
observed with the loose panicle type covering the vast majority. Among the three
categories, the white seeded group occupied the largest proportion followed by the brown
type. As to lemma colour, the yellowish and the variegated group occupied the majority of
the colour. The fact that the majority of the studied genotypes were of loose panicle form

180
gives two important advantages for breeders: 1) the chance of developing high yielding
and adapted genotypes for future use; and 2) the chance of developing early maturing
varieties to combat the problem of climate change. The wide range of quantitative traits
variations were also observed for yield and yield related traits, phenological traits and
morphological traits. Thus, genotypeswiththe highest meangrain yield, 1000-kernel
weight, number of spikelets per panicle and number of fertile tillers per plant as well as
shoot biomass were identified especially among collections from West Shewa and Central
Tigray zones.
Chapter IV dealt with molecular diversity study of 189 tef genotypes using SSR markers. The
result revealed that all studied markers were observed to be highly polymorphic (mean PIC
= 0.80) to discriminate the test tef genotypes. Thus, the number of alleles per locus ranged
from 2 for SSR 3.3 to 26 for CNLT 216. Markers like CNLT 538, CNLT 42 and CNLT
216 were found to havethe largest number of alleles, PIC and gene diversitywhile SSR 3.3
hadthe least value for all genetic parameters. Populations having high mean gene diversity
(North Shewa and North Gonder) and allelic richness (improved varieties) and number of
private allele (East Tigray) were identified while the breeding lines had the least value for
all genetic parameters. Clustering based on individual genotypes and population revealed
formation of four clusters. Similarly, the model-based approach of structure software has
also inferred four gene pools. Thus, the observed pattern of genetic diversity at population
and individual genotypes level does not strictly follow the geographic origin, collection
zones, altitudes or woredas. Regarding establishment of non-redundant core collections,
64 genotypes were found to be sufficient to retain 100% of the SSR diversity in the 189
studied tef genotypes. In general, both phenotypic and molecular markers based genetic

181
diversity studyconfirmed the existence of huge diversity among tef genotypes from diverse
origins that can be utilized for further genetic improvement and conservation of tef.
Chapter V, on the other hand, dealt with the genotype by environment interactions, stability
analysis and characterization of tef growing environments. Thus, environmental mean
grain yields were ranged from 1.7 t/ha for E3 (Alem Tena 2016) to 4.29 t/ha for E5 (Debre
Zeit 2015) whereas the genotypic mean grain yieldranged from 2.49 t/ha for Simada (G29)
to 3.33 t/ha for Melko (G6). Among genotypes, variety Melko was identified asthe highest
yielding, relatively stable and ideal genotype to evaluate and rank performance of different
environments relative to it. Regarding environment, Debre Zeit 2015 (E5) was the highest
yielding and ideal environment identified to evaluate and rank performance of different
genotypes relative to it. The pattern of GGE biplot and the relationship between
environments grouped the nine test environments into three mega environments whereas
the 35 studied genotypes were grouped into seven genotypic groups. Thus, mega
environmentone consisted ofE1, E4, E5& E6, the second mega environment consisted of E2,
E3, E7& E8while the third environment consisted of E9 only. In this study, E5, E6, E7 and
E8, which had the longest vector length, were identified to be the most discriminating of
all environments whereas E1 and E4, which had the smallest angle with average
environmental axis, were the most representative of all environments. Regarding genotypes,
G6, G34, G22 and G3 were identified to be high yielding and stable while G13, G19, G12 and
G9were unstable.

182
Chapter VI dealt with the study of food-feed traits of tef and thus, the studied food-feed
traits were significantly affected by genotypes, locations, years and their interactions.
Besides, NDF, ADF and AD that negatively affect feed intake, CP, ME and IVOMD that
positively correlated with feed intakeand GY, STY and SBM which are related to food-
feed yieldwere identifiedto appear in three distinct group. Theassociation among traits
within each group wasfound to be positive and significant whereas the association between
traits in group-Iand that of the second and third groupwas negative and significant.
However, the association between the traits in 2ndand 3rdgroup were positive and
significant. The values of CP, ME, IVOMD, SBM and STY at Debre Zeit were higher than
that of Holetta. The genotypes in the present study were generally grouped into four
clusters such asthose having better yield of food-feed traits; having better feed quality
traits; having dual purpose; and those having less significance to food-feed traits. The
economic analysis of growing representative genotypes from each group has revealed that
Quncho followed by Gimbichu, Gola and Melko gave the highest overall economic return.
Conclusions
• This PhD thesis was conducted to analyze the phenotypic and molecular diversity,
genotype by environment interactions and the food-feed traits variation among tef
genotypes from various sources.
• Genetic diversity assessment based on phenotypic and molecular markers revealed
the existence of significant genetic variation among the studied genotypes.
• Genotypes from central Tigray and west Shewa were identified tohavethe highest
valuefor most yield related traits in tef.

183
• Besides, most studied genotypes were observed to have loose panicle form which
is a good character to identify genotypes with high yield, earliness and adaptation.
• In the molecular diversity study, the employed SSR markers were found to have
high polymorphic information content with a mean PIC > 0.80.
• North Shewa and North Gonder zones were identified to have high mean gene
diversity whereas those from East Tigray zone had the highest mean number of
private alleles.
• Besides, the molecular study has also enabled to establish a core set representing
33.9% of the studied genotypes and 100% of the entire allele without any
redundancy.
• Stability analysishas revealed thatvariety Melko had the highest mean yield and
relatively wider adaptation across a wide range of environment.
• This study, furthermore, enabled the identification of three mega environments for
consideration in future variety development and release.
• The food feed traits variation study revealed existence of sufficient variation for
food-feed traits among improved varieties.
• It was also possible to identify genotypes having better yield, better feed quality
traits, dual purpose and no important food-feed traits.
Recommendations The following recommendations are suggested based on the findings of phenotypic and
molecular genetic diversity, genotype by environment interactions and food-feed traits
study.

184
• The wide range of genetic variation observed in the present study is useful to bring
the improvement expected in tef breeding.
• Genotypes identified to have highest yield related traits (Central Tigray and West
Shewa) are useful for the improvement aiming at increasing tef productivity.
• SSR markers with high mean PIC (PIC > 0.80) are useful in future tef germplasm
characterization and conservation ventures.
• Zones with high mean gene diversity (North Shewa and North Gonder) and high
mean number of private allele (East Tigray) are very useful for future germplasm
collection and in situ conservation.
• The established core set in the present study is a step forward for proper
conservation and utilization of tef germplasm. However, future research should use
more number and kind of markers especially in establishing core germplasm
collections.
• Melko, a variety identified for better mean yield and wider adaptation, is a good
resource in future development of better yielding and wider adapting genotypes.
• The four identified mega environments are useful for consideration in future variety
development and release. However, the more the number of years studied, the more
reliable conclusion and recommendation will be attained.
• The grouping of improved varieties into four categories based on the study of food
feed traits is very useful for farmers and breeders to use them accordingly.
• Eventhough the present markers detected sufficient level of variation for the studied
genotypes, future studies should use more number and kind of markers in
germplasm characterization and establishment of core collections.

185
• Future studies should also include more accessions from the present study area as
well as those un addressed areas in Ethiopia.
• Future tef breeding strategies should consider the development of both food-feed
yield and quality traits to address the problem of both food and feed shortage.
• As the demand for tef is increasing at national and international level, future studies
should focus on the identification of genotypes suitable for the non-traditional tef
growing environments.
186
References
Abate, E. (2015). Pre-breeding of Tef [Eragrostis tef (Zucc.) Trotter] for Tolerance to
Aluminum Toxicity. APhD Thesis, University of KwaZulu-Natal, Republic of
South Africa
Abraha MT. (2016). Breeding Tef [Eragrostis tef (Zucc.) Trotter] for Drought Tolerance
in Northern Ethiopia. PhD Thesos, University of KwaZulu-Natal, Republic of
South Africa
Adenew, T. (2002).Genetic Divergence and Association of Characters among Quantitative
Traits in Tef [Eragrostis tef (Zucc.) Trotter] germplasm.: M.Sc. Thesis, Alemaya
University, Dire Dawa.
Adinew, T., Ketema, S., Tefera, H. & Sridhara, H. (2005). Genetic diversity in tef
[Eragrostis tef (Zucc.)Trotter] germplasms. Genet. Resour. and Crop Evol.52: 891-
902.
Agarwal, M., Shrivastava, N. & Harish, P. (2008). Advances in molecular markers
techniques and their applications in plant sciences. Plant Cell Rep. 27: 617-631.
Allard, R. W. & Bradshaw, A. D. (1964). Implication of genotype-environment
interactions in applied plant breeding. J. Crop Sci.4:503-508.
Alvarado, G., Marco, L., Mateo, V., Angela, P., Francisco, R., Juan, B., José, C. (2016).
META-R (Multi Environment Trial Analysis with R for Windows.) Version 6.0
http://hdl. handle.net/11529/10201 International Maize and Wheat Improvement
Center
Amanda, L. I. and Doyle, J. J. (2003). The origin and evolution of tef (Poaceae) and
Related polyploids: Eviedence from waxy and plastid rps16. Am. J. Bot.
187
90(1):116-122.
Anoumaa, M., Kouadio, Y.N., Kouam, E.B., Kanmegne, G., Machuka, E., Osama, S.K.,
Nzuk, I., Kamga, Y. B., Fonkou, T., Omokolo, D.N. (2017). Genetic Diversity and
Core Collection for Potato (Solanum tuberosum L.) Cultivars from Cameroon as
Revealed by SSR Markers.
AOAC (1990). Official Method of Analysis, 15th edition. Association of Official
Analytical Chemists, Arlington, USA.
Ashamo, A. and Belay, G. (2012). Genotype x Environment Interaction Analysis of Tef
Grown in Southern Ethiopia Using Additive Main Effects and Multiplicative
Interaction Model. Journal of Biology, Agriculture and Healthcare,2 (1):66-73.
Asrat A, Alemayehu F, Gurum F, Atnaf M (2009). AMMI and SREG GGE biplot analysis
for matching varieties onto soybean production environments in Ethiopia. Sci. Res.
Essay, 4(11):1322-1330.
Assefa, K. Cannarozzi, G., Girma, D., Kamies, R., Chanyalew, S., Plaza-Wüthrich, S.
Blösch, R., Rindisbacher, A., Rafudeen, S.and Tadele, Z. (2015). Genetic diversity
in tef [Eragrostis tef (Zucc.) Trotter]. Front. Plant Sci. 6:177. doi:
10.3389/fpls.2015.00177
Assefa, K., Merker, A. & Tefera, H. (2003a). Multivariate analysis of diversity of tef
(Eragrostis tef (Zucc.) Trotter) germplasm from western and southern Ethiopia.
Hereditas138: 228-236
Assefa, K., Merker, A. & Tefera, H. (2003b). Inter simple sequence repeat (ISSR) analysis
of genetic diversity in tef [Eragrostis tef (Zucc.) Trotter]. Hereditas 139: 174-183.

188
Assefa, K., Yu, J.K, Zeid M, Belay, G., Tefera, H. and Sorells, ME (2011) Breeding tef
[Eragrostis tef (Zucc.) trotter]: conventional and molecular approaches. Plant
Breeding 130: 1-9.
Assefa, K., Ketema, S., Tefera, H., Hundera, F. & Kefyalew, T. (2001c).Genetic diversity
for agronomic traits in tef. In Proc. of the International Workshop on Tef Genetics
and Improvement, 33-47 Addis Ababa: Inst. Agric. Res., Ethiopia.
Assefa, K., Ketema, S., Tefera, H., Kefyalew, T. & Hundera, F. (2000). Trait diversity,
heritability and genetic advance in selected germplasm lines of tef [Eragrostis tef
(Zucc.) Trotter]. Hereditas 133: 29-37.
Assefa, K., Merker, A. & Tefera, H. (2002a). Qualitative trait variation in Tef [Eragrostis
tef (Zucc.) Trotter]germplasm fromWestern and Southern Ethiopia. Euphytica 127:
399-410.
Assefa, K., Tefera, H. & Merker, A. (2002b). Variation and inter-relationships of
quantitative traits in tef (Eragrostis tef (Zucc.) Trotter) germplasm from western
and southern Ethiopia. Hereditas 136: 116-112.
Assefa, K., Tefera, H., Merker, A., Kefyalew, T. & Hundera, F. (2001a). Quantitative trait
diversity in tef [Eragrostis tef (Zucc.) Trotter] germplasm from Central and
Northern Ethiopia. Genetic Resources and Crop Evolution 48: 53-61.
Assefa, K., Tefera, H., Merker, A., Kefyalew, T. & Hundera, F. (2001b). Variability,
heritability and genetic advance in pheno-morphic and agronomic traits of tef
[Eragrostis tef (Zucc.) Trotter] germplasm from eight regions of Ethiopia.
Hereditas134: 103-101 113
Assefa, K., Ketema, S., Tefera, H., Nguyen, H.T., Blum, A., Ayele, M., Bai, G., Simane,

189
B. and Kefyalew, T. (1999). Diversity among germplasm lines of the Ethiopian
cereal tef [Eragrostis tef (Zucc.) Trotter]. Euphytica, 106:87-97.
Assefa, K., Chanyalew, S. and Tadele, Z. (2017). Tef, Eragrostis tef (Zucc.) Trotter. In:
J.V. Patil, ed. Millets and Sorghum: Biology and Genetic Improvement, 1st edition.
pp. 226-265. John Wiley & Sons Ltd, New York.
Atnaf, M. (2017). Genetic Diversity and Population Structure, Trait Interrelationships,
Yield Stability and Socioeconomic Importance of White Lupin (Lupinus albus)
Landraces in Ethiopia. A PhD Thesis, Addis Ababa University, Ethiopia.
Ayele, M., Dole, J., Duren, M. V., Brunner, H. & Zapata-Arias, F. J. (1996). Flow
cytometric analysis of nuclear genome of the Ethiopian cereal Tef [Eragrostis tef
(Zucc.) Trotter]. Genetica,98: 211-215.
Ayele M, Tefera H, Assefa K and Nguyen, H.T. (1999). Genetic characterization of two
Eragrostis species using AFLP and morphological traits. Hereditas,130: 33-40.
Ayele M and Nguyen HT. (2000). Evaluation of amplified fragment length polymorphism
markers in tef, Eragrostis tef (Zucc.) Trotter, and related species. Plant
Breeding119: 403-409.
Bai, G., Ayele, M., Tefera, H. and Nguyen, H.T. (1999) Amplified fragment length
polymorphism analysis of tef [Eragrostis tef (Zucc.) Trotter]. Crop Sci. 39: 819-
824.
Bai, G., Ayele, M., Tefera, H. and Nguyen, H.T. (2000) Genetic diversity in tef [Eragrostis
tef (Zucc) Trotter] and its relatives as revealed by random amplified polymorphic
DNAs. Euphytica, 112:15-22.
Barnes, R.J., Dhanoa, M.S. & Lister, S.J. (1989). Standard normal variate transformation

190
and de-trending of near-infrared diffuse reflectance spectra. Applied Spectroscopy,
43: 772–777.
Basford, K. E. & Cooper, M. (1998). Genotype x environment interactions and some
considerations for their amplifications for wheat breeding in Australia. Australian
J. Agric. Research49: 154-174.
Baye, K., Guyot, J. Icard-Verniere, C. and Mouquet-Rivier, C. (2013). "Nutrient Intakes
from Complementary Foods Consumed by Young Children (Aged 12–23 Months)
from North Wollo, Northern Ethiopia: The Need for Agro-Ecologically Adapted
Interventions." Public Health Nutrition. 16 (10): 1741-1750.
Baye, K. (2014). Teff: nutrient composition and health benefits. Working Paper 67,
Ethiopian Strategy Support Program. Addis Ababa Ethiopia.
Bediye, S., Sileshi, Z. & Mengistie, T. (1996).Tef [Eragrostis tef (Zucc.) Trotter] straw
quality as influenced by variety and locations. In Ethiopian Society of Animal
Production, 145-152: ESAP.
Bediye S and Dereje F. (2001) Potential of tef straw as livestock feed. In: Tefera H, Belay
G and Sorrells ME (eds), Narrowing the Rift, Proceedings of the International
Workshop Tef Genetics and Improvement. Debre Zeit, Institute of Agricultural
Research, 245-254.
Bekele, E. and Lester, R.N. (1981). Amino acid composition of the cereal tef and related
species of Eragrostis (Gramineae). Cereal Chemistry58:113-115.
Bekele, E. (1995). Essential and non-essential amino acids in a free state and in the major
protein fractions of teff seeds. SINET: Ethiop. J. Sci.18: 79-99.
Bekele, E. (1996) Morphological analysis of Eragrostis tef: detection for regional patterns

191
of variation. SINET: Ethiop. J. Sci.19: 117–140.
Belay G, Tefera H, Getachew A, Assefa K, Metaferia G. (2008). Highly client-oriented
breeding with farmer participation in the Ethiopian cereal tef [Eragrostis tef (Zucc.)
Trotter]. Afr, J Agric Res., 3(1):2–8
Berhe, T (1975) A break-through in tef breeding techniques. FAO International Bulletin
on Cereal Improvement and Production 12:11-13.
Berhe, T., Nelson, L.A., Morris, M.R. & Schmidt, L.W. (1989). Inheritance of phenotypic
traits in tef. J. Hered., 80: 62-70.
Brown, AHD. (1989). Core collections: a practical approach to genetic resources
management, Genome. 31(2): 818–824.
Bultosa, G. (2007). Physicochemical characteristics of grain and flour in 13 tef [Eragrostis
tef (Zucc.) Trotter] grain varieties. J. of Applied Sci. Research3: 2042-2051.
Bultosa, G., Hamaker, B.R. and Miller, J.N. (2008) An SEC-MALLS study of molecular
features of water-soluble amylopectin and amylose of tef [Eragrostis tef (Zucc.)
Trotter] starches. Starch/Stärke 60:8-22.
Bultosa, G. & Umeta, M. (2013).Food Science and Human Nutrition Research. In
Achievements and Prospects of Tef Improvement:Proceedings of the Second
International Workshop, 21-31 (Eds K. Assefa, S. Chanyalew and Z. Tadele).
Debre Zeit,November 7-9, 2011: Ethiopian Institute of Agricultural Research,
Addis Ababa, Ethiopia; Institute of Plant Sciences, University of Bern, Switzerland.
Caldicott, J. J. B. and A. M. Nuttall. (1979). A method for the assessment of lodging in
cereal crops. Jour.Nat. Inst. Agri. Botany. 15: 88-91.

192
Cannarozzi, G., Plaza, SW, Esfeld, K., Larti, S., Wilson, YS, Girma, D., Castro, E.,
Chanyalew, S., Blösch, R., Farinelli, L., Lyons, E., Schneider, M., Falquet, L.,
Kuhlemeier, C., Asseffa, K. and Tadele, Z. (2014) Genome and transcriptome
sequencing identifies breeding targets in the orphan crop tef (Eragrostis tef). BMC
Genomics 15:581.
Carvalho, M.A. (2004). Germplasm characterization of Arachis pintoi Krap. and Greg.
(Leguminosae). PhD Thesis, University of Florida, USA.
Chanyalew, S., Singh, S., Tefera, H. and Sorrells, M.E. (2005) Molecular genetic map and
QTL analysis of agronomic traits based on a Eragrostis tef x E. pilosa recombinant
inbred population. J. Genet. Breed.59: 53–66.
Chanyalew, S., Tefera, H., Zelleke, H. and Singh, H. (2006). Correlation and path
coefficient analysis of yield related traits in recombinant inbred lines of tef
(Eragrostis tef). Journal of Genetics and Breeding 60:209-216.
Chanyalew, S., Tefera, H. and Sigh H. (2009) Genetic variability, heritability and trait
relationships in recombinant inbred lines of tef [Eragrostis tef (Zucc.) Trotter], Res.
Journal of Agric. and Biol. Sci. 5: 474-479.
Chanyalew S, Assefa K and Metaferia G. (2013) Phenotypic and molecular diversity in tef.
In: Assefa K, Chanyalew S and Tadele Z (eds), Achievements and Prospects of Tef
Improvement, Proceedings of the Second International Workshop Debre Zeit 7-9
November 2011 Ethiopia. Ethiopian Institute of Agricultural Research, Addis
Ababa, Ethiopia, Institute of Plant Sciences, University of Bern, Switzerland, 21-
31.

193
Collard BCY, Jahufer MZZ and Pang ECK. (2005) An introduction to markers,
quantitative trait loci (QTL) mapping and marker-assisted selection for crop
improvement: The basic concepts. Euphytica 142: 169-196.
Costanza, S.H. (1974). Literature and numerical taxonomy of tef (Eragrostis tef). MSc
Thesis, Cornell University, Urbana, Illinois.
Costanza, S.H., Dewt, J.M.J and Harlon, J.R. (1979). Review and Numerical Taxonomy
Of Eragrostis tef (Te’f). Econ. Bot. 33: 413-424
Crossa, J. (1990). Statistical analysis of multi-location trials. Advances in Agronomy44:
55-85
CSA (2017). Agricultural sample survey 2016/17 (2009 E.C.) Report on Area and
Production of Major Crops, (Private Peasant Housholdings, Meher Season).
Statistical Bulletin 584. Addis Abaaba, Ethiopia.
Degu, H. and Fujimura, T (2010). Mapping QTLs related to plant height and root
development of Eragrostis tef under drought. J. Agric Sciences,2(2):62-72
de Vicente, M. C., Guzman, F. A., Engels, J. & Rao, V. R. (2005).Genetic characterization
and its use in decision making for the conservation of crop germplasm. In The role
of Biotechnology. In: International Workshop the Role of Biotechnology for the
Characterization and Conservation of Crop, Forestry, Animal and Fishery Genetic
Resources, 121-128 Turin, Italy, 5-7 March 2005: FAO, FOBIOTECH, ECOGENE,
SIGA.
Doyle, J.J. and Doyle, J.L. (1990) A rapid total DNA preparation procedure for fresh plant
tissue. Focus 12:13-15.
194
Earl, D. A. (2012) STRUCTURE Harvester: a website and program for visualizing
structure output and implementing the evanno method. Conserv. Genet.
Resour.,4:359–361.
Ebba, T. (1969) Tef (Eragrostis tef): the cultivation, usage and some of the known diseases
and insect pests. Part I. Debre Zeit Agricultural Experiment Station. Addis Ababa
University, College of Agriculture, Dire Dawa, Ethiopia
Ebba, T. (1975) Tef (Eragrostis tef) cultivars: morphology and classification. Experimental
Station Bulletin. No. 66. Addis Ababa University, College of Agriculture, Dire
Dawa, Ethiopia.
Eberhart, S.A. and Russell, W.A. (1966). Stability parameters for comparing varieties.
Crop Science 6: 36–40.
Esfeld, K., Sonia, P.W. and Tadelle, Z. (2013). TILLING as a high throughput technique
for Tef improvement. In: Assefa, K., Chanyalew, S. and Tadele, Z. (eds).
Achievements and Prospects of Tef Improvement, Proceedings of the Second
International Workshop Debre Zeit 7-9 November 2011, Ethiopia. Ethiopian
Institute of Agricultural Research, AddisAbaba, Ethiopia, Institute of Plant Sciences,
University of Bern, Switzerland, 21-31.
Evanno G, Regnaut S, Goudet J (2005) Detecting the number of clusters of individuals
using the software STRUCTURE: a simulation study. Mol Ecol. 14(8):2611–2620
Falush D, Stephens M, Pritchard JK. 2007. Inference ofpopulation structure using
multilocus genotype data: Dominantmarkers and null allele. Mol Ecol Notes7: 574–
578.
FAO (2015). Analysis of price incentives for teff in Ethiopia. Technical notes by Assefa,

195
B., Demeke, M. and Lanos, B., Rome
Farshadfar, E., Hassan, Z. and Mohammadi, R. (2011) GGE Biplot anal- ysis of
genotypes x environment interaction in chick pea genotypes. European Journal of
Experimental Biology3 (1), 417-423
Fekadu, D., Bediye, S. Kehaliw, A., Daba,T., Kitaw, G. and Assefa, G. (2010). Near
Infrared Reflectance Spectroscopy (NIRS) for determination of chemical entities
of natural pasture from Ethiopia. Agric. Biol. J. N. Am., 1(5): 919-922
Ferreira, D.F., Demetrio, C.G.B., Manly, B.F.J., Machado, A.D.A. and Vencovsky R.
(2006). Statistical model in agriculture: Biometrical methods for evaluating
phenotypic stability in plant breeding. Cerne Lavras.; 12: 373-388
Fisehaye, R. and Tadele, Z. (2001). Weed research in tef. pp 201-214. In: Tefera, H.; G.
Belay and M. Sorrells (eds.) In: Narrowing the Rift: Tef Research and
Development. Proceedings of the International Workshop on Tef Genetics and
Improvement, 16-19 October 2000, Addis Ababa, Ethiopia
Frutos, E., Galindo, M. P., & Leiva, V. (2014). An interactive biplot implementation in R
for modeling genotype-by-environment interaction. Stochastic Environmental
Research and Risk Assessment, 28(7):1629-1641.
Fulgueira, C. L., Amigot, S. L., Gaggiotti, M. & Basílico, J. C. (2007). Forage Quality:
Techniques for Testing. Fresh Produce1(2): 121-131.
Gabriel, K. R. (1971). The biplot graphic of matrices with application to principal
component analysis. Biometrics 58: 453-467.
Gauch, H.G. and Zobel, R.W. (1997). Identifying mega-environments and targeting
genotypes. Crop Sci 37: 311-32

196
Geleti, D., Hailemariam, M., Mengistu, A. and Tolera, A. (2013). Herbage Yield and
Quality of Selected Accessions of Centrosema Species Grown under Sub humid
Climatic Conditions of Western Oromia, Ethiopia, Global Veterinaria,11 (6): 735-741
Girma, D., Cannarozzi, G., Weichert, A. and Tadele, Z. (2018). Genotyping by Sequencing
Reasserts the Close Relationship between Tef and its Putative Wild Eragrostis
Progenitors, Diversity, 10:17; doi:10.3390/d10020017, www.mdpi.com/ journal/
diversity
Glaubitz JC (2004) CONVERT: a user friendly program to reformat diploid genotypic data
for commonly used population genetic software packages. Molecular Ecology
Notes4: 309-310.
Gollob, H.F. (1968). A statistical model that combines features of factor analysis and
analysis of variance techniques. Psycrometrika 33: 73-115
Gomez, K. A. & Gomez, A. (1984). Statistical Procedures for Agricultural Research. New
York: John Wiley & Sons.
Goering, H. K. and van Soest P. J. (1970). Forage Fibre Analysis. USDA, ARS Agric.
Handbook, No. 379, pp. 1 – 12.
Gous M., Mohd, Y. R., Mohd R. I., Adam B., Puteh., Harun A. R., Nurul I. K.and
Mohammad L. (2013) A review of microsatellite markers and their applications in
rice breeding programs to improve blast disease resistance. Int. J. Mol. Sci.14:
22499-22528.
Greenbaum G, Templeton AR, Zarmi Y, Bar-David S, (2014) Allelic Richness following
Population Founding Events – A Stochastic Modeling Framework Incorporating
Gene Flow and Genetic Drift. PLoS ONE9(12): e115203. doi:10.

197
1371/journal.pone.0115203
Gruneberg, W. J., Maniique, K., Zhang, D. & Hermann, M. (2005). Genotypexenvironment
interactions for a diverse of sweet potato clones evaluated across varying eco-
geographic conditions in Peru. Crop Sci. 45: 2160-2171.
Gauch GH, Zobel RW (1997). Interpreting mega-environments and targeting genotypes.
Crop Sci. 37: 311–326
Guach, H.G. and Zobel, R.W. (1988). Predictive and postdictive success of statistical
analyses of yield trials, Theor. Appl. Genet. 76:1-10
Gupta PK and Varshney RK. (2000) The development and use of microsatellite markers
for genetic analysis and plant breeding with emphasis on bread wheat. Euphytica
113: 163-185.
Hao, CY., Zhang, XY., Wang, LF., Dong, YS., Shang, XW., Jia, JZ. (2006). Genetic
diversity and core collection evaluations in common wheat germplasm from the
Northwestern Spring Wheat Region in China. Mol Breed. 17:69‐77.
Hundera, F. (1998). Variations of morpho−agronomic characters and grain chemical
composition of released varieties of tef [Eragrostis tef (Zucc.) Trotter]. Journal of
Genetics and Breeding52: 307-311.
Hundera, F., Tefera, H., Assefa, K., Tefera, T., Kefyalew, T. and T. Girma. (2000a).
Grain yield and stability analysis in late maturing genotypes of tef [Eragrostis tef
(Zucc.) Trotter]. J. Genet. Breed. 54: 13-18.
Hundera, F., Arumuganathan, K. and Baenziger, P.S. (2000b) Determination of relative
nuclear DNA content of tef using flow cytometry, J. Genet. and Breed.54:165-168.
198
Jain, K. S., Quaset, C. O., Bhatt, G. M. & Wu, K. K. (1975). Geographical patterns of
phenotypic diversity in a world collection of Durum wheat. Crop Sci.15: 700-704.
Jansen, G. R., Dimaio, L. R. & Hause, N. L. (1962). Amino acid composition and lysine
supplementation of tef. J. Agric. Food Chem.10: 62-64.
Jifar, H. (2008).Genetic Diversity and Association of Characters in Released Varieties of
Tef [Eragrostis tef (Zucc.)Trotter]. In Biology (Applied Genetics), M.Sc Thesis. 74
pages Addis Ababa University, Addis Ababa.
Jifar, H., Assefa, K. & Bekele, E. (2011).Genetic variability in released tef [Eragrostis tef
(Zucc.)Trotter] varieties of Ethiopia. In Proceedings of the Thirteenth Biennial
Conferences of Crop Science Society of Ethiopia, Vol. Sebil, 160-169 (Eds K.
Assefa, W. Sinebo, A. Fikre, A. Teklewold, L. Korbu, T. Dessalegn, E. Habte and
L. Gugsa). Addis Ababa, 31st Dec. 2008 -2nd Jan. 2009: Crop Science Society of
Ethiopia.
Jifar, H. and Assefa, K. (2013). Variation and association of yield and yield related traits
in released tef [Eragrostis tef (Zucc.) Trotter] varieties evaluated during offseason
in Ethiopia. Journal of Agriculture and Development 3:18-33.
Jifar, H., Assefa, K. and Tadele, Z. (2015a). Grain yield variation and association of major
traits in brown-seeded genotypes of tef [Eragrostis tef (Zucc.) Trotter]. Agriculture
and Food Security 4:7.
Jifar, H., Bekele, E. and Assefa, K. (2015b). Genetic variability, heritability and association
of traits in released tef [Eragrostis tef (Zucc.) Trotter] varieties evaluated in
Southwestern and Central Ethiopia. J. Sci. and Sust. Develop. 3:19-31.
Jifar, H., Tesfaye, K., Assefa, K., Chanyalew, S., and Tadele, Z. (2017). Semi-Dwarf Tef

199
(Eragrostis tef) Lines for High Seed Yield and Lodging Tolerance in Central
Ethiopia.
African Crop Science Journal, 25 (4): 419 - 439.
Jones, B.M.G, Ponti, J., Tavassoli, A. And Dixon, P.A. (1978). Relationships of
Ethiopian a cereal T’ef [Eragrostis tef (Zucc) Trotter]: Evidence from
morphology and chromosome number. Ann. Bot. 42:1369-1373.
Kalinowski, S.T ( 2005) HP-RARE1.0: a computer programme for performing rarefaction
on measures of allelic richness. Molecular Ecology Notes 5:187-189.
Kassier, S. B. (2002). Comparative responses of fodder and grain teff (Eragrostis tef(zucc.)
Trotter) cultivars to spatial, Temporal and nutritional management, M.Sc. Thesis,
University of Natal, Pietermaritzburg, Republic of South Africa
Kefyalew, T. (1999). Assessment of genotype environment interaction for grain yield and
Yield related traits in tef [Eragrostis tef (Zucc.) Trotter]. MSc thesis, School of
Graduate Studies, Alemaya University, Alemaya, Ethiopia.
Kefyalew, T., Tefera, H, and Assefa, K. (2000). Phenotypic diversity for qualitative and
phenologic characters in germplasms collections of tef (Eragrostis tef).Genet.
Resour. Crop Evol. 47: 73–80.
Kefyalew, T. (2001). Genotype x environment interaction in tef. In: Hailu Tefera,
Getachew Belay and Mark Sorrells (eds). Narrowing the Rift: Tef Research and
Development. Proceedings of the International Workshop on Tef Genetics and
Improvement, Debre Zeit, EARO, Ethiopia. pp. 145-156.
Kent, EH and Bruce, SW (2009). Genetics in geographically structured populations:
defining, estimating and interpreting FST. Nature Reviews,10: 639-650.

200
Ketema, S. (1993). Tef (Eragrostis tef): Breeding, Genetic Resources, Agronomy,
Utilization and Role in Ethiopian Agriculture. Institute of Agricultural Research
(IAR), Addis Ababa, Ethiopia
Ketema S. (1997) Tef [Eragrostis tef (Zucc.) Trotter], Gatersleben/International Plant
Genetic Resources Institute, Rome: Institute of Plant Genetics and Crop Plant
Research.
Khorgade, P., Narkhede, W. and Raut, S. (1985). Genetic variability in chickpea.
International Chickpea Newsletter, No. 5. pp 3-4.
Kroonenberg, P.M. (1995). Introduction to Biplots for GXE Tables, University of
Queensland, Brisbane.
Liu K, Muse SV (2005) Power Marker: an integrated analysis environment for genetic
marker analysis. Bioinformatics.21:2128-2129.
Liu, Y., Hou, W. (2010). Genetic diversity of faba bean germplasms in Qinghai and Core
germplasm identified based on AFLP analysis. Legume Genomics Genet. (online).
1(1): 1‐6.
Lule, D., Bekele, E. and Ayana, A. (2011). The extent and pattern of genetic diversity for
quantitative traits in tef [Eragrostis tef (Zucc.) Trotter] landrace populations. In:
Proceeding of 13th Conference of Crop Science Society of Ethiopia 13: 183-195.
Lule, D. (2015). Assessment of genetic diversity, genotype by environment interaction,
blast (Magnaporthe oryzae) disease resistance, and marker development for finger
millet germplasm from Ethiopia and introduced. A PhD Thesis, Addis Ababa
University, Ethiopia

201
Mengesha, M. H., Picket R. C. & Davis R. L. (1965). Genetic variability and
interrelationship of characters in teff, Eragrsotis tef (Zucc.) Trotter. Crop Sci.5:
155-157.
Mengesha, M.H. (1966). Chemical Composition of Teff (Eragrostis tef) Compared with
that of Wheat, Barley and Grain Sorghum. Economic Botany. 20 (3): 268-273.
Miller, D. (2009).TEFF GRASS: A NEW ALTERNATIVE. In Proceedings, 2009
California Alfalfa & Forage Symposium and Western Seed Conference, 5 Reno,
NV, 2-4 December, 2009: UC Cooperative Extension, Plant Sciences Department,
University of California.
Minitab Inc. (2007). Minitab Statistical Software, Release 15 for Windows, State College,
Pennsylvania, USA.
MoANR (2017) Crop Variety Registry, Issue No. 20. Ministry of Agriculture and Natural
Resource: Plant Variety Release, Protection and Seed Quality Control Directorate,
Addis Ababa, Ethiopia.
Mondini L, Noorani A and Pagnotta MA. (2009) Assessing Plant Genetic Diversity by
Molecular Tools. Diversity 1: 19-35.
Murray, I. (1993). Forage analysis by near infrared reflectance spectroscopy. In A. Davies,
R.D. Baker, S.A. Grant & A.S. Laidlaw, eds. Sward Management Handbook, pp.
285–312. British Grassland Society, Reading, UK.
Nassir, A. L. & Ariyo, O. J. (2011). Genotype X environment interaction and yield stability
analyses of rice grown in tropical inland swamp. Not Bot Hort Agrobot Cluj,39(1):
220-225.

202
National Academy of Sciences (NAS) (1996). Lost Crops of Africa. Volume 1: Grains.
Washington, D.C. : National Academy Press, Washington, D.C. pp 215-234..
Nei, M (1978) Estimation of average heterozygosity and genetic distance from a Small
number of individuals Genetics 89: 583-590
Pacheco, A., Vargas, M; Alvarado, G; Rodríguez, F; López, M; Crossa, J; Burgueño, J
(2016). GEA-R (Genotype x Environment Analysis with R for Windows.) Version
4.0, http:// hdl.handle.net/11529/10203 International Maize and Wheat
Improvement Center.
Paredes, MC., Becerry, VV., Tay, JU., Blair, MW., Bascur, GB. (2010). Selection of a
representative core collection from the Chilean common bean germplasm. Chilean
J. Agric. Res. 70(1):3‐15
Patricia, A. & Lisette, V. (2008). Survey on the Nutrition and Health aspects of tef
(Eragrostis tef). Larenstein: Hogeschool van Hall.
Peakall, R. and Smouse P.E. (2012) GenAlEx 6.5: genetic analysis in Excel. Population
genetic software for teaching and research–an update. Bioinformatics 28: 2537-
2539. Freelyavailable as an open access article from: http://bioinformatics.
oxfordjournals.org/ content/28/19/2537
Peakall, R. and Smouse P.E. (2006) GENALEX 6: genetic analysis in Excel. Population
genetics Perrier, X. and Jacquemond-Collet, J. P. (2006) Darwin software.
Piepho, H.P. (1996). Analysis of genotype by environment interaction and phenotypic
stability. In: M.S. Kang, and H.G. Zobel Jr(Eds), pp.151-174.Genotype by
Environment interaction. CRC Press, Boca Raton.
Perrier, X., and J.P. Jacquemoud-Collet. 2006. DARwin software, Available at

203
http://www. darwin.cirad.fr/darwin.html.
Peter M.V., William, G.H., Naomi, R.W. (2008). Heritability in the genomics era:
concepts and misconceptions. Nat Rev Genet. 9:255‐267.
Plaza-Wüthrich, S.W., Cannarozzi, G. and Tadele, Z. (2013). Genetic and phenotypic
diversity in selected genotypes of tef [Eragrostis tef (Zucc.) Trotter. African
Journal of Agricultural Research 8:1041-1049.
Ponti, J.A. (1978). The systematics of Eragrostis tef (Graminae) and related species. PhD
Thesis, University of London, London, UK
Pritchard, J. K., Stephens, M. and Donnelly, P. (2000) Inference of population structure
using multi-locus genotype data. Genetics, 155: 945–959.
Rambut,A. (2016) FigTreeV1.4.3.A graphical viewer of phylogenetic trees and as a
program for producing publication-ready figures. http://tree.bio.ed.ac.uk
/software/figtree/
Roseberg, R. J., Charlton, B. A. & Shuck, R. A. (2008).Yield and Forage Quality of Six
Teff Seed Brands as Affected by Seeding Date in the Klamath Basin. 12 Klamath
Falls, OR: Klamath Basin Research and Extension Center.
Rubenstein, D. K., Heisey, P., Shoemaker, R., Sullivan, J. & Frisvold, G. (2005).Crop
genetic resources: an economic appraisal. United States Department of Agriculture
(USDA). In Economic Information Bulletin No. 2. (www.ers.usda.gov).
Sadeghi, S. M., Samizadeh, H., Amiri, E. and Ashouri, M. (2011). Additive main effects
and multiplicative interactions (AMMI) analysis of dry leaf yield in tobacco hybrids
across environments.African Journal of Biotechnology,10(21):4358-4364
Samonte, P. B., Wilson, L. T., McClung, A. M. and Medley, J. C. (2005). Targeting

204
cultivars onto rice growing environments using AMMI and SREG GGE biplot
analysis. Crop Science45: 2414-2424
SAS (2002) System Analysis Software. Version 9.0. SAS Institute Inc., Cary, North
Carolina, USA
Saturni, L., Ferretti G and Bacchetti, T. (2010). The Gluten-Free Diet: Safety and
Nutritional Quality. Nutrients, 2: 16-34.
Schuelke, M. (2000). An economic method for the fluorescent labelling of PCR fragments.
Nature Biotechnol. 18:233-234.
Shafi, B., Mahler, K. A., Price, W. J., & Auld, D. L. (1992). Genotype x Environment
Interaction Effects on Winter Rapeseed Yield and Oil Content. Crop Science, 32(4):
922-927.
Shenk, J. S. and Westerhaus, M. O. (1993). Analysis of agriculture and food products by
Near Infrared Reflectance Spectroscopy. ISI Monograph. 116 pp.
Singh, B. (2000). Plant Breeding: Principles and Methods (6th ed.). Kalyani Publishers,
New Delhi.
Singh, R.K. and Chaudhary, B.D. (1985). Biometrical methods in quantitative genetic
analysis. Kalyani publishers, New Delhi.
Spaenij-Dekking L, Kooy-Winkelaar Y and Koning F. (2005) The Ethiopian Cereal Tef in
Celiac Disease. N Engl J Med 353: 1748-1749.
Smith, J. & Smith, O. (1992). Fingerprinting crop varieties. Adv. Agron.47: 85-140.
Szpiech, Z. A. and Rosenberg, N.A. (2011). On the size distribution of private
microsatellite alleles. Theoretical Population Biology80:100 –113.
Tadesse, D. (1993). Study of genetic variation of landraces of teff (Eragrostis tef (Zucc.)

205
Trotter) in ethiopia. Genet. Resour. and Crop Evol., 40:101-104.
Takezaki, N., Nei, M. and Tamura, K. (2010) POPTREE2: Software for Constructing
Population Trees from Allele Frequency Data and Computing Other Population
Statistics with Windows Interface Mol. Biol. Evol.27(4):747–752.
doi:10.1093/molbev/msp312
Tolossa, T., Keneni, G, Sefera, T, Jarso, M. and Bekele, Y (2013). Genotypes X
Environment Interaction and performance Stability for grain Yield in Field Pea
(Pisum sativum L.) Genotypes. International Journal of Plant Breeding, 7(2): 116-
123.
Tautz D. (1989) Hyper-variability of simple sequences as a general source for polymorphic
DNA markers. . Nucleic Acids Res.17: 6463-6471.
Tavassoli, A. (1986). The cytology of Eragrostis tef with special reference to E. tef and
its relatives. PhD Thesis, University of London, London, UK.
Tazeen, M., Nadia, K., Farzana, NN. (2009). Heritability, phenotypic correlation and path
coefficient studies for some agronomic characters in synthetic elite lines of wheat.
J. Food Agric Environ. 7: 278 ‐ 282.
Tefera, H. (1988).Variability and association of characters in tef [Eragrostis tef (Zucc.)
Trotter] cultivars. M.Sc. Thesis, Alemaya University.
Tefera, H., Ketema, S. & Tesemma, T. (1990). Variability, heritability and genetic advance
in tef [Eragrostis tef (Zucc.) Trotter] cultivars. Trop. Agric.67: 317-320.
Tefera, H., Peat, W.E. & Chapman, G.P. (1992). Quantitative genetics In t'ef (Eragrostis
tef (Zucc.) Trotter). In: Chapman GP (ed.) Desertified Grasslands: their biology and
management. London UK, Academic Press pp 283 - 296.

206
Tefera, H., Ayele, M. & Assefa, K. (1995). Improved Varieties of Tef (Eragrostis tef) in
Ethiopia: Releases of 1970–1995. Research Bulletin No. 1, Debre Zeit Agricultural
Research Center, Alemaya University of Agriculture, Debre Zeit, Ethiopia.
Tefera, H., Assefa, K., Hundera, F., Kefyalew, T. and Tefera, T. (2003 ). Heritability and
genetic advance in recombinant inbred lines of tef (Eragrostis tef). Euphytica 131:
91-96.
Tefera H and Ketema S. (2001) Production and importance of tef in Ethiopian Agriculture
In: Tefera H, Belay G and Sorrells ME (eds) Workshop Proceedings Addis Ababa:
Ethiopian Agricultural Research Organization 3-7.
Tefera, H., Assefa, K., Hundera, F., Kefyalew, T., Teklu, Y., Gugsa, L., Ketema, S. and
Adenew, T. (2001). The genetics of quantitative traits in tef. pp 87-98. In: Tefera,
H.; G. Belay and M. Sorrells (eds.) In: Narrowing the Rift: Tef Research and
Development. Proceedings of the International Workshop on Tef Genetics and
Improvement, 16-19 October 2000, Addis Ababa, Ethiopia
Tessema A. (2013) Genetic Resource of Tef in Ethiopia In: Assefa K, Chanyalew S and
Tadelle Z (eds), Achievemnts and Prospects of Tef Improvement, Proceedings of
the Second International Workshop. Debre Zeit.: Ethiopian Institute of Agricultural
Research, Addis Ababa and Institute of Plant Sciences, Bern University, 15-20.
Teklu, Y. (1998). Genetic gain in grain yield potential and associated agronomic traits of
tef [Eragrostis tef (Zucc.) Trotter]. M.Sc. Thesis, Alemaya University of
Agriculture, Dire Dawa, Ethiopia.
Teklu, Y. and Tefera, H. (2005) Genetic improvement in grain yield potential and
associated agronomic traits of tef (Eragrostis tef). Euphytica141: 247–254

207
Tilley, J.A. and Tery R. A. (1963). A two-stage technique for the in vitro digestion of
forage crop. Journal of British Grassland Society, 18: 104 –111.
Tolera, A., Berg, T. & Sundstol, F. (1999). The effect of variety on maize grain and crop
residue yield and nutritive value of the stover. Animal Feed Science and Technology
79: 165-177.
Varshney, RK, Graner, A. and Sorrells, ME (2005) Genic microsatellite markers in
plants: features and applications. Trends in Biotechnology 23: 48-55.
Vavilov, N. I. (1951) The Origin, Variation, Immunity and Breeding of Cultivated Plants.
Translated from the Russian by K. Starrchester. The Ronald Press Co., New York, p.
37–38.
Wakjira, A., and Labuschagne, M. T. (2002). Genotype by environment interactions and
phenotypic stability analyses of linseed in Ethiopia.Plant Breeding, 121: 66 -71
Wolter, A., Hager, A.S., Zannini, E., Arendt, E.K. (2013). In vitro starch digestibility and
predicted glycemic indexes of buckwheat, oat, quinoa, sorghum, teff and
commercial gluten-free bread. Journal of Cereal Science, 58: 431-436.
Wondimu, A. and Frew, T. (2001). Utilization of tef in the Ethiopian diet. pp 239-244. In:
Tefera, H.; G. Belay and M. Sorrells (eds.), Narrowing the Rift: Tef Research and
Development. Proceedings of the International Workshop on Tef Genetics and
Improvement, 16-19 October 2000, Addis Ababa, Ethiopia
Wright, S. (1978). Evolution and the Genetics of Populations: Variability Within and
Among Natural Populations. University of Chicago Press, Chicago.
Yami A. (2013). Tef Straw: a Valuable Feed Resource to Improve Animal Production and
Productivity. In: Assefa K, Chanyalew S and Tadele Z (eds), Achievements and
208
Prospects of Tef Improvement, Proceedings of the Second International Workshop.
Debre Zeit: Ethiopian Institute of Agricultural Research, Addis Ababa and Institute
of Plant Sciences, Bern University, 233-251.
Yan, W., Hunt, L.A., Sheng, Q. and Szlavnics, Z. (2000). Cultivar evaluation and Mega
environment investigation based on the GGE biplot. Crop Science40: 597-605.
Yan, W., Cornelius, P.L., Cross, J. and Hunt, L.A. (2001). Biplot Analysis of Multi-
environment Trial Data. Crop Science 41:656-663.
Yan, W. (2002). Singular-value partitioning in biplot analysis of multi-environment trial
data. Agronomy Journal 94:990-996.
Yan, W. and Rajcan, I. (2002). Biplot analysis of test sites and trait relations of soybean in
Ontario. Crop Sci42: 11-20.
Yan W, Hunt LA (2002). Biplot analysis of diallel data. Crop Sci.42:21–30
Yan, W. and Kang, M.S. (2003). GGE Biplot Analysis: A Graphical Tool for Breeders,
Geneticists and Agronomists. 1st Edition., CRC Press LLC., Boca Raton, Florida,
pp: 271
Yan, W. and Tinker, N.A. (2006). Biplot analysis of multi- environment trial data:
Principles and applications. Can J Plant Sci. 86: 623-645
Yu, J.K., Kantety, R.V., Graznak, E., Benscher, D., Tefera, H. and Sorrells, M.E. (2006).
A genetic linkage map for tef [Eragrostis tef (Zucc.) Trotter]. TAG. Theoretical
and applied genetics. Theor. Appl. Genet.113: 1093–1102.
Yu, J.K., Sun, Q., Rota, M.L, Edwards, Tefera H. and Sorrells, M. E. (2006b) Expressed
Sequence tag analysis in tef (Eragrostis tef (Zucc) Trotter). Genome 49(4):365-372.
Yu, J.K., Elizabeth, G., Flavio, B., Tefera H. and Mark, E. S. (2007).QTL mapping of

209
agronomic traits in tef [Eragrostis tef (Zucc) Trotter]. BMC Plant Biology.
http://www.biomedcentral.com/1471-2229/7/30
Zeid, M., Belay, G., Mulkey, S., Poland, J. and Sorells, M.E. (2011). QTL mapping for
yield and lodging resistance in enhanced SSR-based map for tef. Theor. Appl.
Genet., 122:77-93.
Zeid, M., Assefa, K., Haddis A., Chanyalew S. and Sorells, ME (2012). Genetic diversity
in tef (Eragrostis tef) germplasm using SSR markers. Field Crops Research 127:
64-70.
Zhang D, Ayele, M., Tefera, H. and Nguyen HT ( 2001). RFLP linkage map of the
Ethiopian cereal tef [Eragrostis tef (Zucc) Trotter]. Theor Appl Genet 102: 957-964.
Zhu, Q., Smith, S.M., Ayele, M., Yang, L., Jogi, A., Chaluvadi, S.R. and Bennetzen, J.L.
(2012). High-Throughput discovery of mutations in tef semi-dwarfing genes by
next-generation sequencing analysis. Genetics 192: 819-829.
Zobel, R.W., Wright, M.J. and Gauch, H.G. (1988). Statistical analysis of a yield trial.
Agronomy. Journa l80: 388-393.

210
APPENDICES
Appendix 9. Tables
Appendix Table 1. Regional, zonal and altitudinal distribution of the studied tef
germplasm
Region Zones
Altitudinal classes
Total <1500m1 1501-2000m 2001-2500m >2500m
Tigray
Central Tigray 1 4 3 4 12
East Tigray 0 1 7 4 12
West Tigray 6 3 3 0 12
Amhara
North Gonder 0 5 7 0 12
South Gonder 0 3 7 2 12
North Wello 0 9 0 3 12
South Wello 0 5 4 3 12
East Gojam 1 2 3 6 12
West Gojam 0 3 7 2 12
Oromia
North Shewa 4 3 0 5 12
East Shewa 0 6 6 0 12
West Shewa 0 5 4 3 12
Total 12 49 51 32 144

211
Appendix Table 2. Distribution of studied tef germplasm by regions, zones
of collection
Region Zones
Collection years
Total Before 2000 After 2000
Tigray
Central Tigray 4 8 12
East Tigray 3 9 12
West Tigray 4 8 12
Amhara
North Gonder 0 12 12
South Gonder 7 5 12
North Wello 11 1 12
South Wello 5 7 12
East Gojam 8 4 12
West Gojam 2 10 12
Oromia
North Shewa 5 7 12
East Shewa 7 5 12
West Shewa 4 8 12
Total 60 84 144

212
Appendix Table 3. Private allelic richness per locus & populations for 189 tef genotypes from various sources
Locus CT EG ES ET NG NS NW SG SW WG WS WT Imp Mut Mean
CNLT 133 0.00 0.00 0.00 0.00 2.00 1.00 0.00 0.00 0.00 0.00 0.00 0.00 1.00 0.00 0.29
CNLT 216 0.00 0.00 0.00 2.00 1.00 0.00 1.00 1.00 0.00 1.00 0.00 0.00 0.00 0.00 0.43
CNLT 27 0.00 0.00 0.00 0.00 0.00 0.00 0.00 0.00 0.00 0.00 0.00 0.00 0.00 0.00 0.00
CNLT 538 0.00 0.00 0.00 0.00 0.00 0.00 0.00 0.00 2.00 1.00 1.00 1.00 0.00 0.00 0.36
CNLT 60 0.00 0.00 0.00 0.00 0.00 0.00 0.00 0.00 0.00 0.00 1.00 0.00 0.00 0.00 0.07
CNLT 33 0.00 1.00 0.00 2.00 0.00 1.00 0.00 0.00 0.00 0.00 0.00 0.00 0.00 0.00 0.29
SSR 9.4 0.00 0.00 0.00 0.00 0.00 1.00 0.00 0.00 0.00 0.00 0.00 0.00 0.00 0.00 0.07
CNLT 42 0.00 0.00 0.00 0.00 1.00 0.00 0.00 0.00 0.00 0.00 0.00 1.00 0.00 0.00 0.14
CNLT 150 0.00 0.00 0.00 0.00 0.00 0.00 0.00 0.00 0.00 0.00 0.00 0.00 0.00 0.00 0.00
CNLT 157 0.00 0.00 0.00 2.00 0.00 0.00 0.00 0.00 0.00 0.00 0.00 0.00 0.00 0.00 0.14
SSR 3.3 0.00 0.00 0.00 0.00 0.00 0.00 0.00 0.00 0.00 0.00 0.00 0.00 0.00 0.00 0.00
CNLT 136 0.00 0.00 0.00 1.00 2.00 1.00 0.00 0.00 0.00 1.00 0.00 1.00 0.00 0.00 0.43
CNLT 315 0.00 0.00 0.00 0.00 1.00 0.00 0.00 0.00 0.00 0.00 0.00 0.00 1.00 0.00 0.14
CNLT 416 1.00 0.00 2.00 1.00 0.00 0.00 1.00 0.00 0.00 0.00 0.00 1.00 1.00 0.00 0.50
CNLT 438 0.00 1.00 0.00 0.00 0.00 0.00 0.00 0.00 0.00 0.00 0.00 0.00 0.00 0.00 0.07
CNLT 484 0.00 0.00 0.00 2.00 0.00 1.00 0.00 0.00 2.00 2.00 1.00 0.00 0.00 0.00 0.57
Mean 0.06 0.13 0.13 0.63 0.44 0.31 0.13 0.06 0.25 0.31 0.19 0.25 0.19 0.00 0.22
CT=Central Tigray, EG= East Gojam, ES= East Shewa, ET=East Tigray, NG=North Gondar, NS= North Shewa, NW=North Wello, SG=
South Gondar, SW= South Wello, WG= West Gojam, WS=West Shewa, WT=West Tigray, Imp= Improved variety, Mut= Mutant lines

213
Appendix Table 4. Allelic frequency of each marker for 189 tef genotypes from various sources
Allele/Locus CNLT_133 CNLT_216 CNLT_27 CNLT_538 CNLT_60 CNLT_33 SSR_9.4 CNLT_42
A 0.0029 0.011 0.1108 0.0028 0.0057 0.006 0.0054 0.0299
B 0.0029 0.0746 0.2243 0.0221 0.0575 0.0569 0.1102 0.0978
C 0.0143 0.1878 0.0595 0.0773 0.0603 0.0778 0.3306 0.0054
D 0.0086 0.0387 0.2784 0.047 0.0776 0.0479 0.3172 0.0136
E 0.0057 0.047 0.0946 0.1354 0.1121 0.0988 0.2124 0.0299
F 0.0171 0.0055 0.0676 0.0829 0.1552 0.2246 0.0242 0.0272
G 0.1514 0.0552 0.1162 0.1077 0.1609 0.1976 0.019
H 0.2543 0.0829 0.0486 0.1519 0.2184 0.006 0.019
I 0.1657 0.1436 0.011 0.1063 0.0928 0.0598
J 0.0486 0.0718 0.0221 0.023 0.0569 0.0027
K 0.0229 0.0497 0.0746 0.0172 0.0389 0.1467
L 0.0171 0.0138 0.0331 0.0057 0.015 0.1033
M 0.0086 0.0249 0.0028 0.015 0.0571
N 0.02 0.0304 0.0193 0.015 0.0543
O 0.0371 0.0304 0.0055 0.021 0.0516
P 0.0571 0.011 0.0166 0.012 0.038
Q 0.0943 0.0055 0.0055 0.009 0.0679
R 0.0429 0.0221 0.0028 0.003 0.0815
S 0.0171 0.0055 0.0525 0.006 0.0489
T 0.0057 0.0552 0.0663 0.019
U 0.0057 0.0249 0.0193 0.0136
V 0.0028 0.011 0.0136
W 0.0028 0.011
X 0.0028 0.0055
Y 0.011
Z 0.0028

214
Appendix Table 4. Continued. Allele/Locus CNLT_150 CNLT_157 SSR_3.3 CNLT_136 CNLT_315 CNLT_416 CNLT_438 CNLT_484
A 0.1485 0.0056 0.2358 0.0068 0.5239 0.003 0.0806 0.0027
B 0.0333 0.1854 0.7642 0.0135 0.0133 0.1152 0.0548 0.0027
C 0.0061 0.0758 0.1453 0.0293 0.0152 0.1516 0.0108
D 0.0758 0.0674 0.0203 0.2101 0.0061 0.0194 0.2081
E 0.2424 0.191 0.0541 0.0186 0.0212 0.0194 0.0027
F 0.0394 0.3483 0.0135 0.1463 0.2364 0.0129 0.2054
G 0.0303 0.0646 0.0068 0.0106 0.003 0.0774 0.0703
H 0.0121 0.0393 0.098 0.0186 0.1879 0.0129 0.0135
I 0.0212 0.0169 0.0068 0.0027 0.0606 0.0323 0.0216
J 0.1121 0.0056 0.1014 0.0186 0.003 0.0935 0.0189
K 0.0091 0.0135 0.0053 0.0273 0.0226 0.0324
L 0.0364 0.1351 0.0027 0.0152 0.0516 0.0622
M 0.0121 0.0304 0.0061 0.1387 0.1135
N 0.2212 0.2669 0.0242 0.0903 0.0378
O 0.0608 0.1 0.0903 0.0027
P 0.0135 0.0273 0.029 0.0595
Q 0.0135 0.0061 0.0161 0.0676
R 0.003 0.0065 0.0162
S 0.003 0.0027
T 0.0091 0.0108
U 0.0121 0.0297
V 0.0091 0.0027
W 0.0091 0.0027
X 0.0909 0.0027
Y 0.0061

215
Appendix 9. Figures
Appendix Figure 1. Distribution of 188 tef genotypes across the first two PCs

216
Appendix Figure 2. Biplot showing distribution of 72 Woredas of tef germplasm collection on PC1& PC2

217
Appendix Figure 3. Partial view of LI-COR gel electrophoretic bands of DNA from 189 tef genotypes as revealed by polymorphic SSR
marker, CNLT 42. Lane number 2 to 65 represent 64 samples of tef genotypes while lane 1 and 65 represent the DNA ladder with 50bp.

218
Appendix Figure 4. CP%, ME (MJ/Kg) and IVOMD (%) of tef straw from 36 genotypes evaluated at two locations for two years
Appendix Figure 5. NDF, ADF, ADL and DM% of tef straw from 36 genotypes evaluated at two locations for two years

219
Biography of the author
Habte Jifar Daba was born on July 12, 1970 in
Illubabor Zone, Ethiopia. Initially, he
graduated in Diploma from Addis Ababa
University Awassa Junior College of
Agriculture in Plant Science and Technology
in July 1989. Up on graduation, he was
assigned to Bako Agricultural Research Center
as a Technical Assistant by the then Institute of
Agricultural Research (IAR). He competed and got full scholarship opportunity from
the then Alemaya University, now Haramaya University in 1998 to continue his study
as advanced standing student and obtained a BSc degree in Plant Sciences in 2001. After
graduating with B. Sc. Degree, he was employed back to the Ethiopian Institute of
Agricultural Research (EIAR) and assigned as a junior researcher to Jimma Agricultural
Research Center in December 2001. After serving for five years, he allowed to pursue
his post graduate study and obtained MSc degree in Biology (Applied Genetics) in 2008
from Addis Ababa University, Ethiopia. Habte resumed his career as a researcher again
in EIAR where he is still working. Thus, Habte has served as a technician and researcher
at various positions and capacities in EIAR. His research work mainly deals with the
improvement of cereal crops like tef, maize and sorghum. Habte along with his research
colleagues have released several improved varieties of maize and tef crops for the
farmers. He has been among the tef improvement research team awarded the Gold
Medal at the national level for outstanding accomplishment in 2013. He authored and
220
coauthored various peer reviewed research articles, conference and workshop
proceedings. Habte is a breeder and member of the national tef research team in Ethiopia.
Publications
A. Peer reviewed journal published during this PhD Study
1. Habte Jifar, Kifle Dagne, Kassahun Tesfaye, Kebebew Assefa and Zerihun Tadele
(2018). Agro-Morphological Traits Diversity in Tef [Eragrostis Tef (Zucc.)
Trotter] Genotypes from Various Sources Ethiop. J. Agric. Sci, 28(3): 131-
148.
2. Habte Jifar, Kassahun Tesfaye, Kebebew Assefa, Solomon Chanyaleew and
Zerihun Tadele (2017). Semi-dwarf tef lines for high seed yield and lodging
tolerance in Central Ethiopia. African Crop Science Journal, 25(4): 419-
439.
3. Habte Jifar, Kebebew Assefa and Zerihun Tadele. (2015). Grain yield variation
and association of major traits in brown-seeded genotypes of tef [Eragrostis
tef (Zucc.) Trotter]. Journal of Agriculture and Food Security4:7 DOI
10.1186/s40066-015-0027-3
4. Habte Jifar, Endashaw Bekele and Kebebew Assefa. (2015). Genetic variability,
Heritability and Association of Traits in Released tef [Eragrostis tef (Zucc.)
Trotter] Varieties Evaluated in Southwestern and Central Ethiopia Journal
of Science and Sustainable Development (JSSD), 3(2): 19-31
5. Kebebew Assefa, Solomon Chanyalew, Yazachew Genet, Mitiku Asfaw, Tsion
Fikre, Habte Jifar, Nigussu Hussen, Mihireteab H/Sellassie, Girma
Chemeda, and Molalign Assefa. (2017). Tef (Eragrostis tef) Variety Kora.
Ethiop. J. Agric. Sci., 27(2): 137-140
6. Solomon Chanyalew, Kebebew Assefa, Mitiku Asfaw, Yazachew Genet, Kidist
Tolossa, Worku Kebede, Tsion Fikre, Nigussu Hussen, Habte Jifar,
Atinkut Fentahun, Kidu Gebremeskel, Girma Chemeda and Tegegn Belete.
(2017). Tef (Eragrostis

221
tef) Variety "Dagim",Ethiop. J. Agric. Sci.27(2): 131-135
7. Gina Cannarozzi, Solomon Chanyalew, Kebebew Assefa, Abate Bekele, Regula
Blo¨sch, Annett Weichert, Dominik Klauser, Sonia Plaza-Wu¨thrich,
Korinna Esfeld, Moritz Jo¨st, Abiel Rindisbacher, Habte Jifar, Victoria
Johnson-Chadwick, Ermias Abate, Wuyan Wang, Rizqah Kamies, Negussu
Husein, Worku Kebede, Kidist Tolosa, Yazachew Genet, Kidu
Gebremeskel, Brikti Ferede, Firew Mekbib, Federico Martinelli, Hans
Christian Pedersen, Suhail Rafudeen, Shimelis Hussein, Muluneh
Tamiru, Naomi Nakayama, Mike Robinson, Ian Barker, Samuel Zeeman,
Zerihun Tadele. (2018). Technology generation to dissemination: lessons
learned from the tef improvement project. Euphytica, 214:31
https://doi.org/10.1007/s10681-018-2115-5
Other Journal articles
1. Habte Jifar and Kebebew Assefa. (2013). Variation and Association of yield and
yield related traits in released Tef [Eragrostis tef (Zucc) Trotter] varieties
evaluated during off-season in Ethiopia. Journal of Agriculture and
Development 3(1):18-33
2. Habte Jifar and Likyelesh Gugsa. (2013). Variation in Major Traits of
Gynogenically derived Tef [Eragrostis tef (Zucc.) Trotter] lines Evaluated
in the Central highlands of Ethiopia. Ethiopian Journal of Applied Sciences
and Technology. 4:50-64
3. Leta Tulu Bedada and Habte Jifar.(2010). Maize (Zea mays L.) Genetic Advances
through S1 Recurrent Selection in Ethiopia. Journal of Environmental
Issues and Agriculture in Developing Countries. 2(1):154 -175.
4. Leta Tulu and Habte Jifar (2010). Advances in Improving Ukiriguru Composite
B Maize (Zea mays L.) Variety Through S1 Recurrent Selection. East
African Journal of Agricultural Sciences. 4 (2): 78-85.
5. Leta Tulu and Habte Jifar (2010). Registration of Morka Maize (Zea mays L.)
variety. East African Journal of Agricultural Sciences. 4 (2): 128-13 1.
6. Esayas Mendesil, Chemeda Abdeta, Abush Tesfaye, Zekarias Shumeta and Habte

222
Jifar (2007). Farmers’ Perceptions and Management Practices of Insect
Pests on Stored Sorghum in Southwestern Ethiopia. Crop Prot. 26:1817-
1825.
Conferences and workshop proceedings
1. Habte Jifar, Endashaw Bekele and Kebebew Assefa (2011). Genetic Variability in
Released tef [Eragrostis tef (Zucc.) Trotter] varieties of Ethiopia. Crop
Science Society of Ethiopia (CSSE). Sebil Vol. 13. Proceedings of the Thirteen
Biennial Conferences, 31st Dec. 2008 -2nd Jan. 2009. Addis Ababa, Ethiopia.
2. Leta Tulu and Habte Jifar (2008). Cereals for high potential coffee growing regions
of Ethiopia. In Girma A., Bayetta B., Tesfaye S., Endale T. and Taye K. (eds.)
Cofee diversity and knowledge (ISBN 978-99944-53-21-4), Proceedings of a
National Workshop, Four Decades of Coffee Research and Development in
Ethiopia, 14-17, August 2007, Addis Ababa (Ghion Hotel), Ethiopia. PP: 472-
482
3. Leta Tulu and Habte Jifar (2011). Progress and Achievements in Improving
Composite Maize (Zea mays L.) Variety through S1 Recurrent Selection. Crop
Science Society of Ethiopia (CSSE). Sebil Vol. 13. Proceedings of the Thirteen
Biennial Conferences, 31st Dec. 2008 -2nd Jan. 2009. Addis Ababa, Ethiopia.
4. Tewabech, T., Dagne W., Girma D., Meseret N., Solomon A. and Habte J. (2012).
Maize Pathology Research in the 2000s: A Review paper. In: Worku, M.,
Twumasi-Afriyie, S., Wolde, L., Tadesse, B., Demisie G., Bogale, G., Wegary,
D. and Prasanna, B.M. (Eds.) 2012. Meeting the Challenges of Global Climate
Change and Food Security through Innovative Maize Research. Proceedings of
the Third National Maize Workshop of Ethiopia April 18-20, 2011; Addis Ababa,
Ethiopia.
5. Mosisa W., Legesse W., Berhanu T., Girma D., Girum A., Wonde A., Tolera K.,
Gezahegne B., Dange W., Solomon A., Habtamu Z., Kassa Y., Temesgen C.,
Habte J., Demoz N and Getachew B. Status and Future Direction of Maize
Research and Production in Ethiopia. In: Worku, M., Twumasi-Afriyie, S.,

223
Wolde, L., Tadesse, B., Demisie G., Bogale, G., Wegary, D. and Prasanna, B.M.
(Eds.) (2012). Meeti ng the Challenges of Global Climate Change and Food
Security through Innovative Maize Research. Proceedings of the Third National
Maize Workshop of Ethiopia April 18-20, 2011; Addis Ababa, Ethiopia.
6. Mosisa W., Legesse W., Berhanu T., Girum A., Wonde A., Solomon A., Tolera K.,
Dange W., Girma D., Temesgen C., Leta Tulu, Habtamu Z., Habte J., Alemu T.,
Fitsum S., Andualem W. and Belayneh A. Genetic Improvement of maize for
Mid-Altitude and Lowland Sub-Humid Agro-Ecology of Ethiopia. In: Worku,
M., Twumasi-Afriyie, S., Wolde, L., Tadesse, B., Demisie G., Bogale, G.,
Wegary, D. and Prasanna, B.M. (Eds.) (2012). Meeti ng the Challenges of Global
Climate Change and Food Security through Innovative Maize Research.
Proceedings of the Third National Maize Workshop of Ethiopia April 18-20,
2011; Addis Ababa, Ethiopia.
7. Gudeta N., Twumasi-Afriyie, Demisew A.K., Bayisa A., Demoz N., kassa Y.,
Habtamu Z., Leta T., Habte Jifar., Wondimu Fekadu., Solomon A., Abiy A.,
Jemal A., Abrha K., Hintsa G. and Habtamu T. Development of Improved Maize
Germplasm for Highland Agro-Ecology of Ethiopia. In: Worku, M., Twumasi-
Afriyie, S., Wolde, L., Tadesse, B., Demisie G., Bogale, G., Wegary, D. and
Prasanna, B.M. (Eds.) (2012). Meeti ng the Challenges of Global Climate
Change and Food Security through Innovative Maize Research. Proceedings of
the Third National Maize Workshop of Ethiopia April 18-20, 2011; Addis Ababa,
Ethiopia.
8. Bediru B., Endashaw H., Bayissa G., Gemechu S., Habte J., Tolera K., Gudeta N.,
Belete T., Lealem T., Gezahegne B., Dange W. and Tsige D. (2012).
Participatory On-farm Maize Technology Evaluation and Promotion in Ethiopia.
In: Worku, M., Twumasi-Afriyie, S., Wolde, L., Tadesse, B., Demisie G.,
Bogale, G., Wegary, D. and Prasanna, B.M. (Eds.) 2012. Meeti ng the Challenges
of Global Climate Change and Food Security through Innovative Maize
Research. Proceedings of the Third National Maize Workshop of Ethiopia April
18-20, 2011; Addis Ababa, Ethiopia.
9. Tolera K., Meseret N., Solomon A., Temesgen C., Hirko S., Girma C., Gudeta N.,

224
Gezahegne B., Habte J., Taye H., Tekaligne T., Molla A., Wondimu F., Desta
G. and Andualem W. (2012). Maize Seed Production in Research Cenetrs and
Higher Learning Institutes. In: Worku, M., Twumasi-Afriyie, S., Wolde, L.,
Tadesse, B., Demisie G., Bogale, G., Wegary, D. and Prasanna, B.M. (Eds.)
2012. Meeting the Challenges of Global Climate Change and Food Security
through Innovative Maize Research. Proceedings of the Third National Maize
Workshop of Ethiopia April 18-20, 2011; Addis Ababa, Ethiopia.
Books
1. Habte Jifar Daba (2012). Diversity and Association of Characters in Tef Crop.88pages
LAB LAMBERT Academic Publishing, Gm BH & Co. KG, Germany. ISBN: 978-
3-659-15758-5
Copyright © 2022 FDOKUMEN